voluntary food intake and diet selection in farm animals - j.m. forbes - 2nd ed - 2007 - (cabi)
TRANSCRIPT


VOLUNTARY FOOD INTAKE AND
DIET SELECTION IN FARM ANIMALS
Second Edition

This page intentionally left blank

VOLUNTARY FOOD INTAKE
AND DIET SELECTION IN
FARM ANIMALSSecond Edition
J. Michael Forbes
Emeritus ProfessorInstitute of Integrative and Comparative BiologyUniversity of LeedsLeeds LS2 9JTUK
Correspondence:1, The WoodlandsArthington LanePool in WharfedaleOtley LS21 1JYUKe-mail: [email protected].: 0113 2842529

CABI is a trading name of CAB International
CABI Head Office CABI North American Office Nosworthy Way 875 Massachusetts AvenueWallingford 7th FloorOxfordshire OX10 8DE Cambridge, MA 02139UK USA
Tel: +44 (0)1491 832111 Tel: +1 617 395 4056Fax: +44 (0)1491 833508 Fax: +1 617 354 6875E-mail: [email protected] E-mail: [email protected]: www.cabi.org
© J.M. Forbes 2007. All rights reserved. No part of this publication may be reproduced in any form or by any means, electronically, mechanically, byphotocopying, recording or otherwise, without the prior permission of the copyright owners.
A catalogue record for this book is available from the British Library, London, UK.
ISBN-13: 978 1 84593 279 4
Library of Congress Cataloging-in-Publication DataForbes, J. M. (John Michael), 1940–
Voluntary food intake and diet selection in farm animals / J. Michael Forbes.-- 2nd ed.
p. cm.Includes bibliographical references and index.ISBN 978-1-84593-279-4 (alk. paper) -- ISBN 978-1-84593-280-0 (ebook)
1. Animal nutrition. 2. Food preferences. 3. Ingestion--Regulation.I. Title.
SF95.F675 2007636.08’4--dc22
2007006773
Typeset by Columns Design Ltd, Reading, UKPrinted and bound in the UK by Biddles Ltd, King’s Lynn

Contents
v
Preface vii
Part I Basics
1 Introduction 1
2 Feeding Behaviour 12
Part II Mechanisms
3 Feedbacks from the Gastrointestinal Tract 41
4 Metabolites and Hormones 69
5 Central Nervous System and the Special Senses 91
6 Learning about Food: Conditioned Preferences 117and Aversions
7 Diet Selection: Principles 144
8 Diet Selection: Practicalities 171
Part III Theories
9 Integrative Theories of Food Intake Control 188
10 Minimal Total Discomfort 203
Part IV Food Composition
11 Diet Digestibility, Energy Concentration and 219Supplementation of Forages

12 Protein and Other Nutrients 243
13 Appetites for Specific Nutrients 261
14 Silage 287
Part V Animal and Environmental Factors
15 Growth and Fattening 310
16 Reproduction and Lactation 341
17 Environmental Factors Affecting Intake 365
18 Epilogue 391
References 407
Index 449
vi Contents

Preface
The importance of the subject of this book encouraged me to prepare a secondedition both to provide up-to-date coverage and to change the emphasis ofsome sections. The first edition (Forbes, 1995), as with its predecessor (Forbes,1986b), has been well received, so a broadly similar approach has beenadopted for this edition.
The preface to the first edition states that: ‘My approach throughout hasbeen to provide examples … I have given many references to the literature’.This not only cluttered the text and might have interfered with ease of reading,it also resulted in a very long reference list (over 1300 references!) occupying agreat many pages. In this edition I have not sought to justify my everystatement but rather to provide references to reviews; in many cases only themost recent of a batch of papers is referenced and older literature can be tracedthrough this. Nevertheless, there still remain many references to what I considerto be key original papers. The list of references of the first edition has beenmade available at http://www.fbs.leeds.ac.uk/ForbesRef/RefsForFirstEdition toprovide access to some of the information for which references have beenomitted from this second edition.
Where I have felt that the text and/or diagrams from the first edition are stillappropriate, I have left them in rather than paraphrase for the sake of it.However, there are many new sections and much reorganized material.Chapters have been added and grouped into common themes, and the chapteron intake at grazing has been removed, as that in the first edition did not dojustice to the subject. The material on prediction of intake, previously in its ownchapter, has now been distributed to relevant sections in appropriate chapters;in this way most of the material on, say, lactation is together rather than beingdivided between two or more chapters. Prediction of food intake andunderstanding of how it is controlled should go hand in hand and not beartificially separated as they were in the first edition.

Some areas have seen consolidation but not a great deal of development,especially in physiology, as few are working with farm animals in that area now.There have been expansions in modelling and in molecular biology, but little ofthe latter has been applied to farm animals yet. It would be logical to includeinformation on laboratory animals where it is missing for farm animals, but thiswould make an already long book far too long. The classic book of Le Magnen(1985) is an excellent starting point, while that of Dockray and Smith (2006)brings the subject up to date. For those with an interest in fish the book editedby Houlihan et al. (2001) provides comprehensive coverage.
I have attempted to provide more structure to the book by using theMinimal Total Discomfort (MTD) concept as a linking strategy. Do not mistakethis for a belief that this theory explains everything (or even anything). Simply,the first edition was not as strong as it should have been in structure anddirection, and MTD provides a simple way of incorporating several factorsaffecting intake in a semi-quantitative manner and thereby acting as aframework around which many of the experimental results and ideas can beintegrated.
In covering the subject from so many different angles it is unavoidable thatthere will be some overlap between chapters; in most cases I have cross-referenced between chapters in order to minimize overlap. Nevertheless, it hasat times been necessary to present similar information in more than one place.It seems to me that the most obvious such case is in the consideration of dietselection and appetites for protein. Thus, this subject appears in Chapter 7 inthe consideration of the principles of diet selection and its methodology, inChapter 8 where more practical aspects of diet selection are being discussedand in Chapter 13 where the appetite for protein comes under scrutiny. Tohave put these three sections together in one chapter would have left obviousgaps in the two chapters from which the material was removed.
In describing results of experiments I have not usually given the level ofstatistical significance; if I say there is an effect then it is significant at P < 0.05.If a difference or a relationship is not quite significant then I make this clear.
I am very pleased to acknowledge the advice of Dr Mike Wilkinson onChapter 14, to my academic colleagues for discussions and collaboration, andto my wife Joan for her patience and understanding.
J. Michael ForbesFebruary 2007
viii Preface

1 Introduction
The majority of farm animals are fed ad libitum; that is, they have foodavailable almost all of the time. This is true whether they are kept intensively –the supply of food being under direct control of their keeper – or extensively,where the herbage available varies in quantity and quality according to thetime of year, but is rarely completely unavailable. Despite this freedom ofaccess to food there are many situations in which animals over- or undereat,and ‘voluntary food intake’ and the factors which control and influence it are ofgreat importance to agriculturists across the world. The ramifications of thesubject are so great that it is impossible to cover them all in one book, and Ihave tried to give an even coverage of all aspects although, no doubt, some ofmy particular interests and prejudices will show through.
The subject of grazing and herbage intake is not covered and readers arereferred to books by Hodgson (1990) and Vallentine (2001) and to conferenceproceedings edited by Hodgson and Illius (1998). Vallentine’s book alsoincludes details of the anatomical and metabolic adaptations of ruminants.
In this brief introductory chapter, we discuss in general terms why studiesof the control of voluntary food intake in farm animals are important, theterminology is defined and a little of the history of the subject is described. Thetechniques used to measure food intake are briefly described while methods ofmonitoring feeding behaviour are dealt with in Chapter 2.
The Significance of Voluntary Food Intake
If voluntary intake is too low then the rate of production is likely to bedepressed, meaning that the requirements for maintenance become a verylarge proportion of the metabolizable energy in the food and so giving a poorefficiency of food conversion. If there is too high a level of intake then excessivefat deposition may occur, in some species at least. Thus the aim must be to
© J.M. Forbes 2007.Voluntary Food Intake and Diet Selection 1in Farm Animals 2nd Edition (J.M. Forbes)

match food consumption with the required level of production. This optimumlevel of production depends to a large extent on the relative costs of differenttypes of food and their nutritive values, and on the production response curveto changes in food quantity and quality. For example, depending on thecircumstances, it may be economically more efficient to feed a low rather thana high level of compound supplement to a dairy cow, because forage intakeincreases and milk yield is not seriously depressed.
The quantitative importance of voluntary food intake is illustrated by thefact that poultry, which are mostly fed ad libitum, consume some 3.5 million tof food annually in the UK, accounting for some 70% of the total cost ofpoultry production.
Animals compete with man for food and there is a need to reduce theamount of grain-based food, especially in ruminants, which are able to makeuse of grass, grass products and by-products of other agricultural and industrialactivities; cereals can thus be saved for human consumption and for pigs andpoultry which cannot digest cellulose, unlike the ruminant. Because the bulk ofa food as well as its nutritive value may limit intake, knowledge of the effects ofchanges in the type of food offered is essential.
The scientific study of voluntary food intake is important, therefore, anddemands a multidisciplinary approach. The nutritionist, the physiologist, thepsychologist, the pharmacologist, the modeller and, in the agricultural context,the animal and crop scientist all have to be involved in unravelling thecomplexities of the subject.
Problems of overeating
While the problems of human obesity are obvious, those concerning farmanimals are less so. That proverbial glutton, the pig, is often prevented fromeating his fill by restricted feeding of a daily measured amount of food which isexpensive in labour. Other species also become obese, however: cattle, sheepand broiler chickens fed ad libitum continue to deposit fat until they becomegrossly ‘overweight’ (see Chapter 15). For example, Friesian dairy cows offereda food low in roughage ad libitum and not remated were seen to increase inweight at the rate of about 1 kg/day and to show no sign of slowing down after70 weeks, when they weighed 700 kg, some 100 kg above the ‘normal’ weightfor such cattle (Monteiro, 1972).
Do these animals become fat through overeating or because their energyoutput is too low? There has been much interest in the possibility that brown fatmight ‘burn off ’ excess energy intake, but brown fat appears to be absent infarm animals after the first few weeks of life. This then might be why cattle,sheep and pigs do not control their body fat content as well as does the rat.Cattle, sheep, pigs and broilers seem to be more prone to obesity than otherspecies, possibly as a result of selection by man for fast growth (up to the middleof the last century), even if much of the rapid weight gain was in the form of fat.
Consumer preference has been to reduce amounts of fat in meat over thelast 60 years or so due, at least in part, to the general decrease in physical
2 Chapter 1

exertion of the human population. It is in the interests of the producer toreduce the amount of fat their animals deposit because of its low sale value andbecause the high energy content and low water content of adipose tissue makeit very expensive to produce – excessive intakes are therefore to be avoided.
Problems of undereating
Animals normally eat that amount of food which satisfies their energyrequirements, including continued fat deposition in the adult. There are somecircumstances, however, when insufficient is eaten, resulting in loss of bodyweight or a decrease in a productive process, such as growth or milk secretion(see Chapters 11, 15 and 16). Undereating can occur, in humans at least, evenin the presence of adequate availability of food (e.g. the condition of anorexianervosa). More commonly it occurs when there is a shortage of food (famine).
In farm animals the problem of undereating is most often seen withruminants where highly fibrous, bulky food is offered. This is digested slowlyand its disappearance from the rumen sets a limit to the rate at which morefood can be eaten; the mechanisms are dealt with in Chapters 3 and 11. Thisproblem of undereating is at its most acute when other abdominal organs arecompeting for space (uterus, fat) or when the energy requirements are veryhigh, as in early lactation. Food intake may be depressed also when the food isdeficient in an essential component such as protein, a mineral, a vitamin or anamino acid (see Chapter 12).
When the amount of herbage available for grazing is very sparse and eachmouthful is small, there may not be enough time in the day for the animal toeat enough to satisfy its nutrient demands. When snow, cold wind or hotweather prevent grazing there will again be inadequate food intake.
Matching Diet with Appetite
Under natural conditions animals such as ruminants, pigs and poultry are‘general’ feeders: that is, they eat from a wide range of foods. Initially, theysample most potential foods but as they learn the nutritive (or toxic) propertiesof each type of material they become more selective. Although energy isprobably the main controller of food intake there are other appetites – someinnate, others learned – that influence the animal’s choice of food and its totalintake. The aim of the animal nutritionist is to match the quantity and quality ofthe diet with the nutrient requirements of the animal. If the diet is offered adlibitum, this implies that the composition of the food should be such as to allowenough to be eaten to meet the animal’s nutrient needs, but not to over-consume.
In practice, this means offering a highly digestible nutrient-dense food (orfoods) when high production is required (growth, late pregnancy, earlylactation, egg production), but reducing the nutrient density of the food at othertimes so as to prevent excessive fat deposition. This control of diet quality is
Introduction 3

often achieved with ruminants by varying the amount of a cereal-basedcompound supplement while allowing free access to a more fibrous forage.With pigs and poultry, the greater degree of dilution with inert or poorlydigestible ‘fillers’ that is necessary to depress intake of digestible nutrientsusually renders this approach impractical, and restriction of food mustsometimes be practised (e.g. pregnant sows, broiler breeders).
The formulation of diets has become increasingly sophisticated, especiallyfor non-ruminants, so that they meet as closely as possible the requirements ofthe animals for which they are intended. Because requirements of an animalare for a given amount of a nutrient to be taken in a day, rather than per unit offood, assessment of optimum levels of inclusion of nutrients depends on aknowledge or prediction of voluntary intake if it is intended that the foodshould be given ad libitum, as is usually the case with poultry and pigs. It isunnecessary and impractical to control exactly the composition of ruminantfoods because they are going to be modified by ruminal fermentation, whichprecedes the normal processes of mammalian digestion.
Definitions
Voluntary food intake is the weight eaten by an animal or group of animalsduring a given period of time during which they have free access to food. Inthis book, the word food describes the materials that animals eat while a feed isa portion of food offered to an animal, usually of a size and materialdetermined by man. However, for ruminants especially, feed is often used tomean food and anyone dealing with practical animal husbandry must beprepared for this.
Distinct eating periods, which may include short breaks but which areseparated by longer intervals, are called meals and the short within-mealperiods of eating are called feeding bouts. In analysing feeding behaviour, aminimum inter-meal interval is often adopted, meals separated by intervals ofless than this value being considered as part of the same continuing meal. Thiscritical inter-meal interval, if it is to be applied, should not be selected arbitrarilybut only after study of a frequency plot of inter-meal intervals (see Chapter 2).When an animal starts to eat it is said to do so because it is in a state ofhunger; when it stops eating it does so because it is satiated. These two termshave no precise physiological meaning.
Given free access to food of good quality, individuals of many species mayeat 10–15 meals/day. Very often the distribution of meals through a 24-hperiod is not uniform, with more frequent, larger meals being taken during thephotophase in those species – including the common farm animals that aremore active during that period than at night.
Derived from measurements of meal size and inter-meal interval are thehunger ratio, i.e. weight of meal divided by pre-meal interval, and the satietyratio – i.e. weight of meal divided by post-meal interval. Appetite is used todescribe a drive to eat a specific nutrient, rather than to eat food in general.The word palatability has often been used to describe the overall sensory
4 Chapter 1

impression the animal receives from its food. However, there is no precise wayof measuring palatability and there seems little point in using the term.However, it is very widely used (e.g. Powell et al., 2000), and it may be betterto qualify it rather than to reject its use altogether (see Chapter 6).
The weight of food eaten per unit of time is the rate of eating. In this bookthe term refers to rate of eating during a meal rather than mean rate of eatingover the whole day, which is sometimes called rate of intake. In some cases ithas been possible to measure instantaneous rates of eating at different timesduring a meal and to show, for example, that rate of eating may decline as themeal progresses.
The total amount eaten during a given period of time (usually one day) isusually called the voluntary intake: this is often lower than the potential intake(the weight of food required to fulfil all of the animal’s nutrient requirements) dueto the physical or chemical constraints within the animal, or to environmentallimitations.
Methods of Measuring Food Intake
In order to study factors affecting voluntary food intake and to developmethods of prediction, we need to be able to measure intake in a variety ofexperimental and farm situations. Much of the more applied experimental workcovered in later chapters has relied for measurement of voluntary food intakeon single weighings of food at intervals of 24 h, but often at shorter andoccasionally longer periods. The method of 24-h weighings is not applicable tothe grazing situation, nor is it appropriate to the estimation of individual intakesof animals kept in a group, and Chapter 2 describes methods for monitoringfeeding behaviour.
When the fresh food is offered only once per day it is important to offersufficient so that at least 15% remains; excessive allowance may, however,enable selection of the more preferred parts of food mixtures (see Chapter 8). Itis important to recognize that the ability of animals to select an optimum diet(see Chapter 7) allows them to choose between different parts of the sameplant and they can select a much more nutritious diet than the overallcomposition of the forage would provide, if given a sufficient excess of thefood. For example, it has been shown that the digestibility of the herbage eatenby goats increases with the amount on offer until this amount on offer reachesabout twice the dry matter selected to be eaten by the animals.
Sufficient time should be allowed for animals to become accustomed tonew food before voluntary intake is recorded. For ruminants, at least 10 days isrequired because of the slow rate of passage and adaptation of the ruminalmicropopulation, but more prolonged standardization appears to beunnecessary. In view of the variability between individuals it is necessary to usea sufficient number of animals in order to get a reliable estimate of intake.
Variability between animals in a group does not differ greatly betweendifferent foods but is less when they are penned individually than when theyare penned together (Heaney et al., 1968). These authors observed that: ‘ …
Introduction 5

while intake is unquestionably an important index of forage value, highvariability of estimates (coefficient of variation, 0.16) renders it not so useful asit might appear at first sight’. It has been suggested that the effects of between-animal variation in measurements of voluntary intake can be reduced by usingthe intake of a standard forage by each animal as a reference point, but thiswould be very difficult to apply over a long period of time with large numbersof animals.
Marker dilution methods
In situations where it is not possible to measure intakes by individuals directly,such as grazing or group housing, indigestible markers added to, or alreadypresent in, the food can be used. Knowledge of the concentration of the markerin the food and measurement of its concentration in the faeces allowsdigestibility to be calculated. Alternatively, adding a known weight of a markerto the daily diet, followed by measurement of its concentration in the faeces,allows intake to be calculated, as long as digestibility is known. Digestibility iseither measured in individuals indoors by weighing the food and faeces or bythe use of two markers in the food, one at a known concentration, the other ata known dose. A group of plant waxes, the n-alkanes, possesses the requiredcharacteristics and are now widely used for herbivores (reviewed by Mayes andDove, 2000) and they have also begun to be used in other species, includingpigs (Rivera Ferre et al., 2001) and pigeons but not, as far as this author candiscover, in poultry.
Each animal is dosed by mouth with a known amount of n-alkanes, giveneither as a pellet or incorporated in the food. After several days to allowequilibrium to be reached, faeces are collected from each animal, either bygrab sampling from the rectum, by collection of faeces identified byobservation or by coloured plastic particles which can be given by mouth at thesame time as the marker. From the content of the marker in the faeces, totalfaecal production can be calculated. It is then necessary to know thedigestibility of the food in order to calculate the food intake; digestibility varieswith level of intake so that ideally the individually penned animals used todetermine the digestibility of the food should be of the same species,physiological state and level of intake as those whose intake is being estimatedin the group. The cumulative errors involved in these procedures make theresults unreliable, but useful for comparisons.
Developments in the use of n-alkanes have included the estimation ofconcentrate, as well as forage intake, taking advantage of the natural content ofsome of the n-alkane family in plant material (Mayes and Dove, 2000).Avoidance of regular oral dosing is a major aim of recent research. Forexample, how well can forage intake be estimated from a known intake of asupplement and an alkane-based estimate of the supplement and roughageproportions in the diet (Ginane and Petit, 2005)? The conclusion is that such amethod is valid and will be particularly useful in situations in which individualanimals, especially dairy cows, normally receive supplements.
6 Chapter 1

Classical Theories of Intake Control
This section briefly presents hypotheses of the way in which voluntary intakemight be controlled. Various aspects are then covered in detail in subsequentchapters.
The history of studies of control of food intake is reviewed by Gallouin and LeMagnen (1987). While there are many references to the subject before thebeginning of the 20th century, it was not until around 1950 that much objectivescientific study was directed at the problem. Having observed fluctuations in bloodglucose concentration in synchrony with meals, and mindful of the central role ofglucose in the metabolism of the rat, Mayer (1953) proposed the glucostatictheory, in which he envisaged that the animal attempted to maintain a relativelyconstant level of glucose in the blood by a central nervous monitoring system.
This has been modified in several ways, as described in Chapter 4, but theconcept that it is the supply of energy to the body that the animal attempts tomaintain by feeding is still very important. While rats and other simple-stomached animals reduce their food intake when glucose is supplied, as wouldbe expected, ruminant feeding is unaffected by glucose infusion. However,their intake is depressed by infusions of volatile fatty acids, the major productsof ruminal fermentation, suggesting that receptors for these acids are involvedin control of intake.
It had long been suggested that the capacity of the digestive tract is animportant limiting factor in feeding; this seems to be especially true forruminants, in which fermenting bulky food remains in the rumen for very longperiods. In the late 1950s, the importance of gut-fill had been demonstratedexperimentally (Balch and Campling, 1962), and the positive relationshipbetween the rate and extent of digestion of a forage and its level of voluntaryfood intake, which is so important in the utilization of forages, had beenestablished and used as evidence for a ‘physical’ limit to intake. However, it isalso generally accepted that ruminants can control their food intake to meettheir nutrient requirements under quite a wide range of circumstances, andthere is evidence of sensitivity to the chemical and osmotic properties of thedigesta that allow a ‘metabolic’ control of intake. It is likely that physical andmetabolic controls of intake are not mutually exclusive, but additive, and theMinimum Total Discomfort theory is based on the sum of squares of variousnegative and positive factors affecting intake (see Chapter 10).
While short-term changes in energy supply and gut-fill can be seen to beinvolved in the control of meal size and frequency, it is unlikely that they wouldgive a perfect balance between nutrient intake and nutrient requirements. Along-term imbalance must lead to an increase or decrease in body energystores, particularly adipose tissue, and it has been proposed that there is aroute whereby the size of fat depots is relayed to the CNS, which uses thisinformation in the control of intake: a lipostatic theory (Kennedy, 1953). This‘long-term’ signal must be integrated with the various ‘short-term’ signals inorder that the sum total of the food eaten at a series of meals is appropriate tothe animal’s long-term requirements. It now appears that leptin might fulfil thisrole (see Chapter 5).
Introduction 7

When requirements change, intake should change in parallel. For example,the onset of lactation creates a massive increase in the requirements for energy,protein and other nutrients. Normally voluntary intake increases to match butsometimes, especially for ruminants offered forages, low voluntary intake limitsmilk yield and causes mobilization of body fat stores. Climatic changes alsomodify energy requirements and food intake normally responds appropriately(see Chapter 17); the thermostatic theory of intake control (Brobeck, 1948)envisaged that animals eat to maintain a constant body temperature, but this isnow considered to be only a safety mechanism to avoid hyperthermia.
Because the unit of feeding is the meal, it has been suggested thatdifferences in meal size or inter-meal interval must account for differences infood intake over any longer period from a few hours to a lifetime. It wasproposed that, if we understand what causes an animal to start and stop eating,then we can claim to understand the control of voluntary food intake. While weknow that several occurrences during a meal (stomach distension, accumulationand flow of products of digestion) are able to induce satiety when imposedexperimentally, their significance to intake control is uncertain. These negativefeedback signals will be considered further in Chapters 3 and 4, and the pointwill be made that it is likely to be an integration (the sum or sum of squares) ofthese signals that controls not only satiety, but hunger also.
It must be recognized, however, that feeding behaviour is very plastic andthat daily intake can be maintained under a wide variety of meal patterns,voluntary or imposed. It now seems that it is intake over one or a few days thatis being controlled, rather than the size of each meal (see Chapter 2).
Nervous pathways from the viscera relay information to the brainconcerning such parameters as stomach acidity, abdominal temperature anddistension of various parts of the gastrointestinal tract. The lower part of thebrain responds with changes in signals controlling metabolic hormones(including growth hormone, insulin and glucagon); it also activates the highercentres to initiate, continue or cease feeding. Information on the environment isrelayed from the special senses influencing the basic control of feeding, which isexerted by the lower centres. The identity of the parts of the brain which areinvolved is covered in Chapter 5.
There are two major reasons for continuing to study the role of the brain inthe control of food intake in farm animals: on the one hand there are theagricultural implications of the possibility of manipulating intake bypharmacological or other means to improve animal productivity and welfare.On the other hand there is the possibility of using these species, especially thepig, as a more adequate model than the rat, for gaining deeper understandingof basic feeding mechanisms that will improve chances of combating thehuman problems of obesity and anorexia.
Prediction of Food Intake
In order to plan a feeding programme or to decide the optimum formulation ofa ration to meet the animals’ requirements under conditions of ad libitum
8 Chapter 1

Introduction 9
feeding, it is necessary to be able to predict the level of voluntary intake of afood or foods by farm animals.
There are two general methods for prediction: empirical equations andmathematical modelling, but the division between them is not absolute. Thefirst involves measurement of several parameters, including voluntary intake,followed by regression analysis to find the equation which best fits the data. Forexample, analysis of live weight (LW), daily gain (LWG), milk yield (MY) andvoluntary intake (I) measurements in a large number of dairy cows would yieldan equation of the form:
I = a + bLW + cLWG + dMY (1.1)
which could be used to predict intake in other animals of the same type. Notethat this equation is a ‘model’ insofar as live weight, live weight gain and milkyield might reasonably be expected to be causal factors in the determination offood intake.
The regression approach was adopted by the UK Agricultural ResearchCouncil (ARC, 1980) in their summary of voluntary food intake of ruminantlivestock. The most comprehensive review of the quantitative aspects of foodintake with particular reference to ruminants has been made by the USANational Research Council (NRC, 1987), using predominantly North Americandata. The reader is referred to this for more detailed coverage of the predictionof food intake.
The second type of prediction method involves incorporation of more basicbiological principles and functions that describe the relationships betweenfactors likely to underlie the control of food intake. Such methods are likely tobe less accurate at prediction but to be more general in their application. Seethe book edited by Dijkstra et al. (2005) for discussion of modelling inruminants. A dynamic model is one in which the predictions of one iterationare used as starting values for the next iteration, where time is incrementedbetween successive iterations.
Thus, equations that describe the relationship in ruminants between intakeand digestible energy concentration (metabolic control) on the one hand, andintake and rumen capacity (physical control) on the other, can be solved foranimals of given live weight, fatness and energy requirement. Whichever intakewas the lower would then be used to determine the level of weight gain (or loss)that will change body fatness and live weight for the next iteration, and so on.Such a model might well be constructed using two or more equations derivedempirically, as described above. Some examples are given in subsequentchapters.
It is clear that voluntary intake is influenced by both animal and foodfactors. Many prediction equations are based on one or the other, so it wouldbe surprising if they gave low errors of prediction under conditions somewhatdifferent from those under which the data used in their construction werecollected. The major effort in predicting intake has been for ruminants in viewof the importance of physical limitations on intake.

Problems and Pitfalls
In case this brief review gives the impression that we understand exactly howintake is controlled, it must be pointed out that there are numerous cases wheredifferent experiments and observations lead to contradictory conclusions. Thissituation can arise for many reasons: first, there may have been differences inexperimental protocol such as the type of food offered or the duration of anyperiod of food withdrawal before an experimental treatment or observation.Most studies of peripheral feedback signals either offer food ad libitum and addthe infused substance to the contents already in the gut or precede feeding testswith fasts of many hours, which put the animal in an abnormal state. Thedegree of stress to which animals are subjected might also influence the resultsof experiments on the control of intake.
Secondly, species differences. Hamsters do not increase their food intakeafter a period of food deprivation while rats invariably do. Would de Jong et al.(1981) have reached similar conclusions concerning the role of short-chainfatty acids (SCFAs) in the control of feeding in goats had they been workingwith sheep as did Anil and Forbes (1980b)?
Thirdly, differences in interpretation. For example, Le Magnen and Tallon(1966) found a close correlation between the size of a meal and the post-mealinterval, using an arbitrary minimum inter-meal interval of 40 min, andproposed that the onset of feeding is determined largely by the rate ofmetabolic utilization of the products of the previous meal. Castonguay et al.(1986) have used an objective method, based on a sudden change in thefrequency distribution of inter-meal intervals,1 to determine the minimum inter-meal interval and found it to be between 5 and 10 min. Applying this criterion,they failed to obtain a significant relationship between size and post-mealinterval and reached a different conclusion.
It is tempting to think that we can ultimately explain the control of food intakeonce we know about all the negative and positive feedbacks that pass informationto the CNS. However, it is becoming increasingly clear that learning plays a vitalrole (see Chapter 6). For example, animals learn the difference between two foodsoffered as a choice and base their relative intakes of the two on what they havelearned. Why should the intake of a single food not be subject to the samelearning processes? That is, the metabolic consequences of previous meals of thatfood allow the animal to anticipate the likely consequences of the current mealand to adjust its size accordingly. Thus, the nutritional and metabolic history of theanimal is as important in determining when and how much it eats, as are theevents occurring in the digestive tract, liver and CNS during the current meal.
The Minimal Total Discomfort Concept of Food Intake and Choice
While accepting the complexities of the control of food intake and choice,many proposals have been made for models encapsulating its major features
10 Chapter 1
1 See Chapter 2 for a better method of defining the critical inter-meal interval.

Introduction 11
(see Chapter 10). The Minimal Total Discomfort (MTD) concept is based on theprinciple that discomfort is caused by mismatches between what is being eatenand what the animal needs to match its current needs, as well as by physicaldistension and environmental factors, including social and climatic; it is furtherproposed that these discomforts are combined into a total signal that theanimal tries to minimize. This model will be used as a linking feature in manyof the following chapters, as well as being described and discussed in detail inChapter 10, in order to provide continuity.

2 Feeding Behaviour
The term ‘feeding behaviour’ generally refers to meal-taking activity, in whichthe time (and weight) of each meal is monitored. However, it can alsoencompass events within a meal and the number, frequency and size ofindividual bites have been monitored and, in some cases, at an even finerscale, the movement of the head and mouth during a bite have been recorded.
Monitoring and analysing feeding behaviour are areas of considerablescientific activity, but their importance in understanding and predicting foodintake and selection over longer periods, e.g. a day, is dubious. While the weightof food eaten over periods of a few days can be related to such factors as theanimal’s nutrient requirements and the composition of the food, there is veryconsiderable variation in biting and meal-taking activity during the course of aday, even between similar individuals within a group. Many factors affect feedingbehaviour, including the degree of competition for food and environmentalvariables – the weather and management system – without having major impactson food intake over periods of several days.
An example of this disparity between feeding behaviour and long-termfood intake is shown in Fig. 7.9, in which it can be seen that daily choices of acow fluctuate markedly, while weekly intake is very stable. If our interest isprimarily in farm animal production, then feeding behaviour may simply be adistraction and, even if it is important in the physiological control of meals,then we need to know how short-term variations in intake can be cumulatedinto long-term consistency.
The justification for monitoring feeding behaviour is, on the one hand, toallow measurement of daily intake in situations in which it cannot be measureddirectly (e.g. group housing, see below) and, on the other, to satisfy curiosityand with the hope of gaining understanding about the factors controlling intakeover periods of a day or more.
12 © J.M. Forbes 2007.Voluntary Food Intake and Diet Selection in Farm Animals 2nd Edition (J.M. Forbes)

Monitoring Individual Feeding Behaviour
This has traditionally been carried out by many hours of patient observation,noting at regular intervals whether or not each animal is eating, ruminating,standing, etc. While there is no substitute for this in terms of learning aboutanimal behaviour, and certain types of behaviour are not amenable toquantification in any other way, this method suffers from two major drawbacks:it is very time-consuming (this can be overcome to some degree by videorecording and observing the playback at a fast speed) and it does not provideinformation on the weight of food eaten, but only on the timing of meals.
Automated systems
Comprehensive data can be collected by continuous automatic recording of theweight of the food container. If the weight is static the animal is not eating. Theduration of a meal is signalled by frequent oscillations in the weight of thecontainer as it is disturbed by the animal’s head; the weight of food eatenduring that meal is the difference between the weights before and after themeal. It is often possible to obtain intermediate weights during a meal when theanimal is not touching the container and thereby to determine the rate ofeating at different stages during the meal.
In fully automated systems used at Leeds University, UK, for sheep, pigs andchickens, each balance is programmed to transmit continuously the weight as astring of digits through a multiplexer to a PC. Each time a weight is obtained it iscompared with the previous weight from that balance. If there has been nochange then it is initially assumed that the animal is not eating; if previously theanimal was eating then a potential end of meal is stored. However, in case this isjust a pause in a meal, a series of stable weights over the period required for aninter-meal interval is necessary to confirm that the meal has indeed ended.
If, on the other hand, there is a difference between two successive weightson the same balance, then the animal is detected as eating; if this follows aperiod of stable, i.e. non-eating, weights, then the start of a meal is signalled.Each pen or cage can be provided with more than one weigher, so that theintake of two or more different foods and water can be monitored.
Operant conditioning
In the systems just described, the animal has free access to the food; analternative is to teach the animal to ‘work’ for a reward of food (reinforcement)by pressing a button (response), a technique known as operant conditioning(pigs and sheep, Baldwin, 1979; chickens, Clifton, 1979; cattle, Matthews andKilgour, 1980). The number of responses the animal has to make before areward is given (the reinforcement schedule) can be increased in order to seehow strong is its desire for food. The use of operant conditioning techniquesensures that the animal eats only when it has a definite urge to do so, and not
Feeding Behaviour 13

simply when it happens to find itself near to food. The apparatus used tocontrol the reinforcement schedule can easily be adapted to keep a record ofthe timing of responses for subsequent analysis of meal occurrence.
Perhaps operant conditioning, in which the animal has to ‘work’ for food,might be a method of avoiding the social eating so often seen when animalsare penned in sight of each other – one animal’s eating often triggers that ofanother when the second would not have otherwise taken a meal at that time,thus confounding a strict ‘physiological’ experimental design. It must berecognized, however, that single confinement may induce abnormal behaviour.Savory (1989) has suggested that having to do a moderate amount of work forfood avoids eating from boredom and gives more natural patterns of feedingunder laboratory conditions.
Monitoring of jaw movements
The timing of eating and ruminating can be monitored by means of a smallballoon or a pressure transducer held on the animal’s lower jaw by means of abridle. In the upper half of Fig. 2.1 can be seen patterns typical of eating,showing both long and short timescales. At the left, eating bouts can be seenwhile at the right the individual jaw movements are clear and allowdifferentiation to be made between prehension (1) and mastication (2). In thelower part of the figure can be seen rumination jaw movements, at low andhigh resolution, the latter demonstrating the very regular movements comparedwith the irregularities of eating. Some progress has been made in analysingsuch records by computer (S.M. Rutter, personal communication).
Monitoring Feeding Behaviour in Groups
The relatively simple methods available for automatically recording the mealstaken by individuals penned by themselves are not all suitable for monitoring
14 Chapter 2
Fig. 2.1. Recordings of traces of jaw movements of sheep using a small foam-filled balloonin the submandibular space connected to a pressure transducer (from Jarridge et al., 1995).

the behaviour of individuals in a group. Observation, either direct or by videorecording, is still possible for animals in groups when individuals can beidentified by sight. With modern electronic equipment, recognition ofindividuals is possible and a food dispensing system can identify animals andrecord the amount of food eaten by each individual. Such systems areavailable commercially for the recording and/or control of the concentrateallowance to individual dairy cows kept in groups (out-of-parlour dispensers)and for groups of growing pigs for genetic selection purposes on breedingfarms. While these systems are suitable for pelleted foods, they cannot be usedto dispense long roughages.
Full details of meal patterns of forages by individuals in a group can bemonitored by continuous automatic weighing of the box containing the food,with animals identified as they eat by means of transponders worn on their eartags or collars. An example is that developed by Forbes et al. (1986), in whichcows wear collars with transponders of the type available commercially foridentification in the milking parlour or at out-of-parlour concentrate dispensers.The food is placed in boxes mounted on top of load platforms which arecapable of weighing to the nearest 0.1 kg. Both food weighing andidentification systems are multiplexed to a PC with software to collect mealpatterns at each weigher and also for each cow. A controlled-entry, solenoid-controlled door can be provided for each feeder (e.g. a Calan® door), whichallows certain animals to be prevented from eating from some or all of the foodboxes for some or all of the day.
Thus, it is possible to have a group of animals, managed as a herd, in whichdifferent individuals have access to different foods; it is also possible to restrictanimals to eating within given periods of the day and/or to predeterminedweight of food(s). Figure 2.2 illustrates an example of the feeding pattern of onecow obtained using this system (known as the LUCIFIR system).
Other systems have been developed elsewhere (e.g. Insentec, http://www.insentec.nl/). Equipment such as this is expensive but yields a very large amount ofdetail about feeding behaviour; it also allows animals to be kept in groups for themeasurement of intake and thus avoids the likely effects of individual confinement.In addition to its use for research, it is being used by breeding companies to enablethe intakes and thus efficiencies of individual animals to be used in the selectionindex. Several pig breeding companies are using automated food intake recordingsystems to monitor daily intakes of individual pigs kept in a group.
We have recently developed a system (Leeds University Pig Intake System,LUPINS) for monitoring feeding of weaned piglets, in which small weighed foodhoppers are suspended from electronic balances alongside which are antennae fordetection of piglet identity from transponders carried in their ear tags. Figure 2.3 isa diagram of the system, while Fig. 2.4 is a photograph showing the feeders in apen of pigs. The output is similar to that for the bovine system, but the advantageof using commercial digital balances is that they provide an additional signal(stable/unstable) that assists in the analysis of the data; sometimes animals changeso quickly at a given feeder that it is impossible to obtain a stable weight. In thiscase, an ‘unstable’ signal accompanies the weight, which can then be ‘corrected’(i.e. the best estimate calculated) during the subsequent analysis phase.
Feeding Behaviour 15

16 Chapter 2
Fig. 2.2. An example of the meals of silage and concentrates and the drinks of water takenby a lactating dairy cow during a 24-h period using the LUCIFIR system (D.A. Jackson, J.M.Forbes and C.L. Johnson, unpublished results). S, meals of silage; C, meals of concentrates;U, visits to the concentrate dispenser that go unrewarded as the requisite time since lastdispensation has not elapsed; D, drinks of water; E, visits to the concentrate dispenser thatgo unrewarded as the daily allowance has been exhausted.
Fig. 2.3. Diagram of side view of a LUPINS feed station for young pigs.

Analysis of Meal Data
Reduction of meal data: calculation of inter-meal interval
Typically, the data generated by automatic recording systems are of the form:(i) animal identity; (ii) serial number of feeding station; (iii) times of start andend of meal; and (iv) weights of start and end of meal, with each meal forminga record in a computer file. These data can be manipulated by statisticalanalysis programs, by purpose-written software or by means of a spreadsheetor database program. Calculation of total intake per day or during particularperiods of the day is straightforward, as is calculation of inter-meal interval, rateof eating, hunger and satiety ratios.
However, it is first necessary to consider ‘When is a meal not a meal?’ Animalsinvariably take short pauses during a meal and these must be differentiated fromthe longer gaps between separate meals. Sometimes an arbitrary period has beenused. However, examination of the frequency distribution of inter-meal intervalsoften shows that these intervals form two distinct populations. In several species ofbird, for example, intervals of more than a few minutes between feeding bouts aredistributed in the form of negative exponentials, implying that there is a constantprobability of a meal starting. However, the shortest intervals between meals do notfollow this pattern and can be regarded as breaks in a meal, rather than trueintervals between meals.
Feeding Behaviour 17
Fig. 2.4. Piglets in pen with four-station feed monitoring system. Balances are protected by alid and feeding apertures are adjusted according to the size of pigs with masks, throughwhich the feed hoppers can be seen.

Duncan et al. (1970) plotted the frequency distribution of inter-mealintervals for domestic fowl and noted that there were far more intervals of � 2min than would be predicted from the negative exponential of the rest of thedata, and 2 min was therefore adopted as the minimum inter-meal interval. Forlactating cows fed grass silage at the Leeds University farm, the critical inter-meal interval was found to be close to 7 min (Forbes et al., 1986), and thisvaried little between animals or with season or physiological state of the cows.
However, these approaches to defining meals have been seriously questionedby Tolkamp and colleagues (1998c), based on the convincing argument that ifmeals are satiating then the probability of an animal starting to eat again after ameal should initially be low, but then increase as the satiating properties of themeal decline. Thus, there would be a large number of short (within-meal) intervalsand a large number of long (inter-meal) intervals, with relatively few ofintermediate length. They tested this proposition with data collected from 16 dairycows and compared the following methods of deriving the inter-meal interval(Tolkamp and Kyriazakis, 1999):
● ‘Broken stick’ (two straight intersecting lines, both with a negative slope) tothe frequency distribution.
● Log(e)-transformed cumulative frequency distribution (the log-survivorshipcurve).
● Log(e)-transformed frequency distribution.● Two Gaussians fitted to the frequency distribution of log-transformed
interval length (log-normal models).● Three Gaussians fitted to the frequency distribution of log-transformed
interval length (log-normal models).
They found that the frequency of intervals to visits to feeders was muchbetter described by two log-normal distributions than by a random probability.Inter-meal interval was estimated as 1.9, 6.0, 7.5, 32.4 and 49.1 min by thesemethods, respectively, while meal number was between 5.7 and 12.1/cow/dayand meal size from 4.0 to 8.4 kg. The two log-normal models fitted the datamost closely, and it can be concluded that they are the most useful forestimating meal criteria in cattle and probably in other species as well.
It was noted that there was a small third peak, seen as an irregularity onthe descending part of the first, and this was traced to intervals between mealsand drinks, which often occur in close association. Inclusion of a thirddistribution representing these intervals – including drinking – gave an evenbetter fit than the two-peak model (Tolkamp and Kyriazakis, 1999). These threesegments of the relationship can be seen in Fig. 2.5, which was generated fromalmost 80,000 pauses between automatically recorded meals of dairy cowsoffered completed foods. They represent: (i) intra-meal pauses; (ii) intervalsbetween eating and drinking; and (iii) true inter-meal intervals. Once the criticalinter-meal interval has been determined or estimated for the animal(s) inquestion, raw meal data can be merged into ‘true’ meals.
This log-normal approach has been used for growing pigs by Morgan et al.(2000a), who analysed visits to feeders by 16 individually housed growing pigs for35 days. Intervals between visits were described by two log-normal distributions,
18 Chapter 2

as described for cows, above. For all the animals, the mean intra-meal interval was11.2 s and the mean inter-meal interval was 110.1 min; the critical intervalseparating the two types of intervals was 1.29 min. The three-Gaussian modelgave an improved fit to the interval distribution and an estimate of the inter-mealcriterion of 2.78 min. Although this was more than twice the criterion from thetwo-Gaussian model, this has little effect on the number (approximately 14/day)and size of meals as there are relatively few intervals in this part of the distribution– most intervals are short (< 30 s) or long (> a few min). The probabilities ofmeals of these pigs starting were different between daytime and night-time(Morgan et al., 2000b), so that pooling data for all times of the 24-h cycleintroduces a false appearance of randomness.
Meal Patterns
Farm animals feed in discrete meals and considerable effort has gone intotrying to discover what causes them to start and stop eating, on the premisethat if we understand this then we will understand how food intake iscontrolled. However, despite the discovery of numerous factors that influencemeal onset and cessation, we have to take on board the fact that intakes over
Feeding Behaviour 19
Fig. 2.5. Observed frequencies of inter-meal intervals for lactating cows offeredconcentrate/silage mixtures (●) and probability density functions for the three-Gaussiancurves (––), with their summation (–– ) (from Tolkamp and Kyriazakis, 1999).

longer periods are invariably much more stable than those over short periodsof one or a few meals. Stability of intake over several days is observed in theface of extreme variability of meal size and interval.
This is shown nowhere more clearly than in the results of Savory (1989),from a study in which chickens were trained to respond in order to obtainaccess to food. As the number of pecks required for access (the fixed ratio, FR)was increased, so the meal size increased, the number of meals decreased andthe rate of eating increased, but the daily intake of food remained stable(except at the very high FR of 160) (see Fig. 2.6).
Nevertheless, meal size and inter-meal interval must be co-controlled in orderthat daily intake be regulated, and there has been considerable speculation as towhich of these is modified. Are meals initiated at random and their size controlled,or is the interval between meals controlled by the size of previous meal(s)? Thesequestions will be addressed below in a discussion of hunger and satiety ratios.
Even when the food, the environment and the animal itself do not changesignificantly, there can be considerable differences in the patterns shown bydifferent individuals, even when conditions are similar (e.g. Barrio et al., 2000).Clearly, variability in meal patterns is enormous and its analysis features instudies of feeding behaviours (below), as well as in the use of feedingparameters in animal breeding programmes (see Chapter 15).
It has been suggested that grazing animals are not meal-eaters because theyoften seem to spend most of the day eating. This is because the slow rate atwhich they can harvest herbage means that they have to take very long meals inorder to try to satisfy their hunger but, with more easily harvested foods, wherethe rate of eating easily outpaces the rate of utilization of nutrients, meals are
20 Chapter 2
Fig. 2.6. Food intake (♦, g/day), time spent eating (�, min/day), meal size (�, g) and numberof meals per day (●) for chickens with different numbers of pecks required to gain access tofood (from Savory, 1989).

Feeding Behaviour 21
discrete. Our assumption is that the various classes of farm animal, ruminant andnon-ruminant, have similar basic mechanisms of controlling their food intake,although differences in anatomy and metabolism that have evolved to suit themfor particular niches have resulted in emphasis on different mechanisms indifferent species and in different physiological states.
The study of feeding behaviour has been given a great boost by thedevelopment of automated methods of monitoring meal timing and weights,described above. While the primary purpose of such methodology is to allowdaily intakes of food by individual animals kept in a group to be monitored, ithas resulted in some development of our understanding of feeding behaviour.
Movement between feed stations
When housed in groups with access to several food hoppers, animals usuallymove between feeders during a meal. To what extent should this be taken intoaccount in determining meal occurrence? Tolkamp et al. (2000) analysed visitsto feeders by cows offered two foods of differed protein content and those withaccess only to one of the two foods. Single-visit characteristics were poorlycorrelated with daily intake and the probability of cows ending a visit did notchange greatly with visit length.
Visits were then grouped into meals according to the log-normal modeldescribed above; neither inter-meal interval (44.7 +/– 2.1 min), meal duration(36.9 +/– 1.3 min) nor daily number of meals (6.1 +/– 0.1) were affected bytreatment, and the probability of cows ending and starting a meal increased withmeal length and interval between meals, as predicted by the satiety concept. Itcan safely be concluded, therefore, that it is meals rather than visits to feedersthat are the more meaningful description of short-term feeding behaviour.
Statistical Analysis of Meal Data
Various ways of analysing meal pattern data are discussed by Panksepp (1978).This section covers some of the more commonly used methods.
Univariate analyses
Methods such as t-test and analysis of variance have usually been used tocompare means of parameters such as daily intake, meal size and rate of eating.However, because many feeding characteristics, such as meal duration, mealsize and inter-meal interval, are inter-correlated, the use of univariate tests foreach variable is likely to yield some false significant differences. It is, therefore,often advisable to use multivariate methods of analysis. Where intake has beenmeasured at several intervals during and after an experimental treatment, theintakes during each time interval should be analysed rather than cumulativeintakes (Fitts, 2006).

Multivariate analyses
These methods include multiple analysis of variance, discriminant analysis andmultiple regression analysis, in which more than one meal-related variable canbe included. This is a complex area of statistical analysis (see Geiselman et al.,1980, for examples).
Sometimes, to reduce the huge amount of data collected by automaticsystems, calculations are made of mean meal size and inter-meal interval.When done for whole days this disguises the fact that there is a circadianrhythm of feeding behaviour, so the day can be divided into periods of, say,4 h and means calculated for each period (Forbes et al., 1989).
Figure 2.7 shows the number of meals, meal size and rate of eating bysheep during the six 4-h periods of the day during late pregnancy, lactation andafter weaning. The number of meals/4 h declined from the time when freshfood was offered, as did meal size. However, rate of eating did not differbetween different periods of the day. The increase in total food intake betweenpregnancy and lactation was due to an increase in meal numbers, while theslight fall in intake after weaning was due to fewer meals of larger size than inlactation, eaten at a faster rate.
22 Chapter 2
1000
600
500
400
200
0
Foo
d in
take
(g/
4 h)
No.
of m
eals
(/4
h)
1 2 3 4 5 6 1 2 3 4 5 6 1 2 3 4 5 6
1 2 3 4 5 6 1 2 3 4 5 6 1 2 3 4 5 61 2 3 4 5 6 1 2 3 4 5 6 1 2 3 4 5 6
Period of dayPhysiological status
Pregnant Lactating Weaned
Pregnant Lactating Weaned
1 2 3 4 5 6 1 2 3 4 5 6 1 2 3 4 5 6
Pregnant Lactating Weaned
Pregnant Lactating Weaned
(a) (b)
(d)(c)
10
8
6
4
2
0
Rat
e of
eat
ing
(g/m
in) 40
30
20
10
0
Mea
l siz
e (g
)
150
120
90
60
30
0
Fig. 2.7. (a) Food intake, (b) meal numbers, (c) meal size and (d) rate of eating by pregnant,lactating and weaned ewes during different periods of the day (from Forbes et al., 1989).

Feeding Behaviour 23
Forbes et al. (1989) confirmed that feeding behaviour of ewes wasmarkedly affected by physiological state using discriminant function analysis,which showed that there was very little overlap between pregnancy, lactationand weaning in the characteristics of eating as described by total daily intake,rate of eating, meal weight, number of meals, satiety ratio and time spenteating.
Division of the day into arbitrary periods is an artificial procedure, andmethods that adopt a more continuous approach have been developed.Deswysen et al. (1989) used Fourier analysis to extract rhythms from mealpatterns recorded from heifers offered maize silage. There were large andconsistent cycles with phases of 24, 12 and 8 h; the authors speculate aboutthe physiological significance of these rhythms, but only the 24-h cycle isclearly explicable as it is related to the diurnal light cycle and the daily offeringof fresh food.
Barrio et al. (2000) noted that individual water buffalo had differentfeeding patterns but that any one animal had a similar pattern on consecutivedays. They used cluster analysis to characterize these patterns and saw that thefirst meal after fresh food (hay) had been offered was longer and heavier thansubsequent meals.
Hunger and satiety ratios
Close correlation between the size of meals and the length of the precedinginter-meal intervals implies that there is a mechanism that determines whenfeeding should stop, i.e. that satiety mechanisms predominate. If, on the otherhand, there is a significant correlation between meal size and post-mealinterval, this implies that there is a mechanism for determining when feedingshould start, i.e. a hunger mechanism. The hunger ratio has usually been foundto be more important than the satiety ratio in chickens, as in rats. It has beensuggested that using a fixed schedule operant situation gives more ‘normal’feeding patterns with more reliable hunger ratios. In cattle, Metz (1975) found apositive correlation between meal size and the length of the pre-meal interval,as did Baile (1975) with sheep offered a 0.6 concentrate:0.4 forage mixture,i.e. the hunger ratio was thought to be more useful than the satiety ratio.
Note, however, that statistically significant ratios between meal weight andprior or subsequent intervals might be a consequence of using inappropriateinter-meal intervals. If arbitrarily defined inter-meal criteria are used that areshorter than the ‘true’ biologically defined interval (as in the two examples citedimmediately above), there will be many small meals separated by shortintervals, which will give closer correlations between meal size and pre- orpostprandial interval than if the more biologically meaningful interval is used. Itis important, therefore, that a method with biological integrity be used for thecalculation of inter-meal intervals if false conclusions are not to be drawn fromdata on feeding behaviour.
In Tolkamp’s observations, lengths and weights of meals by cows weredistributed according to negative exponentials, suggesting that the termination of

meals was largely random and not tightly controlled by the animal reaching athreshold level of satiety. Although statistically significant, pre- and postprandialcorrelations were associated with very small proportions of the variation in mealsize (Tolkamp et al., 2002). Preprandial correlations, although low (r ≈ 0.12)were about four times higher than postprandial correlations. This is a sign thatfeeding behaviour is determined more by satiety than by hunger mechanisms,and means that cows manage their daily intake by means other than inter-mealinterval, i.e. feeding behaviour is flexible but, the longer the time over whichmeals are summed, the more stable and predictable is intake. Therefore,detailed studies of feeding behaviour are of little direct help in improving ourunderstanding of what physiological mechanisms underlie the control ofvoluntary food intake on a longer timescale.
Description of Feeding Behaviour and its Development
In this chapter we do not describe in detail the many and various methodsanimals use to harvest food. The book by Fraser and Broom (1997) gives auseful introduction to feeding behaviour, while considerable detail of thefeeding process can be found in that edited by Bels (2006). It is, however,appropriate to describe briefly some of the main features.
Poultry
For the first 2 days after hatching, chicks are not dependent on eating food asthey have sufficient reserves from the yolk sac. In the first few hours they eatlittle or nothing, although they are exploring their environment and pecking atsmall, round objects.
Chickens peck jerkily at food items, pick up the grain in their beak andthen lift the head back before swallowing (see Appleby et al., 1992b for adetailed description of feeding behaviour in poultry). Yo et al. (1997a) providevery detailed studies based on high-speed video recording and Picard et al.(2000) follow this up with further observations that demonstrate the rapidlearning of day-old chicks to associate nutritional effects with the sensoryproperties of the food, based on both their visual and tactile senses.
A novel analytical technique has been applied to describe the patterns ofactivity during pecking at food by chicks, in which hidden (i.e. not obvious tothe human observer) time patterns of behaviours not randomly distributed intime are exposed (Martaresche et al., 2000). It was seen that some pecking atfood is organized in regular patterns while other pecking, which increases whenthe physical form of the food is changed, is not so organized. It was suggestedthat the latter might be a way in which the chick gathers information aboutnovel foods.
Isolated birds feed in frequent, brief bouts from which it is difficult to definea meal (Kaufman and Collier, 1983). However, when the cost of feeding is
24 Chapter 2

increased, chickens exhibit similar patterns of feeding to mammals, and similarfunctional relations between foraging cost, meal frequency and meal size, i.e.meal frequency and, eventually, daily intake, decline with increasing difficultyof obtaining food. The authors conclude that: ‘Meal patterns do not reflectmomentary fluctuations in the internal environment; rather, they appear to be abehavioural device that animals adjust to exploit the available resources in theircurrent habitat efficiently’. Savory (1989) has suggested that feeding behaviourshould be studied in conditions where birds have to do a modest amount ofwork to get food, as this provides more clearly defined meals than when food iseasily available all the time.
Although broiler chickens eat almost twice as much as layers of the sameage, they spend only half as much time eating and take more meals of shorterduration (Masic et al., 1974).
Feeding data of poultry have not yet been subjected to the rigorousanalytical methods of Tolkamp and colleagues to define the critical inter-mealinterval. However, analysis of a modest amount of data – from 11 individuallycaged male chicks of a layer strain, 9 weeks of age with an average bodyweight of 1115 g – has been performed (Hannah, 2001, using data from M.Picard). The food provided 13.0 MJ ME and 190 g protein/kg. In every birdthere were two peaks of interval frequencies, and an example is given in Fig.2.8. Note that intervals of � 5 s have been filtered out before analysis, so theleft-hand distribution is artificially truncated at 1.6 (natural logarithm of 5).
It is clear from these relative frequency distribution plots that twopopulations of intervals are present, i.e. intervals within and between meals.These initial observations suggest that the log-normal model incorporating twoGaussian distributions can be used to analyse the data to obtain the criticalinterval time between meals in chickens, which was found to be 1 min 49 s forthe bird shown in Fig. 2.8. The proportion of intervals in the first distributionwas calculated to be 0.82. To calculate how many meals/day this bird was
Feeding Behaviour 25
Fig. 2.8. Relative frequency distribution of natural log-transformed intervals between feedingactivity (interval length in s) of an individual chicken (from Hannah, 2001).

eating, the number of intervals/day between feeding activities must bemultiplied by the proportion of intervals in the second distribution (1 – 0.82 =0.18). The total number of intervals recorded for this chicken was 175/day, sothe number of meals/day eaten was 175 � (1 – 0.82) = 31.5. Ten other birdsin the same study had critical inter-meal intervals of 18–163 s and took 30–70meals/day.
The mean critical interval time between meals is therefore just under 3min. The relative paucity of intervals in the middle of the distribution (between1 and 20 min) means that changes in the critical interval within this range donot have a very large effect on the calculated number of meals.
Beak trimming
While beak trimming, sometimes carried out on laying hens to overcomefighting, does not affect daily food intake or meal number or size (Persyn et al.,2004), beak-trimmed birds spent more time per day eating (3.3 versus2.0 h/day), so ate more slowly (0.43 g/min-kg0.75 versus 0.79 g/min-kg0.75).Trimmed hens seemed to be more selective as there was a higher proportion oflarge particles in the food refusals, suggesting that they found it more difficult topick up particles, for which the tip of the beak is required. Because of thisselection the food actually eaten by the trimmed birds had somewhat highercrude protein and mineral contents than for the untrimmed hens.
Pigs
Pigs grasp at food with their mouths and chew vigorously to mix it with salivabefore swallowing the bolus. When kept outdoors, they spend a lot of timerooting in the soil with their snouts. Pregnant sows with nose rings to inhibitrooting ate pellets more slowly than did those without rings, especially whenthey had to root in turves for the food pellets, putting them at a disadvantage ifa mixed group is given a limited amount of pelleted food (Horrell et al., 2000).
Stolba and Wood-Gush (1989) described the behaviour of domestic pigs ina semi-natural environment. Concentrates were given, as the paddocks werenot large enough to support the groups with natural food. Even so, on average,31% of the day was spent grazing and 21% rooting, i.e. over half of the timewas spent in ingestive activity. The animals turned turves over to get at wormsand prized certain types of root, especially tree roots and those of sedge.Stereotypies and vices, common in indoor confinement, were absent.
Individually housed pigs have shorter and more frequent visits to thefeeder than do pigs kept in groups. Nielsen et al. (1996) initially housedgrowing pigs in groups of ten for 14 days and then moved selected animals intoindividual housing. Contrary to expectations, the animals’ feeding behaviourdid not appear to change greatly within this new social environment. Theindividual housing resulted in only a small increase in the frequency of feedervisits. The authors suggested that the feeding pattern of growing pigs may beless flexible than expected.
26 Chapter 2

Cattle
Dulphy et al. (1980) and Dulphy and Faverdin (1987) have reviewed thefeeding behaviour of ruminants in detail. A characteristic of grazing cattle is thatthey wrap their tongue around herbage and pull rather than biting cleanly.They walk slowly forward, moving their head from side to side to takemouthfuls as they go.
The feeding behaviour of housed cattle depends to a large extent on theratio of animal numbers to length of trough. If there is sufficient space for allanimals to eat at once then this they will do, especially when fresh food hasbeen given or when they have just returned from milking. At other times aproportion will be eating leisurely. If, however, there is insufficient space for allanimals to eat simultaneously then a great deal of manoeuvring takes place,dominant animals displacing timid ones, and meals tend to be a succession ofbrief episodes interspersed with movement to other feeding positions. Thosecows lower in the social dominance order are forced to eat at less popular timesof day, including late at night.
Using a critical inter-meal interval of 9 min, it was found that Friesian-Holstein cows in early lactation ate an average of 8.7 meals/day, irrespective ofwhether the silage dry matter (DM) content was high (H, 449 g/kg) or low (L,215 g/kg) or whether the supplementary compound food was high in starch orhigh in digestible fibre (Romney et al., 2000). The results show that chewingindices (time spent eating silage, ruminating and total time chewing/kg DMingested) were significantly greater for the L silage, while time spent eating, andduration and number of meals were similar for either silage. The most likelyexplanation for the greater intakes of H is a faster particle breakdown in therumen, allowing larger meal sizes before animals became constrained (seeTable 2.1). Factors affecting silage intake are discussed in Chapter 14; theinformation given here is as an example of eating parameters in dairy cows.
In a similar experiment, intake reached a peak in mid-lactation, while thenumber of meals per day reached a nadir around week 15 of lactation(Jackson et al., 1991). The daily intakes of silage for the two supplement typeswere 10.8 and 13.0 kg DM, respectively, eaten in 209 and 229 min. Thus thehigher silage intake was achieved on the digestible fibre supplement by eating
Feeding Behaviour 27
Table 2.1. Food intake parameters derived from 48 h continuous recording of intake for dairycows consuming low (L) or high (H) DM silage supplemented with 9 g/day concentrates (fromRomney et al., 2000).
Silage L H Significance
Silage intake (kg DM/day) 9.0 13.8 +++Time spent eating (min/day) 183 200 nsa
Rate of eating (g/kg) 49 69 +++Number of meals 8.4 8.6 nsIntra-meal pauses (min/day) 27.6 36.8
a Not significant.

larger, longer meals. Figure 2.2 shows an example of a 24-h meal pattern ofone cow. In this case, nine meals of silage were taken and three allocationseach of 2 kg concentrates were dispensed. At 230 min, she tries to getconcentrates but is not allowed and diverts her attention to eating silage. Someof the silage meals are protracted and fragmented (e.g. those at 650–750 min),while others are continuous (e.g. that starting at 840 min).
Dado and Allen (1994) have monitored feeding, ruminating and drinkingbehaviour in lactating cows offered a total mixed ration and have concludedthat a Latin Square design with 12 cows monitored for 5 days would besufficient to detect a 10% difference between means for feeding-relatedbehaviour variables with a probability of 80%.
Sheep
From 2 or 3 weeks of age, lambs spend increasing amounts of time nibbling atfood. After weaning they eat by prehending food with their lips and tongue,pulling it back into the mouth for extensive chewing.
Sheep can select well as they have a narrow bite. However, they have ablind area about 30 mm in front of the nose so they can’t see clearly what theyare eating! Perhaps they use touch to decide exactly what to eat. When theyare selecting actively, e.g. green material from a predominantly dead sward,rate of eating is greatly reduced. The best way to monitor what sheep areselecting is to collect oesophageal extrusa from fistulated animals, although it isthen difficult to identify the various parts of the plants. Lynch et al. (1992)cover feeding behaviour of sheep in detail.
Dulphy et al. (1980) reported a mean total eating time of 305 min/day forwether sheep fed fresh-cut green forages, with a mean rate of eating of 4.3 gDM/min. These animals took 7.5 meals/day and spent an average of 537min/day ruminating.
Rate of Eating
When it is possible to measure intermediate weights of the food during thecourse of a meal it can be seen that rate of eating sometimes declines towardsthe end of the meal.
Poultry
Growing broilers eat faster than layers of the same age (Masic et al., 1974), but itis not clear whether this is because they are bigger and heavier or have a greaterneed of nutrients. Rates of eating were significantly faster for pellets than for thesame food in powdered form, and declined during the 30 min after giving foodafter a 0–4-h fast (Savory, 1988). The weight eaten in the first 5–10 min wasproportional to the length of the previous deprivation period (see below).
28 Chapter 2

Pigs
Auffray and Marcilloux (1983) observed a deceleration in the rate of eating asthe meal progressed. ‘Unpalatable’ foods are eaten more slowly than ‘normal’ones and rate of eating often increases over a period of several weeks as theanimals learn that the food is completely safe. It had been assumed that rate ofeating would be influenced by the bitter-tasting glucosinolates present inrapeseed meals but, in the work of Lambert et al. (1992), the food eaten mostslowly was that lowest in glucosinolate!
Cattle
Faverdin (1985) observed that the rate of eating of a complete food by alactating cow increased linearly from 50 g/min in the first few days of lactationto 90 g/min in week 9 of lactation. The rate declined as a large mealproceeded, from 120 to about 50 g/min due to longer pauses in actual chewingas the meal progressed. Intake rate at the beginning of the meal is four to fivetimes higher than at the end for cows eating maize silage.
The mean rate at which lactating mature cows ate grass silage (54 g DM/min,Jackson et al., 1991) was very similar to that for lactating heifers eating acomplete silage/concentrate mixed food, with an average rate of approximately50 g DM/min (J.M. Forbes, unpublished observations).
Presumably in systems where food is limited, e.g. dairy cows fed con-centrates in a group, the fastest eaters will consume more and produce moremilk, thus rendering themselves more likely to be selected as the mothers offuture cows, i.e. selection for fast rate of eating. However, the rate of eating bycows low in the dominance order was found by Kenwright and Forbes (1993)to be significantly faster during the 40-min peak periods after each milking (300g fresh matter/min) than at a quiet period (10.00–12.00 h) (200 g/min) and thetime spent eating significantly less (14.6 versus 18.7 min/h).
The most dominant animals did not eat significantly more quickly duringthese peak times than at other times of day (270 versus 250 g/min), but spent alittle more time eating than at other times of day (19.9 versus 17.6 min). Thus,the dominant cows did not feel under pressure to eat quickly at busy times asthey were confident of being able to continue eating when they were hungry.
Rate of eating of concentrates is particularly important when cows are fed inthe parlour at milking time. Any cow not having eaten all her allowance whenher group has finished milking will hold up the whole group, or miss part of herration which will then be eaten by the next cow to come into that position in themilking parlour. Inclusion of rapeseed meal in a dairy compound food slows rateof eating, but only to a marked extent during the first two or three foods after therapeseed is introduced (Frederick et al., 1988). A familiar flavour incorporatedin the food successfully prevents this initial slow rate of eating.
Wet food is eaten more quickly than the same food given in the dry form,and Clough (1972) found that cows that ate loose meal at 323 g/min ate pelletsat 455 g/min and slurry at 1670 g/min; even though the slurry contained water,the rate of DM intake was considerably higher with the food in this form.
Feeding Behaviour 29

Sheep
Pregnant ewes fed throughout on a complete, pelleted food ate at an averagerate of 15 g/min and this increased to around 20 g/min during lactation and toover 30 g/min after weaning (Forbes et al., 1989; Fig. 2.7).
Rates of eating during the first 30 min of the large meal taken after offeringfresh hay, chopped dried grass or pelleted dried grass were 7.3, 9.4 and 10.8g/min, respectively (Forbes et al., 1972). During the second and third 30-minperiods there were progressive reductions in the rate of eating. In a furtherexperiment, the same authors penned ewes either singly or in groups of six andfed them on hay either ad libitum or at two-thirds of ad libitum. Rate of eatingin the 30 min after giving fresh hay was significantly higher for the lower levelof feeding (9.7 g/min) than for ad libitum (8.4 g/min), but only slightly higherfor group-fed ewes (9.3 g/min) than for those penned individually (8.8 g/min).
The fact that restricted-fed sheep ate more quickly than those fed adlibitum shows that the latter were not eating at their maximum rate, andtherefore that neither jaw fatigue nor lack of saliva were likely to have limitedad libitum intake.
Detailed studies of long meals have shown an exponential slowing of rateof eating. In the example given in Fig. 2.9, the sheep was allowed access tolucerne for only 6 h/day and would therefore have been very hungry at thestart of this meal (Baumont et al., 1989).
30 Chapter 2
Fig. 2.9. Cumulative intake of lucerne by a sheep given access for 6h/day: intake (g DM) =1975(1–e(–0.0044.time)) (from Baumont et al., 1989).

Short-term Intake Rate
It has been suggested that foods that are initially eaten more quickly thanothers will have a higher daily intake, and Short-term Intake Rate (STIR) hasbeen proposed as a way of predicting intake, or at least of ranking the intakepotential and as a test for intake potential of foods initially only available insmall quantities (e.g. from plots of new varieties of herbage plant) (Harrison etal., 1998). STIR was defined for cows as the amount eaten in 4 min after a 4-hfast. Although there was some evidence that STIR predicted rank order ofintakes of different forage mixtures, there were quite marked effects of the orderin which forages were offered on test days. However, many factors are likely toaffect STIR, including starvation time, length of ingestion period, form ofpresentation of food, fibre concentration, DM content, feeding level, bodycondition of animals and physiological state of the animals.
One very important consideration is the experience the test animals havehad of the tested foods, or of foods with similar sensory properties (see Chapter6). For example, lambs that had received intra-ruminal infusions of starch justafter feeding increased intake, intake rate, bite rate and intake per bite of thefood available just after the infusion, compared with lambs that had receivedonly intra-ruminal infusions of the vehicle (water) (Villalba et al., 1999).
This demonstrates that STIR is influenced to a great extent by the post-ingestive consequences of food ingestion, so that it is not suitable for testingfoods that are only available in sufficient quantities to make one or two tests,i.e. insufficient experiences to allow learning.
Rate of eating silage or grazed herbage was found to increase with lengthof pre-fasting, mainly through increases in biting rate and dry matter intake(DMI)/bite (Patterson et al., 1998, Fig. 2.10). Extending the fasting period from6 to 13 h did not cause any further increase in rate of eating, however,suggesting a physical limit to the frequency and size of bites. Intake rate wasfound to decline during an eating bout, as the hunger drive declined.
Circadian Rhythms of Feeding
Rats eat more frequent and larger meals at night than during the day, as theyare nocturnal animals, while farm mammals are more active during the dayand eat a greater proportion of their meals in daylight than at night.
Poultry
Unless the nights are very long, poultry do not eat during the hours ofdarkness, so there is a very marked diurnal rhythm of feeding. Savory (1979)observed a peak of feeding activity and intake during the hour before dusk,presumably to fill the crop as a reservoir of food to last the bird through thenight. It is not necessary for the light to dim slowly for this feeding to occur, asthe peak of feeding still occurs when the lights are extinguished abruptly.
Feeding Behaviour 31

In order to see the extent to which birds learn to anticipate a fast, Petherickand Waddington (1991) housed pullets individually in a circadian-freeenvironment and, on days 17–47, 50% were shown a coloured card during thefinal hour of food availability, prior to food deprivation of 8 or 12 h. There wasno indication of increased intake during this period and so no suggestion thatthey could learn to use the colour cue to anticipate a fast. Do they learn whendusk is approaching by the number of hours since dawn?
Pigs
There are two peaks of feeding, one in the morning and one in the earlyafternoon (de Haer and Merks, 1992) but Fig. 2.11 shows that the second is byfar the greater. Note than some feeding still takes place at night and that there islittle effect of single versus group penning. However, examination of the data inmore detail showed that, in groups, 69% of meals accounted for 87% of intakeand 83% of eating time. With individual housing, only 39% of mealscontributed 90% of the food eaten and 79% of the feeding time.
In other words, there were a lot of small, short meals when pigs were keptindividually, compared with when they were in groups; with group feeding therecan be considerable competition for a single feeder, resulting in many interruptedmeals and therefore fragmented feeding behaviour. The repeatabilities of day-to-day recordings of intake traits were high within 2-week periods compared withmonths or the whole fattening period, indicating a steady change in feedingbehaviour as pigs grow.
The difference in behaviour between day and night is likely to be a resultof social constraints, but may also represent a reluctance by the animals to feed
32 Chapter 2
Fig. 2.10. Intake of grazed herbage (●) and silage (�) by lactating cows after various lengthsof fast (from Patterson et al., 1998).

at night. The two daylight feeding peaks may be coincidental with the entranceof the stockperson into the animal house or may be the preferred feeding timesof the pigs.
Cattle
A high level of feeding activity is usually observed after fresh food is offered. Asmaller peak often occurs before sunset and another just after midnight. Datafrom individual young bulls fed from automatically recording feeders showedthat the sunset peak moved according to the time of year and that the night-time quiet period was longer in winter (Stricklin, 1988). In another trial, cattlewere either trough-fed or fed from a single automatic feeder. While those fedfrom the trough showed a normal diurnal pattern of feeding, those on thesingle-space feeder ate at any time of day or night, presumably due tocompetition. Trough-fed cattle spent about 120 min/day feeding compared with80 min/day for those on the single feeder.
Under conditions where little competition for feeder space exists, dairy cowseat few meals from around 01.00–06.00 h. When there are more animals thanfeeder spaces there is strong competition at busy times, particularly after milkingand when fresh food has been delivered. Kenwright and Forbes (1993)observed a clear triphasic pattern of eating in cows milked three times per day,peaks of feeding activity occurring during the periods after return from milking,including large meals, which shows that some cows were monopolizing feeders,thereby preventing others from eating at that time. The more dominant animals
Feeding Behaviour 33
Fig. 2.11. Diurnal patterns of feed intake in group-housed growing pigs. The three linesrepresent different batches of animals (from de Haer and Merks, 1992).

ate less at night (01.00–06.00 h) than those at the bottom of the ‘pecking’ order.Therefore, heifers low in the social dominance order might not be able to satisfyfully their desire to eat when the level of competition for feeding space was high.The high incidence of aggressive interactions during the period immediatelyafter return from milking has implications for the health and nutrition of theanimals.
The fact that lower-yielding cows were lower in the dominance order(calculated according to Rutter et al., 1987) than high yielders but ate more atnight suggests that high demand for nutrients was not the prime cause ofnocturnal eating, although it is possible that low dominance caused low intake,resulting in lower milk yield. It is more likely that those lower in the dominanceorder were prevented from meeting their needs during the day and were thusforced to satisfy their requirements by eating in the middle of the night. Whenthey did manage to eat at the most popular times of day it was in short meals,eaten at a rapid speed and terminated by the arrival of a more dominantanimal.
What are the implications of these findings for the management of dairyherds? Jackson et al. (1991) suggested that, up to a ratio of 3.5 cows/feeder, therewas no effect on daily intake of silage, while Elizalde and Mayne (1993) haveshown that, although feeding behaviour is affected with 5 or more cows/feeder(increased rate of eating and shorter total feeding times), it is not until there is aratio of 7 cows for each feeder that daily intake of silage becomes depressed.
Sheep
Sheep show similar light-entrained circadian rhythms of feeding to cattle (see Fig.17.7). Another factor affecting feeding rhythms is environmental temperature:sheep do not eat in the hottest part of the day when the heat load is so great thatthey must seek shelter.
Food Restriction and Fasting
Periods without food leave the animal in a different state than when fully fed. Itis important to measure fully this state in order to predict how the animal willrespond when fully fed again. Care needs to be given to the choice anddescription of the treatment(s) during the rehabilitation period.
Poultry
Pecks at food become faster, stronger and less accurate after increasing periods ofdeprivation (Wood-Gush and Gower, 1968) but, when food is unavailable for 1day in 5, there is complete compensation of intake and growth. Petherick et al.(1992) trained hens to run down a 14.4-m alley for food after being deprived for0, 6, 12 or 18 h. The speed of running was significantly increased by deprivation,
34 Chapter 2

but there was no difference between deprivation periods (0.29, 0.62, 0.65, 0.57m/s, respectively), suggesting that 0.65 m/s was the fastest they could run.
Food restriction is sometimes used to delay puberty in pullets. When pulletswere subsequently restricted to that weight of food eaten voluntarily at 6 weeksof age (45 g/day), the birds ate and pecked at empty feeders for the sameamount of time per day as ad libitum controls spent eating, i.e. there was noincrease in attempts to get food, as is seen in more severe types of underfeeding.
Broiler breeder stock are usually restricted to less than one-half of adlibitum intake. Such animals have a high rate of working for food, even justafter their ration has been consumed, and are highly motivated to eat at alltimes (Savory et al., 1993). If offered food ad libitum after a period ofrestriction, at first they eat up to three times the restricted daily level, graduallyfalling to about double the restricted level (de Jong et al., 2003).
When food was returned to cockerels of an egg-laying strain after fooddeprivation, the rate of eating was higher after a 24-h fast than after a 2-h fast,but there was no further effect of 48 h (Wood-Gush and Gower, 1968). It islikely that the size of the first meal after a long fast is limited by the capacity ofthe crop, which acts as a storage organ, the distension of which inhibitsfeeding.
Rather than restrict intake by offering weighed amounts of food, it is oftenmore convenient to give access to unlimited amounts of food for limited periodsof time. Cockerels of a layer strain allowed food for one or two periods of 2 heach per day ate 65 and 80%, respectively, of the amount eaten by controlgroups with 24 h/day access and, somewhat surprisingly, they did not increasetheir intake as they became accustomed to the situation (Barach et al., 1992).
In a review of the welfare of poultry in modern production systems, Mench(1992) discusses food deprivation and restriction which pose a welfaredilemma as, if fed ad libitum, broiler breeders experience reduced fertility andhealth problems, yet if fed at the usual severely restricted level they are hungryfor most of the time. The welfare aspects of feeding restricted amounts of foodor imbalanced foods are discussed further in Chapter 18.
Pigs
There was a linear increase in the weight of food eaten by growing pigs duringthe first meal after deprivation of 1–6 h (M. Corbett, S. McNicholas and J.M.Forbes, unpublished observations).
Restriction of protein intake in pigs has been shown to cause increasedrooting and general activity, suggesting that specific nutritional needs increaseforaging motivation (Lawrence et al., 1993). Restriction of food intake givesrise to increases in ‘working’ for food in an operant conditioning situation, butnormal farm environments do not provide facilities for foraging. Therefore,animals develop stereotypies such as chewing chains; ingestion of even a smallamount of food stimulates such activities. Pregnant sows are usually restrictedto about 60% of their ad libitum intake and such animals have a high rate ofworking for food, even just after their ration has been consumed. In order to
Feeding Behaviour 35

give sows a more natural way of getting food by working for it, a feeding ballhas been developed that delivers food pellets at random intervals if it is rolledaround (Young and Lawrence, 1993). The lower the level of feeding, the moresows push the ball around.
Quite severe food restriction of boars makes them much more willing topress a button to obtain small rewards of food, compared with those fed almostad libitum (Lawrence et al., 1989). When the bulk of the restricted ration isincreased by incorporating straw, there is no reduction in operant responding,showing that the mere presence of bulk in the digestive tract is not satiating.However, pregnant gilts and sows given restricted amounts of food withdifferent levels of fibre showed a significant reduction in stereotypies withhigher fibre foods, and so Robert et al. (1993) concluded that bulky food maybe beneficial for the welfare of pregnant sows.
Pigs spend a considerable amount of time chewing materials in theirenvironment, but it is unclear whether this reflects motivation to feed, toexplore or a combination of both. By providing a tube containing water,saccharin solution or sucrose solution, Day et al. (1996a) were able to separatethese possibilities. They observed that chewing at the plain water tube was at alow level and not affected by the degree of food deprivation. Saccharin onlyslightly increased chewing whereas sucrose, which provided energy as well as asweet taste, caused large increases in chewing activity, especially in food-deprived animals, demonstrating that nutritional feedback during explorationmodifies foraging behaviour towards correction of energy deficiency.
Cattle
The intake of hay by cows increased by 20% as the increase in time of accessto food was increased from 5 to 24 h/day, in contrast to an 80% increase inintake when the food was a concentrate mixture (Freer and Campling, 1963),suggesting a physical limit to intake of the hay. Daily access for at least 6 h isnecessary for maximum intake of silage by beef cattle (Wilson and Flynn,1974). Dry cows ate 8.0 kg/day when given access to silage for 5 h/day, whilethose with continuous access ate 10.1 kg (Campling, 1966).
Sniffen and Chase (1987) observed that mildly intake-restricted cows(100% of calculated net energy requirement) ate an average of 4.4 meals daily,compared with an ad libitum group (111% of net energy (NE) requirement)that ate 12.4 meals.
Sheep
When sheep were given access to hay cubes for 3, 6, 12 or 24 h/day, intakeswere 1502, 1869, 2086 and 2413 g/day (Hidari, 1981). With fasts of 1–6 h,sheep fed on a pelleted 0.5 dried grass:0.5 barley compound food compensatedfor the fasting period in the first two or three meals after the food had been
36 Chapter 2

replaced and there was no effect on daily intake (J. Black, F. Carey-Wood andJ.M. Forbes, unpublished observations).
Abnormal Feeding-related Behaviour
In intensive husbandry it is not uncommon for abnormal feeding-relatedbehaviours to occur. While these have been ascribed to boredom, it is alsopossible that such behaviours as tail biting and feather pecking are expressionsof a desire to obtain nutrient(s) not provided in sufficient quantities by the diet.
A stereotypy is ‘a repeated, relatively invariate sequence of movementswhich has no obvious purpose’ (Fraser and Broom, 1997), such as repeatedchewing of metal bars by individually penned sows. They are mostly performedduring the post-feeding period and are initiated by giving a small amount offood. This, and the fact that they are not normally elicited by non-food-relatedstimuli, suggests that they are due to underfeeding and exacerbated by the lackof alternative possibilities for exploration and activity.
Excessive water consumption is sometimes seen in poultry, pigs, sheep andhorses, the latter taking up to 140 l/day. When this occurs, it is usually inconfined animals and can be overcome by provision of more space andexercise. Often, the apparently high consumption of water is due to excessivewaste, as bored animals stand with their noses on nipple drinkers, allowingmost of the water to go to waste.
Poultry
Feather pecking can occur in all types of poultry, especially if insufficient troughspace is provided. This can be alleviated by giving birds something to searchfor, e.g. by giving some whole grains in the food or on the floor, but this doesnot necessarily alleviate hunger (de Jong and Jones, 2006). Feather peckingsometimes leads to body pecking and wounding.
Egg eating by hens may be an indication of mineral deficiency in the diet,as it is reduced by providing grit, although this again may be a question of lackof variety of activities rather than a nutrient deficiency. Birds eat shavings onwhich they are bedded if they have insufficient trough space; this can result ingizzard compaction and eventual death if not forestalled by increasing theavailability of food.
Pecking at metal or wood in a stereotypic manner is sometimes observed inbirds, again when the environment is monotonous. It has been noted that theamount of time spent stereotypically pecking was negatively related to plasmacorticosterone levels, and it has been suggested that such activity relieves stress.
Pigs
It is natural for newly weaned animals to explore their environment and theyoften lick and chew objects, including other animals. However, this sometimes
Feeding Behaviour 37

develops into biting each other’s tails if pigs are heavily stocked in a boringenvironment. The use of straw bedding and/or the provision of ‘toys’ is helpfulas it gives the pigs more interest and activity. Belly nosing in early-weanedpiglets is a response to the lack of the mother. Pigs also show increased tail bitingwhen the diet is deficient in salt or protein. This is probably a general increase inoral activity rather than a specific alleviation of the nutrient deficiency, as thelittle blood obtained would not significantly improve their salt or protein status(Fraser and Broom, 1997).
Stereotypies by pigs are increased by low levels of feeding, leading topersistent feeding motivation. Bar chewing or sham chewing in sows, commonin individual pens or stalls when restricted feeding is practised, is usuallyreduced if straw or sawdust is provided (Lawrence et al., 1993). Sows often eatdead piglets but occasionally a sow may attack, kill and eat a piglet. Usuallyonly first litters are affected and in the first few hours after parturition.
Cattle
Calves spend about 1 h/day sucking naturally from their mothers, but can drinkmilk replacer much more quickly than this, leading to boredom and sucking ofother calves, particularly the navel. The use of dispensers that deliver the milkslowly to simulate natural suckling is helpful, as is the provision of straw bedding.
Many calves in crates lick their own hair, a symptom of boredom andpossibly of nutrient deficiency. This often creates hairballs in the stomach,which can occasionally become so large that they block the digestive tract.
Restricted-fed heifers sometimes show stereotypies in the post-feedingperiod, and those individuals spending less time eating spend more timeexhibiting stereotypies. Feeding-related activities such as sniffing or licking thefeeding trough are seen more frequently around the time that stereotypies areexhibited, suggesting that oral stereotypies are indicative of frustrated feedingbehaviour. Although lactating cows are usually fed ad libitum, they are often innegative energy balance and higher-yielding cows, which typically lose moreweight in early lactation, have been seen to show more stereotypies.
Redbo et al. (1996) studied the effect of mild restriction of food on oralstereotypies in lactating cows. A total mixed ration was given ad libitum fromweeks 3 to 26 of lactation or ad libitum from weeks 3 to 14, with restriction toSwedish standards for maintenance and lactation from weeks 17 to 26, whilethe third treatment was restriction throughout. When food was available adlibitum there were almost no stereotypies, while with restricted feeding theamount of time spent in stereotypic activities was noticeable (see Fig. 2.12).Those cows that were restricted in both periods showed distinctly morestereotypies in period 2, i.e. when they had been on restriction longer. It seemsas if stereotypic activity is caused by underfeeding, but it is not always clearwhether it is hunger or boredom that is the main determinant.
38 Chapter 2

Sheep and goats
Sheep will pull and eat the wool of others if too tightly penned, but this canusually be prevented by providing roughage for them to chew. Agile, younggoat does can suck their own teats.
Marsden and Wood-Gush (1986) fed individually penned lambs aged 8weeks either high (174 g/kg DM) or low (110 g/kg DM) protein foods ad libitumor restricted to 1 kg/day. More time was spent in abnormal activities (such asbiting empty food bins, wood or wool, ‘star-gazing’) by those on the restrictedlevel of food but, when hay was offered in addition, there was much lessabnormal behaviour. Blackface lambs chewed wool more when on low-proteinthan when on high-protein food, while there was no difference in Suffolkcrosses. The former spent less time eating than the latter when on ad libitumfeeding and more time in abnormal food searching. These ad libitum fedanimals grew at a very high rate, thus showing that high performance is notnecessarily an indication of good welfare.
Conclusions
There are various ways of monitoring food intake, but some of the indirectones have a large amount of variability associated with them. Automationallows the collection of large amounts of data without the presence of a humanobserver to disturb the animals. It is possible to monitor the feeding behaviourand food intake of individual animals kept in a group, which allows monitoringunder realistic farm conditions.
This has paved the way for the use of food intake and efficiency ofutilization in selecting breeding stock. It has also allowed better statistical
Feeding Behaviour 39
Fig. 2.12. Time spent feeding (blank) and performing stereotypies (filled) by lactating cowsfed on a total mixed ration. Period 1, weeks 3–14 of lactation; period 2, weeks 17–26. AL, adlibitum throughout; AL-R, ad libitum in period 1, restricted in period 2; R, restricted throughout(from Redbo et al., 1996).

methods of defining inter-meal intervals to be developed. Feeding ischaracterized by relatively stable food intakes over periods of several days, butalso by widely different meal patterns between individuals on the same foodand within individuals with different foods.
The feeding behaviour of an animal in a barren experimental environmentmight be quite different from that of the same animal in more naturalsurroundings, and it has been suggested that the use of operant systems thatmake the animal work to obtain food encourage the animal to adopt a morenatural feeding pattern. Unnatural feeding-related behaviour is seen in animalsthat are frustrated, either by lack of food or by being kept in a restrictingenvironment.
There are strong circadian rhythms of feeding, but these are not inflexible:for example, chicks will eat during the dark if that is the only time food isavailable, even though they normally eat nothing at night. Short periodswithout food can be compensated for when food becomes available, but longerperiods of fasting result in a significant reduction in daily intake.
40 Chapter 2

3 Feedbacks from theGastrointestinal Tract
In searching for hunger/satiety signals we are looking for changes in the body thatgo in one direction during a meal, may continue in that direction for some timeafter the meal, but eventually return to the pre-meal level. There are numerouschanges that fit these criteria, including physical and chemical factors in thegastrointestinal tract, and hormones and metabolites in the bloodstream. Thesechanges, and the routes by which information concerning them is carried to thebrain, are referred to as negative feedback pathways. It is unlikely that, undernormal circumstances, only one factor is involved in the termination of feeding,or satiety. Rather, satiety is proposed to occur when the combined strength ofsignals from gastrointestinal and liver receptors reaches a threshold (MTDhypothesis, see Chapter 10).
Even this is a simplification, however, as it does not allow for long-termbalancing of food intake with requirements; in order to achieve this match,feeding must terminate long before the animal knows how much of the variousnutrients have been absorbed. In order to provide ways of predicting nutrientavailability, learned associations between the organoleptic properties of a foodand its eventual nutritive value are developed (see Chapter 6). However, theconsiderable variation in meal size and number within a day, both between andwithin animals, throws great doubt on the importance of short-term negativefeedback signals as the only determinant of the amount of food eaten overperiods of 1 day or more. This has already been alluded to in Chapter 2, and wewill return to this theme in later chapters. This chapter deals with thegastrointestinal tract, while metabolites and hormones are covered in Chapter 4.
There is particular emphasis in this chapter on ruminant animals because ofthe great economic importance of their having evolved a large and complex set ofstomachs in which digesta are stored for many hours for microbial fermentation(Church, 1988). This long period of storage makes the physical capacity of thestomachs a potential limiting factor to intake and gives considerable importance tothe rates of digestion, breakdown and onward passage of particles of food. In
© J.M. Forbes 2007.Voluntary Food Intake and Diet Selection 41in Farm Animals 2nd Edition (J.M. Forbes)

addition, there are several unusual products of digestion, particularly the volatilefatty acids (VFAs), which the host animal must metabolize and which are thereforepotentially important controllers of voluntary intake.
Altering the digestibility and rate of passage of a forage food causes parallelchanges in intake (Van Soest, 1994). For example, supplementation of low-protein forages with urea increases the rates of digestion and passage and allowsa greater intake. Grinding a forage food also increases its rate of flow out of therumen and allows increased voluntary intake. Although the digestibility of thefood is reduced by grinding, since the food is in the rumen for a shorter time,the total weight of nutrients absorbed daily is increased. Such treatment of poorforages, accompanied by pelleting, is sometimes practised commercially.Relationships between the digestible energy concentration of food and level ofintake by ruminants and simple-stomached animals are discussed in Chapter 11.
The Mouth
The first point at which intake might be limited is the mouth or, more precisely,the teeth. While this is not likely to be an important limit under mostcircumstances, Illius et al. (1995) have observed that wild Soay sheep on thesmall island of St Kilda off the Scottish coast show 3–4-year cycles ofpopulation due to high mortality from starvation and intestinal parasites whenthe population gets too great to be supported by the available herbage. Thesurvival rate is significantly related to the incisor arcade, animals with widemouths being better able to harvest the short grass.
These authors wondered why this natural selection did not lead to ever-widening mouths, and proposed counter-selection for arcade width in the years ofplenty following the population ‘crash’. According to their theory, an excess ofherbage leads to poor-quality pasture and it is the animals with narrow mouthsthat can more successfully select the more nutritious shoots from amongst the bulkof stemmy grass, thus obtaining a more nutritious diet on which their chances ofsurvival are improved compared with wide-mouthed individuals. Thus, over aperiod of many years, mean arcade width remains relatively constant.
It has been suggested that the jaw muscles become fatigued in species suchas ruminants that have to spend a long time chewing each day, leading toslowing of the rate and eventually to the cessation of eating. Such fatigue is notof importance in normal satiety, however, because cows continued to eat formuch longer than usual when ingested food was removed via a gastric fistula(Balch and Campling, 1961). It is not necessary, therefore, to consider themouth as a generator of negative feedback signals, except in helping the animalto identify the food with learned associations.
Oropharyngeal Receptors
Receptors in the buccal cavity and throat are important in the animal’s sensoryperception of food; the sensory properties of a food are as likely to encourage
42 Chapter 3

further feeding as they are to cause feeding to stop. De-afferentation of thebuccal region in the pigeon, by section of the trigeminal nerves, leads to loss ofinterest in food, although drinking and grooming are unaffected; clearly, in thisspecies the taste and texture of food in the mouth is an important reinforcer offeeding.
Gastric Receptors
The first internal changes to be correlated with feelings of hunger were the so-called hunger contractions of the stomach. However, vagotomy, whichabolishes these contractions, does not seriously interfere with the regulation offood intake in poultry or pigs. In the chicken hunger contractions occur in thecrop and in the proventriculus and gizzard, whereas with ruminants there is adecrease in the frequency of contractions during periods without food.
Distension of a balloon in the stomach depresses intake, but does notcompletely abolish feeding, while intra-gastric administration of the amount offood normally taken in a meal also depresses, but does not totally inhibit,feeding showing that stomach distension is not the only controller of intake.Clearly, the presence of food in the stomach and/or its passage through andabsorption from the intestines are important factors in inducing satiety, but notthe sole factors.
Dilution of food with non-nutrients, or ‘dietary bulk’, reduces the con-centration of nutrients in the food so that more food is eaten before nutrient-induced satiety occurs. However, the volume accumulating in the stomach, andlater passed to the intestines, may be limited by the capacity of these visceraand a physical, distension-induced satiety may result. This is particularly true inruminant animals with foods high in fibrous constituents that have to stay in therumen for many hours. Chapter 11 discusses this aspect in more detail.
Poultry
Stimulation of the crop by filling it with water, saline or a balloon, or coolingthe crop, all depress food intake (Richardson, 1970). Such treatments involveconsiderable disturbance and there would have been less stress if the crop wereloaded via a surgically implanted cannula. Introduction of 12 or 20 ml of apaste of food into the crop via a cannula depressed food intake (Shurlock andForbes, 1981b). To determine whether bulk or nutrients were involved in thisresponse, glucose solutions were given into the crop. Amounts > 1.5 g in 10 mlof water significantly depressed food intake during the 1 h after injection, whileat least 3.8 g was necessary to depress intake over a 3-h period. The effect ofadditional amounts of glucose was greatest with loads of up to 4 g, and withgreater weights there was little additional effect on food intake, suggesting thatthe receptor(s) involved are maximally stimulated by 4 g. Even so, intake wasonly depressed by one-half of that of the control during the 1 h after injectionand by one-third during the 3 h after.
Feedbacks from the Gastrointestinal Tract 43

Although the results of this experiment might indicate the presence ofreceptors sensitive to glucose in the crop, or lower down the digestive tract orpost-absorptively, they do not rule out the possibility of distension receptors,because more concentrated solutions take up more water and therefore occupymore space; osmoreceptors might also be present. Shurlock and Forbes(1981b) therefore compared the effects on feeding of glucose and the non-absorbable substances, sorbitol and potassium chloride, all at an osmolality of3 osm. During the 3 h after injection into the crop, the food intakes weredepressed to an equal extent by all three solutes. It was concluded that glucoseintroduced into the crop was probably not, therefore, influencing intake bystimulating post-absorptive receptors, but by an osmotic or distension effect.
Mechanoreceptors are to be found in the muscular stomach of the chicken,and both the crop and the gizzard are well innervated by branches of the vagusnerve. The crop is, however, a diverticulum, and food often bypasses it; thus itcannot be the main controller of meal size. Following surgical removal of thecrop, daily intake is normal once the immediate effects of surgery and theadaptation period are over (Savory, 1985). Cropectomy is followed by decreasedmeal size and increased feeding frequency, although eventual oesophagealdilation often leads to a gradual return to normal meal frequency.
Introduction of food slurry into the intestines of growing turkeys increasedthe proportion of boli entering the crop during an evening meal by decreasingthe proportion of boli travelling directly to the gizzard (Jackson and Duke,1995). A slowing of stomach emptying by the presence of digesta in theintestines is a general feature of the control of the digestive tract, making itdifficult to pinpoint the site of effects of artificial or natural changes.
Pigs
Indirect evidence of a physical limit to intake in the pig has been obtained fromobservations of the effects of dietary dilution. Pigs attempt to compensate fordilution of the food by increasing their intake when its energy concentration isreduced. Although there appear to be no reports in the literature of ballooninflation in the porcine stomach, loading young pigs with hypertonic saline orwater equal in volume to the volume of milk taken voluntarily after a 3-h fastdepressed intake. As pigs grow older they can compensate better for dietdilution (see Chapter 11).
Pekas (1983) loaded the stomachs of young pigs daily through a cannula,which led to a reduction in voluntary intake that almost exactly compensated forthe weight of food introduced. When loading was carried out on 4 days/week,compensation was incomplete on these days so that total intake increased.However, a reduction of voluntary intake on the other three days of each weekled to weekly intakes, growth rates and carcass compositions indistinguishablefrom those of controls. Long-term (or at least medium-term) control mechanismsare involved, therefore.
The rate at which the stomach discharges its contents into the duodenumhas an important influence on the signals generated by that part of the intestine
44 Chapter 3

and is partly controlled by the quantity and quality of duodenal contents.Infusion of fats and products of lipolysis into the stomach was compensatedalmost exactly by reduced food intake, suggesting that the rate of stomachemptying plays a major part in determining meal size. Glucose infusions intothe stomach similarly depress intake, but this effect can be ascribed to intestinalosmotic or caloric effects of the glucose that delay stomach emptying andprolong gastric distension.
Ruminants
As already mentioned in Chapter 1, a considerable body of evidence had beenbuilt up by about 1960 to support the concept that the food intake ofruminants was restricted primarily by ruminal capacity; this was reviewed byBalch and Campling (1962). It is clear that there are also effects of the VFAsproduced by fermentation, and of the osmolality of ruminal contents, and it isproposed in Chapter 10 that these various factors are integrated in an additivemanner. Dietary effects on intake mediated by the rumen are covered inChapters 11 and 12.
Physical aspects
It is generally considered that the voluntary intake of forages is limited by thecapacity of the digestive tract, particularly the rumen, to store and allowpassage of digesta (see review by Allen, 1996). This is based on observedrelationships between intake and digestibility, rate of digestion, fibre contentand other indicators of the residence time of material in the rumen. In addition,placing bulky objects such as water-filled balloons in the rumen results inreductions in forage intake, and mechanoreceptors have been demonstrated inthe ruminal wall whose firing rate is increased by stretch, with afferent neuronesin the vagal nerves carrying information to the gastric centre of the medullaoblongata in the CNS, as described by Leek (1986).
CORRELATIONS BETWEEN RUMINAL CAPACITY AND INTAKE Not only is intake affected bythe rates of digestion and passage, but also by the capacity of the digestivetract, principally the rumen. Positive correlations have been found betweenlevel of intake and the weight of the empty reticulo-rumen, but cause and effectare difficult to establish. There are positive correlations between the weight ofvoluntary intake of forage just before slaughter and the weight of ruminalcontents at slaughter in cattle (Tayler, 1959), but the causality cannot beestablished with certainty.
Increases in the volume of other abdominal organs, such as abdominal fator the pregnant uterus, can apparently cause compression of the rumen and areduction in food intake. Tayler (1959) found a negative correlation between theweight of abdominal fat and the intake of herbage in cattle. In late pregnancythere is an increase in the girth of the abdomen, but this is not always greatenough to accommodate the growth of the uterus. Although the rate of passage
Feedbacks from the Gastrointestinal Tract 45

of particles of forage food through the digestive tract is increased duringpregnancy, under some circumstances this is not enough to prevent a limitationof voluntary intake (see Chapter 16).
For animals of any given size, the fatter they are the heavier they are, sointake is often inversely correlated with body weight. On the other hand, thereis a positive relationship between intake and body weight in growing animals,and between mature animals of different skeletal sizes but of equal fatness.
ADDITION OF MATERIAL TO THE RUMEN Addition of food material directly into therumen through a fistula reduces subsequent intake (Hodgson, 1971a) but, ofcourse, supplies nutrients as well as bulk. Removal of digesta from the rumen isfollowed by increased intake, but this removes a source of nutrients as well asphysical bulk, so that physical and metabolic factors are again confounded insuch situations.
In the early 1960s, Campling and Balch conducted a series of experimentsusing a more critical approach. One of their methods was to insert balloons via afistula into the rumen of non-pregnant, non-lactating mature cows; the balloonswere then filled with water and the effect on intake during a 4-h period of accessto food was noted. When 50–100 l of water-filled balloons were introduced for10–14 days, there was a 0.54 kg/day decrease in dry matter intake (DMI) foreach 10 l of water (Campling and Balch, 1961). If the water was added directlyinto the rumen of cattle there was no effect on intake, even when largequantities were involved (45 l). With sheep, addition of 8 l of water directly intothe rumen had no effect on forage intake, while inclusion of only 2 l in a balloondepressed intake by 27% (Davies, 1962). There is often a negative relationshipbetween the water content of grass or silage and voluntary intake; water trappedin stems and leaves acts more like water in balloons than free water.
It is likely that physical aspects were unduly emphasized as a result of theapproach adopted in the work of Balch and Campling, because the 20-h fastthat preceded each feeding period would leave the animals in considerablenutrient deficit, causing them to need to eat a much larger amount than wouldotherwise be eaten during such a small part of the day. Also, the use of ruminalDM as a measure of fill is inappropriate, as volume is related more closely tototal weight, i.e. wet weight, of the ruminal contents.
More recent studies using balloons in the rumen of lactating cows fed grasssilage (Anil et al., 1993) showed that there was a 70 g DM decrease in intakefor every additional litre of water put in the balloon over a 3-h period, and thatthis response was approximately linear over the range 0–25 l – similar to the54 g DM/l decrease noted by Campling and Balch (1961) with non-lactatingcows fed on hay. This approach has been extended to include gradualincreases in the volume of balloons in the rumen of cattle by Mowatt (1963),who found little evidence of a compensatory increase in ruminal capacity.However, some recovery of DM intake towards pre-treatment levels was seen insheep with balloons maintained in the rumen when fed on a pelleted diet, butnot when fed on straw (Egan, 1972).
A single, large balloon in the rumen might interfere with the normal flow ofmaterials and, at worst, block the reticulum and prevent onward flow of digesta.
46 Chapter 3

An alternative is to use many small balls, and tennis balls have been used forthis purpose (Schettini et al., 1999). Steers fed a low-quality forage diet had 50or 100 balls placed in the rumen, with a specific gravity (SG) of either 1.1 or1.3, for 18-day periods, of which the first 10 days were for adaptation. Therewere significant effects on intake of both number of balls and of SG, eventhough increasing the SG did not increase the volume (see Fig. 3.1).
As both SGs used were higher than the SG of ruminal fluid, it is assumedthat all the balls eventually sank to the bottom of the posterior ventral sac of therumen, where they would directly stimulate the mechanoreceptors in thatregion, as well as exerting a stretching effect on the ruminal wall more dorsally,where receptors are more numerous. The effects of volume and SG wereapproximately additive, supporting the additivity hypothesis proposed inChapter 10. Note, however, that the authors conclude by saying: ‘The largechange in ruminal mass and volume as a function of the experimentaltreatments in our study … resulted in a relatively small change in the voluntaryintake of a hay diet. This suggests that factors other than distension of the guthave a large influence on voluntary intake of low-quality forage diets byruminants.’
The effect on food intake of balls or balloons in the rumen would bepredicted to be greater with a more fibrous diet than with a more concentratedone, given the belief that physical factors are more important in the control offorage intake as compared with concentrates. When lactating cows were fed ondiets containing either 250 or 350 g NDF/kg (low- and high-fibre, respectively),and plastic containers of water (each of 500 ml) were inserted into the rumen tooccupy 25% of pre-trial rumen volume for each cow, food intake wassignificantly decreased by the addition of ruminal inert bulk when the high-fibrediet was fed, but had no effect with the low-fibre diet (Dado and Allen, 1995).
Feedbacks from the Gastrointestinal Tract 47
Fig. 3.1. Effects of adding 50 or 100 tennis balls, SG 1.1 or 1.3, to the rumen on daily intakeof low-quality hay. Shaded bars, weight of balls (kg); open bars, volume of balls (l); solid bars,intake (kg DM/day); C, control (from Schettini et al., 1999).

With the former food, the objects displaced an equal volume of ruminalcontents, suggesting that this food ‘filled’ the rumen; food intake was depressed.
Overall, therefore, as far as the voluntary intake of long forages is concerned,ruminal distension with balloons and similar objects has consistent andpredictable effects, but ones that are not as large as might be expected from thevolume displaced.
As an alternative experimental technique for demonstrating effects of ruminalfill on intake, Welch (1967) introduced into the rumen via a fistula 150 gof polypropylene fibres, each 30 cm in length, which were too long to exit therumen. Intake of hay was depressed to 33% of control values and remained low.With shorter fibres (3.5 or 7 cm), regurgitation was possible so that the fibres werebroken down by re-chewing and fragments were found in faeces; intake wasinitially depressed, but recovered during the few weeks after administration of thefibres. Such manipulations are apparently not unpleasant, as sheep voluntarilyconsume polypropylene fibres when offered a fibre-free diet.
Muscular activity of the reticulo-rumen causes particles of digesta to rubagainst the papillae, stimulating the epithelial receptors, but the role of thesereceptors in the control of feeding is unclear. Baumont et al. (1990) placedblocks of expanded polystyrene in the rumen that floated on top of ruminal fluidso that they would stimulate tactile responses as well as increasing the bulk ofruminal contents. Hay intake was significantly reduced by 2 l of cubes, but therewas no effect on the frequency of reticulo-ruminal contractions during eating.However, the frequency of contractions during rumination was increased andmore periods of rumination occurred. The polystyrene blocks became roundedduring their stay in the rumen, showing that they must have been rubbing onthe ruminal papillae, but their bulk meant that they were also likely to have beenstimulating the distension receptors.
Baumont et al. (1990) provided tactile stimulation of the dorsal ruminalpapillae without distension by means of a stiff brush via the fistula. Thisinduced pseudo-rumination and extra-reticular contractions in sheep given anon-stimulating liquid diet to a similar extent as did a small amount of hay or1 l of polystyrene cubes. On the other hand, insufflating the rumen with air for5 min or adding 2 l of a buffer solution – which would cause distension but notstimulate tactile receptors – did not induce pseudo-rumination and had noeffect on contractions. These results suggest that the use of a balloon in therumen might not mimic all of the effects of forage, especially if the balloon getsdragged down into the rumen away from the sensitive areas of the reticulumand the cranial dorsal sac of the rumen.
DIGESTION AND PASSAGE OF FOOD There is an overwhelming amount of literatureon positive relationships between extent and/or rate of digestion of forages andvoluntary intake by ruminants. In interpreting these data it is necessary toremember that the evidence from such relationships, that intake is limitedphysically, is circumstantial.
The more digestible the food, the less indigestible material remains tooccupy space in the rumen. By the mid-1960s it was becoming clear that thispositive relationship did not continue to hold true with foods of very high
48 Chapter 3

digestibility, and Baumgardt (1970) reviewed the evidence that intake iscontrolled to balance energy requirements when the food is highly digestibleand of small particle size. With highly digestible long forages, however, intakecontinues to be positively related to digestibility, even at the very highest levelof digestibility (see review by Minson, 1982).
Ruminants eating forages have to trade off the advantage of holding thefood in the rumen for a long time to allow extensive digestion against theadvantage of moving digesta along the tract to allow for further food intake.While relationships are found between the digestibility of the diet and voluntaryintake (see Chapter 11), the total extent of digestion by the whole alimentarytract is not sufficient to give an adequate understanding of the physical limit tointake, as it depends not only on the physical form of the food, but also on itspotential to be digested. Digestibility is the product of the retention time in therumen and the degradation characteristics of the food concerned. The longer aportion of food stays in the rumen, the closer it will come to being digested tothe maximum extent possible, i.e. its potential digestibility, but factors such aslevel of feeding and ruminal capacity cause variations in residence time andtherefore in actual digestibility. Increasing the rate of passage of food particlesby grinding forages results in increased levels of voluntary intake, while theextent of food digestion is reduced due to the decreased time spent by eachparticle in the digestive tract.
The degree to which food particles are digested in the rumen could be asimportant as whole-tract digestibility. Several studies have found that theintakes of different hays were closely related to the rate of disappearance of hayfrom Dacron bags in the rumen (potential ruminal degradability). Intakes haveoften shown a much closer relationship with this than with digestibility or rateof degradation, making ruminal degradability a useful predictor of intake. Forexample, a very close fit was obtained for browse plants fed to goats, when theindependent variables included the digestion rate constant (c from the equationp = a + b(1–ect), see Chapter 11), the soluble fraction of the food and theinsoluble but fermentable fraction of the food. As Dacron bag studies aretedious, the measurement of the rate and amount of gas production of samplesof foods incubated in vitro with ruminal contents as a measure of degradationis a very promising method for predicting intake of forages (Getachew et al.,1998).
Rates and extents of breakdown of forage particles depend in part on theanimal – the time and vigour devoted to chewing, for example – but are to agreat degree dependent on the physical and chemical characteristics of theplant material being eaten. The subject of relationships between plant structureand breakdown in the rumen is well covered by Wilson and Kennedy (1996).They make the vital point that genetic modification of herbage plants to maketheir tissues more readily digested by ruminants is certain to reduce the strengthof stems and leaves during growth, leading to increased likelihood of lodging,i.e. collapsing in heavy wind and/or rain. Thick cuticles, inimical to digestion,are very protective during drought conditions; plant toxins reduce attacks bypests; endogenous antimicrobials deter infections of the living plant but mayalso reduce microbial attack in the rumen.
Feedbacks from the Gastrointestinal Tract 49

Nevertheless, there are strategies for improving particle breakdown, e.g.breeding animals to spend more time per day chewing. Increasing activity ofruminal microbes by genetic engineering is another possibility – but will theintroduced bacteria survive (Flint and Scott, 2000)?
RELATIONSHIPS WITH DIETARY FIBRE Cellulose and hemicellulose are degradable bythe ruminal microorganisms, but the rate of digestion and the time spent by aparticle in the rumen are variable, so there is no close relationship between thelevel of voluntary intake and a forage’s content of these carbohydrates. It mightbe rather that the bulk of plant cells would be a good predictor of intake offorages, and the cell-wall constituents (CWC) fraction (Van Soest, 1994) – asmeasured by the NDF method – was found to give an almost constant intake ofNDF for a wide range of grasses, including many tropical species:
I = 110 – 1716/(100 – CWC) (3.1)
where I is the voluntary intake (g DM/kg LW0.75) by sheep and CWC is theproportion of CWC in the dry matter (%). The amount of time spent inrumination is much more closely correlated with the intake of NDF than it is withthe weight of food eaten, and NDF is now widely accepted as being a goodindicator of the bulk properties of forages. Figure 3.2 shows the relationshipbetween the NDF content of forages and their organic matter intake by sheep,after adjusting for the intake by each sheep of a standard reference forage(Osbourn et al., 1974).
While most research into the relationships between intake and foragecomposition has been with sheep, which show an approximately constant intakeof NDF, cattle increase their intake of NDF as its content in food increases (Van
50 Chapter 3
Fig. 3.2. Intake by sheep of a range of forages with different cell wall (NDF) contents relativeto intake of a standard forage by the same animals. *, legumes; o, grasses (from Osbournet al., 1974).

Soest, 1994). For any given level of NDF, sheep eat more DM/kg0.73, butless/kg1.0, than cattle because of the lower ratio of gut capacity per unit ofmetabolic rate in the smaller species. Maximum forage energy intake forruminant species of different mature body sizes has been estimated to be relatedto live weight0.87 (Taylor et al., 1987). Further discussion on the effects of fibrecontent of the diet on voluntary intake is to be found in Chapter 11.
Much of the evidence for physical limitation of forage intake is circumstantialand has been challenged (e.g. Ketelaars and Tolkamp, 1992a). However, thesheer weight of the evidence, and the lack of any sustainably credible alternative,means that many still view stimulation of ruminal stretch and mechanoreceptorsas a critical part of the intake control system of the ruminant.
Involvement of receptors in the physical control of intake
There is irrefutable evidence of mechanoreceptors in the wall of the rumen withafferent fibres to the CNS. The ruminant fore-stomachs are innervated bybranches of the vagus and splanchnic nerves (see Leek, 1986 for detailedreview). There are rapidly adapting mechanoreceptors in the epithelial lining ofthe reticulo-rumen, concentrated in the anterior dorsal rumen and thereticulum, and slowly adapting tension receptors in the muscular layersthroughout the gastrointestinal tract. One important role of mechanoreceptorsis in the control of gastrointestinal motility. However, since the epithelialreceptors found in the reticulo-rumen and duodenum also respond to chemicalstimuli (see below), it is likely that chemical effects are also involved in thecontrol of motility. Central projection of these receptors is to the gastric centresof the medulla oblongata, which have afferent fibres projecting to the nucleusof the solitary tract of the hindbrain.
RETICULO-RUMINAL MOTILITY There are spontaneous biphasic cyclic contractions ofthe rumen that mix the digesta, the contractions being weaker when groundand pelleted diets are fed than with long forages. Reduction in the strength orfrequency of ruminal contractions does not necessarily mean a decrease intension, however. Pentagastrin infused into the coeliac artery caused anincrease in reticular tension receptor activity without an increase in pressure asmeasured by a balloon in the lumen. Intra-ruminal pressure is, therefore, not areliable indicator of tension.
If the reticulo-rumen were an inert elastic sphere, then it would be a simplematter to calculate the degree of stretch for any given load of digesta. However,the muscular activity of the ruminal wall complicates the situation, especially aseating (or even teasing with food) stimulates more frequent contractions. Ifstimulation of the in-series stretch receptors by distension of the rumendepresses voluntary food intake, then this increased muscular activity duringfeeding will act to inhibit feeding. However, increased motility, as duringfeeding, increases the rate of outflow of digesta, leading to decreased distensionand, potentially, to increased food intake.
Rumination increases the breakdown of particles of food and thus increasesthe rate of emptying of the reticulo-rumen. When rumination was prevented
Feedbacks from the Gastrointestinal Tract 51
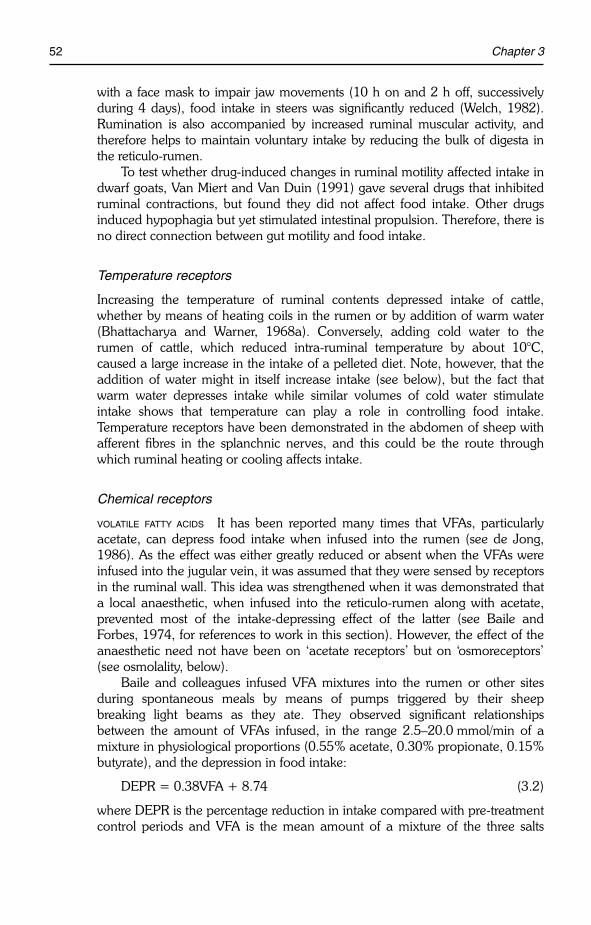
with a face mask to impair jaw movements (10 h on and 2 h off, successivelyduring 4 days), food intake in steers was significantly reduced (Welch, 1982).Rumination is also accompanied by increased ruminal muscular activity, andtherefore helps to maintain voluntary intake by reducing the bulk of digesta inthe reticulo-rumen.
To test whether drug-induced changes in ruminal motility affected intake indwarf goats, Van Miert and Van Duin (1991) gave several drugs that inhibitedruminal contractions, but found they did not affect food intake. Other drugsinduced hypophagia but yet stimulated intestinal propulsion. Therefore, there isno direct connection between gut motility and food intake.
Temperature receptors
Increasing the temperature of ruminal contents depressed intake of cattle,whether by means of heating coils in the rumen or by addition of warm water(Bhattacharya and Warner, 1968a). Conversely, adding cold water to therumen of cattle, which reduced intra-ruminal temperature by about 10°C,caused a large increase in the intake of a pelleted diet. Note, however, that theaddition of water might in itself increase intake (see below), but the fact thatwarm water depresses intake while similar volumes of cold water stimulateintake shows that temperature can play a role in controlling food intake.Temperature receptors have been demonstrated in the abdomen of sheep withafferent fibres in the splanchnic nerves, and this could be the route throughwhich ruminal heating or cooling affects intake.
Chemical receptors
VOLATILE FATTY ACIDS It has been reported many times that VFAs, particularlyacetate, can depress food intake when infused into the rumen (see de Jong,1986). As the effect was either greatly reduced or absent when the VFAs wereinfused into the jugular vein, it was assumed that they were sensed by receptorsin the ruminal wall. This idea was strengthened when it was demonstrated thata local anaesthetic, when infused into the reticulo-rumen along with acetate,prevented most of the intake-depressing effect of the latter (see Baile andForbes, 1974, for references to work in this section). However, the effect of theanaesthetic need not have been on ‘acetate receptors’ but on ‘osmoreceptors’(see osmolality, below).
Baile and colleagues infused VFA mixtures into the rumen or other sitesduring spontaneous meals by means of pumps triggered by their sheepbreaking light beams as they ate. They observed significant relationshipsbetween the amount of VFAs infused, in the range 2.5–20.0 mmol/min of amixture in physiological proportions (0.55% acetate, 0.30% propionate, 0.15%butyrate), and the depression in food intake:
DEPR = 0.38VFA + 8.74 (3.2)
where DEPR is the percentage reduction in intake compared with pre-treatmentcontrol periods and VFA is the mean amount of a mixture of the three salts
52 Chapter 3
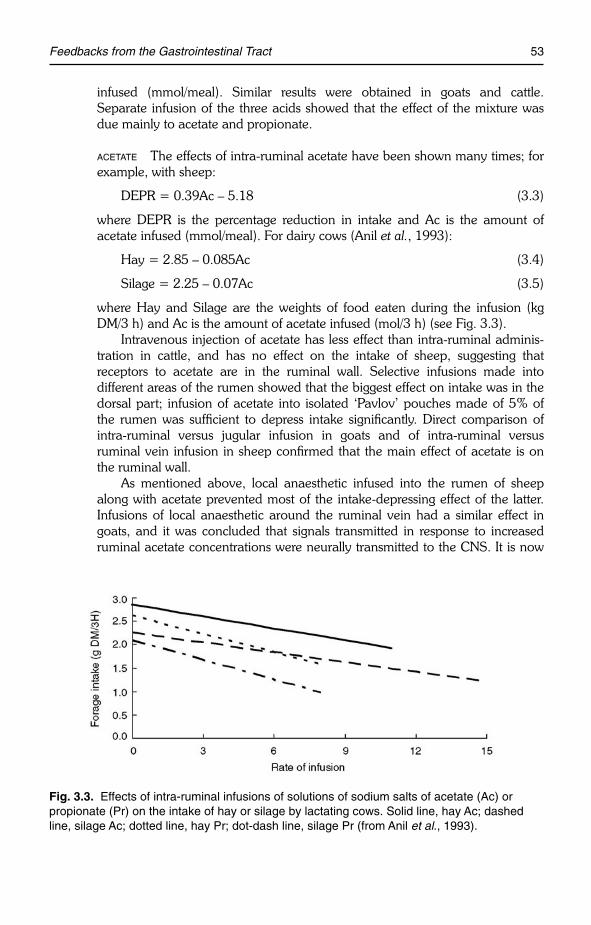
infused (mmol/meal). Similar results were obtained in goats and cattle.Separate infusion of the three acids showed that the effect of the mixture wasdue mainly to acetate and propionate.
ACETATE The effects of intra-ruminal acetate have been shown many times; forexample, with sheep:
DEPR = 0.39Ac – 5.18 (3.3)
where DEPR is the percentage reduction in intake and Ac is the amount ofacetate infused (mmol/meal). For dairy cows (Anil et al., 1993):
Hay = 2.85 – 0.085Ac (3.4)
Silage = 2.25 – 0.07Ac (3.5)
where Hay and Silage are the weights of food eaten during the infusion (kgDM/3 h) and Ac is the amount of acetate infused (mol/3 h) (see Fig. 3.3).
Intravenous injection of acetate has less effect than intra-ruminal adminis-tration in cattle, and has no effect on the intake of sheep, suggesting thatreceptors to acetate are in the ruminal wall. Selective infusions made intodifferent areas of the rumen showed that the biggest effect on intake was in thedorsal part; infusion of acetate into isolated ‘Pavlov’ pouches made of 5% ofthe rumen was sufficient to depress intake significantly. Direct comparison ofintra-ruminal versus jugular infusion in goats and of intra-ruminal versusruminal vein infusion in sheep confirmed that the main effect of acetate is onthe ruminal wall.
As mentioned above, local anaesthetic infused into the rumen of sheepalong with acetate prevented most of the intake-depressing effect of the latter.Infusions of local anaesthetic around the ruminal vein had a similar effect ingoats, and it was concluded that signals transmitted in response to increasedruminal acetate concentrations were neurally transmitted to the CNS. It is now
Feedbacks from the Gastrointestinal Tract 53
Fig. 3.3. Effects of intra-ruminal infusions of solutions of sodium salts of acetate (Ac) orpropionate (Pr) on the intake of hay or silage by lactating cows. Solid line, hay Ac; dashedline, silage Ac; dotted line, hay Pr; dot-dash line, silage Pr (from Anil et al., 1993).

accepted that the major effect of acetate on intake in ruminants is via receptorsin the ruminal wall. However, it has been shown that the type of infusion usedby Baile and others induces large, probably unphysiological, changes inruminal fluid and blood composition, and de Jong (1986) could not reproducethe results of Baile’s group with infusions made to demonstrate that theseunphysiological changes were avoided.
Continuous infusion of sodium acetate for 3 h into the rumen of lactatingcows had small and non-significant effects when the doses were less than therate at which it is calculated that acetate is normally produced, even thoughthis led to greatly elevated concentrations of acetate in ruminal fluid (Anil et al.,1993). The depression in intake only became obvious and significant at rates ofinfusion considerably above the normal production rate that elevated theconcentration of ruminal acetate to at least twice the normal. However, thesignificant, linear relationship between the dose of acetate administered and thedepression in food intake suggests that the effect of physiological amounts isreal, albeit small.
Infusion of acetate into the rumen avoids oral effects during ingestion.However, when rumination occurs there will be a higher concentration ofacetate than normal in the regurgitated bolus. It has been shown that acetateadded to food reduces the rate of eating of that food and, by implication, itsacceptability, using a sophisticated method whereby the effects of additions of arange of levels of acetate on rate of eating were compared with several foods(Gherardi and Black, 1991). Surveys have shown a negative relationshipbetween the acetate content of silages and their daily intake by ruminants(Tayler and Wilkins, 1976) but, at the present time, we have no way of knowingthe relative significance of oral and ruminal effects of acetate. In general,however, oral effects are of little significance when only one food is on offer;palatability effects come into play in determining the food to be eaten when achoice is available (see Chapter 7).
A further complication in ascertaining the effects of acetate on food intakearises from the fact that acetate inhibits ruminal motility, which would be likelyto reduce the intake of forage foods by reducing rate of passage and increasingthe occupancy of the rumen (see above). However, infusions of acetate thatsignificantly depressed silage intake in cows did not affect the frequency oramplitude of ruminal contractions (S.B.J. Dunne, M.H. Anil and J.M. Forbes,unpublished results).
PROPIONATE Propionate is approximately as effective, mole for mole, as acetatein depressing intake when infused into the rumen of sheep:
DEPR = 0.36Pr – 0.27 (3.6)
where DEPR is the percentage reduction in intake and Pr is the amount ofpropionate infused (mmol/meal). However, propionate was rather more effectivethan acetate when infused into the rumen of lactating cows (Anil et al., 1993):
Hay = 2.61 – 0.13Pr (3.7)
Silage = 2.09 – 0.14Pr (3.8)
54 Chapter 3

where Hay and Silage are the weights of food eaten during the infusion (kgDM/3 h) and Pr is the amount of propionate infused (mol/3 h) (see Fig. 3.3).
Sodium propionate is particularly effective in depressing intake whenincorporated in foods for sheep. Seeking its site of action, Baile andMcLaughlin (1970) infused propionate into the dorsal rumen, ventral rumen,abomasum or duodenum of goats; intake was depressed to the same extent byeach infusion, which shows that, in contrast to those for acetate, the receptorsare not specifically in the rumen. Comparison of infusion into the lumen of therumen, ruminal vein, mesenteric vein, portal vein and carotid artery showedthe biggest effect on voluntary intake with ruminal vein infusion, and it wasconcluded that receptors sensitive to propionate were in the wall of this vessel.In the light of later work this seems unlikely, as sensitivity to propionate hasbeen demonstrated in the liver (see Chapter 4) but, of course, ruminal veininfusion would elevate the levels of propionate entering the liver.
Propionate effects on intake of a total mixed ration by lactating cows havebeen studied by Oba and Allen (2003b). Rather than simply infusingpropionate at different rates, they used mixtures of sodium propionate andsodium acetate so that the total amount of VFA infused was constant, giveninto the rumen continuously for 14 h at rates of 16.7 and 25 mmol/min,respectively, for experiments 1 and 2. In both experiments, as the proportion ofpropionate increased, there were linear decreases in DM intake (see Fig. 3.4a)and total ME intake (see Fig. 3.4b), meal size tended to decrease and inter-meal interval tended to increase linearly. Thus, the depression in food intakewas greater than compensation for the energy yield of the infusate. Also,propionate had a greater effect on feeding than did acetate (cf. Fig. 3.3), giventhat the ‘control’ was acetate, and this adds further weight to the propositionthat propionate plays an important role in food intake regulation.
BUTYRATE When injected intravenously or intra-ruminally, butyrate has smallerand more variable effects on feeding than either acetate or propionate (Baileand Mayer, 1969):
DEPR = 0.17Bu + 11.4 (3.9)
where DEPR is the percentage reduction in intake and Bu is the amount ofbutyrate infused (mmol/meal).
Although intravenous infusion of butyrate sometimes reduces feeding, thisis probably of little physiological significance as butyrate is produced byfermentation at a much lower rate than acetate; it is converted to 3OH-butyratein the ruminal wall, so that plasma levels are very low. For these reasons therehave been few studies on the effects of butyrate on voluntary intake. However,butyrate appears to be more slowly absorbed from the rumen than eitheracetate or propionate, and is more effective in causing ruminal stasis. Butyrateimproves the acceptability of foods to which it is added (Gherardi and Black,1991). It is not possible to say whether the positive effect of butyrate onpalatability might override its negative effect on ruminal chemoreceptors nor,indeed, whether its attractiveness to sheep is due to its metabolic effects.
Feedbacks from the Gastrointestinal Tract 55

56 Chapter 3
Fig. 3.4. Dose–response effects of intra-ruminal infusion of propionate relative to acetate on(a) food intake of lactating dairy cows for experiments 1 (●) and 2 (�); (b) energy intake(MJ/12 h): in diet (●), infusion (�), total (�) for experiment 2 (from Oba and Allen, 2003b).
Difficulties of interpretation of work with sodium salts of VFAs
Most studies of the effects of VFAs on feeding have used infusions of their sodiumsalts. In addition to elevating the concentrations of the VFA(s) in question, theyalso elevate sodium levels and osmolality of ruminal fluid. The use of the acidsthemselves has been restricted by the discomfort apparently induced in theexperimental animals. Thus, there has been considerable confounding of thespecific effects of VFAs and the more general osmotic effects of intra-ruminalinfusions. Grovum (see Carter and Grovum, 1990b) has been particularly activein highlighting doubts about the specificity of VFA effects on feeding, and theeffects of ruminal osmolality are reviewed below. In addition, changes in short-

chain fatty acid (SCFA) production are small during and after the relatively smallmeals that are taken with ad libitum access to food, which also casts doubt ontheir importance in the physiological control of intake in ruminants.
Further doubt has been cast on the relevance of VFA concentrations in therumen on the control of meal size when, following fasting overnight, sheepwere given a meal of concentrates 30, 60 or 120 min before hay was offeredad libitum; there was no effect on the intake of hay in the 1 or 3 h following,despite different levels of ruminal VFA concentrations when hay was offered(Duranton and Bueno, 1985). However, the daily intake of hay wassignificantly reduced.
Another concern is the rate at which VFAs are infused. In much of the workof Baile and his colleagues, infusion into the rumen was carried out at high andunphysiological rates for the duration of each spontaneous meal, and thiswould cause a very rapid elevation in VFA and sodium concentrations. Itwould be more appropriate to use slowly rising and falling rates of infusion inorder to achieve increases similar to those occurring naturally duringfermentation of meals taken previously.
Experimental addition of chemicals into the rumen via a fistula is a widelyused technique that appears to avoid sensory evaluation by the animal.However, we rarely consider the effects of such materials on the taste, smelland physical form of the boluses of digesta regurgitated during rumination. Inassessing the effects of the characteristics of the food on intake we must becareful to differentiate between their influence on the taste of the food and itspost-ingestional effects (see Chapter 6).
Despite these difficulties, the facts that: (i) VFA concentrations, osmolalityand distension increase during feeding; (ii) food intake is depressed byexperimentally increasing VFA concentrations, osmolality or distension in therumen; and (iii) there are receptors sensitive to these changes, encourage thebelief that there is a physiological role for gastrointestinal receptors in thecontrol of food intake in ruminants. The theory of Minimal Total Discomfort(see Chapter 10) can incorporate changes such as these as discomforts, alongwith the effects of other food characteristics and animal factors. One suchadditional set of factors is protein, amino acids and their metabolites.
NITROGENOUS COMPOUNDS Although under some circumstances ammonia oramines depress intake, there is as yet insufficient information about their site(s)of action or the receptors which might be involved, although many of thesecompounds are of types that are known to be biologically active. This subject isaddressed in more detail in Chapters 12 and 14.
Propionate can decrease the ability of the liver to detoxify ammonium, andOba and Allen (2003a) investigated whether intra-ruminal infusion ofpropionate, compared with acetate, had more than an additive effect on thereduction in food intake caused by infusion of ammonium salts into the rumenof lactating dairy cows. The results (see Fig. 3.5) show that the effect ofammonium was significantly greater when infused along with propionate,compared with ammonium and acetate, both on weight eaten and number ofmeals.
Feedbacks from the Gastrointestinal Tract 57

PH AND ACIDITY It has been suggested that the fall in ruminal pH towards theend of large meals is involved in the cessation of feeding, but relevantexperimental work has yielded conflicting results. On the one hand it has beenreported that the activity of chemoreceptors is changed according to the pH ofruminal fluid, irrespective of the type of acid applied (Crichlow and Leek,1981) while, on the other, VFAs – but not lactic, citric or hydrochloric acids –given into the reticulum at concentrations of 100–200 mM inhibited ruminalcontractions (Ash, 1959) (when ruminal pH falls below about 5.0, ruminalstasis occurs and the hypophagia that follows is more likely to be due to thatruminal stasis than to low pH per se).
With regard to effects on intake, acetic acid depressed intake but there wasno effect of potassium acetate given intra-ruminally (Hutchinson and Wilkins,1971). However, Baile and Mayer (1969) found a similar depression of intakeby sheep whether the pH was lowered by acetic acid or by infusion of sodiumacetate that did not affect ruminal pH.
Bhattacharya and Warner (1967) infused various acids, includingphosphoric, lactic and citric, into the rumen of steers, maintaining the ruminalpH at about 6.0. They observed significant reductions in food intake, but thiseffect might be an indirect one because acidity, even when pH is maintainedwithin the normal range for the rumen, is known to have strong inhibitoryeffects on reticulo-ruminal motility.
It is therefore likely that the titratable acidity of silage is more importantthan pH, and attempts to stimulate the intake of concentrates by incorporatingbuffers in the food have sometimes been successful. The inclusion of sodiumbicarbonate (25 kg/t) in concentrates for dairy cows increased hay intake andthe fat content of milk, with no effect on total milk yield (Edwards and Poole,1983). With inclusion at 20 kg/t of a complete food in another experiment,
58 Chapter 3
Fig. 3.5. Effect of sodium (Na) or ammonium (NH3) salts of acetate (Ac) or propionate (Pr)infused intra-ruminally at 17 mol/min on food intake (solid bars, kg/12 h) and number ofmeals (open bars, meals/12 h) by lactating cows (from Oba and Allen, 2003a).

intake increased (13.9 to 19.0 kg/day) and weight loss was reduced, but noeffect on milk yield or composition was observed.
Inclusion of 25 g/kg of calcium hydroxide in a complete food containing30% hay and 70% concentrates increased intake by sheep significantly from920 to 1120 g/day, while in cattle the increase was from 11.0 to 16.3 kg/day(Bhattacharya and Warner, 1968b). Sodium carbonate (25 g/kg) and sodiumbicarbonate (50 g/kg) were as effective as calcium carbonate in cattle but lessso in sheep. Other experiments have not always shown an effect, however, andthese additives are not widely used in practice.
OSMOLALITY Many of the effects that have been attributed to chemoreceptorscould be due to osmotic effects rather than to specific chemical effects on thegut wall. There are significant changes in the osmolality of ruminal contentsdepending on the intakes of DM and water. In general, osmolality increasesduring and after a meal. Osmolality of the ruminal contents increases from apre-feeding level of 250–300 mosmol/kg to as much as 500 mosmol/kg in thefew hours after a large meal, and thus it must be considered as a candidate forinvolvement in the control of food intake.
However, some have concluded that osmolality does not play a significantrole in the control of food intake unless it is increased above the physiologicalrange but, in a critical review of the control of food intake, Grovum (1987)suggested that osmolality can account for many of the effects of intra-ruminalor intravenous infusions of VFA salts on food intake. By increasing theosmolality of ruminal contents with either sodium chloride or PEG(polyethylene glycol), Carter and Grovum (1990a) found a linear reduction infood intake during the first 10 min of 3.49 g food/g NaCl. The local anaestheticlidocaine injected intra-ruminally just before the sodium chloride did not reducethe response. When given into the abomasum, sodium chloride had no effectin the first 10 min, and there was no consistent relationship between osmolalityof plasma collected from the jugular vein and the reduction in intake followingeither loading or drinking. Thus, it was concluded that osmolality is sensed inthe rumen rather than in the abomasum or vascular system.
In comparisons between equimolar sodium acetate and sodium chlorideinfusions into the rumen of cows (Forbes et al., 1992) and sheep (Engku Azahanand Forbes, 1992), a somewhat greater inhibitory effect of the former has beenshown. Figure 3.6a shows the dose–response relationship between rate of infusionof sodium acetate and silage intake and also the silage intake during infusion of15 mol of sodium chloride/3 h. While chloride depresses intake to a lesser extentthan the same number of mol of acetate, this difference is not significant. It shouldalso be noted that the osmolality and sodium concentration of rumen fluid at theend of the infusion period are similar for the 15 mol of sodium chloride and 12 molof sodium acetate, suggesting that chloride is absorbed more quickly than acetate,or else stimulates outflow from the rumen. Thus, the results of this experiment areinconclusive as far as demonstrating a greater effect of acetate than chloride.
However, a second experiment, the results of which are summarized in Fig.3.6b, gives much clearer evidence for this effect, acetate depressing intakemore than chloride, mole for mole, across the range of doses studied.
Feedbacks from the Gastrointestinal Tract 59

One difficulty in interpreting these results is that raised ruminal tonicitynormally stimulates voluntary drinking, thereby attenuating the effects of theinfusion, but can only do so if animals have access to water. Grovum andcolleagues withheld water during their experimental periods, so it is under-standable that Grovum should place such emphasis on the importance ofosmolality of ruminal fluid as a controller of food intake.
In the experiments of Baile and Mayer (1969), infusions of sodium salts ofVFAs into the rumen reduced voluntary food intake but stimulated waterintake; there was no effect on drinking when the acids were infused. BecauseVFAs are naturally produced in the rumen without such large increases intonicity as have been induced by most of these experimental manipulations,and any increases in tonicity of ruminal fluid induce increased water intake, it is
60 Chapter 3
Fig. 3.6. Effect of infusing sodium chloride or sodium acetate solutions into the rumen oflactating cows on silage intake. (a) The seven infusion treatments were: none (�); 0, 6, 9, 12and 15 mol sodium acetate (�), 15 mol sodium chloride (●) in 4.5 l water over 3 h; (b), theseven infusion treatments were: 0, 5.5, 7.4 and 9.1 mol Ac (�), 5.5, 7.4 and 9.1 mol Cl (●) in4.5 l water over 3 h (from Forbes et al., 1992).

likely that Grovum has exaggerated the involvement of osmolality in thecontrol of food intake in ruminants.
Nevertheless, it seems likely that osmoreceptors exist in the rumen in orderto stimulate drinking when this is required to maintain ruminal osmolality withinthe normal range. However, there is no consistent experimental evidence ofosmoreceptors located in the ruminal wall and/or duodenum. One explanationfor this, proposed by Forbes and Barrio (1992), is that osmotic changes in therumen induce changes in the concentration of sodium and potassium in theextracellular fluid of the ruminal mucosa. An increase in extracellular sodium, aswould occur during and for some time after an infusion of sodium salts into therumen, should increase the likelihood of transmission of an action potential inview of the fact that removal of sodium from the extracellular fluid abolishestransmission. Thus, osmolality would only affect the frequency of afferentimpulses in the vagus nerve if the receptors were themselves being stimulated.
Under the conditions of Leek’s experiments, in which solutions were gentlysprayed on to the exposed ruminal mucosa of anaesthetized sheep, therewould be little nervous activity and therefore little chance to show a modifyingeffect of osmolality. In the conscious sheep, on the other hand, in whichepithelial receptors are being continually stimulated, both physically andchemically, there is plenty of opportunity for osmotic changes to attenuate oramplify the action potentials passing along the axons, hence the observedosmotic effects on feeding.
One indirect effect of osmotic changes in the rumen on intake might be byinhibition of ruminal microfauna, but this is not likely to be important in short-term responses to treatments. Nevertheless, a normal ruminal osmotic pressurenear 260 mosmol/kg is favourable for ciliate protozoan activity. Cellulosedegradation is inhibited in vitro at osmolalities > 400 mosmol/kg, but suchhigh tonicity is unlikely to occur as long as drinking water is available.
Almost all experiments involving infusion of salts into the reticulo-rumenhave been performed using sodium salts, other cations rarely having beingused. However, Warner and Stacy (1965) stated that the post-feeding rise inruminal osmotic pressure, when sheep were fed on equal amounts of lucernechaff and wheaten chaff, was largely due to increases in the concentration ofpotassium and, to a lesser extent, ammonium. J.P. Barrio, S.T. Bapat and J.M.Forbes (unpublished results) have observed a closer relationship betweenosmolality of ruminal fluid and potassium concentration than betweenosmolality and sodium concentration in sheep with free access to a pelleted,complete diet and drinking water.
Ruminal osmolality can indirectly affect voluntary food intake by alteringsalivary secretion. Large amounts of saliva are secreted and swallowed by theruminant in order to keep stable the ruminal pH, which tends to be lowered bythe continuous production of VFAs. When strongly hypertonic solutions ofsodium or potassium salts were infused into the reticulo-rumen of sheep, orsodium salts or urea were infused into the bloodstream, saliva production wasfound to decrease (Warner and Stacy, 1977). Marked decreases in plasmavolume have been shown during feeding, and the state of hydration of the bodyprobably plays a part in the control of feeding, as giving a diuretic before feeding
Feedbacks from the Gastrointestinal Tract 61

reduced food intake while a preload of isotonic saline given intraperitoneally insheep increased intake (Ternouth and Beattie, 1971). It can be concluded thatthe relative importance of osmolality as a satiety factor in ruminants is stilluncertain.
Physiology of chemoreceptors
Acids affect the epithelial receptors according to their titratable acidity andmolecular size (but not pH) to cause ruminal stasis. Butyric acid has a morepotent effect than would be predicted from the effects of a mixture of VFAs.Leek (1986) questioned whether epithelial receptors have a physiological roleas chemoreceptors, in view of the high concentration of chemicals required toactivate them and their long response times. However, the inhibition ofreticulo-ruminal motility by intra-ruminal infusion of VFAs or arising patho-logically during the ruminal acidosis syndrome is undoubtedly attributable toreticulo-ruminal epithelial receptor excitation.
It has been reported that ruminal fluid samples taken from sheep,immediately after the contractions of the reticulo-rumen had been inhibited byintra-ruminal infusion of VFAs, were able to elicit responses in the ruminalepithelial receptors of another anaesthetized sheep (Crichlow, 1988). Decreasingthe pH enhanced the potency of this fluid, while raising it decreased activity,showing that it was undissociated acid affecting the receptors. VFAs aretransported through the ruminal epithelium mainly as un-ionized molecules, andthe pH-partition hypothesis of membrane permeability predicts faster transportfor un-ionized substances, suggesting that weak organic acids have to diffusethrough cell membranes in order to affect epithelial receptors.
The Omasum
The reticulo-omasal orifice is very sensitive to mechanical stimuli and itsdistension evokes rumination and parotid salivary secretion via the vagusnerves. As the only exit for particles of food not digested in the rumen is viathis orifice, and in view of its small size, it might be thought that control ofrumen emptying, and thus of voluntary intake, could reside at this site. Laplace(1970) observed a correlation between feeding and omasal activity andproposed a role for the omasum in the control of food intake and rumination.
The Abomasum
Mechano- and chemoreceptors are to be found in the stomach of non-ruminants, and the abomasum – as the equivalent organ in the ruminant – alsopossesses such sensitivity. There are mechanoreceptors in the epithelium of theabomasum, which give a rapidly adapting response to stimulation butcontinuous discharge if sufficient stimulus is provided. These abomasalreceptors also respond to chemicals. The effects of acids on abomasal mucosal
62 Chapter 3

receptors are very similar to those in the rumen (Leek, 1977), being positivelyrelated to their titratable acidities rather than to pH and inversely related tomolecular weight. Thus, acetic acid had the same effect whether buffered orunbuffered. Alkalis also stimulate these receptors, as do hyper- and hypotonicsolutions and water. The effect of tonicity is very variable, however, applicationof the same stimulant to the same unit generating different latent periods onsuccessive occasions.
Intra-abomasal infusion of VFAs reduces abomasal activity and emptying,butyric acid being the most potent. This suggests that total VFA content and therelative proportions of VFAs may be important factors in the induction of theabomasal hypomotility preceding abomasal displacement in dairy cattle.Whether the composition of abomasal fluid and the degree of activation of thereceptors has any influence on ruminal emptying and food intake is not clear.
Abomasal motility is increased during rumination, which might account forthe increased rate of outflow from the rumen during the night – which is whenmost rumination takes place.
Infusion of fat into the abomasum of sheep reduces food intake, pre-sumably by inhibiting ruminal outflow. Infusion into the abomasum of dairycows of a mixture of rapeseed and sunflower oils, supplying predominantlyunsaturated long-chain fatty acids (LCFA), significantly depressed DMI, butonly to the extent of the ME (metabolizable energy) content of the oil, so therewas no effect of oil infusion on milk yield (Benson et al., 2001). Comparison ofthis result with the results of other trials involving post-ruminal fat infusionsuggests that polyunsaturated non-esterified fatty acids have the most potenteffect on DMI. The mechanisms of the effect of fats and oils in the abomasumare as yet unclear (Ingvartsen and Andersen, 2000), but may involvegastrointestinal hormones and fatty acid oxidation (see Chapter 4).
Intestinal Receptors
Chyme is likely to reach the jejunum before the end of the meal, and thedistension which results may play a part in the initiation and maintenance ofsatiety. The effects of digesta reaching the duodenum and jejunum could bemediated by stretch receptors, osmoreceptors or chemoreceptors. Althoughthere is adequate neurophysiological evidence for receptors sensitive to severalchemical types, that for osmoreceptors is weak. However, there is muchcircumstantial evidence that they are important in the control of food intake.
In later chapters, the role of learned associations between the sensoryproperties of foods and the consequences of eating those foods will beemphasized. Most research with simple-stomached animals has been carried outwith hormones and metabolites, but Bardos (2001) demonstrated aversion in ratsto a food taste that had been paired with mechanical stimuli (balloon distension)applied in both small and large intestinal loops. Distension of the intestines is notsimply, therefore, the affector of a primary negative feedback, it also contributesto the secondary, learned feedback complex, which is now viewed as being of theutmost importance in the control of food intake and choice.
Feedbacks from the Gastrointestinal Tract 63

Poultry
Duodenal infusion of glucose solutions inhibits feeding but potassium chlorideand sorbitol solutions, which are not absorbed, have a more prolonged effect(see below) suggesting that it is the physical presence rather than the chemicalnature that is important.
Distension of the cloaca or rectum results in reduced food intake, so that itseems reasonable to conclude that stimulation of stretch receptors at any pointalong the digestive tract will result in hypophagia, and that this distensionduring and after meals is a factor in the control of meal size and frequency.
Some of the solutions injected into the crop (Shurlock and Forbes, 1981b)probably found their way further along the digestive tract and might haveaffected food intake by means of gastric or intestinal stimulation. This wasinvestigated by slowly injecting 10 ml of 3 osm solutions of glucose, sorbitol orpotassium chloride into the duodenum of cockerels through permanentlyimplanted cannulae. Compared with control (no injection), water had no effecton intake, nor did glucose, while sorbitol and potassium chloride caused highlysignificant decreases in intake. Neither did intra-duodenal glucose infusionsaffect food intake in the work of Lacey et al. (1986). Glucose is absorbedquickly from the small intestine and would not be present for long enough toresult in prolonged stimulation of gut distension or of osmoreceptors, while thenon-absorbed solutes would continue to stimulate these receptors, resulting indepressed voluntary intake. In birds that had been fasted overnight beforethese same treatments were given, glucose injection into the duodenum didsignificantly depress feeding, perhaps because the liver content of glycogen wasdepleted so that it took up glucose, which stimulated liver receptors (seeChapter 4).
Vagotomy at the level of the proventriculus prevented the effects of glucosesolutions infused into the duodenum of chickens (Shaobi and Forbes, 1987)but, as the nerve section included fibres to and from the liver and pancreas aswell as the duodenum, it is not completely clear whether the glucose was actingprimarily on the duodenum or elsewhere. It seems likely that osmoreception isimportant in birds, although it is possible that the effects of hypertonic solutionsare due to physical distension of the duodenum by the increase in volume aswater is drawn from the blood. It is also worth noting that hypertonic solutionsstimulate gut motility, this being likely to stimulate mechanoreceptors in the gutwall.
Pigs
Food intake by hungry growing pigs is reduced by injection of 250 ml of a150 g/l solution of glucose into the duodenum. When the treatment was given3 min after food had been offered following an overnight fast, intake was 445 gcompared with 782 g for control, whereas 250 ml of a 15% solution of neutralfat or a 10% solution of amino acids had no effect (Stephens, 1980). Thissuggests that there are specific glucose receptors in the duodenum rather than
64 Chapter 3

osmo- or distension receptors. The effect of 250 ml of a 150 g/l glucosesolution into the duodenum was prevented by prior bilateral thoracic vagotomy(Stephens, 1985), confirming that there is a neural link with the CNS ratherthan a humoral one in this context.
2-deoxy-D-glucose (2DG, a glucose antimetabolite) did not affect feedingwhen given just after the start of the meal, but it did block the effect of glucose,suggesting that some of the hypophagic effect of glucose solutions infused intothe duodenum is not osmotic unless, of course, the glucose has to be absorbedbefore gaining access to the osmoreceptors.
Duodenal infusions of solutions of non-absorbable sugars such as mannitolhave a more prolonged action than glucose, presumably due to the osmoticdrawing of water into the intestinal lumen, which causes greater stretch ofmechanoreceptors. Infusion of a fat emulsion also depressed intake, but thiswas blocked by local anaesthetic as was the effect of glucose given into theduodenum. A large increase in the osmolality of duodenal contents occursduring a normal large meal, so that these receptors could be of physiologicalimportance in the termination of meals (Houpt, 1983). Xylose solutions, whichare not absorbed, are less effective than glucose or sodium chloride when giveninto the duodenum, which suggests that the osmoreceptors are not on thesurface of cells exposed directly to the infusate. Most of these effects can beblocked by a local anaesthetic given in the infusion, so the receptors are notthought to be deeper than the mucosal layer.
Houpt (1983) suggested that good control over food intake in the pigcould be exerted by a combination of three factors working largely in theduodenum: (i) osmotic sensitivity, which is precise but not directly related tonutritive value; (ii) CCK (cholecystokinin) responses to protein and fat induodenal digesta; and (iii) glucoreceptors in the intestine. The satiating effect ofglucose infused into the duodenum of young pigs has been apportioned asfollows: 20% due to fluid movements from blood to gut, 55% is osmotic withinthe gut, while the remaining 25% is hormonal, perhaps involving CCK.
Despite the emphasis on osmolality as a major factor in intake control inpigs, with normal feeding and free access to drinking water, osmolality ofduodenal fluid never exceeded 300 mosmol/kg. It is uncertain, therefore,whether osmolality normally plays a significant part in the control offeeding.
Protein infused into the stomach or protein hydrolysate into stomach,duodenum, jejunum or ileum all decrease intake approximately in proportionto the amount of energy infused. Glucose infusion into the duodenum slowedgastric emptying so that the total flow of energy through the duodenum wasunchanged, but the mechanisms for this apparent control of energy flow arenot understood. Infusion of fat into the stomach or duodenum, or fat, bile saltsand lipase into the upper jejunum, depressed intake in pigs (Rayner andGregory, 1989). Fat, bile and lipase infusions into the ileum had no effect onthat meal but did tend to reduce the size of the next meal. Older pigs, > 60 kgbody weight, still respond to glucose and fatty acid infusions, so their‘overeating’ is not due to lack of sensitivity to nutrients in the gastrointestinaltract.
Feedbacks from the Gastrointestinal Tract 65

Ruminants
There are tension receptors with vagal afferent fibres in the duodenum of thesheep that also respond to chemicals (Cottrell and Iggo, 1984). In view of theevidence of important roles for intestinal mechano- and chemoreceptors in thecontrol of food intake in other classes of animal, it is likely that such receptorsare also important in the ruminant. There are two different types of duodenalchemoreceptor: one is excited by potassium chloride solutions, the responseincreasing with the concentration of the salt (12.5–450.0 mmolar), while theother is insensitive to potassium chloride but excited by acetic, butyric orpropionic acids (10–150 mmolar). The responses elicited were directly relatedto molecular weight but not to pH or osmolality; both were excited by sodiumhydroxide solutions but not usually by sodium bicarbonate. Considerablequantities of potassium ions and VFAs leave the rumen and might, therefore,be expected to stimulate the abomasal and duodenal chemoreceptors and actin the negative feedback control of feeding.
Dynes (1993) studied the effect of duodenal osmolality on feeding in sheepby injecting 5 ml/kg of 6.5% NaCl or mannitol into the duodenum 5 min beforefeeding and without access to drinking water. There was almost completeinhibition of feeding in the first 15 min, an effect not alleviated by localanaesthetic. When water was made available 30 min after feeding hadcommenced, the sheep immediately drank a large volume and between 1.5and 3 h food intake was significantly higher than when water was not available.The amounts of salt, mannitol and anaesthetics were similar to those used byHoupt et al. (1983), who did find that anaesthetic reversed the intakedepression by mannitol in pigs. It seems unlikely that there would be basicdifferences between the intestinal physiology of pigs and sheep, but noexplanation has been proposed for these different experimental results.
In adult ruminants offered dry foods, osmolality can be up to 585mosmol/kg in the duodenum, but not so high further along the intestines. Theosmotic effect of digesta in the duodenum could be an important contributor tosatiety under many circumstances, but little relevant research has been carriedout with ruminants.
Although there have been suggestions on several occasions that flowthrough the intestines limits voluntary intake by ruminants, this is not agenerally important factor. Suspensions of sawdust or methylcellulose infusedinto the abomasum at rates which doubled the volume of faecal productionhad no effect on voluntary food intake and it should be concluded, therefore,that intestinal capacity is not a limiting factor in feeding.
The role of gut hormones such as cholecystokinin is covered in Chapter 4.
Integration of Multiple Signals from the Gastrointestinal Tract
There are several instances of stimulation of receptors in one part of thedigestive tract having consequences elsewhere that might influence voluntaryintake indirectly. Chemical or acid factors in the rumen affect motility and
66 Chapter 3

therefore the stimulation of mechanoreceptors by local contractions so that, forexample, loss of reticulo-ruminal motility occurs when epithelial receptors in therumen become stimulated by high levels of VFAs. Lactic acid may facilitate theinhibitory effects of VFAs, as it has been reported that activation of reticulo-ruminal epithelial receptors by low levels of undissociated VFAs occurs afterexposure of the luminal surface to dl-lactic acid. Thus, the intake-depressingeffects of lactic acid on food intake may be indirectly related to the inhibition ofreticulo-ruminal motility.
There is presumably a concentration gradient in digesta for such things asVFAs, with the highest levels in the centre of the rumen and lower levels at theruminal wall, from where they are absorbed. Such a gradient is difficult toconfirm experimentally in view of the contractions that move the tips ofsampling tubes, and may be quite small in magnitude. However, the increase infrequency of ruminal contractions during feeding, speeding up the mixing ofruminal contents, may significantly increase the level of intake-depressingactivity at the ruminal wall.
Leek (1977) points out that one stimulus excites several types of receptorand one type of receptor is excited by several types of stimulus. Thus, no singlestimulus/receptor combination is likely to explain the effects of the physical andchemical properties of digesta in the gastrointestinal tract on motility and foodintake. The experimenter measures fullness of a part of the tract as the volumeof its contents, whereas to the CNS this may be:
a composite quality depending not on the absolute volume of the contents but onthe rate of change of volume, the tonic state of the visceral muscle, the texture andchemistry of the contents and the extent to which the contents displace the viscuson its mesenteric attachment; such possibilities illustrate the difficulty of definingand quantifying a visceral stimulus.
(Leek, 1977)
If these are the difficulties involved in understanding receptor involvementin signalling to the CNS, how much more difficult will it be to understand thecontrol of voluntary food intake, in which many more factors must be takeninto account?
The great complexity of the signals reaching the CNS from the digestivetract makes it necessary to aggregate the effects of different types of foodaccording to measurable features such as fermentability, nitrogen content, fibrecharacteristics and energy yield in order to describe and predict their effects onvoluntary food intake. Modelling of the convergence of such aggregated signalscan then be attempted, for example by the theories discussed in Chapter 10.
Conclusions
There are stretch receptors in most or all parts of the gut that relay informationon fill to the brain via the nervous system to inhibit feeding. Hypertonicsolutions infused into the gut inhibit feeding but it is not certain whether thereare osmoreceptors or whether water drawn in by the hypertonic solution
Feedbacks from the Gastrointestinal Tract 67

stimulates the stretch receptors. There is evidence for chemoreceptors in theduodenum, but the relative importance of distension, stretch or chemical effectsprobably varies depending on the type of food.
The capacity of the rumen to hold digesta clearly sets a limit to how muchthe ruminant can eat, but rarely is this the only factor controlling food intake.Those receptors in the ruminal mucosa sensitive to chemical influences cannotbe envisaged as ceasing to inform the CNS about pH, VFA concentration andosmolality when the mechanoreceptors are being strongly stimulated. In factchemo- and mechanoreception are properties of the same neurones and itseems likely that chemical and stretch information are dealt with in an additivemanner (see Chapter 10).
The osmolality of ruminal contents has an important influence on feedingwhen it is raised above the normal range, and this changes the interpretation ofresults from experiments in which the sodium salts of the VFAs were infused.The situation is clouded by the difficulty of demonstrating receptors sensitive toosmolality, and new experimental approaches will have to be developed toresolve this difficult area.
We can rarely be sure of the exact mechanism(s) being brought into playwhen intake is affected by a change of diet or an experimental treatment. It isdifficult to design experiments to isolate one factor at a time, but suchexperiments are necessary if progress is to be made in understanding more fullythe control of food intake. It might be technically possible, for example, tomanipulate the composition of ruminal fluid while maintaining normalconditions in the rest of the tract by preventing the flow of digesta from therumen and infusing artificial digesta of normal composition into the abomasum.However, a multiplicity of cannulae and tubes, even if ethically acceptable, willundoubtedly increase the risk of inappetence in the experimental animals.
68 Chapter 3

4 Metabolites and Hormones
Digesta in the stomach(s) and intestines stimulate mechano- and chemoreceptors(Chapter 3), but it is unlikely that the total of the information from these receptorsis sufficient for the CNS to gain a complete picture of the quantities of nutrientsingested in order to balance intake with output. The liver is the first point atwhich most of the absorbed nutrients can be monitored by a single organ but,even then, lipids are absorbed via the lymphatic system and bypass the liver. Thegeneral circulation transports nutrients between organs and is also the mediumwhereby hormones, secreted by endocrine organs, pass to their target tissues.Many of the hormones have metabolic functions and have been implicated in thecontrol of food intake (e.g. insulin, leptin), while others have primary roles inother bodily functions but influence intake secondarily (e.g. oestrogens).
Early theories of food intake control gave a prominent place to the monitor-ing of blood metabolite levels such as glucose, suggesting that they were sensedby the CNS. However, many of the functions of the body have evolved toprotect the CNS from fluctuations in its supply of nutrients. A parallel can bemade with the regulation of body temperature, where it appears that thetemperature sensors in the periphery are more important than central receptorsunder normal conditions, so that the CNS is made aware of potential changes indeep body temperature and can set in motion actions to balance environmentalchanges before brain temperature itself has changed. So, with nutrient supply,we can envisage a more important role for peripheral receptors, with those inthe CNS only being stimulated under severe conditions of nutrient shortage orexcess. This will be explored further in Chapter 5, and it is sufficient here to saythat blood concentrations of metabolites or hormones are unlikely to be the onlyfactors taken into account by the CNS circuits controlling voluntary intake.
This is not to say that blood-borne nutrients and hormones cannot exertmarked influences on feeding, as changes in their concentrations inducechanges in the metabolism of tissues and organs. Satiated sheep began to eatsoon after the start of blood exchange with hungry donors; the intake of hungry
© J.M. Forbes 2007.Voluntary Food Intake and Diet Selection 69in Farm Animals 2nd Edition (J.M. Forbes)

sheep was reduced when blood was exchanged with satiated donors (Seoaneet al., 1972).
The levels of many metabolites and hormones in the blood have beensuggested to inform the brain of the animal’s metabolic state and to beinvolved in the short-term control of feeding. Of these, insulin and glucagonare the most likely candidates despite the attention that has been directed atother hormones, particularly cholecystokinin. In the longer-term control ofintake and body weight, leptin is prime candidate as the link between adiposetissue and the CNS.
Glucose
Mayer (1953) suggested that voluntary intake is controlled by blood glucoselevels. He pointed to the facts that blood glucose concentration rises after a meal,then falls before the next meal and that injection of gold thioglucose into micecaused hyperphagia and obesity. At autopsy, gold was found in the ventromedialhypothalamus, which had been damaged by its toxic effects; this was used asevidence that glucose had been taken up by this part of the brain. It was latershown that the uptake of gold thioglucose into the ventromedial hypothalamuswas dependent on the presence of insulin. These findings supported the theorythat the hypothalamus monitored blood glucose concentration in order to controlintake.
Subsequently, there has been very great attention paid to glucose as anegative feedback signal, some of it concluding that it is just one of manyoxidizable substrates that can act in this way, others finding evidence forspecific effects of glucose. Rather than attempt here what must needs be a veryinadequate coverage of the subject from the point of view of laboratoryanimals and humans, the reader is referred to the comprehensive book editedby Stricker and Woods (2004).
Poultry
Infusion of glucose into peripheral veins has no effect on intake but, wheninfused into the hepatic portal vein, it has a potent suppressing effect (Shurlockand Forbes, 1981a). The quantities of glucose required to depress intake wheninfused into the portal vein are within the physiological range, and the effectsare blocked by bilateral vagotomy at the level of the proventriculus (Rusby andForbes, 1987b). This shows that the flow of glucose from the digestive tract ismonitored by the liver, which relays its information to the CNS via peripheralnerves. The liver is the first organ to be presented with an overall picture ofwhat is being absorbed; also, with its role as a buffer in the maintenance ofblood glucose concentration, the liver takes up glucose from the portal bloodwhen it is in excess of the requirements of the rest of the body and releases itwhen necessary. Thus, it can transmit a signal that contributes to satiety whenglucose (and other metabolites such as amino acids) are becoming available in
70 Chapter 4

excessive quantities, this signal being reduced or reversed in times of need. Therole of the liver in the control of food intake is discussed further below.
It has proved difficult to affect feeding in chickens by manipulation of bloodglucose concentrations with insulin. Injection of mammalian insulin, for example,caused decreased blood glucose in birds, but intake was depressed (e.g. Smithand Bright-Taylor, 1974) rather than elevated as in mammals; perhaps avianinsulin would give different results. 2-deoxy-D-glucose (2DG), which prevents theuptake and utilization of glucose in mammals and stimulates voluntary intakebecause of glucoprivation, actually depresses feeding in the chicken (Rusby andForbes, 1985); unfortunately, it is not yet known whether 2DG has the samemetabolic effects in birds as in mammals.
Incorporation of 100 g glucose/l in the drinking water for growing chickensdoes not depress food intake, nor does it increase live weight gain. There is,however, an increase in carcass fatness (Engku Azahan and Forbes, 1989).Thus, apart from osmotic effects, only hepatic infusion of glucose suggests thatit is specifically involved in the control of intake in chickens.
Pigs
Glucose infused into the jugular vein or hepatic portal vein had no effect onfood intake by young pigs (Houpt et al., 1979), but the conditions of theexperiment (10 min access to food after an overnight fast) would not necessarilyallow an effect to be shown – severe hunger might far outweigh the effects ofinfused glucose. In the young pig, 1 unit/kg insulin causes increased intakeduring the 6 h after injection (Houpt and Houpt, 1977).
Infusion of glucose solution into the duodenum of fasted pigs depressesintake (Chapter 3) but the effect is not specific to glucose, as similar depressionof intake was induced by infusion of hypertonic saline. Thoracic vagotomy, orconcurrent infusion with local anaesthetic, largely blocked the effect ofduodenal infusion of glucose (Stephens, 1985). Thus, there is a mechanism forsensing of duodenal osmotic pressure with nervous transmission to the CNSbut, once glucose has been absorbed, it seems to have no effect under theconditions of the work done so far, in which food was only available for shortperiods each day.
Cattle
Plasma glucose concentrations in ruminants are much lower than those insimple-stomached animals and the fluctuations are smaller. However, becauseof the major role of glucose as a fuel in the non-ruminant and the prevalence ofthe glucostatic theory of control of intake, there were several investigations inthe 1960s of effects on feeding of manipulation of blood glucose levels inruminants. Glucose had no effect in cattle whether given intra-ruminally,intravenously or intra-cerebroventricularly.
Metabolites and Hormones 71

Sheep and goats
Short-term intravenous infusion of glucose or insulin infusion, at physiologicalrates, has no effect on feeding in goats, nor has intra-cerebroventricularinjection of glucose in sheep. However, intravenous infusion of 275 g or 160 gglucose/day for 8–10 days depressed intake of an optimal food by 1.95 g OM/gglucose, i.e. almost exactly 100% compensation in terms of ME (Weston,1996). The fact that prolonged infusions were necessary to show this effectsuggests that it might be via a slow adaptation, such as occurs when the energyconcentration of the food is changed. It seems, therefore, that glucose is not animmediate short-term feedback signal in ruminants, not surprising in view ofthe small amounts escaping ruminal fermentation.
While a very large dose of insulin given into the jugular vein depressedintake, lower amounts had no effect, but a relatively slow rate of infusion intothe hepatic portal vein depressed intake (Deetz et al., 1980). Infusion of glucoseto prevent insulin-induced hypoglycaemia blocked the intake-stimulating effectof that hormone. Injection of 2DG into the cerebroventricles, together withinsulin depressed intake – a paradoxical result in that 2DG inhibits glucoseuptake and would be expected to stimulate intake by causing glucoprivation inhypothalamic cells. However, Houpt (1974) showed that 2DG given intra-venously induced hyperphagia in sheep, even when hyperglycaemia wasprevented by adrenalectomy.
From this evidence it can again be concluded that glucose is not likely tobe specifically involved in the control of feeding in sheep, although energystatus is of significance. VFAs do affect intake, however, and the whole subjectof receptors and the role of the reticulo-rumen in the control of feeding hasbeen covered in Chapter 3.
Liver Receptors
The liver is well placed to monitor the uptake of nutrients from the digestivetract and, given its role in smoothing out this erratic supply to maintain morestable levels in the general circulation, it must be able to detect concentrationsor rates of uptake of metabolites such as glucose and amino acids. There areimportant nervous links between the liver and the central nervous system and itis perhaps surprising that little serious attention was paid to the role of the liveras a source of signals for controlling food intake until the early 1970s (reviewedby Anil and Forbes, 1987).
The potent effect of portal glucose infusion is reduced by liver denervation,and electrical activity is induced in some neurones in the lateral hypothalamusby portal infusion of glucose. The activity was modified by either vagotomy orsplanchnotomy. Nerve endings have not been found in liver parenchyma butthere are many nerve endings in the wall of the portal vein, and superfusion ofthe exposed inner wall of the hepatic portal vein with glucose solutiondecreases firing of some vagal fibres.
72 Chapter 4

There is considerable evidence that the supply of oxidizable substrates to theliver is monitored in simple-stomached animals with transmission of informationto the central nervous system via the nerves of the hepatic plexus, and that thisplays a part in the control of feeding (Forbes, 1988a).
The liver is an important site of fat metabolism in mammals, where in therat the intake-depressing effects of fatty acids are blocked by substances thatblock fatty acid oxidation. Vagal section prevents these effects, furtherstrengthening the belief that fatty acids can play a significant role in satiationvia the liver. The hypophagic effect of metabolites is linked to a particular stepin their metabolism, principally in the liver (Scharrer et al., 1996). Whereasglycerol and malate depress intake, their oxidation products dihydroxyacetoneand oxaloacetate do not, indicating that the oxidation process itself isimportant. Lactate and its product of metabolism, pyruvate, depress intake toan equal extent and, as lactate is metabolized to pyruvate and as pyruvate itselfis oxidized to acetyl-CoA, the importance of the oxidation step is supported.
When a high-fat diet was offered, lactate and pyruvate no longer showedthe intake-depressing effect, but fat is known to depress pyruvate oxidation; it islikely that such a depression occurred in this experiment because blood levelsof these metabolites remained elevated for longer after injection in rats fed thehigh-fat diet compared with those on a high-carbohydrate diet. All of thisevidence points to the oxidation step in liver metabolism being the key toeffects of the liver on food intake (Forbes, 1988a).
Several studies have failed to confirm an important role for the liver insensing nutrients and transmitting the information via the nervous system, butM.G. Tordoff and M.I. Friedman (personal communication) have noted thatthose experiments in which there has been no effect on feeding of increasingnutrient flow to the liver have exposed animals to different, contrasting,treatments at short intervals, thus confusing them by not allowing adequatetime for them to learn the effects of different infusions (see Chapter 6). Despitethe evidence presented here, there is still considerable controversy as towhether the liver is important in the control of intake under physiologicalconditions.
Poultry
Several experiments have investigated the glucostatic theory of intake controlin birds without finding any significant depression due to glucose injections orinfusions. In the first recorded infusions of glucose solutions into the coccygeo-mesenteric vein (leading into the liver) of chickens, Shurlock and Forbes(1981a) infused a solution of 60 g glucose/l at a rate of 1.2 ml/min intocockerels over a period of 3 h. Even though this high rate of infusion had noeffect on food intake when given into the jugular vein (32 versus 28 g/3 h), italmost completely suppressed feeding when given into the liver (34 versus2 g/3 h). Further, when a range of solutions from 1 to 60 g/l was given, therewas a highly significant negative correlation between the concentration ofglucose in the solution and the weight of food eaten during the infusion (see
Metabolites and Hormones 73

Fig. 4.1). The slope of the relationship is steep at lower concentrations, which isthe physiological range, suggesting that liver sensitivity to glucose has thepotential to exert a powerful control over feeding in the normal chicken.
The effects of overnight fasting on the response of cockerels to portalinfusion of glucose were investigated by Shurlock and Forbes (1981a). Intakewas depressed only by the highest dose of glucose when access to food wasallowed during the infusion. When food was withheld until the end of theinfusion there was a large, dose-dependent inhibition of voluntary intake. Thisresult, together with observations made during the post-infusion period inprevious experiments, showed that the effect of glucose lasted beyond theinfusion period and was more likely to be a result of changes in liver glycogenor glucose content rather than simply an effect of the concentration of glucosein the blood perfusing the liver.
An amino acid mixture infused into the portal vein also depressed intake,while jugular introduction at the same rate had a much smaller effect (Shurlockand Forbes, 1984); effects of glucose and amino acids were additive andpossibly affected the same system in the liver. Lysine infused at 50–150 mg/3 hcaused a reduction in intake during the 3-h treatment, whereas ammonia at anequivalent rate did not and leucine had a delayed effect (Rusby and Forbes,1987a). Vagotomy at the level of the proventriculus blocked these effects ofportal infusion of glucose and lysine (Rusby et al., 1987; Fig. 4.2), althoughdoubt is cast on this conclusion by the lower intake of the vagotomized birdsduring the control infusion, compared with the intact chickens, suggested asbeing due to the changed feeding pattern of the former (see below).
74 Chapter 4
0
10
20
30
40
50
60
70
80
90
0 1 2 3 4 5 6 7
Concentration of glucose in infusate (g/l)
Food
inta
ke (g
)
Fig. 4.1. Effect of infusing at 1.2 ml/min isotonic saline (including glucose) into the liver ofcockerels on food intake over 1 h (�) and 3 h (●) (from Shurlock and Forbes, 1981a).

Adrenaline injected into the hepatic portal vein at low doses of up to0.1 mg/kg depresses intake, an effect which is blocked by section of the hepaticbranch of the vagus nerve (Howes and Forbes, 1987a). As adrenaline causesglycogenolysis, these results suggest that it is glucose concentration in oraround hepatocytes that is important rather than the direction of flow ofglucose through the hepatocyte membrane. In order to study the mode ofaction of adrenaline, an �-adrenergic blocker, phenylephrine, was given intothe liver at a wide range of doses, but without effect; a �-blocker, salbutamol,depressed intake but the range of doses used (500–2000 �g) was probably toohigh to achieve its effect just by a physiological blocking of endogenousadrenaline. The intake-depressing effect of injecting glucagon into the liver ofchickens is also blocked by vagal section (Howes and Forbes, 1987b), butwhether the dose used was physiological is open to question.
In birds, most fat synthesis occurs in the liver, and plasma levels oftriglycerides are much higher than in mammals. Cockerels of an egg-layingstrain were sensitive to fat infused into the hepatic portal vein, but not into thejugular vein, while in broilers there was no effect, irrespective of site of infusion(Lacy et al., 1986). Has selection of meat-type chickens bred out some of theliver’s sensitivity to metabolites?
If the liver is important in the control of food intake, it would be expectedthat liver denervation would disrupt feeding behaviour. Local denervation hasnot been undertaken in the chicken, but section of both vagus nerves as theycross the proventriculus (the equivalent of sub-diaphragmatic vagotomy inmammals) has been carried out, this affecting many visceral organs, notjust the liver. It is perhaps surprising, therefore, that Savory and Hodgkiss(1984) found no differences in feeding behaviour between vagotomized and
Metabolites and Hormones 75
30
40
50
60
70
Control Lysine Glucose Lysine + glucose
Foo
d in
take
(g/
3 h)
Fig. 4.2. Food intake during 3-h infusions of glucose and/or lysine solutions into the liver ofintact (solid bars) or vagotomized (open bars) chickens (from Rusby et al., 1987).

sham-vagotomized chickens, although Rusby et al. (1987) observed signi-ficantly fewer meals, each of a larger size, but there was no effect on total dailyintake. If, as suggested in Chapter 10, many feedback factors are integrated bythe CNS, the loss of some of these would not necessarily result in a change indaily intake, but would be likely to result in larger meals.
Pigs
Infusion of a solution of 150 g glucose/l, or of 250 ml of a solution of 100 gamino acids/l, into the jugular vein or hepatic portal vein during feeding had noeffect on the voluntary intake of pigs trained to eat in one session per dayunder operant conditions (Stephens, 1980). These results are in contrast tothose with other mammals and birds, but there is no a priori reason why thepig should be different to other mammals, as its liver metabolism is similar tothat of the rat. It seems likely that the feeding regime used in experiments withpigs, with only one or two periods of access to food per day, makes themreliant on different stimuli to terminate feeding compared with animals withcontinuous access to food. Perhaps the large amount they must eat in the shortperiod of access emphasizes the physical aspects of gut-fill as a limit to mealsize.
Ruminants
Ruminant animals absorb most of their energy from the digestive tract in theform of volatile fatty acids (VFAs), of which propionate is gluconeogenic andhas been shown to depress intake in sheep (see below). The only direct studyinvolving infusions into the hepatic portal vein of cattle was that of Elliotet al. (1985), who noted reduced intake during 20 out of 30 infusions of20–50 mmol/min of sodium propionate into the portal vein of growing cattle;they ascribed the variability of their results to their method of feeding, whichwas restricted to 2.5% of body weight/day, given in 24 hourly meals.
It had been found in sheep that propionate depressed intake to a greaterextent when infused into the ruminal vein than into other vessels, and theexistence of propionate receptors at that site was proposed. Anil and Forbes(1980b) showed that a 3-h infusion of 1.2 mmol/min of sodium propionate intothe hepatic portal vein almost completely prevented feeding in sheep, while thesame rate of infusion into the jugular vein had little effect. It seems highly likely,therefore, that the ruminant liver is sensitive to its rate of utilization of propionate.
The route(s) taken by information from the liver to the CNS have beenstudied by sectioning the hepatic plexus of nerves, by sectioning or anaesthetizingthe splanchnic nerves and by sectioning the hepatic branch of the vagus nerve(Anil and Forbes, 1980b, 1988). Almost complete section of the hepatic plexus,bilateral splanchnotomy (Fig. 4.3a) or temporary blockade of nervous trans-mission in the splanchnic nerves (Fig. 4.3b) all prevented the intake-depressingeffect of 3-h infusions of sodium propionate into the hepatic portal vein at
76 Chapter 4

Metabolites and Hormones 77
0
50
100
150
200
250
300
350
Intact Splanchnotomy Hepaticvagotomy
Hepaticdenervation
**
Foo
d in
take
(g/
3 h)
(a)
Fig.4.3. (a) The effect on food intake of saline (solid bars) and sodium propionate (NaPr)solution (open bars) infused into the hepatic portal vein of sheep subject to bilateralsplanchnotomy, section of vagal innervation of the liver or total liver denervation; (b) effecton food intake of sodium propionate infused into the hepatic portal vein of sheep with andwithout splanchnic blockade with anaesthetic; **, highly significant effect of propionateinfusion (from Anil and Forbes, 1988).
Foo
d in
take
(g/
3 h)
(b)
0
50
100
150
200
250
300
350
Saline NaPr NaPr + block
1.2 mmol/min. The paradoxical situation whereby either one of the two likelyroutes for transmission of afferent information from liver to CNS results inblockage of the effects of propionate given into the liver has not been resolved,but may be due to some efferent involvement with the control of blood flow orenzyme activity that is prevented by nerve section.

These clear-cut effects of propionate infusion into the portal vein on feedingby sheep have not always been seen by other workers. De Jong (1981) infused amixture of the sodium salts of VFAs into the hepatic portal vein of goats at a ratesimilar to that used for sheep by Anil and Forbes (1980b), but found no change infood intake despite a doubling of plasma levels of VFAs. The protocols used by thetwo groups were very similar, and it seems unlikely that there is a fundamentaldifference between such closely related species – perhaps the tips of the cannulaein de Jong’s animals were beyond the receptors in the wall of the veins enteringthe liver, while those of Anil and Forbes ended in the mesenteric vein into whichthey were introduced, i.e. short of the portal entry to the liver (see below). Theeffect observed in the sheep is not likely to be simply osmotic, because sodiumacetate infused into the portal vein at 4 mmol/min (i.e. more than three times theosmotic load of the sodium propionate infusion) had no effect on feeding (Aniland Forbes, 1980b); acetate is not utilized by the liver in significant quantities.
Denervation of the liver does not affect daily food intake in several species,including sheep, and this has been cited as evidence that the liver does notplay a role in the control of food intake. However, the meals are larger and lessfrequent than those of normal animals (Anil and Forbes, 1980b), as would beexpected if some, but not all, of the negative feedback information from thevisceral organs had been cut off.
A nervous pathway from the liver to the nucleus of the solitary tract in themedulla oblongata via the vagus nerve has been identified (M.H. Anil, P.Chaterjee and J.M. Forbes, unpublished observations), and it would appearthat the sheep is similar to the rat in that both vagal and splanchnic afferentpathways are involved in the transmission of information from liver to brain(Anil and Forbes, 1988).
Attempts in our laboratory to study vagal discharges from chemoreceptorsin the liver of the sheep have not revealed any consistent responses topropionate injected into the hepatic portal vein (M.H. Anil and J.M. Forbes,unpublished observations). Nor have we been able to find receptors in livertissue of sheep or chickens by electron microscopy (P. Chaterjee, M.H. Anil andJ.M. Forbes, unpublished results). This is in line with the failure to demonstratereceptor nerve endings in the parenchyma of the liver of several other species,including the rat (see above). Structures with the appearance of chemoreceptorshave, however, been located in the hepatic portal vein of the rat, so furtherstudies are required in farm animals. The finding that propionate depressed foodintake by sheep when given for 20 min at 2 mmol/min into a mesenteric vein –but not the portal vein (where the tip of the infusion catheter would lie withinthe liver) – supports the idea that the receptors are in the portal vein rather thanin liver parenchyma (Leuvenink et al., 1997).
Ingestion by sheep of the plant Lantana camara leads to ruminal stasis andanorexia, which McSweeney and Pass (1983) showed to be due to liverdamage rather than to direct effects of the toxin on receptors in the reticulo-rumen. Liver denervation of intoxicated animals reduced the severity of thereduction in ruminal muscular activity, and it was concluded that the effects oflantana poisoning on the rumen were indirect and that the ruminal stasis wasreflex in nature, the primary lesion being in the liver.
78 Chapter 4

Lipids
Fat is stored in the body in large quantities, with continuous turnover involvingthe release of fatty acids, glycerol and ketones such as D-3-hydroxybutyrate.There is particular interest in ways in which adipose tissue might affect feeding,in view of the practical significance of preventing or reversing over-fatness, bothin humans and in farm animals (see Chapter 15).
Dietary fat is absorbed into the lymphatic system rather than into the venousdrainage of the intestines in mammals, and thus bypasses the liver. However, theliver is an important site of fat metabolism in mammals and especially in birds.Intravenous infusion of fat emulsion depresses intake, an effect that is notaccompanied by changes in plasma glucose or insulin concentrations. As animalsfatten, there is a gradual increase in plasma insulin concentration, and theimpressive evidence that this is reflected in increased concentrations of insulin inthe cerebrospinal fluid that inhibit intake, thus acting as a homeostaticmechanism for body fat, has recently been reviewed (Stricker and Woods, 2004).Because of its importance in controlling fat deposition, insulin has received muchattention in studies on relationships between body fatness and voluntary foodintake. In particular, insulin resistance increases with increasing body fatness.
The continuous turnover of adipose tissue involves the release of fattyacids, glycerol and ketones. Glycerol levels in blood do not increase during ameal, so that any involvement in the control of intake is more likely to be as along-term signal of adiposity, added to the immediate signals of the nutrientvalue of food being eaten or recently eaten. Infusion of glycerol into the portalvein of castrated male sheep at a physiological rate of 0.3 mmol/min for 3 h didnot increase the peripheral concentration of glycerol and had no short-termeffect on intake (P.M. Driver and J.M. Forbes, unpublished results). Glyceroldoes not seem to be a strong candidate for a signal mediating reduced intake insheep, although proportionately higher doses do depress intake in rats.
Palmitate increases liver cell membrane potential (via the sodium pumpdriven by oxidation), and this could be a way in which fat metabolisminfluences feeding. Inhibition of fatty acid utilization in rats with intraperitonealmercaptoacetate, which inhibits fatty acid oxidation, reduced the latency toeat without affecting meal size, thus implicating fatty acid oxidation in themaintenance of satiety after a meal (see review by Scharrer, 1999).
A net synthesis of lipids and deposition in adipose tissue is a drain onnutrients – particularly glucose and fatty acids – from the blood, which willcause a compensatory increase in food intake. However, there must be anupper limit to the rate and amount of fat deposition and, when either of theselimits is approached, the uptake of nutrients for fat synthesis will be reducedand food intake will decline.
Poultry
The site(s) of action of fats on intake has not been adequately studied inchickens. If the situation is similar to that in mammals, then one of the effects of
Metabolites and Hormones 79

fat in the diet is to slow the rate of emptying of the stomach, and this has beenconfirmed in hens but not in young broilers. If a reduction in rate of passagedoes occur it might in turn depress food intake by a stomach distensionmechanism. In view of the discussion above, there is clearly a lot of scope forstudies on the involvement of lipids in the mechanisms that control intake inthe chicken.
The chicken seems to be particularly sensitive to the effects of parenterallyinfused fat on feeding, which may be related to the fact that most lipid synthesisoccurs in the liver and the lipid is then transported in the bloodstream. As littleas 100 mg of lipid given in suspension into the hepatic portal vein of cockerelsof an egg-laying strain over a 30-min period depressed subsequent intake toone-half of control levels, while similar infusion into the jugular vein waswithout effect. However, a much larger amount was without effect in broilerchickens of the same weight (but younger age), and these birds were alsoinsensitive to glucose infused into the hepatic portal vein (Lacy et al., 1986).Broilers have been selected for high food intake, but whether this has involvedreduced sensitivity to metabolites is not yet understood.
Cattle
Choi et al. (1997) have tested the hypothesis that inhibition of fatty acidoxidation by sodium mercaptoacetate blocks the decrease in food intake bydairy heifers when the fat content of their diet is increased. They observed adecrease in intake during the 4 h after injection rather than the expectedincrease, and suggested it might be due to the changes in hormones andmetabolites induced by mercaptoacetate.
Plasma insulin is higher in obese than lean heifers and there is a biggerinsulin response to glucose in the obese, especially during oestrus.
Sheep
There must be a positive relationship between intake and rate of fat deposition,other factors being equal, and Mears and Mendel (1974) concluded from anexperiment with young lambs that intake was stimulated in animals with greaternumbers of adipocytes, due to the faster removal of metabolites from thecirculating pool: ‘The amount of glucose removed from the glucose pool couldbe the feed-back signal which results in a high long-term food intake’. It is inolder animals that the established size of the fat depots affects intake in anegative manner.
Adipose tissue is continually undergoing lipolysis and lipogenesis, andplasma free fatty acid levels are approximately proportional to body fat stores.Intravenous infusion of long-chain fatty acids depresses food intake in sheep(Vandermeerschen-Doize and Paquay, 1982), but this is not likely to represent asimple feedback loop because high free fatty acid levels also occur in underfedanimals which, if offered free access to food, eat more than well-fed animals.
80 Chapter 4

However, a well-fed animal has high plasma insulin levels while an underfedone has a low rate of insulin secretion. Perhaps fatty acids are satiating only inthe presence of high insulin concentrations in plasma.
McCann et al. (1992) fed adult Dorset ewes in lean condition a pelletedhay–grain food and observed a doubling of body weight over 42 weeks from47 to 97 kg, and the lipid content of the carcass increased from 25 to 49%.From week 5 to 20, intakes were at the maximum allowed (3.0 kg/day) butthen fell steadily to about 1.2 kg at 42 weeks. Once they had reached the staticphase of obesity, intake per unit of body weight was the same as required formaintenance by lean sheep. Plasma insulin rose from 50 to 249 pmol/l byweek 30. At around 25 weeks thyroid hormones rose significantly, plasma freefatty acid levels rose and voluntary intake started to decline, changes whichmight have been related to changes in morphology and/or humoral signalsemanating from adipocytes. The high insulin levels coupled with high plasmaglucose showed that insulin resistance had occurred.
Vandermeerschen-Doize et al. (1982) found that plasma insulin concentrationincreased steadily from 10 to 300 �U/ml over a 35-week period of ad libitumfeeding of sheep; by the end of this period body weight had stabilized. Insulinconcentration also increases in goats as they get fatter. This suggests that thedeclining intake was not simply due to a reduction in ruminal capacity withincreasing volume of abdominal fat; had this been the only cause, then insulinlevels would have been more likely to decrease due to a fall in plane of nutrition.
Volatile Fatty Acids
Although plasma levels of the VFAs increase in ruminants after large meals, thechanges in peripheral blood during and between small spontaneous meals arenot clear-cut. The available evidence indicates that acetate affects receptors inthe ruminal wall (see Chapter 3) and propionate affects the liver (see above);transport in the general circulation is not considered to be very important as anegative feedback signal.
Amino Acids
Amino acids stimulate gut receptors, but whether these are osmoreceptors orwhether there are specific amino-receptors is not clear. Once absorbed, aminoacids reach the liver and some metabolism takes place, including deaminationand oxidation of those present in excess. An imbalance in the proportions ofamino acids relative to the requirements invariably leads to reduction in foodintake (see Chapter 12).
The liver of the chicken is sensitive to lysine, as infusion into the portal veincauses a much greater depression of intake than infusion at the same rate intothe jugular vein; the liver effect is blocked by vagotomy in the same way as theeffect of portally infused glucose (Rusby et al., 1987).
Metabolites and Hormones 81

The evidence for a direct effect of amino acids on the brain is stronger thanthat for glucose. Tobin and Boorman (1979) fed chickens on a histidine-deficient diet that depressed food intake and found that infusion of histidineinto the carotid artery, which goes directly to the brain, reversed the effect ofthe amino acid imbalance while infusion into the jugular vein had no effect.Thus, histidine appears to act directly on the brain to alleviate the intake-depressing effects of deficiency rather than more generally in the whole body.
Metabolic Hormones
Insulin
In farm animals, the effects of insulin administration have sometimes been todepress food intake and sometimes to stimulate it. In the chicken, mammalianinsulin depresses intake but avian insulin is structurally different from that ofmammals and any future work will need to use chicken insulin.
Exogenous insulin has been shown to stimulate voluntary intake of pigsunder some circumstances (Houpt et al., 1977). Similarly, some experimentswith sheep have shown increased intake (e.g. Houpt, 1974) while others havenot. Intravenous administration of 0.7 �g/kg of insulin at the beginning of ameal depressed food intake during the following 30 min by 14% when given tocows deprived of food for 11 h, but not in those fed 4 h beforehand (Faverdin,1986), so the role of insulin in short-term control of intake depends onnutritional status.
Evidence that insulin does play an important physiological role inmaintaining food intake in ruminants comes from the observation that alloxan-induced diabetes causes inappetence and death in sheep (Reid et al., 1963).This is due to the lack of insulin rather than to the general toxic effects ofalloxan, because replacement therapy with insulin maintains intake at normallevels.
A collation of data from the literature on effects of intravenous insulin inruminants (Dulphy and Faverdin, 1987) shows that, in the short term (15–30min after injection), doses up to about 0.5 �g/kg depress feeding but dosesabove this have less effect; higher doses (84–170 �g/kg) stimulate intake from2–4 h after injection. Infusion of glucose to maintain plasma levels prevents theinsulin-induced hypophagia in sheep, but in cows a euglycaemic clamp appliedfor long-term infusions (4 days) during hyperinsulinaemia generally depressedintake (Faverdin, 1999). Given the many physiological responses, both directand indirect, to changing the concentration of insulin in the blood, it is notpossible to explain these diverse results without a deeper understanding of allof the factors effecting, and affected by, changes in insulin secretion.
In summary, insulin may play a role in long-term intake and weightregulation in ruminants but it does not seem likely that it plays a role in thedepressed intake in dairy cows in early lactation when the insulin concentrationis low.
82 Chapter 4

Glucagon
Glucagon has been found to increase in blood during feeding. The liver is thefocus of attention for effects of this hormone on feeding, as injections into theportal vein are more effective in depressing feeding than those into the generalcirculation, and hepatic vagotomy blocks the effect of glucagon given portally.
Glucagon injected into the portal vein of cockerels at doses of 5–50 �g wasfound to depress food intake in a dose-related manner during the subsequent90 min (Howes and Forbes, 1987b). This effect was prevented by vagotomy,although interpretation of the results was somewhat clouded by the fact thatcontrol levels of feeding at the time of day the experiments were carried outwere lower in vagotomized birds than intact birds. The reason for this isprobably that vagotomized chickens eat fewer meals and the infusion periodhappened to include less meals after vagotomy.
Of the few studies of glucagon and glucagon-like peptide 1 (GLP1) onfood intake in ruminants, one shows that glucagon administered intravenouslyat physiological concentrations does reduce intake in sheep. More research isrequired in ruminants on the effect of glucagon and GLP1 to unravel theirimportance in intake regulation.
Corticotropin-releasing factor (CRF)
CRF is the hypothalamic releasing hormone that controls the output of pituitarycorticotrophin and thus the adrenal output of corticosteroids. Centrallyadministered, CRF reduces food intake in cattle and it may be that it plays arole in the reduced intake around calving and during other stressful events(Ingvartsen and Andersen, 2000).
Growth hormone and somatostatin
In the sheep, spontaneous meals of a highly digestible food are preceded bypeaks of growth hormone (GH) in plasma, as shown in Fig. 4.4 (Driver andForbes, 1981). Unexpected withdrawal of food resulted in much greater peaksof GH secretion within 2–3 h and, within a few minutes of replacement of food,levels were low once again. The concentration of GH in lactating cows alsotends to fall during spontaneous meals. Growth hormone secretion is asensitive index of nutritional status, and this suggests that the pre-meal peak isan indication of the need to replenish body stores, rather than a direct cause ofeating. Injection of GH to mimic spontaneous peaks has no effect on feedingbehaviour (P.M. Driver and J.M. Forbes, unpublished results), so that therelease of GH from the anterior pituitary (under the control of thehypothalamus) and the onset of feeding seem to be independent consequencesof a relative shortfall in nutrient supply from the digestive tract.
Somatostatin is the hypothalamic factor that maintains inhibitory controlon GH secretion. In a summary of 11 studies, it was found that growing cattle
Metabolites and Hormones 83

84 Chapter 4
immunized against somatostatin ate an average of 4.2% more food than didcontrols (Ingvartsen and Andersen, 2000). This effect is likely to be via theincrease in growth, and thus in nutrient requirements, caused by theimmunization. It may seem paradoxical that GH should both signal a shortageof nutrients and stimulate growth. However, it should be borne in mind thatinsulin secretion is reduced by underfeeding so that mild underfeeding willallow fat mobilization (increased GH and reduced insulin), while encouragingdeposition of non-fat tissues.
Adrenaline
Eating stimulates the sympathetic and parasympathetic branches of theautonomic nervous system, causing the release of adrenaline both from the
Fig. 4.4. Plasma growth hormone concentrations and meal sizes during 27-h periods in asheep; (a) with free access to food throughout; (b) food removed from 17.30 to 03.30 h (fromDriver and Forbes, 1981).

adrenal medulla and from sympathetic nerve endings in the liver, which mightcontribute to satiety via actions on the liver. Intramuscular injection of adrenalineat doses of 0.2–1.0 mg/bird caused hypophagia for several hours (Sykes, 1983).This inhibition of feeding was not overcome by prior starvation for 24 h, but pre-treatment with 1.5 mg phentolamine or 0.4 mg propranalol (�-adrenergicantagonists) completely blocked this effect. Injection of up to 2.5 mg adrenalineinto the hepatic portal vein of cockerels depressed intake in a dose-relatedmanner, but the effect of the highest dose was not attenuated by vagotomy at thelevel of the proventriculus (Howes and Forbes, 1987a). Phenylephrine, a pure �-blocker, given intraportally at doses of up to 3.0 mg, had no effect on foodintake whereas the �-blocker salbutamol gave a dose-related depression, whetheror not the vagus nerves were intact. The biological significance of these results isin doubt, however, as the doses used are likely to be well above the physiologicalrange.
Leptin
It had long been suspected that adipose tissue secretes a substance inproportion to its mass, that acts as a feedback signal to the CNS. Leptinpossesses many of the characteristics necessary for this function, as adiposetissue produces this hormone increasingly as adipocyte size increases (seereview by Houseknecht and Spurlock, 2003). Leptin is taken up in the CNSwhere it inhibits feeding via the NPY system, with pro-opiomelanocortin,melanocortin-stimulating hormone and aguti-related peptide also likely to beinvolved as mediators. Leptin primarily binds to the dorso- and ventromedialnuclei of the hypothalamus and to the arcuate nucleus, areas of the brain thatare involved in the control of hormone secretion (including GH) and foodintake.
While much of the research on leptin has been performed with laboratoryanimals and humans, there is evidence that it has similar functions in farmanimals (Ingvartsen and Andersen, 2000). Leptin also affects energyexpenditure, glucose metabolism, insulin secretion and action, the adrenal axisand hormones of the growth hormone axis, but virtually no research in theseareas has been conducted with farm animals, although it has been demon-strated that growing pigs injected intra-cerebroventricularly with 10, 50 or100 mu porcine leptin showed a dose-related depression in food intake overapproximately the next 24 h (Barb et al., 1998).
Although there have been some studies on the effects of GH on plasmaleptin levels in cattle, there appears to have been no work on voluntary intake.
Leptin in the plasma of sheep shows a mean concentration of 2.9 ng/ml,but with secretory episodes at 4.8 pulses/day with a mean amplitude 0.67ng/ml and length of 1.13 h. These parameters are not affected by pattern offeeding or light (Tokuda et al., 2000b). There appears to be a seasonalinfluence on the effects of leptin in sheep, as ICV injection in the autumnreduces food intake by 30%, when it is already low (see Chapter 17), while thesame injection in the spring has no effect (Adam and Mercer, 2004).
Metabolites and Hormones 85

Administration of single injections of 200 �g of mouse leptin intra-cerebroventricularly daily for 7 days in sheep reduced intake and body weight(Tokuda et al., 2000a), and continuous infusion for 3 days of recombinanthuman leptin at 20 �g/h into the cerebroventricles of sheep decreased the foodintake significantly (Henry et al., 1999).
If we can envisage leptin as generating ‘discomfort’ in the CNS, then wecan integrate it into our concept of MTD, whereby its effects are added to thoseof other feedback signals (see Chapter 10). A small but persistent effect ofleptin could, when added to the short-term signals from the digestive tract andliver, result in significant long-term reduction in intake in obese animals. Thereis no need to consider short-term and long-term controls of intake as beingdifferent in nature, just in the rate of change of the signals involved.
While there have been hopes that our increasing knowledge of the biologyof leptin would lead to advances in the treatment of obesity in humans, it isdifficult to see how knowledge of the leptin system could be made use ofcommercially in farm animals. If leptin is contributing significantly to the controlof intake, then neutralizing leptin (e.g. with specific antibodies) would allowfood intake to increase but the extra nutrients would be used for fat synthesis,which is not usually required. If, on the other hand, the animal is eatinginsufficient to support its metabolic needs, then adipose tissue will have beendepleted and its production of leptin will be low, rendering neutralizationineffective.
Not all agree that the leptin hypothesis is valid. Speakman et al. (2002)point out that there are very great differences in the concentrations of leptin inpeople of similar fatness; different fat depots produce different amounts ofleptin, subcutaneous fat a great deal, omental fat hardly any; in some speciesleptin is produced in the liver as well as in adipose tissue. Leptin production isvery sensitive to immediate food intake, so leptin should be thought of as astarvation signal, i.e. a memory of energy deficit, and body mass is thenconsidered an output variable rather than part of a closed loop, and to besusceptible to social factors, etc. Speakman’s alternative proposals to explainthe maintenance of more-or-less constant body fat content are discussed inChapter 15.
Ghrelin
This is a hormone produced by the stomach wall that stimulates feeding byacting on the hypothalamus. Plasma levels increase during fasting, and humansinjected with ghrelin have reported sensations of intense hunger. In pigs,intravenous infusion of 2 �g/kg/day of ghrelin for 5 days stimulated weight gainand insulin, GH and cortisol secretion without affecting food intake (Salfen etal., 2004). This reinforces the endocrine effects of ghrelin without giving anysupport for an effect on intake.
Ghrelin and its cDNA-encoding precursor have been identified from thechicken proventriculus, and Kaiya et al. (2007) review ghrelin structure,distribution and function in birds.
86 Chapter 4

In sheep, peaks of ghrelin in plasma have been noted just before scheduledfeeding times, falling back to baseline 1 h after feeding (Sugino et al., 2002). Itwas suggested that ghrelin was acting as a hunger hormone.
Another hormone, obestatin, was found in late 2005 to decrease appetite.It is encoded by the same gene as ghrelin, but the purpose of this mechanismremains unknown.
Cholecystokinin
The secretion of several gut hormones is increased during feeding andsubsequently as digesta pass through the stomach and duodenum. Of these,cholecystokinin (CCK) is perhaps the most studied as a satiety signal, butothers, such as bombesin and gastrin, are also likely to be involved; CCK isproduced principally in the wall of the duodenum. Strong evidence thatendogenous CCK is important in the limitation of feeding has been providedby autoimmunization of rats to CCK, which increases food intake and weightgain and by the conditioning of a flavour preference to CCK with very lowdoses; higher doses condition an aversion.
The receptors for CCK that are involved in the feeding response wereinitially assumed to be those in the brain, but it has been shown that there arealso receptors in the stomach, as gastric vagotomy prevents the effects ofexogenous CCK on intake. The major effect of peripheral injection is probablyon the digestive tract, stimulated to contract and thereby activatemechanoreceptors whose information is relayed to the CNS via the vagusnerves. The effect of injection into the brain is direct, and the effect on feedingis probably independent of that on the gastrointestinal tract (see Chapter 5).
Poultry
Intravenous injection of CCK in chickens reduces food intake, depresses gizzardmotility and stimulates muscular activity in the duodenum. It has been found thatintravenous infusion of CCK had less effect in birds offered diluted food and it wassuggested that CCK may induce gastrointestinal responses that lead to abdominaldiscomfort; these are reduced when the motivation to food is higher (Savory andGentle, 1984). Savory (1987) used conditioning tests to demonstrate thatbombesin or CCK-8 at 1–10 �g/kg were mildly aversive, increased heart rate andinduced abnormal gastrointestinal motility. Cholecystokinin is less effective whenarousal is reduced with reserpine, when the birds are very hungry or when theirattention is distracted, all these points being used to support the contention thatCCK acts by inducing abdominal discomfort rather than normal satiety.
Covasa and Forbes (1994b) confirmed the effects of CCK in broilerchickens by intraperitoneal injection and demonstrated a learned aversion tothe colour of food offered for 2 h after 14 �g/kg CCK injections, compared withsaline. Vagotomy at the level of the proventriculus (equivalent to sub-diaphragmatic vagotomy in the mammal) prevented the effect of CCK onfeeding and the learned aversion to CCK-paired coloured food. A very low
Metabolites and Hormones 87

dose of CCK (2�g/kg) had no significant effect on feeding and did not elicit apreference for the colour paired with the injection.
The CCK-blocker, MK-329, given intraperitoneally at doses of � 90 �g/kg,significantly increased food intake over the next 2 h while, when givenintravenously, somewhat lower doses were effective (Covasa and Forbes,1994a). Lower doses of MK-329 did not affect food intake and failed tocondition a preference or aversion for the colour of food given for 2 h after theinjection. Cholecystokinin (14 mg/kg) caused a reduction in feeding, but thiseffect was not blocked by pre-treatment with intraperitoneal injection of MK-329 (32, 90, 180 and 360 mg/kg), thus questioning the role of endogenousCCK in satiety in chickens. A logical next step would be to see whether MK-329still stimulates intake when given intraperitoneally in vagotomized birds.
Pigs
Cholecystokinin is thought either to constrict the pylorus, reducing the rate ofstomach emptying, or to increase the sensitivity of vagal afferent receptors.CCK given into the jugular vein of pigs at a rate sufficient to depress foodintake by 25% did not affect gastric emptying, however, suggesting that aneffect on stomach motility is not necessary for CCK to exert at least some of itseffect on feeding. This is confirmed by the observation that MK-329 reversesthe depression of intake caused by fat infusion, but does not reverse the effecton gastric emptying. MK-329 increases intake in operant-fed pigs and also inpigs given a single meal after an overnight fast (Rayner et al., 1991). AnotherCCK antagonist (L-364,718) blocked the inhibition of food intake induced byjugular or abdominal aortic infusion of CCK or duodenal infusion of emulsifiedfat or monoglyceride, while the responses to duodenal glucose, glycerol or oleicacid were not blocked.
Feeding in the pig is depressed by infusion of CCK into the generalcirculation but not by that into the hepatic portal vein or gastric artery. ProbablyCCK is most active in the upper intestine, as it is most effective when given intothe branch of the mesenteric circulation going to this part of the intestine. Thesite of action is concluded to be in the intestines, but it is not yet known whetherthis is dependent on vagal innervation. The fact that duodenal infusion ofphenylalanine or tryptophan in pigs increased plasma concentrations of CCK,but did not affect feeding (Rayner and Gregory, 1985), casts further doubt onthe role of CCK as a true hormone of satiety. However, pigs immunized againstCCK increased their intake by 8.2% and their growth by 10.6% (Pekas, 1983),strong support for a physiological role for CCK in the control of food intake.
Baldwin et al. (1983) have suggested that exogenous CCK causes ageneral malaise in the pig. They trained pigs by operant conditioning torespond for food, water, sucrose solution or heat. Doses of 20 or 40 units ofCCK octapeptide given intravenously transiently reduced responding for food,water or sucrose but had no effect on responses for heat. These results showthat CCK affects several types of behaviour and is thus unlikely to be a specificfood satiety factor. However, the CCK receptor antagonist MK-329 caused adose-related increase in food intake during 2 h following intravenous injection,
88 Chapter 4

and MK-329 also abolished the intake depression caused by CCK (Ebenezer etal., 1990). This suggests that endogenous CCK does play a role as a negativefeedback inhibitor of food intake.
It is likely that the doses of exogenous CCK used have mostly been abovethe physiological and have caused malaise, but the recent work with low dosesof exogenous CCK, with antagonistic drugs and with immunization againstCCK, provides very strong evidence for a role for CCK in normal satiety.
Ruminants
In ruminants there are delays between eating and the arrival of food at theduodenal CCK-producing sites. Thus, CCK might be less important in thesetypes of animal than in those such as the pig in which the simple stomachreleases digesta into the duodenum as soon as a meal starts. However, a dose-dependent increase in plasma CCK concentrations to feeding different amountsof fat to cows has been observed 3 h post-feeding (Choi and Palmquist, 1996),giving some support to a role for CCK in controlling food intake in ruminants.
Grovum (1981) infused CCK into several blood vessels in sheep and foundthat there was no greater effect on food intake when infusion was into thecarotid artery or portal vein than when it was given into the jugular vein. Heconcluded that neither the brain nor the liver were involved in the reduction offood intake in response to CCK. The main effect is probably on the digestivetract. However, the flow of digesta through the duodenum is relatively constantin free-feeding ruminants, and Furuse et al. (1991) found no significantfluctuations in plasma levels of CCK in cows either with concentrate orroughage feeding. Without such meal-related fluctuations it is difficult to seehow CCK can be involved in the control of feeding.
Other gut hormones
Pentagastrin depressed food intake of sheep whether given into the jugular veinor portal vein (Anil and Forbes, 1980a), while secretin had no effect by eitherroute. Two other gut peptides, somatostatin and bombesin, also depress foodintake and the former has many properties that make it a possible satietyhormone. The effect of somatostatin administered peripherally is blocked bygastric vagotomy, but that of bombesin is not and the route whereby the latterinfluences the CNS is unknown.
Other Hormones
Vasopressin
0.75–3.00 �g/kg of vasopressin given by intraperitoneal injection reduced foodintake by goats in a dose-dependent manner (Meyer et al., 1989). This effectwas reversed by a V1-receptor antagonist or an �-adrenergic antagonist. The
Metabolites and Hormones 89

vasopressin concentrations achieved in plasma as a result of the injections weresimilar to those seen during stress, and it was suggested that this hormonemight be involved in stress-induced anorexia.
Hormones involved in growth and reproduction are covered in Chapters15 and 16, respectively.
Conclusions
This chapter cannot claim to do justice to the complex subject of the roles ofmetabolites and hormones in the control of voluntary food intake. Although theglucostatic theory in the form originally proposed is no longer tenable, it is clearthat animals can monitor the availability of energy-yielding materials and usethis information to control their food intake. Because glucose is the majorenergy-yielding substrate in most non-ruminants, its infusion causes a reductionin food intake, especially when given into the liver. The liver is sensitive tooxidizable nutrients including glucose (propionate in the ruminant).
The effects of infusion of glucose or propionate into the liver can beblocked by local section of the vagus and/or splanchnic nerves, showing thatthe information to the brain is transmitted via the autonomic nervous system. Amajor role of the liver is to prevent the uneven flow of nutrients from thedigestive tract causing undue fluctuations in the energy supply to the rest of thebody, especially the CNS, so it is well placed to play a major role in the controlof feeding.
Fats and proteins can also yield energy and therefore affect the energostaticcontrol of intake in situations where they are oxidized. This utilization isinfluenced by metabolic hormones, and the effect of metabolites is modifiedaccording to the insulin and glucagon status of the animal. The role of insulinin the control of food intake is complex and dependent on the nutritional statusof the animal as well as on other hormones and metabolites.
Most hormones affect food intake when given in large amounts, but it is oftendifficult to decide whether they are acting directly on the CNS or peripherally andwhether they are important under normal, physiological conditions. This is true forthe gut peptides such as CCK, which act at both sites and whose natural sites andrates of secretion are difficult to mimic experimentally.
90 Chapter 4

5 Central Nervous System andthe Special Senses
The central nervous system is clearly the integrator of most of the actions of theanimal and, as such, plays a vital role in the control of voluntary food intake aswell as in growth, fattening and reproduction. It is axiomatic that informationfrom receptors in other parts of the body, including the special senses, isrelayed to the brain, which integrates this with what it has previously learnedabout the consequences of feeding and makes decisions whether or not to seekand eat food.
The centres in the brain that are involved in feeding control were originallythought to be in the hypothalamus, a region with a volume of about 0.5 cm3 inthe sheep, lying just above the pituitary gland and optic chiasma at the base ofthe brain. These centres have been associated with the glucostatic, thermostaticand lipostatic theories of control of feeding (see Chapter 1). The ventromedialhypothalamus (VMH) is important in the control of anterior pituitary functionas well as in food intake, while the lateral hypothalamic area (LHA), being apart of the medial forebrain bundle, receives information both from the visceralreceptors and from higher centres of the brain.
Early studies used lesioning techniques to destroy small parts of the brain,followed by observation of changes in behaviour following recovery from theanaesthetic. Subsequently the effects of electrical stimulation were studied,while more recently effort has been concentrated on the neurochemistry ofintake control using techniques such as injection of drugs that mimic or blockthe effects of the naturally occurring brain chemicals.
It is now accepted that feeding is organized by circuits and networks ofneurones rather than by discrete ‘centres’, but the full picture is far from beingcomplete. The involvement of the brain in the control of food intake withparticular respect to poultry has been reviewed by Denbow (1985), whileForbes and Blundell (1989) have covered the subject for pigs and Baileand McLaughlin (1987) for ruminants. None of these reviews is recent and,while subsequent research is covered in this chapter, studies with farm animals
© J.M. Forbes 2007.Voluntary Food Intake and Diet Selection 91in Farm Animals 2nd Edition (J.M. Forbes)

have decreased in the last two decades. Research using laboratory animals ispresumably of relevance to farm animals, but there is evidence of significantdifferences between species. Reference in this chapter to species other thanfarm animals is minimal, and the reader is referred to the book edited byStricker and Woods (2004).
Lesioning Studies
The first evidence of a particular locus for feeding within the brain was based onhypothalamic tumours found in obese humans in the late 19th century. Then,in the early 1940s, it was found that abnormalities of feeding and/or bodyweight occurred when discrete electrolytic lesions were made in the medialand lateral hypothalamus of the cat. Further studies in the 1940s and 1950sconfirmed that lesions of the ventromedial hypothalamus (VMH) led toobesity and hyperphagia in the rat, and this area became known as the‘satiety centre’.
Lesions of the lateral area of the hypothalamus (LHA), on the other hand,caused aphagia and death, although rats kept alive by force-feeding dideventually resume spontaneous feeding and survived, albeit at a lower bodyweight than normal; this area became known as the ‘hunger centre’.
Poultry
The VMH appears to be important in birds, and lesions in this area induceovereating and obesity in chickens, ducks and geese. However, the increasedfatness of VMH-lesioned chickens (probably by depression of the secretion ofgrowth hormone) was not always accompanied by hyperphagia. An increase oflipoprotein lipase activity precedes any increase in intake, suggesting that whenhyperphagia occurred it was a response to altered fat metabolism rather than aprimary effect of the lesions (Snapir and Robinzon, 1989).
In a detailed review of nerve tracts involved in food intake control in birds,Kuenzel (1989) describes mechanoreceptors in the bill/beak that are innervatedby the trigeminal nerve. However, lesions of the quintofrontal tract (thedestination of the trigeminal nerve) in chicks affect feeding for only a few days,in contrast to the pigeon, which cannot recognize food for several weeks.Lesions involving the optic system cause severe feeding problems, whileremoval of the olfactory bulbs causes an increase in food intake, but withoutobesity as metabolic rate is also increased. Further evidence that obesity andhyperphagia are not always linked came from the observations in which septal-lesioned cockerels overate but did not become obese.
Lesions placed in the mid-lateral hypothalamic region (equivalent to the‘hunger centre’ of mammals) induced hypophagia and loss of weight in only asmall proportion of individuals, but careful work by Kuenzel, involving bilaterallesions in the LHA of the chick, showed hypophagia for only a few days; moreposterior lesions gave more persistent effects.
92 Chapter 5

Gold thioglucose, which causes hypothalamic lesions and hyperphagia inmice, had no effect in chickens whether given systemically or implanted directlyinto the hypothalamus.
Removal of the pineal gland from the brain of day-old chicks stimulatessubsequent voluntary intake and weight gains (see Chapter 17), but no effectof pinealectomy on subsequent food consumption was found when theoperation was carried out at 9 days of age.
Pigs
VMH lesions in pigs cause hyperphagia while LHA lesions induce aphagia,with no signs of recovery when the animals were kept alive by force-feeding.Lesions in the VMH of young pigs (5–6 weeks old) did not immediately inducehyperphagia, although other metabolic effects were seen (Baldwin, 1985). Thisis similar to young rats, where hyperphagia and fatness occur only after theinfantile stage has been passed, both in VMH-lesioned and genetically obeseanimals.
Sheep and goats
Small VMH lesions in sheep did not change food intake, but they may not haveinvolved destruction of a large enough portion of the critical area because Baileet al. (1969), making larger lesions that destroyed the whole ventromedial partof the hypothalamus of goats, did observe overeating and excessive fatness.Electrolytic lesions in the LHA of goats and sheep caused hypophagia, but notaphagia or death.
Electrical Stimulation
Lesioning is obviously a clumsy technique, and more sophisticated methods ofstudying brain function have been used since the original lesioning studies.Information is transmitted along nerve fibres electrically and between nerves bychemical transmitters, and both electrical and chemical stimulation have beenused experimentally.
Although several species of bird have been tested for feeding responses toelectrical stimulation, very few such responses have been obtained, even whenthe site of stimulation was the lateral hypothalamus (chicken, Tweeton et al.,1973).
The only electrical stimulation which appears to have been performed in thepig has been self-stimulation in which animals, aged 10–16 weeks, were trainedto press a panel to stimulate the hypothalamus in addition to panels to obtainfood and water (Baldwin and Parrott, 1979). After a 22-h fast, there was a highrate of self-stimulation compared with the rate after eating to satiation in two outof four pigs, both of which had the electrodes in the lateral hypothalamus. Of six
Central Nervous System and the Special Senses 93

other animals tested on 5 consecutive days, four decreased their food and waterintake when self-stimulation was available, suggesting that the intake of foodand/or water is pleasurable; these four had electrodes in the lateral hypothalamuswhile the other two had them implanted in other regions of the brain. The pigsdid not starve themselves in favour of self-stimulation, however, indicating thatthere are more inputs to feeding control than simply the pleasure of eating.
Stimulation of the lateral hypothalamus causes satiated sheep and goats tostart eating again and to continue eating voraciously as long as the stimulus isapplied. Stimulation of the ventromedial nucleus of goats reduces feedingactivity.
Brain Activity during Feeding
Studies have been made of changes in single unit activity in the lateralhypothalamic area of goats during scheduled feeding (Nagamine et al., 2003)in order to clarify the location of feeding centres. Of 31 units studied in sevengoats, only five altered their firing rates in response to feeding. Firing rateslowed or stopped as rate of eating slowed and the animals reached satiety. Itwas subsequently found that all the active units were located in the dorsolateralhypothalamic area close to the fornix. As these animals were fed only twicedaily, they would have been quite hungry at the time these recordings weremade; the relevance of the findings to spontaneous meals in animals fed adlibitum is therefore uncertain.
Kendrick (1992) recorded electrical activity of single neurones in regions ofthe sheep brain thought to be involved in feeding control. Cells in the lateralhypothalamus and zona incerta responded to the sight, but not to the smell, offood, mostly only when food was moved towards the mouth. Sheep can alsobe trained to associate coloured non-food objects with food, and cells in thezona incerta then respond to the sight of those objects. It takes seven to 13trials for the association to be established and only a couple of hours for it to beforgotten, but it is well known that sheep retain preferences for certain foods formuch longer than this. When the conditioned stimulus is a less artificial object,i.e. a novel food, learning is much quicker (one to two trials) and retention ismuch longer (months, see Chapter 6).
The cells that respond to the sight of food respond only to palatable food,not to foods that the sheep will not eat. Probably these sites in the brain areassociated with rewarding aspects of stimuli but not with their negative aspects.Oats, which are highly palatable, cause stomach upsets when eaten in too greata quantity. Two sheep that had eaten too much rolled oats no longerresponded as well in terms of increased firing rate of neurones as they hadbefore this overeating. Cells that respond to food will respond to salt insteadwhen the animal is rendered sodium deficient (see Fig. 5.1). Cells that respondto the sight of food also respond to its ingestion, but if an animal is not allowedto eat the food, its continued presence does not result in continued firing ofthese cells. Cells that respond to food in solid form do not do so when the samefood is liquefied.
94 Chapter 5

Before parturition, firing rate increases most in response to foods, and nocells respond to fetal fluid odours. After parturition, however, there is very littleresponse to food odours but large responses to lamb odours, whether from theewe’s own lamb or from an alien lamb. Cells responsive to food sometimes firein the absence of food; is this when the sheep is thinking about that food, i.e.when it is hungry?
Chemical Stimulation
Although transmission of signals along nerves is primarily electrical, interneuronalcommunication is mainly chemical. Neurotransmitters, such as noradrenaline andacetyl choline, are released by the terminals of one nerve and stimulate thereceptors on one or several other neurones, which respond by an increase ordecrease of firing rate. There is more scope for both physiological andpharmacological mechanisms to work at the synapse than along the nerve fibreand, in recent years, chemical stimulation of the brain has been used as themajor experimental technique. The development of pharmacological antagoniststo neural transmitters has also provided useful tools for the investigation of brainfunction.
Methods of introducing drugs into the brain include injection via cannulaeimplanted in the lateral ventricle, micro-injection via fine cannulae implanted oradvanced through guides into brain tissue and by elecrophoretic introduction.Invariably, drugs must be injected in amounts greater than the amount normallypresent in brain tissue in order to cause a significant response, and the questionarises as to whether results can be considered to be ‘physiological’. Despite suchmethodological problems, it seems likely that substances in the extracellular fluid
Central Nervous System and the Special Senses 95
0
200
400
600
800
Food Salt Water Control
Mea
n ch
ange
in fi
ring
rate
(%
)
Fig. 5.1. Response in firing rate of neurones in the zona incerta of sheep to the sight of food,water and salt when the animals were food-deprived for 12 h (solid bars) or sodium-deprivedfor 4–6 days (open bars) (from Kendrick, 1992).

of the brain are involved with the physiological control of feeding. Martin et al.(1973) transferred 1 ml of cerebrospinal fluid (CSF) from fasted sheep into thelateral ventricle of recipients and found a fivefold increase in food intake duringthe following 15 min; CSF from satiated sheep had no effect.
Anaesthetics
By preventing neural transmission through affected parts of the brain, localanaesthetics are expected to have similar effects on feeding to lesions in thesame areas. In general, this has proved to be the case.
Pentobarbital (a local anaesthetic) injected into the third ventricle orbasomedial hypothalamus of chickens caused intake to increase from 14 to32 g during the 1 h after injection, even though the birds were almost asleep;there was no effect when the injections were made into the posterior lateralhypothalamus (Snapir et al., 1973). A dose of 6.5 mg of sodium pentobarbitalgiven into the LHA depresses intake in hungry pigs, while in the VMH orcerebroventricles it stimulates intake in satiated animals.
Cerebroventricular injections of pentobarbital stimulate feeding in calves,goats and sheep. Detailed studies with sheep, in which a range of barbiturateswith different durations of action were compared, showed that long-acting oneswere more effective than those with a short action in inducing feeding wheninjected into the third ventricle (Seoane et al., 1973). The effects of barbiturateswere similar in a hot environment and at normal temperatures, and with highroughage and high concentrate rations. Micro-injection of barbiturates into themedial hypothalamus also stimulates feeding in sheep.
Adrenergic agents
Substances such as anaesthetics are, of course, unnatural, and manipulation ofthe concentrations of substances found naturally in the brain, and theiranalogues and antagonists, have formed the basis of most recent work.
Since the original work with rats there has been ample confirmation of amajor place for adrenergic transmitters in the control of intake, and numerousexperiments have demonstrated that noradrenaline given into the medial hypo-thalamus stimulates intake in several species, including farm animals. This effectcan be prevented by prior injection of the appropriate blocker, but blockers givenalone do not stimulate feeding. Work originally concentrated on the VMH andLHA and the paraventricular nucleus (PVN) as being the most sensitive sitesmediating the actions of adrenergic agonists on eating. It seems likely that thePVN and its �-adrenergic receptors are important in the control of eating inresponse to deprivation and, possibly, to post-ingestional satiety signals.
Brain turnover of noradrenaline is increased by glucoprivation, a situationthat can be reversed by providing substrates, either by ingestion or infusion,which could be used by the brain. This is evidence for a physiological role fornoradrenaline in the control of feeding.
96 Chapter 5

Central Nervous System and the Special Senses 97
Poultry
Cerebroventricular injections of adrenaline or noradrenaline increase foodintake in broiler-type chickens, while dopamine has no effect. However, theinjection of adrenaline had no effect in birds of a layer strain. A differentialresponse was also noted to cerebroventricular injections of 5-HT which, inbroilers, depressed food intake in fully fed birds but not in 24-h fasted birds,while in layers 5-HT decreased food intake in both fully fed and 24-h fastedbirds.
Further studies (Denbow et al., 1986), with lines of broilers selected for fastand slow growth, showed that methoxamine (an �-adrenergic agonist)increased feeding in the fast- but not in the slow-growing strain, while 5-HThad no effect in fully fed birds but did depress intake in 24-h fasted birds ofboth lines. Genetic selection for growth has been demonstrated to alter themeal pattern as well as to alter the feeding response to intubations of aminoacids and cerebroventricular injections of biogenic amines. Further studies arerequired to explore the mechanisms of these differences between breeds andstrains.
Injection of 6-hydroxy-dopamine, which depletes noradrenaline, into thecerebroventricles or hypothalamus not only increases food intake but alsocauses obesity and testicular atrophy in geese.
Fenfluramine is a well-known appetite suppressant in mammals and, whenincorporated in food, it induced a dose-dependent reduction in food intake bybroiler chickens (Hocking and Bernard, 1993).
Pigs
In the pig, noradrenaline injected into the hypothalamus stimulates feedingwhile isoproterenol (a synthetic �-adrenergic agonist) causes temporaryanorexia, blocked by propranolol (a synthetic �-adrenergic antagonist). Thevolume injected was large, however, so these results tell us little about the exactsite of action.
Cattle
Lateral ventricular injection of noradrenaline in cattle stimulated voluntaryintake over a very narrow range of doses (50–200 nmol), whereasisoproterenol was effective over a broad range (500–2000 nmol).
Sheep
Baile and his colleagues were, for several years, particularly active in this field(see Baile, 1975). They found that intraventricular injection of noradrenaline atdoses of 542 nmol induced hyperphagia for some 30 min after injection. Theeffect was blocked by prior injection of �-adrenergic blockers, and it was laterconfirmed that intrahypothalamic injections had similar effects. At very lowdoses (4–16 nmol), the �-adrenergic agonist isoproterenol stimulated intake forabout 1 h and this was blocked by �- but not by �-adrenergic antagonists. This

suggests the existence of two classes of adrenergic receptors and adrenaline,which has both �- and �-adrenergic activity, stimulated intake at two doseranges, presumably corresponding to optimum stimulation of the two types ofreceptor.
One major drawback to ventricular injection is that the site of actioncannot be determined because CSF secreted in the lateral ventricles transportsthe injected material through several parts of the brain. More precise targetingcan be achieved by implanting guides through the cranium, which are directedtowards certain loci in the brain. Using sheep prepared in this way it was shownthat noradrenaline (240 nmol) and isoproterenol (8 nmol) had similar effectson feeding when given into hypothalamic tissue as they did when givenintraventricularly. Again, effects of each were blocked by the appropriateblocking agent and the dose–response curve showed an optimum range withdepression at high doses.
A brain locus sensitive to noradrenaline was not usually responsive toisoproterenol, and prostaglandins (PG) injected at loci sensitive to noradrenalinehad different effects on feeding than at loci sensitive to isoproterenol. Doses of14 or 28 nmol of PGE1 depressed food intake when injected at loci that showedfeeding in response to noradrenaline. A PG antagonist, polyphloretinphosphate, not only blocked the effects of subsequent PG injection but by itselfsignificantly increased intake. Whether this means that PGE1 normally inhibitsfeeding is not clear. At sites that responded to isoproterenol, PGE1 significantlystimulated intake. This subject is complex and will not be properly understooduntil the full range of the pharmacological and metabolic effects of thesesubstances is known.
Serotonin (5-hydroxytryptamine, 5-HT)
In the mammalian central nervous system, 5-HT systems occupy a strategicanatomical location, projecting to, and passing through, the hypothalamus.Experimental manipulations of 5-HT metabolism can, under certain conditions,produce marked changes in food intake, food preferences and body weight,most obviously the suppression of food intake by experimental treatments thatdirectly or indirectly activate 5-HT receptors. More controversial is the role of 5-HT in diet selection (see Chapter 7). Serotonin binds to several distinct receptortypes in peripheral tissues but, while the significance of these receptor types inthe CNS is uncertain, there is evidence linking them with effects on eating (seeForbes and Blundell, 1989).
In chickens of an egg-laying strain, 33–100 �g 5-HT injected intraventricularlydepressed intake, while in broilers it had this effect only if the birds were relativelysatiated.
Intravenous injection of the serotonin agonist 8-OH-DPAT significantlyincreased food intake in the 45 min following injection in non-deprived pigs,while after 4 h of deprivation it had no effect on food intake (Baldwin et al.,1995). After deprivation, pigs are likely to eat so quickly that it will be difficultto demonstrate effects of experimental treatments unless they are severe.
98 Chapter 5

In sheep, 5-HT has smaller effects on feeding than noradrenaline and atfewer sites, the responsive ones being concentrated in the area of the anteriorcommissure.
Cholinergic agents
Acetyl choline is a neural transmitter found in significant amounts in thehypothalamus. In the rat, ventricular or hypothalamic injection of carbachol, aslowly metabolized cholinergic agonist, causes an increase in water intake but aconsistent and large depression in food intake.
Carbachol injected into the hypothalamus of sheep at doses as low as7 nmol stimulated feeding for 30–60 min and when atropine, a cholinergicantagonist, was injected a few minutes before a 28 nmol dose of carbachol, thehyperphagia was prevented (Forbes and Baile, 1974; Fig. 5.2). The adrenergicantagonists phentolamine and LB46 did not attenuate the carbachol effect,showing that it was acting on cholinergic receptors in the hypothalamus ratherthan causing non-specific stimulation. However, atropine alone had no effecton intake, which implies that endogenous acetyl choline is not involved infeeding control.
It had been shown that significantly increased feeding followed the injectionof 50 nmol of carbachol into the lateral ventricle. However, larger amounts ofcarbachol (56–436 nmol) given into the lateral ventricle of sheep almost totally
Central Nervous System and the Special Senses 99
0
50
100
150
200
250
0 30 60 90 120
Time after injection (min)
Cum
ulat
ive
food
inta
ke (
g)
Carb
Carb/LB 46
Carb/phent
AtrCSFArt/carb
Fig. 5.2. Food intake by sheep 30, 60 and 120 min after intrahypothalamic injection of: (i)synthetic cerebrospinal fluid (control, CSF); (ii) carbachol (28 nmol, Carb); (iii) atropine(28 nmol, Atr); (iv) carbachol preceded by atropine (Atr/carb); (v) carbachol preceded byphentolamine (120 nmol, Carb/phent); or (vi) carbachol preceded by LB46 (120 nmol,Carb/LB46) (Forbes and Baile, 1974).

prevented feeding for 1 h, accompanied by significantly elevated plasma levelsof growth hormone (Driver et al., 1979). Experimental differences that might beresponsible for this discrepancy between the two sets of results have not beenidentified.
It is unlikely that the carbachol-induced stimulation of growth hormonesecretion directly caused the reduction in food intake because intrajugulargrowth hormone infusion to mimic peaks of this type had no effect on feedingbehaviour in sheep (P.M. Driver and J.M. Forbes, unpublished results). It isequally unlikely that the low food intake following carbachol injection wouldgive such a rapid response in growth hormone secretion; feeding and growthhormone were probably affected independently by carbachol.
Gamma-amino butyric acid (GABA)
Intracerebroventricular (ICV) injection of several GABA agents inducedhyperphagia in layer-type chicks (Bungo et al., 2003). However, in broilerchicks two of the agents (muscimol and nipecotic acid) had similar effects whilebaclofen depressed feeding. These results suggest that there are somedifferences in central GABAergic systems between these strains of chicks, butthat GABAergic systems have an important role in the regulation of food intakein neonatal chicks.
Muscimol, the GABA-A receptor agonist, increased operant responding forfood in pigs after injection into the lateral ventricles, an effect that wascompletely abolished by simultaneous administration of bicuculine, a GABAantagonist (Baldwin et al., 1990b). GABA itself at 800 and 1600 nmol increasedintake, and this was also abolished by bicuculine.
It has also been found that muscimol given intraventricularly stimulatedfeeding in sheep, and this was prevented by the GABA antagonist, �-vinylGABA; GABA itself had little effect on feeding, however (Seoane et al.,1988).
Cholecystokinin (CCK)
CCK was first implicated in the control of feeding following experimentsinvolving peripheral injections (see Chapter 4). CCK is found in the brain andreduces food intake when injected intraventricularly. The possibility that CCK isa neurotransmitter involved in a physiological control is discussed by Baile etal. (1986).
Poultry
ICV injection of chickens with 0.1 or 0.4 �g CCK-8/kg (CCK octapeptide, CCK-8,is the active moiety of CCK) had no effect on gizzard or duodenal motility butcaused drowsiness in some birds and reduced intakes by 20 and 31%,respectively, during the following 30 min (Savory and Gentle, 1984). Dibutyryl
100 Chapter 5

cyclic GMP, a CCK receptor blocker, stimulated intake, supporting a physiologicalrole for CCK. The mean concentrations of CCK-8 in different parts of the braindid not differ between fed birds and those fasted for 24 h, however, but nomeasurements of turnover have been reported.
Four-week-old broilers injected intracerebroventricularly with 100 and150 ng of CCK-8 reduced intake, respectively, for 60 and 105 min. The fact thatsmaller amounts of CCK are required to depress intake by a given amount wheninjected into the brain, compared with peripheral injection, has been used tosupport the concept that brain CCK receptors are more important than gut CCKreceptors in the control of food intake. However, brain injections are made intoa much smaller volume than peripheral injections, making comparisons ofefficacy very difficult.
Pigs
Doses of CCK-8 thought to be within the physiological range based onconcentrations of CCK found in human CSF were injected into the lateralventricles of prepubertal pigs. There was a dose-dependent reduction in foodintake, cessation of feeding appearing to be similar to normal satiety, with noeffect on drinking (Parrott and Baldwin, 1981). Greater doses injected intra-venously were without effect, strongly suggesting that the effect on feeding wason central mechanisms. However it has been suggested that exogenous CCK(given intravenously) causes a general malaise in the pig and thus depressesfood intake non-specifically (see Chapter 4).
Sheep
Infusions of CCK-8 into the lateral ventricles of sheep at 0.01 pmol/minsignificantly depressed intake and ruminal motility during a 3-h period andwere much more effective than a single injection (Della-Fera and Baile, 1980).There was no effect on water intake or body temperature, and increasing thetime of fasting before the infusion reduced the magnitude of the effect. Thisexperiment offers no proof of a physiological role for CCK in the centralnervous control of feeding. However, continuous ventricular infusion ofdibutyryl cyclic GMP (a CCK antagonist) led to a large increase in food intakein the sheep (Della-Fera et al., 1981) suggesting that endogenous CCK in thebrain is a natural satiety factor.
Bombesin
This brain peptide is as effective as CCK in inhibiting feeding when given intothe lateral ventricle of sheep, but in rats there is considerable evidence that itinduces abnormal behaviour. Injected intracerebroventricularly at doses of1.25–5.00 �g, bombesin depressed food intake in the 17-h food-deprivedyoung pig (Parrott and Baldwin, 1982), but the behaviour induced was not
Central Nervous System and the Special Senses 101

typical of normal satiety as the pigs appeared uncomfortable and occasionallyvomited. In water-deprived pigs, bombesin also inhibited drinking showing thatit, like intravenously administered CCK, was non-specific in its behaviouraleffects.
Opioid peptides
Many peptides of the opiate family are synthesized in the brain and theexistence of brain receptors for these peptides suggests that they have aphysiological role. Amongst other effects the opiates have been found to stimu-late feeding in rats and sheep after cerebroventricular injection. Endogenousopioids might play a role in the regulation of food intake as the opioidantagonist naloxone decreases feeding in rats and in a variety of otherspecies ranging from the slug to the wolf. It is likely that more than one opioidreceptor and more than one brain site are involved in the opioid modulation offeeding.
Resistance to the inhibitory effects of naloxone on feeding occurs whenanimals are eating large amounts of food per kg of body mass and/or have ahigh basal blood glucose concentration. This strongly suggests that, althoughopioids play an important role in initiating food-seeking behaviours, they arenot the only food drive system. Much evidence has accumulated suggestingthat stress-induced eating is driven by activation of the opioid system. Similarly,the hyperphagia associated with diabetes mellitus appears to have an opioidcomponent.
Poultry
A stable analogue of met-enkephalin, D-ala2-methionine enkephalinamide,stimulated food intake by pullets for 30 min after 2 and 8 �g/kg were given intothe cerebroventricles, but had no effect when given intravenously at 15 and60 �g/kg (Savory et al., 1989). Naloxone had no effect after eithercerebroventricular (50 and 200 �g/kg) or intravenous (1 and 4 mg/kg) injection.Nalmefene, a more potent and long-lasting opioid antagonist than naloxone,inhibited feeding in a dose-related manner at doses from 0.2 to 1.6 mg. Itappears that central release of endogenous opioids may reinforce feeding inbirds. Further evidence of opioid release during feeding in the chicken comesfrom the observation that the reduction in tonic pain during feeding is reversedby naloxone (Wylie and Gentle, 1998).
Pigs
There was no effect on feeding of naloxone injected into the lateral ventriclesat doses of 0.4 or 0.8 mg, 10 min after access to food was given following anovernight fast. This was attributed to the fact that the pigs were young andhad been subjected to a fast, and were therefore very highly motivated tofeed.
102 Chapter 5

An injection of 200 �g of dynorphin (a natural endorphin) given into thelateral ventricles resulted in a meal within a few minutes (Baldwin et al., 1990a).Leumorphin and �-neo-endorphin also elicited feeding but �-neo-endorphin didnot. Administration after the start of a meal taken after 4 h of deprivationincreased the size of that meal; 400 �g of naloxone significantly reduced intakeafter 4 h of deprivation and abolished the effects of dynorphin. It appears thatdynorphin and related endogenous opioids might be involved in the regulationof food intake in pigs.
Feeding seems to induce an opioid-based analgesia, as the latency of tail-flick to a painful stimulus was longer after feeding than before, and this wasabolished by naloxone. However, sows with marked behavioural stereotypieshad shorter tail-flick latencies after feeding.
Sheep
Opioid levels are elevated in the brain of sheep after a 4-h fast, at which time theanimal would be expected to be hungry, and intracerebroventricular injections ofseveral opioids stimulate feeding. Baile et al. (1987), reviewing their work oninvolvement of opioids in feeding control in sheep, concluded that more specificagonists are needed before a full elucidation is possible.
Naloxone given intravenously prevents the feeding stimulated by cerebro-ventricular injection of enkephalamide (Bueno et al., 1983). Many times moreanalogue were required to generate a similar effect on feeding when it wasgiven intravenously compared with injection into the lateral ventricles, implyingthat the major site of action is the CNS.
Neuropeptide Y and peptide YY
The pancreatic polypeptide family consists of pancreatic polypeptide,neuropeptide Y (NPY) and peptide YY (PYY). Very low doses increase feedingin rats when injected directly into the paraventricular nucleus (PVN), themagnitude of the increased food intake following NPY injections being muchgreater than that seen following central administration of opioid peptides or ofnoradrenaline. PYY has been shown to be an even more potent stimulator offeeding in rats than is NPY, and when PYY is administered every 6 h for 48 h itcauses massive hyperphagia (80.5 g/day compared with 31.1 g in the controlgroup) and stomach distension, attesting to the fact that central factors canoverride the physiological satiety signals from the periphery.
Poultry
Central (lateral ventricle) administration of NPY or PYY significantly stimulatesfeeding in chicks, possibly as a result of stimulation of insulin secretion, andNPY immunoreactivity has been found around the area of the PVN in chickens(Keunzel and McMurtry, 1988).
Central Nervous System and the Special Senses 103

Pigs
NPY has been injected into the brain of prepubertal pigs trained on an operantschedule with a fixed ratio of 5 to obtain reinforcements of 12 g of food (Parrottet al., 1986). Amounts of 25–100 �g of NPY injected into the lateral ventriclesstimulated responding for food in a dose-related manner, the highest dosecausing a 12-fold increase in the number of reinforcements obtained in the 30min following injection, and reducing the latency to feed from 17.0 to 1.5 min.Both meal size and duration were increased and there were no aversive effectsnor any influence on drinking.
Sheep
A 10 �g bolus of NPY into the cerebral ventricles immediately stimulatedfeeding in sheep while continuous infusion slowly increased feeding, but thecumulative effect was the same as that of the bolus injection. A 3 nmolinjection of NPY given intracerebroventricularly increased food intake by up to150% over the following 30 min. This was not blocked by an �-adrenoceptorantagonist, which demonstrates that NPY does not work via an �-adrenergicpathway. NPY overcomes the intake-reducing effects of ruminal distension andVFA infusion (Miner, 1992).
Growth hormone-releasing factor (GRF; somatoliberin)
A dose of 100 ng/kg GRF given intraventricularly stimulated intake of aconcentrate food by about 25% only in the first hour after injection in sheep,while with hay the stimulation of intake occurred later, from the 2nd to the 8thhours (Riviere and Bueno, 1987). With both foods this was by increased rate ofeating rather than by a change in number of meals. When ten times this dosewas given intravenously (the minimum dose required to stimulate feeding),cerebroventricular administration of insulin (40 mU/kg) blocked the effect. Thefact that GRF is effective at a much lower dose when given into the brain ratherthan peripherally suggests that it is acting centrally, and the fact that its effectsare blocked by insulin suggests it might be acting via growth hormonesecretion, some of the metabolic effects of which are blocked by insulin.
Leptin
Leptin is a feedback factor from adipose tissue to CNS, i.e. a hormone, dealtwith alongside other hormones in the previous chapter. Rather than describehere the effects of leptin administration directly into the CNS and therebydividing the subject in two, it has been discussed in Chapter 4.
104 Chapter 5

Orexins
These are a group of peptides involved in the regulation of food intake. Orexin-B stimulates food intake in pigs after intramuscular injection. ICV injection ofporcine orexin-B (0.3 �g/kg BW) stimulated food intake (Sartin et al., 2001).There was no effect of orexin injection on plasma free fatty acids, glucose,growth hormone or insulin concentrations, suggesting that its action wasdirectly on the CNS centres controlling intake rather than via metabolic routes.
When this treatment was compared to or combined with NPY (0.3 �g/kgBW), they had similar effects (0.07 kg/2 h after injection for control, 0.23 kg fororexin and 0.2 kg for NPY), while the combination of NPY and orexin had agreater effect on food intake (to 0.34 kg) (see Fig. 5.3). Thus, the sum of thetwo separate effects was 0.29 kg, versus 0.27 kg for the combined injection, i.e.an additive effect.
Melanocortin
The recently discovered brain melanocortin receptors reduce food intakewhen stimulated and increase feeding when exposed to antagonists. ICVadministration of a melanocortin receptor agonist suppressed food intakecompared with controls for up to 72 h in growing pigs (Barb et al., 2004), butan antagonist failed to stimulate intake. The authors stated that these results didnot support a role for endogenous melanocortin in regulating food intake in thepig.
Central Nervous System and the Special Senses 105
0
100
200
300
400
Control Orexin NPY Orexin + NPY
Food
inta
ke (g
/2 h
)
Fig. 5.3. Food intake by sheep during 2 h following ICV injection of orexin, NPY (each at 3�g/kg body weight) or both (from Sartin et al., 2001).

Steroid Hormones
Oestrogen treatment, except at very low levels, depresses food intake (see Chapter16), and oestrogen receptors have been demonstrated in the hypothalamus.Following the demonstration that oestradiol infused intravenously into sheep andgoats depresses intake, small amounts were injected into the lateral ventricles ofsheep (Forbes, 1974). A low dose (10 �g) led to a 60% increase in intake of acomplete pelleted food during the 2-h period after injection, with little effect ondaily intake; intake was progressively lower than this maximum as the doseincreased and, above 60 �g, was lower than control. The stimulating effect of 10or 20 �g was blocked by simultaneous intraventricular injection of 1.25 or 1.88 mgprogesterone.
Ionic Changes
The concentrations of several ions in the extracellular fluid are very importantin controlling neural function. In laboratory animals, ionized calcium saltsinjected into the cerebroventricles or hypothalamus stimulate feeding,suggesting that the calcium:sodium ratio controls body weight. Plasma levels ofmany minerals are regulated and the fluctuations in concentration in the CSFare normally small. It is uncertain whether any of the effects of perturbingconcentrations of salts in the CSF, outlined below, represent real effects thatcould be induced by excessive or deficient dietary intakes of minerals.
Pigs
Baldwin et al. (1975) injected 12.5–50.0 �mol of calcium or magnesium ions intothe lateral ventricles and found that food intake was increased by both, in a dose-related manner. The maximum stimulation followed the injection of 25 �mol ofcalcium plus 25 �mol of magnesium, whereby food intake increased from acontrol level of 60 g to a staggering 950 g during the 30 min following injection.
Sheep and goats
Sheep seem to be especially sensitive to ionic changes in the CSF but, even so,changes large enough to affect feeding are probably beyond the normal range.
Solutions of calcium salts injected into the third ventricle of sheep in orderto change the composition of the CSF in the region of the hypothalamusincreased voluntary intake during the 30 min following injection in a dose-related manner. Magnesium had a similar effect, while both were blocked byincreasing concentrations of sodium or potassium (see Fig. 5.4). Calcium ormagnesium (1 �mol in 1 �l) injected into the hypothalamus also stimulatedintake (Seoane et al., 1975); magnesium stimulation was not blocked by pre-injection with several pharmacological blockers, whereas the calcium effect was
106 Chapter 5

blocked by atropine. The intake-stimulating effect of pentobarbital injected intothe ventricles was reduced by sodium chloride (Seoane et al., 1988).
ICV injections of sodium or potassium into goats suppressed feeding,whereas slow infusion of similar amounts over 30 min actually elicited feeding(Olsson, 1969). Given that CSF is produced at around 0.5 ml/min, a slowinfusion would result in a very much lower concentration being achieved thanwould a single injection of the same amount, and it may be that very lowconcentrations of these ions are stimulatory.
Thermostatic Control
Brobeck (1948) said that ‘Animals eat to keep warm and quit eating to preventhyperthermia’ and, as the anterior hypothalamus is the most important tempera-ture sensor in the body, it would be expected that heating or cooling this part of
Central Nervous System and the Special Senses 107
0 50 100 150 200 250 300 350
CSF/CSF
CSF/Ca20
Na550/Ca20
Na275/Ca10
Na1100/Ca10
CSF/Mg20
Na550/Mg20
Na275/Mg10
Na1100/Mg10
K40/Ca20
K40/Ca10
K40/Mg20
K40/Mg10
Food intake (g/30 min)
Fig. 5.4. Effects on food intake by sheep of solutions of different ionic composition injectedinto the third ventricle. Ca20, for example, is calcium salt at a dose of 20 mmol (from Seoaneet al., 1975).

the brain would affect heat loss and/or production, which might then indirectlyinfluence food intake through change in energy and nutrient requirements.
Local cooling of the preoptic area and anterior hypothalamus stimulatedfeeding in satiated goats (Andersson and Larsson, 1961). Even if the animalwas dehydrated to the point of aphagia, or heated until rectal temperature hadrisen by 1°C, hypothalamic cooling induced feeding, demonstrating a directeffect. Warming the same area inhibited feeding and induced drinking; in onegoat with lesions in the preoptic area food intake was normal even atsupraphysiological body temperatures above 41°C.
Although these observations support the thermostatic theory as far as thegoat is concerned, heating or cooling of the hypothalamus of the pig had noeffect on voluntary intake (Carlisle and Ingram, 1973). In addition, hypothalamictemperature showed no increase during feeding in the goat, whether during thevery large meal occurring after a 20-h fast or during force-feeding (Baile andMayer, 1968). Infusion of acetate into the rumen, which suppressed feeding, alsocaused a 0.25°C reduction in hypothalamic temperature, so the acetate clearlydoes not act via a hyperthermic mechanism. Although pentobarbital depressedhypothalamic temperature, this occurred after the increase in feeding (see above)and was unlikely to be the mediator.
The thermostatic theory of the control of food intake is true in the sensethat mammals and birds maintain a relatively constant body temperature andthat heat production is proportional to the weight of food eaten; too little foodwill, eventually, result in a shortfall in heat production, although body reserveswill normally be mobilized to prevent undue hypothermia. Overeating, on theother hand, will increase heat production, and heat loss mechanisms areactivated to prevent hyperthermia. It is only under conditions where heat losscannot increase further that voluntary intake falls to prevent hyperthermia.
Thus, intake is controlled to supply energy for heat production in additionto energy for other purposes. If further evidence of the fallibility of thethermostatic theory is needed, it can be found in the observation that thelactating animal produces more heat than the non-lactating animal and has ahigher body temperature, but also eats more food.
CNS Sensitivity to Metabolites and Hormones
A question of considerable significance in the control of intake and metabolism ishow the brain, which is well insulated from marked short-term fluctuations innutrient flow, is informed of the energy status of the body. The evidence for directeffects of blood metabolites on the brain is sparse, but new hope of finding themissing link came from the observation that infusion of insulin into the lateralventricles of baboons at physiological rates over many days causes lower foodintake and body weight. Central implants of insulin-secreting cells into the base ofthe third ventricle (i.e. hypothalamus) depress intake. Insulin in the CSF has amuch longer half-life than it does in plasma, but reflects plasma insulin in the longterm. As insulin is secreted in increasing amounts with increasing fat deposition,this might be how the brain is made aware of fatness as well as nutrient status.
108 Chapter 5

Parts of the brain are sensitive to the direct effects of glucose and/or insulin.Glucose-sensitive neurones in the lateral hypothalamus decrease their firingrate in the presence, locally, of glucose. These same neurones appear to belinked with glucose-sensitive receptors in the liver, as most of these neurones inthe lateral hypothalamus decreased their rate of firing when glucose wasinfused into the hepatic portal vein.
So far as feeding is concerned, the important receptors in the brain areprobably not glucose-specific, as intracerebroventricular infusions of mannoseand 3-D-hydroxybutyrate (both of which can be utilized by the brain) – as wellas glucose – depressed food intake in hypoglycaemic rats. Whether their effectis exerted through oxidation, as is the case in the liver (see Chapter 4), is thesubject of speculation. It is not fully understood whether the brain’s sensitivityto lack of glucose is called into play under normal circumstances or whether theperipheral mechanisms that normally protect the brain from fluctuations inglucose supply mean that the central mechanism for detecting glucose is calledupon only in emergencies.
Although there is incontrovertible evidence that the hypothalamus isintimately involved in the control of feeding, studies of the hindbraindemonstrate that the area postrema and the nucleus of the solitary tract aresensitive to glucose and capable of exerting an influence on diet selection.Reciprocal connections exist between the hypothalamus and the caudalhindbrain, which presumably form part of the neural circuitry that controlsfeeding.
Baby rats with forebrain–hindbrain transection still suck at a normalfrequency when tube-fed into the mouth. Sucrose given into the stomach ofsuch animals depresses the amount of sucrose accepted into the mouth andCCK also suppresses intake as normal. Therefore, the caudal brainstemintegrates metabolic stimuli and can perform the important function ofmodifying feeding behaviour according to nutrient demands.
Lack of glucose causes activation of the sympathetic nervous system,leading to release of catecholamines, glucocorticoids, growth hormone andglucagon, as well as to inhibition of insulin secretion, all of which mobilizeglucose and protect the brain. Injection of insulin to increase glucose uptake byperipheral tissues, or 2-deoxy-D-glucose (2DG) to block glucose entry into cells,activates a cerebral response that results in feeding; for example, a dose of 2DGtoo small to have any effect when given into the general circulation causes amarked feeding response in rats when given into the cerebroventricles.Glucose-sensitive neurones have been identified in the brain, but little is knownabout their characteristics other than that they are probably activated by lack ofglucose within the cell rather than on its surface. It might be more appropriateto talk of ‘energoprivation’ rather than ‘glucoprivation’, because D-3-hydroxybutyrate, which is used by brain cells when glucose is unavailable,prevents the feeding induced by 2DG.
Central Nervous System and the Special Senses 109

Poultry
The voluntary intake of chickens was depressed by the intraventricular injectionof glucose, but this was found to be true only when the birds were satiated.Implantation of gold thioglucose1 at several sites in the brain of chickens hadno effect on feeding behaviour, and it was concluded from this that there is nocentral nervous glucostatic control of food intake in birds (Smith and Szper,1976).
Pigs
Parrott and Baldwin (1978) trained pigs aged 3–4 months to operant con-ditioning for 8 g reinforcements of food on a fixed schedule ratio of 5 and theninjected 4 mmol of glucose, xylose or 2DG into the lateral ventricles. All threecompounds stimulated drinking, presumably because of osmotic effects on thebrain. Food intake was only stimulated by 2DG which blocks the uptake ofglucose into cells, and this supports the concept of glucoprivation outlinedabove.
Sheep and goats
Infusion of glucose or acetate into the lateral ventricles of goats has no effect onfeeding. 2DG stimulated sheep to eat more when infused into the thirdventricle, but so did xylose and the results suggested an osmotic effect ratherthan a specific response to the 2DG (Seoane and Baile, 1972). The absence ofa direct negative effect on feeding of metabolites in the brain of ruminantssuggests that the various types of visceral receptors referred to in Chapter 3 areof greater importance in the control of food intake.
There is strong evidence for an effect of insulin on the CNS which is partof the system for controlling body fat content (Chapter 15). Six-day intra-cerebroventricular infusions of insulin at what was thought to be a physiologicalrate for sheep (123 ng/kg body weight/day) depressed food intake by 40% andplasma insulin to about half that of controls (Foster et al., 1991). However, thistreatment increased the concentration of insulin in CSF by 10 to 100-foldwhich suggested a supra-physiological rate of infusion. It is still not known,therefore, whether insulin transferred from the plasma to the CSF is involved inthe normal control of food intake.
The Special Senses: Identification of Foods
It has become abundantly clear in recent years that animals learn to associatethe sensory properties of foods with the metabolic consequences of eating those
110 Chapter 5
1 A substance taken up by, and toxic to, the VMH (at least in some strains of mouse).

foods (see Chapter 6). Nowhere is this more obvious than in the field of dietselection, to be discussed in Chapter 7. In this section we consider how foodsare perceived by animals in order that they can learn about their nutritionalvalue.
Without visual or taste cues, animals cannot identify an appropriate diet. Thedominant sense differs between species but most animals can use any of theirsenses to identify food. Thus, although Wilcoxon et al. (1971) demonstrated thatrats use taste more than vision as a cue for aversion to nauseating effects whilequail use vision more than taste, either species is capable of using either sense.
Vision
Most domesticated animals have good visual acuity and this is used both bycarnivores in hunting and herbivores in gathering herbage. Visual perception infarm animals has been reviewed by Piggins (1992).
Poultry
Newly hatched chicks initially peck at small, round (seed-like) objects butbecome more selective as they learn the specific visual characteristics of seeds.
Chicks possess colour vision and sometimes show a weak innatepreference for food of a particular colour; we have usually observed that greenfood is preferred over red in naïve chicks. Preferences for other colours can beinduced simply by prior exposure to them or, more specifically, by pairing themwith a more balanced food given in choice with an imbalanced food of anothercolour (e.g. Kutlu and Forbes, 1993c), while strong colour aversions can beinduced in birds by association with toxic substances (e.g. Martin et al., 1977).
Sheep
Sheep are thought to be colour-blind, although their eyes do possess cones.Temporary covering of the eyes does not interfere with the preference forherbage species by grazing sheep, suggesting that they use smell, taste andtactile stimuli to a great extent to discriminate between different plant species.
Objects of different hue can be discriminated by sheep, but this may bedue to brightness rather than colour; there is uncertainty as to whether they candiscriminate colour. Bazely and Ensor (1989) found that none of their sheeplearned to discriminate between green and yellow of the same brightness, butcould differentiate between different brightnesses (41 or 77% reflectance). Thisdoes not discount the possibility that sheep have colour vision, but brightnessmight be important for grass as it is proportional to protein content of perennialryegrass.
Sheep have all-round vision (290°), although acuity is only good in the 40°field where the two eyes overlap, i.e. they can see food in front of them veryclearly. Sheep, like cattle, goats and chickens, can make quite complexdiscrimination between shapes.
Central Nervous System and the Special Senses 111
Taste
Perry (1992) discusses olfaction and taste, with particular respect to farmanimals, while Houpt and Wolski (1982) review studies of taste thresholds andpreferences in domestic animals. The taste of food is a more proximate guide tofood quality than is vision or olfaction, and is used as a powerful cue withwhich to associate the nutritional properties of food, especially in mammals.
A bitter taste is often associated with toxins in the food, so it is under-standable that such tastes are innately disliked by many species. Sweetness, onthe other hand, signals sugars, a rich source of energy, and is innately preferredby the young of most species of mammal.
Poultry
The chicken has a good sense of taste but flavours as such, although initiallyable to influence intake and preference, soon lose this ability if the birds learnthat there is no nutritional implication of the different flavours. A line of broilerchickens selected for high lean weight had lower preference at any givenconcentration for dextrose, and lower aversion for quinine, compared with a lowgrowth line (Barbato et al., 1982), but it is not clear whether these differencesare due to changed sensory abilities or to changed nutrient requirements.
Removing the sense of taste by cutting nerves of the mouth in the pigeonleads to loss of interest in food, although drinking and grooming are unaffected(Zeigler and Karten, 1975); clearly, in this species the taste and texture of foodin the mouth is an important reinforcer of feeding.
The taste of saccharin is accepted as similar to sucrose by mammals,whereas chickens will not drink saccharin solutions but take readily to sucroseor glucose (Injidi, 1981).
Pigs
Baldwin (1976) has reviewed studies on taste preference in pigs. Young pigsare quite sensitive to taste, and their preference for glucose or sucrose solutionsincreases with the logarithm of concentration in aqueous solution up to 0.1molar. The preference for saccharin solutions was not as marked and in otherwork was found to be very variable. Aversion can develop to tastes associatedwith a feeling of illness.
McLaughlin et al. (1983) studied weanling piglets put in a T-maze to assesspreference for flavoured versus unflavoured foods. Five flavours that were well-preferred in these short tests (they did not belong to any one category asassessed by human taste) were used in sustained preference tests over 5 days,and two of these were then tested for 5 weeks after weaning and resulted insignificant improvement in performance in the first week after weaning. In alarge-scale growth trial with over 1200 pigs, one flavour (cheesy) increasedbody weight gain, but only in first week. It was concluded that some flavoursmight be useful in overcoming the stress of weaning.
There are other examples of intake of food by weaned pigs being stimulatedby flavours, but also cases where no significant effects have been observed.
112 Chapter 5

Sugar and other flavouring ingredients are widely used in weaning foods foryoung pigs to attract their interest in solid food and encourage high levels ofintake. The fact that young pigs are aware of the flavour of the food, and thatthe flavour is apparently preferred when given in choice with foods of otherflavours, does not necessarily mean that they will eat more when the preferredfood is given alone.
Nofre et al. (2002) carried out two-bottle preference tests with pigs on 60compounds, all of them perceived as sweet by humans, and related theresponses to a sweet-taste receptor model at the molecular level. Of thecompounds tested, 35 gave preferences, against plain water, but atconcentrations many times the minimum that can be sensed by humans. Froma comparison of human and pig taste responses it was concluded that there areeight differences in the amino acid composition of the sweet-taste receptors ofthe two species, and these are detailed by these authors.
Cattle
Cattle are sensitive to bitter, sour, salty and sweet solutions (Goatcher andChurch, 1971) and are able to detect tastes with greater sensitivity than sheep.
Calves preferred a food that included 2 ppm of monosodium glutamate(MSG, a flavour enhancer) over a similar food without MSG, but it is notknown whether offering only the MSG-flavoured food would result in higherintake and growth than a similar food without MSG. Preferences or aversionsto bitter, sour, salty and sweet tastes can be blocked by including 5–50 ppm ofMSG in the solution.
Nombekela (1994) tested the effects of various additives on the preferenceranking by lactating cows of a silage:concentrate food mixture fed twice dailybeginning 8 days post-partum. Taste preference ranking was: sweet (1.5%sucrose in DM) > control > bitter (1% urea) > salt (4% NaCl) > sour (1.25%HCl), and cows consumed 12.8% more DM for sweet than for the second-place (control) diet; however, the length of time for which this increase wassustained is not reported and caution is required in extrapolating from short-term preference tests to long-term voluntary intakes. In a further study, MSGwas preferred equally to a control diet > molasses > dehydrated lucerne >anise.
Sheep and goats
Goats are more sensitive to bitter, sour, salty and sweet solutions than aresheep, but less than cattle, in general (Goatcher and Church, 1971).
The normal type of two-choice preference test confounds the sensoryimpressions of the foods or liquids offered with post-ingestive factors. WhereasGoatcher and Church (1971) found aversion to a 22 g/l solution of salt in water,by using sheep with oesophageal fistulae that could be opened when required toprevent the entry of swallowed food or drink into the digestive tract, Chapmanand Grovum (1982) found a preference for hay containing up to 200 g/kg ofsodium chloride, due presumably to post-absorptive effects of sodium ions in the
Central Nervous System and the Special Senses 113

former case. Care must be taken in the interpretation of results from oesophagealfistulated sheep, however, as they lose much saliva through the fistula, becomesodium deficient and might therefore prefer a higher concentration of sodiumchloride than intact sheep. Urea was discriminated against at all levels ofinclusion, from 10 to 80 g/kg.
Because of regurgitation of digesta from the rumen, it is possible that thetaste of the major products of fermentation, the VFAs, might affect foodpreferences, as it has been demonstrated on several occasions that sheep preferthe taste of butyrate over several other compounds (e.g. Gherardi and Black,1991). When a food containing 25 ml of 2M acetic acid/kg was offered adlibitum to sheep, intake was less than the intake of untreated food; addition ofcarbocaine, a local anaesthetic, at 500 mg/kg returned intake to control levels.
Olfaction
Olfactory ability varies widely between species, some carnivores detecting preyby smell over very long distances while other animals have a very poor senseof smell. Herbivores are often surrounded by food, in which case an ability tosmell is of little use in seeking food.
Poultry
It is often said that poultry have no sense of smell because they are willing toeat grain contaminated with wild onion bulbs that other stock reject. Chickens,whether in the wild or in captivity, usually search close-by for food and identifyit by sight – smell is a long-distance cue and may be of little importance tothem.
Pigs
The lack of apparent effect of olfactory bulbectomy on food intake in pigssuggests that olfaction plays little part in food intake control, although it wasdifficult to confirm that the sense of smell had been removed, because pigslearn very quickly to locate hidden food by exploration. Presumably, however,smell is used when selecting from a range of available foods.
Cattle
Remarkably, sodium-deficient cattle can detect sodium bicarbonate at up to20 m if assisted by wind direction, as anosmic cattle took longer than controlsto identify a salt solution from amongst an array of buckets of water (Bell andSly, 1983). It can thus be deduced that cattle can smell salt solutions, but noexplanation was offered as to how non-volatile salts can have a smell. Anosmiccattle can still taste salt, clearly demonstrating that the senses of smell and tasteare separate.
114 Chapter 5

Sheep
There are some odours, e.g. that of carnivore faeces, that are so innatelyaversive to sheep that they never habituate to them and avoid them at adistance.
The internal state of an animal can influence its response to odours:Kendrick (1994) found that in pregnant ewes the firing rate of neurones in theolfactory bulb increased in response to odours of foods but not to fetal fluidodours. After parturition, however, there is very little response to food odoursbut large responses to lamb odours, whether from the ewe’s own lamb or froman alien lamb.
Physical properties of food in the mouth
Changes in texture, temperature and taste during a meal, or even a singleswallow, have been proposed as having a big impact on a food’s palatability,accepting that ‘palatability’ depends on context, including metabolic context.Memorable foods are more easily learned with regard to their eventualmetabolic properties, compared with bland foods. The concept of ‘dynamiccontrast’ has been proposed, which refers to the manner in which foods givechanging sensations during chewing and swallowing. We should considertexture, in its various manifestations, as an additional cue in characterizing afood, in conjunction with its sight, smell and taste. Memories of chewingpressures and number of chews/swallows may even help to recall how muchfood to eat for satiety.
Conclusions
Although lesioning studies helped to identify possible important control siteswithin the brain, they have been largely superseded by less invasivetechniques. Finding that lesions of the ventromedial hypothalamus increasefood intake and deducing that this part of the brain is the ‘satiety centre’ is akinto hammering a nail into a radio, observing that this causes it to emit a loudwhistle, and concluding that the nail had penetrated the ‘anti-whistling centre’of the radio. The organization of the brain is not in discrete centres, but incircuits, each involving millions of neurones and interacting with other circuitsand with other parts of the body.
While other techniques for studying brain function in relation to feeding areless crude than lesioning, it is often difficult to decide whether what they areshowing are artefacts due to the type of chemical injected, its dose or leakageinto other parts of the brain. Le Magnen (1992) warned: ‘It is interesting toobserve that almost all compounds, intraventricularly or locally infused in eitherdeprived or satiated animals, augmented or inhibited food intake’. Justbecause a substance affects feeding when injected into the brain does notmean that it plays a significant role in normal circumstances.
Central Nervous System and the Special Senses 115

The variety of substances found in the brain and the diversity of sites atwhich exposure to these substances, their analogues and antagonists affectsfeeding, means that this chapter is something of a catalogue. If any conclusioncan be drawn it is that the PVN seems to be of paramount importance and thatNPY is of particular importance as far as transmitters are concerned.
The results of experiments involving electrical and chemical stimulationgive only glimpses into what might eventually become a well-described systemof connections within the brain. Up to the present time there has been littlework in farm animals on the changes taking place in the brain that might becorrelated with feeding behaviour. Changes have been seen in the firing rate ofneurones in the lateral hypothalamus of rats in response to the carbohydratestatus of their environment, and Maddison and Baldwin (1983), recording fromsingle neurones in the brain of the conscious sheep, found responses in thelateral hypothalamus to the sight of food and in the ventrobasal thalamus totactile stimulation of the mouth and face.
Many of the responses made by animals to food are learned (see Chapter6), and the plasticity of the brain in the young animal means that it is possiblefor different neurones using different transmitter substances to be used for thesame purpose in different individuals. We may be as likely to make progress inunderstanding the development and functioning of the CNS involvement infeeding by neural network modelling as by injecting yet more chemicals intothe brain.
Tranquillizer drugs, given in the food or by injection, stimulate food intakeand have been studied for their possible use as commercial intake stimulants. Itis unlikely, however, that the use of such drugs will be allowed for anythingother than short-term treatment under veterinary supervision.
The relative roles of the special senses in detecting food and determiningwhether it is safe to eat or not vary between the species under consideration.As will become clearer in Chapter 6, the important principle is that animalslearn to associate one or more sensory properties of foods with pleasant orunpleasant metabolic consequences when foods with these same or similarsensory properties have been eaten previously.
116 Chapter 5

6 Learning about Food:Conditioned Preferences and Aversions
There can be no doubt that learning to associate the sensory properties of afood with the metabolic consequences of eating that food is central to animals’ability to make sensible choices between foods. It will become obvious thatthere is no clear demarcation between the contents of this chapter and those ofthe subsequent one on diet selection (Chapter 7). In principle, the evidencepresented in the current chapter is based on learned preferences for foodsdemonstrated in short-term tests, whereas in the subsequent discussion of dietselection, the extent to which animals show consistent choices over more thana few days is covered. We will discuss in Chapter 10 the likelihood that thislearning also underlies the control of intake of a single food.
Animals are born with innate preferences and aversions to particularfoods, but these cannot be relied on for the rest of their life. For example, afood that has been tasted once or twice in the spring and has been found tobe bitter might, by the summer, have become sweet; it might have changedfrom toxic to nutritious or vice versa. Therefore, an animal ought to be able tobenefit from prior experience to be able to best exploit its environment, andevolution has seen the development of this ability – indeed, it might be saidthat such capability accompanied the origin of the chemical and visual senses– but also to be flexible and to be able to relearn the associations whennecessary.
The previous chapter has shown that animals can identify foods by meansof all the special senses. Because of the taste acuity of mammals and the easeof adding flavours to most types of food, much of the research in this area hasbeen done using flavoured foods. For poultry, however, where vision seems tobe more important as a means of identifying food, much of the research hasused food colour as a cue.
There are other important methodological considerations in conductingresearch on how and when animals learn about food. In particular, it isnecessary to separate the unconditioned stimulus (US) from the conditioning
© J.M. Forbes 2007.Voluntary Food Intake and Diet Selection 117in Farm Animals 2nd Edition (J.M. Forbes)

stimulus (CS) (food and bell, respectively, in the case of Pavlov’s dogs) if theinterpretation of the results is to be unequivocal. While there is not space, nor isit necessary to go into experimental detail in every case given, the methods ofArsenos and Kyriazakis (1999) are given in detail below in the section on‘Continuum from Preference to Aversion’ as an example of good methodology.
Motivation
Eating is continuous in very simple animals and the drive to eat is veryprimitive and powerful. It seems likely that higher animals have inherited thisdrive but that satiating factors have developed to temporarily override it. Shamfeeding, in which the ingested food leaves the digestive tract via anoesophageal fistula before any gastric, intestinal or metabolic effects haveoccurred, is continuous in rats that have always been fed by gastric tube andhave not learnt to associate the act of eating with eventual satiety. This is incontrast to the results of other studies in which animals with gastric fistulae weresometimes fed with the fistula closed so that they learned to stop eating after acertain amount of food had been eaten.
Motivation is a reversible brain state induced by internal and externalsignals, which results in an increased tendency to perform a specific behaviour.The tendency to seek food can be of similar intensity whether due to high levelof hunger in the absence of food or low hunger in the presence of food. As ananimal can normally perform only one behaviour at a time, there must be adecision-making process to determine which activity the animal does at anygiven time. Models based simply on motivation to eat, declining as ingestiontakes place, result in dithering output as the animal switches from one activityto another and back again. If a positive feedback is introduced, then somesemblance of real behaviour is seen. That is, feeding, once started, tends toreinforce itself until such time as satiating factors become dominant.
Learning can modulate the expression of motivational state. Animals aresensitive to a number of nutrients and can make appropriate choices, accordingto how they feel. Therefore, if a food is deficient or imbalanced in one or moreessential nutrients, the animal is malnourished and feels ill, which influences howmuch it eats. No animal offered a single food is likely to have its requirementsmet exactly by the food for more than a very short part of its life, so animbalanced diet is the norm for animals provided with a single food.
Non-primate species should not have their intelligence judged on the basisof their ability to form artificial associations between objects and rewards. Workon imprinting in chicks shows that natural stimuli are more effective thanartificial ones. In general, farm animals do not perform well on complexlearning tasks involving the making of artificial associations, but have nodifficulty learning complex information about the natural environment.
There are connections between the hypothalamus and the caudalhindbrain that form part of the neural circuitry that controls feeding. Themedial forebrain bundle, coursing between the fore- and hindbrain through thelateral hypothalamus, carries largely subconscious information that contributes
118 Chapter 6

to the animal’s knowledge, but not necessarily awareness, of the consequencesof eating particular foods. This information is integrated with awareness offoods gained by the special senses and committed to memory to serve theanimal when it next has to make decisions about how much, or what, food toeat. Of particular importance in the hindbrain is the area postrema (AP), whichpossesses chemoreceptors. Destruction of the AP prevents the development ofconditioned taste aversions (CTA) to a variety of toxic agents.
Awareness of digestive and metabolic sensations
Once a bite of food has been swallowed there are few conscious sensations offood passing through the digestive tract and being processed, unless the foodcontains toxins or induces excessive distension. Nevertheless, informationconcerning both physical and chemical changes in various parts of the digestivetract is transmitted to the central nervous system (CNS) via the autonomicnervous system and in the circulating blood. There is no compelling reason whylearning or cognitive abilities require awareness (Nicol, 1996).
For example, ruminant animals have mechano- and chemoreceptors in therumen and reticulum with afferent pathways in the vagus nerve (see Chapter3). There is a clear relationship between the degree of stimulation of a family ofreceptors by inflation of a balloon, or infusion of salts of volatile fatty acids intothe rumen, and the increase in firing rate in vagal fibres leading to thehindbrain, particularly the nucleus of the solitary tract. This, in turn, iscorrelated with the depression in food intake. Thus, the CNS is informed,normally subconsciously, of the consequences of eating in terms of physicaland chemical effects on the digestive tract, and uses this information in how itresponds when it again becomes aware of the food, i.e. what food it chooses toeat and how much it eats.
The liver is the first organ to have a reasonably complete picture of theresults of eating a particular food, in terms of supply of metabolites. Evidencefor neural transmission of metabolic information from liver to CNS is extensive,and it is clear that the brain uses the degree to which substrates are beingoxidized as part of the complex control of food choice and intake (see Chapter4). A major function of the liver is to stabilize the fluctuating supply of nutrientsarriving from the digestive tract as a result of eating discrete meals into a moreeven supply of nutrients to the rest of the body, particularly the CNS. Thus, thebrain is informed by the liver of the balance between the supply of nutrientsfrom the gut and the demand for nutrients by the rest of the body.
Measuring motivation – operant conditioning
Rewards of food are powerful, unconditioned stimuli in an operant-conditioningsituation, i.e. one in which the animal has to respond (e.g. by pressing a button)in order to elicit a reward (technically known as a reinforcement, e.g. the
Learning about Food: Conditioned Preferences and Aversions 119

delivery of a portion of food). Animals quickly learn to respond, and the biggerthe reinforcement the more quickly is the association learned.
When animals are trained to press a bar to obtain food and the number ofpresses required to initiate a meal is varied, increasing the effort required tostart a meal causes a reduction in the number of meals, but an increased mealsize so as to maintain total intake and body weight (see Chapter 2). This showsthat feeding is not dependent simply on short-term changes in the supply ofmetabolites and must involve the interaction of numerous factors.
Once animals are accustomed to working for their food they like to do so;ostriches trained to respond for food prefer to peck at a button for food than toobtain it ‘free’. When a bag was accidentally dropped in the pen, they ate onlya little of the spilled food and then returned to the operant dispenser.
Poultry
In laying hens, daily food intake stayed the same up to a fixed ratio ofreinforcements:responses of 160 (FR160) (Fig. 2.6), but the total time spentfeeding and meal frequency were negatively related to FR, while inter-mealinterval, meal size and rate of eating within meals were positively related to FR.It appeared that randomness in meal taking declined at higher FRs, and FR20seems the most appropriate to use in experiments in which it is desired to getbirds to eat only when they feel hungry.
Pre- and postprandial correlations are generally higher when animals haveto expend some energy to get food. As the cost rose from 1 to 5000 pecks togain access, so the number of meals fell from about 20 to 1/day, and meal sizerose from being very small to > 200 g (Kaufman and Collier, 1983). Daily foodintake remained approximately constant up to about 500 pecks/meal, but rateof eating increased more or less continuously with FR. Unfortunately, there wasconfounding between the FR imposed and the age/weight of birds, so theobserved reduction in daily intake at higher ratios might just have been due toa slowing of growth as birds were about 3 kg at this stage, at which point theywere growing only slowly.
When hens trained to push a weighted door to get food were deprived offood for 12 h, they took significantly longer to gain access to food by applying therequired force � time than when deprived for 43 h, due to longer pausesbetween attempts to open the door. It is not necessary to construct specialequipment in order to quantify animals’ motivation to eat. For example, Pethericket al. (1992) trained hens to run down a 14.4 m alley for food. The speed withwhich they ran was significantly increased by deprivation of � 6 h (0.29, 0.62,0.65, 0.57 m/sec for deprivation periods of 0, 6, 12 or 18 h, respectively).
The speed with which chicks approached food was also used by Hannah(2001) in studies of motivation to eat foods made moderately (M) or highly (H)imbalanced by dilution with wheat, colouring and quinine being added as cuesand compared with unadulterated food (C) given a different colour (but noquinine). During the first phase of the experiment, from 17–32 days of age,they were fasted for 1 h and given the test food for 2 h daily; for the rest of thetime untreated food was available ad libitum. On days 26 and 33 each bird’s
120 Chapter 6

motivation was tested individually by recording the time taken to attack the testfood to which it had been trained.
During the second period of the experiment, the training and testingprocedures continued but the test food was either kept the same or changed to amoderately toxic food, as shown in Fig. 6.1, in order to study the duration andextent of the adjustment in motivation. The results show very clearly the reductionin motivation (increase in ‘attack’ time) of the chicks given toxic test foodcompared with those given the control food. By 4 days after the test food havingbeing changed there were clear changes in motivation, which had stabilizedsome 10 days after the change. This demonstrates very clearly the learning andrelearning involved, the latter taking only a few days in these young chicks.
In this and many other similar studies, including operant conditioning,birds have been fasted for short periods in order to increase their motivation toeat. This creates an abnormal situation, mildly stressful, and adds significantlyto the time taken to perform the experiments. It has been shown that maggotsare highly attractive to hens, who show great motivation to eat them evenwithout prior fasting, and it has been suggested that they could be used as testfoods for poultry (Bruce et al., 2003).
Pigs
Sows, fed at a commercial level of 2.3 kg/day, were trained to lift a lever to obtainreinforcements of 2.7 g of food on a 10:1 FR. After 1 h of responding, the FR wasraised to 20, and so on. Extinction (failure to respond sufficiently to obtain areinforcement) occurred at ratios which varied from 70:1 to 430:1 for different
Learning about Food: Conditioned Preferences and Aversions 121
0
100
200
300
400
500
16 21 26 31 36 41 46 51
Day of age
Low attack
motivation
High attack
motivation
Period 2 – conditioningPeriod 1 – training
Atta
ck ti
me
(s)
Fig. 6.1. Attack times for each treatment group: � HH,♦ CC, � HM, ▫ CM. C, control testfood; M, moderately; H, highly toxic test food. Vertical dotted line shows where the foodswere changed (see text for details) (from Hannah, 2001).

sows. For high FRs, it was estimated that the energy cost of responding wasgreater than the benefit gained from the food. Sows trained to lift a lever toobtain straw, twigs, nothing or a portion of food responded for food, mostfrequently (Hutson, 1992).
Specific nutritional deficits or general nutrient restriction will increasehunger and the motivation of the animal to ingest food (Lawrence et al., 1993).Jensen et al. (1993) found that individually housed, protein-deficient, growingpigs increased their general activity relative to those animals offered a dietexcessive in protein or to those offered a choice between the two foods. Food-restricted (ad libitum � 20%) pigs spend less time lying than pigs fed adlibitum. They also rooted the straw substrate significantly more.
In group-housed situations, pigs may redirect their behaviour towardspenmates as alternative foraging stimuli and hence increase the chance of injuriesthrough excessive abnormal behaviour. Pigs with an inadequate dietary proteinsupply tend to have an enhanced attraction for blood. It is not known whetherthe inadequate protein nutrition predisposed the animal’s attraction specificallyfor blood or would have been similar for other protein-rich substances. Thus it isproposed that, if animals are allowed a choice of balanced foods such that theycan select a diet to meet their requirements, they can satisfy their motivation toingest food.
Sheep
Sheep can quite easily be trained to respond for food (Kilgour et al., 1990).
Learning
Selection of a food may be euphagic, i.e. implying nutritional wisdom orhedyphagic, i.e. selection for pleasurable flavour. Because there will be somefood items that have an innately pleasant appearance or flavour but arenutritionally inadequate or even toxic, animals should not rely solely on inbornpreferences to determine their food choice. Rather, they should sample a rangeof foods and, when they have learned which ones are nutritious, eatpredominantly from those while sampling other foods occasionally to takeadvantage of any nutritious foods that may become newly available – a foodthat is toxic now might not continue to be so in the future.
With a few notable exceptions, there is no reason to believe that nutritionalwisdom occurs because animals can directly taste or smell either nutrients ortoxins in foods. There is, rather, compelling evidence that animals learn toassociate taste, smell and/or visual appearance with the consequences of foodingestion, and this affects food selection and intake. Animals acquirepreferences for foods that cause satiety and aversions to foods that causemalaise. Increasing excess or deficiency of a toxin or nutrient will lead to anincreasing tendency for the animal to correct the imbalance.
There are toxin receptors in the hindbrain, and consciousness is notnecessary for toxins to affect the animal’s response to the taste of a food.
122 Chapter 6

Neophobia
When a new food is available, the animal has only its instincts to guide it; as wehave already seen, this might not give it a good prediction of what will happenwhen the food has been ingested. Animals are initially cautious on beingoffered a food with a novel flavour, e.g. ‘bait-shyness’ in wild rats. This isadvantageous in evolutionary terms, even if the nutritive value of the food hasnot changed, as it is mainly by taste and smell that the animal recognizes thefood. When, by taking small amounts of the food, the animal learns that it issafe, then normal rates of intake can be resumed. Abrupt weaning, such asusually carried out in intensive animal husbandry, challenges the young animalby removing the familiar food and forcing it to assess novel food and to drinkwater for the first time. The weanling is clearly aware of its changedcircumstances, conscious of its hunger, but innately cautious in its acceptanceof novel foods.
Learned Aversions
It is known that when an unpleasant metabolic experience occurs around thetime a novel food has been eaten, this food becomes aversive. For example,injections of lithium chloride, known to induce nauseous feelings, when pairedwith red food, induce aversion for that colour by chickens.
There are several unusual features concerning the conditioned aversion tofood paired with abdominal discomfort: (i) the aversion can develop after asingle trial; (ii) it can occur even though there may be a long delay (severalhours) between the unconditioned stimulus (US) and conditioned stimulus(CS), making this learning different in character from Pavlovian association, inwhich US and CS must be presented almost simultaneously; and (iii) tastes aremuch more effective than visual or aural cues, at least in mammals. Evenanimals under the influence of an anaesthetic when a painful stimulus (US) isgiven learn to associate it with the food available when they are regainingconsciousness (CS). It is important for food to be novel, with a strong tasteand/or odour, and these characteristics are often associated with high-proteinfoods.
As an example of the methodology used in studies of the development ofconditioned aversions, research with CCK and coloured foods for chicks ispresented. CCK, produced in the duodenum and proposed as a satietyhormone (see Chapter 4), has been shown to condition an aversion tocoloured food. CCK given intraperitoneally (i.p.) is known to depress foodintake, and the aim of studies by Covasa and Forbes (1994b) was to determinewhether this reduction was due to a pleasantly satiating effect or anunpleasantly nauseating effect of CCK.
On days 1, 4 and 7, one-half of the birds were injected with 100 �g CCKi.p., sufficient to depress intake by about 20% over the next 2 h; for 2 h afterthe injection the normal food was replaced with food of the same composition,but coloured green for one-quarter of the birds and red for the other quarter.
Learning about Food: Conditioned Preferences and Aversions 123

The other half were injected with saline and, again, one-quarter given greenfood and one-quarter red for the next 2 h. On days 2, 5 and 8, each bird wasgiven the alternate injection with the alternate colour and on days 3, 6 and 9were made mildly hungry by fasting for 1 h and then individually given achoice between green and red food.
The colour approached was noted and, as shown in Fig. 6.2, they becameprogressively averse to the colour of food associated with CCK – it is clear thatthe effects of the hormone are unpleasant and that the birds had becomeconditioned to believe that their discomfort was due to food of a particularcolour – the identity of the colour is not important. For the next 11 days, noinjections were made but the preference test was repeated from time to time –the aversion was lost within a few days. Then, from day 26, injections werepaired with the opposite colours to those used in the first phase of theexperiment and aversion rapidly developed, again followed by return to nopreference within a few days of stopping the injections. Thus, colour preferencecan be easily manipulated and the same is true for the association betweenfood flavour and the consequences of eating, which is more readily evident inmammals.
It is known that the intake depression caused by giving CCK i.p. can beprevented by section of the vagal nerves (i.e. CCK stimulates abdominalreceptors that transmit information to the CNS via the vagal pathway, Chapter 4)and, when the above experiment was repeated with chickens vagotomized at thelevel of the proventriculus, no significant colour preferences or aversions becameestablished.
124 Chapter 6
0
20
40
60
80
100
0 10 20 30 40
Days
Chi
cks
eatin
g C
CK
-pai
red
colo
ured
food
(%)
Fig. 6.2. Percentage of chicks favouring the colour of food associated with CCK injection;dotted line, 50% (see text for explanation) (from Covasa and Forbes, 1994b).

Unnatural toxins
Lithium chloride (LiCl) has been widely used as US in studies of conditionedaversions. It has approximately the same effects in various species on a per-body weight basis and is effective when given either enterally or parenterally.
Poultry
Hayne et al. (1996) studied aversion learning and retention in chicks whosedrinking water was coloured blue and adulterated with LiCl for a period of 24 h.The chicks self-administered large and often lethal doses of the LiCl solution butsubsequently avoided blue water during two-bottle preference tests administered3–7 days, but not 14 days, after exposure. Surprisingly, neophobia alone wasinsufficient to prevent non-deprived chicks from ingesting large quantities of atoxin during their initial encounter with it. On the other hand, those that survivedhad learned to avoid the colour associated with toxic consequences although thishad been forgotten 1–2 weeks later.
Pigs
It appears that no studies with LiCl have been made in pigs!
Cattle
Pfister (2000) used LiCl to induce aversion to toxic pine needles, and the workof Cibils et al. (2004) is another example in which the ability to associatestimulation of the external skin-defence system with the internal gut-defencesystem was tested. Young cattle made averse to high-quality foods by means ofelectric shocks were not put off from eating these foods when they were in‘safe’ locations, whereas they avoided foods rendered aversive by means ofLiCl irrespective of location. It can be concluded that non-food features of theenvironment are not used as CS for food aversions, a conclusion also reachedby J. Catterall and J.M. Forbes (unpublished observations), who paired solidfloor (preferred) or wire mesh (avoided) with different coloured foods andfound no aversion to the mesh-paired colour of food.
Sheep
The rumen, by storing food for several hours, may act as a buffer betweeneating a meal and experiencing its metabolic consequences and thereby reducethe chance of a toxin being associated with its originating food. Alternatively,the rumen may assist learning by prolonging the time over which a toxin froma particular meal is available to the host animal. Presumably because of theirlarge size and high cost of carrying out research with cattle, most of the studieson ruminants have been carried out with sheep.
Sheep find LiCl, injected or in the food, to be unpleasant and the degree oflearned taste aversion varies closely with the dose. Strong aversion was shownwith injection of 150 mg/kg, similar to the dose causing strong aversion in rats.
Learning about Food: Conditioned Preferences and Aversions 125

Feeding neophobia was also increased in proportion to the last dose of LiClused. When sheep and goats were given 2% LiCl in food, they ate a maximumof around 39 mg/kg body weight for sheep and 27 mg/kg for goats, levels notmuch higher than those causing mild discomfort in humans.
Lambs made averse to a novel food by means of LiCl persisted in avoidingthis novel food, even when not adulterated, but gradually this aversion wore off(Burritt and Provenza, 1996). However, when at a later date they were giventhe novel food together with another novel food adulterated with LiCl, theysubsequently avoided the original novel food at first, demonstrating a memoryfor the effects of LiCl. In a second experiment, lambs were offered a novel foodfor either 28, 14, 7 or 1 day, followed by a single exposure to LiCl. The longerthe lambs had experienced this food, and become convinced that it was safe,the less persistent the aversion.
Sheep can clearly detect different concentrations of a flavour and prefer alower concentration of a flavour associated with the unpleasant consequencesof LiCl administration. Lambs offered food with a medium concentration ofLiCl after being offered a high-LiCl food increased their intake, while thosepreviously on a low-LiCl food decreased their intake when given the medium-LiCl food; the influence of either US (LiCl) or CS (flavour) on preferences andintake is, therefore, relative rather than absolute.
Naturally occurring toxins
Oxalic acid is a mild toxin found in some materials used as animal feed, suchas the leaves of many root crops. Conditioned taste aversions have beeninduced in sheep that persisted for up to 60 days after the last dose of oxalicacid (Kyriazakis et al., 1997). The rate of development and severity of theaversion were dependent on the rate of administration of oxalic acid,developing after as little as one exposure to a very high dose but requiringmany exposures to low doses (Kyriazakis et al., 1998). These findings show thatit is not only to powerful unnatural toxins that aversions are developed, but tosubstances that are found in the diet and are only mildly toxic at naturalconcentrations.
Excess of nutrients
Not only do substances that are overtly toxic act as US in conditioned aversion,but even essential nutrients can depress intake and preference when theirsupply to the animal exceed the animal’s needs. Sheep prefer a straw of aflavour associated with the provision of NaCl until their requirements are met,then they find this same flavour aversive; a similar situation applies to sulphur.These and other appetites are described and discussed in Chapters 8 and 13.
There is a large and significant literature on learned preferences andaversions to the protein:energy ratio of foods, and this is discussed below in thesection on ‘Continuum from Preference to Aversion’ and in Chapters 7 and 8.
126 Chapter 6

Distension of the digestive tract
We have seen above that animals prefer foods, or flavours associated withfoods, that provide adequate amounts of nutrients. Foods high in fibre andtherefore occupying a lot of space in the stomach might be expected to generateaversion, as it has been shown that gut distension in rats conditions an aversionto the paired taste (Bardos, 2001). In pigs, feeding motivation is inverselyproportional to the bulkiness (measured as water-holding capacity) of iso-energetic meals (Day et al., 1996b).
In the only relevant study in ruminants, non-lactating cows had a balloonin the rumen inflated with 12 l of water for 2 h, immediately after which eachwas given 500 g of either unflavoured or citrus-flavoured concentrate food(Klaiss and Forbes, 1999). This was repeated on the following 2 days and for afurther 3 days when the treatments (± balloon, ± flavour) were reversed. Thefollowing day, a preference test was administered in which 500 g of flavouredand 500 g of unflavoured concentrate were given at different ends of the foodtrough and the times at which each animal changed from one food to the otherwere noted. For the next 6 days, the training was continued by alternating thetreatments (± balloon), still associated with the same flavour as before, onalternate days, followed by another preference test.
No significant preferences were observed, for which the authors gave threepossible reasons: (i) the cows could not differentiate between the flavoured andunflavoured foods. This is highly unlikely, as the citrus flavour was easilyrecognized by humans and the concentration used was greater than that of asimilar citrus flavour that was clearly distinguished by cows; and (ii) thedistension of the rumen caused neither pleasant nor unpleasant sensations.This seems unlikely because such distension depresses intake of forage and theballoon was added to a rumen that was already fairly full; or (iii) filling theballoon just before, rather than just after, giving the flavoured/unflavouredconcentrate. While animals associate unpleasant stimuli applied from a fewseconds to several hours after eating a distinctively flavoured food, applicationof the CS (in this case balloon inflation) before exposure to the US (in this casethe flavoured food) might not condition the association. The reason forinflating the balloon before the concentrate meal was to avoid the disturbanceassociated with inflation coinciding with the critical time just after exposure tothe US – the eating of flavoured or unflavoured food.
Conditioned Preferences
Sources of energy
Infusions of starch into the rumen, to provide 2.5–9.4% of daily DE intake,causes preference for the flavour of food given at the time of the infusions,which lasts up to 8 weeks after infusions have stopped (Villalba and Provenza,1997c). The fermentation of starch in the rumen is predominantly topropionate, and this VFA is required for the synthesis of glucose, which is often
Learning about Food: Conditioned Preferences and Aversions 127

in short supply in the forage-fed ruminant. Infusion of propionate into therumen also induced a preference for the flavour of food given with the infusion,even though the propionate supplied was equivalent to no more than 1.4% ofthe daily ME intake (Villalba and Provenza, 1996). This preference wasinduced by the propionate rather than by the sodium or osmolality of theinfusions.
Other conditioned preferences have been demonstrated but, as these areincluded in the following section, they will not be referred to here.
Continuum from Preference to Aversion
Examples of aversions and preferences to stimuli paired with administration ofnutrients have been given in the preceding sections. In some cases thedifference between preference and aversion is one of dose – small amounts of anutrient given to an animal deficient in that nutrient are likely to generate alearned preference for the paired stimulus (e.g. flavour of novel food), whileamounts given in excess of requirements will generally cause an aversion. It canbe envisaged, therefore, that given the opportunity, an animal will eatincreasing amounts of a food that supplies a needed material until its need ismet (or even exceeded), at which point it will limit its intake of that food inorder to obtain an amount of the material that meets its requirements – there isa continuum of effect as the dose provided is increased, from preferencethrough aversion. We now provide examples of such continua.
The first example is given in some detail as an illustration of the methodologyof this type of research. Arsenos and Kyriazakis (1999) have demonstrated acontinuum between conditioned preferences and aversions in sheep to flavouredfoods associated with doses of casein from 9, 17, 35 and 53 g given by gavage.Growing sheep were maintained on a protein-deficient basal diet containing 9.5g CP/kg. A test food containing 393 g CP/kg was prepared, with either orange oraniseed flavouring. Twice a day on days 1, 2, 5 and 6 of an 8-day period, eachlamb was given a particular dose of casein by stomach tube and offered one ofthe flavoured test foods, or the other flavour of test food with water given into thestomach. Flavour order and association with dose of casein were completelyrandomized within each casein dose. On the 8th day, both flavoured test foodswere offered simultaneously for 40 min to monitor the degree of preference. Thisprocedure was repeated three times after which, without further conditioning,preference tests were performed 7, 21 and 35 days later to investigate thepersistence of preferences or aversions in the absence of reinforcement. Theresults are given in Fig. 6.3.
No preferences or aversions were apparent after the first conditioningperiod (preference ratios (PR) not different from 0.5), but subsequently thelower two doses led to conditioned flavour preferences (PR � 0.7), presumablybecause they alleviated a deficiency of N, while the higher two doses led toconditioned flavour aversions (PR < 0.4 and much less with the highest doseof casein), presumably being sensed as toxic overdoses.
128 Chapter 6

The preference tests carried out after cessation of conditioning showed nosignificant diminution in the preferences or aversions observed immediatelyafter conditioning, demonstrating strong persistence. The authors observe thatthe existence of a continuum of flavour preferences and aversions created bydifferent amounts of the same nutrient source could be the basis of howruminants select a diet that meets their nutrient requirement at a particularpoint in time. The concept of an optimum rate of intake of a nutrient for aparticular animal is utilized in the MTD hypothesis described in Chapter 10.
In a similar experiment in which different doses of urea were paired withdifferent food flavours, a low dose (0.12 g N/day) led to preferences, while ahigher dose (0.23 g) produced aversion; in a second experiment, doses of 0.23and 0.46 g N gave preferences for the paired flavour of food while the highestdose of 0.92 g N led to aversion (Villalba and Provenza, 1997b). The differencebetween the thresholds in the two experiments is probably related to thedifferent basal diets between the experiments.
Energy-yielding nutrients have also been shown to cause flavour-associatedaversions or preferences, depending on the dose of US administered. Propionategiven at 4% of daily DE intake engendered a preference, while at 12% it producedan aversion to the flavours paired with the administration of propionate (Villalbaand Provenza, 1997a).
Thus a food that the animal is conditioned to believe alleviates a deficiencybecomes preferred over other foods, while one thought to be excessive in thesame nutrient becomes aversive. Under natural conditions such responseswould lead to ‘nutritional wisdom’, i.e. eating a mixture of foods that mostclosely meets the animal’s nutrient requirements.
Learning about Food: Conditioned Preferences and Aversions 129
0
0.1
0.2
0.3
0.4
0.5
0.6
0.7
0.8
0.9
9 17 35 53
Dose of casein (g)
Pre
fere
nce
ratio
Fig. 6.3. Preference for flavour associated with administration of casein into the rumen onfirst, second and third test during conditioning (solid bars), for doses of casein from 9 to 53 g,and 7, 21 and 35 days post-conditioning (open bars) (from Arsenos and Kyriazakis, 1999).

Trade-offs and Interactions
Whenever a food contains a toxin, an animal offered this food alone has totrade off the consequences of reducing its daily intake, thereby escaping the fulleffects of the toxin and suffering a lack of nutrients (bearing in mind that, ingeneral, the only difference between a toxin and a nutrient is the concentrationof the substance in the diet).
Interactions between nutrients
The ratio of VFAs administered can influence the degree of preference oraversion generated. The preference by straw-fed lambs for the associatedflavoured food was greater when the ratio of acetate:propionate in the infusatewas 55:45 than when it was 75:25 (Villalba and Provenza, 1997a). It is likelythat sheep on the straw diet would be deficient in glucose due to low rates ofproduction of propionate in the rumen, and this would be alleviated moreeffectively by the mixture with the higher proportion of propionate.
Lambs prefer a poorly nutritious flavoured food eaten during, and shortlyafter, an intra-ruminal infusion of energy or protein. Preloads of caseindecrease preferences for flavours previously paired with casein and increasepreferences for flavours paired with starch, while preloads of energy have theopposite effect. These animals can, therefore, discriminate between the post-ingestive effects of energy and protein and associate the effects with foodflavours in order to regulate macronutrient ingestion.
It has been proposed that certain types of diet provide imbalances betweenenergy and protein supply at different times of day, even though they may bebalanced overall. Kyriazakis and Oldham (1997) set out to test whether suchasynchrony of nutrient supply would influence diet selection, relative to a fooddesigned to provide the same nutrient supply in a synchronous manner. Foodswere formulated to provide rapidly or slowly fermentable energy with high orlow ruminal degradable protein (RDP) – all foods had the same calculatedcontents of metabolizable energy and metabolizable protein. When choiceswere offered, the proportion of the low-RDP food in the selected diet was lowerwhen the carbohydrate source was rapidly rather than slowly fermentable,which is consistent with the hypothesis that ruminants learn to select a mixtureof foods that minimize metabolic imbalance.
There is thus accumulating evidence that ruminants prefer to avoid a foodwith an adequate nutrient balance overall that delivers different nutrients atdifferent rates and results in temporary imbalances.
Interactions of nutrients with toxins
Animals on a high plane of nutrition are better able to withstand toxins thanunderfed animals. Sheep are able to eat more LiCl when on a diet high inenergy and more of several toxins when on a diet high in energy and protein
130 Chapter 6

(Villalba and Provenza, 2005). Presumably the higher rate of metabolism on ahigher level of nutrient intake enables a faster rate of detoxification.
Conversely, dosing with toxins (terpenes, nitrates, tannins or LiCl) hascaused sheep to select a diet with a higher protein:energy ratio, while treatmentwith cyanide causes a decrease in the protein:energy of the diet selected. Thus,there is no common response to different toxins; rather, they vary on a toxin-by-toxin basis depending on physiological state.
It sometimes happens that the plants with the highest yield of digestiblenutrients are those containing toxins, and grazing animals must trade nutrientsoff against toxins. Deer offered pairs of foods with different ratios of phenolictoxin to digestible energy eat high-energy foods when these are low inphenolics, but low-energy foods when the high-energy ones are high inphenolics. Similarly, goats eat more low-digestibility blackbrush twigs when thehigh-digestibility twigs are high in toxin, and lambs prefer foods lower in readilyavailable carbohydrate when a high-energy food has tannin added to it (Tituset al., 2000). Given PEG, which neutralizes tannin, these lambs moved theirpreferences to lower-energy foods to a significantly lesser extent after tanninlevels were increased than those which did not receive the PEG supplement.
In most studies of conditioned preferences and aversions, access to test foodshas been given one at a time, giving plenty of opportunity for animals to learnthe association between each US and its attendant CS. In nature, animals areconfronted with many different plants at the same time, and Duncan and Young(2002) studied the ability of goats to learn about foods when multiple foods wereavailable simultaneously. Different conifer species were offered on separate daysand animals were dosed with LiCl (20 mg/g DM foliage consumed) as a negativestimulus, sodium propionate (90 mg/g DM foliage consumed) as a positivestimulus or sodium chloride (54 mg/g DM foliage consumed) as a neutralstimulus. The goats were able to learn the associations and adjusted their dietselection accordingly (see Fig. 6.4a). However, when a different set of animalswas given all three test foods and all three associated US simultaneously duringthe learning phase of the experiment, the animals took a mixed diet (see Fig.6.4b), thereby reducing their chances of learning the associations. The authorsstate that: ‘… caution is required in extrapolating results of artificial conditioningexperiments to free-ranging herbivores’.
Lambs given two foods containing different toxins (tannins, terpenes oroxalates) ate more food in total than when given only one of the foods; thoseoffered three foods, one containing each toxin, ate even more as the intake ofeach individual toxin was lower than when only one of the foods was on offer(Villalba et al., 2004). This improvement is likely to arise only when thedifferent toxins are detoxified by different mechanisms. The experience ofeating these foods enhances total intake when such choices are given up to 8months later, and emphasizes the importance of carrying out research withmore than one toxin at a time and of considering the long-term as well as theshort-term responses to such choices.
Learning about Food: Conditioned Preferences and Aversions 131

Interactions between ‘working’ and nutritive value
The quality of food frequently differs in different parts of the animal’senvironment, and they must choose whether to stay eating a poor food orexpend effort in moving to a food of better quality. In order to study this type oftrade-off, Ginane et al. (2002) offered heifers a poor hay ad libitum and alimited amount of a better-quality hay on the other side of the test arena. Asthey depleted the limited quantity of the better food, the animals spent moretime eating the poorer one; also, they were prepared to walk less to obtain thebetter hay when the difference in quality between the two was small, comparedwith when it was large. Although these heifers tended to behave in a mannerlikely to maximize their energy intake, their choices were sometimes suboptimaland the authors speculated that the animals desired to diversify their diet, notsimply to maximize energy intake.
132 Chapter 6
Fig. 6.4. Influence of post-ingestive stimulus (lithium chloride, shaded bars; sodium chloride,open bars; sodium propionate, solid bars) on intake of associated conifer species in three-way preference tests when individual conifer species were offered; (a) on separate daysduring conditioning weeks in the temporal separation experiment; (b) simultaneously duringconditioning weeks in the simultaneous experiment (from Duncan and Young, 2002).

Relearning Following a Change of Food, Animal or Environment
Change of diet
Animals must relearn when the food to which they have been accustomed issuddenly changed to another with different sensory and nutritional properties. Inmost practical and experimental situations, sudden changes are avoided by aslow change of diet; in changeover experiments it is usual to wait for animals tostabilize on a new diet before recommencing recording of feeding behaviour.There are few data in the literature, therefore, with which to illustrate the time-course of adaptation. Figure 6.5 shows what happened when 32 individual sheepaccustomed to oaten chaff were suddenly changed to a diet of barley straw; themean daily intakes are shown, together with intakes of two individuals, selectedat random (J. Hills, 1998, unpublished results).
The intake of oaten chaff was fairly stable at around 1200 g/day, but onthe first day after the change to barley straw the sheep ate very little, whichsuggests that they were not familiar with the new food and were showingneophobia – a wariness of new food in which only small amounts are taken inorder to assess whether there are unpleasant consequences to eating it. Thenintake increased (but with a minor decrease on days 4 and 5 after the change,perhaps due to ruminal disturbance if the microflora has not adapted tothe new food) to reach a plateau of around 800 g/day some 10 days after thechange. The two individuals shown in the figure conform quite well to themean for all 32 animals, but with greater day-to-day fluctuations than themean.
Learning about Food: Conditioned Preferences and Aversions 133
0
200
400
600
800
1000
1200
1400
1600
26 Aug 31 Aug 5 Sep 10 Sep 15 Sep 20 Sep 25 Sep 30 Sep
Date
Inta
ke (
g/da
y)
Fig. 6.5. Mean daily intakes for 32 sheep (solid line) and two individual sheep (lines withsymbols) selected at random; on 6th September the oaten chaff was replaced with barleystraw (from J. Hills, unpublished results).

Changes in the animal
As the animal grows and develops so its optimum diet changes. These changesoccur slowly and there is plenty of time for animals to learn whether smallincreases or decreases in intake are necessary to conserve minimal discomfort.
On the other hand, as a cow progresses from late pregnancy into earlylactation, there are much more rapid physical and metabolic changes,including: (i) a reduction in the competition for abdominal space; (ii) changesin amounts and ratios of nutrients required; (iii) oestrogens increasing in latepregnancy and then falling at parturition; and (iv) the distraction of parturitionitself. Thus, there is a whole new balance of factors required in order to achieveoptimal metabolic comfort, which takes the animal a long time to get right,hence the slow increase in early lactation (see Chapter 16).
Timescale of Aversions and Preferences
Provenza (1995) has proposed that there are three kinds of memory involvedin the association between sensory and metabolic properties of foods. The firstis that provided by evolution through the special and general senses, wherebysome food-related stimuli are innately aversive (e.g. odour of faeces) orpreferred (e.g. sweet taste). The second kind of memory is provided by themother, who is a source of ‘transgenerational knowledge’, reducing the riskinvolved in learning about foods and environments. The third kind of memoryis that of the individual itself, involving post-ingestive feedback from nutrientsand toxins and associations with sensory properties of foods. Thus, eachanimal has its own genetic and behavioural history, making it difficult to predicthow it will react in a particular choice situation.
CS–US interval
For most associations to be learned, the CS (the ringing of a bell in the case ofPavlov’s dog) must be presented a few seconds before the US (the presentationof food in order to elicit salivation). However, with learned preferences andaversions to foods, the presentation of the conditioning stimulus (CS, theflavour/appearance of the food that the animal has learned to be associatedwith its metabolic properties) and of the unconditioned stimulus (US, the effectsof the metabolites absorbed from the food) can be many minutes, or evenhours, apart.
In some cases animals find a food aversive only when discomfort is feltsoon after ingesting that food. For example, giving sheep 150 mg/kg LiCl (US)either at the time of offering oat chaff (CS) or 1 or 2 h later resulted only in thedevelopment of an aversion for that food in those given LiCl at the time ofoffering the chaff. In other cases, however, longer intervals can elapse betweenCS and US, such as at least 8 h in sheep (Arsenos et al., 2000). Preferences arestronger, however, when the interval is short (Villalba et al., 1999), and this
134 Chapter 6

may well be why a stronger preference is induced by starch (rapidly digested)than a fibrous material when introduced into the rumen, and why sheepactively seek plant parts high in soluble carbohydrates.
It is not even necessary for animals to be conscious during the time theyare exposed to the nauseating effects of a toxin: when sheep were given anovel food and then anaesthetized while a nauseating dose of LiCl wasadministered, and maintained unconscious until its effects had dissipated, theystill found that food aversive when offered it subsequently (Provenza et al.,1994a, b). Thus, animals need not be consciously aware that some foods aremildly toxic and are inducing a learned aversion; the whole process isautomatic unless, of course, the toxin concerned is powerful, in which case thediscomfort is obvious.
Speed of learning
It is to be expected that the speed of learning will depend on the degree to whichthe animal has been moved from its normal state, e.g. by previous feeding of adeficient diet, as the reinforcing properties of feeding can be very rapid indeed.
The speed with which chicks learned new associations between the proteincontent of a food and its colour was investigated by training them to associateone colour with a high protein content of 248 g/kg and another colour with alow protein content of 103 g/kg (Hannah, 2001). Then they were fasted for 1h, offered both foods and the time taken to start eating from each wasmonitored. In Fig. 6.6, the area to the left of the dashed vertical lines showsthat they ‘attacked’ the high-protein food significantly more quickly than thelow-protein food, whether the high- or the low-protein food was colouredgreen. On day 48, the colours were reversed and there was a rapid reversal ofthe attack times so that within 3 days the high-protein food was once again
Learning about Food: Conditioned Preferences and Aversions 135
0
50
100
150
200
250
300
40 45 50 55
Age (days)
(a)
0
50
100
150
200
250
300
40 45 50 55
Age (days)
(b)
Atta
ck ti
me
(s)
Atta
ck ti
me
(s)
Fig. 6.6. Mean times to attack foods with different protein contents and colours. (a)treatment 2 (red, HP, green, LP and reversed at day 48); (b) treatment 4 (red, LP, green, HPand reversed at day 48). �, red food; ●, green food; the vertical dashed line shows the timethat the food colours were reversed (from Hannah, 2001).

being attacked far more quickly than the low-protein food. This relearning timeis similar to those noted in other experiments with chicks.
Jones and Forbes (1984) found that sheep which obviously discriminatedagainst quinine-treated hay in a preliminary period ate equal amounts oftreated and untreated hay in subsequent 5-day choice periods, therebydemonstrating adaptation as they learned that there were no harmfulconsequences to eating the quinine-flavoured food. Following a change inflavour, even without changes in the nutritive value of food, sheep sample thefood cautiously.
Speed of forgetting
There is a difference between a situation in which the UC–CS association ischanged, as in the examples above, and one in which an association is nolonger reinforced. In other words, once learned, for how long is the memoryof the nutritive value of a food retained? The answer seems to vary with thecircumstances. This makes sense because it is necessary, on the one hand,for conditioned taste aversions to persist (otherwise they have no function),but also to be flexible (otherwise an animal might be saddled with anunnecessary aversion for the rest of its life). The stronger the aversion thelonger it persists.
Growing broilers seem to forget the aversive properties of a coloured foodpaired with an i.p. injection of cholecystokinin within a few days (see Fig. 6.2)and it might be thought, therefore, that this aversion is a mild one. However, itneeds to be remembered that the younger an animal, the faster it is likely tolearn and forget. Once sheep have eaten > 10 g of supplement/day they willsubsequently eat it readily even if they have not seen it for 3 years. Sheepmoved from native pastures to high-quality pasture select a food withsignificantly lower nitrogen content than sheep reared from birth on thatpasture. This is true even after the introduced sheep have been on the goodpasture for 3 months.
There are many examples to show that experience of eating a particularfood is helpful. Sheep reared on grass are more dextrous and have a higherbiting rate for grass than those experienced in harvesting shrubs. Conversely,those used to eating shrubs do so more efficiently than those with only grassexperience. Goats with experience of browsing blackbrush eat faster and moreby breaking twigs off than do inexperienced goats. Lambs with experience ofgrazing the serviceberry shrub later grazed it more efficiently when it was sparsethan did naïve lambs, while there was no such difference in the rate of eating ofother foods. Lambs or ewes recognized foods to which LiCl had previouslybeen added, after 2 months without exposure.
If an animal learns that a food item is unpalatable and avoids it, does itforget the unpalatability by it not being reinforced? Do unreinforced encountershave a memory-jogging effect? Usually animals sample from time to time foodsto which they are averse, presumably so that they can be made aware of anychange in their properties.
136 Chapter 6

Social Components
While the general framework whereby aversions and preferences for foods canbe learned has evolved over the generations, and indeed some are innate(preference for sweet taste; aversion to bitter taste), cues as to how to behavewhen selecting a diet can be given by other animals, usually of the samespecies and often the parents.
Poultry
The sight and sound of the hen pecking and giving a low call stimulates newlyhatched chicks to peck at food. Those brooded with their mothers performmore locomotion and more sustained feeding activities than non-broodedchicks, as well as having different preferences from non-brooded chicks, andvery clearly followed their mother’s preferences (Wauters et al., 2002).
Chicks can learn from each other but don’t learn so well to get food if thedemonstrator doesn’t receive a reinforcement. To what extent is thedemonstrator aware that it is teaching and does it modify its behaviour, e.g. byaccentuation, when it realizes that it is a teacher? Sherwin et al. (2002) showedthat 9-week-old chickens consumed a greater proportion of food of a colourthat they had seen demonstrators pecking at more actively (but only when thefood was green and not red). Their choice was not, however, affected byhaving observed a disgust reaction to bitter food eaten by demonstrators.
Adult birds tend to feed in groups and visual, but not auditory, cues areimportant in the synchronization of feeding in individually caged birds, although ithas been said that feeding can be synchronized in the short term by sound alone.
Pigs
Farm animals are all gregarious species and, even when penned separately butwith sight and sound of each other, tend to eat in synchrony. Weaned pigletspenned close to suckling sows go to their feeder when they hear youngerpiglets sucking. There is synchrony of sucking within a litter of piglets, anddifferent litters in the same house tend to suck at the same time. Taperecordings of the sounds associated with nursing have been used with somesuccess to increase the frequency of nursing and to improve weight gains.Young pigs also accept a food more readily if it has the flavour of their mother’smilk – in some studies, but not in others.
Although young piglets did not appear to observe precisely the feedingbehaviour of trained siblings, some combinations of cues resulted in asignificant bias of food-searching behaviour towards a site where thedemonstrator had previously eaten (Nicol and Pope, 1994). Thus, observing anexperienced animal does not necessarily cause acquisition of a feedingbehaviour, but may direct investigation towards stimuli involved in the task,which could facilitate learning.
Learning about Food: Conditioned Preferences and Aversions 137

Other senses may be integral to the social transmission of informationrelated to feeding, although Nicol and Pope (1994) suggested that previousvisual cues were more relevant to pigs than olfactory signs in their learningabout operant panel pressing. Pigs tended to press panels of a similar colour tothe one they had observed the demonstrator using to obtain food.
Social facilitation of feeding is known to occur in pigs, but any attempt toinvestigate whether or not this might affect daily food intake would be fraughtwith difficulties of interpretation as it would involve keeping some pigs inisolation, which might be stressful and depress intake. Effects of group and pensize on food intake are discussed in Chapter 17. The relative importance ofsocial transmission of feeding behaviour to pigs is relatively unknown. Theimportance of individual determinants is likely to vary, depending on theenvironment and on other current circumstances.
Morgan et al. (2001) investigated the extent to which pairing newly weanedpiglets with others that had been weaned a week earlier would increase theacceptance of food. Each pair had visual contact and either no physical contact,contact through mesh or penned together, with pairs of inexperienced pigletshoused together as controls. The two ages housed together had the highestweight gain and the inexperienced pairs ate less food than the other pairs. Pairswith no experience ate simultaneously on fewer occasions than the pairs inwhich one piglet was experienced. It was concluded that food intake isstimulated when an inexperienced piglet is housed with an experienced piglet,and it was suggested that this might be exploited to alleviate the post-weaningcheck in growth.
Cattle
Calves are social drinkers. If one calf is allowed to drink to completion and thenanother calf in the next pen allowed to drink, the first one starts to consumeagain. Even when the second calf is muzzled and put in the same pen, it tries todrink and stimulates the first to drink more. Thus it is sensible to provide plenty ofteats so that all calves can drink together, in order to achieve maximum intake.
Social facilitation of feeding also occurs in adult cattle, and cows fed ingroups have been noted to eat 7% more of a complete food containing 0.6silage than individually stanchioned cows. In three herds in which first-lactationcows were either mixed with or separated from older cows, the heifers spentmore time eating when they were mixed with older cows (263 versus 240min/day), had more eating periods (6.7 versus 5.3 periods/day) and, in the oneherd in which silage intake was recorded, ate more food (9.3 versus 7.7 kgDM/day) (Konggaard and Krohn, 1978). Social interactions do not necessarilyfacilitate feeding, however, especially if there is insufficient feeding space for allanimals in a group to eat at the same time. Trough space can be a limitingfactor, and less than 0.2 m/cow is likely to reduce intake.
Heifers can be conditioned with LiCl to avoid eating larkspur, but they losethis conditioning more quickly when kept with unconditioned heifers thanwhen not kept with such untrained animals.
138 Chapter 6

Sheep
Lambs quickly learn to differentiate between their mother and other ewes, theformer offering herself for sucking (positive reinforcement), the latter buttingand moving away to generate aversion. Lambs show preference for a food witha flavour they experienced in their mother’s milk or even in utero (Nolte andProvenza, 1992).
Provided they are at least 7 weeks old, lambs can learn as well from eithertheir mothers or from other adults. On two commercial farms, ewes and lambswere given grain on three consecutive days. Eighteen months later, 140 ofthese lambs and 140 naïve lambs were offered grain; all of the experiencedones ate by end of day 3, while less than 10% of the others had eaten by thistime (Lynch and Bell, 1987). Thus, the simple strategy of giving ewes grain fora few days just before their lambs are weaned will have a very big beneficialeffect if and when these lambs have to be given grain.
One limitation is that the same grain must be given; sheep trained to onegrain behave naïvely when offered another. Those which had no previousexperience of wheat ate very little of any grain (wheat, barley, oats, maize) inthe first 3 weeks of offering, while those which had already had some wheatexperience ate wheat from the first day of offering but did not take the othergrains as readily, even though they eventually ate more of them than did thetotally untrained animals.
Even when sight, hearing and smell are removed, learning is rapid. Sheepintroduced to wheat in the presence of experienced sheep start to eat muchmore quickly than those penned with other inexperienced sheep. When sheephad their sight, hearing or olfaction – or a combination – temporarily impaired,only impairment of all three senses resulted in slower learning, so there is nooverriding role for any one sense in the learning process.
When supplementary food is offered in drought conditions in Australia,sometimes sheep fail to eat it and suffer undernutrition or even die. In order tosee the extent to which prior experience would alleviate the problem, lambs wereoffered wheat with their mothers for 5 days for a few minutes each day in one ofweeks 1 to 7 of age (Chapple and Lynch, 1986). When, at a much later date theywere offered wheat, those which had been given it when 3 weeks or older atemore than those without prior exposure or those exposed in the first 2 weeks oflife. Other work showed that lambs given wheat for 5 days subsequently atemuch more than those given it for only 2 days. Weaner sheep which had neverseen wheat ate almost none for the first 11 days, after which their intakeincreased rapidly. There is also a fear of unfamiliar troughs, with a reduction inthe time taken to eat wheat if it was fed in troughs from which the sheep hadpreviously obtained hay. Sheep must overcome the fear of the trough, the fear ofthe food and then learn how to prehend, chew and swallow grains.
Provenza et al. (1993) offered ewes a novel food (elm leaves) followed byLiCl or saline, and some of their lambs were conditioned similarly. When lambswere offered a choice, those which were averse themselves, or whose motherwas averse, took fewer bites of elm than controls, while there was no differencedue to treatment on the number of bites of poplar, which had not been paired
Learning about Food: Conditioned Preferences and Aversions 139

with a toxin and which they had previously eaten readily. It was concluded thatthe toxin was more effective than the mother in determining preferences, asthose lambs that received LiCl themselves avoided elm whether their motherhad eaten it or not.
In a further demonstration of the power of observing adults eat, it wasfound that pre-weaning exposure to molasses-urea blocks had a greaterinfluence on subsequent acceptance than post-weaning exposure.
Position of Food Cues
In most natural situations there is no fixed association between the exactposition of a food item and its nutritive value, in contrast to food factors suchas appearance or taste. However, in the absence of any direct sensory cues,many animals can use spatial memory to locate sources of food, or to choosebetween foods. In addition to the colour, shape and brightness, animals canlearn the position of the food if that is consistent between exposures.
Steinruck et al. (1990) offered methionine-deficient broilers complete andmethionine-deficient foods either in the same position every day for 36 days, orelse the positions of the foods were reversed every 3, 6 or 9 days. Where thepositions were unchanged there was a 68% choice of the complete food (i.e.selection for methionine, Chapter 8) but, as the changes became more rapid, soselection was less appropriate, being 65, 62 and 58% for the 9-, 6- and 3-daychange-over birds, respectively.
These results are not surprising given the lack of cues, other than position,to the content of methionine, which is colourless and has little taste; moving theposition confused the birds and forced them to relearn the relationship betweenposition and methionine content. The detailed results presented by Steinruckand colleagues clearly demonstrate this relearning process, with a temporarydecrease in the proportion of complete food eaten following each change-over.
Heifers learned more quickly than cows in which of two hoppers to findfood after two 10-min tests/day for 5 days (92% of heifers, 23% of primiparouscows and 54% of cows after their second calving) (Kovalcik and Kovalcik,1986). Six weeks later, tests were resumed and 77% of cows – but only 46% ofheifers – went straight to the correct feeder. Thus, the process of learning wasquicker in heifers but they forgot sooner than did cows, which is in generalagreement with learning at different ages in other species. When cows have topush open a Calan door to obtain food, they learn within about 24 h of ‘their’door being changed.
To determine whether cattle use visual cues to track food locations, steerswere trained to associate traffic barricades and traffic cones with high- and low-quality foods, respectively, in either fixed or variable locations (Howery et al.,2000). When the two foods were placed in different locations in different tests,and no visual cue was offered, animals succeeded in finding the food significantlyless often than when cues were given and/or the foods were in the same locationsin successive tests. This is a clear indication that cattle can learn to associatevisual cues with different qualities of food and thereby forage more efficiently.
140 Chapter 6

Sheep and goats were given a high-quality food in one arm of a T-maze,and animals of both species tended to return to the food-providing arm on asecond occasion (Hosoi et al., 1995). As this could be attributed to a stronglateral preference, in further studies a low-quality food was placed in the otherarm. Goats, but not sheep, responded by increasing the frequency of shiftingon the second free choice, particularly when the first choice was a losing one.The authors concluded that foraging behaviour may be more stronglyinfluenced by negative experiences than by winning ones, and that this shouldbe incorporated into foraging theory.
Thus, even though not directly aware of the presence of food or able todifferentiate between two foods on the basis of their sensory properties,animals can remember the likely spatial position of appropriate foods, based onprevious experience. It is not helpful to deliberately confuse animals byswapping the position of the two foods daily in choice-feeding experiments, apoint apparently missed by some researchers!
‘Palatability’
The features of a food material that are sensed before it is swallowed, of whichan animal is consciously aware, are often collectively called the ‘palatability’ ofthat food. Palatability is often confused with acceptability or preference, but itcannot be considered to be simply a quality of the food because it depends soheavily on the experience and metabolic status of the animals in question. Agood definition is: ‘a response measure which is based on the outcome of thecentral nervous system’s integration of taste and internal-state signals combinedwith cues arising from previous associations’ (Grill and Berridge, 1985).
There is no single way to measure palatability, but several methods have beenused: (i) intake tests, which often give very different results depending on whetherthe two foods are offered simultaneously or sequentially; (ii) brief exposure testswith minimal ingestion; (iii) initial rate of eating on first exposure (lick analysis); (iv)oesophagostomy or stomach fistula tests; and (v) taste reactivity observations.
It might be thought that a palatable food will be eaten in greater quantitiesthan an unpalatable food. When a flavour is added to the single food on offer,there is sometimes a short-term increase or decrease in intake but rarely aprolonged change. It is not realistic to expect to be able to stimulate voluntaryfood intake in the long term simply by changing the flavour of the food.
For example, the addition of Bitrex (the most bitter substance according tothe human palate) to the food being offered to growing pigs immediatelycaused the animals to stop eating (Blair and Fitzsimons, 1970). However, aftera few hours they became hungry, sampled the food again but finding it stillvery ‘unpalatable’ avoided it for a while longer; eventually their hunger got thebetter of them and, as there had been no adverse consequences of nibbling itearlier, they increased their intake, returning to normal within 3 days of thestart of addition of Bitrex.
Thus, a completely ‘unpalatable’ food had become ‘palatable’ within a fewdays. Although not tried in the reported experiment we can be confident that,
Learning about Food: Conditioned Preferences and Aversions 141

were the same animals to be confronted with Bitrex-adulterated food at somelater date, they would recognize it as safe and eat it readily.
Greenhalgh and Reid (1967) developed an ingenious method ofseparating how much of the difference between intakes of different diets is dueto post-ingestional differences rather than to differences in palatability. Twofoods of very different sensory and chemical properties were offered to sheepwithout involving any differences in the composition of the digesta. This wasdone by matching the weight of food eaten voluntarily with an equal weightgiven through the ruminal fistula. When straw was given both by mouth and byfistula, the total intake was 13.8 g/kg0.73/day and the digestibility of organicmatter (OMD) was 0.41; when dried grass was given by both routes, intake was59.4 g/kg0.73 and OMD was 0.74. When equal amounts of the two foods weregiven, one by mouth and the other by fistula, the digestibility was intermediate(0.55–0.57) but the voluntary intakes were very different: 23.5 when straw wasgiven by mouth and 48.8 g/kg0.73 when dried grass was given by mouth. Thiswas said to demonstrate a powerful influence of palatability on voluntaryintake.
However, given the discussion above, it is quite possible that these sheepwere eating according to learned rather than to innate preferences, as they hadexperienced eating straw before the experiment started. As the experimentprogressed they ate less straw – they learned that it provided less nutrients thanthe dried grass once they had had a chance to experience the effects of eatingboth.
An example of the lack of correlation between intake when a choice offoods is on offer and when they are given singly is the work in which pregnantewes were offered one of three silages or else free choice of the three silages(Forbes et al., 1967). Silage B was of poor quality but was eaten in quantitiesonly slightly less than silages A or C by ewes which had access to only onefood. However, the group that had access to all three ate equal amounts ofsilages A and C but very little of silage B.
Gherardi et al. (1991), studying the short- and long-term responses inintake of sheep to additions of chemicals thought to influence palatability,concluded that palatability effects are not important in determining the level atwhich a single forage is eaten, but can have marked effects on the relativeintakes when two forages are on offer. Addition of butyrate plus monosodiumglutamate increased preference for a forage by sheep, while magnesium oxidehad the opposite effect.
Adding a pleasant flavour can increase the preference for a particular food,and there is sometimes a short-term increase in intake or rate of eating.Unusually, a prolonged 10% increase in silage intake was obtained with theaddition of Simax 100 (a mixture of several flavours with a predominantlyorange taste) (Weller and Phipps, 1989) but, more commonly, animals revert totheir former level of intake once they learn that there has been no change inthe nutritive value of the food.
Sudden changes in the formulation of concentrate feeds, even though thenutrient composition is unchanged, make cows hesitant in eating the new foodand suspicion falls on the manufacturer. If the same flavour is included in all
142 Chapter 6

batches of food then changes in the underlying formulation go unnoticed, rateof eating is not affected and the farm staff are kept happy. For example, whenrapeseed meal was included in a dairy supplement there was a reluctance toeat on the first few occasions, but this was largely prevented by inclusion of aconstant flavour (Frederick et al., 1988).
Drinking water can be used to carry nutrients to cows; ammonium acetatewould provide both non-protein nitrogen and an energy source, but it is notreadily accepted by some cows. Jackson et al. (1968) found that addition ofmolasses, sodium cyclamate or ethyl acetate caused cows to drink morewhereas saccharin, vanilla or aniseed gave little or no improvement.
Thus, in summary, the extent to which an animal finds a particular food‘palatable’ depends on innate factors (e.g. bitter/sweet) and on the previoushistory, if any, of interactions between the animal and that food, or foods withsimilar sensory properties.
Conclusions
Animals are highly motivated to eat and drink, and this motivation is increasedas metabolic demands increase. All the senses are used in the identification offood and the absence of one sense does not, therefore, result in a loss ofselective or ingestive ability. However, while mammals rely primarily on taste toidentify foods, birds use vision, and quickly learn to associate the sensoryproperties of a food with the metabolic consequences of eating that food.
Thus, the term ‘palatability’ is difficult to define as it depends not only onthe taste and appearance of the food, but also on the nutrient requirementsand history of the animal. For example, a food that is initially preferredbecomes aversive when its ingestion is coupled with injections of a toxicsubstance. Such learned aversions and preferences are long-lived and are likelyto influence animals’ behaviour for many years.
In addition to innate preferences/aversions and those learned by theanimal from its own experience, it can also learn from conspecifics without everhaving itself ingested the food in question. Thus, a mother can pass on to heroffspring some information about food before the young have themselvesstarted to eat solid food.
As will be made clear in Chapter 13, these learned associations form thebasis of the ability of animals to make appropriate selections when a choice offoods is offered, and may also play an important part in determining howmuch of a single food an animals eats, i.e. its voluntary food intake (seeChapter 10).
Learning about Food: Conditioned Preferences and Aversions 143

7 Diet Selection: Principles
In the previous chapter we have seen the overwhelming evidence that animalscan learn to associate the taste, smell or colour of a food with the feelings theyexperience after they have eaten that food. It was hinted that this is a powerfulability, which allows animals to select from a range of foods to best meet theirnutrient requirements, and it will be proposed later that learning is also ofimportance in determining how much they eat if only one food is available.
This chapter reviews the evidence for diet selection, defines the prerequisitesfor animals to demonstrate its occurrence and discusses the possible mechanismswhereby animals can make nutritionally wise food choices. The following chapterdeals with effects of differences between animals, between foods and in differentenvironments on food choice and shows how diet selection might be exploited infarming practice, while Chapter 13 deals with appetites for specific nutrients.
In modern farming systems, animals are typically presented with a singlefood. This is not a situation in which most species of birds and mammals haveevolved and must be considered unnatural. The ancestors of our farm animalshad the opportunity to select from a range of available foods and obviouslywere able to select a mixture that allowed them to grow and reproduce. It ispossible that by eating at random from a variety of foods they obtainedsufficient nutrients to survive, but this would not be enough in some situations,e.g. when toxic food sources make up a significant part of what is available. Itshould be recognized that some species of animal have evolved to eat only asingle food, i.e. they have an innate inflexible diet selection. However, manyspecies eat a variety of foods and they need to learn the properties of thesefoods.
Because animals do not always select from between two or more foods onoffer to produce what the observer considers to be an optimum mixture, therehas been considerable scepticism as to whether the ability to select iswidespread, either across a wide range of species or between food andphysiological situations. Sih and Christensen (2001) have collated information
144 © J.M. Forbes 2007.Voluntary Food Intake and Diet Selection in Farm Animals 2nd Edition (J.M. Forbes)

on what they call optimal diet theory (ODT) from across the animal kingdomand concluded that:
Contrary to our predictions, forager types (invertebrate versus vertebrateectotherms versus vertebrate endotherms) did not differ significantly in their fit toODT. Apparently, even organisms with relatively low energy demands or withsimple information gathering and processing abilities (e.g. insects, snails or evenprotozoa) are capable of adaptive foraging.
It is justifiable, therefore, to start from the assumption that farm animalshave the characteristics necessary to enable them to select wisely betweendifferent foods. Sometimes it is the observer’s prejudices that hinder the correctinterpretation of observations made in experiments or in the wild (Forbes andKyriazakis, 1995).
There are currently new opportunities in diet selection, both from scientificand commercial points of view. The realization that it is necessary for animalsto be able to differentiate between foods with different nutrient compositions bycolour, taste and/or position, and that they need to be able to learn to associatethe sensory properties of foods with the metabolic consequences of eatingthem, has made it possible to envisage a learned appetite for each of theessential nutrients. Thus, there is now more certainty that if animals can betaught an appetite then this can be used in a choice-feeding situation toimprove the balance between their nutrient requirements and their nutrientintake.
Most of the raw materials used in animal foods have concentrations ofavailable energy within a fairly narrow range, 9–13 MJ/kg DM, whereas thecontent of nutrients such as protein, minerals and vitamins varies over a muchwider range. An animal can control its energy intake by varying the amount ofDM it consumes but can then only control its intake of nutrients independentlyof energy if it has access to two or more foods that differ in the content of thenutrient in question. Because of its quantitative importance, high cost and thepolluting nature of its excretory products, protein has been widely studied interms of diet selection and is used as evidence for diet selection in this chapter.An appetite for protein seems to be very primitive in evolutionary terms, astrained locusts eat more of a high-protein food after preloading of carbohydrate,and vice versa.
Some species of animal rely on a narrow range of foods for their sustenance,and the recognition of these food sources is genetically predetermined. Otherspecies will sample a wide range of potential foods and must learn by experiencethose that are palatable and nutritious. Whereas deficiency in an animal of anutrient for which there is a specific appetite will induce increased preference fora food that contains that nutrient, the reverse is not necessarily the case: that is,intake of a modestly greater amount of that nutrient than is necessary is notdetrimental and may not induce a reduction in selection for a food containing itin high concentrations.
Taste and smell are the most important senses in feeding situations; visual andauditory cues are not normally part of the food experience and so are notconditioned as well in mammals, while the reverse is true for birds (see Chapter 6).
Diet Selection: Principles 145

Theory of Diet Selection
The principles of diet selection have been outlined by Emmans (1991) andillustrated by Fig. 7.1. When two nutrient properties of foods are considered,the proportions of two foods necessary to meet an animal’s requirements forboth nutrients can be shown by a straight line (Fig. 7.1a). The two dimensionscould be energy and protein. Foods A and B are both within the subspacerepresenting adequacy, and any mixture of the two would satisfy the animal’srequirements; choice between these two foods could therefore be random oraccording to the hedonic properties of the foods interacting with innate orlearned preferences for colour, taste or other non-nutritional characteristics.Food C has too much protein and foods D and E too little protein. Offered achoice between (C and D) or (C and E) the animal could choose proportions ofthe two to make a balanced diet. Offered only D and E it could not avoidunder-eating protein.
In Fig. 7.1b, the three dimensions are protein, energy and minerals. FoodsC, D and E lie outside the adequate subspace, but a line between C and Dpasses through this area so that an appropriate mixture of the two would beadequate; the line between C and E does not pass through the area so there isno mixture of these two that would be adequate. A choice between (A or B)and (C, D or E) requires that A or B are predominantly eaten if requirementsare to be met. Thus, to test the hypothesis that animals make selections fromtwo or more foods according to their nutrient requirements, it is necessary for atleast one of the foods to have a composition outside the adequate subspace.
Four nutrients are represented by the tetrahedron in Fig. 7.1c, in which thefour vertices represent energy, protein, calcium and phosphorus. There may bea few foodstuffs, such as A and B, that contain the right ratios of all four, but itis more likely that two, three or four raw materials will be required to satisfy ananimal’s requirements.
This theory of what animals should eat is realistic only if we know therequirements of the animal(s) in question. We can obtain an estimate of energyand protein requirements, for example, from results of experiments in otherenvironments, i.e. standard textbooks or tables of nutrient requirements.However, to define the responses to nutrients under the conditions under whichchoice-feeding experiments are to be carried out, it is preferable to conductadequate experiments with single foods of a range of compositions, but this isnot often done. Furthermore, conclusions that animals are selecting foods witha nutritional purpose are strengthened if their requirements change with time,and this change is reflected in appropriate adjustments to the proportions ofdifferent foods chosen. The change with time could be that naturally occurringduring growth or an imposed change, such as one of temperature or hormonalmanipulation of metabolism (see below).
One of the difficulties in studying individual variation in food choice is thecomplexity of graphs with many animals’ results. The ‘diet selection pathway’method of plotting food choice data (Kyriazakis et al., 1990) is a way of clearlyshowing the behaviour of individuals in a compact manner. The cumulativedifference between the intakes of two foods (food A – food B) is plotted against
146 Chapter 7

the cumulative total intake of the foods, i.e. a horizontal line represents equalintakes of the two foods; a line that increases shows the animal eating more offood A, while one declining shows a greater intake of food B. It needs to beemphasized that this method of presentation of daily diet choice provides abroad picture of each animal’s choices, but does not draw particular attention todaily variations in the proportions selected. Figure 7.2 shows an example of dietselection pathways for eight piglets offered two foods containing 291 (HP) and155 (LP) g CP/kg fresh matter for 3 weeks from weaning (Dalby et al., 1995).
Diet Selection: Principles 147
Fig. 7.1. Diagrammatic representation of mixtures of foods required to satisfy an animal’sdemands for nutrients; (a) two nutrients; (b) three nutrients; (c) four nutrients. The circled area isthat in which the animal’s requirements are satisfied. A–F are foods in positions which representtheir content of the two, three or four nutrients. See text for details (from Emmans, 1991).

The first point to be noted is the increased horizontal distance betweenpoints marking daily intakes from left to right. This shows the increase in totaldaily intake as the piglets grow; in the first few days after weaning (4 daysbefore the first point on this graph) intake increases rapidly as the pigs becomeaccustomed to their surroundings, including food and water. A secondimportant point is the variation in total intake between animals (the position ofthe 25th day’s intake on the horizontal axis varies from 12 to 20 kg). Also, thereare large differences in the shapes of the selection pathways. Initially, oneanimal starts by eating almost all HP (pathway close to +45º), three eatapproximately equal amounts of the HP and LP (pathway close to horizontal)and four eat mainly LP (pathway close to –45º).
The first-mentioned animal, after 6 days, changes from mostly HP toapproximately equal intakes of HP and LP; after about 14 days into theobservation period it changes to eating predominantly LP, as do two of the threethat started by eating roughly 50:50. The downward trajectories eventuallyachieved by all but one animal are approximately parallel, showing a similar,low, proportion of HP eaten by these animals. We can suggest that each piglearned that its needs were best met by taking a low proportion of HP, butdifferent individuals learned this at different rates. At 10 days, when choice hadstabilized, the mean proportion of HP eaten was 0.25 of total (giving a dietcontaining 189 g CP/kg), and this declined to 0.20 (182 g/kg) by day 25.
Additional discussion of diet selection theory is provided in Chapter 10.
148 Chapter 7
Fig. 7.2. Diet selection pathways for eight piglets with access to high- (H) and low- (L)protein foods for 25 days starting 4 days after weaning (from Dalby et al., 1995).

Evidence for Diet Selection: Protein as an Example
Considerable evidence has accumulated for the ability of laboratory animals tomake directed selection from a choice of foods and, in recent years, suchevidence has also become available for farm animals. Probably the best-knownexample is the choice made by animals offered two foods with different ratiosof protein:energy content, and this will be used to introduce the subject in thenext section.
Poultry
There were numerous reports from the first half of the 20th century that hens,given a choice between foods, could select a balanced diet from amongstseveral imbalanced foods, and free-choice feeding has received attention eversince. Laying hens, pullets, growing broilers and growing turkeys all show theability to select an adequate diet from a choice of two or three foods that areindividually imbalanced (Forbes and Shariatmadari, 1994). In most cases, thechoice has been between one food that is clearly higher in protein content thanrequired and another lower in protein (these will be called HP and LP,respectively), but Ahmed (quoted by Rose and Kyriazakis, 1991) showed thatbroilers selected a diet from a range of nine different foodstuffs that providednutrients in similar proportions to those normally recommended.
On a commercial scale, choice feeding has given mixed results in layers,though it has proved to be successful in broilers (see Chapter 8). The opinion hasbeen expressed, however, that layers might choose better than broilers becausethe broilers have so little time to learn how to make the appropriate choices.
As an example of diet selection for protein by broiler chickens, the experi-ment of Shariatmadari and Forbes (1993) is presented. Pairs of foods differingin protein content were offered to broilers from 4–9 weeks of age. The results,shown in Fig. 7.3, show that, where possible, the birds chose proportions of thetwo to give themselves a diet containing 195–228 g protein/kg, i.e. the proteincontent known to be optimal for growth (see Chapter 12). When both foodshad protein contents below this range, the birds ate predominantly from thehigher one and, when both foods had protein contents higher than this range,they ate mostly from the lower, thereby selecting a diet close to the optimum.
Note that even when the bird has learned that one food provides sufficientprotein (the last two treatments in Fig. 7.3), it still samples the other food,which provides a gross excess of protein. This is presumably to ensure that achange in the quality of an extreme food does not go undetected and to allowfor novel foods to be sampled with relative safety.
Pigs
There is considerable evidence for directed selection for protein, and this isdealt with in more detail in Chapter 13. As an example, the work of Kyriazakis
Diet Selection: Principles 149

et al. (1990) included choices between two foods with different proteinconcentrations. When one food contained more, and the other less, than thelikely optimum protein level, the pigs selected a mixture which gave almostidentical overall protein contents of about 205 g CP/kg (see Fig. 7.4). Whenboth foods had less protein than required (125 and 171 g CP/kg, respectively),more was eaten of the one with the higher protein level; it is, perhaps,surprising that they did not eat entirely or almost entirely from the higher-protein food. When both foods provided too much protein, intake was almostexclusively from the one with the lower protein content, suggesting a strongdrive to avoid an excessive protein intake. As shown in Fig. 7.2 (Dalby et al.,1995), there is variation in the selection pattern between a low-protein food (L)and one high in protein (H) by different animals.
In order that animals can make sensible choices between foods they mustbe able to differentiate between them before they eat them, and the foods usedhere were clearly different in appearance, smell and taste because of thedifferent ingredients used to achieve the different protein contents. These pigshad the opportunity to balance both energy intake (as a result of their totalintake) and protein intake (as a result of the choice they made between HP andLP), whereas pigs given a single food could only meet their energy and proteinrequirements exactly if the food was perfectly balanced. Even if the diet allowedthem to meet their requirements for both energy and protein at one point intime, the same food would no longer be well balanced some time later when thegrowing animal’s protein requirements, relative to energy requirements, hadfallen.
150 Chapter 7
0
200
400
600
800
1000
65:115 65:225 115:225 225:280 280:320
CP contents of LP and HP (g/kg)
112 217 227195 282
Pro
port
ion
chos
en (
g/kg
)CP content of chosen diet (g/kg)
Fig. 7.3. Proportions of HP (solid bars) and LP (open bars) chosen by broiler chickensoffered pairs of foods varying in protein content. The CP contents of the two foods on offerare shown at the bottom of each column and the resulting CP content of the diet chosen atthe top (from Forbes and Shariatmadari, 1996).

Thus, an animal offered a single food has to compromise for much of itslife by either: (i) controlling its energy intake and suffering the consequences ofeating too much or too little protein; (ii) controlling its protein intake andsuffering the consequences of eating too much or too little energy; or (iii)compromising between the two. We will consider in Chapter 10 which of theseis the most likely.
Cattle
Experiments with several different pairs of foods given to different individuals,as described elsewhere in this chapter for chickens, pigs and sheep, have notbeen performed, but a number of demonstrations of the ability of dairy cows toselect for CP have been provided by Tolkamp and colleagues, and are detailedin Chapter 13. These have offered two foods of mixed silage and concentrates,the composition of the latter used to manipulate protein content.
A different approach to the study of cows’ ability to choose appropriately forprotein was adopted by Lawson et al. (2000), mindful of the difficulties inpractice of providing two mixed foods for large numbers of cows. They offered24 cows free access to grass silage and, for 3 weeks, a choice between differentlyflavoured concentrates with 90 or 39 g digestible undegradable protein(DUP)/kg DM, up to a maximum of 5.4 kg DM/day, via computer-controlledout-of-parlour feeders such as could feasibly be provided on a commercial dairyfarm. The amounts of the high-protein food eaten as a proportion of totalconcentrate intake were 0.47, 0.45 and 0.50 for the 3 consecutive weeks, with amuch higher standard deviation in the first week (0.372) than in the second(0.265) or third week (0.252).
Diet Selection: Principles 151
0
200
400
600
800
1000
1200
125:171 125:217 125:266 171:217 171:266 217:266
CP contents of LP and HP (g/kg)
CP content of chosen diet (g/kg)
160 208 204 202 205 218
Pro
port
ions
cho
sen
(g/k
g)
Fig. 7.4. Proportions of HP (solid bars) and LP (open bars) chosen by growing pigs offeredpairs of foods varying in protein content. The CP contents of the two foods on offer are shownat the bottom of each column and the resulting CP content of the diet chosen at the top (fromKyriazakis et al., 1990).

This greater initial variation in selection is shown clearly in Fig. 7.5, whichincludes the diet selection pathways for eight of the 24 animals. Two cows atealmost entirely HP; another cow ate almost only LP for the first 6 days; theremaining five ate closer to equal amounts of HP and LP. In all animals butone, however, the selection paths eventually became approximately horizontal,confirming that approximately equal amounts of LP and HP were being eatenonce the animals had become accustomed to the choice-feeding situation (andhad learned to associate the sensory properties of each food with the metabolicconsequences of eating it). The fact that the preference ratio was notsignificantly different from 0.5 could be due to an indifference on the cows’part as to which concentrate they ate (no selection) or because a roughly equalmixture of the two provided an optimal diet.
Based on previous research on factors affecting food choice in bothruminants and non-ruminants, it would be expected that individuals with highprotein requirements would select a higher proportion of HP than animals withlow protein requirements. The major need for protein in lactating cows is tosupport milk protein output, so choice between concentrates – expressed as theproportion of HP in the total intake of concentrates – was regressed againstmilk protein output immediately before the period of choice feeding began.
It can been seen from Fig. 7.6 that there was a positive relationship (P <0.05); the cow that ate only HP was the one with by far the highest yield ofmilk protein. Because the regression was carried out with milk protein outputmeasured before the choice-feeding period, when cows were given a single
152 Chapter 7
Fig. 7.5. Diet selection pathways for eight lactating cows with access to high (HP) and low(LP) protein concentrates for 21–29 days in mid-lactation. See text for interpretation (fromLawson et al., 2000).

balanced concentrate food, this relationship can be interpreted as causal, i.e.the higher pre-existing milk protein output driving the selection of a higherproportion of HP concentrate.
Silage DM intake was significantly higher when, in other periods of theexperiment, LP concentrate was offered alone (14.7 kg/day) than it was when HPwas given (14.1 kg/day) or when there was a choice (14.2 kg/day). Milk yield wassignificantly reduced when the concentrate was LP and body condition scoresignificantly increased compared with the HP or choice treatments. This suggeststhat cows given LP concentrates were trying to increase their protein intake byeating more silage, but that the increase was insufficient to provide the proteinintake needed to maintain milk protein output and provided more energy, whichwas utilized for body fat deposition.
Sheep
Growing lambs have been observed to switch from little discrimination amongfoods of different digestible energy concentrations, when first introduced tothem, to a preference for high-energy foods as they learned the consequences ofeating each one (Glimp, 1971). More recently, it has been shown that sheepselect proportions of low- and high-protein foods to give a protein intakematched to their presumed requirements for growth (Kyriazakis and Oldham,1993).
Figure 7.7 shows the results of an experiment in which individually pennedgrowing lambs were offered a high-protein food containing 235 g CP/kg and alower-protein food containing either 78, 109, 141 or 172 g CP/kg. In the casesof the first three treatments, the lambs chose a mixture providing CP in the
Diet Selection: Principles 153
0
0.2
0.4
0.6
0.8
1.0
0.4 0.6 0.8 1.0 1.2 1.4
Milk protein output (kg/day)
Pro
port
ion
of H
P in
tota
lco
ncen
trat
e in
take
Fig. 7.6. Relationship between milk protein output and the proportion of a high-proteinconcentrate selected when given in choice with a low-protein concentrate (from Lawsonet al., 2000).

range of 130–160 g CP/kg, i.e. within the optimum range. When the low-protein food contained 172 g CP/kg they avoided it almost completely,apparently to avoid a toxic excess of nitrogen in the rumen. The motivation forselection of an adequate protein concentration is strong, as sheep are willing tomake at least 30 responses in an operant-conditioning situation to obtain afood reinforcement in order to obtain a ‘balanced’ diet (Hou et al., 1991a).
An attempt to resolve the question as to whether ruminants select diets tooptimize rumen degradable protein (RDP) intake was made by James et al.(2001), who fed sheep on basal foods formulated and demonstrated to bedeficient, adequate or excessive in RDP, and then gave choices between theirbasal food and the same food with urea (which provides RDP) added. In everycase the animals ate more of the urea-supplemented food, even though in thecases of the RDP-sufficient and -excessive foods this provided them with a greatexcess of RDP. Clearly, these sheep were not managing to control their intake ofRDP in order to prevent an excess.
Prerequisites for Diet Selection
Against the background of clearly demonstrated abilities of animals to select ina nutritionally appropriate manner when offered a choice of foods, there arenumerous examples of animals that appear not to be making appropriatechoices (from the standpoint of the human observer), implying that their foodpreferences are governed by factors other than, or additional to, nutritionalwisdom (ability to match the foods selected to provide the correct balance ofnutrients) (Forbes and Kyriazakis, 1995). It is therefore necessary to examinesuch cases in order to provide guidance on good practice in carrying outstudies on food choice and diet selection.
154 Chapter 7
CP content of diet chosen (g/kg)
0
200
400
600
800
1000
CP content of LP (g/kg)
131 133 158 178
78 109 141 172
Pro
port
ions
cho
sen
(g/k
g)
Fig. 7.7. Selection of crude protein (CP) by growing lambs offered HP (235 g CP/kg) and LPfoods. The CP contents of the LP foods are shown at the bottom of each column and theresulting CP content of the diet chosen at the top (from Kyriazakis and Oldham, 1993).

The need for sensory differentiation
Clearly, animals must be able to differentiate between two or more foods if theyare to select proportions in order to make up a balanced diet. If the nutrient inquestion is required only in trace amounts, and especially if it is colourless, it isnecessary to give a cue by means, for example, of artificial flavouring and/orcolouring. This is not usually a problem with foods differing markedly in proteincontent, but is surely necessary when a single amino acid is deficient in onefood and in excess in the other.
Given that there are these sensory differences, the animal might have aninnate preference for one food, e.g. because of its sweet taste. However,nutritional value is not always closely correlated with sweetness, so that theassociations the animal learns, between sensory properties and nutritive value,are much more valuable to it than innate preferences. Thus, a bitter flavourimparted to food will cause initial rejection but, if the nutritional value remainsbalanced, then normal intakes are resumed within a few days. A good exampleof this is the lack of effect of inclusion of Bitrex, the most bitter substanceknown to man, on the long-term intake of food by pigs (see Chapter 6). Thus,there is no need to be concerned about the exact nature of the flavours used todifferentiate between two foods, as animals soon learn to associate them withthe nutrient yields of the foods in which the flavours are incorporated and toeat for nutrients rather than just for taste.
A clear example of the need for sensory differentiation and learning isprovided by work with young broiler chicks (Kutlu and Forbes, 1993c), inwhich mild heat stress increases the requirements for ascorbic acid (vitamin C),offered a choice between a normal food with no supplementary ascorbic acidand an exactly similar food containing 200 mg/kg of protected ascorbic acid.When neither food was coloured, the birds did not differentiate between themand ate at random. When each food was given a different colour (red orgreen), however, and the birds were trained to associate each colour with thenutritive value of the food by giving them separately in half-day periods for 6days, they subsequently selected significantly more unsupplemented food whenin the thermoneutral environment and significantly more supplemented foodwhen in the hot environment. A sudden change in environmental temperaturewas followed by a gradual change in the proportions of the two foods eaten asthe birds learned that the red (or green) food was no longer the one that madethem feel metabolically most comfortable.
In summary, farm animals can select a diet appropriate to their metabolicneeds as long as the foods offered are clearly differentiated by flavour or colourand the animals have the opportunity to learn the nutritional differencebetween the foods.
Training and experience
In order for an appetite for a specific nutrient to develop, it is necessary foranimals to learn to associate the sensory properties of each food with its
Diet Selection: Principles 155

content of the nutrient in question. In many cases they will learn about twofoods if they are introduced simultaneously, but they may learn more quickly ifeach food is given in turn for a few days. It is evident that some form of‘education’ about the foods on offer prior to a choice may aid animals in theirlater discrimination between foods, but in many cases no advantage of suchtraining has been noted. In group situations, there may be opportunities foranimals to learn about food in other ways, and ‘training’ periods may be lessimportant than for individual animals. A training period may be a hindrance tochoice feeding being accepted commercially, due to the high levels ofmanagement involved.
Poultry
While large farm animals have been given alternating days on two foods to beoffered later as a choice, half-day alternating periods have been used for broilerchickens, on the basis that smaller animals, with a higher rate of turnover ofnutrients, need shorter periods of exposure to learn the characteristics ofdifferent foods. It takes hens only a few hours to recognize a change in proteincontent of the food.
Training birds by accustoming them to whole grains at an early ageappears to confer benefits at the later stages of growth, in terms of ability toselect foods to meet nutrient requirements. Broilers trained from 10–21 daysafter hatching by giving whole sorghum and protein pellets showed nodifference in weight gain compared with complete-fed or untrained choice-fedbirds, but the trained birds were significantly more efficient because theinexperienced choice-fed birds ate much greater excess of the proteinconcentrate in the first 10 days of the experimental period than those withprevious experience (Covasa and Forbes, 1993).
No effect was found on subsequent selection for whole wheat of time ofaccess to wheat nor deprivation during the rearing phase, but those birds givenwheat alone for part of each day during rearing ate significantly more wheatduring the growing phase (Covasa and Forbes, 1995a). They had heavierproventriculus and gizzard than those given mixed wheat and starter crumbsduring the rearing phase, but growth and abdominal fat pad weight wereunaffected by treatment. Thus, it may be beneficial for subsequent dietselection to remove the standard food while offering whole grains to youngchicks during the training period.
Pigs
Kyriazakis et al. (1990) trained growing pigs to recognize the differencebetween HP and LP by offering them as single foods on alternate days for1 week before offering both in a choice-feeding situation but they did notcompare their performance with untrained animals, so whether it is helpful ornecessary is not known. Newly weaned pigs do not seem to benefit, in terms ofsubsequent ability to select between HP and LP, from a period of training suchas that advocated by Kyriazakis et al. (Dalby et al., 1995). Whether they were
156 Chapter 7

given alternate daily exposure to the foods for 6 days, given one for 3 days andthe other for 3 days or given free choice for 6 days, there was no difference infood intake or growth rate over the next 21 days of free-choice feeding,compared with controls fed a single, adequate food throughout, but all choice-fed pigs ate significantly less protein than controls.
Comparisons have been made between selection for protein by trained anduntrained growing pigs (Morgan et al., 2003). Groups of four pigs were formedcontaining either an individual trained to select between two foods or anuntrained control animal, and all were offered LP and HP foods. Over a 2-weekperiod there was no effect of the trained pig on the growth rate. However, for thefirst few hours, the groups with the trained pig were more consistent in selecting abalanced diet close to that of the trained pig, while the untrained groups showedmuch more variation initially, but stabilized within 3 days. Thus, although thisform of training does influence piglets, the untrained piglets learn to achieve abalanced diet so quickly that there is no effect on long-term performance.
Cattle
In a study of training in dairy cows, they were offered two mixtures of grasssilage and concentrates, one with a high concentration of protein, the other lowin protein (Tolkamp and Kyriazakis, 1997). Some cows were offered both at thestart of the experiment, while others had only one food for the first 3 daysfollowed by just the other for the next 3 days. Yet other animals had two suchperiods of alternate access before being offered both as free choice. After thefirst week, untrained cows selected 0.66 HP, significantly different from random.From the third week onwards, those given one or two periods of 3-days accessto each food alone established similar diet choice: 0.70 HP. It was concludedthat, under the circumstances tested, training was not required for cows todistinguish between two mixed foods with different calculated MP/ME ratiosand to select proportions significantly different from random.
Identifying ‘nutrient requirements’ of animals (the need for adequate control)
For the proper design and interpretation of diet selection experiments, we firsthave to be clear about what food resource(s) it is we are studying. Then we needto formulate foods that provide a greater and a lesser ratio of resource:energythan the animal requires. This entails knowing what the animal’s ‘requirement’ isfor the resource in question and for energy, which typically entails the feeding ofa range of single foods with different ratios of resource:energy (made as mixturesof the two foods to be given as a choice), building up a dose–response curve thatallows us to define the optimum.
In many other diet selection studies, the optimum resource:energy ratio hasbeen taken from the literature, which may be satisfactory in the case ofintensively managed animals in which genotype, diet and environment are wellcharacterized. It can, however, be easy to make unwarranted assumptions. It isgenerally considered, for example, that chicks do not require supplementary
Diet Selection: Principles 157

ascorbic acid in their diet, yet they choose a significant proportion of asupplemented food (see Chapter 8), which might be taken as evidence forunwise selection had it not been demonstrated that, under the conditions of theexperiments in question, dietary ascorbic acid was beneficial to growth andfood intake, especially at high environmental temperatures.
Just because two foods offered in a choice situation intentionally differ intheir content of a nutrient, e.g. protein, according to some calculation or limitedanalysis, does not restrict animals to selecting only on the basis of that nutrient.This is especially true for protein, where it is notoriously difficult to formulatefoods with different protein contents but the same ratio of amino acids. Pigsgiven choices between pairs of foods containing 220/180, 220/140, 220/100 or180/100 g CP/kg grew well and efficiently, but it was found that the isoleucinecontent of the chosen diet was almost exactly what would be predicted foroptimal growth, suggesting that the pigs might have been selecting in order toobtain the correct amount of this most limiting amino acid rather than CP asintended (Bradford and Gous, 1991). Proper interpretation was not possible,therefore – a situation existing with most protein selection experiments.
Even when diets selected by choice-fed animals are compared with‘control’ diets, care must be taken not to draw unwarranted conclusions. Forexample, broiler chicks given free access to foods containing 456 and 86 gprotein/kg selected proportions that gave the same growth as controls(Kaufman et al., 1978). As they grew, the proportion of HP taken in the diet fellto give a decline in the protein content of the selected diet from 250 to 140g/kg. The authors pointed out that this was a lower protein content than thesingle food given to controls, implying that the birds had not selectedappropriately but, as the control food contained an excessive amount ofprotein (265 g/kg), this was not surprising.
Previous nutritional history
Animals rendered deficient in a nutrient will, when given access to a choice offoods one of which provides an excess, eat more of that food than do non-deprived control animals. For example, pigs made fat through feeding a low-protein food subsequently selected a much higher protein content whenchoice-fed (233 g CP/kg) than those previously given a high-protein food (175g CP/kg); this diet selection enabled them to deposit fat at a slower rate andprotein at a faster rate than the latter animals and return their bodycomposition to a ‘desired’ one (Kyriazakis and Emmans, 1991). It must also beborne in mind that gender influences growth potential and that males chose adiet higher in protein than did females (228 versus 181 g CP/kg).
As the nutrient requirements of animals vary with stage of growth, gender,breed and nutritional history, so diet selection should not be expected to bestatic or uniform across animals. Great care is needed, therefore, in decidingwhich is more ‘correct’, the choices made by selecting animals or theexpectations of the human observer, when interpreting the results of dietselection studies. The animal’s ‘target’ might be different from that assumed by
158 Chapter 7

us on their behalf; for example, choice-fed animals are often somewhat fatterthan those given a single, commercially optimal food, the implication being thatwe often ‘force’ animals to be a little leaner than they ‘want’ to be.
Concentrations of the resource being studied
It is short-sighted to provide two foods with high and low contents of thenutrient in question such that the optimum diet consists of half of one and halfof the other, because equal intakes of the two foods can be interpreted asrandom eating or directed choice where the optimal is 50:50 (see Lawson etal., 2000). Better to design foods for which an optimum mixture is well awayfrom 50:50, as in the study of Tolkamp and Kyriazakis (1997), so that astatistical comparison of the observed proportion of one food can be testedagainst the nul hypothesis of 0.5.
For animals to make nutritionally meaningful choices, all foods on offershould be nutritionally imbalanced, otherwise there is no benefit to be had inchoosing. Many experiments have offered a choice between two foods, neitherof which is demonstrably imbalanced. For example, several experiments onamino acid appetite in growing pigs have shown that the pigs could growperfectly well on either given alone so that, when given a choice between thetwo, individual animals adopted different choices and overall no significantselection was apparent.
There are instances where animals have been given a choice between twofoods in both of which the content of the nutrient under study is below theirrequirements, either due to miscalculation of their requirements or intentionally.The expectation is that the animal will consume the less limiting food (e.g. thefood with slightly lower protein over a food very low in protein) and avoid themore limiting one. With laying hens (Holcombe et al., 1976), broiler chickens(Shariatmadari and Forbes, 1993), growing pigs (Kyriazakis et al., 1990) andsheep (Kyriazakis and Oldham, 1993), animals consumed appreciable amountsof the more limiting food, i.e. more than just occasional sampling. This ispuzzling and suggests that they are confused, because neither food providessufficient protein. Choosing between two limiting foods may be more difficultthan choosing between two which can, together, provide a balanced mixture.
Environmental factors
Farm animals are easy to train in operant-conditioning situations in which theyhave to ‘work’ for a food by pressing a coloured panel. If the animal has towork harder to obtain one food than the other, then it is likely to bias selectionin favour of the food that is obtained with less effort.
Because two foods offered in choice are usually given in different troughs,sometimes one trough will be in a more favoured position than the other. Wehave observed such an effect due to the positioning of a heater for newlyweaned piglets, in which food in the trough closer to the source of heat was
Diet Selection: Principles 159

eaten in greater quantities than food further away, to the extent of biasing dietselection against the choice of an optimum diet.
Another constraint on completely free choice between foods would be ifone food were to be more difficult to obtain than the other. Ginane and Petit(2005) offered heifers a leafy (L) and a coarse (C) hay, together with a physicaland a temporal accessibility constraint given singly or combined. The physicalconstraint involved covering the trough containing L with a steel grid of 4 cmmesh size, and the temporal constraint limited the daily access time to bothhays to 4 h. The physical constraint made the heifers decrease their choice(proportion of feeding time or intake) for L regardless of access time, whereasthe temporal constraint had no significant effect on choice (see Fig. 7.8). Thepresence of mesh over food L caused a reduction in the proportion of L eatenand increased the rate at which L was eaten. Reduction in time of access from24 to 4 h reduced total food intake while increasing the rate of eating. Evenwhen they were not constrained, the heifers continued to eat some C, therebyshowing preference for a mixed diet.
160 Chapter 7
0
2
4
6
8
10
open 24 mesh 24 open 4 mesh 4
(a)
0
100
200
300
400
500
open 24 mesh 24 open 4 mesh 4
(b)
Fee
ding
tim
e (m
in/d
ay)
DM
inta
ke (
kg/d
ay)
Fig. 7.8. (a) Daily dry matter (DM) intake and (b) feeding time on leafy (open bars) and coarse(solid bars) hays when offered in a choice situation, according to physical (open or 4 cm mesh)and temporal constraints (24 or 4 h of access daily) (from Ginane and Petit, 2005).

We learn from this example that there are complex interactions betweenrate of eating and food choice that could make it difficult to interpret the resultsunless we were aware of the effects of the constraints.
Social interactions
When animals are in a group in which a social hierarchy has developed, theyoften have to compete for access to food(s). An animal low in the pecking ordermight not be able to gain equal access to both foods, while a dominant animalmight feel obliged to maintain its position by eating more of the ‘better’ food thanis optimal for its nutritional status. This situation could be accentuated when thetrough space is not sufficient for all animals in the group to eat simultaneously, sothat free and continuous access to both foods cannot be achieved. Such bias canbe overcome by keeping animals in individual pens or cages. However, it hasbeen shown in some situations that animals learn about foods more quickly whenthey are in groups than in individual cages (see Chapter 6).
We know that the behaviour of animals in groups can differ markedly fromthat of individuals, and there is strong evidence of nutritional wisdom beingpassed between individuals (e.g. mother to offspring, older to younger animals,see Chapter 6). A serious study should be made of the effect of single-penningand the social environment on diet selection, and particularly on the variationin selection between individuals. If the potential to use diet selectionmethodology to study the optimum nutrition of farm animals is to be realized,then practical problems such as optimum group size and the need for a trainingperiod need to be resolved.
Poultry
Most chicks in a choice situation begin to eat from both foods on offer within afairly short time, but there is often a minority that is slow, and there may be afew individuals who fail to select close to an appropriate diet. However, animalsliving together in a group tend to copy from each other and there is usually aleader that guides the others to the desired food. Individually caged broilers thatdid not voluntarily consume any wheat, when given a choice with a standardgrower food, immediately started to eat significant amounts when put in pairs,irrespective of whether the partner was formerly a wheat-eater or not.
Within 5 days of being given a choice between a calcium-deficient foodand calcite, broilers consumed enough calcium when kept in groups (Joshuaand Mueller, 1979). However, individual caging inhibited this ability even whenthere was visual contact between birds, but birds caged individually afterlearning to eat calcium in a group took an adequate amount of calcium.
Pigs
One of the ‘rules’ for successful choice feeding is that animals have access toboth choices ad libitum. Clearly, this will not always occur when animals are
Diet Selection: Principles 161

housed in a group situation. However if the feeding behaviour of pigs isadaptable and the nutritional wisdom ‘strong’, then pigs may wait for thetrough with the ‘right’ choice to become available.
It is difficult to separate the effects of floor space, group size and feederaccess on food intake and performance (see Chapter 17). These may also beconfounded by other factors such as floor type, straw provision andenvironmental temperature. The influence of these factors on dietary selection bypigs may be greater if entrance to only one feeder in a choice situation can begained. Thus, the number of feeder spaces available may be crucial in a choicesituation and is likely to be influenced by the group size and stocking density. Thequestion is raised as to whether pigs will wait for their choice or attempt to quelltheir hunger by eating from the feeder to which they can gain access.
Sheep
Transfer of learned aversion from mother to offspring has been demonstratedin sheep. Ewes were allowed to eat Amelanchier alnifolia (a shrub) and trained,with lithium chloride, to avoid Cercocapus montanus (also a shrub) (Mirza andProvenza, 1994). After training, lambs aged either 6 or 12 weeks were put withtheir mothers for 5 min each day for 5 days in a small pen with both foodsavailable. Trained ewes ate no C. montanus, while control ewes took equalamounts of each. The lambs were then weaned and, 7 days later, tested, atwhich time trained lambs showed a tendency to prefer A. alnifolia (79% and72% for lambs trained at 6 and 12 weeks, respectively), while lambs fromcontrol ewes showed no preference (49% and 53%, respectively).
Familiarity with straw has also been shown to increase its intake by lambsat a later date. After weaning, lambs were fed indoors on concentrates andstraw and the intake of straw was higher in those previously exposed to strawwhen with their dams, especially in the first week, than those not exposedbefore weaning.
We learn from such examples that experimental studies on diet selectionmust use animals from a homogeneous social background.
Aversive compounds: toxins
Animals learn to ignore innately aversive cues (e.g. bitter tastes) if they arepaired with essential nutrients, but such cues are usually associated with toxicsubstances, such as tannins. An example of the presence of a toxin in one foodbiasing diet selection is provided by an experiment in which growing pigs weregiven choices between an LP food, with too low a protein:energy ratio tosupport normal growth, and an HP food with an excess of protein:energy,where one food or both contained rapeseed meal, which has a bitter taste andmay contain mild toxins (Kyriazakis and Emmans, 1993).
When neither or both foods contained rapeseed meal, the choice was suchas to give an optimal dietary protein content (205 and 206 g CP/kg, respectively);however, when HP contained rape the pigs chose a diet containing 155 g CP/kg
162 Chapter 7

while, when it was in LP, they chose 271 g/kg. In other words, they avoidedrapeseed meal sufficiently to give themselves grossly imbalanced diets as far asprotein was concerned. From these results it might be predicted that rapeseed istoxic, but there was no difference in growth rate between pigs given the food highin rape and those on the low-rape food. It could be that the toxicity of rape is ofsuch low severity that, although it generates mild discomfort, this is not sufficientto depress food intake.
There are many other examples of situations in which animals have totrade off one discomfort with another (see Chapters 6 and 8). Therefore, wemust assess the likelihood that one or more toxins, inadvertently included inone food but not the other, bias results in an unexpected manner.
Physical form of food
Some foods are rendered easier or more difficult to prehend by physical treatment,and this can affect animals’ selection as one form involves more ‘work’ to eat thanothers. For example, broilers were offered maize (either whole grains, cracked orground) and a protein concentrate (43.7% CP) (Yo et al., 1997b). When maizewas fed as whole grains, the proportion of protein concentrate in the selected dietwas significantly higher (35.1%) than with cracked (29.3%) or ground maize(29.1%). Although birds could eat the whole grains faster than either the crackedor ground maize, they probably found it more difficult to swallow and digest andtherefore ate less of it than when the maize was easier to swallow.
When foods were offered to sheep in pairs, preference was strongly relatedto rate of eating when that food was offered alone (Kenney and Black, 1984).Reducing the length of straw from 30 to 10 mm increased rate of eating from5.5 to 12.4 g/min – and also the preference. With rapidly eaten foods (> 24g/min) there were no differences in preference associated with rate of eating.
These examples teach us that something as simple as physical processingof food can influence the choices animals make and this needs to be taken intoaccount, particularly when making comparisons between the results of differentexperiments.
Neophobia and familiarity
Although it was stated above that animals continue to sample even those foodsthey have learned as being imbalanced, there are many examples of animalsshowing reluctance to sample novel foods. This is particularly true if thefamiliar food(s) is fairly well balanced with regard to nutrient composition: priorexperience can be a very powerful influence in determining food choice.
Lambs show a persistent preference for the type of shrub they had accessto from 50–110 days of age, and similarly prefer either an onion- or garlic-flavoured complete food, whichever they experienced, from 30–110 days ofage (Nolte and Provenza, 1992). Therefore, familiarity can influence foodchoice but is not likely to override strong, nutritionally based preferences.
Diet Selection: Principles 163

Mechanisms of Diet Selection
Pathways are presumed to exist that transmit information concerning themetabolic effects of a food to the brain to allow development of learnedassociations with one or more sensory properties of the food. The simplestsuch pathway would be via the blood. For example, a low blood calciumlevel arising from eating a low-calcium food might be sensed by the brain,which would respond by increasing the intake of an alternative, high-calciumfood.
There have been a number of proposals as to the involvement of neuraltransmitters in the control of diet selection in rats. For example, carbohydrateintake appears to be enhanced by hypothalamic injections of noradrenalineand neural peptide Y (NPY) and inhibited by 5-HT. There is a steady rise inhypothalamic NPY concentration from birth to puberty, at a time when proteinintake increases; however, the optimal protein:energy ratio in the diet declinesduring this period (see Chapter 8), so the relationship between hypothalamicNPY and selection for protein:energy is not in the direction expected if NPY isindeed solely or mainly responsible for selection between carbohydrate andprotein.
There have also been theories of the involvement of individual aminoacids in the control of food choice. Given a choice between a tryptophan-deficient food and a control food, chickens preferred the latter but, when thepiriform cortex was separated from the rest of the brain, they had difficulty indiscriminating between the two foods (Firman and Kuenzel, 1988). It ispossible that the piriform cortex monitors amino acid levels, or that itsseparation disrupted the sense of smell (it is part of the olfactory system), orboth of these. However, lesions of the nucleus taeniae, which is also a part ofthe olfactory system, did not affect ability of birds to choose the right food.
As so little is known about neural pathways and transmitters in farmanimals, the interested reader is referred to a book reviewing the neurobiologyof food choice in laboratory animals (Berthoud and Seeley, 1999).
Timescale of control of diet selection
It might be supposed that animals that start to eat a meal from one food willtend to find the other food more attractive as the meal progresses. Sixty percent of the meals taken by broilers given free access to high- and low-proteinfoods are from both foods, i.e. there is a strong tendency to change foodsduring the meal (Shariatmadari and Forbes, 1992a). As metabolic receptorswould not have had time to be significantly influenced by the food eaten earlierin the meal, this suggests that the choice of food is predominantly controlled bylearned associations between the foods and their hedonic properties ratherthan by immediate feedbacks.
In order to look for an explanation as to how short-term feeding behaviouris involved in food choice, Yeates et al. (2002) have analysed large amounts ofmeal data collected automatically from cows given free access to foods high
164 Chapter 7

(HP) and low (LP) in protein, in three experiments. It was concluded that thecows did not attempt to select a consistent diet in terms of protein:energy ratioeither within a single meal or in a short sequence of meals, as there was nodifference in the proportion of visits to HP and LP during meals compared withrandom sequences of feeding bouts. The authors concluded: ‘Our presentanalysis does not suggest what the most relevant time scale is, except that ismust be longer than a meal’. Further detail is given in Chapter 2.
As an illustration of the greater stability of choice over longer periods,Fig. 7.9 shows the proportion of HP taken by eight cows offered a choice ofHP and LP over a period of 28 day (Kyriazakis et al., 1999). Choice inconsecutive 8-h periods is very variable and ranges from wholly HP to mostlyLP. Cumulating these into 24-h periods greatly reduces, but certainly does noteliminate, the variability, while 7-day means show great consistency, with asteady decline in selection for HP as milk yield declines in mid-lactation. It canbe concluded from this that diet selection was being controlled in these cowsover a timescale of 1–7 days.
Other research with cows shows selection changing in response to changesin protein content of the foods on offer, starting within 1 day after the changeand being complete by about 4 days later (Tolkamp et al., 1998b, Fig. 13.2). Ithas to be said that in this latter case the changes in food composition were bymeans of addition or removal of urea from both foods, which leads to rapidchanges in ruminal ammonia, whereas in the earlier example (Fig. 7.9) the onlychange was the very gradual one of advancing lactation.
In sheep the timescales are similar, i.e. regulation of protein content byselection between normal foods with different protein contents to produce a
Diet Selection: Principles 165
0
100
200
300
400
500
600
700
800
900
1000
0 5 10 15 20 25 30
Day
Die
t cho
ice
(g H
P/k
g T
FI)
Fig. 7.9. High-protein (HP) food intake as a proportion of total food intake (TFI) by eightlactating cows given a choice of HP and LP over periods of 8 h (�), 24 h (�) and 7 days (●)(from Kyriazakis et al., 1999).

stable diet over 3–7 days (Kyriazakis et al., 1994), but a much more rapidadjustment as a consequence of feeding on a rapidly fermentable food (Jamesand Kyriazakis, 2002). In the opinion of Kyriazakis et al. (1999): ‘… thequestion to be asked in relation to diet selection is not “what time periodmatters to the animal?” but “how much change or deviation in the internalstate is the animal prepared to accept?”’.
In the medium to long term, internal changes in the animal do lead toappropriate changes in selection, presumably in order to control some aspect ofthe animal’s state rather than to stabilize some short-term changes in bloodhormones or metabolites. Examples are given in Chapter 8.
Nutrient infusions and preloads
In order to understand the link between metabolism and learning, numerousexperiments have studied the effects of loading a substance or a certain type offood into the digestive tract or bloodstream of animals and observing theeffects on diet selection.
Poultry
Mechanisms of diet selection have been investigated in more detail by givingovernight-fasted broilers a meal of either HP or LP, to which they hadpreviously been accustomed, and then offering both a choice. Whether thechoice was given immediately after the initial meal or delayed for 1 h,significantly greater amounts of the opposite food were eaten (Forbes andShariatmadari, 1996) (Fig. 7.10). When the initial meal was given by tube intothe crop there was no significant preference subsequently, so it seems as if it isnecessary for the bird to taste the food in order to predict its protein contentaccording to its previous experience of the two foods.
The independent control of energy and protein intakes was furtherdemonstrated by force-feeding broilers with 40 g of food containing 60, 135,215 or 295 g CP/kg daily for 10 days while given free access to foods with 60and 295 g CP/kg (Shariatmadari and Forbes, 1992b). During the force-feedingperiod, the higher the protein content the greater the voluntary food intake, butthe proportion of HP chosen was lower, resulting in an almost constant level ofprotein intake across the treatments. After the cessation of force-feeding, thebirds which had been force-fed with the two highest levels of protein continuedto have higher voluntary food intakes but with a lower proportion of HP, anddeposited less protein in the carcass, than birds force-fed with lower-proteinfoods.
This suggests that, although compensating only partly for the protein givenby gavage during the force-feeding part of the experiment and thus ending thisperiod with more carcass protein, the birds force-fed with the higher levels ofprotein then responded to their higher body protein content by voluntarilyconsuming a diet with a lower protein concentration than those given lowerprotein by tube.
166 Chapter 7

Sheep
It might be expected in ruminant animals that products of digestion in the rumenwould affect diet selection. Infusion of sodium acetate or sodium chloride intra-ruminally in sheep gave large reductions in the intake of concentrates but hadno effect on hay intake (Engku Azahan and Forbes, 1992). The effect wasalmost as great for chloride as it was for acetate, so the major reason for thedecreased intake was probably osmotic (see Chapter 3).
Physiological State
Animals’ nutrient requirements usually vary over time according to changes innutrient demand as influenced by growth, pregnancy, lactation, egg laying,disease and season of the year. It is to be anticipated that their choice betweenhigh- and low-protein foods would change with this changing optimumprotein:energy ratio of the diet.
Differences between individual animals with different genotype, genderand physiology are also expected to influence selection between foods. Thus,males with higher growth potential than females generally choose a diet with ahigher protein:energy ratio.
Diet Selection: Principles 167
0
10
20
30
40
LP HP LP HP LP HP
Initial meal
(a) (b) (c)F
ood
inta
ke (
g/1
h)
Fig. 7.10. Intake of low-protein (70 g/kg, solid bars) and high-protein (300 g/kg, open bars)foods offered in free choice by broiler chickens given (a) previous access to one food (LP orHP) for 10 min and then immediate access to both; (b) previous access to one food (LP orHP) for 10 min and then access to both after 45 min without food; (c) 20 g of one food giveninto the crop by gavage and then access to both after 45 min without food (from Forbes andShariatmadari, 1996).

Poultry
As animals grow, the increased cost of maintenance and the increase in rate offat deposition mean that the optimal ratio of protein:energy in the diet declines.It is to be expected, therefore, that broilers offered a choice of foods higher andlower in protein:energy yield would progressively eat a greater proportion ofthe food lower in protein; this has been observed to occur with several differentcombinations of protein content in the two foods (Shariatmadari and Forbes,1993). Males grow more quickly than females and it is not surprising, therefore,that they choose a high proportion of high-protein food when given a choicewith a low-protein food (see Fig. 7.11).
Correlations between selection for protein and rates of deposition ofprotein and fat in the body might be the cause rather than the result of differentgrowth potentials at different ages or in the two genders. In attempts to resolvecause and effect, corticosterone has been used to reduce the ratio ofmuscle:adipose tissue being deposited in broiler chickens. In a short-termexperiment in which 2-week-old broilers were offered a choice between wholewheat and a balancer food, corticosterone injection at 4 mg/day for 5 daysinduced a significant preference for the whole wheat and thereby a reducedprotein:energy ratio in the diet, as predicted (Covasa and Forbes, 1995b).
In a more comprehensive experiment, male broiler chickens were givenfree choice of three foods in each of which protein, lipid or carbohydrate wasisocalorically substituted for one other macronutrient (Malheiros et al., 2003).
168 Chapter 7
0.4
0.5
0.6
0.7
0.8
0.9
0 1 2 3 4 5
Week of treatment
HP
as
prop
ortio
n of
tota
l int
ake
Fig. 7.11. The effect of corticosterone on the proportional intake of HP food in male (circles)and female (squares) broiler chickens. Closed symbols, control; open symbols,corticosterone (from Sahin, 1998).

Treatment with corticosterone (45 mg/kg of food) increased liver and fat padweight and tended to reduce the dietary content of protein and increased thatof fat; there was no effect on daily food intake.
Not all results are as predicted, however. Male and female broilers wereoffered high- (HP, 285 g CP/kg) and low-protein (LP, 70 g CP/kg) foods andgiven daily intramuscular injections of 4 mg/kg of corticosterone and had, as aresult, a decrease in protein accretion and an increase in total body fat content(Sahin and Forbes, 1997b) (Fig. 7.11). Corticosterone significantly increased theintake of HP as a proportion of total food intake from the third week oftreatment in males (from 195 to 245 g/kg) and from the second week in females(from 183 to 203 g/kg). Rather than reducing the protein:energy ratio of the dietselected, corticosterone treatment increased the preference for the HP food. Thisis likely to be due to the increased protein turnover and/or to increased proteindegradation to supply the carbon skeleton used for fat synthesis.
Similar increases in the ratio of protein:energy intake were found withinclusion of corticosterone in the diet of broilers (Sahin and Forbes, 1997a) andlaying hens, in which it decreased the egg production (Sahin and Forbes,1999). This might be due to the fact that corticosterone changes the oestradiolprofile in plasma, resulting in the change in the route of lipid transport from theyolk to the abdominal fat pad, and then builds the new body profile with anincrease in fat anabolism. Therefore, the demand for protein is increased ratherthan reduced because of the wasteful usage of dietary protein.
Pigs
As with broiler chickens, growing pigs show a decrease in the protein:energyratio of the diet they choose from high- and low-protein foods (Kyriazakis et al.,1990).
Stimulation of the rate of protein deposition – and depression of fatdeposition – in choice-fed growing pigs by daily injections of 4 mg STHsignificantly depressed food intake. This decrease was accounted for entirely bya reduction in the amount of the low-protein food (120 g CP/kg) selected (theother food contained 240 g CP/kg), so that energy intake was reduced but totalprotein intake was unaffected (Roberts and Azain, 1997). When the treatmentwas stopped intake increased, so that within 3 days it had reached pre-treatment levels, but this was by increased consumption of both high- and low-protein foods rather than specifically by normalization of intake of the low-protein food.
Sheep
It has been observed that growing lambs offered high- and low-protein foodschose a diet well matched to their requirements for growth and, even when oneof the foods required up to 30 responses to obtain a reinforcement, the lambsresponded accordingly to maintain this balanced diet (Hou et al., 1991b).
Diet Selection: Principles 169

Pregnant ewes select a significantly greater proportion of a food of high CPconcentration than non-pregnant ewes, reflecting their enhanced demand forprotein (Cooper et al., 1994). Thus, diet selection is driven not only by thecomposition of the foods on offer but also by the requirements of the animal,which change in a systematic manner with growth and reproductive cycles.
Conclusions
The theory that animals can select, from a choice of foods, a diet that meetstheir requirements is difficult to prove, but it is clear that there are manysituations in which they show considerable ‘nutritional wisdom’. The mostwidely studied situation is one in which animals are offered two foods, withhigher and lower protein contents than required in relation to the energyconcentration of the diet. Manipulating the protein content of one or bothfoods is accompanied by diet selection to maintain a fairly constant proteinintake.
A training period, in which the foods are offered alternately, can be usefulin ensuring that animals unambiguously associate each food with its nutritionalvalue. Individuals can also learn about the differences between foods indirectly,from conspecifics, particularly the mother.
It is far from clear what internal mechanisms are involved in controllingdiet selection; very few studies have been made in this area with farm animals.What is clear is that the principles established in this chapter for protein applyalso to many other components of the diet, as will be demonstrated inChapters 8 and 13.
170 Chapter 7

8 Diet Selection: Practicalities
In Chapter 7 we presented evidence for the ability of animals to select betweenfoods in order to obtain a diet balanced for energy and protein; this is based onlearned associations between internal and external stimuli, covered in Chapter 6.We have also discussed the prerequisites for successful studies of diet selectionand effects of changes in physiological state, especially growth. In this chapter webring the subject closer to application by covering those aspects of diet selectionthat can be utilized in practice and, again, selection for protein is the main focusof research because of the economic and biological importance of protein intake,in relation to energy intake. Examples of appetites for nutrients, including protein,are given in Chapter 13.
The controversial subject of self-medication is discussed; this is of greatcurrent interest with the banning of the routine use of antibiotics and otherdrugs in livestock production and the consequent search for natural remediesfor the diseases associated with intensive agriculture. The potential for usingapplied selection methodology to the commercial situation is also considered.
It has been demonstrated in Chapter 7 that, where two foods differ in theconcentration of a nutrient such that one contains more and the other less thanoptimal, in relation to energy requirements, then animals eat the two in such aratio that the intake of the nutrient in question is optimized. The higher thedemand for the nutrient, the greater should be the proportion of the food highin that nutrient. Note that the animal can cope with mildly imbalanced diets butat a metabolic cost; where possible, it should avoid this cost by eating thatamount and mixture of foods that minimizes the cost (discomfort, Chapter 10)of metabolism.
There is a large literature on selection by herbivores at pasture, not surprisinggiven the agricultural and ecological significance of herbivores, especiallyruminants. Not only do most grazing animals have to make choices betweendifferent species of plant, they also can choose which part of the plant to eat –this ability varies depending on the width of the incisor arcade – and whether to
© J.M. Forbes 2007.Voluntary Food Intake and Diet Selection 171in Farm Animals 2nd Edition (J.M. Forbes)

select against old herbage. As this book does not cover herbage intake, thisimportant subject is omitted, but see the proceedings of relevant conferences(Hodgson and Illius, 1998; Lemaire et al., 2000) and examples of experimental(Parsons et al., 1994) and modelling (Thornley et al., 1994) reports.
Self-medication
In the widest sense, all successful diet selection could be described as self-medication. An animal choosing a greater or lesser proportion of a food inorder to match its optimum intake is defending itself against an illness (oftencovert) – that of nutrient deficiency or excess. However, we will use the termhere in its more usual sense, that is the ability of animals to avoid overt illnessby making appropriate food choices.
Much of the evidence for self-medication is anecdotal (Engel, 2002), buthere we use only examples where well-designed experiments have adoptedcontrolled conditions (Chapter 7).
Toxins
Tannins are a constituent of many plants, including some available to animalsgrazing on the range. They can be toxic (causing haemorrhagic gastroenteritis,necrosis of the liver and kidney damage), but can also be beneficial by bindingproteins to reduce their breakdown in the rumen and thus allow more proteinsto enter the intestines, where they can be broken down and absorbed as aminoacids.
Polyethylene glycol (PEG) is a substance that attenuates the aversiveeffects of tannins and when sheep eat foods high in tannins they adjust theirintake of PEG to balance the amount of tannin in their diet (Provenza et al.,2000). In some animals, intake of PEG continues for at least 1 week aftertannin has been removed from the diet – presumably PEG alone did not causediscomfort so there was no disadvantage in continuing to eat it once it becamean accustomed food ingredient. Sheep also seek out locations where they havelearned to find PEG when offered nutritious foods high in tannins (Villalba etal., 2002).
Given access to a range of plants, grazing animals usually eat sufficientvariety that the intake of one, with its attendant toxins, is not excessive. What,however, if most of the plants eaten deliver toxins? If two or more toxins aredetoxified by the same pathway, they depress intake and preference additively(Burritt and Provenza, 2000). However, if the various toxins act on differentorgans and detoxification pathways, they are less harmful than a large dose ofany single toxin. Sheep and goats maintain high levels of intakes when theycan select a variety of shrubs that contain different toxins, and the benefit is fargreater than that due to medicines such as activated charcoal and PEG(Provenza and Immense, 2006); these medicines have a large effect only whenthe number of shrubs in the diet is only two or three.
172 Chapter 8

Maintenance of stable ruminal function
It has long been known that excessive intakes of rapidly fermented materials havean adverse effect on ruminal function, leading to low-fat milk due to lack of acetateas a precursor of milk fat synthesis, and a condition known as subacute ruminalacidosis (SARA). Cows suffering from SARA significantly increased theirpreference ratios for long lucerne over lucerne pellets from 0.60 to 0.85 in anapparent attempt to alleviate the discomfort generated by SARA (Keunen et al.,2002). Further studies with cows in which SARA was induced by a high-starch dietshowed no increase in their preference for drinking water that had beensupplemented with sodium bicarbonate (an acid-neutralizing agent) at 2.5 g/l overplain water. They did, however, increase their total water intake in an apparentattempt to dilute out the excess acids in the rumen. Extreme acidosis can result incattle ‘cud spitting’, i.e. dropping regurgitated boluses from their mouths.
Inclusion of sodium bicarbonate in the diet of sheep given a choice betweenfoods with low- and high-energy density increased the proportion of high-energyfood selected, as the bicarbonate ameliorated the low pH induced by the rapidfermentation of the high-energy food (Cooper et al., 1996). However, insubsequent experiments in which sheep were given an energy-dense food or aless dense food, with or without sodium bicarbonate supplementation, there wasno effect of bicarbonate on the proportions of the two foods subsequentlyselected (James and Kyriazakis, 2002).
There was, nevertheless, an effect of dietary energy density such that sheeppreviously on the less dense food chose a significantly higher proportion of themore dense food than those previously on that high-density food. There was,however, a reduction in choice for urea-containing foods when the basal dietwas higher in bicarbonate, explained by the need for urea as a buffer beingreduced by the presence of bicarbonate in the diet (James et al., 2002). Effectsof diet on buffering may override other diet selection objectives, such as theavoidance of an excess intake of RDP.
Stability of ruminal fermentation is an important requirement for theeffective functioning of the microflora. Of particular importance is the regularand sufficient intake of fibrous material and it is observed that, given freechoice between forage and concentrates, cattle and goats take about 20% oftheir DM intake as forage.
Castle (1979) offered dairy cows perennial ryegrass, with median choplengths of 9, 17 and 72 mm. Voluntary food intake and milk yield increased aschop length decreased, while eating and ruminating times were reduced.Despite this apparent nutritional advantage of the short-chopped grass, cowsgiven a choice of all three ate 16% of the long and 32% of the medium-lengthgrass. Similarly, lambs offered two foods do not totally avoid the bulkier onewhile lactating goats (J.M. Forbes, unpublished results) and growing heifers(J.H.M. Metz, personal communication) took about 20% of their DM intake ashay when they also had free access to concentrates. Growing lambs offeredfoods with different nutrient densities but similar ME:CP ratios ate some of thepoorer food, and it was suggested that the better foods increased ruminalosmolality or reduced pH to an uncomfortable extent.
Diet Selection: Practicalities 173

Rapidly fermentable nitrogenous compounds also upset the ruminalbalance and sheep avoid urea where possible (Kyriazakis and Oldham, 1993),even though this is a good source of nitrogen for the ruminal microflora. Whentwo foods with protein contents above requirements were offered, the sheepconsistently ate more of that with the lower content. However, when the choicewas between a high-protein food and one supplemented with urea, the HPfood was preferred, giving an overall crude protein content of the diet that wasgreater than required. The sheep preferred to eat too much undegradableprotein than too much urea, presumably because of the more toxic effects of anexcess of the latter. Thus, tactical adjustment to diet selection by ruminantanimals that initially appears as a failure by the animals in obtaining a diet thatboth meets their requirements and avoids excess can be viewed within theoverall feeding strategy of the animal to achieve its long-term goals that dependon healthy ruminal function.
When infused with acid or alkali to increase ruminal osmolality, sheepreduced their intake of a high-energy food but maintained their intake of a low-energy food, apparently in order to maintain the stability of conditions in therumen (Engku Azahan and Forbes, 1992; Cooper et al., 1995).
In preference studies, Phy and Provenza (1998) offered lambs large (1200g) or small (400 g) meals of barley followed by a choice between 200 g barleyand 200 g lucerne pellets. Lambs given the small amount of barley did notexpress a strong aversion to it, whereas those given the large amount showed amarked preference for the lucerne. The adverse effects of the excess of readilyfermentable carbohydrate provided by the high dose of barley induced anaversion, while the low dose of barley provided a readily available of source ofenergy without disturbing ruminal function unduly.
Although lambs preferred barley to lucerne when given a balanced basalfood, this preference was reduced when they were given a basal food with anexcessively high ratio of energy:protein (Villalba and Provenza, 1999). As thelucerne has a higher protein:energy ratio than barley (and higher than the basalfood), this provides evidence that ruminants select to achieve a diet balanced forenergy and protein. Similarly, their preference for whole over ground foods ismodified if they need to eat more ground food in order to preserve a balance ofenergy and protein in their diet. Need for a particular macronutrient generated astronger preference for a food providing more of that macronutrient, irrespectiveof its physical properties.
More recently Villalba et al. (2006) have shown that sheep learn to recoverfrom overeating grain, tannins and oxalic acid, respectively, by ingestingsources of three medicines – sodium bentonite, polyethylene glycol ordicalcium phosphate – that specifically lead to recovery from illnesses causedby eating these three toxins. This is the first demonstration of multiplemalaise–medicine associations.
There is thus ample evidence that ruminants do not always eat formaximum efficiency, as implied by Tolkamp and Ketelaars (1992), but strive tomaintain sufficient intake of long fibre or chemical ameliorators of ruminalconditions to aid proper ruminal function.
174 Chapter 8

Gut parasites
Gut parasites often reduce food intake by sheep and this is discussed inChapter 17.
Tannins can offer some protection from gut parasites, as animals feeding onplants with tannins show lower nematode burdens, lower faecal egg counts andhigher body weight gains than those eating similar plants without tannins.Animals can learn to eat foods high in tannins and nutrients in order toovercome internal parasites (Hutchings et al., 2003). Gut immune function isalso increased by the increase in protein passing through the rumen undegraded– caused by tannins in the diet.
Anti-emetic drugs
Daily treatment with the anti-emetic metoclopramide increased intake ofendophyte1-infected, but not uninfected, tall fescue by sheep, suggesting thatintake of the infected material is limited by feelings of nausea (Aldrich et al.,1993). In addition, anti-emetic drugs attenuated the aversion to several cerealsinduced by LiCl in sheep (Provenza et al., 1994a), which does induce nauseain many species. Also, sheep receiving anti-emetic drugs ate more grain thanthose not receiving them; it thus appears that intake of cereal-based foods islimited by mild aversion to abdominal discomfort induced by overeating.
Lameness in chickens
Lameness is a common problem in intensively reared poultry, and administrationof the analgesic carprofen allows lame birds to negotiate obstacles more quicklythan untreated lame birds, although not as fast as normal birds, evidence thatlameness causes pain. In order to discover whether broiler chickens could self-medicate with carprofen, lame and sound broilers were trained to discriminatebetween different-coloured feeds, one of which contained carprofen (Danbury etal., 2000). Lame birds selected significantly more drugged food than sound birdsand, as the severity of the lameness increased, lame birds consumed a significantlyhigher proportion of the drugged feed. Clearly, they were selecting a dose of theanalgesic that relieved the pain or discomfort of lameness.
Practical Uses of Diet Selection
Poultry
Choice feeding may be attractive for small-scale producers in developingcountries, as it can avoid the need for grinding or mixing, at least of the cereal
Diet Selection: Practicalities 175
1 Fungi living within plants.

grains (Henuk and Dingle, 2002). Standard feeding equipment can be used, asbirds can select within a trough as long as there are clear visual differencesbetween the foods. Such a system is also widely used in large-scale commercialproduction, both for laying hens and growing broilers, as detailed below.
Broiler chickens
In a comparison of feeding a complete diet with the choice of whole or groundmaize or sorghum to male broilers from 21–56 days of age, no differences inbody weight, food consumed, food efficiency, carcass ash, dressing percentageor mortality were found (Olver and Jonker, 1997). The main benefit of choicefeeding was said to be the financial savings of feeding whole grains as the mainenergy source.
Birds trained with alternate days of access to whole wheat and a standardstarter food for 4 days, when given the choice between the two, ate asignificantly smaller proportion of wheat than birds that had been given achoice throughout (Covasa and Forbes, 1996). It is likely that offering wholewheat alone for 24 h at a time rendered this food aversive, due to its lowcontent of protein and other essential nutrients. In a subsequent experiment,the period of exposure to whole wheat alone was reduced to 2 or 6 h and wasfollowed by significantly higher whole wheat intake than for birds fed to choicethroughout. It was concluded that a training period is not necessary as long asbirds have experience of whole wheat from an early age.
In a classic experiment, Gous and Swatson (2000) offered broilers choices oftwo or three foods containing different protein sources: fishmeal, sunflower oilcakemeal and soyabean oilcake meal. Their growth and food intake were monitoredfrom 7–21 days of age and compared with those of birds fed 13 different mixturesof the three foods. The design is shown in Fig. 8.1a, with 13 combinations offoods 1, 2 and 3 represented. Fig. 8.1b shows the results in terms of growth rates,and it can be seen that birds chose mixtures that gave them growth very close tooptimal; they did not choose mixtures that gave optimal FCE, however, althoughsupplementing the soyabean food with DL-methionine in a second experiment didallow the choice-fed birds to optimize FCE. As a result of this ‘severe test’, it ispossible to state unequivocally that broilers choose to maximize weight gain andFCE when given the opportunity to do so.
WHOLE-GRAIN FEEDING Wheat and barley are attractive ingredients for broilerfoods in view of their low price but, because of their low protein content andimbalanced amino acid composition, they must be supplemented, and thisnecessitates grinding and mixing with supplements before pelleting into acomplete manufactured food. Whole grains of cereal can, however, be viewedas low-protein foods that can be offered in free choice with high-proteinconcentrate pellets, but the extra expense of providing two feeding systems hasprevented its large-scale adoption. There is, however, no need to offer the twofoods separately, for as long as they are mixed in roughly the right proportionsthey are visually different and can be separately prehended by the birds. Theconcentrate is made by removing the cereal from a conventional formulation
176 Chapter 8

with added premix and calcium (note that it is not necessary to formulate aspecial high-protein food to use as a balancer for wheat. Standard commercialfoods are designed to provide sufficient protein for 95% of the birds, whichmeans that the great majority are being over-provided).
Although barley is generally cheaper than wheat, the high content of �-glucans in barley, which slows the rate of food passage through the digestivetract, means that replacement of wheat with barley in a broiler food reducesintake. Treatment of ground barley with a �-glucanase enzyme increases theproportion selected by choice-fed broilers, presumably by overcoming theaversive properties of untreated barley.
Performance of broiler chicks given a choice of concentrate pellets andsorghum grains is about equal to that of pellet-fed controls, but the choice-fedbirds ate less protein and converted protein more efficiently. Broilers given achoice of a cereal and a high-protein concentrate performed just as well ascontrols, whether sorghum, wheat or both were the cereals and, when bothwheat and sorghum were on offer, they ate more sorghum than wheat(Cumming, 1983). It is appropriate to provide a small proportion of wholegrains from an early age, to give the birds familiarity with their appearanceand, hopefully, with their metabolic effects.
Many broiler producers in Northern Europe are now including whole grainin their foods. Adequate mixing takes place during the normal handling of thefood through the augers, bins and feeders. Successive batches of food aremade with increasing proportions of whole wheat to give a steady increase inthe proportion of whole grain, calculated to meet the requirements of theaverage bird. Results in terms of growth rate and carcass quality are reported tobe at least as good as with the commercial grower food fed on its own and, inScandinavia and other European countries, it is now common practice to feed
Diet Selection: Practicalities 177
(a) (b)soybean soybean
sunflowerfishmeal fishmeal sunflower
Fig. 8.1. (a) Thirteen combinations of three components making up the optimal design for a3-component mixture; (b) Contours in a 3-component mixture representing differentcombinations of soybean oilcake meal, fishmeal and sunflower oilcake meal that result insimilar daily weight gains (maximum growth rate (X) and combinations chosen when broilersoffered the various 2-way (thick bars) and 3-way (*) choices); the contours are at 1 g/dayintervals (from Gous and Swatson, 2000).

a starter food containing 240 g protein/kg throughout and to add increasingamounts of wheat, up to 40%.
While there are scientific grounds for controlling the proportion of wholegrain more accurately to match the birds’ potential and actual growth, andthese are utilized in a comprehensive, computer-monitored and -controlledcomplete housing and feeding system (the Flockman system, Filmer, 1991), theexpense of installing such a system seems unjustified at the moment in view ofthe good results being achieved with ad hoc methods.
Laying hens and pullets
The large-scale application of choice feeding of caged hens was studied byTauson and Elwinger (1986) using two narrow, flat-chain feeders, one distributinga mash concentrate, the other whole grain. In a semi-choice treatment the mashwas given as a layer on top of the grain, which was provided ad libitum. Twoexperiments with over 5000 birds showed greater egg size with choice and semi-choice feeding than with conventionally fed controls, with no difference in thenumber of eggs laid. Egg shell quality and cracks tended to be worse in thechoice treatments, however. Profit margin was higher over the two productioncycles for both choice-fed groups than control, and these authors concluded thatchoice feeding from flat feeders is feasible but that further studies would benecessary before similar systems were used in practice.
R.B. Cumming (personal communication) has been a great proponent ofchoice feeding in practice, and emphasized the importance of exposing pulletsduring rearing to all the grains that they may be offered later in life. He alsoobserved that water consumption has been found to be lower in choice-fedlayers, and the droppings have tended to be drier and to cone more readilyunder the cages. This may be due to the better gizzard development in birdsfed some whole grains, and requires further investigation.
Pullets of a layer strain were given a choice of pelleted protein concentrate (aspellet or mash), whole yellow maize and limestone powder from 7–16 weeks ofage and compared with birds fed a complete pullet grower diet in mash form(Olver and Malan, 2000). Choice-fed birds were significantly heavier at first eggthan those fed the control diet, even though they ate less food (66.2 versus 68.2g/day). During the laying period (16–80 weeks), choice-fed hens laid eggs thatwere significantly heavier, had thicker shells and darker yolks, with better foodconversion ratios than those fed the control diet. It was concluded that choicefeeding was beneficial for laying hens, and it was suggested that for optimal resultsthe birds should have experience of choice feeding well before the onset of laying.
In summary, under commercial conditions laying hens usually perform wellalthough efficiency is sometimes reduced. There is uncertainty about theoptimum methods of training and feeding.
The potential advantages of whole-grain feeding
If animals do make nutritionally wise choices between foods, the followingadvantages may be seen:
178 Chapter 8

1. There is a saving by not having to grind and pellet as much food and the factthat grain stores better whole, especially in hot, humid areas. Trained birdsmodify the ratio of intakes of the two foods within a few hours of a change inthe energy content of the grain or of the protein content of the concentrate.Under heat stress, they decrease only their grain intake, but not that ofconcentrate. In the cool of the night they once again eat more grain, and eggsare generally a bit heavier than for birds given a single food, especially in hotweather. Choice diets are cheaper, but broilers take a bit longer to reach a givenweight as they lose a day or two while they learn. They may be less susceptibleto coccidiosis and usually more efficient financially.2. Expensive determination and laborious calculations of nutrient requirementsfor use in food formulations could be avoided by offering a choice of two or morefoods and allowing animals to choose a combination that will reflect their needs.3. Separate-sex feeding will be unnecessary: within a mixed-sex, choice-feedingflock the males and the females will be able to select different diets that reflectthe different requirements of the sexes. Differences between individual birds anddifferent strains with different growth potential will be compensated for.4. Food changes will not be needed: two foods, offered as a choice, could beused throughout the growing and finishing period. In addition, nutrient under-supply (with consequent loss in output) or nutrient oversupply (with noresulting benefit but increased cost and waste) will be avoided since the dietselected by each individual will precisely meet its requirements. Changes inenvironmental temperature will be accommodated by the birds without theneed for reformulation of the foods.5. Excretion of nitrogenous and other waste will be reduced as individualanimals select diets to meet their nutrient requirements. There is potential for asignificant reduction in the pollutants generated by intensive animal units.
The potential disadvantages of whole-grain feeding
1. It is an additional task for managers to check that both cereal grainsand concentrate are available to all birds to ensure an adequate mixture isprovided.2. The proportion of whole grains eaten tends to increase with the amount ofgrains provided – in some cases birds seriously overeat whole grain, especiallyif it is very freely available. There is an advantage in providing the ratio ofgrain:concentrate that is optimal for the birds in question, i.e. increasedmanagement input.3. Risk of poorer performance: in a comprehensive experiment in which broilerchicks were offered either a single balanced food or a choice of two foods thatdiffered in protein and energy, growth rate and efficiency were reduced bychoice feeding, especially in the faster-growing strain (Siegel et al., 1997).Choice-fed birds selected a diet that was lower in protein:energy than optimal,had heavier abdominal fat pads and lighter breasts relative to body weight thanthose fed a single diet. In another case, although total food intake to 6 weeks ofage was not significantly affected by the feeding treatments, broilers on choice
Diet Selection: Practicalities 179

feeding selected diets with a lower percentage of CP and had lower live bodyweights at 6 weeks than those fed the complete diet (Yo et al., 1998).
Gizzard development and coccidiosis
Grit is not usually offered in intensive poultry production and foods are low infibre, as a result of which the gizzard is small and the proventriculus may bedilated. This results in food passing very quickly through the stomachs and arrivingin the duodenum in a particulate form in which penetration of digestive juicesmight be slow. This might be conducive to coccidiosis, and Cumming (1987)observed that a higher-fibre food (62.5 g/kg) given to groups of cockerels from 1-day-old to 4 weeks reduced the incidence of coccidiosis compared with a low-fibre food (28.5 g/kg). All birds were dosed with coccidiosis oocysts, and 7/50 diedin the low-fibre group, 3 in the high-fibre and none in a third, choice-fed group.The oocyst outputs were 293, 96 and 6, respectively, at 6 days post-infection. It isalso advantageous for gizzard development and coccidiosis prevention to offerlimestone grit to ensure large particles that stay in the gizzard, rather than aspowder incorporated in complete food. Gizzards were significantly heavier inchoice-fed birds compared with those given a single complete food.
In well-controlled experiments using Eimeria acervulina, it has not beenpossible to confirm the reduction in oocyst output and improvement of birdperformance obtained by Cumming, however, even though gizzard weight wassignificantly increased by the use of whole wheat, rather than ground, in thediet of broiler chickens (Banfield and Forbes, 2001). It had been proposed thatthe beneficial effects of whole cereals on coccidial infection were due to theincrease in the viscosity of gut contents compared with ground cereals.However, when carboxymethyl cellulose was added to the diet to increasegreatly the viscosity of gut contents, there was no benefit in terms of reducedEimeria oocyst output, with the additional disadvantage that food conversionefficiency was reduced (Banfield et al., 2002).
When grit is available to broilers offered whole wheat and a high-proteinfood, they select a higher proportion of whole wheat as presumably they arebetter able to grind it in the gizzard in which the grit is stored for this purpose;when access to grit is denied there is a reduction in the intake of the wholegrain. When the balancer food for broilers was given in mash form the birdsselected more wheat when ground than whole but, if the balancer was pelleted,they selected more wheat when whole. Presumably physical form influencesgizzard development and pelleted food improves its ability to grind food andallows birds to make better use of whole wheat. Thus, they select more wholewheat when offered concentrate in the pelleted form rather than mash.
Sequential feeding
One way to cope with the logistical difficulties of providing two foodssimultaneously under commercial conditions would be to feed the twoalternately. The length of time each food is offered will affect the outcome, as
180 Chapter 8

there is limited storage for many nutrients in the animal’s body. If one food iseaten to satiety and another, contrasting, food is then offered, animals usuallyeat again: this is known as sensory-specific satiety. On the face of it, therefore,offering two or more foods in sequence might be expected to increase totalintake but this is not usually the case.
Offering HP and LP to broilers for alternate half-days gave food intakesand growth very similar to birds fed the same two free-choice foods (Forbesand Shariatmadari, 1996), and it appears that alternate feeding would be aneffective way of ‘choice feeding’. Birds given HP and LP on alternate days hadsomewhat lower total intakes and significantly less fat in the carcass than thoseoffered free choice. When whole wheat and balancer are given to broilersduring alternate 8-h periods, there is good selection: the higher the proteincontent of the balancer, the greater the proportion of wheat is eaten.
Gous and DuPreez (1975) gave layer cockerels two foods that wereindividually poorly balanced but complementary in their amino acid com-position, in alternating periods of 6 or 12 h. There were no significantdifferences in food intake or weight gain, either between the two alternatingtreatments or compared with controls fed the two foods mixed together. Thus,the growing bird appears to have the ability to compensate for short periods onamino acid-imbalanced foods.
Chicks offered a choice between high- and low-protein foods during the12 h of daylight but a food with an adequate protein content at night adopteda nocturnal feeding pattern, but did not completely eliminate daytime meals.Thus, although normally a diurnal feeder, if necessary the chick will eat at nightin order to get a single, complete food. This suggests they prefer to eat a single,balanced food rather than making up their own balanced diet. Chicks exposedto cold conditions at night ate more and selected a higher energy:protein ratiothan controls kept continuously in the warm, and chicks kept in permanentlycool conditions ate more food, with a higher energy:protein ratio, than thoseput in the warm at night (Hayne et al., 1986). The chick has the ability,therefore, to compensate for changed nutrient requirements at one time of dayby altering its diet selection at other times.
In a comprehensive series of experiments, Rose et al. (1995) comparedalternating periods of access to whole wheat and a balancer food with freeaccess to both or a single, complete food. The proportion of the diet taken aswhole wheat was low with choice- and 4-h sequential-feeding, but higher withsequential periods of 8, 12 or 24 h (see Fig. 8.2). Weight gains were similar forthe complete, choice, 4-h and 8-h treatments, but lower for the 12-h and lowerstill for the 24-h sequential treatments.
When the foods were given in alternating 4-h periods, it can be assumedthat the chicks learned that they did not have to wait very long before thepreferred balanced food became available again, whereas with the 12-h and24-h alternating periods they became hungry and this encouraged them to eatmore of the whole wheat. When the 8-h sequential treatment was comparedwith a single complete food, both in small group cages and in larger groups infloor pens, the sequential treatment gave growth rates that were 7% and 5%lower, respectively. However, because of the reduced need for food processing
Diet Selection: Practicalities 181

and transport in the sequential treatment, the cost of food/kg of weight gainwas lower (36.1 p2/kg) than for the complete food (38.6 p/kg). Because of theslower growth of sequentially fed birds, the authors’ opinion was that thismethod of feeding is not to be favoured for intensive broiler production.
Nutrient solutions
Almost all animals are choice-fed almost all of the time in that they are given foodand water; water intake is covered in Chapter 12. Other nutrients can be includedin the drinking water and the situation is then more obviously choice feeding.
Feeding a low-energy food increased the preference by domestic chickensfor a 100 g/l solution of sucrose, compared with feeding a normal or a high-energy food (Kare and Maller, 1967). In contrast, jungle fowl selected signifi-cantly more sugar solution than water irrespective of the energy and proteincontent of the foods, which were a 200 g/kg protein food diluted or enrichedwith 250 g/kg of cellulose or corn oil. Jungle fowl have a low potential growthrate and therefore a low protein:energy requirement, and so choose to reducethe protein concentration of their diet by drinking sucrose solution.
The inclusion of 9% of glucose in the drinking water of cockerels of alaying strain did not reduce food intake, but weight gains were not increasedand it was suggested that the extra energy was mainly stored as fat. In otherexperiments with broiler chickens, intake was depressed by glucose solutions tomaintain a constant total energy intake (Engku Azahan and Forbes, 1989). Tosee whether the different response might be due to differences in the proteincontent of the food in relation to potential growth rate, either water or a9% solution of glucose was offered to male broiler chicks fed on either low-
182 Chapter 8
Fig. 8.2. Food intakes of broiler chickens fed a complete food (grey bar), free choicebetween a balancer food (solid bars) and whole wheat (open bars) of these two foods insequence for alternating periods of 4, 8, 12 or 24 h (from Rose et al., 1995).
2 UK currency, 100 p = £1.

(150 g/kg) or adequate (195 g/kg) protein foods. Compared with those on tapwater, those birds having dextrose in the water ate significantly less food butthere was a highly significant interaction between the effects of dietary proteinlevel and type of fluid offered, glucose depressing intake of the medium-proteinfood but stimulating it with the high-protein diet (see Fig. 8.3).
Fluid intake was generally closely related to food intake and did not differbetween types of fluid on offer. On the high-protein food, glucose solution hadno effect on food intake but allowed increased protein and fat deposition,whereas with the medium-protein food, intake, protein and fat were alldepressed, presumably due to lack of protein to balance the increased energyintake from glucose. It appears that chickens consider glucose solution to be adrink rather than a food and that, having taken in extra energy, respondaccording to the new protein:energy ratio of the diet.
Pigs
Choice feeding has not been practised on a commercial scale to any significantextent as, unlike the situation with whole-grain feeding in poultry, no consistenteconomic benefits have been found. However, results from research undercommercial conditions suggest that there is potential for choice feeding of pigs(Dalby et al., 1997; Lawlor and Lynch, 2003). Choice feeding frequently leadsto more efficient utilization of food protein (e.g. Dalby et al., 1995), althoughthere has been a tendency towards a lower food conversion efficiency in someexperiments. This may indicate that the animals are depositing higher levels offat tissue, and this is corroborated by greater thickness of back fat in choice-fedanimals in some cases, but by no means all.
Diet Selection: Practicalities 183
Fig. 8.3. Intakes of feed and fluid, weight gain and carcass composition of broilers offered waterwith either 150 (open bars) or 195 (dark grey bars) g CP/kg or 90 g/kg glucose solution witheither 150 (solid bars) or 195 (light grey bars) g CP/kg (from Engku Azahan and Forbes, 1989).

Nitrogen excretion and pollution
The environmental consequences of diets that are offered to pigs must now beconsidered. In several European countries pollution with phosphorus andnitrogen from animal manures is a major problem, and nutritional strategies toincrease utilization should be investigated. Choice-feeding experiments havegenerally shown that choice-fed pigs eat lower levels of protein with nosignificant reduction in live weight gain when compared with pigs offered asingle food with fixed protein level. From this it can be estimated that there willbe lower levels of nitrogen excretion from the pigs selecting their own diet, asthe protein is utilized more efficiently, although similar results can be obtainedby feeding lower than normal levels of protein that are balanced by theinclusion of synthetic amino acids.
Sequential feeding
Fowler et al. (1984) studied the effects of dietary novelty and frequency offeeding on the food intake and performance of growing pigs. From 25–90 kgbody weight they were offered nine foods in sequence or as a mixture givennine times or twice per day. Initially, the sequentially fed groups ate more but,at the end, intakes were similar at 2.32, 2.35 and 2.33 kg/day and live weightgains and food conversion efficiencies were not different between groups.
Ruminants
Selection within a single food
When grass or hay is offered in the long, unchopped form, animals have theopportunity to select between stem and leaf. The proportion of leaf selected bysheep increases with the amount of straw offered. Sheep given unchoppedbarley straw in sufficient amounts so as to leave uneaten 20, 30, 40, 50 or 70%of that on offer ate increasing amounts of leaf blade as the allowance increased,in a linear manner, at the expense of stem; leaf sheath was little affected(Bhargava et al., 1988). Little stem was eaten until refusals were < 40% of theamount offered, and the DM digestibility of the whole diet increased from 0.59to 0.64 with increasing allowance from 20 to 70% excess.
Ruminants select leaves in preference to stems when given an excess ofhay – the former have a lower content of fibre and higher levels of solublecarbohydrates and protein. Wahed et al. (1990) offered goats 50% more strawthan they would eat and noted a significantly higher DM intake (18.9 gDM/kg0.75/day) than those offered 20% more than ad libitum (14.4 g DM).Further work with goats and sheep confirmed this, as shown in Fig. 8.4, i.e.very worthwhile increases in levels of nutrition. The refused straw can beutilized as bedding or fuel.
Oosting and Nordheim (1999) have developed a theory of the proportion ofthe offered food sheep select as the amount of forage on offer is increased. Belowa certain threshold, animals eat all that is put in front of them (phase 1); above
184 Chapter 8

this point they choose to eat an amount of food according to the efficiency withwhich ME is used for maintenance and growth (see Chapter 9). Once the amountof food on offer gives an efficiency of 0.6, over this level refusals are left in suchamounts as the intake is such that efficiency stays at 0.6 (phase 2). Eventually, asthe amount of offer increases further, a point will be reached at which there is nofurther increase in intake (phase 3); the transition points and gradients will varyfor different food materials, as illustrated in Fig. 8.5.
Matching Food Composition with Requirements
Diet formulation
In commercial practice the protein content of food given to broiler chickens andgrowing pigs is reduced in a stepwise manner to match the changing needs of theanimals as they grow. Even if choice feeding is difficult to apply commercially, ithas the potential to be used to define more precisely the changes in requirementsto allow more accurate formulation of rations. In particular, the optimum level ofamino acids for animals of particular genotypes at different stages of growth canbe assessed more comprehensively by diet selection experiments than bycomplex factorial experiments in which different groups of animals are given allcombinations of likely amino acids at different stages of growth (Forbes andCovasa, 1995).
Based on results with choice feeding, the optimum single foods to be givento birds under different environmental temperatures have been recommended,as have levels of methionine inclusion in broiler foods and lysine inclusion infood for growing pigs.
Diet Selection: Practicalities 185
Fig. 8.4. Effect of allowing sheep and goats 13% (solid bars), 57% (grey bars) or 70% (openbars) excess straw over intake on voluntary intake, organic matter (OM) digestibility anddigestible OM intake (from Wahed et al., 1990).

New genotypes
If diet selection can be used to define more precisely the optimum content ofprotein, amino acids and any other essential nutrient, for existing genotypes, thenit can also be used for novel genotypes, such as may be produced by geneticengineering techniques in the foreseeable future. Leaving aside the moral issues,there are likely to be major technical problems with the feeding and managementof animals whose potential for growth has been elevated considerably but whoseability to ingest, digest and metabolize the food to support such growth isunknown. Diet selection experiments are likely to lead more rapidly to a resolutionof these problems than classical factorial experiments but the limits of diet selectionas a technique for assessing optimal nutrition have yet to be defined, and muchmore basic research is needed at this stage so that we are not to be takenunawares if, and when, novel genotypes are produced for commercial use.
New genotypes of crop plants can also be assessed as animal foods by dietselection techniques.
Conclusions
Given the appropriate conditions, diet selection methodology provides a verypowerful tool for nutritional and behavioural scientists and has great commercialpotential.
Currently, however, there are only two situations in which farm animals areoffered choices in practice. One is grazing, which is not covered specifically in
186 Chapter 8
Fig. 8.5. Relation between amount of food organic matter (OM) offered and amount eatenaccording to the model of Oosting and Nordheim (1999). Phase 1, all offered food is eaten;phase 2, intake increases with amount offered, according to theory of efficiency of utilizationof ME; phase 3, further addition of food does not result in increased intake. Symbols areobserved intakes: �, untreated; ●, urea-treated rice straw.

this book. The other is the apparently widespread practice of offering poultry amixture of whole cereal and a pelleted balancer food, either in separate troughsor, more usually, in the same trough. However, there is little evidence to datethat individual birds improve their diet by choosing disproportionate amountsof the two foods.
Questions still to be answered include:
● Is it better to offer a standard complete food in choice with whole grain orto formulate a high-protein balancer to complement the cereal?
● Is the welfare of animals better served by offering them a choice of two ormore foods?
Ultimately, it is economics that will dictate whether choice feeding is imple-mented commercially. In most research, non-standard foods have usually beenused to try to ensure that selection is for or against a nutrient rather than aningredient. In commercial practice least-cost formulation determines the rawmaterials to be used as ingredients, and some of these have sensory propertiesrendering them more or less attractive to animals and distorting their choiceaway from constructing for themselves a balanced diet. It remains to be seenwhether choice feeding will be suitable in practice, especially for pigs.
Diet Selection: Practicalities 187

9 Integrative Theories of Food Intake Control
This chapter deals with mechanistic modelling of voluntary food intake and dietselection over periods of 1 day or more. The philosophy of modelling, togetherwith many examples from ruminant digestion and metabolism, is included inthe book edited by Dijkstra et al. (2005), while Yearsley et al. (2001) discussmodelling of food intake in herbivores, with particular reference to extensivesystems.
Some of the theories that have been put forward to explain the control ofintake in birds and mammals are described. In many cases they aredevelopments of simpler hypotheses described briefly in Chapter 1, whichpostulated that feeding is controlled by a single factor, usually acting in a negativefeedback manner. Stomach distension (Chapter 3), hypothalamic temperature(Chapter 5), blood glucose concentration (Chapter 4), body fat stores (Chapters 4and 15) and plasma amino acids (Chapter 4) have all, in their turn, beenproposed as the factor whereby intake is controlled to match requirements.However, none of these theories outlined so far can explain how intake iscontrolled under all circumstances. Balch and Campling (1962), having reviewedthe control of voluntary food intake in non-ruminants, concluded that: ‘… foodintake is unlikely to be regulated by any single mechanism and … oropharyngealsensations, gastric contractions and distension, changes in heat production andchanges in the levels of circulating metabolites, may severally be implicated’.
In a complex situation it is often helpful to construct a model to study thelikely consequences of integrating the various parts of the system in aquantitative manner. At the very least, the attempt at model-building forces thewould-be modeller to consider the main factors involved in the system understudy and can usually point to what critical experiments are required in order tofill in gaps in concepts or data.
In the first edition of this book (Forbes, 1995), prediction of food intakewas given a chapter to itself. In this edition this subject is incorporated into theappropriate parts of the text, including this chapter, because it is the aim of
188 © J.M. Forbes 2007.Voluntary Food Intake and Diet Selection in Farm Animals 2nd Edition (J.M. Forbes)

theorists and modellers to develop quantitative hypotheses that reflect the mainfeatures of the intake control systems and should thereby produce goodpredictions of intake.
Energostasis
Several of the single-factor theories have in common the idea that somefunction of energy intake or storage is monitored by the brain, which thencontrols intake in order to preserve the constancy of a bodily function (glucoseconcentration or utilization, deep body temperature, body fat stores, etc.). It isclear that any attempt at formulating a more complex hypothesis must rely onenergy as the principle commodity. So far as we know, the body cannotmeasure energy per se, although several recent theories imply monitoring ofenergy flows.
Le Magnen and colleagues (summarized in 1985), realizing the limitationsof the ‘classical’ theories, have accumulated evidence to support the conceptthat the energy supply to some tissues is monitored and used to control foodintake. They showed that, during the day, the rat has a lower metabolic ratethan at night and speculated that this might be the cause, rather than the result,of the reduced frequency of meals during the day, compared with the night.They concluded that the amount of food eaten from the onset to thetermination of a meal, or meal size, is mainly determined by the peripheral, i.e.oral and gastrointestinal action of ingested foods.
Meal-to-meal intervals, and therefore the meal frequency, are mainlydependent on post-absorptive and metabolic factors. Another way of puttingthis is to say that meal termination is not finely controlled, as it seems to becaused by numerous factors acting in concert, many of which are not directlyrelated to the eventual nutrient yield of the meal. However, the products of themeal in question can be more accurately monitored during the subsequentinter-meal interval and used to determine the onset of the next meal.
The same idea was expressed by Stricker and McCann (1985): ‘wheneating, increasing gastric fill and increasing hepatic delivery of calories bothserve to reduce the likelihood that animals will continue to feed. Once theystop eating … they will remain satiated despite an empty stomach so long asthe liver continues to get utilizable calories from the intestines.’
Whatever the mechanism, the idea that ‘animals eat for calories’ haspervaded the subject, even though it has been clear for many years thatincreasing the caloric density of food by the addition of fat results in increasesin the intake of digestible energy and weight gain (see Chapter 11).
Limitation of Intake by Bulk
The concept that animals try to meet their energy requirement by eating anappropriate amount of food is central to theories of the control of food intake.In many situations, however, particularly with ruminants, there are constraints
Integrative Theories of Food Intake Control 189

that limit intake to below the optimal. The history of studies on voluntary foodintake in farmed ruminants shows that initially (up to the 1960s) all theemphasis was on a positive relationship between the digestibility of the foodand how much animals would eat, rather than the negative relationshippredominantly seen in simple-stomached animals.
With unchopped forages it is likely that intake is constrained by thecapacity of the digestive tract and the dynamics of breakdown and passage offood particles (see Chapter 3). This assumption is made in the model of Illiusand Gordon (1991), and no account is taken of any metabolic factors thatmight be involved. The model is run with three equally spaced meals per dayuntil it reaches a semi-steady state; the number of meals per day is thenincreased until the mean daytime digesta load reaches 21 g DM/kg body weight(the mean digesta load found from the literature).
Predictions of forage intake were highly correlated with observed values(r = 0.78) and, not surprisingly, were found to be particularly sensitive tochanges in the model of the permitted average DM contents of the rumen, thedigestible cell wall content of the forage and the rate of passage of particles outof the rumen. Further discussion of models based on the physical limitation ofintake is provided by Illius et al. (2000).
Constraints Models and the Two-phase Hypothesis
With the increasing use of high-concentrate diets on farms in the 1960s, itbecame clear that when constraints such as bulk were not limiting, ruminantscontrol their intake of food to achieve an approximate constancy ofmetabolizable energy intake (see Chapter 11). It was necessary, therefore, tocombine so-called ‘metabolic’ and ‘physical’ controls of intake into an overallpicture of how intake might be controlled.
Animals eat in order to satisfy their requirements for energy unlessprevented from doing so by limiting factors, of which the bulk of the food is themost commonly considered. Figure 11.6 summarizes data from numerousexperiments and it can be seen that, in general, intake (of both DM andenergy) increases with increasing DE yield (digestibility of energy, reducingbulk) until energy requirements are being met. Further increases in DE yield donot result in any further increase in energy intake, so that DM intake actuallydecreases. The concept of a sudden change from ‘physical’ limitation of intaketo ‘metabolic’ control, although physiologically unrealistic (see below), hasbeen widely accepted and named the two-phase hypothesis (TPH), by Pittroffand Kothmann (1999).
It must be made clear that physical limitation of intake by gut capacity isnot the only constraint that might be applied to food intake. Heat load and theneed to maintain body temperature is another constraint when intakes and/oreffective environmental temperatures are high. In some situations, therefore,more than one constraint should be included simultaneously, and approachesto doing this will be covered later in this chapter and in Chapter 10.
190 Chapter 9

Poultry
Although acknowledged as a possibility, physical limitation of intake has notbeen seriously considered, presumably because poultry are normally offeredhighly digestible foods. A TPH has, therefore, not been developed for birds.
Pigs
While principally applied to ruminants, the TPH concept has been applied topigs (Kyriazakis and Emmans, 1999) based on evidence from experimentalwork involving bulky foods. In order to test whether pigs behaved in a mannerconsistent with the TPH or with an hypothesis of optimization of biologicalefficiency (Tolkamp and Ketelaars, 1992), Whittemore et al. (2001b) fedgrowing pigs – kept at a thermoneutral or low environmental temperature –either on a highly digestible food or on a high-bulk food incorporating 650 g ofsugar beet pulp/kg.
While both theories predict that lowering the temperature will increase theintake of a high-quality food, the THP predicts that intake of a bulk-limited foodwill not be increased by such treatment. The results showed a highly significantfood � temperature interaction for food intake, whereby reduction in temperatureresulted in an increase in food intake of the high-quality food but had no effect onthe intake of the bulk-limiting food, thereby agreeing with the TPH.
In a further test of these two frameworks, foods with low (L), medium (M)and high (H) bulk characteristics were used (Whittemore et al., 2001c).Compared to L fed throughout, a period on H followed by L resulted incompensation of the reduced intake and growth in period 1, while H followedby M did not give such high intakes or growth rates, suggesting that food Mwas preventing the full expression of compensation for the period on H. Whilenot clear-cut, the results were in closer agreement with the TPH than with theefficiency theory.
Ruminants
Evidence that can be interpreted as supporting the TPH is presented in Chapter11, and its use in models of intake and ruminants has involved assumptionsthat sheep (Forbes, 1977b) and lactating cows (Forbes, 1977a) will eat dailysufficient metabolizable energy to meet the animal’s requirements formaintenance, production and fattening, unless physical limitations intervene.The daily intake of food supplies energy to the body pool, which is utilized formaintenance, pregnancy, lactation and fattening. Food intake also leads tostomach distension, and this is compared with the abdominal space available(taking the size of the uterus and abdominal fat into account) to determine aphysical limit to feeding. If the physically limited intake is less than themetabolically controlled intake, then the former value is used and the shortfallin energy supply made up by fat mobilization.
Integrative Theories of Food Intake Control 191

An important principle in this model is that fat deposition (in addition tomaintenance, growth and lactation) is seen to be driving food intake in that it isassumed that the sheep tries to deposit 100 g of fat/day if the quality of thefood is good enough to avoid physical limitation of intake. Of course, if intakeis physically limited then fat deposition cannot reach this target and may evenbe mobilized if intake is very low. The deposition or mobilization of fatincreases or reduces the volume of abdominal fat which, in turn, reduces orincreases the space available for the rumen and hence for food intake.
This type of model produces a much steeper increase in daily intake in theperiod immediately after parturition than that seen in ewes or cows. The sharprise is due to the sudden reduction in the volume of the uterus, which releasesthe animal from physical limitation of intake and allows it to satisfy its greatlyincreased energy requirements for lactation. To cope with this anomaly themodel was provided with a limit to the rate at which intake could increase, butthis is artificial as we do not know the physiological reasons for theunexpectedly slow increase in intake in early lactation (but see Chapter 16).
While there are numerous reasons to doubt the TPH as representing whatoccurs physiologically, Emmans and Kyriazakis (2001) have vigorouslydefended it as a tool for predicting intake in practical situations. One of theirobjections to attempting to include numerous physiological factors in ruminantmodels is that the effects of the different presumed signals need to be expressedin a common currency. They state that it will be necessary to know the strengthof all relevant signals in order to calibrate them and combine them and thatthere is still considerable uncertainty as to what signals are involved, nevermind their quantification. Concepts that involve more complex integration ofsignals than the TPH are dismissed by them as having no contribution to maketo the accurate prediction of food intake.
With those in mind who draw a distinction between ‘understanding’ and‘ability to predict’, Emmans and Kyriazakis (2001) state that: ‘The test ofwhether we understand a system is always whether we can make accuratepredictions of its behaviour’. They do not denounce attempts to describe indetail the systems controlling intake outright, but consider that such approacheshave no immediate prospect of predicting intake.
In order to predict intake for a given kind of animal it is necessary toconsider the food contents of protein, fat and carbohydrate, the amino acidcontents of the protein and the contents of minerals, vitamins, water and theindigestible – or only slowly digestible – components such as fibre. It is alsonecessary to know the climatic environment, as energy requirement can beincreased in a cold environment, and a hot environment can limit the rate atwhich the animal can dispose of heat. To these factors must be added adescription of the animal, to allow animals of different potentials to be includedin the prediction model. The description of the animal will include growth rateand body composition, or milk yield and composition.
The paper by Emmans and Kyriazakis (2001) provides equations for thecalculation of energy requirements, considered to be the driver for food intake, butdoes not address constraints other than to mention that it is sensible to selectanimals for heat tolerance where intake is limited by a hot environment, and forhigher capacity for forages in situations where forage is cheaper than concentrates.
192 Chapter 9

Multiple constraints
A more comprehensive constraints model for growing cattle is proposed byPoppi et al. (1994), in which six potential limits to intake are calculated andwhichever gives the lowest predicted intake is assumed to be the limiting factor;no attempt is made to integrate or add these limiting factors. Nevertheless,there are several interesting ideas in this model. The six factors are:
1. Rate of eating; this is of importance as it is likely that there is an amount oftime per day above which the animal will not eat, which is thought to be12–13 h/day for ruminants. However, motivation to eat, and thus maximumtime per day spent eating, is likely to be flexible and to depend on demand fornutrients.2. Faecal output; faecal output of steers for forage-based diets has been foundto be 9.6 g DM/kg body weight/day. In practice, the rumen is likely to be thelimiting part of the digestive tract, but this cannot be predicted from faecaloutput unless digesta flow is known.3. Ruminal turnover; this essentially is the rate at which the cell wall is digestedand its particles leave the rumen.4. Nutrient requirements; this is expressed as the potential for proteindeposition and is acknowledged as being a difficult area in view of the fact thatthe level of food intake to some extent affects the rate of growth, milk yield, etc.and thus the ‘nutrient requirements’.5. Heat dissipation; there is a physical limit to the rate at which heat can belost, depending on environmental factors such as air temperature, wind speedand humidity. Heat produced in excess of the capacity to lose it results in a risein body temperature and a defensive reduction in voluntary intake.6. Metabolism; a common factor is fluxes of ATP; ATP must be degraded withimbalanced diets, and an upper limit can be set for this metabolism in order tolimit intake.
As the authors did not consider that there was a good concept of how theshort-term effects on intake, which might be additive, are used in the long term,they used the most limiting factor at any moment in time to predict intake.Seven diets were chosen to be representative; values for nutrient absorptionwere obtained from the literature and the model solved for the equationspredicting the strength of each of the six limiting factors.
For a steer of 100 kg empty live weight and starting with 15.4 kg of proteinand 4.4 kg fat in the body, initial pool sizes were: ATP, 292 mol; C2 equivalents,5.8 mol; C6 equivalents, 23.8 mol. Rates of eating of 3–30 g/min were used,from the literature. Maximum capacity of the rumen was set at 13.8 g NDF/kgbody weight and maximum faecal output was set at 9.6 g/day/kg body weight.Particles can leave the rumen when 80% has been digested. Literature valueswere used for NDF content and rates of digestion of NDF, and the geneticpotential for protein deposition was set at 298 g/day.
Duodenal absorption of protein from the different foods was used toestimate how much food could be eaten before excess limited intake, assuminga value of 80% for efficiency of utilization of amino acids. An upper limit of
Integrative Theories of Food Intake Control 193

1100 kJ/kg wt0.75/day at 20°C was used for heat dissipation; heat production iscalculated from the inefficiency of utilization of ME, calculated from the ATPutilization and energy retained as fat and protein. The rate of ATP degradationis speculative, but was subjected to sensitivity analysis. A standard value of45 mol ATP degradation/day was taken, arrived at by iteration of the model.
In general, there was good agreement between the model’s predictions andliterature values, but predicted intakes were usually somewhat higher (see Table9.1). Substrate cycling was a limiting factor for all foods, while rate of eatingdid not pose a limit with any of the diets used, but is probably important ingrazing animals. Assuming a constant maximum fill of NDF may be wrong inview of the likelihood that different signals are interpreted additively by theCNS (see Chapter 10). Fractional digestion rate is not sufficiently welldocumented and, as digestion approaches its plateau, small differences in therate of digestion will make big differences to the time taken to reach that pointand therefore the residence time.
The fact that rumen fill needs to be set lower than the assumed maximumsupports the concept that animals often do not utilize their full ruminal capacity.Substrate cycling limits intake in many of the simulations, implying that nutrientimbalances are often limiting intake. Where two or more factors are almostequally limiting, removal of one may not increase intake, and thereby lead tothe conclusion that it is not important; however, it is highly unlikely that varioussignals are used in an exclusive manner but that they are integrated, perhapsadditively. If this is true then the model of Poppi et al. (1994) should bemodified to integrate the various limiting factors in a more physiologicalmanner, along the lines suggested below and in Chapter 10.
This type of model, based on a time interval of less than one day but morethan a few minutes, is particularly useful as it allows integration of voluntaryintake into well-developed models of digestion and metabolism. It does not,however, allow meal patterns to be studied or simulated in a realistic way.
194 Chapter 9
Table 9.1. Observed and predicted dry matter intake by a Friesian steer of 100 kg emptybody weight consuming various feedstuffs. *, limiting factor(s) (from Poppi et al., 1994).
Dry matter intake (kg/day)
Predicted from:
Rate of Faecal Ruminal Genetic Heat ATPFood type Observed intake output turnover potential dissipation degradation
Concentrate 2.3–2.7 33.4 3.7 6.0 4.3 4.0 2.2*Legume > 2.6 7.9 4.2 16.5 2.9* 4.3 2.4*Grass 2.6 11.8 5.3 6.2 3.9 4.1 2.2*High-D silage > 1.8 3.8 4.0 5.3 3.9 3.9 2.2*Low-D silage 1.8 3.8 2.7* 2.9* 5.3 4.7 2.7*High-D dried
grass 2.5–2.8 11.1 4.0 5.9 4.6 4.8 2.4*Low-D dried
grass 2.2–2.4 7.7 3.1* 3.3* 4.4 5.5 3.0*

Comparisons and criticisms of constraints models
The basis of constraints theories – that each limiting factor is considered tohave no effect on intake until its constraining limit is reached, at which point nofurther intake is allowed – seems untenable. Under this concept it is imaginedthat stimulation of receptors sensing rumen fill, for example, should contributenothing to intake control until a certain degree of stretch is reached, at whichpoint rumen fill suddenly becomes the only factor to control food intake.
Pittroff and Kothmann (2001a, b) have criticized much of the modelling workon food intake by ruminants and have been particularly critical of the TPH, startingfrom the basis that it has been used in many models of ruminant food intake overthe past 30 years and has yielded no consistently successful predictive system. Theyfound weak concepts in the sense of ability to accommodate experimental data;rarely did they find a serious attempt at sensitivity analysis or proper validation.Also, the mathematical properties of models were frequently questionable and theyclaimed that the modelling approaches they reviewed provided a distinct lack ofdirection for future research, i.e. an absence of new hypotheses. Suggestions weremade for improved model development, implementation and documentation.
Pittroff and Kothmann (2001c) reviewed 11 published prediction modelsfor sheep and 12 for cattle, mainly for intake at pasture. There was a widerange of predictions, in which the highest was approximately double the lowest,and the authors dismissed the modelling approaches used as unsuitable basesfor predicting the voluntary intake of forage. In particular, they were stronglycritical of the lack of a formal approach to modelling in most of the cases cited,i.e. a failure to state the limits within which the model is designed to operate; afailure to present examples of calculations from their models and discuss thegoodness of fit with published observational data on food intake.
They highlight the need for robust, testable theory on how intake and dietselection are controlled in ruminant animals and for experiments designed totest specific hypotheses, rather than just being used to collect yet more data:
… the analysis provides disturbing evidence of the failure of model developers tothoroughly examine the theoretical basis of key assumptions upon which theirmodels rest. Although it would be clearly more appropriate to formulate models asresearchable hypotheses, given the current state of knowledge of intake regulationin ruminants, this is generally not done.
(Pittroff and Kothmann, 2001c)
Fisher et al. (1987) were also concerned with progress in modelling intake,observing that previous models had used only the physically limited intake or,when the metabolically controlled intake was included, whichever was thelower was used as the predicted level of intake. They proceeded, therefore, toincorporate both simultaneously to take into account the likelihood (see belowand Chapter 10) that the factors that control intake do so in concert rather thanseparately.
On the one hand, they used a simulation of digestion and passage (Mertensand Ely, 1979) as a basis for the physical limit; fibre was classified into threeparticle size classes, each with different digestibility classes and a maximumrumen DM fill of 1.9% of body weight was assumed. On the other hand, they
Integrative Theories of Food Intake Control 195

supposed the optimal flow of nutrients to be that absorbed from a food of 650g/kg DM digestibility, this being approximately the point above which intakeappears to be controlled metabolically. Rate of intake (I) was assumed to bebased on the ratio of current rumen contents to maximum contents (D) and theratio of current nutrient flow to optimal flow (C) according to the equation
It+1 = ItDCaDb (9.1)
in which the exponent a limited the chemostatic effect relative to distension andthe exponent b gave an increased chemostatic effect at low levels of distension.When a and b were set to zero to eliminate the chemostatic feedback, intakeincreased with increasing digestibility (decreasing NDF content) in a curvilinearmanner right up to the highest digestibility, as expected. Setting a to 0.2 and bto 5 reduced the increase in intake per unit increase in digestibility and gavereduced intakes at very high digestibilities.
Whereas rumen fill was constant when no chemostatic feedbacks wereincluded, it decreased with increasing diet quality when such feedbacks wereused. Daily intake declined with increasing NDF content and increased withincreasing energy demand by the animal, although no quantitative informationon the latter point is presented.
Combinations of Relationships into Predictive Models
Even the most complex equation cannot adequately represent what we know tobe the range of factors that affect intake and can therefore be used in itsprediction. Some of these factors are discontinuous while others are conditional.Several prediction systems have been developed with the aim of making themmore flexible and general than any one single equation. Some approachesinvolve iterative calculations and are as much to explore the limits of ourunderstanding as they are to be used for predictions under practical conditions.
Institut National de la Recherche Agronomique, France
A comprehensively documented system of prediction of food intake byruminants has been developed by Jarrige and his colleagues at the NationalInstitute for Agricultural Research of France (Jarrige et al., 1986). This systemdepends on knowledge or prediction of the animal’s ingestion capacity for astandard food, the ingestibility of a food relative to that of a standard food by astandard animal and substitution rates for concentrates in place of forages.
The animal’s ingestion capacity for a standard food
Observations of food intake of cows on 59 different dietary regimes, corrected to600 kg live weight, showed that the ingestion capacity (bulk units for cattle, BUC)was closely related (r = 0.88) to milk yield (kg of fat-corrected milk/day, MY):
BUC = 10.43 + 0.26MY (9.2)
196 Chapter 9

The data were for cows having a mean yield of 17 kg/day (range 10–28),at which level the capacity is 14.9 BUC. During the first month of lactation, andfor the whole of the first lactation, ingestion capacity is reduced by 0.15because heifers and recently calved cows have low voluntary intakes. Intakecapacity (IC, kg/day) was predicted from:
IC = 22 – 8.25 exp(–0.02MP) + 0.01(LW – 600) (9.3)
where MP is milk production (kg FCM/day) and LW is live weight (kg).Ingestion capacities for suckler beef cows are also tabulated by INRA (1979).
The ingestibility of a food relative to that of a standard food by a standard animal
The ingestibilities of some 2500 forages by ‘standard’ sheep (castrated malesaged 1–3 years and weighing 40–75 kg) have been determined. A pasturegrass which was used as the standard food had a mean intake by such sheep of75 g/kg0.75; on average, this grass contained 150 g CP/kg DM and 250 g CF/kgDM with an organic matter digestibility of 770 g/kg. By definition, 1 kg DM ofthis standard food has a bulk value of 1 bulk unit for sheep (BUS). Thus theBUS value for other forages is 75 divided by the amount of that forageconsumed by the standard sheep/unit of metabolic live weight. Typically, greenleguminous plants have a BUS of around 0.8 while straws are 2.0–2.5 BUS.
The ingestibility of forages by cattle is higher than by sheep, for any givenfood. Data from a large number of feeding trials in which the same forage wasoffered ad libitum to both sheep and cattle were used to allow BUC to bepredicted from BUS:
BUC = 57 + 0.87BUS (9.4)
Thus the standard grass has an ingestibility for cows of 122.6 g DM/kg0.75
which, for a 600 kg cow, is 14.9 kg DM. The bulk value for a forage for cattle istherefore 122.6 divided by its ingestibility in cattle.
Substitution rates for concentrates in place of forages
The INRA algorithm for this is covered in Chapter 11.The system devised by INRA (1979) is designed to be used in situations
where physical factors are predominant in the control of intake. That is, foragesare to be used as much as possible, concentrate supplements being given onlyto the extent demanded by the desired level of production. However, there isnow a recognition that nutrient demand can exert some influence on voluntaryintake of forages, so it will be interesting to see how well the principles andprocedures adopted in the INRA system cope with the needs of farmers andadvisors.
Integrative Theories of Food Intake Control 197

Interactions between Factors Affecting Food Intake
To suppress feeding in rats completely (cause satiety?) it is necessary to infusenot just a supply of energy but also fat and protein, and it is abundantly clearthat satiety is not induced by a single mediator acting on a single group ofreceptors in a single target organ. Any experimental treatment given on its ownmust usually be applied at a level far above that achieved in the normal animalin order to prevent feeding completely.
For example, in order to suppress feeding totally by infusion of glucose intothe hepatic portal vein it is necessary to give quantities greatly in excess ofthose normally flowing in the portal vein, even after a very large meal. Thus, ifall of the pathways described above are involved in controlling intake, theirsignals must be integrated by the appropriate circuits in the brain. Presumablythese signals which fluctuate rapidly in relation to meals are added to a morestable signal coming from adipose tissue, and a relatively small change in thestrength of the signal from adipose tissue will, in the long term, play asignificant part in controlling intake.
Food intake is also affected by positive signals, such as the sight or soundof other animals eating, and the delivery of fresh food. These are presumablyintegrated with the negative signals coming from the visceral receptors todetermine whether or not feeding should occur.
Although the discussion of ‘modern’ theories of the control of intake startedoff with energostasis, it is necessary to include other factors, particularly thephysical fill of the digestive tract and the sensory characteristics of the food.There are many ways in which these signals might be combined in order togenerate the final outcome in terms of feeding; two possibilities are that theyare either added or multiplied.
Consider one set of receptors sensitive to stretch in the stomach wall andanother set of chemoreceptors in the liver, both responding to increases instimulation during and after a meal. The signal from the stretch receptors willbe S � Ns, where S is the degree of stretch and Ns is the number of receptors.Similarly, the signal from the chemoreceptors will be C � Nc, where C is theconcentration of the chemical(s) to which the liver receptors are exposed andNc is the number of such receptors. Geometric combination of the two signalswould give:
IS = (S � Ns) � (C � Nc) (9.5)
where IS is the strength of the integrated signal. However, should either of thefamilies of receptors not be stimulated (as may occur with a highlyconcentrated food that does not stretch the gut wall or a totally indigestible‘food’ that does not yield any nutrients to stimulate the liver) and S or C aretherefore zero, then the combined signal will be zero:
IS = (0 � Ns) � (C � Nc) = 0 (9.6)
or
IS = (S � Ns) � (0 � Nc) = 0 (9.7)
198 Chapter 9

and intake will be uncontrolled. This led to an alternative possibility: that theeffects on intake of stimulation of different groups of receptors are additive:
IS = (S � Ns) + (C � Nc) (9.8)
Booth (1978) found it necessary, in order to prevent excessively large meals, toinclude distension as well as energy feedbacks in a rat model in an additivemanner, equating distension with Joules and adding this to the genuine energysignal. This is in contrast to models based on the TPH, in which feeding wasstopped by energy supply or gut fill, whichever was first to reach a critical level.There is sufficient evidence to be able to conclude now that some feedbacksignals combine additively in their effects on intake, rather than being mutuallyexclusive, and experimental evidence for additivity of feedback signals insupport of this equation is presented in Chapter 10.
Maximizing efficiency
Dissatisfied with the concepts of distension and chemical feedback ascontrollers of intake in ruminants, Ketelaars and Tolkamp (Ketelaars andTolkamp, 1992a, b; Tolkamp and Ketelaars, 1992) have explored theoreticallythe costs and benefits of food consumption and proposed that intake iscontrolled to optimize the ratio of oxygen consumed to net energy madeavailable.
They give several examples of animals behaving in ways that minimize theratio of oxygen consumed to work done, showing that, for example, horsesprefer to walk, trot or gallop at speeds at which they are most efficient. Usingdata collated by the Agricultural Research Council (ARC, 1980), they havesought to demonstrate that ruminants eat that amount of food/day at which netenergy production per mole of oxygen is maximized.
Figure 9.1 shows the relationships between the efficiency of obtaining netenergy by oxidation (ratio of net energy intake (NEI):oxygen consumption) andthe level of food intake (ratio of net energy intake:net energy required formaintenance) for foods of several metabolizabilities which, according to theequations of ARC (1980), reach maximum values at points at which animalsare predicted to consume each food voluntarily. For example, a food with ametabolizability (q) of 0.55 shows a peak of NEI:O2 consumption at the samelevel of intake of this food (1.4 � maintenance) that sheep consume voluntarily.
In attempting to answer the question ‘How can oxygen utilization bemeasured?’, Ketelaars and Tolkamp suggest that intracellullar pH is capable ofbeing monitored and is, in part at least, influenced by oxygen consumption.However, intracellular pH is influenced by numerous other factors and wouldbe an unreliable indicator of oxygen consumption. Even if the latter could bemeasured, why should animals seek to be optimally efficient? Presumablythrough evolution, gross inefficiency has been avoided but there is no moreevidence that animals want to be efficient than that they want to becomfortable. Although such a novel approach is refreshing, there is too littleevidence on which to accept their claims at the present time.
Integrative Theories of Food Intake Control 199

In a recent development (Tolkamp et al., 2007), the investigators haveextended their coverage of this theory to fattening animals, with veryencouraging results, and this is covered in Chapter 15.
Concept of Weston (1996)
A recurring theme in food intake control, especially for ruminants, is the ideathat animals eat to meet their nutrient (energy) requirements unless preventedfrom doing so by one or more constraints, of which the constraint of gut fill isthe most common. This is expressed in the two-phase hypothesis (TPH, seeabove). Concerns about the validity of the TPH in its simple form led Weston(1996) to revisit the subject and to present his concept of the principles onwhich ruminants control their food intake.
His assumptions included the common one that the animal’s capacity touse energy is the sum of the requirements for maintenance plus growth plusreproductive activities, including lactation; this capacity is reduced when
200 Chapter 9
Fig. 9.1. The efficiency of oxygen utilization (NEI:O2 consumption) as a function of NEI forroughages of metabolizabilities (q) 0.45–0.65. ♦, values corresponding to the averageobserved voluntary intake of such feed by sheep (Tolkamp and Ketelaars, 1992, usingequations from ARC, 1980).

pathways of oxidation or synthesis are blocked, e.g. by inadequate levels ofessential nutrients (including glucogenic substrates) or when climatic conditionslimit rate of heat loss.
He proceeded to propose that energy deficit generates hunger signals, thestrength of which is linearly related to magnitude of deficit. His other basicassumption was that forage constraints include resistance of flow of OM fromthe rumen, difficulties of harvesting and prehension, environmental stressesand ‘low diet palatability’, whatever is meant by this. He observed that theclearance rate of digesta OM from the rumen and quantity of OM in rumen aredirectly related, but with a limit to the increase in OM removal. The digestaload generates a satiety signal, directly related to rumen load once a thresholdis reached. Weston viewed such factors as stretch, osmolality, chemical effectsand hormones as warning signals preventing overloading of the system ratherthan as satiety factors per se, and points out that feeding pattern can easily bedisturbed without much change in daily intake. However, we must considertheir roles as US in the development of conditioning (see Chapter 6).
Critically, Weston then proposed that feeding drive is overcome when thecombined inhibitory signals more than balance the hunger signals. As evidenceof the interplay between ruminal digesta load and energy deficit, he pointed tothe increase in ruminal digesta load when voluntary intake of a low-energyfood (forage) is low. Also, infusion of a nutrient solution into the abomasum oflambs fed low-quality forage decreased both intake and ruminal digesta load,showing that intake was no longer limited by capacity, even if it had beenbefore the infusion. While glucose infusion i.v. into lambs fed high-quality foodreduces voluntary intake with almost exact energy compensation, with poorforage similar infusions do not decrease intake sufficiently to give completecaloric compensation. It indicates that both physical and metabolic factors canbe acting at the same time.
Whereas the inverse relationship between digesta load and energy supplyis seen in animals of similar physiological state, when energy demand changesthere are changes in load and energy intake – e.g. lactation, in which energyintake increases and digesta load increases. Thus, load can be the same atvarious energy intakes because of differences in capacity to use energy.
Figure 9.2 is the conceptual relationship between the ruminal digesta ‘load’and energy deficit for forages without (ABCD) or with (EFGD) constraints such as‘low palatability’. Weston places great emphasis on energy deficit (the shortfall inenergy supply being the difference between the current supply from the food andthe optimal supply to satisfy all requirements). When energy deficit is zero (A)then reducing the yield of DOM/kg of food (digestibility) causes an increase inDM intake and ruminal digesta load (B). Further reduction in digestibility resultsin a further increase in rumen load, but not sufficient to prevent a decrease inenergy intake, giving the linear relationship from B to C. On reaching C, furtherreduction in the digestibility does not result in further increase in rumen load asthe rumen is ‘full’ (CD). The concept that BC is linear suggests that Westonviewed hunger and satiety signals as being additive, at least up to a certain point.
A further proposition is that limiting factors move the relationship to the right,i.e. for any given energy deficit, intake and rumen load is lower than for a food
Integrative Theories of Food Intake Control 201

without such constraints. Although Weston puts forward ‘palatability’ as being aparticularly important example of a constraint, he does acknowledge that: ‘Thesignificance of low palatability as an intake constraint remains a vexed question’.
Note that rumen load in Weston’s concept has a fixed upper limit, incontrast to some others in which it changes according to metabolic state (e.g.Mertens, 1994). However, is the notion realistic that the rumen allows itself tobe filled until a sudden, fixed limit is reached? The question is addressed inChapter 10 through the MTD hypothesis.
Conclusions
Many theories of the control of voluntary intake have concentrated on singlefactors such as gastric distension, blood glucose concentration, bodytemperature or fat stores. In ruminants, distension of the rumen and infusion ofshort-chain fatty acids have additive effects on intake but this has not beenproperly incorporated into models of intake by ruminants, although additivityof distension and metabolic signals is a feature of the early rat models.
More recent theories of intake control have included those in which theefficiency of utilization of oxygen for net energy production is maximized, andthis may in some way be coupled to feelings of metabolic ‘comfort’, whichanimals presumably seek to maximize.
Mathematical models help us to understand the relative importance ofdifferent factors affecting and controlling intake. Models are only as good as theconcepts and data from which they are built, but play a vital part in theadvancement of our understanding of what controls food intake.
202 Chapter 9
Fig. 9.2. Conceptual relationship between energy deficit in sheep and rumen digesta load.Solid line is without, and dotted line with, inhibitory factor(s) such as low palatability (fromWeston, 1996).
10 Minimal Total Discomfort
In previous chapters it has been shown that many factors affect food intake, butit is uncertain as to whether each factor in question plays a significant role inthe normal control of intake. Some of these difficulties can be overcome by ahypothesis that negative feedback signals are interpreted by the CNS in anadditive manner. In this chapter the evidence for the integration of signals,particularly by addition of their effects on intake, is presented. This is followedby the development of the Minimal Total Discomfort (MTD) hypothesis, inwhich it is proposed that animals eat that amount of food, and such a mixtureof foods where more than one is available, so as to minimize the ‘discomfort’emanating from the integrated sum of the deviations of the various factors fromtheir optimal.
Evidence for Additivity
Poultry
The effects on the food intake of cockerels of various combinations of loadingthe crop with glucose solution and infusion of glucose into the portal vein on 3-h intake are additive (Shurlock and Forbes, 1981a). Not only are the effectsof the same nutrient administered into different sites additive, but also differentnutrients given into the same site. A mixture of amino acids depressed intakemuch more when infused into the portal vein than into the jugular vein(Shurlock and Forbes, 1984), and several combinations of amino acid mixtureand glucose given into the portal vein had similar effects on food intake duringthe 3-h infusion.
Similarly, lysine and glucose infusions into the portal vein have additiveeffects (Rusby and Forbes, 1987a); whereas the birds ate 71 g during the 3-hinfusion of saline, intakes were depressed to 54 and 61 g with 300 mg lysine
© J.M. Forbes 2007.Voluntary Food Intake and Diet Selection 203in Farm Animals 2nd Edition (J.M. Forbes)

and 1260 mg glucose, respectively. When both metabolites were given togetherthe intake was 46 g, which is almost exactly the sum of the depressions causedby the two given separately (see Fig. 4.2).
Cattle
To test the hypothesis of additivity of negative feedback signals in lactating cows,Mbanya et al. (1993) applied distension of the rumen by a balloon (10.0 l),infusion of acetate (9.0 mol/3 h) into the rumen and infusion of propionate (4.0mol/3 h) into the rumen, each of which had a small and non-significant effect onsilage intake. When given in combination there were additive effects in mostcases, to give significant depressions in intake (see Fig. 10.1).
The only exception to the general observation of additivity was whensodium acetate infusion was combined with sodium propionate infusion. Whileit is possible that this is a chance finding, it can also be explained in terms of animbalance of nutrients. Infusion of a single metabolite, such as acetate, upsetsthe normal balance of volatile fatty acids, which makes the animal feeluncomfortable. A simultaneous infusion of propionate, in a ratio with acetatesimilar to that normally produced by fermentation, corrects the imbalance,making the animal more comfortable and therefore not depressing intake.Overall, however, the evidence is for additivity.
204 Chapter 10
0
0.2
0.4
0.6
0.8
1
1.2
1.4
1.6
C A P D A+P P+D A+D A+P+D
Treatment
* *
**
DM
inta
ke (
kg/3
h)
Fig. 10.1. Intake of silage DM by dairy cows given distension of the rumen (D, 10.0 l for 3 h),intra-ruminal infusion of acetate (A, 9.0 mol/3 h) and propionate (P, 4.9 mol/3 h) eitherseparately or in combination). Significantly different from control (C): *P<0.05, **P<0.01 (fromMbanya et al., 1993).

Sheep
Equivalent experiments with sheep have given similar results. Sodium propionatesolution at 0.6 mmol/min into the hepatic portal vein depressed intake additivelywith sodium acetate into the rumen at 2 mmol/min for 3 h, as did ruminal acetateinfusion and balloon distension (1 l) (Adams and Forbes, 1981).
If one negative feedback factor is administered experimentally at a rate thatinitially completely suppresses feeding, it is to be expected that eventually,when other negative factors have declined to low levels due to an abnormallylong period without food, the exogenous treatment will no longer be sufficientto prevent feeding. Infusion of sodium propionate into the hepatic portal veinof sheep at 1.2 mmol/min for 3 h prevents feeding for the whole of this period(Anil and Forbes, 1980b). When infusion continued for longer periods, smallmeals started to occur after about 6 h of treatment and were then morefrequent than on control days (P.M. Driver and J.M. Forbes, unpublishedresults). Although intake was significantly depressed during 7 h of infusion, thefact that eating did resume agrees with the general theory of additivity.
If one set of receptors is denervated and the brain is no longer aware of theextent of stimulation by negative feedback factors, the animal might beexpected to continue feeding for a longer time during each meal than beforethe denervation. Because of these large meals, levels of all negative feedbacksignals will rise to higher levels and for longer than usual, which will lead to alonger interval before the next meal occurs. This happens when the liver isdenervated in rabbits (Rezek et al., 1975), sheep (Anil and Forbes, 1980b) andchickens (Rusby et al., 1987).
So far, our examples of additivity have been for signals that inhibit feeding.Aydintug and Forbes (1985) studied combinations of noradrenaline injectedinto the lateral ventricles of sheep (a potent stimulus to feeding, see Chapter 5)with infusions of acetate into the rumen; additivity is, once again, quite clear:while noradrenaline stimulated intake (292 g versus 217 g/3 h for control) andacetate inhibited feeding (18 g/3 h), noradrenaline partly reversed the effect ofacetate when both were given together (98 g/3 h), i.e. almost exact additivity.
There is general agreement, then, that small, experimentally inducedchanges in several signals that might be involved in food intake act together toreduce food intake. The sum of such small changes that occur during aspontaneous meal might be sufficient to be satiating.
The concept of additivity is useful in understanding situations, such aslactation, where there is a very high rate of utilization of metabolites, leading tothe under-stimulation of chemoreceptors. The animal can therefore suffer agreater degree of distension before the total of the negative feedback signalsreaches the level at which feeding is switched off.
Egan (1970) added casein to a straw diet or infused casein into theduodenum and saw increased voluntary intake by sheep. The volume of ruminalcontents was increased, and Egan suggested that there is a mechanism thatallows greater fill when protein nutrition is improved. He also saw the possibilitythat concentrate intake might be regulated by ruminal volume being ‘set’ at alower level than for forages; these ideas do not now seem so speculative as they
Minimal Total Discomfort 205

did in 1970. Improving the protein status of the sheep allowed a more rapidutilization of nutrients and thus a greater degree of ruminal distension before theircombined signal became satiating.
It might be, therefore, that additivity is a general phenomenon involvingmany factors affecting food intake, not simply the negative feedbacks from theviscera, and that intake and body weight are the net result of the effects of thesemany factors. This theory helps to resolve the conceptual difficulty of copingwith the many factors that affect intake and may be involved in its control.
No longer do we have to take the pessimistic view, expressed by aneminent animal scientist, that: ‘The problem in research in intake regulation isthe establishment of evidence for or against mutually exclusive alternativehypotheses’. For such a view to be valid it would be necessary to assume that afeedback signal, say stomach distension, which was controlling intake with apoor-quality food, suddenly disappeared (or was suddenly ignored by theCNS) when the quality of the food was improved so as to bring it into the‘metabolic’ range. It seems highly unlikely that this would be the case.
Maximal stimulation of one population of receptors, perhaps causing pain,may saturate the control system and prevent other stimuli having additiveeffects on feeding. Grovum (1979) found that distension of the reticulum with800 ml of water in a balloon depressed intake to a marked extent, but thatsimultaneous abomasal distension had no further effect. This result might beexplained by the likelihood that mechanoreceptors in the reticulum weregrossly affected by a balloon of such large size in relation to the capacity of thatviscus, especially as the reticular wall is relatively inelastic.
Afferent pathways for negative feedbacks
This section presents anatomical and physiological evidence that signals frommetabolic receptors converge with those from other classes of receptor, such asthose monitoring visceral distension, osmolality and adiposity, to provide theCNS with a composite picture of comfort/discomfort and thus to play a vitalpart in influencing intake and preferences for food.
From the mouth to the anus, food and digesta provide a continuouslychanging set of stimuli to stretch and tactile receptors. There is considerableconvergence in the afferent branches of the autonomic nervous system thatrelays the impulses to the CNS (Forbes, 1996). The work of Leek andcolleagues showed how physical and chemical stimulation of receptors in thedigestive tract activates vagal afferent pathways to the gastric centre of themedulla oblongata (Forbes and Barrio, 1992). In addition, the liver is sensitiveto propionate, once again relaying its information to the CNS via autonomicafferents (Anil and Forbes, 1987) and providing a comprehensive assessmentof the energy supply via the liver.
It seems unlikely that the CNS could interpret individually the nature anddegree of stimulation of each receptor in the viscera, as there are bothpolymodal and polytopic integration of visceral signals with convergence inganglia and in hind-, mid- and forebrains.
206 Chapter 10

Pain?
If we are to place reliance on a smooth relationship between stimulus andresponse in the context of feedback signals from the viscera and food intake,we must address the question of whether the supraphysiological stimulationrequired to depress food intake significantly represents an extremity of adose–response relationship that includes also a small (and often non-significant)depression in intake caused by mild and physiological stimulation of one typeof receptor. Cervero (1994) says that visceral sensations (including pain) arecarried by spinal afferents while reflex regulation of visceral function ismanaged through vagal fibres, i.e. physiological and supraphysiologicalsensations are relayed to the CNS via different pathways.
However, Janig and Morrison (1987) see abdominal pain as an extension ofnormal sensitivity to stimuli such as distension of a viscus or irritation of a mucosalsurface by chemicals, i.e. the afferents responsible for relaying abdominal pain arethe same as for physiological functions, but that different ranges of stimulation areinvolved. They observe that most neural units studied in various abdominalviscera have stimulus–response functions covering the normal and supranormalranges of pressure in a single curve. This agrees with the effects of different degreesof distension, and different rates of infusion of VFA salts into the rumen, on foodintake by ruminants (see Chapter 3), where a single dose–response curve fits thedata for dose ranging from physiological to well above the physiological range.
Thus, while a large stimulus is required to induce a statistically significantreduction in food intake, the effects of smaller stimuli, within the physiologicalrange, are part of a continuum with the more extreme doses; they can beconsidered to cause discomfort rather than pain. Additivity of feedback signals,discussed above, could account for satiety, with modest changes in manysignals being summed to provide a general, total signal of visceral stimulation.
Minimizing Discomfort
Knowing that animals learn to associate discomfort induced by ingestion of toxicor imbalanced foods with the sensory properties of those foods (see Chapter 6),it seems reasonable to propose that animals eat to optimize their comfort. It is,as we know, uncomfortable to have an insufficient supply of nutrients, so we eatto reduce the discomfort of hunger. It is also uncomfortable, and sometimespainful, to eat too much food or to eat poisonous materials, so we avoid eatingtoo much and avoid eating poisonous foods. Thus, by eating for minimumdiscomfort, we integrate positive and negative signals but then rely to a greatextent on what we have learned to be the consequences, in terms of discomfort,of eating foods on previous occasions.
The use of the term ‘discomfort’1 in this context has been criticized, but isjustified on the grounds that animals would prefer not to suffer discomfort and
Minimal Total Discomfort 207
1 Something that causes difficulty, trouble or lack of ease (http://www.answers.com/topic/discomfort).

will behave in such a way as to minimize it – preferring a balanced diet to anunbalanced one is an example of avoiding a discomfort.
Theories based on discomfort have to rely on human experience and suchanimal feelings as can be deduced from learned associations, preferences andoperant conditioning. Science progresses by dissatisfaction with currentexplanations, leading to new or modified theories and then to experiments todemonstrate or otherwise the validity of these theories. The challenge now is todevelop experimental methodologies to measure animals’ comfort ratings. Giventhat metabolic comfort is primarily subconscious, this is a significant challenge.
Minimal Total ‘Discomfort’ (MTD)
Why talk about ‘minimizing discomfort’ rather than ‘maximizing comfort’?Because there is no quantitative way of defining what is maximum comfort,whereas the minimum for discomfort is clearly zero.
It is apparent that animals are eating to obtain the nutrients they need tosurvive and to ensure their genes survive. The physiological state of the animaldetermines the optimum rate at which each tissue takes up each nutrient fromthe blood in order to meet genetic targets, and an inability to supply these infull leads to signals whereby the state of deficiency is transmitted to the centralnervous system.
An excess leads to signals of toxicity. Moderate deficiencies or toxicities canbe tolerated – the tissue in question, or another tissue(s), adapts to cope withthe situation but, the more extreme the difference between supply anddemand, the stronger the message becomes and the more urgently is theanimal driven to redress the imbalance – to reduce the discomfort (for thepurposes of this discussion we classify energy as a ‘nutrient’ – more correctlywe could encompass nutrients, energy, bulk and flavour as ‘properties’ of foodsor of ‘resources’ provided by foods). In addition, factors such as the bulk offood, difficulty of losing sufficient heat to the environment and limitations ongrazing time per day (constraints) can all be viewed as generating discomforts;so can environmental and social factors.
There are numerous food properties that can be presumed to generatenegative feedback signals because experimental addition of these to the diet, orintroduction directly into the animal enterally or parenterally, generates dose-related reductions in voluntary food intake (see Chapters 3 and 4). It seemslikely that the signals generated by the various families of chemo- andmechanoreceptors in the abdomen are integrated by the CNS in an additivemanner (see above) but, when it comes to using this concept to predict foodintake, the problem of expressing the various factors in a common currency hasto be faced.
We can propose that the difference between the rate at which a foodproperty is supplied and the optimal rate for body functioning generates‘discomfort’ in proportion to the magnitude – but not the sign – of thedeviation, expressed as a proportion of the optimal rate. We then square therelative discomforts before adding them, justified as follows.
208 Chapter 10

We will start by considering the very simple case involving just two foodproperties, energy and protein. In Fig. 10.2, the intake of each is representedalong an axis of the two-dimensional relationship between the two properties.If the animal’s current food intake provides energy and protein in amountsrepresented by point A and its optimal intakes of energy and protein are atpoint B, then its desired trajectory is indicated by the arrow from A to B. Thestrength of the combined deviation in energy and protein supplied isrepresented by the length of this arrow, which is calculated (Pythagoras) as thesquare root of the sum of (A – B)2 and (B – C)2. Thus, the combineddiscomfort (d) generated from energy (E) and protein (P) can be calculatedfrom the squares of the two separate deviations.
dEP = sqrt(dE2 + dP2) (10.1)
Squaring the deviations provides two practical benefits: (i) discomforts arealways positive, whether more or less than the optimal quantity of a resource iscurrently being consumed; and (ii) large deviations have a disproportionatelygreater feedback effect than small ones, in line with physiological expectations.A sheep with an optimal supply of ME of 20 MJ/day, but only eating anamount of food that provides 15 MJ, will have a relative discomfort from lackof ME of (20 – 15)/20 = + 0.25, as would a similar sheep receiving 25 MJ/dayin its diet ((20 – 25)/20 = –0.25). Squaring each of these gives the same result:+0.063.
It is possible, of course that the animal is influenced by each of thedeviations in sequence, rather than in parallel as implied by the diagonal arrowin Fig. 10.2, in which case it would first change its food intake to reach itsdesired intake of one of the properties (energy or protein) and afterwardsmodulate its intake to optimize the balance between the two properties.
Minimal Total Discomfort 209
desi red
EnergyIntake
dE
current
dP
desired
Protein intake
C
A
B
Fig. 10.2. Notional pathways between an animal’s current intakes of energy and protein andits desired intakes (see text for description).

To determine whether the solution is Pythagorean or rectangular wouldinvolve designing appropriate experiments in which animals’ intakes weremonitored closely after a change of diet. A possible design would be similar tothat of Ferguson et al. (2002), in which growing pigs were given choicesbetween three foods. Although the changes in intake with time are notpresented in detail, the authors conclude that: ‘Preference was firstly againstpotentially harmful substances in the food (e.g. tannin) or an anti-nutritivefactor (e.g. cottonseed oilcake), and then for better-balanced or higher protein-value feeds’. Whether this sequential, rather than parallel, response is generalcan be answered only by further relevant experiments.
This line of reasoning can be extended to more dimensions, eachrepresenting a different source of discomfort, be it food- or environmentallyrelated. Figure 10.3 shows the case for three food factors, energy, protein andcalcium, while environmentally related factors are considered in Chapter 18.The relationship between energy and protein is the same as above, whilecalcium (C) is represented by the third dimension.
As dEP = sqrt(dE2 + dP2) and dEC = sqrt(dE2 + dC2) (10.2)
then
dEPC = sqrt(dEP2 + dC2) = sqrt(dE2 + dP2 + dC2) (10.3)
More generally:
Total discomfort = (10.4)w o c ojj
i
j j j=∑ −
1
2(( ) / )
210 Chapter 10
Energyintake
dE
current
Protein intake
dPdC
desired
Calciumintake
Fig. 10.3. Notional pathways between an animal’s current intakes of energy, protein andcalcium and its desired intakes (see text for description).

where the total discomfort is generated by the discomforts of each of an arrayof i items – food and environmental properties, where w, c and o are theweighting, current and optimal rate of supply for resource j out of the set of iresources. All the weightings are set to 1 in this example.
A worked example
As an example, we will take a growing lamb of high genetic merit for which wecan specify the approximate ‘nutrient requirements’: e.g. 20.0 MJ ME/day,0.25 kg crude protein/day, with an effect of bulk becoming increasingly strongabove an intake of NDF of 0.4 kg/day and an increasing discomfort if the timespent eating exceeds 10 h/day (grazing time does not normally go above 13 hfor sheep and 15 h/24 h for cattle). The forage offered contains 10.00 MJME/kg DM, 0.10 kg CP/kg DM and 0.6 kg NDF/kg DM, eaten at a rate of 1.5 gDM/min. A lamb eating this at a rate of 1 kg DM/day would have a discomfortdue to lack of ME of (20 – 1.0 � 10) = 10 MJ/day, giving a relative error of10/20 = 0.5 and a relative discomfort of 0.52 = 0.25. Similar calculations forCP, NDF and time spent eating give discomforts of 0.36, 0.25 and 0.012,respectively and a total discomfort of 0.93 units (square root of the sum ofsquares of each of the individual discomforts).
Repeating the calculations with a daily intake of 1.2 kg/day we find thattotal discomfort has risen to 1.09. Reducing intake to 0.8 kg DM/day gives atotal discomfort of 0.93; further iterations show that total discomfort isminimized at 0.91 when daily intake is 0.90 kg DM. This is plotted in Fig. 10.4,with discomfort on the y-axis and intake on the x-axis (note that the MTD modelrun with similar parameters (Forbes, 1999a) gave different results because adifferent weighting was applied to each factor, but this is not now consideredjustifiable at our present state of understanding).
Minimal Total Discomfort 211
0.0
0.2
0.4
0.6
0.8
1.0
1.2
1.4
0.5 0.6 0.7 0.8 0.9 1 1.1 1.2 1.3
Food intake (kg/day)
Total
Time
NDF
CP
ME
Dis
com
fort
Fig. 10.4. Calculations of discomfort due to deviations in supply of ME, CP, NDF and timespent eating from optimum, and total discomfort (see text for details).

The example given here is simple – in reality, changes in the quantity andrumen degradable fraction of the CP are likely to affect yield of ME and rate ofdigestion of NDF; excess CP can be used as a source of energy. A model ofrumen and animal metabolism should be used in conjunction with the MTDmodel if it is to be tested more realistically for its adequacy in predicting foodintake of ruminants.
Further, the function relating the deviation in supply of a food propertyfrom that required to the discomfort generated – the unweighted square of theproportional deviation from the ‘requirement’ – is not likely to be optimal. It isunrealistic to expect that an intake of a mineral at half the required rate willgenerate as much discomfort as ME supplying half the requirement, so thequestion of whether and how to place a relative weighting on each factor willhave to be resolved before this approach can be expected to generatequantitatively appropriate predictions.
There are other factors that can generate discomfort under someconditions: (i) social pressures – whether to follow the flock or to stay eating therich patch of herbage; (ii) heat production – the problem of heat dissipation ina hot environment and/or with a heavy covering of insulation; while (iii) otherconstituents to be considered include individual essential amino acids,minerals, vitamins and toxins.
Note the shallow nature of the total discomfort curve: intake can changequite a lot around the optimum with little change in TD. Emmans and Kyriazakis(1995) criticized the theory of optimization of energy yield per unit of oxygenconsumption (Ketelaars and Tolkamp, 1992b) for this very feature but, ofcourse, it’s what happens in reality – similar animals eat different amounts fromeach other and the same animal eats different amounts on different days. This isa major obstacle to the short-term predictions of intake at the level of theindividual animals (see ‘day-to-day variation’, below).
MTD in action
The example above describes how the MTD hypothesis is quantified. It will workwith inputs from one factor (i.e. just ME, as a trivial example) upwards to asmany factors as required for the situation under review. One or more of the foodproperties and/or animal requirements can be systematically altered to investigatehow MTD holds up under a variety of conditions. Examples are presented in thefollowing publications: (i) effect of dietary protein level and selection for proteinin sheep (Forbes and Provenza, 2000); (ii) rate of harvesting by sheep (Forbes,2001); (iii) choice between two types of herbage by sheep (Forbes and Mayes,2002); (iv) dietary NDF in sheep (Forbes, 2005a); (v) effect of food CP on dietselection by growing chickens (Forbes, 2005b); and (vi) food quality (energy,protein and NDF covarying), food protein, supplementation and substitution,selection for protein in sheep (Forbes, 2007). In each case the model performedin a similar manner to animals subjected to the same treatments, but it cannot beclaimed that predictions are precise – the model is semi-quantitative in its currentstate.
212 Chapter 10

EFFECT OF ME CONTENT ON INTAKE BY LACTATING COWS As a further example of theuse of the MTD model, we here investigate its performance for dairy cows overa range of foods of different qualities. ME was varied from 8 to 13 MJ ME/kg,in parallel with which NFD decreased progressively from 700 to 300 g/kg; CPwas maintained at 140 g CP/kg.
Figure 10.5 shows the predictions of intake plotted against food quality(expressed here as ME concentration) of the food for the lactating cow withoptimal intakes of 219 MJ ME/day, 1.60 kg CP/day and 8.60 kg NDF/day. Itcan be seen that intake increases with improvements in energy yield up toabout 9 MJ ME/kg, but then decreases with the highest-quality foods. When theME requirements of the animal were increased to 250 MJ ME/day (but the NDFthreshold stayed the same), the maximum DM intake was predicted to beachieved at an ME content of about 10 MJ ME/kg. An increased productiveenergy output was thus predicted to increase food intake with diets of high MEcontent; despite no change in the ‘capacity’ to handle fibre, the intake offorages was predicted to be increased by increased nutrient demand, asobserved by Tulloh (1966).
The predicted change-over from a positive to a negative relationship is notabrupt, as suggested by Conrad et al. (1964) but, as envisaged by Owen et al.(1969) and observed in practice (Bines, 1979; NRC, 1987, p. 57), occursgradually in a manner that is more biologically credible than a sudden changein slope.
APPLICATION OF MTD TO LAYING HENS In this example, the laying hen has optimalintakes (‘requirements’) of 1.25 MJ ME, 3 g calcium and 25 g protein/day andis offered a single food containing 11.5 MJ ME, 17 g crude protein (CP) and2.5 g calcium (Ca)/kg. Figure 10.6 shows the predictions that discomfort due toME is minimal at an intake of 110 g/day, that due to Ca at an intake of 120
Minimal Total Discomfort 213
15
16
17
18
19
20
8 9 10 11 12 13
ME content (MJ/kg DM)
Inta
ke (
kg D
M/d
ay)
Fig. 10.5. Predicted intake of foods of a range of nutrient values (see text) for a lactating cowwith ME requirement of 219 MJ/day (●) and another with ME requirement of 250 MJ/day (�).

g/day while discomfort due to CP is minimal up to an intake of 150 g/day.Summation of the squared discomforts gives a total discomfort curve whoseminimum is at an intake of 120 g/day, at which point discomfort is not zero asthe animal is suffering a moderate excess of ME and a deficiency of CP.
To simulate a bird with access to two or more foods, the model is given thebird’s ‘requirements’ and the composition of the foods and ‘experiments’ withdifferent combinations of food until it arrives at that mixture which givesminimal total discomfort. A hen with the same requirements as above is offeredtwo foods with different protein:energy ratios and ground limestone, i.e. achoice between three foods. High-protein food has an ME content of 11.5MJ/kg, a CP content of 0.25 kg/kg and a calcium content of 0.010 kg/kg; low-protein food contains 12.5 MJ ME, 0.15 kg CP and 0.01 kg Ca/kg, whilelimestone includes 0.35 kg Ca/kg with no energy or protein.
It is not always possible to achieve optimal intakes of three nutrients whenchoosing between three foods but, in this case, there is a mixture of the threethat provides optimal intakes of ME, CP and Ca and this is shown in Table 10.1,which also includes the results of simulations with each pair of foods and eachsingle food. Comments on the right of the table indicate how the hen ispredicted to cope in each situation. As long as limestone is available Ca intakecan be maintained but, in the absence of either the high- or low-protein foods,then ME or CP, respectively, is under-consumed. The model appears to behaveas hens are expected to behave, but no attempt is made here to compare thepredictions with real observations.
Validation
It is not the intention to screen numerous published sets of results searching fora few that match the outputs of the model, but rather to see that a modelbelieved by the author to be based on physiological principles behaves in a
214 Chapter 10
0.00
0.05
0.10
0.15
0.20
100 110 120 130 140 150
Food intake (g/day)
Rela
tive d
isco
mfo
rt
Fig. 10.6. Relative discomfort due to ME (♦), Ca (�), CP (�) and total discomfort (—) forlaying hens at food intakes of 100–150 g/day (from Forbes, 2006b).

Minim
al Total Discom
fort215
Table 10.1. Outcome of running the MTD model for laying hens with either three, two or one food available, in terms of intake (g/day) andtotal discomfort (TD, arbitrary units) (see text for details of hens’ requirements and composition of foods). HP, high-protein food; LP, low-proteinfood; LS, limestone (from Forbes, 2006b).
Food(s) available HP intake LP intake LS intake Total intakeTD Comments
HP, LP and LS 89 18 6 113 0.378 Perfect matchHP and LP 74 50 124 0.378 Overeats both ME and CP, but very short of CaLP and LS 118 5 123 0.118 Overeats ME and undereats CP, marginally; normal for CaHP and LS 104 6 110 0.003 Undereats ME and overeats CP, marginally; normal for CaHP 115 115 0.410 Overeats a little to try to acquire CaLP 131 131 0.460 Overeats a lot to try to get Ca and CP; excessive ME intakeLS 9 9 2.378 Eats only to acquire exactly right Ca; dies of starvation

rational manner. It is not a predictive model but a research tool designed to beused to explore the usefulness of the MTD approach to understanding howintake and selection might be controlled. There is a long way to go, especiallyin discovering relative weighting factors for each food resource and determiningthe shape of the relationships between food intake and discomfort generatedby each of the nutrients of interest.
In addition, many other factors than those mentioned above can beincorporated, such as: (i) infusion of metabolites and inflation of a balloon inthe stomach; (ii) social influences, as long as they can be quantified; and (iii)environmental factors (see Chapter 18). As far as the author can see, thisflexibility is unique amongst models of food intake and selection and is onereason why it seems to be a path worth following.
Day-to-day Variation in Intake in the Context of the MTD Hypothesis
If the MTD hypothesis has any bearing on the way in which animals control theintake and choice of foods, then it must surely depend on them experiencingthe effects of straying from the optimum in order to know whether their currentintake and/or choice is still the most appropriate. To what extent is there day-to-day variation in intake?
It is usual for mean intakes to be calculated over several days and severalanimals, but it is a matter of common observation that there are large day-to-day variations in intake both between and within animals. In terms of the MTDhypothesis (and indeed of some other hypotheses) this is not surprising, as thecontrol of daily intake is not expected to be closely controlled.
Some of this variation is likely to be due to external factors such as short-term changes in the composition of the food, climatic variables and changes inmanagement procedures. However, there is individual variation over-and-above that induced by external factors, which would be similar for all animalsin a group (A.O. Jolaosho and J.M. Forbes, unpublished observations), and itmay be that such variation serves some useful evolutionary purpose.
An animal that eats exactly the same amount of food each day has noopportunity to find out whether its overall comfort would be better served byeating a little more, or a little less, than on the previous days. An animal can onlyknow whether it should be eating more (or less) than at present in order tominimize its discomfort if intake varies from time to time. Even when it hasarrived at the optimal state it can only know whether it should maintain the samelevel of intake if it tries out the effects of different rates of intake. The concept thatanimals find an optimum intake by ‘experimenting’ with a range of intakes,which implies that learning is involved, is supported by clear demonstrations thatruminants, like other animals, learn to associate the sensory properties of thefood with the consequences of eating that food (Forbes and Provenza, 2000;Chapter 6).
216 Chapter 10
Poultry
An example of day-to-day variation of intake in a laying hen can be seen inFig. 16.8. In a study of the daily variation in intake by broiler chickens (S. Wahland J.M. Forbes, unpublished observations), residuals from the regression ofintake on age tended to be positively correlated with intakes 1 and 2 days later,but negatively with the third and subsequent days. This suggests that intake isbeing controlled to meet requirements over a period of several days; higherthan average intake might persist for 2 or 3 days but is followed by lower thanaverage intake for the next few days. This behaviour can be interpreted as thebirds ‘experimenting’ by increasing or decreasing their daily intake in order todetermine whether they feel more or less comfortable, and then following theline of least discomfort.
Pigs
Figure 15.3 illustrates an example of the extreme day-to-day variation in intakeof an individual growing pig. Each of a large number of pigs showed similaramounts of variability, some of it synchronized but much of it unique toindividuals.
Cattle
Graphs of day-to-day fluctuations of intake of forages by cattle (Forbes andProvenza, 2000; Forbes, 2001, 2003a) show the large and irregular variationswhich, when smoothed over increasing numbers of days, become more stable.Ingvartsen et al. (1992) studied random day-to-day variation in DMI andreported an average CV of 19.6 within animals. It has been suggested that acyclic food intake pattern reflected repeated bouts of acidosis, and a fourfoldincrease in the odds of a health incident (calving, metabolic or digestivedisorder) associated with a 1% increase in the CV of DMI in the first 21 daysafter calving has been reported.
More consistent food consumption could help minimize the incidence ofketosis and displaced abomasum, and it can be suggested that it is in the cow’sinterests to maintain stable intakes, day by day. The fact that they do not mightmean that there is some advantage in variable daily intake, and this advantagemight be to allow them better to judge whether their current intake is optimal.
Sheep
Figure 6.5 shows the daily intakes of two sheep selected at random from dataof 32 sheep provided by J. Hills (unpublished observations). Examination ofdata from the previous 15 days, by which time intake had become relativelystable, again showed large day-to-day fluctuations in intake by individuals, in
Minimal Total Discomfort 217

comparison with fluctuations in the mean for all animals. The mean standarddeviation of the residuals was 82, with a range of 31–162 g/day for individuals.Only in 15 out of the 32 individual sheep was daily intake in the last 15 dayssignificantly (P < 0.05) correlated with the daily mean intake of all 32 sheep.
This is clear evidence for large variations in daily intake that are unrelatedto external factors such as food quality or climatic variables. Even if this day-to-day variation is not purposeful, it still serves the animals’ intake control systemby providing information about whether a small increase or decrease in intakeimproves metabolic comfort.
Conclusions
It is proposed that animals eat according to an integration of negative andpositive signals from myriad sources, including gut and liver receptors,metabolites and adipose tissue. These signals are speculated to generatediscomforts in proportion to the square of the deviation from optimal intakes ofeach food resource, and the discomforts are added together to provide theintegrated signal that the animal can learn to associate with the sensoryproperties of the food in question.
The advantage of the MTD hypothesis is that it can take into account anyfactors that affect food intake, although it is necessary for them to bequantifiable. The weaknesses include the fact that many such factors are notproperly capable of being quantified and, even for those that are, we do notoften have reliable relationships between their strength and the response, nordo we know the relative weighting to be put on each factor. The theory can,therefore, be called semi-quantitative, at best. Nevertheless, the author hopesthat it will stimulate discussion, experimentation and modelling.
The MTD hypothesis incorporates and emphasizes the role of learning, notonly in determining what choice between foods should be made, but also whattotal amount of food should be eaten. The large day-to-day variation in foodintake shown by most animals when fed ad libitum provides the wherewithalfor this learning process; an animal taking exactly the same amount of foodeach day does not know whether that amount is optimum for its currentphysiological state or for the food currently available. MTD provides a veryflexible tool for integrating thinking on many aspects of the control of foodintake and diet selection.
218 Chapter 10

11 Diet Digestibility, EnergyConcentration andSupplementation of Forages
‘Animals eat for calories.’ While not true under all circumstances this statementprovides a good starting point for consideration of the effects of digestible ormetabolizable energy concentration in the diet on the intake of DM. Perfectcompensation for changes in DE1 or ME2 content (i.e. ‘useful energy’) ordigestibility (which is closely related to energy yield) would entail animalsregulating their DM intake in order to maintain a constant energy intake underconditions of changing concentrations of available energy. Similarly, changes inenergy requirements, as in animals in lactation, should lead to changes in DMintake exactly sufficient to match the new requirements.
Such perfection is, however, rarely achieved. First, the measured orestimated concentrations of DE or ME in their diet may not reflect exactly theyield of useable energy per kg of food. Secondly, animals might not be seekingto achieve simply constancy of useful energy. Thirdly, there are frequentlylimiting factors preventing increases in intake large enough to compensate forreductions in useful energy concentration of foods, or increases in animals’energy requirements. Management of the energy concentration of foods forfarm animals is probably the most important task for animal nutritionists andmanagers; in view of this importance, a great deal of information is availableon the effects of useful energy concentration on voluntary intake and animals’performance, hence a whole chapter is devoted to this subject.
Voluntary food intake is dependent to a considerable extent on thechemical and physical characteristics of the food(s) being eaten. It is essential,therefore, to incorporate some measure(s) of food quality in multiple regression
© J.M. Forbes 2007.Voluntary Food Intake and Diet Selection 219in Farm Animals 2nd Edition (J.M. Forbes)
1 DE is the amount of energy in the diet that does not appear in faeces, expressed as MJ/kgDM. This is the common method of expressing energy value of foods for pigs.
2 ME is the amount of energy in the diet that does not appear in faeces, urine or gas,expressed as MJ/kg DM. This is a common method of expressing energy value of foods forpoultry and ruminants.

equations for predicting food intake. Parameters such as digestibility and rate ofpassage of food are functions of both the animal and the food and should, intheory at least, be capable of being predicted from primary measurementsmade separately on the animal and the food. However, digestibility and rate ofpassage are to some extent dependent on the level of food intake, so directmeasurement is preferable to prediction until we have a better understanding ofthe causal relationships between all of these factors.
The amount and type of fibre in a food influences the extent and rate ofdigestion and thus the yield of absorbable energy and nutrients. There are,therefore, relationships between the yield of energy and nutrients per kg of foodand such parameters as the content of fibre (crude, acid detergent, neutraldetergent), degradation rate in nylon bags, rate of gas production duringincubation with ruminal microbes in vivo and NIR spectra. Because of the highfibre content of many ruminant foods, the relationships between fibre contentand food intake have been explored predominantly with this class of animal. Inthe section of this chapter on ruminants, therefore, there are subsections dealingwith the relationships of each of the above-listed parameters with voluntaryintake.
Poultry
There is a negative relationship between the concentration of ME in the diet andvoluntary intake. However, the compensation is not usually complete, so thatincreasing the ME content of the diet by adding fat can be used to increase MEintake and thus weight gain or egg production. Conversely, fibrous ingredientscan be included in the diet where high levels of performance are not required,e.g. growing pullets.
Growing birds
Fat incorporation in the diet tends to reduce DM intake. In general, it is thoughtthat fats depress intake by a general energy-related effect because injection ofsmall amounts of individual long-chain fatty acids (the major constituents offat) intraperitoneally or their inclusion in the food does not depress intake to asignificant extent. Some short- and medium-chain fatty acids do depress intake,however, whether given intraperitoneally or in the diet (Cave, 1982). In thelatter case propionic, but not acetic, acid was effective; caprylic and lauric acidsgave a 5–6 g depression in daily food intake by 2–3-week-old broilers for eachgram of the acid included per kg of diet.
However, the modern broiler actually increases its intake when maize oil ortallow is incorporated in the food, presumably due to the lack of completecontrol over ME intake in young birds. Fats high in polyunsaturated fatty acids,such as cod liver oil and olive oil, depress intake by broilers, possibly due todeterioration or to toxic effects. It is clearly inappropriate to refer to ‘fat’ in thiscontext without specifying the type of triglycerides involved.
220 Chapter 11

Dilution of the food with 100 or 200 g kaolin/kg increased the total foodintake of growing Leghorn (layer strain) cockerels to regain the same intake ofdigestible DM and maintain the same weight gain as controls (Savory, 1984).When 300 g kaolin/kg was included they stopped gaining weight, while with400 g/kg they lost weight because, although total food intake increased, it didnot immediately do so sufficiently to maintain intake of digestible nutrients.Eventually, however, intake did increase but weight gains were still depressed,presumably because of the high cost of eating the greater amount of food.Physical limitation of intake, although usually considered in the context ofruminants, can exert an effect on the voluntary intake of simple-stomachedanimals but has not been well characterized.
With a fast-growing broiler strain, however, dilution of a standard finisherfood with up to 50% sand and oats resulted in a 100% increase in food intakeand thus a maintenance of weight gain (Leeson et al., 1996). Broilers havemuch greater growth potential than layer chicks and, according to the MTDtheory (see Chapter 10), this will make them less prone to physical limitation,analogous to the effect of lactation in cows.
Laying hens
Laying hens adjust their food intake to satisfy their energy requirements whenthe energy concentration of the food is changed. Compensation is not perfect,however, de Groot (1972) gave foods with ME concentrations ranging from10.5–13.4 MJ/kg and observed a significant negative relationship between MEconcentration and food intake (see Fig. 11.1a). The reduction in food intakecaused by increasing ME concentration was not sufficient to prevent anincrease in ME intake (see Fig. 11.1b) and egg weight and body weight gainwere significantly increased by increasing ME concentration of the food.
Heavier eggs can thus be obtained by feeding more energy-dense diets,but such diets are invariably more expensive than less dense foods. Given thevalue of eggs and cost of foods at the time of de Groot’s work, the economicoptimum food ME concentration was around 11.7 MJ/kg under the conditionsof this experiment.
Morris (1968) surveyed the available literature and found the followingoverall relationship between the voluntary intake (MEI, kJ/day) by laying hensand the metabolizable energy concentration of the food (MEC, kJ/g):
MEI = SMEI + ((2.28 * SMEI) – 612.7) * (MEC – 11.3) (11.1)
where SMEI is the intake of a standard food with a metabolizable energyconcentration of 11.3 kJ/g DM. The compensation in voluntary intake is notusually sufficient to prevent changes in ME intake, especially when intakes arelow, e.g. associated with low egg production at high temperatures.
Diet Digestibility, Energy Concentration and Supplementation of Forages 221

Whole cereals
Although choice-feeding of whole barley and a balancer food has beenreported to improve or have no effect on egg production, including wholebarley in a single, balanced food has met with mixed results (see Chapter 8). Ina carefully balanced experiment, Bennett and Classen (2003) compared foodswith either 60% ground or 60% whole barley, with or without insoluble gritprovided at 4 g/bird/week. The latter was studied as it was thought it mightimprove the breakdown of the whole grains and improve performance of henson the whole-grain food. Feeding whole barley reduced egg production, foodefficiency and egg specific gravity and increased food intake, egg weight andbody weight gain (see Fig. 11.2). Access to insoluble grit had no effect on anyof the production variables measured and there were no interactions betweenthe physical form of the cereal and the provision of grit.
222 Chapter 11
1.30
1.34
1.38
1.42
10 11 12 13 14
ME concentration of diet (MJ/kg)
100
105
110
115
120
125
130
10 11 12 13 14
ME
inta
ke (
MJ/
day)
Foo
d in
take
(g/
day)
(a)
(b)
Fig. 11.1. Effect of dietary concentration of metabolizable energy (ME) on (a) food intake(g/day) and (b) ME intake (MJ/day) by laying hens (from de Groot, 1972).

Pigs
As noted in Chapter 1, pigs tend to overeat and attempts to manipulatevoluntary intake have concentrated on limiting the digestible energy (DE) intakewhile feeding ad libitum to save labour (as detailed in Chapter 15, modern piggenotypes have much less propensity to fatten and ad libitum feeding ofconventional foods to growing pigs is now widely practised in the UK).
In many studies with growing pigs, energy density of the diet has not beenshown to affect DE intake, i.e. there is complete compensation. However,compensation is not complete with foods below about 14.5 MJ DE/kg,although the exact DE content below which failure to compensate completelydepends on the age of the pig (NRC, 1987). Henry (1985) concluded, from abroad review of the literature, that as DE concentration increases DE intakealso increases, while DMI is reduced, resulting in pigs becoming fatter on moreconcentrated diets. Whether energy concentration was increased by adding fator starch, the effect on intake was similar (Cole and Chadd, 1989).
However, growth was slower on high-fat diets compared with high-starchfoods, even though intakes were the same. This may be due to a poorerefficiency of utilization of the energy from high levels of fat for protein synthesis.Inclusion of fat is useful at higher environmental temperatures as it has a lowerheat increment than carbohydrate or protein and therefore depresses intake lessin hot climates.
An experiment was carried out in which growing pigs were given foods withdifferent TDN3 concentrations (Owen and Ridgman, 1967). From the results
Diet Digestibility, Energy Concentration and Supplementation of Forages 223
80
90
100
110
120
0% 60% 0 4
Whole barley (%) Grit (g/bird/week)
Foo
d in
take
(g/
day)
Egg
pro
duct
ion
(%)
*
*
Fig. 11.2. Effect of whole barley and insoluble grit on food intake (solid bars) and eggproduction (open bars) of hens from 19 to 43 weeks of age. *, significant effect of level ofbarley, P < 0.05 (from Bennett and Classen, 2003).
3 Total Digestible Nutrients: this approximates to the proportion of energy-yielding nutrients inthe diet.

shown in Fig. 11.3, it can be seen that food intake was greater in the olderanimals; in addition to their greater maintenance requirements, they were alsodepositing fat at a much greater rate than the younger animals although proteindeposition would be little changed (Whittemore, 1987). It will also be noted thatintake of indigestible material was considerably greater in the older animals,especially with foods low in TDN, indicating their greater capacity to handle bulk.
During the early stage of growth, from 27 to 50 kg, food intake wasrelatively unaffected by the nutrient content of the diet, which meant that TDNintake increased and indigestible matter intake decreased with the moredigestible diets (see Fig. 11.3a). When the same pigs were approachingslaughter weight, however, intake of both food and indigestibles declined withincreasing nutrient density, while TDN intake was relatively constant (see Fig.11.3b). In this experiment, the foods were formulated to have a constant ratio
224 Chapter 11
0
0.5
1.0
1.5
2.0
2.5
0.5 0.6 0.7 0.8
TDN (kg/kg)
0
0.5
1.0
1.5
2.02.5
3.0
3.5
4.04.5
0.5 0.6 0.7 0.8
TDN (kg/kg)
(a)
(b)
Fig. 11.3. Intakes of dry matter (�), TDN (�) and indigestible matter (�) by growing pigs feddiets with different TDN contents from (a) 27–50; (b) 95–118 kg live weight (from Owen andRidgman, 1967).

of protein:TDN, so protein intake also increased with TDN concentration inyoung pigs and remained more or less constant in the older animals.
Although it has been shown that inclusion of inert fillers in the food ofgrowing pigs reduces the intake of digestible energy, substantial dilution has tobe made in order to depress DE intake sufficiently to affect fatteningsignificantly. Fillers such as sawdust are easy to obtain in small amounts, forexperimental purposes, but if they were to be included in commercial rationsthe demand created would soon result in an increase in price. Lower grades offood, such as oat hulls, have been used to depress DE intake but compensationfor such dilution occurs in older pigs, i.e. when the depression in DE intake ismost required to prevent over-fatness.
Figure 11.4 summarizes the proposals of a model of the effects of energyconcentration of the food on intake of pigs at different stages of growth (Tybirk,1989). This agrees with the observations reported above, that in young pigsthere is a positive relationship between the DE concentration of the food andthe amount of DE eaten, but as the pig grows the intake-depressing effect oflow-energy diets becomes less.
These results demonstrate that the importance of different factors controllingintake changes as the animal grows; presumably the older animal has a greatergut capacity, relative to its nutrient requirements, and this allows it to eat morehigh-fibre material and maintain its intake of nutrients to meet its metabolicdemands. Even so, the intake of DE increases slightly with increasing nutrientconcentration – there appears to be some interaction between physical andmetabolic controls, as envisaged by the MTD hypothesis (see Chapter 10).
Diet Digestibility, Energy Concentration and Supplementation of Forages 225
Fig. 11.4. Effect of body weight of growing pigs on the intake of DE, expressed as aproportion of energy capacity as influenced by the energy concentration of the diet: 11 MJ/kg,open bars; 12 MJ/kg, grey bars; 13 MJ/kg, solid bars (from Tybirk, 1989).

Capacity for bulk
The question of the capacity of the digestive system of the growing pig for bulkhas been addressed in detail by Whittemore et al. (2001a), who present severalequations for predicting the effects of bulk, expressed either as fibre content orwater-holding capacity (WHC) of the food. They draw particular attention toan experiment that included a range of values for WHC of less than 2 to greaterthan 6 (g/g) and show a one unit (g/g) increase in WHC as being associatedwith a decrease in food intake of about 6 g food DM/kg body weight(Kyriazakis and Emmans, 1995). From their considerations, Whittemore et al.(2001a) proposed:
Food intake (kg/day) = (0.111W 0.803 ) – (0.006(WHC – 4)W) (11.2)
where W = body weight (kg) and WHC = water-holding capacity of the diet(g/g) for foods of 0.9 DM.
The WHC of foods is mainly related to the NSP4 content (Tsaras et al.,1998). Figure 11.5 shows the relationship between the water-holding capacityof a range of foods with different NSP contents and voluntary intake bygrowing pigs. With bulky foods such as these it was noted that intake isproportional to body weight rather than to metabolic body weight, suggestiveof physical limitation of intake.
Pigs adapt to bulky foods more quickly if they have had previous experienceof bulky foods, being able to consume up to 1.4 times as much of a high-bulk
226 Chapter 11
4 NSP, non-starch polysaccharides – polysaccharide component of dietary fibre.
0
10
20
30
40
50
60
70
0 0.05 0.10 0.15 0.20 0.25 0.30
1/WHC (g/g)
SF
I (g/
kg/d
ay)
Fig. 11.5. Intake (SFI) of six bulky foods by growing pigs plotted against the reciprocal of thewater-holding capacity (WHC) of the foods (from Tsaras et al., 1998).

food than pigs that had previously been fed a low-bulk food (Whittemore et al.,2001c).
To investigate further the relationship between live weight and the intake ofbulky foods in pigs, Whittemore et al. (2001c) offered bulky foods – intended tolimit growth – for 21 days to pigs of 12, 36 and 108 kg live weight. The high-bulk foods reduced weight gain and caused significant increases in the weightsof the stomach, large intestine, caecum and gut fill. The pigs’ capacity for bulk(Cap, kg water-holding capacity/day) was related to live weight (W, kg):
Cap = (0.192 � W) – (0.000299 � W2) (11.3)
The weights of the large intestine plus caecum (WLIC) changed with W inparallel with Cap, and the ratio of Cap to WLIC was close to constant. It wasconsidered, therefore, that the capacity of the large intestine and caecum maydetermine the capacity for food bulk in pigs.
Selection for efficiency of lean growth has led to a marked reduction involuntary food intake of modern genotypes, and there is concern that lean growthrate is being limited. It has been found that modern Large White � Landrace pigshave poorer ability to compensate for diluted foods than do pigs with 1/8 Meishanblood (Gill et al., 1999). The conditions under which the Meishan breed hasdeveloped, where there is a need to utilize low-nutrient density by-products, mighthave led to greater ability to accommodate bulky foods.
As discussed in Chapter 10, the idea of a fixed limit to gut capacity doesnot sit well with physiological concepts, although the intake of bulky foods bypigs appeared limited to around 50 g daily food intake/kg body weight(Whittemore et al., 2000). It seems as if the modern pig has been changedgenotypically in a similar way to the broiler, where physiological control ofintake seems to have given way to some extent to eating for bulk. The youngerthe animal, the greater its nutrient requirements per unit of body weight andthe more important is stomach distension as a limit to food intake.
It can be concluded, therefore, that when the concentration of digestibleenergy in the diet changes then pigs, like hens, vary the level of voluntaryintake in the appropriate direction to maintain digestible energy intake, but thatcompensation is not complete, giving increased DE intake with increased DEconcentration in the food. Maximum weight gains in weaner pigs, therefore,require a diet high in DE, which can be achieved by adding fat, while older pigscan be fed a diet with a lower nutrient specification.
The effects of dietary dilution on voluntary intake of pregnant sows and thepotential for commercial application are discussed in Chapter 16. The wholequestion of predicting intake and performance on changes in food bulk isthoroughly discussed by Whittemore et al. (2003).
Ruminants
The pre-ruminant calf or lamb compensates for dilution of its milk althoughexcessive dilution, necessitating high fluid intakes, causes loss of production(see Chapter 15).
Diet Digestibility, Energy Concentration and Supplementation of Forages 227

Digestibility
It used to be thought that the response of the ruminant animal to changes inthe digestibility of the food was entirely opposite to that of non-ruminants, areasonable conclusion based on the evidence available up to the early 1960s,i.e. a positive correlation between intake of forages and their digestibility byruminants (Baile and Forbes, 1974). There is a great deal of evidence thatdilution of a forage-based diet depresses intake of ruminants, some of whichwill now be reviewed.
In contrast to dilution with inert solid material, sheep and cattle cancompensate for dilution of forages with water because the free water is quicklyabsorbed. If, however, the water is trapped inside cells, as in fresh grass or silage,then intake is often negatively correlated with water content (see Chapter 14).
Crampton et al. (1960) realized the significance of intake in determiningthe nutritive value of forages whose value is proportional to the yield ofdigestible nutrients per unit weight multiplied by the weight eaten. Thus,nutritive value is proportional to the square of digestibility for foods whoseintake is limited predominantly by physical factors and thus dependant ondigestibility. For example, a food of 500 g/kg DM digestibility might be eaten bycattle at a rate of 10 kg/day; another food of 600 g/kg DM digestibility would beeaten by the same animal at about 12 kg/day, thus increasing the intake ofdigestible DM from 5.0 to 7.2 kg/day.
Crampton and colleagues also realized that between-animal variations inintake would obscure between-food variations. They therefore used a standardfood of lucerne offered to each of their animals, against which the intake forthe other forages could be compared. Unfortunately, since different batches oflucerne varied in composition between experiments, comparisons were difficult.Moreover, the use of wether sheep as the standard animal may not predictrelative intakes for forages by dairy cows.
In the early 1960s, then, ruminants were thought to control their foodintake by physical limitation. Then came several developments that suggested arole for metabolic control. With pelleted diets, ranging from lucerne alone to40% hay:60% concentrates, it was found that sheep controlled their intake to aconstant intake of digestible energy, i.e. DM intake falls as the concentration ofDE increases. This implied metabolic rather than physical control of intake.Also around this time came a series of experiments in which it was shown thatinfusion of short-chain fatty acids depressed intake (see Chapter 3), whichindicated the possible mechanisms of such metabolic control.
Conrad et al. (1964) then published their analysis of a large volume ofdata obtained from routine digestion trials at the Ohio Research andDevelopment Station, USA. They described the voluntary intakes of lactatingcows for a wide range of foods. Despite the flawed nature of their analysis(Grovum, 1987; Tolkamp, 1999), the concept that the intake of forages islimited physically while that of highly digestible foods was controlledmetabolically had a great impact at the time of its publication.
This has been called the two-phase hypothesis (TPH) for the control ofintake by ruminants (Pittroff and Kothmann, 2001b), which states that animals
228 Chapter 11

eat that amount of food which meets their energy requirements unless preventedfrom doing so by the physical bulk of the food (see Chapter 9). The inverted V-shaped relationship between the DE content of the food and voluntary intakecan be seen in the large amount of data collated by Baumgardt (1970; Fig. 11.6).In general, up to a DE concentration of about 12.5 MJ DE/kg DM, DE intake ispositively related, while above this there are negative relationships. Note,however, the extreme variability between DE intakes in different experiments atany one DE content.
Where the food is of moderate digestibility but the forage part is ground, anegative effect on intake may be seen, as passage of particles is not a limitingfactor to intake as it would be if the forage was in its long form. Thus, in theresults of Montgomery and Baumgardt (1965) with beef cattle, it will be seenthat DM intake decreases in a linear manner with increasing DE concentration(see Fig. 11.7a); this is the direction expected if the animals were compensatingin order to maintain their DE intake. There is, nevertheless, a small butconsistent reduction in DE intake as DE concentration increases (see Fig.11.7b); although compensation in DM intake has been in the right direction ithas not been such as to maintain a constant intake of DE.
This is in contrast to observations with simple-stomached animals, in whichincreased availability of energy in the food results in slight but persistentincreases in DE intake. It is also in contrast to many other studies with
Diet Digestibility, Energy Concentration and Supplementation of Forages 229
0
0.5
1.0
1.5
2.0
2.5
5 7 9 11 13 15 17
DE content of feed (MJ/kg DM)
DE
inta
ke (
kJ/d
ay/k
g LW
0.66
)
Fig. 11.6. Voluntary intake of digestible energy (DE) by sheep (�), growing cattle (●) andlactating cows (�) (MJ/kg0.66/day) against concentration of DE in the feeds (MJ/kg DM);treatments within each experiment are joined by a line (plotted from data included inBaumgardt, 1970).

ruminants, in which there is a similar slight increase in DE intake with increasingDE concentration (Grovum, 1987).
Another example of a negative relationship between ME concentration offood (as low as 8.5 MJ ME/kg DM) and DM intake is to be found in Chapter 17(Webster et al., 2000; Fig. 17.6).
Digestible and metabolizable energy
With the increasing agricultural use of cereal-based rations for ruminants in theearly 1960s, experiments were carried out that included foods with a widerrange of digestibilities than had previously been used.
When sheep were fed on pellets containing various proportions of cerealsand inert fillers (Dinius and Baumgardt, 1970), intake (g/day) was positivelyrelated to DE concentration (proportional to DM digestibility) for diets < 10.5kJ DE/g DM:
Intake = 619DEC – 660 (11.4)
where intake is kJ DE/kg BW0.66 and DEC is DE concentration in kJ/g. Above10.5 kJ DE/g intake of DE was almost constant:
Intake = 1007 – 50DEC
suggesting that intake was controlled to match energy requirements whenphysical constraints were not important. The tendency for a negative slope onthe latter relationship and in other published work indicates again that intake isnot perfectly controlled by metabolic mechanisms.
230 Chapter 11
70
80
90
100
110
9 11 13
DE content (MJ/kg)
950
1000
1050
9 11 13
DE content (MJ/kg)
DM
inta
ke (
g/kg
0.75
/day
)
DE
inta
ke (
g/kg
0.75
/day
)
Fig.11.7. Intake of pelleted feeds of different digestible energy (DE) concentrations bygrowing beef cattle: (a ) DM intake; (b) DE intake (from Montgomery and Baumgardt, 1965).

Net energy
From a particularly large data set (1102 dairy cows) with a wide range offorages with concentrate supplementation, the following equation was derived:
FI = 0.009LW + 2.21NEL0.67 – 0.07CI1.63 (11.5)
where FI is forage intake (kg DM/day), LW is live weight (kg), NEL is netenergy concentration of the forage (MJ NEL/kg DM) and CI is concentrateintake (kg DM/day) (Schwarz et al., 1996). This shows that increasing energyconcentration increases the forage intake, but at a declining rate, in agreementwith previous observations, although it does not show the decline in intake withvery high-quality ground foods seen in some cases. Increasing the rate ofconcentrate supplementation results in an increased depression in forageintake, i.e. substitution rate increases with high rates of supplementation.
Fibre
There are many examples of negative relationships between the fibre content offood and its intake by ruminants. However, variations in the rate of digestion offibre, as well as its extent, are likely to cause variations in the intake of forages,as rapid digestion releases digestive capacity quickly to allow more food to beaccepted.
Earlier reliance on chemical measures of fibre, especially neutral detergentfibre (NDF), has been replaced by measures with more biological meaning,including: (i) rates of disappearance of food material from nylon bags suspendedin the rumen; (ii) gas production by samples incubated in vitro with ruminalinocula; or (iii) methods giving a much greater number of physicochemicalmeasures, such as NIR.
There are several types of fibre in most forages. Lignin is indigestible and soits content is inversely related to digestibility, but it has no consistent relationshipwith voluntary intake. Cellulose and hemicellulose are degradable by theruminal microorganisms, but the rate of digestion is variable and the time spentby a particle in the rumen also varies, so there is no close relationship between aforage’s content of these and the level of voluntary intake.
NDF
Van Soest (1967) has pioneered the cell-wall constituents (CWC) fraction offorages, as measured by the neutral detergent fibre (NDF) method, for predictingthe physical fill created by food in the rumen. For a wide range of grasses,including many tropical species, there is an almost constant intake of NDF:
I = 110 – 1716/(1 – CWC) (11.6)
where I is the voluntary intake (g DM/kg LW0.75) by sheep and CWC is theproportion of CWC in the dry matter over a range of CWC contents from350–750 g/kg. Rumination time is well correlated with the intake of NDF but
Diet Digestibility, Energy Concentration and Supplementation of Forages 231

not with the weight of food eaten. There is, however, a very large amount ofvariation between intakes of forages with similar contents of NDF, which showseither that NDF is not a suitable descriptor for the prediction of intake or thatother factors in addition to physical limitation are involved in the control ofvoluntary intake (see Chapter 10).
Although highly fibrous forages are eaten in lower amounts than those withlow NDF content, there is a danger of feeding too little fibre that results in thelack of a ‘mat’ to trap particles in the rumen, so that faecal particles are bigger!Sometimes, grinding and pelleting increases faecal particle size because of this.There is also the risk of low milk-fat concentration if the food is too low in fibreand the optimal NDF content of the whole ration for milk production is360 g/kg, irrespective of the type of forage on offer.
Indigestible organic matter (IOM)
Hopkins (1985) used IOM to develop a practical system for predicting intake bydairy cows under UK conditions. He accepted that, with high-energy diets, themetabolic controls of intake are of prime importance, but argued that this is ofacademic interest in view of the need to feed as much forage as possible in orderto reduce concentrate requirements. From a review of the literature, Hopkinscalculated that a mature cow can eat 6 g/kg body weight/day of forage IOMwhilst growing heifers and beef cattle only eat 4.5 g/kg of their body weight.When compound foods are offered, the substitution rate resulting is appropriateto an IOM concentration of 110 g/kg of concentrate dry matter. Comparison ofobserved and predicted substitution rates showed that agreement is moderatelygood.
Predicting food intake in ruminants
In situ degradability
Digestibility is relatively easy to measure, but is probably not the most usefulanimal/food measurement for predicting intake. This is because some foods maybe poorly digested but pass through the digestive tract relatively quickly, therebyoccupying space for less time than a more digestible food with a slower rate ofpassage. For example, grinding a poor-quality forage increases its rate of passageand intake but, because particles spend less time in the tract, they are less welldigested. Rate of passage through the whole tract is not a good predictor of intake,however, but a more useful measurement is the rate of degradation of food in therumen, carried out by suspension of nylon bags containing food samples in therumen of fistulated animals. The use of degradation of samples of food suspendedin the rumen in nylon bags has been reviewed by Ørskov (2000).
For example, Carro et al. (1991) monitored the intakes of hays by sheepand the degradation characteristics, both for DM and for NDF. Disappearancefrom the bag was fitted to the equation of Ørskov and McDonald (1979):
y = a + b(1 – e–ct) (11.7)
232 Chapter 11

where y is the DM or NDF disappearance (g/kg) from the bag after time t, arepresents the immediately soluble material, b is the insoluble but potentiallydegradable material and c is the rate of degradation. Carro et al. (1991) foundsignificant relationships between voluntary intake and the soluble fraction ofthe DM, the rate of degradation of DM and the rate of degradation of NDF. Thebest fit, however, was:
DMI = 21.3 + 0.073PSOL + 138DINSOL (11.8)
where DMI is voluntary DM intake (g/kg0.75/day), PSOL is the proportion ofsolubles in the DM and DINSOL is the rate of degradation of the insolublepotentially degradable fraction of the DM. Although NDF degradationcharacteristics were not as closely related to intake as those for DM degradationcharacteristics in this set of forages, the simple correlation between intake andNDF content was highly significant (r = –0.84), which reinforces theimportance of routinely measuring NDF in forage evaluation programmes.
Another example of the many studies done on the relationship betweendegradability in the rumen and voluntary intake of roughages is that of Fonsecaet al. (1998). Mature, non-pregnant, non-lactating ewes were fed five untreatedcereal straws, two cereal straws treated with urea and five grass hays in differentperiods for the measurement of voluntary intake. To avoid protein deficiency,soybean meal was given in addition in amounts calculated to provide for thedegradable nitrogen needs of the ruminal microbes. Male sheep were used tomeasure the digestibility of each diet and the kinetics of dry matter (DM)degradation in the rumen of the roughages. The best prediction of food intake,which ranged from 9.6 to 17.9 g/kg live weight, was given by the proportiondegraded in the first 3 h of incubation (r2 = 0.68) and the ADF content of theforage (r2 = 0.67). However, digestible DM intake was best predicted by amultiple regression equation including the soluble fraction and rate ofdegradation, accounting for 89% of the variation observed.
A wider range of forages was included in the study of Blummel and Becker(1997), who found 82% of the variation in DMI to be accounted for by theparameters for the degradation of NDF. A combination of determination ofNDF-D after many hours (� 24 h) and gas volume measurements after a shortperiod of incubation (4–8 h) gives good prediction with a shorter analysis time(24 h) than used by many others. Eighty per cent of the variation in DMI wasaccounted for by degradation parameters obtained from the incubation of500 mg whole roughage, when incubation was terminated after 24 h and theresidual undegraded substrate quantified.
While these correlations suggest that the in situ degradation method –especially when coupled with gas production methodology (see below) –provides accurate prediction of intake, great care must be taken before using thismethodology in practice. First, the parameters that give best prediction are oftendifferent in different studies. For example, the optimum time of incubation varieswidely between studies, some suggesting that a few hours are sufficient, othersinsisting that several days are necessary.
Secondly, the way in which the samples are prepared for incubation canhave marked effects on the results. For example, it has been found that more
Diet Digestibility, Energy Concentration and Supplementation of Forages 233

finely ground samples of dried maize silage appeared to have faster degradationand, importantly, a greater proportion of degradable material, than ungroundsamples (Valentin et al., 1999). Even simply drying the silage increases itsapparent degradability, compared with incubation of fresh samples.
Gas production
Studies of rate of degradation of materials in the rumen by the nylon bagmethod are time consuming and do not lend themselves to automation.Fermentation produces gas in amounts and at rates proportional to thedegradation of materials, and gas production in vitro is much easier to measurethan degradation. Close correlations between total gas produced duringincubation of forage samples and food intake by ruminant animals have beenobserved (Blummel and Becker, 1997). The subject has been reviewed byGetachew et al. (1998).
Khazaal et al. (1995) compared many laboratory methods for predictingvoluntary intake of forages: CP, NDF, ADF and ADL in vitro digestibility, in situ(nylon bag) DM degradation and gas production of 10 graminaceous hays fedad libitum to four sheep; they also measured in vivo digestibility. Intake andDMD of the hays were variable and poorly related (r = 0.52). In situ DMdegradation to 96 h of incubation was significantly related to intake (r = 0.75).Accurate prediction of intake (r = 0.90) was achieved using NDF, ADF, ADLand CP in a multiple regression or by using the (a + b) and c of gas production(r = 0.87).
When data of the graminaceous and other data from leguminous hays werecombined, the most accurate prediction of intake was by using characteristics ofin situ DM degradation followed by those of gas production, the latter in turnbeing more accurate than using chemical components or the in vitro digestibility.It was concluded that accurate prediction of intake can be achieved simply fromthe degradation characteristics of foods. However, these impressive correlationcoefficients do not necessarily mean accurate prediction, and the relativelynarrow data set (ten hays and four sheep) are not conducive to widespreadapplication of the results.
Artificial mastication
Smaller food particles disappear from the rumen faster than larger ones, so thatthe ease with which a food can be masticated will affect rate of passage andthus food intake. Troelson and Bigsby (1964) developed a method of artificialmastication involving gentle passage of the wetted food between gears followedby drying and estimation of particle size index (P). The close relationship(r = 0.94) with intake by sheep (DMI, g/day) was:
DMI = 353P – 14 (11.9)
which predicted forage intake by a 45 kg sheep to within 127 g/day. Bear inmind, however, that the hay intakes were by similar sheep kept under standardconditions.
234 Chapter 11

Blummel et al. (1996) studied relationships between the extent and rate ofin vitro gas production and the energy required to grind through a 1 mmscreen, of 40 Syrian barley straws and their dry matter intakes by sheep andsteers. In vitro gas-production parameters were closely correlated with thelogarithm of grinding energy, and both measures were equally good inpredicting intake (r2 = 0.84 and 0.83, respectively). Thus, as grinding energy isa much quicker and cheaper measure than gas production, the former could beused to predict intake quite accurately in this data set. Importantly, in thecontext of this review, forages should be selected for low grinding energy inorder to have a chance of high levels of intake when fed to dairy cows.
NIRS
The measurement of in situ degradation is time consuming and requiresfistulated animals; gas production methods also take several days in thelaboratory and there is a need for better methods of food analysis, both to giveresults more quickly – preferably on the farm – and to give results that arebetter predictors of nutritive value and voluntary food intake than thelaboratory methods currently in use. Near infrared spectroscopy (NIRS) is apromising tool for this purpose, as it quickly and cheaply provides informationon the whole chemistry of a food rather than the few specific moieties normallymonitored. However, a large databank of NIR spectra for foods with knownintake characteristics must be built up and this is occurring only slowly.
NIRS gives a complex spectrum from which can be deduced a great dealabout the chemical linkages in the material being analysed. Features of thespectrum are related to protein, fibre and other factors of nutritional interest.Initially, correlations of NIRS spectra with intake were found for dry forages(Givens et al., 1997), but it has subsequently been found that intake of grasssilage by sheep and cattle can be predicted well by NIRS and that wet samplescan give similar accuracy of prediction (r2 = 0.88) to dried samples (Park et al.,1996). This paves the way for rapid assessment of nutritive value andprediction of intake on-farm once the cost of NIRS equipment comes withinrange of a small group of users.
In an attempt to simplify the indirect measurement of intake, Garnsworthyand Unal (2004) used NIRS of faeces to predict intake and digestibility in dairycows in which DM intake had also been measured directly. The standard error ofprediction of DMI directly from NIRS was 0.48 kg/day (r2 = 0.97), but predictionof dry matter digestibility was much less accurate (r2 = 0.68), probably because ofthe limited variation in digestibility values within the data set. The estimates ofDMI are of similar accuracy to those derived from the traditional alkane technique.
Dilution with low-quality food
Cattle
Reduction of digestibility by inclusion of up to 30% of straw in a compoundfood for growing cattle may be compensated for by an increase in intake, butnot always sufficiently to maintain the same growth rate.
Diet Digestibility, Energy Concentration and Supplementation of Forages 235

Sheep
When lambs that had passed their stage of maximum growth were offeredpelleted foods in which a barley/oats food was diluted with oat husks, to give arange of dry matter digestibilities of 600–780 g/kg, intake of digestible organicmatter was constant and growth was unaffected. Because of the relatively lownutrient requirements of the sheep and the fast rate of passage of the residuesof the ground, pelleted food, the point of inflexion of the intake/digestibilitycurve was < 600 g/kg.
Owen (1969) fed lambs on coarse or ground oat husks at 200, 400 or 600g/kg in meal or pelleted form with a barley-based concentrate. From 15 to 27 kglive weight, intakes were constant or increased with increasing digestibility. From28 to 40 kg, intakes of foods containing ground straw decreased with increasingdigestibility, providing evidence for metabolic control in older lambs when therewas a fast rate of passage. In several other experiments in which ground straw wasused to dilute concentrate foods to give a range of digestibilities from 540–800g/kg, there was complete compensation of voluntary intake by growing lambs.
Food Processing
Pigs
Pelleting appears to reduce food intake by weaners by about 10% but, at laterstages of growth, the effect is much less. However, it is difficult to know howmuch of this apparent reduction in intake is really a reduction in wastage.
Cattle
NRC (1984a) provide a comprehensive coverage of effects of food processingon intake and digestibility in ruminants. Increases in intake caused by grindingand pelleting are generally negatively related to forage quality. Choppingincreases intake of high-fibre, but not of better-quality, hay by cows; whetherthis is due to a limit imposed by chewing or ruminal capacity is not clear.
Particle size
It has been found that, the faster the rate of disappearance of food from thedigestive tract, the lower is the digestibility above which intake declines. Oneway to reduce the time spent by food particles in the rumen is to offer foragesin ground form. Inclusion of ground forages in complete foods for lactatingcows allows digestible energy intake to be maintained, even at up to 60%forage, because the small particles of ground forage leave the rumen morequickly. Although digestibility is usually depressed, as there is faster rate ofpassage and thus less time for digestion, the yield of absorbable nutrients(intake � digestibility) is normally increased and animal performance isimproved. The benefits of grinding are greatest with forages of low digestibility.
236 Chapter 11

Sheep
Sheep are much more sensitive to particle size than cattle. For cattle, unmilledand milled foods were eaten in similar amounts while, for sheep, the intakeswere 57 and 91 g/kg body weight0.75, respectively.
When dried grass was ground to different degrees of fineness, voluntaryintake by cattle and sheep increased with decreasing particle size but thedigestibility of organic matter was depressed, resulting in unchanged intake ofdigestible organic matter. With the finer particle size it is necessary toincorporate a binding agent to reduce dust.
Complete Foods for Ruminants
Knowledge of the relationships between intake and food characteristics can beutilized to manipulate the intake of metabolizable energy and thus the level ofgrowth or milk production. When nutrient requirements are relatively low, a foodof lower ME concentration can be offered, thus reducing the cost of feeding. Afood consisting of concentrates and chopped or ground forage and presented ina form in which it is not possible for the animals to select one ingredient is oftentermed a complete diet (or feed or food) or a Total Mixed Ration (TMR). For anygiven level of animal performance there is a ME concentration which can bereflected in a forage:concentrate ratio that allows the ruminant animal tovoluntarily eat the amount of food containing ME appropriate to its requirements.Ad libitum feeding of a complete food may encourage a higher intake thanconventional restricted feeding of concentrates with forage ad libitum, andtherefore gives the potential for better use of forages.
Owen (1979) has presented a detailed account of the principles andpractice of complete diet systems for cattle and sheep. Within a herd of dairycows there is usually a wide range of milk yields and nutrient requirements,from the high-yielding cow at the peak of lactation – which Owen suggestsrequires at least 50% concentrates – to the dry cow whose requirements can bemet by good forage alone. It is implicit, therefore, that the herd must begrouped according to requirements, and it is the complication of feeding andmilking several groups of cows that has largely been responsible for the delay inthe widespread adoption of the complete diet system for winter feeding ondairy farms in the UK.
In the USA, however, herds are often larger and fed on conserved foods atall times of the year, justifying expenditure on machinery for handling and mixingthe diets. Everson et al. (1976) compared the production of cows fed on acomplete food consisting of 60% forage:40% grain compared with others on a50:50 diet during the first 21 weeks of lactation, a 65:35 food for the remainderof lactation and an 85:15 food during the dry period. There was no differencebetween groups in milk yields or composition, although the fat content washigher in the cows on the complete diet of constant composition. The variable-composition system was closer to the animals’ nutrient requirements and resultedin more rapid return to calving body weight, lower blood ketone values and
Diet Digestibility, Energy Concentration and Supplementation of Forages 237

earlier post-calving oestrus. A high-concentrate diet in early lactation seems to bea good way of encouraging high intake.
Inclusion of a high-energy ingredient such as fat has been used in an attemptto increase energy intake in dairy cows. However, dietary fat seems to interferewith ruminal fermentation and voluntary food intake is usually depressed, so thatoften its inclusion does not result in any increase in metabolizable energy intake.
Modification of Ruminal Fermentation
Monensin is a commercially used food additive that modifies fermentationpatterns in the rumen, giving increased propionate production and lessmethane. In beef cattle there is either no increase in weight gain and areduction in voluntary food intake or increased weight gain with no effect onfood intake, but in either case the efficiency of conversion is improved. Weightgains were improved and milk yields of beef cows were not affected, eventhough the amount of time spent grazing was decreased by the inclusion ofmonensin in the concentrate supplement (Lemenager et al., 1978). It has beensuggested that the decrease in intake that usually occurs when monensin isincluded in concentrate foods for cattle is due to an aversion to some sensorycue associated with malaise resulting from the changes in ruminal fermentation.
Replacement of One Food with Another
A major practical and theoretical problem for ruminant nutritionists is to beable to predict the effect, on the intake of one food available in unlimitedquantities, of changing the quantity and/or quality of another food, given inrestricted amounts. Although numerous empirical approaches have beenmade, the underlying theory is not often considered, perhaps due to lack ofhypotheses to test, but more likely due to the great expense of performing thenecessary research with cattle, which is where the main interest lies.
The reduction in forage intake for a unit increase in supplement allowanceis termed the substitution rate. For dairy cows this is usually in the range0.4–0.8, i.e. despite the reduction in forage consumption the intake ofdigestible nutrients increases with supplementation. The ability to predict thesubstitution rate is of great commercial significance as the increase in the valueof the output (milk) should more than compensate for the increase in the costof feeding.
Cattle
It is common practice to feed dairy cows forage ad libitum supplemented withpredetermined amounts of compound food. The concentrate allowance isincreased if forage intake is insufficient to meet the required level of production.Most experience shows increasing effects of higher levels of supplementation
238 Chapter 11

(Ostergaard, 1979; Chapter 15); substitution rate also increases as lactationprogresses, even at fixed levels of concentrate feeding.
A review of the literature (Bines, 1985) strongly supports a positiverelationship between forage quality and substitution rate. With growing heifersit was found that with poor forages the substitution rate increased to 0.64 asforage digestibility increased but then remained steady with better forages(Leaver, 1973), suggesting that physical constraints controlled substitution ratewith poor- to medium-quality forages but that with good forages the controlwas primarily metabolic.
Increasing the level of supplementation with concentrates often causes adecline in the rate of digestion of forages in the rumen. It may be better,therefore, to use slowly fermenting concentrates high in cellulose, such as sugar-beet pulp, rather than ones based on starchy materials such as barley, in orderto avoid the adverse effects of rapidly fermentable starch on fibre digestion.
In a comprehensive piece of research, involving a total of eight trials atthree centres, Faverdin et al. (1991) gave combinations of three levels ofconcentrate supplementation (L, M and H, with approximately 2 kg DMbetween each level), three types of forage (maize silage, grass silage, hay) andthree types of concentrates (high starch, high digestible fibre, low digestiblefibre). Each trial was of 3 � 3 Latin Square design, replicated three or fourtimes, each period lasting 1 month. Substitution rates increased with increasingsupplement level (see Fig. 11.8) and, on average, were 0.47 between L and Mand 0.67 between M and H.
For a given forage, the increase in the energy concentration of theconcentrate gave an increase in substitution rate, mainly between L and M. The
Diet Digestibility, Energy Concentration and Supplementation of Forages 239
0.2
0.3
0.4
0.5
0.6
0.7
0.8
0.9
3 4 5 6 7 8 9 10
Concentrate (kg DM/day)
Sub
stitu
tion
rate
(kg
/kg)
Fig. 11.8. Substitution rate at different levels of concentrate supplementation of dairy cows;each line is for a different forage/concentrate combination (from Faverdin et al., 1991).

average substitution rate with maize silage was 0.7, with grass silage, 0.53 andfor hay, 0.44. In mid-lactation, the higher the energy balance, the greater thesubstitution rate. There were highly significant relationships between substitutionrate and milk production and energy balance:
Substitution rate = 0.7 – 0.11dMP (11.10)
Substitution rate = 0.50 + 0.14EB (11.11)
where dMP is the change in milk production between levels H and L; EB is theenergy balance in UFL (energy value for milk production).
Where the quality of the forage is high, the mean decrease in hay DMintake/kg of concentrates can be as high as 0.8. In contrast, where the foragequality is very poor, there may be no effect of supplementation on forageintake with low levels of concentrate supplementation, and low substitutionrates (0.2–0.4) with high levels. With lactating dairy cows, therefore, the meansubstitution rate is around 0.5, but there is a positive relationship with the levelof concentrates fed and the quality of the forage.
For growing cattle fed silage, as with dairy cows, substitution rate is greaterwith higher levels of supplementation. For example, adding barley incrementallyto silage so that it formed 0–90% of the diet increased total DM intake, up to40% inclusion, above which it decreased (Petchey and Broadbent, 1980). Whenthe barley was mixed with the forage in a complete food:
DM intake (kg/day) = 6.63 + 6.91PB – 6.08PB2 (11.12)
while for barley fed as a discrete meal once per day:
DM intake (kg/day) = 6.00 + 9.26PB – 10.57PB2 (11.13)
where PB is the percentage of barley in the mixture. The substitution rate wasvery low at low levels of incorporation of barley but then increased to very highlevels when barley became the predominant component of the ration. Thesituation is complicated by the fact that the intake of barley varied with totalintake, which declined at high levels of inclusion so that, between the 78 and90% inclusion rates, total intake fell and, in that situation, the concept ofsubstitution is not very meaningful.
Sheep
Clearly, there is a large influence on the intake of lactating ewes of both the typeof forage offered and the amount of concentrate supplement (see Chapter 16).The results of a series of experiments (Orr and Treacher, 1994) showed verydifferent substitution rates between experiments, as well as between foragetypes. Ewes rearing twins and fed ad libitum on forage were given three levels ofsupplement: 300, 650 or 1000 g of a barley-based concentrate per day. In oneexperiment in which hay (OMD 0.59) and silage (OMD 0.65) were compared,OM intakes and performance were similar but, while the substitution rate was0.09 for silage, it was 0.62 for hay; the former is a very low replacement ratewhile the latter is similar to that expected from similar work with dairy cows.
240 Chapter 11

In another experiment with three silages (OMD 0.56, 0.60, 0.67),substitution rates were not so low (0.29), and there was no significantdifference between silages. In a third experiment with three hays (OMD 0.51,0.59, 0.72), substitution rates were very similar to those for silages (0.30),again independent of hay quality. The lack of effect of forage quality on thedecline in intake with increasing supplement level in the second and thirdexperiments in this series is surprising in view of the findings with dairy cows.
INRA model for substitution
The extent to which a unit of concentrate food will replace forage depends onthe ingestibilities (see Chapter 9) of both foods. A summary of 30 sets of datashowed that substitution rates in dairy cows (S) were related (r = 0.87) to thebulk value of the forage as follows:
S = 1 – (BUC – 0.975)0.33 (11.14)
Substitution rates are low (0.2–0.4) for forages of poor to mediumingestibility, but approach unity with high-quality forages; this is similar to therange of substitution rates normally encountered (see below).
Substitution is negatively related to the difference between the energy ofthe forage fed alone and the animal’s energy requirements – the wider this gap,the lower the substitution rate. It is lower for high- than low-producing animals.
S = 0.673 + 1.134OMD – 0.665FFV + 126.2PC – 118.2PC2 (11.15)
where S is substitution rate, OMD is digestibility of OM (g/g DM), FFV is fillvalue of forage (g/g DM) and PC is proportion of concentrates in ration (g/g).
Methods of supplementation
At high levels of concentrate feeding, many cows cannot consume theirallowance in the milking parlour within the time it takes them to be milked,which means that extra compound food may be offered outside the parlourand this must be rationed to prevent over-consumption. Automatic out-of-parlour feeders are now widely used on dairy farms; simple versions dispense afixed weight of compound food to any cow wearing a metal chain around herneck. More sophisticated equipment automatically identifies each animal froma collar-borne tag that transmits a unique signal, and the equipment isprogrammed to allocate the amount of compound food appropriate to the milkyield and stage of lactation.
Efforts can be made to speed up the rate of eating in the parlour. Pelletingof the compound food increases the rate of eating, while mixing with water toform a slurry causes an even greater acceleration. In one case, lactating cowsate loose meal at 323 g/min, pellets at 455 g/min and slurry at 1670 g/min(Clough, 1972). The use of wet concentrates for slow-eating cows, orunpalatable food, could be beneficial if it takes longer to eat the food allowance
Diet Digestibility, Energy Concentration and Supplementation of Forages 241

than to be milked but the potential problems, such as moulding of residues,prevent its routine use.
Flavouring agents, such as aniseed, are often incorporated in dairycompound foods. These may encourage a faster rate of eating but the mainreason for using them is to ensure that cows don’t reject a new food when it isfirst offered.
Restricted intake
For ruminants, restriction of forage intake is not usually intentional but oftenoccurs as, in an effort to reduce wastage, more is not given until the previousallocation has been completely eaten. In other cases silage is available, but inthe tightly packed face of a clamp silo from which cows are unwilling to pull it,especially when they are expecting some to be cut down for them to eat moreeasily. Maximum intake of forage cannot be expected if animals have to workfor it for all or part of the day.
Conclusions
The content of digestible or metabolizable energy is probably the mostimportant factor affecting voluntary intake in farm animals, from a commercialpoint of view. The cost of the food varies generally in relation to the energycontent, and providing the most economical diet demands a knowledge of theway in which dietary energy affects food intake.
Although there is compensation in the voluntary intake of poultry and pigsfor changes in the digestible energy content of foods, this is not sufficient toachieve an absolutely constant intake of digestible energy; given high-energydiets, poultry and pigs gain more weight than when given low-energy foods.
With ruminants there is a positive relationship between the digestibility offorages and the level of voluntary intake, due to physical limitation. Increasingthe rate of degradation and/or outflow from the rumen increases the voluntaryintake. With high-energy diets that are digested quickly, this physical limit is notreached and the animal controls its intake to meet approximately its energyrequirements. In order to achieve the required level of production it is oftennecessary to supplement the forage with concentrates, but this depresses forageintake to an extent that varies with the level of concentrate feeding and thequality of both foods.
242 Chapter 11

12 Protein and Other Nutrients
While the energy content of food and the energy required by animals for theirmaintenance and productive processes are the major determinants of foodintake in many situations (see Chapter 11), the food’s complement of nutrients(energy is not a nutrient) can have an important impact on the amount eaten.In terms of quantities, the most important nutrient is protein, although it is theconstituent amino acids that should really be thought of as nutrients in theirown right. Minerals, vitamins and water are other constituents of the diet andmany of these have effects on food intake if present in the diet in amountsinsufficient or in excess of animals’ needs.
Animals can usually tolerate mild over-provision of a nutrient but adeficiency leads to disruption of normal metabolism causing ill-defined feelings ofmalaise (discomfort). It seems that there are direct inhibitory effects of impairedmetabolic pathways on intake, and that the animal learns that by eating more ofthe unbalanced food its condition deteriorates.
Protein
Within the normal range of dietary protein contents voluntary intake is notaffected by protein content. Intake is, however, depressed by diets of low orvery high protein concentration. The lower critical content of protein in a foodcan be defined as that level below which voluntary intake is depressed, for anygiven class of livestock. Note that part of the dietary ‘protein’ in this context canbe replaced by non-protein nitrogen in the diet of ruminants, where the ruminalmicroflora can use it for protein synthesis.
The decline in intake with very low protein foods leads eventually to deathbut, if a greater demand for energy is created (e.g. by a reduction inenvironmental temperature to below the lower critical temperature), then intakeincreases and the total amount of protein consumed may once again be
© J.M. Forbes 2007.Voluntary Food Intake and Diet Selection 243in Farm Animals 2nd Edition (J.M. Forbes)

adequate for life. An excessive protein content in food, leading to increasedheat production from deamination of the excess amino acids, may depressintake if heat dissipation becomes limiting and body temperature rises or if theproducts of deamination (i.e. ammonia and urea) become marginally toxic.
Poultry
Morris and Njuru (1990) gave foods with a range of protein contents from167–251 g CP/kg to growing broilers and layer chickens. Broilers grew threetimes faster than layer cockerels and optimal growth was attained on a foodcontaining 251 g CP/kg, while layers needed only 188 g/kg to achievemaximum growth rate. Broilers ate about twice as much as layers (see Fig.12.1) and, in both strains, optimum conversion efficiency was attained with afood of 230 g CP/kg. Carcass fat decreased from 87 to 29 g/kg of the wholebody for layers and from 167 to 81 g/kg in broilers as dietary protein increased.The question of optimum protein content of a food therefore depends on thepotential of the birds to grow and fatten and also on the criterion used –maximum growth or maximum efficiency.
Shariatmadari and Forbes (1993) offered growing broiler and layercockerels foods containing a wide range of protein content (65, 115, 172, 225or 280 g CP/kg) and found that food intake, while lower in all cases in layersthan broilers, was unaffected by diet except the one with the lowest proteincontent, on which it was greatly depressed in both strains. Live weight gain wasmaximal for foods with 172 g/kg or more, i.e. the critical protein content forgrowth was higher than for food intake. Thus, the carcasses of those birds giventhe 115 and 172 g/kg foods were fatter than those whose food was higher inprotein content.
244 Chapter 12
0
10
20
30
40
50
60
70
150 170 190 210 230 250 270
Crude protein (g/kg diet)
Foo
d in
take
(g/
bird
/day
)G
row
th r
ate
(g/b
ird/d
ay)
Fig. 12.1. Food intake (�,▫) and growth rate (●,�) from 0–21 days of male broiler (solidsymbols) and layer strain (open symbols) chicks fed on diets of five different proteinconcentrations (from Morris and Njuru, 1990).

It should be possible to reduce gradually the protein content of the diet asthe broiler grows and its amino acid requirements per gram of food decline. Inpractice, a single change of diet is often applied, at about 4 weeks afterhatching, when the protein content is reduced from 220 to 190 g/kg.
A review of the literature on the effects of protein content on the voluntaryfood intake of laying hens found that there is some compensation fordifferences in protein concentration, but that this is not enough to maintain aconstant protein intake (Boorman, 1979). The situation is complicated by thefact that low protein intake leads to low growth rate and/or egg productionleading to a decreased protein requirement.
When hens were given a high-fat diet they showed signs of becoming protein-deficient and egg weight declined but, during a spell of very cold weather whenthe temperature of the poultry house fell, food intake and egg quality returned tonormal showing that sufficient protein was now being eaten (G.H. Smith, personalcommunication). This example indicates that intake of a single food is primarilycontrolled so as to regulate energy intake rather than protein intake.
Pigs
Very low or very high protein content of a food reduces intake, and themaximum DM intake is with a food whose protein and amino acid compositionis close to that which gives maximum efficiency of growth when given at arestricted level. The amino acid composition of the dietary protein is ofparticular importance in controlling the level of voluntary intake (see below).
Reduction of the protein content of the food to somewhat below theoptimum for growth causes increased food intake, but this is not seen when thefood is of low energy content. Henry (1985) concluded that protein and energyintake are regulated separately and that the mechanisms for both interact todetermine the level of voluntary food intake.
It is likely that pigs offered ad libitum a food inadequate in protein still feelhungry as they increase their general activity, walking and rooting in straw inmuch the same way as they do when fed restricted amounts of a balanced diet.Rooting for straw declines with time, perhaps as pigs learn that it does notprovide much nutrition.
Ruminants
As with other animals, low protein content of the food depresses voluntary intake,but the critical level is lower than in monogastric species because the ruminantanimal supplements the dietary protein supply with urea recycled in the saliva,which can be used for protein synthesis by the ruminal microorganisms. Maturesheep and cattle eat less when the crude protein (CP1) content is lower than about
Protein and Other Nutrients 245
1 Crude protein is the nitrogen content multiplied by 6.25; this incorporates non-proteinnitrogen but, as this can be utilized by microorganisms in the rumen, it is a usefulexpression of protein equivalent for the ruminant animal.

80–100 g/kg DM while lactating cows, where protein requirements are higher,need at least 120 g CP/kg of food. A low-protein food can be supplemented with ahigh-protein concentrate or with non-protein nitrogen in order to alleviate thenitrogen deficiency in the rumen and stimulate microbial activity. The intake oflow-protein forages is usually increased by such supplementation, i.e. a negativesubstitution rate, due to either the improvement in ruminal fermentation andresultant increase in rates of digestion and passage (see Chapter 3), theamelioration of amino acid deficiency in the animal itself (see below) or both.
As well as providing nitrogen for the ruminal microorganisms (rumendegradable protein, RDP), the diet should also provide sufficient protein thatescapes degradation in the rumen, to ensure that those amino acids not producedin sufficient quantities by the microorganisms are available to the host animal;such protein is called undegradable dietary protein (UDP), or ‘by-pass’ protein.
Cattle
Supplementation of a low-protein hay with low-protein concentrates depresseshay intake, while high-protein concentrates stimulate hay intake. Straw intakeby 13-month-old beef steers was significantly higher when 1.37 kg of aconcentrate food containing 136 g CP/kg was given than with the sameamount of a supplement containing 89 g CP/kg (Lyons et al., 1970). There wasno further increase with concentrates > 136 g CP/kg.
A comparison was made between the benefits of infusing 400 g/day ofsodium caseinate into the rumen or into the abomasum of beef steers given avery poor-quality hay (34 g CP, 766 g NDF/kg) (Bandyk et al., 2001). Ruminalinfusion gave a greater increase than post-ruminal infusion, but the effect ofboth treatments increased with time on experiment. Organic matter (OM)digestion improved with supplementation but there was no effect on NDFdigestion. Supplementation via either route increased plasma urea N, relative tocontrols, and ammonia N concentrations in ruminal fluid were also increased bysupplementation, with a much greater effect of ruminal infusion. In this case,therefore, where the rumen itself was grossly deficient in N, there was no furtherbenefit of post-ruminal protein supply than the increase in ruminal ammonia N,via the saliva.
In arid countries leguminous trees and shrubs are a useful source ofsupplementary protein, and it was found that intake of hay by lactating cowsincreased from 7.8 to 9.3 and to 10.4 kg/day due to giving supplements of 4 or8 kg fresh weight of Leucaena, respectively; live weight loss was reduced andmilk yield was increased (Muinga et al., 1992).
Supplementation of low-protein forage with high-protein concentrates isnot always effective in increasing intake. If the primary cause of the low-forageintake is not protein deficiency, then no benefit of supplementation with proteinmay be evident.
RUMEN DEGRADABLE NITROGEN The frequently advanced explanation for thepositive relationship between food protein content and voluntary intake is theeffect of the crude protein on microbial activity and the digestion of N in the
246 Chapter 12

rumen (Faverdin, 1999). Food digestibility and microbial activity are improvedwhen crude protein that is degradable in the rumen is added to the diet. Fasterand more complete digestion apparently reduces rumen fill and thus enables anincrease in food intake.
While this hypothesis is plausible with very poor roughage, it is notconvincing for other diets. High-carbohydrate foods seem to benefit more, interms of voluntary intake, than high-forage diets from the addition of crudeprotein, despite bulk being less important with the concentrated foods.Ruminants rapidly learn to prefer diets that improve the functioning of the rumen.For example, after a conditioning period, lambs always prefer diets associatedwith the presence of casein in the rumen, whereas this is not always the case withhigh doses of urea, which may result in excess NH3 (see Chapter 6).
A significant positive relationship was found between the amount of RDPgiven to pregnant beef cows, with an increase in forage intake of 3.5 g/day/gRDP; during lactation the increase in intake was 5.9 g/day/g of RDP (Alawa etal., 1987).
Tied up with the amount of RDP available from the diet is the rate ofdegradation of dietary protein. Slowing down of degradation by such methodsas heating has usually not affected voluntary intake. Protection of proteins fromdegradation in the rumen by formaldehyde tanning has been seen to increasefood intake.
UNDEGRADED DIGESTIBLE PROTEIN (UDP) Adding protein directly to the abomasum orto the duodenum by continuous infusion generally has no significant effect onfood intake (Faverdin, 1999), except in a few cases with very poor roughage,grass or grass silage. In a comparison with lactating cows of supplementscontaining either 74 or 45 g/kg DM of UDP, it was observed that the higher levelof UDP resulted in lower hay intake in thin animals but had no effect on intake infatter animals, whose milk yield was increased (Garnsworthy and Jones, 1987).
Sheep and goats
With tropical forages of < 70 g CP/kg, there is a positive relationship between thecrude protein content of the diet and intake by mature sheep, while above thislevel there is little effect of protein content on intake (Milford and Minson, 1966).
Urea supplementation of straw increases its intake. In practice, the basalfood is often poor forage in which it is impossible to incorporate a supplement.Under these conditions, urea is given in the form of a block in which it is mixedwith cereals and molasses or in liquid form with molasses and salt. Although itis claimed that the continuous availability of this type of supplement ensuresthat all animals have a good chance to eat some, it has been found that asignificant minority of hill ewes did not eat any.
Mechanisms for the effect of protein content on intake by ruminants
Protein deficiency in the ruminant reduces the activity of the ruminal microfloraand thus the rate of digestion of cellulose. It was therefore suspected that
Protein and Other Nutrients 247

protein deficiency depresses voluntary intake by physical means but this is onlypart of the reason, as clearly demonstrated by the experiments of Egan andMoir (1964). They compared the effects of duodenal infusion of casein,isonitrogenous amounts of urea or phosphate (as control) into sheep on a low-protein (41 g CP/kg) forage. Casein had a rapid effect, and within a few hoursintake was increased. The effect of urea was delayed for 24 h, during whichtime there was an increase in ruminal cellulolytic activity. Urea increased thedigestibility of DM and accelerated the rate of digestion of cotton threads in therumen, while casein had very small effects on digestibility and cellulosedisappearance.
It was concluded that casein alleviated a protein deficiency and therebyincreased the rate of removal of metabolites by tissues, and thus stimulatedintake while urea acted primarily by increasing rates of digestion and passageafter absorption from the intestines and secretion in saliva. Longer periods ofcasein infusion gave persistent increases in intake, even though digestibilitydecreased and the volume of rumen contents increased. Summarizing his work,Egan (1965) concluded that: ‘… differences in the level of ad libitum energyintake should be examined in relation to changes in the ability to utiliseenergy’. According to the MTD hypothesis (see Chapter 10), an increase in therate at which body tissues can utilize metabolites – such as induced by thealleviation of protein deficiency – will allow a greater degree of rumen fillbefore the total discomfort reaches a critical level, hence the increase in volumeof ruminal contents seen in this example.
Amino Acid Deficiency and Imbalance
A food in which the essential amino acids are available in a ratio that is widelydifferent from the animal’s requirements for amino acids is as effective indepressing intake as a low-protein food. Such an imbalance can be alleviatedby supplementing the food with the deficient amino acid (or by infusion of thisamino acid into the digestive tract or circulation). The way in which the proteincontent of the diet is monitored by the animal is not fully understood, but thereare some clues as to the mechanisms of action of severe imbalance ordeficiency of amino acids. It is likely that the primary effect of imbalance is onvoluntary intake, with a secondary effect on growth. Studies in the rat haveshown that the imbalance is sensed in the brain, in a site(s) other than theventromedial hypothalamus – probably the anterior prepyriform cortex andmedial amygdala, which have connections with the lateral hypothalamus. It islikely that animals learn to associate eating an imbalanced food with theconsequent feeling of malaise (see Chapter 6).
Animals’ ability to store amino acids in excess of immediate requirements isvery limited, so not only must the correct amounts of amino acids becomeavailable from the food, but they must also be available at the same time.Provision of an imbalanced mixture of amino acids slows growth and increasesthe oxidation of all but the most limiting amino acid, thereby causing inefficientutilization of dietary protein as well as lower voluntary intake.
248 Chapter 12

Poultry
Amino acid imbalance depresses voluntary intake in poultry. If the imbalance issevere there is a large fall in growth and intake. This can be induced by addingsmall amounts of one or a few amino acids to a balanced, low-protein diet (seeFig. 12.2). Compared to a balanced food, a low-protein food (deficiency of allamino acids) did not depress daily food intake by chicks, while deficiencies ofindividual amino acids caused a marked reduction in intake. Not only does adeficiency of an amino acid depress intake and performance, but an excess canalso have this effect as, with diets containing above about 12 g lysine/kg, thereis reduced performance due to a proportion of birds developing leg problems,the reason being unknown.
To resolve the site of action of amino acid imbalances, Tobin and Boorman(1979) prepared young cockerels with indwelling catheters in the carotid arteryand jugular vein. The birds were fed on a low-protein diet (100 g/kg) that wasimbalanced by the addition of a mixture of all the essential amino acids excepthistidine. Infusion of histidine into the carotid artery significantly increasedintake, while infusion into the jugular vein had no effect; this is direct evidencefor an area of the brain being sensitive to the amino acid imbalance. In order toinduce lysine imbalance, cockerels were offered a diet with a low level ofbalanced protein (100 g/kg) and infused with lysine into the carotid artery orjugular vein at 100 mg/h. In both cases voluntary intake was severelydepressed, from 40.4 to 11.6 g/day with carotid infusion and from 48.4 to26.6 g with jugular infusion. The greater effect of the carotid infusion againstrongly suggests that the sensitive area is in the brain.
The fact that imbalances of amino acids affect intake rapidly suggests thatit is the primary way in which amino acid imbalance affects growth. Force-
Protein and Other Nutrients 249
Fig. 12.2. Effect on food intake of young chicks of supplementation of a low-protein food (openbars) with either a mixture of amino acids deficient in histidine or lysine (solid bars) or a similarmixture of amino acids designed to provide a balance (grey bars) (from Boorman, 1979).

feeding of chicks eating an imbalanced diet to the same level of intake ascontrols gave normal growth, demonstrating that the major effect of imbalanceis on voluntary food intake. However, others have noticed a deceleration ofgrowth before a decrease in intake and put forward the idea that the drop infood intake seen under such circumstances is secondary to the reduction ingrowth rate.
The results referred to above have been obtained using severe imbalances.If the imbalance is mild there may be a compensatory increase in food intake.Thus, G. Tobin and K.N. Boorman (cited by Boorman, 1979) showedincreased intake by chickens when a supplement lacking histidine was added toa low-protein food; this was, however, only a transitory effect. With growingbirds there is some evidence of increased intake when the lysine content isslightly suboptimal; the lysine content that gives maximum weight gain ishigher than that giving maximum food intake, again pointing to increasedintake in mild lysine deficiency (see Boorman, 1979).
In another study in which lysine was included in the diet of broilers atlevels of 9.1–14.4 g apparent faecal digestible lysine/kg, there was no significanteffect on food intake although weight gain, and thus conversion efficiency,were increased and carcass fat content was decreased, by increasing lysineconcentration in the diet (Wijtten et al., 2004). A similar phenomenon alsoappears in the laying hen. One practical consequence is that the dietary aminoacid concentration required for optimum food conversion efficiency is higherthan that for maximum production.
Pigs
Lysine is the first limiting amino acid for growing pigs. Increasing lysinesupplementation from 4.3 to 9.1 g/kg of the food increased intake from 1000 to1400 g/day, with smaller increments at higher levels of supplementation (Bakeret al., 1975). Sparkes et al. (1981) included ten levels of lysine, from 5.5 to 12.7g/kg, balanced for non-essential amino acids and isocaloric, in foods offered toboars, castrated male and female pigs. Voluntary intake was increased up tolysine contents of 9.1, 8.4 and 9.4 g/kg DM, respectively, for the three ‘sexes’.Modern, lean pigs require higher concentrations of digestible lysine in their dietthan do fatter pigs, because of the lower daily food intake of the former.Growing Pietrain-cross intact pigs have an optimal lysine content of > 11 g/kg.
When lysine was included in foods for growing pigs at levels of 6–30 g/kg,the maximum voluntary intake was with the food containing about 10 g/kg,which is close to the optimum for growth according to work with restricted-fedpigs (Cole and Chadd, 1989). It was concluded that: ‘Changing the level of asingle amino acid to alter amino acid balance has a more drastic effect [onvoluntary intake] than altering total protein’. Figure 12.3 shows the food intakeresponse by growing boars to different levels of dietary lysine (G.M. Sparkes,D.J.A. Cole and D. Lewis, unpublished observations), and it can be seen thatthe highest intake is with a food containing just over 10 g lysine/kg, which isjust below the optimum. At higher levels of lysine there is approximately
250 Chapter 12

constant food intake (apart from the anomalous point at 22 g lysine/kg) but,when a toxic excess of an amino acid is included in the food, there is a sharpreduction in intake (not shown on this graph).
When pigs are given foods slightly deficient in lysine, as in the instanceabove, or threonine, there is a slight increase in voluntary food intake. However,if the amino acid in question is present at below about 90% of requirements,food intake is depressed showing that the pig’s ability to compensate for aminoacid deficiency is quite limited, presumably by the consequences of eating moreof the other components of the diet, especially energy. As with proteindeficiency, pigs offered a diet deficient in tryptophan increase their explorativebehaviour compared with similar animals on a balanced diet.
Henry et al. (1992) varied lysine and protein contents of food for growingpigs independently by offering foods with either 5.5 or 6.5 g/kg lysine in foodscontaining either: (i) 130 g CP/kg; (ii) 156 g CP/kg with the same amino acidpattern as food 1; or (iii) 152 g CP/kg with glutamic acid added to food 1 as asource of non-essential amino acids. At the same lysine content, increasing theprotein content did not affect voluntary intake but reduced growth due to theincreased load of catabolizing the excess protein. Increasing the protein supplywith non-essential amino acids caused a fall in intake, probably due to aninadequate supply of methionine and threonine in the basal food, as evidencedby the plasma amino acid pattern.
Methionine supplementation can also stimulate food intake additively withthe effects of lysine. If the environmental temperature is reduced to below thecritical temperature and food intake is thereby stimulated to meet the increasedrequirements for energy, then the intake of a deficient amino acid is alsoincreased and the deficiency is alleviated.
Valine is more likely to be limiting in lactating sows than lysine, and sowsfed a valine-deficient but otherwise balanced diet responded to additions of
Protein and Other Nutrients 251
1.5
1.6
1.7
1.8
1.9
2.0
2.1
5 10 15 20 25 30
Dietary lysine (g/kg)
Foo
d in
take
(kg
/day
)
Fig. 12.3. Food intake of boars growing from 25 to 55 kg and given foods with different lysinecontents (from G.M. Sparkes, D.J.A. Cole and D. Lewis, unpublished observations).

valine by increasing their food intake (Paulicks et al., 2003). The basal foodcontained 3.5 g apparent ileal digestible valine/kg, and L-valine was added togive concentrations of 5.5, 6.5, 8.5, 10.5 and 14.5 g/kg. Food intake of thesows during lactation averaged 2.9, 4.3, 4.6, 4.6, 4.9 and 5.1 kg/day for the sixtreatments, respectively. Although the treatment containing 5.5 g valine/kgincreased food intake almost as much as the higher rates, sow weight losses,milk production and piglet growth rate did not plateau until that containing6.5 g valine/kg, so this is the recommendation for the valine content of a dietfor lactating sows.
Cattle
High-quality protein or single amino acids of dietary origin are degraded in therumen so that it is necessary to infuse amino acids post-ruminally, or to feedthem in a form in which they are protected from degradation in the rumen, todiscover those that are limiting intake, growth or milk production. The specificeffects of amino acids on food intake in ruminants are much fewer than thosein single-stomached animals. Variation in the composition of intestinal aminoacids is less than that in single-stomached animals, due to the large proportionof microbial protein in intestinal protein flows. However, the availability ofprotected methionine and lysine now makes it easy to increase the intake ofthese two amino acids but, at the levels at which they are usually used (i.e.6–30 g/day for a lactating dairy cow), there is generally no significant effect onfood intake (Faverdin, 1999).
Sheep
In a survey of the results of ten experiments in which post-ruminal amino acidsupplementation was given to sheep on various types of food (Barry, 1976),voluntary intake was seen to be increased in seven cases and nitrogen retentionor wool growth was increased in almost all instances.
Intravenous infusion of methionine at 1 g/day into sheep significantlyincreased the intake of a low-protein straw (J. Twigg and J.M. Forbes, un-published observations). Removal of threonine or isoleucine from a milksubstitute containing 80 g protein/kg halved voluntary intake by lambs. There isthus some evidence that amino acid imbalance affects intake in sheep in a waysimilar to that in other species.
Minerals
A deficiency of any of the essential minerals results in reduced food intake, whilean excess of many of the minerals has toxic effects, including reduced intake. Inmost cases the role of each mineral in one or more metabolic pathways isknown, but the way in which a mineral deficiency or toxicity depresses voluntary
252 Chapter 12

intake is unclear. In Chapter 6 we discussed learned associations between thesensory properties of foods and their metabolic consequences, and presumablyanimals learn to adjust their intake of a food to minimize the discomfort inducedby that food (see Chapter 10). Chapter 13 includes a discussion of appetites forminerals. References to support the statements made in the following sectioncan be found in the first edition of this book (Forbes, 1995).
Calcium
There is an optimum content of dietary calcium below or above which intake isdepressed. When the contents of calcium and phosphorus in food for sowswere increased from 6 and 5 g/kg to 8 and 6 g/kg, respectively, there was anincrease in voluntary food intake, but this then decreased again when theywere raised further to 9 and 7 g/kg, respectively. Calcium deficiency causesdepressed food intake in calves.
Copper
Copper sulphate is used as a growth stimulant for pigs as it improves theefficiency of food conversion and has no effect on food intake up to aninclusion rate of about 1 g/kg. At 2 g/kg or above, intake is depressed. In adultruminants, deficiencies of copper cause inappetence while an excess results in ahaemolytic crisis and death.
Iodine
Excess iodine in the diet of both growing chickens and laying hens depressesfood intake.
Magnesium
Voluntary intake of cattle introduced to a magnesium-free food fell to 32% ofcontrol by the fourth day; this was alleviated by inclusion of 10 mg magnesium/kglive weight/day in the food. Cellulose digestibility was depressed by themagnesium deficiency, but not enough to account for the large decrease involuntary intake.
Phosphorus
Phosphorus is an essential mineral, both as a structural component of boneand as a participant in many metabolic processes. Dietary deficiency depressesvoluntary food intake and results in severe economic losses in range animalswhere soils are deficient in phosphorus.
Protein and Other Nutrients 253

The requirements for dietary phosphorus are particularly high in the layinghen, to support the secretion of the shell around the egg. Even relatively milddeficiency of phosphorus depresses food intake and reduces egg production(Barkley et al., 2004), and the effects become more severe as time progresses,as bone reserves of phosphorus and calcium become exhausted.
Sheep
Phosphorus deficiency depresses food intake in sheep. This could be due to alack of P for ruminal microbial activity, thereby slowing fermentation andapplying a greater physical constraint to intake, or to P deficiency in theanimal’s body, interfering with normal metabolism, or both. In a cleverlydesigned experiment, Milton and Ternouth (1985) set out to determine whatwas the limiting factor by correcting the P deficiency in both rumen andanimal, or just in the animal.
Sheep were prepared with parotid duct catheters to allow depletion ofbody P, ruminal fistulae to allow sampling of rumen contents and abomasalcatheters to allow diversion of parotid saliva around the rumen; they were fedon a P-deficient diet. The three treatments were: (i) low-rumen, low-body P(LRLB) by diverting saliva away from the body; (ii) high-rumen, high-body P(HRHB) by infusing 1.3 g/day of P into the abomasum and returning saliva tothe mouth; and (iii) low-rumen, high-body P (LRHB) by draining saliva,abomasal infusion of 4.7 g/day of P and P-free saliva infused into the mouth.
The results are shown in Table 12.1, and it can be seen that correcting justthe body P level, leaving the ruminal P deficient, had as large an amelioratingeffect on intake as did the treatment that corrected both ruminal and bodydeficiencies. This demonstrates that it was the shortage of P in the body thatwas depressing intake in the LRLB treatment. The lack of difference in thedigestibility of OM between treatments also shows that the activity of theruminal microbes was not inhibited by the level of ruminal P achieved in therumen-deficient treatments.
Further evidence of the importance of P supply to the body of theruminant, as distinct from its rumen, is provided by experiments in which low-Pand low-Ca diets depressed food intake of sheep, the extent of which wasdirectly related to the resultant levels of P in the blood rather than in the rumen(Ternouth and Sevilla, 1990).
254 Chapter 12
Table 12.1. Effect of ruminal and blood P levels of sheep fed a low-P diet on food intake anddigestibility; see text for explanation (from Milton and Ternouth, 1985).
LRLB HRHB LRHB
Rumen inorganic P (mg/l) 148* 314 70*Plasma inorganic P (mg/l) 2.8* 4.7 4.4Food intake (g OM/day) 592** 906 892Apparent digestibility of OM 0.65 0.65 0.64
Significance of differences from HRHB: *, P < 0.05; **, P < 0.01.

Selenium
Selenium deficiency in chickens depressed voluntary intake and, whenselenium was added to the food, the birds started to eat more within 3 h. Toxicexcesses of selenium depress intake in ruminants.
Sodium
Sodium deficiency depresses intake by poultry: chicks offered a sodium-deficient food ate 11.7 g/day compared with a daily intake of 15.7 g/day inthose on a normal food containing 2.5 g sodium chloride/kg. Diets high in saltcan lead to sodium toxicity in pigs; these do not reduce their intake sufficientlyto prevent this, suggesting that the excessive salt is not aversive.
Deficiencies of sodium cause inappetence in adult ruminants. Excessive saltalso leads to reduced intake; addition of 30 g sodium/kg to a sodium-adequatediet depressed the food intake of sheep without affecting plasma sodiumconcentrations. However, plasma calcium and magnesium concentrations weredepressed while calcium retention was increased, so it is not clear as to whatactually depresses intake. There was no decrease in voluntary intake of Merinosheep until the sodium chloride content of the diet exceeded 100 g/kg, andsheep can tolerate up to 13 g/l in their drinking water without serious effects onfood intake.
Zinc
Food intake is reduced within 1 h when adult hens are given 8 mg/kg or moreof dietary zinc. In adult ruminants, deficiencies of zinc and toxic excesses havebeen reported to cause inappetence.
Other minerals
Toxic excesses of arsenic, fluoride or molybdenum depress food intake inruminants, while deficiencies of cobalt, manganese or potassium have beenreported to cause inappetence.
Vitamins
As with minerals, much is known about the metabolic roles of the vitamins, andit is likely that animals learn to eat that amount of a food with a deficiency orexcess of a nutrient which minimizes their overall feelings of discomfort (seeChapter 10).
Protein and Other Nutrients 255

There is a decrease in food intake and growth when chicks are heatstressed, and this is partly alleviated by supplementing the diet with about 200ppm ascorbic acid (Kutlu and Forbes, 1993a). Supplementation of non-stressedchicks tends to reduce intake, and the optimum level of supplementation canbe assessed by appropriate choice-feeding experiments (see Chapter 8).
In adult ruminants, deficiencies of vitamin A or vitamin D cause inappetence.Riboflavin deficiency causes depressed intake in calves.
Further information about animals’ ability to select for vitamins is providedin Chapter 13.
Toxins in Food
The effects of toxins on food choice are discussed in Chapter 7.Oilseed rape (canola) meal is available in Europe in large quantities and is a
good source of vegetable protein. However, it contains several substances,including glucosinolates, sinapines and tannins, which are mildly toxic andwhich usually reduce the intake of foods into which they are incorporated.
Poultry
Inclusion of 100 or 200 g/kg of rapeseed meal in a food for broiler chickenscaused reduced food intake, even though the variety of rape used was one lowin glucosinolates and erucic acid (McNeill et al., 2004).
Pigs
Intakes and weight gains of growing pigs closely follow the acceptabilitiesestablished in an experiment in which they were not allowed to becomeaccustomed to the effects of each food. Intake seemed to be more closelyrelated to glucosinolate content than to contents of sinapines or tannins.However, glucosinolate level alone cannot be used as a predictor of intake andperformance.
Cattle
Heat/moisture treatment of rapeseed meal reduces its glucosinolate level andcan increase the intake of silage given alongside the rapeseed-containingconcentrate food. The improved performance could not be explained solely bythe reduced ruminal degradability, so is likely to have been due to theincreased intake. No close relationship has been found between glucosinolatecontent and intake of rapeseed-containing foods by calves and lambs. Modernvarieties of rape have greatly reduced levels of toxins and are not likely tocause problems of low intake as long as they are not included in diets atexcessive levels.
256 Chapter 12

Sheep
Fungal infestation of herbage has a negative effect on its intake. While part ofthis effect might be due to the effects on the taste or smell of the grass, it wasshown that a more important factor is the feeling of nausea generated in sheepafter eating contaminated grass (Aldrich et al., 1993), which would lead tolearned aversion. Daily treatment of these sheep with an anti-emetic(metoclopramide) increased intake of endophyte-infected tall fescue but had noeffect on the intake of uninfected grass.
Water Deprivation
Water is an essential nutrient and the most indispensable of all. In the earlystages of water deficiency there is the discomfort of a dry mouth, and laterthere is reduced secretion of digestive juices and ultimately a comprehensivedisruption of bodily function. Not surprisingly, lack of water results in reducedfood intake and eventually in complete anorexia. The voluntary intake of wateris covered as ‘water appetite’ in Chapter 13.
Poultry
Effects of water deprivation on food intake by poultry have been reviewed byBailey (1999). When daily water allowance is restricted, the reductions involuntary food intake and growth rate that follow are proportional to thedegree of restriction; in one case, as water supply for broilers was reduced fromad libitum to 50% of that level, the daily food intake fell from 111 to 75 g/day.
Cattle
In addition to ensuring free access to food, there should be no restriction ofwater intake if forage intake by cattle is to be maximized. Reducing the waterallowance for dairy cows to 40% below ad libitum depressed food intake byonly 16% (Little et al., 1976), which might suggest that cows are quite resistantto water shortage. However, if the ad libitum intake of these cows wasexcessive due to boredom, as they were individually tethered, it is possible thatthis result underestimates the magnitude of the real effect of water shortage.
By the fourth day of water deprivation the hay intake of cattle falls to lessthan one-quarter of control. Cattle that normally ate 7.6 kg of food/day ate 4.2,2.2, 0.9 and 0.5 kg on four successive days when water was removed.
Although cows fed on silage took only a few drinks per day, most of thesewere large and associated with meals, often occurring in the middle of a meal(Forbes et al., 1991). In this case the water trough was adjacent to the silage andit was convenient for cows to mix eating and drinking. If they had to walk somedistance in order to drink they might either have forgone a drink and continued
Protein and Other Nutrients 257
eating, but eaten less due to increased osmolality of ruminal contents, or elsegone to drink but not taken the trouble to walk all the way back to continueeating, as they were already partly satiated.
Sheep
The food intake of sheep declines noticeably by the second day without water.This can be attributed to the difficulty of transporting the more viscous digestathrough the digestive tract, but must also be due to the general feeling ofmalaise accompanying dehydration of the body. A moderate reduction in waterallowance (to 0.75 of ad libitum) does not affect the dry matter intake by sheep,as urinary volume can be reduced to some extent without harm to the animal.
Ruminants in extensive agricultural systems sometimes have to walkextremely long distances to water. Squires and Wilson (1971) studied the effecton Border Leicester wether sheep of placing water and food pellets containing15% sodium chloride different distances apart. As the distance increased from1.6 to 5.6 km, the number of drinks per day decreased and the food intake fellfrom around 70 to 45 g/kg0.75/day. The maximum distance walked by thewethers was 17.6 km/day.
Wet feeding
Wet mashes of food mixed with water were commonly given to backyardpoultry and it is now common practice in Europe to feed growing pigs on wetfoods. Some work with rats has shown improved dry matter intake and weightgain when the food is mixed with water.
Poultry
Foods with more water than is conventionally found in cereal-based mixtureshave been examined for poultry feeding for two reasons: the utilization of wetby-products and the alleviation of heat stress. An example of the former is theincorporation of lucerne juice when chicks compensated for the added waterand there was no effect on DM intake. Egg production decreased when henswere fed diets > 300 g moisture/kg by the addition of methane digester effluent;the suppression in performance was attributed to fungal growth. Laying hensfed a diet containing methane digester effluent to give 400 g moisture/kg hadegg production and food efficiency similar to those hens fed an air-dried controldiet. An automated feeding system to deliver high-moisture by-product dietswith 50% added water to laying hens has been developed; improvements in eggproduction, egg weight and food efficiency have been found.
Wet food can be useful in partially alleviating the reduction in food intakeand performance under very hot climatic conditions. Giving hens food with50% water added stimulated dry matter intake by 38% under environmentaltemperatures of 33.3°C. Offering broiler chickens a food with the addition of 33
258 Chapter 12

or 50% water increased both food intake and body weight in the hot season(37°C); however, food intake and body weight were reduced significantly bywet feeding under normal temperatures (20°C).
There is, however, a significant body of evidence that the use of wet foodscan be beneficial for the performance and/or efficiency of both broiler andlaying chickens kept under temperate conditions (see review by Forbes,2003b). The optimal rate of addition of water is between 1 and about 2.5 l/kgof air-dry food. With an insufficient rate the improvements are not seen,probably because there is inadequate penetration of water into the foodparticles to allow rapid diffusion of digestive chemicals in the stomach, butexcess water, whereby there is a layer of free water over the wet food, inhibitsfeeding as poultry do not like to put their beaks under the water. The amountof water absorbed by different foods varies considerably, and it would benecessary to make some preliminary tests to discover the optimum rate ofwater addition for foods intended for offering in the wet form.
If the primary effect of wet feeding is to increase food intake then it wouldbe expected that there would be a large increase in fat deposition. However,the composition of the carcass, in terms of its fat:protein ratio, is not affected bywet feeding. The suggestion is that the rapidly growing broiler, or the high-yielding laying hen, is limited in its productivity by the amount of nutrients itcan obtain and that improved digestion due to pre-wetting of the food canimprove efficiency and/or intake.
Pigs
It has become very common in intensive pig production throughout the worldto feed growing pigs on liquid foods, the main advantage being that deliverycan be automated. However, wet feeding can also have benefits for biologicalefficiency, as indicated by a large-scale survey in Denmark (Danish NationalCommittee for Pig Breeding and Production, 1986, quoted by Riley, 1989),which showed that on wet-feeding systems pigs ate 2.27 Scandinavian FeedUnits (SFU)/day and gained 717 g/day compared with dry-fed pigs that ate2.03 SFU and gained 643 g. Weaner pigs given food with approximately equalweights of water and dry food had higher DM intakes than dry-fed, significantlyso in most weeks and, as growth rate was improved, there were no differencesin conversion ratios. Sows may also benefit from wet feeding as they ate morewhen fed from a trough with a water nipple in it, i.e. wet food.
With very wet foods (< 75% water), further increasing the water content toas much as 85% has no effect on DM intake as the extra water is readilyexcreted. Presumably there is a threshold above which very high water contentdoes begin to affect DM intake. However, in order to avoid an undue increasein effluent output, it is recommended that the water content of liquid dietsshould not exceed 80% (equivalent to a 3.5:1 water:food ratio, bearing in mindthat normal ‘dry’ food contains about 10% water). Care must be taken thattrough design is not such as to encourage food wastage. When wastage isminimized, wet feeding increases efficiency of conversion of food into growth.
Protein and Other Nutrients 259

Conclusions
Foods containing a significantly lower concentration of an essential nutrient thanrequired by the animal to which they are fed are eaten in smaller amounts thanfoods with an adequate content. This shows that when offered a single food,animals are generally not able to respond to a deficiency by increasing their dailyintake. A common feature of all deficiencies is that they interfere with normalmetabolism and lead to feelings of metabolic unease, and it seems likely that it isan innate response of animals to reduce their intake of a food that makes themfeel unwell. In nature the animal could turn its attention to other sources of food,but in intensive husbandry no such opportunity is available so the only option isfor the animal to eat less in an attempt to relieve the metabolic discomfort.
A toxic excess of a substance in food causes reduced intake as does animbalance, such as when a low-protein food is supplemented with anindividual amino acid, even with amounts that only bring its concentration inthe food to what would be normal for a high-protein food.
Figure 12.4 is a general diagram of responses to changes in the content ofan essential nutrient. For foods with a content of the nutrient just below the‘requirement’, there is sometimes a modest increase in intake as the animal triesto maintain its intake of the nutrient in question. Below this metabolic illnessoccurs with consequent depression in intake. For foods with a content abovethe ‘requirement’, there is little or no effect on intake until such a high contentis reached that intake is depressed due to the toxic effects of the excess.
Water deprivation reduces the intake of food. Initially this is due to theunpleasantness of a dry mouth but, ultimately, the disturbance of metabolismwill reduce feeding, which is a major determinant of the need for water.
260 Chapter 12
0
20
40
60
80
100
120
0 2 4 6 8 10 12
Food content of essential nutrient (arbitrary units)
severedeficiency
marginaldeficiency
optimalmoderateexcess
toxicexcess
Foo
d in
take
(%
of n
orm
al)
Fig. 12.4. Generalized diagram of the effects of a nutrient in food on voluntary intake ofexcesses and deficiencies.

13 Appetites for Specific Nutrients
In Chapters 7 and 8 the principles and practice of diet selection in farm animalshave been discussed, i.e. the ability to choose from two or more imbalancedfoods a diet of adequate composition to meet the animals’ nutrientrequirements. It has been demonstrated that there needs to be learning of themetabolic effects of each food and association with some sensory property orproperties of each food (see Chapter 6). It has also been shown in Chapter 12that a dietary deficiency or excess of one or more essential nutrients causes areduction in intake when a single food is offered. In this chapter we examineevidence for appetites for many nutrients, including water. As we have usedprotein and energy to illustrate the principles of diet selection in Chapters 7and 8, the following section should be read in conjunction with that earlierdiscussion.
Regulation of Protein Intake
Interest in choice feeding has centred on animals offered two foods: one with aprotein content higher than that required for optimum performance, the otherwith lower than optimal content of protein (HP and LP, respectively). There is avery wide range of protein content in readily available foodstuffs, from around40 g/kg for straw to 600 g/kg for fishmeal, while the range of usable energycontents is quite small, from 9–13 MJ ME/kg. Also, protein is an expensivedietary constituent and there is considerable interest in optimizing its dietaryconcentration in commercial practice.
It must be acknowledged that, in most cases, it is only an assumption thatprotein is the target of the animals’ selection between HP and LP, as details ofthe content of minerals and vitamins are not always published. Thus, wherewhole grain is given in choice with a compound pellet, the latter will be higherin many minerals and vitamins as well as protein, and it is possible that the
© J.M. Forbes 2007.Voluntary Food Intake and Diet Selection 261in Farm Animals 2nd Edition (J.M. Forbes)

results are clouded by an appetite for one or more of the trace constituents aswell as, or instead of, an appetite for protein.
Growing chickens
If a claim is made that birds are selecting an optimum diet from a choice of foods,it is necessary to demonstrate this by feeding other groups of birds on single-foodmixtures of the two foods used in the choice-feeding situation. Shariatmadari andForbes (1993) have done this for broilers and layer cockerels, and the resultshave been discussed in Chapter 8.
Four foods of 195, 210, 227 and 242 g protein/kg were offered simul-taneously to male and female broilers from 2–8 weeks of age by Kaminska(1979). They ate most of the lowest-protein food and this preference increasedin the last 2 weeks; the mean protein content selected was 214 g/kg up to week6, but then it decreased to 210 and 207 in the final 2 weeks, results similar tothose from broilers given only two foods by Shariatmadari and Forbes (1993).
In a further experiment (B. Kaminska, personal communication), broilerswere offered foods with ME contents of 11.6, 12.2, 13.0 and 13.8 MJ/kg. In thiscase they ate more of the higher energy diets, progressively as the experimentprogressed. With a higher protein content there was even more preference forthe high-energy foods. It is clear from these experiments that broilers use dietselection to achieve their ‘ideal’ dietary energy:protein ratio. Thus, an appetitefor protein has been clearly demonstrated in growing chickens.
As the bird grows, its requirement for energy relative to protein increases,so that the concentration of protein required in the food declines with age. Itwould be expected that the ratio of HP:total would fall with age in choice-fedbirds – and this is often the case. For example, the proportion of HP taken bychicks fell from 0.25 at 15 days of age to 0.15 at 50 days, a decline in theprotein content of the selected diet from 250 to 140 g/kg (review by Forbes andShariatmadari, 1994).
Rapeseed meal is an economically attractive source of protein, but it isclaimed that poor palatability prevents its use as more than a small proportionof the diet. Rapeseed meal, even the modern genotypes with low levels ofglucosinolates, contains toxins, however, so the taste of rapeseed could be usedas a cue to aversion even if the substance(s) being tasted was not itself toxic.However, broilers offered a choice between the standard food and onecontaining rapeseed meal over a period of 28 days ate similar amounts of each(McNeill et al., 2004), suggesting neither sensory nor metabolic problems withthe latter.
When HP and LP offered as a choice to broilers could provide a balanceddiet there were significant decreases in the HP:total ratio as the birds grew, inline with the decrease in protein:energy requirements during this phase ofgrowth (Shariatmadari and Forbes, 1993); this applies to the choices betweenHP and VLP and between AP and L (see Fig. 13.1). However, when the twofoods could not provide a balanced diet (LP+VLP, AP+VLP, VHP+HP), themost unbalanced pair was largely avoided and this avoidance became more
262 Chapter 13

extreme as time passed – as the birds’ conviction of its harmfulness strengthenedas they gained more experience.
As observed in Chapter 7, animals almost always continue to sampleaversive foods from time to time, as if to check that they are still as unbalancedas before. The sixth choice, between HP and AP, declined slightly from about0.18 HP through the observation period, suggesting that AP was not quite‘adequate’ for the birds in question. Overall, therefore, these results confirm thedecline in preferred dietary protein content as the optimum protein:energy ratiodeclines with stage of growth.
There is, after several decades of intensive selection, a very large differencein the potential for growth between chicks of layer and broiler strains. Becauseof the requirements of energy for maintenance, slower-growing birds require alower protein:energy ratio in their food so would be expected to choose a lowerHP:total than faster-growing birds. In choice-feeding comparisons of broiler andlayer chicks, significantly higher intakes of HP than of LP by broilers wereobserved, giving an overall protein content in the diet selected of 205 g/kg,whereas layers ate similar amounts of HP and LP to give an overall content of184 g protein/kg.
Mature birds from a strain of broiler selected for high body weight ate moreprotein than a low-weight strain when given the choice of HP and LP foods(Brody et al., 1984), and birds of both strains ate less protein when given achoice of HP (467 g/kg) and LP (82 g/kg) than when given a complete foodwith a protein content of 188 g/kg. Low-weight birds increased their energyintake by 38–53% when given a choice of foods compared with a singlecomplete food, suggesting that the latter placed a considerable constraint on
Appetites for Specific Nutrients 263
0
0.1
0.2
0.3
0.4
0.5
0.6
0.7
0.8
0.9
1.0
25 35 45 55 65
Age (days)
LP/(LP+VLP)AP/(AP+VLP)
HP/(HP+VLP)
VHP/(VHP+HP)
HP/(HP+AP)
AP/(AP+LP)
Pro
port
ion
of h
ighe
r-pr
otei
n fo
od s
elec
ted
Fig. 13.1. Proportions of two foods with different protein contents selected by broilerchickens from 28–61 days. VLP, very low protein (65 g CP/kg); LP, low protein (116 g CP/kg);AP, adequate protein (225 g CP/kg); HP, high protein (280 g CP/kg); VHP, very high protein(320 g CP/kg) (from Shariatmadari and Forbes, 1993).

intake in birds of the low-weight strain, probably by having too high a proteincontent. These birds took considerable amounts of glucose solution when giventhe single, complete food, but much less when given a choice of HP and LP,showing that the complete food was providing too little energy (relative to itsprotein content) and that this imbalance depressed food intake.
Males have a higher growth potential and seem to be capable ofresponding to this by eating a higher proportion of the HP food than females.While growing turkeys select similar energy concentrations irrespective ofgender, the males – which have a higher growth potential – select a higherconcentration of protein than females; similar results have been obtained withgrowing broilers.
Laying hens
Up to about 14 weeks of age, the growing pullet requires protein only forfeather development and a relatively slow rate of muscle deposition but,around 15 weeks of age, there is rapid development of the ovaries and oviductthat would be expected to increase protein demand and, thus, protein intake ina choice-feeding situation. This has been observed as a marked increase in theprotein content of their diet about 2 weeks before the onset of lay in choice-fedpullets.
Laying hens are capable of choosing an appropriate protein intake whengiven the opportunity, and showed a preference for HP that increased steadilyduring a 26-day observation period.
Emmans (1977) gave laying hens from 41–56 weeks of age a conventionalfood with a crude protein content of 173 g CP/kg, either as the sole food orwith a choice of ground barley. There were no differences in egg production ortotal food intake. The choice-fed birds ate, on average, 84% of their intake asthe compound food, but this was affected by output: those with higher thanaverage egg production ate more food, but this extra was all from thecompound food. Emmans was careful to point out that there were differencesother than in protein content and quality between the layer mash and thebarley, especially calcium, and that his results were not absolute proof of aprotein appetite.
Pairs of foods containing 80/170, 110/170, 80/230 or 110/230 g protein/kgwere offered as choices to laying hens by Steinruck and Kirchgessner (1992).There were no differences in egg output between any of the choice-fed groupscompared with those on single foods of 170 or 230 g CP/kg, nor any significantdifferences in body weight gain. The dietary protein concentrations selected onthe four choice treatments were 153, 152, 188 and 179 g/kg, respectively, andthis was claimed to demonstrate the ability of laying hens to select a proteinintake corresponding to their requirements for optimal egg production, but thisability was not very accurate.
These results provide clear evidence that poultry demonstrate an appetitefor protein.
264 Chapter 13

Pigs
As described in Chapter 8, growing pigs choose between high- and low-proteinfoods in such a way as to meet their supposed requirements for growth,without over-consuming protein.
As a further test of the theory that growing pigs can select for a proteinintake meeting their growth requirements, Bradford and Gous (1991) offeredpigs choices between pairs of foods containing 220/180, 220/140, 220/100,180/100 or 140/100 g CP/kg. Compared to controls on a single 160 g/kg food,choice-fed pigs grew leaner and more efficiently from 30 to 90 kg. Theproportion of HP eaten fell as the pigs grew, except in the 140/100 choice,where they ate almost all from the 140 g/kg food.
Of course, the intake of protein might be controlled in order to obtain theappropriate amount of the first limiting amino acid, and it was observed thatthe isoleucine content chosen was almost exactly what would be predicted,whereas lysine intake was higher than predicted, suggesting that isoleucine isthe first limiting amino acid under the conditions used in that experiment. Itwill, therefore, be difficult to tell whether an appetite is for protein or for themost limiting amino acid.
There is variability in protein choice between batches of pigs reared in thesame facilities, as shown when maize and a protein supplement were fed togrowing pigs in complete and free-choice diets (Engelke et al., 1984). In thefirst experiment, the pigs grew well and the proportion of protein supplementchosen declined as the pigs grew, so that over the entire experiment the proteincontent of the chosen food was 136 g/kg compared with 146 g/kg for thecomplete food given to controls. In a second experiment, however, the choice-fed pigs ate a lot of supplement and consumed more protein than complete-diet-fed animals. Variability, both between and within batches of animals, is afeature of choice feeding and the extent to which this is related to differences ingrowth potential, and therefore nutrient requirements, is not yet clear.
Synthetic foods with extremes of protein have been used for growing giltsoffered a protein-free food and one fortified with casein (Robinson, 1974).Each successive week the protein content of the fortified food was increased,from 200 to 800 g/kg in steps of 100. There was significant selection for thefood containing protein up to a protein content of 600 g/kg, resulting in proteinconsumption greatly in excess of requirements. Foods containing 700 or 800 gprotein/kg were rejected. Even though the protein-free food was highlyunpalatable and was avoided to a great extent, it was preferable to a very high-protein food which would exert considerable metabolic costs of deamination.
Female growing pigs were offered 122, 206 or 240 g CP/kg fresh food or achoice between 122 and 240, and free access to straw (Jensen et al., 1993).Those on the lowest-protein food alone had lower live weight gain and foodconversion efficiency and stood for longer, walked and rooted in straw more. Itwas suggested that: ‘specific nutritional needs can increase the foragingmotivation of growing pigs’. The choice-fed group did not select an adequatediet and grew a bit more slowly than those on the medium- or high-proteinfoods (this was thought to be due to positional, social and urination effects).
Appetites for Specific Nutrients 265

As pigs grow, the ratio of protein:energy required in the diet declines andthere is evidence that they select decreasing protein contents when offered HPand LP. Kyriazakis et al. (1990) noted that the protein content selected fell fromabout 250 to 180 g/kg over an 18-day period starting at 15 kg live weight.Similarly, when growing pigs were given a choice between two foods madefrom the cereal and protein components of a standard control food, the proteincontent of the chosen diet fell with age from 254 to 191 g protein/kg over a 3-week period from 18 kg live weight (Healy et al., 1993).
Nutrient requirements for growth are influenced by previous nutritionalhistory, and Kyriazakis and Emmans (1991) have demonstrated that this isreflected in the choice pigs make for foods with different protein contents. Thosepreviously given a single, low-protein food chose a diet containing 233 g CP/kgwhen given a choice of HP and LP, while those previously given a high-proteinfood chose only 175 g CP/kg. By 33 kg body weight the two groups did notdiffer in carcass composition, showing that the changes in composition inducedby restriction in the first phase were compensated for by choice feeding in thesecond phase of the experiment. Males, with a higher growth potential, chose adiet higher in protein than did females (228 versus 181 g CP/kg).
Chinese Meishan pigs, of particular interest because of their greatprolificacy but having low growth potential and a high rate of fat deposition,when given free choice between HP and LP chose 144 g protein/kg whileLarge White-cross animals, with a high potential for growth but low fatdeposition, chose 194 g protein/kg (Kyriazakis et al., 1993a). The growth ratesachieved by the choice-fed animals were not significantly different from thehighest achieved on a single food (130 and 220 g protein/kg for Meishan andLarge White, respectively). This is another example of animals compiling a dietthat avoids either an excess or deficiency of protein in relation to energy.
It is clear, therefore, that growing pigs have a well-developed appetite forprotein.
Cattle
Appetite for protein was investigated by Tolkamp et al. (1998a), who gavelactating cows either LP (131 g CP/kg DM) or HP (185 g/kg) or a choicebetween the two. That LP was deficient in protein was demonstrated by thefact that the milk yield was significantly lower than for the other two treatments.Cows in the choice treatment chose a mean of 683 g HP/kg of food DM,significantly different from a ‘random’ choice of 500 g/kg, but any suggestionthat they were selecting to meet their protein requirements was denied by thelack of change in the proportions of the two foods taken between the 2nd and22nd weeks of lactation, a period during which milk yield and protein outputdeclined markedly. Also, there was no relationship between milk protein outputand the choice made by individual cows, in contrast to the results of Lawson etal. (2000) (Chapter 8).
In addition, it was calculated that even LP provided sufficient MP to meet theneeds of the average cow, despite the low daily intakes of this food. It appears,
266 Chapter 13

therefore, that the cows in this experiment were not selecting for protein, whethercrude or metabolizable, to meet their requirements.
If selection is not for CP or MP then maybe it is for ruminally degradableprotein (see Chapter 7). In a further experiment, Tolkamp et al. (1998b) gavecows a choice between a low-protein food (128 g CP/kg) and a high-proteinfood (185 g /kg) and also these same two foods to both of which was addedurea at 7.5 g/kg food DM to give 161 and 225 g CP/kg, respectively. Urea isutilized by the ruminal microbes for protein synthesis and therefore providesruminally degradable protein (N � 6.25). By raising the CP content of bothfoods with the addition of the same amount of urea, any effect of the latter on‘palatability’ was avoided, as the flavour of both foods would be affected in thesame way.
Figure 13.2 summarizes the results and shows the effect of adding and thenremoving urea in the first half of the experiment (solid symbols). It can clearlybe seen that the addition of urea causes a change in selection; whereas beforeurea addition cows chose about 800 g of HP/kg of total intake, this rapidlychanged to around 300 g/kg, stabilizing at this lower level after about 3 days.Conversely, when the urea was removed, choice quickly reverted to around800 g/kg.
In the second half of the experiment (open symbols), choice of HP wasaround 200 g/kg when both foods contained urea, increased to around 600 g/kgwhen it was removed from both foods and fell back to around 200 g/kg whenthe urea was reintroduced. It is possible that choice of the lower CP mixtures inthe second half, compared with the first half, of the experiment was due to the
Appetites for Specific Nutrients 267
0
200
400
600
800
1000
0 10 20 30 40 50
Day
Urea added (A)or removed
A
BHP
/tota
l int
ake
(g/k
g)
Fig. 13.2. Effect of adding and removing urea from both HP and LP foods on the choicemade between them by lactating cows. A, solid circles, first half of experiment; B, opencircles, second half (from Tolkamp et al., 1998b).

cows being later in lactation and thus having lower protein requirements. Theseresults are startling in both the magnitude and the speed of changes in foodchoice by cows, and suggest a substantial effect of the content of ruminallydegradable protein (RDP) in foods on diet selection.
While the compensation in choice during periods with or without ureasupplementation of both foods is not exact, the accumulated evidence supportsthe likelihood that cows can demonstrate an appetite for protein. It seems thatcows can also select a diet adequate in protein when a choice between a high-and a low-protein concentrate is given as a supplement to silage (Lawson et al.,2000; Figs 7.5 and 7.6).
Sheep
When growing sheep were given choices between two foods, one with aprotein content above and the other below their presumed requirements, theymade apparently nutritionally directed choices to achieve a dietary proteincontent of 131–133 g CP/kg, which was close to the protein content of asingle food giving optimal tissue protein deposition (Kyriazakis and Oldham,1993; Fig. 7.7). When two foods with protein contents above requirementswere offered, the sheep consistently ate more of that with the lower content.However, when the choice was between a high-protein food and one supple-mented with urea, the HP food was preferred, giving an overall protein contentof the diet of 173 g CP/kg, i.e. greater than required. The sheep preferred to eatexcess protein than excess urea, presumably because of the more toxic effectsof the latter.
It seems that lambs are able to differentiate between foods with differentprotein contents and to select between them according to their protein andenergy requirements. The choices made are not always such as to provide aconstant intake of protein, however, as the sheep always ate some of bothfoods, even when to do so produced an imbalanced diet. The propensity tosample available foods from time to time has been noted in Chapter 7.
Environmental temperature
Increasing the environmental temperature to above the thermoneutral rangedepresses food intake in animals given a single, complete food. If given achoice between HP and LP it might be expected that protein intake could bemaintained while energy intake was reduced to relieve the heat stress.However, protein metabolism and growth are heat-producing processes and itis difficult to predict the outcome of choice-feeding at high temperatures. Theexperimental evidence is conflicting.
Full discussion of effects of environmental temperature on food intakeappears in Chapter 17.
268 Chapter 13

Poultry
Several experiments have shown that increasing the environmental temperaturetends to increase the protein concentration of the selected diet as energy intakefalls, but this is not sufficient to prevent all of the temperature-induced reductionin performance, in either growing birds or laying hens. However, some otherstudies have found no difference in the proportion of HP selected by broilerswhether they were kept in a thermoneutral or heat-stressing environment whileone study, with mature birds from high- and low-weight strains, found increasingtemperature to have a proportionately greater depressing effect on proteinintake than on energy intake, against expectations.
Broilers given a choice of protein concentrate and whole sorghum grainsate 30% more grain during the day under constant 20°C than in a cyclicaltemperature of 20°C during the night and 33°C in the day with continuousillumination (Mastika and Cumming, 1985), i.e. the latter increased their pro-portion of HP in their diet during the hot period. Similar results were obtainedin a second experiment, in which the lights were on for 16 h/day and choice-fed birds were more efficient than those on the complete food in the hotenvironment.
Under cold conditions (10°C), choice-fed broilers ate as much protein butmore energy than at 20°C (Mastika and Cumming, 1987), a furtherdemonstration of the ability of the broiler to independently control its energyand protein intakes according to changes in requirement.
Sheep
Cropper and Poppi (1992) kept growing lambs in thermoneutral (12–20°C), cold(3–6°C) or hot (27–30°C) environments for 7 weeks and gave a choice of twofoods containing 67 and 251 g protein/kg. There were no differences betweenthose in the thermoneutral and cold environments, whose consumption ofprotein and energy was at rates close to NRC recommendations, giving very highgrowth rates. Those in the hot environment increased their HP:LP ratio butreduced their total intake and growth rate. It was concluded that lambs changetheir selection in the appropriate direction when the environment is changed.
Regulation of Amino Acid Intake
Diets that are imbalanced in the amino acids absorbed from the digestive tractlead to metabolic disturbances and a reduction in food intake, which is directlyproportional to the degree of amino acid deficiency or imbalance. The effect onintake may be due to the metabolic cost of deaminating the excess of thoseamino acids that cannot be utilized because of the deficiency – relative orabsolute – of others. Appetites for individual amino acids can therefore beenvisaged if the animal learns that one food contains too little of an amino acidfor its requirements and another too much, as long as there are discerniblesensory differences between the two foods to act as cues.
Appetites for Specific Nutrients 269

Poultry
Newly hatched layer chicks offered a choice between a low-lysine food and onewith an excess of lysine ate some of the supplemented food but not enough tomaintain a growth rate as high as those given a single, adequate food(Newman and Sands, 1983). The two food containers were kept in the sameplace through the 21-day experiment, but no colour cues were given and noseparate training period was provided. In a second experiment, a low-lysinefood was given in choice with L-lysine HCl but, although the birds ate somelysine, it was not enough to support normal growth. In this case, presumablythe birds had no difficulty in differentiating the food from the pure lysine. WhenD-lysine HCl was offered as a choice with low-lysine food, the birds ate someof the former, suggesting that D-lysine triggers some receptor mechanism eventhough D-lysine was unavailable for metabolism. Given a choice between L-and D-lysine, birds ate more of the L form. Thus, there is some evidence ofnutritional wisdom but not sufficient to give a properly balanced diet.
Broilers rendered methionine deficient by prior feeding on the low-methionine food and then given a choice between a complete food and onewith 50% of the recommended methionine chose predominantly the former. Inlaying hens, a methionine-deficient diet depressed egg production from 85 to67%, while a choice between deficient and adequate diets resulted in a 58%choice of the adequate diet and egg production of 80% (Hughes, 1979).Selection for methionine therefore occurred, but not quite enough to prevent asmall decline in egg production.
Pigs
Growing pigs select a food with protein containing a balanced mixture ofamino acids in strong preference to one with an imbalanced amino acidcomposition, whereas the preference for a balanced food paired with a protein-free food is not so marked: clearly, the imbalanced diet is aversive. It takesapproximately 24 h for pigs to recognize an imbalanced diet, which isconsistent with a learned aversion to a food causing malaise.
Pigs preferred a protein-free food to a threonine-imbalanced one(Robinson, 1975), and the imbalanced food was clearly aversive. Growing pigsselected a methionine-supplemented food in preference to an unsupplementeddiet containing 90 g casein/kg, but this may have been due to the strong tasteof the methionine rather than to a specific appetite. In the same report, therewas no lasting selection for lysine-supplemented foods.
Addition of 4% of methionine, tryptophan, arginine, lysine or threonine tothe food for growing pigs led to reductions in weight gain of 52, 31, 28, 16 and5%, respectively and, when given a choice of one of the imbalanced foods andthe control food, there were strong preferences for the balanced food(Edmonds et al., 1987). When choices were offered between different excessesof amino acids, those with excess threonine, lysine or arginine were preferredto those with an equal excess of methionine or tryptophan. When given a
270 Chapter 13

choice between a protein-free food and one with an excess of tryptophan, theyinitially preferred the protein-free one, but by 12 days were eating more of thetryptophan-supplemented food.
In research in which growing pigs were offered pairs of foods containingtwo different levels of lysine or two different levels of threonine, there was noconsistent selection, probably due to the only cue being the position of thefood. However, even when the cues were strengthened by flavouring either thelysine-supplemented or unsupplemented food for choice-fed weaner pigs, therewas still no evidence for selection for lysine (Dalby et al., 1994).
Bradford and Gous (1992) also studied lysine appetite. In their firstexperiment, foods containing 8.6, 11.7 or 17.4 g lysine/kg food were givensingly, and the first and last of these were given as a choice to another group.The results supported the conclusion that the pigs chose for lysine but, as lysinewas confounded with protein content, this could be only a tentative conclusion.
In a second experiment, foods containing 14.7 g lysine/kg were made,using either fish meal, soybean oil cake or sunflower/cottonseed/groundnut oilcake. These were fed alone or in choice with each other or with a low-proteinfood (8.3 g lysine/kg). When they were offered as single foods, there were nosignificant differences in growth, but when given as choice the pigs preferrednot to eat much of the plant protein mixture. However, there was still nodifference in daily food intake or growth.
The question then arises as to whether the plant protein-containing foodcontained an antinutritive factor or it was just unpalatable. The levels of the toxingossypol were not high. With most of the food combinations in this secondexperiment, the lysine content chosen was 14.7 g/kg or very close, except whenthe choice was between the food containing plant protein and one with a lowprotein content, in which case only about 13% was eaten of the former, giving alysine content of only 9.0 g/kg. Even though the three types of food had the sameprotein content, they were not eaten in equal amounts or at random, but for aremarkably constant lysine content, except where the plant protein was concerned.
On the other hand, Nam et al. (1995) concluded from their research thatgrowing pigs are unable to control their protein and lysine intake to meet theirrequirement for growth when given a choice of two isoenergetic diets differingin protein and lysine content. However, the foods they offered to investigateprotein selection contained 100 and 180 g/kg, so knowing that such pigs havean optimum of around 210 g/kg, falling as they grow to perhaps 180 g/kg, it isnot surprising that they ate predominantly HP throughout. Also, the foodsoffered in the study of a possible lysine appetite both contained 140 g/kg CPwith 5.3 or 9.0 g lysine/kg. Given the low CP content of the diet, whicheverfood they chose they would still be very deficient in many amino acids. Thiswork, therefore, fails to meet some of the requirements necessary fordemonstration of wise choices between foods (see Chapter 7).
There is clear evidence of an appetite for tryptophan (Trp) in newly weanedpiglets (Ettle and Roth, 2004). In addition to Trp-adequate (2.0 g/kg) and Trp-deficient (1.1 g/kg) treatments, there were choices between the deficient and theadequate foods and between the deficient and a food mid-way between deficientand adequate (1.6 g/kg). In both choice-fed groups, the pigs ate predominately
Appetites for Specific Nutrients 271

the higher-Trp food, especially after the first week, during which time thepreference was developing. Together with the results of growth performance,these results suggest that piglets are able to detect Trp deficiency-inducedmetabolic changes and respond with an aversion against the Trp-deficient diet.
Appetites for amino acids can be expressed in most cases as long as theexperimental conditions are suitable.
Appetites for Minerals
In order to demonstrate a specific appetite for an individual nutrient rather thanfor a particular type of food, animals are offered a choice between two similarfoods, one of which is supplemented with the nutrient in question while the otheris not. A significant preference for the supplemented food may demonstrate aspecific appetite for the nutrient. Such a conclusion can be strengthened by thedemonstration that animals made deficient in the nutrient in question choose ahigher proportion of the supplemented food than those not made deficient.
Calcium
The great demand for calcium (Ca) for the formation of the eggshell meansthat the laying hen has been the prime subject for studying Ca appetite.
Poultry
Perhaps the most widely recognized example of a specific appetite in farmspecies is the Ca appetite of the domestic chicken. Wood-Gush and Kare (1966)showed that Ca-deficient chickens preferred food containing Ca to a Ca-deficient food when the choice was given after 21 days of deprivation.Palatability is also involved, Ca lactate in food being selected for but Ca lactatein the water being avoided, even by deficient birds. Although this appetite forCa develops slowly (2–4 days) in growing chickens, suggesting that it is learned,it develops very quickly (0.5 h) in laying hens where the Ca requirements aremuch higher. This has been used to support the suggestion that the Ca appetitein chickens is innate (Hughes, 1979), but it seems more likely that it is learned,given that most Ca salts are insoluble and therefore have little taste.
The higher food intake that is observed on days in which an egg is beingformed might be due to the higher Ca requirement on those days, but mightalso be a response to amino acid or energy demand. Chah and Moran (1985)found differential intake of Ca and protein, however, as there was higherprotein intake in the morning and higher Ca intake later in the day by hensproducing at least 90% eggs and given choices of a high-energy food, a high-protein food and oyster shell flakes. Compared with controls given a completefood, there was no difference in egg production or body weight change, buteggshells were thicker and the efficiency of utilization of nutrients appeared tobe better in the choice-fed birds.
272 Chapter 13

Given foods containing 8.9 or 3.5 g Ca/kg and grit containing 380 g/kg,pullets chose diets containing 11.8, 20.8 and 35.0 g Ca/kg during the growing,pre-laying (medullary bone formation) and egg-laying phases, respectively, i.e.close to their requirements. Growing pullets have also been found to self-regulatetheir Ca intake well, but laying hens were not so efficient. When containers forpullets were switched between left and right sides, the birds gradually realized thisand changed their selection appropriately within about 3 days. The fact that thischange was not immediate suggests that the birds were using positional cues theyhad learnt to associate with the Ca levels of the two foods.
Clearly, the animal must be able to distinguish between high- and low-Cafoods by visual or taste cues, otherwise it cannot identify the appropriate diet (seeChapter 6). What is the reinforcement that leads to preference for a particulardiet? It seems unlikely to be a learned aversion for the deficient food becausebirds tend to choose familiar foods even when they are deficient, as against noveldiets that might supply the missing nutrient. It is more likely, therefore, thatingestion of Ca gives a feeling of well-being, which becomes associated with thatparticular food, i.e. preference for the Ca-supplemented food.
Although voluntary intake of food declines around the onset of laying inpullets, their intake of oyster shell increases during this period. Once in full lay,hens show a diurnal fluctuation in selection for Ca, eating more limestone gritor oyster shell just before dark (at a time when eggshell formation isproceeding) than earlier in the day (Mongin and Sauveur, 1979). To separatethe effects of egg formation from those of photoperiod, hens were kept incontinuous light; there was still a consistent peak in Ca selection 6–10 h afterovulation when Ca deposition in the shell was just about to start, whichsuggests an anticipation of need.
It had been found that hens ate more food in the first hour of thephotoperiod (presumably because they were hungry after not eating all night)and again in the last hour or two before dusk (postulated to be in response toincreased demand for Ca and phosphorus at that time). However, we have seenno evidence of such phenomena although we have confirmed that, whenoffered ground limestone separately from the main food, the hens ate limestoneonly between 20.00 h and midnight (lights off), i.e. at the beginning of shelldeposition (S.H. Gordon, G.R. Barkley and J.M. Forbes, unpublished results).
Calcium deposition is not a direct stimulus to Ca intake, however, aspreventing shell formation by placing a thread in the wall of the shell gland didnot abolish the daily peak in Ca selection. Of the other events occurring duringthe egg-laying cycle of the hen, oestradiol secretion is the most likely to beinvolved in the diurnal changes in Ca selection. Oestradiol treatment of cockerelscauses an increase in Ca intake, and plasma oestradiol concentrations closelyparallel differences in Ca intake on different days.
Pigs
Growing pigs offered a choice between water and a 24 g/l solution of Calactate drank very little of the latter, even though they were on a low-Ca diet.Even after parathyroidectomy, when plasma Ca concentration was significantly
Appetites for Specific Nutrients 273

reduced, they did not choose Ca lactate and had to be revived with injectionsof Ca borogluconate (Pickard et al., 1977). Intact pigs on a low-Ca diet did,however, eat solid Ca carbonate but did not reduce the intake of this when Cacarbonate was added to their food at the rate of 5 g/day. Thus, if there is a Caappetite in pigs it is not very specific. As Ca absorption is regulated accordingto the animal’s requirements, excess Ca in the gut is not absorbed, therefore afood containing an excess does not necessarily become aversive.
Ruminants
It is widespread practice to offer ruminants access to mineral licks (blockscontaining multiple minerals) on the assumption that they will regulate theirmineral intake, but this cannot be achieved when the block contains manyminerals unless the composition is exactly in proportion to the animals’requirements, which is unlikely. It is inadvisable to offer Ca salts ad libitum becauseabsorption of Ca from the gut is regulated in mammals: a high intake of Ca leadsto a lower rate of absorption and no change in total uptake from the gut. Widedifferences were observed in voluntary intake of dicalcium phosphate and calciumcarbonate between pregnant cows fed a ration low in Ca and phosphate (Pickardet al., 1978), and it must be concluded that there is no evidence for a specific Caappetite in cattle. This conclusion can also be drawn from the compilation ofexperimental results by Pamp et al. (1976), although some of the results theyquote are suggestive of a selective intake of bone meal by cows.
Phosphorus
Poultry
Phosphorus (P) is an essential nutrient, required for bone and eggshell formationin addition to many metabolic processes. Laying hens choose diets withintermediate P contents (5–10 g/kg) and reject those with low (2 g/kg) or high (24g/kg) contents. When the Ca content was raised from 30 to 60 g/kg, theproportion eaten of a food containing 24 g P/kg rose from 20 to 37% when theother food contained 10 g P/kg, which suggests homeostatic control of P intake tomaintain a constant ratio to Ca. However, Hughes (1979) reports a failure todemonstrate a P appetite in laying hens.
In addition to optimizing the nutrition of the hen, there is the increasinglyimportant need to avoid excessive excretion into the environment. Much of the Pin plant materials is in the form of phytate, which is resistant to digestion, hencethe importance of the proportion of dietary P that is available for absorption(available P, AP). Phytase enzymes release P from phytate, and these are used asfood additives to improve the availability of P from poultry diets. Nevertheless, itis not possible to predict with accuracy the optimal rate of inclusion of phytase indiets for birds in different physiological states. Some of the results presented in theprevious paragraph suggest that diet selection methodology might offer a meansof determining optimum provision of dietary P, including the use of phytase.
274 Chapter 13

As described in Chapter 7, it is necessary to ensure that one food to beoffered is deficient in the nutrient in question, in this case P. This has provedsurprisingly difficult with the type of wheat-based food usually used in northernEurope, because of the relatively high activity of natural phytase in wheat.However, it is possible to produce P deficiency in hens by using maize/soy-based foods, and Barkley et al. (2004) confirmed that the low-AP (LAP, 1.1 gAP/kg) food they formulated was indeed deficient, as evidenced by significantlyreduced egg weight compared with eggs from hens given a similar foodformulated to be adequate in AP (normal AP, NAP, 2.2g AP/kg DM) by additionof dicalcium phosphate. Laying hens were then offered a choice between LAPand NAP foods to determine whether they would choose proportions of thetwo appropriate to their needs for AP.
At the peak of egg laying (25–28 weeks of age with a production of 0.98eggs/bird/day), P-replete or P-deficient hens were fed either NAP or LAP alone,a choice of LAP and NAP or a choice of LAP and PAP (LAP with 400 FTU/kgmicrobial phytase). The P-deficient hens given a choice of NAP/LAP ate asignificantly greater proportion of NAP (66%) than did P-replete hens fed NAPin phase 1 (28%), demonstrating that P deficiency influenced subsequentselection for AP, i.e. an appetite for P (see Fig. 13.3).
With a choice between LAP and the same deficient food with added phytase(PAP), there was no effect of previous diet on the proportions of food chosen,which were not significantly different from 50%. The recommended level ofinclusion of phytase in the diet for laying hens is 200 ppm, and the diet takenincluded 0.5 of the food containing phytase at 400 FTU/kg; therefore, the
Appetites for Specific Nutrients 275
0
20
40
60
80
100
24 25 26 27 28
Age (weeks)
Pro
port
ion
of N
P in
die
t (%
)
Fig 13.3. Proportion of NP or PP eaten by laying hens. Diets: �, NP in phase 1, choicebetween NP and LP foods in phase 2; ▫, LP in phase 1, choice between LP and PP in phase2; ●, NP in phase 1, choice between LP and PP in phase 2; �, LP in phase 1, choice betweenNP and LP foods in phase 2 (from Barkley et al., 2004).

concentration of exogenous phytase in their diet was diluted to approximately200 FTU/kg, i.e. the recommended level. It may be, therefore, that the selectionof close to 50% of each food was targeted at optimizing P nutrition rather thaneating at random. Nevertheless, the P-depleted hens would have been expectedto choose a higher proportion of PAP than did the P-replete birds, which they didnot. This highlights the difficulty of interpreting results from diet selectionexperiments where the two foods used have an optimal mixture close to 50:50.
A factor limiting the birds’ ability to choose wisely for AP might be thenature of the ‘discomfort’ induced by P deficiency. Mild deficiencies or toxicitieswhose effects on metabolism have a delayed onset, and/or which do not affectabdominal receptors, are less likely to induce sensory-paired aversions than arethose inducing immediate nausea; P deficiency or excess is likely to fall into theformer category and is therefore not a strong candidate for conditionedpreference or aversion. Although the evidence supports an ability amongst hensto select their diet according to its P content, this has not been demonstrated asclearly as has been the case for protein.
Ruminants
Phosphorus-deficient sheep and cattle will eat bones but it is doubtful whetherthis is a true appetite for P, because they do not specifically select a supplementcontaining a high level of phosphate. However, cattle stop eating bones whentheir blood Pi (inorganic phosphate) levels have risen to normal or areexcessive, providing circumstantial evidence for a P appetite.
Grazing cattle and sheep fail to select a P supplement to correct a Pdeficiency induced by low-P herbage. However, Merino sheep show preferencefor phosphorus-fertilized plots of grass in the dry season (but not in the wetseason), even when the levels of P were higher than those giving maximumpasture growth (Ozanne and Howes, 1971). The major difference between thepastures was the P content but there was also a small but consistent fall in thephenol content as P increased, so perhaps they were using this as a cue, oreven as the primary stimulus.
Selenium
Evidence for an appetite for selenium (Se) is provided by the results of anexperiment in which Se-deficient hens preferred a food high in Se over a low-Se food during the first 3 weeks of choice but not thereafter, when presumablythe deficiency had been alleviated (Zuberbuehler et al., 2006).
Sodium
Poultry
Several attempts by Hughes and his colleagues (Hughes, 1979) failed todemonstrate anything more than a weak sodium (Na) appetite in laying hens;
276 Chapter 13

even when a slight preference was shown for a higher-Na food, it was notenough to prevent a reduction in egg production. This is surprising, as Na is amajor mineral in the body and many species of mammal have been shownclearly to have Na appetites.
Ruminants
A specific Na appetite has been demonstrated and studied by Denton andcolleagues for many years. Housed sheep correct for Na deficits very accuratelywhen given NaCl solutions (Denton, 1982), while on grazing they select plantspecies that are high in Na. The increase in intake of NaCl solution when sheepwere Na-depleted by drainage of saliva via a parotid duct fistula is reversed byinfusion of Na salts into a lateral ventricle of the brain, showing that the CNS issensitive to Na ions.
Sodium depletion of calves led to reduced food intake and the developmentof a relatively specific appetite for the Na ion, calves responding more for Nabicarbonate in an operant situation when they were more severely Na depleted.
No increase has been found in the preference shown by ewes for salt whenon low-salt diets during pregnancy or lactation, when salt requirements areknown to be increased, but this increase in Na demand is likely to be smallrelative to that induced by saliva drainage.
Sulphur
There is good evidence for an appetite for sulphur (S) in sheep. Ewes offeredfoods with low (1.1 g/kg) and high (9.5 g/kg) contents of S after having beenfed on a diet adequate in S initially ate at random but, within 2 days, increasedthe proportion of the low-S food so that their daily intake of S was very close tothat required. Sheep previously made S-deficient initially ate a high proportionof the high-S food but later reduced the S content chosen until it had stabilizedat close to the optimum level (Hills et al., 1998). Moreover, ewes conditioned toassociate different flavours of straw with different doses of S into the rumenpreferred flavours associated with moderate doses but avoided flavours pairedwith high (mildly toxic) doses, as shown in Fig. 13.4 (Hills et al., 1999). Withthe highest doses (9 or 12 g), preference for food of the flavours associatedwith these doses declined significantly in successive tests.
Zinc
Zinc (Zn)-deficient chicks will consume more of a food containing 65 mg Zn/kgthan of one containing only 5 mg/kg (Hughes and Dewar, 1971). During thefirst 6 days after offering the Zn-supplemented food, it was consumed at greaterthan twice the level of the low-Zn food by Zn-deficient birds. Control birds ateabout 40% of the high-Zn food for several days, but this proportion graduallyincreased as they apparently became marginally Zn-deficient themselves.
Appetites for Specific Nutrients 277

Appetites for Vitamins
Thiamine (Vitamin B1)
Thiamine selection has been studied in chickens by inducing a functionaldeficiency with injections of oxythiamine hydrochloride, a metabolic antagonistof thiamine (Hughes and Wood-Gush, 1971). When offered two foods, onedeficient in thiamine, the other supplemented with 20 mg/kg, the depletedbirds ate consistently more of the supplemented food than did control birds,demonstrating a specific appetite for thiamine.
Vitamin B6
Broilers given a choice of vitamin B6-sufficient and -deficient foods at first ate toolittle of the former and showed signs of deficiency of the vitamin (Steinruck et al.,1991). They then increased their relative intake of the supplemented food to re-establish normal growth and continued to eat proportions of the two foods, whichprovided them with a balanced diet. Thus, they demonstrated a specific appetitefor vitamin B6 based on the learned consequences of eating the two foods.
Ascorbic acid (Vitamin C)
There have been several reports that the adverse effects of heat stress on foodintake and performance are partially alleviated by supplementation of the diet
278 Chapter 13
Fig. 13.4. Preference ratios of sheep for food of the flavour associated with doses of 3 g(solid bars), 6 g (shaded bars), 9 g (vertically striped bars) or 12 g (horizontally striped bars)sulphur given intra-ruminally during three conditioning periods (from Hills et al., 1999).

with ascorbic acid. This is somewhat unexpected, as it had been generallyassumed that chickens could synthesize sufficient ascorbic acid and that dietarysupplementation was unnecessary.
In order to see whether the different requirements for ascorbic acid undertemperate and hot conditions would be expressed as an appetite for ascorbicacid, Kutlu and Forbes (1993c) trained young chicks to differentiate asupplemented food from an unsupplemented one by means of colour, andthen gave them a choice of the two. Those birds kept in an non-stressfulenvironment ate a significantly lower proportion of the supplemented foodthan those maintained under mildly heat-stressing conditions.
Figure 13.5 shows the ascorbic acid intakes chosen by broiler chicks underthe two environmental conditions and the changes following reversal of theenvironments (Kutlu and Forbes, 1993b). It will be seen that, following achange in environmental temperature, the birds adjusted their ascorbic acidintake within 3 days; the voluntary intake of the vitamin in the thermoneutralenvironment was 5–6 mg/day, while under the hot conditions it was 9–10mg/day. Clearly, the colour discrimination of the two foods had allowed thechicks to express their desire for an intake of ascorbic acid appropriate to theirneeds. If the two foods were offered without colour, the birds ate at random.
Appetite for Fibre
Given only a food whose ingredients have been finely ground, ruminants do notperform proper rumination and seem to crave a source of long fibre: provisionof fibre restores normal rumination. To investigate whether this can beconsidered to be an appetite, in the true sense of the word, Campion and Leek
Appetites for Specific Nutrients 279
4
5
6
7
8
9
10
0 1 2 3 4 5 6 7 8 9 10 11
Day
Ascorbicacid intake
(mg/bird/day)*
*
*
* **
**
*
*
*
Hot
Hot
Cool
Cool
*
Fig. 13.5. Self-selected intakes of ascorbic acid by growing broiler chickens offered colouredfoods that were unsupplemented or supplemented with ascorbic acid. �, birds in a heat-stressing environment for 5 days followed by a thermoneutral environment; �, thermoneutral,followed by hot environment. The vertical arrow indicates the time of change of environments.*, selection between foods significantly different from 50:50 (from Kutlu and Forbes, 1993b).

(1997) offered polyethylene fibre to sheep on diets of long or ground hay. Onswitching from hay to the pelleted diet, the sheep commenced eating the fibrewithin 24 h. Further, tickling the anterior dorsal part of the rumen wall withpolyethylene fibres – via the rumen fistula – reduced the voluntary intake ofpolyethylene fibres, suggesting that the intake of inert fibre may be a result of thereduction of ruminal sensory input to the brain normally provided by fibrousreticulo-ruminal contents.
However, when offered a choice between short (3 mm) and long (15 mm)polyethylene fibres, sheep on a finely ground food significantly preferred the3 mm fibre, even though this did not permit proper rumination. Choice of fibreis therefore partly governed by ease of ingestion rather than by which substrateis more ideally suited to induction of rumination. This can be encompassed bythe MTD theory (se Chapter 10), whereby the discomfort of eating too muchfibre can be traded off against the problems of eating too little.
Toxins
While appetites for nutrients, and fibre, are directed towards providing sufficientfood resources to allow the animal to achieve its programmed physiologicalactivities, they also serve to prevent toxic excesses of these nutrients. Theprinciple of conditioned preferences and aversions has been discussed in Chapter7. The same principles apply to toxic substances, i.e. those for which the ‘desired’intake is zero, or at least very low.
Tall larkspur is a rangeland herb that contains toxins and is frequently fatalif ingested. The hypothesis that cattle can generally limit intake of larkspur tosublethal levels was tested by feeding pelleted food containing 27% larkspur(Pfister et al., 1997). The animals showed distinct cyclic patterns of intake,where increased larkspur consumption on one or two days was followed bysignificantly reduced consumption on the following day. The intake of larkspurprovided just under the amount that would produce overt signs of toxicity.
Pfister et al. (1997) subsequently examined the response to doses of a toxin,in this case lithium chloride (LiCl), that varied with food intake. Increasedconsumption was followed by application of a stronger dose of LiCl, and thiscaused a reduction in food intake. According to the experimental protocol, thiswas followed by application of a lower dose of LiCl and therefore higher foodintake, in a cyclical manner. Then they repeated this experiment but using oraladministration of larkspur instead of LiCl and, again, there were clear cycles ofintake, days of higher food consumption being followed by 1–3 days of reducedconsumption. This might suggest that the fluctuations of daily intake commonlyobserved are due to toxins in the food, but there is no evidence for this in caseswhere the food appears to be free of obvious toxins (see Chapter 10).
Examples such as the one above and in Chapter 8 clearly show thatanimals can regulate their intake of toxins, in balance with their intakes ofnutrients.
280 Chapter 13

Water Intake
Water is the most important nutrient. If you doubt this statement then considerwhich nutrient, when removed from the diet, will cause illness and death mostquickly. The fact that water is taken so much for granted in temperate countriesis due to its ready availability and thus its very low cost.
Water is required for: (i) wetting food in the mouth and stomachs; (ii) as amedium for digestive reactions in stomachs and intestines; (iii) as the majorcomponent of the body; (iv) as a medium for the excretion of soluble materialin the urine; and (v) for the secretion of sweat. Thus, its requirements areinfluenced by the amount and type of foods eaten and by the environmentaltemperature.
The voluntary intake of water is usually about twice the weight of drymatter eaten and, because many of the functions of water are related to thedigestion and metabolism of food, water intake is closely related to food intake,both quantitatively and temporally. Simple-stomached animals usually drinkbefore, during or after each meal of food whereas ruminants, with their greatcapacity for storing digesta with a high water content, often eat a meal withoutdrinking and, when they do drink, take a very large volume of water.
In addition to the water drunk by the animal it is also present in foods,especially fresh grass, silage and root crops, so it is not always necessary toprovide drinking water. However, fresh water should always be availablebecause animals that are ill reduce their dry matter intake and will then requirewater, especially if they are suffering from diarrhoea – in which large amountsof water are lost in the faeces. In addition to ingested water, the metabolism ofsubstrates in the body yields water, which provides a small but significantaddition to the body’s supply.
Water intake is depressed if water is difficult to obtain; a small degree ofrestriction is usually not harmful, but in many areas of the world water is notexpensive and is usually offered ad libitum. Prediction of water requirementsand intake has not, therefore, received as much attention as has the predictionof food intake.
Water intake is controlled by the hypothalamus, and an increase in thetonicity of cerebrospinal fluid is an important stimulus to drinking. The controlof water intake is a complex subject dealt with in detail by Rolls and Rolls(1982), while Olsson and McKinley (1980) covered the subject for ruminants.
There is clearly a specific appetite for water and it is generally assumed thatthe animal takes in as much water as is needed to meet its requirements,although excessive water consumption can be induced under some conditions,such as the schedule-induced polydipsia seen in pigs. There is relatively littlecost to the animal if it drinks too much water.
Poultry
Bailey (1999) has reviewed the control of water intake by poultry, factorsaffecting water intake and the effects of water restriction.
Appetites for Specific Nutrients 281

Chickens drink up to 40 times per day, but make fewer visits to drinkers asthey mature. It is likely that poultry drink more than is strictly required because,when the water intake of chickens was restricted by adulteration with quinine toabout 75% of normal, there was no effect on food intake and only a smallreduction in growth rate.
Pigs
Brooks and Carpenter (1990) carefully considered the theoretical and practicalaspects of the various requirements for water by growing and finishing pigs andthe routes by which the animal gains and loses water, including a completewater balance sheet for a pig. They particularly considered wastage of water asintroducing important errors in assessment of the true water requirements ofpigs. Huge variation has been found between water intakes by pigs in differentstudies, and much of this may be due to inaccurate water meters. Also, therecan be considerable wastage, especially if there are many pigs per drinkerand/or if fighting occurs.
Flow rate is important in determining how much pigs drink. A low rate ofdelivery necessitates long drinking periods, and pigs seem unwilling to drink formore than a few seconds at a time. Barber et al. (1989) found pigs to have asignificantly lower food intake during the 3 weeks following weaning fromdrinkers with a flow rate of 175 ml/min compared with that from thoseproviding 450 ml/min.
Lactating sows have a very high requirement for water. They might beexpected to drink up to 20 l/day, and even more in hot weather.
Cattle
Lactating cows fed a fixed amount of concentrates and silage ad libitum tookabout four drinks/day, even though silage was taken in 15 meals/day andconcentrates in a further two to four allocations per day (J.M. Forbes, C.L.Johnson and D.A. Jackson, unpublished results). Figure 2.2 shows the feedingand drinking pattern over a 24 h period for a cow yielding 25 kg of milk/dayand eating 14 kg of silage and 5.5 kg of concentrate DM. There were fourdrinks, ranging in size from 1–13 l, all in association with meals of silage.
As in other species, most drinks occur in close association with eating, eventhough many meals (of silage) are not accompanied by drinking. Figure 13.6shows the distribution of the frequencies of different intervals between mealsand subsequent drinks and between drinks and subsequent meals (Forbes etal., 1991). Fifty-three per cent of drinks occurred within 10 min of eating.
Environmental temperature
Water intake by poultry is positively correlated with environmental temperature,but the initial increase that accompanies a sudden rise in temperature is not
282 Chapter 13

sustained as the birds become acclimatized. Cool water is preferred to warmwater, even in a cool environment.
In pigs, there is a rise in the ratio of water intake to dry matter intakebetween 20 and 30°C from 2.7 to 4.3 kg/kg DM (Close et al., 1971). Above25°C this is mainly due to the decrease in food intake rather than to an increasein water intake. In cold weather, if the temperature of drinking water is warmerthan that of the environment then pigs drink more while, in hot weather, theydrink more if the water is cold.
Above 0°C there is a positive relationship between environmentaltemperature and water intake in cattle (Winchester and Morris, 1956). Belowfreezing, however, the water intake of lactating cows increases, probably due tothe increased metabolic rate. Kadzerea et al. (2002) have reviewed the effectsof heat stress on water intake by cattle and quote the following equation forlactating Holstein cows:
WI = 15.99 + 1.58DMI + 0.90MY + 0.05SODIN + 1.20 TMIN (13.1)
where WI is water intake in l/day, DMI is total DM intake in kg/day, MY is milkproduction in kg/day and TMIN is the weekly mean minimum temperature indegrees Celsius; SODIN is sodium intake in grams/day (Murphy et al., 1982).Note that if milk yield is omitted then the regression coefficient for DM intakebecomes much larger and in line with other results, because of the high degreeof correlation between milk yield and food intake.
Provision of cool water encourages a higher water intake by cattle in veryhot environmental conditions. Sheep also drink more as temperatures increasebut, like cattle, also increase water intake/unit of DM eaten when environmentaltemperatures fall below about 0°C (Forbes, 1968c).
Appetites for Specific Nutrients 283
Fig. 13.6. Frequency distribution of drink–meal and meal–drink intervals in lactating dairycows fed silage ad libitum (from Forbes et al., 1991).

Dry matter intake
The greater the dry matter intake, the greater the urinary excretion and therequirement for water. In addition, heat production is increased by increasedfood intake, which leads to greater evaporative heat loss and thus to greaterwater intake.
Water intake by poultry increases with increasing food intake; the bestsingle predictor of water intake is dry matter intake, and drinking usuallyfollows meals (Hill et al., 1979). Fasted broilers drink about one-third of theirnormal daily intake of water.
There are two phases of drinking in growing pigs, one of which is closelyassociated with eating, the amount of water being about 89% of the weight offood eaten, while the other is drinking between meals, which is fairly constantat 2.2 l/day. The total weight of food and water intake comes to close to 12%of body weight/day in each case, and it might be speculated that there is aweight or volume limit to intake.
Restricting the food allowance for pigs to half the usual amount or completefasting increases the volume of water consumed by up to sixfold. As discussed inChapter 2, chronic hunger leads to oral activities such as bar chewing, and it islikely that the polydipsia of underfeeding is such a displacement activity. Care isneeded before accepting very high water intakes as being valid, as much of thatapparently drunk might be wasted. For example, stalled sows have been notedto stand with their snouts pressing nipple drinkers for up to 1 h/day but withoutdrinking.
Water intake increases in direct proportion to the intake of food DM eatenby cows. Under UK conditions with cows fed grass silage, the followingequation was one of several ridge regressions that gave a good fit (R2 = 0.89)to data (Dewhurst et al., 1998b):
WI = – 73.7 + 2.19DMI + 2.21MY – 6.9VFAPROP +16.3pH (13.2)
where WI is water intake (l/day), DMI is total DM intake (kg/day), MY is milkyield (kg/day), VFAPROP is VFA proportion of total fermentation acids and pHis silage pH. Note that the coefficients that are common to equation 13.1 aboveare not similar, highlighting the specificity of such equations to the conditionsunder which they were derived.
Total water intake (free water plus water in the food) is correlated with drymatter intake in sheep and goats. In observations on non-pregnant ewes of twobreeds of very different type fed on silage, hay or dried grass, the relationshipwas:
TWI = 3.86 DMI – 0.99 (13.3)
where TWI is total water intake (l/day) and DMI is DM intake (kg/day) (Forbes,1968c).
Silanikove (1989) found a close relationship between water turnover anddigestible energy intake in desert and temperate goats:
WT = – 5.4 + 0.22 DEI (13.4)
284 Chapter 13

where WT is water turnover (ml/kg body weight/day) and DEI is digestibleenergy intake (kJ/kg/day). This relationship holds good for a wide range of sizesand physiological states, including lactation.
Diet composition
Increasing the salt concentration or the protein level of the diet stimulatesincreased water intake in all species because of the increase in urine volumenecessary for the excretion of the salt or urea.
Increases in the fat, protein or potassium content of the food all lead to anincrease in water intake by poultry. Water intake in pigs is also increased byprotein (especially unabsorbed protein), Na, potassium (K) and by someantibiotics.
Pregnant gilts and sows given restricted amounts of food with different levelsof fibre show a significant reduction in the time spent drinking and in water intakewith higher-fibre foods. This suggests that some drinking is a substitute for eatingand that the longer time spent eating and chewing a high-fibre food reduces thedesire for further oral stimulation by drinking.
Water drinking is induced by intra-cerebroventricular infusion of hypertonicsolutions in cattle but without effect on the intakes of food or NaCl. The effectof NaCl infusion is greater than that of mannitol or sucrose, despite the fact thatthey all cause very similar increases in osmolality of cerebrospinal fluid. Whengiven intravenously, NaCl and mannitol have equal effects, demonstrating thatthere are central NaCl receptors as well as osmoreceptors in cattle.
A dried grass diet was associated with a higher intake of water per unit ofdry matter by sheep than hay, presumably because of the higher ash andprotein contents (Forbes, 1968c). Increasing the intake of dry matter and/orcrude protein increases water intake by sheep, and the diurnal distribution ofwater intake is directly related to feeding times.
In summer, when other grasses are available in addition to saltbush (a salt-tolerant orache plant), sheep in Australia drink only once per day but, inautumn, only saltbush is available and they must drink twice per day. Theythen spend about 3 h/day walking to and from water. Where there is nosaltbush, they normally drink only once every 2–3 days, and only in very hotweather do they drink every day.
Physiological state
Inadequate water intake has sometimes been thought to be the reason for thepost-weaning growth check in piglets, and flavouring the water has been foundto be effective in overcoming this problem in some cases, but not all.
It has also been suggested that low water intake might be a cause of lowfood intake and loss of weight for a few days after weaning of lambs, and waysshould be sought to increase water intake, perhaps by offering it beforeweaning when lambs can sometimes drink considerable amounts.
Appetites for Specific Nutrients 285

Water intake increases during pregnancy in the ewe in proportion to thenumber of fetuses carried. In contrast to the results with goats, quoted above,Forbes (1968c) found lactation to stimulate water intake in ewes by more thanthe volume of water in the milk, presumably because of the increased foodintake and heat production of the lactating animal (see Fig. 13.7).
Conclusions
Poultry and pigs can select a diet containing a ratio of protein to energy that isclose to that providing for optimal growth. Changes in the requirements forprotein during growth are accompanied by reductions in the proportion taken ofthe high-protein food, and animals with a higher propensity to grow or produceeggs eat more protein than those with a greater potential to deposit fat.
There is considerable evidence that animals can select between foodsaccording to their requirements for individual amino acids, although thebalance of amino acids in a food can have a profound effect on its selection.
Many minerals and vitamins have been shown to be capable of beingselected, as long as the animals are able to differentiate the deficient andsufficient foods by means of sight, taste or position.
Water intake is regulated largely by the intake of food and responds to suchfactors as environmental temperature, pregnancy and lactation. Overconsumptionof water is a common problem of intensive housing, especially when restrictedfeeding is practised.
Overall, therefore, it has been clearly demonstrated that appetites foressential nutrients can be developed. This depends on animals sensing theirmetabolic ‘well-being’ and associating this with the sensory properties of thefoods on offer. The possibility of any appetites being innate seems remote,although the salt appetite of sheep seems to be very accurate, even inuntrained animals.
286 Chapter 13
0
1
2
3
4
5
0 1 2 3 4 5 6 7 8
Week of lactation
Tot
al w
ater
inta
ke (
kg/k
g D
MI)
Fig. 13.7. Total water intake (free water and in food) per unit of food DM (kg/kg) by lactating(�) and non-lactating (●) ewes. ▫, total water intake minus water in milk (from Forbes, 1968c).

14 Silage
Conservation is necessary in much of the world where grass stops growing forpart of the year due to coldness or drought. Traditionally, herbage has beenmade into hay, i.e. cut, left to lie in the field to dry and then stored under cover.The quality of the original grass is better retained if the drying is more rapidand one avoids rain falling on the cut grass.
Artificial grass-drying has therefore been used in rainy developedcountries, but the cost of fuel for drying is very high. It is possible to preservegrass by pickling rather than by drying: grass preserved in this way is calledsilage and is produced by compressing the material within a day or so ofcutting to exclude air and thereby encouraging the production of acids bynaturally occurring anaerobic microorganisms. It is common to add acidsat the time of ensiling, and the addition of a culture of particularly effectivemicroorganisms is also now widely used. Approximately 85% of the grassconserved in the UK is in the form of silage, as the frequent rain makes hay-making a risky process.
The reason for particular interest in the voluntary intake of silage is that thevoluntary intake of ensiled forage has been reported to be, on average, 27%(range 1–64%) lower than that of the corresponding fresh herbage, with sheepbeing more sensitive than cattle to ensiling. With partially fermented silages, thedepression in intake is much less, suggesting that products of fermentation –particularly nitrogenous products – are largely responsible. However, grass isusually more mature when cut for silage than when grazed, and thus lessdigestible, which will result in lower intakes (see Chapter 11).
Even where intakes of grass silage are similar to intakes of the parent grass,milk yield and protein production are still significantly lower, the efficiency ofutilization being reduced on average by 13% for dairy cows and by about 25%in growing heifers and finishing beef cattle; efficiency of utilization of energy inforages has been implicated in the control of food intake by ruminants (seeChapter 9).
© J.M. Forbes 2007.Voluntary Food Intake and Diet Selection 287in Farm Animals 2nd Edition (J.M. Forbes)

In many parts of the world, the crop predominantly used for silage ismaize. Cutting takes place before the cobs mature, and maize silage ischaracteristically lower in nitrogen and higher in soluble carbohydrate thangrass silage. Maize silage has been made in increasing quantities in northernEurope in recent years, as varieties have been developed suitable for growingat higher latitudes. Many other plant materials can be made into silage, andsome of these will be mentioned below.
Although the yield of grass for conservation is increased by cutting later inthe summer, this is obtained at the expense of decreased digestibility. It is betterto cut early and then take a second cut of the regrowth. The optimum strategydepends on the class of livestock to be fed on the conserved forage.
The products that depress intake appear to include ammonia and volatile fattyacids, particularly acetic acid (Tayler and Wilkins, 1976). Partial neutralizationsometimes increases voluntary intake while addition of formic acid, which hassometimes been used as a preservative, depresses intake. Thomas andChamberlain (1983) quote correlations between voluntary intake and severalchemical components but point out that there are also intercorrelations betweenthe various components: acid concentration and ammonia nitrogen are negativelyrelated to intake, while the ratio of lactic acid:total acid is positively related. Poorensilage conditions, which encourage a clostridial type of fermentation, yield asilage with particularly low intake characteristics.
Books by McDonald et al. (1991) and Wilkinson (2005) cover the basicand applied aspects of silage, respectively.
Dry Matter Content
In general there is a positive relationship between the DM content of silage andits intake by ruminants. In the USA it has been clearly shown that intake ispositively related to dry matter content for lucerne and maize silages. Overnightwetting of a silage depresses its intake by sheep, but the addition of water justbefore offering silage to young cattle did not affect daily intake compared withunwetted silage; it is likely that water outside plant cells is absorbed veryquickly from the rumen and does not contribute to the bulk of the food,whereas the volume of intracellular water does, until it is released.
Wilting
It follows that intake can be increased by wilting the herbage before ensilage,although there have been several instances of an accompanying drop in theyield of fat-corrected milk, possibly because of adverse effects on fermentation.Castle (1983) concluded that: ‘.. it is extremely doubtful whether there will beconsistent benefits [of wilting] in terms of animal production’. This is in contrastto the conclusion of Osbourn (1967) that: ‘ … wilting must continue to be theonly method available in practice to reduce this disadvantage of ensilage as amethod of conservation’.
288 Chapter 14

It is likely that grass for silage is cut nowadays at an earlier stage of maturitythan formerly, and that the effects of wilting are greater with silage of lowerdigestibility, cut later in the summer. The use of additives now improves thecontrol of fermentation of wet silages (see below), and wilting is recommendedmore to reduce the volume of effluent than to improve the nutritive value of thesilage.
An extreme form of wilting has been investigated by R. Simpson and H.Dove at the University of Melbourne, Australia (personal communication).Pasture is sprayed with half the normal level of glyphosate (a herbicide) 1 or 2weeks before flowering; this stops growth but does not completely kill the grass,and the soluble carbohydrate content remains elevated for at least 60 dayswhile that of untreated grass declines after flowering. Intake and performanceof animals fed this grass are greatly increased compared with those on unwiltedmaterial.
Products of Fermentation
The silage-making process ferments soluble carbohydrates to produce organicacids, predominantly lactic, but also significant amounts of acetic acid, andmany nitrogenous compounds such as amines. These substances, and thoseadditives that are incorporated to improve the silage, have been under suspicionas the cause of the lower intake of silage, compared with hay or grass, and havebeen infused into the rumen in a number of experiments.
Silage juice
The importance of fermentation in limiting the intake of silage is thrown intodoubt by results of an experiment in which ryegrass was either not fermented,or fermented for 4 or 12 days (Offer, 1997). Juice was extracted from thesematerials and solutions of dl-lactic acid were prepared to have the sameneutralizing values (NV) as the silage juices. When the dried residues wereoffered to sheep, there was no effect on voluntary intake. When they wereoffered unmolassed sugarbeet nuts with one of the juices or lactic acid solutionsadded (1.5 1/kg), there were no differences in intake despite large differences inpH, lactic acid concentration, NV and osmolality.
However, short-term DM intake (during the 3 h following the offering offood) decreased with increasing NV, being significantly lower for the highest NVthan for the others but with no difference between lactic acid and silage juice.While this suggests effects on short-term feedback mechanisms or palatability, itwill be necessary to conduct studies of any associations that might be learnedbetween the sensory and metabolic properties of different silages.
Offer (2000) conducted a further series of experiments with growing sheepto study what factors might limit silage intake. Silage was made from ryegrasswith either 2.5 l/t (LF) or 5.5 l/t (HF) of an ammonium tetraformate additive.Intake of HF was significantly greater than of LF. The two silages then had their
Silage 289

juice extracted and there was no significant difference between intakes of thedried materials. In a third experiment, juices from the two silages were added tounmolassed sugarbeet nuts (SBN) pre-feeding or administered directly into therumen. The only treatment to significantly depress intake was the one in whichjuice from LF was infused into the rumen, leading to the conclusion that it wassubstances in the liquid and volatile phases – rather than in the solid phase –that were responsible for the low intake, but that it was not via an effect on thesensory properties of the silage. In any case, any effects on taste or smell wouldnot be expected to be lasting, unless they were associated with internaldiscomfort sufficient to generate a conditioned aversion (see Chapter 6).
A comparison has been made of the effects of rapid intra-ruminal infusionof silage juice with a mixture containing the same volatile fatty acids, lactate,soluble carbohydrate, ammonia and nitrate, and was of the same pH andosmolality (Clancy et al., 1977). The depression of hay intake with this mixturewas only 40% of the depression with juice, so that other factors such as aminesmust have contributed to the depressing effects of silage juice.
Lactic acid
Lactic acid is present in silage at concentrations of up to 20% of the organicmatter, as well as being a product of ruminal fermentation. The evidence forlactate affecting voluntary intake is somewhat controversial, as 0.16 mol ofsodium lactate infused intra-ruminally to goats over 5 h did not affect intake(de Jong, 1981), whereas intra-ruminal infusions of 35 mmol during each ofabout ten meals/day reduced food intake in goats by almost half, but had asmaller effect in sheep. Compared with VFAs, infusion of lactate had aprolonged after-effect on intake.
When a high physiological concentration of lactic acid was infused into theduodenum of sheep, the intake of concentrates was reduced (Bueno, 1975),probably related to the reduction in stomach motility or to the involvement inpropionate metabolic pathways.
Cows can ingest more than 1 kg/day of lactic acid in silage, but thisamount added to hay does not depress intake to the same level as that ofsilage. As stated earlier, it appears that no single constituent of silage isresponsible for its low intake, but it is possible that the additive effects of anumber of substances might be important.
Nitrogenous components
Grass silage is often found to be eaten in lower quantities by cows than grasshay or maize silage. During the ensiling process, some of the protein is degradedto non-protein nitrogenous compounds while some is rendered indigestible,particularly if overheating has occurred in the silo. It may be, therefore, thatsome silages are protein-deficient even though their N content may make themappear adequate. There are two ways of overcoming the problem: making
290 Chapter 14

better silage and using supplementary feeding to balance the protein intake. Theformer implies cutting the forage at a relatively immature stage, while the latter iscovered in the section on supplementary feeding below. Chopping and the useof additives have proved very useful, while in northern Europe increasingattention is being paid to ensiling maize.
Infusing the rumen with nitrogenous constituents of maize silage extractsdepresses intake of hay. Complex changes occur to nitrogen (N)-containingcompounds in forages during ensiling, including the release of N-compoundsinto the fluid medium where a significant proportion can be lost rapidly fromthe rumen by onward flow of liquid. The efficiency of utilization of Ncompounds is generally higher in maize silage than in grass or legume silages.Givens and Rulquin (2004) state that:
New research needs to be aimed at enhancing the utilisation of N in the rumenthrough a better understanding of N/carbohydrate relationships and the ability offorages to supply degraded carbohydrate. Also more emphasis is needed onunderstanding of the potentially different role of the different N fractions that existin silages.
Ammonia
Intake of silage is inversely related to the content of ammonia-N (expressed asa proportion of total N), but infusion of ammonium salts into the rumen has tobe at rates that are toxic in order to depress intake significantly. Urea enters therumen in the saliva in large quantities, and much of this is metabolized toammonia; urea infusion into the rumen of goats during spontaneous mealsdepressed intake but was less effective, mole for mole, than ammonium salts(Conrad et al., 1977).
Biogenic amines
The addition of biogenic amines1 to silage depresses intake, but this effectdecreases after a few days (VanOs et al., 1996), suggesting that animals learnthat the unpleasant taste and smell are not associated with long-termdiscomfort. In a detailed experiment, Dawson and Mayne (1995) infused intothe rumen or added to the squeezed silage diet several amines (putrescine,cadaverine, gamma amino butyric acid (GABA), putrescine + cadaverine +GABA, 2 g/kg DM) or expressed juice from grass silage, or water into therumen of cattle for 1 week per treatment. There was no significant effect of anyof the treatments on silage intake. They later infused putrescine or gammaamino butyric acid (at 6 g/kg DM) into the rumen of cattle and studied theeffects on the intake of grass silage containing three levels of lactic acid(Dawson and Mayne, 1997). The rate of infusion was varied throughout theday in an attempt to match the amount infused with the amount the animalwould have consumed if the treatment had been added to the diet. Neither
Silage 291
1 Naturally occurring amines derived by enzymatic decarboxylation of the natural amino acids,e.g. histamine, serotonin, adrenaline.

putrescine nor GABA significantly affected intake or feeding behaviour. Itseems unlikely, then, that these biogenic amines found in silage are responsiblefor its low intake.
One of the biogenic amines, histamine, is present in some silages inamounts that might depress ruminal motility, but when given at 1 g/day to sheepit does not affect their silage intake. In the presence of formic acid, however, it isthought that sufficient histamine might sometimes be absorbed to cause areduction in silage intake. Direct infusion of histamine into the abomasumcauses a reduction in intake, but the increase in respiration rate indicated that ithad a systemic effect, and it can be concluded that it would require a very rapidpassage of dietary formate or histamine into the abomasum to obtain the lowintake of silage observed in this experiment.
Protein
Although the N content of grass silage implies an adequate protein content,some of the N is as non-protein N compounds while some is in proteinsrendered indigestible during ensilage, particularly if overheating has occurred.The provision of a protein source that is largely undegraded in the rumen, butwhich yields amino acids in the intestines, has been proposed to alleviate thisproblem. Once again, the results have been variable, Sanderson et al. (1992)finding that a fish meal supplement increased silage intake by growing steers,but that the increase was only as great as the increase in live weight. Forgrowing calves, soybean meal did not affect silage intake or performancerelative to fish meal, while maize gluten did not affect production in oneexperiment but did in another (Steen, 1992).
Low N status is not always the reason for low intake, however, as duodenalinfusion of casein in sheep offered grass silage ad libitum has improved Nretention with no effect on intake. Similarly, supplementation of grass silage foryoung cattle with isonitrogenous amounts of degradable (63 g groundnutmeal/kg DM) or undegradable (50 g fish meal/kg DM) protein resulted in nochange in silage intake but an improvement in digestibility and in the Nretention of the animals.
Sensory factors
Attention has turned to the possibility that the peculiar composition of silageinfluences its acceptability to ruminants. Buchanan-Smith (1990) fedoesophageal-fistulated sheep on lucerne but then fasted them for 5 h beforeoffering silage with added solutions, with the oesophageal plugs removed toprevent the test foods entering the rumen. Acetate added alone depressedintake, while a mixture of two amines and GABA stimulated intake at low levelsbut had no effect at higher levels.
The author suggested that the intake of silage with a high acetic content islimited by palatability. However, the animals were sham-fed both during trainingand experiments so that they had no chance to learn anything about associations
292 Chapter 14

between taste and metabolic properties of the various test foods. It will benecessary to train animals to make such associations before we can draw firmconclusions about the mechanisms responsible for low intakes of silage (seeChapter 6).
Silage Additives
One disadvantage of ensilage is that the product is likely to be variable due tolack of control of the microbial fermentation. Of the approaches toimprovement of the situation, two have involved addition of materials to thegrass: acids and inoculants.
Acids
Mineral acids were the first to be used, principally hydrochloric and sulphuric.They prevent the growth of harmful bacteria and reduce protein breakdown.Later, formic acid became popular but is difficult to handle as it is volatile. Itreduces the production of volatile fatty acids and ammonia by acting as asterilizing agent. Although it has been associated with decreased voluntaryintakes, this can be avoided by supplementation with a high-protein concentrate.Propionic acid can control silage fermentation and increases the intake of maizesilage, but it is more expensive than formic and is not likely to replace it.
Acetic acid has been tested, but with little advantage. Formalin is a usefuladditive for lucerne but not for grass, and it depressed intake when used atgreater than 10 l/t.
Because of the relationships between intake and pH, partial neutralizationwith bicarbonate before feeding has been investigated and it is sometimes, butnot always, effective in stimulating intake, especially with calves. In both cattleand sheep it increases water intake.
An alternative way of using acids is as a mixture of salts of carboxylic acids,which is applied at sufficiently high rates to grass before ensilage that fermentationis largely prevented. This results in higher soluble carbohydrate content comparedwith conventionally made silage, which enhances microbial activity in the rumenwhen the material is fed and results in higher levels of intake. The use of suchcarboxylic acid salts gave a milk yield response in cows equivalent to an extra2.5 kg concentrates/day (Mayne, 1992).
Results, in terms of improved silage intake and milk production, have beenvariable, as would be expected when the quality of the herbage to which theaddition was made is so variable.
Inoculants
Most inoculants use Lactobacillus plantarum and, again, quite variable resultshave been obtained, but they are attractive in use because of their safety of
Silage 293

application. Sometimes their use gives higher intakes than some acid additives,even when the chemical composition of the conserved grass is similar, while inother cases organic acids are better. In a comparison of formic acid, sulphuricacid and a bacterial inoculation as additives in silage making, Mayne (1993)found a significant increase in intake (12%) due to formic acid for first regrowthbut a smaller effect of inoculant (4.6%). Sulphuric acid tended to reduce intakeof first regrowth, and none of the treatments had significant effects with asecond regrowth of grass.
Lack of soluble carbohydrates
With the fermentation of soluble carbohydrates, 10% of grass DM disappearsduring ensilage. This is equivalent to half of the potential to generate ATP inthe rumen and results in a very poor energy supply for microbial growth, eventhough there is plenty of energy for the animal itself. Microbial growth andactivity are therefore restricted, with the consequence that rates of fermentationand particle breakdown of silage are lower than for materials with highercontents of soluble carbohydrates. The problem is, to some extent, overcomeby supplying readily fermentable energy to the rumen, i.e. supplementationwith concentrates.
Physical Limitation of Silage Intake
Another possible reason for low silage intake is physical limitation, given theslower rate of ruminal breakdown relative to hay. However, it has been notedthat ruminal dry and wet matter contents were less in heifers fed on silage thanon hay, and it was concluded that silage intake was not restricted by ruminalcapacity. The total contractile activity of the rumen and its organic mattercontent were significantly greater for hay (at equal levels of feeding to cattle)than silage, and more time was spent ruminating on hay when each was fedonce per day (Thiago et al., 1992). Whereas hay offered once per day at arestricted level was all eaten in 2 h after having been offered, an equivalentamount of silage took about 10 h. Perhaps, metabolic discomfort accompaniesthe slow rate of fermentation of silage in the rumen and the animal learns toeat less and/or more slowly to avoid this.
Intake of silage does not always appear to be positively related to digestibility,due to both a small range of digestibilities observed in some comparisons andconfounding with other factors, but with a wider range of digestibilities there hasbeen a positive correlation between digestibility and intake. The demonstrationthat water-filled bags in the rumen (16 l) depressed the intake of a high-qualitysilage by 16% in dry cows confirms that physical fill of the rumen is important,and the fact that reducing the particle size by chopping or mincing increasedvoluntary intake by cows and beef cattle supports this.
It has been concluded that silage particles stay in the rumen for longer thanthose of hay, and there is more pseudo-rumination in silage-fed sheep and
294 Chapter 14

cattle than in those offered hay, suggesting that the slow breakdown of fibres ismaking it more difficult for the animals to regurgitate. In addition to thepossibility that rate of digestion is slow with silages, there is evidence thatruminal motility is depressed; infusion of lucerne silage juice intra-ruminallydepressed ruminal motility and rate of eating (Smith and Clapperton, 1981).Thus, chemicals in the silage, particularly amines, might act through physicalmechanisms.
Degradation rate
From a collation of studies on 136 silages incubated in nylon bags in the rumenof steers, whose intakes had previously been measured, it has been found that,although degradation rate of silages is quite well correlated with digestibility,the relationship with intake is poor (Dawson and Steen, 2000). This puts indoubt the role of degradation characteristics of DM, fibre and N in the rumenon silage intake. Most particle size reduction is achieved by mastication, anddegradation in the rumen only accounts for some 20% of particle sizereduction.
Silage intake has been found to be related to the time spent chewing.Wilted silage and hay are more brittle and need less chewing during eating,allowing more time for rumination, which may be a critical factor. NDF is agood indicator of the amount of chewing required but, in the study of Dawsonand Steen, it was no more closely correlated with intake than several otherfactors, including soluble N – ammonia N, ADF and lignin.
Chop length
The intake of silage can be increased by chopping the grass at harvest, whichimproves fermentation in the silo and increases the rate of passage through thedigestive tract. In nine comparisons with sheep, mean intake was increased by56% for silages harvested with a precision-chop machine rather than with asimple flail harvester. This was more effective than chopping just before feeding(McDonald et al., 1991). Young beef cattle ate 66% more silage made fromgrass cut to 8 mm at harvest compared with that cut to 33 mm, and the finelychopped material was also more digestible.
The intake of silage made from perennial ryegrass and the yield of milk bycows increase as chop length decreases; eating and ruminating times reduce aschop length decreases, but the mean retention time of food particles in thedigestive tract is not affected. Occasionally, rumination of finely chopped silageis reduced to the extent that it increases the risk of acidosis because ofinsufficient saliva production to provide adequate buffering of ruminal fluid.Offering a small amount of unchopped forage, even of poor quality, will usuallycorrect the problem.
Deswysen et al. (1978) compared grass silage chopped to either 53 or18 mm before ensilage or to 18 mm just before feeding. Sheep offered the long
Silage 295

silage had lower intakes and spent less time ruminating. Pseudo-rumination wassignificantly increased on the long silage, suggesting difficulty in regurgitating thelong, slippery strands. There were no differences between silages chopped to18 mm either at ensilage or just before feeding. Cattle prefer unchopped tochopped silage, and this may be because they get a larger amount of food permouthful.
The physical effort required by the cow to pull silage directly from theclamp reduces the rate of eating compared with the same silage cut and fed ina trough, and this could be a further physical factor limiting silage intake undersome conditions.
Maize Silage
Maize silage has lower levels of acid than grass silage, typically, while having asimilar pH. Lactic acid, in particular, is about one-half and acetic perhaps two-thirds of that for grass silage. Maize silage has about 200 g/kg DM of starch,whereas grass silage has very little; as discussed above, a supply of rapidlyfermentable carbohydrate is essential for normal microbial function in the rumen.
Because of the low protein content of maize silage, it is better to feed it withgrass silage and/or a protein supplement. Mineral and vitamin supplementationmust be adequate due to low levels of Ca, P and vitamin E in maize silage. Thehigh starch content can cause acidosis, especially if fed with starchy supplementssuch as cereals. For these reasons, maize silage should not exceed about 75% ofthe total DM intake.
Compared with grass silage, cows fed maize silage, or a mixture, ate moreDM and produced more milk. Even when high-quality grass silage wasavailable, offering maize silage in addition improved the performance of dairycows. Offering dairy cows one-third of the forage as maize silage, brewers’grains or fodder beet increased DM intake by about 1 kg/day compared withgrass silage alone (Phipps et al., 1993). In a comparison of: (i) maize silageonly; (ii) maize silage and lucerne or maize silage; and (iii) lucerne and wheat,intake of digestible organic matter was highest for maize silage alone, eventhough the digestibility of this was the lowest of the three diets.
The question of whether maize should be cut at an early stage for silagemaking – in order to acquire high levels of soluble carbohydrates, or later – toachieve a higher yield of DM, was examined by Phipps et al. (2000). Silageswere made from maize cut at different stages during September and October togive DM contents of 226, 290, 302 and 390 g/kg. These were mixed 3 parts:1with a high-quality, well-fermented grass silage that was also fed on its own,and the five diets were given to cows during the first 20 weeks of lactation; 8.7kg of dairy concentrate were given daily. The results (see Fig. 14.1) show that,even compared with good grass silage, inclusion of maize silage will increaseforage intake, with an optimum of around 300 g DM/kg.
The results suggest that farmers in marginal areas should consider usingmaize silage in dairy cow diets and should avoid the production of mature maizesilage, since when silage DM content approached 400 g/kg there was a significant
296 Chapter 14

decline in yield of milk and protein, even though silage intake was not depressedat these high DM contents. Of course, there were many other differences betweenthe four maize silages in addition to DM, as they were harvested at different timesof the late summer and early autumn and at different stages of maturity, so careneeds to be taken with the interpretation of these results.
Silage is the predominant forage for beef cattle in northern Europe, andthe question of grass versus maize arises, as it does for dairy cows. In acomparison of grass silage, maize silage, 1/3 grass:2/3 maize and 1/3 maize:2/3grass silages for cattle growing from 424–560 kg (Juniper et al., 2005), DMintake was increased linearly as the proportion of maize silage increased, andgrowth rate increased in parallel. Note that 2 kg of concentrate supplement wasgiven to each animal daily, formulated to give similar CP intakes for each silagetreatment, i.e. the low CP of the maize silage was compensated for.
Choice feeding of silages
The optimum ratio of grass silage:maize silage for ruminant animals of differenttypes could be studied by choice feeding. Heifers offered a choice between grassand maize silages eat about 40:60 grass:maize, although this varies widelybetween animals. Intakes and milk yields have been reported to be significantlyhigher in heifers offered the choice or just maize silage compared with those ongrass silage alone.
Silage 297
6
8
10
12
14
16
0 5 10 15 20
Weeks post-calving
DM
inta
ke (
kg/d
ay)
Fig. 14.1. Forage dry matter (DM) intake (kg/day) for cows receiving either grass silage asthe sole forage (●) or a forage mixture containing maize and grass silage in a 3:1 DM ratiowith maize silage DM contents of 226 (�), 290 (x), 302 (�) and 390 (♦) g DM/kg (from Phippset al., 2000).

Further work with cows (Weller and Phipps, 1985) included the additionaltreatment of a 1:2 mixture of grass:maize silage, and there was no maize silage-only treatment. For half of the cows, the grass silage was of good quality, forthe other half it was of poor quality. Significantly more DM was eaten of themixture compared with just grass silage. The ratio of grass:maize silage in thefree-choice treatments ranged from 30:70–77:23 for poor-quality grass silageand from 48:52–81:19 when the grass silage was of good quality, i.e. bettergrass silage gave a higher preference. Even with high-quality grass silage,offering maize silage improved performance. Presumably, a beneficial effect ofthe maize silage (soluble carbohydrates?) was recognized by the cows and theylearned that they felt most ‘metabolically comfortable’ when eating a 4:1 ratioof grass:maize silages.
Dairy cows given free access to hay, maize silage (MS) and grass silage(GS) obtained the most energy from hay during the light phase, followed byMS and GS (Senn et al., 1995). However, during the dark phase, most energywas derived from GS, and hay contributed the least. It is not clear why there isthis difference in choice between day and night, although a detailed study ofthe nutrients supplied by each of the three foods, and the changingrequirements of the animals during daytime and night-time, might yield sometentative explanation.
Other Silages
Clover is a good source of protein for ruminants, and there have been severalstudies of clover silage intake. A mixture of grass and white clover silages had ahigh intake by dairy cows (15.2 kg DM/cow/day), but there were unusually highsubstitution rates for supplementation with concentrates, presumably becauseclover is more rapidly digested than grass, i.e. similar to concentrates. Forsilages with similar digestibility, red clover silage gives higher food intake andmilk yield by cows than ryegrass silage when fed with 7 kg DM/day of acereal/soybean supplement.
When lucerne was fed to sheep as hay or silage, there was no difference inintake and no difference in response to intra-ruminal introduction of food(Etheridge et al., 1992). Thus, any benefits of clover silage are not very largeand it is probably better to ensile a clover/grass mixture than just clover.
Concentrate Supplementation of Silage
Since silage cannot usually be eaten in sufficient amounts to satisfy the nutrientrequirements for rapid growth or high milk yield, some supplementary food isnormally provided. Supplementation normally depresses forage intake and it isusually observed that the higher the level of supplementation the greater thedepressing effect of an additional allocation on forage intake. The reduction inforage DM intake/unit of concentrate DM supplement is called the substitutionrate (see Chapter 11), and it is generally concluded that the substitution rate
298 Chapter 14

increases as the level of concentrate allowance rises. For example, increasingthe allowance of concentrates from 3 to 6 kg had the greater effect on digestibleenergy intake and milk production, while the step from 6 to 9 kg/day had thebigger effect on silage intake (Sutton et al., 1992; Fig. 14.2).
In a particularly comprehensive study, Faverdin et al. (1991) (see Fig. 11.8)also found substitution rates to increase with increasing levels of supplementation.The average substitution rates with maize silage, grass silage and hay were 0.70,0.53 and 0.44, respectively.
A substitution rate of 0.51 for barley supplementation of grass silage forAyrshire cows has been found and, if the supplement was given frequently insmall amounts, a more even pattern of fermentation was seen in the rumen, butthis did not affect the substitution rate (Gill and Castle, 1983). Supplementationwith dried grass cubes has given a substitution rate of 0.36, i.e. a smallerreduction in silage intake per unit of supplement compared with barley;molassed beet pulp, which also has a slower pattern of nutrient release thanbarley, gives a substitution of 0.4. Although barley supplementation depressessilage intake more than that of dried grass, the resulting level of production isoften higher because of the higher digestibility of the barley compared withtypical dried grasses.
Bulky supplements depress silage intake to a greater extent than do cerealsor dried grass. For example, hay offered to cows depressed silage intake by0.84 kg/kg, but that still provides a useful increase in total DM intake. Similarly,lactating cows ate significantly more when both hay and silage were offeredthan when either were offered alone.
It is usually the intention to feed silage ad libitum, but in practice this is notalways achieved, either because cows wait for fresh silage to be cut down fromthe face of the silo rather than pulling it off themselves or because they arepurposely restricted to avoid wastage. When silage intake is reduced because ofrestricted access, increasing the level of supplementation does not reduce silageintake.
Silage 299
0
5
10
15
20
25
30
2 4 6 8 10
Supplement (kg/day)
0
50
100
150
200
250
300
Sila
ge in
take
(kg
DM
/day
)M
ilk y
ield
(kg
/day
)
DE
inta
ke (
MJ/
day)
Live
wei
ght c
hang
e (g
/day
)
Fig. 14.2. Silage intake (�), milk yield (�), DE intake (♦) and live weight change (●) ofHolstein Friesian cows with three levels of concentrate allowance (from Sutton et al., 1992).

Carbohydrate supplementation
As outlined above, one limiting factor to intake of grass silage is lack of solublecarbohydrates. This suggests that concentrate supplements should be high inreadily fermentable carbohydrates; however, these may result in a reduced rateof cellulose digestion and therefore have a greater depressing effect on silageintake than might otherwise be predicted. It has been suggested that givingsupplements in small amounts spread over the day would avoid these effectson cellulose digestion. In addition, supplements based on slowly digestedmaterials might allow a higher intake of forage, and this has proved to be thecase (Jackson et al., 1991).
Protein supplementation
It has been found that less N is retained by cattle when silage is fed than whenhay is fed, and this was originally attributed to the lower voluntary intake ofsilage. However, recent experiments have revealed that supplements providinggreater amounts of protein result in smaller depressions of silage intake. Thelower the N content of silage, the greater the beneficial effects of N supplementson intake (McDonald et al., 1991). A supplement of dried lucerne was better inthis respect than dried grass, oilseed meals did not affect silage intake at all andsoybean meal resulted in an increase in the voluntary intake of silage in somecases. In practice, the provision of ‘balancer’ cubes high in protein and low insoluble carbohydrate appears to be of considerable benefit.
As well as providing N for the ruminal microorganisms, the diet should alsoprovide sufficient protein that escapes degradation in the rumen (UDP or ‘by-pass’ protein) to ensure that those amino acids that are not produced insufficient quantities by the microorganisms are available to the host animal.Fish meal is a high-protein material which largely escapes rumen fermentationand has been a valuable, but expensive, ingredient in dairy cow supplements.Its use is not currently permitted in ruminant diets in Europe because of fearsconcerning feeding products of animal origin to herbivores arising from theBSE crisis.
Proteins of plant origin can also provide an appropriate supply of UDP aswell as RDP. Inclusion of soybean meal in the supplement has resulted in anincrease in the voluntary intake of silage in some cases. The extent to which thesupplement needs to provide soluble carbohydrate and the need for additionalprotein vary with many factors – especially silage composition – andcommercial concentrate supplements for dairy cows are now available tailoredto the characteristics of the individual silage.
Supplementary protein can be provided by leguminous trees and shrubs,such as leucaena, particularly useful in arid countries. Supplements of 4 or 8 kgfresh weight of leucaena increased intake of hay by lactating cows from 7.8 to9.3 and 10.4 kg/day (Muinga et al., 1992); live weight loss was reduced andmilk yield increased.
300 Chapter 14

Pattern of supplementation
In a comparison of patterns of allocation of concentrates for silage-fed dairycows, Taylor and Leaver (1984) observed that feeding at a flat rate of 9 kg/daywas accompanied initially by a small increase, followed by a progressivedecline in silage intake as lactation progressed; feeding concentrates accordingto yield gave a similar pattern of silage intake over lactation. On the otherhand, giving the same total amount of concentrates but reducing from 11 to 7kg/day as lactation progressed resulted in a steady increase in silage intake.
Feeding behaviour on supplemented silage
The hypothesis that cows eating a ‘non-limiting’ food (high concentrate, HC)have longer inter-meal intervals and more variable meal sizes than similaranimals given a diet whose intake was likely to be limited by the physicalcapacity of the digestive tract (high silage, HS) was tested by Tolkamp et al.(2002), using the lognormal procedure described in Chapter 2 to determineinter-meal intervals. It was found that the inter-meal criterion was similar forHC (28.0 min) and HS (23.8 min), as was the number of meals (6.4 versus6.7/24 h), i.e. cows on both treatments showed very similar meal patterns,contrary to the expectations of the hypothesis. Note, however, that because ofthe much lower DM content of HS, the meals were smaller and had a slowerrate of eating of DM than for HC.
These results should not be taken to mean that intake of silage is limitedphysically, but rather that cows manage their daily intake by means other thaninter-meal interval. These authors conclude that detailed studies of feedingbehaviour are of little direct help in improving our understanding of whatphysiological mechanisms underlie the control of voluntary food intake,including that of silage, on a longer timescale.
Acidogenicity of supplements
The effect of supplementary foods of different acidogenicity value (AV) onlactation performance of dairy cows has been evaluated by feeding concentratesformulated with different levels of acidogenicity (but equal contents of ME andMP) and used to supplement grass or maize silage, the later being moreacidogenic than the former (Dewhurst et al., 1998a). Voluntary intake of silageand the yields of milk and milk solids were markedly lower with the high AVconcentrate, despite the formulated similarity in energy and protein valuesbetween concentrates. The voluntary intake of the highly acidogenic maizesilage was lower than for the grass silage, though this did not result insignificantly lower milk yields. The low voluntary intake of the maize silage wasfurther reduced when feeding the high-AV concentrates. Thus, feeding high-AVconcentrates can reduce food intake and milk production, particularly whenfeeding high-AV forages, such as maize silage.
Silage 301

Total Mixed Rations
The recommendation that concentrate is best given little and often has led tothe development of the Total Mixed Ration (TMR) concept, in whichconcentrates are mixed with chopped silage and perhaps other materials suchas sugarbeet pulp in ratios that can vary for groups of animals with differentnutrient requirements. This gives advantages in simplified management, butfor any group of cows some will be adequately fed by any given mixture offorage and concentrates, others will be overfed and yet others underfed. It isnormal practice, therefore, to divide the herd into groups and to feed each adifferent mix, to satisfy the average needs of the group. Thus, the cost offeeding can be reduced as lactation progresses until forage only is given at theend of lactation.
However, the complication of feeding and milking several groups of cowshas been largely responsible for the delay in the widespread adoption of thecomplete diet system for winter feeding on dairy farms in the UK, although ithas become increasingly popular over the last few years as herd sizes havebecome increasingly large.
In the USA, where herds are often even larger and fed on conserved foodsat all times of the year, there is more justification for investing in machinery forhandling and mixing the diets. In a comparison of a TMR consisting of 60%forage:40% grain fed throughout lactation, against cows given a 50%:50% dietduring the first 21 weeks of lactation, a 65%:35% food for the remainder oflactation and a 85%:15% food during the dry period (Everson et al., 1976),there were no differences between treatments in milk yield or composition. Thevariable-composition system was closer to the animals’ nutrient requirementsand resulted in higher milk fat content, more rapid return to calving bodyweight, lower blood ketone values and earlier post-calving oestrus.
The forage portion of the diet must be chopped, to avoid selection, assmall ruminants can take a much higher proportion of leaf than stem material.Forage will normally have been chopped before ensiling.
Ad libitum feeding of a TMR encourages a higher intake than conventionalrestricted feeding of concentrates with forage ad libitum and therefore gives thepotential for better use of forages.
Flavours for silage
Lower than expected levels of silage intake are often ascribed to ‘unpalatability’,and several attempts have been made to overcome the problem by addingpleasant flavours. A few such attempts have resulted in significant medium-termincreases in silage intake: Simax 100 (main ingredients caramel, maple syrup,orange oil, vanilla and citrunella) and Palatol (main ingredients ethyl vanillin,isopropyl alcohol, cyclotene and furfuraldehyde 2-methylvaleric acid) increasedsilage intake by cows in mid-lactation, although milk yield and milk compositionwere unaffected (Weller and Phipps, 1989); Simax 100 gave similar results in asecond experiment.
302 Chapter 14

Further, Palatol, molasses or molasses + Talin (a protein sweetener andflavour enhancer extracted from the fruit of Thaumatoccus daniellii) all increasedthe intake of a poor-quality silage (the molasses probably by supplying solublecarbohydrate), but did not affect intake of a good-quality silage. Milk yield andmilk composition were not affected by flavouring agents. Thus, there is evidencethat flavours can improve silage intake, but it seems unlikely that flavouring cansubstitute for nutritional improvement in optimizing forage intake.
Prediction of Silage Intake
Many empirical equations have been derived for the purpose of predicting thevoluntary intake of silage by ruminant animals, particularly dairy cows, andsome of these have been reviewed by AFRC (1991). Variables used forprediction have included several chemical attributes of silage, such as NDF andnon-ammonia N, and several animal characteristics, such as body weight andmilk yield. Mean square prediction errors (MSPEs) have typically been at least15%, but this should be capable of reduction by using more comprehensivedata sets, incorporating more variables and using better models. Furtherdiscussion of prediction of intake by lactating cows is to be found in Chapter 16.
Additional variables used in more recent studies have included digestibilityand rumen degradability, which involve complex and time-consuming animalstudies and further laboratory analyses, particularly NIRS. Rather than attempta comprehensive coverage of the literature, a few examples will be covered insome detail here.
Digestibility and degradability
Ferret et al. (1998) fed 11 maize silages to mature ewes and used the earcontent, chemical composition, fermentative characteristics, in vitro DMdigestibility and ruminal degradation characteristics in equations to predictvoluntary intake. Good prediction of DM intake (r = 0.93; P < 0.01; residualSD = 3.9) was achieved using the soluble fraction and the insoluble butfermentable matter derived from the rumen degradation studies. Because ofthe difficulties of degradability studies the authors suggested that, for acompromise between accuracy and simplicity, reliability and inexpensiveness,the pH and acetic acid concentration of the silages might be used as a predictorof DM intake (r = 0.80; P < 0.05).
Silage composition
Prediction of potential silage intake by sheep and cows was made by Offer et al.(1998) from laboratory silage measurements. A wide range of silagecharacteristics was included (cutting dates from 19 May to 18 September, wiltingperiods from 0–48 h and additives of several types) to achieve wide ranges of
Silage 303

compositional variables. A wide range of silage composition was achieved (CVsfor DM, CP, DOMD, lactic acid, total VFA and sugar were 0.22, 0.19, 0.07, 0.43,0.84 and 0.69, respectively). Most of the silages were fed to lambs as the solefood, with hay intake used as a covariate in the statistical analysis, and somewere also given to lactating cows along with 7 kg/day of concentrates.
Not surprisingly the best predictions of intake were from equations thatincluded the largest number of conventional compositional variables. However,NIRS analysis (see Chapter 11), both dry and wet, gave even more accuratepredictions, with the advantage that such analysis can be carried out quicklyand on-farm.
A study of intake prediction for beef cattle, which includes many chemicalmeasures on silage (but not degradability), has been carried out by Rook andcolleagues (1990). The data used for analysis came from almost 700 animalson over 60 silages and used live weight, intake and 16 silage characteristics intheir predictions. For validation data from another 57 silages were used. Inorder to produce better estimates than can be obtained from ordinary multipleregression, ridge regression methods were used, and the best equation usingparameters which could be relatively easily measured was:
I = – 5.84 – 0.615CDMI + 0.098TDM + 8.65pH – 0.049NH3-N + 0.429N + 0.32DOMD (14.1)
where I is intake (g/kg LW0.75/day), CDMI is concentrate DM intake (g/kg0.75/day),TDM is toluene DM (g/kg fresh), NH3-N is ammonia N (g/kg N), N is total N (g/kgTDM) and DOMD is the digestible OM in the DM (g/kg TDM). The MSPE was11% of the actual intakes while the multiple regression including all variablesgave an MPSE of 14%. It is not, therefore, automatically better to include asmany variables as possible in prediction equations; however, this work did notclearly indicate which is the best subset of silage characteristics to measure and sodoes not lead immediately to reduced analytical costs.
NIRS for silage intake prediction
NIRS has proved to be both accurate and simple and particularly suitable foruse within a technical support role for the agricultural industry, as long asappropriate sample preparation and scanning methods are used. An R2
coefficient of 0.90 has been found in one extensive study between NIRS andintake of grass silage by beef cattle (Steen et al., 1998).
Prediction of substitution rate
Of critical importance to the management of silage-fed cattle is the extent towhich silage intake is depressed by the addition of increments of concentratesupplements to the diet (substitution rate, SR, above and Chapter 11). SRincreases with increasing level of supplementation and with increasing qualityof silage, and McNamee et al. (2001) have incorporated these effects in theirmodel for beef cattle.
304 Chapter 14

Means for each combination of silage and concentrate were subject toregression analysis to investigate the relationship between silage intake (y, g/kgW0.75) and concentrate intake (x, g/kg W0.75). The exponential relationship y = a + brx was used, where (a + b) represented silage intake when silage wasoffered as a sole feed, a common value for the parameter r was used for eachsilage and the line was forced through the same concentrate intake when theintake of each silage intake was zero, i.e. the concentrate intake when concen-trate was the sole feed was independent of silage type. This constraint gave theequation: y = � bi(r
k � r x), where k is a constant and is equal to concentrateintake for zero silage intake and i is silage type for each of 11 silages.
Figure 14.3 shows the observed data points for intakes of each silage withdifferent levels of supplementation: the smoothed lines are the predictionsdeveloped by their model. A high degree of accuracy is provided whenpredictions are compared with a wide range of results from experiments atdifferent sites (R2 = 0.89), but note that the voluntary intake of the silage whenfed alone must be known, or be capable of being accurately estimated. Thepredictions for the validation set gave a mean difference between actual andpredicted silage DM intake of 8.9% and a mean bias of 1.0%. The success ofthis model is undoubtedly due to the use of a series of convergent curves, whichis biologically more appropriate as it reflects the decreasing significance of thesilage quality as silage represents a decreasing proportion of the total diet.
These authors subsequently adapted this approach for lactating dairy cows(McNamee et al., 2005), using predictions of silage DM intake from NIRSanalysis, with good results (R2 = 0.98 for the regression of silage intake on levelof concentrate supplementation, with a correction for milk yield) providing93% of predictions within 10% of observed intakes in the validation data.
Silage 305
Fig.14.3. The observed (symbols) and predicted (lines) silage DM intakes of 11 silages insupplemented diets with various levels of DM intake when offered as the sole food (fromMcNamee et al., 2001).

It can be seen, therefore, that the combination of modern analytical method-ology – specifically NIRS – and appropriate biological models and statisticalanalysis is providing ever more accurate predictions of silage intake. There will,however, always be situations in which prediction is poor, especially when one ormore variables are outside the range of data used in developing the predictionequations.
Comparison of equations
This section should be read in conjunction with the section on comparison ofprediction equations in Chapter 16, which deals with lactating dairy cows fedon foods other than silage.
A very comprehensive data set was assembled by Keady et al. (2004),including data from 2425 individual cows from 27 studies at three researchcentres in the British Isles. The data included wide ranges of intake and milkyield, and the five published prediction models commonly used in the BritishIsles against which these data were tested were:
1. (from Vadiveloo and Holmes, 1979):
TDMI = 0.076 + 0.404CDMI + 0.013LW �0.129WL + 4.12logWL + 0.14MY (14.2)
(see Table 14.1 for definitions of abbreviations and Fig. 14.4 for graphicalrepresentation of goodness of fit of predictions to actual intakes).
306 Chapter 14
Table 14.1. Definitions of abbreviations used in intakeprediction equations.
C Concentrate dry matter intake (kg/day)CDMI Concentrate dry matter intake (kg/day)CFV Concentrate fill volume (UE/kg DM)CIC Cow intake capacity (UE)D Silage DOMD (g/kg)DM Silage dry matter (g/kg)FE Forage energy (UFL/kg DM)FFV Forage fill value (UE/kg DM)LW Live weight (kg)MUD Mud adjustment factor for DMIMY Milk yield (kg/day)N Ammonia N (g/kg total nitrogen)PQ Milk fat %SDMD Silage dry matter digestibility (kg/kg)SDMI Silage dry matter intake (kg/day)SIP Silage intake potential (g DM/kg W0.75)SLW LWTDMI Total dry matter intake (kg/day)TEMP Temperature adjustmentWL Week of lactation

This provided the most precise predictions of the five, with an MSPE of 2.9kg2/day, even though it did not include variables describing any aspect of silagecomposition. It should be noted that this equation was derived from datacollected from cows fed on hay-based diets. Daily intake was under- or over-predicted by only 0.2 kg DM for actual intakes of 26 and 10 kg DM/cow/day,respectively. However, this equation is useful only in predicting the food intakerequired to support a given milk yield.2. (from Lewis, 1981):
SIP = 0.1035DM + 0.0516D � 0.05N + 45 (14.3)
SDMI = 1.068SIP � 0.00247C � SIP �0.00337CDMI2 � 10.9 + 0.00175(MY)2 (14.4)
This model, which included silage compositional variables as well as animalfactors and concentrate allowance, under-predicted intake by 5%. The successof this model, and that of Vadiveloo and Holmes (1979), is due to the inclusionof concentrate allowance as a predictive variable – the weight of concentrates isincluded in the predicted total daily DM intake so it is not surprising that thereis a good fit, especially for cows given high levels of supplements!3. (from Milligan et al., 1981, Cornell Net Carbohydrate and Protein System –CNCPS):
TDMI = (0.0185*0.9*LW + 0.305MY(0.4 + 0.15PQ)) �(TEMP) � (MUD) (14.5)
Silage 307
5
10
15
20
25
30
10 15 20 25
Predicted intake (kg/day)
Vadiveloo
Lewis
Milligan
Oldham
Dulphy
Act
ual i
ntak
e (k
g/da
y)
Fig. 14.4. Relationship between actual and predicted dry matter intake for the equations ofVadiveloo and Holmes (1979), Lewis (1981), Milligan et al. (1981), Dulphy et al. (1989) andOldham et al. (1998) using individual cow observations (n = 2425). The thick solid line is thatfor x = y (from Keady et al., 2004).

This model includes animal and environmental variables, but no informationon diet composition. Nevertheless, it provided a lower MSPE than theremaining two models while over-predicting silage DM intake by 12%. Whenevaluated with data from North American cows and diets, this equation slightlyunder-predicted intake, however, and the leanness of the cows and thepreponderance of maize in US silages is probably responsible for the relativefailure of prediction of intakes by cows in the British Isles.4. (from Oldham et al., 1998):
SDMI = LW � (0.01503 + (1/(1 � SDMD) � (0.004248 + (� 0.0004333/SDMD))) � 0.4914 � (C) (14.6)
This model, based on the TPH (see Chapter 11), over-predicted DM intake by13% and this is due to the lack of variables representing milk yield or stage oflactation. In addition, it includes a constant for substitution rate, whereas thisvaries with silage quality and level of concentrate feeding (see below).5. (from Dulphy et al., 1989, French Fill Unit – FFU):
CIC = (22 � 8.25exp(� 0.02MY) + (LW � 600) � 0.01) � 0.9for primiparous cows and 1.0 for multiparous cows;
CFV = 1.2 � MY � 0.69 � exp(1.46FE/FFV) � FFV (14.7)
SDMI = (CIC � CDMI � CFV)/FFV (14.8)
TDMI = SDMI + CDMI (14.9)
This series of equations provided the least accurate predictions of intake, withan MSPE of 17%. However, many of the data on voluntary intake have beenderived from mature sheep, and the use of this for lactating cows is notacceptable (Cushnahan et al., 1994).
Keady et al. (2004) concluded that, while the equations of Vadiveloo andHolmes (1979) and Lewis (1981) gave relatively small errors of prediction, theyboth included milk yield, i.e. they were based on the ‘requirements’ of the cowsrather on the responses of cows to various levels of input. They state that:‘Further research is required to establish if a truly predictive model can bederived which will facilitate accurate prediction of food intake based on animalcharacteristics, excluding milk output, and detailed characteristics of the rangeof foods offered’. Further description of the comparisons made by Keady et al.(2004) is to be found in Chapter 16.
Conclusions
Grass and other types of plant are often conserved during the growing seasonfor use as food at other times of year. Hay, dried grass and silage are commonforms of preserved herbage. The intake of silage DM is often seen to be lowerthan that of hay made from the same sward, although this is not so much aproblem now as it was in the past. Low DM content, slow rates of degradation,low pH, high ammonia, nutrient imbalance and unavailability of protein are all
308 Chapter 14

recognized as factors in the depression of silage intake, but the relativeimportance of these in any given situation is hard to estimate. The greater thedegree of fermentation, the more likely is intake of silage to be influenced bythe products of fermentation rather than by the nutrients supplied by that silagerelative to the animal’s requirements (Wilkinson, 2005).
Intake of maize silage is usually higher than that of grass silage, and auseful technique is to mix grass silage with either maize or clover silage toachieve maximum intakes by cows.
Silage is the staple food for dairy cows for a large part of the year in manydairy systems. The risk of producing a poor silage, i.e. one with low intake, canbe reduced by the use of additives: bacterial inoculants are now the additives ofchoice. The potential intake of any forage can be attained only if there issufficient time for eating, no restriction of water and a favourable socialenvironment. Probably the best way to achieve high forage intakes is to employwell-educated stockmen and to remunerate them adequately for their work.
Supplementation of herbage or silage with concentrates depresses forageintake, although in situations in which there is marginal protein deficiency – suchas is often suspected with silages – high-protein concentrates can sometimeslead to increased forage intake.
The problem of predicting forage intake, and therefore being in a positionto advise farmers on the correct management of their animals and crops foroptimum utilization of forages, has seen some significant developments inrecent years, but is by no means solved. Opportunities exist for improving theintake characteristics of forage crops by modern biotechnological methods, buta clearer understanding of the control of voluntary food intake is needed inorder to specify the targets for which the plant breeders should be aiming.
Silage 309

15 Growth and Fattening
Animals must grow in order to be able to reproduce. In addition to increasedbody weight, growth also involves development, i.e. changes in the relativeweights of various organs and tissues and changes in their shape. Of particularrelevance in this chapter is the change in the ratio of fat:non-fat, which in normalconditions increases, especially after puberty. Despite the overlap between growthand fattening, it is convenient to deal with them separately here.
Changes in voluntary food intake occur during growth and fattening which,to a large extent, meet the changing nutrient requirements for protein and lipidsynthesis. If food intake cannot meet these requirements then the rate of growthwill decrease and/or body stores will be depleted, hence the reduction ingrowth of young pigs when the food is diluted, so as to depress digestibleenergy intake or to slow the rate of fattening of cattle offered only foods of lowenergy content. It cannot be said in these cases that requirements control intakeor that intake controls production: they are interdependent.
Growth
An animal can only attain its potential growth rate when sufficient high-qualityfood is available. In practice, however, several factors may restrict intake andprevent the young animal achieving its potential rate of growth. For mammals,it is convenient to discuss pre- and post-weaning growth periods separately, asweaning is often abrupt and imposed before the young have begun to eat largequantities of solid food.
The young chick
For the first 2 days after hatching, chicks are not dependent on eating food asthey have sufficient reserves from the yolk sac. During this time they peck at
310 © J.M. Forbes 2007.Voluntary Food Intake and Diet Selection in Farm Animals 2nd Edition (J.M. Forbes)

small round objects and quickly learn which are food. They seem to have someinnate knowledge, however, as beak-trimmed chicks – which cannot pick upfood – show the same initial preference for grains over pebbles as do intactbirds. They do not maintain this preference, however, as the pecking is notreinforced by ingestion. Social hierarchy develops within the first 3 weeks, butchicks incubated in the dark – which randomizes the side of the brainresponsible for food location and selection (normally the left brain and righteye) – develop a more flexible group structure than those incubated in light. Ithas been suggested that, by incubating in the dark, there may be a weakerpecking order with fewer low-dominant chicks dying from starvation.
Pre-weaning in mammals
Once the young have recovered from the acute affects of birth, their activitiesare totally directed to teat-seeking, which is actively encouraged by the dam.Young nose around the underside of the dam and will persist for an hour ortwo if not rewarded. Calves sometimes do not succeed in obtaining milk fromtheir mothers for over 6 h after birth, but thereafter suck about ten times perday. Most lambs find the teats within 2 h and may then take milk as often as 50times in the next 24 h. However, by 4 weeks of age, they are suckled onlyabout six times per day.
The mother’s milk is the major source of nutrients during early life, with theexception of the calf in the dairy herd, which is usually fed milk substitute afterthe first 24 h. Within a species both the composition of this milk and thequantity available may be limiting factors. Where the mother does not haveenough teats for all the progeny, the weakest of the litter will receive only thatleft by the others and often die or have to be reared artificially. This oftenoccurs in pigs when the litter is greater than about 14, and in sheep when threeor more lambs are born.
Even when individuals receive a fair share, the total amount of milkproduced may not supply the full nutrient requirements of the young. There isa negative correlation between litter size and growth rate of the individual inthe litter. Supplementation of the diet with a highly palatable food in such away that the mother cannot steal it (creep feeding) is common practice foryoung pigs and lambs. The high energy requirements of the rapid relativegrowth rate of young animals might be expected to predispose them to eatsolid food avidly when milk supply was insufficient, but creep foods must behighly palatable and low in fibre to encourage maximum intake.
Pigs
There is little synchrony in the first hour, but after that all piglets within a littertend to suck at the same time. Piglets soon establish a ‘teat order’ andthereafter always suck from ‘their’ teat. Whatever the potential intake, actualintake depends on the milk yield of the dam, which is affected by nutrition,mastitis and metritis. Litter size is obviously an important factor.
Growth and Fattening 311

The milk produced in the first day or so after farrowing is colostrum, andDevillers et al. (2004) developed a method of estimation of colostrum intakebased on weight gain in newborn pigs bottle-fed on colostrum. The equationderived from their data was:
CI = – 217.4 + 0.217 � t + 1861019 � BW/t + BWB � (54.80 –1861019/t) � (0.9985 – 3.7 � 10–4 � tFS + 6.1 � 10–7 � tFS2) (15.1)
where CI = colostrum intake (g from T0); BW = body weight at CI estimation(kg), t = time since T0 (min), BWB = birth weight (kg), tFS = age at first suck(min) and t = duration of colostrum intake (min), with a root mean-squareerror of 33 g.
Evaluation with results from a second data set gave good agreementbetween measured and predicted values (R2 = 0.90). Comparison of colostrumintake estimated with the equation or with the deuterium oxide dilution methodin catheterized sow-reared or bottle-fed piglets showed that bottle feeding versussow rearing had no effect on the relationship between weight gain andcolostrum intake. Application of the equation to sow-reared piglets will,however, require a great deal of observation in order to define age at first suckand duration of colostrum intake.
Once lactation is established, the piglet takes enough of its mother’s milk tosupply about four � maintenance, depending on genetic potential for proteinand fat deposition (which can be very variable): the faster the piglet’s growth,the higher its intake. The frequency of suckling is approximately once per hour,declining somewhat after the first few days. About 5% of sucklings do not resultin the piglet obtaining milk and it has been speculated that these serve thefunction of increasing local blood flow in the udder. However, given the costs ofunrewarded suckling, it seems unlikely they have an important function.Indeed, the additional massage provided during non-nutritive nursings did notinduce higher milk output during subsequent milk ejection.
The frequency of suckling starts to fall after about the 8th day, and thiscould be considered to be the start of the weaning process. Suckling frequencystarts to decline earlier in larger litters (Puppe and Tuscherer, 2000). There is anegative correlation between suckling frequency and creep food intake in the3rd week of lactation, suggesting that the piglets compensate for the decreaseof suckling and consequent assumed reduction of milk intake.
The young pig has some control over food intake; for example, loading thestomach with hypertonic saline or water or giving nutrient loads can depresssubsequent voluntary intake. Dilution of a milk substitute containing 4.68 MJ/lto 2.38 MJ/l caused a 36% increase in the intake by piglets, which was notquite sufficient to prevent a reduction of growth rate (Wangsness and Soroka,1978). While this suggests that young piglets have a mechanism for matchingintake with requirements, albeit imperfect, piglets less than 1 week old did notrespond to insulin injections (which increase energy uptake and increase intakein adult pigs), indicating an immaturity in the integration of feeding responsesat that early age.
When creep food is available, piglets eat little in the first 2 weeks, even iftheir milk intake is low. A detailed study of creep food intake was made by
312 Chapter 15

Pajor et al. (1991) by providing the food in continuously weighed containersand observing which piglets were eating – by means of video recordings. Themean age of first intake was 12 days, and mean intake was only a few gramsup to about 20 days, after which intake increased steeply, averaging 63 gduring the following week. Although they collected the data, these authors didnot describe the characteristics of feeding behaviour, i.e. size and frequency ofmeals.
With the common adoption of 4-week weaning, it is expected that foodintake will be higher at weaning than in 3-week-weaned piglets, because creepfood intake increases rapidly in the fourth week (see Fig. 15.1).
Ease of access to creep food is a factor affecting the intake of food bysuckling piglets. If there is insufficient space for all the piglets in a litter to eat atonce, some will not eat at all. Appleby et al. (1992a) gave some litters access toa single, two-space feeder and provided others with four similar feeders from21 days of age until weaning at 28 days. With the more restricted system, atleast four pigs in each litter did not use the feeder at all, while with the moreliberal treatment less than one pig per litter on average did not eat creep feed.The ones that did not eat tended to have had higher birth weights and growthrates to 21 days, suggesting that they were satisfied with the milk from the sowand were not highly motivated to eat solid food. Perhaps for this reason theyhad low growth rates from weaning to day 42, but their growth overall up to 42days was no different from that of those piglets that ate creep feed. The authorssuggest that low food intake before weaning is a predictor, but not a cause, ofpoor growth after weaning.
Three-week-old piglets have a strong preference for sucrose, glucose,lactose and fructose, but the thresholds of discrimination are higher than inadult pigs.
Calves
Milk is the primary product of the dairy cow, but in modern intensive dairymanagement it is too expensive to feed to calves. After access to the mother’s
Growth and Fattening 313
0
20
40
60
80
100
120
140
10 15 20 25 30 35
Age(days)
Cre
ep fo
od c
onsu
mpt
ion
(g/d
ay)
Fig. 15.1. Creep food consumption of an average piglet (from Puppe and Tuscherer, 2000).

colostrum for a day or so, the calf is separated from its mother and fed onreconstituted artificial milk from a bucket or automatic feeder until it is weanedat about 5–6 weeks of age. The quality and quantity of milk offered can bothbe controlled. Some adjustment of voluntary liquid intake occurs in response tochanges in milk concentration in an attempt to maintain a constant dry matter(DM) intake, but this fails if the milk is too dilute. Older calves can compensatebetter for dilution. Dry matter intake from milk substitute declines when its drymatter concentration is less than about 100 g DM/l and increases, especially inolder calves, when the DM content is above about 200 g/l.
Twice-a-day feeding of milk substitute leads to higher voluntary intake thanoffering one feed per day, although as the calves become accustomed to takingvery large amounts of liquid in one meal so intake rises. The temperature of themilk on offer is not a very important determinant of intake, although cold milk(6–15°C) tends to be taken in greater quantities than warm (38°C).
Dry food intake by 4-month-old calves varies inversely with the DM contentof the milk, while in lambs at grass solid food intake is also inversely proportionalto the allowance of milk. A highly significant relationship between the intake ofdried grass (GDMI, g/kg LW) and the amount of milk substitute offered (MS, gDM/kg LW) with 3-week-old calves has been found (Hodgson, 1971b):
GDMI = 7.5 – 0.26MS (15.2)
Calves of different genetic types have been found to show differentpatterns of milk consumption when suckled by dams of the same type(Mezzadra et al., 1989). Charolais-cross calves consistently took more milk thanAngus-cross, while calves sired by Nalore bulls (an Argentinian Bos indicusbreed) not only took more than Angus-cross calves, but had a completelydifferent shape of curve, starting with very high intakes but declining morerapidly than the Angus. It was suggested that Bos indicus calves reduce theirdependency on milk at an earlier age than those of Bos taurus breeds, perhapsbecause of the shorter period of the year when good forage is available tosupport milk production.
Post-weaning
Weaning is followed by much agitation and calling for the mother, whichoverrides hunger for several hours, especially if the dry food on offer isunfamiliar. The young animal may have difficulty in learning how to locatewater and to drink from an unnatural container, and this will further delay theonset of eating.
Although solid food is eaten in small quantities from an early age by theyoung of many species, they are not usually eating enough to support fullgrowth at weaning, especially when that occurs well before the age at which itwould occur naturally. A fall in body weight therefore occurs, which is moresevere the younger the animal at weaning. Hunger stimulates a rapid increasein food and water intake (perhaps the latter is critical), and weight gains areresumed within a few days.
314 Chapter 15

Pigs
By weaning, the piglet requires the equivalent of about 475 g of good food perday, but in practice it is several days before it reaches this level of intake: in thefirst few days it usually manages less than maintenance (Riley, 1989); in oneobservation the mean intake on days 1–3 after weaning was only 71 g/day, ondays 4–7, 120 g and on days 8–35, 518 g. Continuous availability encouragesa higher intake than meal feeding, and those fed a meal every 2 h ate morethan those given meals every 4 or 6 h.
Water intake is important; it takes about 1 week before water intake levelsreach those taken in milk before weaning. For the first time, the animal mustseparately satisfy its hunger and thirst. Behavioural problems such as navelsucking can occur, presumably due to a desire for the same comfort asprovided by sucking the sow’s teat. Water intake is very variable in the 2 daysfollowing weaning, suggesting that the animals have difficulty finding or usingthe drinkers immediately after weaning (Barber et al., 1989).
If solid food intake can be encouraged during the milk-feeding period, thenthe check at weaning will be less severe; highly palatable, sweet concentratefoods encourage high intakes. Sucrose is sweet, provides energy and iscommonly included in early-weaning rations. Soluble saccharin also enhancesintake of starter foods by early-weaned pigs, but insoluble saccharin is lesseffective. Moist food is eaten in greater quantities than dry food, but thepracticalities of keeping wet food free of contamination such as moulds meanthat it has not been widely adopted in practice.
Attempts to familiarize piglets with food and drink before weaning have hadvariable effects on performance after weaning. Exposure to recordings of sow’schanting, to vanilla odour and flashing lights before offering food to conditioneating had no effect on daily intake, even though the anticipatory response wasusually elicited. Perhaps putting newly weaned pigs with experienced pigs wouldspeed their learning about food and water, but this would be likely to encouragefighting and the spread of disease. Antibiotics in the food often increase intakeafter weaning due to suppression of pathogens and by sparing nutrients frommicrobial degradation; copper sulphate has similar effects. The inclusion oforganic acids such as citric in the food sometimes improves intake, perhapsbecause stomach pH is elevated in stressed piglets, but the results are variable.
Early-weaned piglets are susceptible to cold environments, slippery floorsand difficult access to feeders and drinkers. Attempts to improve intake withflavouring agents have usually shown no effect – flavoured foods which werepreferred in a choice test were not eaten in any greater amounts when given asthe sole food, a not unexpected result (see Chapter 6). However, McLaughlin etal. (1983) preference tested 129 flavours and found one with a cheese aromathat did increase intake in a sustained manner when no choice was available.This is unusual and unexplained, as a change in the sensory properties of afood without any change in its nutritional value usually only results in atemporary change in intake.
Many things such as heat-damaged or putrefied proteins depress intake, asdo fungal toxins generated by contamination of cereal grains. Rapeseed meal
Growth and Fattening 315

contains glucosinolates, saponins, sinapines and tannins, all of which depressintake, although it is not clear to what extent they do so simply by their effecton food flavour and to what extent by damage to the gut and toxic effects afterabsorption. From evidence presented in Chapter 6, it is likely that toxic effectsbecome associated with the sensory properties of the food, so that a learnedaversion to toxic foods ensues, whatever their flavour.
Calves
Intake of solid food by calves increases as the daily allowance of milk decreases(Le Du et al., 1976): when given 36 g milk DM/kg0.75, the intake of grass DMwas 33 g/kg0.75, whereas when only 6 g milk DM/kg0.75 was given the calvesconsumed 101 g DM/kg0.75.
Between 7 and 13 weeks of age the calf has increasing ability to compensatefor the addition of food to the rumen via a fistula, and there is a similarimprovement in compensation for removal of digesta. These results support thegradual development of visceral control of voluntary intake in young animals.
The apparent rate of live weight gain may be as fast when calves are weanedearly on to solid food as it is when milk feeding is continued, but this is in part dueto the increased gut fill. Calves do not voluntarily consume as much solid food DMas they do from milk substitute until their live weight is about 80 kg (Roy, 1980).Voluntary intake rises to about 3.0 kg DM/100 kg live weight at about 120 kg,which is similar to the maximum level of intake seen in lactating cows.
Intake increases as the digestibility of the food increases, implying physicallimitation (see Chapter 3). As the calf gets older it can utilize roughage better,and the intake of concentrates may be metabolically controlled, with a negativerelationship between intake and digestibility. When various diets with differentconcentrate:roughage ratios were offered to calves, the all-concentrate foodwas consumed in greatest quantities up to live weights of 136 kg; at heavierweights the intake of the 80:20 ration was highest.
Lambs
Faichney (1992) observed that sucking Merino lambs given access to solid foodfrom about 3 weeks of age ate little for the first 10 days, but from 4 weeks ofage intake increased, with large day-to-day variations, to < 50 g/day/kg0.75.There was little effect of weaning, but the steady increase continued to reach aplateau at 16 weeks, at about 95 g/kg0.75.
The intake of milk substitute by lambs separated from their mothers a fewhours after birth increases rapidly to reach about 2.5 l/day at 5 weeks of age,by which time their body weight is 10 kg (Bermudez et al., 1984). When theselambs were abruptly weaned at 5 weeks of age and offered concentrates,forage and water ad libitum, those lambs that were heavier at weaning,through taking more milk, suffered a greater setback when milk was withdrawn,as they had taken less solid food before weaning and took longer to establishan adequate intake of dry food. Within a few days of weaning, the lambs wereeating sufficient to resume their pre-weaning growth rate.
316 Chapter 15

Weaning to maturity
Once the stress of weaning is over, the individual grows at a rate characteristic ofthe species, following a sigmoid curve, unless it is exposed to shortage of food,environmental stress or disease. There have been many attempts to describe thesigmoid growth curve mathematically. Suffice it to say that the daily weight gainaccelerates for a period, followed by deceleration to an eventual asymptoticmature size, although fat deposition may lead to further increases in live weight.
As the animal grows, feeding frequency usually decreases while meal sizeincreases. For example, pigs fed ad libitum ate ten meals per day soon afterweaning, declining to three per day when adulthood was reached.
The voluntary intake of a nutritionally adequate food increases as an animalgrows, but is not maintained at the same proportion of live weight. It has beencommonly assumed that intake is proportional to metabolic live weight(weight0.73, often rounded to 0.75), because comparison of mature animals ofvarious species shows this to be an appropriate relationship, both for metabolicrate and for voluntary food intake (Blaxter, 1962). When voluntary intake ofindividual animals is examined, however, the exponent is much lower than 0.75.Re-analysis of several sets of data show that voluntary intake is related to liveweight raised to a power close to 0.6 for an animal as it grows (Forbes, 1971),as distinct to a comparison of mature animals of different weights.
Poultry
As the broiler grows, its daily food intake increases; the increase is not in directproportion to body weight, however, nor to metabolic body weight (bodyweight to the power 0.73), but rather to a lower power such as 0.66 (Hurwitz etal., 1978). In a thermoneutral environment, the energy requirement of the birdcan be stated as the sum of the requirement for maintenance and that forgrowth:
MER = 8.0LW0.66 + 8.6WG (15.3)
where MER is the metabolizable energy requirement (kJ/day), LW is the bodyweight (g) and WG is the weight gain (g/day). This must be anoversimplification, however, as the composition of the weight gain changes asthe bird grows, going from predominantly protein in the early stages to greaterproportions of fat as the bird approaches maturity. Each successive gram ofweight gain will therefore require a greater input of food in view of the greaterenergy content and lower water content of adipose tissue compared with non-fat tissues, and also the increasing mass of body tissue to be maintained.
Figure 15.2 shows food intake and body weight changes during growth ofbroiler chickens to maturity (Prescott et al., 1985). Relative to body weight,intake is higher during the rapid early phase of growth, reaching an asymptoteof 300 g/bird/day for mature birds weighing about 6 kg.
PREDICTION OF INTAKE Chicken foods, especially those used in the early stages ofgrowth, are well balanced for nutrients, so it has been possible to propose an
Growth and Fattening 317

equation for broilers based solely on age. The intake of broiler chicks wasmeasured from hatching to 210 days of age and the following equation wasderived:
dF/dt = c(1–e–t/t*) (15.4)
where F is food intake, c is the mature weight, t is the age and t*ln2 is the timefor an increment of (c–dF/dt)/2 (Wilson and Emmans, 1979). This is a curve ofdiminishing returns, in which the increase in intake is less with every passing day.
NRC (1987) gives tables of intake for various combinations of food, animaland environment, based on the equation of Hurwitz et al. (1978):
MEI = 7.98BW0.66 + 8.57dW (15.5)
where MEI is ME intake (kJ/day), BW is body weight (g) and dW is weight gain(g/day).
Pigs
Castrated males eat 7–16% more than entire boars, while gilts eat approximatelythe same as entire boars (Cole and Chadd, 1989). These differences are relatedto different propensities to grow and fatten due to the presence or absence ofsex steroid hormones.
In order to establish the development of food intake by growing pigs in theabsence of environmental and competitive constraints, Tullis (1982) penned
318 Chapter 15
Fig. 15.2. Body weights (open circles) and food intakes (closed circles) of broiler cockerels fromhatching to 160 days (from Prescott et al., 1985).

animals individually and offered a balanced food ad libitum. From 5–85 kgbody weight intake increased in a manner that was, to all intents, linear, while> 85 kg intake plateaued, albeit with wide fluctuations on a day-to-day basis.
PREDICTION OF INTAKE Whittemore et al. (2001a) cover the subject of intake-predicting equations for growing pigs in considerable detail, and the interestedreader is referred to their review.
There was little interest in the prediction of voluntary food intake of pigs aslong as the domestic pig had a very high propensity to deposit fat above a liveweight of about 60 kg and was, therefore, fed at a restricted level to preventexcessive fat deposition. In recent years, however, intensive selection forleanness and the use of uncastrated boars, which deposit little fat, has meantthat growing pigs can be fed ad libitum.
NRC (1987) summarized data for intake of creep food by sucking pigletsup to 35 days of age from various sources by the equation:
DEI = 46.8DAY – 634 (15.6)
where DEI is digestible energy intake (kJ/days) and DAY is age (days), i.e.intake of creep food is predicted to start at 13 days.
After weaning it can be expected that voluntary intake will be such as tomeet the animal’s energy requirements and therefore to be proportional tobody weight and weight gain. For pigs from 5–117 kg, data fitted the equation(Ewan, 1983):
DEI = 55 (1–e–0.018LW) (15.7)
where DEI is DE intake (MJ/day) and LW is body weight (kg), while ARC(1981) present the equation:
DEI = 4.7LW0.51 (15.8)
The values calculated from these two curves are, in fact, very similar within thenormal range of weight, although the ARC example is some 7 MJ/day higher atall stages of growth.
As with poultry, it has not been necessary to include indices of food qualityin the equations for growing pigs, as it is assumed that the diets are balancedand that intake of digestible energy is regulated by the pig in order to achievemaximal growth rate. There are, however, several management factors affectingintake, and Kornegay and Notter (1984) have presented equations for predictingthe effects of different space allowances for weanling, growing and finishing pigs,in relation to the intakes of animals with ample space.
For optimal food intake, the space allowances were 0.4, 1.06 and 1.09m2/animal, respectively. There is an effect of group size that is independent ofspace allowance, which these authors have quantified as a 0.92% decrease inintake per additional pig, in the range three to 15 pigs per pen for weaners,0.25% for growing pigs and 0.32% for finishers. There is a fuller discussion ofeffects of space allowance and group size on voluntary food intake by pigs inChapter 17.
Growth and Fattening 319

Examples of the use of these prediction equations for pigs are given byNRC (1987, pp. 36–37), with the acknowledgement that the agreement withpublished results was not always good.
Eissen et al. (1999) examined linear, quadratic and cubic equations to fitdata on intake in pigs growing from 28–108 kg and concluded that there wasno advantage in going beyond the linear for which the equation is:
Intake (kg/day) = 1.23 kg + 0.0161*day (from day 28) (15.9)
This slope is only half that found by Tullis (1982), and highlights the dangers ofusing equations describing data sets reported in the literature for purposes ofpig food intake prediction. The pigs of Tullis were penned and fed individuallyin experimental facilities, while those of Eissen were group-fed under farmconditions, and Whittemore et al. (2001a) have highlighted the differences inintake between these two situations (see below).
If intake potential depends on demand for nutrients and the requirementsfor maintenance are relatively small, then it should be possible to predict intake(under non-limiting conditions) from rates of deposition of fat and non-fattissues. Backfat thickness and live weight can be used as proxies for theseparameters, and intake has been well predicted for pigs with very different ratesof growth and fattening (Whittemore et al., 1995). Lipid (Lt) and protein (Pt)masses (kg) were estimated from:
Lt = 1.12 (0.19W + 0.78(P2) – 9.2) (15.10)
Pt = 0.44 (0.41W – 0.52(P2) + 2.4) (15.11)
where P2 is the backfat thickness;
energy intake (MJ ME/day) = 52Pr + 53Lr+ 0.44W0.75 (15.12)
Kyriazakis and Emmans (1999) used the logic that food intake will equalthat which is desired to fulfil the metabolic requirements of the day in question:
daily food intake = (1/food energy content)*(EM + EPr /kPr + ELr /kLr) (15.13)
where EM is the energy for maintenance, EPr and ELr are the daily rates of energyretention in protein and lipid and kPr and kLr are the efficiencies of utilization ofenergy for protein and fat deposition. An energy cost for cold thermogenesis mayalso be added (0.016 MJ/W0.75) for each °C of cold (Tc – Te), where environmentaltemperature (Te) is below the lower critical temperature (Tc). Rates of protein andlipid deposition may be adequately described as Gompertz functions in relation tolive body weight.
Whittemore et al. (2001a) conclude that their ‘analysis suggests thatpredictions of food intake either from general empirical formulae or fromrequirement models may be unsafe for the practical estimation of food intake inparticular circumstances’. On-farm pigs usually eat less than that predicted fromexperimental measurements and predictions. Thus there is an importantrequirement for on-farm measurement to allow more realistic predictions formanagement purposes: live weight and food intake measurements on at leasttwo pens for at least 2-week periods at the beginning, middle and end of thegrowth range are recommended (Schinckel and de Lange, 1996).
320 Chapter 15

Whittemore et al. (2001a) propose that daily intake (DFI) at any stage canbe predicted from the starting and finishing weights, the total amount of foodused (the annual food usage/number of pigs fed) and the assumption that foodintake follows the form: DFI = a.Wb. If on the other hand the total amount offood consumed is not known, then information on daily food intakes of piggroups of varying live weights may be obtained from the farm in question usingsubsamples of pigs, and the most likely curve describing the relationshipbetween intake and weight (or age) estimated.
INTAKE OF GROWING PIGS IN PRACTICE For practical purposes, the increase in intakeup to 85 kg can be treated as a straight line followed by constant intake, i.e. a‘broken stick’ relationship between body weight (or age) and food intake,contrary to the theoretical curvilinear response based on Gompertz growthequations (Whittemore et al., 2001a). As the major purpose of research withfarm animals is, presumably, to assist with improved economy of growth, canthe theoretical relationships be of any real value?
The discrepancy might be due to a number of factors: first the intake of thevery young pig might be limited by gut capacity, thereby giving real intakeslower than those predicted from growth curves. Thus they increase their rate ofgrowth when the nutrient density of the diet is increased. Older pigs, on theother hand, ‘eat for energy’, apparently achieving their theoretical intakes. Thelower than predicted intakes at light weights will result in a straightening of theintake curve from 5 to 85 kg body weight. Clearly, it is necessary to make somemeasurements on a particular farm, and even in a particular building, beforereliable estimates of intake in that situation can be made.
Cattle
As with other species, voluntary intake increases with age, eventually reachingan asymptote. However, intakes vary much more at any given age than withpoultry or pigs because of the wide range of foods offered, including poor-quality forages.
When the intake of growing cattle is plotted against their metabolic weight(body weight0.73), there is a steady decline with increasing weight. Weight hasto be raised to a lower power, close to 0.6, in order to get a constant value asthe animal grows, at least for animals on complete, pelleted feeds, as well as forcattle on good-quality pasture. Figure 15.5 (see below) is an example, in whichthe best fit for intake is 0.29 kg/live weight0.54 (Pickard et al., 1969).
In a comparison of 1-year-old cattle of 25 breeds, Taylor et al. (1986)found a close relationship between the logarithm of daily food intake and thelogarithm of body weight. The regression coefficient of 0.42, indicating thatintake was proportional to body weight0.42, is much smaller than intra-breedcoefficients, which lay between 0.61 and 0.82, indicating that intake cannot bepredicted from body weight alone, without a knowledge of the animal’s breed.
However, it was found that foods of different energy concentrations wereeaten by growing zebu cattle in proportion to live weight0.79; notwithstanding,within types of food, as the concentration of cell wall constituents fell from 710
Growth and Fattening 321

to 610 to 540 g/kg DM, the exponent changed from 0.87 to 0.69 to 0.56(Karue et al., 1973). This suggests that the intake of poor-quality roughages,which is limited primarily by physical constraints, is related directly to bodyweight, while more concentrated diets are eaten in relation to metabolicrequirements. Re-analysis of the data collected from the literature for thechapter on voluntary food intake in the Agricultural Research Council (1980)publication on the nutrient requirements of ruminant livestock gave theequation:
DMI = 172LW0.6 (15.14)
Thus there is considerable evidence against expressing the voluntary intakeof growing animals in terms of ‘metabolic live weight’, W0.75, and it is moreappropriate to include Wb or logW than W0.75 in statistical models relating foodintake to body weight.
It is reasonable to assume that intake of complete diets was not limitedprimarily by physical restraint and that requirements for growth determinedintake under the conditions in which these relationships were obtained. Anincrease in growth rate would therefore be expected to lead to an increase involuntary intake, and growth stimulants act primarily on growth with a secondaryeffect on voluntary intake. In one typical set of observations it was found thatdiethylstilboestrol (DES) improved weight gains by 20%, while intake increasedby 6%. Further discussion of growth stimulants will be found later in this chapter.
PREDICTION OF INTAKE Prediction of intake by ruminants is often difficult becauseof the interactions between animal and diet, and is particularly so underconditions where few reliable data are available on which to base equations,e.g. grazing. Despite these difficulties, there have been numerous attempts atprediction of the voluntary intake of sheep and cattle. Because it is clear thatintake is influenced by live weight, energy demand and food quality, it isnatural that multiple regression analysis should be applied.
Neal et al. (1988) used an equation provided by ARC (1980) for predictionof intake in a computer program to ration beef cattle, as this equation had beenfound to have lower prediction errors than several others tested:
DMI = 106.5q + 37C + 24.1 (15.15)
where DMI is DM intake (g/kg body weight0.75/day), q is the metabolizability of theration (MJ/kg DM) and C is the proportion of concentrate in the ration (kg/kg). Asthey observed that this over-predicted by an average of 26% when compared withexperimental data, they used this equation but reduced by a factor of 0.26.Predicted silage intakes were still higher than those observed in severalexperiments, especially for short-chopped silage, and substitution rates were in anarrower range than actually observed. The authors suggested that the modelwould be much improved by inclusion of indices of silage quality anddegradability. Chapter 14 includes examples of prediction of silage intake by cattle.
NRC (1987) published comprehensive compilations of equations onprediction of food intake in beef cattle. The graphs presented there are plots ofvarious equations that have been proposed to predict DMI in beef cattle and, in
322 Chapter 15

some cases, show considerable discrepancy between the predictions of equationsfrom different sources. No validation is presented, in common with mostpublished prediction equations (Pittroff and Kothmann, 2001b) and, as alwayswith this type of approach, predictions of intake should be limited to the range inwhich the observations on which the equations are based were made.
Having concluded that none of the equations they summarize include all ofthe important variables, NRC (1987) adopts a factorial approach and presentsequations and tables for adjusting predicted intake for diet energy concentration,body fat, initial body weight, breed, genetic variance, anabolic agents, foodadditives, particle size of diet, environmental temperature, muddiness of ground,forage availability, grazing system, milk production, milk intake, pregnancy andwater intake. Space precludes detailed coverage of this work, but the interestedreader is strongly recommended to study it.
However, NRC (2000) have more recently provided validation of theequation:
DMI = (SBW0.75*(0.2435NEma – 0.0466NEma2 – 0.1128))/NEma (15.16)
for growing yearlings, where DMI is DM intake (kg/day), SBW is starting bodyweight (kg) and NEma is net energy for maintenance (Mcal/kg DM). Incomparison with one set of experimental results from cattle fed high-energydiets, this equation accounted for 76% of the variation with an overall predictionbias of 0.16% and standard error of predicted intake of 0.34 kg. Other data setswere fitted less well but adjustment factors for body fat, breed, food additive,environmental temperature and mud were calculated to adapt the basicequation to different management situations.
The use of such factors as gender and use of anabolic agents as multipliers forthe basic prediction equations is not always justified, however. For example,reduction in the DE concentration of a medium-quality diet for an animal with lownutrient requirement results in it eating more as it is not at the ‘physical limit’, whilefor an animal with high nutrient requirement a reduction in the DE concentrationcauses it to eat less as it is already eating to its physical capacity, i.e. there areinteractions between the factors affecting intake. Another example is where theintake of a small, fat animal is likely to be reduced more by high environmentaltemperatures than that of a large, lean animal of the same body weight.
Sheep
What has been said above concerning cattle is largely true for sheep. However,because it is less usual for lambs to be kept intensively, there has been lessemphasis on prediction of their intake.
Genetics of intake in growing animals
Intensive selection by breeders over many generations for economicallyimportant production traits such as egg or milk production, growth rate andmeat production has invariably been accompanied by changes in food intake.
Growth and Fattening 323

Poultry
The increase in intake in modern broilers may be due to a functional equivalentof hypothalamic lesioning, because it has been found that electrolytic lesions ofthe hypothalamus caused increased intake (and fattening) in broilers selected forlow growth, while having no effect in the high-growth line (Burkhart et al.,1983). However, another interpretation of these results is that the high-growthbirds are already eating as much as their gut capacity will allow; it was muchmore difficult to force-feed broilers of a high-growth line than those selected forlow rate of growth (Barbato et al., 1984).
High-growth birds have higher thresholds for the detection of both sweet andbitter substances in the water (Barbato et al., 1982), and it can be concluded thatselection for high growth renders birds less sensitive to taste. However, birdsselected for high growth take longer than the low-growth strain to adjust theirfood intake when dextrose is included in the drinking water, suggesting thatlonger preference tests might be required to determine true preferences.
In addition to a control, random-bred line and a line selected for high liveweight gain, other lines have been selected for maximum food consumptionand maximum food conversion efficiency (Pym and Nichols, 1979). In the 12thgeneration of selection, the mean intake from 5–9 weeks of age was 70 g/dayfor the controls and 72 g/day for the efficiency-selected line, while for the gain-and intake-selected lines it was 100 and 109 g/day, respectively (S. Iskandarand R.A.E. Pym, personal communication).
Whereas the control-, weight- and efficiency-line birds increased their intakewhen given a diluted diet, those selected for high food intake did not and it wassuggested, therefore, that these birds were eating to digestive capacity even withthe nutrient-dense diet. This is supported by the fact that they had the most rapidrate of passage of digesta through the tract, the smallest gizzard andproventriculus and the shortest small intestine. The high-intake line also had thehighest weight of abdominal fat pad and it is possible that this set a lowerphysical limit to gut capacity, as proposed for ruminants (see Chapters 3 and 11).
Selection of broilers for high or low fat-pad weight (R.A.E. Pym, personalcommunication) resulted in a 70% greater fat-pad weight after five generations.However, there was no difference between the intakes of the fat-line (100 g/dayfrom 4–8 weeks of age) and thin-line (97 g/day) birds and neither differed fromthe random-bred control line, which ate 99 g/day. This shows that the physicalsize of the fat pad does not directly affect intake. Selection for weight gainalone or for weight gain with a constraint on fatness resulted in higher intakes(108 g/day in both cases).
Broiler chicks may eat no more per unit of body weight than do those ofan egg-laying strain, but convert food to live weight more efficiently, grow morequickly and therefore eat more than layer chicks at any given age.
Pigs
For several decades up to the 1980s, selection of pigs for breeding had includedselection for low voluntary food intake, on the basis that high food intake was
324 Chapter 15

accompanied by high fat deposition. However, by that time it was realized thatselection against high food intake had probably gone too far and that growth andprotein deposition were being limited by low intake. De Vries and Kanis (1992)developed a growth model based on a linear-plateau relationship between proteindeposition and food intake incorporating a minimum fat to protein depositionratio and a maximum protein deposition rate. If capacity to eat was too low torealize maximum protein deposition, then increasing the intake capacity had apositive economic value, while if it was too high it had a negative value, whereaspreviously increased intake was always considered a bad thing! This model wasthen used to simulate effects of various selection indices and it was concluded that,if intake capacity is too low, selection emphasis should be on this trait.
There is important genetic variation in food intake between and withinbreeds, e.g. for the Pietrain it is 0.87 of that for the Large White (Webb, 1989),while some breeds (e.g. Chinese pigs) seem to have a bigger capacity fordietary fibre. Within a breed, heritability of intake is about 0.3 and showsgenetic correlations with growth rate (positive) and lean content (negative), butnot with efficiency of utilization of food. The correlations between test stationand commercial farm performance are low (0.25 for growth rate and 0.40 forbackfat), so some of the genetic improvement is not being expressed on farms,i.e. there are interactions between genotype and production system. This maybe due to test stations using individual feeding and some genes affecting socialbehaviour not being expressed in the test environment – monitoring intake ofindividuals in groups is now the norm in pig testing stations, using FIREsystems (see Chapter 2).
After seven generations of selection, with reduction in fatness being themajor trait in the selection index, average daily food intake was reduced from2.71 kg/day in a control, random selection line to 2.51 (Wood, 1989). Whenselection of pigs was based on an index that included high live weight gain, lowbackfat thickness and efficient food conversion, voluntary food intake declinedfor 7 years but then plateaued (Smith et al., 1991). The cumulative responsesin intake after 11 years were –0.25 kg/day for boars and –0.19 for gilts.
However, selection for efficiency is difficult as it involves measurement ofintakes by individual pigs and, where it has been used, direct selection forefficiency has not always given an improvement. Selection for increasedprotein deposition and reduced backfat has usually led to improved efficiencyanyway, so breeders have not been worried about selecting directly forefficiency. Currently, equipment is available for monitoring individual foodintakes and less emphasis is being placed on reduction of backfat. Thus,improvement in efficiency has recently become feasible and attractive.However, efficiency is a ratio of output to input and ratios have poor statisticalproperties, so that selection responses can be erratic. An alternative is to selectagainst high food intake, but this leads to reduced performance.
Selection for efficiency and leanness on ad libitum feeding caused reducedvoluntary intake; from years 2–4 to 6–8 of the Meat and Livestock Commission’sCommercial Product Evaluation Scheme (UK), voluntary intake fell by 6%.Paradoxically, when selection was done with restricted feeding, voluntary intakeof subsequent generations was found to be increased.
Growth and Fattening 325

Fat is now at about the right level in pigs, so the only way to continue toimprove efficiency is to increase lean tissue growth to reduce the maintenancecost per unit of production. Testing and selection are, therefore, made on adlibitum feeding, penning in groups to allow expression of genes for behaviourunder commercial conditions, and recording of individual intakes to measuregenetic differences in maintenance which cannot be predicted either fromgrowth rate or backfat. The ability to feed ad libitum due to reduced voluntaryintake accompanying selection for low fat deposition has enabled ad libitumfeeding systems increasingly to be used commercially, with considerable savingin labour.
Selection on food conversion is inefficient, and further improvement offood efficiency by reduction of fatness is limited. It has been suggested,therefore, that selection should be for high food intake from early in growthwhen the pig is most efficient, and lean growth is highly associated with foodintake to produce a food intake curve corresponding to the curve of leangrowth.
GENETIC PARAMETERS FOR DAILY FEED INTAKE PATTERNS From monitoring of dailyintake over a 95-day period in Dutch Landrace gilts, it was observed thatgenetic correlations were low (around 0.3) between intake at start and end ofthe test, suggesting that intake on different days on test could not be regarded asrepeated measurements of a single trait with constant variance and heritability(Huisman and van Arendonk, 2004). It was concluded that it should be possibleto manipulate food intake patterns during growth through selection.
Bermejo et al. (2003a) have proposed that selection for high relative intakeearly and low intake later in growth could be based on the parameters ofcurves fitted to daily intakes over as long a period as possible. Several methodsof describing intake curves were applied, including linear-segmented (brokenstick) and logistic functions (see Fig. 15.3). Selection can then be on reducedage at which the intake plateau is reached or at which the maximum incrementin food intake per day occurs, using the plateau or logistic functions,respectively.
Breeding values of these selection criteria were estimated, which showedthat a change in food intake by selection is possible and that an optimization ofthe food intake curve corresponding to lean growth rate can be achieved. Notethat there is not much difference between the two relationships. While thecontinuous curve gives a good fit for carefully measured intakes (e.g. in aresearch environment), it is often not possible to differentiate it from thebroken-stick model where the data are not so accurately recorded (e.g. in acommercial situation).
This encouraged a larger-scale study in which daily intakes of over 5000boars were monitored over a period of 9 weeks (Bermejo et al., 2003b). Use ofthe logistic model showed that the day on test at which the maximumincrement in food intake occurred ranged between 71–81 days on test, whilethe day on which the plateau of intake was achieved varied from 45–48 dayson test (90 days of age at start of test). Heritability for parameterscharacterizing food intake at the beginning of the test period ranged from
326 Chapter 15

0.03–0.30 and selection based on the logistic function resulted in a 0.2 kg/dayreduction in food intake at the end of the test period, but with only a smalleffect on intake at the early part of the test. Further analysis, including randomregression models, allowed early intake to be increased as well as late intake tobe reduced (Bermejo et al., 2003c), and adoption of this method in breedingprogrammes should lead to improved food efficiency.
Comparison between breeds shows that Pietrain pigs eat less thanLandrace or Meishan through most of the growing period (see Fig. 15.4). From40–70 kg, the Landrace pigs ate less than the Meishan, although the former atemore at 20 kg; the plateau in food intake was reached first by the Meishan,followed by the Landrace, the Pietrain being last.
Expressing intake relative to metabolic live weight (LW0.75) shows that foodintakes were 0.128, 0.108 and 0.123LW0.75 for Landrace, Pietrain andMeishan types, respectively. Data collected under commercial conditions showad libitum food intakes of all three types of pig to be substantially less than thevalue of 0.12W0.75 that might be expected from research results.
Neuropeptide Y (NPY) and leptin have been identified as being involvedin the control of food intake (see Chapters 4 and 5) and it might be expectedthat genetic differences in intake would be accompanied by changes in suchtransmitters as these. This was investigated by Cameron et al. (2003), whomonitored serum NPY and leptin concentrations after six generations ofdivergent selection for daily food intake in pigs. At 90 kg live weight, NPYconcentration was not affected while serum leptin concentration was increased(3.06 versus 2.45 ng/ml) by selection for high intake compared with selectionfor low intake. This is consistent with increased leptin resistance in fatter
Growth and Fattening 327
0
1
2
3
4
80 100 120 140 160 180 200 220
Age (days)
Foo
d in
take
(kg
/day
)
Fig. 15.3. Estimation of daily feed intake using linear-segmented (black line) and logistic(grey line) functions presented for one animal; x, raw data (from Bermejo et al., 2003a).

animals and humans. The relationship of leptin to either growth or food intakeis not sufficiently close for serum leptin to be used as a selection criterion.
It has been found that a line of pigs selected for rapid weight gain (withhigher voluntary food intake) had a significantly lower plasma concentration ofcholecystokinin (CKK, see Chapter 4) per unit of food consumed comparedwith the low line, while higher blood glucose, insulin and IGF-1 concentrationsand greater basal blood growth hormone concentrations have been found inpigs selected for high weight gain than for control pigs. All of these differencesare in the direction expected for animals with higher nutrient demand, whichthe animal attempts to satisfy by taking a higher intake of food.
Beef cattle
Although intakes of cattle of various beef breeds are similar at the same bodyweight, those for dairy Holsteins are usually higher, by some 8%, although thisdifference has disappeared by 450 kg (NRC, 1986). Perhaps, the lower bodyfat content of growing Holsteins underlies this difference. Another difference isthat beef calves are normally with their dams and can obtain milk up to 6months of age, whereas Holsteins are usually weaned from milk replacer atabout 6 weeks and thus have had a longer time to adapt to solid food by theage the comparisons are made. Higher growth potential is likely to be the mostimportant reason.
Between-species comparison of the voluntary food intake of adult animalsshows that intake is related to live weight0.73 (metabolic live weight). Within aspecies the level of intake may also be related to metabolic live weight, butthe exponent is greater the less digestible the food. This generally accepted
328 Chapter 15
0
0.5
1.0
1.5
2.0
2.5
3.0
3.5
20 40 60 80 100 120
Live weight (kg)
Foo
d in
take
(kg
/day
)
Fig. 15.4. Relationship between daily feed intake and live weight for three pig types: Landrace(solid line), Pietrain (dotted line) and Meishan (dashed line) (from Whittemore et al., 2001a).

relationship between intake and live weight does not hold good as a group ofanimals grow or fatten, however, as discussed above. For example:
DMI (g/day) = 172LW0.61 (15.17)
calculated from the cattle data used by ARC (1980). NRC (1987) showpredictions of intake against net energy content of diet. Intake per unit ofmetabolic body weight is stable or rising up to about 350 kg body weight, butfalls above this weight.
Sheep
Merino sheep selected for high weaning weight had higher food intake than astrain selected for low weight at weaning, which to some extent persisted evenwhen intake was expressed on a per kg basis (Thompson et al., 1985).
Residual food consumption
What is required is not low intake per se but low intake relative to performance,i.e. minimization of the difference between actual food intake and thatpredicted to be required for maintenance and production, known as ResidualFood Consumption (RFC). Selection for low RFC should reduce food intakewithout affecting performance, thereby improving the profitability of animalproduction.
For growing animals:
Food intake = b1(Pr + Lr) + b2W0.75 + e (15.18)
where b1 and b2 are the efficiency coefficients for production and formaintenance, respectively, Pr and Lr are the rates of deposition of protein andlipid, respectively and e is the error term, or RFC (Whittemore et al., 2001a).
Poultry
The concept of Residual Food Consumption (RFC) for laying hens is fullydiscussed by Luiting (1999). Factors related to RFC are fatness, behaviourpattern and metabolic heat loss. The heritability of RFC is estimated to be 0.37and it is suggested to use RFC from 25–29 weeks of age in cocks as a selectiontool to improve conversion efficiency of laying hens (Katle and Nordli, 1992)as, although it is better to record RFC in hens, it is cheaper to do it for cocks. Abreeding programme including RFC was calculated to be 17% more efficientthan one without.
Pigs
Although RFC has a lower heritability (0.30–0.38) than food intake (0.45), it isbetter than that for efficiency of food conversion (0.28) (Mrode and Kennedy,1993). About half the variation in food intake is residual, the causes of which
Growth and Fattening 329

include food wastage, physical activity, digestibility and efficiency of utilizationfor maintenance and/or growth. The use of RFI in selection programmes forpigs warrants further study.
Cattle
Herd and Bishop (2000) found RFC for beef cattle to have a heritability of 0.16and to be phenotypically independent of size and growth; it was negativelyrelated to lean deposition. RFC was not affected by differences in pre-testrearing treatments, in contrast to live weight at the start or end of test, ADGand FCE. It was concluded that selection for low RFC could reduce food intakewithout affecting growth rate or mature size, thereby increasing the efficiency ofbeef production.
Selection for high growth rate or efficiency is likely to increase cow weight,counteracting any benefits in terms of improvements in the performance of thecalves during growth. Thus, selecting for low RFC rather than these otherparameters has great advantages and is accompanied by better digestibility andreduced heat increment of feeding and activity (Richardson and Herd, 2004).Protein turnover, tissue metabolism and stress contribute at least 37% of thevariation in RFC, and it seems as if selection for low residual food intake inbeef cattle is accompanied by a reduction in susceptibility to stress. The effectsof selection for improved RFC on protein turnover, tissue metabolism, iontransport and stress susceptibility require further research.
Heritability for dry matter intake in lactation has been estimated as beingbetween 0.18 and 0.46, depending on the stage of lactation, but it wouldappear that the concept of RFI has not been applied to dairy cows.
Compensatory growth
Following a period of reduced growth caused by restriction of food, illness orenvironmental stress, animals grow at a faster rate than unrestricted animals ofthe same age. This phenomenon is called compensatory growth and is due toincreased voluntary food intake, increased weight of gut contents and improvedefficiency of conversion. The latter may be due to reduced maintenancerequirements. Whether the increased intake is a result of or a cause of theincreased growth is not easy to answer; restriction will have reduced the fatcontent of the body, which will tend to increase appetite (see below).
Poultry
Compensatory increases in food intake by cockerels following restriction havebeen demonstrated. However, in our work with broiler chickens, restriction to85% of ad libitum was not followed by an increase in intake when ad libitumaccess was restored (Yalda and Forbes, 1990). It must be noted that, duringrestriction, the protein content of the food was increased to maintain the sameprotein intake as controls, and protein deposition was not reduced. It may be that
330 Chapter 15

compensation for a period of restriction is due to the low body protein for theanimals’ age, rather than to reduced body fat, at least in growing broiler chickens.
Pigs
Restriction of pigs from 25–50 kg live weight to half of the ad libitum level of foodwas followed by increased intakes when free access was given, to the extent of15% above unrestricted controls. This work was then extended to investigate theability of growing pigs to compensate for the effects of diet dilution whenreturned to conventional foods (Owen and Ridgman, 1968). Young pigs up toabout 60 kg weight did not recover fully, whereas older pigs did compensate byeating more, although it took some 2 weeks for this to occur. We should note,therefore, that the results of short-term experiments can be very misleading.
Cattle
Ruminants are often subjected to periods of underfeeding, both in the wild andin practical animal husbandry. Therefore, many studies of compensatorygrowth in ruminants have been undertaken and it is concluded thatcompensatory growth is largely dependent on compensatory increases involuntary intake. A significantly higher herbage intake by cattle, which hadbeen fed at a low level during the previous winter, has been seen, comparedwith those fed at a high level. Figure 15.5 shows the higher intake, for anygiven body weight, of animals that had suffered a period of restriction beforeintroduction to the experiment (Pickard et al., 1969).
Growth and Fattening 331
15
20
25
30
100 150 200 250 300 350 400 450 500
Live weight (kg)
Foo
d in
take
(g
DM
/kg
live
wei
ght/d
ay)
Fig. 15.5. Voluntary intake of a cereal-based food by growing cattle; �, fed ad libitumthroughout; ●, undergoing compensatory growth (from Pickard et al., 1969).

Reduced maintenance requirements may play a part, and the unexpectedlylow heat production of adequately fed ruminants after a period of restrictionmay occur as a result of reduced thyroid hormone secretion.
Sheep
Lambs recover from a period of restricted feeding if subsequently fed adlibitum. For example, 4-month-old wether sheep held at a weight of 20 kg foreither 4 or 6 months and then offered free access to a good-quality food had ahigher food intake and lower heat production than the controls that had beenfed ad libitum throughout (Graham and Searle, 1975). The increased voluntaryintake occuring during compensatory growth is evidenced irrespective of themetabolizable energy content of the diet, although compensation is better on ahigh-quality food than one of poor quality.
From a review of the literature it can be concluded that, the longer theperiod of restricted feeding the greater the food intake when ad libitum feedingis resumed. Gut fill is very high – as much as 25% of body weight – incompensating lambs, compared with 15% in controls offered free access tofood throughout. Although this difference could be due to the greateravailability of abdominal capacity in the restricted lambs, which are thinner, it ismore likely that the increased rate of utilization of nutrients is the primarystimulus to higher intake which, in turn, resulted in a higher volume of ruminalcontents, according to the MTD hypothesis (see Chapter 10). The high intakeduring compensatory growth is not likely to be caused by low thyroid secretionrate per se, however, because treatment of sheep with exogenous thyroxinestimulates voluntary intake even though body reserves may be mobilized tosupport the higher metabolic rate.
Growth manipulation
Since the middle of the 20th century, several ways of stimulating growth infarm animals have been developed, some of them having been used verywidely on a commercial scale. Many countries have now banned most or all,because of fears for human health, and some have never been licensed.
Few, if any, have their primary effect on voluntary food intake but, in severalcases, intake is increased, through effects on either digestion or metabolism.
Antibiotics
PIGS When included in pig diets antibiotics often increase efficiency ofdigestion, but also consistently increase voluntary food intake to a small extent.However, antibiotics are now banned in Europe for routine prophylactic use.
CATTLE Monensin and similar food additives modify ruminal fermentation toincrease the production of propionate and reduce methane production. Theyhave been widely used commercially as they improve food conversion
332 Chapter 15

efficiency. In beef cattle there is either no increase in weight gain and reducedvoluntary food intake or increased gain with no change in intake. Beef cowsproduce milk more efficiently, forage intake being depressed from 9.6 to 8.3and 7.7 kg/day by the inclusion of 50 or 200 mg/day of monensin in the food,with no consistent effect on weight change (Lemenager et al., 1978).
In a second trial by the same authors, weight gains were improved and milkyields were not affected, even though the amount of time spent grazing wasdecreased by the inclusion of monensin in the concentrate supplement. It hasbeen suggested that the decrease in intake occurring when monensin is includedin concentrated foods for cattle is due to an aversion to some sensory cueassociated with the malaise resulting from the changes in ruminal fermentation.
Anabolic steroids
POULTRY Oestrogens have been used commercially to stimulate weight gains;their effect, unlike that in ruminant animals, is primarily to stimulate food intakeand, in the absence of marked stimulation of true growth, the rate of fatdeposition. Even in force-fed broilers, oestrogen treatment significantlyincreases the weight of food consumed voluntarily. The use of steroidal growthpromoters has now been banned in Europe.
PIGS Voluntary intake is decreased during treatment with commercial doses ofa mixture of diethylstilboestrol (DES) and methyl testosterone. It is not clear towhat extent this reduction is due to direct effects of the oestrogens on intakeand to what extent to reduced fat deposition induced by the steroid. Anabolicagents of this type are not used commercially because of the risk of residues inmeat and because the growth stimulation is less than in ruminants where intakeis not depressed.
The use of uncastrated boars for meat production is more widespread sincethe rate of lean meat production has increased, and the propensity to fatten issufficiently low that they can be fed ad libitum.
CATTLE Following the discovery in the early 1950s that DES, a syntheticoestrogen, had anabolic properties and was orally active in ruminants, its usewas widely adopted in the USA. Voluntary intake is increased in response toincreased weight gain due to greater secretion of growth hormone which, bystimulating growth, increases the rate of utilization of metabolites. DES waswithdrawn in the early 1970s because of fears concerning its safety for humanconsumers of meat. In the UK, another synthetic oestrogen, hexoestrol, wasused because it is not orally active and is therefore potentially safer, but this hasalso been banned.
Natural oestrogens, which have very similar biological effects to DES andhexoestrol but a much shorter half-life, were then used on an extensive scale;they stimulate growth in castrated or intact male ruminants and food intake isincreased.
Androgens stimulate growth by means other than growth hormone,probably by a direct effect on muscle. Trenbolone acetate was widely used as it
Growth and Fattening 333

stimulates growth without inducing undesirable male characteristics. It is likelythat the effect of androgens on intake is due to the increased demand fornutrients, although a more direct effect was suggested by results showing alarge and rapid increase in voluntary intake in ketotic cows treated with 60 or120 mg of trenbolone acetate. The use of all of these substances as growthstimulants for farm animals is now banned in Europe.
The mechanism by which oestrogens influence DMI is still not very clear,although there is evidence that it regulates the secretion of leptin from adipocytes.
SHEEP Voluntary intake by sheep of a 0.5 hay:0.5 concentrate food wasincreased by DES from 1.43 to 1.50 kg/day. This increase in intake is theresponse to increased weight gain rather than its cause, because restrictingtreated animals to the same weight of food as controls does not completelyprevent the increase in weight gain and carcass weight.
Growth hormone (GH)
There was a dose-related decrease in carcass fatness in lambs treated with GH,but live weight gain and food intake from 10–22 weeks of age were notsignificantly affected, although intake tended to decline as dose was increasedfrom 0.025 to 0.250 mg/kg/day. It can be speculated that the mobilization oflipid reserves and increase in plasma free fatty acid levels caused by GH act assatiating agents.
Corticosteroids
Corticosteroids, whose secretion increases during stress, are catabolic inlaboratory animals but have stimulated weight gains and food intake in severalexperiments with sheep. Doses of 25–75 mg cortisol/day given intramuscularlyto sheep for 3 weeks resulted in plasma levels similar to those seen duringstress. Intake and weight gains were increased, especially when intake wasotherwise low because of seasonal factors. Doses of 100 or 300 mg given threetimes per week stimulated intake from 934 to 1170 g/day of lucerne and from1107 to 1306 g/day of a 0.5 lucerne:0.5 barley ration. Cortisol tended toreduce the amount of protein in the carcass, but increased the amount of fatsignificantly.
Combined cortisone (100 mg of cortisone three times per week) and DES(3 mg implant) treatment, to ascertain whether the higher intake due to theformer could be combined with the greater protein deposition induced by thelatter (Ellington et al., 1967), increased intake of a pelleted food by sheep from1.65 to 1.89 kg/day; animals given DES alone had a mean intake of 1.72kg/day, while those given cortisol had a daily intake of 1.97. Withdrawal of thecortisone treatment 2 weeks before slaughter to reduce fat deposition reducedthe mean intake to 1.65 kg/day.
Similar results have been obtained with cattle; subcutaneous injection of 1 gof cortisone acetate three times per week increased voluntary intake significantlyfrom 12.1 to 13.9 kg/day, with an increase in carcass fat.
334 Chapter 15

�-agonists
�-adrenergic agonists were originally investigated for their ability to reduce fatdeposition, but were also found to stimulate muscle growth. A commercial dosefor steers of 10 mg/day of the �-agonist clenbuterol in the food significantlyaltered carcass composition without affecting voluntary intake. Overdosing with500 mg/day to study the toxic effects depressed intake.
Cyproheptadine
Cyproheptadine, a pharmacological antagonist to serotonin, stimulates foodintake and growth rate in children and rats. Oral administration of 0.64–1.92mg/kg live weight/day to growing cockerels caused a dose-dependent increasein daily food intake (Injidi and Forbes, 1987), but there was no improvement infood conversion efficiency and it is unlikely that such treatment would be usefulcommercially.
Fatness and Food Intake
Relationships between body fat and intake
Most adults of many species maintain a more or less constant body weightdespite changes in food quality and climate. This has long been ascribed to aregulation of body fat, and the mechanism has more recently been shown toinvolve leptin (see Chapter 4). The statement that body fat content is heldconstant by changes in energy intake (and/or output) cannot now be regardedas sacrosanct. Incorporation of fat in a diet for rats, for example, gives areduction in intake, but not sufficient to maintain a constant level of digestibleenergy intake, which remains slightly higher than with the standard food, withthe result that the animals gain weight slowly.
Similar phenomena are also observed in chickens and pigs (see Chapter11). Although this has been ascribed to an improvement in the palatability ofthe food, it is more likely to be the effect of the higher energy density. A theoryof metabolic efficiency, heat production or comfort might account for theseobservations, as dietary fat is used efficiently for body fat deposition, so dietshigh in fat do not involve as much metabolic work and/or discomfort ascarbohydrate diets.
The influence of fatness on intake of those animals that have been selectedgenetically for rapid weight gain, e.g. pigs, cattle, sheep and broiler chickens,seems to be less than in other species, e.g. rats, goats and laying hens, whichhave not been so selected.
Poultry
Force-feeding of mature chickens, at a level which caused great increases in thefat stores, was followed by complete absence of voluntary feeding for up to 10
Growth and Fattening 335

days and, even 23 days after the cessation of force-feeding, the birds had notrecovered their pre-experimental level of intake (Lepkovsky and Furuta, 1971).Plasma triglyceride concentrations were elevated during the period of force-feeding. Force-feeding an amount equivalent to half the previous daily intakedepressed voluntary intake to about 63% (i.e. 13% overeating) (Polin andWolford, 1973). The birds compensated for the loading, but not sufficiently toavoid increased total food intake and fat deposition.
More recently, Yalda and Forbes (1991) have shown that force-feeding ofgrowing broiler chickens the same amount as the voluntary intake of controlbirds – divided into five meals spread throughout the day – did not completelysuppress feeding, which continued at 30% of control to give a total daily intakeconsiderably higher than normal. This resulted in a great increase in fatdeposition so it was surprising that, when force-feeding was terminated,voluntary intake increased to 122% of control and declined only slowly to thatlevel over the next few weeks. Apparently, the over-provision of nutrientsduring force-feeding had stimulated the rate of fat deposition, and this had gotthe body into such a metabolic state that the high demand for nutrientsgenerated a high voluntary intake.
Mild restriction (130 g/day) of older broilers from 18–47 weeks of age,without increasing the protein concentration of the food, was followed byhyperphagia (180 g/day) for 2 weeks before a steady rate (160 g/day) wasachieved (March et al., 1982). Probably, the increased intake was a response toreduced protein deposition during the period of restriction. A problem withthese manipulations is that a period of abnormal nutrition is involved, to whichcontrol birds are not subjected. This was overcome by reducing body fatcontent by partial lipectomy involving surgical removal of the abdominal fatpad of chickens (Taylor and Forbes, 1988). Both lipectomized and sham-operated birds recovered their pre-operative food intakes quite rapidly, atesimilar amounts of food and gained at similar rates; when slaughtered at 14weeks of age the lipectomized birds were lighter than the controls by anamount (154 g) similar to the weight of fat removed at surgery (190 g).
The conclusion drawn is that broilers of this age do not compensate forremoval of fat by increasing their food intake. However, there might be adifference between: (i) birds that have had all their various fat depots depletedby a period of underfeeding, which can be repleted when ad libitum feeding isreintroduced; and (ii) those in which one fat depot is surgically removed, thuspreventing any more deposition at that site – the remaining depots might bedepositing fat at the maximum rate throughout and there would be nopossibility for them to increase their rate of synthesis after removal of the fatpad.
The abdominal fat pad may not be truly representative of fat in general, asit has a later maturity than other fat depots. It is clear, nevertheless, that thefood intake of broiler chickens is not closely controlled by the amount of fat inthe body.
Broiler breeder stock become very fat if allowed to eat ad libitum and, inpractice, have to be fed at a severely restricted level if reduced reproductiverate is to be avoided (see Chapter 16).
336 Chapter 15

Pigs
Domestic pigs may become grossly overweight, as if the feedbacks from fat arereduced or ignored by the brain. It might thus be suggested that the lipostatictheory does not apply and that intake is limited by the maximum rate of fatsynthesis above which precursors will accumulate and prevent higher levels offood intake. Perhaps selection for rapid weight gain (with little regard forcomposition at a time when fat was more acceptable to the consumer) was aselection against negative feedback from fat to the CNS. Selection against fatdeposition in recent years has been accompanied by reduced voluntary intake(see above).
Voluntary intake actually declines in many growing pigs once they havereached around 100 kg live weight (see above). In gilts, this might be due tothe onset of oestrus at around this weight, although the intake of castratedmales tends to fall more steeply, but from a higher peak.
Cattle
Northern European domesticated breeds of cattle become very fat if offeredfree access to high-quality feeds, but eventually reach a plateau. Non-pregnantmature Friesian cows fed ad libitum on a pelleted food were still gaining weightat about 1 kg/day when they weighed 700 kg, while smaller-framed Jerseysshowed signs of a plateau at about 430 kg (Monteiro, 1972). The Jersey breedhas not been selected for rapid growth, while the Friesian is a ‘dual-purpose’breed that might have a much greater potential for fattening than the Jersey orother ‘pure’ dairy breeds.
In a more critical analysis of effects of fatness on intake, Bines et al. (1969)fed cows at two levels to bring them into either fat or thin condition.Subsequently, when straw was offered alone, mean intakes were similar forboth groups but, when offered hay or concentrates, thin cows ate 31% more or23% more, respectively, than fat ones, despite the fact that the fat cows wereheavier. The weight of ruminal contents was greater in the thin cows than in thefat cows when offered hay, and it was thought that ruminal capacity waslimiting hay intake. The higher intake of concentrates by the thin animals wasattributed to their greater capacity for lipogenesis.
Sheep
Food intake by sheep is generally inversely related to the proportion of fat inthe body. A close inverse correlation between intake of dried grass pellets andcondition score was observed in Scottish Blackface ewes (Foot, 1972). In orderto examine the relationships between fatness and intake critically, it is better towork with animals whose differences in fatness are imposed by theexperimenter rather than by natural differences in fatness. Sheep with anaverage starting weight of 50 kg were fed differentially until 33 or 7% of theirweight was fat (Graham, 1969). Subsequent DM intakes were 65 and 106 g/kglive weight0.75/day, respectively, so that fatness had a clear effect on intake.
Growth and Fattening 337

Scottish Blackface ewes differentially fed to make them thin (L, meancondition score 2.15) or fat (H, mean condition score 3.15) subsequently ate2176 and 1727 g DM/day of dried grass pellets, respectively (Sibbald andRhind, 1997). Mean basal plasma insulin concentration was higher in the Hthan in the L ewes (43.0 versus 29.0 mU/l). From this and other results it wasconcluded that the effect of previous body condition on voluntary food intakemay be mediated by plasma insulin concentrations providing a long-termfeedback signal to the brain. The feeding behaviour of these sheep was studiedwhen they had 6, 12 or 24 h/day access to the pelleted food (Sibbald, 1997).Intakes for the 6, 12 and 24 h food access treatments were 1429, 1686 and1805 g DM/day, respectively, and there were no interactions between theeffects of body condition and food access time. More time was spent feeding bythin ewes (231 versus 197 min/day), but frequency of meals and rate of intakeduring meals were not markedly affected by body condition, i.e. meal size wasgreater in the thin animals.
Sheep kept on an ad libitum feeding regime of a complete pelleted food,for up to 4 years from the age of 4 months, showed no difference between thelevel of intake per animal between 12 months of age and 3.5 years of age,during which period they gained in weight from about 30 to 130 kg (Blaxter etal., 1982). It was concluded that: ‘Voluntary food intake is established early inlife and this determines the ultimate body size sheep attain on a particular diet’,because asymptotic body weight was positively related to food intake.
In a similar experiment, Thompson and Parks (1983) offered a pelletedfood to Merino and Dorset Horn rams and wethers. Intake increased toapproximately 50 weeks of age then declined rather than remaining stable asobserved by Blaxter et al. (1982), presumably due to the increasing negativefeedback effect of accumulating body fat. While the sheep of Blaxter et al.(1982) were still growing at 3 years of age, those of Thompson and Parks(1983) had ceased growing by 2 years of age. The latter calculated that,according to their equation for intake predicted as a function of the energyrequired for both growth and fattening, this difference in age at maturityaccounted for the different patterns of long-term food intake in the twoexperiments.
While the afferent pathway for the lipostatic control of fatness has beensupposed to be leptin (see Chapter 4), Tolkamp et al. (2007) have used theKetelaars and Tolkamp theory of intake control (see Chapter 9) to provide adifferent explanation for the plateau in weight achieved by sheep. Theycalculated that the efficiency with which fat is deposited declines with bodyfatness, and derived parameters for their model from two groups of sheep,estimating body fat content from measurements of body condition score. Theintake of hay or pelleted food by three other groups was predicted quite well,and extension to include a Gompertz curve for protein deposition allowedgood simulation of changes in body weight and condition score. The goodnessof fit between observed and predicted results is additional evidence, albeitcircumstantial, of the validity of the efficiency theory of Ketelaars and Tolkamp.
Ewes lose their teeth from the age of about 6 years, which can reduce rateof eating, especially of hard foods such as root crops. This is likely to affect only
338 Chapter 15

the intake of foods that are eaten very slowly, however, and Dove and Milne(1991) found almost no difference in intake of long herbage between ewes withfull and broken mouths, even though live weight gain and body condition scorewere lower for those ewes with poorer teeth.
Wild and undomesticated ruminants do not become permanently obese, butshow an annual cycle of fluctuating body weight and fatness (see Chapter 17).
Mechanisms for effects of body fat
Some discussion of possible mechanisms for interrelationships between fatnessand voluntary intake is also to be found in Chapter 4.
Physical constraints
The underlying reason for the inverse relationship between fatness andvoluntary intake in ruminants may be one of competition between abdominalfat and rumen for abdominal space, and there have been several reports ofnegative correlations between the volume of abdominal fat and that of ruminalcontents.
Karkeek (1845) noted that: ‘… in proportion as an animal (cattle) fattened,so in proportion did the organs which are chiefly concerned with nutritionbecome diminished in size … it is rather a remarkable coincidence that thefatter an animal becomes at this period (later stages of fattening), the less foodit consumes’. There are negative relationships between the volume of ruminalcontents in cows after slaughter and the volume of abdominal fat and ruminaldigesta further depressed in advanced pregnancy.
In pregnant ewes slaughtered at various stages of pregnancy, it was notedthat the volume of ruminal contents and the voluntary intake of hay wasinversely proportional to the volume of ‘incompressible abdominal contents’and that abdominal fat was a significant cause of variation in this (Forbes,1968b). If physical limitation was the sole reason for the reciprocal relationshipbetween fatness and intake, then fat would not depress intake when highlydigestible foods were given; however, the work of Orr (1977) showed thatintake was lower in fat animals even when a highly digestible diet was fed.
Lean or fat mature sheep (52.2 or 83.2 kg live weight) were offered foods ofthree qualities (8.4, 10.0 or 12.2 MJ ME/kg DM). In both lean and fat animals,voluntary food intake compensated for differences in ME concentration,although intake was significantly lower in the fat groups. Thus, the fat animalswere still controlling their ME intake, but at a lower level than the lean sheep.These experiments show that, in animals with equal propensity to fatten(assuming random allocation of animals to experimental groups), increasingfatness is associated with declining voluntary intake.
The only experiment with ruminants reporting surgical removal of fat isthat of Joubert and Uekerman (1971), who removed the tail of fat-tailed sheep,which weighed 1.9 kg in the undocked animals at slaughter. However, thesubsequent weight gains were the same as those of non-operated control
Growth and Fattening 339

animals, and there was no increase in body fat to compensate for the loss ofthe large tail deposit. As discussed above for poultry, there is a clear differencebetween reducing body fat by underfeeding and by lipectomy. In the formercase the adipocytes are still present, albeit in a depleted state, and will take upprecursors for fat synthesis when they become available, thereby exerting aneffect on intake. In the latter case the adipocytes are no longer present, andtherefore cannot exert such an effect; hence, the lack of a compensatoryincrease in food intake following the surgical removal of adipose tissue.
Metabolic constraints
The role of hormones and metabolites in the effects of body fatness on foodintake has been covered in Chapter 4. However, it has been pointed out thatthere are weaknesses in the ‘leptin hypothesis’ (Speakman et al., 2002). Theseauthors developed a theme proposed many decades earlier, that the increase inbody weight through overeating leads to an increased maintenance requirement,thereby eventually resulting in stable body weight as long as food intake remainsstable.
Speakman et al. (2002) provide more physiological and metabolicevidence for this theory, specifically through their observation that, not onlydoes adipose tissue have a maintenance requirement for energy, but weightgain in adult animals is part fat, part lean tissue and the lean tissue depositionhas a much higher energy requirement for maintenance than does adiposetissue. Their calculations demonstrate how their theory can predict body weightand intake changes similar to those observed in fattening and fasting animals,without invoking a negative feedback such as that proposed by others as beingprovided by leptin.
Conclusions
The higher the intake of milk by the sucking animal the lower its intake of dryfood, and this can increase the setback at weaning, when the withdrawal of thesupply of milk stimulates the intake of solid food, encouraged by creep feedingbefore weaning. Artificially fed ruminants respond to dilution of the milkreplacer by changes in intake in the appropriate direction, but not usually to anextent appropriate to maintain the same intake of energy.
Food intake increases as animals grow, not in direct proportion to liveweight but more usually in proportion to live weight raised to the power of 0.6.A period of restricted feeding is followed by higher voluntary intake and atendency to catch up with the live weight of unrestricted controls.
Although fatness depresses the intake of farm animals, as it does in otherspecies, the effect is less and, as they approach maturity, pigs, broiler chickens,cattle and lowland breeds of sheep become very fat if fed ad libitum on good-quality diets. We must accept that the control of food intake is very complexand not expect to be able to make simple statements about its interrelationshipswith body weight and fatness.
340 Chapter 15

16 Reproduction and Lactation
The changes in nutrient requirements that take place during pregnancy, lactationand egg-laying lead to changes in voluntary food intake, but these are not alwayswell-balanced, and unwanted increases or decreases in body fatness often arise.However, as reproduction is so essential, it has been proposed that changes infood intake at key reproductive events have some selection advantage and arenot simply accidental (Weston, 1996). Forbes (1986a) and Ingvartsen andAndersen (2000) have reviewed the physiological changes associated with thesechanges in intake in ruminants.
Oestrus
A decrease in food intake is often observed at the time of oestrus, whenoestrogen levels are high and progesterone is low. Reduction in intake at oestrusallows females to spend more time responding to males. The rut in males, seenso clearly in deer, allows full concentration on mating with a reduced competingdrive for food.
There are several changes occurring during female reproduction which areresponsible for changes in voluntary intake. Oestrogens, while being associatedwith small increases in intake when used at low doses as growth promoters,depress intake when secreted in larger quantities (50 �g/day in the ewe) by theovaries at oestrus or by the placenta in the last few weeks of pregnancy.
Although it is known that there are oestrogen receptors in the brain andit had been assumed that the primary effects of oestrogens on behaviourwere through these receptors, gonadal steroids also have important effectson peripheral tissues, and changes in the metabolic activity of these tissuesalso cause secondary changes in feeding behaviour.
© J.M. Forbes 2007.Voluntary Food Intake and Diet Selection 341in Farm Animals 2nd Edition (J.M. Forbes)

Pigs
During the week that included oestrus in sows, the total food intake was foundto be 4 kg lower than in each of the other 2 weeks of the cycle. The most likelyreason for this is that blood oestrogen levels are high at oestrus.
Cattle
In the cow, total food intake sometimes declines at oestrus, less time is spenteating and there also seems to be a change in the choice of food. J.H.M. Metz(personal communication) noticed that the intake of concentrates declinedwhile that of hay increased at oestrus (cows usually eat about 0.2 of their intakeas hay if it is available free choice with concentrates).
Sheep and goats
Concentrate intake is often decreased for a day or two around oestrus, anddaily intake was depressed in a dose-dependent manner when oestradiol wasinfused intravenously into lactating goats, at the rate of 8 g food/�g oestradiol,although there was no effect on the intake of hay, offered simultaneously(Forbes, 1986a). The concentrate intake of goats was further depressed atoestrus by an amount equivalent to that caused by 50 �g of oestradiol/day –approximately the rate of secretion of oestrogens by the ovary during oestrus.
The differential effect of oestrogens on the intakes of concentrates andforage is also illustrated by the results of an experiment in which oestradiol wasinfused into castrated male sheep. When hay was offered, intravenousinfusions of oestradiol at up to 400 �g/day had no consistent effect, but when acomplete pelleted diet was offered a 90 �g/day infusion caused a lower foodintake, followed by a significant increase in intake after treatment was stopped.Note also that when given hay ad libitum and a restricted amount ofconcentrates, goats nevertheless reduced their intake of the latter only wheninfused with oestradiol or during oestrus.
The effects of oestradiol infusion on intake of an optimal food were greaterin fat wethers than in thin (Weston, 1996; Fig. 16.1). Given that adipose tissueabsorbs steroids, it would be expected that blood levels of oestradiol wouldhave been lower in the fat animals, so the effects in this experiment were notlikely to have been on the CNS, but on adipose tissue itself. Oestrogens affectadipose tissue metabolism, and adipose tissue can influence food intake (seeChapter 15), so the effects of oestrogens on food intake are likely to be throughboth peripheral and central effects.
Pregnancy
In simple-stomached mammals, there is increased food intake duringpregnancy to match the high nutrient requirements of large litters of fetuses. On
342 Chapter 16

the day of parturition, intake is very low as the mother prepares her nest andenters the first stages of labour.
Pigs
The pregnant sow tends to overeat and is usually fed at a restricted level toprevent over-fatness. The severity of the restriction, and the difficulty ofensuring that individuals in a group get their fair share, has engenderedsignificant criticism and a great deal of research.
The possibility of using a food with high fibre content to restrict pregnantsows’ intake has been investigated. In one experiment, six foods were formulatedto have equal digestible energy content, by including 650 g/kg sugarbeet pulp(SBP), 360 g/kg straw, 370 g/kg oat husk, 460 g/kg malt culms, 610 g/kg rice branor 670 g/kg wheat bran (Brouns et al., 1995). Five of these were eaten at 6–8kg/day, with the sows gaining weight excessively, but the food that included SBPwas eaten only at 2.3 kg/day, which gave a small weight loss. In a secondexperiment, voluntary food intake decreased from 5.0 to 3.0 kg/day when theinclusion level of SBP increased from 400 to 650 g/kg. The intake of SBP tendedto remain constant at 2.0 kg/day for all diets, suggesting that intake was limitedby gut capacity (see Chapter 11).
This prompted studies with a food containing 600 g/kg of unmolassed SBP,and it was confirmed that this allowed sows to be fed ad libitum throughoutpregnancy without becoming obese. Low-ranking sows are at a disadvantagewhen fed conventional food at a restricted level in a group, but not when fedad libitum on the beet pulp-based food. The rate of eating of this food is much
Reproduction and Lactation 343
–800
–400
0
400
0 5 15 20
Days
–1200
–1600
Cha
nge
in fo
od it
ake
(g/d
ay)
10
Fig. 16.1. Effect of continuous intravenous infusion of 73 (solid symbols) or 160 (opensymbols) �g �-oestradiol on the food intake of fat (squares) or thin (circles) adult wethersheep. The horizontal line at zero change of intake corresponds to intakes of 1600–1800 gDM/day; the vertical lines indicate the start and end of infusion (from Weston, 1996).

slower than that of a conventional diet. It was subsequently confirmed that the600 g/kg SBP can be fed ad libitum to gilts in their first pregnancy withoutexcessive weight gain. Such a feeding system reduces fighting amongst sows, aswell as preventing excessive weight gain, and is therefore thought to be goodfor the animals’ welfare.
Food intake of sows given ad libitum access to food containing 45% SBPincreased up to the sixth week of gestation and then decreased to parturition(van der Peet-Schwering et al., 2004), but there was no difference in intake of astandard food during lactation compared with sows given conventional food ata restricted level during gestation, nor were there differences in productiveparameters such as litter size and piglet growth. SBP is readily available inmany northern European countries, but not in many other parts of the world.In reviewing the whole subject of high-fibre diets for sows, Ru and Bao (2004)highlight the need for research into alternative sources of fibre for use in otherparts of the world.
In the last few days before parturition it might be expected that sows wouldbe more motivated to make a nest than to seek food. Hutson (1992) trainedsows to lift a lever to obtain straw, twigs, a portion of food or nothing. Justbefore farrowing, they lifted for food most frequently by a factor of 20–433times, demonstrating that motivation for food completely overshadows that fornesting materials. However, in two of the food-reinforced sows, the onset ofnest building resulted in complete cessation of responding for food. As in mostaspects of this subject, there are considerable between-animal differences.
Cattle
Although pregnant ruminants may increase their voluntary intake in mid-pregnancy, this increase is proportionately smaller than that which occurs in thepig, and often so small that it is not noticed.
There is often a noticeable decrease of intake in late pregnancy; Ingvartsenet al. (1992) presented a comprehensive table of 20 groups of cows from ninepublications showing changes of voluntary intake in late pregnancy rangingfrom an increase of 0.2%/week to a decline of 9.4%/week. In their ownobservations, heifers in the last 14 weeks of pregnancy reduced intake of acomplete food by 1.53% (0.17 kg)/week, with an even higher rate of decline inthe last 2 weeks, sometimes as much as a 30% reduction during the last 5–7days prepartum. In the last month of pregnancy, cows spend less time eatingthan those in early pregnancy or non-pregnant cows.
There is a significant correlation between the decline in the last 6 weeksbefore parturition and the birth weight of the calf, suggesting that limitation ofruminal capacity might be responsible for the decline, given the large volume ofabdominal capacity occupied by the fetus.
DM intake declines from about the 26th week of pregnancy in dairy heifersby 1.53% (or approximately 0.17 kg)/week until 3 weeks before calving (seeFig. 16.2). In a more recent study, in which the energy density of the dietremained constant during the last 168 days of pregnancy (Ingvartsen and
344 Chapter 16

Andersen, 2000), a similar decline was observed in the last 12 weeks ofpregnancy both in heifers and lactating cows when diet energy was high(11.6 MJ ME/kg of DM), while the decline was much smaller with lower-energyfoods (10.2 or 8.3 MJ ME/kg of DM). This is contrary to the hypothesis that thereduction of intake in late pregnancy is cause by physical compression of therumen by the uterus, and more in line with observations in non-pregnantruminants that intakes of concentrates are more severely affected by oestrogensthan those of forages (see above). It appears as if the role of physicalconstraints has been overemphasized in ruminants, and that metabolic andendocrine changes in late pregnancy also have a role in this dip in intake.
Many other authors have noted declines in intake, both of forage andconcentrates, but there is no need to list these as they are covered byIngvartsen and Andersen (2000) and in the first edition of this book (Forbes,1995).
Sheep
Small increases in intake in mid-pregnancy have been noted with grazing ewesand with ewes fed on hay. In some cases there is increased intake in mid-pregnancy in single-bearing ewes but not in those carrying twins. For example,Fig. 16.3 shows the intake of hay by ewes of the Speckle-faced Welsh breed.This figure also shows the decline in intake in ewes in the last few weeks beforeparturition (Forbes, 1968a).
Intakes of silage in the last 6 weeks of pregnancy by ewes with twins andmultiples were 86 and 81% of those with singles, respectively (Orr andTreacher, 1989), similar to the figures for good hay. With poor-quality hay orstraw, however, the differences were much greater (63 and 71%, respectively),suggesting that the quality of the forage food has an influence on the severity ofthe decline. However, some observations show that the fall in intake in the last
Reproduction and Lactation 345
0
4
8
12
16
20
–25 –20 –15 –10 –5 0 5 10 15 20 25
Time pre- or post-calving (weeks)
DM
inta
ke (
kg/d
ay)
Fig. 16.2. Voluntary intake of food by heifers (�) and cows (●) from mid-pregnancy to mid-lactation (from Ingvartsen and Andersen, 2000).

few weeks of pregnancy in ewes occurs both with medium and good forage tothe same extent, suggesting that there is a reduction in capacity to utilizeenergy. Voluntary herbage intake has also been noted to decline in latepregnancy, especially with twin-bearing ewes.
The fact that forage intake usually falls in late pregnant ewes has promptedthe practical use of concentrate supplements, given at increasing levels in the last6 weeks before parturition. This has often been practised in experiments as well,leading to uncertainty about the cause of the decline in forage intake. Forexample, increasing the rate of supplementation of silage from 400 to 600 to 800g/day over the last 6 weeks of pregnancy showed that silage DM intake declinedfrom 758 to 552 g/day in those ewes fed the concentrates once per day, from853 to 782 g/day in those given the supplement twice or thrice per day and from996 to 876 g/day in those animals for which the supplement was mixed with thesilage (Wylie and Chestnutt, 1992). It is not possible to apportion the cause of thedecline in silage intake between pregnancy and substitution for concentrates.
Fat ewes are particularly susceptible to declining voluntary intake in latepregnancy, and there is a greater reduction in intake of a standard food in latepregnancy in ewes that have been fed at a high level – or on good-qualitysilage – in mid-pregnancy compared with that of ewes on poor silage.
Prediction of intake
A model was developed to predict hay intake of pregnant ewes, linearized toenable the use of linear programming techniques:
HOMI = COMI(1.90 – 0.076WEEK – 1.87HOMD) + 2069HOMD – 88LS + 17.4LW – 1325 (16.1)
346 Chapter 16
13
14
15
16
17
8 10 12 14 16 18 20
Duration of pregnancy (weeks)
Foo
d in
take
(g/
kg b
ody
wei
ght/d
ay)
Fig. 16.3. Intake of hay by ewes carrying single (�) or twin (●) lambs between weeks 8 and20 of pregnancy (from Forbes, 1968a).

where HOMI is hay OM intake (g/day), COMI is concentrates intake (g/day),HOMD is hay OM digestibility (g DOM/g OM), LS is litter size and LW is bodyweight (kg) (Neal et al., 1985). Rations were formulated to include themaximum proportion of hay while remaining within the intake limits providedby the equation; requirements were calculated from ARC (1980). The modelwas validated by comparison with other experimental results and found toperform reasonably well but in general to predict lower voluntary intakes of haythan often observed, which the authors ascribe to the high level of wastage inmany large-scale experiments.
Similarly, Orr and Treacher (1989) compiled results from several of theirexperiments with pregnant ewes fed silage and produced the equation:
SOMI = 1063COMI + 2882SOMD – 3.20SOMD � COMI + 462WEEK –14.71WEEK � WEEK + 0.034WEEK � COMI + (16.2)1.92SDM – 71.7LS + 9.08W – 5516
where SOMI is silage OM intake (g/day), COMI is intake of concentrates(g/day), SOMD is OM digestibility of silage (g/g), WEEK is week of pregnancy,SDM is silage DM (g/g), LS is litter size, and W is body weight of the ewe8 weeks before lambing.
Causes of declining intake in late pregnancy in ruminants
Physical factors
It has been suggested that the commonly observed decrease in intake is due tothe compression of the rumen by the growing uterus, exacerbated byabdominal fat. The displacement of the rumen by the growing conceptus isgraphically illustrated by Forbes (1968b), who killed sheep at several stages ofpregnancy, froze the whole body, cut cross-sections of the abdomen andpresented photographs of mid-abdominal sections. There was a negativerelationship between the volume of ruminal contents at slaughter (RV, l) andthe volume of ‘incompressible abdominal contents’ (uterus plus abdominal fat,IAC, l) in ewes that had been fed on hay (Forbes, 1969a):
RV = 10.3 – 0.37IAC (P < 0.001, r = 0.51) (16.3)
Intake during the last 2 weeks before slaughter (FI, kg/day) was positivelyrelated to volume of ruminal contents at slaughter:
FI = 0.48 + 0.033RV (P < 0.01, r = 0.28) (16.4)
The decline in intake was proportionately less than that of ruminal volume,probably as a result of the increase in rate of passage. These relationshipsprovide no more than circumstantial evidence for a physical cause of thedecline in intake in late pregnancy.
Reproduction and Lactation 347

Endocrine factors
Even if physical competition has some effect on prepartum voluntary intake, itdoes not provide a complete explanation for the decline in intake because therehave been some observations of a decline when concentrates were the sole ormain food (Ingvartsen and Andersen, 2000); it is unlikely that physical factorswould have been dominant in the control of intake in these circumstances. Thedecline in intake by cows in the last 3 weeks of pregnancy was steeper for high-concentrate than for high-forage foods, which does not support a purelyphysical theory for depression of intake.
In view of the effects of oestrogens on food intake described above, andthe fact that oestrogen secretion by the placenta increases in the last few weeksof pregnancy to rates similar to or greater than that at oestrus, it has beensuggested that the late pregnancy decline in intake may be due entirely orpartly to oestrogens. Plasma oestrogen concentrations increase to around300 pg/ml during the first half of pregnancy in cows, and then remain steadyuntil about 1 month before calving, from which point there is a steady increaseto around 2000 pg/ml a week or so before parturition. In the last few days,levels reach 4000–6000 pg/ml. Thus, during the last week of pregnancyoestrogen dominates and is likely to be a major factor in the decrease in foodintake observed in late pregnancy. A highly significant negative correlation hasbeen reported between food intake and serum oestradiol-17� concentrations inewes in late pregnancy.
Progesterone blocks many of the actions of oestrogens, so Bargeloh et al.(1975) investigated the effect of progesterone on the decline of voluntaryfood intake in late pregnancy in cows. Progesterone at the level of0.25 mg/kg/day was given subcutaneously for 15 days before the expected dateof calving, and treated cows ate 17.1 kg DM/day in the last 6 days ofpregnancy compared with 11.7 kg DM/day for untreated controls. Pregnancywas prolonged in two out of the five treated cows, and such treatment cannotbe contemplated in commercial practice.
Metabolic factors
An imbalance between the nutrients required by the ewe and fetus(es) might beexpected to reduce food intake. To see whether a shortage of amino acidsand/or glucose were limiting intake in grass-fed pregnant ewes, Barry andManley (1986) infused glucose and casein into the abomasum. Voluntaryintake 4 weeks before lambing was increased by the infusion from 0.6 to 0.85MJ/kg0.75. Intake of the infused animals then declined in the last 4 weekswhereas that of non-infused control groups increased towards parturition, andthe authors suggested that the higher level of intake in the infused animalsrendered them more prone to the intake-depressing effects of pregnancy, whileintake of the non-infused controls was limited by the imbalanced diet ratherthan the effects of late pregnancy.
Other possible reasons for the decreased intake in late pregnancy – especiallythe very low levels in the last few days – include discomfort, preoccupation with
348 Chapter 16
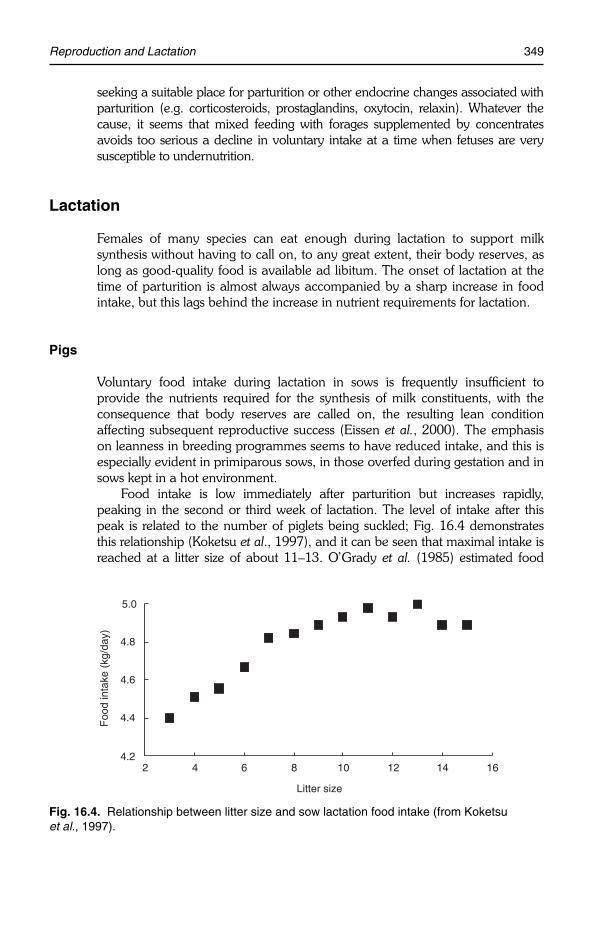
seeking a suitable place for parturition or other endocrine changes associated withparturition (e.g. corticosteroids, prostaglandins, oxytocin, relaxin). Whatever thecause, it seems that mixed feeding with forages supplemented by concentratesavoids too serious a decline in voluntary intake at a time when fetuses are verysusceptible to undernutrition.
Lactation
Females of many species can eat enough during lactation to support milksynthesis without having to call on, to any great extent, their body reserves, aslong as good-quality food is available ad libitum. The onset of lactation at thetime of parturition is almost always accompanied by a sharp increase in foodintake, but this lags behind the increase in nutrient requirements for lactation.
Pigs
Voluntary food intake during lactation in sows is frequently insufficient toprovide the nutrients required for the synthesis of milk constituents, with theconsequence that body reserves are called on, the resulting lean conditionaffecting subsequent reproductive success (Eissen et al., 2000). The emphasison leanness in breeding programmes seems to have reduced intake, and this isespecially evident in primiparous sows, in those overfed during gestation and insows kept in a hot environment.
Food intake is low immediately after parturition but increases rapidly,peaking in the second or third week of lactation. The level of intake after thispeak is related to the number of piglets being suckled; Fig. 16.4 demonstratesthis relationship (Koketsu et al., 1997), and it can be seen that maximal intake isreached at a litter size of about 11–13. O’Grady et al. (1985) estimated food
Reproduction and Lactation 349
4.2
4.4
4.6
4.8
5.0
2 4 6 8 10 12 14 16
Litter size
Foo
d in
take
(kg
/day
)
Fig. 16.4. Relationship between litter size and sow lactation food intake (from Koketsuet al., 1997).

intake to be related to litter size with a linear (0.22 kg/pig/day) and a quadraticresponse (�0.01 kg /pig2/day), giving a maximum food intake at a litter size of14 piglets.
The voluntary intake of lactating sows depends partly on the intake duringpregnancy and on fatness at parturition. The fatter the sow at farrowing the lessshe eats during lactation, so there is a higher intake during lactation in sowsthat have been restricted to about half of ad libitum during pregnancy than inthose given as much as they could eat. The lower food intake during lactationfollowing higher levels of feeding in pregnancy is accompanied by reducedmeal size rather than changes in meal number. Data from the literature havebeen compiled and are displayed in Fig. 16.5, from which this negativerelationship can be clearly seen. There are significant negative relationshipsbetween fatness and food intake, but with widely varying regression coefficientsin different studies, ranging from 19–129 g/day/mm of backfat thickness (Eissenet al., 2000). Likely causes of the intake-depressing effects of body fat are givenin Chapter 15.
Although concentrations in blood of NEFA during late gestation were notsignificantly affected by the feeding levels of rearing or gestation, those ofglycerol were significantly higher in fat sows. Levels of NEFA and glycerol werealways higher in fat than in lean sows in early lactation, but whether thesecause, or are caused by, the lower food intake of fat sows is unclear.
It has been suggested that high levels of food intake in pregnancy, and theresultant increase in body fatness, render the sow less sensitive to insulin(Eissen et al., 2000). Higher blood glucose concentrations will therefore arise
350 Chapter 16
2.5
3.0
3.5
4.0
4.5
5.0
5.5
6.0
6.5
1.0 1.5 2.0 2.5 3.0 3.5 4.0
Food intake during rearing or gestation (kg/day)
Foo
d in
take
dur
ing
lact
atio
n (k
g/da
y)
Fig. 16.5. Relationship between daily food intake during rearing (♦) or gestation (othersymbols) and voluntary feed intake during lactation of sows (compiled by Eissen et al., 2000).

after a meal, which may be more satiating, Additionally fat mobilization is likelyto be increased, providing more NEFA for oxidation, again a satiating factor. Ithas indeed been found that fatter sows are more glucose intolerant than thinsows during late gestation, with higher glucose and lower insulin concentrationsand a greater intolerance to glucose compared with lean sows. Immediatelyafter parturition, the rate at which glucose is cleared from the blood is muchslower for the fat sows, a symptom of insulin resistance.
Even the level of feeding during rearing can affect glucose tolerance duringlactation, fatter sows being more resistant to insulin and less tolerant of glucose inmid-lactation than similar sows fed less during rearing, and therefore leaner. Itseems, therefore, that impaired glucose clearance is more likely caused by bodycomposition at farrowing per se than by a high feeding level during the precedinggestation. The lower voluntary food intake of fat sows during lactation, comparedwith thin sows, could be concluded to be due to differences in glucose toleranceand insulin resistance.
Fatness at parturition can also affect the number of mammary secretorycells, so that fatter sows have a lower potential to secrete milk and thus a lowerrequirement for nutrients, leading to lower food intake than in leaner sows.However, this effect on litter growth rate has not been noted in all studies,suggesting that the number of secretory cells is not limiting milk yield in allcases.
Body protein reserves might also limit milk production and thus voluntaryintake. Gilts given a low-protein food (90 g/kg) in pregnancy ate almost 50%more in lactation if they were given a 180 g CP/kg food compared with thosegiven a food containing 120 g CP/kg (Mahan and Mangan, 1975), whileothers given a high-protein food (170 g CP/kg) in pregnancy ate only 5% morewhen given the higher-protein food in lactation, i.e. those protein-restrictedduring pregnancy were trying to regain the lost body protein.
Providing a high-protein food during gestation has been shown to increasefood intake during lactation, while a high-protein lactation diet can alsoincrease voluntary food intake. It seems, therefore, that low body proteinreserves may limit voluntary food intake through a constraint on milkproduction of sows during lactation. This is likely to be a limiting factor only forfood intake, however, when the protein supply of the lactation diet is notoptimal in relation to the body composition of the sow.
The pattern of intake during lactation follows that of milk yield, rising forthe first 4 weeks and then declining, even though milk yield remains high. Thedecline might be caused by the increasing fatness that often occurs, but thisdoes not happen with modern genotypes that have a greatly reducedpropensity to fatten compared with those of a decade or more ago (seeChapter 15). It is acceptable to feed ad libitum from farrowing onwards.
In a summary of results from many sources, there was an average foodintake for sows during lactation of 5.17 kg/day, with gilts consuming 15% less(NRC, 1987). However, there is considerable variation about this mean,10–12% of gilts and 3–4% of sows eating < 3 kg/day. There are oftenfluctuations in intake during lactation, and a consistent reduction between days10 and 15 after parturition has been observed in one study.
Reproduction and Lactation 351

Environmental temperature
Given the large amount of heat produced by the very high rate of metabolismof lactating sows, it is not surprising that they are particularly susceptible to highenvironmental temperatures. Typically, a 1°C increase in temperature depressesintake by 0.1 kg/day. In one particular situation, an increase in environmentaltemperature from 18 to 28°C decreased voluntary food intake by 40%, whilegoing from 20 to 30°C depressed intake by 43% (Messias de Bragança et al.,1998). In these cases, sows kept at 20°C and fed a similar amount of food tosows fed ad libitum but kept at 30°C had a higher litter pre-weaning weightgain, explained by the reduction in milk yield at high temperatures, andprobably due to diversion of blood to the skin for the purpose of increasedcooling.
Parity
Food intake by sows increases up to parity 6 or 7 (NRC, 1987). Sows in theirfirst lactation eat significantly less than in subsequent lactations but this can beincreased by providing a high-protein diet, whereas this is not the case formultiparous sows, probably a reflection of higher maternal protein requirementsof primiparous sows; however, lower protein body reserves of primiparous sowsmay also play a role (Eissen et al., 2000). Bear in mind that litter size alsoincreases with parity number, so there is confounding. In addition, body weightalso increases with age, resulting in increased maintenance requirements drivinga higher food intake.
Prediction of intake
For lactating sows, intake increases up to day 17 but then declines (NRC,1987), approximately in line with the pattern of milk yield:
DEI = 56012 + 2491DAY – 7.19DAY2 (16.5)
This prediction should be adjusted for environmental temperature:
Percentage change in DEI = 0.0165(To – EAT) (16.6)
where To is the optimal temperature and EAT is effective ambient temperature:
EAT = 0.065DBT + 0.35WBT (16.7)
where DBT is dry bulb temperature and WBT is wet bulb temperature (°C).Although nutritional and management practices have been suggested to
alleviate the problem of low intake in lactation, an additional way would be bymeans of appropriate breeding programmes. A heritability of 0.19 has beenestimated for voluntary food intake of lactating sows, so intake can be changedby selection. Sows selected for low daily food intake eat less than those selectedfor high intake, despite a leaner body composition and the fact that within agenotype intake is negatively related to fatness.
352 Chapter 16

Cattle
Cows normally eat their fetal membranes, sometimes before they are fullyseparated.
Intake is invariably higher in lactating cows than during pregnancy, or incomparison with non-lactating cattle. The nutrient requirements for lactationare up to five times the maintenance requirement. This high demand fornutrients may, by removing metabolites rapidly from the blood, reduce the levelof stimulation of chemoreceptors, so that physical limitation assumes greaterimportance than it does in similar, but non-lactating, animals. Voluntary intakeusually increases rapidly after calving, but often this increase is slower for cowswith abnormalities of various sorts, especially when fed silage rather than hay;this delay is not so severe with maize silage as with grass silage. Once thetrauma of calving is over, voluntary intake increases, but usually at a slowerrate than necessary to support the rapidly increasing demands of the mammarygland. Examples of patterns of intake from 2 to 20 weeks of lactation of cowsfed on silage are shown in Figs 14.1 and 16.6.
That intake increases after calving is not surprising. The fetus and fetalfluids occupy some 70 l in the parturient Holstein Friesian cow, and the suddendisappearance of this bulk allows for a large increase in the capacity of thedigestive tract, particularly the rumen. Therefore, if intake is limited primarilyby physical mechanisms, a large and rapid increase would be expectedimmediately after calving. However, the increase that invariably takes place ismuch slower than could be explained by this simple physical mechanism.While milk yield usually peaks at around 7 weeks after calving, voluntary intakereaches its highest level up to 22 weeks post-calving.
Reproduction and Lactation 353
12
15
18
21
0 5 10 15 20
Time post-calving (weeks)
Foo
d in
take
(kg
DM
/day
)
Fig. 16.6. Intake of hay by lactating cows that were either fat (F, condition score (CS) 3.5) orthin (T, CS 2.0) at calving and supplemented with concentrates that were either high (H, 74g/kg DM) or low (L, 45 g/kg DM) in undegradable protein; ●–––●, FH; ●- - - -●, FL; �–––�, TH;�- - - -�, TL (from Garnsworthy and Jones, 1987).

The limitation on intake assumes greatest importance with high-yieldingdairy cows. The rapid increase in requirements during the first few weeks oflactation is not usually matched by such a rapid rise in voluntary intake, andthis lag is longer with forages and with heifers than with cows. Heifers areparticularly susceptible to low intake of poor foods.
Body condition
Fat cows eat less silage and lose more weight than thinner ones in earlylactation, and cows fed at maintenance level during the dry period eat about10% more during the first 4 months of lactation than those fed at 1.8 ofmaintenance during the dry period. There is, however, no difference in milkyield and the need to ‘steam up’ (give extra supplementary feeding) beforecalving is questioned. However, cows that have become very thin duringlactation should be fed in order to build up some reserves during the dryperiod.
Cows that were thin at calving (condition score (CS) 2.15 or 2.00) hadtheir intake of hay reduced by a high level of UDP in the concentrate, whileintake by fat cows (CS 3.15 or 3.50) was increased by such a supplementcompared with that by a concentrate low in UDP (Garnsworthy and Jones,1987; Fig. 16.6). It is possible that the fat cows could utilize the additionalprotein by mobilizing fat to provide energy to balance the increased proteinsupply.
Moreover, thin cows given a high-energy food (13.0 MJ/kg DM) ate morethan fat cows and produced the same amount of milk (Jones and Garnsworthy,1989). When a poor-quality food (9.8 MJ/kg DM) of the same crude proteincontent (180 g CP/kg DM) was given, intake was not affected by bodycondition, with the result that thin cows produced significantly less milk; thiswas suggested to be due to physical limitation of intake, but it is difficult toagree with this in view of the evidence that thin animals have a higher ruminalcapacity (see Chapter 15).
The level of feeding before calving did not affect intake in the work ofCowan et al. (1981), but a lactation diet containing 147 g CP/kg DM gavehigher intakes than one containing 111 g. The increased intake with the higher-protein food was greater when it contained 40% forage than for a 60% foragefood.
Heritability of food intake in cattle
There are large individual variations in intake of cows of similar milk yieldsthat are consistent throughout lactation, suggesting that efficiencies differgreatly between cows. Heritabilities have been estimated as: milk yield, 0.20;fat and protein yield, 0.15; live weight, 0.34; dry matter intake, 0.52;efficiency, 0.13. This shows that responses in efficiency following selection forfat and protein yield will be only 47–74% as great as those selected directly forefficiency, i.e. if the selection objective is to improve efficiency then achieverecord intake!
354 Chapter 16

Prediction of food intake by dairy cows
There has been major interest in predicting intake for the lactating dairy cow:Conrad (1987) has summarized the prediction of food intake by dairy cows underNorth American conditions, while the review of Forbes (1988b) describes the UKsituation. Prediction of intake of silage, including some examples from dairy cows,is covered in Chapter 14. The chapter on predicting feed intake in the book byChamberlain and Wilkinson (1996) is especially useful as a practical guide.
Although the curves of milk yield and voluntary food intake of cows duringearly lactation are approximately parallel there is usually a lag in voluntaryintake, and simple regression is not adequate to describe the relationship. Thegoodness of fit has often been found to be improved by inclusion of a term forthe stage of lactation. Cows are usually given supplementary feeding duringlactation, and this invariably depresses forage intake; concentrate allowance istherefore a useful additional term to include in prediction equations. Intake isoften more closely related to live weight than it is to milk yield, so live weight isoften included as a predictive variable.
An approximate prediction of intake by dairy cows, taking live weight andmilk yield into consideration, is provided by:
DMI = 0.025LW + 0.1MY (16.8)
or, for high-yielding cows
DMI = 0.022LW + 0.2MY (16.9)
(Ministry of Agriculture, Fisheries and Food (MAFF), 1975), where DMI is totalDM intake (kg/day), LW is live weight (kg) and MY is milk yield (kg/day).
A large set of data was assembled from 385 cows in 26 experiments at fivesites (Vadiveloo and Holmes, 1979). Of the many regression models fitted, theone that explained most variation was their equation 2:
FDMI = 0.015LW + 0.21MY – 0.57C – 0.095WL + 4.04logWL – 4.14 (16.10)
where FDMI is forage DM intake (kg/day), C is the amount of concentratesupplement (kg/day) and WL is the week of lactation. The constant for milk yield issimilar for equations MAFF (1975) and to the ME requirement for milk secretion,and suggests that cows can adjust intake quite well to compensate for increasedenergy requirements when fed supplements according to recommendations.
In a comprehensive study by Rook et al. (1991), data from 251 lactations ofcows fed 14 different silages were used for prediction. Concentrates were givenat flat rates not closely related to milk yield. Data from 192 lactations on 15silages were used for validation. Five food variables were available and, with thissmall number of variables, no problems of co-linearity amongst them werefound. The negative relationship between level of concentrate supplementationand silage intake was linear over the range of conditions studied, with acoefficient (i.e. substitution rate ) of –0.39 kg/kg.
Live weight was best handled by using post-calving weight as an index offrame size, and deviations from this as an index of body condition change. Better
Reproduction and Lactation 355

prediction was obtained using yield of milk fat plus protein than simply milk yield,milk fat or milk energy. There were no important effects of silage compositionvariables. The best model (equation 6 of Rook et al., 1991), overall, was:
I = –3.74 – 0.39CDMI + 1.49(MF + MP) + 0.007LW (16.11)
where I is silage intake (g DM/day), CDMI is concentrate allowance (kgDM/day), MF is milk fat (g/kg), MP is milk protein (g/kg) and LW is live weight(kg). This equation gave an MSPE for weeks 3–9 of 1.88 (kg/day)2 and, forweeks 10–20, 1.52 (kg/day)2. At 17 and 15% of mean intake, these MSPEswere better than those of Vadiveloo and Holmes (1979) (19 and 16% for earlyand mid-lactation, respectively).
There was greater variation in intakes in early lactation than later on, andimprovement was obtained by considering weeks 3–9 separately and fittingtime effects explicitly. The comprehensive equation for weeks 3–9 (equation 7of Rook et al., 1991) was:
I = –4.28 – 0.46CDMI + 1.44(MF + MP) + 0.006PCLW + 0.01LWD – 0.0002LWD2 – 0.005NH3-N + 0.012DOMD + (16.12)0.77WL – 0.04WL2
(MSPE 2.12 (kg/day)2)
where PCLW is post-calving live weight (kg), LWD is live weight deviation frompost-calving weight (kg), NH3-N is ammonia nitrogen (g/kg N), DOMD isdigestible organic matter in the dry matter (g/kg DM) and WL is week oflactation; while for weeks 10–20 (equation 8 of Rook et al., 1991) it was:
I = –57.7 – 0.48C + 3.09(MF + MP) + 0.006PCLW + 0.011LWD –0.00003LWD2 + 0.184DOMD – 0.0001DOMD2 (16.13)
(MSPE 1.74 (kg/day)2)
However, there was discontinuity between these models of the two stagesof lactation and discrepancy in prediction of intake at the intersection (9–10weeks of lactation). The remaining error was due mainly to random variationrather than consistent bias, and suggests that emphasis should be given toobtaining more and better data rather than developing more sophisticatedmodels. It was speculated that great improvements in prediction should not beexpected, as for groups of animals it was probably much better than forindividuals. Investigation of the lag between change in milk yield and change inintake, and possibility of autocorrelation between successive weeks, did notyield any improvements in the models. The authors suggest that specificmodels for different situations be developed rather than a global equation.
Roseler et al. (1997a) developed new equations using predictive variables thatcan easily be measured under commercial conditions: parity, milk yield, milk protein,body weight (BW), BW change, days pregnant, ambient temperature, relativehumidity and night cooling. Their predictions were compared with independent datasets. A simplified prediction equation of DMI for farm application based on milkprotein yield and BW at calving, with adjustments for ambient temperature for earlylactation, gave an MSPE of 2.75 kg2/day with an R2 of 0.84 for multiparous cows:
DMI = 8.4 + 0.006 calving BW + 12.2 Milk protein kg/day (16.14)
356 Chapter 16

The authors emphasize that the equations they developed must be used insituations close to those in which they were developed, in this case one inwhich Holstein cows are fed highly digestible diets because dietary fill effectsare not considered.
In early lactation it is common for cows to mobilize body reserves thatsubstitute for ingested food, and later in lactation to replenish these reserves byeating more than required for maintenance and lactation.
The importance of live weight change as one of the predictors of intakewas realized by Bines et al. (1977), whose equation for heifers was:
DMI = 0.16MY + 2.45LWC + 0.011LW + 4.25 (16.15)
where LWC is live weight change (kg/day).However, live weight change is difficult to measure over short periods in
ruminants, and its interpretation is uncertain due to short-term effects of gutfill. Also, there is considerable uncertainty in most situations as to whethermobilization is the cause or the effect of a change in food intake.
Curran et al. (1970) found that, for cows in the first 4 weeks of lactation,live weight did not contribute usefully and the best equation was:
DOMI = 0.22LWC + 0.64CDM + 4.6D – 0.17MY + 0.003MY2 – 6.8 (16.16)
where DOMI is digestible organic matter intake (kg/day), LWC is live weightchange (kg/day), D is digestibility (g/kg) and MY is milk yield (kg/day), with alimit of prediction for a single cow of 13%.
The list of independent variables to be included to obtain the best correlationvaried at different stages of the investigation, demonstrating the inadequacy of thisapproach to the general prediction of intake. The predominance of digestibility asa predictor in these equations demands that this parameter be known (orpredicted with accuracy), and this is not feasible in practice; in the work of Curranet al. (1970), digestibility was estimated from regressions equations based on dataof dry cows and wether sheep. These authors concluded that: ‘… attempts topredict the intake of single cows are unlikely to be worthwhile in practice … butthe mean intakes of groups of 30 similar cows could be predicted with anacceptable level of accuracy for practical applications’. Note that the constant forLWC is more than ten times greater in the equation of Bines et al. (1977) than thatof Curran! This gives some idea of the scale of the problem of incompatibilitybetween different publications using the empirical approach.
Prediction will be much better if previous records are available fromindividuals or groups of animals. While typically this would be milk productionand live weights in previous lactations, intake and efficiency recorded for a fewweeks in early or mid-lactation are well correlated with these measures over thewhole of the same lactation. Regression of food intake over the first 38 weeks oflactation on intake measured over shorter periods within that time showedintake in weeks 5–10 of lactation to be highly correlated (R2 = 0.76) with intakeover the whole 38 weeks (Simm et al., 1991). Thus, it is possible to monitorintakes for a short period (e.g. using the LUCIFIR system, see Chapter 2) and touse these in the index for selecting heifers for a breeding programme.
Reproduction and Lactation 357

Comparison of prediction equations
A comprehensive comparison of prediction equations for dairy cows is that ofNeal et al. (1984). These authors have used data collected over a period of 9years from British Friesian cows fed silage ad libitum plus various supplements,to compare with the predictions of seven equations.
1. Equations 16.8 and 16.9 (MAFF, 1975).
2. Equation 16.10 (Vadiveloo and Holmes, 1979, equation 2).
3. Equation 16.15 (Bines et al., 1977).
4. TDMI = [0.135LW0.75 + 0.2(MY – Y5000[n])] M (16.17)
where Y5000 is the average milk yield for week n with a total lactation yield of5000 kg and M is the adjustment for the month of lactation (ARC, 1980).
5. Equation 14.2 (Vadiveloo and Holmes, 1979, equation 1).
6,7. Equations 14.3 and 14.4 (Lewis, 1981).
Actual and predicted weekly intakes were compared by calculating the meansquare prediction error (MSPE):
MSPE = 1/t sigma(A – P)**2 (16.18)
where A is the actual intake and P the predicted intake. When the observedweekly live weights were used, both equations 1 and 2 of Vadiveloo andHolmes (1979) and that of Lewis (1981) gave the least MSPEs. Table 16.1includes the MSPEs for nine widely quoted equations, from the work of Neal etal. (1984), Rook et al. (1991), Roseler et al. (1997a) and Keady et al. (2004),each of which used different data for validation.
Many farms have no facilities for weighing cows; when the estimatedweight after calving was used, together with notional live weight changes,equation 1 of Vadiveloo and Holmes (1979) was the best. All the equationsthat gave the best predictions were those derived from cows kept in similarconditions to those used for this comparison; they all also included some aspectof food quality, though only that of Lewis (1981) specifically incorporatedindices of silage quality, and Rook et al. (1991) found little advantage inincluding silage characteristics in prediction equations for dairy cows.
Those equations that have no term for stage of lactation have high MSPEsin early lactation when intake is lower than expected. Least MSPE in thecomparisons of Neal et al. (1984) was 1.8 kg DM2/day for heifers and 2.2 kgDM2/day for cows when weekly live weights were used; this lack of accuracy isa cause for concern but, in view of the complex factors affecting and controllingintake, it is doubtful whether further empirical investigations will be of benefit.
In a test of accuracy and robustness of seven prediction equations for USconditions, it was found that most MSPEs for mean DM intake of groups of animalswere > 10% of the mean, while for individual cows all MSPEs were > 20% of theobserved mean (FuentesPila et al., 1996). Similarly, six equations were assessedand all found to predict intake poorly, at least at some stages of lactation (Roseler etal., 1997b). The equation with the best accuracy (MSPEs of 15.6, 12.9, 7.9, 5.3
358 Chapter 16

and 6.3 kg2/day for multiparous cows for weeks 1–9, 10–24, 25–36, 37–48 and49–60, respectively) was the modified equation of the NRC (1989):
DMI (kg/day) = –0.293 + 0.372 � FCM (kg/day) + 0.0968 � BW0.75 (kg) (16.19)
However, the overall mean bias (predicted minus observed) of theprediction of weekly DMI of a single cow was high for all equations. The meanbias for the NRC equation was +6, +3.4, –1.3, –2.1 and –2.8 kg/day forweeks 2, 4, 8, 10 and 20 of lactation, respectively.
Bovine somatotropin (BST)
With the development of genetic engineering it has become possible to producelarge quantities of a bovine growth hormone analogue, called bovinesomatotropin (BST), which stimulates milk yield when administered to cows. Theresults of short-term trials indicated that this is not accompanied by increasedfood intake; indeed, initially there is a tendency for food intake to decrease. It hasbeen demonstrated that the energy for the extra milk comes initially from fatmobilization, but that food intake starts to rise after about 2 weeks of treatmentand does not decline as rapidly as in untreated cows in mid-lactation.
Long-term experiments have often been confounded by the practice ofchanging the composition of the food depending on the milk yield of the cows,making it difficult to know what the effect of BST is on voluntary intake. Forexample, Bauman et al. (1984) treated cows with bGH or BST for 188 days,starting 84 days after calving. Intake of a complete food remained higher thanfor control cows from about the fourth week of treatment. However, the quality
Reproduction and Lactation 359
Table 16.1. Mean square prediction errors (MSPEs) for equations predicting the voluntaryintake of cows, compared with independent data (from Neal et al., 1984; Rook et al., 1991;Roseler et al., 1997b; Keady et al., 2004).
Source Equation MSPE (kg DM/day)2
From Keady From Neal et al. (1984) et al. (2004)
All Adult Weeks cows Heifers cows 10–26
Vadiveloo and Holmes (1979) (equation 1) 14.2 2.1 2.1 2.2 1.74 2.9
Lewis (1981) 14.3, 14.4 2.5 2.0 2.8 2.11 5.5MAFF (1975) (average yield) 16.9 3.3 2.7 3.7 3.05Agricultural Research Council
(ARC, 1980) 16.18 3.5 3.5 4.3 5.75Rook et al. (1991) (equation 8,
weeks 3–9 ) 16.13 1.74 Milligan et al. (1981) 14.5 8.9Dulphy et al. (1989) 14.7, 14.8, 14.9 11.4Oldham et al. (1998) 14.6 10.8Roseler et al. (1997a) 16.15 2.75

of the food was adjusted according to the quantity of milk production so thatthe BST-treated cows, by producing more milk, were fed more digestible,higher-energy food than controls, which would be likely to result in increasedintake (see Chapter 11).
In another experiment, in which control and bGH-treated identical twincows were offered the same freshly cut grass, after 8 weeks of treatment controlcows ate 15.5 kg DM/day while twins given 50 mg bGH/day ate 16.7 kgDM/day; in the 22nd week of treatment the intakes were, respectively, 15.4 and17.5 kg DM/day (Peel et al., 1985).
Sheep
After lambing there is a slow rise to a peak, trailing behind milk yield, so thatweight loss is common, particularly with poor-quality foods. This lag is longerwith forage diets than with concentrates. Peak intake is normally seen at weeks4–6 of lactation. For a range of foods, lactating ewes ate more than wethers, evenwith diets low in digestible energy concentration where there was a positiverelationship between digestibility and intake, implying physical limitation tointake. This makes sense only if we propose that increased nutrient demandallows the animal to accommodate a greater degree of gut fill, as envisaged bythe MTD hypothesis (see Chapter 10).
Forbes (1969b) recorded the voluntary intake of hay and the milk yieldduring the first 7 weeks of lactation in Speckle-faced Welsh ewes, 11 with singlelambs and four with twins. Mean hay intake over the period of observation (I,kg DM/day) was positively related to milk yield (MY, kg/day) and live weightchange (LWC, kg/42 days):
I = 0.76 + 0.5MY + 0.03LWC (16.20)
The weight gain of the lambs from 2–7 weeks of age (WG, kg/day) waspositively related to the hay intake of the ewe (kg/day):
WG = 0.17I + 0.05 (16.21)
Although lamb weight gain was probably dependent on milk yield, it is notcertain whether milk yield determines intake or vice versa; almost certainly thetwo are interdependent.
During lactation, thin ewes eat more than fat ones, in proportion to thedifference in rate of disappearance and extent of digestion of the food (Cowanet al., 1980):
I = (54 – 1.2BF)/(MRT(1–DMD)) (16.22)
where I is the intake (kg DM/day), MRT is the mean retention time of particles(h), BF is body fat (kg) and DMD is the DM digestibility. This might be taken asevidence to support the idea that low intake in early lactation is due to physicallimitation, but the fat effect could equally be a metabolic phenomenon (seeChapter 15).
Other reasons for the lag in intake might be slow metabolic adaptation toincreased nutrient requirements and hypertrophy of the digestive tract and
360 Chapter 16

liver; there is no sound information on likely maximum rates of hypertrophy ofthese tissues, although it has been suggested that the potential for hypertrophygreatly exceeds the observed rate of increase in intake (Forbes, 1986a).
Another possible reason for the slow increase of intake in early lactation isslow recovery from the effects of endocrine changes in late pregnancy.Although short exposure to small doses of oestrogens has a reversible effect onvoluntary intake (see above), more severe treatment can have long-lastingeffects. When moderately fat dry ewes were injected with a high dose of 17�-oestradiol (10 mg) on 2 consecutive days there was a 60% decrease inintake of a pelleted diet, which took at least 2 weeks to recover to pre-treatmentlevels (J.M. Forbes, unpublished observations). Extremely high rates ofoestrogen production that might have this sort of effect occur in the last fewdays of pregnancy. The hypothalamus of cattle seems to be very sensitive tooestradiol in the first few weeks of lactation.
Clearly, further work is required to elucidate the usual lag betweenincreasing nutrient demands and the increase in voluntary intake in earlylactation; it is unlikely that the answer to this question will be a simple one.
From a series of eight experiments, each with 48 ewes, Bocquier et al.(1987) derived the equation:
HDMI = 346 ± 58A ± 45B + 672W – 28.9WEEK � WEEK – 1.53EC + 12.8EBW + 39.9EBWC + 1.72LGR – 1.28NDF – (16.23)0.55W � NDF + 0.002EC � NDF – 0.07W � EC
where HDMI is hay DM intake (g/day), A = + for mature, – for old ewes, B = +for Romanov cross ewes, – for Limousines, EC = concentrate allowance (g/day),EBW = ewe body weight at lambing (kg), EBWC = ewe body weight changeduring lactation (kg/6 weeks), LGR = litter daily gain from 7–28 days (g/day) andNDF = neutral detergent fibre content of hay (g/kg DM). Despite the complexityof this equation, it accounted for only 53% of the variation in hay intake.
The Laying Hen
The nutrient requirements for egg-laying place a great demand on the hen’smetabolism and, not surprisingly, laying hens eat much more food than thosenot in lay. It is normal for eggs to be laid on consecutive days, with a singlenon-laying day separating the ‘clutches’. Modern breeds have long clutchesand produce more than 300 eggs/year. Mean egg production is correlated withfood intake between groups of birds with different rates of production (see Fig.16.7), and high-producing birds gain less weight (Ivy and Gleaves, 1976).Between individuals there is a positive correlation between food intake andshell thickness and between the weight of the egg and food intake on the sameday, but it is not clear which is cause and which is effect.
Laying birds eat more on egg-forming days than on non-egg-forming days,presumably in response to the increased requirements for nutrients when eggconstituents are being deposited. For 2–3 h before oviposition the following
Reproduction and Lactation 361

morning feeding activity is depressed, as the hen is occupied with pacing orsetting. In broiler hens kept in continuous light, food intake is also lower duringthe hour or two before oviposition, and intake increases markedly for a shortperiod afterwards. Perhaps compression of the gastrointestinal tract by the egginhibits feeding just before oviposition.
There is also a depression about 32 h before oviposition, which isapproximately the time of release of luteinizing hormone, and an increasearound ovulation and for several hours after entry of the egg into the uterus;this latter change may be related to the demands for calcium for deposition ofthe shell (see Chapter 12). The increase in food intake that occurs afterovulation is accompanied by increased intake of oyster shell (a source ofcalcium), and so is the peak 20–22 h later (Mongin and Sauveur, 1979).
At normal environmental temperatures around 21°C, hens ate 116.6 g onegg-forming days and 102.2 g on non-egg-forming days (Morris and Taylor,1967; Fig. 16.8). At 30°C, intakes were 100.9 g and 78.6 g, respectively. Whenintakes from 09.30 to 14.30 were examined, it was seen that on egg-formingdays it was 23.2 g while on non-egg-forming days it was 19.7 g. Intakes from14.30 to 09.30 the next morning were 101.8 g and 75.3 g, respectively, a truereflection of the effect of egg formation. These authors speculated that it isprobably the increase in protein requirements to support the albumen depositionthat is responsible for this effect of egg-laying on voluntary intake by the hen.
Prediction of food intake
For laying hens in controlled environments, where the temperature range is notlarge, the following equation was found to be satisfactory for individually cagedlayers:
MEI = (3.14 – 0.031T)LW0.75 + 33WC + 9.6EM (16.24)
362 Chapter 16
60
80
100
120
140
160
0 25 50 75
Egg production (%)
Foo
d in
take
(g/
day)
Fig. 16.7. Food intakes of hens at four levels of egg production offered foods of three energyconcentrations: �, 8.4; �, 10.5; ●, 12.5 MJ ME/kg (from Ivy and Gleaves, 1976).

where MEI is the ME intake (kJ ME/bird/day), T is the ambient temperature(°C), WC is the weight gain (g/bird/day), EM is the egg mass (g/bird/day) andLW is the live weight (g) (Byerly, 1979).
A survey of the literature for experiments relating intake by hens to dietdigestibility provided data from which was derived the equation:
EI = Y11.3 + (0.000547)Y11.3 – 0.147(DIETE – 11.3) (16.25)
in which EI is energy intake (kJ/bird/day), Y11.3 is the intake of a food with11.3 MJ ME/kg and DIETE is the ME content of the food in question (MJ/kg)(Morris, 1968b).
Under US conditions:
MEI = W0.75(173 – 1.95T) + 5.50WC + 2.07EE (16.26)
where MEI is ME intake (kJ/day), T is ambient temperature (°C), WC is changein weight (g/day) and EE is egg production (g/day) (NRC, 1984b). Thisassumes a nutritionally balanced food with an ME concentration typical ofnormal commercial practice.
Conclusions
Reproductive status can have a marked effect on food intake in the female. Atoestrus, intake is often temporarily depressed by the oestrogens secreted by theovaries, but it is not clear the extent to which this is a direct effect on the brainor to a change in metabolism in liver, muscle and adipose tissue. In sows,intake increases in pregnancy which would – unless prevented by restriction offood allowance – result in gross deposition of fat.
In the last few weeks of pregnancy there is often a decline in intake inruminants, probably caused by competition for space in the abdomen and by
Reproduction and Lactation 363
0
30
60
90
120
150
180
1 5 9 13 17 21
Days
Foo
d in
take
(g/
day)
Fig. 16.8. Daily food intake of a laying hen in relation to egg formation. White bars, egg-formingdays; black bars, non-egg-forming days (from Morris and Taylor, 1967).

the increasing oestrogen secretion by the placenta. On the day of parturitionvery little is eaten, but then intake increases at the start of lactation. In cowsand ewes this increase is not usually fast enough to keep pace with the increasein milk yield, as a result of which body reserves are mobilized. After the peak oflactation, the level of voluntary intake stays high and reserves are replenished.
There is a rhythm of food intake in the laying hen related to therequirements for deposition of the components of the egg. It is not clearwhether this is dependent on the changing requirements for different nutrientsat different times of day, or to the changing hormone levels that accompanythese fluctuating requirements. Hens eat less on days in which an egg is notbeing formed and, over a longer period, intake is proportional to the numberof eggs laid.
364 Chapter 16

17 Environmental FactorsAffecting Intake
This chapter considers intake responses to changes in temperature, photoperiod,the social environment, housing and feeding conditions, and disease. These areall external factors that are not directly associated with the characteristics of thefood(s) on offer or with the genetic make-up of the animal. In many cases,however, there are interactions between food and intrinsic and environmentalfactors, so all of the features of the control of intake, and factors affecting it,covered in previous chapters must be borne in mind.
Environmental Temperature
Unless otherwise stated, the term environmental temperature will refer to theeffective ambient temperature, which is the actual temperature modified by theeffects of humidity, wind and rainfall. Above the thermoneutral zone, bodytemperature rises and so food intake decreases in order to reduce the heatproduction associated with feeding, digestion, absorption and metabolism, inan attempt to prevent an excessive increase in body temperature. Below thethermoneutral zone, heat production must increase in order to maintain bodytemperature, and intake rises to provide substrates for this increased heatproduction.
Poultry
Feeding behaviour is erratic at very low temperatures and few data are availableon the quantitative responses. Below an optimum temperature, which dependson the size and feathering of the birds, food intake increases and the efficiencyof conversion into body weight gain declines; above this temperature, foodintake and growth are depressed. For broilers in the later stages of growth, this
© J.M. Forbes 2007.Voluntary Food Intake and Diet Selection 365in Farm Animals 2nd Edition (J.M. Forbes)

optimum temperature for efficiency is 21°C. A similar temperature is optimumfor growing pullets and for laying hens. Every 1 degree of increase between 25and 34°C results in a 1.0–1.5 g/day decline in food intake by laying hens; above35°C the decline is greater.
In a detailed experiment (Cooper and Washburn, 1998), individual broilerchickens were monitored from 28–49 days in environmental temperatures of32 and 21°C. After 7 days, body temperature was significantly higher at 32°C,with the difference between environments ranging from 0.5–1.0°C. While thecorrelations between body temperature and food intake were mostly low andnot significant in the cooler environment, in the hot environment bodytemperature was significantly correlated with food consumption.
More generally useful results can be obtained from an experiment involvingseveral temperatures, rather than just two as in the previous example. May etal. (1998) applied five treatments from 23 to 31°C to broilers from 21–49 daysold. Figure 17.1 shows food intake plotted against environmental temperatureat seven body weight points. While intake is hardly affected by temperaturewhen the birds weighed 600 g, by the time they were approaching slaughterweight (2–5 kg) there was a large depression in intake, from a level of around215 g/day at 23°C to about 180 g/day at 31°C.
These results emphasize the difficulty of maintaining maximum growth rateright up to the time of slaughter, as house temperature usually increases withbody weight given the fixed stocking density normally adopted in commercialbroiler production.
In broiler chicks, the depression of food intake and growth at high environ-mental temperatures can be partially reversed by supplementing the diet withascorbic acid (vitamin C). Plasma corticosterone is reduced during suchtreatment, water intake increases and body temperature falls. Birds can be trainedto know the difference between supplemented and unsupplemented foods, andare then able to select their desired intake of ascorbic acid (see Chapter 13).
366 Chapter 17
80
100
120
140
160
180
200
220
22 23 24 25 26 27 28 29 30 31
Environmental temperature (°C)
Foo
d in
take
(g/
day)
Fig. 17.1. The effect of environmental temperature on food intake of broiler chickens for arange of different body weights at the start of exposure. Body weight: ●, 600 g; �, 900 g;�, 1200 g; ♦, 1500 g; �, 1800 g; ▫, 2100 g; �, 2400 g (from May et al., 1998).

For laying hens, food intake is negatively related to environmentaltemperature between 5 and 30°C. Below the optimum temperature of 21°C,egg numbers decline but the increased food intake is driven by the increase inheat production necessary to maintain a constant body temperature. Above21°C food intake is depressed to prevent an increase in body temperature, andegg production suffers.
Pigs
Growing pigs
The temperature above which voluntary intake is depressed varies with the sizeof the animal. Younger or thinner pigs have a greater surface:weight ratio andcan more easily get rid of excess heat than older or fatter animals. Thus, at anygiven temperature above the thermoneutral zone, intake by heavy pigs isdepressed relatively more than that of lighter pigs.
When the effective environmental temperature is below that required formetabolic comfort, energy demand for cold thermogenesis increases and thisleads to higher voluntary food intake. At temperatures < 20°C, the decline inintake is steeper (21 g/°C) than between 20 and 25°C (7 g/°C). Close (1989) re-analysed data from four experiments that yielded the equation:
MEI = 9.6 + 0.075ET + 0.52BW – 0.012ET*BW (17.1)
where MEI is ME intake (MJ/day), ET is environmental temperature (°C) andBW is body weight (kg). Thus, ME intake increased by 0.16 MJ/day for each °Cdecrease in ET for pigs of 20 kg and by 1.12 MJ/day for pigs of 100 kg (seeFig. 17.2).
Environmental Factors Affecting Intake 367
0
10
20
30
40
50
60
0 10 20 30 40
Environmental temperature (°C)
ME
inta
ke (
MJ/
day)
Fig. 17.2. Effect of environmental temperature on ME intake of growing pigs at three bodyweights: —, 20 kg; – –, 60 kg; - -, 90 kg (from Close, 1989).

For growing/finishing pigs, intake decreases as environmental temperaturerises; over the range 5–30°C the relationship is:
PCI15 = 126.3 – 1.65ET (17.2)
where PCI15 is the percentage change from the level of intake at 15°C and ETis environmental temperature (°C) (NRC, 1987).
The increase in intake under cold conditions does not usually preventretardation of growth, and so the proportion of food energy retained in the carcassis reduced. However, the increase in voluntary consumption is sometimes greaterthan that necessary to maintain weight gain, and occasionally cold-stressedgrowing pigs have been found not only to eat more than controls but also to gainmore weight. An explanation for this might be that the diet was marginally protein-deficient, so that increasing the rate of energy utilization rectified an excessivelyhigh energy:protein ratio.
Food intake of pigs kept chronically at 10°C stayed high for at least 24 hafter moving to 25°C, and there was a closer relationship with metabolic ratethan with body temperature. Plasma levels of thyroid hormones changedwithin a few hours after changes in environmental temperature, but food intaketook at least 4 days (Macari et al., 1986). Transferring thyroidectomized pigsfrom hot to cool was accompanied by increased intake, but not vice versa, andthese authors concluded that thyroid hormones, while not controlling intakedirectly, are responsible for the metabolic adaptations affecting intake.
In theory, food intake is expected to be stable throughout the zone ofthermal neutrality, to increase below the lower critical temperature1 (LCT) andto decrease above the upper critical temperature, eventually reaching zerowhen environmental temperature exceeds body temperature. In practice,however, the relationship between environmental temperature and voluntaryfood intake is close to being linear, over the range 6–30°C (NRC, 1987). Invery cold environments the potential intake may not be realized due tophysical limitations, but this will depend on the age and relative gut capacityof the animal, and on the physical characteristics of the food (see Chapter 11).
It is not practicable to monitor all the factors affecting heat loss in manysituations, and it is proposed that body temperature is a suitable proxy forpredicting and modelling the pig’s response to different environmentaltemperatures (Fialho et al., 2004).
Cool temperatures do not increase colostrum intake in newborn piglets, asthey become less vigorous and spend less time sucking. This means that it isdifficult to arrange for optimum temperatures for both sow and piglets in thesame house. Once they get to about 1 week of age, piglets do respond tocooler temperatures by taking more milk. Reduced temperatures at night, whengrowing pigs have a lower body temperature, increased intake and growth byabout 10%, but with no improvement in efficiency.
368 Chapter 17
1 The environmental temperature below which the animal must increase its heat productionin order to maintain a stable body temperature.

Sows
Voluntary intake by lactating sows fell by 12% when environmentaltemperature increased from 21 to 27°C and by 25% when it was increasedfrom 16 to 27°C. This led to greater weight loss at the higher temperature(Lynch, 1989).
Temperature has a particularly great effect on lactating sows: weight loss oflactating sows increased as environmental temperature increased, although theuse of wet food and higher energy food have increased the daily intake of thesow. As well as sows losing more weight, piglets grow more slowly at highertemperatures.
Renaudeau et al. (2004) have summarized the effects of ambient temperatureon food intake by pigs, using the results of several experiments. Figure 17.3 givesthe results, expressed as multiples of maintenance requirements in order to showpigs of all sizes, from weaners to mature sows, on the same scale. The range oftemperatures, 18–29°C, encompasses temperatures normally encountered inhoused pigs in northern Europe. It can be seen clearly that the sow, with her largebody size relative to surface area and great heat production due to lactation, is themost severely affected. The marginal reduction in intake at 18°C, compared withthat at 19°C, is surely not realistic, as at low environmental temperatures intake isincreased to try to meet the increased heat losses below the LCT.
Diet can be manipulated to reduce the effects of high temperature, and fatinclusion improves performance under hot conditions as it has a lower heatincrement than carbohydrates. Sows ate more of a food containing 200 gCP/kg than one containing 140 g/kg at 16°C but less at 28°C, presumably dueto the high heat increment of protein metabolism.
Environmental Factors Affecting Intake 369
1.8
2.0
2.2
2.4
2.6
2.8
3.0
3.2
3.4
3.6
18 20 22 24 26 28 30
Environmental temperature (°C)
Foo
d in
take
(mul
tiple
s of
mai
nten
ance
)
Fig. 17.3. Summary of effects of environmental temperature on voluntary food intake(multiples of maintenance requirements) by: newly weaned piglets (2 kg, �); growing pigs(45 kg, ●); finishing pigs (90 kg, �); and lactating sows (270 kg, �). Maintenance requirementsare taken as 0.44 MJ ME/kg0.75/day for sows and 1.0 MJ ME/kg0.60 for the others (fromRenaudeau et al., 2004).

Amongst the ways available to reduce the effects of heat stress on pigperformance is to select for heat tolerance. Renaudeau et al. (2004) discuss thebest selection criteria, but acknowledge that little is known about genetic diversityfor heat tolerance within or between pig breeds. They suggest that indicators ofheat sensitivity (heat shock protein), heat production (residual consumption,uncoupling protein) or heat dissipation (respiratory rate, cutaneous heatconductivity) could be used as selection criteria.
Ventilation
Ventilation rate can also affect growth and food intake in pigs, with significantdepression in intake at very low ventilation rates. Too high a rate of ventilation– which induces high air speeds – can also affect intake, as an increase from 10to 56 cm/s in air speed is equivalent to a 4°C fall in air temperature, in terms ofits effects on pigs. However, huddling together at low effective temperatures willreduce the cooling effect, and the results from individually penned pigs are notdirectly applicable to groups of pigs (Mount, 1968).
At high temperatures, evaporation is very important as a means of losingheat. At thermoneutral temperatures, increasing the relative humidity from 50to 95% had no effect on voluntary food intake or growth, but at 28 and 33°C,each 10% increase in humidity depressed intake by 36 g/day. Localized coolingof the head or even just the snout increases intake by sows, especially at hightemperatures. When snout cooling was provided, sows kept in a hotenvironment (29°C) increased their intake from 3.99 to 4.86 kg/day andreduced weight loss from 19.8 to 14.3 kg/28 days (McGlone et al., 1988). Awater drip increased intake to 5.29 kg/day and weight loss was 10.8 kg/28days, while with both snout cooling and a water drip intake was 5.84 kg/dayand weight loss was 2.0 kg/28 days.
Cattle
Disruption of feeding behaviour occurs in cattle at very low temperatures(< –10°C), especially in beef cattle, which are more susceptible to increased heatlosses because their heat production is less than that of dairy cows. DM intake bygrazing beef cattle increases when daily temperature increases or decreases fromthe mean of previous days, but the magnitude of the response is very small.Fluctuations in temperature in the range of –16 to +8°C have a minimal effect onintake or grazing behaviour, and it can be concluded that fluctuations within thatrange within a familiar environment are minimally stressful.
In sub-zero conditions, with a range of minimum daily temperatures from 0to –35°C, grazing time of beef cows (GT, h/day spent eating) decreased inproportion with minimum daily temperature (MDT, °C), more so for youngercows than for older (fatter?) cows:
GT = 9.32 + 0.16MDT for 3-year-old cows (15.3)
GT = 9.02 + 0.009MDT for 6-year-old cows (15.4)
370 Chapter 17

with little effect of snow cover (Adams et al., 1986). Increase in gut motilityunder cold exposure leads to increases in rate of passage, which could beresponsible for increases in food intake if physical constraints are limitingintake.
Under hot conditions, provision of shade increases intake, as evidenced bybody weight increase and lowered plasma free fatty acid levels. As with sows,head cooling can be beneficial, as it increased the food intake of cattle workingon treadmills under hot conditions.
Animals usually acclimatize to changes in environmental conditions so thatthe acute effects of heat exposure may be more severe than the chronic effectson food intake; heifers exposed to temperatures that increased from 18 to 29°Ccaused growth to be depressed during the 20-day period after the change, butnot subsequently, even though the high temperature was maintained. Short-term observations can, therefore, give misleading results. One way in whichcattle adapt to hot conditions is by eating more at night when it is cooler, whichallows them to eat more than would be predicted from the results ofexperiments with continuous exposure to hot environments in a heat chamber.
Although heat stress has a greater effect on the intake of Bos taurus thanon B. indicus cattle, the level of intake is generally higher in B. taurus (Colditzand Kellaway, 1972); first-cross animals had similar levels of intake to Friesiansat the lower temperature but, under heat stress, they ate more than either purebreed, an example of hybrid vigour or heterosis.
As the proportion of concentrates in the diet is increased, so the heatincrement of feeding decreases; this can be used to alleviate heat stress to alimited extent. For any given type of food, ruminal VFA concentrations reach apeak faster after a large meal in steers at 35°C compared with those at � 29°C,suggesting that this accounts for the lower food intake and that foods resultingin lower ruminal acetate production might be useful in hot areas.
In addition to the direct effects on the animal, high environmentaltemperatures affect the growth of food plants. Typically there is an increase inthe proportion of cell wall constituents (CWC), especially in tropical grasses,because of faster maturation. The increased stem:leaf ratio, as well asdepressing nutritive value, will also reduce the acceptability of the herbage.
In a comprehensive review of effects of high environmental temperatureson lactating cows, Kadzerea et al. (2002) found that food intake in high-yielding lactating cows begins to decline at ambient temperatures of 25–26°C.Above 30°C it drops more rapidly and, by the time it has reached 40°C, thedecline can be as much as 40%. The reduction is particularly large if the food ishigh in forage, as fermentation produces large amounts of heat and VFAs areutilized relatively inefficiently, thereby generating heat during their metabolismin the body.
Prolonged heat stress allows adaptation to occur, especially by feedingpatterns being changed and a greater proportion of the daily intake being takenduring the cooler periods, i.e. at night. The reduction in food intake is theprimary cause of reduced milk yield under hot conditions, as maintainingintake by introducing food into the rumen of heat-stressed cows greatlyreduced the depression in yield.
Environmental Factors Affecting Intake 371

Sheep
Cold environments
Below the LCT the animal has, by definition, to increase its rate of heatproduction in order to maintain its deep body temperature within the narrowrange compatible with normal function. This increase in energy requirementswould be expected to result in increased food intake, and this is indeed so. At afixed level of feeding, sheep eat faster in a colder environment and there is anincrease in ruminal motility, a reduction in the volume of ruminal contents andin the extent of digestion of cell wall constituents.
Thyroxine secretion is increased by reducing the environmental temperature,and this might be responsible for increased voluntary food intake. Treatment ofsheep with 1 mg thyroxine/day increases food intake, but weight gains arereduced; the increase in intake is due, presumably, to the greater energy requiredto support the increase in metabolic rate. Implants of 60 mg givensubcutaneously at 3-month intervals also stimulate intake. While body weight islost in the first month, food intake is even higher in the second and third monthsafter implantation, as weight is regained. Again, it is apparent that intake isresponding to changes in energy expenditure.
Shearing
Shearing increases heat production in sheep, and this is matched by increasedfood intake (about 25% at 13°C). This increase in voluntary intake occursabout 1 week after shearing, although heart rate increases at once and therecan be marked shivering during the week between shearing and the start ofhyperphagia; the rise in intake peaks at some 50% above the pre-shearinglevel. The increase in intake after shearing is not usually accompanied by anydifference in live weight gains, compared with controls, suggesting that theincrease in intake is a response to the increased heat losses. During the fewweeks after shearing intake is inversely related to environmental temperaturebut, by about 2 months after shearing, the difference in voluntary intakebetween shorn and unshorn sheep has disappeared; sufficient wool has grownto afford adequate protection by this time.
There was little effect on the intake, already high, of a highly digestiblelucerne-based food but a marked increase with low-intake, poorly digestibleforages (Minson and Ternouth, 1971). It would appear that the high level ofintake on the more concentrated food was providing sufficient heat for shearingnot to push the animal below its LCT. The increase in intake following shearingtends to be greater in lighter ewes, as they have less subcutaneous fat tocompensate for the loss of the fleece.
These results from sheep show that, although the response takes at least 1week, increased heat loss is compensated for by increased voluntary foodintake to provide the necessary metabolizable energy. If heat production isalready high, then shearing does not bring the animal to below its LCT andintake is unaffected.
372 Chapter 17

Hot environments
Sheep are also affected by high temperatures. Shorn lambs, whose LCT wasapproximately 13°C, were exposed to environments ranging from –5 to +35°Cwith the following relationship (Brink, 1975):
DMI = 111.3 – 0.52T (17.5)
where DMI was the dry matter intake (g/kg live weight0.75) and T was thetemperature (°C). The depression of intake at high temperatures is probablysmaller with high-concentrate rations than with forages, because the latter havea higher heat increment.
As with cattle, acclimatization can ameliorate the acute effects of hightemperatures, and the true effect of a hot climate on food intake by sheep canonly be assessed in well-acclimatized sheep.
Photoperiod
The most obvious difference between day and night as far as feeding isconcerned is the ease with which animals can see their food. However, theregular sequence of dark and light in a 24 h cycle acts as a synchronizer toentrain diurnal rhythms in many biological functions that are not directlydependent on the presence of light or dark. In many cases it is not knownwhether rhythms of approximately 24 h are entrained, in which case theyshould correctly be called circadian rather than diurnal rhythms. It is importantto consider time-of-day when studying the control of food intake (Forbes,1982).
Poultry
Poultry do not normally eat during darkness. If daylength is short (< 8 h),however, hunger overcomes the reluctance to eat at night, and feeding occursto a limited extent during darkness. In continuous darkness intake is as high asin long daylengths, indicating that lack of visual contact with food is not theonly reason for the aphagia normally seen at night. If chickens are subjected toconstant illumination, following experience of light–dark cycles there is aresidual rhythm of feeding, although this does not remain at exactly 24 h.Chickens that have been in continuous light from hatching do not show such arhythm unless some event such as servicing occurs sufficiently regularly for it tobe used as a zeitgeber or synchronizing agent.
Within the light phase, the rate of taking meals is not usually constant. Thereis often a peak at the beginning and/or at the end of the light phase (Savory,1979). Laying hens tend to show this peak in the evening, presumably to fill upthe crop for the night, while non-layers usually eat more in the morning. Whilstthe evening peak might be related to the laying cycle in the hen, when it occursin non-layers it implies anticipation of darkness; this is obviously possible when
Environmental Factors Affecting Intake 373

the light dims slowly at the end of the day but not when the lights go outabruptly. Birds that show a feeding peak before dusk eat more than other,similar, birds that have peak feeding activity shortly after dawn.
Broiler chickens seldom show the pre-dusk peak unless the lights dimslowly, and maximum intake is achieved by the use of 23 h lighting, byintermittent illumination or by simulated dusk. When the daylength is extendedby adding 3 h, the evening feeding peak moves to 3 h later over a period ofabout 3 days. If the extra 3 h are added at the beginning rather than at the endof the day the evening peak does not move, showing that the hen can predictthe time at which the lights will go out rather than the length of the light phase;perhaps servicing at a fixed time of day acts as an indicator.
To determine whether domestic fowl can anticipate a period of fooddeprivation, individually housed pullets were maintained in a circadian-freeenvironment and, for 30 days, half were shown a coloured card during the final1 h of food availability, prior to food deprivation of 8 or 12 h (Petherick andWaddington, 1991). There was no indication subsequently of increased intaketo fill the crop when the coloured card was shown. In addition, it has beenfound that broilers are able to anticipate withdrawal of food if this coincideswith the onset of darkness, but not in continuous light. Continuously lit birdsconsume more at the onset of a 12-h period of food availability whereas thosewith a dark period eat more towards the end of the light period. Thus, theability to predict food unavailability depends specifically on a daily period ofdarkness and not just on a period of fasting.
When chickens are exposed to ahemeral cycles,2 their feeding patternshows signs of keeping to a cycle of approximately 24 h. Thus, laying hens keptunder 21 h cycles (12 light (L):9 dark (D) or 11L:10D) show an ‘evening’ peakof feeding activity which continues into the early part of the night (Bhatti andMorris, 1978). Conversely, hens in 30 h cycles (12L:18D or 20L:10D) eatconsiderably less in the last few hours of the light phase than would beexpected.
When the light phase is divided by a dark phase in the middle (skeletonphotoperiod, for example 2L:8D:2L:12D), some food is eaten during the 8Dperiod, which the bird treats as ‘day’, rather than as ‘night’. Feeding, therefore,is not ‘switched’ on by light and off by darkness, but rather is related to ametabolic rhythm that is entrained by the pattern of lighting.
Mechanisms
It has been established that the pineal gland is an important mediator of theeffects of photoperiod on reproduction and growth, both in birds andmammals. The pineal receives information from the eyes via the superiorcervical ganglion and influences other parts of the brain by the secretion ofhormones, particularly melatonin. Melatonin given during the daytime mightbe expected to cause the cessation of feeding. Not only did this prove to be thecase, but cockerels actually went to sleep for up to 3 h after intraperitoneal
374 Chapter 17
2 Lighting cycles other than 24 h.

injection of 10 mg melatonin (Bermudez et al., 1983). This dose is clearlyunphysiological but, as much of the melatonin will be extracted by the liver andthe remainder will be separated from the brain by the blood–brain barrier, theamounts entering the sensitive parts of the brain may be within thephysiological range. At lower rates of injection there is dose-related hypophagiawith drowsiness, but not sleep.
If melatonin is responsible for the nocturnal aphagia in chickens, removal ofthe pineal gland – which is the major source of melatonin – would allow feedingto take place at night. This did occur, although the quantity eaten during the12 h of darkness (4.4 g) was much less than that eaten during the daytime (Injidiand Forbes, 1983). Total daily intake was significantly higher than in sham-operated birds, and growth was significantly faster. Thus the pineal plays a rolein the circadian patterns of feeding, but is not the only factor.
As voluntary food intake is related to energy requirements, the effect ofmelatonin may be to lower the metabolic rate of the sleeping or drowsy bird.Measurement of oxygen consumption showed that it was significantlydepressed within the first 1 h after injection of melatonin. Simultaneousinjection of triiodothyronine (T3, 200 �g, intramuscularly) blocked the effects ofmelatonin on sleep and feeding immediately, but the stimulating effect onmetabolism was not shown until 3 h later (Bermudez et al., 1983); the effects ofthese hormones are, therefore, direct and not via effects on metabolic rate. AsT3 concentration in plasma is lower at night and melatonin injection depressesT3 concentration, thyroid hormone metabolism may be involved in the diurnalcycle of food intake and metabolism.
Pigs
Pigs that had free access to food and were observed for 24 h periods ate for atleast twice as long per hour during the day compared with at night. There istypically a peak of feeding activity in the late afternoon, with 10 min/h spenteating in that period of the day (see Fig. 2.11). There are few reports in theliterature of effects of photoperiod on the voluntary food intake or productivityof pigs, although in one study intake was increased if 16 h or more light perday was provided to lactating sows, compared with short daylengths.
Cattle
The overall feeding pattern is related to photoperiod, with larger, more frequentmeals during the day, but this can be modified if the middle of the day is veryhot, when cattle eat more at night – especially if the moon is bright (Dulphy etal., 1980).
In winter, more time is spent eating during the hours of darkness, since thedays are too short to allow cattle to meet their requirements during the day.Beef cattle in open feedlots spend up to 75% of their feeding time between06.00 and 18.00 h. Reversal of lighting or lengthening the hours of light is
Environmental Factors Affecting Intake 375

accompanied by changes in feeding behaviour, so that feeding takes placepredominantly during the light period. When fresh food was provided aftereach meal so that any circadian changes in food intake could not be caused bychanges in the availability or palatability of the food (Chase et al., 1976), mealsoccurred more frequently during the period from 08.00–20.00 h, with a peakaround 08.00 (inter-meal interval of about 80 min); during the early part of thenight the inter-meal interval averaged 180 min, while from 24.00–06.00 h itwas about 300 min.
While some studies under naturally fluctuating conditions have shownsmall increases in voluntary intake with increasing daylength, artificialextension of natural winter days has shown bigger effects. Peters et al. (1980)showed a significant increase in the voluntary intake of heifers given acomplete food and provided with 16 h of light/day compared with those undernatural winter daylengths in Michigan, USA (5.20 versus 4.80 kg/head/day), orthose under continuous light (4.86 kg/day). The effect on live weight gainpreceded that on food intake, supporting the hypothesis that the effects of longphotoperiod on food intake are due to the stimulation of growth and theincreased energy requirements.
In dairy cows exposed to 16 h of fluorescent lighting/day compared withthose kept under natural lighting conditions, from October to March (9–12h/day), food intake was increased by 6%, which approximately matched therequirements for the recorded increase in milk yield of 1.4 kg/day (Peters et al.,1981). Adjusted for parity and milk yield, the food intakes were 17.4 and 16.4kg DM/day, respectively.
Deer
Deer are farmed in many countries and can therefore be classed as ‘farmanimals’. The justification for including them here is that, being more seasonalin their behaviour and food intake than species with a longer history ofdomestication, they show in an exaggerated form the effects of photoperiod onfeeding behaviour. In males, the depression in food intake induced by shortdays is even more marked than in the female and, at the time of the ‘rut’ – thebreeding season – males eat very little for several weeks.
Figure 17.4 shows food intake by stags, Suffolk rams and Soay ramssubjected to an artificial 6-month pattern of lighting (Kay, 1979). The Suffolkbreed of sheep is representative of highly domesticated breeds and theamplitude of the intake cycle is less than that of deer, while that of the Soay – arelatively undomesticated breed – is proportionately at least as great as fordeer. The fact that intake follows daylength – even though this is in a 6-monthcycle – shows that it is photoperiod, rather than temperature or nutrition, that iscontrolling the circennial rhythm in animals under natural conditions.
Meal size is markedly different at different times of year, although it is littledifferent between day and night (Rhind et al., 1998; Fig. 17.5). In contrast,number of meals changes little over the year but is always considerably greaterduring the day than in the night.
376 Chapter 17

Deer given foods with ME concentrations in the range 8.5–11.0 MJ ME/kgDM (all with 156 g protein/kg) decreased their DM intake with increasingdietary ME concentration to give an approximately constant intake of ME perunit of metabolic LW (Webster et al., 2000; Fig. 17.6). However, therelationships between ME concentration and DM intake were significantlydifferent between spring and winter. In winter there was a small but significantpositive relationship, and in spring a small but significant negative relationshipbetween ME intake and ME concentration. This example featuring deer isincluded because it neatly includes both dietary and environmental factors.
Sheep
Lambs kept during long days eat more than those in short days due to thestimulation of growth. Although growth is increased by long daylength, even atrestricted levels of feeding, the maximum response is obtained when the animalis allowed to fulfil its increased growth potential by ad libitum feeding. Exposureof growing lambs to fixed daylengths of either 8 or 16 h/day resulted in higherintake of a complete pelleted food in the longer photoperiod (Forbes et al.,1979). However, neither the speed of onset nor the statistical significance of thisincrease were as great as the effects on growth rate and gut fill, so the additionalnutrient requirements of stimulated growth probably caused a secondaryincrease in food intake. This conclusion is supported, since the effect ofphotoperiod on growth can still be seen in pair-fed lambs (Forbes et al., 1981).
Environmental Factors Affecting Intake 377
Fig. 17.4. Intake of balanced foods by stags (●), Suffolk rams (�) and Soay rams (�)subjected to an artificial 6-month pattern of lighting (from Kay, 1979).

378 Chapter 17
0
40
80
120
160
200
Aug Sep Oct Nov Dec Jan Feb Mar Apr May Jun Jul Aug
0.3
0.5
0.7
0.9
1.1
1.3
1.5
Aug Sep Oct Nov Dec Jan Feb Mar Apr May Jun Jul Aug
Mea
l siz
e (g
)M
eals
/h
(b)
(a)
Fig. 17.5. (a) Meal sizes and (b) number of meals/h at monthly intervals in deer fed adlibitum and kept in the natural annual rhythm of daylength, i.e. shortest day is in December.- - -, the daylight period between dawn and refilling of the feed bins; —, the period betweendusk and dawn (from Rhind et al., 1998).
A 1 h ‘flash’ of light in the middle of long nights is as effective as long days(Schanbacher and Crouse, 1981). Figure 17.7 shows the number of mealstaken during hourly intervals in 8 and 16 h daylengths and with a 1 h ‘flash’ inthe middle of the night. In all treatments there was a lower feeding frequencyduring darkness, although there was more feeding in the middle of the longnights and a sharp peak during the ‘flash’. The daily intake of a complete foodwas increased from 1.62 kg/day under 8L:16D to 1.83 kg under 16L:8D and1.79 kg under the 7L:9D:1L:7D ‘flash’ treatment. Meals are smaller and occurless frequently at night than during the day in housed growing lambs.
Since significant amounts of food are eaten at night, there is no question ofa block such as that caused by melatonin in chickens; 200 or 400 �g melatonininjected into the lateral ventricles of sheep had no effect on feeding (Driver etal., 1979). The metabolic rate of ruminants is lower at night, although notsufficiently so to account for the large difference between daytime and night-time intake.

Environmental Factors Affecting Intake 379
70
80
90
100
110
120
8.0 8.5 9.0 9.5 10.0 10.5 11.0
ME concentration of diet (MJ/kg)
Foo
d in
take
(g
DM
/kg0.
75/d
ay)
Fig. 17.6. Effect of ME concentration of diet on voluntary intake of DM by growing male reddeer calves. �, spring; ●, winter, with lines of best fit (from Webster et al., 2000).
Sheep fed ad libitum on hay showed higher intake during the day, especiallyafter fresh food has been offered. Ruminal volatile fatty acid concentrationsincrease during the day and decrease at night, so the animals are not eating inorder to achieve constant conditions in the rumen, nor to achieve a constantmetabolic rate. Although they do not sleep deeply, ruminants become less awareof their surroundings at night and may also be less aware of internal signals.Sheep trained to self-stimulate in the postero-lateral hypothalamus showedreduced self-stimulation during the 12 h dark phase with a compensatoryincrease during the day, so that the total activity was the same as for sheep keptin continuous lighting, under which there was no diurnal rhythm (Baldwin andParrott, 1982).
Under conditions of natural lighting in latitudes where there is a markedannual rhythm in photoperiod, sheep show an annual cycle of daily foodintake, with a peak a few weeks after the longest day and a nadir after theshortest day. Artificial manipulation of photoperiod showed that long daysstimulate wool growth and that three-quarters of the variation in wool growthwas associated with variation in food intake. Kay (1979) and his colleagueshave shown that the intake cycle is caused by changes in photoperiod ratherthan in temperature or food quality, by compressing the annual lighting cycleinto 6 months (see Fig. 17.4). It would appear that the intake, growth andfattening cycles have greater changes in unimproved breeds of sheep, such asthe Soay, compared with improved breeds like the Suffolk.
Superior cervical ganglionectomy, which prevents fluctuations in pinealfunction, reduces but does not totally inhibit the cycle of appetite in Soay ramskept under 6-month compressed annual cycles of lighting (Kay and Suttie,1980). This annual cycle of food intake is associated with a parallel cycle offasting metabolic rate in sheep (204–264 kJ/kg0.75/day) and, in Soay rams, theestimated maintenance requirements for metabolizable energy were 400(midwinter) and 530 kJ/kg0.75/day (summer).

380 Chapter 17
0
5
10
15
20
25
12:00 16:00 20:00 00:00 04:00 08:00
Time of day (h)
(a)
0
5
10
15
20
25
12:00 16:00 20:00 00:00 04:00 08:00
Time of day (h)
(b)
0
5
10
15
20
25
12:00 16:00 20:00 00:00 04:00 08:00
Time of day (h)
(c)
Fee
ding
freq
uenc
y (/
h)F
eedi
ng fr
eque
ncy
(/h)
Fee
ding
freq
uenc
y (/
h)
Fig. 17.7. Feeding patterns of ram lambs in (a) 16 h days, (b) 8 h days and (c) 8 h days with‘flash’ in middle of the night. Solid bars, hours of darkness; open bars, hours of daylight/‘flash’(from Schanbacher and Crouse, 1981).

Plasma leptin concentrations are lower in lean sheep under short dayscompared with those in fatter sheep in long days, and the seasonal pattern ofcirculating leptin concentrations reflects that of adiposity and matches thepattern of food intake (Adam and Mercer, 2004). Given the conventional beliefthat leptin inhibits food intake these observations seem paradoxical, but in factit appears that leptin receptors are down-regulated in long daylengths.
Lactating ewes in long days ate 16% more food (lucerne ad libitum with aconstant proportion of a concentrate food) and produced 25% more milk thansimilar animals kept in short days at the same time of year (Bocquier et al.,1997). At 150 days post-lambing, all animals were put under 12L:12Dconditions and intakes became almost equal after a further 30 days. The timingof the changes in yield and intake strongly supported the idea that the effect ofdaylength was primarily on milk production and that this, in turn, influencedfood intake.
Occasionally, environmental factors other than daylight can entrain a feedingrhythm. For example, sheep on North Ronaldsay, Western Isles, Scotland, thateat mostly seaweed as they are restricted to the outer part of the island, exhibit agrazing pattern that is controlled by the tide.
Rhind et al. (2002) provide a comprehensive review of the effects ofphotoperiod on intake by ruminants and discuss likely mechanisms at thehormonal and neural levels, but conclude that: ‘the sequence of neuroendocrinesignals through which a change in photoperiod can alter food intake is poorlyunderstood’.
Exercise
Enforced exercise reduces food intake and growth rate of pigs with no effect onback fat thickness; it is not clear whether the reduced time spent eating is dueto fatigue or stress.
Although most studies with cattle have shown no significant effect ofexercise on voluntary food intake in the short term, intake by cattle of ricestraw supplemented with 18 and 27 g concentrates/kg live weight was reducedby 11 and 14%, respectively, when oxen worked to increase their energy dailyexpenditure by 1.3–1.6-fold (Pearson et al., 1999). However, there was nodepression due to exercise with a diet of hay which had higher ME but lowernitrogen content than the straw. On both diets there was a return to pre-worklevels of intake in the week after exercise. If work takes up a significantproportion of the time available for feeding, then intake is likely to be reducedwith forages with slow rates of intake.
When intakes have been monitored over long periods, however, there areseen to be increases – of the order of 15% over a period of 2 years, forexample – in cows that worked about 100 days/year.
Walking cows for 2–3 km/day does not affect food intake compared withsimilar cows not exercised. Hereford � Friesian cows exercised 5 days/week for3 weeks over 10.6 km/day, with 480 m/day climbing with 4 kg/day ofsupplement and barley straw ad libitum, showed no effect on straw intake but
Environmental Factors Affecting Intake 381

body weight was lost when exercising and gained when not (Matthewman etal., 1993). This confirms previous results that animals performing moderatework and given poor forage do not in the short term increase intake, and thatintake may even decrease when animals work.
In sheep exercised on a treadmill over 9 km/day at 3 km/h up a 10°gradient for 6 days, intake of chopped hay was decreased from a pre-exerciselevel of 1347 to 1125 g OM/day, with little effect on rumen retention times(Henning, 1987). The time taken to complete the work (3 h) is unlikely to besufficient to explain the observed reduction in hay intake, as limiting animals to21 h/day access to food does not affect daily intake.
In the short term, therefore, exercise tends to reduce intake rather thanincrease it in parallel with the increase in energy expenditure. Long-termexercise must result in a compensatory increase in intake, otherwise hard-working animals would die of underfeeding.
Group Size and Stocking Density
The presence of competition for feeding space exerts a major influence on feedingbehaviour, rate of eating being increased when there are more animals per feeder.In some studies, but not others, social dominance has been found to be correlatedwith food intake, growth, milk production or egg production; this is especially truewhere there are not enough feeding spaces for all animals to eat at once.
Even with a well-balanced food available ad libitum, intake might beinsufficient. Many farm species show social synchrony of feeding and it ispossible that some individuals cannot get to the trough during these feedingperiods, sometimes being excluded by dominant members of the group. Inmany cases the deprived animals compensate by increasing their feeding rateand/or by eating at less favoured times of day.
In many of the studies reported there has been confounding betweengroup size, stocking density and trough length per pig, so that it is often difficultto reach conclusions about their relative importance.
Poultry
Food intake of broiler chicks from 1–42 days, stocked at 10, 15, 20 or 25birds/m2, was significantly lower at the two higher densities (3842, 3838, 3738and 3518 g/42 days, respectively) (Valdivie and Dieppa, 2002). Although this wasaccompanied by reduced live weight gain, the yield of meat/m2 was increased bythe higher stocking densities, with no difference in conversion efficiency.
Pigs
Group size and floor area per pig are important factors affecting stress. Pigsgenerally grow more slowly as stocking density increases, due largely to an
382 Chapter 17

effect on food intake (Whittemore et al., 2001a). An optimum space allowanceof 0.04 m2/W0.67 has been proposed, with a linear depression of intake by 20%at a space allowance of 0.02m2/W0.67. NRC (1998) propose that, at stockingrates < 1.1 m2/pig, ME intake be adjusted by (0.773 + (0.429SP) –(0.203SP2) – 1) for pigs < 50 kg, or by (0.617 + (0.701SP) – (0.320SP2) – 1)for heavier pigs, where SP is the space allowed (m2/pig).
Increasing the area per animal, with groups of eight bacon pigs, from 0.56to 1.19 m2, resulted in an increase in food intake from 2.46 to 2.73kg/animal/day. There was a reduction in food intake when space was reducedfrom 0.25 to 0.17 m2/pig (Lindvall, 1981), and a further 10% reduction ifspace was reduced to 0.13 m2, although other work has failed to show such aneffect.
As group size increased from three to six to 12, even though the floor areaper pig was maintained, food intake declined from 2.57 to 2.33 to 2.27 kg/daywith Duroc pigs weighing 35–50 kg (Heitman et al., 1961). For group size, eachadditional pig in a pen of weaners reduces intake by 0.9%, while for growingand fattening pigs the reduction is 0.25 and 0.32%, respectively. These effectsare likely to be due to reduced heat losses in the larger groups.
In a comprehensive study of group size, 640 pigs, growing from 23 to 95kg over 12 weeks, were kept in groups of 10, 20, 40 and 80, with feeder accessand floor space kept equal per pig (Schmolke et al., 2003). Food intake wasnot affected by group size and there did not seem to be any effect on thewelfare of the pigs.
In an analysis of the results of 20 published studies using almost 22,000animals, Turner et al. (2003) found reduced growth rates in larger groups,although food intake was affected only in the early stages after weaning, associal dominance orders were re-established after mixing of pigs. However,several other studies have not found significant or lasting effects of group sizeon food intake, when feeder access and floor space were equal betweengroups.
The results of several experiments show that pigs eat less when in largergroups (Morgan et al., 1999). Grouped pigs eat fewer and larger meals thanthose single-housed, but this is due to a limitation of trough space because, ifmore feeders are provided, the number of meals increases and they becomesmaller, similar to the situation in individual pigs.
Pigs in groups take fewer meals, eat faster and, in some studies, eat lessper day than pigs penned individually. The effect on meal number was mostobvious with groups of 20 pigs compared with 5, 10 or 15, presumably as aresult of greater competition and less time for individuals, especially those lowin the dominance order, to eat.
Sheep
As the space allowance for lambs was increased from 0.37 to 0.62 to 0.99m2/head, intake increased from 1.36 to 1.32 to 1.49 kg/day, with no effect oncortisol, adrenaline or noradrenaline (Horton et al., 1990).
Environmental Factors Affecting Intake 383

Feeder Design and Feeding Space Allowance
Poultry
Battery cages with wide fronts allow a feeding pattern more closely related tothe hens’ requirements (more first thing in the morning and just before dusk)than a deeper cage with same floor-space per bird, which has less feedingspace per bird. When the front of the battery cage is vertical bars, hens feedmost frequently singly, while with horizontal bars they feed usually in threes, i.e.closer to the birds’ inclination to synchronize their feeding.
Pigs
Feeding is stimulated by the sight of other pigs eating, so there should be enoughfeeder space for all pigs in a pen to eat at once; by the time they reach 90 kg theyrequire about 350 mm of trough length per animal. Barriers separating the headsof pigs at feeding reduce the incidence of fighting. Where the feeding spaceprovided does not allow several pigs to eat simultaneously, dominant pigs willhinder the lower-ranking pigs’ access to the feeder, and aggressive behaviour canbe caused by inadequate feeder space. Competition for access to the feeder canoccur with as few as four growing/finishing pigs per feeding place. Increasingfrom one to two the number of feeding spaces available for 20 pigs, daily foodintake of the pigs increased but with no significant effects on growth rate or foodconversion efficiency (Morrow and Walker, 1992).
Piglets offered creep food in a single or three times the normal number offeeders had the highest intake in this latter situation by 2.1 times at 3 weeks ofage and 1.4 times at 4 weeks, as a result of less competition for feeder access.
The feeding behaviour of pigs housed in groups of ten, given access to afour-space trough, was significantly different to that demonstrated by pigs withaccess to a single-space feeder. Those animals with access to the four-spacefeeder visited the feeder more frequently and for shorter durations, eating only alittle per visit, compared with pigs kept in the groups with access to only a single-space feeder (Neilsen et al., 1996; Table 17.1). These authors commented thatpreviously, the differences in the feeding patterns between animals housed eitherindividually or in groups had been attributed to the differences in the socialenvironment in terms of less competition and fewer social interactions. However,in this experiment the social groupings were the same, although the pig:troughratio did differ, therefore access to the feeder is an important factor affectingfeeding behaviour in its own right.
Pigs working for food by having to roll a ‘food ball’ (the Edinburghfoodball, Young and Lawrence, 1993) to obtain small rewards of food atirregular intervals, seem to limit their intake by the amount of time spentforaging rather than the weight eaten, analogous to the apparent unwillingnessof sheep to spend more than about 12 h/day grazing.
Given the variation in results from different experiments on group size,stocking density and feeder space, care must be taken before including suchfactors in predictions of food intake for pigs.
384 Chapter 17

Cattle
A moderate amount of competition for feeding space affects the feedingbehaviour of cows low in the dominance order, but they compensate by eatingat less favoured times of day. Stronger competition results in some animalshaving insufficient time to eat as much as they would under less time-limitingconditions. The number of cows per feeding position above which daily intakeis depressed is variously reported as two and five, but this will depend on therate of eating of the forage. Using a LUCIFIR system, Elizalde and Mayne(1993) did not find that silage intake by cows was significantly depressed untilthe number of animals per food station exceeded five. Less than 0.2 m/cow oftrough space is likely to reduce intake.
Grant and Albright (1995) provide a comprehensive review of the effects offeeder space on the behaviour and intake of cattle.
Sheep and goats
Goats have a greater reach than sheep of the same body weight, so can eatfood spread more widely behind any given type of barrier.
Social Stress
Pigs
When weaner pigs from several litters are mixed there is a short period of stressuntil a dominance order has been established, but this does not appear to affectvoluntary intake. Intake of pigs in mixed-sex groups (gilts and castrated males)was lower by 1.8% compared with the mean for single-sex groups; although thisis a small effect, it was obtained from experiments with a total of 3200 animals(Ollivier, 1978), and so may have biological and economic significance.
Competition for food is also affected by the amount of food obtainedduring each press of a panel. With feeders set to dispense either 1.4, 2.7 or 5.3
Environmental Factors Affecting Intake 385
Table 17.1. Feeding behaviour and performance variables for group-housed growing pigsgiven access to either a single-space or a four-space feeder (means of 2 days and 7 days,respectively) (from Neilsen et al., 1996).
4-space 1-space SED P
Means per pig:No. of visits (09:00–20:00 h) 53.5 9.2 3.36 <0.001Food intake (g/visit) 24 149 13.6 <0.001Meal duration (min/visit) 0.67 4.67 0.360 <0.001Daily food intake (g/day) 1760 1766 nsDaily live weight gain (g/day) 810 813 48.6 nsFood conversion ratio (g/g) 2.25 2.23 0.111 ns
g/response, food intakes by growing pigs (ten to one single-space feeder) were1.97, 2.14 and 2.21 kg/day, respectively, resulting in growth rates of 727, 797and 845 g/day, respectively, and improved conversion efficiency (Morrow andWalker, 1992). Feeding times were 110, 78 and 87 min/day with 52, 46 and 42entries/day, respectively.
Pigs worked for longer at the low setting, which generated more queuing atthe entrance to the feeder. There were fewer aggressive contacts when twofeeders were provided, but no difference in food efficiency or growth ratecompared with that for a single feeder. Morrow and Walker (1994) recordedqueuing for feeder access but this was not related, in this experiment, toposition in the social rank. It would be interesting to note the order with whichpigs obtain access to the feeder and whether those animals with long waits orforced to take ‘out-of-hours’ visits were subordinate.
In groups of sows, however, the social dominance order is the same as thefeeding order to obtain a restricted amount of food from an automatic feeder.Feeding by some of the lower-rank animals is disrupted by return visits by moredominant sows, and experience is a major factor in determining the socialhierarchy. In a competitive feeding situation sows lower in social ranking havelower daily gains, which appears to be related to their lack of competitiveability to obtain food.
Wellock et al. (2003) have made an integrated approach to modelling theeffects of several stressors (group size, space allowance, feeder space allowanceand mixing) on food intake and growth of pigs. This necessitated quantifyingthese effects and, rather than using empirical equations derived directly frompublished data, they have adopted a more basic, biological approach, althoughparameter values were estimated from experimental data. Food intake wasderived mainly from the reduction in potential growth rate caused by thevarious stressors. Importantly, the effects of multiple stressors are taken as beingadditive, as demonstrated experimentally with chickens by McFarlane et al.(1989) and with pigs by Hyun et al. (1998) (see Chapter 18).
Neilsen et al. (1995) found no relationship between position in the socialhierarchy and any aspects of feeding behaviour or performance when pigswere housed in different group sizes, nor did Dalby et al. (1996) when weanedpigs were allowed access to a choice of foods. With ample access to feederspace and adequate environmental conditions, social competition may be lessrelevant to performance. Social hierarchy is likely to be more stable within agroup when there is plentiful feeding space.
Cattle
When heifers are kept with older cows they tend to lose weight, while similarheifers fed separately gain weight, due to limited space at food troughs anddominance of older cows. Similarly, calves at the lower end of the dominanceorder eat less concentrates and gain weight more slowly. It is better to provide afeeding space for each individual rather than just one long trough. A barrierthat separates the heads of adjacently feeding animals is better than one that
386 Chapter 17

just separates the bodies, but a complete head and body barrier is best inallowing subordinate animals to eat.
Miller and Wood-Gush (1991) observed that feeding by dairy cows wasmore synchronized when they were grazing in summer than when in yard inwinter because, even though each cow had her own Callan3 door there were alot of displacements, usually by a low-ranking cow being displaced by a higher-ranking one. It has also been noted that group-fed cows have a higher intake ofa complete food than those fed individually through Callan doors.
As with pigs, social relationships amongst cows during idling are veryclosely correlated with those at feeding. Low-ranking cows ate less frequently,while middle-ranking ones were ejected most frequently from feeders (Kabugaand Sarpong, 1991). Presumably the lowest learned not to eat when otherswere eating, whereas ones in the middle did not find replacement as aversive.The frequency of agonistic interactions was 1.4 times higher during feedingperiods (especially the first 30 min) than during idling periods, while amicableinteractions were more frequent during idling.
Rutter et al. (1987) used raw meal data from the LUCIFIR system (seeChapter 2) to test the hypothesis that if one cow replaced another cow at a feedingposition within 1 min more times than the second cow replaced the first, then theformer was dominant. A matrix of the frequency of competitive replacements wasused to generate a social dominance order for a group of 12 cows, and this wasfound to be almost identical to the social dominance order derived from visualobservations of the outcome of all interactions by cows, i.e. it is possible toestimate an animal’s position in the ‘pecking order’ from its feeding behaviour.
Cattle ate faster when there was only one stall for a group of animals thanwhen free access to troughs was allowed (Striklin and Gonyou, 1981).However, the diurnal pattern of eating did not differ between the two situationsand dominant cattle did not prevent submissive ones from gaining access to thesingle feeder.
Dairy cows spend a lot of time visiting concentrate food dispensers and themajority of visits go unrewarded, disrupting the activity of the rest of the herd(Wierenga and Hopster, 1986). When cows were fitted with remote-controlledminiature beepers near the ear to tell them when they could get food, there wasa dramatic reduction in the number of unrewarded visits and consequently lessdisruption.
Bulls are affected by diversions such as heifers or rain. Stags in rut withaccess to hinds in oestrus eat almost nothing, and therefore show an even morepronounced fall in body condition in the autumn than do hinds, or stags keptin controlled conditions.
Sheep
In hill sheep given blocks of supplementary food, younger ewes have been seento consume less than older ewes as a result of social competition, probably
Environmental Factors Affecting Intake 387
3 A door giving access to food that can only be opened by cows wearing the appropriatelycoded collar-borne device.

because the former kept together as a group, separate from the rest of the flock.Two- and 3-year-old ewes approached the food blocks but were prevented fromeating most of the time by the 4-year-old ewes. Thus, social behaviour limits theusefulness of supplementary feeding by causing wide variations in the intakebetween individual ewes.
Isolated lambs eat less than those in groups but, other than that, the size ofthe group does not seem to affect daily intake.
The feeding behaviour of sheep can be influenced by the presence andbehaviour of other animals, predators being an obvious example. As forinteractions between different sheep in a group, when faced with a choicebetween remaining close to other sheep or moving away to graze, more sociableindividuals grazed less (Sibbald et al., 2000). Thus, individual differences in socialmotivation affect the trade-offs that sheep make when foraging.
Frequency of Offering Food
Lactating and dry cows, given an average of 7 kg of concentrates/day, did notchange their silage intake or feeding pattern, irrespective of whether theconcentrate was given in two or 22 feeds/day (Gill and Castle, 1983).
Concentrates were given to ewes, increasing from 400 to 600 to 800 overthe last 6 weeks of pregnancy, once, twice or thrice daily or mixed with silage(Wylie and Chestnutt, 1992). In weeks 5–6 before lambing, silage intakes were758 g DM/day for once, 853 for twice/thrice and 996 for mixed, respectively.Three to four weeks before lambing, intakes were 655, 830 and 987 g DM/day,and in weeks 1–2 they were 552, 782 and 876 g DM/day, respectively. Theseimprovements in silage intake are probably due to a more regular flow ofnutrients from the concentrates to balance those coming from silage.
Disease
Reduced voluntary food intake is one of the first sign of many diseases. Whilein some cases this can be attributed to fever, many diseases do not increasebody temperature, and some other reason for the reduced intake must besought. Pair-feeding experiments show poorer performance of infected animals,i.e. anorexia is not responsible for all of the loss of performance, e.g. chickensinfected with Eimeria spp., sheep with Strongylus matthei.
As with other species, a reduction in food intake is one of the first signs ofdisease in poultry. Decreased weight gains and food intakes are characteristic ofinfection with the various species of Eimeria that cause coccidiosis. Vaccinationagainst Marek’s disease has no effect on intake, although it does lead to theproduction of more extra-sized eggs and a tendency to reduced mortality.
A relatively low level of dosing with Fasciola hepatica (liver fluke) for 25weeks caused a 15% decrease in intake in sheep (Sykes et al., 1980), whilelarge doses severely depressed intake.
388 Chapter 17

Mice force-fed after Listeria monocytogenes infection had increased mortalitycompared with anorexics, and it has been suggested that the purpose of theanorexia is to starve the infecting organisms or stimulate the immune system.Holmes (1993) concludes that: ‘… present explanations for anorexia in parasiticinfections are so rudimentary that this is a most interesting and fruitful field forfuture study’.
Gastrointestinal parasites in sheep
Infestation with helminths causes a primary depression of food intake in sheep,possibly by the continuous stimulation by the parasites of receptors in the gutwall. The steady decline in intake, which occurs even with a constant level ofinfestation, is in parallel with the reduction in plasma protein concentration, and itis possible that a deficiency of amino acids is responsible. Plasma levels of CCKincrease as intake falls during the course of infestations with Trichostrongyluscolubriformis, and this is another factor which might be involved in the loss ofappetite. A CNS CCK-blocker (Mederantil) given to sheep infected with T.colubriformis blocked the intake depression for about 2 h after injection but hadlittle effect in non-infected controls (Dynes et al., 1990).
However, a peripheral CCK-blocker (loxiglumide) had no significant effectin either control or infected lambs (perhaps because the dose was too small orthe experiment too short), and it was concluded that CCK produced bynematode infection acts centrally to inhibit food intake. Plasma gastrin levelsare also increased in gastric parasitization, and gastrin infusion into the hepaticportal vein depresses intake in sheep (Anil and Forbes, 1980a). Further work isrequired to elucidate the possible role of gastrointestinal hormones in theanorexic effects of gut infection.
Pair-feeding experiments, to prevent the difference in food intake thatwould otherwise occur between infested and uninfested animals, show thatthere is still some loss of production probably as a result of the cost of plasmaprotein synthesis. Holmes (1993) states that: ‘… it is still not possible toconstruct accurate balance sheets of protein synthesis in parasitized animals …’and ‘… the cardinal feature of such infections is the loss of considerablequantities of host protein into the gastrointestinal tract and consequent changesin protein synthesis in host tissues’.
Animals on low nutrition, particularly when the food is low in proteincontent, are more susceptible to the hypophagic effects of parasites, so it isparadoxical that, when fed ad libitum, they eat less food than uninfectedanimals. Infusion of 50 g protein/day into the duodenum of lambs infected withT. colubriformis resulted in a food intake depression that was less (22 versus32%) and worm burdens reduced, compared with non-infused controls (Bownet al., 1989).
Following up the possibility that protein deficiency was responsible for thereduced food intake in infected sheep, Kyriazakis et al. (1993b) offered lambsinfected with T. colubriformis a choice of foods high and low in protein contentand found that, relative to uninfected controls, they had reduced daily intake
Environmental Factors Affecting Intake 389

but increased the proportion of the food high in protein, to give approximatelythe same daily protein intake as the controls. This increased protein:energyratio chosen by the infected lambs is presumed to be in response to theincreased requirements for protein induced by the parasites. Subsequently, itwas shown that this difference in selection for protein between parasitized andunparasitized lambs disappeared once the infected animals had becomeresistant to the parasite (Kyriazakis et al., 1996). There is further discussion ofeffects of parasitism on diet selection in Chapter 8.
More recent studies have concentrated on the behaviour of sheep providedwith more natural choices of foods at grazing. While the subject of grazing isnot covered in this book, it is worth noting that sheep trade off increased risk ofbeing parasitized against the nutritive value of herbage. For example, usingOstertagia circumcincta, Hutchings et al. (1999) demonstrated that hungrysheep ate more of a nutritious sward even though it was infested with O.circumcincta, and those immune to the parasite also chose more of thenutritious infested grass than did non-immune animals. The whole area oftrade-off theory in understanding interactions between herbivores and parasitesis discussed by Hutchings et al. (2006).
Conclusions
Below the LCT, energy requirements increase and food intake normallyincreases in parallel. In very cold environments, especially with strong windsand heavy precipitation, animals seek shelter and intake may be reduced. Inhot environments there is a specific negative effect on intake, with a decline inlevel of production; the results of short-term experiments can be misleading,however, as acclimatization to hot weather usually gives opportunity forcompensatory intake in the cool of the night. In reality, there is an almostcontinuous negative relationship between environmental temperature andvoluntary food intake.
Long daylength stimulates food intake. In poultry this is a primary effect asthey do not normally eat at night, but in ruminants it is secondary to thestimulation of growth.
Social facilitation encourages feeding in all farm species, and animalsusually eat more when kept in groups than when penned individually.However, if competition for limited feeding space is severe, then feedingbehaviour is disrupted (see Chapter 2) and daily food intake can be reduced.
Diseases of most types depress voluntary intake. They are likely to do soby causing abdominal discomfort or by disturbing nutrient requirements in sucha way that the food on offer is no longer suitable to meet the newrequirements, a situation likely to reduce intake in order to lessen theimbalance. Where a choice of foods is available, animals tend to behave inways that minimize the parasite burden, but in grazing situations they mustoften make compromises between obtaining sufficient nutrients for their needsand accepting a certain level of parasitism.
390 Chapter 17

18 Epilogue
The years since the publication of the first edition of this book have seen steadyprogress in our knowledge of the role of learning in the control of foodpreferences, but this has not been reflected in any great advancement of ourability to predict voluntary intake. A major limitation is the wide variation inintake and choice between individual animals offered the same food(s) in thesame conditions.
Given the general opinion that intake and choice are controlled to meetthe animal’s requirements, then either there are large differences in therequirements of different animals or the control system is not very precise (orboth). By ‘requirements’ we do not restrict ourselves to nutrient requirements,but we include ‘requirements’ to avoid undue discomfort, ‘requirements’ of thesocial situation in which the animal finds itself and ‘requirements’ to achievegoals that might be different from those we set for our livestock.
As stated in Chapter 15, there are two approaches to looking at voluntaryfood intake and diet selection. One is from the point of view of the animal’sphysiology and seeks to explain food intake and diet selection frommeasurements of such things as blood levels of hormones and metabolites, anddegrees of stimulation of receptors. The other comes from an evolutionarybackground and posits that animals will evolve to use whatever mechanismsallow them to survive and reproduce.
It has to be said that the first of these has not proved to be very successfulor, at least, sufficient entities have not yet been measured in sufficient detail toallow a conclusion as to how intake and selection are controlled. However, thesecond approach is not fully satisfying either, allowing any observation to be‘explained’ on the grounds of evolution without physiological justification.
This chapter brings together some of the various threads that have beenrunning throughout the rest of the book and provides some personalviewpoints and challenges for the future.
© J.M. Forbes 2007.Voluntary Food Intake and Diet Selection 391in Farm Animals 2nd Edition (J.M. Forbes)

Feeding Behaviour
We have seen in Chapter 2 how difficult it is to predict feeding behaviour. Mealsize and inter-meal interval seem to be very loosely controlled – indeed, it canbe speculated that they are not controlled at all – and Smith (2002), speakingfrom a lifetime’s study of the subject, has said that: ‘The apparently simpleobject – the scientific explanation of the size of a meal – has proven elusive. Ithas not been attained yet in any animal under any condition.’
While intake and choice of foods over periods of several days are related toanimals’ nutrient requirements, this is not true for shorter periods, and it raisesserious doubts about the validity of trying to simulate feeding behaviour bymeans of metabolically driven models. For example, the detailed model ofForbes (1980) was induced only to provide realistic meal patterns for sheep byincluding direct mechanistic control of feeding by rate of absorption of nutrientsand, whereas it was described in detail in the first edition of this book, it hasnot been mentioned in this edition, apart from here. Not the least of thedifficulties of accepting a mechanistic model of feeding is the fact that suchmodels generate regular sequences of meals, in contrast to the unpredictableintervals actually observed in many animals (see Chapter 2).
In discussing the difficulty of understanding feeding patterns, Kyriazakis etal. (1999), already quoted in Chapter 7, have passed the opinion that: ‘… thequestion to be asked in relation to diet selection is not “what time periodmatters to the animal?” but “how much change or deviation in the internalstate is the animal prepared to accept?’’ ’. This still assumes that meal-takingand -selecting are driven by the animal’s internal state and not just by externalevents – but state of what?
Mayer (1953) proposed that the state monitored was the concentration ofglucose in the blood of rats, while Booth (1974) suggested that it was rate ofsupply of energy with an additive contribution from gut distension – we shouldthink of many states at once, not just one or two. What is required is a way ofconsidering feeding behaviour that is multidimensional and not dependent onlyon minute-by-minute changes in metabolism. The following speculation ispresented as a possible way forward in describing how steady changes inphysiological variables within the animal can generate the sudden step changesin rate of eating at the start and end of a meal.
The Catastrophe of Feeding
Thom (1975) explores ways of looking at situations in which slow changes insome variables induce very rapid (catastrophic) changes in other variables; asimpler presentation of Thom’s ideas is given by Saunders (1980). Themultidimensional possibilities of catastrophe theory allow us to use more thanone single potential on which feeding depends. In the example that followsonly two potentials are used, as this allows pictorial representation in a way thatis reasonably easy to understand, although more than two potentials can beincorporated by the use of high-order catastrophes.
392 Chapter 18

The potentials adopted here are: (i) the integration of negative feedbacks,which will vary according to the time since eating last occurred, the rate ofdigestion of the food, the capacity of the digestive tract and the bulkiness of thefood, amongst other things; and (ii) the capacity to utilize nutrients generated bythe metabolism of the tissues, varying according to such things as the animal’smetabolic rate and its potential to synthesize protein and fat, amongst otherthings. Figure 18.1 shows Thom’s second-order catastrophe which generates abifurcation, or cusp, diagram.
The sequence of events during a feeding cycle are envisaged to be asfollows, with reference to Fig. 18.1.
A–B: start of eating; as the meal progresses capacity starts to fall; negativefeedback still weak.
B–C: meal continues; capacity still falling; negative feedback increasing instrength; rate of eating slows.
C–D: meal stops.D–E: nutrient supply still rising, but more slowly; capacity starts to increase
as stomach empties.E–F: capacity rising; feedback falling.F–G: capacity rising further; supply falling further.G–A: next meal starts at M, by catastrophic jump.
Epilogue 393
Fig. 18.1. Bifurcation diagram of feeding (see text for explanation).

As the meal starts area X is inaccessible, while area Y is inaccessible later inthe meal. The vertical axis is labelled ‘propensity to eat’, and eating is deemedto start when this potential rises above zero, i.e. at point M midway up thevertical between G and A. Thus, eating starts at the maximum rate, as usuallyseen, but towards the end of the meal rate of eating slows, as between C and Da commonly observed phenomenon.
With a higher capacity for nutrient utilization, e.g. in lactating animals, thecycle is moved towards the viewer so that segment CD now spans the cusp andeating is predicted to stop suddenly; there is faster initial rate of eating and morerapid movement around the circuit, generating an increase in meal frequency.Low demand for nutrients, on the other hand, moves the cycle away from theviewer, predicting a more gradual start to the meal, lower maximum rate ofeating and more gradual slowing towards the end of the meal.
The nature of the two axes is arbitrary, and other factors affecting feedinghave been explored, including ease of prehension of food that predicts thatgrazing animals will fluctuate in their rate of eating during their very long meals.This and other testable outputs of the cusp model can be examined either byscrutiny of past research results or by designing appropriate experiments andmeasurements.
The ‘catastrophe of feeding’ has been briefly presented here to stimulatethought and discussion, and it is the author’s intention to explore its conceptsfurther and to publish the outcomes.
Minimal Total Discomfort: a Multifactorial Approach
No longer can we look upon the various theories of intake control as alternatives,but rather as complementary and contributing to a multifactorial control system.No single factor is essential for normal food intake, and many manipulations thatstay within the physiological range have only small effects that are oftenstatistically non-significant: ‘… the conventional univariate focus mainly onenergy must be replaced with multivariate approaches that recognize multiplebiochemical interactions’ (Provenza and Immense, 2006). This multiplicity offactors is recognized in the MTD hypothesis in which the sum of squares ofdeviations of the current supply of each of the resources of interest from theirideal is calculated. While not linear, the addition of the various signals does avoidthe introduction of interaction between independent variables and overcomes theproblems inherent in multiplicative models that introduce ‘non-trivialrequirements (usually not met) for model testing’ (Pittroff and Soca, 2005).
Like the application of catastrophe theory to feeding described above, theMTD hypothesis is first and foremost an intellectual exercise in which anattempt has been made to incorporate the major factors likely to be involved inthe control of food intake and diet selection, including some features of boththe physiological and the evolutionary approaches. As discussed in Chapter 10,further development is required before it will be clear whether MTD representsa viable way forward in our understanding, and eventually prediction, of intakeand selection.
394 Chapter 18

I suppose the MTD hypothesis is an attempt to bridge the two approachesto food intake control outlined at the start of this chapter. On the one hand, itadopts the commonly held view that there are optimal rates of supply ofnutrients and that the animal behaves in such a way as to try to provide these;on the other, while not getting to the level of receptors, it does acknowledgethat there is sensory information from the body relaying information on thecurrent mismatch between supply and demand. MTD allows both approachesto be incorporated at once, e.g. effects of short-term infusion of an energy-yielding metabolite can be combined with effects of a long-term change incomposition of food.
It is highly unlikely that the MTD approach will ever be ‘proved’ right orwrong. The idea that we will eventually be able to explain and predict by areductionist approach alone the behaviour of such a complex system as thatcontrolling food intake and choice is probably wrong. It is certainly worthpersisting, however, given the importance of optimal nutrition of farm animals,and we should not reject new hypotheses just because they do not giveaccurate predictions, which could hardly be expected when we can currentlymake only crude estimates of some of the important variables in ourcalculations.
Sensing the Environment, External and Internal
General senses
The first primitive organisms to evolve the capacity to move must also havedeveloped receptors to inform them of the environment in which they foundthemselves, otherwise they would have no reason to use the new-found abilityof locomotion. Initially, the receptors would be likely to sense chemicals towhich the proto-animal could respond by moving towards (food) or away from(toxins). Multicellular organisms developed a coelom and eventually a digestivesystem in which to store and digest food. The contents of the digestive systemare outside the body proper and their composition is still sensed, but now amechanism is required to encourage the ingestion of some substances (food)and to avoid the ingestion of others (toxins). Special senses developed to allowthe animal to sense the outside world separately from the world within thedigestive tract and to allow it to make decisions about what (and how much?)to eat, based either on innate preferences or on previous experience.
Special senses
In mammals, the taste of potential food is used as a powerful cue to its nutritivevalue. In some cases (e.g. sugar) the connection between the taste and thenutritive value is close and an innate link can be established. In other cases thenutrient cannot itself be sensed and the animal must learn to rely on some other,proximate, feature of a food source to determine whether it is likely to provide
Epilogue 395

the nutrient in question. Thus, learned associations between the sensoryproperties of foods and their nutritive value are likely to be very primitive onesthat can function at the subconscious level, such as the ability of the effects of apainful stimulus administered to an anaesthetized animal to become associatedwith the flavour of the food available when it recovers consciousness (Provenzaet al., 1994b).
What are the most appropriate means of differentiating foods for differenttypes of animal? We know that mammals are more sensitive to taste, whilevision is more important in birds, but are there particular characteristics thatmake it easier for animals to learn to associate a food with the metabolicconsequences of eating that food? Is a combination of cues, e.g. colour andtaste, more effective than one single cue?
Gastrointestinal receptors
Given that the receptors in the wall of the digestive tract are now no longer indirect contact with the external environment, the information they providecannot be used directly to seek or reject food (except in the case of vomiting).However, their responses can be used as the conditioning stimulus for learnedpreference or aversion to food with a particular taste, or other characteristicsensory property such as colour. Nausea or other feelings of illness, especiallywhen of abdominal origin, are powerful conditioning stimuli presumablybecause they presage more serious illness and/or vomiting. Vomiting is innatelyaversive; also, to expend resources seeking and eating food and then not toobtain any nutritive value from that food is wasteful in the extreme, and wasteis minimized by evolution.
The visceral organs of the ruminant are well supplied with receptors formechanical, chemical and (probably) osmotic stimuli, with afferent informationpassing to the CNS by the vagal and splanchnic routes. While numerousexperiments have been performed in which the natural stimulation of thesereceptors by digesta has been augmented by balloon distension or introductionof chemicals into the rumen, these have often generated conflicting results.Specifically, how does osmolality exert its effect on food intake via the rumenwhen it has proved to be so difficult to identify osmoreceptors? Of the threemajor VFAs, why does butyrate exert least effect on feeding when infused intothe rumen while having the greatest effect on chemoreceptors?
Metabolic receptors
The gastrointestinal receptors cannot be expected to guide the animal to eatamounts and mixtures of foods that meet the animal’s requirements. Suchcontrol must come from within the animal and receptors must exist whichmonitor the supply in relation to the demand. It is unlikely that there is aspecific receptor for each of the 50 or so essential nutrients and, even if therewere such prolificacy of receptor types, how would each one know whether the
396 Chapter 18

level of the nutrient it sensed was sufficient or not? Nutrients are essential whenthey act either as substrates for, or enzymes and cofactors in, essentialmetabolic pathways, so it would seem sensible to look for ways in which theCNS could be informed about the state of a few critical metabolic pathways.One such appears to be the pathway whereby energy is made available in theliver (see Chapter 4).
The concept of a requirement for a nutrient is difficult to sustain when ananimal functions quite well over a range of levels of supply of each nutrient,adapting to an excess by eliminating or storing the unwanted material and to adeficiency by reducing the rate of the pathway in question. The concept‘responses to nutrients’ is more meaningful than that of ‘requirements fornutrients’, and hypotheses that animals endeavour to eat quantities of nutrientswhich support maximum growth or milk production or that they eat tooptimum efficiency do not seem realistic. Rather, animals eat to achieve themost comfortable situation metabolically which does, in practice, often meanthat they eat that amount and proportion of foods which allows them to bemost efficient.
Whatever their nature, the signals generated by the animals’ metabolismcan be used as conditioning stimuli for learned preferences for food, both interms of quality and quantity. An animal whose metabolism is provided withtoo much glucose in relation to lysine may attempt to redress the balance byeating more food (to increase the lysine supply), eating less food (to reduce theglucose supply) or eating a different mixture of foods, if it has the choice (tocorrect the glucose:lysine imbalance). Which of these actions it takes willdepend not only on its immediate circumstances (is there a choice of foodsavailable?) but on its nutritional and metabolic history (what has it learnedpreviously about how to cope with the imbalanced situation?).
Despite our appreciation of the importance of learning and our knowledgeof receptors in the visceral organs, we are still left with the problem of knowinghow animals are able to regulate food intake with reasonable accuracy inrelation to their requirements for normal growth, reproduction and fattening.We know, for example, that pigs in the UK used to become very fat if fed adlibitum, so they clearly had the capacity to eat, digest and metabolize greatquantities of nutrients.
Genetic selection for leanness over the last few decades has produced pigsthat have a low level of food intake, so presumably the lower propensity tofatten has caused that lower food intake – intake is responding to demand.Reduced fat synthesis results in reduced uptake of precursors into adiposetissue, and this must lead to metabolic discomfort due to accumulation of theseprecursors which, in turn, reduces voluntary intake. Is the metabolic discomfortin this case simply an excess of fatty acids available for oxidation in the liver?Or is it a change in the relationship between leptin production by adipocytesand CNS sensitivity to leptin?
A related issue is the ability of animals to select between two foods, amixture of which provides the most appropriate intake of energy and anothernutrient, e.g. protein. Pigs with greater potential rates of lean tissue depositionchoose to eat food with a higher protein:energy ratio than do pigs with a
Epilogue 397

greater propensity to fatten. Again, this is postulated to be related to the abilityof the foods to provide metabolic comfort.
How are we to proceed experimentally to unravel the concept of metabolicdiscomfort?
Central Nervous Involvement
In higher animals, all the capabilities of learning are concentrated in the brain andclosely related structures (CNS). The CNS is provided with information by thespecial senses, gastrointestinal receptors and metabolic sensations and it can useany or all of these as conditioning agents. It may learn, for example, that food withcertain sensory characteristics leads to certain unpleasant gastrointestinalconsequences and avoid eating it on that basis. Another food may be recognizedas one that alleviates a metabolic imbalance and become preferred for that reason.
It is also likely that the CNS is directly sensitive to its own nutrient supply,particularly to energy deficit. However, it is the duty of much of the rest of thebody, particularly the liver, to prevent shortages of nutrient supply to the brain(excesses are not so damaging), so the CNS should not normally have to takeaction to eat food, or avoid eating food, based on its own metabolic status.
The whole concept is summarized in Fig. 18.2, in which the passage of aparcel of food through the GI tract leads to the stimulation of numerousreceptors from which signals are relayed to the CNS in a time-related sequence(Forbes, 1999). This information is integrated and used to generate learnedassociations, e.g. between the sensory properties of the food eaten and itssubsequent gut and metabolic effects. As a result, the CNS controls feeding,digestion and metabolism in ways designed to avoid deficiency or toxicity andto provide an optimum supply of nutrients for the various tissues of the body.
These concepts can be visualized as a ‘satiety cascade’ (Blundell andHalford, 1994), with the information available to the CNS about a particularfood item becoming progressively more accurate as the food is seen or smelledin the environment; tasted and eaten; accumulating in the stomach; yieldingnutrients in the intestines; providing the body with nutrients via the liver;contributing to the body stores of energy and protein.
There is a continual contention between short- and long-term studies –minute-by-minute changes in behaviour, digestion and metabolism on the onehand – continuous and fairly stable demand for nutrients for maintenance andproductive process on the other. It remains to be established experimentallywhether there is additivity between effects of rapidly changing internal signals,such as supply of glucose to the liver, and slow-changing indicators of adiposity,such as leptin.
Future Experimentation
Too many experiments have been carried out without it being clear whathypothesis is being tested. Experimentation must go hand-in-hand with theory, orat least be designed to collect data to construct relationships to be used in models.
398 Chapter 18

Experimental design
Attempts to understand what causes animals to stop eating have often involvedinjection of putative satiety factors into parts of the digestive or vascularsystems, with observation of food intakes during and after the injection period.In a ‘well-designed’ experiment, each animal is given each treatment only oncebefore it is given control and other treatments in a Latin Square design. Thus,the animals are not given the opportunity to learn to associate the effects of theinjection with any characteristic of the food and are denied an important routeof control that is normally open to them, namely learned associations betweenthe sensory properties of the food, its eventual visceral effects and yields ofmetabolites. It is postulated that many such experiments have either under- oroverestimated the satiating effects of metabolites; some may even have shownno effects of a factor which is, under ‘natural’ circumstances, actually quiteimportant and vice versa.
Consider the dilemma of an experimental animal which, despite continuingto eat the same safe food as usual, suddenly feels ill (or metabolicallyuncomfortable) due to an infusion of an imbalancing nutrient. The immediateeffect of the feeling of illness is to depress food intake, but a longer-term effectmight be to render that food aversive, especially if this or a similar treatment isrepeated on other days. However, on non-experimental days, or during controlinfusions, the same food is once again safe. Does the animal learn to associatethe presence of the white-coated experimenter with illness and the blue-overalled technician with well-being? Whatever the outcome, it would hardlybe surprising if it became very confused and gave results that were difficult tointerpret.
Epilogue 399
SightOdour
TasteTexture
GI tract
mechanoreceptorschemoreceptors
Blood-borneliverhindbrain
Bodyadiposemuscle
FOOD DIGESTA NUTRIENTS STORES
CNS
time
Eating MetabolismDigestion
Fig. 18.2. Satiety ‘cascade’. Dotted arrows indicate flows of information to CNS as food goesfrom being identified in the environment to its nutrients being stored in the body (see text forexplanation) (from Forbes, 1999).

If we are to discover the real significance of putative factors involved in thecontrol of food intake, we must give animals a chance to learn about theireffects in a much more natural way than the change-over experiments outlinedabove. During the periods when the animals are exposed to the experimentaltreatment, they should be given a food with distinctive sensory properties,different from the one they normally eat. The treatment–food pairing should berepeated on several occasions to allow the association to be established and, inaddition to recording intake during these treatment periods, the animal shouldbe allowed to demonstrate its feelings for the experimental food, either byrecording intake of the stimulus-paired food in the absence of the treatmentstimulus or by assessing the animal’s preference for this food against anotherdistinctive food which has been paired with a control treatment.
For example, not only does CCK depress food intake in broiler chickensbut it also leads to a conditioned aversion for the colour of food on offer afterthe injection of CCK, relative to a food of a different colour which was availableafter saline injections (Covasa and Forbes, 1994). Learned aversions to novelfoods by farm animals have been demonstrated many times, particularly byProvenza and colleagues and, more recently, learned preferences have alsobeen studied. The development of specific appetites for nutrients, whereanimals not only avoid eating too much of a substance but also avoid eatingtoo little, are clear evidence that learning to balance the diet is possible.
Experimental complexity and the role of modelling
The complexity of the control of food intake suggests that complex experimentsmust be performed to advance our understanding of the system. However, themore elaborate the experiment the more likelihood there is of problemsoccurring where the main parameter to be measured is voluntary food intake,subject as it is to large between- and within-animal variation and to the well-being of the experimental animals. While some complicated experiments maystill be necessary, progress can be made by an alternative strategy involvingtesting of simple hypotheses and linking of ideas and data by simulationmodels.
Toates and Booth (1974) were the first to adopt this approach for the rat,and their model generated realistic predictions concerning meal size andinterval. A similar approach was adopted for ruminants by Forbes (1980), butwith the assumption that feeding was inhibited either by energy-yieldingproducts of digestion or by rumen fill. This approach has been overtaken byseveral developments in our thinking: (i) the realization that feeding behaviouris not closely controlled by metabolic needs or physical constraints; (ii) theincreasing realization of the importance of learning; and (iii) the proposal thatthe various factors affecting intake do so in an integrated (additive?) rather thanan exclusive manner.
400 Chapter 18

Variation between and within individuals
Not only is there considerable variation in feeding behaviour between similaranimals, there are also marked fluctuations in intake and choice on successivedays in any given animal. This variation has often been overlooked because wetend to assimilate data into means or relationships which we test for statisticalsignificance without necessarily ever looking at the raw data. Variability of feedintake within an animal has been postulated in Chapter 10 to enable animalsbetter to manage the relationship between their needs, in terms of nutrientsupply, and the food(s) available to them. Variability between animals is anecessity for allowing Darwinian evolution to proceed.
Variability in genetic potential, and therefore nutrient demand, also meansthat giving a single food to a group is not likely to provide optimally for all ofthe animals. A diet formulated for the needs of the average animal will seesome animals over- and others undersupplied with one or more nutrients.Allowing for this by increasing the concentration of a critical component, e.g.protein, to prevent undersupply for the great majority, will see even morewastage as a greater proportion of the population eat a food excessively high inprotein. Oversupply leads to increased excretion in faeces and urine, especiallycritical for the environment in the cases of nitrogen and phosphorus. Willchoice feeding provide a practical solution by allowing individuals to composetheir own optimum diet?
Practical Considerations Regarding Farm Animals
The reason for our focus in this book on animals of agricultural importance issimple: efficient use of resources, especially food resources, is essential as wetackle the conflict between the increasing number of human beings in the worldand the uncertainties of climate, and thus of agriculture, including those due toglobal warming. While the tone of many parts of this volume is abstract, someof what is written should be of use to those who advise and serve livestockfarmers, if not to those farmers themselves.
A balanced diet
Voluntary intake of a single food will be likely to be at an adequate level tomeet most closely the animal’s ‘requirements’ when it provides nutrients in aratio close to that with which the animal uses those nutrients, i.e. a well-balanced food. Where the food is imbalanced, then intake might increase andthe animals thereby take in too much energy and become fat, or intake mightdecrease if the imbalance causes severe metabolic discomfort.
The problem of deciding when a food is balanced is particularly difficult inthe case of ruminants, in which considerable modification of some foodconstituents takes place before absorption. The relative amounts of acetate,
Epilogue 401

propionate and butyrate produced by ruminal fermentation are unlikely tomatch exactly the amounts required for the animal’s metabolic processes,resulting in a situation of imbalance. While the amount of acetate absorbedfrom the rumen of a lactating cow offered forage might be adequate to supportthe synthesis of milk fat, the amount of propionate might be insufficient forgluconeogenesis to support milk lactose synthesis. An increase in voluntaryintake to supply the propionate would result in overproduction of acetate andeither a return to undereating or an increase in body fat deposition. Thepractical solution is to supplement the forage with concentrates that provide ahigher propionate:acetate ratio, thus balancing the forage and overcoming theimbalance.
It is possible that a ruminal fermentation modifier, by increasing thepropionate:acetate ratio, might increase the intake of a forage. However, theforage may well have other imbalances, such as a gross deficiency of protein oran imbalance in the ratio of amino acids, which prevent a higher level ofvoluntary intake even when the VFA balance is corrected. The problem ofamino acid supply is of particular importance in ruminants in which dietarynitrogen sources are considerably metabolized by the ruminal microflora toproduce an imbalanced mixture of absorbed amino acids, even when thedietary amino acid mixture was balanced. Hence the importance of providingsources of some essential amino acids that escape ruminal degradation (UDP),as well as sufficient sources of degradable nitrogen so as not to limit microbialactivity in the rumen (RDP).
The ruminant nutritionist strives to minimize the cost of a diet (by includingcheap, fibrous materials) while ensuring adequate intake of digestible nutrients.Recent research has given us considerable confidence in discussing theimportance of learning in animals’ adaptation to changes in the food(s) onoffer, but we still need to know more about how ruminants trade off the variousfactors tending to stimulate and inhibit feeding, especially the balance betweennutrients and fibre.
Adequate ways of predicting the yields of absorbed nutrients from thecomposition of the diet and the characteristics of the animal are thereforeof the utmost importance and dynamic modelling, supported by appropriateexperimentation, provides the best chance of achieving this.
Choice feeding
Chapters 6, 7, 8 and 13 have provided many examples of the ability of animalsto correct nutritional imbalances by making appropriate choices from two ormore foods. While there is some commercial interest in choice feeding usingwhole cereal grains for poultry, it is with ruminants that the greatest potentiallies, given our relative ignorance of the ability of forage foods to provide abalanced diet in most situations. We have ample evidence that ruminants arecapable of making nutritionally wise choices between foods but, as yet, fewattempts have been made to develop choice feeding to answer the problemsoutlined above.
402 Chapter 18

There is a rational fear that, given free access to concentrates, animalswould gorge themselves in the short term and eat wastefully large amounts inthe long term. However, it may be that offering choices between two forages,or a forage and a by-product such as brewers grains, would actually reduce theneed for concentrate supplementation.
It would be a mistake to expect choice feeding to solve all the problems ofnutrition of farm animals. We do not yet know the limits to animals’ ability toselect appropriately in situations where one food is scarce or where one foodcontains innately aversive compounds, even where these are not toxic. Apparentlysimilar animals can show quite different levels of intake and dietary preference,and it is not known to what extent this is due to differences in their nutritionalhistory and nutrient requirements and to what extent it is inexplicable, randomvariation.
Welfare
In the wild most animals have access to, and eat from, a variety of foodmaterials. Two of the ‘five freedoms’ to which farm animals are entitled are‘freedom from hunger and thirst’ and ‘freedom to indulge in most natural formsof behaviour’. Where a dietary imbalance exists which, according to thediscussion above, causes metabolic discomfort, choice feeding is clearly goodfor the welfare of animals. What is less certain is whether the welfare of animalsgiven a completely balanced diet ad libitum can be improved by access to achoice in order to allow them to indulge in the natural behaviour of dietselection and to be given a feeling of some control over their own lives.
If it causes discomfort to eat too much food, or too little, or an imbalance ofnutrients, then it should be possible to integrate such food-related discomfortswith other discomforts due to an ‘imbalanced’ environment, e.g. too little space,too hot a temperature. The MTD hypothesis tentatively provides a way ofincorporating disparate stressors in the same model (Forbes, 2006a).
It has been shown that multiple stressors increase the heterophil:lymphocyteratio and plasma corticosterone in chicks in an approximately additive manner(McFarlane and Curtis, 1989). The growth rate of pigs subjected to adverseenvironmental temperature, stocking density and regrouping in all combinationswas depressed according to the sum of the separate effects (Hyun et al., 1998).As the number of stressors increased from 0 to 3, weight gain, food intake andconversion efficiency all decreased linearly (see Fig. 18.3). It seems likely,therefore, that the effects of stressors are additive and that they can be combinedwith nutrient imbalances by means of the MTD hypothesis.
The following example explores the application of the MTD hypothesis tofood- and environment-generated discomforts and uses protein intake,environmental temperature and space allowance (Forbes, 2006a). If each ofthese is within the optimum range for the animal in question, the place theyoccupy in 3D space can be considered to be the ‘desired’ point (see Fig. 18.4).
However, the animal may be currently overeating protein (perhapsbecause the dietary protein content is high in relation to energy concentration),
Epilogue 403

is cold-stressed and is allowed less space than it requires for comfort: this is the‘current’ position. The shortest route to get from ‘current’ to ‘desired’ is alongthe straight line joining the two, and the length of this can be calculated fromthe square root of the sum of squares of the three individual deviations, dP, dEand dS (Pythagoras). In order to transform each of the three factors into formsin which they can be combined, it is necessary to put each on a numerical scaleand to express the difference between current and desired as a proportion of
404 Chapter 18
1.6
1.7
1.8
1.9
2.0
2.1
2.2
0 1 2 3
Stressor order
Foo
d in
take
(kg
/day
)
Fig. 18.3. Effect of stressor order on average food intake by growing pigs over a 4-weekperiod (from Hyun et al., 1998).
Environmental temperature
Spaceallowance
current
dP
dEdS
desired
Proteinintake
Fig.18.4. Diagram of Pythagorean calculation of distance between current and desiredposition of an animal in relation to protein intake, environmental temperature and spaceallowance (from Forbes, 2006a).

the desired value. These proportional differences are then squared, summedand the square root of the sum is obtained as an expression of total discomfort.
Thus:
total discomfort = (18.1)
where d is the desired value and c is the current value of each of i variablesaffecting welfare.
In our example (Forbes, 2006a) the current protein intake is 12 g/day andthe desired intake is 10 g/day, giving a deviation of 2 g/day, and theproportional deviation is 2/12 = 0.17, see Chapter 10. For environmentaltemperature it would be useless to take absolute zero as the starting point of thetemperature scale; rather, we can use the minimum at which the animal cansurvive, say 273°A (0°C), as the low end of the range and then calculatediscomfort as the current temperature relative to its optimal temperature, say303°A. Thus, a temperature of 293°A would give a relative proportionaldiscomfort of (303–293)/30 = 0.33.
As far as space allowance is concerned, a minimum realistic space mightbe the area the animal itself occupies, say 0.1 m2, while the optimum might bethat space that it is prepared to work to attain, say 1 m2. The range fromminimal to optimal is thus 0.9 m2 and an animal with a space allowance of 0.2m2 has a proportional deviation of (0.9 – 0.2)/0.9 = 0.77. Squaring these threedeviations and taking the square root gives a total discomfort of 0.854. Thesecalculations suggest that space allowance is having the largest effect ondiscomfort. Increasing this to 0.55 m2 greatly reduces total discomfort to 0.14.This compares with a minimum total discomfort of 0.22 for a situation of milddietary imbalance (Forbes, 2006b).
This proposal is very speculative and further research will be requiredbefore it is known whether it provides any advantage in solving ‘… theproblem … to find the right parameters, variables and indicators and the rightsolutions using firm biological, psychological and statistical methods’ (Koene,2006). At least it provides a framework upon which to design relevant research,which is the main function of research models that can themselves never bemore than semi-quantitative.
Conclusion
A large part of this book is taken up with simple descriptions of relationshipsbetween food intake and the many factors that might affect it, whether these beexperimental infusions of hormones or changes in food composition orphysiological status. These descriptions are necessary for the completeness ofthe book, but do not individually give us great insight into how intake andchoice might be controlled.
Therefore, other parts of the book are occupied with various theories andintegrating hypotheses that are, on the whole, speculative. Such speculation is
j
j i
j j jd c d=
=
∑ −1
2(( ) / )
Epilogue 405

also necessary if advances are to be made in understanding and thereforeprediction. Precise prediction of food intake and diet selection will then becomemore useful as a tool in diet formulation, concentrate supplementation andgrazing management, although evidence on this last area has not been presentedhere.
We need to perform well-controlled, critical experiments to clarifyindividual parts of the jigsaw, but to integrate this with models and to validatethe models with other, independent results. Given the key role of learning inthe control of food intake and diet selection, future models may benefit fromthe use of artificial intelligence techniques, but such applications are only justbeginning. It may well be that intake control is so complex that it will not befully understood until we have models as complex as animals themselves, asituation impossible to envisage with current research paradigms.
If some of the experimental results and other observations described herelead others to different hypotheses, and if the approaches to integrationadopted here encourage further development then that is all I can hope for.The advances made since the publication of the first edition in 1995 have beenconsiderable and I hope a ‘solution’ to the mystery of how animals control theamount and mixture of foods they eat is achieved in the useful lifetime of thispresent volume. I strongly suspect, however, that a single ‘solution’ will not befound to fit all situations.
406 Chapter 18

References
Adam, C.L. and Mercer, D.K. (2004) Appetite regulation and seasonality: implications for obesity.Proceedings of the Nutrition Society 63, 413–419.
Adams, D.C., Nelson, T.C., Reynolds, W.L. and Knapp, B.W. (1986) Winter grazing activity andforage intake of range cows in the northern Great Plains. Journal of Animal Science 62,1240–1246.
Adams, G.B. and Forbes, J.M. (1981) Additivity of effects of ruminal acetate and either portalpropionate or rumen distension on food intake in sheep. Proceedings of the Nutrition Society40, 44A.
AFRC (1991) AFRC Technical Committee on Responses to Nutrients. Report No. 8. Voluntaryintake of cattle. Nutrition Abstracts and Reviews 61, 815–823.
Agreil, C., Meuret, M. and Fritz, H. (2006) Adjustment of feeding choices and intake by aruminant foraging in varied and variable environments: new insights from continuous bitemonitoring. In: Bels, V.L. (ed.) Food and Feeding in Domestic Vertebrates. A ComprehensiveApproach from Structure to Behaviour. CAB International, Wallingford, UK, pp. 302–325.
Alawa, J.P., Fishwick, G., Parkins, J.J. and Hemingway, R.G. (1987) A note on the effects ofdietary protein degradability in the rumen on the voluntary intake and digestibility of barleystraw by lactating beef cows. Animal Production 44, 446–449.
Aldrich, C.G., Rhodes, M.T., Miner, J.L. and Kerley, M.S. (1993) The effects of endophyte-infected tall fescue consumption and use of a dopamine antagonist on intake, digestibility,body temperature and blood constituents in sheep. Journal of Animal Science 71, 158–163.
Allen, M.S. (1996) Physical constraints on voluntary intake of forages by ruminants. Journal ofAnimal Science 74, 3063–3075.
Andersson, B. and Larsson, B. (1961) Influence of local temperature changes in the preoptic areaand rostral hypothalamus on the regulation of food and water intake. Acta PhysiologicaScandinavica 52, 75–89.
Anil, M.H. and Forbes, J.M. (1980a) Effects of insulin and gastrointestinal hormones on feedingand plasma insulin levels in sheep. Hormone and Metabolic Research 12, 234–236.
Anil, M.H. and Forbes, J.M. (1980b) Feeding in sheep during intraportal infusions of short-chainfatty acids and the effect of liver denervation. Journal of Physiology 298, 407–414.
Anil, M.H. and Forbes, J.M. (1987) Neural control and sensory functions of the liver. Proceedingsof the Nutrition Society 46, 125–133.
© J.M. Forbes 2007.Voluntary Food Intake and Diet Selection 407in Farm Animals 2nd Edition (J.M. Forbes)

Anil, M.H. and Forbes, J.M. (1988) The roles of hepatic nerves in the reduction of food intake asa consequence of intraportal sodium propionate administration in sheep. Quarterly Journalof Experimental Physiology 73, 539–546.
Anil, M.H., Mbanya, J.N., Symonds, H.W. and Forbes, J.M. (1993) Responses in the voluntaryintake of hay or silage by lactating cows to intra-ruminal infusions of sodium acetate orsodium propionate, the tonicity of rumen fluid or rumen distension. British Journal ofNutrition 69, 699–712.
Appleby, M.C., Pajor, E.A. and Fraser, D. (1992a) Individual variation in feeding and growth ofpiglets: effects of increased access to creep feed. Animal Production 55, 147–152.
Appleby, M.C., Hughes, B.O. and Elson, H.A. (1992b) Poultry Production Systems – Behaviour,Management and Welfare. CAB International, Wallingford, UK.
ARC (1980) The Nutrient Requirements of Ruminant Livestock. Commonwealth AgriculturalBureaux, Farnham Royal, UK.
ARC (1981) The Nutrient Requirements of Pigs. CABI, Farnham Royal, UK.Arsenos, G. and Kyriazakis, I. (1999) The continuum between preferences and aversions for
flavoured foods in sheep conditioned by administration of casein doses. Animal Science 68,605–616.
Arsenos, G., Hills, J. and Kyriazakis, I. (2000) Conditioned feeding responses in sheep towardsflavoured foods associated with casein administration: the role of long delay learning. AnimalScience 70, 157–169.
Ash, R.W. (1959) Inhibition and excitation of reticulo-ruminal contractions following theintroduction of acids into the rumen and abomasum. Journal of Physiology 147, 58–73.
Auffray, P. and Marcilloux, J.C. (1983) Studies of feeding behaviour in the adult pig.Reproduction, Nutrition, Développement 23, 517–524.
Aydintug, S. and Forbes, J.M. (1985) Additive effects of intraventricular injection of noradrenalineand intra-ruminal infusion of sodium acetate on food intake of sheep. Proceedings of theNutrition Society 44, 48A.
Baile, C.A. (1975) Control of feed intake in ruminants. In: McDonald, I.W. and Warner, A.C.I.(eds) Digestion and Metabolism in the Ruminant. University of New England, Armidale,Australia, pp. 333–350.
Baile, C.A. and Forbes, J.M. (1974) Control of feed intake and regulation of energy balance inruminants. Physiological Reviews 54, 160–214.
Baile, C.A. and Mayer, J. (1968) Hypothalamic temperature and the regulation of feed intake ingoats. American Journal of Physiology 214, 677–684.
Baile, C.A. and Mayer, J. (1969) Depression of feed intake of goats by metabolites injected duringmeals. American Journal of Physiology 217, 1830–1836.
Baile, C.A. and McLaughlin, C.L. (1970) Feed intake of goats during volatile fatty acid injectionsinto four gastric areas. Journal of Dairy Science 53, 1058–1063.
Baile, C.A. and McLaughlin, C.L. (1987) Mechanisms controlling feed intake in ruminants: areview. Journal of Animal Science 63, 915–922.
Baile, C.A., Mayer, J., Mahoney, A.W. and McLaughlin, C. (1969) Hypothalamic hyperphagia ingoats and some observations of its effect on glucose utilisation rate. Journal of Dairy Science52, 101–109.
Baile, C.A., McLaughlin, C.L. and Della-Fera, M.A. (1986) Role of cholecystokinin and opioidpeptides in control of food intake. Physiological Reviews 66, 172–234.
Baile, C.A., McLaughlin, C.A., Buonomo, F.C., Lauterio, T.J., Marson, L. and Della-Fera, M.A.(1987) Opioid peptides and the control of feeding in sheep. Federation Proceedings 46,173–177.
Bailey, M. (1999) The water requirements of poultry. In: Wiseman, J. and Garnsworthy, P.C. (eds)Recent Developments in Poultry Nutrition. Vol. 2, Nottingham University Press, UK,pp. 321–337.
408 References

Baker, D.H., Katy, R.S. and Easter, R.A. (1975) Lysine requirement of growing pigs at two levelsof dietary protein. Journal of Animal Science 40, 851–856.
Balch, C.C. and Campling, R.C. (1961) Factors affecting the voluntary intake of food by cows. 1.Preliminary observations on the effect, on the voluntary intake of hay, of changes in theamount of the reticulo-ruminal contents. British Journal of Nutrition 15, 523–530.
Balch, C.C. and Campling, R.C. (1962) Regulation of voluntary food intake in ruminants.Nutrition Abstracts and Reviews 32, 669–686.
Baldwin, B.A. (1976) Quantitative studies on taste preference in pigs. Proceedings of the NutritionSociety 35, 69–73.
Baldwin, B.A. (1979) Operant studies on the behaviour of pigs and sheep in relation to thephysical environment. Journal of Animal Science 49, 1125–1134.
Baldwin, B.A. (1985) Neural and hormonal mechanisms regulating food intake. Proceedings ofthe Nutrition Society 44, 303–311.
Baldwin, B.A. and Parrott, R.F. (1979) Studies on intracranial electrical self-stimulation in pigs inrelation to ingestive and exploratory behaviour. Physiology and Behavior 22, 723–730.
Baldwin, B.A. and Parrott, R.F. (1982) Self-stimulation in the sheep: interactions with ingestivebehaviour and light cycle. Physiology and Behavior 28, 77–81.
Baldwin, B.A., Grovum, W.L., Baile, C.A. and Brobeck, J.R. (1975) Feeding followingintraventricular injection of Ca, Mg or pentobarbital. Pharmacology, Biochemistry andBehavior 3, 915–918.
Baldwin, B.A., Cooper, T.R. and Parrott, R.F. (1983) Intravenous cholecystokinin octapeptide inpigs reduces operant responding for food, water, sucrose solution or radiant heat. Physiologyand Behavior 30, 399–403.
Baldwin, B.A., de la Riva, C. and Ebenezer, I.S. (1990a) Effects of intracerebroventricularinjection of dynorphin, leumorphin and alpha neo-endorphin on operant feeding in pigs.Physiology and Behavior 48, 821–824.
Baldwin, B.A., Ebenezer, I.S. and de la Riva, C. (1990b) Effects of intracerebroventricular injectionof muscimol or GABA on operant feeding in pigs. Physiology and Behavior 48, 417–421.
Baldwin, B.A., Riva, C. and De, R. (1995) Effects of the 5-HT1A agonist 8-OH-DPAT on operantfeeding in pigs. Physiology and Behavior 58, 611–613.
Bandyk, C.A., Cochran, R.C., Wickersham, T.A., Titgemeyer, E.C., Farmer, C.G. and Higgins, J.J.(2001) Effect of ruminal vs. postruminal administration of degradable protein on utilizationof low-quality forage by beef steers. Journal of Animal Science 79, 225–231.
Banfield, M.J. and Forbes, J.M. (2001) Effects of whole wheat dilution vs. substitution oncoccidiosis in broiler chickens. British Journal of Nutrition 86, 89–95.
Banfield, M.J., Kwakkel, R.P. and Forbes, J.M. (2002) Effects of wheat structure and viscosity oncoccidiosis in broiler chickens. Animal Feed Science and Technology 98, 37–48.
Barach, I., Nitsan, Z. and Nir, I. (1992) Metabolic and behavioural adaptation of light-bodiedchicks to meal feeding. British Poultry Science 33, 271–278.
Barb, C.R., Yan, X., Azain, M.J., Kraeling, R.R., Rampacek, G.B. and Ramsay, T.G. (1998)Recombinant porcine leptin reduces feed intake and stimulates growth hormone secretion inswine. Domestic Animal Endocrinology 15, 77–86.
Barb, C.R., Robertson, A.S., Barrett, J.B., Kraeling, R.R. and Houseknecht, K.L. (2004) The roleof melanocortin-3 and -4 receptor in regulating appetite, energy homeostasis andneuroendocrine function in the pig. Journal of Endocrinology 181, 39–52.
Barbato, G.F., Siegel, P.B. and Cherry, J. (1982) Genetic analysis of gustation in the fowl.Physiology and Behavior 27, 29–33.
Barbato, G.F., Cherry, J.A., Siegel, P.B. and Van Krey, H.P. (1984) Selection for body weight ateight weeks of age. 17. Overfeeding. Poultry Science 63, 11–18.
Barber, J., Brooks, P.H. and Carpenter, J.L. (1989) The effects of water delivery on the voluntaryfood intake, water use and performance of early weaned pigs from 3 to 6 weeks of age. In:
References 409

Forbes, J.M., Varley, M.A. and Lawrence, T.L.J. (eds) The Voluntary Food Intake of Pigs.British Society of Animal Production, Edinburgh, UK.
Bardos, G. (2001) Conditioned taste aversion to gut distension in rats. Physiology and Behavior74, 407–413.
Bargeloh, J.F., Hibbs, J.W. and Conrad, H.R. (1975) Effect of prepartal hormone administrationon feed intake and mineral metabolism of cows. Journal of Dairy Science 58, 1701–1707.
Barkley, G.R., Forbes, J.M. and Miller, H.M. (2004) Phosphorus nutrition of laying hens: phytaseand diet selection. British Journal of Nutrition 92, 233–240.
Barrio, J.P., Zhang, S.Y., Zhu, Z.K., Wu, F.L., Mao, X.Z., Bermudez, F.F. and Forbes, J.M. (2000)The feeding behaviour of the water buffalo monitored by a semiautomatic feed intakerecording system. Journal of Animal and Feed Sciences 9, 55–72.
Barry, T.N. (1976) Effects of intraperitoneal injections of DL-methionine on the voluntary intakeand wool growth of sheep fed sole diets of hay, silage and pasture differing in digestibility.Journal of Agricultural Science 86, 141–149.
Barry, T.N. and Manley, T.R. (1986) Glucose and protein metabolism during late pregnancy intriplet-bearing ewes given fresh forages. 1. Voluntary intake and birth weight. British Journalof Nutrition 54, 521–534.
Bauman, D.E., Eppard, P.J., DeGeeter, M.J. and Lanza, G.M. (1984) Responses of highproducing dairy cows to long term treatment with pituitary- and recombinant-growthhormone. Journal of Dairy Science 68, 1352–1362.
Baumgardt, B.R. (1970) Regulation of feed intake and energy balance. In: Phillipson, A.T. (ed.)Physiology of Digestion and Metabolism in the Ruminant. Oriel Press, Newcastle upon Tyne,UK, pp. 235– 253.
Baumont, R., Brun, J.P. and Dulphy, J.P. (1989) Influence of the nature of hay on its ingestibilityand the kinetics of intake during large meals in sheep and cow. In: XVIth InternationalGrassland Congress, Nice, France, pp. 787–788.
Baumont, R., Malbert, C.H. and Ruckenbusch, Y. (1990) Mechanical stimulation of rumen fill andalimentary behaviour in sheep. Animal Production 50, 123–128.
Bazeley, D.R. and Ensor, C.V. (1989) Discrimination learning in sheep with cues varying inbrightness and hue. Applied Animal Behaviour Science 23, 293–299.
Bell, F.R. and Sly, J. (1983) The olfactory detection of sodium and lithium salts by sodiumdeficient cattle. Physiology and Behavior 31, 307–313.
Bels, V.L. (ed.) (2006) Food and Feeding in Domestic Vertebrates: A Comprehensive Approachfrom Structure to Behaviour. CAB International, Wallingford, UK.
Bennett, C.D. and Classen, H.L. (2003) Performance of two strains of laying hens fed ground andwhole barley with and without access to insoluble grit. Poultry Science 82, 147–149.
Benson, J.A., Reynolds, C.K., Humphries, D.J., Rutter, S.M. and Beever, D.E. (2001) Effects ofabomasal infusion of long-chain fatty acids on intake, feeding behaviour and milk productionin dairy cows. Journal of Dairy Science 84, 1182–1191.
Bermejo, J.L., Roehe, R., Rave, G. and Kalm, E. (2003a) Comparison of linear and nonlinearfunctions and covariance structures to estimate feed intake pattern in growing pigs. LivestockProduction Science 82, 15–26.
Bermejo, J.L., Roehe, R., Schulze, V., Looft, H. and Kalm, E. (2003b) Genetic change of feedintake curves in growing pigs using nonlinear two-stage genetic analysis and linear randomregression models. Journal of Animal Breeding and Genetics 120, 217–227.
Bermejo, J.L., Roehe, R., Schulze, V., Rave, G., Looft, H. and Kalm, E. (2003c) Randomregression to model genetically the longitudinal data of daily feed intake in growing pigs.Livestock Production Science 82, 189–199.
Bermudez, F.F., Forbes, J.M. and Injidi, M.H. (1983) Involvement of melatonin and thyroidhormones in the control of sleep, food intake and energy metabolism in the domestic fowl.Journal of Physiology 337, 19–27.
410 References

Bermudez, F.F., Sanz Arias, R. and Forbes, J.M. (1984) Effect of feed quality on the growth checkat weaning in artificially reared lambs. Research and Development in Agriculture 1, 113–117.
Berthoud, H.R. and Seeley, R.J. (eds) (1999) Neural and Metabolic Control of MacronutrientIntake. CRC Press, Boca Raton, Florida.
Bhargava, P.K., Ørskov, E.R. and Walli, T.K. (1988) Rumen degradation of straw. 4. Selection anddegradation of morphological components of barley straw by sheep. Animal Production 47,105–110.
Bhattacharya, A. and Warner, R.G. (1967) Rumen pH as a factor for controlling feed intake inruminants. Journal of Dairy Science 50, 1116–1119.
Bhattacharya, A. and Warner, R.G. (1968a) Influence of varying rumen temperature on centralcooling or warming and on regulation of voluntary feed intake of dairy cattle. Journal ofDairy Science 51, 1481–1489.
Bhattacharya, A.N. and Warner, R.G. (1968b) Voluntary feed intake of pelleted diets for cattle,sheep and rabbits as affected by different alkali supplements. Journal of Animal Science 27,1418–1425.
Bhatti, B.M. and Morris, T.R. (1978) The effect of ahemeral light and dark cycles on patterns offood intake by the laying hen. British Poultry Science 19, 125–128.
Bines, J.A. (1979) Voluntary food intake. In: Broster, W.H. and Swan, H. (eds) Feeding Strategyfor the High Yielding Dairy Cow. Granada, London, pp. 23–48.
Bines, J.A. (1985) Feeding systems and food intake by housed dairy cows. Proceedings of theNutrition Society 44, 355–362.
Bines, J.A., Suzuki, S. and Balch, C.C. (1969) The quantitative significance of long-termregulation of food intake in the cow. British Journal of Nutrition 23, 695–704.
Bines, J.A., Napper, D.J. and Johnson, V.W. (1977) Long-term effects of level of intake and dietcomposition on the performance of lactating dairy cows. 2. Voluntary intake and rationdigestibility in heifers. Proceedings of the Nutrition Society 36, 146A.
Blair, R. and Fitzsimons, J. (1970) A note on the voluntary feed intake and growth of pigs givendiets containing an extremely bitter compound. Animal Production 12, 529–530.
Blaxter, K.L. (1962) The Energy Metabolism of Ruminants. Hutchinson, London.Blaxter, K.L., Fowler, V.R. and Gill, J.C. (1982) A study of the growth of sheep to maturity.
Journal of Agricultural Science 98, 405– 420.Blummel, M. and Becker, K. (1997) The degradability characteristics of fifty-four roughages and
roughage neutral-detergent fibres as described by in vitro gas production and theirrelationship to voluntary feed intake. British Journal of Nutrition 77, 757–768.
Blummel, M., Paul, C., Goodchild, A. and Becker, K. (1996) Grinding energy and in vitro gastechnique for the assessment of Syrian barley straws: physical and microbial degradation andvoluntary feed intake by sheep. Journal of Animal Physiology and Animal Nutrition 76,132–140.
Blundell, J.E. and Halford, J.C.G. (1994) Regulation of nutrient supply: the brain and appetitecontrol. Proceedings of the Nutrition Society 53, 407–418.
Bocquier, F., Theriez, M. and Brelurut, A. (1987) The voluntary hay intake by ewes during thefirst week of lactation. Animal Production 44, 387–394.
Bocquier, F., Ligios, S., Molle, G. and Casu, S. (1997) Effect of photoperiod on milk yield, milkcomposition and voluntary food intake in lactating dairy ewes. Annales De Zootechnie 46,427–438.
Boorman, K.N. (1979) Regulation of protein and amino acid intake. In: Boorman, K.N. andFreeman, B.M. (eds) Food Intake Regulation in Poultry. Longman, Edinburgh, UK,pp. 87–126.
Booth, D.A. (1978) Prediction of feeding behaviour from energy flows in the rat. In: Booth, D.A.(ed.) Hunger Models: Computable Theory of Feeding Control. Academic Press, London,pp. 227–278.
References 411

Bown, M.D., Poppi, D.P. and Sykes, A.R. (1989) The effect of post-ruminal infusion of protein orenergy on the pathology of Trichostrongylus colubriformis infection and body composition inlambs. Proceedings of the New Zealand Society of Animal Production 46, 27–30.
Bradford, M.M.V. and Gous, R.M. (1991) The response of growing pigs to a choice of dietsdiffering in protein content. Animal Production 52, 185–192.
Bradford, M.M.V. and Gous, R.M. (1992) The response of weaner pigs to a choice of foodsdiffering in protein content. Animal Production 55, 227–232.
Brink, D.R. (1975) Effect of ambient temperature on lamb performance. MS thesis, Kansas StateUniversity, Manhattan, Kansas.
Brobeck, J.R. (1948) Food intake as a mechanism of temperature regulation. Yale Journal ofBiology and Medicine 20, 545–552.
Brody, T.B., Cherry, J.A. and Siegal, P.B. (1984) Responses to dietary self selection and caloriesin liquid form by weight selected lines of chickens. Poultry Science 63, 1626–1633.
Brooks, P.H. and Carpenter, J.L. (eds) (1990) The water requirement of growing-finishing pigs –theoretical and practical considerations. Recent Advances in Animal Nutrition. Butterworths,London, pp. 115–136.
Brouns, F., Edwards, S.A. and English, P.R. (1995) Influence of fibrous feed ingredients onvoluntary intake of dry sows. Animal Feed Science and Technology 54, 301–313.
Bruce, E.H., Prescott, N.B. and Wathes, C.M. (2003) Preferred food rewards for laying hens inbehavioural experiments. British Poultry Science 44, 345–349.
Buchanan-Smith, J.G. (1990) An investigation into palatability as a factor responsible for reducedintake of silage by sheep. Animal Production 50, 253–260.
Bueno, L. (1975) Role of dl-lactic acid in the control of food intake in the sheep. Annales deRecherches Vétérinaires 6, 325–336.
Bueno, L., Duranton, A. and Ruckebusch, Y. (1983) Antagonistic effects of naloxone on CCK-octapeptide induced satiety and rumino-reticular hypomotility in sheep. Life Sciences 32,855–863.
Bungo, T., Izumi, T., Kawamura, K., Takagi, T., Ueda, H. and Furuse, M. (2003) Intracerebroven-tricular injection of muscimol, baclofen or nipecotic acid stimulates food intake in layer-type,but not meat-type, chicks. Brain Research 225, 249–269.
Burkhart, C.A., Cherry, J.A., Van Krey, H.P. and Siegel, P.B. (1983) Genetic selection for growthrate alters hypothalamic satiety mechanisms. Behavior and Genetics 13, 295–300.
Burritt, E.A. and Provenza, F.D. (1996) Amount of experience and prior illness affect theacquisition and persistence of conditioned food aversions in lambs. Applied AnimalBehaviour Science 48, 73–80.
Burritt, E.A. and Provenza, F.D. (2000) Role of toxins in intake of varied diets by sheep. Journalof Chemical Ecology 26, 1991–2005.
Byerly, T.C. (1979) Prediction of the food intake of laying hens. In: Boorman, K.N. and Freeman,B.M. (eds) Food Intake Regulation in Poultry. British Poultry Science Ltd., Edinburgh, UK,pp. 327–390.
Cameron, N.D., McCullough, E., Troup, K. and Penman, J.C. (2003) Serum neuropeptide Y(NPY) and leptin concentrations in pigs selected for components of efficient lean growth.Domestic Animal Endocrinology 24, 15–29.
Campion, D.P. and Leek, B.F. (1997) Investigation of a ‘fibre appetite’ in sheep fed a ‘long fibre-free’ diet. Applied Animal Behaviour Science 52, 79–86.
Campling, R.C. (1966) The intake of hay and silage by cows. Journal of the British GrasslandSociety 21, 41–48.
Campling, R.C. and Balch, C.C. (1961) Factors affecting the voluntary intake of food by cows. 2.The relationship between the voluntary intake of roughages, the amount of digesta in thereticulo-rumen and the rate of disappearance of digesta from the alimentary tract. BritishJournal of Nutrition 15, 531–540.
412 References

Carlisle, H.J. and Ingram, D.L. (1973) The effects of heating and cooling the spinal cord andhypothalamus on thermoregulatory behaviour in the pig. Journal of Physiology 231,353–364.
Carro, M.D., Lopez, S., Gonzalez, J.S. and Ovejero, F.J. (1991) The use of the rumendegradation characteristics of hay as predictors of its voluntary intake by sheep. AnimalProduction 52, 133–139.
Carter, R. and Grovum, W.L. (1990a) Factors affecting the voluntary intake of food by sheep. 5.The inhibitory effect of hypertonicity in the rumen. British Journal of Nutrition 64, 285–299.
Carter, R.R. and Grovum, W.L. (1990b) A review of the physiological significance of hypertonicbody fluids on feed intake and ruminal function: salivation, motility and microbes. Journal ofAnimal Science 68, 2811–2832.
Castle, M.E. (1983) (ed.) Feeding High-quality Silage. Technical Bulletin No.2, Silage for MilkProduction, NIRD, HRI, Reading, UK, pp. 127–150.
Castle, M.E., Retter, W.C. and Watson, J.N. (1979) Silage and milk production: comparisonsbetween grass silage of three different chop lengths. Grass and Forage Science 34, 293–301.
Castonguay, T.W., Kaiser, L.L. and Stern, J.S. (1986) Meal pattern analysis: artefacts,assumptions and implications. Brain Research Bulletin 17, 439–443.
Cave, N.A.G. (1982) Effect of dietary short- and medium-chain fatty acids on feed intake bychicks. Poultry Science 61, 1147–1153.
Cervero, F. (1994) Sensory innervation of the viscera: peripheral basis of visceral pain.Physiological Reviews 74, 95–138.
Chah, C.C. and Moran, E.T. (1985) Egg characteristics of high performance hens at the end oflay when given cafeteria access to energy, protein and calcium. Poultry Science 64,1696–1712.
Chamberlain, A.T. and Wilkinson, J.M. (1996) Feeding the Dairy Cow. Chalcombe Publications,Lincoln, UK.
Chapman, H.W. and Grovum, W.L. (1982) Studies on the palatability of salt and urea in sheep.Proceedings of the Nutrition Society 41, 73A.
Chapple, R.S. and Lynch, J.J. (1986) Behavioural factors modifying acceptance ofsupplementary foods by sheep. Research and Development in Agriculture 3, 113–120.
Chase, L.E., Wangsness, P.J. and Baumgardt, B.R. (1976) Feeding behaviour of steers fed acomplete mixed ration. Journal of Dairy Science 59, 1923–1928.
Choi, B.R. and Palmquist, D.L. (1996) High fat diets increase plasma cholecystokinin andpancreatic polypeptide, and decrease plasma insulin and feed intake in lactating cows.Journal of Nutrition 126, 2913–2919.
Choi, B.R., Palmquist, D.L. and Allen, M.S. (1997) Sodium mercaptoacetate is not a useful probeto study the role of fat in regulation of feed intake in dairy cattle. Journal of Nutrition 127,171–176.
Church, D.C. (1988) The Ruminant Animal: Digestive Physiology and Nutrition. Waveland PressInc., Long Grove, Illinois.
Cibils, A.F., Howery, L.D. and Ruyle, G.B. (2004) Diet and habitat selection by cattle: the relationshipbetween skin- and gut-defence systems. Applied Animal Behaviour Science 88, 187–208.
Clancy, M., Wangsness, P.J. and Baumgardt, B.R. (1977) Effect of silage extract on voluntaryintake, rumen fluid constituents and rumen motility. Journal of Dairy Science 60, 580–590.
Clifton, P.G. (1979) Patterns of feeding in the domestic chick. 2. An operant feeding situation.Animal Behaviour 27, 821–828.
Close, W.H. (1989) The influence of the thermal environment on the voluntary food intake ofpigs. In: Forbes, J., Varley, M. and Lawrence, T. (eds) The Voluntary Food Intake of Pigs.British Society of Animal Production, Edinburgh, UK, pp. 87–96.
Close, W.H., Mount, L.E. and Start, I.B. (1971) The influence of environmental temperature andplane of nutrition on heat loss from groups of growing pigs. Animal Production 13, 285–294.
References 413

Clough, P.A. (1972) Feeding ‘porridge’ in the parlour. Dairy Farmer 19, 18–21.Colditz, P.J. and Kellaway, R.C. (1972) The effect of diet and heat stress on feed intake, growth
and nitrogen metabolism in Friesian, F1 Brahman � Friesian, and Brahman heifers.Australian Journal of Agricultural Research 23, 717–725.
Cole, D.J.A. and Chadd, S.A. (1989) Voluntary food intake of growing pigs. In: Forbes, J.M.,Varley, M.A. and Lawrence, T.L.J. (eds) The Voluntary Food Intake of Pigs. British Society ofAnimal Production, Edinburgh, UK, pp. 61–70.
Conrad, H.R. (1987) (ed.) Dairy Cattle: Predicting Feed Intake of Food-producing Animals.National Academy Press, Washington, pp. 48–55.
Conrad, H.R., Pratt, A.D. and Hibbs, J.W. (1964) Regulation of feed intake in dairy cows. 1.Change in importance of physical and physiological factors with increasing digestibility.Journal of Dairy Science 47, 54–62.
Conrad, H.R., Baile, C.A. and Mayer, J. (1977) Changing meal patterns and suppression of feedintake with increasing amounts of dietary nonprotein nitrogen in ruminants. Journal of DairyScience 60, 1725–1733.
Cooper, M.A. and Washburn, K.W. (1998) The relationship of body temperature to weight gain, feedconsumption, and feed utilisation in broilers under heat stress. Poultry Science 77, 237–242.
Cooper, S.D.B., Kyriazakis, I. and Oldham, J.D. (1994) The effect of late pregnancy on the dietselections made by ewes. Livestock Production Science 40, 263–275.
Cooper, S.D.B., Kyriazakis, I. and Nolan, J.V. (1995) Diet selection in sheep – the role of therumen environment in the selection of a diet from 2 feeds that differ in their energy density.British Journal of Nutrition 74, 39–54.
Cooper, S.D.B., Kyriazakis, I. and Oldham, J.D. (1996) The effects of physical form of feed,carbohydrate source, and inclusion of sodium-bicarbonate on the diet selections of sheep.Journal of Animal Science 74, 1240–1251.
Cottrell, D.F. and Iggo, A. (1984) Tension receptors with vagal afferent fibres in the proximalduodenum and pyloric sphincter of sheep. Journal of Physiology 354, 457–475.
Covasa, M. and Forbes, J.M. (1993) Exposure to choice feeding at different ages and thesubsequent choice of broiler chickens. Proceedings of the Nutrition Society 52, 354A.
Covasa, M. and Forbes, J.M. (1994a) Effects of the CCK receptor antagonist MK-329 on foodintake in broiler chickens. Pharmacology, Biochemistry and Behavior 48, 479–486.
Covasa, M. and Forbes, J.M. (1994b) Exogenous cholecystokinin octapeptide in broiler chickens:satiety, conditioned colour aversion and vagal mediation. Physiology and Behavior 56, 39–49.
Covasa, M. and Forbes, J.M. (1995a) The effect of prior training of broiler chickens on dietselection using whole wheat. Animal Production 58, 471.
Covasa, M. and Forbes, J.M. (1995b) Selection of foods by broiler chickens followingcorticosterone administration. British Poultry Science 36, 489–501.
Covasa, M. and Forbes, J.M. (1996) Effects of prior experience and training on diet selection ofbroiler chickens using wheat. Applied Animal Behaviour Science 46, 229–242.
Cowan, R.T., Robinson, J.J., McDonald, I. and Smart, R. (1980) Effects of body fatness atlambing and diet in lactation on body tissue loss, feed intake and milk yield of ewes in earlylactation. Journal of Agricultural Science 95, 497–514.
Cowan, R.T., Reid, G.W., Greenhalgh, J.F.D. and Tait, C.A.G. (1981) Effects of feeding level inlate pregnancy and dietary protein concentration during early lactation on food intake, milkyield, liveweight change and nitrogen balance of cows. Journal of Dairy Research 48,201–212.
Crampton, E.W., Donefer, E. and Lloyd, L.E. (1960) A nutritive value index for forages. Journalof Animal Science 19, 538–544.
Crichlow, E.C. (1988) Ruminal lactic acidosis: forestomach epithelial receptor activation byundissociated volatile fatty acids and rumen fluids collected during loss of reticuloruminalmotility. Research in Veterinary Science 45, 364–368.
414 References

Crichlow, E.C. and Leek, B.F. (1981) The importance of pH in relation to the acid-excitation ofepithelial receptors in the reticulo-rumen of sheep. Journal of Physiology 310, 60–61.
Cropper, M.R. and Poppi, D.P. (1992) The effect of ambient temperature on feed intake and dietselection in growing lambs. Animal Production 54, 492A.
Cumming, R.B. (1983) (ed.) Further Experiments on Choice Feeding in Poultry. Recent Advancesin Animal Nutrition in Australia. University of New England, Armidale, Australia,pp. 313–316.
Cumming, R.B. (1987) The effect of dietary fibre and choice feeding on coccidiosis in chickens. In:4th AAAP Animal Science Congress, Sydney, Australasian Association of Animal Production,216.
Curran, M.K., Wimble, R.H. and Holmes, W. (1970) Prediction of the voluntary intake of food bydairy cows. 1. Stall-fed cows in late pregnancy and early lactation. Animal Production 12,195–212.
Cushnahan, A., Gordon, F.J., Ferris, C.P., Chestnutt, D.M.D. and Mayne, C.S. (1994) The use ofsheep as a model to predict the relative intakes of silages by dairy cattle. Animal Production59, 415–420.
Dado, R.G. and Allen, M.S. (1994) Variation in and relationships among feeding, chewing, anddrinking variables for lactating dairy cows. Journal of Dairy Science 77, 132–144.
Dado, R.G. and Allen, M.S. (1995) Intake limitations, feeding behaviour, and rumen function ofcows challenged with rumen fill from dietary fiber or inert bulk. Journal of Dairy Science 78,118–133.
Dalby, J.A., Varley, M.A., Forbes, J.M. and Jagger, S. (1994) Diet selection of weaned piglets forlysine using flavour as a cue. In: Proceedings of the 45th Annual Meeting of the EuropeanAssociation of Animal Production, N2.5, 126.
Dalby, J.A., Forbes, J.M., Varley, M.A. and Jagger, S. (1995) The requirements of weaned pigletsfor a training period prior to a choice feeding regime. Animal Science 61, 311–319.
Dalby, J.A., Varley, M.A., Forbes, J.M. and Jagger, S. (1996) The diet selection of weaned pigletsin different group sizes. Animal Science 62, 623.
Dalby, J.A., Varley, M.A., Forbes, J.M. and Jagger, S. (1997) A comparison of choice, phase andsingle feeding systems in pigs from weaning to slaughter. Proceedings of the British Society ofAnimal Science 1997, 14.
Danbury, T.C., Weeks, C.A., Chambers, J.P., Waterman-Pearson, A.E. and Kestin, S.C. (2000)Self-selection of the analgesic drug carprofen by lame broiler chickens. Veterinary Record146, 307–311.
Danish National Committee for Pig Breeding and Production (1986) In: Svineavl og–Production(cited by Riley, 1989).
Davies, H.L. (1962) Intake studies in sheep involving high fluid intake. Proceedings of theAustralian Society of Animal Production 4, 167–171.
Dawson, L.E.R. and Mayne, C.S. (1995) The effects of either dietary additions or intra-ruminalinfusion of amines and juice extracted from grass-silage on the voluntary intake of steersoffered grass-silage. Animal Feed Science and Technology 56, 119–131.
Dawson, L.E.R. and Mayne, C.S. (1997) The effect of infusion of putrescine and gamma aminobutyric acid on the intake of steers offered grass silage containing three levels of lactic acid.Animal Feed Science and Technology 66, 15–29.
Dawson, L.E.R. and Steen, R.W.J. (2000) Relationship between dry matter, fibre and nitrogendegradation characteristics of silage and silage intake of steers. Animal Science 70, 537–546.
Day, J.E.L., Kyriazakis, I. and Lawrence, A.B. (1996a) An investigation into the causation ofchewing behaviour in growing pigs – the role of exploration and feeding motivation. AppliedAnimal Behaviour Science 48, 47–59.
Day, J.E.L., Kyriazakis, I. and Lawrence, A.B. (1996b) The use of a second-order schedule to assessthe effect of food bulk on the feeding motivation of growing pigs. Animal Science 63, 447–455.
References 415

Deetz, L.E., Wangsness, P.J., Kavanaugh, J.F. and Griel, L.C. (1980) Effect of intraportal andcontinuous intrajugular administration of insulin on feeding in sheep. Journal of Nutrition110, 1983–1991.
de Groot, G. (1972) A marginal income and cost analysis of the effect of nutrient density on theperformance of White Leghorn hens in battery cages. British Poultry Science 13, 503–520.
de Haer, L.C.M. and Merks, J. (1992) Patterns of daily food intake in growing pigs. AnimalProduction 54, 95–104.
de Jong, A., Steffens, A.B. and de Ruiter, L. (1981) Effects of portal volatile fatty acid infusionson meal patterns and blood composition in goats. Physiology and Behavior 27, 683–689.
de Jong, A. (1981) Regulation of food intake in the goat. PhD thesis, University of Groningen,Netherlands.
de Jong, A. (1986) The role of metabolites and hormones as feedbacks in the control of foodintake in ruminants. In: Milligan, L.P., Grovum, W.L. and Dobson, A. (eds) Control ofDigestion and Metabolism in Ruminants. Reston Boot-Prentice Hall, Englewood Cliffs, NewJersey, pp. 459–478.
de Jong, I.C., Van Voorst, S. and Blokhuis, H.J. (2003) Parameters for quantification of hunger inbroiler breeders. Physiology and Behavior 78, 773–783.
de Jong, I.C. and Jones, B. (2006) Feeding restriction and welfare in domestic birds. In: Bels, V.L.(ed.) Food and Feeding in Domestic Vertebrates: a Comprehensive Approach from Structureto Behaviour. CAB International, Wallingford, UK, pp. 120–135.
Della-Fera, M.A. and Baile, C.A. (1980) Cerebral ventricular injections of CCK-octapeptide andfeed intake: the importance of continuous injection. Physiology and Behavior 24, 1133–1138.
Della-Fera, M.A., Baile, C.A. and Peikin, S.R. (1981) Feeding elicited by injection of thecholecystokinin antagonist dibutyryl cyclic GMP into the cerebral ventricles of sheep.Physiology and Behavior 26, 799–801.
Denbow, D.M. (1985) Food intake control in birds. Neuroscience and Biobehavioural Reviews 9,223–232.
Denbow, D.M., Van Krey, H.P. and Siegel, P.B. (1986) Selection for growth alters the feedingresponse to injections of biogenic amines. Pharmacology, Biochemistry and Behavior 24,39–42.
Denton, D.A. (1982) The Hunger for Salt. Springer Verlag, Berlin.Deswysen, A.G., Vanbelle, M. and Focant, M. (1978) The effect of silage chop length on the
voluntary intake and rumination behaviour of sheep. Journal of the British GrasslandSociety 33, 107–115.
Deswysen, A.G., Dutilleul, P. and Ellis, W.C. (1989) Quantitative analysis of nyctohemeral eatingand ruminating patterns in heifers with different voluntary intakes and effects of monensin.Journal of Animal Science 67, 2751–2761.
Devillers, N., van Milgen, J., Prunier, A. and Le Dividich, J. (2004) Estimation of colostrum intakein the neonatal pig. Animal Science 78, 305–313.
de Vries, A.G. and Kanis, E. (1992) A growth model to estimate economic values for food intakecapacity in pigs. Animal Production 55, 241–246.
Dewhurst, R.J., Wadhwa, D., Borgidaz, L.P., Davies, D.W.R. and Fisher, W.J. (1998a)Acidogenicity of feeds for dairy cows. 2. Production responses. Proceedings of the BritishSociety of Animal Science 1998, 207.
Dewhurst, R.J., Offer, N.W. and Thomas, C. (1998b) Factors affecting water intakes of lactatingdairy cows offered grass silages differing in fermentation and intake characteristics. AnimalScience 66, 543–550.
Dijkstra, J., Forbes, J.M. and France, J. (eds) (2005) Quantitative Aspects of Ruminant Digestionand Metabolism. 2nd edn., CAB International, Wallingford, UK.
Dinius, D.A. and Baumgardt, B.R. (1970) Regulation of food intake in ruminants. 6. Influence ofcaloric density of pelleted rations. Journal of Dairy Science 53, 311–316.
416 References

Dockray, G.J. and Smith, G.P. (eds) (2006) Appetite. Royal Society, London.Dove, H. and Milne, J.A. (1991) An evaluation of the effects of incisor dentition and of age on
the performance of lactating ewes and their lambs. Animal Production 53, 183–190.Driver, P.M. and Forbes, J.M. (1981) Episodic growth hormone secretion in sheep in relation to time
of feeding, spontaneous meals and short term fasting. Journal of Physiology 317, 413–424.Driver, P.M., Forbes, J.M. and Scanes, C.G. (1979) Hormones, feeding and temperature in sheep
following cerebroventricular injections of neurotransmitters and carbachol. Journal ofPhysiology 290, 399–411.
Dulphy, J.P. and Faverdin, P. (1987) Voluntary feed intake in ruminants: feeding patterns andassociated phenomena. Reproduction, Nutrition, Développement 27, 129–155.
Dulphy, J.P., Remond, B. and Theriez, M. (1980) Ingestive behaviour and related activities inruminants. In: Ruckebusch, Y. and Thivend, P. (eds) Digestive Physiology and Metabolism inRuminants. MTP Press, Lancaster, Pennsylvania, pp. 103–122.
Dulphy, J.P., Faverdin, P. and Jarrige, R. (1989) Feed intake: the Fill Unit Systems. In: Jarrige, R.(ed.) Ruminant Nutrition: Recommended Allowances and Feed Tables. John LibbeyEurotext, London and Paris, pp. 61–67.
Duncan, A.J. and Young, S.A. (2002) Can goats learn about foods through conditioned foodaversions and preferences when multiple food options are simultaneously available? Journalof Animal Science 80, 2091–2098.
Duncan, I.J.H., Horne, A.R., Hughes, B.O. and Wood-Gush, D. (1970) The pattern of food intakein female brown leghorn fowl as recorded in a Skinner box. Animal Behaviour 18, 245–255.
Duranton, A. and Bueno, L. (1985) Influence of regimen (roughage vs. concentrate) on satietyand forestomach motility in sheep. Physiology and Behavior 34, 105–108.
Dynes, R.A. (1993) Factors causing feed intake depression in lambs infected by gastrointestinalparasites. PhD thesis, Lincoln University, Christchurch, New Zealand.
Dynes, R.A., Ankersmit, A.E.L., Poppi, D.P., Barrell, G.K. and Sykes, A.R. (1990) Studies on thephysiological basis of appetite depression in nematode infection in sheep. Proceedings of theNew Zealand Society of Animal Production 50, 249–253.
Ebenezer, I.S., de la Riva, C. and Baldwin, B.A. (1990) Effects of the CCK receptor antagonistMK-329 on food intake in pigs. Physiology and Behavior 47, 145–148.
Edmonds, M.S., Gonyou, H.W. and Baker, D.H. (1987) Effect of excess levels of methionine,tryptophan, arginine, lysine or threonine on growth and dietary choice in the pig. Journal ofAnimal Science 65, 179–185.
Edwards, S.A. and Poole, D.A. (1983) The effects of including sodium bicarbonate in the diet ofdairy cows in early lactation. Animal Production 37, 183–188.
Egan, A.R. (1965) Nutritional status and intake regulation in sheep. 3. The relationship betweenimprovement of nitrogen status and increase in voluntary intake of low-protein roughages bysheep. Australian Journal of Agricultural Research 16, 463–447.
Egan, A.R. (1970) Nutritional status and intake regulation in sheep. 6. Evidence for variation insetting of an intake regulatory mechanism relating to the digesta content of the reticulo-rumen. Australian Journal of Agricultural Research 21, 735–746.
Egan, A.R. (1972) Nutritional status and intake regulation in sheep. 7. Control of voluntary intakeof three diets and the responses to intra-ruminal feeding. Australian Journal of AgriculturalResearch 23, 347–361.
Egan, A.R. and Moir, R.J. (1964) Nutritional status and intake regulation in sheep. 1. Effects ofduodenally infused single doses of casein, urea and propionate upon voluntary intake of alow protein roughage. Australian Journal of Agricultural Research 16, 437–449.
Eissen, J.J., de Haan, A.G. and Kanis, E. (1999) Effect of missing data on the estimate of averagedaily feed intake of growing pigs. In: van der Heide, D., Huisman, E.A., Kanis, E., Osse,J.W.M. and Verstegen, M. (eds) Regulation of Feed Intake. CAB International, Wallingford,UK, pp. 209–213.
References 417

Eissen, J.J., Kanis, E. and Kemp, B. (2000) Sow factors affecting voluntary feed intake duringlactation. Livestock Production Science 64, 147–165.
Elizalde, H.F. and Mayne, C.S. (ed.) (1993) The effect of degree of competition per feed space onthe dry matter intake and eating behaviour of dairy cows offered grass silage. In: Proceedingsof the Third Research Conference, British Grassland Society, Greenmount College, Antrim,UK, pp. 137–138.
Ellington, E.F., Fox, C.W., Kennick, W.H. and Sather, L.A. (1967) Feedlot performance andcarcass characteristics of lambs receiving cortisone and diethylstilbestrol. Journal of AnimalScience 26, 462–465.
Elliot, J.M., Symonds, H.W. and Pike, B. (1985) Effect on feed intake of infusing sodium propionateor sodium acetate into a mesenteric vein of cattle. Journal of Dairy Science 68, 1165–1170.
Emmans, G.C. (1977) The nutrient intake of laying hens given a choice of diets in relation totheir production requirements. British Poultry Science 18, 227–236.
Emmans, G.C. (1991) Diet selection by animals: theory and experimental design. Proceedings ofthe Nutrition Society 50, 59–64.
Emmans, G.C. and Kyriazakis, I. (1995) The idea of optimisation in animals: uses and dangers.Livestock Production Science 44, 189–197.
Emmans, G.C. and Kyriazakis, I. (2001) Consequences of genetic change in farm animals onfood intake and feeding behaviour. Proceedings of the Nutrition Society 60, 115–125.
Engel, C. (2002) Wild Health. Weidenfeld & Nicolson, London.Engelke, G.L., Jurgens, M.H. and Speer, V.C. (1984) Performance of growing-finishing swine fed
high-moisture or artificially dried corn in complete and free-choice diets. Journal of AnimalScience 58, 1307–1312.
Engku Azahan, E.A. and Forbes, J.M. (1989) Growth, food intake and energy balance of layerand broiler chickens offered glucose in the drinking water and the effect of dietary proteincontent. British Poultry Science 30, 907–917.
Engku Azahan, E.A. and Forbes, J.M. (1992) The effects of intra-ruminal infusions of sodium saltson the selection of hay and concentrate foods by sheep. Appetite 18, 143–154.
Etheridge, M.O., Stockdale, C.R. and Crannell, P.D. (1992) Effect of ensilation of lucerne onvoluntary intake, digestibility, and eating and rumination behaviour in sheep. AustralianJournal of Experimental Agriculture 32, 315.
Ettle, T. and Roth, F.X. (2004) Specific dietary selection for tryptophan by the piglet. Journal ofAnimal Science 82, 1115–1121.
Everson, R.A., Jorgensen, N.A., Crowley, J.W., Jensen, E.L. and Barrington, G.P. (1976)Input–output of dairy cows fed a complete ration of a constant or variable forage-to-grainratio. Journal of Dairy Science 59, 1776–1787.
Ewan, R.C. (1983). Voluntary Feed Intake of the Pig. Iowa State University CooperativeExtension Service, Ames, Iowa.
Faichney, G.J. (1992) Consumption of solid feed by young lambs during their transition from pre-ruminant to full ruminant function. Applied Animal Behaviour Science 34, 85–91.
Faverdin, P. (1985) Control of food intake in dairy cows at the start of lactation: studies of the roleof insulin. PhD thesis, Institut National Agronomique, Paris.
Faverdin, P. (1986) Injections of physiological doses of insulin in the lactating cow: effects on foodintake and blood metabolites. Reproduction, Nutrition, Développement 26, 383–384.
Faverdin, P. (1999) The effect of nutrients on feed intake in ruminants. Proceedings of theNutrition Society 58, 523–531.
Faverdin, P., Dulphy, J.P., Coulon, J.B., Verite, R., Garel, J.P., Rouel, J. and Marquis, B. (1991)Substitution of roughage by concentrates for dairy cows. Livestock Production Science 27,137–156.
Ferguson, N.S., Bradford, M.M.V. and Gous, R.M. (2002) Diet selection priorities in growing pigsoffered a choice of feeds. South African Journal of Animal Science 32, 136–143.
418 References

Ferret, A., Gasa, J., Plaixats, J., Casanas, F., Bosch, L. and Nuez, F. (1998) Prediction of voluntaryintake and digestibility of maize silages given to sheep from morphological and chemicalcomposition, in vitro digestibility or rumen degradation characteristics. Animal Science 64,493–501.
Fialho, F.B., van Milgen, J., Noblet, J. and Quiniou, N. (2004) Modelling the effect of heat stresson food intake, heat production and growth in pigs. Animal Science 79, 135–148.
Filmer, D. (1991) A new system for livestock feeding. Feeds and Feeding July/August, 1991.Firman, J.D. and Kuenzel, W.J. (1988) Neuroanatomical regions of the chick brain involved in
monitoring amino acid deficient diets. Brain Research Bulletin 21, 637–642.Fisher, D.S., Burns, J.C. and Pond, K.R. (1987) Modelling ad libitum dry matter intake by
ruminants as regulated by distension and chemostatic feedbacks. Journal of TheoreticalBiology 126, 407–418.
Fitts, D.A. (2006) Misuse of ANOVA with cumulative intakes. Appetite 46, 100–102.Flint, H.J. and Scott, K.P. (2000) Genetics of rumen microorganisms: gene transfer, genetic
analysis and strain manipulation. In: Cronje, P.B. (ed.) Ruminant Physiology: Digestion,Metabolism, Growth and Reproduction. CAB International, Wallingford, UK, pp. 389–408.
Fonseca, A.J.M., Dias-da-Silva, A.A. and Orskov, E.R. (1998) In sacco degradation characteristicsas predictors of digestibility and voluntary intake of roughages by mature ewes. Animal FeedScience and Technology 72, 205–219.
Foot, J.Z. (1972) A note on the effect of body condition on the voluntary intake of dried grasswafers by Scottish Blackface ewes. Animal Production 14, 131–134.
Forbes, J.M. (1968a) The effect of pregnancy on rumen volume and voluntary feed intake in theewe. PhD thesis, University of Leeds, UK.
Forbes, J.M. (1968b) The physical relationships of the abdominal organs in the pregnant ewe.Journal of Agricultural Science 70, 171–177.
Forbes, J.M. (1968c) The water intake of ewes. British Journal of Nutrition 22, 33–43.Forbes, J.M. (1969a) The effect of pregnancy and fatness on the volume of rumen contents in the
ewe. Journal of Agricultural Science 72, 119–121.Forbes, J.M. (1969b) A note on the voluntary feed intake of lactating ewes, their milk yield and
the growth rate of their lambs. Animal Production 11, 263–266.Forbes, J.M. (1971) Physiological changes affecting voluntary food intake in ruminants.
Proceedings of the Nutrition Society 30, 135–142.Forbes, J.M. (1974) Feeding in sheep modified by intraventricular estradiol and progesterone.
Physiology and Behavior 12, 741–747.Forbes, J.M. (1977a) Development of a model of voluntary food intake and energy balance in
lactating cows. Animal Production 24, 203–214.Forbes, J.M. (1977b) Interrelationships between physical and metabolic control of voluntary food
intake in fattening, pregnant and lactating mature sheep: a model. Animal Production 24,91–101.
Forbes, J.M. (1980) A model of the short-term control of feeding in the ruminant: effects ofchanging animal or feed characteristics. Appetite 1, 21–41.
Forbes, J.M. (1982) Effect of lighting pattern on growth, lactation and food intake of sheep, cattleand deer. Livestock Production Science 9, 361–374.
Forbes, J.M. (1986a) Effects of sex hormones, pregnancy and lactation on digestion, metabolismand voluntary food intake. In: Milligan, L.P., Grovum, W.L. and Dobson, A. (eds) Control ofDigestion and Metabolism in the Ruminant. Prentice Hall, New Jersey, pp. 420–435.
Forbes, J.M. (1986b) The Voluntary Food Intake of Farm Animals. Butterworths, London.Forbes, J.M. (1988a) Metabolic aspects of the regulation of voluntary food intake and appetite.
Nutrition Research Reviews 1, 145–168.Forbes, J.M. (1988b) The prediction of voluntary intake by the dairy cow. In: Garnsworthy, P.C.
(ed.) Nutrition and Lactation in the Dairy Cow. Butterworths, London, pp. 294–312.
References 419

Forbes, J.M. (1995) Voluntary Food Intake and Diet Selection in Farm Animals, 1st edn. CABInternational, Wallingford, UK.
Forbes, J.M. (1996) Integration of regulatory signals controlling forage intake in ruminants.Journal of Animal Science 74, 3029–3035.
Forbes, J.M. (1999a) Minimal total discomfort as a concept for the control of food intake andselection. Appetite 33, 371–371.
Forbes, J.M. (1999b) Natural feeding behaviour and feed selection. In: van der Heide, D.,Huisman, E.A., Kanis, E., Osse, J.W.M. and Verstegen, M. (eds) Regulation of Feed Intake.CAB International, Wallingford, UK, pp. 1–15.
Forbes, J.M. (2001) Consequences of feeding for future feeding. Comparative Biochemistry andPhysiology 128, 461–468.
Forbes, J.M. (2003a) The multifactorial nature of food intake control. Journal of Animal Science81, E139–E144.
Forbes, J.M. (2003b) Wet feeding of poultry. Avian & Poultry Biology Reviews 14, 175–193.Forbes, J.M. (2005a) Voluntary feed intake and diet selection. In: Dijkstra, J., Forbes, J.M. and
France, J. (eds) Quantitative Aspects of Ruminant Digestion and Metabolism, 2nd edn. CABInternational, Wallingford, UK, pp. 607–625.
Forbes, J.M. (2005b) Why did the chicken choose the food? 2005 Australian Poultry ScienceSymposium, University of Sydney, Australia.
Forbes, J.M. (2006a) Conclusion and perspectives. In: Bels, V.L. (ed.) Food and Feeding inDomestic Vertebrates: A Comprehensive Approach from Structure to Behaviour. CABInternational, Wallingford, UK, pp. 349–358.
Forbes, J.M. (2006b) Food choice and intake in chickens. In: Bels, V.L. (ed.) Food and Feeding inDomestic Vertebrates: A Comprehensive Approach from Structure to Behaviour. CABInternational, Wallingford, UK, pp. 108–119.
Forbes, J.M. (2007) A personal view of how ruminant animals control their intake and choice offood: Minimal Total Discomfort. Nutrition Research Reviews 20(2) (in press).
Forbes, J.M. and Baile, C.A. (1974) Feeding and drinking in sheep following hypothalamicinjections of carbachol. Journal of Dairy Science 57, 878–883.
Forbes, J.M. and Barrio, J.P. (1992) Abdominal chemo- and mechanosensitivity in ruminants andits role in the control of food intake. Experimental Physiology 77, 27–50.
Forbes, J.M. and Blundell, J.E. (1989) Central nervous control of voluntary food intake. In:Forbes, J.M., Varley, M.A. and Lawrence, T.L.J. (eds) The Voluntary Food Intake of Pigs.British Society of Animal Production, Edinburgh, UK, pp. 7–26.
Forbes, J.M. and Covasa, M. (1995) Application of diet selection by poultry with particularreference to whole cereals. World’s Poultry Science Journal 51, 149–165.
Forbes, J.M. and Kyriazakis, I. (1995) Food preferences in farm animals: why don’t they alwayschoose wisely? Proceedings of the Nutrition Society 54, 429–440.
Forbes, J.M. and Mayes, R.W. (2002) Food choice. In: Freer, M. and Dove, H. (eds) SheepNutrition. CAB International, Wallingford, UK, pp. 51–69.
Forbes, J.M. and Provenza, F.D. (2000) Integration of learning and metabolic signals into a theoryof dietary choice and food intake. In: Cronje, P.B. (ed.) Ruminant Physiology: Digestion,Metabolism, Growth and Reproduction. CAB International, Wallingford, UK, pp. 3–19.
Forbes, J.M. and Shariatmadari, F.S. (1994) Diet selection for protein by poultry. World’s PoultryScience Journal 50, 7–24.
Forbes, J.M. and Shariatmadari, F. (1996) Short-term effects of food protein content onsubsequent diet selection by chickens and the consequences of alternate feeding of high- andlow-protein foods. British Poultry Science 37, 597–607.
Forbes, J.M., Rees, J.K. and Boaz, T.G. (1967) Silage as a feed for pregnant ewes. AnimalProduction 9, 399–408.
Forbes, J.M., Wright, J.A. and Bannister, A. (1972) A note on rate of eating in sheep. AnimalProduction 42, 79–84.
420 References

Forbes, J.M., El Shahat, A.A., Jones, R., Duncan, J.G.S. and Boaz, T.G. (1979) The effect ofdaylength on the growth of lambs. 1. Comparison of sex, level of feeding, shearing andbreed of sire. Animal Production 29, 33–42.
Forbes, J.M., Brown, W.B., Al Banna, A.G.M. and Jones, R. (1981) The effect of daylength onthe growth of lambs. 3. Level of feeding, age of lamb and speed of gut-fill response. AnimalProduction 32, 23–28.
Forbes, J.M., Jackson, D.A., Johnson, C.L., Stockill, P. and Hoyle, B. (1986) A method for theautomatic monitoring of food intake and feeding behaviour of individual cattle kept in agroup. Research and Development in Agriculture 3, 175–180.
Forbes, J.M., Bermúdez, F.F. and Jones, R. (1989) Feeding behaviour of sheep during pregnancyand lactation. Appetite 13, 211–222.
Forbes, J.M., Johnson, C.L. and Jackson, D.A. (1991) The drinking behaviour of lactating cowsoffered silage ad lib. Proceedings of the Nutrition Society 50, 97A.
Forbes, J.M., Mbanya, J.N. and Anil, M.H. (1992) Comparisons of the effects of intra-ruminalinfusions of sodium acetate and sodium chloride on silage intake by lactating cows. Appetite19, 293–301.
Foster, L.A., Ames, N.K. and Emery, R.S. (1991) Food intake and serum insulin responses tointraventricular infusions of insulin and IGF-1. Physiology and Behavior 50, 745–749.
Fowler, V.R., McWilliam, R., Pennie, K. and James, M. (1984) The effects of dietary novelty andfrequency of feeding on the food intake and performance of growing pigs. AnimalProduction 38, 535–536.
Fraser, A.F. and Broom, D.M. (1997) Farm Animal Behaviour and Welfare. CAB International,Wallingford, UK.
Frederick, G., Forbes, J.M. and Johnson, C.L. (1988) Masking the taste of rapeseed meal in dairycompound food. Animal Production 46, 518.
Freer, M. and Campling, R.C. (1963) Factors affecting the voluntary intake of food by cows: 5The relationship between the voluntary intake of food, the amount of digesta in the reticulo-rumen and the rate of disappearance of digesta from the alimentary tract with diets of hay,dried grass or concentrates. British Journal of Nutrition 17, 79–88.
FuentesPila, J., DeLorenzo, M.A., Beede, D.K., Staples, C.R. and Holter, J.B. (1996) Evaluationof equations based on animal factors to predict intake of lactating Holstein cows. Journal ofDairy Science 79, 1562–1571.
Furuse, M., Yang, S.I., Choi, Y.H., Kawamura, N., Takahashi, A. and Okomura, J. (1991) A noteon plasma cholecystokinin concentration in dairy cows. Animal Production 53, 123–125.
Gallouin, F. and Le Magnen, J. (1987) History of concepts of hunger, satiety and appetites.Reproduction, Nutrition, Développment 27, 109–128.
Garnsworthy, P.C. and Jones, G.P. (1987) The influence of body condition at calving and dietaryprotein supply on voluntary food intake and performance in dairy cows. Animal Production44, 347–353.
Garnsworthy, P.C. and Unal, Y. (2004) Estimation of dry-matter intake and digestibility in group-fed dairy cows using near infrared reflectance spectroscopy. Animal Science 79, 327–334.
Geiselman, P., Martin, J., VanderWeele, D. and Novin, D. (1980) Multivariate analysis of mealpatterning in intact and vagotomized rabbits. Journal of Comparative Physiology andPsychology 94 (2), 388–399.
Getachew, G., Blummel, M., Makkar, H.P.S. and Becker, K. (1998) In vitro gas measuringtechniques for assessment of nutritional quality of feeds: a review. Animal Feed Science andTechnology 72, 261–281.
Gherardi, S. and Black, J.L. (1991) Effect of palatability on voluntary feed intake by sheep. I.Identification of chemicals that alter the palatability of a forage. Australian Journal ofAgricultural Research 42, 571–584.
References 421

Gherardi, S., Black, J.L. and Colebrook, W.F. (1991) Effect of palatability on voluntary feedintake by sheep. II. The effect of altering the palatability of wheaten hay on long-term intakeand preference. Australian Journal of Agricultural Research 42, 585–598.
Gill, B.P., Blanchard, P.J., Chadwick, J.P. and Stickney, K. (1999) Voluntary intake responses of‘White’ and Meishan cross growing pigs to nutrient dilution. Proceedings of the BritishSociety of Animal Science 1999, 175.
Gill, M.S. and Castle, M.E. (1983) The effects of the frequency of feeding concentrates on milkproduction and eating behaviour in Ayrshire dairy cows. Animal Production 36, 79–86.
Ginane, C. and Petit, M. (2005) Feeding behaviour and diet choices of cattle with physical andtemporal constraints on forage accessibility: an indoor experiment. Animal Science 81, 3–10.
Ginane, C., Dumont, B. and Petit, A. (2002) Short-term choices of cattle vary with relative qualityand accessibility of two hays according to an energy gain maximisation hypothesis. AppliedAnimal Behaviour Science 75, 269–279.
Givens, D.I. and Rulquin, H. (2004) Utilisation by ruminants of nitrogen compounds in silage-based diets. Animal Feed Science and Technology 114, 1–18.
Givens, D.I., de Boever, J.L. and Deaville, E.R. (1997) The principles, practice and some futureapplications of near infrared spectroscopy for predicting the nutritive value of foods foranimals and humans. Nutrition Research Reviews 10, 83–114.
Glimp, H.A. (1971) Effect of diet composition on diet preference by lambs. Journal of AnimalScience 33, 861–864.
Goatcher, W.D. and Church, D.C. (1971) Review of some nutritional aspects of the sense of taste.Journal of Animal Science 31, 973–981.
Gous, R.M. and DuPreez, J.J. (1975) The sequential feeding of growing chickens. British Journalof Nutrition 34, 113–117.
Gous, R.M. and Swatson, H.K. (2000) Mixture experiments: a severe test of the ability of a broilerchicken to make the right choice. British Poultry Science 41, 136–140.
Graham, N.M. (1969) The influence of body weight (fatness) on the energetic efficiency of adultsheep. Australian Journal of Agricultural Research 20, 375–385.
Graham, N.M. and Searle, T.W. (1975) Studies of weaner sheep during and after a period ofweight stasis. 1. Energy metabolism and nitrogen utilization. Australian Journal ofAgricultural Research 26, 343–353.
Grant, R.J. and Albright, J.L. (1995) Feeding behaviour and management factors during thetransition period in dairy cattle. Journal of Animal Science 73, 2791–2803.
Greenhalgh, J.F.D. and Reid, G.W. (1967) Separating the effects of digestibility and palatabilityon food intake in ruminant animals. Nature 214, 744.
Grill, H.J. and Berridge, K.C. (1985) Taste reactivity as a measure of the neural control ofpalatability. Progress in Psychobiology and Physiological Psychology 11, 1–61.
Grovum, W.L. (1979) Factors affecting the voluntary intake of food by sheep. 2. The role ofdistension and tactile input from compartments of the stomach. British Journal of Nutrition42, 425–437.
Grovum, W.L. (1981) Cholecystokinin administered intravenously did not act directly on thecentral nervous system or on the liver to suppress food intake by sheep. British Journal ofNutrition 45, 183–201.
Grovum, W.L. (1987) A new look at what is controlling food intake. In: Owens, F.N. (ed.) FeedIntake by Beef Cattle. Oklahoma State University, Stillwater, Oklahoma, pp. 1–40.
Hannah, S.L. (2001) Feeding behaviour of farmed animals and how chickens cope with dietarychange. PhD thesis, University of Leeds, UK.
Harrison, S., Romney, D.L., Phipps, R.H. and Owen, E. (1998) Short Term Intake Rate (STIR) asa method of ranking the intake potential of forage mixtures by dairy cows. Proceedings of theBritish Society of Animal Science 1998, 193.
422 References

Hayne, H., Rovee-Collier, C. and Gargano, D. (1986) Ambient temperature effects on energeticrelations in growing chicks. Physiology and Behavior 37, 203–212.
Hayne, H., Rovee-Collier, C., Collier, G., Tudor, L. and Morgan, C.A. (1996) Learning and retentionof conditioned aversions by freely feeding chicks. Developmental Psychobiology 29, 417–431.
Healy, W.J., Gill, B.P., English, P.R. and Davidson, F.M. (1993) The selection by young pigs ofdietary cereal and protein fractions supplemented with amino acids to idealise proteincontents. Animal Production 56, 468A.
Heaney, D.R., Pritchard, G.I. and Pigden, W.J. (1968) Variability in ad libitum forage intakes bysheep. Journal of Animal Science 27, 159–164.
Heitman, H., Hahn, L., Kelly, C.F. and Bond, T.E. (1961) Space allotment and performance ofgrowing finishing swine raised in confinement. Journal of Animal Science 20, 543–546.
Henning, P.H. (1987) The effect of increased energy demand through walking exercise on intakeand ruminal characteristics of sheep fed a roughage diet. Journal of Agricultural Science109, 53–59.
Henry, B.A., Goding, J.W., Alexander, W.S., Tilbrook, A.J., Canny, B.J., Dunshea, F.R., Rao, A.,Mansell, A. and Clarke., I.J. (1999) Central administration of leptin to ovariectomized ewesinhibits food intake without affecting the secretion of hormones from the pituitary gland:evidence for a dissociation of effects on appetite and neuroendocrine function. Endocrinology140, 1175–1182.
Henry, Y. (1985) Dietary factors involved in the feed intake regulation in growing pigs: a review.Livestock Production Science 12, 339–354.
Henry, Y., Colleaux, Y. and Seve, B. (1992) Effects of dietary level of lysine and of level andsource of protein on feed intake, growth performance, and plasma amino acid pattern in thefinishing pig. Journal of Animal Science 70, 188–195.
Henuk, Y.L. and Dingle, J.G. (2002) Practical and economic advantages of choice feedingsystems for laying poultry. World’s Poultry Science Journal 58, 199–208.
Herd, R. and Bishop, S. (2000) Genetic variation in residual feed intake and its association withother production traits in British Hereford cattle. Livestock Production Science 63, 111–119.
Hidari, H. (1981) The relationships between rumen load and diurnal eating pattern of sheep fedin various time of access to feed. Japanese Journal of Zootechnical Science 52, 19–26.
Hill, J.A., Powell, A.J. and Charles, D.R. (1979) Water intake. In: Boorman, K.N. and Freeman,B.M. (eds) Food Intake Regulation in Poultry. Longmans, Edinburgh, UK, pp. 231–257.
Hills, J., Nolan, J.V., Hinch, G.N. and Lynch, J.J. (1998) Selection of diets differing in sulphurcontent by sheep in sulphur adequate or depleted states. Proceedings of the British Societyof Animal Science 1998, 28.
Hills, J., Kyriazakis, I., Nolan, J.V., Hinch, G.N. and Lynch, J.J. (1999) Conditioned feedingresponses in sheep to flavoured foods associated with sulphur doses. Animal Science 69,313–325.
Hocking, P.M. and Bernard, R. (1993) Evaluation of putative appetite suppressants in thedomestic fowl (Gallus domesticus). British Poultry Science 34, 393–404.
Hodgson, J. (1971a) The development of solid food intake in calves. 4. The effect of the additionof material to the rumen, or its removal from the rumen, on voluntary food intake. AnimalProduction 13, 581–592.
Hodgson, J. (1971b) The development of solid food intake in calves. 5. The relationship betweenliquid and solid food intake. Animal Production 13, 593–597.
Hodgson, J. (1990) Grazing Management: Science into Practice. Longman, London.Hodgson, J. and Illius, A.W. (eds) (1998) The Ecology and Management of Grazing Systems.
Oxford University Press, Oxford, UK.Holcombe, D.J., Roland, D.A. and Harms, R.H. (1976) The ability of hens to regulate protein
intake when offered a choice of diets containing different levels of protein. Poultry Science55, 1731–1737.
References 423
Holmes, P.H. (1993) Interactions between parasites and animal nutrition – the veterinaryconsequences. Proceedings of the Nutrition Society 52, 113–120.
Hopkins, J.R. (1985). Feeding the dairy cow by maximising forage and minimising concentrateinput. ADAS Regional Nutrition Chemist, ADAS, Leeds, UK, 12 pp.
Horrell, I., A’Ness, P., Edwards, S.A. and Riddoch, I. (2000) Nose-rings influence feedingefficiency in pigs. Animal Science 71, 259–264.
Horton, G.M.J., Malinowski, K. and Talbot, J.A. (1990) Effect of confinement on performanceand physiological indicators of stress in lambs. Journal of Animal Science 68 (Suppl. 1), 260.
Hosoi, E., Swift, D.M., Rittenhouse, L.R. and Richards, R.W. (1995) Comparative foragingstrategies of sheep and goats in a T-maze apparatus. Applied Animal Behaviour Science 44,37–45.
Hou, X.Z., Emmans, G.C., Anderson, D., Illius, A.W. and Oldham, J.D. (1991a) The effect ofdifferent pairs of feeds offered as a choice on food selection by sheep. Proceedings of theNutrition Society 50, 94A.
Hou, X.Z., Lawrence, A.B., Illius, A.W., Anderson, D. and Oldham, J.D. (1991b) Operant studieson feed selection in sheep. Proceedings of the Nutrition Society 50, 95A.
Houlihan, D., Boujard, T. and Jobling, M. (eds) (2001) Food Intake in Fish. Blackwell Science,Oxford, UK.
Houpt, K.A. and Houpt, T.R. (1977) The neonatal pig: a biological model for the development oftaste preferences and controls of ingestive behaviour. In: Weiffenbach, J.M. (ed.) Taste andDevelopment. U.S. Department of Health, Bethesda, Maryland.
Houpt, K.A. and Wolski, T. (1982) Domestic Animal Behavior for Veterinarians and AnimalScientists. Iowa State University Press, Ames, Iowa.
Houpt, K.A., Houpt, T.R. and Pond, W.G. (1977) Food intake controls in the suckling pig:glucoprivation and gastrointestinal factors. American Journal of Physiology 232,E510–E514.
Houpt, K.A., Houpt, T.R. and Pond, W.G. (1979) The pig as a model for the study of obesity andof control of food intake: a review. Yale Journal of Biology and Medicine 52, 307–329.
Houpt, T.R. (1974) Stimulation of food intake in ruminants by 2-deoxy-D-glucose and insulin.American Journal of Physiology 227, 161–167.
Houpt, T.R. (1983) The control of food intake in the pig. In: Laplace, J.P., Corring, T. and Rerat,A. (eds) Physiologie Digestive Chez le Porc. INRA, Paris, pp. 17–28.
Houpt, T.R., Baldwin, B.A. and Houpt, K.A. (1983) Effects of duodenal osmotic loads onspontaneous meals in pigs. Physiology and Behavior 30, 787–796.
Houseknecht, K.L. and Spurlock, M.E. (2003) Leptin regulation of lipid homeostasis: dietary andmetabolic implications. Nutrition Research Reviews 16, 83–96.
Howery, L.D., Bailey, D.W., Ruyle, G.B. and Renken, W.J. (2000) Cattle use visual cues to trackfood locations. Applied Animal Behaviour Science 67, 1–14.
Howes, G.A. and Forbes, J.M. (1987a) Food intake of domestic fowl injected with adrenergicagonists and antagonists into the hepatic portal vein. Pharmacology, Biochemistry andBehavior 26, 757–764.
Howes, G.A. and Forbes, J.M. (1987b) A role of the liver in the effects of glucagon on food intakein domestic fowl. Physiology and Behavior 39, 587–592.
Hughes, B.O. (1979) Appetites for specific nutrients. In: Boorman, K.N. and Freeman, B.M. (eds)Food Intake Regulation in Poultry. Longman, Edinburgh, UK, pp. 141–169.
Hughes, B.O. and Dewar, W.A. (1971) A specific appetite for zinc in zinc-depleted domestic fowls.British Poultry Science 12, 255–258.
Hughes, B.O. and Wood-Gush, D. (1971) Investigations into specific appetites for sodium andthiamine in domestic fowls. Physiology and Behavior 6, 331–339.
Huisman, A.E. and van Arendonk, J.A.M. (2004) Genetic parameters for daily feed intakepatterns of growing Dutch Landrace gilts. Livestock Production Science 87, 221–228.
424 References
Hurwitz, S., Sklan, D. and Bartov, I. (1978) New formal approaches to the determination ofenergy and amino acid requirements of chicks. Poultry Science 57, 197–205.
Hutchings, M.R., Kyriazakis, I., Gordon, I.J. and Jackson, F. (1999) Trade-offs between nutrient intakeand faecal avoidance in herbivore foraging decisions: the effect of animal parasitic status, level offeeding motivation and sward nitrogen content. Journal of Animal Ecology 68, 310–323.
Hutchings, M.R., Athanasiadou, S., Kyriazakis, I. and Gordon, I.J. (2003) Can animals useforaging behaviour to combat parasites? Proceedings of the Nutrition Society 62, 361–370.
Hutchings, M.R., Judge, J., Gordon, I., Athanasiadou, S. and Kyriazakis, I. (2006) Use of trade-offtheory to advance understanding of herbivore–parasite interactions. Mammal Review 36, 1–16.
Hutchinson, K.J. and Wilkins, R.J. (1971) The voluntary intake of silage by sheep. 2. The effectsof acetate on silage intake. Journal of Agricultural Science 77, 539–543.
Hutson, G.D. (1992) A comparison of operant responding by farrowing sows for food and nest-building material. Applied Animal Behaviour Science 34, 221–230.
Hyun, Y., Ellis, M., Riskowski, G. and Johnson, R.W. (1998) Growth performance of pigssubjected to multiple concurrent environmental stressors. Journal of Animal Science 76,721–727.
Illius, A. and Gordon, I.J. (1991) Prediction of intake and digestion in ruminants by a model ofrumen kinetics integrating animal size and plant characteristics. Journal of AgriculturalScience 116, 145–157.
Illius, A.W., Albon, S.D., Pemberton, J.M., Gordon, I.J. and Clutton-Brock, T.H. (1995) Selectionfor foraging efficiency during a population crash in Soay sheep. Journal of Animal Ecology64, 481–492.
Illius, A.W., Jessop, N.S. and Gill, M. (2000) Mathematical models of food intake and metabolismin ruminants. In: Cronje, P.B. (ed.) Ruminant Physiology: Digestion, Metabolism, Growth andReproduction. CAB International, Wallingford, UK, pp. 21–39.
Ingvartsen, K.L. and Andersen, J.B. (2000) Integration of metabolism and intake regulation: areview focusing on periparturient animals. Journal of Dairy Science 83, 1573–1597.
Ingvartsen, K.L., Andersen, H. and Foldager, J. (1992) Effect of sex and pregnancy on feed intakecapacity of growing cattle. Acta Agralia Scandinavica, Section A, Animal Science 42, 40–46.
Injidi, M.H. (1981) The involvement of melatonin, thyroid hormones and glucose in the controlof feed and growth of chickens. PhD thesis, University of Leeds, UK.
Injidi, M.H. and Forbes, J.M. (1983) Growth and food intake of intact and pinealectomisedchickens treated with melatonin and triiodothyronine. British Poultry Science 24, 463–469.
Injidi, M.H. and Forbes, J.M. (1987) Stimulation of food intake and growth of chickens bycyproheptadine: lack of interaction with the effects of pinealectomy and melatonin. BritishPoultry Science 28, 139–145.
INRA (1979) Alimentation des Ruminants. Institut National de la Recherche Agronomique,Versailles, France.
Ivy, R.E. and Gleaves, E.W. (1976) Effect of egg production level, dietary protein and energy onfeed consumption and nutrient requirements of laying hens. Poultry Science 55, 2166–2171.
Jackson, D.A., Johnson, C.L. and Forbes, J.M. (1991) The effect of compound composition andsilage characteristics on silage intake, feeding behaviour, production of milk and live-weightchange in lactating dairy cows. Animal Production 52, 11–19.
Jackson, P., Hodgson, J. and Rook, J.A.F. (1968) The voluntary intake of acetate by dairy cowsgiven ammonium salts of short-chain fatty acids in their drinking water. Animal Production 10,473–481.
Jackson, S. and Duke, G.E. (1995) Intestine fullness influences feeding behaviour and crop fillingin the domestic turkey. Physiology and Behavior 58, 1027–1034.
James, S.M. and Kyriazakis, I. (2002) The effect of consumption of foods that differ in energydensity and/or sodium bicarbonate supplementation on subsequent diet selection in sheep.British Journal of Nutrition 88, 81–90.
References 425

James, S.M., Kyriazakis, I. and Emmans, G.C. (2001) Diet selection of sheep: effects of addingurea to foods with different protein contents. Animal Science 73, 183–195.
James, S.M., Kyriazakis, I., Emmans, G.C. and Tolkamp, B.J. (2002) Diet selection of sheep:sodium bicarbonate, but not the offering of hay, modifies the effect of urea on diet selection.Animal Science 74, 357–367.
Janig, W. and Morrison, J.F.B. (1987) Functional properties of spinal visceral afferents supplyingabdominal and pelvic organs, with special emphasis on visceral nociception. In: Cervero, F.and Morrison, J.F.B. (eds) Visceral Sensation. Vol. 67, Elsevier, pp. 87–114.
Jarrige, R., Demarquilly, C., Dulphy, J.P., Hoden, A., Robelin, J., Beranger, C., Geay, Y., Journet,M., Malterre, C., Micol, C. and Petit, M. (1986) The INRA ‘Fill unit’ system for predicting thevoluntary intake of forage-based diets in ruminants: a review. Journal of Animal Science 63,1737–1758.
Jarrige, R., Dulphy, J.P., Faverdin, P., Baumont, R. and Demarquilly, C. (1995) Feeding andruminating behaviour. In: Jarrige, R., Ruckebusch, Y., Demarquilly, C., Farce, M.H. andJournet, M. (eds) Nutrition des Ruminants Domestiques. INRA Editions, Paris, pp. 123–182.
Jensen, M.B., Kyriazakis, I. and Lawrence, A.B. (1993) The activity and straw directed behaviourof pigs offered foods with different crude protein content. Applied Animal Behaviour Science37, 211–221.
Jones, G.P. and Garnsworthy, P.C. (1989) The effects of dietary energy content on the responseof dairy cows to body condition at calving. Animal Production 49, 183–192.
Jones, R. and Forbes, J.M. (1984) A note on effects of glyphosate and quinine on the palatabilityof hay for sheep. Animal Production 38, 301–303.
Joshua, I.G. and Mueller, W.J. (1979) The development of a specific appetite for calcium ingrowing broiler chicks. British Poultry Science 20, 481–490.
Joubert, D.M. and Ueckerman, L. (1971) A note on the effect of docking on fat deposition in fat-tailed sheep. Animal Production 13, 191–192.
Juniper, D.T., Browne, E.M., Fisher, A.V., Bryant, M.J., Nute, G.R. and Beever, D.E. (2005)Intake, growth and meat quality of steers given diets based on varying proportions of maizesilage and grass silage. Animal Science 81, 159–170.
Kabuga, J.D. and Sarpong, K. (1991) Influence of weather conditions on milk production andrectal temperature of Holsteins fed two levels of concentrate. International Journal ofBiometeorology 34, 226–230.
Kadzerea, C.T., Murphy, M.R., Silanikove, N. and Maltz, E. (2002) Heat stress in lactating dairycows: a review. Livestock Production Science 77, 59–91.
Kaiya, H., Darras, V.M. and Kangawa, K. (2007) Ghrelin in birds: its structure, distribution andfunction. Journal of Poultry Science 44, 1–18.
Kaminska, B. (1979) Evaluation of chickens’ ability to meet nutrient requirements in case of freechoice of different protein-level mashes. Instytut Zootechniki Prace Bad. Zakl. Hod. Drobiu 8,47–57.
Kare, M.R. and Maller, O. (1967) Taste and food intake in domestic and jungle fowl. Journal ofNutrition 92, 191–196.
Karkeek, W.F. (1845) An essay on fat and muscle. Journal of the Royal Agricultural Society 5,245–266.
Karue, C.N., Evans, J.L. and Tillman, A.D. (1973) Voluntary intake of dry matter by African zebucattle. Quality of feed and the reference base. Journal of Animal Science 36, 1181–1185.
Katle, J. and Nordli, H. (1992) Variation in residual food consumption between cocks in a highlyproductive egg-laying strain. Acta Agriculturae Scandinavica, Section A, Animal Science 42,20–26.
Kaufman, L. and Collier, G. (1983) Meal-taking by domestic chickens (Gallus gallus). AnimalBehavior 31, 397–404.
Kaufman, L.W., Collier, G. and Squibb, R.L. (1978) Selection of an adequate protein–carbohydrateratio by domestic chicks. Physiology and Behavior 20, 339–344.
426 References

Kay, R.N.B. (1979) Seasonal changes of appetite in deer and sheep. Agricultural ResearchCouncil Research Reviews 5, 13–15.
Kay, R.N.B. and Suttie, J.M. (1980) Relationship of seasonal cycles of food intake and sexualactivity in Soay rams. Journal of Physiology 310, 34P–35P.
Keady, T.W.J., Mayne, C.S. and Kilpatrick, D.J. (2004) An evaluation of five models commonlyused to predict food intake of lactating dairy cattle. Livestock Production Science 89,129–138.
Kendrick, K.M. (1992) Cognition. In: Phillips, C.J.C. and Piggins, D. (eds) Farm Animals and theEnvironment. CAB International, Wallingford, UK, pp. 209–231.
Kendrick, K.M. (1994) Neurobiological correlates of visual and olfactory recognition in sheep.Behavioural Processes 33, 89–111.
Kennedy, G.C. (1953) The role of depot fat in the hypothalamic control of food intake in the rat.Proceedings of the Royal Society B 140, 578–592.
Kenney, P. and Black, J.L. (1984) Factors affecting diet selection by sheep. I. Potential intake rateand acceptability of food. Australian Journal of Agricultural Research 35, 5511–5563.
Kenwright, A.D. and Forbes, J.M. (1993) Relationships between social dominance and feedingbehaviour in lactating heifers during periods of heavy competition. Animal Production 56,457A.
Ketelaars, J.J.M.H. and Tolkamp, B.J. (1992a) Toward a new theory of feed intake regulation inruminants. 1. Causes of differences in voluntary feed intake: critique of current views.Livestock Production Science 30, 269–296.
Ketelaars, J.J.M.H. and Tolkamp, B.J. (1992b) Toward a new theory of feed intake regulation inruminants. 3. Optimum feed intake: in search of a physiological background. LivestockProduction Science 31, 235–258.
Keunen, J.E., Plaizier, J.C., Kyriazakis, L., Duffield, T.F., Widowski, T.M., Lindinger, M.I. andMcBride, B.W. (2002) Effects of a subacute ruminal acidosis model on the diet selection ofdairy cows. Journal of Dairy Science 85, 3304–3313.
Keunzel, W.J. and McMurtry, J.P. (1988) Neuropeptide Y: brain localisation and central effects onplasma insulin. Physiology and Behavior 44, 669–678.
Khazaal, K., Dentinho, M.T., Ribeiro, J.M. and Orskov, E.R. (1995) Prediction of apparentdigestibility and voluntary intake of hays fed to sheep – comparison between using fibercomponents, in vitro digestibility or characteristics of gas-production or nylon bagdegradation. Animal Science 61, 527–538.
Kilgour, R., Foster, T.M., Temple, W., Matthews, L.R. and Bremner, K.J. (1990) Operanttechnology applied to solving farm animal problems. An assessment. Applied AnimalBehaviour Science 30, 141–166.
Klaiss, M. and Forbes, J.M. (1999) Effect of conditioning feed flavour to rumen distension incows. Proceedings of the British Society of Animal Science 1999, 85.
Koene, P. (2006) Feeding and welfare in domestic animals: a Darwinistic framework. In: Bels, V.L.(ed.) Food and Feeding in Domestic Vertebrates: a Comprehensive Approach from Structureto Behaviour. CAB International, Wallingford, UK, pp. 84–107.
Koketsu, Y., Dial, G.D., Pettigrew, J.E. and King, V.L. (1997) Influence of feed intake duringindividual weeks of lactation on reproductive performance of sows on commercial farms.Livestock Production Science 49, 217–225.
Konggaard, S.P. and Krohn, C.C. (1978). Investigation concerning feed intake and socialbehaviour among group-fed cows under loose housing conditions. 3. Effects of isolating firstlactation cows from older cows. Beretning fra Statens Husbyrbrugforsog 469, 30 pp.
Kornegay, E.T. and Notter, D.R. (1984) Effects of floor space and number of pigs per pen onperformance. Pig News and Information 5, 523.
Kovalcik, K. and Kovalcik, M. (1986) Learning ability and memory testing in cattle of differentages. Applied Animal Behavioural Science 15, 27–30.
References 427

Kuenzel, W.J. (1989) Neuroanatomical substrates involved in the control of food intake. PoultryScience 68, 926–937.
Kutlu, H.R. and Forbes, J.M. (1993a) Alleviation of the effect of heat stress by dietary methods inbroilers: a review. World Review of Livestock Production 28, 16–26.
Kutlu, H.R. and Forbes, J.M. (1993b) Effect of changes in environmental temperature on self-selection of ascorbic acid in coloured feeds by broiler chicks. Proceedings of the NutritionSociety 52, 29A.
Kutlu, H.R. and Forbes, J.M. (1993c) Self-selection of ascorbic acid in coloured foods by heat-stressed broiler chicks. Physiology and Behavior 53, 103–110.
Kyriazakis, I. and Emmans, G.C. (1991) Diet selection in pigs: dietary choices made by growingpigs following a period of underfeeding with protein. Animal Production 52, 337–346.
Kyriazakis, I. and Emmans, G.C. (1993) The effect of protein source on the diets selected by pigsgiven a choice between a low and high protein food. Physiology and Behavior 53, 683–688.
Kyriazakis, I. and Emmans, G.C. (1995) The voluntary feed intake of pigs given feeds based onwheat bran, dried citrus pulp and grass meal, in relation to measurements of feed bulk.British Journal of Nutrition 73, 191–207.
Kyriazakis, I. and Emmans, G.C. (1999) Voluntary food intake and diet selection. In: Kyriazakis, I.(ed.) A Quantitative Biology of the Pig. CAB International, Wallingford, UK, pp. 229–248.
Kyriazakis, I. and Oldham, J.D. (1993) Diet selection in sheep: the ability of growing lambs toselect a diet that meets their crude protein (nitrogen � 6.25) requirements. British Journal ofNutrition 69, 617–629.
Kyriazakis, I. and Oldham, J.D. (1997) Food intake and diet selection in sheep: the effect ofmanipulating the rates of digestion of carbohydrates and protein of the foods offered as achoice. British Journal Nutrition 77, 243–254.
Kyriazakis, I., Emmans, G.C. and Whittemore, C.T. (1990) Diet selection in pigs: choices made bygrowing pigs given foods of different protein concentrations. Animal Production 51, 189–199.
Kyriazakis, I., Leus, K., Emmans, G.C., Haley, C.S. and Oldham, J.D. (1993a) The effect of breed(Large White � Landrace v. purebred Meishan) on the diets selected by pigs given a choicebetween two foods that differ in their crude protein content. Animal Production 56, 121–128.
Kyriazakis, I., Anderson, D.H., Cooper, S.D.B., Oldham, J.D., Coop, R.L. and Jackson, F.(1993b) The effect of subclinical parasitism with Trichostrongylus colubriformis on the dietselection of growing sheep. Proceedings of the Nutrition Society 52, 353A.
Kyriazakis, I., Oldham, J.D., Coop, R.L. and Jackson, F. (1994) The effect of subclinical intestinalnematode infection on the diet selection of growing sheep. British Journal of Nutrition 72,665–677.
Kyriazakis, I., Anderson, D.H., Oldham, J.D., Coop, R.L. and Jackson, F. (1996) Long-termsubclinical infection with Trichostrongylus colubriformis – effects on food-intake, dietselection and performance of growing lambs. Veterinary Parasitology 61, 297–313.
Kyriazakis, I., Papachristou, T.G., Duncan, A.J. and Gordon, I.J. (1997) Mild conditioned foodaversions developed by sheep towards flavors associated with plant secondary compounds.Journal of Chemical Ecology 23, 727–746.
Kyriazakis, I., Anderson, D.H. and Duncan, A.J. (1998) Conditioned flavour aversions in sheep:the relationship between the dose rate of a secondary plant compound and the acquisitionand persistence of aversions. British Journal of Nutrition 79, 55–62.
Kyriazakis, I., Tolkamp, B.J. and Emmans, G. (1999) Diet selection and animal state: anintegrative framework. Proceedings of the Nutrition Society 58, 765–771.
Lacey, M.P., Van Krey, H.P., Skewes, P.A. and Denbow, D.M. (1986) Intraduodenal glucoseinfusions do not affect food intake in the fowl. Poultry Science 65, 565–569.
Lacy, M.P., Van Krey, H.P., Skewes, P.A. and Denbow, D.M. (1986) Food intake in the domesticfowl: effects of intrahepatic lipid and amino acid infusion. Physiology and Behavior 36,533–538.
428 References

Lambert, R.J., Hawkins, C.G. and Ellis, M. (1992) Time taken by growing pigs to consume mealsfrom different varieties of rapeseed. Animal Production 54, 482A–483A.
Laplace, J.P. (1970) Omaso-abomasal motility and feeding behaviour in sheep: a new concept.Physiology and Behavior 5, 61–65.
Lawlor, P.G. and Lynch, P.B. (2003) The effect of choice feeding complete diets on theperformance of weaned pigs. Journal of Animal Science 76, 401–412.
Lawrence, A.B., Appleby, M.C., Illius, A.W. and Macleod, H.A. (1989) Measuring hunger in thepig using operant conditioning: the effect of dietary bulk. Animal Production 48, 213–221.
Lawrence, A.B., Terlouw, E.M.C. and Kyriazakis, I. (1993) The behavioural effects ofundernutrition in confined farm animals. Proceedings of the Nutrition Society 52, 219–229.
Lawson, R.E., Redfern, E.J. and Forbes, J.M. (2000) Choices by lactating cows betweenconcentrates high and low in digestible undegraded protein. Animal Science 70, 515–525.
Leaver, J.D. (1973) Rearing of dairy cattle. 4. Effect of concentrate supplementation on the live-weight gain and feed intake of calves offered roughages ad libitum. Animal Production 17,43–52.
Le Du, Y.L.P., Baker, R.D. and Barker, J.M. (1976) The effect of length of milk feeding period andmilk intake on herbage intake and performance of grazing calves. Journal of AgriculturalScience 87, 197–204.
Leek, B.F. (1977) Abdominal and pelvic visceral receptors. British Medical Bulletin 33, 163–168.Leek, B.F. (1986) Sensory receptors in the ruminant alimentary tract. In: Milligan, L.P., Grovum,
W.L. and Dobson, A. (eds) Control of Digestion and Metabolism in Ruminants. Prentice Hall,New Jersey, pp. 3–17.
Leeson, S., Caston, L.J. and Summers, J.D. (1996) Broiler response to energy or energy andprotein dilution in the finisher diet. Poultry Science 75, 522–528.
Le Magnen, J. (1985) Hunger. Cambridge University Press, Cambridge, UK.Le Magnen, J. (1992) Neurobiology of Feeding and Nutrition. Academic Press, San Diego,
California.Le Magnen, J. and Tallon, S. (1966) Spontaneous periodicity of meal taking in the white rat.
Journal of Physiology (Paris) 58.Lemaire, G., Hodgson, J., Moraes, A., Cavalho, P.C.d.F. and Nabinger, C. (eds) (2000) Grassland
Ecophysiology and Grazing Ecology. CAB International, Wallingford, UK.Lemenager, R.P., Owens, F.N., Lusby, K.S. and Totusek, R. (1978) Monensin, forage intake and
lactation of beef cows. Journal of Animal Science 47, 247–254.Lepkovsky, S. and Furuta, F. (1971) The role of homeostasis in adipose tissues upon the
regulation of food intake of White Leghorn cockerels. Poultry Science 50, 573–577.Leuvenink, H.G.D., Bleumer, E.J.B., Bongers, L.J.G.M., Van Bruchem, J. and Van der Heide, D.
(1997) Effect of short-term propionate infusion on feed intake and blood parameters insheep. American Journal of Physiology 272, E997–E1001.
Lewis, M. (1981) Equations for predicting silage intake by beef and dairy cattle. Proceedings ofthe VI Silage Conference, Edinburgh, UK, pp. 35–36.
Lindvall, R.N. (1981) Effect of flooring material and number of pigs per pen on nursery pigperformance. Journal of Animal Science 53, 863–868.
Little, W., Sansom, B.F., Manston, R. and Allen, W.M. (1976) Effects of restricting water intake ofdairy cows upon their milk yield, body weight and blood composition. Animal Production22, 329–339.
Luiting, P. (1999) The role of genetic variation in feed intake and its physiological aspects: resultsfrom selection experiments. In: van der Heide, D., Huisman, E.A., Kanis, E., Osse, J.W.M.and Verstegen, M. (eds) Regulation of Feed Intake. CAB International, Wallingford, UK,pp. 75–87.
Lynch, J.J. and Bell, A.K. (1987) The transmission from generation to generation in sheep of thelearned behaviour for eating grain supplements. Australian Veterinary Journal 64, 291–292.
References 429
Lynch, J.J., Hinch, G.N. and Adams, D.B. (1992) The Behaviour of Sheep: Biological Principlesand Implications for Production. CAB International, Wallingford, UK.
Lynch, P.B. (1989) Voluntary intake of sows and gilts. In: Forbes, J.M., Varley, M.A. andLawrence, T.L.J. (eds) The Voluntary Food Intake of Pigs. British Society of AnimalProduction, Edinburgh, UK, pp. 71–77.
Lyons, T., Caffrey, P.J. and O’Connell, W.J. (1970) The effect of energy, protein and vitaminsupplementation on the performance and voluntary intake of barley straw by cattle. AnimalProduction 12, 323–334.
Macari, M., Zuim, S.M., Secato, E.R. and Guerreiro, J.R. (1986) Effects of ambient temperatureand thyroid hormones on food intake by pigs. Physiology and Behavior 36, 1035–1040.
Maddison, S. and Baldwin, B.A. (1983) Diencephalic neuronal activity during acquisition andingestion of food in sheep. Brain Research 278, 195–206.
MAFF (1975) Energy Allowances and Feeding Systems for Ruminants. Technical Bulletin 33,HMSO, London, 79 pp.
Mahan, D.C. and Mangan, L.T. (1975) Evaluation of various protein sequences on the nutritionalcarry-over from gestation to lactation with first-litter sows. Journal of Nutrition 105,1291–1298.
Malheiros, R.D., Moraes, V.M.B., Collin, A., Decuypere, E. and Buyse, J. (2003) Free dietselection by broilers as influenced by dietary macronutrient ratio and corticosteronesupplementation. 1. Diet selection, organ weights, and plasma metabolites. Poultry Science82, 123–131.
March, B.E., Chu, S. and Macmillan, C. (1982) The effects of feed intake on adipocytes in theabdominal fat pad of mature broiler-type female chickens. Poultry Science 61, 1137–1146.
Marsden, D. and Wood-Gush, D. (1986) A note on the behaviour of individually penned sheepregarding their use for research purposes. Animal Production 42, 157–159.
Martaresche, M., Le Fur, C., Magnusson, M., Faure, J.M. and Picard, M. (2000) Time structure ofbehavioural patterns related to feed pecking in chicks. Physiology and Behavior 70,443–451.
Martin, G.M., Bellingham, W.P. and Storlien, L.H. (1977) Effects of varied colour experience onchickens’ formation of colour and texture aversions. Physiology and Behavior 18, 415–420.
Martin, H.F., Seoane, J.R. and Baile, C.A. (1973) Feeding in satiated sheep elicited byintraventricular injections of CSF from fasted sheep. Life Sciences 13, 177–184.
Masic, B., Wood-Gush, D.G.M., Duncan, I.J.H., McCorquodale, C. and Savory, C.J. (1974) Acomparison of feeding behaviours of young broiler and layer males. British Poultry Science15, 499–505.
Mastika, I.M. and Cumming, R.B. (1985) Effect of nutrition and environmental variations onchoice feeding in broilers. Recent Advances in Animal Nutrition in Australia 1985, 19.
Mastika, I.M. and Cumming, R.B. (1987) Effect of previous experience, and environmentalvariations on the performance and pattern of feed intake of choice fed and complete fedbroilers. Recent Advances in Animal Nutrition in Australia 1987, 260–282.
Matthewman, R.W., Oldham, J.D. and Horgan, G.W. (1993) A note on the effect of sustainedexercise on straw intake and body weight in lactating cattle. Animal Production 57, 491–494.
Matthews, L.R. and Kilgour, R. (1980) Learning and associated factors in ruminant feedingbehaviour. In: Ruckebusch, Y. and Thivend, P. (eds) Digestive Physiology and Metabolism inRuminants. MTP Press, Lancaster, Pennsylvania, pp. 123–144.
May, J.D., Lott, B.D. and Simmons, J.D. (1998) The effect of environmental temperature andweight on growth rate and feed:gain of male broilers. Poultry Science 77, 499–501.
Mayer, J.H. (1953) Glucostatic mechanisms of regulation of food intake. New England Journal ofMedicine 249, 13–16.
Mayes, R.W. and Dove, H. (2000) Measurement of dietary nutrient intake in free-rangingmammalian herbivores. Nutrition Research Reviews 13, 107–138.
430 References

Mayne, C.S. (1992) An evaluation of the concentrate sparing effect of four silage additives.Animal Production 54, 488.
Mayne, C.S. (1993) The effect of formic acid, sulphuric acid and a bacterial inoculation on silagefermentation and the food intake and milk production of lactating dairy cows. AnimalProduction 56, 29–42.
Mbanya, J.N., Anil, M.H. and Forbes, J.M. (1993) The voluntary intake of hay and silage bylactating cows in response to ruminal infusion of acetate or propionate, or both, with andwithout distension of the rumen by a balloon. British Journal of Nutrition 69, 713–720.
McCann, J.P., Bergmann, E.N. and Beerman, D.H. (1992) Dynamic and static phases of severedietary obesity in sheep: food intakes, endocrinology and carcass and organ chemicalcomposition. Journal of Nutrition 122, 496–505.
McDonald, P., Henderson, A.R. and Heron, S.J.E. (1991) The Biochemistry of Silage. 2nd edn.,Chalcombe, Marlow, UK.
McFarlane, J.M. and Curtis, S.E. (1989) Multiple concurrent stressors in chicks. 3. Effects onplasma corticosterone and the heterophil–lymphocyte ratio. Poultry Science 68, 522–527.
McFarlane, J.M., Curtis, S.E., Shanks, R.D. and Carmer, S.G. (1989) Multiple concurrent stressorsin chicks. 1. Effect on weight gain, feed intake and behaviour. Poultry Science 68, 501–509.
McGlone, J.J., Stansbury, W.F. and Tribble, L.F. (1988) Management of lactating sows during heatstress: effects of water drip, snout coolers, floor type and a high energy-density diet. Journalof Animal Science 66, 885–891.
McLaughlin, C.L., Baile, C.A., Buckholtz, L.L. and Freeman, S.K. (1983) Preferred flavors andperformance of weanling piglets. Journal of Animal Science 56, 1287–1293.
McNamee, B.F., Kilpatrick, D.J., Steen, R.W.J. and Gordon, F.J. (2001) The prediction of grasssilage intake by beef cattle receiving barley-based supplements. Livestock Production Science68, 25–30.
McNamee, B.F., Woods, V.B., Kilpatrick, D.J., Mayne, C.S., Agnew, R.E. and Gordon, F.J. (2005)The prediction of the intake potential of grass silage in the supplemented diets of lactatingdairy cows. Livestock Production Science 92, 233–240.
McNeill, L., Bernard, K. and MacLeod, M.G. (2004) Food intake, growth rate, food conversion andfood choice in broilers fed on diets high in rapeseed meal and pea meal, with observations onsensory evaluation of the resulting poultry meat. British Poultry Science 45, 519–523.
McSweeney, C.S. and Pass, M.A. (1983) The mechanism of ruminal stasis in lantana-poisonedsheep. Quarterly Journal of Experimental Physiology 68, 301–313.
Mears, G.J. and Mendel, V.E. (1974) Correlation of food intake in lambs with adipocyte glucosemetabolism and NEFA release. Journal of Physiology 240, 625–637.
Mench, J.A. (1992) The welfare of poultry in modern production systems. Poultry ScienceReviews 4, 107–128.
Mertens, D.R. (1994) Regulation of forage intake. In: Fahey, G.C. (ed.) Forage Quality, Evaluationand Utilization. American Society of Agronomy, Madison, Wisconsin, pp. 450–493.
Mertens, D.R. and Ely, L.O. (1979) A dynamic model of fiber digestion and passage in theruminant for evaluating forage quality. Journal of Animal Science 49, 1085–1095.
Messias de Bragança, M., Mounier, A.M. and Prunier, A. (1998) Does feed restriction mimic theeffects of increased ambient temperature in lactating sows? Journal of Animal Science 76,2017–2024.
Metz, J.H.M. (1975) Time patterns of feeding and rumination in domestic cattle. Meded.Landbouwhogeschool Wageningen 75, 1–66.
Meyer, A., Langhans, W. and Scharrer, E. (1989) Vasopressin reduces food intake in goats.Quarterly Journal of Experimental Physiology 74, 465–473.
Mezzadra, C., Paciaroni, R., Vulich, S., Villareal, E. and Melucci, L. (1989) Estimation of milkconsumption curve parameters for different genetic groups of bovine calves. AnimalProduction 49, 83–87.
References 431

Milford, R. and Minson, D.J. (1966) Intake of tropical pasture species. Proceedings of the 9thInternational Grassland Congress 1, Sao Paulo, Brazil, 815–822.
Miller, K. and Wood-Gush, D.G.M. (1991) Some effects of housing on the social behaviour ofdairy cows. Animal Production 53, 271–278.
Milligan, R.A., Chase, L.E., Sniffen, C.J. and Knoblanch, W.A. (1981) Least-cost Ration BalancedDairy Rations. A Computer Program Users Manual. Department of Animal Science, Ithaca,New York.
Milton, J.T.B. and Ternouth, J.H. (1985) Phosphorus metabolism in ruminants 2. Effects ofinorganic phosphorus concentration upon food-intake and digestibility. Australian Journal ofAgricultural Resarch 36, 647–654.
Miner, J.L. (1992) Recent advances in the central control of intake in ruminants. Journal ofAnimal Science 70, 1283–1289.
Minson, D.J. (1982) Effects of chemical and physical composition of herbage eaten upon intake.In: Hacker, J.B. (ed.) Nutritional Limits to Animal Production from Pastures. CAB, Slough,UK, pp. 167–182.
Minson, D.J. and Ternouth, J.H. (1971) The expected and observed changes in the intake ofthree hays by sheep after shearing. British Journal of Nutrition 26, 31–39.
Mirza, S.N. and Provenza, F.D. (1994) Socially induced food avoidance in lambs – direct orindirect maternal influence. Journal of Animal Science 72, 899–902.
Mongin, P. and Sauveur, B. (1979) The specific calcium appetite of the domestic fowl. In:Boorman, K.N. and Freeman, B.M. (eds) Food Intake Regulation in Poultry. Longman,Edinburgh, UK, pp. 171–189.
Monteiro, L.S. (1972) The control of appetite in lactating cows. Animal Production 14, 263–282.Montgomery, M.J. and Baumgardt, B.R. (1965) Regulation of food intake in ruminants: I Pelleted
rations varying in energy concentration. Journal of Dairy Science 48, 569–574.Morgan, C.A., Nielsen, B.L., Lawrence, A.B. and Mendl, M.T. (1999) Describing the social
environment and its effects on food intake and growth. In: Kyriazakis, I. (ed.) A QuantitativeBiology of the Pig. CAB International, Wallingford, UK, pp. 99–125.
Morgan, C.A., Emmans, G.C., Tolkamp, B.J. and Kyriazakis, I. (2000a) Analysis of the feedingbehaviour of pigs using different models. Physiology and Behavior 68, 395–403.
Morgan, C.A., Tolkamp, B.J., Emmans, G.C. and Kyriazakis, I. (2000b) The way in which thedata are combined affects the interpretation of short-term feeding behaviour. Physiology andBehavior 70, 391–396.
Morgan, C.A., Lawrence, A.B., Chirnside, J. and Deans, L.A. (2001) Can information about solidfood be transmitted from one piglet to another? Animal Science 73, 471–478.
Morgan, C.A., Kyriazakis, I., Lawrence, A.B., Chirnside, J. and Fullam, H. (2003) Diet selectionby groups of pigs: effect of a trained individual on the rate of learning about novel foodsdiffering in protein content. Animal Science 76, 101–109.
Morris, B.A. and Taylor, T.G. (1967) The daily food consumption of laying hens in relation to eggformation. British Poultry Science 8, 251–257.
Morris, T.R. (1968) The effect of dietary energy level on the voluntary caloric intake of layingbirds. British Poultry Science 9, 285–295.
Morris, T.R. and Njuru, D.M. (1990) Protein requirement of fast and slow growing chicks. BritishPoultry Science 31, 803–809.
Morrow, A.T.S. and Walker, N. (1992) The effect of increasing workload to obtain feed ad libitumon performance and behaviour of finishing pigs. Animal Production 54, 481A.
Morrow, A.T.S. and Walker, N. (1994) Effects of number and siting of single space feeders onperformance and feeding behaviour of growing pigs. Journal of Agricultural Science 122,465–470.
Mount, L.E. (1968) The Climatic Physiology of the Pig. Arnold, London.Mowatt, D.N. (1963) Factors affecting rumen capacity and the physical inhibition of feed intake.
PhD thesis, Cornell University, Ithaca, New York.
432 References

Mrode, R.A. and Kennedy, B.W. (1993) Genetic variation in measures of food efficiency inpigs and their genetic relationships with growth rate and backfat. Animal Production 56,225–232.
Muinga, R.W., Thorpe, W. and Topps, J.H. (1992) Voluntary food intake, live-weight change andlactation performance of crossbred dairy cows given ad libitum Pennisetum purpureum(napier grass var. Bana) supplemented with leucaena forage in the lowland semi-humidtropics. Animal Production 55, 331–338.
Murphy, M.R., Davis, C.L. and McCoy, G.C. (1982) Factors affecting water consumption byHolstein cows in early lactation. Journal of Dairy Science 66, 35–38.
Nagamine, I., Sunagawa, K., Kuriwaki, J. and Shinjo, A. (2003) Changes in single unit activity inthe lateral hypothalamic area of goats during feeding. Journal of Animal Science 81,529–536.
Nam, D.S., Aherne, F.X. and Darroch, C.S. (1995) Growth performance of pigs given a choice ofnatural ingredient diets containing different levels of protein and amino acid(s). Animal FeedScience and Technology 56, 265–276.
Neal, H.D., Thomas, C. and Cobby, J.M. (1984) Comparison of equations for predictingvoluntary intake by dairy cows. Journal of Agricultural Science 103, 1–10.
Neal, H.D.S., France, J., Orr, R.J. and Treacher, T.T. (1985) A model to maximize hay intakewhen formulating rations for pregnant ewes. Animal Production 40, 93–100.
Neal, H.D., Gill, M., France, J., Spedding, A. and Marsden, S. (1988) An evaluation of predictionequations incorporated in a computer program to ration beef cattle. Animal Production 46,169–179.
Neilsen, B.L., Lawrence, A.B. and Whittemore, C.T. (1996) Feeding behaviour of growing pigsusing single or multispace feeders. Applied Animal Behaviour Science 47, 235–246.
Newman, R.K. and Sands, D.C. (1983) Dietary selection for lysine by the chick. Physiology andBehavior 31, 13–20.
Nicol, C.J. (1996) Farm animal cognition. Animal Science 62, 375–391.Nicol, C.J. and Pope, S.J. (1994) Social learning in sibling pigs. Applied Animal Behaviour
Science 40, 31–43.Nielsen, B.L., Lawrence, A.B. and Whittemore, C.T. (1995) Effect of group size on feeding
behaviour, social behaviour and performance of growing pigs using single-space feeders.Livestock Production Science 44, 73–85.
Nielsen, B.L., Lawrence, A.B. and Whittemore, C.T. (1996) Effect of individual housing on thefeeding behaviour of previously group housed growing pigs. Applied Animal BehaviourScience 47, 149–161.
Nofre, C., Glaser, D., Tinti, J.M. and Wanner, M. (2002) Gustatory responses of pigs to sixtycompounds tasting sweet to humans. Journal of Animal Physiology and Animal Nutrition 86,90–96.
Nolte, D.L. and Provenza, F.D. (1992) Food preferences in lambs after exposure to flavors in milk.Applied Animal Behaviour Science 32, 381–389.
Nombekela, S.W., Murphy, M.R., Gonyou, H.W. and Marden, J.I. (1994) Dietary preferences inearly lactation cows as affected by primary tastes and some common feed flavors. Journal ofDairy Science 77, 2393.
NRC (1984a) Nutrient Requirements of Beef Cattle. 6th edn., National Academy Press,Washington, DC.
NRC (1984b) Nutrient Requirements of Poultry. National Academy Press, Washington, DC.NRC (1987) Predicting Feed Intake of Food-producing Animals. National Academy Press,
Washington, DC.NRC (1989) Nutrient Requirements of Dairy Cattle. 6th edn., National Academy of Science,
Washington, DC.NRC (1998) Nutrient Requirements of Swine. 10th edn., National Academy Press, Washington, DC.
References 433

NRC (2000) Feed Intake. Nutrient Requirements of Beef Cattle. 7th edn., National Academy ofSciences, Washington, DC, pp. 85–96.
Oba, M. and Allen, M.S. (2003a) Hypophagic effects of ammonium are greater when infused withpropionate compared with acetate in lactating dairy cows. Journal of Nutrition 133, 1100–1104.
Oba, M. and Allen, M.S. (2003b) Intraruminal infusion of propionate alters feeding behaviourand decreases energy intake of lactating dairy cows. Journal of Nutrition 133, 1094–1099.
Offer, N.W. (1997) A comparison of the effects on voluntary intake by sheep of dietary additionof either silage juices or lactic acid solutions of the same neutralizing value. Animal Science64, 331–337.
Offer, N.W. (2000) A comparison of the effects on voluntary intake by sheep of either dietary orintra-ruminal addition of silage juices. Animal Science 70, 325–333.
Offer, N.W., Percival, D.S., Dewhurst, R.J. and Thomas, C. (1998) Prediction of the voluntaryintake potential of grass silage by sheep and dairy cows from laboratory silagemeasurements. Animal Science 66, 357–367.
O’Grady, J.F., Lynch, P.B. and Kearney, P.A. (1985) Voluntary feed intake by lactating sows.Livestock Production Science 12, 355–365.
Oldham, J.D., Emmans, G. and Friggens, N. (1998) Development of predictive systems to relateanimal and feed characteristics to amounts and patterns of forage, and total food intake, bycows. In: Gill, M. (ed.) Optimisation of Forage Quality and Intake by Ruminants. Report toMAFF on DS04, Natural Resources International Ltd., Chatham, UK.
Ollivier, L. (1978) The unfavourable effect of mixing sexes in fattening pigs in groups. Annales DeZootechnie 26, 615–619.
Olsson, K. (1969) Effects of slow infusions of KCl into the 3rd brain ventricle. Acta PhysiologicaScandinavica 77, 358–364.
Olsson, K. and McKinley, M.J. (1980) Central control of water and salt intake in goats and sheep.In: Ruckebusch, Y. and Thivend, P. (eds) Digestive Physiology and Metabolism in Ruminants.MTP Press, Lancaster, Pennsylvania, pp. 161–175.
Olver, M.D. and Jonker, A. (1997) Effect of choice feeding on the performance of broilers. BritishPoultry Science 38, 571–576.
Olver, M.D. and Malan, D.D. (2000) The effect of choice-feeding from 7 weeks of age on theproduction characteristics of laying hens. South African Journal of Animal Science 30, 110–114.
Oosting, S.J. and Nordheim, H. (1999) The role of metabolic feed intake regulation in feed intakebehaviour of sheep fed increasing amounts of low-quality forages. A model approach. In:van der Heide, D., Huisman, E.A., Kanis, E., Osse, J.W.M. and Verstegen, M. (eds)Regulation of Feed Intake. CAB International, Wallingford, UK, pp. 41–48.
Orr, R.M. (1977) A study on the role of body fatness in the control of voluntary feed intake insheep. PhD thesis, University of Edinburgh, UK.
Orr, R.J. and Treacher, T.T. (1989) The effect of concentrate level and the intake of grass silage byewes in late pregnancy. Animal Production 48, 109–120.
Orr, R.J. and Treacher, T.T. (1994) The effect of concentrate level on the intakes of silages or haysby ewes in the 1st month of lactation. Animal Production 58, 109–116.
Ørskov, E.R. (2000) New concepts of feed evaluation for ruminants with emphasis on roughagesand feed intake. Asian-Australasian Journal of Animal Sciences 13, 128–136.
Ørskov, E.R. and McDonald, I. (1979) The estimation of protein degradability in the rumen fromincubation measurements weighted according to rate of passage. Journal of AgriculturalScience 92, 499–503.
Osbourn, D.F. (1967) The intake of conserved forages. Fodder Conservation 3. Reading, UK,British Grassland Society, pp. 20–28.
Osbourn, D.J., Terry, R.A., Outen, G.E. and Cammell, S.B. (1974) The significance of adetermination of cell walls as the rational basis for the nutritive evaluation of forages.Proceedings of the XII International Grassland Congress 3, Moscow, p. 374.
434 References

Ostergaard, V. (1979) Strategies for Concentrate Feeding to Attain Optimum Feeding Level inHigh Yielding Dairy Cows. National Institute of Agricultural Science, Copenhagen.
Owen, J.B. (1979) Complete Diets for Cattle and Sheep, Farming Press, Ipswich, UK.Owen, J.B. and Ridgman, W.J. (1967) The effect of dietary energy content on the voluntary feed
intake of pigs. Animal Production 9, 107–113.Owen, J.B. and Ridgman, W.J. (1968) Further studies of the effect of dietary energy content on
the voluntary intake of pigs. Animal Production 10, 85–91.Owen, J.B., Davies, D.A.R. and Ridgman, W.J. (1969) The control of voluntary food intake in
ruminants. Animal Production 11, 511–520.Ozanne, P.G. and Howes, K.M.W. (1971) Preference of grazing sheep for pasture of high
phosphate content. Australian Journal of Agricultural Research 22, 941–950.Pajor, E.A., Fraser, D. and Kramer, D.L. (1991) Consumption of solid food by suckling pigs:
individual variation and relation to weight gain. Applied Animal Behaviour Science 32,139–155.
Pamp, D.E., Goodrich, R.D. and Meiske, J.C. (1976) A review of the practice of feeding mineralsfree choice. World Review of Animal Production 12, 13–18.
Panksepp, J. (1978) Analysis of feeding patterns: data reduction and theoretical implications. In:Booth, D.A. (ed.) Hunger Models: Computable Theory of Feeding Control. Academic Press,London, pp. 143–166.
Park, R.S., Gordon, F.J., Cooper, K. and Steen, R.W.J. (1996) The prediction of intake potentialand organic matter digestibility of grass silages by near infrared spectroscopy analysis ofundried samples. Animal Science 62, 626.
Parrott, R.F. and Baldwin, B.A. (1978) Effects of intracerebroventricular injections of 2-deoxy-D-glucose, D-glucose and xylose on operant feeding in pigs. Physiology and Behavior 21,329–331.
Parrott, R.F. and Baldwin, B.A. (1981) Operant feeding and drinking in pigs followingintracerebroventricular injection of synthetic cholecystokinin octapeptide. Physiology andBehavior 26, 419–422.
Parrott, R.F. and Baldwin, B.A. (1982) Centrally administered bombesin produces effects unlikeshort-term satiety in operant feeding pigs. Physiology and Behavior 28, 521–524.
Parrott, R.F., Heavens, R.P. and Baldwin, B.A. (1986) Stimulation of feeding in the satiated pig byintracerebroventricular injection of neuropeptide Y. Physiology and Behavior 36, 523–525.
Parsons, A.J., Newman, J.A., Penning, P.D., Harvey, A. and Orr, R.J. (1994) Diet preference bysheep: effects of recent diet, physiological state and species abundance. Journal of AnimalEcology 63, 465–478.
Patterson, D.A., McGilloway, A., Cushnahan, A., Mayne, C.S. and Laidlaw, A.S. (1998) Effect ofduration of fasting period on short-term intake rates of lactating dairy cows. Animal Science66, 299–305.
Paulicks, B.R., Ott, H. and Roth-Maier, D.A. (2003) Performance of lactating sows in response tothe dietary valine supply. Journal of Animal Physiology and Animal Nutrition 87, 389–396.
Pearson, R.A., Zerbini, E. and Lawrence, P.R. (1999) Recent advances in research on draughtanimals. Animal Science 68, 1–17.
Peel, C.J., Sandles, L.D., Quelch, K.J. and Herington, A.C. (1985) The effects of long-termadministration of bovine growth hormone on the lactational performance of identical-twindairy cows. Animal Production 41, 135–142.
Pekas, J.C. (1983) A method for direct gastric feeding and the effect on voluntary ingestion inyoung swine. Appetite 4, 23–30.
Perry, G.C. (1992) Olfaction and taste. In: Phillips, C.J.C. and Piggins, D. (eds) Farm Animals andthe Environment. CAB International, Wallingford, UK, pp. 185–199.
Persyn, K.E., Xin, H., Nettleton, D., Ikeguchi, A. and Gates, R.S. (2004) Feeding behaviours oflaying hens with or without beak trimming. Transactions of the American Society of AgriculturalEngineers 47, 591–596.
References 435

Petchey, A.M. and Broadbent, P.J. (1980) The performance of fattening cattle offered barley andgrass silage in various proportions either as discrete feeds or as a complete diet. AnimalProduction 31, 251–257.
Peters, R.R., Chapin, L.T., Emery, R.S. and Tucker, H.A. (1980) Growth and hormonal responseof heifers to various photoperiods. Journal of Animal Science 51, 1148–1153.
Peters, R.R., Chapin, L.T., Emery, R.S. and Tucker, H.A. (1981) Milk yield, feed intake, prolactin,growth hormone and glucocorticoid response of cows to supplemental light. Journal of DairyScience 64, 1671–1678.
Petherick, J.C. and Waddington, D. (1991) Can domestic fowl (Gallus domesticus) anticipate aperiod of food deprivation? Applied Animal Behaviour Science 32, 219–226.
Petherick, J.C., Sutherland, R.H., Waddington, D. and Rutter, S.M. (1992) Measuring themotivation of domestic fowl in response to a positive and negative reinforcer. Applied AnimalBehaviour Science 33, 357–366.
Pfister, J.A. (2000) Food aversion learning to eliminate cattle consumption of pine needles.Journal of Range Management 53, 655–659.
Pfister, J.A., Provenza, F.D., Manners, G.D., Gardner, D.R. and Ralphs, M.H. (1997) Tall larkspuringestion: can cattle regulate intake below toxic levels? Journal of Chemical Ecology 23,759–777.
Phipps, R.H., Sutton, J.D., Jones, B.A., Allen, D. and Fisher, W.J. (1993) The effect of mixedforage diets on food intake and milk production of dairy cows. Animal Production 56, 424A.
Phipps, R.H., Sutton, J.D., Beever, D.E. and Jones, A.K. (2000) The effect of crop maturity onthe nutritive value of maize silage for lactating dairy cows 3. Food intake and milkproduction. Animal Science 71, 401–409.
Phy, T.S. and Provenza, F.D. (1998) Eating barley too frequently or in excess decreases lambs’preference for barley but sodium bicarbonate and lasalocid attenuate the response. Journalof Animal Science 76, 1578–1583.
Picard, M., Le Fur, C., Melcion, J.P. and Bouchot, C. (2000) Feed particles: what chickens seeand touch! Productions Animales 13, 117–130.
Pickard, D.W., Swan, H. and Lamming, G.E. (1969) Studies on the nutrition of ruminants. 4. Theuse of ground straw of different particle sizes for cattle from twelve weeks of age. AnimalProduction 11, 543–550.
Pickard, D.W., Hedley, W.G. and Skilbeck, S. (1977) Calcium appetite in growing pigs.Proceedings of the Nutrition Society 36, 87A.
Pickard, D.W., Beevors, J.A., Hughes, G. and Knibb, H.F. (1978) The voluntary intake of calciumby dairy cows at the end of pregnancy and its effect on plasma calcium at parturition. AnimalProduction 26, 365.
Piggins, D. (1992) Visual perception. In: Phillips, C.J.C. and Piggins, D. (eds) Farm Animals andthe Environment. CAB International, Wallingford, UK, pp. 131–158.
Pittroff, W. and Kothmann, M.M. (1999) Regulation of intake and diet selection by herbivores. In:Jung, H.G. and Fahey, G.C. (eds) Nutritional Ecology of Herbivores. American Society ofAnimal Science, Savoy, Illinois, pp. 366–422.
Pittroff, W. and Kothmann, M.M. (2001a) Quantitative prediction of feed intake in ruminants. I.Conceptual and mathematical analysis of models for sheep. Livestock Production Science71, 131–150.
Pittroff, W. and Kothmann, M.M. (2001b) Quantitative prediction of feed intake in ruminants. II.Conceptual and mathematical analysis of models for cattle. Livestock Production Science 71,151–169.
Pittroff, W. and Kothmann, M.M. (2001c) Quantitative prediction of feed intake in ruminants. III.Comparative example calculations and discussion. Livestock Production Science 71, 171–181.
Pittroff, W. and Soca, P. (2006) Physiology and models of feeding behaviour and intake regulationin ruminants. In: Bels, V.L. (ed.) Food and Feeding in Domestic Vertebrates: a ComprehensiveApproach from Structure to Behaviour. CAB International, Wallingford, UK, pp. 278–301.
436 References

Polin, D. and Wolford, J.H. (1973) Factors influencing food intake and calorific balance inchickens. Federation Proceedings 32, 1720–1726.
Poppi, D.P., Gill, M. and France, J. (1994) Integration of theories of intake regulation in growingruminants. Journal of Theoretical Biology 167, 129–145.
Powell, J., Bolte, M.R., Hengel, D.A., Mount, D.E., Pollock, M.D., Scholljegerdes, E.J. and Schultz,W.L. (2000) Affecting Plant Palatability and Animal Preferences: an Annotated Bibliography.Available at http://uwadmnweb.uwyo.edu/RenewableResources/classes/Palatability.htm
Prescott, N.J., Wathes, C.M., Kirkwood, J.K. and Perry, G.C. (1985) Growth, food intake anddevelopment in broiler cockerels raised to maturity. Animal Production 41, 239–246.
Provenza, F.D. (1995) Tracking variable environments – there is more than one kind of memory.Journal of Chemical Ecology 21, 911–923.
Provenza, F.D. and Immense, J.J. (2006) Foraging in domestic herbivores: linking the internal andexternal milieu. In: Bels, V.L. (ed.) Food and Feeding in Domestic Vertebrates: a ComprehensiveApproach from Structure to Behaviour. CAB International, Wallingford, UK, pp. 210–240.
Provenza, F.D., Lynch, J.J. and Nolan, J.V. (1993) The relative importance of mother andtoxicosis in the selection of foods by lambs. Journal of Chemical Ecology 19, 313–323.
Provenza, F.D., Ortega-Reyes, C.B., Scott, C.B., Lynch, J.J. and Burritt, E.A. (1994a) Antiemeticdrugs attenuate food aversions in sheep. Journal of Animal Science 73, 1989–1994.
Provenza, F.D., Lynch, J.J. and Nolan, J.V. (1994b) Food aversion conditioned in anesthetizedsheep. Physiology and Behavior 55, 429–432.
Provenza, F.D., Burritt, E.A., Perevolotsky, A. and Silanikove, N. (2000) Self-regulation of intakeof polyethylene glycol by sheep fed diets varying in tannin concentrations. Journal of AnimalScience 78, 1206–1212.
Puppe, B. and Tuscherer, A. (2000) The development of suckling frequency in pigs from birth toweaning of their piglets: a sociobiological approach. Animal Science 71, 273–279.
Pym, R.A.E. and Nichols, R.J. (1979) Selection for food conversion in broilers: direct andcorrelated responses to selection for body weight gain, food consumption, and foodconversion ratio. British Poultry Science 20, 73–86.
Rayner, D.V. and Gregory, P.C. (1985) Gastrointestinal influences on short-term regulation offood intake in pigs. Proceedings of the Nutrition Society 44, A56.
Rayner, D.V. and Gregory, P.C. (1989) The role of the gastrointestinal tract in the control ofvoluntary food intake. In: Forbes, J.M., Varley, M.A. and Lawrence, T.L.J. (eds) The VoluntaryFood Intake of Pigs. British Society of Animal Production, Edinburgh, UK, pp. 27–39.
Rayner, D.V., Miller, S. and Lopez, S. (1991) MK-329, L-365,260 and the inhibition of foodintake, gastric emptying, volume and pressure to duodenal emulsified fat infusion in the pig.Regulatory Peptides 35, 255.
Redbo, I., Emanuelson, M., Lundberg, K. and Oredsson, N. (1996) Feeding level and oralstereotypies in dairy cows. Animal Science 62, 199–206.
Reid, R.L., Hinks, N.T. and Mills, S.C. (1963) Alloxan diabetes in pregnant ewes. Journal ofEndocrinology 27, 1–19.
Renaudeau, D., Mandonnet, N., Tixier-Boichard, M., Noblet, J. and Bidanel, J.P. (2004)Attenuate the effects of high ambient temperature on pig performance: the genetic selection.Productions Animales 17, 93–108.
Rezek, M., Schneider, K. and Novin, D. (1975) Regulation of food intake following vagotomy,coeliacotomy and a combination of both procedures. Physiology and Behavior 15, 517–522.
Rhind, S.M., McMillen, S.R., Duff, E., Hirst, D. and Wright, S. (1998) Seasonality of mealpatterns and hormonal correlates in red deer. Physiology and Behavior 65, 295–302.
Rhind, S.M., Archer, Z.A. and Adam, C.L. (2002) Seasonality of food intake in ruminants: recentdevelopments in understanding. Nutrition Research Reviews 15, 43–65.
Richardson, A.J. (1970) The role of the crop in the feeding behaviour of the domestic chicken.Animal Behaviour 18, 633–639.
References 437

Richardson, E.C. and Herd, R.M. (2004) Biological basis for variation in residual feed intake inbeef cattle. 2. Synthesis of results following divergent selection. Australian Journal ofExperimental Agriculture 44, 431–440.
Riley, J.E. (1989) Recent trends in pig production: the importance of intake. In: Forbes, J.M.,Varley, M.A. and Lawrence, T.L.J. (eds) The Voluntary Food Intake of Pigs. British Society ofAnimal Production, Edinburgh, UK, pp. 1–5.
Rivera Ferre, M.G., Edwards, S.A., Mayes, R.W., Riddoch, I. and Hovell, F.D.D. (2001) Theeffects of season and level of concentrate on the voluntary intake and digestibility of herbageby outdoor sows. Animal Science 72, 501–510.
Riviere, P. and Bueno, L. (1987) Influence of regimen and insulaemia on orexigenic effects ofGRF 1–44 in sheep. Physiology and Behavior 39, 347–350.
Robert, S., Matte, J.J., Farmer, C., Girard, C.L. and Martineau, G.P. (1993) High-fibre diets forsows: effects on stereotypies and adjunctive drinking. Applied Animal Behaviour Science 37,297–309.
Roberts, T.J. and Azain, M.J. (1997) Somatotropin treatment reduces energy intake withoutaltering protein intake in pigs selecting between high and low protein diets. Journal ofNutrition 127, 2047–2053.
Robinson, D.W. (1974) Food intake regulation in pigs. 3. Voluntary food selection betweenprotein-free and protein-rich diets. British Veterinary Journal 130, 522–527.
Robinson, D.W. (1975) Food intake regulation in pigs. 4. The influence of dietary threonineimbalance on food intake, dietary choice and plasma amino acid patterns. British VeterinaryJournal 131, 595–600.
Rolls, B.J. and Rolls, E.T. (1982) Thirst. Cambridge University Press, Cambridge, UK.Romney, D.L., Blunn, V., Sanderson, R. and Leaver, J.D. (2000) Feeding behaviour, food intake
and milk production responses of lactating dairy cows to diets based on grass silage of highor low dry-matter content, supplemented with quickly and slowly fermentable energysources. Animal Science 71, 349–357.
Rook, A.J., Dhanoa, M.S. and Gill, M. (1990) Prediction of the voluntary intake of grass silagesby beef cattle. 3. Precision of alternative prediction models. Animal Production 50, 455–466.
Rook, A.J., Gill, M., Wilkins, R.D. and Lister, S.J. (1991) Prediction of voluntary intake of grasssilages by lactating cows offered concentrates at a flat rate. Animal Production 52, 407–420.
Rose, S.P. and Kyriazakis, I. (1991) Diet selection of pigs and poultry. Proceedings of the NutritionSociety 50, 87–98.
Rose, S.P., Fielden, M., Foote, W.R. and Gardin, P. (1995) Sequential feeding of whole wheat togrowing broiler chickens. British Poultry Science 36, 97–111.
Roseler, D.K., Fox, D.G., Chase, L.E., Pell, A.N. and Stone, W.C. (1997a) Development andevaluation of equations for prediction of feed intake for lactating Holstein dairy cows.Journal of Dairy Science 80, 878–893.
Roseler, D.K., Fox, D.G., Pell, A.N. and Chase, L.E. (1997b) Evaluation of alternative equationsfor prediction of intake for Holstein dairy cows. Journal of Dairy Science 80, 864–877.
Roy, J. (1980) The Calf. 4th edn., Butterworths, London.Ru, Y.J. and Bao, Y.M. (2004) Feeding dry sows ad libitum with high fibre diets. Asian-
Australasian Journal of Animal Sciences 17, 283–300.Rusby, A.A. and Forbes, J.M. (1985) The effect of portal vein infusion of 2-deoxy-glucose and 3-
methyl-glucose on the food intake of cockerels. Proceedings of the Nutrition Society 44, 59A.Rusby, A.A. and Forbes, J.M. (1987a) Effects of infusion of lysine, leucine and ammonium
chloride into the hepatic portal vein of chickens on voluntary food intake. British Journal ofNutrition 58, 325–331.
Rusby, A.A. and Forbes, J.M. (1987b) Food intake of intact and vagotomised chickens infusedwith lysine and glucose into the hepatic portal vein. Proceedings of the Nutrition Society 46,33A.
438 References

Rusby, A.A., Anil, M.H., Chatterjee, P. and Forbes, J.M. (1987) Effects of intraportal infusion ofglucose and lysine of food intake in intact and hepatic-vagotomized chickens. Appetite 9,65–72.
Rutter, S.M., Jackson, D.A., Johnson, C.L. and Forbes, J.M. (1987) Automatically recordedcompetitive feeding behaviour as a measure of social dominance in dairy cows. AppliedAnimal Ethology 17, 41–50.
Sahin, A. (1998) Diet selection for protein by chickens subjected to metabolic manipulation. PhDthesis, University of Leeds, UK.
Sahin, A. and Forbes, J.M. (1997a) Dehydroepiandrosterone for modulation of the effect ofcorticosterone on diet selection and body components in broiler chickens. British PoultryScience 38, S53–S54.
Sahin, A. and Forbes, J.M. (1997b) Diet selection in broiler chickens with corticosterone-inducedchanges in body composition. In: Forbes, J.M., Lawrence, T.L.J., Varley, M.A. and Rodway,R.G. (eds) Animal Choices. British Society of Animal Production, Edinburgh, UK, pp. 121–123.
Sahin, A. and Forbes, J.M. (1999) Effect of corticosterone on diet selection for protein in relationto egg production by laying hens. British Poultry Science 40, S54–S55.
Salfen, B.E., Carroll, J.A., Keisler, D.H. and Strauch, T.A. (2004) Effects of exogenous ghrelin onfeed intake, weight gain, behaviour, and endocrine responses in weanling pigs. Journal ofAnimal Science 82, 1957–1966.
Sanderson, R., Thomas, C. and McAllan, A.B. (1992) Fish-meal supplementation of grass silagegiven to young growing steers: effect on intake, apparent digestibility and live-weight gains.Animal Production 55, 389–396.
Sartin, J.L., Dyer, C., Matteri, R., Buxton, D., Buonomo, F., Shores, M., Baker, J., Osborne, J.A.,Braden, T. and Steele, B. (2001) Effect of intracerebroventricular orexin-B on food intake insheep. Journal of Animal Science 79, 1573–1577.
Saunders, P.T. (1980) An Introduction to Catastrophe Theory. Cambridge University Press,Cambridge, UK.
Savory, C.J. (1979) Feeding behaviour. In: Boorman, K.N. and Freeman, B.M. (eds) Food IntakeRegulation in Poultry. Longman, Edinburgh, UK, pp. 277–323.
Savory, C.J. (1984) Regulation of food intake by brown leghorn cockerels in response to dietarydilution with kaolin. British Poultry Science 25, 253–258.
Savory, C.J. (1985) An investigation into the role of the crop in control of feeding in Japanesequail and domestic fowls. Physiology and Behavior 35, 917–928.
Savory, C.J. (1987) An alternative explanation for apparent satiating properties of peripherallyadministered bombesin and cholecystokinin in domestic fowls. Physiology and Behavior 39,191–202.
Savory, C.J. (1989) Responses of fowls to an operant feeding procedure and its potential use forreducing randomness in meal occurrence. Physiology and Behavior 45, 373–379.
Savory, C.J. and Gentle, M.J. (1984) Effects of food deprivation, strain, diet and age on feedingresponses to intravenous injections of cholecystokinin. Appetite 4, 165–177.
Savory, C.J. and Hodgkiss, J.P. (1984) Influence of vagotomy in domestic fowls on feedingactivity, food passage, and satiety effects of two peptides. Physiology and Behavior 33,937–944.
Savory, C.J., Gentle, M.J. and Yeomans, M.R. (1989) Opioid modulation of feeding and drinkingin fowls. British Poultry Science 30, 379–392.
Savory, C.J., Maros, K. and Rutter, S.M. (1993) Assessment of hunger in growing broiler breedersin relation to a commercial restricted feeding programme. Animal Welfare 2, 131–152.
Savory, J. (1988) Rate of eating by domestic fowls in relation to changing food deficits. Appetite10, 57–65.
Schanbacher, B.D. and Crouse, J.D. (1981) Photoperiodic regulation of growth. A photosensitivephase during the light dark cycle. American Journal of Physiology 241, E1–E5.
References 439

Scharrer, E. (1999) Control of food intake by fatty acid oxidation and ketogenesis. Nutrition 15,704–714.
Scharrer, E., Lutz, T.A. and Rossi, R. (1996) Coding of metabolic information by hepatic sensorscontrolling food intake. In: Shimazu, T. (ed.) Liver Innervation. John Libbey, Eastleigh, UK,pp. 381–388.
Schettini, M.A., Prigge, E.C. and Nestor, E.L. (1999) Influence of mass and volume of ruminalcontents on voluntary intake and digesta passage of a forage diet in steers. Journal of AnimalScience 77, 1896–1904.
Schinckel, A.P. and de Lange, C.F.M. (1996) Characterization of growth parameters needed asinputs for pig growth models. Journal of Animal Science 74, 2021–2036.
Schmolke, S.A., Li, Y.Z. and Gonyou, H.W. (2003) Effect of group size on performance ofgrowing-finishing pigs. Journal of Animal Science 81, 874–878.
Schwarz, F.J., Heindl, U. and Kirchgessner, M. (1996) Estimation of forage intake by lactatingcows. Zuchtungskunde 68, 65–76.
Senn, M., Durst, B., Kaufmann, A. and Langhans, W. (1995) Feeding patterns of lactating cowsof three different breeds fed hay, corn silage, and grass silage. Physiology and Behavior 58,229–236.
Seoane, J.R. and Baile, C.A. (1972) Effects of intraventricular (III ventricle) injections of 2-deoxy-d-glucose, glucose and xylose on feeding behaviour of sheep. Physiology and Behavior 9,423–428.
Seoane, J.R., Baile, C.A. and Martin, H.F. (1972) Humoral factors modifying feeding behaviourof sheep. Physiology and Behavior 8, 993–995.
Seoane, J.R., Baile, C.A. and Webb, R.L. (1973) Feeding behaviour in sheep as related to thehypnotic activites of barbiturates injected into the third ventricle. Pharmacology,Biochemistry and Behavior 1, 47–53.
Seoane, J.R., McLaughlin, C.L. and Baile, C.A. (1975) Feeding following intrahypothalamicinjections of calcium and magnesium ions in sheep. Journal of Dairy Science 58, 349–361.
Seoane, J.R., Bedard, L. and Caron, N. (1988) Comparison between pentobarbital- andmuscimol-induced feeding in satiated sheep. Canadian Journal of Physiology andPharmacology 66, 703–706.
Shaobi, T.S. and Forbes, J.M. (1987) Feeding responses to infusions of glucose solutions into theduodenum of cockerels and the influence of pre-fasting and vagotomy. British PoultryScience 28, 407–413.
Shariatmadari, F. and Forbes, J.M. (1992a) Diurnal food intake patterns of broiler chickensoffered a choice of feed varying in protein content. Animal Production 54, 470.
Shariatmadari, F. and Forbes, J.M. (1992b) The effect of force-feeding various levels of protein ondiet selection and growth of broiler chickens. Proceedings of the Nutrition Society 51, 56A.
Shariatmadari, F. and Forbes, J.M. (1993) Growth and food intake responses to diets of differentprotein contents and a choice between diets containing two levels of protein in broiler andlayer strains of chicken. British Poultry Science 34, 959–970.
Sherwin, C.M., Heyes, C.M. and Nicol, C.J. (2002) Social learning influences the preferences ofdomestic hens for novel food. Animal Behaviour 63, 933–942.
Shurlock, T.G.H. and Forbes, J.M. (1981a) Evidence for hepatic glucostatic regulation of foodintake in the domestic chicken and its interaction with gastrointestinal control. British PoultryScience 22, 333–346.
Shurlock, T.G.H. and Forbes, J.M. (1981b) Factors affecting food intake in the domestic chicken:the effect of infusions of nutritive and non-nutritive substances into the crop and duodenum.British Poultry Science 22, 323–331.
Shurlock, T.G.H. and Forbes, J.M. (1984) Effects on voluntary intake of infusions of glucose andamino acids into the hepatic portal vein of chickens. British Poultry Science 25, 303–308.
Sibbald, A.M. (1997) The effect of body condition on the feeding behaviour of sheep withdifferent times of access to food. Animal Science 64, 239–246.
440 References

Sibbald, A.M. and Rhind, S.M. (1997) The effect of previous body condition on appetite andassociated insulin profiles in sheep. Animal Science 64, 247–252.
Sibbald, A.M., Smith, D.J.F. and Hooper, R.J. (2000) Individual differences in sociability and theirconsequences for foraging in sheep. Proceedings of the British Society of Animal Science2000, 129.
Siegel, P.B., Picard, M., Nir, I., Dunnington, E.A., Willemsen, M.H.A. and Williams, P.E.V. (1997)Responses of meat-type chickens to choice feeding of diets differing in protein and energyfrom hatch to market weight. Poultry Science 76, 1183–1192.
Sih, A. and Christensen, B. (2001) Optimal diet theory: when does it work, and when and whydoes it fail? Animal Behaviour 61, 379–390.
Silanikove, N. (1989) Interrelationship between water, food and digestible energy intake in desertand temperate goats. Appetite 12, 163–170.
Simm, G., Persaud, P., Neilson, D.R., Parkinson, H. and McGuirk, B.J. (1991) Predicting foodintake in dairy heifers from early lactation records. Animal Production 52, 421–434.
Smith, C.J.V. and Bright-Taylor, B. (1974) Does a glucostatic mechanism for feed intake controlexist in chickens? Poultry Science 53, 1720–1724.
Smith, C.J.V. and Szper, I. (1976) The influence of direct implantation of gold thioglucose into thebrain of chickens on food consumption and weight gain. Poultry Science 55, 2421–2423.
Smith, E.J. and Clapperton, J.L. (1981) The voluntary food intake of sheep when silage juice isinfused into the rumen. Proceedings of the Nutrition Society 40, 22A.
Smith, G.P. (2002) The evolution of an operant ecologist. Appetite 38, 166–172.Smith, W.C., Ellis, M., Chadwick, J.P. and Laird, R. (1991) The influence of index selection for
improved growth and carcass characteristics on appetite in a population of large white pigs.Animal Production 52, 193–199.
Snapir, N., Robinzon, B., Godschalk, M., Heller, E.D. and Perek, M. (1973) The effect ofintrahypothalamic administration of sodium pentobarbital on eating behaviour and feedintake in chickens. Physiology and Behavior 10, 97–100.
Snapir, N. and Robinzon, B. (1989) Role of the basomedial hypothalamus in regulation ofadiposity, food intake and reproductive traits in the domestic fowl. Poultry Science 68,948–957.
Sniffen, C.J. and Chase, L.E. (1987) Feeding management for conventional systems. Advances inNutrition Seminar for Agribusiness, Cornell University, Ithaca, New York.
Sparkes, G.H., Cole, D.J.A. and Lewis, D. (1981) The effect of dietary protein level on voluntaryfood intake in the pig. Animal Production 32, 356–357.
Speakman, J.R., Stubbs, J.R. and Mercer, J.G. (2002) Does body mass play a role in theregulation of food intake? Proceedings of the Nutrition Society 61, 473–487.
Squires, V.R. and Wilson, A.D. (1971) Distance between food and water supply and its effect ondrinking frequency, and food and water intake of Merino and Border Leicester sheep.Australian Journal of Agricultural Research 22, 283–290.
Steen, R.W.J. (1992) A comparison of soya-bean meal, fish meal and maize gluten feed asprotein sources for calves offered grass silage ad libitum. Animal Production 54, 333–339.
Steen, R.W.J., Gordon, F.J., Dawson, L.E.R., Park, R.S., Mayne, C.S., Agnew, R.E., Kilpatrick,D.J. and Porter, M.G. (1998) Factors affecting the intake of grass silage by cattle andprediction of silage intake. Animal Science 66, 115–127.
Steinruck, U. and Kirchgessner, M. (1992) Regulation of protein intake of hens with high layingperformance by self-selecting diets with different protein levels. Archivs fur Geflugelkunde56, 163–171.
Steinruck, U., Kirchgessner, M. and Roth, F.X. (1990) Selective methionine intake of broilers bychanging the position of the diets. Archivs fur Geflugelkunde 54, 245–250.
Steinruck, U., Roth, F.X. and Kirchgessner, M. (1991) Selective vitamin B6 intake of broilers.Journal of Animal Physiology and Animal Nutrition 65, 110–119.
References 441

Stephens, D.B. (1980) The effects of alimentary infusions of glucose, amino acids, or neutral faton meal size in hungry pigs. Journal of Physiology 299, 453–463.
Stephens, D.B. (1985) Influence of intraduodenal glucose on meal size and its modification by 2-deoxy-d-glucose or vagotomy in hungry pigs. Quarterly Journal of Experimental Physiology70, 129–135.
Stolba, A. and Wood-Gush, D. (1989) The behaviour of pigs in a semi-natural environment.Animal Production 48, 419–426.
Stricker, E.M. and McCann, M.J. (1985) Visceral factors in the control of food intake. BrainResearch Bulletin 14, 687–692.
Stricker, E.M. and Woods, S.C. (2004) Neurobiology of Food and Fluid Intake. Kluwer Academic,Norwell, Massachusetts.
Stricklin, W.R. (1988) Influence of photoperiod on eating patterns of beef cattle. In: Phillips,C.J.C. and Forbes, J.M. (eds) Photoperiodic Manipulation of Dairy Cattle. University ofWales Dairy Research Unit Technical Report No. 4, pp. 8–15.
Stricklin, W.R. and Gonyou, H.W. (1981) Dominance and eating behaviour of cattle fed from asingle stall. Applied Animal Ethology 7, 135–140.
Sugino, T., Hasegewa, Y., Kikkawa, Y., Yamaurua, J., Yamagishi, M., Kurose, Y., Kojima, M.,Kangawa, K., Hasegawa, Y. and Terashima, Y. (2002) A transient ghrelin surge occurs justbefore feeding in a scheduled meal-fed sheep. Biochemical and Biophysical ResearchCommunications 295, 255–260.
Sutton, J.D., Aston, K., Beever, D.E. and Fisher, W.J. (1992) Body composition and performanceof autumn-calving Holstein-Friesian dairy cows during lactation: food intake, milk constituentoutput and live weight. Animal Production 54, 473–473.
Sykes, A.H. (1983) Food intake and its control. In: Freeman, B.M. and Boorman, K.N. (eds)Physiology and Biochemistry of the Domestic Fowl. Vol. 4. Academic Press, London, pp. 1–29.
Sykes, A., Coop, R. and Rushton, B. (1980) Chronic subclinical fascioliasis in sheep: effects on foodintake, food utilisation and blood constituents. Research in Veterinary Science 28, 63–70.
Tauson, R. and Elwinger, K. (1986) Prototypes for application of choice feeding in caged layinghens using flat chain feeders. Acta Agralia Scandinivaca 36, 129–146.
Tayler, J.C. (1959) A relationship between weight of internal fat, ‘fill’, and the herbage intake ofgrazing cattle. Nature 184, 2021–2022.
Tayler, J.C. and Wilkins, R.J. (1976) Conserved forage – complement or competitor toconcentrates? In: Swan, H. and Broster, W.H. (eds) Principles of Cattle Production.Butterworths, London, pp. 343– 364.
Taylor, C.G. and Forbes, J.M. (1988) Food intake and growth of broiler chickens followingremoval of the abdominal fat pad. Proceedings of the Nutrition Society 47, 90A.
Taylor, S.C.S., Moore, A.J. and Thiessen, R.B. (1986) Voluntary food intake in relation to bodyweight among British breeds of cattle. Animal Production 42, 11–18.
Taylor, S.C.S., Murray, J.I. and Illius, A.W. (1987) Relative growth of incisor arcade breadth andeating rate in cattle and sheep. Animal Production 45, 453–458.
Taylor, W. and Leaver, J.D. (1984) Systems of concentrate allocation for dairy cattle. 1. Acomparison of three patterns of allocation for autumn-calving cows offered grass. AnimalProduction 39, 315–324.
Ternouth, J.H. and Beattie, A.W. (1971) Studies of the food intake of sheep at a single meal.British Journal Nutrition 25, 153–164.
Ternouth, J.H. and Sevilla, C.C. (1990) The effects of low levels of dietary phosphorus upon thedry-matter intake and metabolism of lambs. Australian Journal of Agricultural Research 41,175–184.
Thiago, L.R.L., Gill, M. and Sissons, J.W. (1992) Studies of method of conserving grass herbageand frequency of feeding in cattle. 2. Eating behaviour, rumen motility and rumen fill. BritishJournal of Nutrition 67, 319–336.
442 References

Thom, R. (1975) Structural Stability and Morphogenesis: an Outline of a General Theory ofModels. W.A. Benjamin, Reading, Massachusetts.
Thomas, P.C. and Chamberlain, D.G. (ed.) (1983) Silage as a Feedstuff. Silage for MilkProduction. Technical Bulletin No.2, NIRD, HRI, Reading, UK, pp. 63–102.
Thompson, J.M. and Parks, J.R. (1983) Food intake, growth and mature size in Australian Merinoand Dorset Horn sheep. Animal Production 36, 471–479.
Thompson, J.M., Parks, J.R. and Perry, D. (1985) Food intake, growth and body composition inAustralian Merino sheep selected for high and low weaning weight. 1. Food intake, foodefficiency and growth. Animal Production 40, 55–70.
Thornley, J.H.M., Parsons, A.J., Newman, J. and Penning, P.D. (1994) A cost–benefit model ofgrazing intake and diet selection in a two-species temperate grassland sward. FunctionalEcology 8, 5–16.
Titus, C.H., Provenza, F.D., Burritt, E.A., Perevolotsky, A. and Silanikove, N. (2000) Preferencesfor foods varying in macronutrients and tannins by lambs supplemented with polyethyleneglycol. Journal of Animal Science 78, 1443–1449.
Toates, F.M. and Booth, D.A. (1974) Control of food intake by energy supply. Nature 215,710–711.
Tobin, G. and Boorman, K.N. (1979) Carotid artery or jugular amino acid infusions and foodintake in the cockerel. British Journal of Nutrition 41, 157–167.
Tokuda, T., Matsui, T., Ito, J., Torii, S. and Yano, H. (2000a) The changes in body weight andplasma metabolite levels during leptin injection are caused by the reduction of food intake insheep. Animal Science 70, 343–348.
Tokuda, T., Matsui, T. and Yano, H. (2000b) Effects of light and food on plasma leptinconcentrations in ewes. Animal Science 71, 235–242.
Tolkamp, B.J. (1999) Limitations in the use of constraints for intake predictions. In: van derHeide, D., Huisman, E.A., Kanis, E., Osse, J.W.M. and Verstegen, M. (eds) Regulation ofFeed Intake. CAB International, Wallingford, UK, pp. 151–166.
Tolkamp, B.J. and Ketelaars, J.J.M.H. (1992) Toward a new theory of feed intake regulation inruminants. 2. Costs and benefits of feed consumption: an optimization approach. LivestockProduction Science 30, 297–317.
Tolkamp, B.J. and Kyriazakis, I. (1997) Measuring diet selection in dairy cows: effect of trainingon choice of dietary protein level. Animal Science 64, 197–207.
Tolkamp, B.J. and Kyriazakis, I. (1999) A comparison of five methods that estimate meal criteriafor cattle. Animal Science 69, 501–514.
Tolkamp, B.J., Dewhurst, R.J., Friggens, N.C., Kyriazakis, I., Veerkamp, R.F. and Oldham, J.D.(1998a) Diet choice by dairy cows. 1. Selection of feed protein content during the first half oflactation. Journal of Dairy Science 81, 2657–2669.
Tolkamp, B.J., Kyriazakis, I., Oldham, J.D., Lewis, M., Dewhurst, R.J. and Newbold, J.R. (1998b)Diet choice by dairy cows. 2. Selection for metabolizable protein or for ruminally degradableprotein? Journal of Dairy Science 81, 2670–2680.
Tolkamp, B.J., Allcroft, D.J., Austin, E.J., Nielsen, B.L. and Kyriazakis, I. (1998c) Satiety splitsfeeding behaviour into bouts. Journal of Theoretical Biology 194, 235–250.
Tolkamp, B.J., Schweitzer, D.P.N. and Kyriazakis, I. (2000) The biologically relevant unit for theanalysis of short-term feeding behaviour of dairy cows. Journal of Dairy Science 83,2057–2068.
Tolkamp, B.J., Friggens, N.C., Emmans, G.C., Kyriazakis, I. and Oldham, J.D. (2002) Mealpatterns of dairy cows consuming mixed foods with a high or a low ratio of concentrate tograss silage. Animal Science 74, 369–382.
Tolkamp, B.J., Yearsley, J.M., Gordon, I.J., Illius, A.W., Speakman, J.R. and Kyriazakis, I. (2007)Predicting the effects of body fatness on food intake and performance of sheep. BritishJournal of Nutrition 97, 6 (in press).
References 443

Troelson, J.E. and Bigsby, F.W. (1964) Artificial mastication – a new approach for predictingvoluntary forage consumption by ruminants. Journal of Animal Science 23, 1139–1142.
Tsaras, L.N., Kyriazakis, I. and Emmans, G.C. (1998) The prediction of the voluntary food intakeof pigs on poor quality foods. Animal Science 66, 713–723.
Tullis, J.B. (1982) Protein growth in pigs. PhD thesis, Edinburgh, UK.Tulloh, N.M. (1966) Physical studies of the alimentary tract of grazing cattle. IV. Dimensions of the
tract in lactating and non-lactating cows. New Zealand Journal of Agricultural Research 9,999–1008.
Turner, S.P., Allcroft, D.J. and Edwards, S.A. (2003) Housing pigs in large social groups: a reviewof implications for performance and other economic traits. Livestock Production Science 82,39–51.
Tweeton, J.R., Phillips, R.E. and Peek, F.W. (1973) Feeding behaviour elicited by electricalstimulation of the brain in chickens. Poultry Science 52, 165–172.
Tybirk, P. (1989) A model of food intake regulation in the growing pig. In: Forbes, J.M., Varley,M.A. and Lawrence, T.L.J. (eds) The Voluntary Food Intake of Pigs. Volume OccasionalPublication No. 13, British Society of Animal Production, Edinburgh, UK, pp. 105–110.
Vadiveloo, J. and Holmes, W. (1979) The prediction of the voluntary feed intake of dairy cows.Journal of Agricultural Science 93, 553–562.
Valdivie, M. and Dieppa, O. (2002) Stocking rate of broilers. Cuban Journal of AgriculturalScience 36, 127–130.
Valentin, S.F., Williams, P.E.V., Forbes, J.M. and Sauvant, D. (1999) Comparison of the in vitrogas production technique and the nylon bag degradability technique to measure short andlong term processes of degradation of maize silage in dairy cows. Animal Feed Science andTechnology 78, 81–99.
Vallentine, J.F. (2001) Grazing Management. 2nd edn., Academic Press, San Diego, California.Vandermeerschen-Doize, F. and Paquay, R. (1982) Effects of continuous long-term infusion of
long-chain fatty acids on feeding behaviour and blood components of adult sheep. Appetite5, 137–146.
Vandermeerschen-Doize, F., Bouckoms-Vandermeier, M. and Paquay, R. (1982) Effects of long-term ad libitum feeding on the voluntary food intake, body weight, body composition andadipose tissue morphology of lean. Reproduction, Nutrition, Développement 22, 1049–1061.
van der Peet-Schwering, C.M.C., Kemp, B., Plagge, J.G., Vereijken, P.F.G., den Hartog, L.A.,Spoolder, H.A.M. and Verstegen, M.W.A. (2004) Performance and individual feed intakecharacteristics of group-housed sows fed a nonstarch polysaccharides diet ad libitum duringgestation over three parities. Journal of Animal Science 82, 1246–1257.
Van Miert, A.S.J.P.A.M. and Van Duin, C.T.M. (1991) Feed intake and rumen motility in dwarfgoats. Effects of some a2-adrenergic agonists, prostaglandins and posterior pituitaryhormones. Veterinary Research Communications 15, 57–67.
VanOs, M., VanVuuren, A.M., Spoelstra, S.F. and Baumont, R. (1996) Mechanisms of adaptationin sheep to overcome silage intake depression induced by biogenic amines. ProductionAnimale 9, 349–358.
Van Soest, P.J. (1967) Development of a comprehensive system of feed analysis and itsapplication to forages. Journal of Animal Science 26, 119–128.
Van Soest, P.J. (1994) Nutritional Ecology of the Ruminant. 2nd edn., Cornell University Press,Ithaca, New York.
Villalba, J.J. and Provenza, F.D. (1996) Preference for flavored wheat straw by lambs conditionedwith intra-ruminal administrations of sodium propionate. Journal of Animal Science 74,2362–2368.
Villalba, J.J. and Provenza, F.D. (1997a) Preference for flavored wheat straw by lambsconditioned with intra-ruminal infusions of acetate and propionate. Journal of AnimalScience 75, 2905–2914.
444 References

Villalba, J.J. and Provenza, F.D. (1997b) Preference for flavoured foods by lambs conditionedwith intra-ruminal administration of nitrogen. British Journal of Nutrition 78, 545–561.
Villalba, J.J. and Provenza, F.D. (1997c) Preference for wheat straw by lambs conditioned withintra-ruminal infusions of starch. British Journal of Nutrition 77, 287–297.
Villalba, J.J. and Provenza, F.D. (1999) Effects of food structure and nutritional quality andanimal nutritional state on intake behaviour and food preferences of sheep. Applied AnimalBehaviour Science 63, 145–163.
Villalba, J.J. and Provenza, F.D. (2005) Foraging in chemically diverse environments: energy,protein and alternative foods influence ingestion of plant secondary metabolites by lambs.Journal of Chemical Ecology 31, 123–138.
Villalba, J.J., Provenza, F.D. and Rogosic, J. (1999) Preference for flavored wheat straw by lambsconditioned with intra-ruminal infusions of starch administered at different times after strawingestion. Journal of Animal Science 77, 378–387.
Villalba, J.J., Provenza, F.D. and Banner, I.E. (2002) Influence of macronutrients andpolyethylene glycol on intake of a quebracho tannin diet by sheep and goats. Journal ofAnimal Science 80, 3154–3164.
Villalba, J.J., Provenza, F.D. and Han, G.D. (2004) Experience influences diet mixing byherbivores: implications for plant biochemical diversity. Oikos 107, 100–109.
Villalba, J.J., Provenza, F.D. and Shaw, R. (2006) Sheep self-medicate with substances thatameliorate the negative effects of grain, tannins, and oxalates. Animal Behaviour 71,1131–1139.
Wahed, R.A., Owen, E., Naate, M. and Hosking, B.J. (1990) Feeding straw to small ruminants:effect of amount offered on intake and selection of barley straw by goats and sheep. AnimalProduction 51, 283–289.
Wangsness, P.J. and Soroka, G.H. (1978) Effect of energy concentration of milk on voluntaryintake of lean and obese piglets. Journal of Nutrition 108, 595–600.
Warner, A.C.I. and Stacy, B.D. (1965) Solutes in the rumen of the sheep. Quarterly Journal ofExperimental Physiology 50, 169–184.
Warner, A.C.I. and Stacy, B.D. (1977) Influence of ruminal and plasma osmotic pressure onsalivary secretion in sheep. Quarterly Journal of Experimental Physiology 62, 133–142.
Wauters, A.M., Richard-Yris, M.A. and Talec, N. (2002) Maternal influences on feeding andgeneral activity in domestic chicks. Ethology 108, 529–540.
Webb, A.J. (1989) Genetics of food intake in the pig. In: Forbes, J.M., Varley, M.A. andLawrence, T.L.J. (eds) The Voluntary Food Intake of Pigs. British Society of AnimalProduction, Edinburgh, UK, pp. 41–50.
Webster, J.R., Corson, I.D., Littlejohn, R.P., Masters, B.M. and Suttie, J.M. (2000) Effect of dietenergy density and season on voluntary dry-matter and energy intake in male red deer.Animal Science 70, 547–554.
Welch, J.D. (1967) Appetite control in sheep by indigestible fibres. Journal of Animal Science 26,849–854.
Welch, J.G. (1982) Rumination, particle size and passage from the rumen. Journal of AnimalScience 54, 885–894.
Weller, R.F. and Phipps, R.H. (1985) The effect of silage preference on the performance of dairycows. Animal Production 42, 435.
Weller, R.F. and Phipps, R.H. (1989) Preliminary studies on the effect of flavouring agents on thedry-matter intake of silage by lactating dairy cows. Journal of Agricultural Science 112,67–71.
Wellock, I.J., Emmans, G.C. and Kyriazakis, I. (2003) Predicting the consequences of socialstressors on pig food intake and performance. Journal of Animal Science 81, 2995–3007.
Weston, R.H. (1996) Some aspects of constraint to forage consumption by ruminants. AustralianJournal of Agricultural Research 47, 175–197.
References 445

Whittemore, C.T. (1987) Elements of Pig Science. Longmans, Harlow, UK.Whittemore, C.T., Kerr, J.C. and Cameron, N.D. (1995) An approach to prediction of feed intake
in growing pigs using simple body measurements. Agricultural Systems 47, 235–244.Whittemore, C.T., Green, D.M. and Knap, P.W. (2001) Technical review of the energy and protein
requirements of growing pigs: food intake. Animal Science 73, 3–17.Whittemore, E.C., Kyriazakis, I., Emmans, G.C., Tolkamp, B.J., Knap, P.W., Simmins, P.H. and
Jagger, S. (2000) Testing two theories of feed intake using the effect of temperature on theintake of bulky feeds in pigs. Proceedings of the British Society of Animal Science 2000, 23.
Whittemore, E.C., Kyriazakis, I., Emmans, G.C. and Tolkamp, B.T. (2001a) Tests of two theoriesof food intake using growing pigs – 1. The effect of ambient temperature on the intake offoods of differing bulk content. Animal Science 72, 351–360.
Whittemore, E.C., Emmans, G.C., Tolkamp, B.J. and Kyriazakis, I. (2001b) Tests of two theoriesof food intake using growing pigs – 2. The effect of a period of reduced growth rate on thesubsequent intake of foods of differing bulk content. Animal Science 72, 361–373.
Whittemore, E.C., Emmans, G.C. and Kyriazakis, I. (2003) The problem of predicting food intakeduring the period of adaptation to a new food: a model. British Journal of Nutrition 89,383–398.
Wierenga, H.K. and Hopster, H. (1986) Behavioural research to improve systems for automaticconcentrate feeding. Proceedings of the International Symposium on Applied Ethology inFarm Animals, Balatonfured, Hungary.
Wijtten, P.J.A., Prak, R., Lemme, A. and Langhout, D.J. (2004) Effect of different dietary idealprotein concentrations on broiler performance. British Poultry Science 45, 504–511.
Wilcoxon, H.C., Dragoin, W.B. and Kral, P.A. (1971) Illness-induced aversions in rat and quail:relative salience of visual and gustatory cues. Science 171, 826–828.
Wilkinson, J.M. (2005) Silage. Chalcombe Publications, Lincoln, UK.Wilson, B.J. and Emmans, G.C. (1979) The animal’s relationship to its food. In: Boorman, K.N.
and Freeman, B.M. (eds) Food Intake Regulation in Poultry. British Poultry Science Ltd.,Edinburgh, UK, pp. 3–10.
Wilson, J.R. and Kennedy, P.M. (1996) Plant and animal constraints to voluntary feed intakeassociated with fibre characteristics and particle breakdown and passage in ruminants.Australian Journal of Agricultural Research 47, 199–225.
Wilson, R.K. and Flynn, A.V. (1974) Observations of the eating behaviour of individually fed beefcattle offered grass silage ad libitum. Irish Journal of Agricultural Research 13, 347–349.
Winchester, C.F. and Morris, M.J. (1956) Water intake of cattle. Journal of Animal Science 15,722–740.
Wood, J.D. (1989) Meat quality, carcass composition and intake. In: Forbes, J.M., Varley, M.A.and Lawrence, T.L.J. (eds) The Voluntary Food Intake of Pigs. British Society of AnimalProduction, Edinburgh, UK, pp. 79–86.
Wood-Gush, D.G.M. and Gower, D.M. (1968) Studies on motivation in the feeding behaviour ofthe domestic cock. Animal Behaviour 16, 101–107.
Wood-Gush, D.G.M. and Kare, M.R. (1966) The behaviour of calcium deficient chickens. BritishPoultry Science 7, 285–290.
Wylie, A.R.G. and Chestnutt, A.M.B. (1992) The effect of silage quality and frequency of feedingof supplementary concentrates on serum metabolite and insulin-like growth factor1 (IGF-1)concentrations in the late pregnant ewe. Animal Production 54, 455–456.
Wylie, L. and Gentle, M.J. (1998) Feeding induced tonic pain suppression in the chicken: reversalby naloxone. Physiology and Behavior 64, 27–30.
Yalda, A.Y. and Forbes, J.M. (1990) Effect of energy restriction on the relationship between bodyfat and food intake in broilers. Proceedings of the Nutrition Society 49, 215A.
Yalda, A.Y. and Forbes, J.M. (1991) The effect of force-feeding on the relationship between bodyfat and food intake in broilers. Proceedings of the Nutrition Society 50, 99A.
446 References

Yearsley, J., Tolkamp, B.J. and Illius, A.W. (2001) Theoretical developments in the study andprediction of food intake. Proceedings of the Nutrition Society 60, 145–156.
Yeates, M.P., Tolkamp, B.J. and Kyriazakis, I. (2002) The relationship between meal compositionand long-term diet choice. Journal of Animal Science 80, 3165–3178.
Yo, T., Vilarino, M., Faure, J.M. and Picard, M. (1997a) Feed pecking in young chickens: newtechniques of evaluation. Physiology and Behavior 61, 803–810.
Yo, T., Siegel, P.B., Guerin, H. and Picard, M. (1997b) Self-selection of dietary protein and energyby broilers grown under a tropical climate: effect of feed particle size on the feed choice.Poultry Science 76, 1467–1473.
Yo, T., Siegel, P.B., Faure, J.M. and Picard, M. (1998) Self-selection of dietary protein and energyby broilers grown under a tropical climate: adaptation when exposed to choice feeding atdifferent ages. Poultry Science 77, 502–508.
Young, R.J. and Lawrence, A.B. (1993) The effects of food level and a foraging device on thebehaviour of sows. Animal Production 56, 440A.
Zeigler, H.P. and Karten, H.J. (1975) Trigeminal lemniscal lesions and the lateral hypothalamicsyndrome. Science 190, 694–696.
Zuberbuehler, C.A., Messikommer, R.E., Arnold, M.M., Forrer, R.S. and Wenk, C. (2006) Effectsof selenium depletion and selenium repletion by choice feeding on selenium status of youngand old laying hens. Physiology and Behavior 87, 430–440.
References 447

Index
© J.M. Forbes 2007.Voluntary Food Intake and Diet Selection 448in Farm Animals 2nd Edition (J.M. Forbes)
2-deoxy-D-glucose (2DG) 65, 71, 72, 1095-HT see serotonin6-hydroxy-dopamine 97
abnormal feeding behaviour 37–39feather pecking 37tail-biting 37
abomasum 62–63acetate, infusion into rumen 53–54, 59,
204–205in silage 292
acidity of silage 58–59, 301of rumen fluid 58–59
addition of material to rumen 46, 316additivity of feedback signals 198–199, 208
evidence for 203–206adrenergic agents, adrenaline 84–85
injection into brain 96–98, 205injection into liver 75, 85
afferent pathways for feedbacks 206ahemeral lighting cycles 37amino acids, deficiency and imbalance
248–252monitoring of levels 164optimum levels of 185ratio of 158role in intake control 81–82selection for 269–272
ammonia, in silage 291toxicity in rumen 57
anaesthetic, general 135local, addition to food 114
duodenum 65, 71hypothalamus 96, 108rumen 53, 59splanchnic nerve 76
androgens as growth stimulants 333–334anti-emetic drugs 175appetite, definition 4artificial mastication 234–235artificial milk see milk substituteascorbic acid (vitamin C) 155, 158, 256asynchrony of nutrient supply 130autoimmunization to CCK 87, 88aversions see preferences and aversionsawareness of digestive and metabolic
sensations 119
ß-agonists 335ß-glucans 177balloon inflation, aversion to 127
rumen 45, 46–48, 204–205, 294stomach 43
beak-trimming 311biogenic amines in silage 291bitter taste 141, 155body composition 244, 259, 351, 354body weight change 357bombesin 87, 89
injection into brain 101–102bone-eating 276bovine somatotropin (BST) 359brain activity during feeding 94–95bulk, limitation of intake by 189

butyrate, infusion into rumen 55taste of 142
calciumappetite for 272–274deficiency 161, 253injection of salts into brain 106–107
carboxymethyl cellulose 180casein injection
abomasum 348duodenum 205, 248stomach 128, 246
catastrophe theory applied to feeding392–394
cell-wall constituents (CWC) see neutraldetergent fibre
chemoreceptors, rumen 52–55cholecystokinin (CCK) 87–89
blocked by MK-329 88injection into brain 100–101intravenous injection 87learned aversion to 123, 136plasma concentration 328, 389
cholinergic agents, injection into brain 99–100chop length of forage 163, 173, 294, 295–296circadian rhythms of feeding 31–34, 373–374clover silage 298coccidiosis 180, 388colour of food 135, 136, 137, 156, 279compensatory growth 330–332complete foods for ruminants 237–238, 302conditioned preferences 127–128conditioned taste aversions 119conditioning stimulus 117–118
interval to unconditioned stimulus 134–135continuum from preference to aversion
128–129convergence of feedback signals 206copper, deficiency of 253corticosteroids 168–169, 334corticotrophin-releasing factor (CRF) 83creep feeding 311, 312, 319critical intermeal interval see minimum
intermeal intervalcrop
distension 43nutrient infusion into 166surgical removal 44
crude protein (CP), definition of 245–246cyproheptadine 335
daylength 273, 373–381skeletal long 378
deer 376–377degradability, rumen 48–50, 232–234, 295, 303diabetes, alloxan-induced 82diet composition, effect on water intake 285diet formulation 185diet selection, between silages 297–298
evidence for 149–154mechanisms 164–167pathway 146–148, 152practical uses for 175–185prerequisites for 154–163theory 146–148
diethylstilboestrol (DES) 322digestibility 42, 303digestible energy (DE) concentration, definition
of 219relation of intake to 223–225, 230
digestion 48–49dilution of food 44, 221, 225, 228, 230,
235–236disease 388–390dry matter content, effect on silage intake
288–289effect on water intake 284–285
efficiency, maximization of 199–200, 338laying hen 361–363
appetite for protein 264application of MTD hypothesis to
213–214energostasis 189environmental temperature 155, 191,
258–259, 268, 269, 279, 282–283, 352,365–373, 403–405
exercise 381–382walking to obtain water 285
experimental design 399–400
fatbody and intake 335–340, 350–351incorporation in diet 220, 223, 245, 369infusion
abomasum 63duodenum 65liver 80
inhibition of oxidation 79, 80surgical removal of 336, 339–340
Index 449

fatty acids 220intravenous infusion 80
feeder design and space 37, 313, 384–385feeding behaviour 392
cattle 27–28, 301 poultry 24–26sheep 28
feeding bouts, definition 4fenfluramine 97fibre
appetite for 279–280dietary 50–51, 231neutral detergent fibre (NDF) 50–51,
231–232, 371flavouring agents 242, 302–303, 315force-feeding 166, 335–336frequency of offering food 388fungal infestation of herbage 257
gamma-amino butyric acid (GABA) 100, 291gas production by rumen fluid 49, 234gastric centre 45, 51, 206gender 318genetics of intake 323–330, 397 genotypes, differences between
cattle 321, 328pigs 227, 266, 327poultry 263
ghrelin 86–87gizzard development 180glucagon 83
injection into liver 75glucose
infusion into stomach 45role in control of intake 70–72sensitivity of brain 109solutions, intake of 264
glucostatic theory 7glutamic acid 251glyphosate 289gold thioglucose 93, 110grazing 1, 3, 20, 171–172
pigs 26group versus individual housing, pigs 26, 30,
319, 382–383growth hormone 83–84, 169, 328, 334growth hormone-releasing factor (GRF) 104growth and diet selection 168–170, 262, 266
and food intake 317, 321, 367–368manipulation 332–335
hens see laying hensheritability 325, 326–327, 329–330, 352,
354histamine 292histidine 249, 250hunger centre see lateral hypothalamushunger contractions 43hunger ratio 4, 23–24hypothalamus 281
anterior 107–108lateral 91, 94, 118–119lesions of 92–93ventromedial 91, 94
indigestible organic matter (IOM) 232ingestibility 197ingestion capacity 196–197Institut National de la Recherche Agronomique
196–197insulin 79, 80, 81, 82, 328
brain injection 108–110plasma concentrations 338
integration of multiple signals in digestive tract66–67
intestines, involvement of 63–66iodine 253isoleucine, selection for 158, 265
jaw movements 14
lactation 349–361, 369–370application of MTD hypothesis 213colostrum 312
lactic acid 290lameness in chickens 175learned aversion 87, 123–127, 162, 396learning 10, 122–123leguminous trees 246, 300leptin 7, 85–86, 327–328
in brain 104plasma concentrations 381
lipids see fatlipostatic theory 7liquid food see wet feedinglithium chloride 123, 125–126, 130–131,
134–135, 136, 138, 139, 280liver fluke 388
450 Index

liver, amino acid infusion, chicken 74denervation of 78, 205glucose infusion 73–74oxidation of substrates in 73role in control of intake 72–78
lysine 249, 250, 270
magnesiumdeficiency of 253injection of salts into brain 106–107oxide, taste of 142
maize silage 296–298meal patterns 19–21, 376
analysis of 21–24meal size 317, 376meals, definition 4mechanoreceptors, rumen 45, 51medial forebrain bundle 118melanocortin 105melatonin 374–375metabolizable energy
definition 219relation of intake to 221
methioninedeficiency 140infusion with 252selection for 176, 270supplementation with 251
methods of measuring food intake 5–6automated systems 13, 325in groups 14–15in individuals 13
milk substitute 314, 316minerals
appetites for 272–277 deficiency and toxicity 252–255
Minimal Total Discomfort (MTD) theory10–11, 207–216, 394–395
day to day variation in the context of216–218
in relation to animal welfare 403–405worked example of 211–212
minimum intermeal interval 25, 27definition 4determination of 10, 17–19
modelling, philosophy of 188, 400models, comparisons of 195–196
predictive 196–197Monensin 238, 332–333monosodium glutamate 113, 142
motility, reticulo-rumen 51–52motivation 119–122multiple constraints model 193–194
n-alkanes 6naloxone 102–103near infrared spectroscopy (NIRS) 235, 304neophobia 123, 133, 163neuropeptide Y (NPY) 103–104, 164, 327non-protein nitrogen (NPN) 243non-starch polysaccharides (NSP) 226nucleus of the solitary tract (NTS) 109nutrient infusions 166–167
solutions 182–183nutrient requirements, identification of
157–158nylon bags see degradability, rumen
obesity 2, 81oestrogens, as growth stimulants 333–334
brain 106during pregnancy 348effect on selection for calcium 273injection with 341, 342
oestrus 341–342olfactory bulbectomy 92, 114omasum 62operant conditioning 13–14, 20, 119–122,
159–160pigs 35, 36, 88, 110, 121–122, 385–386poultry 120–121sheep 154
opioid peptides 102–103orexins 105osmolality, rumen fluid 56, 59–62oxalic acid, aversion to 126, 131, 174
palatabilitydefinition 4–5description 141–143
parasites, intestinal 175, 389–390particle size of food 236–237parturition, response to food odours during 95pelleting of food 236pentagastrin see gastrin 89pH see acidityphosphorus
deficiency of 253–254selection for 274–276
Index 451

photoperiod see daylengthphysical properties of food in the mouth 115phytase 161–162, 274–276pineal gland 374, 379
removal of 93polyethylene glycol (PEG) 59, 131, 172, 174polypropylene fibres, addition to rumen 48,
280position of food as a cue 140–141potassium, injection of salts into brain
106–107prediction
food intake 8–9comparison of equations 306–308,
358–359during growth 317–318, 319–321,
322–323during pregnancy 346–347during lactation 352, 355–359,
360–361from gas production 49with egg laying 363silage intake 303–308water intake 281
preferences and aversionsinnate 117, 124learned 397
pregnancy 342–349water intake during 286
progesterone in brain 106during pregnancy 348
propionateinfusion
into liver 76, 78into rumen 54–55, 76, 204–205
preference and aversion 129prostaglandins, injection into brain 98protein
appetite for 145, 149–154, 164–166,166–167, 212, 261–269
during pregnancy 170dietary content of 243–248, 292
quinine 136, 282
rapeseed meal 29, 143, 162–163, 256, 262,315–316
rate of eating 4, 28, 29, 29, 193, 30, 212rate of passage 42
receptorsgastrointestinal 396metabolic 396–398rumen 62, 67
relative humidity 370relearning 133–134residual food consumption (RFC) 329–330restriction of intake 34–36, 336rumen capacity 45rumen degradable protein (RDP) 130, 154,
246–247, 267, 402rumination 51–52, 63
saccharin 112saliva 61satiety centre see ventromedial hypothalamussatiety ratio 4, 23–24selection within a single food 184–185selenium 254, 276self-medication 171, 172–175self-stimulation 93, 379sequential feeding 180–182serotonin (5-HT) 97–99, 164sham feeding 118shearing 372short-term intake rate (STIR) 31silage, additives 293–294
intake 153, 239–241, 287–309, 355–356juice 289–290supplementation with concentrates
298–301wilting 288–289
social dominance 29, 34, 161–161, 311social factors 137–140, 385–388
social facilitation 138sodium chloride
rumen infusion 59deficiency of 255injection of salts into brain 106–107selection for 276–277
soluble carbohydrates in silage 294somatostatin 83–84, 89splanchnic nerve, section of 76stereotypies 26, 37–38stomach loading 44subacute ruminal acidosis (SARA) 173, 217substitution rate 197, 212, 238–241, 298–299
prediction of 304–306, 355suckling 311, 312sucrose 112
452 Index

sugar beet pulp 239, 343–344sulphur 277
tannins 131, 172, 174taste 112–114, 395teeth
loss of 338–339width of incisor arcade 42
temperature receptors in rumen 52environmental see environmental
temperaturethermostatic control 7, 107–108threonine 251, 270, 271–272thyroid hormones 372, 375time of access to food 160total mixed rations (TMR) see complete foods
for ruminantstoxins 256–257
selection against 280trade-offs between nutrients 130training 155–157tryptophan
dietary level of 251selection for 164, 271
two-phase hypothesis (TPH) 190–192, 195,228–229
unconditioned stimulus (US) 117undegraded dietary protein (UDP) 174, 246,
247, 300, 354, 402urea
dietary 165, 247, 267, 268infusion 248preference and aversion 129, 154, 174
vagotomy 72, 87chickens 64, 70–71, 74, 75, 81, 87, 124
pigs 65, 71sheep 76
valine 251–252variability
diet selection 265food intake 5–6, 216–218, 228, 280,
401meal patterns 20meal size 41water intake 282
vasopressin 89–90ventilation 370vision 111vitamins 255–256
appetites for 278–279volatile fatty acids 7, 42
infusion into abomasum 63infusion into rumen 52–55, 57
voluntary food intake, definition 4
water, intake 281–286, 315, 319excessive 37deprivation 257–258, 281
water-holding capacity as index of bulk 191,226–227
weaning 314–316pigs 138, 148, 157–158sheep 162, 285, 316
welfare of animals 403–405Weston concept 200–202wet food, cattle 29, 241
pigs 259, 315poultry 258–259
whole-grain feeding 176–182, 222
zinc 255zona incerta 94
Index 453