voluntary private health care insurance among the over
TRANSCRIPT

Voluntary Private Health Care Insurance Among the Over Fifties in Europe:
A Comparative Analysis of SHARE Data *
Omar Paccagnella, Vincenzo Rebba, Guglielmo Weber
Department of Economics, University of Padua - Italy
Authors’ e-mail addresses:
May 2007
Abstract. Using data from SHARE (Survey of Health, Ageing and Retirement in Europe), we
analyze the effect of having a voluntary health insurance policy (VPHI) on out-of-pocket (OOP)
health spending for individuals aged 50 or more in a host of European countries. We control for self
selection into VPHI policy holding, and find that VPHI policy holders do not have lower OOP’s than
the rest of the population: in Southern European countries they even spend more. We also find that
the main determinants of VPHI are different in each country and this reflects the differences in the
underlying health care systems.
* An earlier version of this paper was presented at 1st SHARE–ELSA–HRS User Conference, 26–28 September 2005,
Lund, Sweden. We thank conference participants and our discussant, Alberto Holly, for helpful comments. The SHARE
data collection has been primarily funded by the European Commission through the 5th framework programme (project
QLK6-CT-2001-00360 in the thematic programme Quality of Life). Additional funding came from the US National
Institute on Aging (U01 AG09740-13S2, P01 AG005842, P01 AG08291, P30 AG12815, Y1-AG-4553-01 and OGHA
04-064). Data collection in Austria (through the Austrian Science Fund, FWF), Belgium (through the Belgian Science
Policy Office) and Switzerland (through BBW/OFES/UFES) was nationally funded. The SHARE data set is introduced
in Börsch-Supan et al. (2005); methodological details are contained in Börsch-Supan and Jürges (2005).

1
1. Introduction
Health risks are a major determinant of household saving behaviour in old age. In fact, part of the
explanation of why elderly consumers do not run down their assets after retirement has do with the
revision in conditional probabilities of health-related outlays (Palumbo, 1999). Health insurance
policies exist, but the issue arises of whether they are effective in reducing the need for out-of-pocket
health spending. In most European countries, major health shocks are covered by the public health
system, thus out-of-pocket health spending for people who do not purchase health insurance has to
do with private expenditures for health care partially covered (co-payments) or not reimbursed by the
public scheme: in particular, specialist and diagnostic outpatient services, drugs, dental care, medical
appliances, glasses, alternative medicine, and occasionally the choice of better or faster inpatient care
for relatively important interventions.
The issue we address in this paper is the following: how effective are voluntary private health
insurance policies in reducing out-of-pocket spending for individuals aged 50 or over across a group
of European countries? To answer this question, we need to address the issue of the determinants of
the decision to have an insurance policy.
In this paper we use data from a new European survey, SHARE (Survey of Health, Ageing and
Retirement in Europe). This Survey collects data on the individual life circumstances of about 28,000
persons aged 50 and over in 11 European countries, ranging from Scandinavia to the Mediterranean.
Ageing is one of the greatest social and economic challenges of the 21st century for European
societies. Of the world regions, Europe has the highest proportion of people aged 65 or over. The
main task of SHARE is to understand ageing and how it affects individuals in the diverse cultural
settings of Europe. It is the first European data set to combine extensive cross-national information
on socio-economic status, health, and family relationships of the elderly population (Börsch-Supan et
al. 2005).
SHARE data show that holding voluntary private health care insurance (VPHI) among 50+ people is
highly differentiated among European countries. In some countries, such as France, Belgium and the
Netherlands, a high percentage of households (more than 50%) have a VPHI. On the other hand, in
countries with a National health service (NHS) – such as Sweden, Italy, Spain and Greece – the
percentage of households covered by VPHI is much lower (less than 10.5%)1.
1 In this paper we consider “voluntary supplementary health insurance” as defined in Health Care Section of SHARE
questionnaire (HC060 question). The definition given in the SHARE questionnaire is rather broad and encompasses all
the three types of VPHI (i.e., complementary, supplementary, and duplicate of primary statutory coverage) according to
OECD taxonomy (OECD, 2004).
2
Therefore, it seems relevant to analyse both the characteristics of VPHI (in terms of covered services
and costs) and the main determinants of the different distribution of these policies within the SHARE
countries. In particular, for each country, we aim at evaluating the impact of health, demographic and
socio-economic variables on the probability to be covered by a supplementary health care insurance.
To this purpose, we firstly estimate a probit model for each country, considering a set of variables
that can explain the holding of private health care insurance by 50+ people: physical health status,
cognitive abilities, demographic, economic and financial characteristics.
Secondly, we consider the effects of VPHI on health care utilization and out-of-pocket (OOP)
expenditures for inpatient care, outpatient care (including dental services), and prescribed drugs. In
particular, we study the causal effect of having a VPHI on these OOP expenditures. To this purpose
we use a simultaneous-equations model with instrumental variables, adopting a particular
identification assumption: past or current occupation have an impact on the probability to subscribe a
VPHI, but only current occupation affects OOP spending levels. We further assume that cognitive
ability affects the probability to hold a VPHI, not OOP spending.
The paper is organized as follows. In section 2 we consider the institutional features of the health
care systems and the role of private health insurance (both compulsory and voluntary) within
SHARE countries. In section 3 we analyse the main characteristics of the households who subscribed
VPHI policies and the additional coverage provided by them in the SHARE countries. In section 4
the main determinants of having a VPHI policy are evaluated for each country, while the causal
relationship between VPHI and OOP spending is investigated in section 5. Section 6 concludes the
paper with some comments and suggestions.
2. Role of private health care insurance within health care systems of SHARE countries
SHARE countries can be divided into four groups according to the public share of total health care
expenditure (see Table 1, that shows some basic features of national health care systems): a) below
60% (Greece and Switzerland); b) ranging from 60% to 73%, which represented the OECD average
in 2002 (Austria, the Netherlands, Spain); c) ranging from 73% to 80% (Belgium, France, Germany,
Italy); d) above 80% (Denmark and Sweden).
Most SHARE countries have a statutory coverage for more than 90% of the entire population, with
the exception of the Netherlands with 72% of public coverage. Private health insurance is used at
different levels and for different reasons in individual countries. In some countries it is the primary
source of health coverage for at least part of population. In other countries it acts as a complement, a

3
supplement or a duplicate of primary statutory coverage (OECD, 2004). The presence of private
health insurance as primary source of health coverage for a part of population contributes to explain
high levels of private insurance expenditure in the Netherlands (17.1%), Switzerland (9.6%) and
Germany (8.6%), while the diffusion of mutual and employer-based insurance schemes is the main
reason of the high percentage of health expenditure financed by private insurance in France (12.7%).
We can distinguish two groups of countries: a) countries where VPHI represents the primary source
of health coverage for a more or less wide subset of the population (the Netherlands, Germany,
Belgium, Spain and Austria), and b) countries characterised by universal (public or mandatory) basic
coverage (Denmark, France, Greece, Italy, Sweden and Switzerland).
a) In the first group of countries private health insurance is a source of primary coverage for that
part of the population which is not eligible for universal public cover (in this case private insurance
is the principal cover) or is entitled for public coverage but has chosen to opt out (in this case private
insurance is a substitute cover). In 2002, in the Netherlands, nearly 28% of the population – those in
the upper-income bracket – were excluded from public coverage and could voluntarily rely on
private health insurance for principal coverage.2 In Germany about 9.1% of population are covered
by primary private insurance (the self-employed who are excluded from the social security system,
employees above an income threshold who opt for private insurance, and public employees for the
part of health care expenditures not directly reimbursed by the government)3. Finally, in Belgium,
Spain and Austria there are small percentages of population (mainly self-employed and civil
servants) who are covered by primary private health insurance (respectively 1.0%, 2.7% and 0.1%)4.
2 After recent reforms (the new Health Insurance Act - Zorgverzekeringswet), the Dutch health care system would no
longer be considered within this group. In fact, as from January 2006, all residents of the Netherlands are obliged to take
out a health insurance. The system is operated by private health insurance companies; the insurers are obliged to accept
every resident in their area of activity. A system of risk equalisation enables the acceptance obligation and prevents direct
or indirect risk selection. The insured pay a nominal premium to the health insurer. Everyone with the same policy will
pay the same insurance premium. The Health Insurance Act also provides for an income-related contribution to be paid
by the insured. Employers contribute by making a compulsory payment towards the income-related insurance
contribution of their employees. 3 In Germany, employees above an income threshold are allowed to opt out of social health insurance provided by
sickness funds and to buy a private health policy. Individuals eligible to opt out can still choose to remain insured with a
sickness fund; once they opt out, however, they cannot opt back into social health insurance (OECD, 2004). 4 In Belgium, self-employed individuals are covered by the social security system only for “major risks” such as
hospitalisation, while “minor risks” (ambulatory care, dental care, drugs) can be covered through PHI offered by mutuals
or by commercial insurers. About 12% of Belgian population were self-employed in 1999, and about 85% of them
bought PHI for minor risks. In Spain the statutory public system does not cover a minority of population (about 1%
including particular employment categories such as independent lawyers), 60% of which buys primary private insurance;
another part of population, mainly civil servants and their dependents, are covered under a special system by mutual
funds within which they can opt to choose care provided by the National Health Service or coverage through private
insurance. In Austria, some self-employed individuals (about 0,1% of the population) opt out of the social security
system, provided their relevant professional categories purchase primary private insurance for them. (OECD, 2004, pp.
31-33).

4
Table 1 : Characteristics of health care systems in SHARE countries
% of population covered
by
Public
expenditure OOP PHI (2)
All Other
Private
Funds (3)
Country Type of
Coverage Public/Mandatory
Insurance
VPHI
(1)
as % of total
health care
expenditures
(2002)
as % of total
health care
expenditures
(2002)
as % of total
health care
expenditures
(2002)
as % of total
health care
expenditures
(2002)
Sweden Public Tax
Financed 100.0%
1-
1.5% 85.3% n.a. n.a. n.a.
Denmark Public Tax
Financed 100.0% 28.0% 82.9% 15.8% 1.2% 0.0%
Germany Social
Insurance 90.9%
9.1%
(4) 78.6% 10.3% 8.6% 2.5%
Netherlands Social
Insurance 72.0%
64.0%
(4) 62.5% 8.0% 17.1% 12.4%
Belgium Social
Insurance 99.0% (5)
57.5%
(6) 75.0% 13.5% n.a. n.a.
France Social
Insurance 100.0%
92.0%
(7) 76.1% 10.2% 12.7% 1.0%
Switzerland
Private
Mandatory
Insurance
100.0% 29.7% 57.9% 31.5% 9.6% 1.0%
Austria Social
Insurance 99.9% 31.8% 69.9% 17.5% 7.4% 5.2%
Italy Public Tax
Financed 100.0%
9.6-
10.5% 75.4% 20.4% 2.1% 2.1%
Spain Public Tax
Financed 97.3% 10.3% 71.3% 23.7% 4.1% 0.9%
Greece Public Tax
Financed 100.0% 10.0% 51.6% 46.0% 2.4% 0.0%
(1) Voluntary private health insurance (VPHI) includes duplicate, complementary and supplementary VPHI by insurance companies
and non profit collective funds (employer-based insurance funds and other group schemes). The percentage includes both the enrolled
people and their dependents (other entitled household members).
(2) The percentage includes both primary (principal or substitute) private health insurance and VPHI.
(3) Health expenditure incurred by corporations and private employers providing occupational health services and other unfunded
medical benefits to employees plus expenditure by non-profit institutions serving households (excluding social insurance) such as red
cross, philanthropic and charitable institutions, religious orders, lay organizations; benefits provided for free by medical care providers
plus health expenditure incurred by the rest of the world.
(4) For the Netherlands and Germany the data refers to VPHI policies held by individuals who belong to social health insurance
systems. Some of the individuals with primary private health insurance are also covered by VPHIs which are sometimes packaged
with primary private insurance policies.
(5) In Belgium compulsory statutory health insurance includes one scheme for salaried workers and one scheme for the self-employed
people (about 12% of the population in 1999). The latter excludes coverage of “minor risks” such as outpatient care, most
physiotherapy, dental care and minor operations.
(6) For Belgium, data include VPHI policies for hospital care offered by sickness funds as well as PHI policies offered by commercials
companies. They exclude policies for hospital care that are compulsorily offered by several sickness funds to their members, that
guarantees a limited lump sum (mostly less than 12.4 euros per day) and covered about 67% of the population in 2000.
(7) Including CMU, publicly financed programme providing complementary private health insurance to eligible low income groups
(86% without CMU).
Sources: OECD (2006), (2005) and (2004); Mossialos and Thomson (2002); Nomisma-Criep (2003) (for Italy); Holly et al. (2005)
(for Switzerland).

5
b) In the second group of SHARE countries, Sweden, Denmark, Italy, Greece and France are
characterised by basic universal coverage provided by a public health care system (a tax-based
National Health Service for the first four countries; a social security system for France). In this
second group, the Swiss health care system can be considered as a border line case since it
guarantees a universal basic coverage by compulsory (and publicly subsidised) private health
insurance5 with flat and non income-related premiums
6.
As pointed out by OECD (2004), voluntary private health insurance (VPHI) can integrate statutory
health insurance in three ways: providing “supplementary”, “complementary” and “duplicate”
coverage7.
Supplementary VPHI provides full or partial coverage for goods and services that are excluded by
statutory health care insurance (some inpatient and outpatient services, dental care, pharmaceuticals,
rehabilitation, long-term care, alternative medicine). VPHI is only supplementary in the Netherlands
and in Switzerland. For example, in the Netherlands nearly all of the population with social health
insurance, and some individuals who buy primary private insurance, purchase supplementary
insurance which covers for dental care for adults, private rooms in the hospitals and alternative care.
Complementary VPHI provides full or partial funding for goods and services that are not fully
covered by the statutory health care system, by covering all or part of the residual costs not otherwise
reimbursed (e.g. co-payments). This type of coverage predominates in France (especially for
outpatient services), where complementary insurance reaches almost 92% of the population (anyway,
for a lower proportion of the French population, VPHI also has important supplementary coverage
features)8.
Duplicate VPHI offers cover for goods and services already included under statutory health
insurance. It increases consumer choice (where privately funded providers operate in parallel to the
5 In this respect, it is similar to the new Dutch health care system, see note 2 above. 6 In Switzerland the mandatory private basic insurance is mostly provided by not-for profit sickness funds and it is
heavily regulated: enrolment is open, premiums are community rated at the level of each insurer, the benefit package is
standardised, and the insured can freely move across private insurers. The private insurers can also provide
supplementary VPHI, like sickness funds in the Netherlands, through affiliated insurers. 7 In the case of employment group insurance plans (mainly offered in France, Italy, Austria, Greece and Sweden),
sometimes membership is the default option. Even in this case we use the term VPHI. 8 France has used cost-sharing as a means of controlling health care expenditure; nevertheless, instead to control moral
hazard, this strategy has encouraged the growth of complementary PHI and now most French people purchase this type
of PHI to reduce financial burden of co-payments. Under this respect, France represents an outlier since in other
European countries the increase in cost-sharing have not made much impact on the size of the market for voluntary PHI
(Mossialos and Thomson, 2002). This result depends on the wide diffusion of non profit mutual and employer-based
insurance schemes (mutuelles and institutions de prévoyance). Moreover, since 2000 the publicly financed programme
CMU (Couverture Maladie Universelle) provides low income individuals with complementary PHI coverage. These
individuals now account for 6% of population covered by complementary PHI. CMU has partly reduced a former pro-
rich bias in the distribution of access to health care (Van Doorslaer, Masseria et al., 2004).

6
public delivery system) and access to different health services, e.g. guaranteeing improved quality of
care and faster access to treatment. Duplicate VPHI develops when the level of satisfaction with
publicly funded services is rather low (consumers desire to obtain better and faster care).
In many SHARE countries we find different combinations of the three types of VPHI. In Austria,
Belgium, Denmark, Germany and Sweden VPHI is both supplementary and complementary. In
Greece and Spain it both duplicates and supplement national health insurance. In Italy, VPHI can
duplicate, supplement, or complement NHS coverage (with duplicate coverage mostly provided for
by profit insurance companies and complementary and supplementary coverage provided for by
employer-based, professional and mutual aid funds).
3. Characteristics of voluntary health care insurance in the SHARE countries
3.1. Data
The data we use are derived from the first wave of SHARE, and were collected in 2004. For the
purposes of our analysis, we consider data at the household level. The eligible reference person (the
“head”) is selected within each household (N = 19568). Within couples, the head is chosen as the
elder, or the female when the two partners have the same age.
Table 2 shows some characteristics of VPHI at the household level. In the SHARE sample, 7012
households report holding at least one VPHI (30.57% of total weighted population) and 77.63% of
insured households have more than one VPHI policy. Table 2 also reports mean and median total
yearly premiums paid by households for VPHI. The higher median values of total premiums are in
France and Germany (but in the latter case the total amount refers both to primary PHI and to
supplementary VPHI). It is worth noting that in all countries insured households have median
income higher than non-insured ones.
Table 3 shows demographic and educational characteristics of the heads of insured households with
at least a VPHI policy. For all countries but Germany, a very large share of insured heads are less
than 60 years old (in Germany, the higher percentage of insured is between 60 and 69 years old). The
prevalence of VPHI among the 50+’s varies widely across countries but, considering the entire
SHARE sample, the insured heads are more concentrated among persons younger than 60: 36.42%
against the SHARE average of 32.58% (last two rows of table 3)9. In all countries most heads lives
9 As pointed out by OECD, 2004, the distribution of population coverage across different age groups is not homogenous,
most likely as a consequence of differences in public sector coverage, regulation, varied employer offerings of health

7
with a partner and this percentage is higher for the insured: 64% against 58.96% on average. In many
countries a high percentage of insured heads has higher educational levels (ISCED 3 or more);
however, in the Netherlands, France and Spain we find very high percentages (over 50%) of insured
people at lower educational levels. Considering the SHARE sample as a whole, the insured heads
exhibit higher educational levels (ISCED 3 or more): 54.30% against 47.77% on average.
Table 4 reports some characteristics of physical health of heads. Comparing the statistics of insured
people with those of the entire SHARE sample (last rows), it is evident that persons with a VPHI are
usually characterized by good or very good self-reported health, fewer chronic diseases and physical
limitations, even though in some countries (Austria, Germany and the Netherlands) we find a large
share (more than 40%) of insured people with some limitations as measured by Global Activity
Limitations Indicator (GALI)10
. The “objective” health index reported in the last column of table 4 is
a measure of that part of the self-reported health status that can be explained using information on
health problems and physical tests available in SHARE (Jürges, 2005). It ranges from 0 to 1, when 1
is the best health possible. On average, considering the entire SHARE sample, this particular index is
higher for insured heads.
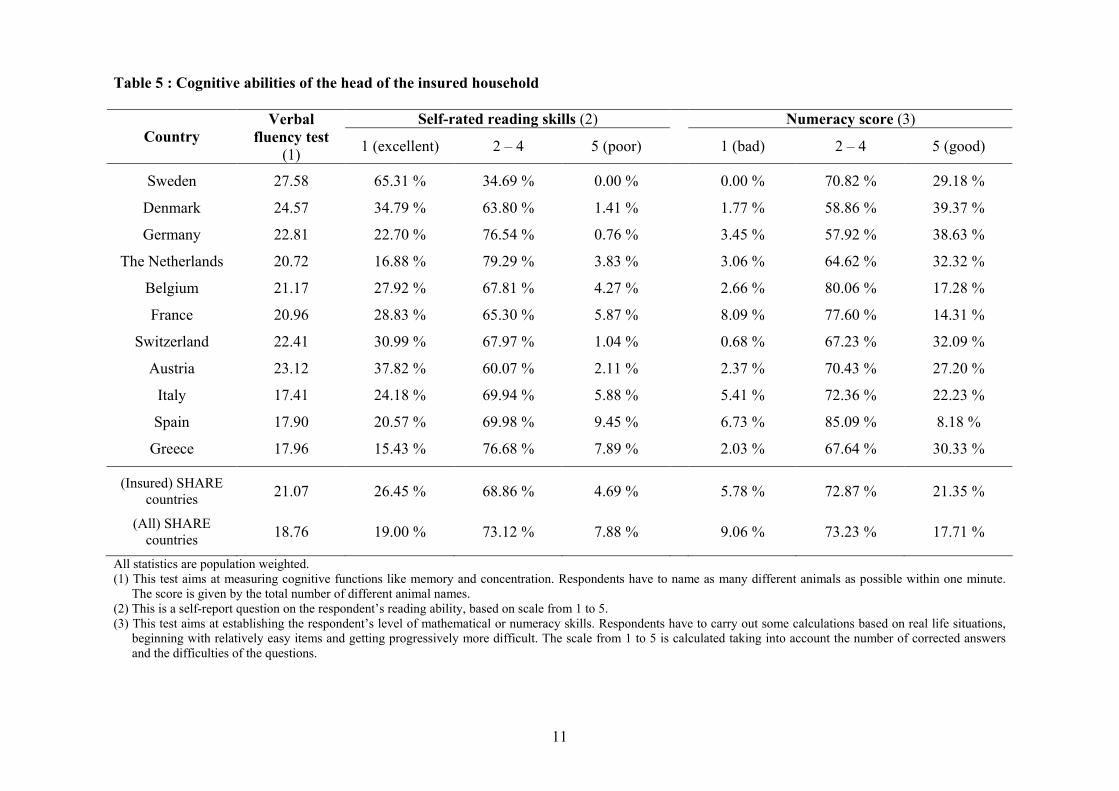
Table 5 reports information about the cognitive abilities of the insured heads. They show better
levels of several cognitive functions (verbal ability, numeracy and reading skills). The only
exceptions are given by the Mediterranean countries (especially Spain and Greece), where low levels
of verbal and reading abilities even for insured people.
Finally, table 6 reports statistics about the current and past occupational status of the members of
households with a VPHI. On average, insured households are more likely to have at least one
member who is currently employee, currently or previously civil servant or employed in a average
size firm with more than 24 employees. Sweden, Switzerland, Italy and Greece show a quite large
share of insured households where at least one member is or was a self-employed.
Summing up, in SHARE VPHI is predominantly held by individuals with higher income, education
levels and employment conditions, in agreement with evidence on OECD countries (OECD, 2004,
pp. 59-62).
insurance, diverse levels of dependent coverage by policies, and other factors. In several countries where private health
insurance is provided as a condition of employment, coverage is highest among the middle age cohorts. 10 Moreover, in France we find that the share of people with more than one ADL limitation is higher for the insured than
for the whole sample.

8
Table 2 : Characteristics of VPHI at the household level
VPHI yearly premiums (1) Median income (PPP adjusted)
Country
Weighted % of
households with
at least one
VPHI
% of insured
households with
more than 1
policy
Mean Median Insured
households
Not-insured
households
Sweden 3.60 51.65 330.46 (54.77) 177.55 61587 29924
Denmark 40.14 58.13 262.12 (37.51) 201.65 42829 21878
Germany 13.91 57.35 1056.65 (132.47) 550.00 36142 23559
The Netherlands 71.14 56.94 1169.12 (162.73) 530.00 38594 32347
Belgium 76.43 72.89 348.50 (112.39) 124.00 26387 19182
France 82.74 96.13 770.48 (20.92) 670.00 24546 21212
Switzerland 35.26 71.38 970.15 (87.63) 391.08 42111 32454
Austria 26.61 39.28 858.96 (57.01) 480.00 26521 19486
Italy 7.51 38.32 672.22 (152.53) 300.00 31759 16801
Spain 10.15 66.83 2521.84 (1086.02) 370.00 23490 11528
Greece 6.18 48.94 515.36 (71.30) 300.00 18880 11425
All SHARE
countries 30.57 77.63 874.01 (52.89) 540.00 28703 19230
All statistics are population weighted. All values are PPP-adjusted. (1)
For Germany, the Netherlands, Austria and Spain, total premiums amount refers both to primary PHI and to additional VPHI.

9
Table 3 : Demographic and educational characteristics of the head of the insured household (percentages)
Age (years) Marital status Educational level – ISCED
Country Gender
(Male) < 60 60–69 70–79 >=80
Living
with a
partner
Separated
or
divorced
Widowed Never
married 0
(1) 1 or 2 3
4 or
more
Sweden 62.58 68.71 25.92 2.78 2.59 83.81 9.03 0.00 7.16 1.20 28.50 25.47 44.83
Denmark 54.21 42.41 31.35 18.74 7.50 63.26 15.40 15.09 6.25 0.53 11.46 47.37 40.64
Germany 57.40 29.19 42.28 17.98 10.55 69.26 6.78 17.87 6.09 0.33 8.82 53.14 37.71
Netherlands 54.46 40.43 26.50 21.40 11.67 66.73 9.26 18.20 5.81 2.00 54.99 23.10 19.91
Belgium 53.45 36.79 29.06 24.89 9.26 68.66 8.73 18.84 3.77 2.40 45.67 25.76 26.17
France 51.48 34.48 25.33 24.08 16.11 59.63 11.00 22.86 6.51 20.64 34.54 26.13 18.69
Switzerland 49.45 39.73 31.17 21.57 7.53 68.08 13.00 15.93 2.99 6.05 39.01 21.76 33.18
Austria 53.91 34.69 28.95 26.18 10.18 60.48 8.68 22.48 8.36 0.18 15.50 43.84 40.48
Italy 60.80 47.64 35.37 12.64 4.35 72.60 8.18 6.54 12.68 1.57 36.91 33.92 27.60
Spain 52.01 46.61 21.25 24.28 7.86 71.09 5.60 15.27 8.04 7.28 48.43 16.20 28.09
Greece 64.30 55.84 31.38 8.20 4.58 67.49 10.22 16.44 5.85 4.71 31.79 32.19 31.31
(Insured)
SHARE
countries 53.40 36.42 28.63 22.18 12.77 64.00 9.80 19.74 6.46 11.41 34.29 30.02 24.28
(All)
SHARE
countries 50.68 32.58 28.53 24.36 14.53 58.96 8.97 23.90 8.17 8.77 43.46 29.42 18.35
All statistics are population weighted. (1)
This category includes also the answers “Still in school” and “Other type of educational degree”

10
Table 4 : Physical health status of the head of the insured household
N. of chronic diseases (1)
: N. of ADL limitations Self-reported health (US scale)
Country
Limitations
with
activities
(GALI)
Long-
term
illness 0 1 > 1 0 1 > 1 Excellent Very
good Good Fair Poor
Objective
health
index
Sweden 37.36 % 36.78 % 36.44% 38.31% 25.25% 93.49% 6.51% 0.00% 33.03 % 34.03% 27.55% 5.39 % 0.00 % 0.875
Denmark 38.99 % 52.10 % 28.17% 31.92% 39.91% 92.23% 5.24% 2.53% 25.84 % 31.24 % 25.00% 13.14% 4.77 % 0.834
Germany 46.60 % 53.60 % 30.47% 34.88% 34.65% 92.13% 5.14% 2.73% 6.60 % 21.71 % 41.04% 24.08% 6.57 % 0.837
Netherlands 46.40 % 44.19 % 30.71% 33.43% 35.86% 90.93% 4.89% 4.18% 12.17 % 18.00 % 41.43% 23.22% 5.18 % 0.825
Belgium 38.60 % 45.96 % 20.35% 32.11% 47.54% 87.83% 7.46% 4.71% 10.39 % 22.57 % 42.28% 19.22% 5.55 % 0.805
France 38.94 % 51.59 % 22.49% 32.84% 44.67% 86.97% 6.35% 6.68% 7.32 % 14.72 % 43.79% 24.62% 9.55 % 0.795
Switzerland 31.65 % 37.13 % 35.44% 35.21% 29.35% 93.84% 3.50% 2.66% 16.91 % 31.80 % 35.80% 11.79% 3.70 % 0.860
Austria 50.83 % 49.51 % 24.99% 37.47% 37.54% 89.63% 4.54% 5.83% 9.29 % 24.37 % 35.08% 23.60% 7.66 % 0.815
Italy 29.98 % 38.16 % 31.30% 36.23% 32.47% 92.89% 3.85% 3.26% 9.05 % 13.01 % 51.98% 22.03% 3.92 % 0.835
Spain 33.07 % 47.94 % 19.42% 37.03% 43.55% 90.21% 5.13% 4.66% 3.19 % 21.64 % 39.15% 32.34% 3.67 % 0.810
Greece 19.33 % 37.09 % 36.77% 33.86% 29.37% 90.80% 4.53% 4.67% 13.29 % 29.80 % 37.07% 15.67% 4.17 % 0.843
(Insured)
SHARE
countries
40.02 % 49.21 % 25.30% 33.62% 41.08% 89.01% 5.78% 5.21% 8.82 % 18.08 % 42.27 % 23.40% 7.43 % 0.811
(All)
SHARE
countries
44.82 % 52.70 % 24.36% 31.64% 44.00% 87.72% 6.18% 6.10% 6.96 % 16.43 % 39.30 % 27.59% 9.72 % 0.796
All statistics are population weighted. (1)
Chronic diseases: heart problems; high blood pressure; high blood cholesterol; stroke and/or cerebral vascular disease; diabetes; chronic lung disease; asthma;
arthritis/rheumatism; osteoporosis; cancer; stomach ulcer; Parkinson disease; cataracts; hip or femoral fracture.
11
Table 5 : Cognitive abilities of the head of the insured household
Self-rated reading skills (2) Numeracy score (3)
Country
Verbal
fluency test
(1) 1 (excellent) 2 – 4 5 (poor) 1 (bad) 2 – 4 5 (good)
Sweden 27.58 65.31 % 34.69 % 0.00 % 0.00 % 70.82 % 29.18 %
Denmark 24.57 34.79 % 63.80 % 1.41 % 1.77 % 58.86 % 39.37 %
Germany 22.81 22.70 % 76.54 % 0.76 % 3.45 % 57.92 % 38.63 %
The Netherlands 20.72 16.88 % 79.29 % 3.83 % 3.06 % 64.62 % 32.32 %
Belgium 21.17 27.92 % 67.81 % 4.27 % 2.66 % 80.06 % 17.28 %
France 20.96 28.83 % 65.30 % 5.87 % 8.09 % 77.60 % 14.31 %
Switzerland 22.41 30.99 % 67.97 % 1.04 % 0.68 % 67.23 % 32.09 %
Austria 23.12 37.82 % 60.07 % 2.11 % 2.37 % 70.43 % 27.20 %
Italy 17.41 24.18 % 69.94 % 5.88 % 5.41 % 72.36 % 22.23 %
Spain 17.90 20.57 % 69.98 % 9.45 % 6.73 % 85.09 % 8.18 %
Greece 17.96 15.43 % 76.68 % 7.89 % 2.03 % 67.64 % 30.33 %
(Insured) SHARE
countries 21.07 26.45 % 68.86 % 4.69 % 5.78 % 72.87 % 21.35 %
(All) SHARE
countries 18.76 19.00 % 73.12 % 7.88 % 9.06 % 73.23 % 17.71 %
All statistics are population weighted.
(1) This test aims at measuring cognitive functions like memory and concentration. Respondents have to name as many different animals as possible within one minute.
The score is given by the total number of different animal names.
(2) This is a self-report question on the respondent’s reading ability, based on scale from 1 to 5.
(3) This test aims at establishing the respondent’s level of mathematical or numeracy skills. Respondents have to carry out some calculations based on real life situations,
beginning with relatively easy items and getting progressively more difficult. The scale from 1 to 5 is calculated taking into account the number of corrected answers
and the difficulties of the questions.

12
Table 6 : Occupational status of insured heads
Country
At least one
member is
currently
retired
At least one
member is
currently an
employee
At least one
member is
currently a
homemaker
At least one
member is
or was a
civil servant
At least one
member is
currently a
self-employed
At least one
member is or
was a self-
employed
At least one
member works or
worked in a firm
with more than
24 employees
Sweden 16.25 % 69.38 % 0.83 % 41.84 % 29.82 % 35.96 % 49.48 %
Denmark 44.84 % 53.17 % 2.72 % 21.96 % 11.12 % 22.07 % 61.55 %
Germany 57.98 % 32.37 % 14.84 % 10.34 % 15.17 % 20.65 % 50.95 %
Netherlands 41.51 % 35.97 % 30.48 % 18.94 % 6.79 % 14.95 % 51.91 %
Belgium 59.98 % 27.84 % 24.90 % 25.78 % 6.10 % 17.84 % 65.02 %
France 62.30 % 30.84 % 16.36 % 24.72 % 6.03 % 18.63 % 60.70 %
Switzerland 40.44 % 45.97 % 15.10 % 7.75 % 17.52 % 25.15 % 59.46 %
Austria 60.47 % 33.66 % 15.45 % 21.95 % 8.83 % 19.05 % 51.92 %
Italy 49.67 % 32.73 % 18.02 % 29.79 % 24.18 % 34.54 % 55.18 %
Spain 38.67 % 33.17 % 29.03 % 16.56 % 14.03 % 24.29 % 36.01 %
Greece 39.58 % 44.36 % 26.12 % 28.55 % 26.91 % 41.17 % 42.93 %
(Insured)
SHARE
countries 56.23 % 32.80 % 18.73 % 21.74 % 9.19 % 19.87 % 57.10 %
(All) SHARE
countries 54.29 % 27.41 % 23.58 % 15.62 % 8.67 % 19.45 % 46.96 %
All statistics are population weighted.

13
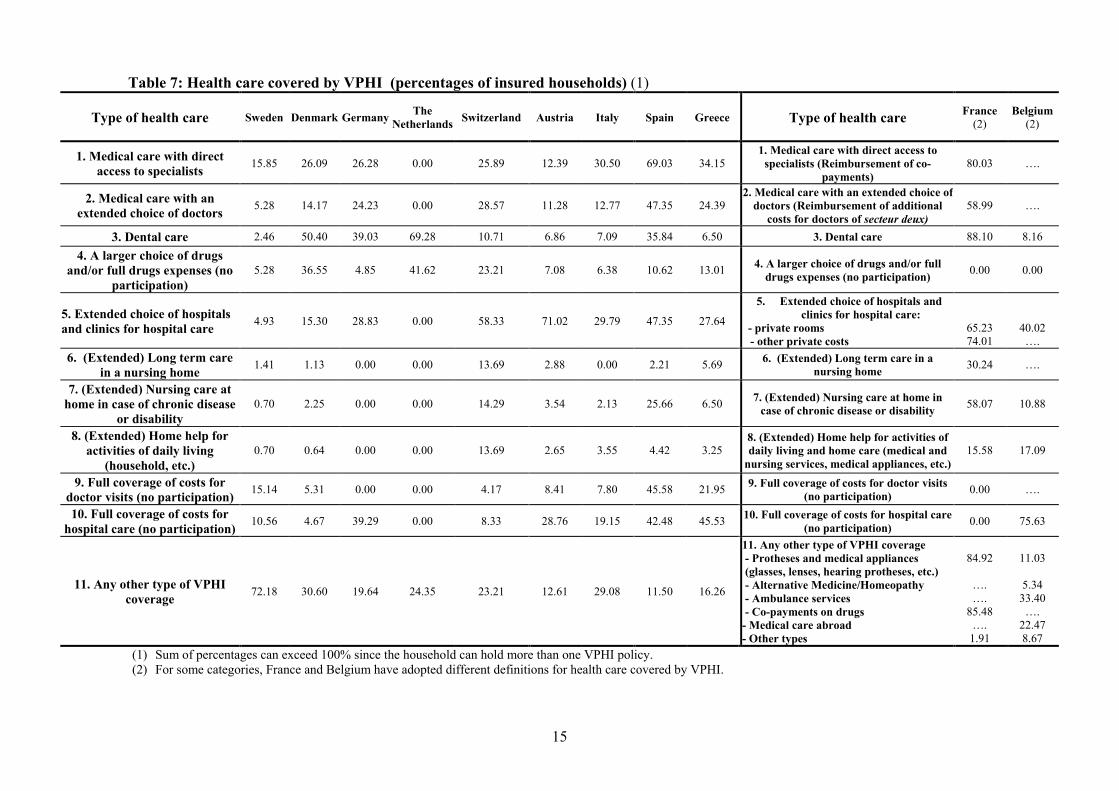
3.2 The additional coverage provided by voluntary private insurance in the SHARE countries
Table 7 reports the types of coverage provided by VPHI in each SHARE country, according to the
country specific answer categories of the following question in the Health Care Section of SHARE
questionnaire:
HC060: “Do you have any voluntary, supplementary or private health insurance for at least one of
the following types of care in order to complement the coverage offered by the National Health
System? If yes, please say what is covered. (CODE ALL THAT APPLY)
1. Medical care with direct access to specialists
2. Medical care with an extended choice of doctors
3. Dental care
4. A larger choice of drugs and/or full drugs expenses (no participation)
5. An extended choice of hospitals and clinics for hospital care
6. (Extended) Long term care in a nursing home
7. (Extended) Nursing care at home in case of chronic disease or disability
8. (Extended) Home help for activities of daily living (household, etc.)
9. Full coverage of costs for doctor visits (no participation)
10. Full coverage of costs for hospital care (no participation)
96. No voluntary health insurance at all
97. Any other type of voluntary health insurance
Given the different characterizations of VPHI across SHARE countries (supplementary,
complementary or duplicate) it is not easy to trace a prevalent type of covered health care.
In addition, for some countries the proposed classification of VPHI coverages proved not easily
adaptable. In Sweden a very large proportion of insured households indicates “any other type of
VPHI coverage”. This answer apparently refers to a private insurance scheme which covers income
loss during longer periods of sickness (normally more than three months). This kind of insurance,
however, does not cover any kind of health care, and therefore we do not treat it as a VPHI. For
France and Belgium, a different classification of covered health care has been adopted. In France
more than 80% of insured households are covered for the reimbursement of co-payments (for
outpatient and inpatient care, and for drugs), of dental care and of optical protheses, confirming that
VPHI predominantly complements public coverage. In Belgium, VPHI mostly covers full costs of
14
hospital care (75.63% of insured households) and an extended choice of hospitals (40.02% of insured
households) and therefore it seems predominantly supplementary of public coverage.
In general, from table 7, we observe that the most frequent VPHI coverages are for providing direct
access to specialists, extended choice of hospitals and clinics, full coverage of hospital care costs,
and access to dental care. In other terms, VPHI can enhance choice over the providers, conditions
and timeliness of care.11
Besides, where cost-sharing on public systems is large, it provides a
complementary coverage for services and costs that may otherwise be paid out-of-pocket; in this
case, the issue of the right balance between improving access and controlling moral hazard from
over-utilization of services becomes crucial.12
Moreover, analysing the data collected from the Health care section of SHARE questionnaire, we
observe that there are some differences between insured and not insured 50+ people as far as health
care utilization concerns.13
People with a VPHI are more likely to have outpatient surgery (6.29% for
the insured against 4.48% for the others); to visit a heart specialist (12.23% against 10.21%), a
dermatologist (2.03% against 1.63%) or a surgeon (2.61% against 1.88%); to see a dentist or a dental
hygienist (57.40% against 49.66%). We also observe that the probability to forego health care
because of its unavailability is relatively lower among people with a VPHI (1.31 against 2.70%).14
Summing up, it seems that, apart from equity considerations, the additional coverage provided by
VPHI somehow enhances access to care.15
But the higher accessibility guaranteed by a private
insurance does not necessarily mean that VPHI contributes to a reduction of households’ out-of-
pocket expenditures (OOPs) as we shall show in section 5.
11 As pointed out by OECD (2004, p. 55), in social-insurance based health systems, such as Germany, the Netherlands,
Austria, France and Belgium, VPHI usually pays for upgraded accommodation in hospitals (but the cost of hospital
treatment is usually covered for by public system, regardless of treating hospitals). Meanwhile, in tax-based health
systems, such as United Kingdom, Denmark, Italy, and Spain, VPHI improves access to timely elective care: those who
lack VPHI have comparatively less choice of provider and timing of care, unless they opt to pay for such care OOP
(OECD, 2004, p. 178). 12 According to Buchmueller and Couffinhal (2004), in France VPHI significantly increases medical care utilisation for
physician services and prescribing drugs, since it seems to reduce (and sometimes eliminate) OOP costs. 13 In this paper we do not report all the statistics on health care utilization by household’s heads with a VPHI policy.
These data are available on request to the authors. 14 This confirms the results of OECD (2004) study on the benefits covered by VPHI. 15 Since in many countries private health insurance coverage increases with economic and financial status (as we will
show in next section) the strong effect of insurance on utilization could imply that VPHI contributes to a “pro-rich”
horizontal inequality in the use of health care. On this point, see also Van Doorslaer, Masseria et al. (2004) and Jones,
Koolman and Van Doorslaer (2005).
15
Table 7: Health care covered by VPHI (percentages of insured households) (1)
Type of health care Sweden Denmark Germany The
Netherlands Switzerland Austria Italy Spain Greece
Type of health care
France
(2) Belgium
(2)
1. Medical care with direct
access to specialists 15.85 26.09 26.28 0.00 25.89 12.39 30.50 69.03 34.15
1. Medical care with direct access to
specialists (Reimbursement of co-
payments)
80.03
….
2. Medical care with an
extended choice of doctors 5.28 14.17 24.23 0.00 28.57 11.28 12.77 47.35 24.39
2. Medical care with an extended choice of doctors (Reimbursement of additional
costs for doctors of secteur deux)
58.99 ….
3. Dental care 2.46 50.40 39.03 69.28 10.71 6.86 7.09 35.84 6.50 3. Dental care 88.10 8.16
4. A larger choice of drugs
and/or full drugs expenses (no
participation)
5.28 36.55 4.85 41.62 23.21 7.08 6.38 10.62 13.01
4. A larger choice of drugs and/or full
drugs expenses (no participation) 0.00 0.00
5. Extended choice of hospitals
and clinics for hospital care 4.93 15.30 28.83 0.00 58.33 71.02 29.79 47.35 27.64
5. Extended choice of hospitals and
clinics for hospital care:
- private rooms
- other private costs
65.23
74.01
40.02
….
6. (Extended) Long term care
in a nursing home 1.41 1.13 0.00 0.00 13.69 2.88 0.00 2.21 5.69
6. (Extended) Long term care in a
nursing home 30.24 ….
7. (Extended) Nursing care at
home in case of chronic disease
or disability
0.70 2.25 0.00 0.00 14.29 3.54 2.13 25.66 6.50
7. (Extended) Nursing care at home in
case of chronic disease or disability 58.07 10.88
8. (Extended) Home help for
activities of daily living
(household, etc.)
0.70 0.64 0.00 0.00 13.69 2.65 3.55 4.42 3.25
8. (Extended) Home help for activities of daily living and home care (medical and
nursing services, medical appliances, etc.)
15.58 17.09
9. Full coverage of costs for
doctor visits (no participation) 15.14 5.31 0.00 0.00 4.17 8.41 7.80 45.58 21.95
9. Full coverage of costs for doctor visits (no participation)
0.00 ….
10. Full coverage of costs for
hospital care (no participation) 10.56 4.67 39.29 0.00 8.33 28.76 19.15 42.48 45.53
10. Full coverage of costs for hospital care (no participation)
0.00 75.63
11. Any other type of VPHI
coverage 72.18 30.60 19.64 24.35 23.21 12.61 29.08 11.50 16.26
11. Any other type of VPHI coverage - Protheses and medical appliances
(glasses, lenses, hearing protheses, etc.)
- Alternative Medicine/Homeopathy
- Ambulance services
- Co-payments on drugs
- Medical care abroad
- Other types
84.92
….
….
85.48
….
1.91
11.03
5.34
33.40
….
22.47
8.67
(1) Sum of percentages can exceed 100% since the household can hold more than one VPHI policy.
(2) For some categories, France and Belgium have adopted different definitions for health care covered by VPHI.

16
4. Main determinants of VPHI holding
In order to identify the main determinants of having a VPHI policy in the SHARE sample, for each
country we estimate a probit model over a wide set of variables that can explain the holding of VPHI
by 50+ people. The dependent variable takes value of 1 if the household has at least one VPHI, zero
otherwise. The explanatory variables can be divided in seven groups: 1) demographic characteristics of
the head and the household; 2) educational level of the head; 3) current physical health status of the
head; 4) current cognitive abilities of the head; 5) current and past occupational status of the
household’s members; 6) current economic and financial status of the household; 7) expected economic
status of the head.
Household income and real asset values are PPP-adjusted. Reading skills, numeracy score and the self-
reported health status are expressed on a 0-1 scale, as the “objective” health index.
In SHARE five different datasets are available for income and asset variables, because of Multiple
Imputations (MI). Therefore, five different datasets are created and we perform the analysis on each
dataset separately. The estimated parameters are then combined using the results of Rubin (1987)16
, in
order to create one repeated-imputation inference (see Little and Rubin, 2002 for a recent survey).
Results are summarized in Table 8, where for each country we report sign and significance of each
parameter.
As expected, the main determinants of VPHI are different in each country and this reflects the
differences in the underlying health care systems.
For most countries the educational level and the cognitive abilities of the household’s head are the main
determinants that explain the holding of a VPHI policy.
The presence of a partner has a significantly positive effect on the probability to be voluntary insured in
Sweden, Denmark, the Netherlands, Belgium, France, and Austria, while gender and age of the
respondent influence the decision to have a VPHI only in a few countries. Demographic characteristics
are very important in Belgium and Denmark.
In several countries the past or current occupational status of the household’s members can
significantly affect the probability of holding a VPHI policy. In particular, the presence of self-
employed in the household is positively related with the holding of a VPHI policy in Sweden,
Denmark, Italy and Greece, while the presence of household’s members employed in firms with more
than 24 employees increases significantly the probability to hold a VPHI in Belgium, France, Italy and
Greece.
16 The point estimate of a parameter in a MI analysis is the average value of the point estimates obtained in each separate
analysis, while the variance of the MI estimate is calculated by a formula involving both the between-imputation and the
within-imputation variance.

17
Tab. 8 : List of sign and significance of the estimated coefficients in each country probit regression
Variable Sweden Denmark Germany Netherlands Belgium France Switzerland Austria Italy Spain Greece
Weighted % households with
at least a VPHI 3.60 40.14 13.91 71.14 76.43 82.74 35.26 26.61 7.51 10.15 6.18
1. Demographic Male + – *** – – – – – – ** + – – * Characteristics Age less than 60 + + – *** + + *** + + – + + + **
Age 60-69 + + ** – * + + *** + + – + – + *
Age 70-79 + + ** – ** + + *** + + + + + +
Partner + ** + * + + *** + *** + *** + + *** + + –
Household size – + – + + – *** – – – – +
2. Educational Education - ISCED 3 + + *** + * + + – + + *** + *** + *** + ***
Level Education – ISCED 4 or more + + *** + ** + + – + ** + *** + *** + *** + ***
3. Physical
health
Limitations with activities
(GALI) + – + + – + – – – – –
Status Long-term illness – – – + ** – + – + – – +
“Objective” health index + – ** + – – + – *** – ** – – –
Self-reported health status
(US scale) + + + + + + + – – – +
4. Cognitive
abilities
Numeracy (best household
performance) – + *** + ** + *** + *** + + + *** + + * +
Verbal fluently test (best
household performance) + * + ** + ** + – + + ** – * + * + + ***
Reading skills (best household
performance) + * + + *** – * + + + * + *** + + * – ***
5. Occupational
status
Any civil servant in the
household (past or current)? – *** + – * – *** + * – + + *** – + ** +
Any self-employed in the
household (past or current)? + ** + ** + – – – – + + ** + + **
Any employed in a firm with
more than 24 employees in the
household (past or current)?
+ + – + + *** + *** + – + ** – + ***
6. Economic Ownership of the house – ** + + + – + *** + + – + – ** and financial
status Household income + + + * – + – + + + + +
Real assets + *** + + – – – – + + + * + **
7. Expected
economic status
Respondent is entitled to
receive a future pension + + – + * + – + + * + *** + –
Significance levels: *** = 1% level; ** = 5% level; * = 10% level

18
Past or current presence of civil servants in the households increases the probability to hold a
VPHI policy in some countries (Belgium, Austria and Spain) while it reduces the probability of
VPHI in other countries (Sweden, Germany, the Netherlands).
Finally, current physical health status, current economic and financial status, and expectations on
future economic status are important determinants of holding a VPHI policy only in a few
countries. In particular, households with higher levels of real assets show a higher probability to
hold a VPHI in Sweden, Spain and Greece.
Overall, there is evidence that VPHI policies are mostly held by better educated and cognitively
more able people.
5. The relationship between out-of-pocket payments and voluntary private health insurance
5.1. Descriptive analysis
Table 1 in section 1 shows that people of all SHARE countries have some out-of-pocket (OOP)
expenditures. It can be important to assess how effective voluntary private health insurance is in
reducing out-of-pocket expenditures (OOPs) for individuals aged 50 or over across SHARE
countries. We define OOPs as the sum of non-refunded payments for hospital inpatient care,
outpatient care (including dental services) and prescribed drugs17
.
In the first results SHARE book, Holly et al. (2005) found that in most countries, the proportion
of people paying out-of-pockets (OOPs) is not significantly different between those who have
subscribed a VPHI and those who have not18
, confirming previous results (e.g., OECD, 2004).
Our analysis, based on a more complete data set than Holly et al. (2005), produces results which
are rather different (Table 9).
In Sweden, Germany, the Netherlands, France, Switzerland and Greece the proportion of people
with positive OOPs does not significantly differ between people with or without VPHI (for all
these counties, P-values are higher than 0.10 in part 1 of table 9). In all other countries VPHI
heads have a higher probability of paying OOPs.
17 These OOP expenditures refer to questions HC045, HC047 and HC049 of the Health Care Section of SHARE
questionnaire. If the answer in any item is missing, a conditional hot-deck procedure is used for imputing the
corresponding amount. In imputation, we stratify by country, gender, age and unfolding bracket information. In fact,
in the SHARE questionnaire, if the answer to an amount question is “Don’t Know” or “Refusal”, a number of
subsequent questions on whether the amount is larger than, smaller than, or about equal to a given amount are asked;
this is the so-called unfolding bracket design and it was proved to be an effective way to collect categorical
information on the initial non-respondents. 18 In two countries (Austria and Italy) 50+ people covered by a VPHI showed a higher probability of spending OOPs,
whereas the opposite relationship were observed in Greece, France and in the Netherlands. Moreover, Holly et al.
(2005) found that in Austria, Germany, Spain, Italy, and Denmark, people in the subgroup of those having positive
OOPs and who are covered by a VPHI meet higher OOPs (this relationship remained true across income quintiles).
They concluded that these results could suggest that the VPHI may induce people in these countries to consume more
and make higher health expenditures. Using different data, Borgia and Doglia (2006) show that in Italy OOP levels
do not differ between insured and uninsured households.

19
Table 9: Relationship between OOP Payments and the coverage by VPHI in SHARE countries
Country
Weighted
percentage
households
with VPHI
(1)
Weighted percentage of households
with OOP> 0
(2)
Weighted mean OOP expenditures
if OOP > 0
(3)
Weighted mean OOP expenditures
Without
VPHI with VPHI P-value
without
VPHI With VPHI P-value
without
VPHI with VPHI P-value
Sweden 3.60 92.66% 93.11% 0.89 371.70 336.96 0.49 344.43 313.74 0.52
Denmark 40.14 85.34% 92.26% <0.01 445.04 552.45 0.05 379.80 509.69 0.01
Germany 13.91 87.55% 87.23% 0.89 296.23 333.60 0.30 259.33 291.01 0.33 Netherlands 71.14 40.94% 42.67% 0.51 470.92 474.86 0.97 192.82 202.63 0.83
Belgium 76.43 93.02% 95.48% 0.03 1084.33 935.22 0.19 1008.67 892.97 0.28
France 82.74 46.02% 42.96% 0.30 594.93 373.43 0.20 273.79 160.44 0.16
Switzerland 35.26 76.44% 71.64% 0.19 646.90 729.33 0.43 494.51 522.52 0.73
Austria 26.61 74.85% 84.54% <0.01 292.95 433.17 <0.01 219.28 363.21 <0.01
Italy 7.51 80.60% 94.71% <0.01 788.57 1449.80 0.18 635.66 1373.04 0.11
Spain 10.15 43.69% 67.15% <0.01 449.27 691.24 0.04 196.27 464.15 <0.01
Greece 6.18 86.71% 83.46% 0.35 690.40 863.68 0.26 598.67 720.84 0.35

20
On the other hand, in Denmark, Austria and Spain the VPHI coverage seems associated with
significantly higher OOPs (table 9, part 2); and these results are confirmed also when the
possibility of zero OOPs is considered (table 9, part 3). It would be interesting to investigate
whether this OOP spending behaviour of insured households is associated with an increase of the
services they use in the health care system as a whole.
5.2 The econometric model
Previous results cannot be considered decisive to ascertain whether VPHI actually substitutes for
private expenditures or determines an incentive to spend more on OOPs. In fact, the total effect of
VPHI on OOP expenditures is likely to differ across households within the same country, partly
as a result of observable characteristics (age, income, education, health status, wealth, etc.), partly
as a consequence of unobserved heterogeneity in preferences. Therefore, unobserved
heterogeneity makes it impossible to give a causal interpretation of the estimate of the VPHI
dummy parameter in a standard linear regression of OOPs.
We tackle this problem by assuming that some variables affect the probability of holding a VPHI
policy, but not the desired OOP expenditures. According to the Probit estimates in Table 8, we
consider six variables that can be used as instruments for VPHI in the OOP regression: a) at least
one household member was or is a civil servant; b) at least one household member was or is a
self-employed; c) at least one household member worked or works in firms with more than 24
employees; d) current cognitive abilities of the head of the household (d1) numeracy, d2) verbal
fluency test score, d3) self-reported reading ability).
Moreover, some types of current occupational status (at least one household member is currently
an employee, a retired, a homemaker) can affect the level of OOP expenditures, but has no effect
on the probability to be covered by a VPHI. Finally, those who are currently self-employed have
higher opportunity costs of time. Hence, they have a relatively higher propensity to spend OOP
privately, in order to avoid waiting times to access to public services.
The relationship between OOP expenditures and the VPHI coverage is then investigated by
means of a simultaneous-equations model with an underlying continuous latent variable, also
known as the “treatment effect model” (Maddala, 1983). More precisely, this model estimates the
effect of an endogenous binary variable (VPHI) on a continuous, fully observed variable (OOP
expenditures), conditional on three sets of explanatory variables: the first (X1) includes variables
that affect both the decision of holding a VPHI and the OOPs; the second (X2) includes variables
that affect OOP expenditures, but not the decision of holding a VPHI (the current occupational
status in this analysis); the third (X3) includes variables that affect the decision of holding a
VPHI, but not the OOP expenditures (the six instrumental variables described above).
21
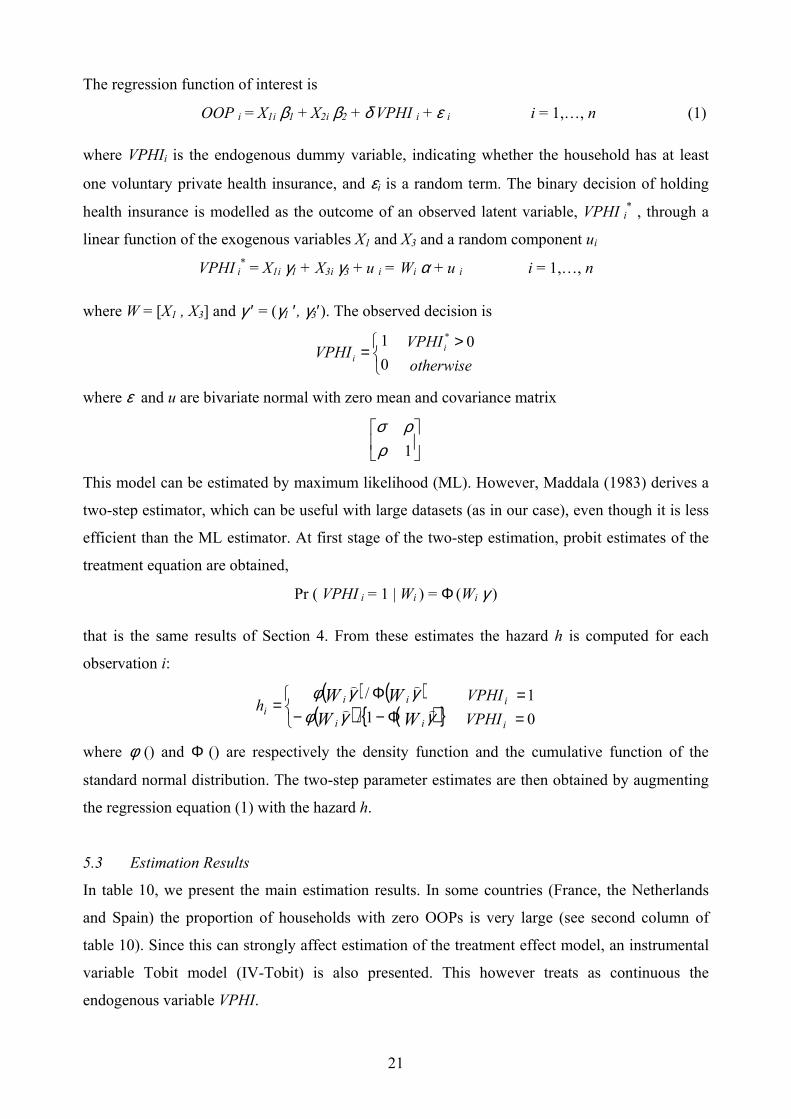
The regression function of interest is
OOP i = X1i β1 + X2i β2 + δ VPHI i + ε i i = 1,…, n (1)
where VPHIi is the endogenous dummy variable, indicating whether the household has at least
one voluntary private health insurance, and εi is a random term. The binary decision of holding
health insurance is modelled as the outcome of an observed latent variable, VPHI i* , through a
linear function of the exogenous variables X1 and X3 and a random component ui
VPHI i* = X1i γ1 + X3i γ3 + u i = Wi α + u i i = 1,…, n
where W = [X1 , X3] and γ ′ = (γ1 ′, γ3′). The observed decision is
otherwise
VPHIVPHI i
i
0
0
1 * >
=
where ε and u are bivariate normal with zero mean and covariance matrix
1ρρσ
This model can be estimated by maximum likelihood (ML). However, Maddala (1983) derives a
two-step estimator, which can be useful with large datasets (as in our case), even though it is less
efficient than the ML estimator. At first stage of the two-step estimation, probit estimates of the
treatment equation are obtained,
Pr ( VPHI i = 1 | Wi ) = Φ (Wi γ )
that is the same results of Section 4. From these estimates the hazard h is computed for each
observation i:
( ) ( )( ) ( ){ } 0
1
1/
/
==
Φ−−Φ
=i
i
ii
iii
VPHI
VPHIh
WW
WWγγφ
γγφ))
))
where φ () and Φ () are respectively the density function and the cumulative function of the
standard normal distribution. The two-step parameter estimates are then obtained by augmenting
the regression equation (1) with the hazard h.
5.3 Estimation Results
In table 10, we present the main estimation results. In some countries (France, the Netherlands
and Spain) the proportion of households with zero OOPs is very large (see second column of
table 10). Since this can strongly affect estimation of the treatment effect model, an instrumental
variable Tobit model (IV-Tobit) is also presented. This however treats as continuous the
endogenous variable VPHI.

22
The models described above plus an OLS regression are estimated for each country. Table 10
reports the main results of the estimation for the dummy variable VPHI in these three types of
regression of OOP expenditures (OLS, IV-Tobit, Treatment-Effect). Treatment-Effect estimates
are obtained by the two-step procedure described above.
The estimates in table 10 provide information on the relationship between VPHI and OOP rather
different from those in table 9. Also, OLS estimates are different to IV-Tobit and Treatment-
Effect results, as expected because of the inconsistency of the OLS estimations. As explained
above, given the high proportion of households with zero OOP, for the Netherlands, France and
Spain, we look at the VPHI parameter of IV-Tobit model, while the other countries are analysed
by the Treatment-Effect model.
P-values in the third column of table 10 signal that the six instrumental variables we consider
(Probit model estimates of Section 4) are jointly significant at 5% level in estimating the
probability to subscribe a VPHI in all countries, i.e. they are informative instruments for
identifying VPHI holders. Residuals for the IV-Tobit and Treatment-Effect methods are
computed and used to construct a Sargan test for the validity of the instruments (columns 6 and 8
of table 10)19
. Restricting the attention to the countries with significant point estimates, the null
hypothesis is strongly rejected in Austria, Germany and Sweden (for the Treatment-Effect
procedure). In all other countries the null hypothesis cannot be rejected.
In France and Spain (analysed with IV-Tobit model) private insurance seems to create a very
strong incentive to spend more OOPs. The similarity of results is surprising in view of the fact
that in France, a very large share of population (more than 80% of households in the SHARE
sample) subscribes at least one health insurance, while in Spain this share is only 10%.
For all other countries, we look at the VPHI parameter of the Treatment-Effect model. The VPHI
estimate is significant in only three countries (Austria, Italy and Belgium), but only in two (Italy
and Belgium) the validity of instruments cannot be rejected by the Sargan test. In Italy, the
estimated effects are similar to those of France and Spain, that is we found a positive effect of
VPHI in OOPs; on the contrary, in Belgium VPHI seems to reduce OOPs for the insured. In
Switzerland, Greece, Denmark, Germany, and Sweden the estimates parameter is not significant,
signalling that for these countries holding a VPHI does not affect (either negatively or positively)
the propensity to spend OOP.
In Belgium, VPHI shows a strong and significant impact on reducing OOP expenditures,
providing an effective supplementary coverage, as we might have expected thinking about the
role of these policies. Conversely, in seven countries (the Netherlands, Switzerland, Austria,
Greece, Denmark, Germany and Sweden) we do not find any significant effect of VPHI in
19 In the case of the IV-Tobit model, generalized residuals (Chesher and Irish, 1987) are calculated.

23
reducing the level of OOPs, while in three Southern European countries (France, Spain and Italy)
there is evidence of a significant effect of VPHI in increasing the level of OOPs.20
It would be interesting to further investigate the causes of the positive relationship between VPHI
and OOPs in Southern European countries. Given that our estimation procedure corrects for the
effects of self-selection into VPHI, a first conclusion we can draw from our analysis is that higher
OOP’s by policy holders are due to the high levels of cost-sharing (in the form of co-payments,
deductibles and ceilings) set out in VPHI contracts. Cost-sharing is normally used to reduce
moral hazard risks. The end result of higher OOP’s for the insured may be interpreted as evidence
that insurance companies in these countries are overly cautious.
While this tentative conclusion appears plausible and well grounded for Italy and Spain, it does
not square with the notion that in France VPHI is mostly complementary, covering the
reimbursement of co-payments and extra-billing for health care under basic public coverage
(ticket modérateur for drugs and ambulatory services; prices higher than the public reimbursed
tariffs for visits, prothesis and medical devices).21
We have found that in France the proportion of
privately insured people paying OOP is relatively low but, on the same time, VPHI has a strong
positive impact on OOP expenditures. We could interpret these data in this way: French VPHI
holders pay less OOP for each unit of public health care they consume, but on the same time, they
demand more public health care (a moral hazard effect created by VPHI coverage and only partly
reduced by private co-insurance); since the second effect is stronger, at the end VPHI holders
spend more OOP than the non-insured. Therefore, our analysis seems to confirm that in France
VPHI, by adding a complementary coverage to for the same types of services covered by social
insurance, weakens the effect of public cost-sharing (ticket modérateur, fixed tariffs) in
controlling moral hazard for public health care; in this way VPHI contributes to increases the use
of public health care services by the insured and consequently (not only OOPs but also) public
expenditure.22
However, this conclusion should be adequately verified by developing a further
analysis of SHARE data, in order to ascertain the existence of a significant positive relationship
between the subscription of a VPHI policy and the consumption of publicly provided health care.
20 In Southern European countries the positive effect of VPHI on OOPs is particularly strong. 21 Moreover, in France mutuelles reduce financial barriers for access to outpatient care. In fact, they generally pay
directly providers, while non insured patients are expected to pay the provider themselves and then they receive (total
or partial) reimbursement of their expenses from the statutory health insurance fund. 22 This effect of VPHI is analysed by Mossialos and Thomson (2002), Couffinhal (2003), and Buchmueller and
Couffinhal (2004).

24
Table 10 : Main results of the relationship between OOPs and VPHI
VPHI parameters estimate
(4)
OLS IV-Tobit
Treatment Effect model
2-step estimation
Country
(1)
Number of
households
(2) Percentage
of households
with positive
OOP among
those with non
missing OOP
(3) P-value of the
joint significance
test for additional
instruments
(informative
instruments)
(5)
Point
estimate
(6)
Sargan test
(instruments
validity)
(7)
Point
estimate
(8)
Sargan test
(instruments
validity)
The Netherlands 1809 42.54 % 0.000 – 13.81 – 1154.29 5.43 – 474.85 1.85
France 1900 43.33 % 0.013 – 118.80 *** 3035.95 * 6.49 1313.80 *** 4.64
Spain 1555 47.06 % 0.005 178.60 *** 4068.97 *** 7.63 – 53.08 8.94
Switzerland 651 74.51 % 0.002 67.64 790.86 8.14 – 83.41 8.91
Austria 1349 77.32 % 0.000 106.14 *** 1059.11 *** 10.81 * 397.26 ** 13.97 **
Italy 1700 81.59 % 0.019 426.16 ** 14453.57 * 4.69 1824.17 ** 6.87
Greece 1867 86.13 % 0.000 142.46 656.42 3.72 679.89 4.33
Denmark 1109 87.43 % 0.000 69.01 * 555.97 * 6.81 356.33 7.91
Germany 1925 88.11 % 0.000 2.19 – 905.75 * 11.33 ** – 315.28 17.62 ***
Sweden 2033 93.04 % 0.000 – 9.34 n.c. n.c. – 92.25 14.88 **
Belgium 2390 94.46 % 0.000 – 38.49 – 1230.34 7.54 – 1151.53 ** 7.92
Significance levels: *** = 1% level; ** = 5% level; * = 10% level
n.c.: not converged.
Parameters on controls not reported

25
6. Conclusions
Using data form SHARE, in this paper we have analysed the characteristics of voluntary private
health insurance (VPHI) among the European over fifties.
For each country, we first estimate how a wide set of variables explain the probability of holding
a private health care insurance. We find that the main determinants of VPHI are different in each
country, reflecting the differences in the underlying health care systems. However, for most
countries current education levels and cognitive abilities have a strong positive effect on holding
a VPHI policy. Past or current occupations are also found to play an important role in several
countries.
We also show that the additional coverage provided by VPHI enhances access to health care of
50+ people, even though our analysis suggest that it can exacerbate inequity since VPHI is
mostly held by better educated and cognitively more able people. Our results confirm that the
strong effect of insurance on utilization (particularly in countries such as Italy, Spain, Greece and
France) could increase income-related inequality in access to care (OECD, 2004 page 179).
In this paper, we also ask whether the better access granted by private insurance is accompanied
by a reduction of households’ OOPs, once allowance is made for the possibly non-random nature
of the sample of VPHI policy holders (adverse selection).
To analyse the causal effect of having a VPHI on out-of-pocket expenditures we adopt a
simultaneous-equations model approach. We use as instruments some variables that affect the
decision to hold VPHI, but that should not directly affect OOP expenditure. The identification
assumption is that past or current occupation and current cognitive abilities have an impact on the
probability to subscribe a VPHI, but only current occupation can affect the OOP spending level.
Our key estimation result is that only in Belgium VPHI provides an effective supplementary
coverage, reducing OOPs for insured households. Conversely, in all other countries the insured
do not have lower OOP’s than the rest of the population, and in some countries (France, Italy and
Spain) they even spend more. This could be due to increased utilization, i.e. an increased demand
for health care goods and services stimulated by VPHI coverage (this is true especially for
France), but also to cost-sharing measures adopted by insurance companies and funds in order to
limit the effects of moral hazard.

26
References
Borgia P. and Doglia M. (2006), “Selection and risk equalisation in the Italian health insurance
market”, Health and Ageing, N° 15, Geneva Association Information Newsletter, October,
pp. 15-17.
Börsch-Supan A., A. Brugiavini, H. Jürges, J. Mackenbach, J. Siegriest and G. Weber (2005),
Health, Aging and Retirement in Europe: first results from the Survey of Health, Aging and
Retirement in Europe. Mannheim: Mannheim Research Institute for the Economics of
Aging.
Börsch-Supan A. and H. Jürges (2005), Health, Aging and Retirement in Europe – Methodology,
Mannheim: Mannheim Research Institute for the Economics of Aging.
Buchmueller T.C., and Couffinhal A. (2004), “Private Health Insurance in France”, OECD
Health Working Paper, No 12, OECD, Paris.
Chesher, A. and M. Irish (1987) “Residual analysis in the grouped data and censored normal
linear model”, Journal of Econometrics, vol. 34 (1), pp. 33-62.
Couffinhal A. (2003), “Cost Sharing in France”, Working Paper, CREDES, Paris, August 2003.
Holly A., K. Lamiraud, H. Chevrou-Severac and T. Yalcin (2005), “Out-of-Pocket Payments for
Health Expenditures”, in Börsch-Supan et al. eds. Health, Aging and Retirement in Europe –
First Results from the Survey on Health, Aging and Retirement in Europe, MEA, pp. 126-
132.
Jones A.M., Koolman X., and Van Doorslaer E.C. (2005), “The Impact of Supplementary Private
Health Insurance on the Use of Specialists in Selected European Countries”, European
Community Household Panel (ECPH), August.
Jürges H. (2005), “Cross-Country Differences in General Health”, in Börsch-Supan et al. eds.
Health, Aging and Retirement in Europe – First Results from the Survey on Health, Aging
and Retirement in Europe, MEA, pp. 95-101.
Little, R.J.A. and D. B. Rubin (2002), Statistical Analysis with Missing Data, John Wiley &
Sons, New York, 2nd edition.
Maddala G.S. (1983), Limited-Dependent and Qualitative Variables in Econometrics, Cambridge
University Press, Cambridge
Mossialos E. and S. Thomson (2002), “Voluntary Health Insurance in the European Union”, in
Mossialos E., Dixon A., Figueras J. and Kutzin J. eds. Funding Health Care: Options for
Europe, World Health Organization – European Observatory on Health Care Systems Series,
Open University Press, Buckingham, pp. 128-160.
27
Nomisma-Criep (2003), I fondi sanitari integrativi Quale futuro per la sanità italiana?, Franco
Angeli, Rome.
OECD (2004), Private Health Insurance in OECD Countries, The OECD Health Project, Paris.
OECD (2005), OECD Health Data 2005, Paris.
OECD (2006), OECD Health Data 2006, Paris.
Palumbo, M.J. (1999) “Uncertain Medical Expenses and Precautionary Saving Near the End of
the Life Cycle”, Review of Economic Studies, vol. 66 (April 1999), pp. 395-421.
Rubin D.B. (1987), Multiple Imputations for Nonresponse in Surveys, John Wiley & Sons, New
York.
Van Doorslaer E.C., Masseria C., and the OECD Health Equity Research Group Members
(2004), “Income-related Inequality in the Use of Medical Care in 21 OECD Countries”,
Towards High-Performing Health Systems: Policy Studies from the OECD Health Project,
OECD, Paris.