voluntary xbrl adopters and firm...
TRANSCRIPT
1
Voluntary XBRL Adopters and Firm Characteristics
[For presentation at the 5th
University of Kansas International XBRL Conference]
Srinivasan (Srini) Ragothaman
Professor of Accounting, Beacom School of Business
The University of South Dakota
Vermillion, SD 57069, USA. Tel: (605) 677-6430
[Revised Draft: March 2011]
Please do not quote without prior permission from the author. Comments welcome.
2
Voluntary XBRL Adopters and Firm Characteristics
Abstract
Some of the governance weaknesses stem from the information asymmetry between
insiders and the investing public. One way to mitigate the information asymmetry problem
is to enhance accounting disclosures through XBRL format. In this paper, we analyze
financial characteristics of early-adopters of XBRL. We build a multivariate logistic
regression model to examine the relationship between firm characteristics and voluntary
XBRL adopters. The results indicate that firm size, debt ratio (leverage), plant intensity, PE
ratio (growth), and inventory ratio (complexity) are useful in discriminating voluntary “XBRL
adopters” from non-adopters We also build a multiple regression model and use the
Governance Score developed by Brown and Caylor (2006) to further investigate the
relationship between corporate governance rating and operating performance for voluntary
XBRL adopters. Our results indicate that current ratio (liquidity), firm size, and auditor type
are associated with corporate governance rating for early adopters of XBRL.
Key words: XBRL; interactive reporting; voluntary adoption; logistic regression;
information asymmetry
3
Voluntary XBRL Adopters and Firm Characteristics
1. Introduction:
The United States Securities and Exchange Commission (SEC) introduced a voluntary
XBRL (eXtensible Business Reporting Language) filing program during 2005. In response,
several firms voluntarily chose to report their financial statements to the SEC using the XBRL
format during the next three years. We investigate some of the financial characteristics of these
voluntary adopters of XBRL in this paper. The financial scandals at Enron, WorldCom, Tyco,
Madoff Investment Securities, and others have exposed “corporate governance” weaknesses and
have increased the interest of investors and scholars alike in various governance and accounting
transparency issues. Some of the governance weaknesses stem from the information asymmetry
between insiders and the investing public. One way to mitigate the information asymmetry
problem is to enhance accounting disclosures through the adoption of XBRL format.
Diamond and Verrecchia (1991) argue that if firms increase the level of disclosures, the
level of information asymmetry is decreased. When a firm provides financial reports in a high-
quality, standardized (XBRL) format, that firm is likely to be viewed as less risky. Such a
favorable perception could potentially decrease the cost of capital for that firm and stock price
of that firm could go up. Yoon et al. (2011) examine whether or not XBRL adoption reduces
information asymmetry in the Korean stock market. Using t-tests and multiple regression
analysis in their study, they report a significant reduction of the information asymmetry for large
firms in the Korean stock market. Pinsker and Li (2008) argue that early adopters can signal
transparency through XBRL filings which can get them better access to capital markets which in
turn, can result in lower cost of capital.
4
The “contracting approach" of accounting theory assumes information and contracting
costs to be non-zero and predicts that accounting method choices are determined by the use of
accounting numbers in contracts between capital suppliers, managers, suppliers, and customers.
Contracting costs include transaction costs, agency costs (such as bonding costs, monitoring costs,
and the residual loss from dysfunctional decisions), renegotiation costs, and bankruptcy costs
(Watts and Zimmerman, 1990). Because a market price is absent within the firm, there are systems
for assigning decisions among managers, and measuring, rewarding and punishing managerial
performance. Meckling and Jensen (1986) argue that accounting plays an important role in these
systems and is an integral part of the firm's efficient contracting technology. We emphasize the
contracting perspective of accounting and posit that the XBRL adoption decision is influenced by
information and contracting costs. This study will identify a set of predictor variables of firms
that have voluntarily filed financial statements using the XBRL format. These explanatory
variables are used in the logistic regression model developed in this study and are rooted in prior
research.
Debreceny et al. (2005) suggest that researchers should examine the adoption of
information systems innovations. Early adoption of XBRL is one such innovation that is
examined in this study. Alles et al. (2008) have called for exploiting the comparative advantage
of academic accounting researchers to provide value added research in the XBRL area. Several
researchers including Baldwin et al. (2006), Srivastava (2009), Bovee et al (2002), Plumlee and
Plumlee (2008), Debreceny et al. (2005), Boritz and No (2008) and others have called for
additional investigation of multiple XBRL related issues. What characteristics of a firm are
associated with the XBRL adoption decision? Does company size influence XBRL filing? Does
leverage influence the XBRL decision? Does firm complexity play a role? What is the impact of
5
auditor type on the adoption decision? Does plant (asset) intensity play a role in the adoption
decision? We extend the prior research in the area of voluntary XBRL adoption in three ways.
First, we use explanatory variables derived from multiple theories: agency theory, innovation
diffusion theory, institutional change theory and information and contracting costs theory.
Second, our sample size of XBRL adopters (n= 102) is bigger than some of the earlier studies
(for e.g. Premuroso, R. and S. Bhattacharya (2008) had a sample size of 20 and Efendi et al (2009)
examined 53 XBRL adopters). Third, we use OLS regression to examine the relationship between
corporate governance rating and operating performance for voluntary XBRL adopters. We use
several interesting explanatory variables including Tobin’s Q.
In this paper, we review prior research exploring the relationship between firm
characteristics and the XBRL adoption decision. Empirical results of this research on accounting
and financial characteristics of firms that have adopted XBRL and a group of control firms that
did not adopt XBRL are presented. Explanatory variables used in this study include: debt ratio
(leverage), cash flow to sales ratio, firm size, price earnings ratio, auditor type, inventory to total
assets ratio, audit type, Tobin’s Q and others. Some of the accounting variables used above are
historical and have an inward looking focus. They measure the past successes of various
decisions taken by the board of directors. On the other hand, market based measures mentioned
above (PE ratio, and Tobin’s Q) are forward looking in the sense that they emphasize future
expected earnings of the firm. These measures reflect current plans and strategies of the
management team. Section 2 provides a brief literature review. Section 3 deals with hypothesis
development. The data and methodology are discussed in sections 4. Section 5 describes the
empirical results for both logistic regression and multiple regression models. A conclusion for
the paper is provided in section 6.

6
2. Literature Review:
Koh et al (2010) examined 206 voluntary XBRL filers in South Korea from three
perspectives: external financing, governance structure, and auditing. In 2007, South Korea
developed “K-GAAP Common Taxonomy” for the voluntary filers. The authors conclude that
XBRL adoption in Korea is associated with low accounting performance and higher amounts of
external debt. They also report that clients of Big 4 accounting firms are more likely to adopt
XBRL voluntarily. Koh et al (2010) also conclude that earnings quality of voluntary XBRL
filers is higher than their control firms.
Efendi et al (2009) examine the financial characteristics of 53 voluntary adopters of
XBRL in the US. They conclude that voluntary adopters are larger and more innovative firms in
their respective industries. They also find that report lags have decreased over time and
efficiency in XBRL reporting is increasing. In a study examining UK firms, Camfferman and
Cooke (2002) reported a positive relationship between disclosures and auditor type.
Zheng and Roohani (2010) use a third party ratings (XBRL Cloud Inc.) to examine
XBRL filings. They examine deficiencies in mandatory XBRL filings and firm characteristics
associated with them. They conclude that deficiencies are less severe in 10Q filings and are filed
by bigger and more complex firms. They also report that more complex firms used the XBRL
format voluntarily in earlier years. An interesting (and intuitive) finding in the Zheng and
Roohani (2010) study is XBRL filers are less likely to have major errors, if they have already
filed in the XBRL format several times. However, these firms might still have more minor
errors.
Yoon et al. (2010) examine whether or not XBRL adoption reduces information
asymmetry in the Korean stock market. They measure information asymmetry using a relative
7
bid-ask spread measure. Based on their examination of a sample of 550 firms, they report highly
significant and negative association between XBRL adoption and information asymmetry. They
use four control variables including volatility, firm size, turnover rate, and stock price. Bonson
et al. (2009) conducted a Delphi investigation regarding XBRL adoption. They surveyed a panel
of 29 XBRL experts asking them about potential reasons for voluntary adoption of XBRL
format. The top three reasons identified by the experts are: 1) gaining a deeper knowledge of
XBRL; 2) acquisition of image as a pioneer of technology and 3) to obtain technical advantages
of XBRL.
Premuroso and Bhattacharya (2008) examined a sample of 20 early adopters of XBRL.
They investigated the relationship between governance and operating characteristics and the
adoption decision. The authors conclude that liquidity (current ratio) and firm size are associated
with the decision to voluntarily adopt the XBRL format.
XBRL facilitates the exchange of financial information and accounting data between
software programs. It is based on XML (eXtensible Markup Language). XBRL allows
businesses to report their accounting/financial (and non-financial) data in a standardized format.
Former SEC chairman, Christopher Cox states: “Few understand the SEC’s interest in interactive
data. The real basis of our interest in interactive data is tied to our fundamental mission – to
protect investors. Markets function best when all the information that market participants need is
available to them when they want it, and in a form they can use.”
Taylor and Dzaranin (2010) suggest that XBRL has three key benefits for financial
reporting: accessibility, usability, and comparability. Once a company creates an instance
document and files it with the SEC, the instance document containing financial statements and
XBRL tags becomes accessible to anyone interested. Investors and other can even use Excel to
8
download these instance documents into preferred formats. Since these instance documents and
tagged data are computer-readable, there is no need to transcribe data from a PDF or HTML
document. Usability is considerably enhanced since XBRL eliminates the need to build a
database from scratch (through additional data entry). XBRL taxonomies (classification
schemes or dictionaries) allow for tagging (akin to bar coding) of data in a standardized fashion.
Tagging in a uniform way makes data comparable across companies.
Former SEC chairman, Christopher Cox observed in a speech to the AICPA (on
December 8, 2008): “In the same way that IFRS might someday soon make financial
statements understandable to investors anywhere on earth, the 30 different spoken
languages that will someday soon be embedded in XBRL data tags attached to public
company financial statements could let any investor read an IFRS or U.S. GAAP
financial statement from any country in his or her own native language. Interactive data is
being introduced in nearly every major market around the world. As the use of interactive
data in SEC filings becomes the norm, we can look forward to a streamlined financial
reporting process that provides more timely access to information for investors, financial
analysts, and regulators. XBRL tagging promises easier identification and comparison of
financial data, and will vastly simplify cross-border analysis . . . . . At the SEC, we are
on the threshold of replacing the EDGAR model with a new 21st-century reporting
system that runs on interactive data."
3. Hypothesis Development:
While several studies (Efendi et al 2009, Zheng and Roohani 2010 ) have documented
significant effects for the size variables, others (Wallace et al 1994, Camfferman and Cooke (2002)
for their Netherlands sample, and Alsaeed (2006)) have reported no relationship between size and
disclosure levels. Ettredge et al. (2002) found that voluntary information disclosure on corporate
web sites is associated with firm size. Larger firms are subject to more attention from investors and
financial analysts and hence may increase disclosures. Moreover larger firms have adopted
technologies such as Just in Time (Efendi et al 2009) and Business to Business systems earlier than
smaller firms. Various measures of firm size appear in the literature. Dowell, Hart, and Young
9
(2000) use the logarithm of total assets with mixed results in examining whether corporate global
standards create or destroy market value. Since we use total assets in debt ratio and in inventory
ratio, we follow Yoon et al. (2011) and use the logarithm of market value of equity as the size
measure.
H1: Ceteris paribus, there is a positive relationship between firm size (natural logarithm of
market value of equity) and the decision to adopt XBRL voluntarily.
Complex firms may want to signal to the investors that they are in the forefront of
technology adoption. Firms with high inventory levels in multiple locations may already be
technologically adept and may have already invested in information systems innovations. Zheng
and Roohani (2010) report that more complex firms used the XBRL format voluntarily in earlier
years. Chan et al (1993) find that inventory to total assets ratios proxy for complexity and risk and
are a determinant of audit fees. Chen et al. (2005) found that companies that carry abnormally high
amounts of inventory had abnormally poor stock returns. Stice (1991) found that inventory
intensity is larger for firms where auditors are facing lawsuits. To proxy for firm complexity, we
use inventory to total assets ratio and plant intensity (property, plant and equipment to total assets –
see Roohani 2010) as explanatory variables in the logit model.
H2: Ceteris paribus, there is a positive relationship between inventory intensity (inventory to
total assets ratio) and the decision to adopt XBRL voluntarily.
H3: Ceteris paribus, there is a relationship between plant intensity (inventory to total assets ratio)
and the decision to adopt XBRL voluntarily.
The auditing world is divided into two groups – the Big 4 and the rest. Big 4 auditors are
associated with high quality audits and have experienced audit teams in different industries. All
of the Big 4 accounting firms are members of the XBRL organization. In addition,
10
PricewaterhouseCoopers is one of earliest supporters of XBRL and hence it may not be
surprising if they push their audit clients to adopt the XBRL format for financial reporting. Xiao
et al. (2004) argue that innovation diffusion theory suggests that Big 4 auditors are more likely to
support the diffusion of innovative practices such as XBRL reporting. Xiao et al. (2004) suggest
that normative isomorphism results from actions of professional firms who want to create
homogenous company practices and standards to be followed. Basically the Big 4 can create
best practices of XBRL reporting to be followed by others. Hence, the Big 4 auditors facilitating
the voluntary adoption of XBRL reporting is supported by the institutional change theory. In a
study examining UK firms, Camfferman and Cooke (2002) reported a positive relationship
between disclosures and auditor type. However, Wallace and Nasar (1995) while examining a
sample of Hong Kong firms concluded that there is a negative relationship between disclosure
levels and auditor type. While the results are unclear as to the direction of the relationship, both
studies found a statistically significant relationship between auditor type and disclosure levels.
Following Premuroso and Bhattacharya (2008), we use a binary variable to denote auditor type
and we code a firm as 1, if it has a Big 4 auditor and 0, otherwise.
H4: Ceteris paribus, there is a relationship between a firm’s auditor type (Big 4 or not) and the
decision to adopt XBRL voluntarily.
Jensen and Meckling (1976) posit that firms that have high levels of debt can reduce the
associated monitoring costs by providing comprehensive levels of disclosures. Healy and Palepu
(2001) argue that firms that are planning to issue debt or equity securities have incentives to
provide voluntary disclosures. According to them, managers attempt to reduce information
asymmetry by providing voluntary disclosures and thereby attempt to reduce firm’s cost of
external financing. Companies that are tapping the capital markets for financing face scrutiny by
11
rating agencies. If managers want to maintain credibility with rating agencies, they may want to
send positive signals. If firms have higher levels of debt, they may want to reduce information
asymmetry by providing informative disclosures and thereby hope to reduce their cost of
borrowing. Ahmed and Courtis (1999) performed a meta-analytic study and concluded that
disclosure increases with leverage. Xiao et al. (2004) argue that increased disclosures can reduce
bondholders’ propensity to price-protect themselves against wealth transfers stockholders.
H5: Ceteris paribus, there is a positive relationship between the magnitude of debt ratio and the
decision to adopt XBRL voluntarily.
Another explanatory variable used in this study it the price to earnings ratio. The price
earnings (PE) ratio is measured as the market price of a firm’s common stock divided by the
firm’s income-per-share of common stock. Following Efendi et al (2009), we include PE ratio in
the model to pick up the effect of firm-level growth. Firms with higher growth opportunities are
expected to provide more disclosures.
H6: Ceteris paribus, there is a relationship between a firm’s PE ratio and the decision to adopt
XBRL voluntarily.
H7: Ceteris paribus, there is a between a firm’s intangible assets to total ratio and the decision to
adopt XBRL voluntarily.
Kinney (2000) argues that voluntary disclosures serve as a positive signal about
management’s successful stewardship. Singhvi and Desai (1971) report that firms with higher
profitability provide additional information to satisfy investors. Hence, managers of highly
profitable firms are more likely to voluntarily adopt XBRL, which increases firms’ accounting
transparency. Firms that voluntarily adopt XBRL are expected to be profitable firms. Cash Flow to
Sales ratio is used here to proxy “profitability” and is expected to be higher for the XBRL firms than for

12
control firms. Therefore in regression model II we add an explanatory variable to proxy for profitability
and test an additional hypothesis: Ceteris paribus, there is a positive relationship between the profitability
of a firm and the decision to adopt XBRL voluntarily.
4. Data and methodology:
Voluntary adopters of XBRL format for filing financial statements were identified by visiting the
SEC website on March 29, 2009 - http://viewerprototype1.com/viewer. Data for 102 voluntary adopters of
XBRL (who filed in 2008 using the XBRL format) were collected from COMPUSTAT for the year 2007.
We then generated a matched sample for these voluntary adopters of XBRL, by selecting firms that were
deemed competitors (similar industry risk effects) and of approximately the same size. Data for these 102
control firms for the year 2007 were also obtained from the COMPUSTAT, so that two groups had roughly
the same risk profile. The control firms were matched with direct competitors of XBRL firms as
determined by yahoo finance. This achieves industry match.
The database used in this study consists of ten attributes (obtained from CONPUSTAT) for
each firm. These attributes are: debt ratio, auditor type, market value of equity, plant intensity, cash
flow to sales ratio, Price Earnings ratio, Tobin’s Q, inventory to total assets ratio, intangible assets to
total assets ratio, and return on assets. Support for using these specific variables is found in earlier
research described in the literature review section.
Univariate tests may not produce robust results, when independent variables are correlated.
Using the independent variables in a multivariate context, however, allows one to examine their
relative explanatory power and can lead to better predictions since the information contained in the
cross-correlations among variables is utilized. A primary objective of many multivariate statistical
techniques is to classify entries correctly into mutually exclusive groups. Multiple discriminant
analysis, PROBIT, and LOGIT represent such multivariate models.
13
In this study, the following logistic regression (LOGIT) model is proposed:
Pr(Y=1|X) = F (0 + 1 x1 + 2 x2 +.....+ K xK )
The dependent variable Y is a dichotomous (0, 1) variable representing the two groups,
voluntary XBRL adopters (Y=1) and control (Y=0) firms. The independent variables X1 , X2 , ....
XK include firms size, auditor type (Big 4 or not), debt ratio, price earnings ratio, and inventory to
total assets ratio, plant intensity (complexity) and intangible assets to total assets ratio.
Specifically these explanatory variables are:
LnMktVal = natural logarithm of market value of equity
InventTA = Inventory / total assets
Auditor = auditor type: 1= Big 4 firm, 0=others
PlantInt = property, plant & equipment / total assets
Debt Ratio = total debt / total assets
P/E ratio = Price Earnings ratio;
IntanTa = Intangibles / total assets
It is assumed that no exact linear dependencies exist among X's across k, and that the
relationship between Y's and X's are non-linear or logistic (i.e., P(Y =1|X ) = exp(K XK) / [1 +
exp(K XK)].) The null hypotheses would be: H0 : k = 0, where k = 1,...7;
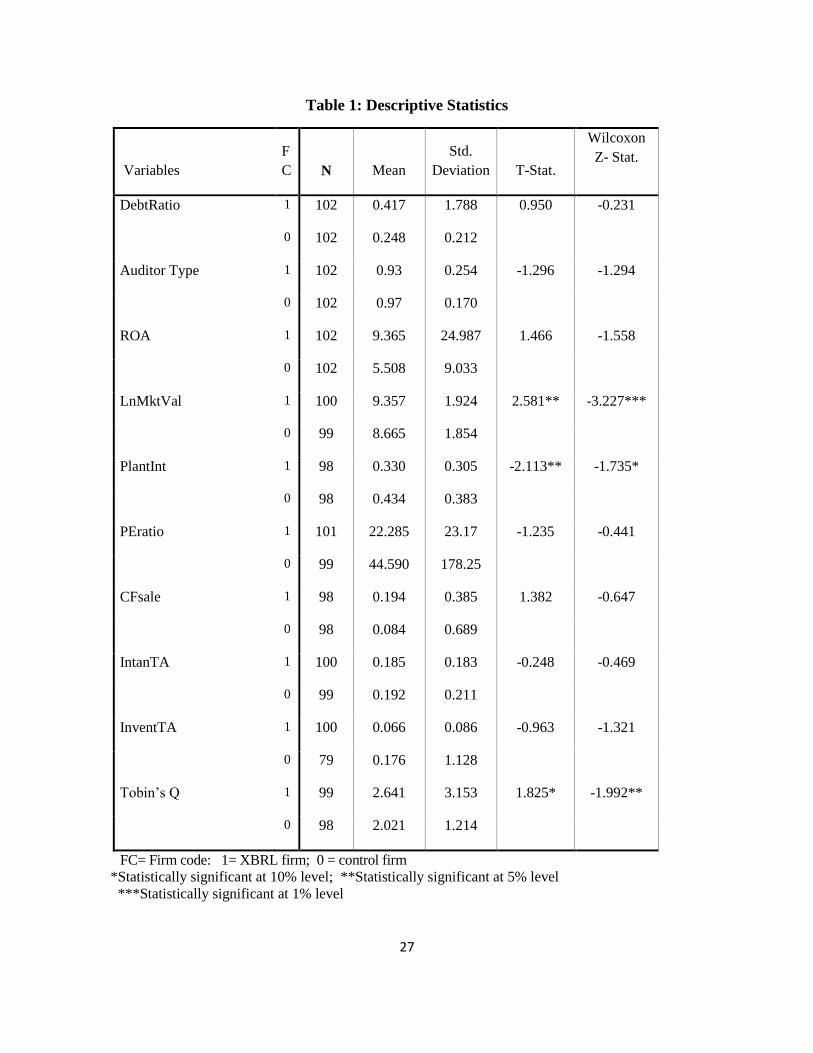
We provide a summary of descriptive statistics in Table 1. The debt ratio averaged 0.417
for XBRL adopters and 0.248 percent for their non-adopting peers. 93 percent of XBRL firms
were audited by a Big 4 firm while 97 percent of the control firms were audited by a Big 4 firm.
The mean for natural logarithm of the market value of equity (size measure) is 9.36 for XBRL
adopters and 8.67 for their control firms. The return on assets measure had a mean of 9.316
percent for XBRL firms and a mean of 5.51 percent for control firms. The inventory to total
assets ratio has a mean of 6.6 percent for XBRL firms and a mean of 17.6 percent for their peers.
14
The cash flow to sales ratio has a mean of 0.194 for XBRL firms and a mean of 0.084 for control
firms. The PE ratio averaged 22.28 for XBRL adopters and 44.59 for their non-adopting peers.
The Tobin’s Q measure has a mean of 2.64 for XBRL firms and a mean of 2.02 for control firms.
The t-test results indicate that firm size, plant intensity and Tobin’s Q were statistically
significantly different between the two groups. Non-parametric Wilcoxon Z test also found that
firm size, plant intensity and Tobin’s Q were statistically different between the two groups.
[Insert Table 1 here]
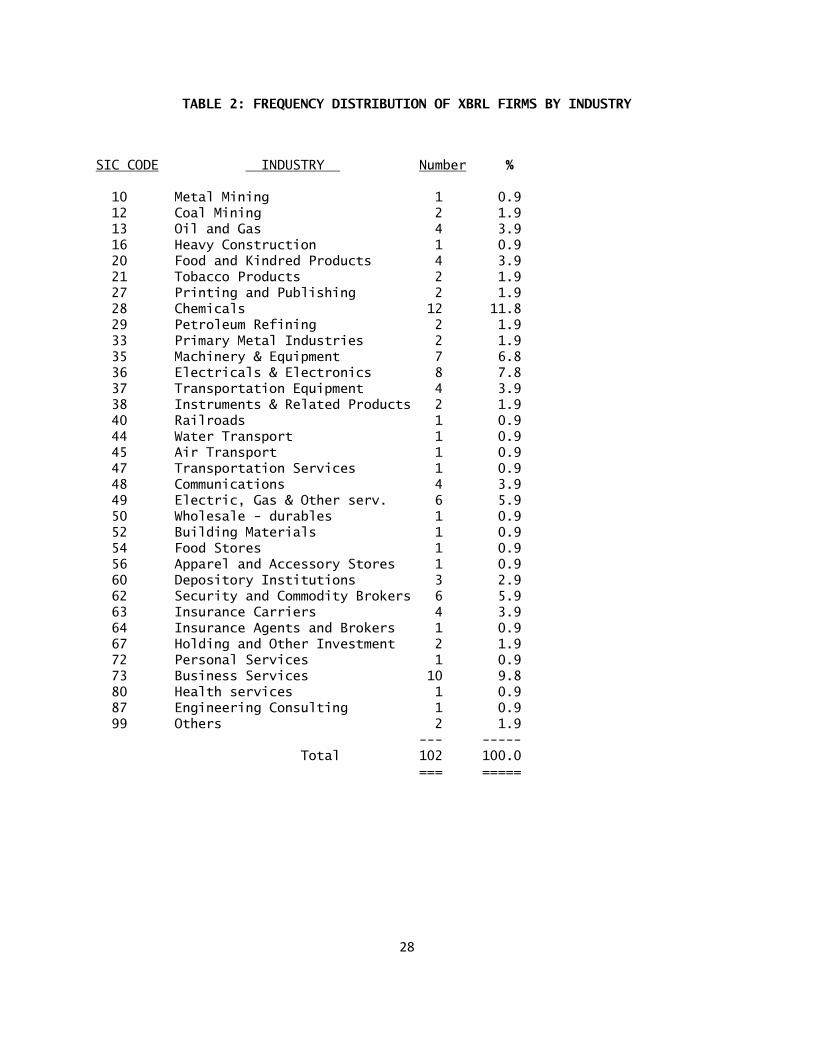
Table 2 provides industry break-down for XBRL firms. The XBRL group contains 102
firms from 34 SIC two-digit industries. In our sample, chemical companies made most XBRL
disclosures accounting for 11.8 percent of the sample. Firms in the business services industry are
the second largest XBRL adopters at 9.8 percent of the sample. This industry includes companies
that develop XBRL software and as such it is not surprising that they are also early adopters of
XBRL. Financial institutions (Depository institutions and security brokers) account for 8.8 percent
of the sample. FDIC already requires several reports from these companies. Firms in the electrical
and electronic industry (7.8 percent) and machinery and equipment industry (6.8 percent) also are
voluntary adopters of XBRL. These industries were closely followed by electric & gas, oil and
gas, and communications. The non-XBRL group has very similar industry distribution.
[Insert Table 2 here]
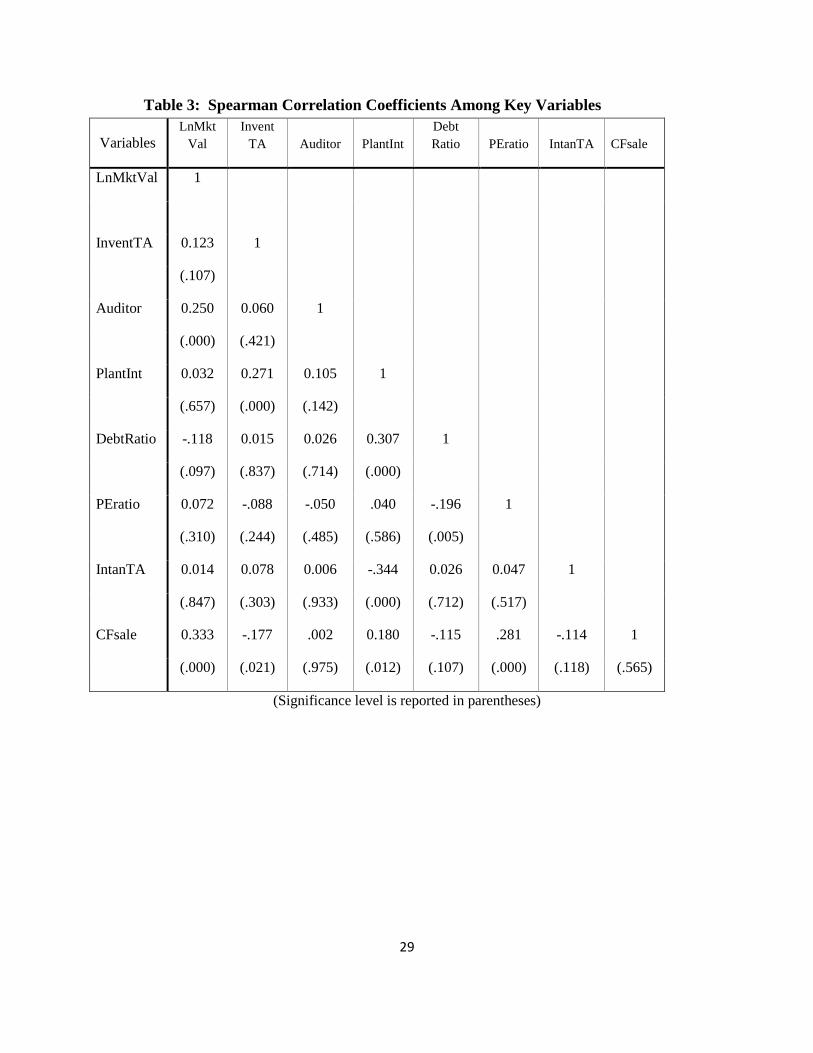
The correlation coefficients are reported in Table 3. The correlation analysis results
indicate that auditor type is strongly related to firm size. Firm size and cash flow to sales ratio are
positively correlated. The higher the profitability (CFsale), the higher is PE ratio. Debt ratio and
PE ratio are negatively related. Profitability and inventory to total assets ratio are also negatively
15
related. Plant intensity and inventory ratio are positively related. Multicollinearity among
independent variables may be present in the data and can potentially lead to unstable regression
coefficients. A rule of thumb is suggested by Judge et al (1985) to assess the impact of
multicollinearity. They argue that a serious multicollinearity problem arises only when correlations
among the explanatory variables are higher than 0.8 or 0.9. In our sample, the highest correlation is
between cash flow to sales ratio and firm size at 0.333. Hence, the degree of collinearity present
among independent variables does not appear to degrade estimation results in any serious way. We
also perform some further collinearity diagnostic tests and their results are discussed in the results
section.
[Insert Table 3 here]
5.1 Results and discussion:
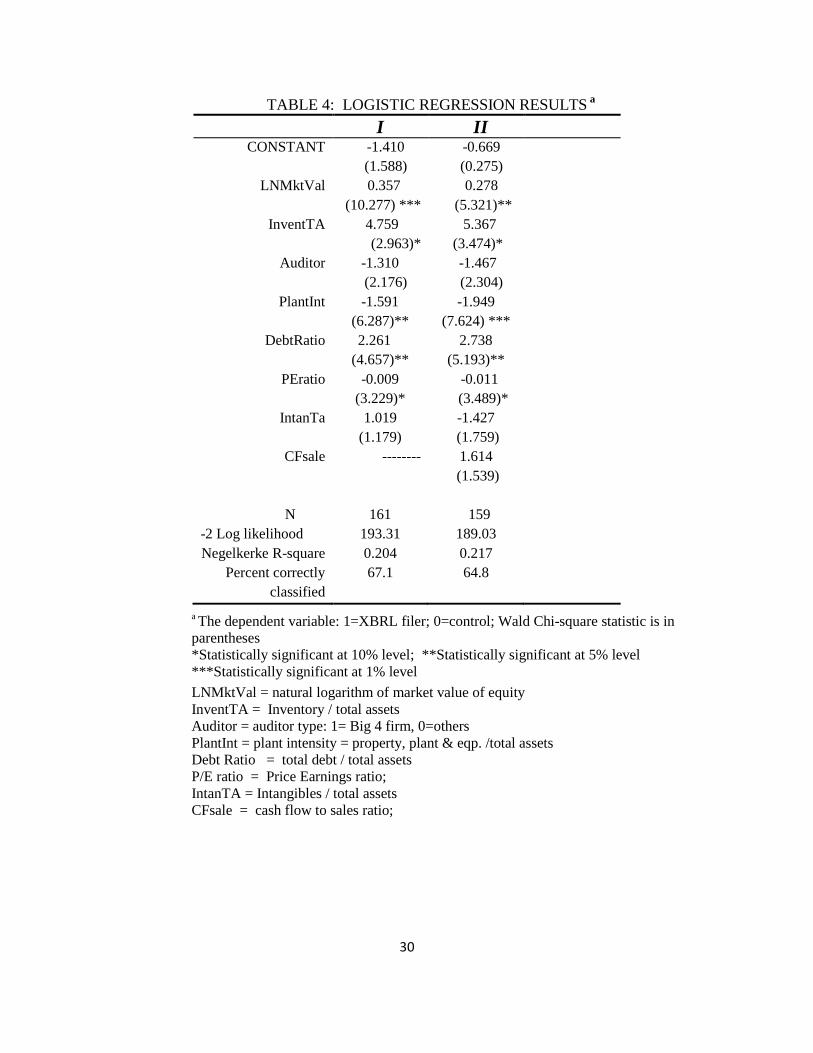
Logistic regression results are reported in Table 4 (column I). When the logistic regression
analysis was performed the sample size shrank from 204 to 161, mainly due to missing data for
inventory. Hypothesis 1 suggests that there is a positive relationship between firm size and the
decision to adopt XBRL voluntarily. The coefficient estimate for firm size is 0.357 and is
statistically significant at the 1 percent level. This suggests that size is different between the two
groups and confirms previous findings by Efendi et al (2009) and Premuroso and Bhattacharya
(2008).
Hypothesis 2 suggests that there is a positive relationship between inventory intensity
(inventory to total assets ratio) and the decision to adopt XBRL voluntarily. The coefficient
estimate for inventory to total assets ratio is 4.759 and is statistically significant at the 10 percent
level. This suggests that the inventory intensity is (weakly) significantly different between the two
16
groups. This is an interesting finding of this study. This confirms earlier findings by several
accounting researchers in other accounting studies. For example, Chan et al (1993) find that
inventory to total assets ratios proxy for complexity and risk and are a determinant of audit fees.
Chen et al. (2005) found that companies that carry abnormally high amounts of inventory had
abnormally poor stock returns. Hypothesis 3 suggests that there is a relationship between the plant
intensity ratio and the decision to adopt XBRL voluntarily. The coefficient estimate for property,
plant & equipment to total assets ratio is -1.591 and is statistically significant at the 5 percent level.
This finding is consistent with the results reported by Roohani (2010).
[Insert Table 4 here]
Hypothesis 4 suggests that there is a relationship between a firm’s auditor type (Big 4 or
not) and the decision to adopt XBRL early. The coefficient estimate for auditor type variable is
-1.310 and is not statistically significant. While this result is somewhat surprising, it is not entirely
unexpected. Results for this variable in prior studies are clearly mixed. Premuroso and Bhattacharya
(2008) report that the Big 4 audit firm variable in their study was negative and insignificant. On the other
hand, Camfferman and Cooke (2002) report a positive and significant estimate for the Big 6 auditor
variable in their study. However, it should be noted that their sample came from UK firms.
Hypothesis 5 suggests that there is a positive relationship between the magnitude of debt
ratio and the decision to adopt XBRL voluntarily. The coefficient estimate for debt ratio is 2.261
and is statistically significant at conventional levels. This suggests that leverage is different
between the two groups. XBRL adopters had larger debt ratios than the control group. The positive
relationship for the debt ratio is consistent with the results reported by Premuroso and Bhattacharya
(2008).
17
Hypothesis 6 suggests that there is a relationship between a firm’s PE ratio and the
decision to adopt XBRL early. The coefficient estimate for PE ratio is -0.009 and is statistically
significant only at the 0.10 level. This suggests that the PE ratio is different between the two groups
only marginally. However, the coefficient estimate had a negative sign. Early adopters of XBRL
had lower PE ratios, on average, than the control group. Hypothesis 7 is not supported and the
intangible assets to total assets ratio is not different between the two groups.
We performed a robustness test by adding an additional explanatory variable in logistic
regression model II: cash flow to sales ratio which is a proxy for profitability. The robustness test
results are reported in Table 4 – column II. The model I results are confirmed by model II and the
same variables as in model I are statistically significant for the most part. The added hypothesis
suggests that there is a positive relationship between the profitability of a firm and the decision to
adopt XBRL early. The coefficient estimate for the cash flow to sales ratio is 1.641 and is
statistically not significant at the 0.05 level. This suggests cash flow to sales ratios are not different
between XBRL filers and non-filers. Even though early adopters of XBRL had higher profitability
ratios, on average, than the control group, the difference is not statistically significant.
5.2 Governance Score and early XBRL adoption:
We also build a multiple regression model and use the Governance Score developed by Brown
and Caylor (2006) to further investigate the relationship between corporate governance rating and
operating performance for voluntary XBRL adopters. An ordinary least-squares regression model
was developed to investigate the relationship between Governance score and firm size, PE ratio
(growth), current ratio (liquidity), auditor type, Tobin’s Q, and return on assets (profitability).
Regression methodology permits the testing of null hypotheses simultaneously. Following
18
Hirschey and Connolly (2003), the following formula is used to estimate Tobin’s q: Tobin’s q =
[Total assets + market value of equity – book value of equity] / Total assets. Tobin’s q was also
computed from the data obtained from the COMPUSTAT data base. Governance score was the
dependent variable and the six explanatory variables mentioned earlier were used as independent
variables. According to Brown and Caylor (2006): “Governance Score is a composite measure of
51 factors encompassing eight corporate governance categories: audit, board of directors,
charter/bylaws, director education, executive and director compensation, ownership, progressive
practices, and state of incorporation.” Accounting based indices serve as an indicator of how
firm earnings respond to managerial policies (Orlitzky et al., 2003). Manufacturing
organizations are asset-intensive; as a result, return on assets (ROA), defined as net income
divided by total assets, is an effective indicator of firm profitability. To an investor ROA is an
effective way to estimate the profit an organization may generate for each $1 of assets. Cochran
and Wood (1984) indicate that ROA capture a firm’s internal efficiency. Preston and O’Bannon
(1997), using a survey methodology, found a positive relationship between corporate social
disclosures and ROA. Return on assets (ROA), is used as a measure of firm-level profitability.
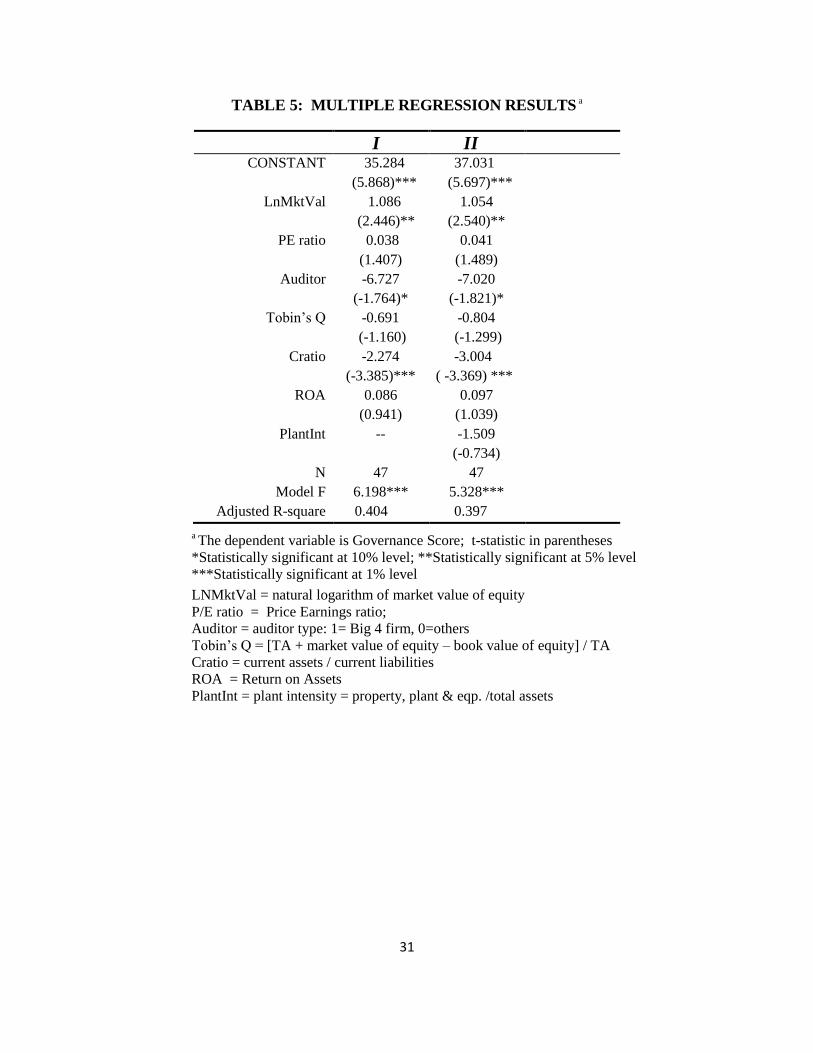
The regression coefficients, t-statistics, and significance levels for the two regression
models for early adopters of XBRL are reported in Table 5 - columns I, and II. The multiple
regression models have a respectable adjusted R-square of 39.7 to 40.4 percent. Because
multicollinearity may be present in the data, diagnostic measures of collinearity are obtained.
Collinearity diagnostics are based on procedures recommended by Belsley et al. (1980) who
suggest that condition indexes in excess of 30 indicate moderate to strong dependencies. There
is one large condition index observed in the regression which is 32.17 and another moderate
index at 16.82 (which is less than 30). The other 5 condition indices are less than 6.9.
19
The multiple regression model used in this study is:
Governance score = f {firm size, PE ratio, auditor type, Tobin’s Q, current ratio and
profitability}
The research questions are transformed into null hypotheses as given below:
H1: Firm size has no significant effect on Governance score
H2: PE ratio has no significant effect on Governance score
H3: Auditor type has no significant effect on Governance score
H4: Tobin’s Q has no significant effect on Governance score
H5: Liquidity as measured by current ratio has no significant effect on Governance score
H6: Profitability as measured by return on assets has no significant effect on Governance score
We discuss the statistically significant independent variables (rejected null hypotheses) first
and the rest of the variables next. The regression results (in column I of table 5) indicate that the
firm size is statistically significant (t=2.446) at the 5 percent level and is positively related to
governance score. Thus, the null hypothesis H1 (firm size has no significant effect on
Governance score) can be rejected. This is along the expected lines since larger companies tend to
have effective boards and good auditor oversight. This confirms the results of Premuroso and
Bhattacharya (2008) study that found firm size to be positively and significantly associated with
governance score.
Current ratio is a commonly used measure of liquidity. The regression results (reported in
column I of table 4) indicate that current ratio is negatively related to the governance score (t-
statistic = -3.385) and is significant at the 0.01 level. Thus, the null hypothesis H5 (liquidity has
no significant impact on governance score) can be rejected. The negative coefficient is similar to
the results reported by Camfferman and Cooke (2002) for current ratio in a study examining UK
20
firms. The auditor type variable has a coefficient of -6.727 and a t-statistic of -1.764 and is
statistically significant at the 10 percent level. The negative coefficient is unexpected and is
inconsistent with a directional finding of Camfferman and Cooke (2002). Camfferman and
Cooke (2002) report a significant and positive relationship between auditor type (Big 6 auditor in
UK) and firm-level disclosures. The other three explanatory variables - PE ratio, Tobin’s Q and
return on assets were not statistically significant and hence null hypotheses 2, 4 and 6 are not
rejected.
An additional hypothesis is tested in regression model II in Table 5. The seventh
hypothesis in the null form is: Plant intensity as measured by property, plant & equipment to
total assets has no significant effect on Governance score. The results as reported in column II of
table 4 indicate that plant intensity is not statistically significant. However, firm size, current
ratio and auditor type are still statistically significant as in regression model I.
6. CONCLUSION
In this paper, we explored the relationship between early adopters of XBRL and some key
financial and accounting variables. Some of the governance weaknesses stem from the
information asymmetry between insiders and the investing public. One way to mitigate the
information asymmetry problem is to enhance accounting disclosures through the adoption of
XBRL format. We addressed some of the limitations of prior studies, by using more holistic
measures of governance (governance score) and allowing for non-linear relationships between
XBRL adoption and financial performance. We built a non-linear, multivariate logistic regression
model to examine the relationship between firm characteristics and voluntary XBRL adoption.
Our independent variables are also multi-dimensional. Our results provide support to some prior
21
studies. The results indicate that firm size, debt ratio (leverage), plant (asset) intensity, PE ratio
(growth), and inventory ratio (complexity) are useful in discriminating voluntary “XBRL adopters”
from non-adopters We also build a multiple regression model and use the Governance Score
developed by Brown and Caylor (2006) to further investigate the relationship between corporate
governance rating and operating performance for voluntary XBRL adopters. Our results indicate
that current ratio (liquidity), firm size, and auditor type are associated with corporate governance
rating for early adopters of XBRL.
Our study also confirms various positive theory hypotheses developed by Watts and
Zimmerman (1990), such as the size hypothesis and the debt hypothesis. Since the sample size
used in this study is somewhat small (even though larger than earlier studies), great care should be
exercised while generalizing the results of this study. We used the Governance Score developed by
Brown and Caylor (2006) in our regression study and it may not have sufficiently captured the
depth of governance ratings. Corporate governance and firm performance are jointly determined by
partially unobservable variables. Also corporate governance adjusts to firm performance in prior
years. Just like several other corporate governance studies (Brown and Caylor, 2006), this paper
also suffers from the endogeneity problem.
Here are some ideas for future XBRL research projects. Since the SEC has recently mandated
that all public companies must submit their filings in the XBRL format (SEC 2009), it would be
interesting to examine the differences in operating and financial characteristics of early adopters vis-
à-vis later (forced) adopters. Researchers could also investigate the problems associated with the
mandated use of XBRL disclosures. For example, there are reports that mandatory XBRL filings
contain large amount of errors (Debreceny et al. 2010). The nature and causes of these errors could
22
be investigated. New research could be performed to examine the research question about
information asymmetry using data from US companies – do XBRL reports reduce information
asymmetry in the US? It would be nice to examine the characteristics of companies that voluntarily
report sustainability information using the XBRL format.
Since certain financial variables are significant in discriminating voluntary adopters of XBRL
from the control group, useful evidence is being provided to investors, regulators, and auditors in
addition to confirming the predictions of agency theory and positive accounting theory in the
accounting literature. Given the extraordinary interest of the accounting profession and regulatory
bodies in XBRL, these findings would be of some interest to rule-making bodies such as the SEC,
the PCAOB, the IASB, and the FASB.
23
References
Ahmed, K. & Courtis, J. K. (1999) Associations between corporate characteristics and
disclosure levels in annual reports: a meta-analysis. The British Accounting Review,
31 (1), 35-61
Alles, M., A. Kogan and M. Vasarhelyi. 2008. Exploiting Comparative Advantage: A Paradigm
for Value Added Research in Accounting. International Journal of Accounting Information
Systems. 9:202-215.
Alsaeed K. 2005. The association between firm-specific characteristics and disclosure: the case
of Saudi Arabia. Journal of American Academy of Business 2005;7(1):310–21.
Baldwin, A., C. Brown, and B. Trinkle. 2006. XBRL: An Impacts Framework and Research
Challenge. Journal of Emerging Technologies in Accounting, v. 3, 97-116.
Bonson, E., V. Cortijo, and T. Escobar. 2009. A Delphi Investigation to Explain the Voluntary
Adoption of XBRL. The International Journal of Digital Accounting Research. 9: 193-205.
Boritz, J. E. and No, W. G. 2008. SEC’s XBRL Voluntary Program on EDGAR: The Case of
Quality Assurance. Working paper, University of Waterloo.
Bovee, M., M. Ettredge, R. Srivastava, and M. Vasarhelyi. 2001. Assessing the 07/31/2000
XBRL Taxonomy for Digital Financial Reports of Commercial and Industrial Firms. Working
paper, University of Kansas.
Belsley, D.A., Kuh, E., and Welsch, R.E., 1980. Regression Diagnostics: Identifying Influential
Data and Sources of Collinearity (New York: Wiley, 1980).
Brown, L. and M. Caylor 2006. Corporate Governance and Firm Performance. Journal of
Accounting and Public Policy. Available at SSRN: http://ssrn.com/abstract=754484
Callaghan, J. and R. Nehmer. 2009. Financial and Governance Characteristics of Voluntary
XBRL Adopters in the United States. International Journal of Disclosure and
Governance, 6(4), 321-335.
Camfferman K, and Cooke T. 2002. An analysis of disclosure in annual reports of U.K. and
Dutch companies. Journal of International Accounting. 2002;1:28.
Chan K, L. Chan, N. Jagadeesh and J. Lakonishok. 2001. Earnings Quality and Stock Returns:
the evidence from accruals. Working paper. University of Illinois.
Chen, H., M. Frank, and O. Wu. 2005. What Actually happened to the Inventories of American
Companies between 1981 and 2000? Management Science
24
Choi, S., and D. Jeter. 1992. The Effects of Qualified Audit Opinions on Earnings Response
Coefficients. Journal of Accounting and Economics (June- September): 229-247.
Cochran, P.L. & Wood, R.A. (1984). Corporate social responsibility and financial performance.
Academy of Management Journal, 27(1), 42-56.
Debreceny, R., A. Chandra, J. J. Cheh, D Guitheus-Amrhein, N. J. Hannon, P. D. Hutchison, D.
Janvrin, R. A. Jones, B. Lamberton, A. Lymer, M. Mascha, R. Nehmer, S. Roohani, R. P.
Srivastava, S. Trabelsi, T. Tribunealla, G. Trites, M. A. Vasarhelyi. 2005. Financial Reporting in
XBRL on the SEC’s EDGAR System: A Critique and Evaluation. Journal of Information
Systems 19, 191-210.
Debreceny, R., S. Farewell, M. Piechocki, C. Felden and A. Gräning 2010. Does it add up?
Early evidence on the data quality of XBRL filings to the SEC. Journal of Accounting and
Public Policy, 29: 296-306.
Diamond DW, Verrecchia RE. 1991. Disclosure, Liquidity, and the Cost of Capital. The Journal
of Finance 46 (4): 1325-1359.
Dowell, G., Hart, S. & Yeung, B. (2000). Do Corporate Global Environmental Standards Create
or Destroy Market Value? Management Science, 46(8) 1059-1074.
Efendi, J., M. Smith, and J. Wong. 2009. “Longitudinal Analysis of Voluntary Adoption of
XBRL on Financial Reporting” Working paper, Texas A&M University.
Eng, L., and Mak, Y. 2003. Corporate governance and voluntary disclosure. Journal of
Accounting and Public Policy 22, 325-345.
Ettredge, M., Richardson, V. and Scholz, S. (2002) Dissemination of information for investors at
corporate Web sites. Journal of Accounting and Public Policy, 21: 357-369.
Healy, P.M. and K. Palepu, 1990, Effectiveness of accounting-based dividend covenants,
Journal of Accounting and Economics 12, 97-123.
Hirschey, M. and R. A. Connolly (2003), “Firm Size and the Effect of R&D on Tobin’s q,”
R & D Management, 35(2), 217-223.
Hodge, F., R. Martin, and J. Pratt. (2004), “The Effect of Audit Qualifications on Investor
Assessments of Financial Performance when Management Reports Conservatively in Periods of
Strong Financial Performance,” Working paper, Indiana University.
25
Jensen M, and Meckling W. 1976. Theory of the firm: managerial behavior, agency costs and
ownership structure. Journal of Financial Economics 3:305–60.
Judge, G., W.E. Griffiths, R.C. Hill, H. Lutkepohl, and T. Lee, The Theory and Practice of
Econometrics (New York, NY: Wiley, 1985).
Kinney Jr., W.R. 2000. Research opportunities in internal control quality and quality assurance.
Auditing: International Symposium on Auditing Research. 83-90.
Koh, Y., H. Lee and C. Ra. 2010. Determinants of Voluntary Adoption of XBRL and Earnings
Quality. Working Paper. Yonsei University.
Lang M, Lundholm R. 1993. Cross-sectional determinants of analyst ratings of corporate
disclosure. Journal of Accounting Research. 306–60 (autumn)
Li, C., F. Song, and S. Wong. (2005), “Audit Firm Size Effects in China’s Emerging Audit
Market,” Working paper, University of Hong Kong.
Meckling, W. and M. Jensen, 1986, Knowledge, control and organization structure, Working
paper (University of Rochester, Rochester, NY).
Miller, R. 2008, XBRL – The Benefits are Clear, but Challenges Remain. Accounting Today,
September, 24-26.
Naser K, and Nusuerbeh R. 2003. Quality of financial reporting: evidence from listed Saudi non-
financial companies. International Journal of Accounting 38:41–69.
Orlitzky, M., Schmidt, F., & Rynes, S. 2003. Corporate social and financial performance: A
meta-analysis. Organization Studies, 24 (3), 403-441.
Pinsker, R., and S. Li 2008. Costs and benefits of XBRL adoption: early evidence.
Communications of the ACM, v. 51, no. 3, 47-50.
Plumlee, D. and M. Plumlee. 2008. Assurance on XBRL for Financial Reporting. Accounting
Horizons, v.22, no. 3, 353-368.
Premuroso, R. and S. Bhattacharya. 2008. Do Early and Voluntary Filers of Financial
Information in XBRL Format Signal Superior Corporate Governance and Operating
Performance? International Journal of Accounting Information Systems, v. 9, no.1, 1-20.
Preston, L.E., and O'Bannon, D.P. (1997). The corporate social-financial performance
relationship: a typology and analysis. Business and Society, 36 (4), 419-29.
26
SEC (Securities and Exchange Commission). 2004. XBRL Voluntary Financial Reporting
Program On The Edgar System. Release Nos. 33-8496, 34-50453, 35-27894, 39-2498, IC-26622;
File Number S7-35-04.
SEC (Securities and Exchange Commission). 2008. Progress Report of the SEC Advisory
Committee on Improvements to Financial Reporting. Release Nos. 33-8896; 34-57331; File No.
65-24.
SEC (U.S. Securities and Exchange Commission). The Investor’s Advocate: How the SEC
Protects Investors, Maintains Market Integrity, and Facilitates Capital Formation. 2009,
http://www.sec.gov/about/whatwedo.shtml.
Singhvi S, and Desai HB. 1971. An empirical analysis of the quality of corporate financial
disclosure. The Accounting Review 46:621–32.
Srivastava, R.P. 2009. XBRL: A Research Perspective. Indian Accounting Review 13: 14-32.
Taylor, A and E. Dzaranin 2010. Interactive Financial Reporting: An Introduction to eXtensible
Business Reporting Language (XBRL). Issues in Accounting Education. Vol. 25:1: pp.71-93.
Wallace RSO, and Naser K. 1995. Firm specific determinants of the comprehensiveness of
mandatory disclosure in the corporate annual reports of firms listed on the stock exchange of
Hong Kong. Journal of Accounting and Public Policy 14:311–68.
Watts, R.L. and J.L. Zimmerman, 1990, Positive accounting theory: A ten year perspective, The
Accounting Review 65, 131-156.
Xiao, J. Z., Yang, H. & Chow, C. W. (2004) The determinants and characteristics of voluntary
Internet-based disclosures by listed Chinese companies. Journal of Accounting & Public Policy,
23 (3), 191-225
Yoon, H., H. Zo, and A. Siganek. 2011. Does XBRL adoption reduce information Asymmetry?
Journal of Business Research. V64: 157-163.
Zheng, X. and S. Roohani 2010. Determinants of the deficiency of XBRL mandatory filings
Working paper, Bryant University.
27
Table 1: Descriptive Statistics
Variables
F
C N Mean
Std.
Deviation
T-Stat.
Wilcoxon
Z- Stat.
DebtRatio 1 102 0.417 1.788 0.950 -0.231
0 102 0.248 0.212
Auditor Type 1 102 0.93 0.254 -1.296 -1.294
0 102 0.97 0.170
ROA 1 102 9.365 24.987 1.466 -1.558
0 102 5.508 9.033
LnMktVal 1 100 9.357 1.924 2.581** -3.227***
0 99 8.665 1.854
PlantInt 1 98 0.330 0.305 -2.113** -1.735*
0 98 0.434 0.383
PEratio 1 101 22.285 23.17 -1.235 -0.441
0 99 44.590 178.25
CFsale 1 98 0.194 0.385 1.382 -0.647
0 98 0.084 0.689
IntanTA 1 100 0.185 0.183 -0.248 -0.469
0 99 0.192 0.211
InventTA 1 100 0.066 0.086 -0.963 -1.321
0 79 0.176 1.128
Tobin’s Q 1 99 2.641 3.153 1.825* -1.992**
0 98 2.021 1.214
FC= Firm code: 1= XBRL firm; 0 = control firm
*Statistically significant at 10% level; **Statistically significant at 5% level
***Statistically significant at 1% level
28
TABLE 2: FREQUENCY DISTRIBUTION OF XBRL FIRMS BY INDUSTRY
SIC CODE INDUSTRY Number % 10 Metal Mining 1 0.9 12 Coal Mining 2 1.9 13 Oil and Gas 4 3.9 16 Heavy Construction 1 0.9 20 Food and Kindred Products 4 3.9 21 Tobacco Products 2 1.9 27 Printing and Publishing 2 1.9 28 Chemicals 12 11.8 29 Petroleum Refining 2 1.9 33 Primary Metal Industries 2 1.9 35 Machinery & Equipment 7 6.8 36 Electricals & Electronics 8 7.8 37 Transportation Equipment 4 3.9 38 Instruments & Related Products 2 1.9 40 Railroads 1 0.9 44 Water Transport 1 0.9 45 Air Transport 1 0.9 47 Transportation Services 1 0.9 48 Communications 4 3.9 49 Electric, Gas & Other serv. 6 5.9 50 Wholesale - durables 1 0.9 52 Building Materials 1 0.9 54 Food Stores 1 0.9 56 Apparel and Accessory Stores 1 0.9 60 Depository Institutions 3 2.9 62 Security and Commodity Brokers 6 5.9 63 Insurance Carriers 4 3.9 64 Insurance Agents and Brokers 1 0.9 67 Holding and Other Investment 2 1.9 72 Personal Services 1 0.9 73 Business Services 10 9.8 80 Health services 1 0.9 87 Engineering Consulting 1 0.9 99 Others 2 1.9 --- ----- Total 102 100.0 === =====
29
Table 3: Spearman Correlation Coefficients Among Key Variables
Variables
LnMkt
Val
Invent
TA Auditor PlantInt
Debt
Ratio PEratio IntanTA
CFsale
LnMktVal 1
InventTA 0.123 1
(.107)
Auditor 0.250 0.060 1
(.000) (.421)
PlantInt 0.032 0.271 0.105 1
(.657) (.000) (.142)
DebtRatio -.118 0.015 0.026 0.307 1
(.097) (.837) (.714) (.000)
PEratio 0.072 -.088 -.050 .040 -.196 1
(.310) (.244) (.485) (.586) (.005)
IntanTA 0.014 0.078 0.006 -.344 0.026 0.047 1
(.847) (.303) (.933) (.000) (.712) (.517)
CFsale 0.333 -.177 .002 0.180 -.115 .281 -.114 1
(.000) (.021) (.975) (.012) (.107) (.000) (.118) (.565)
(Significance level is reported in parentheses)
30
TABLE 4: LOGISTIC REGRESSION RESULTS a
I II CONSTANT -1.410
(1.588)
-0.669
(0.275)
LNMktVal 0.357
(10.277) ***
0.278
(5.321)**
InventTA 4.759
(2.963)*
5.367
(3.474)*
Auditor -1.310
(2.176)
-1.467
(2.304)
PlantInt -1.591
(6.287)**
-1.949
(7.624) ***
DebtRatio 2.261
(4.657)**
2.738
(5.193)**
PEratio -0.009
(3.229)*
-0.011
(3.489)*
IntanTa 1.019
(1.179)
-1.427
(1.759)
CFsale -------- 1.614
(1.539)
N
-2 Log likelihood
161
193.31
159
189.03
Negelkerke R-square 0.204 0.217
Percent correctly
classified
67.1 64.8
a The dependent variable: 1=XBRL filer; 0=control; Wald Chi-square statistic is in
parentheses
*Statistically significant at 10% level; **Statistically significant at 5% level
***Statistically significant at 1% level
LNMktVal = natural logarithm of market value of equity
InventTA = Inventory / total assets
Auditor = auditor type: 1= Big 4 firm, 0=others
PlantInt = plant intensity = property, plant & eqp. /total assets
Debt Ratio = total debt / total assets
P/E ratio = Price Earnings ratio;
IntanTA = Intangibles / total assets
CFsale = cash flow to sales ratio;
31
TABLE 5: MULTIPLE REGRESSION RESULTS a
I II CONSTANT 35.284
(5.868)***
37.031
(5.697)***
LnMktVal 1.086
(2.446)**
1.054
(2.540)**
PE ratio 0.038
(1.407)
0.041
(1.489)
Auditor -6.727
(-1.764)*
-7.020
(-1.821)*
Tobin’s Q -0.691
(-1.160)
-0.804
(-1.299)
Cratio -2.274
(-3.385)***
-3.004
( -3.369) ***
ROA 0.086
(0.941)
0.097
(1.039)
PlantInt -- -1.509
(-0.734)
N 47 47
Model F
Adjusted R-square
6.198***
0.404
5.328***
0.397
a The dependent variable is Governance Score; t-statistic in parentheses
*Statistically significant at 10% level; **Statistically significant at 5% level
***Statistically significant at 1% level
LNMktVal = natural logarithm of market value of equity
P/E ratio = Price Earnings ratio;
Auditor = auditor type: 1= Big 4 firm, 0=others
Tobin’s Q = [TA + market value of equity – book value of equity] / TA
Cratio = current assets / current liabilities
ROA = Return on Assets
PlantInt = plant intensity = property, plant & eqp. /total assets