vonage first quarter 2020 earnings presentation
TRANSCRIPT

May 7, 2020
First Quarter 2020 Earnings Presentation

Safe HarborCaution Concerning Forward-Looking StatementsVarious remarks that the Company makes contain forward-looking statements regarding acquisitions, acquisition integration, growth, growth priorities or plans, new products and related investment, revenues, adjusted EBITDA, churn, seats, lines or accounts, average revenues per customer, cost of communications services, new products and related investment, capital expenditures, and other statements that are not historical facts or information constitute forward-looking statements for purposes of the safe harbor provisions under The Private Securities Litigation Reform Act of 1995. The forward-looking statements are based on information available at the time the statements are made and/or management's belief as of that time with respect to future events and involve risks and uncertainties that could cause actual results and outcomes to be materially different. Important factors that could cause such differences include but are not limited to: the competition we face; the expansion of competition in the cloud communications market; risks related to the acquisition or integration of businesses we have acquired; the impact of the COVID-19 pandemic; our ability to adapt to rapid changes in the cloud communications market; the nascent state of the cloud communications for business market; our ability to retain customers and attract new customers cost-effectively; the risk associated with developing and maintaining effective internal sales teams and effective distribution channels; security breaches and other compromises of information security; risks associated with sales of our services to medium-sized and enterprise customers; our reliance on third-party hardware and software; our dependence on third-party facilities, equipment, systems and services; system disruptions or flaws in our technology and systems; our ability to comply with data privacy and related regulatory matters; our ability to scale our business and grow efficiently; our dependence on third party vendors; the impact of fluctuations in economic conditions, particularly on our small and medium business customers; our ability to obtain or maintain relevant intellectual property licenses or to protect our trademarks and internally developed software; restrictions in our debt agreements that may limit our operating flexibility; our ability to obtain additional financing if required; our ability to raise funds necessary to settle conversion of the 2024 convertible senior notes; conditional conversion features of the convertible senior notes; the cash settlement of the convertible senior notes; the effects of the capped call transactions in connection with the convertible senior notes; fraudulent use of our name or services; intellectual property and other litigation that have been and may be brought against us; fraudulent use of our name or services; intellectual property and other litigation that have been and may be brought against us; reliance on third parties for our 911 services; uncertainties relating to regulation of business services; risks associated with legislative, regulatory or judicial actions regarding our business products; risks associated with operating abroad; risks associated with the taxation of our business; governmental regulation and taxes in our international operations; liability under anti-corruption laws or from governmental export controls or economic sanctions; our dependence on our customers' unimpeded access to broadband connections; foreign currency exchange risk; our history of net losses and ability to achieve consistent profitability in the future; our ability to fully realize the benefits of our net operating loss carry-forwards if an ownership change occurs; certain provisions of our charter documents; and other factors that are set forth in the “Risk Factors” section and other sections of this Annual Report on Form 10-K, as well as in our Quarterly Reports on Form 10-Q and amendments to these reports. While the Company may elect to update forward-looking statements at some point in the future, the Company specifically disclaims any obligation to do so, and therefore, you should not rely on these forward-looking statements as representing the Company's views as of any date subsequent to today.
Non-GAAP Financial MeasuresThis presentation contains non-GAAP financial measures (including adjusted EBITDA, adjusted EBITDA minus capex, constant currency, net debt (cash), free cash flow), as defined in Regulation G adopted by the SEC. The Company provides a reconciliation of these non-GAAP financial measures to the most directly comparable financial measure at the end of the presentation and in the Company's quarterly earnings releases, which can be found on the Vonage Investor Relations website at http://ir.vonage.com.
2

First Quarter 2020 Highlights
• Grew Consolidated revenues to $297 million, up 6% Y/Y and 9% excluding USF revenues
▪ Business revenues of $210 Million, up 17% Y/Y and 20% excluding USF revenues
▪ Business Service revenues of $196 million, up 23% Y/Y
• Increased API Service revenues to $86 million, up 44% Y/Y
▪ Strong usage from healthcare and education verticals drove high-value revenue growth of ~70% Y/Y in Q1
▪ Dollar-based net expansion of 138% driven by uptick in usage from existing customers
• Grew Applications Service revenues to $110 million, up 10% Y/Y
▪ Applications Service revenues from midmarket and enterprise customers (<$12K ARR) grew 14% Y/Y
▪ Applications Service revenues from enterprise customers (>$120K ARR) grew 21% Y/Y
• Experienced significant API platform and Applications usage driven by massive shift to remote work
• Launched significant new products and enhancements on the Vonage Communications Platform (VCP)
• Maintained strong liquidity position with approximately $150 million of cash & undrawn revolver capacity
3
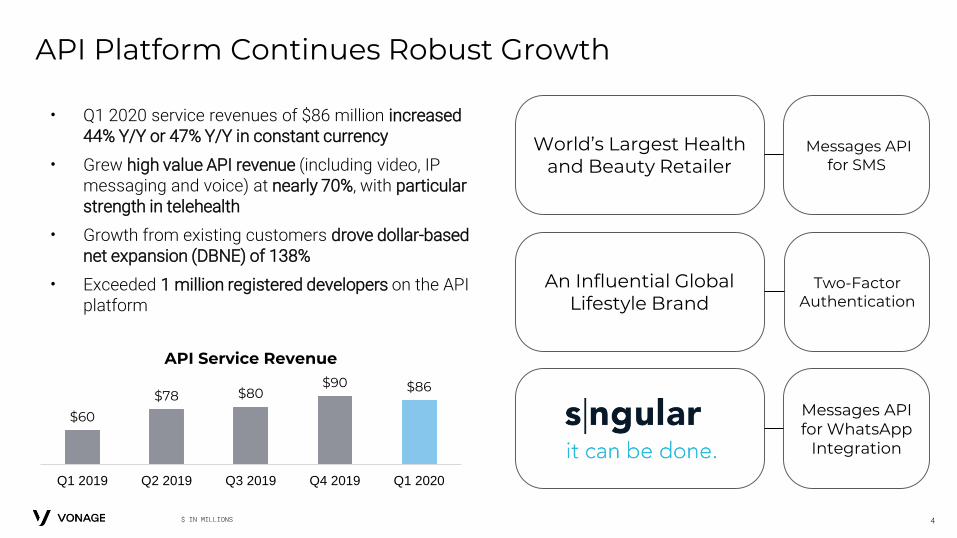
API Platform Continues Robust Growth
• Q1 2020 service revenues of $86 million increased 44% Y/Y or 47% Y/Y in constant currency
• Grew high value API revenue (including video, IP messaging and voice) at nearly 70%, with particular strength in telehealth
• Growth from existing customers drove dollar-based net expansion (DBNE) of 138%
• Exceeded 1 million registered developers on the API platform
4
$60
$78 $80$90 $86
Q1 2019 Q2 2019 Q3 2019 Q4 2019 Q1 2020
API Service Revenue
$ IN MILLIONS
An Influential Global Lifestyle Brand
World’s Largest Health and Beauty Retailer
Messages API for SMS
Two-Factor Authentication
Messages API for WhatsApp
Integration

Applications Continues to Gain Upmarket Traction
• Q1 2020 service revenues of $110 million increased 10% Y/Y or 11% in constant currency
• Q1 2020 Service Revenue from Mid-Market & Enterprise customers (>$12K ARR) grew 14% Y/Y
• Q1 2020 Service Revenue from Enterprise customers (>$120K ARR) grew 21% Y/Y
• Q1 2020 Bookings from combined Mid-Market & Enterprise customers represented 64% of total bookings, up from 36% in the prior year quarter
5
$99 $102 $103$107 $110
Q1 2019 Q2 2019 Q3 2019 Q4 2019 Q1 2020
Applications Service Revenue
$ IN MILLIONS
The Leading Online Marketplace for
Investment Properties
A Leading Mortgage Servicer
7-figure TCVbundled win
driven by Salesforce integration
7-figure TCVbundled win
driven by product
integration
7-figure, multi-year
CC renewal resulting in
doubled ARR

Financial Results
6

Q1 2020As Reported
Q1 2020 USF
Q1 2020 Ex-USF
Q1 2020Guidance
Consolidated Revenues $297 $14 $283 $277 area
Business Revenues $210 $4 $206 $200 area
Consumer Revenues $87 $10 $77 $77 area
Net Loss $(4)
Adjusted EBITDA1 $39 $32 area
Q1 Results Exceeded Guidance
7$ IN MILLIONS (1) NON-GAAP MEASURE. SEE SLIDES 22 AND 23 FOR A RECONCILIATION TO THE MOST COMPARABLE GAAP MEASURE

Business Segment Revenues
• Business revenues of $210 million increased 17% Y/Y
▪ Reduction in USF revenues (pass through) driven by the conclusion of a study which determined Vonage services are mostly software rather than telecommunications
• Business Service revenues of $196 million grew 23% Y/Y
8
$99 $106 $110
$60
$90 $86$12
$11 $10$9
$11 $4
$180
$218 $210
Q1 2019 Q4 2019 Q1 2020
$ IN MILLIONS
USFProduct & AccessApplications Service API Service
$159
$196 $196

Business Segment KPIs
• Service Revenue per customer improved due to
▪ Continued move upmarket in Applications
▪ Increased enterprise adoption of API platform
• Monthly Business Revenue churn improved due to
▪ Continued move upmarket
▪ Product improvements
9
$408$476 $475
Q1 2019 Q4 2019 Q1 2020
Service Revenue Per Customer
1.2% 1.2%
0.8%
Q1 2019 Q4 2019 Q1 2020
Business Revenue Churn

Business Service Margins Have Stabilized
10
56%
52% 52% 53% 53%
Q1 2019 Q2 2019 Q3 2019 Q4 2019 Q1 2020
Four consecutive quarters of stable Business Service margins reflecting the shift to owned, higher margin products

Consumer Segment Revenues
• Consumer Revenues declined 13% Y/Y, in line with expectations
• Ended the quarter with 1 million subscriber lines
▪ Tenured customers >2 years represent 92% of the customer base while those >5 years represent 74%
11
$89$80 $77
$11$12
$10
$100$92
$87
Q1 2019 Q4 2019 Q1 2020
$ IN MILLIONS
USFProduct & AccessService

Consumer Segment KPIs
12
$26.43 $27.57 $27.35
Q1 2019 Q4 2019 Q1 2020
Consumer ARPL
1.9% 1.7% 1.8%
Q1 2019 Q4 2019 Q1 2020
Consumer Customer Churn
• Average Revenue Per Line up $0.92 due to:
▪ Selective pricing actions & maturity of the customer base

Consolidated Revenues
• Consolidated revenues increased 6% Y/Y or 9% excluding USF revenues due to:
▪ Business segment organic growth
▪ Offset by continued managed decline in Consumer
13
$171$208 $206
$89
$80 $77
$20
$22 $14$280
$310$297
Q1 2019 Q4 2019 Q1 2020
$ IN MILLIONS
Consumer (ex-USF)Business (ex-USF) USF
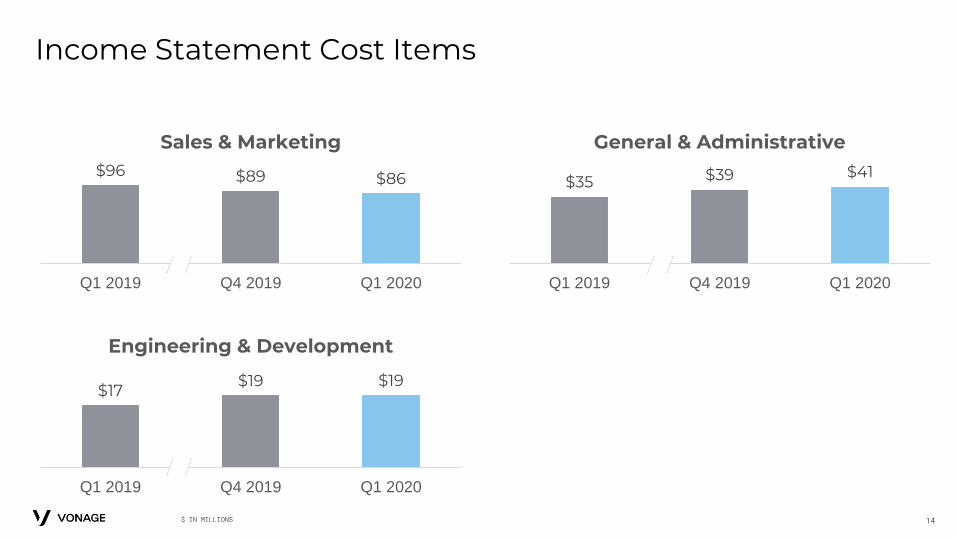
Income Statement Cost Items
14
$96 $89 $86
Q1 2019 Q4 2019 Q1 2020
Sales & Marketing
$17$19 $19
Q1 2019 Q4 2019 Q1 2020
Engineering & Development
$35 $39 $41
Q1 2019 Q4 2019 Q1 2020
General & Administrative
$ IN MILLIONS

Net Loss & Adjusted EBITDA1
• Net Loss increased year-over-year primarily due to a stock compensation-related tax benefit in the prior year quarter
• Adjusted EBITDA1 increased year-over-year primarily due to lower Sales & Marketing expenses
15
$(1)$(2) $(4)
Q1 2019 Q4 2019 Q1 2020
Net Loss
$31$45 $39
Q1 2019 Q4 2019 Q1 2020
Adjusted EBITDA1
$ IN MILLIONS (1) NON-GAAP MEASURE. SEE SLIDES 22 AND 23 FOR A RECONCILIATION TO THE MOST COMPARABLE GAAP MEASURE

Capital Expenditures & Adjusted EBITDA Less Capex1
• Capex increased due to higher capitalized software in support of the Vonage Communications Platform (VCP)
• Adjusted EBITDA less Capex increased year-over-year due to higher Adjusted EBITDA
16
$11 $13 $13
Q1 2019 Q4 2019 Q1 2020
Capital Expenditures (Capex)
$20$32
$26
Q1 2019 Q4 2019 Q1 2020
Adjusted EBITDA Less Capex1
$ IN MILLIONS (1) NON-GAAP MEASURE. SEE SLIDES 22 AND 23 FOR A RECONCILIATION TO THE MOST COMPARABLE GAAP MEASURE

Cash Flow and Balance Sheet
• Cash $43 million
• Gross Debt $611 million
• Net Debt1 $567 million (Gross Debt less Unrestricted Cash)
• Net Debt / LTM Adjusted EBITDA 3.4x
• Debt Maturities 7/2023 and 6/2024
• Available Liquidity Approximately $150 million
17
Cash Flow ($ in millions) Q1 2020
Cash from Operations $3
Capital Expenditures, Software & Intangible Assets ($13)
Free Cash Flow1 ($11)
(1) NON-GAAP MEASURE. SEE SLIDES 22 AND 23 FOR A RECONCILIATION TO THE MOST COMPARABLE GAAP MEASURE

Total Investment in the Vonage Communications Platform
18
$17 $17 $17 $19 $19
$5$8 $8
$8$10$22
$24 $25$27
$29
13.8% 13.5% 13.5% 13.6%
15.1%
Q1 2019 Q2 2019 Q3 2019 Q4 2019 Q1 2020
Engineering & Development Expense Capitalized Software Development Total % of Business Service Revenue
$ IN MILLIONS

Guidance
19$ IN MILLIONS
Q2 2020 FY 2020 - Updated
Incl. USF Ex-USF Incl. USF Ex-USF
Consolidated Revenues $295 to $298 $283 to $286 $1,180 to $1,205 $1,128 to $1,153
Total Business Revenues $213 to $216 $209 to $212 $855 to $880 $838 to $863
Total Consumer Revenues $82 area $74 area $325 area $290 area
Adjusted EBITDA1 $36 area $150 to $155
Capital Expenditures $60 area
(1) NON-GAAP MEASURE. SEE SLIDES 22 AND 23 FOR A RECONCILIATION TO THE MOST COMPARABLE GAAP MEASURE

Disaggregation of Business Revenues
20
Q1’19 Q2’19 Q3’19 Q4’19 Q1’20
Applications Service Revenues $ 99.4 $ 101.9 $ 103.4 $ 106.8 $ 109.7
API Platform Service Revenues $ 59.9 $ 78.1 $ 80.3 $ 89.7 $ 86.0
Business Service Revenues (GAAP) $ 159.3 $ 180.0 $ 183.7 $ 196.5 $ 195.7
Y/Y Growth Rate 37% 41% 37% 32% 23%
Access and Product Revenues $ 11.7 $ 11.7 $ 12.1 $ 10.7 $ 10.1
USF Revenues $ 8.6 $ 8.3 $ 10.7 $ 10.5 $ 4.5
Total Business Revenues (GAAP) $ 179.6 $ 200.0 $ 206.5 $ 217.7 $ 210.3
Y/Y Growth Rate 31% 35% 34% 28% 17%
$ IN MILLIONS

Business Revenue: Year-over-Year Growth Rates2
21
Q1’19 Q1’20
Business Total Revenues GAAP 31% 17%
GAAP (Constant Currency) 18%
Business Service Revenues GAAP 37% 23%
GAAP (Constant Currency) 24%
Applications Service Revenues As Reported 34% 10%
As Reported (Constant Currency) 11%
API Platform Service Revenues As Reported 43% 44%
As Reported (Constant Currency) 47%
(2) INCLUDES UNAUDITED COMBINED FINANCIAL INFORMATION

Non-GAAP Reconciliation
22

Non-GAAP Reconciliation
23

Thank You
24