vote 6 - department of education
TRANSCRIPT

VOTE 6 - Department of Education
VOTE 6 - Department of Education 247

Vote 6
1
Department of Education Vote 6 To be appropriated by Vote in 2016/17 R12 059 747 000 Responsible MEC MEC for Education Administrating Department Department of Education Accounting Officer Head of Department of Education
1. Overview
1.1 Vision
To be a Department that strives for quality, universal education that is internationally competitive. 1.2 Mission To provide all children of the Free State province with quality education in a conductive school environment with qualified professional teachers, learning and teaching material of high quality and parents who are highly involved in school affairs.
1.3 Strategic goals and objectives
1.3.1 Promotion of sound corporate governance through sustainable use of resources:
Improved: Financial Management systems Human resource strategy Communication strategies Security Systems Internal Audit processes Risk Management Systems Audit opinion.
The Education system is broad and complex. Improvement of services in the Administration functions provides leverage on which the Education specific functionaries can deliver to improve the quality of teaching and learning. The Business processes and administrative processes within these functionaries directly affect the entire management of the education system.
1.3.2 Improve the functionality of schools through teacher development and management
support and increased accountability
Ensure availability and utilization of teachers to avoid large classes Implement a strategy for attracting sufficient qualified, young teachers including for Grade R Implement an appropriate framework for teacher development Strengthen districts to support schools in curriculum through subject advisors. Promote oversight and support in the delivery of curriculum in the classroom Circuit Managers (SMGD),subject advisors and inclusive officials to visit schools and provide
support on management Implement a strategy to strengthen school management Teacher development and management support to schools are important in order to create capacity for school functionality and high learner attainment.
VOTE 6 - Department of Education
Vote 6
2
1.3.3 Increased access to grade R Increase Grade R enrolment and expand Grade R classes so that an increasing number of
grade 1 learners have been to a Grade R class. Train ECD practitioners in registered Grade R classes Increase the percentage of Grade 1 entrants who attended a Grade R that are school ready.
Grade R lays a good foundation for schooling. Learners who have done grade R perform better in grade 1 and subsequent grades.
1.3.4 Improve learner performance in grade 3, 6, 9 and 12 as demonstrated through regular
assessment and tracking of progress
Increase the number of learners in Grade 3 who, by the end of the year, have mastered the minimum language and numeracy competencies for Grade 3.
Increase the number of learners in Grade 6 and 9 who, by the end of the year, have mastered the minimum language and mathematics competencies for Grade 6 and 9.
Increase the number of Grade 12 learners who become eligible for a Bachelors programme at a university.
Increase the number of Grade 12 learners who pass mathematics, physical science and accounting.
Improve the average performance of Grade 6 learners in languages and mathematics. Improve the average performance of Grade 9 learners in mathematics. Improve the grade promotion of learners through Grades 1 to 9.
The performance of the department of education as an institution is measured through learner attainment. Good results in mathematics, science and accounting will ensure a constant supply of professional that are required for economic growth in the province.
1.3.5 Provision of infrastructure and learning materials to support quality education
Build new schools; refurbish old schools, built laboratories, libraries, halls, admin blocks and toilets for educators and learners.
Provide sewerage, electricity and water to those schools without. Supply each learner with the nationally defined text book package.
Without classrooms, toilets, laboratories, libraries, text books and reading materials the quality of learning and teaching will be compromised.
1.4 Values Accountability Democracy Efficiency Equality Human dignity Inclusivity Redress Respect Transparency
248

Vote 6
2
1.3.3 Increased access to grade R Increase Grade R enrolment and expand Grade R classes so that an increasing number of
grade 1 learners have been to a Grade R class. Train ECD practitioners in registered Grade R classes Increase the percentage of Grade 1 entrants who attended a Grade R that are school ready.
Grade R lays a good foundation for schooling. Learners who have done grade R perform better in grade 1 and subsequent grades.
1.3.4 Improve learner performance in grade 3, 6, 9 and 12 as demonstrated through regular
assessment and tracking of progress
Increase the number of learners in Grade 3 who, by the end of the year, have mastered the minimum language and numeracy competencies for Grade 3.
Increase the number of learners in Grade 6 and 9 who, by the end of the year, have mastered the minimum language and mathematics competencies for Grade 6 and 9.
Increase the number of Grade 12 learners who become eligible for a Bachelors programme at a university.
Increase the number of Grade 12 learners who pass mathematics, physical science and accounting.
Improve the average performance of Grade 6 learners in languages and mathematics. Improve the average performance of Grade 9 learners in mathematics. Improve the grade promotion of learners through Grades 1 to 9.
The performance of the department of education as an institution is measured through learner attainment. Good results in mathematics, science and accounting will ensure a constant supply of professional that are required for economic growth in the province.
1.3.5 Provision of infrastructure and learning materials to support quality education
Build new schools; refurbish old schools, built laboratories, libraries, halls, admin blocks and toilets for educators and learners.
Provide sewerage, electricity and water to those schools without. Supply each learner with the nationally defined text book package.
Without classrooms, toilets, laboratories, libraries, text books and reading materials the quality of learning and teaching will be compromised.
1.4 Values Accountability Democracy Efficiency Equality Human dignity Inclusivity Redress Respect Transparency
VOTE 6 - Department of Education 249

Vote 6
3
1.5 Types of services delivered by the department The Department provides the following main services: Education Development and Professional Services; Quality Assurance; Curriculum Services; Examination and Assessment; Inclusive Education; Sport and Youth Development in schools; District Management and Governance; Administrative Support Services; and Teaching and Learning in schools, education institutions and Grade R.
1.6 Legislation The legislative mandate of the Department of Education is grounded in the Constitution of South Africa and it is also supported by the following legislation and policies:
Free State Schools Education Act No. 2 of 2000; South African Schools Act No. 84 of 1996 (as amended); National Education Policy Act, 1996 (Act No. 27 of 1996) Annual Division of Revenue Act; Public Finance Management Act No. 1 of 1999 (as amended by act 29 of 1999); Preferential Procurement Policy Framework Act No.5 of 2000; Acts Governing Human Resource Development; Skills Development Act No. 97 of 1998; and Occupation Health and Safety Act No. 85 of 1993.
1.7 Other Regulations Norms and Standards for funding of Public Schools, 2006 Government Gazette No: 29179; Regulations for financial records of Public Schools, Provincial Notice 154 of 2001; Regulations for the examination, Irregularities and the Examination Board, Provincial Notice 155 of
2001; White Paper 5 on Early Childhood Development, May 2001; and White Paper 6 Inclusive Education.
1.8 Alignment of departmental budget to achieve government’s prescribed outcomes The government program of action indicated that since 2011 budget will be centered on the 12 identified outcomes across departments. The Department of Education mainly contributes to outcome 1: “Improve the quality of basic education”. To ensure the achievement of this outcome, the following outputs have been identified:
High Quality of Teaching and Learning Improved literacy and numeracy at schools Better Senior Certificate examination performance Universalization of Early Childhood Development Effective school management, leadership and governance Effective infrastructure development and basic services All schools have safe and supporting environments for all children Improved learner attainment and retention Improved social cohesion, discipline and excellence through extra-curricular activities
VOTE 6 - Department of Education
Vote 6
4
2. Review of the current financial year (2015/16)
The Free State Department of Education continues to place a very high premium on the delivery of quality basic education. The well-being of the province therefore depends on the extent to which the Department are able to create an enabling environment for the delivery of quality basic education to the learner population in the Free State. The Department has over the past five years made great strides in relation to improvement in learner performance. On the whole, this improvement can to a large extent be attributed to the implementation of intervention programmes that have found expression in the Provincial Strategy on Learner Attainment (PSLA). It is important to recognize that the PSLA is an initiative that seeks to bring about continuous improvement in learner attainment in relation to the National Senior Certificate (NSC) examinations. In this context, the PSLA continues to represent a strategic response that focuses on the qualitative improvement of schools with a view to build a strong culture of effective curriculum leadership and school organization. In this culture, the school develops an enabling environment for effective teaching and learning with a view to continuous improvement in learner attainment.
The following are some of the major priorities supported during the 2015/16 financial year.
No Fee Schools Policy Schools in quintile 1, 2 and 3 receive substantial subsidies per learner for educational resources from the Provincial Education Department. The no fee policy’s main objective is to ensure that learners from poor communities have access to education. In total, 519 878 learners from 1146 schools benefit from the no fee school policy which increased from 502 374 learners in 2014/15 financial year. The implementation of this policy ensures access to basic education and contributes towards the improvement of quality of life of the Free State citizens.
National School Nutrition Programme (NSNP) The main purpose of the NSNP Programme is to provide nutritious meals to targeted learners. During this financial year, learners from quintile 1- 3 primary schools and quintile 1 to 3 secondary schools as well as identified special schools were provided with meals. There are 573 284 learners in 1 116 schools that benefitted from this programme in 2015/16. Beneficiaries of the NSNP in the Free State increased from 166 304 in 2004/2005 to 573 284 in 2015. The NSNP ensures that every learner in a no fee school receives at least one nutritious meal per day. Furthermore, it enhanced learning capacity and improves school attendance of learners. The programme has also translated into job creation for 3 566 volunteer-food-handlers (VFH) who are involved in the preparation of meals for the learners during this financial year. Provision of Learning and Teaching Support Material (LTSM) In order to ensure that quality education takes place, learners must be exposed to quality Learning and Teaching Support Material (LTSM). The Department budgeted R97.2 million for Textbooks and Stationery (2015/16 financial year) which is for 2016 academic year. For 2016 academic year, the Department procured top-ups for Grades 4-6 and 11. The Department will also be procuring Grade R and Grade 11 FET literature set works. The Free State Department of Education (FSDoE) will always strive for better education and provide resources for learners so that teaching and learning is not compromised. Examinations The objective of this programme is to provide education institutions as a whole with training and support. Amongst others, this programme caters for professional services, special projects and external examinations. The steady improvement of the NSC results in the last five years demonstrates that despite the challenges in the system, the 2030 vision of eliminating poverty and reducing inequality through
250

Vote 6
4
2. Review of the current financial year (2015/16)
The Free State Department of Education continues to place a very high premium on the delivery of quality basic education. The well-being of the province therefore depends on the extent to which the Department are able to create an enabling environment for the delivery of quality basic education to the learner population in the Free State. The Department has over the past five years made great strides in relation to improvement in learner performance. On the whole, this improvement can to a large extent be attributed to the implementation of intervention programmes that have found expression in the Provincial Strategy on Learner Attainment (PSLA). It is important to recognize that the PSLA is an initiative that seeks to bring about continuous improvement in learner attainment in relation to the National Senior Certificate (NSC) examinations. In this context, the PSLA continues to represent a strategic response that focuses on the qualitative improvement of schools with a view to build a strong culture of effective curriculum leadership and school organization. In this culture, the school develops an enabling environment for effective teaching and learning with a view to continuous improvement in learner attainment.
The following are some of the major priorities supported during the 2015/16 financial year.
No Fee Schools Policy Schools in quintile 1, 2 and 3 receive substantial subsidies per learner for educational resources from the Provincial Education Department. The no fee policy’s main objective is to ensure that learners from poor communities have access to education. In total, 519 878 learners from 1146 schools benefit from the no fee school policy which increased from 502 374 learners in 2014/15 financial year. The implementation of this policy ensures access to basic education and contributes towards the improvement of quality of life of the Free State citizens.
National School Nutrition Programme (NSNP) The main purpose of the NSNP Programme is to provide nutritious meals to targeted learners. During this financial year, learners from quintile 1- 3 primary schools and quintile 1 to 3 secondary schools as well as identified special schools were provided with meals. There are 573 284 learners in 1 116 schools that benefitted from this programme in 2015/16. Beneficiaries of the NSNP in the Free State increased from 166 304 in 2004/2005 to 573 284 in 2015. The NSNP ensures that every learner in a no fee school receives at least one nutritious meal per day. Furthermore, it enhanced learning capacity and improves school attendance of learners. The programme has also translated into job creation for 3 566 volunteer-food-handlers (VFH) who are involved in the preparation of meals for the learners during this financial year. Provision of Learning and Teaching Support Material (LTSM) In order to ensure that quality education takes place, learners must be exposed to quality Learning and Teaching Support Material (LTSM). The Department budgeted R97.2 million for Textbooks and Stationery (2015/16 financial year) which is for 2016 academic year. For 2016 academic year, the Department procured top-ups for Grades 4-6 and 11. The Department will also be procuring Grade R and Grade 11 FET literature set works. The Free State Department of Education (FSDoE) will always strive for better education and provide resources for learners so that teaching and learning is not compromised. Examinations The objective of this programme is to provide education institutions as a whole with training and support. Amongst others, this programme caters for professional services, special projects and external examinations. The steady improvement of the NSC results in the last five years demonstrates that despite the challenges in the system, the 2030 vision of eliminating poverty and reducing inequality through
VOTE 6 - Department of Education 251

Vote 6
5
education can materialize. The Free State has achieved 81.6% (2015) down from 82.8% (2014). This is a decline of 1.2%. The department conducted the following assessments during the 2015/16 financial year: Quarterly tests for grades 3, 4,5,6,9,10, 11 and 12 in 2015 Quarterly tests for ABET Level 4 Feb/ Sept 2015 Abet Level 4 examinations in May/ June 2015 Senior Certificate Amended examinations in June/July 2015 National Senior Certificate Examinations Preparatory examinations in September 2015 ANA tests in September 2015 Abet Level 4 examinations in November 2015 National Senior Certificate Examinations in October/November 2015 National Senior Certificate Supplementary Examinations in February /March 2016. Inclusive Education Training of teachers on Curriculum Differentiation has been extended to Senior Phase teachers to enable teachers to employ Inclusive practices towards curriculum accessibility by all learners. 683 Teachers were trained from 152 schools during this financial year. Early identification and support of learners experiencing learning difficulties remains a priority. Screening, Identification, Assessment and Support (SIAS) was promulgated on the 19th December 2014 as a policy on early identification and support provisioning. SIAS training in the 2015/16 financial year has focused on Provincial Training Teams (PTT), Subject Advisors, Foundation Phase and Senior Phase Teachers. 1,671 Teachers were trained from 323 schools in this regard. South African Sign Language (SASL) was successfully implemented as a subject in Foundation Phase and Grade 9. Currently 34 Teachers from Thiboloha and Bartimea Schools for Deaf, Hard of Hearing and Visually Impaired are enrolled for SASL at WITS. 12 Intermediate Phase and 4 FET teachers from Bartimea and Thiboloha Special Schools were trained on SASL CAPS from 9 - 13 November 2015. The training was to prepare teachers for implementation as SASL as a subject is introduced in the Intermediate Phase (Grade 4,5 & 6) as well as in Grade 10 in the FET Phase this year. Sign Language as a subject is taught in Bartimea and Thiboloha Special Schools for deaf and hard of hearing learners in the Province. The progress made with the implementation of Full Service Schools (FSS) was extended to 20 identified schools for this financial year. The identified schools will be Primary Schools with strong leadership, with physical resources that are conducive and with an ethos that embrace inclusivity. Learners assessed for placement in Special Schools are placed on a waiting list and remain in mainstream schools until space becomes available in Special Schools. Currently there are 546 learners on the waiting list. Revitalisation of Agricultural schools During 2015/16 financial year, R 3 million were spent to improve on the infrastructure and development of production enterprises at 12 Agricultural Schools in the Free State. Money allocated were used as follows Collecting and analysis of soil samples for crop production in precision farming, Livestock purchases for the various schools involved, Cultivation of fields and planting for winter grazing and summer crop for 2015. Various equipment for Agricultural Technology to ensure learners gain experience in the
manufacturing process. Purchasing of new farm machinery to ensure correct cultivation of fields and planting of pastures. New breeding stock for schools where required.
VOTE 6 - Department of Education
Vote 6
6
Processing equipment as to ensure that aspects about processing is addressed and required by the Curriculum and Assessment Policy Statement (CAPS) for Agricultural Management Practices (AMP).
Building of tunnels and broiler houses to ensure practical exposure for learners with Agricultural Management Practices as required for their School Based Assessment (SBA).
Upgrading of handling facilities at schools.
Expansion of Grade R The Department ensured that learners from the poorest communities have access to grade R education in both public and community-based sites. In 2014/15 financial year the department expanded grade R exposure to 80 additional classes bringing the total number of public schools that offer grade R to 646 giving access to 37 293 learners in public schools. Currently the department is also subsiding 264 community-based sites that host 7 908 grade R learners. The department had increased grade R to 80 additional classes in 2015/16 financial year. Training of ECD Teachers It is critical for teachers to have ongoing professional development to keep them up-to-date on new curriculum development which includes how children learn and provide them with resources. In pursuing this critical aspect the FSDoE has currently enrolled 18 grade R teachers are still continuing for B Ed with University of South Africa. Teacher development has continued to occupy a high profile position in ongoing initiatives to build the capacity of teachers with a focus on subject knowledge, teacher orientation in preparation for the implementation of the CAPS and instructional leadership in order to bring about the desired improvement in both curriculum management and classroom practice. These teacher development initiatives will be delivered on an ongoing basis and constitute an important pillar of the Provincial Strategy on Learner Attainment (PSLA) and therefore directly linked to the provincial initiative to improve learner attainment in the NSC examinations. Grade R teachers or In 2014/15 the FSDoE managed to train 857 on Curriculum and Assessment Policy Statement (CAPS). Grade R teachers were trained on CAPS in 2015/16 financial year. Hostel Support The department started a hostel project in 2001 which accommodated over 100 learners. This gradually increased to 33 hostels by 2015. Ventersburg hostel which can accommodate 100 learners was completed in 2014 but could not be operational in 2015 due to challenges of electricity connection but will be operating during 2016/17 financial year. Sediti hostel in Thaba Nchu which can accommodate 250 learners is also having challenges of electricity connection which will be operating in 2016/17 financial year. Memel, Paul Roux and Seotlong, under-utilized hostels were also added to the Farm School Hostel Project which made the total of operational hostels to 33 with a total of 3 959 learners.
DISTRICT NUMBER OF HOSTELS Fezile Dabi 9 Motheo 8 + 1 (Sediti) Lejweleputswa 3 + 1 (Ventersburg) Thabo Mofutsanyana 9 Xhariep 4
252

Vote 6
6
Processing equipment as to ensure that aspects about processing is addressed and required by the Curriculum and Assessment Policy Statement (CAPS) for Agricultural Management Practices (AMP).
Building of tunnels and broiler houses to ensure practical exposure for learners with Agricultural Management Practices as required for their School Based Assessment (SBA).
Upgrading of handling facilities at schools.
Expansion of Grade R The Department ensured that learners from the poorest communities have access to grade R education in both public and community-based sites. In 2014/15 financial year the department expanded grade R exposure to 80 additional classes bringing the total number of public schools that offer grade R to 646 giving access to 37 293 learners in public schools. Currently the department is also subsiding 264 community-based sites that host 7 908 grade R learners. The department had increased grade R to 80 additional classes in 2015/16 financial year. Training of ECD Teachers It is critical for teachers to have ongoing professional development to keep them up-to-date on new curriculum development which includes how children learn and provide them with resources. In pursuing this critical aspect the FSDoE has currently enrolled 18 grade R teachers are still continuing for B Ed with University of South Africa. Teacher development has continued to occupy a high profile position in ongoing initiatives to build the capacity of teachers with a focus on subject knowledge, teacher orientation in preparation for the implementation of the CAPS and instructional leadership in order to bring about the desired improvement in both curriculum management and classroom practice. These teacher development initiatives will be delivered on an ongoing basis and constitute an important pillar of the Provincial Strategy on Learner Attainment (PSLA) and therefore directly linked to the provincial initiative to improve learner attainment in the NSC examinations. Grade R teachers or In 2014/15 the FSDoE managed to train 857 on Curriculum and Assessment Policy Statement (CAPS). Grade R teachers were trained on CAPS in 2015/16 financial year. Hostel Support The department started a hostel project in 2001 which accommodated over 100 learners. This gradually increased to 33 hostels by 2015. Ventersburg hostel which can accommodate 100 learners was completed in 2014 but could not be operational in 2015 due to challenges of electricity connection but will be operating during 2016/17 financial year. Sediti hostel in Thaba Nchu which can accommodate 250 learners is also having challenges of electricity connection which will be operating in 2016/17 financial year. Memel, Paul Roux and Seotlong, under-utilized hostels were also added to the Farm School Hostel Project which made the total of operational hostels to 33 with a total of 3 959 learners.
DISTRICT NUMBER OF HOSTELS Fezile Dabi 9 Motheo 8 + 1 (Sediti) Lejweleputswa 3 + 1 (Ventersburg) Thabo Mofutsanyana 9 Xhariep 4
VOTE 6 - Department of Education 253

Vote 6
7
School Connectivity The department started this pilot programme to equip schools with information technology to improve teaching and learning. IT equipment has already been delivered and installed at 5 schools and training in this regard for educators has already taken place. Teacher Training One of the national priorities regarding teacher development is to promote and facilitate the professional development of teachers, in particular the Continuing Professional Teacher Development (CPTD) Management System. The CPTD Management System is a new system for encouraging and recognising teachers’ professional development. Each teacher will be expected to achieve at least 150 Professional Development (PD) points on their Personal PD Points Account (PPDPA) in every three year cycle. To help teachers organise and focus their professional development, the District Teacher Development Centres (DTDCs) embarked on a process to offer Orientation and Sign-Up Workshops to all school based educators. Currently 1 920 principals and deputy principals, 1 949 Heads of Departments (HODs) and 6 570 teachers signed-up for the CPTD Management System. For the current financial year teachers have spent an average of 34 hours on professional teacher development activities. ICT skills development focused area was on the training of teachers at schools who benefited from ICT hardware provisioning projects in the previous year. The skills developments included device training and training on the integration of ICT in teaching and learning. Sport, Youth, Recreation, Arts & Culture (SYRAC) In-school sport and culture has this earmarked additional fund to specifically improve the quality of and participations in sport and youth programmes. During this financial year, schools participated in Leagues and the province received gold medals in many codes, resulting in: The overall position 2 with cross country and athletics. Overall position 4 in the SA Schools Championships, with codes like Chess, Football Girls, receiving
Gold medals. Some leaners were selected for the National Teams in the respective Codes and Federations, for
International participation. 4 boys got invited for Football trials abroad in Holland and Germany. Maths, Science and Technology Strategy (MST Strategy) The MST grant benefited 77 schools with teaching and learning resources for workshops and for laboratories. Schools also benefited on kits, apparatus, consumables, computer resources like hardware and broadcasting equipment and machinery and tools. The second major benefit was for 300 grade 8, 9 and 10 selected learners on learner support camps, from the 54 MST grant secondary schools taken through a number of Learner Support Camps in partnership with Central University of Technology.
The 77 schools benefiting from the grant were divided into 36 academic high schools, 18 technical high schools and 23 primary schools. The third category of beneficiation was on teacher development which was standing on 3 major legs namely CAPS 2 teacher development focusing on 9 specialisations, technical mathematics and technical science, content and methodology specific targeted training and lastly on ICT integration into teaching and learning Bursaries Non Employees During the 2015/16 financial year, an amount of R 450 million was allocated to the Department for bursaries to non-employees. Currently there are 7 248 bursary holders on the Provincial Bursary System. On annual basis, there is a selection of 500 students of which 200 is selected by the
VOTE 6 - Department of Education
Vote 6
8
Committee, each MECs selecting 15 students, each HODs selecting 5 students, Speaker of the Provincial Legislature selecting 15 and the rest is the Premier inclusive of the Top Achievers.
The Department also have students studying in different countries, 37 Students are in Turkey, 198 students in Cuba, 9 studying pharmacy, 265 students studying in China and 103 was in India for IT. The total number of 7 248 students on the Provincial Bursary System is exclusive of the 103 students who were studying six months Information Technology in 2015 academic year.
3. Outlook for the coming financial year (2016/17) The following policy priorities and strategies, amongst others, will be supported in 2016/17 financial year to ensure the realization of the Department’s vision. Maths, Science and Technology Strategy (MST Strategy) The MST Strategy will continue in 2016/17 financial year in order to provide support and resources to schools, teachers and learners for the improvement of Mathematics, Sciences and Technology teaching and learning at selected public schools. It will also assist in improving the achievement of learner participation and success rates, teacher demand, supply, utilisation, development and support, school resourcing and partnerships, consistent with targets set in the Action Plan 2019 and the National Development Plan (NDP). The strategy is linked to the NDP and Action Plan 2019 by increasing the number of learners taking Mathematics, Sciences and technology subjects. Examination and assessments The Department will strengthen the implementation of its Provincial Strategy on Learner Attainment in both the Primary and the Secondary schools with the intention to improve both the quality of learning and teaching. The objective of the province for 2016 academic year is to achieve 90/40 matric results which means 90% pass rate and 40% bachelors. Learners’ performance is central to the success of the department’s interventions. In its quest to realize this mission, it will focus on the improvement of the quality of the School Based Assessment (SBA), by administering common Provincial quarterly examinations / tests. The purpose of the administration of these quarterly exams/test amongst others, is to:
o indirectly assist with raising the standard and quality of the SBA, o provide professional development support on the content areas that learners are struggling with, o ensure that teachers cover all the curriculum topics, o conduct item and error analysis so as to diagnose and remedy the challenges that learners are
faced with. With these interventions the Department sought to improve the retention rate across the system and consequently the overall performance in the Grade 12 results, by incrementally reducing the number of under-performing schools and subjects. Departmental interventions to support good governance in schools included among others the development of School Academic Performance Improvement Plans (SAPIPs) and the hosting of quarterly accountability sessions for all under-performing schools. The Department has made a budgetary provision of R41 million in the 2016/2017 financial year as part of its strategy to improve learner performance across the grades with the vested interest in the improvement of the 2016 grade 12 National Senior Certificate (NSC) results. The allocation form part of the Internet Broadcast Programme (IBP) which covers grades 8-12 and as a result the number of the subjects and hours have been increased so as to sustain good performance across the system. This is part of the Department’s strategy to reduce the repetition rate which is high in grades 8-11 and to constantly monitor the quality of teaching and learning. A special attention will be given to progressed learners across the system. The importance of grade 12 makes it mandatory that special interventions be implemented for all the progressed learners in this grade and to ensure that they are exposed to all examinable grade 10 and 11 work as part of their grade 12 overall workload. The intention is to ensure
254

Vote 6
8
Committee, each MECs selecting 15 students, each HODs selecting 5 students, Speaker of the Provincial Legislature selecting 15 and the rest is the Premier inclusive of the Top Achievers.
The Department also have students studying in different countries, 37 Students are in Turkey, 198 students in Cuba, 9 studying pharmacy, 265 students studying in China and 103 was in India for IT. The total number of 7 248 students on the Provincial Bursary System is exclusive of the 103 students who were studying six months Information Technology in 2015 academic year.
3. Outlook for the coming financial year (2016/17) The following policy priorities and strategies, amongst others, will be supported in 2016/17 financial year to ensure the realization of the Department’s vision. Maths, Science and Technology Strategy (MST Strategy) The MST Strategy will continue in 2016/17 financial year in order to provide support and resources to schools, teachers and learners for the improvement of Mathematics, Sciences and Technology teaching and learning at selected public schools. It will also assist in improving the achievement of learner participation and success rates, teacher demand, supply, utilisation, development and support, school resourcing and partnerships, consistent with targets set in the Action Plan 2019 and the National Development Plan (NDP). The strategy is linked to the NDP and Action Plan 2019 by increasing the number of learners taking Mathematics, Sciences and technology subjects. Examination and assessments The Department will strengthen the implementation of its Provincial Strategy on Learner Attainment in both the Primary and the Secondary schools with the intention to improve both the quality of learning and teaching. The objective of the province for 2016 academic year is to achieve 90/40 matric results which means 90% pass rate and 40% bachelors. Learners’ performance is central to the success of the department’s interventions. In its quest to realize this mission, it will focus on the improvement of the quality of the School Based Assessment (SBA), by administering common Provincial quarterly examinations / tests. The purpose of the administration of these quarterly exams/test amongst others, is to:
o indirectly assist with raising the standard and quality of the SBA, o provide professional development support on the content areas that learners are struggling with, o ensure that teachers cover all the curriculum topics, o conduct item and error analysis so as to diagnose and remedy the challenges that learners are
faced with. With these interventions the Department sought to improve the retention rate across the system and consequently the overall performance in the Grade 12 results, by incrementally reducing the number of under-performing schools and subjects. Departmental interventions to support good governance in schools included among others the development of School Academic Performance Improvement Plans (SAPIPs) and the hosting of quarterly accountability sessions for all under-performing schools. The Department has made a budgetary provision of R41 million in the 2016/2017 financial year as part of its strategy to improve learner performance across the grades with the vested interest in the improvement of the 2016 grade 12 National Senior Certificate (NSC) results. The allocation form part of the Internet Broadcast Programme (IBP) which covers grades 8-12 and as a result the number of the subjects and hours have been increased so as to sustain good performance across the system. This is part of the Department’s strategy to reduce the repetition rate which is high in grades 8-11 and to constantly monitor the quality of teaching and learning. A special attention will be given to progressed learners across the system. The importance of grade 12 makes it mandatory that special interventions be implemented for all the progressed learners in this grade and to ensure that they are exposed to all examinable grade 10 and 11 work as part of their grade 12 overall workload. The intention is to ensure
VOTE 6 - Department of Education 255

Vote 6
9
that the progressed grade 12 learners acquire the basic foundational skills needed for them to master the content of grade 12. A multiple academic support program will be rolled-out to ensure that this cohort of learners adjust and cope with the high curriculum demand of grade 12. As of 2016, all schools have tracked all their learners from grade R-11 as a means to ensure that differentiated support is provided across the phases and grades with the deliberate intention of reducing the number of learners who are progressed across the system. The department will continue to work with its partners to build a strong working relationship which is aimed at assisting the department to wage a war against underperforming schools in the province. National School Nutrition Programme (NSNP) In 2016/17 the budget for feeding of learners is R334.971 million and about ±600 000 learners will benefit from this programme. NSNP is also used as a channel for local economic development and creation of job opportunities for the local people through the use of cooperatives as service providers and the unemployed parents of learners are appointed as Volunteer Food Handlers (VFHs) to prepare meals for learners. In 2016/17 an estimated 3 700 VFHs will be appointed, with a stipend of R1 000 per person per month. Revitalisation of Agricultural schools R 3 million has been budgeted for this programme of revitalisation of agricultural schools and it will be used to: Complete fencing around the Agricultural production units in rural areas for security purposes, Ensure sustainable production by reducing the risk of power outages through purchasing generators
for relevant schools, Purchasing of various agricultural equipment to ensure PATs (Practical Assessment Tasks) can be
completed as required by the curriculum, To cover running costs for startup enterprises at the various schools. Renovations at various schools in different sections of the farm as per the need, Drilling of boreholes to solve water problems for livestock and other farm animals at schools, barbwire fencing upgrade for various agricultural schools to ensure rotational grazing of natural veld
pastures. Bursaries Non Employees Allocation of bursaries to non-employees will continue to fulfil the mandate of the Free State Provincial Government to fund the performing students and those in financial needs. Province will offer about ±7 000 learners with bursaries and some will study in South Africa others in different countries. Bursaries will also be allocated to students to address the skills gap in the province. Once the students have completed their studies, they are placed in different departments according to their qualification for the internships or a learnership to gain experience of a work environment. The internship programme takes 12 months and some graduates will be absorbed in different departments where posts are vacant. Sport, Youth, Recreation, Arts & Culture (SYRAC) The allocation for 2016/17 financial year is R0.961 million which will be used for the following activities are planned to take place:
Matric Camps - Recreational Programs run for refreshing the learners after a day of formal lessons sessions.
Farm Schools Sport Hub Centres - Sport Festival to be held for each District so as to cater for the Farm Schools sector.
Physical Education in Schools - a monitored roll out of the Physical Education implementation in the Schools
Intensifying the Partnership relationships programmes
VOTE 6 - Department of Education256

Vote 6
9
that the progressed grade 12 learners acquire the basic foundational skills needed for them to master the content of grade 12. A multiple academic support program will be rolled-out to ensure that this cohort of learners adjust and cope with the high curriculum demand of grade 12. As of 2016, all schools have tracked all their learners from grade R-11 as a means to ensure that differentiated support is provided across the phases and grades with the deliberate intention of reducing the number of learners who are progressed across the system. The department will continue to work with its partners to build a strong working relationship which is aimed at assisting the department to wage a war against underperforming schools in the province. National School Nutrition Programme (NSNP) In 2016/17 the budget for feeding of learners is R334.971 million and about ±600 000 learners will benefit from this programme. NSNP is also used as a channel for local economic development and creation of job opportunities for the local people through the use of cooperatives as service providers and the unemployed parents of learners are appointed as Volunteer Food Handlers (VFHs) to prepare meals for learners. In 2016/17 an estimated 3 700 VFHs will be appointed, with a stipend of R1 000 per person per month. Revitalisation of Agricultural schools R 3 million has been budgeted for this programme of revitalisation of agricultural schools and it will be used to: Complete fencing around the Agricultural production units in rural areas for security purposes, Ensure sustainable production by reducing the risk of power outages through purchasing generators
for relevant schools, Purchasing of various agricultural equipment to ensure PATs (Practical Assessment Tasks) can be
completed as required by the curriculum, To cover running costs for startup enterprises at the various schools. Renovations at various schools in different sections of the farm as per the need, Drilling of boreholes to solve water problems for livestock and other farm animals at schools, barbwire fencing upgrade for various agricultural schools to ensure rotational grazing of natural veld
pastures. Bursaries Non Employees Allocation of bursaries to non-employees will continue to fulfil the mandate of the Free State Provincial Government to fund the performing students and those in financial needs. Province will offer about ±7 000 learners with bursaries and some will study in South Africa others in different countries. Bursaries will also be allocated to students to address the skills gap in the province. Once the students have completed their studies, they are placed in different departments according to their qualification for the internships or a learnership to gain experience of a work environment. The internship programme takes 12 months and some graduates will be absorbed in different departments where posts are vacant. Sport, Youth, Recreation, Arts & Culture (SYRAC) The allocation for 2016/17 financial year is R0.961 million which will be used for the following activities are planned to take place:
Matric Camps - Recreational Programs run for refreshing the learners after a day of formal lessons sessions.
Farm Schools Sport Hub Centres - Sport Festival to be held for each District so as to cater for the Farm Schools sector.
Physical Education in Schools - a monitored roll out of the Physical Education implementation in the Schools
Intensifying the Partnership relationships programmes
Vote 6
10
Educators’ Capacity building with training courses for the purpose of quality performance
Teacher Development In the 2016/17 financial year an amount of R32.725 has been allocated to fund the Consolidated Teacher Development Plans of DBE for 2016-2018. Some of the programmes are listed below:
CPTD Management System Induction of newly appointed SMTs and Teachers Competency assessment of School Principals Orientation and training of newly appointed School Governing Bodies Training of Library Personnel to manage libraries and promote reading Multi Grade Teaching Training of Principals in Curriculum & Financial Management Training teachers of all public schools (ordinary and special) on IT to facilitate e-learning, including
knowledge on the use of assistive technology Establishment and support of Professional Learning Communities Conducting Teacher self-Diagnostic Assessments Provision of Learning and Teaching Support Material (LTSM) For the 2017 Academic year, the Department will be procuring top-ups for the following: Grades 4-6 Natural Science and Technology. Grades 7-9 and 12 The Department will also continue to procure FET Literature Set Works during the 2016 financial year, for the 2017 academic year. Stationery for Section 20 and partial Section 21 schools will also be procured in order to ensure that learners are fully equipped for the academic year. School Infrastructure The Department has aligned its planning processes with the Infrastructure Norms and Standards published in November 2013 thereby compiling a plan for the next ten years. Resources have been allocated to finance the construction of new schools, to upgrade existing facilities and to renovate and refurbish dilapidated school facilities. Moreover funds have been allocated to attend to emergency maintenance and repairs as well as damages caused by unexpected events. The Department will finalise the appointment of technically qualified personnel in an effort to ensure that infrastructure delivery is expedited. All this is undertaken with the sole purpose of ensuring that the Department provides schools with an environment that is conducive to learning and teaching.
4. Reprioritisation
The Department, in conjunction with Provincial Treasury, has undertaken vigorous reprioritisation from 2016 MTEF from goods and services in order to fund critical provincial and national priorities. This will mean trading off between the Department’s competing priorities and effective management of personnel. The Department has centralised the function of appointment of employees at head office and filling of critical vacant post, in order to optimise the available resource while ensuring that the quality of education is not compromised. It has also implemented cost containment measures to avoid overspending of the allocation.
5. Procurement
The huge reduction in goods and services budget as well as building and other fixed structure automatically direct the department to focus on continues improvement in the efficiency and effectiveness of the supply management system. The department is responsible for procurement of rural
VOTE 6 - Department of Education 257
Vote 6
11
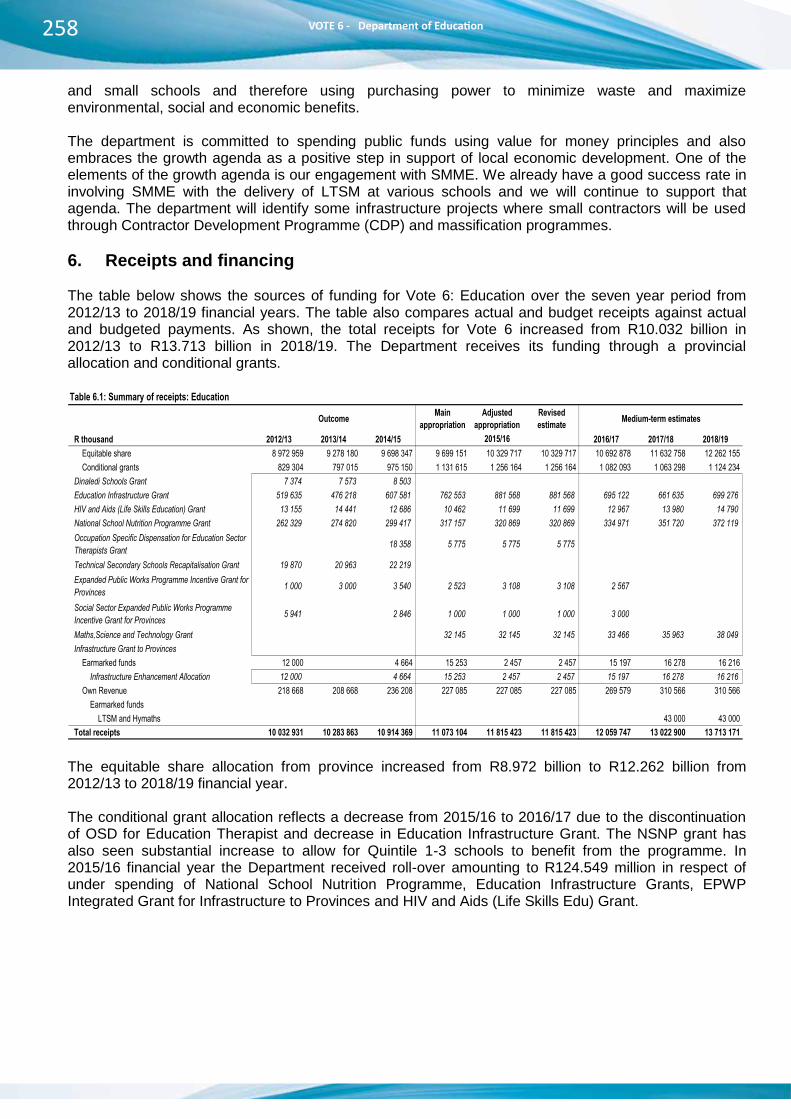
and small schools and therefore using purchasing power to minimize waste and maximize environmental, social and economic benefits. The department is committed to spending public funds using value for money principles and also embraces the growth agenda as a positive step in support of local economic development. One of the elements of the growth agenda is our engagement with SMME. We already have a good success rate in involving SMME with the delivery of LTSM at various schools and we will continue to support that agenda. The department will identify some infrastructure projects where small contractors will be used through Contractor Development Programme (CDP) and massification programmes. 6. Receipts and financing The table below shows the sources of funding for Vote 6: Education over the seven year period from 2012/13 to 2018/19 financial years. The table also compares actual and budget receipts against actual and budgeted payments. As shown, the total receipts for Vote 6 increased from R10.032 billion in 2012/13 to R13.713 billion in 2018/19. The Department receives its funding through a provincial allocation and conditional grants. Table 6.1: Summary of receipts: Education
Outcome Main appropriation
Adjusted appropriation
Revised estimate Medium-term estimates
R thousand 2012/13 2013/14 2014/15 2016/17 2017/18 2018/19Equitable share 8 972 959 9 278 180 9 698 347 9 699 151 10 329 717 10 329 717 10 692 878 11 632 758 12 262 155 Conditional grants 829 304 797 015 975 150 1 131 615 1 256 164 1 256 164 1 082 093 1 063 298 1 124 234
Dinaledi Schools Grant 7 374 7 573 8 503 - - - - - - Education Infrastructure Grant 519 635 476 218 607 581 762 553 881 568 881 568 695 122 661 635 699 276 HIV and Aids (Life Skills Education) Grant 13 155 14 441 12 686 10 462 11 699 11 699 12 967 13 980 14 790 National School Nutrition Programme Grant 262 329 274 820 299 417 317 157 320 869 320 869 334 971 351 720 372 119 Occupation Specific Dispensation for Education Sector Therapists Grant - - 18 358 5 775 5 775 5 775 - - -
Technical Secondary Schools Recapitalisation Grant 19 870 20 963 22 219 - - - - - Expanded Public Works Programme Incentive Grant for Provinces 1 000 3 000 3 540 2 523 3 108 3 108 2 567 - -
Social Sector Expanded Public Works Programme Incentive Grant for Provinces 5 941 - 2 846 1 000 1 000 1 000 3 000 - -
Maths,Science and Technology Grant 32 145 32 145 32 145 33 466 35 963 38 049 Infrastructure Grant to Provinces - - - - - - - - -
Earmarked funds 12 000 - 4 664 15 253 2 457 2 457 15 197 16 278 16 216 Infrastructure Enhancement Allocation 12 000 4 664 15 253 2 457 2 457 15 197 16 278 16 216
Own Revenue 218 668 208 668 236 208 227 085 227 085 227 085 269 579 310 566 310 566 Earmarked funds
LTSM and Hymaths 43 000 43 000 Total receipts 10 032 931 10 283 863 10 914 369 11 073 104 11 815 423 11 815 423 12 059 747 13 022 900 13 713 171
2015/16
The equitable share allocation from province increased from R8.972 billion to R12.262 billion from 2012/13 to 2018/19 financial year. The conditional grant allocation reflects a decrease from 2015/16 to 2016/17 due to the discontinuation of OSD for Education Therapist and decrease in Education Infrastructure Grant. The NSNP grant has also seen substantial increase to allow for Quintile 1-3 schools to benefit from the programme. In 2015/16 financial year the Department received roll-over amounting to R124.549 million in respect of under spending of National School Nutrition Programme, Education Infrastructure Grants, EPWP Integrated Grant for Infrastructure to Provinces and HIV and Aids (Life Skills Edu) Grant.
VOTE 6 - Department of Education258
Vote 6
11
and small schools and therefore using purchasing power to minimize waste and maximize environmental, social and economic benefits. The department is committed to spending public funds using value for money principles and also embraces the growth agenda as a positive step in support of local economic development. One of the elements of the growth agenda is our engagement with SMME. We already have a good success rate in involving SMME with the delivery of LTSM at various schools and we will continue to support that agenda. The department will identify some infrastructure projects where small contractors will be used through Contractor Development Programme (CDP) and massification programmes. 6. Receipts and financing The table below shows the sources of funding for Vote 6: Education over the seven year period from 2012/13 to 2018/19 financial years. The table also compares actual and budget receipts against actual and budgeted payments. As shown, the total receipts for Vote 6 increased from R10.032 billion in 2012/13 to R13.713 billion in 2018/19. The Department receives its funding through a provincial allocation and conditional grants. Table 6.1: Summary of receipts: Education
Outcome Main appropriation
Adjusted appropriation
Revised estimate Medium-term estimates
R thousand 2012/13 2013/14 2014/15 2016/17 2017/18 2018/19Equitable share 8 972 959 9 278 180 9 698 347 9 699 151 10 329 717 10 329 717 10 692 878 11 632 758 12 262 155 Conditional grants 829 304 797 015 975 150 1 131 615 1 256 164 1 256 164 1 082 093 1 063 298 1 124 234
Dinaledi Schools Grant 7 374 7 573 8 503 - - - - - - Education Infrastructure Grant 519 635 476 218 607 581 762 553 881 568 881 568 695 122 661 635 699 276 HIV and Aids (Life Skills Education) Grant 13 155 14 441 12 686 10 462 11 699 11 699 12 967 13 980 14 790 National School Nutrition Programme Grant 262 329 274 820 299 417 317 157 320 869 320 869 334 971 351 720 372 119 Occupation Specific Dispensation for Education Sector Therapists Grant - - 18 358 5 775 5 775 5 775 - - -
Technical Secondary Schools Recapitalisation Grant 19 870 20 963 22 219 - - - - - Expanded Public Works Programme Incentive Grant for Provinces 1 000 3 000 3 540 2 523 3 108 3 108 2 567 - -
Social Sector Expanded Public Works Programme Incentive Grant for Provinces 5 941 - 2 846 1 000 1 000 1 000 3 000 - -
Maths,Science and Technology Grant 32 145 32 145 32 145 33 466 35 963 38 049 Infrastructure Grant to Provinces - - - - - - - - -
Earmarked funds 12 000 - 4 664 15 253 2 457 2 457 15 197 16 278 16 216 Infrastructure Enhancement Allocation 12 000 4 664 15 253 2 457 2 457 15 197 16 278 16 216
Own Revenue 218 668 208 668 236 208 227 085 227 085 227 085 269 579 310 566 310 566 Earmarked funds
LTSM and Hymaths 43 000 43 000 Total receipts 10 032 931 10 283 863 10 914 369 11 073 104 11 815 423 11 815 423 12 059 747 13 022 900 13 713 171
2015/16
The equitable share allocation from province increased from R8.972 billion to R12.262 billion from 2012/13 to 2018/19 financial year. The conditional grant allocation reflects a decrease from 2015/16 to 2016/17 due to the discontinuation of OSD for Education Therapist and decrease in Education Infrastructure Grant. The NSNP grant has also seen substantial increase to allow for Quintile 1-3 schools to benefit from the programme. In 2015/16 financial year the Department received roll-over amounting to R124.549 million in respect of under spending of National School Nutrition Programme, Education Infrastructure Grants, EPWP Integrated Grant for Infrastructure to Provinces and HIV and Aids (Life Skills Edu) Grant.
Vote 6
12
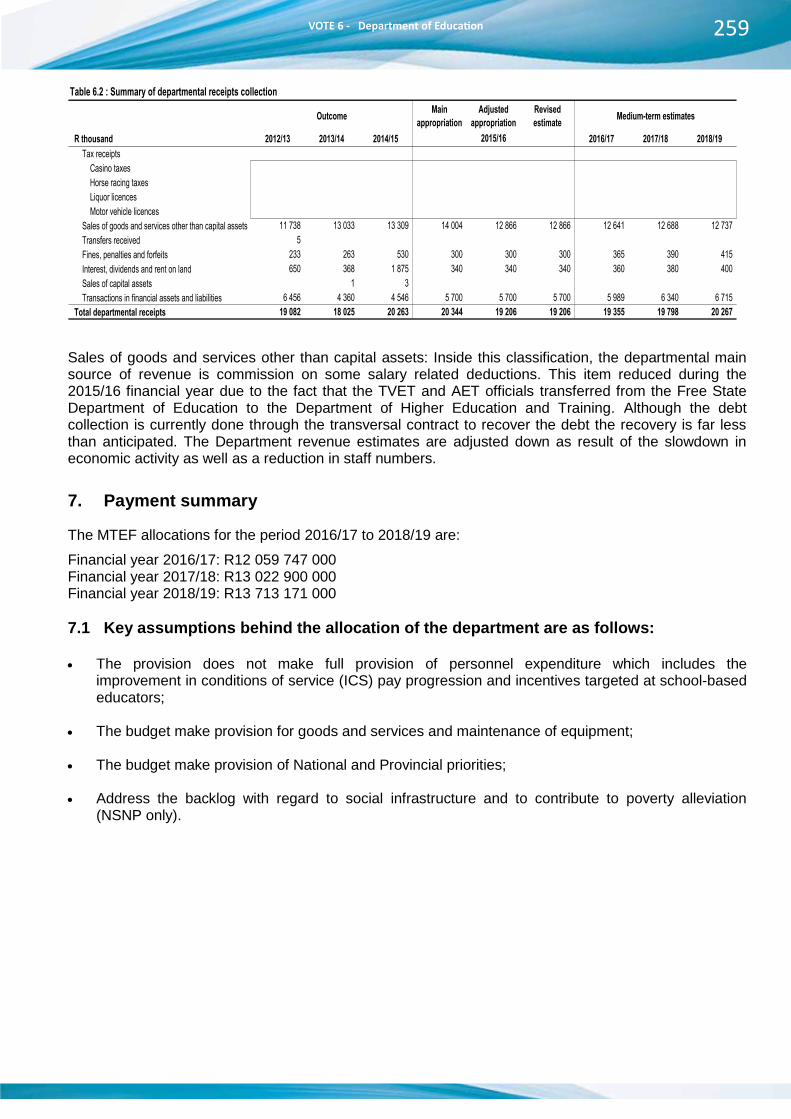
Table 6.2 : Summary of departmental receipts collection
Outcome Main appropriation
Adjusted appropriation
Revised estimate Medium-term estimates
R thousand 2012/13 2013/14 2014/15 2016/17 2017/18 2018/19Tax receipts – – – – – – – – –
Casino taxes – – – – – – – – – Horse racing taxes – – – – – – – – – Liquor licences – – – – – – – – – Motor vehicle licences – – – – – – – – –
Sales of goods and services other than capital assets 11 738 13 033 13 309 14 004 12 866 12 866 12 641 12 688 12 737 Transfers received 5 – – – – – – – – Fines, penalties and forfeits 233 263 530 300 300 300 365 390 415 Interest, dividends and rent on land 650 368 1 875 340 340 340 360 380 400 Sales of capital assets – 1 3 – – – – – – Transactions in financial assets and liabilities 6 456 4 360 4 546 5 700 5 700 5 700 5 989 6 340 6 715
Total departmental receipts 19 082 18 025 20 263 20 344 19 206 19 206 19 355 19 798 20 267
2015/16
abchap1a Sales of goods and services other than capital assets: Inside this classification, the departmental main source of revenue is commission on some salary related deductions. This item reduced during the 2015/16 financial year due to the fact that the TVET and AET officials transferred from the Free State Department of Education to the Department of Higher Education and Training. Although the debt collection is currently done through the transversal contract to recover the debt the recovery is far less than anticipated. The Department revenue estimates are adjusted down as result of the slowdown in economic activity as well as a reduction in staff numbers.
7. Payment summary
The MTEF allocations for the period 2016/17 to 2018/19 are:
Financial year 2016/17: R12 059 747 000 Financial year 2017/18: R13 022 900 000 Financial year 2018/19: R13 713 171 000 7.1 Key assumptions behind the allocation of the department are as follows: The provision does not make full provision of personnel expenditure which includes the
improvement in conditions of service (ICS) pay progression and incentives targeted at school-based educators;
The budget make provision for goods and services and maintenance of equipment;
The budget make provision of National and Provincial priorities;
Address the backlog with regard to social infrastructure and to contribute to poverty alleviation (NSNP only).
VOTE 6 - Department of Education 259

Vote 6
13
7.2 Programme summary Table 6.3 : Summary of payments and estimates by programme: Education
Outcome Main appropriation
Adjusted appropriation
Revised estimate Medium-term estimates
R thousand 2012/13 2013/14 2014/15 2016/17 2017/18 2018/191. Administration 751 275 856 646 843 494 926 557 885 662 883 860 931 718 1 064 738 1 047 537 2. Public Ordinary School Education 7 648 596 8 079 652 8 540 779 8 358 192 8 537 679 9 120 081 9 078 437 9 733 329 10 368 820 3. Independent School Subsidies 45 801 40 367 66 504 66 172 61 172 66 172 70 074 71 873 76 332 4. Public Special School Education 312 544 354 697 382 949 387 827 411 345 416 206 426 878 454 968 481 549 5. Early Childhood Development 86 295 120 709 129 919 128 534 125 791 124 217 151 586 159 928 168 153 6. Infrastructure Development 530 776 423 304 493 096 780 329 887 133 887 929 712 886 677 913 715 492 7. Examination And Education Related Services 681 482 682 256 895 073 890 493 906 641 916 285 688 168 860 151 855 288 Total payments and estimates 10 056 769 10 557 631 11 351 814 11 538 104 11 815 423 12 414 750 12 059 747 13 022 900 13 713 171
2015/16
The service rendered by the department are categorised under seven programmes, which are largely aligned to the uniform budget and programme structure of the Education sector. Table 6.3 provide summary of the vote’s payments and budgeted estimates by programme for seven year period from 2012/13 to 2018/19 financial years. All programmes except Programme 2: Public Ordinary School Education, Programme 6: Infrastructure Development and Programme 7: Examination and Education Related shows positive growth from 2015/16 to 2016/17 financial year and this is due to budget cuts implemented due to weak economic growth. Tabchap2a 7.3 Summary of Economic Classification Table 6.4 : Summary of provincial payments and estimates by economic classification: Education
Outcome Main appropriation
Adjusted appropriation
Revised estimate Medium-term estimates
R thousand 2012/13 2013/14 2014/15 2016/17 2017/18 2018/19Current payments 8 518 369 8 931 571 9 513 042 9 282 394 9 502 034 10 051 560 10 202 256 11 103 719 11 735 859
Compensation of employees 7 844 142 8 414 360 8 761 787 8 681 725 8 843 034 9 397 839 9 393 355 10 092 639 10 798 585 Goods and services 674 227 517 211 750 976 600 669 658 460 653 152 806 901 1 000 495 933 694 Interest and rent on land – – 279 – 540 569 2 000 10 585 3 580
Transfers and subsidies to: 1 050 445 1 288 267 1 447 117 1 505 504 1 509 000 1 559 297 1 167 069 1 245 681 1 278 565 Provinces and municipalities – – – – – -1 – – – Departmental agencies and accounts 7 832 7 036 8 8 658 8 881 8 880 28 082 30 180 32 292 Higher education institutions – – – – – – – – – Foreign governments and international organisations – – – – – – – – – Public corporations and private enterprises – – – – – – – – – Non-profit institutions 872 544 999 730 994 158 1 038 246 1 041 476 1 043 785 1 101 387 1 177 821 1 208 573 Households 170 069 281 501 452 951 458 600 458 643 506 633 37 600 37 680 37 700
Payments for capital assets 487 659 337 729 385 593 750 206 804 389 803 888 690 422 673 500 698 748 Buildings and other fixed structures 448 314 325 867 374 643 740 340 788 401 788 984 672 886 635 063 667 599 Machinery and equipment 38 885 11 862 10 950 9 866 13 279 12 437 13 336 34 417 31 149 Heritage Assets – – – – – – – – – Specialised military assets – – – – – – – – – Biological assets – – – – – – – – – Land and sub-soil assets – – – – – – – – – Software and other intangible assets 460 – – – 2 709 2 467 4 200 4 020 –
Payments for financial assets 296 64 6 062 – – 5 – – –
Total economic classification 10 056 769 10 557 631 11 351 814 11 538 104 11 815 423 12 414 750 12 059 747 13 022 900 13 713 171
2015/16
Tabchap3a The allocation for compensation of employees and goods and services shows a decrease from 2015/16 to 2016/17 financial due to budget cuts. Transfers and subsidies show significant increase because the allocations to schools are allocated according to the national target set by Department of Basic Education.
VOTE 6 - Department of Education
Vote 6
14
7.4 Infrastructure payments
7.4.1 Departmental Infrastructure payments
The total infrastructure adjusted budget for 2015/16 financial year amounts to R684.887.929 million, R649.563 million in 2016/17, R685.7253 million for the 2017/18 and R715.492 million 2018/19 financial years, these funds exclude the non-infrastructure allocation received that is also funded with the Education Infrastructure Grant (EIG) and the EPWP Incentive grant.
Table 6.5: Summary of departmental Infrastructure Payments per programme: Education
Outcome Main appropriation
Adjusted appropriation
Revised estimate Medium-term estimates
R thousand 2012/13 2013/14 2014/15 2016/17 2017/18 2018/19Programme 6: Infrastructure Development 530 776 423 305 406 954 755 329 866 633 867 429 684 886 649 563 685 725 Total payments and estimates: 530 776 423 305 406 954 755 329 866 633 867 429 684 886 649 563 685 725
2015/16
Table 6.6 : Summary of payments and estimates by economic classification: Infrastructure Development
Outcome Main appropriation
Adjusted appropriation
Revised estimate Medium-term estimates
R thousand 2012/13 2013/14 2014/15 2016/17 2017/18 2018/19Current payments 18 447 21 765 17 041 14 989 76 732 76 945 12 000 14 500 18 126
Compensation of employees – – – – – – – – – Goods and services 18 447 21 765 10 455 14 989 76 732 76 945 12 000 14 500 18 126 Interest and rent on land – – – – – – – – –
Transfers and subsidies to: 64 015 75 673 9 355 – – – – – – Provinces and municipalities – – – – – – – – – Departmental agencies and accounts – – – – – – – – – Higher education institutions – – – – – – – – – Foreign governments and international organisations – – – – – – – – – Public corporations and private enterprises – – – – – – – – – Non-profit institutions 64 015 75 673 9 355 – – – – – – Households – – – – – – – – –
Payments for capital assets 448 314 325 867 380 558 740 340 789 901 790 484 672 886 635 063 667 599 Buildings and other fixed structures 448 314 325 867 374 643 740 340 788 401 788 984 672 886 635 063 667 599 Machinery and equipment – – 5 915 – 1 500 1 500 – – – Heritage Assets – – – – – – – – – Specialised military assets – – – – – – – – – Biological assets – – – – – – – – – Land and sub-soil assets – – – – – – – – – Software and other intangible assets – – – – – – – – –
Payments for financial assets – – – – – – – – –
Total economic classification 530 776 423 305 406 954 755 329 866 633 867 429 684 886 649 563 685 725
2015/16
The following priorities will be implemented under Infrastructure Development: Construction of new schools and hostels The construction of 23 school and 6 hostel projects has been planned for the 2016/17 financial year amounting to the budget of R230.2 million. The construction of new schools include 21 schools that are already in the implementation stage as well as two (2) new schools that will commence in 2016/17. These schools are Morena Tshohisi Moloi in Qwaqwa and Vogelfontein in Bethlehem. Upgrades and additions The department will undertake 25 upgrades and additions programmes at a cost of R319.8 million. These projects accommodate 281 schools located in various provincial districts. Included in this
260

Vote 6
13
7.2 Programme summary Table 6.3 : Summary of payments and estimates by programme: Education
Outcome Main appropriation
Adjusted appropriation
Revised estimate Medium-term estimates
R thousand 2012/13 2013/14 2014/15 2016/17 2017/18 2018/191. Administration 751 275 856 646 843 494 926 557 885 662 883 860 931 718 1 064 738 1 047 537 2. Public Ordinary School Education 7 648 596 8 079 652 8 540 779 8 358 192 8 537 679 9 120 081 9 078 437 9 733 329 10 368 820 3. Independent School Subsidies 45 801 40 367 66 504 66 172 61 172 66 172 70 074 71 873 76 332 4. Public Special School Education 312 544 354 697 382 949 387 827 411 345 416 206 426 878 454 968 481 549 5. Early Childhood Development 86 295 120 709 129 919 128 534 125 791 124 217 151 586 159 928 168 153 6. Infrastructure Development 530 776 423 304 493 096 780 329 887 133 887 929 712 886 677 913 715 492 7. Examination And Education Related Services 681 482 682 256 895 073 890 493 906 641 916 285 688 168 860 151 855 288 Total payments and estimates 10 056 769 10 557 631 11 351 814 11 538 104 11 815 423 12 414 750 12 059 747 13 022 900 13 713 171
2015/16
The service rendered by the department are categorised under seven programmes, which are largely aligned to the uniform budget and programme structure of the Education sector. Table 6.3 provide summary of the vote’s payments and budgeted estimates by programme for seven year period from 2012/13 to 2018/19 financial years. All programmes except Programme 2: Public Ordinary School Education, Programme 6: Infrastructure Development and Programme 7: Examination and Education Related shows positive growth from 2015/16 to 2016/17 financial year and this is due to budget cuts implemented due to weak economic growth. Tabchap2a 7.3 Summary of Economic Classification Table 6.4 : Summary of provincial payments and estimates by economic classification: Education
Outcome Main appropriation
Adjusted appropriation
Revised estimate Medium-term estimates
R thousand 2012/13 2013/14 2014/15 2016/17 2017/18 2018/19Current payments 8 518 369 8 931 571 9 513 042 9 282 394 9 502 034 10 051 560 10 202 256 11 103 719 11 735 859
Compensation of employees 7 844 142 8 414 360 8 761 787 8 681 725 8 843 034 9 397 839 9 393 355 10 092 639 10 798 585 Goods and services 674 227 517 211 750 976 600 669 658 460 653 152 806 901 1 000 495 933 694 Interest and rent on land – – 279 – 540 569 2 000 10 585 3 580
Transfers and subsidies to: 1 050 445 1 288 267 1 447 117 1 505 504 1 509 000 1 559 297 1 167 069 1 245 681 1 278 565 Provinces and municipalities – – – – – -1 – – – Departmental agencies and accounts 7 832 7 036 8 8 658 8 881 8 880 28 082 30 180 32 292 Higher education institutions – – – – – – – – – Foreign governments and international organisations – – – – – – – – – Public corporations and private enterprises – – – – – – – – – Non-profit institutions 872 544 999 730 994 158 1 038 246 1 041 476 1 043 785 1 101 387 1 177 821 1 208 573 Households 170 069 281 501 452 951 458 600 458 643 506 633 37 600 37 680 37 700
Payments for capital assets 487 659 337 729 385 593 750 206 804 389 803 888 690 422 673 500 698 748 Buildings and other fixed structures 448 314 325 867 374 643 740 340 788 401 788 984 672 886 635 063 667 599 Machinery and equipment 38 885 11 862 10 950 9 866 13 279 12 437 13 336 34 417 31 149 Heritage Assets – – – – – – – – – Specialised military assets – – – – – – – – – Biological assets – – – – – – – – – Land and sub-soil assets – – – – – – – – – Software and other intangible assets 460 – – – 2 709 2 467 4 200 4 020 –
Payments for financial assets 296 64 6 062 – – 5 – – –
Total economic classification 10 056 769 10 557 631 11 351 814 11 538 104 11 815 423 12 414 750 12 059 747 13 022 900 13 713 171
2015/16
Tabchap3a The allocation for compensation of employees and goods and services shows a decrease from 2015/16 to 2016/17 financial due to budget cuts. Transfers and subsidies show significant increase because the allocations to schools are allocated according to the national target set by Department of Basic Education.
Vote 6
14
7.4 Infrastructure payments
7.4.1 Departmental Infrastructure payments
The total infrastructure adjusted budget for 2015/16 financial year amounts to R684.887.929 million, R649.563 million in 2016/17, R685.7253 million for the 2017/18 and R715.492 million 2018/19 financial years, these funds exclude the non-infrastructure allocation received that is also funded with the Education Infrastructure Grant (EIG) and the EPWP Incentive grant.
Table 6.5: Summary of departmental Infrastructure Payments per programme: Education
Outcome Main appropriation
Adjusted appropriation
Revised estimate Medium-term estimates
R thousand 2012/13 2013/14 2014/15 2016/17 2017/18 2018/19Programme 6: Infrastructure Development 530 776 423 305 406 954 755 329 866 633 867 429 684 886 649 563 685 725 Total payments and estimates: 530 776 423 305 406 954 755 329 866 633 867 429 684 886 649 563 685 725
2015/16
Table 6.6 : Summary of payments and estimates by economic classification: Infrastructure Development
Outcome Main appropriation
Adjusted appropriation
Revised estimate Medium-term estimates
R thousand 2012/13 2013/14 2014/15 2016/17 2017/18 2018/19Current payments 18 447 21 765 17 041 14 989 76 732 76 945 12 000 14 500 18 126
Compensation of employees – – – – – – – – – Goods and services 18 447 21 765 10 455 14 989 76 732 76 945 12 000 14 500 18 126 Interest and rent on land – – – – – – – – –
Transfers and subsidies to: 64 015 75 673 9 355 – – – – – – Provinces and municipalities – – – – – – – – – Departmental agencies and accounts – – – – – – – – – Higher education institutions – – – – – – – – – Foreign governments and international organisations – – – – – – – – – Public corporations and private enterprises – – – – – – – – – Non-profit institutions 64 015 75 673 9 355 – – – – – – Households – – – – – – – – –
Payments for capital assets 448 314 325 867 380 558 740 340 789 901 790 484 672 886 635 063 667 599 Buildings and other fixed structures 448 314 325 867 374 643 740 340 788 401 788 984 672 886 635 063 667 599 Machinery and equipment – – 5 915 – 1 500 1 500 – – – Heritage Assets – – – – – – – – – Specialised military assets – – – – – – – – – Biological assets – – – – – – – – – Land and sub-soil assets – – – – – – – – – Software and other intangible assets – – – – – – – – –
Payments for financial assets – – – – – – – – –
Total economic classification 530 776 423 305 406 954 755 329 866 633 867 429 684 886 649 563 685 725
2015/16
The following priorities will be implemented under Infrastructure Development: Construction of new schools and hostels The construction of 23 school and 6 hostel projects has been planned for the 2016/17 financial year amounting to the budget of R230.2 million. The construction of new schools include 21 schools that are already in the implementation stage as well as two (2) new schools that will commence in 2016/17. These schools are Morena Tshohisi Moloi in Qwaqwa and Vogelfontein in Bethlehem. Upgrades and additions The department will undertake 25 upgrades and additions programmes at a cost of R319.8 million. These projects accommodate 281 schools located in various provincial districts. Included in this
VOTE 6 - Department of Education 261

Vote 6
15
programme is the construction of Administration Blocks, Additional Classrooms, Ablution Facilities, Grade R Classes, Special Schools, Nutrition Centres as well as Perimetre Fencing of schools. Renovation and refurbishment The department has earmarked 11 renovation and refurbishment programmes at a budget cost of R122.7 million. At a project level these programmes will be effected at 95 schools across the province. These projects will include among others Hostel renovations, General School renovations, Farm Schools Renovation, Facilities management as well as renovation to departmental Buildings. Maintenance The department has allocated R12 million to address emergency maintenance requirements like burst pipes, electrical malfunction, broken windows etc. Human resource capacity building To address the capacity challenges, the department has allocated R20 million for the 2016/17 financial year for the appointment of technically qualified personnel in the built environment. This programme is undertaken in collaboration with the Department of Basic Education and the National Treasury.
7.5 Conditional Grants Table 6.7: Summary of conditional grant payments per programme: Education
Outcome Main appropriation
Adjusted appropriation
Revised estimate Medium-term estimates
R thousand 2012/13 2013/14 2014/15 2016/17 2017/18 2018/19Programme 1: Administration 767 8 000 - - - - - - - Education Infrastructure Grant 767 8 000
Programme 2: Public Ordinary School Education 287 282 303 356 325 454 349 302 353 014 353 014 368 437 387 683 410 168
National School Nutrition Programme 257 762 274 820 292 948 317 157 320 869 320 869 334 971 351 720 372 119 Dinaledi Schools Grant 5 184 7 573 8 047 Technical Secondary Schools Recapitalisation Grant 19 594 20 963 22 219 Maths, Science and Technology Grant 32 145 32 145 32 145 33 466 35 963 38 049 Social Sector Expanded Public Works Programme Incentive Grant 4 742 2 240
Programme 4: Public Special School Education - - 18 358 5 775 5 775 5 775 - - - OSD for therapists 18 358 5 775 5 775 5 775 Programme 5: Early Childhood Development - - - 1 000 1 000 1 000 3 000 - - Social Sector Expanded Public Works Programme Incentive Grant 1 000 1 000 1 000 3 000
Programme 6: Infrastructure Development 512 581 471 218 491 195 765 076 884 676 884 676 697 689 661 635 699 276 Education Infrastructure Grant 511 581 468 218 488 566 762 553 881 568 881 568 695 122 661 635 699 276 Expanded Public Works Programme Integrated Grant for Provinces 1 000 3 000 2 629 2 523 3 108 3 108 2 567
Infrastructure Grant to ProvincesProgramme 7: Examinations and Education related services 9 910 14 441 10 931 10 462 11 699 11 699 12 967 13 980 14 790
HIV/AIDS 9 910 14 441 10 931 10 462 11 699 11 699 12 967 13 980 14 790
Total payments and estimates: 810 540 797 015 845 938 1 131 615 1 256 164 1 256 164 1 082 093 1 063 298 1 124 234
2015/16
VOTE 6 - Department of Education
Vote 6
16
Table 6.8: Summary of conditional grant payments by economic classification: Education
Outcome Main appropriation
Adjusted appropriation
Revised estimate Medium-term estimates
R thousand 2012/13 2013/14 2014/15 2016/17 2017/18 2018/19Current payments 39 491 57 456 142 224 95 466 153 921 155 301 84 679 98 304 108 859
Compensation of employees 5 918 9 005 26 670 25 975 17 595 17 942 24 400 22 440 23 490 Goods and services 33 573 48 451 115 554 69 491 136 326 137 359 60 279 75 864 85 369 Interest and rent on land - - - - - - - -
Transfers and subsidies to: 336 487 368 612 324 195 308 970 311 970 310 855 337 055 343 479 359 777 Provinces and municipalities - - - - - - - - Departmental agencies and accounts - - - - - - - - Universities and technikons - - - - - - - - Foreign governments and international organisations - - - - - - - - Public corporations and private enterprises - - - - - - - - Non-profit institutions 336 487 368 612 324 136 308 970 311 970 310 855 337 055 343 479 359 777 Households - - 59 - - - - - -
Payments for capital assets 434 562 370 947 379 409 727 179 790 273 790 008 660 359 621 515 655 598 Buildings and other fixed structures 434 273 370 545 373 466 727 087 787 544 787 331 659 689 621 285 654 508 Machinery and equipment 289 402 5 943 92 2 729 2 677 670 230 1 090 Software and other intangible assets - - - - - - - -
Payments for financial assets 110
Total economic classification: 810 540 797 015 845 938 1 131 615 1 256 164 1 256 164 1 082 093 1 063 298 1 124 234
2015/16
7.6 Non-infrastructure projects Table 6.9: Summary of non-infrastructure projects: Education
National & Provincial Priorities Outcome Main appropriation
Adjusted appropriation
Revised estimate Medium-term estimates
R thousand 2012/13 2013/14 2014/15 2016/17 2017/18 2018/19National Priorities 769 077 560 477 688 229 722 395 734 895 744 033 760 012 844 634 847 598 Norms and Standards for school funding 490 231 466 378 632 853 610 637 610 637 619 775 666 016 701 831 701 831 Inclusive Education 5 322 6 407 5 616 5 616 5 616 8 800 7 890 8 300 Teacher Development 30 227 15 227 15 227 32 725 35 174 37 638 LTSM Enhancement 34 382 27 347 31 663 50 000 82 500 82 500 17 970 52 095 52 095 CAPS 225 178 38 075 EMIS 600 4 833 4 815 4 815 4 815 4 815 7 130 7 220 Maths and Science 10 715 5 356 Literacy and Numeracy 373 12 000 7 000 7 000 2 000 12 146 12 146 Exemption of schools fee 6 042 6 704 6 704 Expansion of Gr R 7 971 12 793 17 306 9 100 9 100 9 100 21 644 21 664 21 664 Provincial Priorities 242 233 417 860 526 485 614 723 607 542 607 542 444 981 534 274 547 726 Provincial Bursaries 125 327 222 612 380 451 450 000 450 000 450 000 261 315 298 608 310 566 Learner support
Learner Transport 42 402 49 117 63 517 5 845 5 845 Hostel Support 30 969 51 731 60 149 60 000 60 000 60 000 32 000 68 000 72 000 NSNP Supplement 1 800 8 342
Kagisho Trust 11 073 8 060 5 590 2 223 2 223 2 223 10 000 30 000 25 000 Kagisho & Shanduka Trust 5 327 Hymaths 9 900 16 700 14 400 29 000 24 000 24 000 12 000 19 780 19 780 Matric support programme 17 526 35 343 2 378 40 000 40 000 40 000 51 655 51 655 51 655 ELITS 12 6 000 6 000 6 000 6 000 Incentives toTop Maths schools 648 1 500 1 500 1 500 1 500 1 500 1 500 Kutlwanong Trust 3 496 2 000 2 000 2 000 4 900 3 110 5 000 Revitalisation of Agricultural schools 4 000 3 000 3 000 3 000 3 000 3 000 3 000 Pre-Grade R training 575 1 061 1 057 1 057 SYRAC 300 1 000 1 274 1 274 961 1 014 1 070 School Connectivity 15 000 15 000 15 000 19 016 19 133 19 257 School furniture 3 205 9 080 10 000 455 741 School Management & governance 31 2 517 5 000 2 500 2 500 2 416 1 644 1 736 School Safety 757 748 790 Schools of trade 28 000 28 000 28 000 Finishing SchoolsEmployee Wellness 200 200 400 570 574
Total payments and estimates: 1 011 310 978 337 1 214 714 1 337 118 1 342 437 1 351 575 1 204 993 1 378 908 1 395 324
2015/16
262
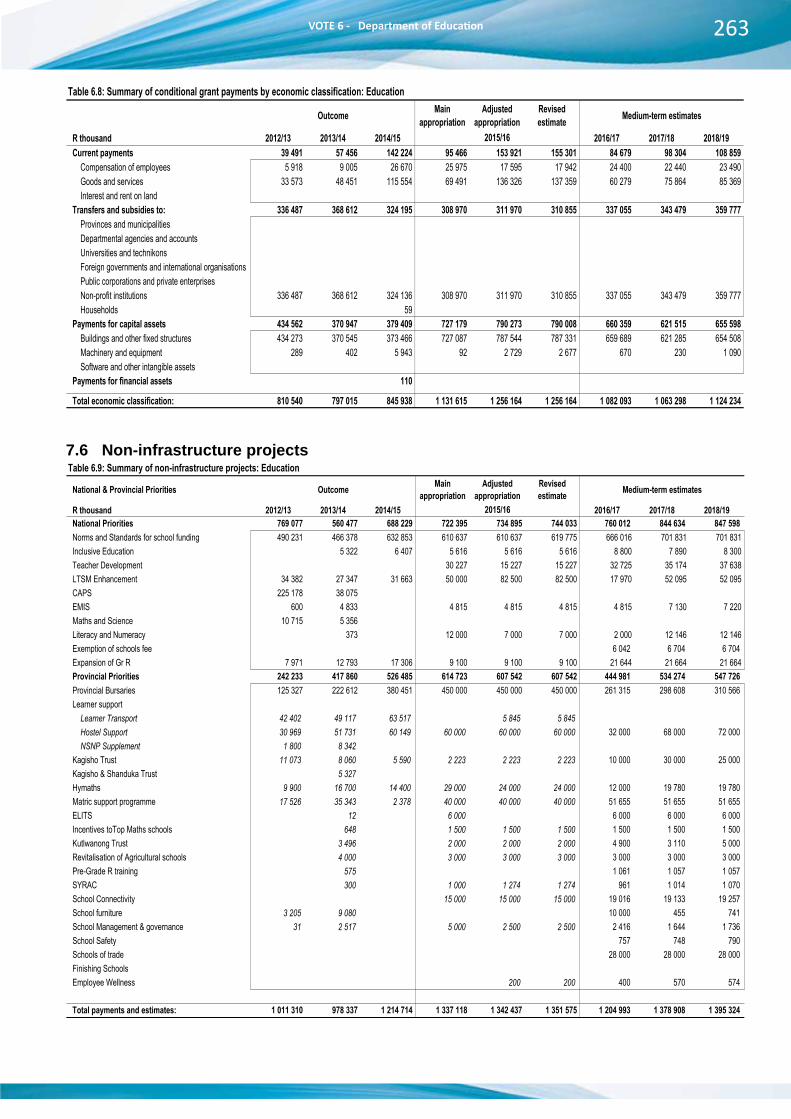
Vote 6
15
programme is the construction of Administration Blocks, Additional Classrooms, Ablution Facilities, Grade R Classes, Special Schools, Nutrition Centres as well as Perimetre Fencing of schools. Renovation and refurbishment The department has earmarked 11 renovation and refurbishment programmes at a budget cost of R122.7 million. At a project level these programmes will be effected at 95 schools across the province. These projects will include among others Hostel renovations, General School renovations, Farm Schools Renovation, Facilities management as well as renovation to departmental Buildings. Maintenance The department has allocated R12 million to address emergency maintenance requirements like burst pipes, electrical malfunction, broken windows etc. Human resource capacity building To address the capacity challenges, the department has allocated R20 million for the 2016/17 financial year for the appointment of technically qualified personnel in the built environment. This programme is undertaken in collaboration with the Department of Basic Education and the National Treasury.
7.5 Conditional Grants Table 6.7: Summary of conditional grant payments per programme: Education
Outcome Main appropriation
Adjusted appropriation
Revised estimate Medium-term estimates
R thousand 2012/13 2013/14 2014/15 2016/17 2017/18 2018/19Programme 1: Administration 767 8 000 - - - - - - - Education Infrastructure Grant 767 8 000
Programme 2: Public Ordinary School Education 287 282 303 356 325 454 349 302 353 014 353 014 368 437 387 683 410 168
National School Nutrition Programme 257 762 274 820 292 948 317 157 320 869 320 869 334 971 351 720 372 119 Dinaledi Schools Grant 5 184 7 573 8 047 Technical Secondary Schools Recapitalisation Grant 19 594 20 963 22 219 Maths, Science and Technology Grant 32 145 32 145 32 145 33 466 35 963 38 049 Social Sector Expanded Public Works Programme Incentive Grant 4 742 2 240
Programme 4: Public Special School Education - - 18 358 5 775 5 775 5 775 - - - OSD for therapists 18 358 5 775 5 775 5 775 Programme 5: Early Childhood Development - - - 1 000 1 000 1 000 3 000 - - Social Sector Expanded Public Works Programme Incentive Grant 1 000 1 000 1 000 3 000
Programme 6: Infrastructure Development 512 581 471 218 491 195 765 076 884 676 884 676 697 689 661 635 699 276 Education Infrastructure Grant 511 581 468 218 488 566 762 553 881 568 881 568 695 122 661 635 699 276 Expanded Public Works Programme Integrated Grant for Provinces 1 000 3 000 2 629 2 523 3 108 3 108 2 567
Infrastructure Grant to ProvincesProgramme 7: Examinations and Education related services 9 910 14 441 10 931 10 462 11 699 11 699 12 967 13 980 14 790
HIV/AIDS 9 910 14 441 10 931 10 462 11 699 11 699 12 967 13 980 14 790
Total payments and estimates: 810 540 797 015 845 938 1 131 615 1 256 164 1 256 164 1 082 093 1 063 298 1 124 234
2015/16
Vote 6
16
Table 6.8: Summary of conditional grant payments by economic classification: Education
Outcome Main appropriation
Adjusted appropriation
Revised estimate Medium-term estimates
R thousand 2012/13 2013/14 2014/15 2016/17 2017/18 2018/19Current payments 39 491 57 456 142 224 95 466 153 921 155 301 84 679 98 304 108 859
Compensation of employees 5 918 9 005 26 670 25 975 17 595 17 942 24 400 22 440 23 490 Goods and services 33 573 48 451 115 554 69 491 136 326 137 359 60 279 75 864 85 369 Interest and rent on land - - - - - - - -
Transfers and subsidies to: 336 487 368 612 324 195 308 970 311 970 310 855 337 055 343 479 359 777 Provinces and municipalities - - - - - - - - Departmental agencies and accounts - - - - - - - - Universities and technikons - - - - - - - - Foreign governments and international organisations - - - - - - - - Public corporations and private enterprises - - - - - - - - Non-profit institutions 336 487 368 612 324 136 308 970 311 970 310 855 337 055 343 479 359 777 Households - - 59 - - - - - -
Payments for capital assets 434 562 370 947 379 409 727 179 790 273 790 008 660 359 621 515 655 598 Buildings and other fixed structures 434 273 370 545 373 466 727 087 787 544 787 331 659 689 621 285 654 508 Machinery and equipment 289 402 5 943 92 2 729 2 677 670 230 1 090 Software and other intangible assets - - - - - - - -
Payments for financial assets 110
Total economic classification: 810 540 797 015 845 938 1 131 615 1 256 164 1 256 164 1 082 093 1 063 298 1 124 234
2015/16
7.6 Non-infrastructure projects Table 6.9: Summary of non-infrastructure projects: Education
National & Provincial Priorities Outcome Main appropriation
Adjusted appropriation
Revised estimate Medium-term estimates
R thousand 2012/13 2013/14 2014/15 2016/17 2017/18 2018/19National Priorities 769 077 560 477 688 229 722 395 734 895 744 033 760 012 844 634 847 598 Norms and Standards for school funding 490 231 466 378 632 853 610 637 610 637 619 775 666 016 701 831 701 831 Inclusive Education 5 322 6 407 5 616 5 616 5 616 8 800 7 890 8 300 Teacher Development 30 227 15 227 15 227 32 725 35 174 37 638 LTSM Enhancement 34 382 27 347 31 663 50 000 82 500 82 500 17 970 52 095 52 095 CAPS 225 178 38 075 EMIS 600 4 833 4 815 4 815 4 815 4 815 7 130 7 220 Maths and Science 10 715 5 356 Literacy and Numeracy 373 12 000 7 000 7 000 2 000 12 146 12 146 Exemption of schools fee 6 042 6 704 6 704 Expansion of Gr R 7 971 12 793 17 306 9 100 9 100 9 100 21 644 21 664 21 664 Provincial Priorities 242 233 417 860 526 485 614 723 607 542 607 542 444 981 534 274 547 726 Provincial Bursaries 125 327 222 612 380 451 450 000 450 000 450 000 261 315 298 608 310 566 Learner support
Learner Transport 42 402 49 117 63 517 5 845 5 845 Hostel Support 30 969 51 731 60 149 60 000 60 000 60 000 32 000 68 000 72 000 NSNP Supplement 1 800 8 342
Kagisho Trust 11 073 8 060 5 590 2 223 2 223 2 223 10 000 30 000 25 000 Kagisho & Shanduka Trust 5 327 Hymaths 9 900 16 700 14 400 29 000 24 000 24 000 12 000 19 780 19 780 Matric support programme 17 526 35 343 2 378 40 000 40 000 40 000 51 655 51 655 51 655 ELITS 12 6 000 6 000 6 000 6 000 Incentives toTop Maths schools 648 1 500 1 500 1 500 1 500 1 500 1 500 Kutlwanong Trust 3 496 2 000 2 000 2 000 4 900 3 110 5 000 Revitalisation of Agricultural schools 4 000 3 000 3 000 3 000 3 000 3 000 3 000 Pre-Grade R training 575 1 061 1 057 1 057 SYRAC 300 1 000 1 274 1 274 961 1 014 1 070 School Connectivity 15 000 15 000 15 000 19 016 19 133 19 257 School furniture 3 205 9 080 10 000 455 741 School Management & governance 31 2 517 5 000 2 500 2 500 2 416 1 644 1 736 School Safety 757 748 790 Schools of trade 28 000 28 000 28 000 Finishing SchoolsEmployee Wellness 200 200 400 570 574
Total payments and estimates: 1 011 310 978 337 1 214 714 1 337 118 1 342 437 1 351 575 1 204 993 1 378 908 1 395 324
2015/16
VOTE 6 - Department of Education 263

Vote 6
17
8. Programmes
8.1 Programme 1: Administration Programme Objective To provide overall management of education system in accordance with the National Education Policy Act, Publication Finance Management Act and other policies.
Description and objectives Sub-programme 1.1: Office of the MEC To provide for the functioning of the office of the Member of Executive Council (MEC) for Education in line with the ministerial handbook. Sub-programme 1.2: Corporate Services To provide management services which are not education specific for the education system. Sub-programme 1.3: Education Management To provide education management services for the education system. Sub-programme 1.4: Human Resource Development To provide human resource development for office based staff. Sub-programme 1.5: Education Management Information Systems To provide an Education Management information System in accordance with the National Education Information Policy. Sub-programme 1.6: Conditional Grants To provide for projects under programme 1 specified by the Department of Basic Education and funded by Conditional Grants
Table 6.10 : Summary of payments and estimates by sub-programme: Administration
Outcome Main appropriation
Adjusted appropriation
Revised estimate Medium-term estimates
R thousand 2012/13 2013/14 2014/15 2016/17 2017/18 2018/191. Office of the MEC 5 784 8 193 8 731 8 694 9 096 8 604 12 387 13 972 13 701 2. Corporate Services 290 178 344 379 324 199 333 435 344 543 345 549 342 284 423 455 373 346 3. Education Management 437 813 488 383 498 012 540 329 508 882 506 837 544 637 589 773 620 130 4. Human Resource Development 11 865 5 812 8 297 35 274 16 010 15 702 23 800 26 300 28 709 5. Educ Management Information Systems 4 868 5 110 4 255 8 825 7 131 7 168 8 610 11 238 11 651 6. Conditional Grants 767 4 769 – – – – – – – Total payments and estimates 751 275 856 646 843 494 926 557 885 662 883 860 931 718 1 064 738 1 047 537
2015/16
Tabchap4a
VOTE 6 - Department of Education
Vote 6
18
Table 6.11 : Summary of payments and estimates by economic classification: Administration
Outcome Main appropriation
Adjusted appropriation
Revised estimate Medium-term estimates
R thousand 2012/13 2013/14 2014/15 2016/17 2017/18 2018/19Current payments 713 987 839 596 829 439 915 844 871 143 865 647 914 823 1 045 244 1 036 037
Compensation of employees 575 919 635 099 670 524 733 457 703 760 699 637 766 638 821 780 873 225 Goods and services 138 068 204 497 158 664 182 387 166 854 165 452 146 185 212 879 159 232 Interest and rent on land – – 251 – 529 558 2 000 10 585 3 580
Transfers and subsidies to: 2 977 6 024 7 793 2 459 2 501 7 373 2 759 2 838 2 858 Provinces and municipalities – – – – – -1 – – – Departmental agencies and accounts 3 3 8 13 12 13 24 23 23 Higher education institutions – – – – – – – – – Foreign governments and international organisations – – – – – – – – – Public corporations and private enterprises – – – – – – – – – Non-profit institutions 140 600 – – – – – – – Households 2 834 5 421 7 785 2 446 2 489 7 361 2 735 2 815 2 835
Payments for capital assets 34 015 10 962 3 928 8 254 12 018 10 837 14 136 16 656 8 642 Buildings and other fixed structures – – – – – – – – – Machinery and equipment 33 555 10 962 3 928 8 254 9 309 8 370 10 336 12 636 8 642 Heritage Assets – – – – – – – – – Specialised military assets – – – – – – – – – Biological assets – – – – – – – – – Land and sub-soil assets – – – – – – – – – Software and other intangible assets 460 – – – 2 709 2 467 3 800 4 020 –
Payments for financial assets 296 64 2 334 – – 3 – – –
Total economic classification 751 275 856 646 843 494 926 557 885 662 883 860 931 718 1 064 738 1 047 537
2015/16
Tabchap5a The following priorities are funded from this programme: A. National
Priorities 2016/17 BUDGET R’000
EXPLANATORY NOTES
1. Expansion of the Education Management Information System
4.815 The EMIS improvement project aims to improve the quality of education management information systems.
Deliverables include quality assurance of data collection, development of systems, development of capacity including human and hardware resources.
8.2 Programme 2: Public Ordinary School Education Programme Objective To provide public ordinary education from Grade 1 to Grade 12 in accordance with the South African Schools Act and White Paper 6 on inclusive education. (E-learning is also included)
Description and objectives Sub-programme 2.1: Public Primary Level To provide specific public primary ordinary schools (including inclusive education) with resources required for the Grades 1 to 7 levels. Sub-programme 2.2: Public Secondary Level To provide specific public secondary ordinary schools with resources required for the Grades 8 to 12 levels.
264

Vote 6
18
Table 6.11 : Summary of payments and estimates by economic classification: Administration
Outcome Main appropriation
Adjusted appropriation
Revised estimate Medium-term estimates
R thousand 2012/13 2013/14 2014/15 2016/17 2017/18 2018/19Current payments 713 987 839 596 829 439 915 844 871 143 865 647 914 823 1 045 244 1 036 037
Compensation of employees 575 919 635 099 670 524 733 457 703 760 699 637 766 638 821 780 873 225 Goods and services 138 068 204 497 158 664 182 387 166 854 165 452 146 185 212 879 159 232 Interest and rent on land – – 251 – 529 558 2 000 10 585 3 580
Transfers and subsidies to: 2 977 6 024 7 793 2 459 2 501 7 373 2 759 2 838 2 858 Provinces and municipalities – – – – – -1 – – – Departmental agencies and accounts 3 3 8 13 12 13 24 23 23 Higher education institutions – – – – – – – – – Foreign governments and international organisations – – – – – – – – – Public corporations and private enterprises – – – – – – – – – Non-profit institutions 140 600 – – – – – – – Households 2 834 5 421 7 785 2 446 2 489 7 361 2 735 2 815 2 835
Payments for capital assets 34 015 10 962 3 928 8 254 12 018 10 837 14 136 16 656 8 642 Buildings and other fixed structures – – – – – – – – – Machinery and equipment 33 555 10 962 3 928 8 254 9 309 8 370 10 336 12 636 8 642 Heritage Assets – – – – – – – – – Specialised military assets – – – – – – – – – Biological assets – – – – – – – – – Land and sub-soil assets – – – – – – – – – Software and other intangible assets 460 – – – 2 709 2 467 3 800 4 020 –
Payments for financial assets 296 64 2 334 – – 3 – – –
Total economic classification 751 275 856 646 843 494 926 557 885 662 883 860 931 718 1 064 738 1 047 537
2015/16
Tabchap5a The following priorities are funded from this programme: A. National
Priorities 2016/17 BUDGET R’000
EXPLANATORY NOTES
1. Expansion of the Education Management Information System
4.815 The EMIS improvement project aims to improve the quality of education management information systems.
Deliverables include quality assurance of data collection, development of systems, development of capacity including human and hardware resources.
8.2 Programme 2: Public Ordinary School Education Programme Objective To provide public ordinary education from Grade 1 to Grade 12 in accordance with the South African Schools Act and White Paper 6 on inclusive education. (E-learning is also included)
Description and objectives Sub-programme 2.1: Public Primary Level To provide specific public primary ordinary schools (including inclusive education) with resources required for the Grades 1 to 7 levels. Sub-programme 2.2: Public Secondary Level To provide specific public secondary ordinary schools with resources required for the Grades 8 to 12 levels.
VOTE 6 - Department of Education 265

Vote 6
19
Sub-programme 2.3: Human Resource Development To provide departmental services for the professional and other development of educators and non-educators in public ordinary schools. Sub-programme 2.4: School sport, culture and media services To provide additional and departmentally managed sporting, cultural and reading activities in public ordinary schools. Sub-programme 2.5: Conditional Grants To provide for projects under programme 2 specified by the Department of Education and funded by Conditional Grants.
Table 6.12 : Summary of payments and estimates by sub-programme: Public Ordinary School Education
Outcome Main appropriation
Adjusted appropriation
Revised estimate Medium-term estimates
R thousand 2012/13 2013/14 2014/15 2016/17 2017/18 2018/191. Public Primary Level 4 310 051 4 587 334 4 892 694 4 623 455 4 708 704 5 151 780 5 112 933 5 491 748 5 851 022 2. Public Secondary Level 2 997 865 3 126 068 3 278 285 3 313 223 3 419 749 3 558 556 3 527 398 3 783 351 4 030 809 3. Human Resource Development 29 829 37 641 16 191 42 453 27 453 27 455 39 335 37 774 41 587 4. School Sport, Culture And Media Services 23 570 27 042 28 155 29 759 28 759 29 276 30 334 32 773 35 234 5. Conditional Grants 287 281 301 567 325 454 349 302 353 014 353 014 368 437 387 683 410 168 Total payments and estimates 7 648 596 8 079 652 8 540 779 8 358 192 8 537 679 9 120 081 9 078 437 9 733 329 10 368 820
2015/16
Tabchap6a Table 6.13 : Summary of payments and estimates by economic classification: Public Ordinary School Education
Outcome Main appropriation
Adjusted appropriation
Revised estimate Medium-term estimates
R thousand 2012/13 2013/14 2014/15 2016/17 2017/18 2018/19Current payments 6 939 643 7 284 947 7 670 903 7 525 795 7 696 385 8 239 120 8 172 653 8 791 712 9 412 112
Compensation of employees 6 804 517 7 224 392 7 492 416 7 315 248 7 494 955 8 041 386 7 932 062 8 532 589 9 141 622 Goods and services 135 126 60 555 178 459 210 547 201 419 197 723 240 591 259 123 270 490 Interest and rent on land – – 28 – 11 11 – – –
Transfers and subsidies to: 708 398 794 207 865 821 831 669 839 899 879 565 905 198 940 978 956 295 Provinces and municipalities – – – – – – – – – Departmental agencies and accounts – – – – – – – – – Higher education institutions – – – – – – – – – Foreign governments and international organisations – – – – – – – – – Public corporations and private enterprises – – – – – – – – – Non-profit institutions 667 834 741 864 791 033 813 833 822 063 819 372 887 455 923 235 938 552 Households 40 564 52 343 74 788 17 836 17 836 60 193 17 743 17 743 17 743
Payments for capital assets 555 498 598 728 1 395 1 396 586 639 413 Buildings and other fixed structures – – – – – – – – – Machinery and equipment 555 498 598 728 1 395 1 396 586 639 413 Heritage Assets – – – – – – – – – Specialised military assets – – – – – – – – – Biological assets – – – – – – – – – Land and sub-soil assets – – – – – – – – – Software and other intangible assets – – – – – – – – –
Payments for financial assets – – 3 457 – – – – – –
Total economic classification 7 648 596 8 079 652 8 540 779 8 358 192 8 537 679 9 120 081 9 078 437 9 733 329 10 368 820
2015/16
Tabchap7a
VOTE 6 - Department of Education266

Vote 6
19
Sub-programme 2.3: Human Resource Development To provide departmental services for the professional and other development of educators and non-educators in public ordinary schools. Sub-programme 2.4: School sport, culture and media services To provide additional and departmentally managed sporting, cultural and reading activities in public ordinary schools. Sub-programme 2.5: Conditional Grants To provide for projects under programme 2 specified by the Department of Education and funded by Conditional Grants.
Table 6.12 : Summary of payments and estimates by sub-programme: Public Ordinary School Education
Outcome Main appropriation
Adjusted appropriation
Revised estimate Medium-term estimates
R thousand 2012/13 2013/14 2014/15 2016/17 2017/18 2018/191. Public Primary Level 4 310 051 4 587 334 4 892 694 4 623 455 4 708 704 5 151 780 5 112 933 5 491 748 5 851 022 2. Public Secondary Level 2 997 865 3 126 068 3 278 285 3 313 223 3 419 749 3 558 556 3 527 398 3 783 351 4 030 809 3. Human Resource Development 29 829 37 641 16 191 42 453 27 453 27 455 39 335 37 774 41 587 4. School Sport, Culture And Media Services 23 570 27 042 28 155 29 759 28 759 29 276 30 334 32 773 35 234 5. Conditional Grants 287 281 301 567 325 454 349 302 353 014 353 014 368 437 387 683 410 168 Total payments and estimates 7 648 596 8 079 652 8 540 779 8 358 192 8 537 679 9 120 081 9 078 437 9 733 329 10 368 820
2015/16
Tabchap6a Table 6.13 : Summary of payments and estimates by economic classification: Public Ordinary School Education
Outcome Main appropriation
Adjusted appropriation
Revised estimate Medium-term estimates
R thousand 2012/13 2013/14 2014/15 2016/17 2017/18 2018/19Current payments 6 939 643 7 284 947 7 670 903 7 525 795 7 696 385 8 239 120 8 172 653 8 791 712 9 412 112
Compensation of employees 6 804 517 7 224 392 7 492 416 7 315 248 7 494 955 8 041 386 7 932 062 8 532 589 9 141 622 Goods and services 135 126 60 555 178 459 210 547 201 419 197 723 240 591 259 123 270 490 Interest and rent on land – – 28 – 11 11 – – –
Transfers and subsidies to: 708 398 794 207 865 821 831 669 839 899 879 565 905 198 940 978 956 295 Provinces and municipalities – – – – – – – – – Departmental agencies and accounts – – – – – – – – – Higher education institutions – – – – – – – – – Foreign governments and international organisations – – – – – – – – – Public corporations and private enterprises – – – – – – – – – Non-profit institutions 667 834 741 864 791 033 813 833 822 063 819 372 887 455 923 235 938 552 Households 40 564 52 343 74 788 17 836 17 836 60 193 17 743 17 743 17 743
Payments for capital assets 555 498 598 728 1 395 1 396 586 639 413 Buildings and other fixed structures – – – – – – – – – Machinery and equipment 555 498 598 728 1 395 1 396 586 639 413 Heritage Assets – – – – – – – – – Specialised military assets – – – – – – – – – Biological assets – – – – – – – – – Land and sub-soil assets – – – – – – – – – Software and other intangible assets – – – – – – – – –
Payments for financial assets – – 3 457 – – – – – –
Total economic classification 7 648 596 8 079 652 8 540 779 8 358 192 8 537 679 9 120 081 9 078 437 9 733 329 10 368 820
2015/16
Tabchap7a
Vote 6
20
The following priorities are funded from this programme: A. National
Priorities 2016/17 BUDGET R’000
EXPLANATORY NOTES
1. Norms and Standards for School Funding
666.016
Public Ordinary Schools are funded according to the National Norms and Standards for School Funding (50%) of the budget must be allocated towards LTSM for Norms and Standards for school funding R6.042 million has been allocated towards compensation of pupils exempted in Quintile 4 and 5 schools All schools in Quintile 1, 2 and 3 were declared no-fee schools. Schools in Quintile 1,2 and 3 (no fee schools) are funded as follows against the national adequacy benchmark of R1059: Quintile 1 – R1177 per learner Quintile 2 – R1177 per learner Quintile 3 – R1177 per learner 88% of the schools are no fee schools in 2016
2.National School Nutrition Programme
334.971 The purpose of the programme is to enhance learning capacity through school feeding and provide nutritious meals to targeted learners. A comprehensive business plan has been approved and it covers primary and secondary schools that qualify for the feeding scheme.
3. Maths, Science and Technology Grant
33.466 The purpose of this grant is to provide support and resources to schools, teachers and learners for the improvement of Maths Science and Technology teaching and learning at selected public schools. To improve the achievement of learner participation and success rates, teacher demand, supply, utilisation, development and support, school resourcing and partnerships, consistent with targets set in the Action Plan 2019 and the National Development Plan (NDP).
4. Teachers Development
30.935 To provide training and development of educators by ensuring that the programmes which are offered are SACE endorsed or accredited. To appreciate the work done by our educators and as such recognise their efforts. This allocation is meant to address in-service training focusing on improving learning and teaching. It will also address the level of skills and knowledge of educators.
B. Provincial Priority 1.School Connectivity
19.016
To equip schools with information technology to improve teaching and learning.
8.3 Programme 3: Independent School Subsidies Programme Objective To support independent schools in accordance with the South African Schools Act.
VOTE 6 - Department of Education 267
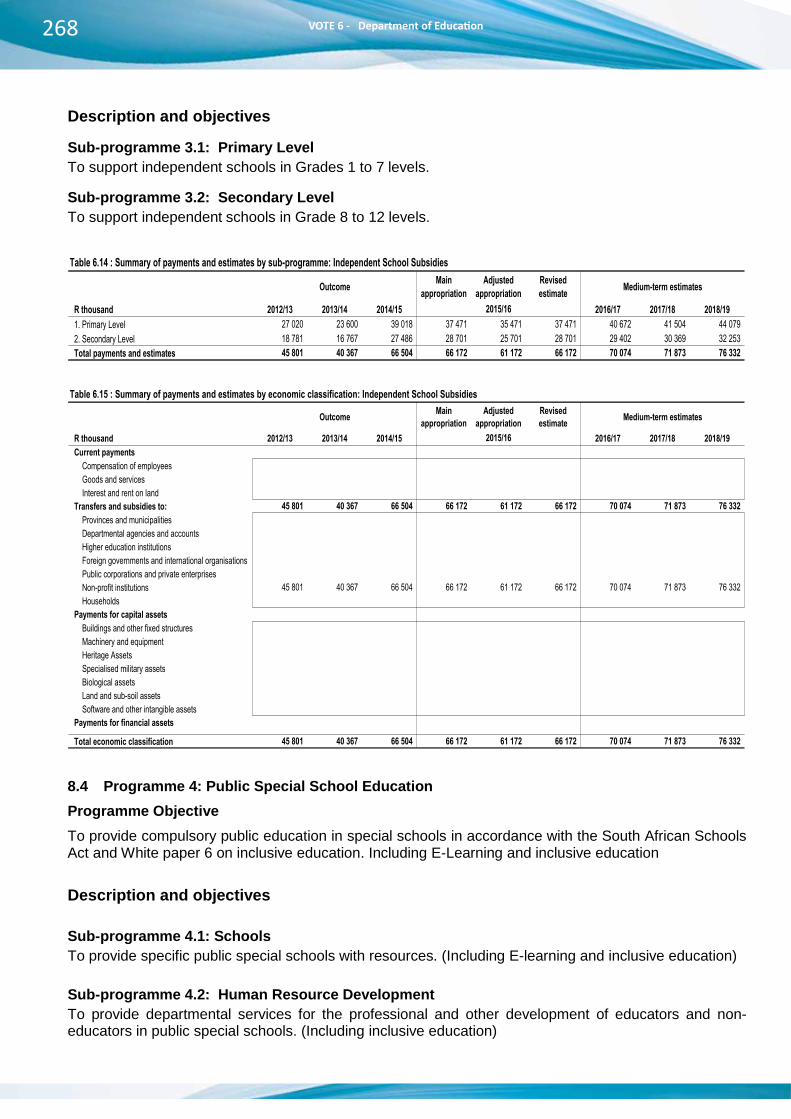
Vote 6
21
Description and objectives Sub-programme 3.1: Primary Level To support independent schools in Grades 1 to 7 levels. Sub-programme 3.2: Secondary Level To support independent schools in Grade 8 to 12 levels.
Table 6.14 : Summary of payments and estimates by sub-programme: Independent School Subsidies
Outcome Main appropriation
Adjusted appropriation
Revised estimate Medium-term estimates
R thousand 2012/13 2013/14 2014/15 2016/17 2017/18 2018/191. Primary Level 27 020 23 600 39 018 37 471 35 471 37 471 40 672 41 504 44 079 2. Secondary Level 18 781 16 767 27 486 28 701 25 701 28 701 29 402 30 369 32 253 Total payments and estimates 45 801 40 367 66 504 66 172 61 172 66 172 70 074 71 873 76 332
2015/16
Tabchap8a Table 6.15 : Summary of payments and estimates by economic classification: Independent School Subsidies
Outcome Main appropriation
Adjusted appropriation
Revised estimate Medium-term estimates
R thousand 2012/13 2013/14 2014/15 2016/17 2017/18 2018/19Current payments – – – – – – – – –
Compensation of employees – – – – – – – – – Goods and services – – – – – – – – – Interest and rent on land – – – – – – – – –
Transfers and subsidies to: 45 801 40 367 66 504 66 172 61 172 66 172 70 074 71 873 76 332 Provinces and municipalities – – – – – – – – – Departmental agencies and accounts – – – – – – – – – Higher education institutions – – – – – – – – – Foreign governments and international organisations – – – – – – – – – Public corporations and private enterprises – – – – – – – – – Non-profit institutions 45 801 40 367 66 504 66 172 61 172 66 172 70 074 71 873 76 332 Households – – – – – – – – –
Payments for capital assets – – – – – – – – – Buildings and other fixed structures – – – – – – – – – Machinery and equipment – – – – – – – – – Heritage Assets – – – – – – – – – Specialised military assets – – – – – – – – – Biological assets – – – – – – – – – Land and sub-soil assets – – – – – – – – – Software and other intangible assets – – – – – – – – –
Payments for financial assets – – – – – – – – –
Total economic classification 45 801 40 367 66 504 66 172 61 172 66 172 70 074 71 873 76 332
2015/16
Tabchap9a 8.4 Programme 4: Public Special School Education Programme Objective To provide compulsory public education in special schools in accordance with the South African Schools Act and White paper 6 on inclusive education. Including E-Learning and inclusive education
Description and objectives Sub-programme 4.1: Schools To provide specific public special schools with resources. (Including E-learning and inclusive education) Sub-programme 4.2: Human Resource Development To provide departmental services for the professional and other development of educators and non-educators in public special schools. (Including inclusive education)
VOTE 6 - Department of Education
Vote 6
22
Sub-programme 4.3: School Sport, Culture and Media Services To provide additional and departmentally managed sporting, cultural and reading activities in public special schools. (Including inclusive education) Sub-programme 4.4: Conditional grants To provide for projects under programme 4 specified by the Department of Basic Education and funded by conditional grants. (Including inclusive education) Table 6.16 : Summary of payments and estimates by sub-programme: Public Special School Education
Outcome Main appropriation
Adjusted appropriation
Revised estimate Medium-term estimates
R thousand 2012/13 2013/14 2014/15 2016/17 2017/18 2018/191. Schools 312 544 354 658 364 591 381 952 405 470 410 331 425 260 451 933 478 502 2. Human Resource Development – – – – – – 1 215 2 625 2 630 3. School Sport, Culture And Media Services – 39 – 100 100 100 403 410 417 4. Conditional Grants – – 18 358 5 775 5 775 5 775 – – – Total payments and estimates 312 544 354 697 382 949 387 827 411 345 416 206 426 878 454 968 481 549
2015/16
Tabchap10a Table 6.17 : Summary of payments and estimates by economic classification: Public Special School Education
Outcome Main appropriation
Adjusted appropriation
Revised estimate Medium-term estimates
R thousand 2012/13 2013/14 2014/15 2016/17 2017/18 2018/19Current payments 261 078 306 498 329 918 327 601 351 119 355 249 361 608 386 900 409 534
Compensation of employees 261 071 306 456 329 898 327 501 351 019 355 132 360 090 383 865 406 487 Goods and services 7 42 20 100 100 117 1 518 3 035 3 047 Interest and rent on land – – – – – – – – –
Transfers and subsidies to: 51 466 48 199 52 860 60 226 60 226 60 957 65 270 68 068 72 015 Provinces and municipalities – – – – – – – – – Departmental agencies and accounts – – – – – – – – – Higher education institutions – – – – – – – – – Foreign governments and international organisations – – – – – – – – – Public corporations and private enterprises – – – – – – – – – Non-profit institutions 50 793 47 343 51 571 59 907 59 907 59 907 64 982 67 780 71 727 Households 673 856 1 289 319 319 1 050 288 288 288
Payments for capital assets – – – – – – – – – Buildings and other fixed structures – – – – – – – – – Machinery and equipment – – – – – – – – – Heritage Assets – – – – – – – – – Specialised military assets – – – – – – – – – Biological assets – – – – – – – – – Land and sub-soil assets – – – – – – – – – Software and other intangible assets – – – – – – – – –
Payments for financial assets – – 171 – – – – – –
Total economic classification 312 544 354 697 382 949 387 827 411 345 416 206 426 878 454 968 481 549
2015/16
Tabchap11a
The following priorities are funded from this programme: A. National
Priorities 2016/17 BUDGET R’000
EXPLANATORY NOTES
1. Inclusive Education
7.300 This priority is mainly towards transport of learners at Special Schools.
2. Teacher Development
0.690 To provide training and development of educators by ensuring that the programmes which are offered are SACE endorsed or accredited. To appreciate the work done by our educators and as such recognise their efforts. This allocation is meant to address in-service training focusing on improving learning and teaching. It will also address the level of skills and knowledge of educators.
268

Vote 6
21
Description and objectives Sub-programme 3.1: Primary Level To support independent schools in Grades 1 to 7 levels. Sub-programme 3.2: Secondary Level To support independent schools in Grade 8 to 12 levels.
Table 6.14 : Summary of payments and estimates by sub-programme: Independent School Subsidies
Outcome Main appropriation
Adjusted appropriation
Revised estimate Medium-term estimates
R thousand 2012/13 2013/14 2014/15 2016/17 2017/18 2018/191. Primary Level 27 020 23 600 39 018 37 471 35 471 37 471 40 672 41 504 44 079 2. Secondary Level 18 781 16 767 27 486 28 701 25 701 28 701 29 402 30 369 32 253 Total payments and estimates 45 801 40 367 66 504 66 172 61 172 66 172 70 074 71 873 76 332
2015/16
Tabchap8a Table 6.15 : Summary of payments and estimates by economic classification: Independent School Subsidies
Outcome Main appropriation
Adjusted appropriation
Revised estimate Medium-term estimates
R thousand 2012/13 2013/14 2014/15 2016/17 2017/18 2018/19Current payments – – – – – – – – –
Compensation of employees – – – – – – – – – Goods and services – – – – – – – – – Interest and rent on land – – – – – – – – –
Transfers and subsidies to: 45 801 40 367 66 504 66 172 61 172 66 172 70 074 71 873 76 332 Provinces and municipalities – – – – – – – – – Departmental agencies and accounts – – – – – – – – – Higher education institutions – – – – – – – – – Foreign governments and international organisations – – – – – – – – – Public corporations and private enterprises – – – – – – – – – Non-profit institutions 45 801 40 367 66 504 66 172 61 172 66 172 70 074 71 873 76 332 Households – – – – – – – – –
Payments for capital assets – – – – – – – – – Buildings and other fixed structures – – – – – – – – – Machinery and equipment – – – – – – – – – Heritage Assets – – – – – – – – – Specialised military assets – – – – – – – – – Biological assets – – – – – – – – – Land and sub-soil assets – – – – – – – – – Software and other intangible assets – – – – – – – – –
Payments for financial assets – – – – – – – – –
Total economic classification 45 801 40 367 66 504 66 172 61 172 66 172 70 074 71 873 76 332
2015/16
Tabchap9a 8.4 Programme 4: Public Special School Education Programme Objective To provide compulsory public education in special schools in accordance with the South African Schools Act and White paper 6 on inclusive education. Including E-Learning and inclusive education
Description and objectives Sub-programme 4.1: Schools To provide specific public special schools with resources. (Including E-learning and inclusive education) Sub-programme 4.2: Human Resource Development To provide departmental services for the professional and other development of educators and non-educators in public special schools. (Including inclusive education)
Vote 6
22
Sub-programme 4.3: School Sport, Culture and Media Services To provide additional and departmentally managed sporting, cultural and reading activities in public special schools. (Including inclusive education) Sub-programme 4.4: Conditional grants To provide for projects under programme 4 specified by the Department of Basic Education and funded by conditional grants. (Including inclusive education) Table 6.16 : Summary of payments and estimates by sub-programme: Public Special School Education
Outcome Main appropriation
Adjusted appropriation
Revised estimate Medium-term estimates
R thousand 2012/13 2013/14 2014/15 2016/17 2017/18 2018/191. Schools 312 544 354 658 364 591 381 952 405 470 410 331 425 260 451 933 478 502 2. Human Resource Development – – – – – – 1 215 2 625 2 630 3. School Sport, Culture And Media Services – 39 – 100 100 100 403 410 417 4. Conditional Grants – – 18 358 5 775 5 775 5 775 – – – Total payments and estimates 312 544 354 697 382 949 387 827 411 345 416 206 426 878 454 968 481 549
2015/16
Tabchap10a Table 6.17 : Summary of payments and estimates by economic classification: Public Special School Education
Outcome Main appropriation
Adjusted appropriation
Revised estimate Medium-term estimates
R thousand 2012/13 2013/14 2014/15 2016/17 2017/18 2018/19Current payments 261 078 306 498 329 918 327 601 351 119 355 249 361 608 386 900 409 534
Compensation of employees 261 071 306 456 329 898 327 501 351 019 355 132 360 090 383 865 406 487 Goods and services 7 42 20 100 100 117 1 518 3 035 3 047 Interest and rent on land – – – – – – – – –
Transfers and subsidies to: 51 466 48 199 52 860 60 226 60 226 60 957 65 270 68 068 72 015 Provinces and municipalities – – – – – – – – – Departmental agencies and accounts – – – – – – – – – Higher education institutions – – – – – – – – – Foreign governments and international organisations – – – – – – – – – Public corporations and private enterprises – – – – – – – – – Non-profit institutions 50 793 47 343 51 571 59 907 59 907 59 907 64 982 67 780 71 727 Households 673 856 1 289 319 319 1 050 288 288 288
Payments for capital assets – – – – – – – – – Buildings and other fixed structures – – – – – – – – – Machinery and equipment – – – – – – – – – Heritage Assets – – – – – – – – – Specialised military assets – – – – – – – – – Biological assets – – – – – – – – – Land and sub-soil assets – – – – – – – – – Software and other intangible assets – – – – – – – – –
Payments for financial assets – – 171 – – – – – –
Total economic classification 312 544 354 697 382 949 387 827 411 345 416 206 426 878 454 968 481 549
2015/16
Tabchap11a
The following priorities are funded from this programme: A. National
Priorities 2016/17 BUDGET R’000
EXPLANATORY NOTES
1. Inclusive Education
7.300 This priority is mainly towards transport of learners at Special Schools.
2. Teacher Development
0.690 To provide training and development of educators by ensuring that the programmes which are offered are SACE endorsed or accredited. To appreciate the work done by our educators and as such recognise their efforts. This allocation is meant to address in-service training focusing on improving learning and teaching. It will also address the level of skills and knowledge of educators.
VOTE 6 - Department of Education 269

Vote 6
23
8.5 Programme 5: Early Childhood Development Programme Objective To provide Early Childhood Education (ECD) at the Grade R and earlier levels in accordance with White Paper 5. (E-learning is also included)
Description and objectives Sub-programme 5.1: Grade R in Public Schools To provide specific public ordinary schools with resources required for Grade R. Sub-programme 5.2: Grade R in early childhood development centres To provide Grade R at early childhood development centres. Sub-programme 5.3: Pre Grade R Training To provide training and payment of stipends of Pre-Grade R practitioners/educators. Sub-programme 5.4: Human Resource Development To provide departmental services for the professional and other development of educators and non-educators in ECD centres. Sub-programme 5.5: Conditional Grants To provide for projects under programme 5 specified by the Department of Basic Education and funded by conditional grants. Table 6.18 : Summary of payments and estimates by sub-programme: Early Childhood Development
Outcome Main appropriation
Adjusted appropriation
Revised estimate Medium-term estimates
R thousand 2012/13 2013/14 2014/15 2016/17 2017/18 2018/191. Grade R In Public Schools 69 836 111 856 123 089 118 624 116 845 115 322 135 671 143 908 152 858 2. Grade R In Early Childhood Development Centres 16 459 7 366 6 830 8 910 7 946 7 895 10 754 11 313 11 889 3. Pre-Grade R Training – 1 487 – – – – 1 061 1 057 1 057 4. Human Resource Development – – – – – – 1 100 3 650 2 349 5. Conditional Grants – – – 1 000 1 000 1 000 3 000 – – Total payments and estimates 86 295 120 709 129 919 128 534 125 791 124 217 151 586 159 928 168 153
2015/16
Tabchap12a
VOTE 6 - Department of Education
Vote 6
24
Table 6.19 : Summary of payments and estimates by economic classification: Early Childhood Development
Outcome Main appropriation
Adjusted appropriation
Revised estimate Medium-term estimates
R thousand 2012/13 2013/14 2014/15 2016/17 2017/18 2018/19Current payments 78 255 117 126 123 139 119 710 116 907 115 333 130 639 138 981 147 206
Compensation of employees 78 248 107 341 112 542 119 414 116 541 114 967 127 756 133 552 143 078 Goods and services 7 9 785 10 597 296 366 366 2 883 5 429 4 128 Interest and rent on land – – – – – – – – –
Transfers and subsidies to: 3 540 3 583 6 708 8 824 8 824 8 824 20 947 20 947 20 947 Provinces and municipalities – – – – – – – – – Departmental agencies and accounts – – – – – – – – – Higher education institutions – – – – – – – – – Foreign governments and international organisations – – – – – – – – – Public corporations and private enterprises – – – – – – – – – Non-profit institutions 3 464 3 583 6 637 8 804 8 804 8 804 20 942 20 942 20 942 Households 76 – 71 20 20 20 5 5 5
Payments for capital assets 4 500 – – – 60 60 – – – Buildings and other fixed structures – – – – – – – – – Machinery and equipment 4 500 – – – 60 60 – – – Heritage Assets – – – – – – – – – Specialised military assets – – – – – – – – – Biological assets – – – – – – – – – Land and sub-soil assets – – – – – – – – – Software and other intangible assets – – – – – – – – –
Payments for financial assets – – 72 – – – – – –
Total economic classification 86 295 120 709 129 919 128 534 125 791 124 217 151 586 159 928 168 153
2015/16
Tchap13a The following priorities are funded from this programme: A. NATIONAL
PRIORITY
2016/17 BUDGET R’000
EXPLANATORY NOTES
1. Expansion of Grade R 21.664 The primary objective is to universalise the provision of Grade R. Increase the number of classes in Grade R Public Schools.
2. Pre-grade R Training 1.061 Support projects in Grade R classes at ECD sites. It will be for the training and payment of stipends for Pre-Grade R practitioners.
3. Social Sector Expanded Public Works Programme Incentive Grant
3.000 To incentivise provincial social sector departments identified in the 2014 social sector EPWP log-frame to increase job creation by focusing on the strengthening and expansion of social sector programmes that have employment potential.
4. Teacher Development 1.100 To provide training and development of educators by ensuring that the programmes which are offered are SACE endorsed or accredited. To appreciate the work done by our educators and as such recognise their efforts. This allocation is meant to address in-service training focusing on improving learning and teaching. It will also address the level of skills and knowledge of educators.
270

Vote 6
23
8.5 Programme 5: Early Childhood Development Programme Objective To provide Early Childhood Education (ECD) at the Grade R and earlier levels in accordance with White Paper 5. (E-learning is also included)
Description and objectives Sub-programme 5.1: Grade R in Public Schools To provide specific public ordinary schools with resources required for Grade R. Sub-programme 5.2: Grade R in early childhood development centres To provide Grade R at early childhood development centres. Sub-programme 5.3: Pre Grade R Training To provide training and payment of stipends of Pre-Grade R practitioners/educators. Sub-programme 5.4: Human Resource Development To provide departmental services for the professional and other development of educators and non-educators in ECD centres. Sub-programme 5.5: Conditional Grants To provide for projects under programme 5 specified by the Department of Basic Education and funded by conditional grants. Table 6.18 : Summary of payments and estimates by sub-programme: Early Childhood Development
Outcome Main appropriation
Adjusted appropriation
Revised estimate Medium-term estimates
R thousand 2012/13 2013/14 2014/15 2016/17 2017/18 2018/191. Grade R In Public Schools 69 836 111 856 123 089 118 624 116 845 115 322 135 671 143 908 152 858 2. Grade R In Early Childhood Development Centres 16 459 7 366 6 830 8 910 7 946 7 895 10 754 11 313 11 889 3. Pre-Grade R Training – 1 487 – – – – 1 061 1 057 1 057 4. Human Resource Development – – – – – – 1 100 3 650 2 349 5. Conditional Grants – – – 1 000 1 000 1 000 3 000 – – Total payments and estimates 86 295 120 709 129 919 128 534 125 791 124 217 151 586 159 928 168 153
2015/16
Tabchap12a
Vote 6
24
Table 6.19 : Summary of payments and estimates by economic classification: Early Childhood Development
Outcome Main appropriation
Adjusted appropriation
Revised estimate Medium-term estimates
R thousand 2012/13 2013/14 2014/15 2016/17 2017/18 2018/19Current payments 78 255 117 126 123 139 119 710 116 907 115 333 130 639 138 981 147 206
Compensation of employees 78 248 107 341 112 542 119 414 116 541 114 967 127 756 133 552 143 078 Goods and services 7 9 785 10 597 296 366 366 2 883 5 429 4 128 Interest and rent on land – – – – – – – – –
Transfers and subsidies to: 3 540 3 583 6 708 8 824 8 824 8 824 20 947 20 947 20 947 Provinces and municipalities – – – – – – – – – Departmental agencies and accounts – – – – – – – – – Higher education institutions – – – – – – – – – Foreign governments and international organisations – – – – – – – – – Public corporations and private enterprises – – – – – – – – – Non-profit institutions 3 464 3 583 6 637 8 804 8 804 8 804 20 942 20 942 20 942 Households 76 – 71 20 20 20 5 5 5
Payments for capital assets 4 500 – – – 60 60 – – – Buildings and other fixed structures – – – – – – – – – Machinery and equipment 4 500 – – – 60 60 – – – Heritage Assets – – – – – – – – – Specialised military assets – – – – – – – – – Biological assets – – – – – – – – – Land and sub-soil assets – – – – – – – – – Software and other intangible assets – – – – – – – – –
Payments for financial assets – – 72 – – – – – –
Total economic classification 86 295 120 709 129 919 128 534 125 791 124 217 151 586 159 928 168 153
2015/16
Tchap13a The following priorities are funded from this programme: A. NATIONAL
PRIORITY
2016/17 BUDGET R’000
EXPLANATORY NOTES
1. Expansion of Grade R 21.664 The primary objective is to universalise the provision of Grade R. Increase the number of classes in Grade R Public Schools.
2. Pre-grade R Training 1.061 Support projects in Grade R classes at ECD sites. It will be for the training and payment of stipends for Pre-Grade R practitioners.
3. Social Sector Expanded Public Works Programme Incentive Grant
3.000 To incentivise provincial social sector departments identified in the 2014 social sector EPWP log-frame to increase job creation by focusing on the strengthening and expansion of social sector programmes that have employment potential.
4. Teacher Development 1.100 To provide training and development of educators by ensuring that the programmes which are offered are SACE endorsed or accredited. To appreciate the work done by our educators and as such recognise their efforts. This allocation is meant to address in-service training focusing on improving learning and teaching. It will also address the level of skills and knowledge of educators.
VOTE 6 - Department of Education 271
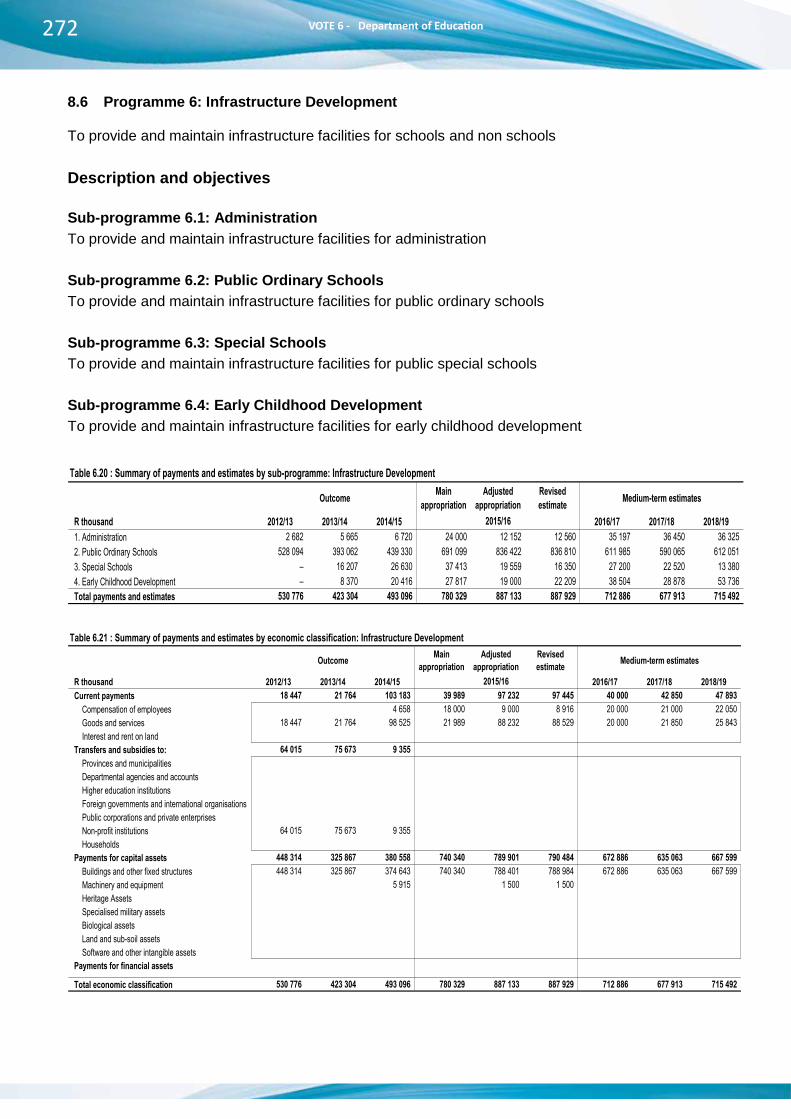
Vote 6
25
8.6 Programme 6: Infrastructure Development To provide and maintain infrastructure facilities for schools and non schools
Description and objectives Sub-programme 6.1: Administration To provide and maintain infrastructure facilities for administration Sub-programme 6.2: Public Ordinary Schools To provide and maintain infrastructure facilities for public ordinary schools Sub-programme 6.3: Special Schools To provide and maintain infrastructure facilities for public special schools Sub-programme 6.4: Early Childhood Development To provide and maintain infrastructure facilities for early childhood development Table 6.20 : Summary of payments and estimates by sub-programme: Infrastructure Development
Outcome Main appropriation
Adjusted appropriation
Revised estimate Medium-term estimates
R thousand 2012/13 2013/14 2014/15 2016/17 2017/18 2018/191. Administration 2 682 5 665 6 720 24 000 12 152 12 560 35 197 36 450 36 325 2. Public Ordinary Schools 528 094 393 062 439 330 691 099 836 422 836 810 611 985 590 065 612 051 3. Special Schools – 16 207 26 630 37 413 19 559 16 350 27 200 22 520 13 380 4. Early Childhood Development – 8 370 20 416 27 817 19 000 22 209 38 504 28 878 53 736 Total payments and estimates 530 776 423 304 493 096 780 329 887 133 887 929 712 886 677 913 715 492
2015/16
Tabchap14a Table 6.21 : Summary of payments and estimates by economic classification: Infrastructure Development
Outcome Main appropriation
Adjusted appropriation
Revised estimate Medium-term estimates
R thousand 2012/13 2013/14 2014/15 2016/17 2017/18 2018/19Current payments 18 447 21 764 103 183 39 989 97 232 97 445 40 000 42 850 47 893
Compensation of employees – – 4 658 18 000 9 000 8 916 20 000 21 000 22 050 Goods and services 18 447 21 764 98 525 21 989 88 232 88 529 20 000 21 850 25 843 Interest and rent on land – – – – – – – – –
Transfers and subsidies to: 64 015 75 673 9 355 – – – – – – Provinces and municipalities – – – – – – – – – Departmental agencies and accounts – – – – – – – – – Higher education institutions – – – – – – – – – Foreign governments and international organisations – – – – – – – – – Public corporations and private enterprises – – – – – – – – – Non-profit institutions 64 015 75 673 9 355 – – – – – – Households – – – – – – – – –
Payments for capital assets 448 314 325 867 380 558 740 340 789 901 790 484 672 886 635 063 667 599 Buildings and other fixed structures 448 314 325 867 374 643 740 340 788 401 788 984 672 886 635 063 667 599 Machinery and equipment – – 5 915 – 1 500 1 500 – – – Heritage Assets – – – – – – – – – Specialised military assets – – – – – – – – – Biological assets – – – – – – – – – Land and sub-soil assets – – – – – – – – – Software and other intangible assets – – – – – – – – –
Payments for financial assets – – – – – – – – –
Total economic classification 530 776 423 304 493 096 780 329 887 133 887 929 712 886 677 913 715 492
2015/16
Tabchap15a
VOTE 6 - Department of Education272

Vote 6
25
8.6 Programme 6: Infrastructure Development To provide and maintain infrastructure facilities for schools and non schools
Description and objectives Sub-programme 6.1: Administration To provide and maintain infrastructure facilities for administration Sub-programme 6.2: Public Ordinary Schools To provide and maintain infrastructure facilities for public ordinary schools Sub-programme 6.3: Special Schools To provide and maintain infrastructure facilities for public special schools Sub-programme 6.4: Early Childhood Development To provide and maintain infrastructure facilities for early childhood development Table 6.20 : Summary of payments and estimates by sub-programme: Infrastructure Development
Outcome Main appropriation
Adjusted appropriation
Revised estimate Medium-term estimates
R thousand 2012/13 2013/14 2014/15 2016/17 2017/18 2018/191. Administration 2 682 5 665 6 720 24 000 12 152 12 560 35 197 36 450 36 325 2. Public Ordinary Schools 528 094 393 062 439 330 691 099 836 422 836 810 611 985 590 065 612 051 3. Special Schools – 16 207 26 630 37 413 19 559 16 350 27 200 22 520 13 380 4. Early Childhood Development – 8 370 20 416 27 817 19 000 22 209 38 504 28 878 53 736 Total payments and estimates 530 776 423 304 493 096 780 329 887 133 887 929 712 886 677 913 715 492
2015/16
Tabchap14a Table 6.21 : Summary of payments and estimates by economic classification: Infrastructure Development
Outcome Main appropriation
Adjusted appropriation
Revised estimate Medium-term estimates
R thousand 2012/13 2013/14 2014/15 2016/17 2017/18 2018/19Current payments 18 447 21 764 103 183 39 989 97 232 97 445 40 000 42 850 47 893
Compensation of employees – – 4 658 18 000 9 000 8 916 20 000 21 000 22 050 Goods and services 18 447 21 764 98 525 21 989 88 232 88 529 20 000 21 850 25 843 Interest and rent on land – – – – – – – – –
Transfers and subsidies to: 64 015 75 673 9 355 – – – – – – Provinces and municipalities – – – – – – – – – Departmental agencies and accounts – – – – – – – – – Higher education institutions – – – – – – – – – Foreign governments and international organisations – – – – – – – – – Public corporations and private enterprises – – – – – – – – – Non-profit institutions 64 015 75 673 9 355 – – – – – – Households – – – – – – – – –
Payments for capital assets 448 314 325 867 380 558 740 340 789 901 790 484 672 886 635 063 667 599 Buildings and other fixed structures 448 314 325 867 374 643 740 340 788 401 788 984 672 886 635 063 667 599 Machinery and equipment – – 5 915 – 1 500 1 500 – – – Heritage Assets – – – – – – – – – Specialised military assets – – – – – – – – – Biological assets – – – – – – – – – Land and sub-soil assets – – – – – – – – – Software and other intangible assets – – – – – – – – –
Payments for financial assets – – – – – – – – –
Total economic classification 530 776 423 304 493 096 780 329 887 133 887 929 712 886 677 913 715 492
2015/16
Tabchap15a
Vote 6
26
The following priorities are funded from this programme: A. NATIONAL
PRIORITY
2016/17 BUDGET R’000
EXPLANATORY NOTES
1. Education Infrastructure Grant
695.122 The purpose of this grant is to help accelerate construction, maintenance, upgrading and rehabilitation of new and existing infrastructure in education including district and circuit accommodation.
To enhance capacity to deliver infrastructure in education.
To address damage to infrastructure caused by natural disasters.
2. EPWP Integrated grant to Provinces for Infrastructure
2.567 The purpose of this grant is to incentivise provincial departments to expand work creation efforts through the use of labour intensive delivery methods.
B. Provincial Priority
3. Infrastructure enhancement allocation
15.197 This allocation is to help and makes provision for the day to day maintenance of schools and administration.
8.7 Programme 7: Examination and Education Related Services Programme Objective To provide the education institutions as a whole with examination and education related services.
Description and objectives Sub-programme 7.1: Payments to SETA To provide employee human resource development in accordance with the Skills Development Act. Sub-programme 7.2: Professional Services To provide educators and learners in schools with departmentally managed support services. Sub-programme 7.3: Special Projects To provide for special departmentally managed intervention projects in the education system as a whole. Sub-programme 7.4: External Examinations To provide for departmentally managed examination services. Sub-programme 7.5: Conditional Grant Projects To provide for projects specified by the Department of Education that is applicable to more than one programme and funded with conditional grants.
VOTE 6 - Department of Education 273
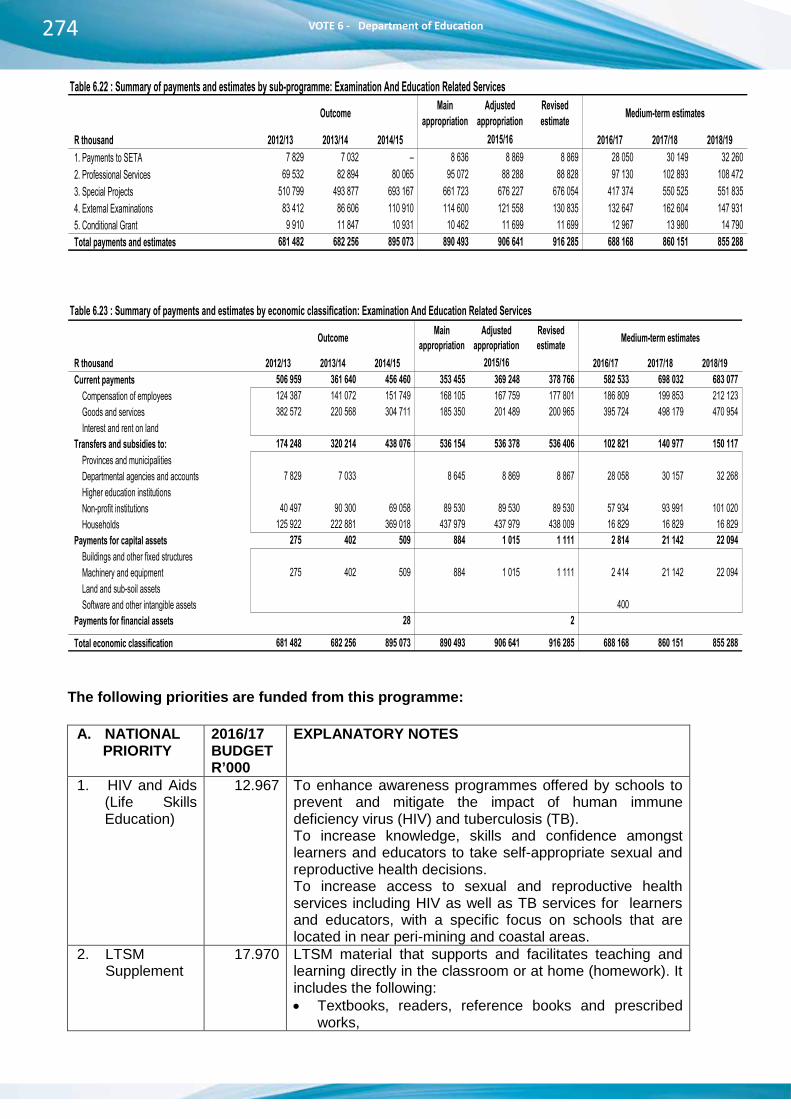
Vote 6
27
Outcome Main appropriation
Adjusted appropriation
Revised estimate Medium-term estimates
R thousand 2012/13 2013/14 2014/15 2016/17 2017/18 2018/191. Payments to SETA 7 829 7 032 – 8 636 8 869 8 869 28 050 30 149 32 260 2. Professional Services 69 532 82 894 80 065 95 072 88 288 88 828 97 130 102 893 108 472 3. Special Projects 510 799 493 877 693 167 661 723 676 227 676 054 417 374 550 525 551 835 4. External Examinations 83 412 86 606 110 910 114 600 121 558 130 835 132 647 162 604 147 931 5. Conditional Grant 9 910 11 847 10 931 10 462 11 699 11 699 12 967 13 980 14 790 Total payments and estimates 681 482 682 256 895 073 890 493 906 641 916 285 688 168 860 151 855 288
2015/16
Table 6.22 : Summary of payments and estimates by sub-programme: Examination And Education Related Services
abchap16aTable 6.23 : Summary of payments and estimates by economic classification: Examination And Education Related Services
Outcome Main appropriation
Adjusted appropriation
Revised estimate Medium-term estimates
R thousand 2012/13 2013/14 2014/15 2016/17 2017/18 2018/19Current payments 506 959 361 640 456 460 353 455 369 248 378 766 582 533 698 032 683 077
Compensation of employees 124 387 141 072 151 749 168 105 167 759 177 801 186 809 199 853 212 123 Goods and services 382 572 220 568 304 711 185 350 201 489 200 965 395 724 498 179 470 954 Interest and rent on land – – – – – – – – –
Transfers and subsidies to: 174 248 320 214 438 076 536 154 536 378 536 406 102 821 140 977 150 117 Provinces and municipalities – – – – – – – – – Departmental agencies and accounts 7 829 7 033 – 8 645 8 869 8 867 28 058 30 157 32 268 Higher education institutions – – – – – – – – – Non-profit institutions 40 497 90 300 69 058 89 530 89 530 89 530 57 934 93 991 101 020 Households 125 922 222 881 369 018 437 979 437 979 438 009 16 829 16 829 16 829
Payments for capital assets 275 402 509 884 1 015 1 111 2 814 21 142 22 094 Buildings and other fixed structures – – – – – – – – – Machinery and equipment 275 402 509 884 1 015 1 111 2 414 21 142 22 094 Land and sub-soil assets – – – – – – – – – Software and other intangible assets – – – – – – 400 – –
Payments for financial assets – – 28 – – 2 – – –
Total economic classification 681 482 682 256 895 073 890 493 906 641 916 285 688 168 860 151 855 288
2015/16
Tabchap17a
The following priorities are funded from this programme:
A. NATIONAL PRIORITY
2016/17 BUDGET R’000
EXPLANATORY NOTES
1. HIV and Aids (Life Skills Education)
12.967
To enhance awareness programmes offered by schools to prevent and mitigate the impact of human immune deficiency virus (HIV) and tuberculosis (TB). To increase knowledge, skills and confidence amongst learners and educators to take self-appropriate sexual and reproductive health decisions. To increase access to sexual and reproductive health services including HIV as well as TB services for learners and educators, with a specific focus on schools that are located in near peri-mining and coastal areas.
2. LTSM Supplement
17.970 LTSM material that supports and facilitates teaching and learning directly in the classroom or at home (homework). It includes the following: Textbooks, readers, reference books and prescribed
works,
VOTE 6 - Department of Education274

Vote 6
27
Outcome Main appropriation
Adjusted appropriation
Revised estimate Medium-term estimates
R thousand 2012/13 2013/14 2014/15 2016/17 2017/18 2018/191. Payments to SETA 7 829 7 032 – 8 636 8 869 8 869 28 050 30 149 32 260 2. Professional Services 69 532 82 894 80 065 95 072 88 288 88 828 97 130 102 893 108 472 3. Special Projects 510 799 493 877 693 167 661 723 676 227 676 054 417 374 550 525 551 835 4. External Examinations 83 412 86 606 110 910 114 600 121 558 130 835 132 647 162 604 147 931 5. Conditional Grant 9 910 11 847 10 931 10 462 11 699 11 699 12 967 13 980 14 790 Total payments and estimates 681 482 682 256 895 073 890 493 906 641 916 285 688 168 860 151 855 288
2015/16
Table 6.22 : Summary of payments and estimates by sub-programme: Examination And Education Related Services
abchap16aTable 6.23 : Summary of payments and estimates by economic classification: Examination And Education Related Services
Outcome Main appropriation
Adjusted appropriation
Revised estimate Medium-term estimates
R thousand 2012/13 2013/14 2014/15 2016/17 2017/18 2018/19Current payments 506 959 361 640 456 460 353 455 369 248 378 766 582 533 698 032 683 077
Compensation of employees 124 387 141 072 151 749 168 105 167 759 177 801 186 809 199 853 212 123 Goods and services 382 572 220 568 304 711 185 350 201 489 200 965 395 724 498 179 470 954 Interest and rent on land – – – – – – – – –
Transfers and subsidies to: 174 248 320 214 438 076 536 154 536 378 536 406 102 821 140 977 150 117 Provinces and municipalities – – – – – – – – – Departmental agencies and accounts 7 829 7 033 – 8 645 8 869 8 867 28 058 30 157 32 268 Higher education institutions – – – – – – – – – Non-profit institutions 40 497 90 300 69 058 89 530 89 530 89 530 57 934 93 991 101 020 Households 125 922 222 881 369 018 437 979 437 979 438 009 16 829 16 829 16 829
Payments for capital assets 275 402 509 884 1 015 1 111 2 814 21 142 22 094 Buildings and other fixed structures – – – – – – – – – Machinery and equipment 275 402 509 884 1 015 1 111 2 414 21 142 22 094 Land and sub-soil assets – – – – – – – – – Software and other intangible assets – – – – – – 400 – –
Payments for financial assets – – 28 – – 2 – – –
Total economic classification 681 482 682 256 895 073 890 493 906 641 916 285 688 168 860 151 855 288
2015/16
Tabchap17a
The following priorities are funded from this programme:
A. NATIONAL PRIORITY
2016/17 BUDGET R’000
EXPLANATORY NOTES
1. HIV and Aids (Life Skills Education)
12.967
To enhance awareness programmes offered by schools to prevent and mitigate the impact of human immune deficiency virus (HIV) and tuberculosis (TB). To increase knowledge, skills and confidence amongst learners and educators to take self-appropriate sexual and reproductive health decisions. To increase access to sexual and reproductive health services including HIV as well as TB services for learners and educators, with a specific focus on schools that are located in near peri-mining and coastal areas.
2. LTSM Supplement
17.970 LTSM material that supports and facilitates teaching and learning directly in the classroom or at home (homework). It includes the following: Textbooks, readers, reference books and prescribed
works,
Vote 6
28
A. NATIONAL PRIORITY
2016/17 BUDGET R’000
EXPLANATORY NOTES
Modules and workbooks, Library material (fiction and non-fiction) and Resource material for teachers, learners, classroom and
library. 3. Literacy and
Numeracy 2.000 The programme will be implemented over the MTEF period.
The guiding principles are: To promote the right to quality education and access to
relevant resources and appropriate support To promote literacy and language skills as the bases
for all learning To promote literacy development as cross cutting effort
at all levels of the department, schools and communities
Pursuing addictive multilingualism in the classroom 4. Inclusive
Education 1.500 The allocation aimed to give additional support to special
schools and full service schools through additional equipment and materials.
B. PROVINCIAL PRIORITY
5. Incentives to top maths schools
1.500 The allocation is aimed at incentivising a number of best performing schools in Mathematics.
6. Elits 6.000 The Education Library Information and Technology Services (ELITS) allocation is aimed at addressing shortage of materials in schools library at the districts.
7. Kagiso Trust & Kutlwanong Project
14.900 The Beyers Naude Schools Development Programme involves a holistic intervention at secondary schools in order to improve the overall performance of so-called “dysfunctional” or “under-performing” schools. 10 secondary schools in Thabo Mofutsanyana are serviced by this partnership between the Department and the Beyers Naude Schools Development Programme.
8. Revitalisation of agricultural schools
3.000 The aim of this allocation is to procure equipment for teaching and learning purposes in Agricultural Schools.
9. Hymaths 12.000 The allocation is aimed at assisting schools to improve mathematics results in the province.
10. Matric Support Programmes
51.655 The allocation is aimed at ensuring that the department is able to provide focused assistance to underperforming schools to improve grade 12 results as well as ensuring that the best performing schools continue doing well.
11. Hostel Project 32.000 The allocation is aimed at providing hostel accommodation for learners from nonviable farm schools.
12. Provincial Bursaries
260.315 The allocation is aimed at catering for tertiary fees for the duration of studies in accordance with the total Provincial needs identified.
13. Management and Governance
2.416 The allocation is aimed to assist schools to hold School Governing Body (SGB) election across the province. The allocation is also aimed to ensure that every school has a School Governing Body (SGB) that is democratically elected.
14. SYRAC 0.961 In-school sport and culture has this earmarked additional
VOTE 6 - Department of Education 275

Vote 6
29
A. NATIONAL PRIORITY
2016/17 BUDGET R’000
EXPLANATORY NOTES
fund to specifically improve the quality of and participations in sport and youth programmes
15. School furniture
10.000 The allocation is aimed to refurbish school furniture and address shortages of school furniture.
16. Employee Wellness
0.400 The allocation is intended to promote the well-being of employees.
17. School Safety 0.757 The allocation is for school safety of learners and teachers at schools.
9. Other programme information 9.1 Personnel numbers and costs
Table 6.24 : Personnel numbers and costs by programme
Personnel numbers As at 31 March 2013
As at 31 March 2014
As at 31 March 2015
As at 31 March 2016
As at 31 March 2017
As at 31 March 2017
As at 31 March 2017
1. Administration 2 321 2 527 2 626 2 536 2 643 2 632 2 613 2. Public Ordinary School Education 27 183 25 511 25 843 25 136 23 372 23 205 23 056 3. Independent School Subsidies – – – – – – – 4. Public Special School Education 1 152 1 238 1 260 1 259 1 209 1 192 1 172 5. Early Childhood Development 1 097 1 364 1 376 1 429 1 470 1 467 1 465 6. Infrastructure Development – – – 25 25 25 25 7. Examination And Education Related Services 310 258 266 1 504 1 497 1 494 1 490 Direct charges – – – – – – – Total provincial personnel numbers 32 063 30 898 31 371 31 889 30 216 30 015 29 821 Total provincial personnel cost (R thousand) 7 844 142 8 414 360 8 761 787 9 397 839 9 393 355 10 092 639 10 798 585 Unit cost (R thousand) 245 272 279 295 311 336 362
1. Full-time equivalentTabchap19a
VOTE 6 - Department of Education276

Vote 6
29
A. NATIONAL PRIORITY
2016/17 BUDGET R’000
EXPLANATORY NOTES
fund to specifically improve the quality of and participations in sport and youth programmes
15. School furniture
10.000 The allocation is aimed to refurbish school furniture and address shortages of school furniture.
16. Employee Wellness
0.400 The allocation is intended to promote the well-being of employees.
17. School Safety 0.757 The allocation is for school safety of learners and teachers at schools.
9. Other programme information 9.1 Personnel numbers and costs
Table 6.24 : Personnel numbers and costs by programme
Personnel numbers As at 31 March 2013
As at 31 March 2014
As at 31 March 2015
As at 31 March 2016
As at 31 March 2017
As at 31 March 2017
As at 31 March 2017
1. Administration 2 321 2 527 2 626 2 536 2 643 2 632 2 613 2. Public Ordinary School Education 27 183 25 511 25 843 25 136 23 372 23 205 23 056 3. Independent School Subsidies – – – – – – – 4. Public Special School Education 1 152 1 238 1 260 1 259 1 209 1 192 1 172 5. Early Childhood Development 1 097 1 364 1 376 1 429 1 470 1 467 1 465 6. Infrastructure Development – – – 25 25 25 25 7. Examination And Education Related Services 310 258 266 1 504 1 497 1 494 1 490 Direct charges – – – – – – – Total provincial personnel numbers 32 063 30 898 31 371 31 889 30 216 30 015 29 821 Total provincial personnel cost (R thousand) 7 844 142 8 414 360 8 761 787 9 397 839 9 393 355 10 092 639 10 798 585 Unit cost (R thousand) 245 272 279 295 311 336 362
1. Full-time equivalentTabchap19a
Vote
6
30
chap
20a
Table 1
7.2 : S
umma
ry of
depa
rtmen
tal pe
rsonn
el num
bers
and c
osts
by co
mpon
ent
Actua
lRe
vised
estim
ateMe
dium-
term
expen
diture
estim
ate
R tho
usan
ds
Perso
nnel
numb
ers1
Costs
Pe
rsonn
el nu
mbers
1 Co
sts
Perso
nnel
numb
ers1
Costs
Fil
led po
stsAd
dition
al po
stsPe
rsonn
el nu
mbers
1 Co
sts
Perso
nnel
numb
ers1
Costs
Pe
rsonn
el nu
mbers
1 Co
sts
Perso
nnel
numb
ers1
Costs
Pe
rsonn
el gro
wth ra
te Co
sts
growth
rate
% Co
sts of To
tal
Salar
y leve
l1 –
69 4
671 5
09 247
8 884
1 456
7108 4
281 4
43 329
8 137
–8 1
371 4
95 123
7 506
1 483
9757 4
421 5
93 045
7 382
1 705
469-3.
2%4.5
%15.
8%7 –
1019
3115 8
04 358
19 071
6 174
04119
5176 5
08 237
19 099
–19
0996 9
21 330
18 130
6 956
97018
0087 4
85 905
17 901
8 024
817-2.
1%5.1
%74.
1%11
– 12
997552
709
1 034
590 68
6994
621 68
7954
–954
653 87
2913
652 65
6900
694 12
4874
725 12
7-2.
9%3.5
%6.8
%13
– 16
5037
34252
39 591
4242
64037
–37
43 402
3643
44835
45 873
3448
170-2.
8%3.5
%0.5
%Oth
er2 2
38237
650
1 857
164 78
62 3
90176
462
–3 6
623 6
62284
112
3 631
256 30
63 6
30273
692
3 630
295 00
2-0.
3%1.3
%2.8
%To
tal32
0638 1
41 306
30 898
8 425
81431
3718 7
92 355
28 227
3 662
31 889
9 397
83930
2169 3
93 355
30 015
10 092
639
29 821
10 798
585
-2.2%
4.7%
100.0%
Progra
mme
1. Ad
ministr
ation
2 321
575 91
92 5
27635
099
2 626
670 52
41 8
62674
2 536
699 63
72 6
43766
638
2 632
821 78
02 6
13873
225
1.0%
7.7%
7.9%
2. Pu
blic Or
dinary
Schoo
l Educ
ation
27 183
6 804
51725
5117 2
24 392
25 843
7 492
41624
813323
25 136
8 041
38623
3727 9
32 062
23 205
8 532
58923
0569 1
41 622
-2.8%
4.4%
84.9%
3. Ind
epende
nt Scho
ol Subs
idies
– –
– –
– –
– –
– –
– –
– –
– –
– –
–4.
Public
Speci
al Scho
ol Educ
ation
1 152
261 07
11 2
38306
456
1 260
329 89
81 2
4514
1 259
355 13
21 2
09360
090
1 192
383 86
51 1
72406
487
-2.4%
4.6%
3.8%
5. Ea
rly Ch
ildhood
Deve
lopme
nt1 0
9778
2481 3
64107
341
1 376
112 54
234
1 395
1 429
114 96
61 4
70127
756
1 467
133 55
21 4
65143
078
0.8%
7.6%
1.3%
6. Infr
astruc
ture De
velop
ment
– –
– –
–4 6
5825
–25
8 917
2520
00025
21 000
2522
050 –
35.2%
0.2%
7. Ex
amina
tion An
d Educ
ation R
elated
310
124 38
7258
141 07
2266
151 74
9248
1 256
1 504
177 80
11 4
97186
809
1 494
199 85
31 4
90212
123
-0.3%
6.1%
1.9%
Direct
charg
es –
– –
– –
– –
– –
– –
– –
– –
– –
– –
Total
32 063
7 844
14230
8988 4
14 360
31 371
8 761
78728
2273 6
62.0
31 889
9 397
839.0
30 216
9 393
355.0
30 015
10 092
639.0
29 821
10 798
585.0
-2.2%
4.7%
100.0%
Emplo
yee di
spen
sation
class
ificati
onPu
blic Se
rvice
Act ap
pointe
es not
cove
red by
OSDs
6 365
–6 3
651 1
02 571
6 147
1 254
7916 1
121 3
65 921
6 055
1 457
280-1.
7%9.7
%13.
0%Pu
blic Se
rvice
Act a
ppointe
es stil
l to be
cove
red by
OSDs
2 –
21 3
242
1 384
21 4
992
1 617
–6.9
%0.0
%Pro
fessio
nal Nu
rses,
Staff N
urses
and Nu
rsing A
ssista
nts
18 –
188 2
6618
9 111
189 8
6718
10 646
–8.8
%0.1
%Leg
al Profe
ssiona
ls4
–4
2 305
42 4
854
2 690
42 9
03 –
8.0%
0.0%
Socia
l Serv
ices P
rofessi
ons
19 –
196 7
5519
7 334
197 9
4219
8 570
–8.3
%0.1
%En
gineer
ing Pr
ofessi
ons an
d rela
ted oc
cupatio
ns 4
–4
3 581
43 6
494
3 984
44 2
89 –
6.2%
0.0%
Medic
al and
related
profe
ssiona
ls –
– –
– –
– –
– –
– –
– –
Thera
peutic,
Diagn
ostic a
nd oth
er rela
ted Al
lied He
alth Pr
ofessi
onals
81 –
8137
39481
39 490
8142
76781
46 145
–7.3
%0.4
%Ed
ucators
and r
elated
profe
ssiona
ls21
734 –
21 734
7 951
53120
3227 8
25 467
20 156
8 408
16920
0198 9
97 589
-2.7%
4.2%
83.7%
Others
such
as inte
rns, E
PWP,
learne
rships
, etc
–3 6
623 6
62284
112
3 619
249 64
43 6
19249
800
3 619
269 54
6-0.
4%-1.
7%2.7
%To
tal28
2273 6
6231
8899 3
97 839
30 216
9 393
35530
01510
092 63
929
82110
798 58
5-2.
2%4.7
%100
.0%1.
Perso
nnel nu
mbers
includ
es all
filled p
osts t
ogethe
r with
those
posts
additio
nal to
the a
pprove
d esta
blishm
ent
Avera
ge an
nual
growth
over
MTEF
201
2/13
2013/1
4201
4/15
2015/1
6201
6/17
2017/1
8201
8/19
2015/1
6 - 20
18/19
VOTE 6 - Department of Education 277

Vote 6
31
8.10.2 Training
Table 6.26 : Payments on training by programme
Outcome Main appropriation
Adjusted appropriation Revised estimate Medium-term estimates
R thousand 2012/13 2013/14 2014/15 2016/17 2017/18 2018/191. Administration 11 865 5 812 8 297 35 274 16 010 15 702 23 800 26 300 28 709
Subsistence and travel 556 28 367 2 000 179 242 50 100 100 Payments on tuition 1 059 1 650 1 785 13 001 13 001 13 001 2 000 2 000 2 000 Other 10 250 4 134 6 145 20 273 2 830 2 459 21 750 24 200 26 609
2. Public Ordinary School Education 29 829 37 641 16 191 42 453 27 453 27 455 39 335 37 774 41 587 Subsistence and travel 6 638 7 431 2 319 13 226 7 726 3 454 7 370 7 284 8 335 Payments on tuition 3 499 3 513 – – – – – – – Other 19 692 26 697 13 872 29 227 19 727 24 001 31 965 30 490 33 252
3. Independent School Subsidies – – – – – – – – – Subsistence and travel – – – – – – – – – Payments on tuition – – – – – – – – – Other – – – – – – – – –
4. Public Special School Education – – – – – – 1 215 2 625 2 630 Subsistence and travel – – – – – – 50 500 100 Payments on tuition – – – – – – – – – Other – – – – – – 1 165 2 125 2 530
5. Early Childhood Development – – – – – – 1 100 3 650 2 349 Subsistence and travel – – – – – – – 550 – Payments on tuition – – – – – – – – – Other – – – – – – 1 100 3 100 2 349
6. Infrastructure Development – – – – – – – – – Subsistence and travel – – – – – – – – – Payments on tuition – – – – – – – – – Other – – – – – – – – –
7. Examination And Education Related Services
7 829 7 032 – 8 636 8 869 8 869 28 050 30 149 32 260
Subsistence and travel – – – – – – – – – Payments on tuition – – – – – – – – – Other 7 829 7 032 – 8 636 8 869 8 869 28 050 30 149 32 260
Total payments on training 49 523 50 485 24 488 86 363 52 332 52 026 93 500 100 498 107 535
2015/16
Tabchap21a Table 6.27 : Information on training: Education
Outcome Main appropriation
Adjusted appropriation Revised estimate Medium-term estimates
R thousand 2012/13 2013/14 2014/15 2016/17 2017/18 2018/19Number of staff – – – – – – – – –
Number of personnel trained 22 357 25 306 9 215 25 306 25 306 25 306 25 306 26 571 28 112 of which
Male 8 404 12 782 5 562 12 782 12 782 12 782 12 782 13 421 14 200 Female 13 953 12 524 3 653 12 524 12 524 12 524 12 524 13 150 13 913
Number of training opportunities 2 668 2 848 35 2 848 166 166 200 200 200 of which
Tertiary 2 668 2 848 – 2 848 – – 25 25 25 Workshops – – 35 – 166 166 150 150 150 Seminars – – – – – – 25 25 25 Other – – – – – – – – –
Number of bursaries offered 2 668 2 848 1 652 2 848 1 555 1 555 1 700 1 800 1 900 Number of interns appointed 76 80 110 80 16 16 50 50 50 Number of learnerships appointed 41 45 379 45 545 545 600 650 700 Number of days spent on training – – – – – – – – –
2015/16
Tabchap22a
Table 6.28: Reconciliation of Structural changes: Education
There were no structural changes for the MTEF period.
VOTE 6 - Department of Education278

Annexure to the Estimates of Provincial Revenue & Expenditure
VOTE 6 - Department of Education 279

Vote 6
33
Table B.1: Specification of receipts: Education
OutcomeMain
appropriationAdjusted
appropriationRevised estimate
Medium-term estimates
R thousand 2012/13 2013/14 2014/15 2016/17 2017/18 2018/19Tax receipts – – – – – – – – –
Casino taxes – – – – – – – – – Horse racing taxes – – – – – – – – – Liquor licences – – – – – – – – – Motor vehicle licences – – – – – – – – –
Sales of goods and services other than capital assets 11 738 13 033 13 309 14 004 12 866 12 866 12 641 12 688 12 737 Sale of goods and serv ices produced by department (excluding capital assets) 11 700 12 968 13 252 13 969 12 831 12 831 12 596 12 688 12 737
Sales by market establishments – – – – – – – – – Administrative fees – – – – – – – – – Other sales 11 700 12 968 13 252 13 969 12 831 12 831 12 596 12 688 12 737
Of whichHealth patient fees 11 111 12 021 12 275 13 379 12 241 12 241 11 446 11 508 11 532 Other (Specify) 271 346 411 300 300 300 350 360 370 Other (Specify) 267 302 204 170 170 170 200 210 220 Other (Specify) 51 299 362 120 120 120 600 610 615
Sales of scrap, waste, arms and other used current goods (excluding capital assets) 38 65 57 35 35 35 45 – –
Transfers received from: 5 – – – – – – – – Other governmental units – – – – – – – – – Higher education institutions – – – – – – – – – Foreign governments – – – – – – – – – International organisations – – – – – – – – – Public corporations and private enterprises 5 – – – – – – – – Households and non-profit institutions – – – – – – – – –
Fines, penalties and forfeits 233 263 530 300 300 300 365 390 415
Interest, dividends and rent on land 650 368 1 875 340 340 340 360 380 400 Interest 650 368 1 875 340 340 340 360 380 400 Div idends – – – – – – – – – Rent on land – – – – – – – – –
Sales of capital assets – 1 3 – – – – – – Land and sub-soil assets – – – – – – – – – Other capital assets – 1 3 – – – – – –
Transactions in financial assets and liabilities 6 456 4 360 4 546 5 700 5 700 5 700 5 989 6 340 6 715 Total departmental receipts 19 082 18 025 20 263 20 344 19 206 19 206 19 355 19 798 20 267
2015/16
Tabchap23a
VOTE 6 - Department of Education280

Vote 6
34
Table B.2: Payments and estimates by economic classification: Education
OutcomeMain
appropriationAdjusted
appropriationRevised estimate
Medium-term estimates
R thousand 2012/13 2013/14 2014/15 2016/17 2017/18 2018/19Current payments 8 518 369 8 931 571 9 513 042 9 282 394 9 502 034 10 051 560 10 202 256 11 103 719 11 735 859
Compensation of employ ees 7 844 142 8 414 360 8 761 787 8 681 725 8 843 034 9 397 839 9 393 355 10 092 639 10 798 585 Salaries and w ages 6 702 955 7 206 120 7 529 718 7 496 037 7 538 046 8 036 849 8 001 925 8 598 480 9 198 561 Social contributions 1 141 187 1 208 240 1 232 069 1 185 688 1 304 988 1 360 990 1 391 430 1 494 159 1 600 024
Goods and serv ices 674 227 517 211 750 976 600 669 658 460 653 152 806 901 1 000 495 933 694 Administrative fees 571 634 502 914 2 719 3 076 14 683 14 672 14 739 Advertising 2 886 1 394 604 220 1 016 1 125 1 928 2 445 2 729 Minor assets 5 416 2 215 356 7 120 922 881 36 541 27 747 20 975 Audit cost: External 10 472 9 784 14 866 17 600 17 564 17 564 15 788 19 906 16 044 Bursaries: Employees 4 558 5 163 2 902 25 101 13 001 13 001 2 000 2 000 2 000 Catering: Departmental activities 27 269 38 144 4 092 23 283 23 803 23 732 21 254 40 906 35 891 Communication (G&S) 15 911 17 934 18 549 17 249 19 037 21 066 11 990 12 814 12 818 Computer services 14 662 31 294 45 926 86 244 52 046 47 158 65 601 102 606 78 056 Consultants and professional services: Business and advisory services 16 605 23 081 14 283 46 960 36 683 45 423 52 418 59 855 61 619 Consultants and professional services: Infrastructure and planning 47 – 216 – 328 367 – – – Consultants and professional services: Laboratory services – – – – – – – – – Consultants and professional services: Scientific and technological services – – – – – – – – – Consultants and professional services: Legal costs 1 029 4 487 390 3 600 3 563 3 715 1 800 4 347 2 890 Contractors 13 502 8 898 3 689 338 7 542 7 564 20 752 1 669 1 830 Agency and support / outsourced services 14 996 15 031 14 913 – 133 333 356 612 612 Entertainment 71 99 27 7 47 37 107 145 145 Fleet services (including government motor transport) – 31 174 23 945 20 000 24 407 23 400 11 199 25 200 1 853 Housing – – – – – – – – – Inventory: Clothing material and accessories – – – 102 53 53 23 48 38 Inventory: Farming supplies – – – – – – – – – Inventory: Food and food supplies 3 972 5 475 5 668 6 900 6 900 6 900 3 012 3 212 4 210 Inventory: Fuel, oil and gas 16 – – – – – 10 61 66 Inventory: Learner and teacher support material 335 321 84 431 287 969 135 379 177 720 178 096 127 772 143 628 158 435 Inventory: Materials and supplies 240 275 181 1 456 1 041 1 041 111 223 3 Inventory: Medical supplies 555 501 3 1 028 1 523 1 523 899 787 510 Inventory: Medicine – – – – – – – – – Medsas inventory interface – – – – – – – – – Inventory: Other supplies – 3 229 58 326 37 567 62 145 78 221 51 456 64 133 75 046 Consumable supplies 3 659 3 846 1 230 5 708 5 463 5 518 6 866 10 716 7 202 Consumable: Stationery,printing and office supplies 10 824 10 149 5 520 13 726 13 455 13 272 111 646 156 303 155 545 Operating leases 19 053 45 313 24 536 20 849 25 539 23 359 15 467 26 801 14 501 Property payments 27 715 30 214 27 435 22 836 67 984 46 452 23 600 32 321 37 917 Transport provided: Departmental activity 44 687 52 669 64 479 2 716 7 859 7 845 2 919 3 684 3 542 Travel and subsistence 62 968 50 159 57 936 60 992 51 245 46 907 144 604 159 228 151 286 Training and development 12 869 12 738 44 414 21 068 16 154 16 287 45 413 59 799 55 435 Operating payments 19 042 26 382 27 341 14 966 17 643 17 833 11 567 18 014 10 917 Venues and facilities 5 311 2 498 637 6 740 925 778 5 119 6 613 6 840 Rental and hiring – – 41 – – 625 – – –
Interest and rent on land – – 279 – 540 569 2 000 10 585 3 580 Interest – – 279 – 540 569 2 000 10 585 3 580 Rent on land – – – – – – – – –
Transfers and subsidies 1 050 445 1 288 267 1 447 117 1 505 504 1 509 000 1 559 297 1 167 069 1 245 681 1 278 565 Prov inces and municipalities – – – – – -1 – – –
Prov inces – – – – – -1 – – – Prov incial Rev enue Funds – – – – – – – – – Prov incial agencies and funds – – – – – -1 – – –
Municipalities – – – – – – – – – Municipalities – – – – – – – – – Municipal agencies and funds – – – – – – – – –
Departmental agencies and accounts 7 832 7 036 8 8 658 8 881 8 880 28 082 30 180 32 292 Social security funds – – – – – – – – – Prov ide list of entities receiv ing transfers 7 832 7 036 8 8 658 8 881 8 880 28 082 30 180 32 292
Higher education institutions – – – – – – – – – Foreign gov ernments and international organisations – – – – – – – – – Public corporations and priv ate enterprises – – – – – – – – –
Public corporations – – – – – – – – – Subsidies on production – – – – – – – – – Other transfers – – – – – – – – –
Priv ate enterprises – – – – – – – – – Subsidies on production – – – – – – – – – Other transfers – – – – – – – – –
Non-profit institutions 872 544 999 730 994 158 1 038 246 1 041 476 1 043 785 1 101 387 1 177 821 1 208 573 Households 170 069 281 501 452 951 458 600 458 643 506 633 37 600 37 680 37 700
Social benefits 44 624 58 798 84 279 20 700 20 743 68 688 20 800 20 880 20 900 Other transfers to households 125 445 222 703 368 672 437 900 437 900 437 945 16 800 16 800 16 800
Payments for capital assets 487 659 337 729 385 593 750 206 804 389 803 888 690 422 673 500 698 748 Buildings and other fix ed structures 448 314 325 867 374 643 740 340 788 401 788 984 672 886 635 063 667 599
Buildings – – – – – – – – – Other fix ed structures 448 314 325 867 374 643 740 340 788 401 788 984 672 886 635 063 667 599
Machinery and equipment 38 885 11 862 10 950 9 866 13 279 12 437 13 336 34 417 31 149 Transport equipment – – 5 915 – – – – – – Other machinery and equipment 38 885 11 862 5 035 9 866 13 279 12 437 13 336 34 417 31 149
Heritage Assets – – – – – – – – – Specialised military assets – – – – – – – – – Biological assets – – – – – – – – – Land and sub-soil assets – – – – – – – – – Softw are and other intangible assets 460 – – – 2 709 2 467 4 200 4 020 –
Payments for financial assets 296 64 6 062 – – 5 – – –
Total economic classification 10 056 769 10 557 631 11 351 814 11 538 104 11 815 423 12 414 750 12 059 747 13 022 900 13 713 171
2015/16
Tabchap24a
VOTE 6 - Department of Education 281

Vote 6
35
Table B.2a: Payments and estimates by economic classification: Administration
OutcomeMain
appropriationAdjusted
appropriationRevised estimate
Medium-term estimates
R thousand 2012/13 2013/14 2014/15 2016/17 2017/18 2018/19Current payments 713 987 839 596 829 439 915 844 871 143 865 647 914 823 1 045 244 1 036 037
Compensation of employ ees 575 919 635 099 670 524 733 457 703 760 699 637 766 638 821 780 873 225 Salaries and w ages 495 703 547 786 580 801 641 473 605 332 601 105 662 128 709 566 753 728 Social contributions 80 216 87 313 89 723 91 984 98 428 98 532 104 510 112 214 119 497
Goods and serv ices 138 068 204 497 158 664 182 387 166 854 165 452 146 185 212 879 159 232 Administrative fees 565 606 501 594 577 934 1 103 1 084 1 159 Advertising 2 815 820 360 – 906 915 1 370 1 265 1 267 Assets less than the capitalisation threshold 1 100 1 141 217 428 441 426 907 655 714 Audit cost: External 10 472 9 784 14 866 17 600 17 564 17 564 15 756 19 880 16 044 Bursaries: Employees 1 059 1 650 1 785 13 001 13 001 13 001 2 000 2 000 2 000 Catering: Departmental activities 2 397 3 105 447 1 699 1 687 1 479 2 567 4 263 4 206 Communication (G&S) 15 147 17 646 18 297 17 070 18 638 20 665 11 641 12 473 12 354 Computer services 1 935 9 162 16 856 14 681 11 626 10 584 15 312 27 122 16 742 Consultants and professional services: Business and advisory services 3 743 938 3 367 4 200 2 560 2 458 6 024 7 126 5 800 Consultants and professional services: Infrastructure and planning 47 – 106 – – – – – – Consultants and professional services: Laboratory services – – – – – – – – – Consultants and professional services: Scientific and technological services – – – – – – – – – Consultants and professional services: Legal costs 1 029 4 487 390 3 600 3 563 3 715 1 800 4 347 2 890 Contractors 225 2 145 2 804 170 7 382 7 404 949 1 283 1 441 Agency and support / outsourced services 14 235 15 031 1 067 – 126 326 56 112 112 Entertainment 71 99 27 7 47 37 107 145 145 Fleet services (including government motor transport) – 31 174 23 945 20 000 23 240 22 233 10 015 24 000 353 Housing – – – – – – – – – Inventory: Clothing material and accessories – – – 88 53 53 18 33 23 Inventory: Farming supplies – – – – – – – – – Inventory: Food and food supplies – 7 – – – – 10 10 10 Inventory: Fuel, oil and gas 10 – – – – – – 50 55 Inventory: Learner and teacher support material 229 356 141 14 237 9 8 197 207 218 Inventory: Materials and supplies 99 10 – – 299 299 9 3 3 Inventory: Medical supplies – – – – – – 31 3 4 Inventory: Medicine – – – – – – – – – Medsas inventory interface – – – – – – – – – Inventory: Other supplies – – 1 612 – – – 626 2 744 2 857 Consumable supplies 570 2 140 368 1 739 2 394 2 235 2 831 4 381 5 141 Consumable: Stationery,printing and office supplies 2 799 5 796 1 930 6 833 5 190 4 986 11 084 13 910 14 742 Operating leases 18 914 45 311 24 536 20 794 25 490 23 310 14 633 23 279 14 205 Property payments 1 242 1 295 3 646 1 694 1 044 1 385 2 286 2 407 2 480 Transport provided: Departmental activity 552 794 219 70 326 382 1 000 1 683 1 743 Travel and subsistence 38 669 27 400 16 329 29 700 19 212 19 073 26 967 33 066 32 426 Training and development 2 119 940 703 3 000 455 924 3 025 6 512 6 725 Operating payments 17 082 22 067 24 039 7 582 10 728 10 952 9 492 14 242 8 533 Venues and facilities 943 593 106 3 600 296 104 4 369 4 594 4 840 Rental and hiring – – – – – – – – –
Interest and rent on land – – 251 – 529 558 2 000 10 585 3 580 Interest – – 251 – 529 558 2 000 10 585 3 580 Rent on land – – – – – – – – –
Transfers and subsidies 2 977 6 024 7 793 2 459 2 501 7 373 2 759 2 838 2 858 Prov inces and municipalities – – – – – -1 – – –
Prov inces – – – – – -1 – – – Prov incial Rev enue Funds – – – – – – – – – Prov incial agencies and funds – – – – – -1 – – –
Municipalities – – – – – – – – – Municipalities – – – – – – – – – Municipal agencies and funds – – – – – – – – –
Departmental agencies and accounts 3 3 8 13 12 13 24 23 23 Social security funds – – – – – – – – – Prov ide list of entities receiv ing transfers 3 3 8 13 12 13 24 23 23
Higher education institutions – – – – – – – – – Foreign gov ernments and international organisations – – – – – – – – – Public corporations and priv ate enterprises – – – – – – – – –
Public corporations – – – – – – – – – Subsidies on production – – – – – – – – – Other transfers – – – – – – – – –
Priv ate enterprises – – – – – – – – – Subsidies on production – – – – – – – – – Other transfers – – – – – – – – –
Non-profit institutions 140 600 – – – – – – – Households 2 834 5 421 7 785 2 446 2 489 7 361 2 735 2 815 2 835
Social benefits 2 787 5 330 7 786 2 446 2 489 7 318 2 735 2 815 2 835 Other transfers to households 47 91 -1 – – 43 – – –
Payments for capital assets 34 015 10 962 3 928 8 254 12 018 10 837 14 136 16 656 8 642 Buildings and other fix ed structures – – – – – – – – –
Buildings – – – – – – – – – Other fix ed structures – – – – – – – – –
Machinery and equipment 33 555 10 962 3 928 8 254 9 309 8 370 10 336 12 636 8 642 Transport equipment – – – – – – – – – Other machinery and equipment 33 555 10 962 3 928 8 254 9 309 8 370 10 336 12 636 8 642
Heritage Assets – – – – – – – – – Specialised military assets – – – – – – – – – Biological assets – – – – – – – – – Land and sub-soil assets – – – – – – – – – Softw are and other intangible assets 460 – – – 2 709 2 467 3 800 4 020 –
Payments for financial assets 296 64 2 334 – – 3 – – –
Total economic classification 751 275 856 646 843 494 926 557 885 662 883 860 931 718 1 064 738 1 047 537
2015/16
Tabchap25a
VOTE 6 - Department of Education282
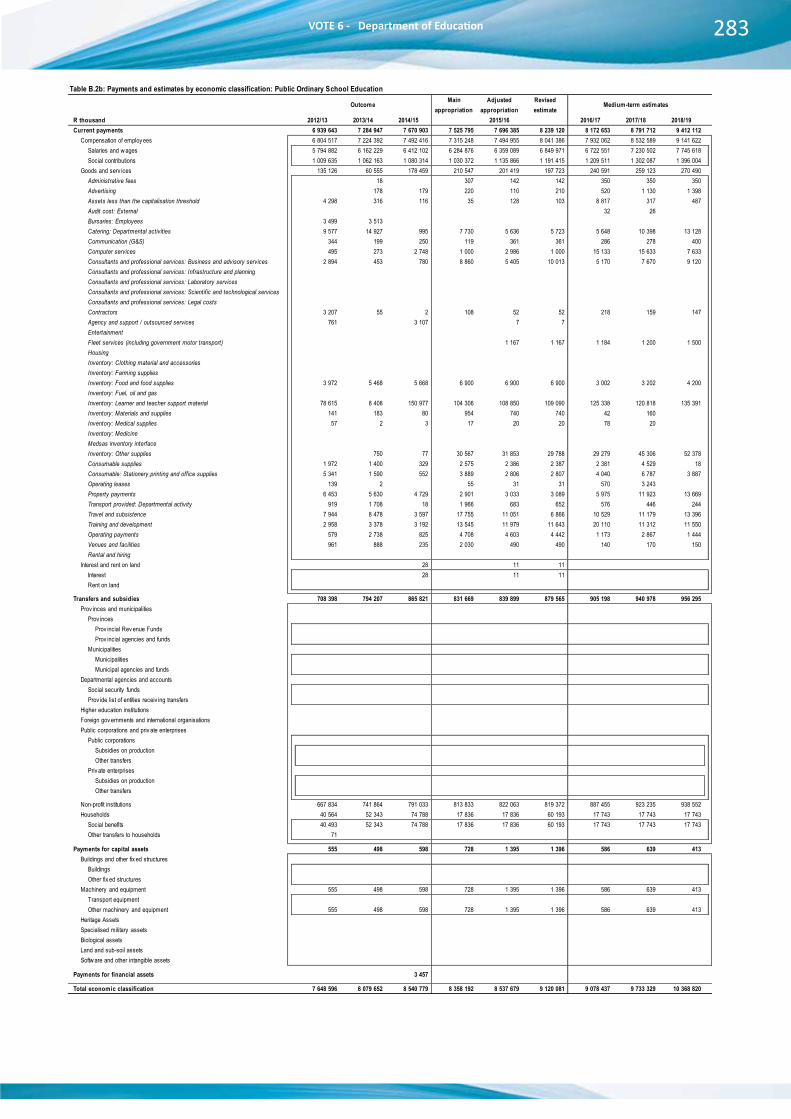
Vote 6
35
Table B.2a: Payments and estimates by economic classification: Administration
OutcomeMain
appropriationAdjusted
appropriationRevised estimate
Medium-term estimates
R thousand 2012/13 2013/14 2014/15 2016/17 2017/18 2018/19Current payments 713 987 839 596 829 439 915 844 871 143 865 647 914 823 1 045 244 1 036 037
Compensation of employ ees 575 919 635 099 670 524 733 457 703 760 699 637 766 638 821 780 873 225 Salaries and w ages 495 703 547 786 580 801 641 473 605 332 601 105 662 128 709 566 753 728 Social contributions 80 216 87 313 89 723 91 984 98 428 98 532 104 510 112 214 119 497
Goods and serv ices 138 068 204 497 158 664 182 387 166 854 165 452 146 185 212 879 159 232 Administrative fees 565 606 501 594 577 934 1 103 1 084 1 159 Advertising 2 815 820 360 – 906 915 1 370 1 265 1 267 Assets less than the capitalisation threshold 1 100 1 141 217 428 441 426 907 655 714 Audit cost: External 10 472 9 784 14 866 17 600 17 564 17 564 15 756 19 880 16 044 Bursaries: Employees 1 059 1 650 1 785 13 001 13 001 13 001 2 000 2 000 2 000 Catering: Departmental activities 2 397 3 105 447 1 699 1 687 1 479 2 567 4 263 4 206 Communication (G&S) 15 147 17 646 18 297 17 070 18 638 20 665 11 641 12 473 12 354 Computer services 1 935 9 162 16 856 14 681 11 626 10 584 15 312 27 122 16 742 Consultants and professional services: Business and advisory services 3 743 938 3 367 4 200 2 560 2 458 6 024 7 126 5 800 Consultants and professional services: Infrastructure and planning 47 – 106 – – – – – – Consultants and professional services: Laboratory services – – – – – – – – – Consultants and professional services: Scientific and technological services – – – – – – – – – Consultants and professional services: Legal costs 1 029 4 487 390 3 600 3 563 3 715 1 800 4 347 2 890 Contractors 225 2 145 2 804 170 7 382 7 404 949 1 283 1 441 Agency and support / outsourced services 14 235 15 031 1 067 – 126 326 56 112 112 Entertainment 71 99 27 7 47 37 107 145 145 Fleet services (including government motor transport) – 31 174 23 945 20 000 23 240 22 233 10 015 24 000 353 Housing – – – – – – – – – Inventory: Clothing material and accessories – – – 88 53 53 18 33 23 Inventory: Farming supplies – – – – – – – – – Inventory: Food and food supplies – 7 – – – – 10 10 10 Inventory: Fuel, oil and gas 10 – – – – – – 50 55 Inventory: Learner and teacher support material 229 356 141 14 237 9 8 197 207 218 Inventory: Materials and supplies 99 10 – – 299 299 9 3 3 Inventory: Medical supplies – – – – – – 31 3 4 Inventory: Medicine – – – – – – – – – Medsas inventory interface – – – – – – – – – Inventory: Other supplies – – 1 612 – – – 626 2 744 2 857 Consumable supplies 570 2 140 368 1 739 2 394 2 235 2 831 4 381 5 141 Consumable: Stationery,printing and office supplies 2 799 5 796 1 930 6 833 5 190 4 986 11 084 13 910 14 742 Operating leases 18 914 45 311 24 536 20 794 25 490 23 310 14 633 23 279 14 205 Property payments 1 242 1 295 3 646 1 694 1 044 1 385 2 286 2 407 2 480 Transport provided: Departmental activity 552 794 219 70 326 382 1 000 1 683 1 743 Travel and subsistence 38 669 27 400 16 329 29 700 19 212 19 073 26 967 33 066 32 426 Training and development 2 119 940 703 3 000 455 924 3 025 6 512 6 725 Operating payments 17 082 22 067 24 039 7 582 10 728 10 952 9 492 14 242 8 533 Venues and facilities 943 593 106 3 600 296 104 4 369 4 594 4 840 Rental and hiring – – – – – – – – –
Interest and rent on land – – 251 – 529 558 2 000 10 585 3 580 Interest – – 251 – 529 558 2 000 10 585 3 580 Rent on land – – – – – – – – –
Transfers and subsidies 2 977 6 024 7 793 2 459 2 501 7 373 2 759 2 838 2 858 Prov inces and municipalities – – – – – -1 – – –
Prov inces – – – – – -1 – – – Prov incial Rev enue Funds – – – – – – – – – Prov incial agencies and funds – – – – – -1 – – –
Municipalities – – – – – – – – – Municipalities – – – – – – – – – Municipal agencies and funds – – – – – – – – –
Departmental agencies and accounts 3 3 8 13 12 13 24 23 23 Social security funds – – – – – – – – – Prov ide list of entities receiv ing transfers 3 3 8 13 12 13 24 23 23
Higher education institutions – – – – – – – – – Foreign gov ernments and international organisations – – – – – – – – – Public corporations and priv ate enterprises – – – – – – – – –
Public corporations – – – – – – – – – Subsidies on production – – – – – – – – – Other transfers – – – – – – – – –
Priv ate enterprises – – – – – – – – – Subsidies on production – – – – – – – – – Other transfers – – – – – – – – –
Non-profit institutions 140 600 – – – – – – – Households 2 834 5 421 7 785 2 446 2 489 7 361 2 735 2 815 2 835
Social benefits 2 787 5 330 7 786 2 446 2 489 7 318 2 735 2 815 2 835 Other transfers to households 47 91 -1 – – 43 – – –
Payments for capital assets 34 015 10 962 3 928 8 254 12 018 10 837 14 136 16 656 8 642 Buildings and other fix ed structures – – – – – – – – –
Buildings – – – – – – – – – Other fix ed structures – – – – – – – – –
Machinery and equipment 33 555 10 962 3 928 8 254 9 309 8 370 10 336 12 636 8 642 Transport equipment – – – – – – – – – Other machinery and equipment 33 555 10 962 3 928 8 254 9 309 8 370 10 336 12 636 8 642
Heritage Assets – – – – – – – – – Specialised military assets – – – – – – – – – Biological assets – – – – – – – – – Land and sub-soil assets – – – – – – – – – Softw are and other intangible assets 460 – – – 2 709 2 467 3 800 4 020 –
Payments for financial assets 296 64 2 334 – – 3 – – –
Total economic classification 751 275 856 646 843 494 926 557 885 662 883 860 931 718 1 064 738 1 047 537
2015/16
Tabchap25a
Vote 6
36
Table B.2b: Payments and estimates by economic classification: Public Ordinary School Education
OutcomeMain
appropriationAdjusted
appropriationRevised estimate
Medium-term estimates
R thousand 2012/13 2013/14 2014/15 2016/17 2017/18 2018/19Current payments 6 939 643 7 284 947 7 670 903 7 525 795 7 696 385 8 239 120 8 172 653 8 791 712 9 412 112
Compensation of employ ees 6 804 517 7 224 392 7 492 416 7 315 248 7 494 955 8 041 386 7 932 062 8 532 589 9 141 622 Salaries and w ages 5 794 882 6 162 229 6 412 102 6 284 876 6 359 089 6 849 971 6 722 551 7 230 502 7 745 618 Social contributions 1 009 635 1 062 163 1 080 314 1 030 372 1 135 866 1 191 415 1 209 511 1 302 087 1 396 004
Goods and serv ices 135 126 60 555 178 459 210 547 201 419 197 723 240 591 259 123 270 490 Administrative fees – 18 – 307 142 142 350 350 350 Advertising – 178 179 220 110 210 520 1 130 1 398 Assets less than the capitalisation threshold 4 298 316 116 35 128 103 8 817 317 487 Audit cost: External – – – – – – 32 26 – Bursaries: Employees 3 499 3 513 – – – – – – – Catering: Departmental activities 9 577 14 927 995 7 730 5 636 5 723 5 648 10 398 13 128 Communication (G&S) 344 199 250 119 361 361 286 278 400 Computer services 495 273 2 748 1 000 2 986 1 000 15 133 15 633 7 633 Consultants and professional services: Business and advisory services 2 894 453 780 8 860 5 405 10 013 5 170 7 670 9 120 Consultants and professional services: Infrastructure and planning – – – – – – – – – Consultants and professional services: Laboratory services – – – – – – – – – Consultants and professional services: Scientific and technological services – – – – – – – – – Consultants and professional services: Legal costs – – – – – – – – – Contractors 3 207 55 2 108 52 52 218 159 147 Agency and support / outsourced services 761 – 3 107 – 7 7 – – – Entertainment – – – – – – – – – Fleet services (including government motor transport) – – – – 1 167 1 167 1 184 1 200 1 500 Housing – – – – – – – – – Inventory: Clothing material and accessories – – – – – – – – – Inventory: Farming supplies – – – – – – – – – Inventory: Food and food supplies 3 972 5 468 5 668 6 900 6 900 6 900 3 002 3 202 4 200 Inventory: Fuel, oil and gas – – – – – – – – – Inventory: Learner and teacher support material 78 615 8 408 150 977 104 306 108 850 109 090 125 338 120 818 135 391 Inventory: Materials and supplies 141 183 80 954 740 740 42 160 – Inventory: Medical supplies 57 2 3 17 20 20 78 20 – Inventory: Medicine – – – – – – – – – Medsas inventory interface – – – – – – – – – Inventory: Other supplies – 750 77 30 567 31 853 29 788 29 279 45 306 52 378 Consumable supplies 1 972 1 400 329 2 575 2 386 2 387 2 381 4 529 18 Consumable: Stationery,printing and office supplies 5 341 1 590 552 3 889 2 806 2 807 4 040 6 787 3 887 Operating leases 139 2 – 55 31 31 570 3 243 – Property payments 6 453 5 630 4 729 2 901 3 033 3 089 5 975 11 923 13 669 Transport provided: Departmental activity 919 1 708 18 1 966 683 652 576 446 244 Travel and subsistence 7 944 8 478 3 597 17 755 11 051 6 866 10 529 11 179 13 396 Training and development 2 958 3 378 3 192 13 545 11 979 11 643 20 110 11 312 11 550 Operating payments 579 2 738 825 4 708 4 603 4 442 1 173 2 867 1 444 Venues and facilities 961 888 235 2 030 490 490 140 170 150 Rental and hiring – – – – – – – – –
Interest and rent on land – – 28 – 11 11 – – – Interest – – 28 – 11 11 – – – Rent on land – – – – – – – – –
Transfers and subsidies 708 398 794 207 865 821 831 669 839 899 879 565 905 198 940 978 956 295 Prov inces and municipalities – – – – – – – – –
Prov inces – – – – – – – – – Prov incial Rev enue Funds – – – – – – – – – Prov incial agencies and funds – – – – – – – – –
Municipalities – – – – – – – – – Municipalities – – – – – – – – – Municipal agencies and funds – – – – – – – – –
Departmental agencies and accounts – – – – – – – – – Social security funds – – – – – – – – – Prov ide list of entities receiv ing transfers – – – – – – – – –
Higher education institutions – – – – – – – – – Foreign gov ernments and international organisations – – – – – – – – – Public corporations and priv ate enterprises – – – – – – – – –
Public corporations – – – – – – – – – Subsidies on production – – – – – – – – – Other transfers – – – – – – – – –
Priv ate enterprises – – – – – – – – – Subsidies on production – – – – – – – – – Other transfers – – – – – – – – –
Non-profit institutions 667 834 741 864 791 033 813 833 822 063 819 372 887 455 923 235 938 552 Households 40 564 52 343 74 788 17 836 17 836 60 193 17 743 17 743 17 743
Social benefits 40 493 52 343 74 788 17 836 17 836 60 193 17 743 17 743 17 743 Other transfers to households 71 – – – – – – – –
Payments for capital assets 555 498 598 728 1 395 1 396 586 639 413 Buildings and other fix ed structures – – – – – – – – –
Buildings – – – – – – – – – Other fix ed structures – – – – – – – – –
Machinery and equipment 555 498 598 728 1 395 1 396 586 639 413 Transport equipment – – – – – – – – – Other machinery and equipment 555 498 598 728 1 395 1 396 586 639 413
Heritage Assets – – – – – – – – – Specialised military assets – – – – – – – – – Biological assets – – – – – – – – – Land and sub-soil assets – – – – – – – – – Softw are and other intangible assets – – – – – – – – –
Payments for financial assets – – 3 457 – – – – – –
Total economic classification 7 648 596 8 079 652 8 540 779 8 358 192 8 537 679 9 120 081 9 078 437 9 733 329 10 368 820
2015/16
Tabchap26a
VOTE 6 - Department of Education 283

Vote 6
37
Table B.2C: Payments and estimates by economic classification: Independent School Subsidies
OutcomeMain
appropriationAdjusted
appropriationRevised estimate
Medium-term estimates
R thousand 2012/13 2013/14 2014/15 2016/17 2017/18 2018/19Current payments – – – – – – – – –
Compensation of employ ees – – – – – – – – – Salaries and w ages – – – – – – – – – Social contributions – – – – – – – – –
Goods and serv ices – – – – – – – – – Administrative fees – – – – – – – – – Advertising – – – – – – – – – Assets less than the capitalisation threshold – – – – – – – – – Audit cost: External – – – – – – – – – Bursaries: Employees – – – – – – – – – Catering: Departmental activities – – – – – – – – – Communication (G&S) – – – – – – – – – Computer services – – – – – – – – – Consultants and professional services: Business and advisory services – – – – – – – – – Consultants and professional services: Infrastructure and planning – – – – – – – – – Consultants and professional services: Laboratory services – – – – – – – – – Consultants and professional services: Scientific and technological services – – – – – – – – – Consultants and professional services: Legal costs – – – – – – – – – Contractors – – – – – – – – – Agency and support / outsourced services – – – – – – – – – Entertainment – – – – – – – – – Fleet services (including government motor transport) – – – – – – – – – Housing – – – – – – – – – Inventory: Clothing material and accessories – – – – – – – – – Inventory: Farming supplies – – – – – – – – – Inventory: Food and food supplies – – – – – – – – – Inventory: Fuel, oil and gas – – – – – – – – – Inventory: Learner and teacher support material – – – – – – – – – Inventory: Materials and supplies – – – – – – – – – Inventory: Medical supplies – – – – – – – – – Inventory: Medicine – – – – – – – – – Medsas inventory interface – – – – – – – – – Inventory: Other supplies – – – – – – – – – Consumable supplies – – – – – – – – – Consumable: Stationery,printing and office supplies – – – – – – – – – Operating leases – – – – – – – – – Property payments – – – – – – – – – Transport provided: Departmental activity – – – – – – – – – Travel and subsistence – – – – – – – – – Training and development – – – – – – – – – Operating payments – – – – – – – – – Venues and facilities – – – – – – – – – Rental and hiring – – – – – – – – –
Interest and rent on land – – – – – – – – – Interest – – – – – – – – – Rent on land – – – – – – – – –
Transfers and subsidies 45 801 40 367 66 504 66 172 61 172 61 172 70 074 71 873 76 332 Prov inces and municipalities – – – – – – – – –
Prov inces – – – – – – – – – Prov incial Rev enue Funds – – – – – – – – – Prov incial agencies and funds – – – – – – – – –
Municipalities – – – – – – – – – Municipalities – – – – – – – – – Municipal agencies and funds – – – – – – – – –
Departmental agencies and accounts – – – – – – – – – Social security funds – – – – – – – – – Prov ide list of entities receiv ing transfers – – – – – – – – –
Higher education institutions – – – – – – – – – Foreign gov ernments and international organisations – – – – – – – – – Public corporations and priv ate enterprises – – – – – – – – –
Public corporations – – – – – – – – – Subsidies on production – – – – – – – – – Other transfers – – – – – – – – –
Priv ate enterprises – – – – – – – – – Subsidies on production – – – – – – – – – Other transfers – – – – – – – – –
Non-profit institutions 45 801 40 367 66 504 66 172 61 172 61 172 70 074 71 873 76 332 Households – – – – – – – – –
Social benefits – – – – – – – – – Other transfers to households – – – – – – – – –
Payments for capital assets – – – – – – – – – Buildings and other fix ed structures – – – – – – – – –
Buildings – – – – – – – – – Other fix ed structures – – – – – – – – –
Machinery and equipment – – – – – – – – – Transport equipment – – – – – – – – – Other machinery and equipment – – – – – – – – –
Heritage Assets – – – – – – – – – Specialised military assets – – – – – – – – – Biological assets – – – – – – – – – Land and sub-soil assets – – – – – – – – – Softw are and other intangible assets – – – – – – – – –
Payments for financial assets – – – – – – – – –
Total economic classification 45 801 40 367 66 504 66 172 61 172 61 172 70 074 71 873 76 332
2015/16
Tabchap27a
VOTE 6 - Department of Education
Vote 6
38
Table B.2: Payments and estimates by economic classification: Public Special School Education
OutcomeMain
appropriationAdjusted
appropriationRevised estimate
Medium-term estimates
R thousand 2012/13 2013/14 2014/15 2016/17 2017/18 2018/19Current payments 261 078 306 498 329 918 327 601 351 119 355 249 361 608 386 900 409 534
Compensation of employ ees 261 071 306 456 329 898 327 501 351 019 355 132 360 090 383 865 406 487 Salaries and w ages 222 432 261 851 282 948 279 756 297 412 301 068 304 239 324 211 343 216 Social contributions 38 639 44 605 46 950 47 745 53 607 54 064 55 851 59 654 63 271
Goods and serv ices 7 42 20 100 100 117 1 518 3 035 3 047 Administrative fees – – – – – – – 1 – Advertising – – – – – – – – – Assets less than the capitalisation threshold – – – – – – – – – Audit cost: External – – – – – – – – – Bursaries: Employees – – – – – – – – – Catering: Departmental activities – 31 – – – – 402 1 184 1 692 Communication (G&S) – – – – – – – – – Computer services – – – – – – – – – Consultants and professional services: Business and advisory services – – – – – – 250 450 450 Consultants and professional services: Infrastructure and planning – – – – – – – – – Consultants and professional services: Laboratory services – – – – – – – – – Consultants and professional services: Scientific and technological services – – – – – – – – – Consultants and professional services: Legal costs – – – – – – – – – Contractors – – – – – – – – – Agency and support / outsourced services – – – – – – – – – Entertainment – – – – – – – – – Fleet services (including government motor transport) – – – – – – – – – Housing – – – – – – – – – Inventory: Clothing material and accessories – – – – – – – – – Inventory: Farming supplies – – – – – – – – – Inventory: Food and food supplies – – – – – – – – – Inventory: Fuel, oil and gas – – – – – – – – – Inventory: Learner and teacher support material – – – – – – – – – Inventory: Materials and supplies – – – – – – – – – Inventory: Medical supplies – – – – – – – – – Inventory: Medicine – – – – – – – – – Medsas inventory interface – – – – – – – – – Inventory: Other supplies – – – – – – – – – Consumable supplies – – – – – – – – – Consumable: Stationery,printing and office supplies – – – – – – – 300 350 Operating leases – – – – – – – – – Property payments – – – – – – – – – Transport provided: Departmental activity – – – 100 100 100 276 275 275 Travel and subsistence 7 2 2 – – – 50 500 100 Training and development – – – – – – 540 325 180 Operating payments – 1 18 – – 17 – – – Venues and facilities – 8 – – – – – – – Rental and hiring – – – – – – – – –
Interest and rent on land – – – – – – – – – Interest – – – – – – – – – Rent on land – – – – – – – – –
Transfers and subsidies 51 466 48 199 52 860 60 226 60 226 60 957 65 270 68 068 72 015 Prov inces and municipalities – – – – – – – – –
Prov inces – – – – – – – – – Prov incial Rev enue Funds – – – – – – – – – Prov incial agencies and funds – – – – – – – – –
Municipalities – – – – – – – – – Municipalities – – – – – – – – – Municipal agencies and funds – – – – – – – – –
Departmental agencies and accounts – – – – – – – – – Social security funds – – – – – – – – – Prov ide list of entities receiv ing transfers – – – – – – – – –
Higher education institutions – – – – – – – – – Foreign gov ernments and international organisations – – – – – – – – – Public corporations and priv ate enterprises – – – – – – – – –
Public corporations – – – – – – – – – Subsidies on production – – – – – – – – – Other transfers – – – – – – – – –
Priv ate enterprises – – – – – – – – – Subsidies on production – – – – – – – – – Other transfers – – – – – – – – –
Non-profit institutions 50 793 47 343 51 571 59 907 59 907 59 907 64 982 67 780 71 727 Households 673 856 1 289 319 319 1 050 288 288 288
Social benefits 673 856 1 289 319 319 1 050 288 288 288 Other transfers to households – – – – – – – – –
Payments for capital assets – – – – – – – – – Buildings and other fix ed structures – – – – – – – – –
Buildings – – – – – – – – – Other fix ed structures – – – – – – – – –
Machinery and equipment – – – – – – – – – Transport equipment – – – – – – – – – Other machinery and equipment – – – – – – – – –
Heritage Assets – – – – – – – – – Specialised military assets – – – – – – – – – Biological assets – – – – – – – – – Land and sub-soil assets – – – – – – – – – Softw are and other intangible assets – – – – – – – – –
Payments for financial assets – – 171 – – – – – –
Total economic classification 312 544 354 697 382 949 387 827 411 345 416 206 426 878 454 968 481 549
2015/16
284

Vote 6
37
Table B.2C: Payments and estimates by economic classification: Independent School Subsidies
OutcomeMain
appropriationAdjusted
appropriationRevised estimate
Medium-term estimates
R thousand 2012/13 2013/14 2014/15 2016/17 2017/18 2018/19Current payments – – – – – – – – –
Compensation of employ ees – – – – – – – – – Salaries and w ages – – – – – – – – – Social contributions – – – – – – – – –
Goods and serv ices – – – – – – – – – Administrative fees – – – – – – – – – Advertising – – – – – – – – – Assets less than the capitalisation threshold – – – – – – – – – Audit cost: External – – – – – – – – – Bursaries: Employees – – – – – – – – – Catering: Departmental activities – – – – – – – – – Communication (G&S) – – – – – – – – – Computer services – – – – – – – – – Consultants and professional services: Business and advisory services – – – – – – – – – Consultants and professional services: Infrastructure and planning – – – – – – – – – Consultants and professional services: Laboratory services – – – – – – – – – Consultants and professional services: Scientific and technological services – – – – – – – – – Consultants and professional services: Legal costs – – – – – – – – – Contractors – – – – – – – – – Agency and support / outsourced services – – – – – – – – – Entertainment – – – – – – – – – Fleet services (including government motor transport) – – – – – – – – – Housing – – – – – – – – – Inventory: Clothing material and accessories – – – – – – – – – Inventory: Farming supplies – – – – – – – – – Inventory: Food and food supplies – – – – – – – – – Inventory: Fuel, oil and gas – – – – – – – – – Inventory: Learner and teacher support material – – – – – – – – – Inventory: Materials and supplies – – – – – – – – – Inventory: Medical supplies – – – – – – – – – Inventory: Medicine – – – – – – – – – Medsas inventory interface – – – – – – – – – Inventory: Other supplies – – – – – – – – – Consumable supplies – – – – – – – – – Consumable: Stationery,printing and office supplies – – – – – – – – – Operating leases – – – – – – – – – Property payments – – – – – – – – – Transport provided: Departmental activity – – – – – – – – – Travel and subsistence – – – – – – – – – Training and development – – – – – – – – – Operating payments – – – – – – – – – Venues and facilities – – – – – – – – – Rental and hiring – – – – – – – – –
Interest and rent on land – – – – – – – – – Interest – – – – – – – – – Rent on land – – – – – – – – –
Transfers and subsidies 45 801 40 367 66 504 66 172 61 172 61 172 70 074 71 873 76 332 Prov inces and municipalities – – – – – – – – –
Prov inces – – – – – – – – – Prov incial Rev enue Funds – – – – – – – – – Prov incial agencies and funds – – – – – – – – –
Municipalities – – – – – – – – – Municipalities – – – – – – – – – Municipal agencies and funds – – – – – – – – –
Departmental agencies and accounts – – – – – – – – – Social security funds – – – – – – – – – Prov ide list of entities receiv ing transfers – – – – – – – – –
Higher education institutions – – – – – – – – – Foreign gov ernments and international organisations – – – – – – – – – Public corporations and priv ate enterprises – – – – – – – – –
Public corporations – – – – – – – – – Subsidies on production – – – – – – – – – Other transfers – – – – – – – – –
Priv ate enterprises – – – – – – – – – Subsidies on production – – – – – – – – – Other transfers – – – – – – – – –
Non-profit institutions 45 801 40 367 66 504 66 172 61 172 61 172 70 074 71 873 76 332 Households – – – – – – – – –
Social benefits – – – – – – – – – Other transfers to households – – – – – – – – –
Payments for capital assets – – – – – – – – – Buildings and other fix ed structures – – – – – – – – –
Buildings – – – – – – – – – Other fix ed structures – – – – – – – – –
Machinery and equipment – – – – – – – – – Transport equipment – – – – – – – – – Other machinery and equipment – – – – – – – – –
Heritage Assets – – – – – – – – – Specialised military assets – – – – – – – – – Biological assets – – – – – – – – – Land and sub-soil assets – – – – – – – – – Softw are and other intangible assets – – – – – – – – –
Payments for financial assets – – – – – – – – –
Total economic classification 45 801 40 367 66 504 66 172 61 172 61 172 70 074 71 873 76 332
2015/16
Tabchap27a
Vote 6
38
Table B.2: Payments and estimates by economic classification: Public Special School Education
OutcomeMain
appropriationAdjusted
appropriationRevised estimate
Medium-term estimates
R thousand 2012/13 2013/14 2014/15 2016/17 2017/18 2018/19Current payments 261 078 306 498 329 918 327 601 351 119 355 249 361 608 386 900 409 534
Compensation of employ ees 261 071 306 456 329 898 327 501 351 019 355 132 360 090 383 865 406 487 Salaries and w ages 222 432 261 851 282 948 279 756 297 412 301 068 304 239 324 211 343 216 Social contributions 38 639 44 605 46 950 47 745 53 607 54 064 55 851 59 654 63 271
Goods and serv ices 7 42 20 100 100 117 1 518 3 035 3 047 Administrative fees – – – – – – – 1 – Advertising – – – – – – – – – Assets less than the capitalisation threshold – – – – – – – – – Audit cost: External – – – – – – – – – Bursaries: Employees – – – – – – – – – Catering: Departmental activities – 31 – – – – 402 1 184 1 692 Communication (G&S) – – – – – – – – – Computer services – – – – – – – – – Consultants and professional services: Business and advisory services – – – – – – 250 450 450 Consultants and professional services: Infrastructure and planning – – – – – – – – – Consultants and professional services: Laboratory services – – – – – – – – – Consultants and professional services: Scientific and technological services – – – – – – – – – Consultants and professional services: Legal costs – – – – – – – – – Contractors – – – – – – – – – Agency and support / outsourced services – – – – – – – – – Entertainment – – – – – – – – – Fleet services (including government motor transport) – – – – – – – – – Housing – – – – – – – – – Inventory: Clothing material and accessories – – – – – – – – – Inventory: Farming supplies – – – – – – – – – Inventory: Food and food supplies – – – – – – – – – Inventory: Fuel, oil and gas – – – – – – – – – Inventory: Learner and teacher support material – – – – – – – – – Inventory: Materials and supplies – – – – – – – – – Inventory: Medical supplies – – – – – – – – – Inventory: Medicine – – – – – – – – – Medsas inventory interface – – – – – – – – – Inventory: Other supplies – – – – – – – – – Consumable supplies – – – – – – – – – Consumable: Stationery,printing and office supplies – – – – – – – 300 350 Operating leases – – – – – – – – – Property payments – – – – – – – – – Transport provided: Departmental activity – – – 100 100 100 276 275 275 Travel and subsistence 7 2 2 – – – 50 500 100 Training and development – – – – – – 540 325 180 Operating payments – 1 18 – – 17 – – – Venues and facilities – 8 – – – – – – – Rental and hiring – – – – – – – – –
Interest and rent on land – – – – – – – – – Interest – – – – – – – – – Rent on land – – – – – – – – –
Transfers and subsidies 51 466 48 199 52 860 60 226 60 226 60 957 65 270 68 068 72 015 Prov inces and municipalities – – – – – – – – –
Prov inces – – – – – – – – – Prov incial Rev enue Funds – – – – – – – – – Prov incial agencies and funds – – – – – – – – –
Municipalities – – – – – – – – – Municipalities – – – – – – – – – Municipal agencies and funds – – – – – – – – –
Departmental agencies and accounts – – – – – – – – – Social security funds – – – – – – – – – Prov ide list of entities receiv ing transfers – – – – – – – – –
Higher education institutions – – – – – – – – – Foreign gov ernments and international organisations – – – – – – – – – Public corporations and priv ate enterprises – – – – – – – – –
Public corporations – – – – – – – – – Subsidies on production – – – – – – – – – Other transfers – – – – – – – – –
Priv ate enterprises – – – – – – – – – Subsidies on production – – – – – – – – – Other transfers – – – – – – – – –
Non-profit institutions 50 793 47 343 51 571 59 907 59 907 59 907 64 982 67 780 71 727 Households 673 856 1 289 319 319 1 050 288 288 288
Social benefits 673 856 1 289 319 319 1 050 288 288 288 Other transfers to households – – – – – – – – –
Payments for capital assets – – – – – – – – – Buildings and other fix ed structures – – – – – – – – –
Buildings – – – – – – – – – Other fix ed structures – – – – – – – – –
Machinery and equipment – – – – – – – – – Transport equipment – – – – – – – – – Other machinery and equipment – – – – – – – – –
Heritage Assets – – – – – – – – – Specialised military assets – – – – – – – – – Biological assets – – – – – – – – – Land and sub-soil assets – – – – – – – – – Softw are and other intangible assets – – – – – – – – –
Payments for financial assets – – 171 – – – – – –
Total economic classification 312 544 354 697 382 949 387 827 411 345 416 206 426 878 454 968 481 549
2015/16
VOTE 6 - Department of Education 285
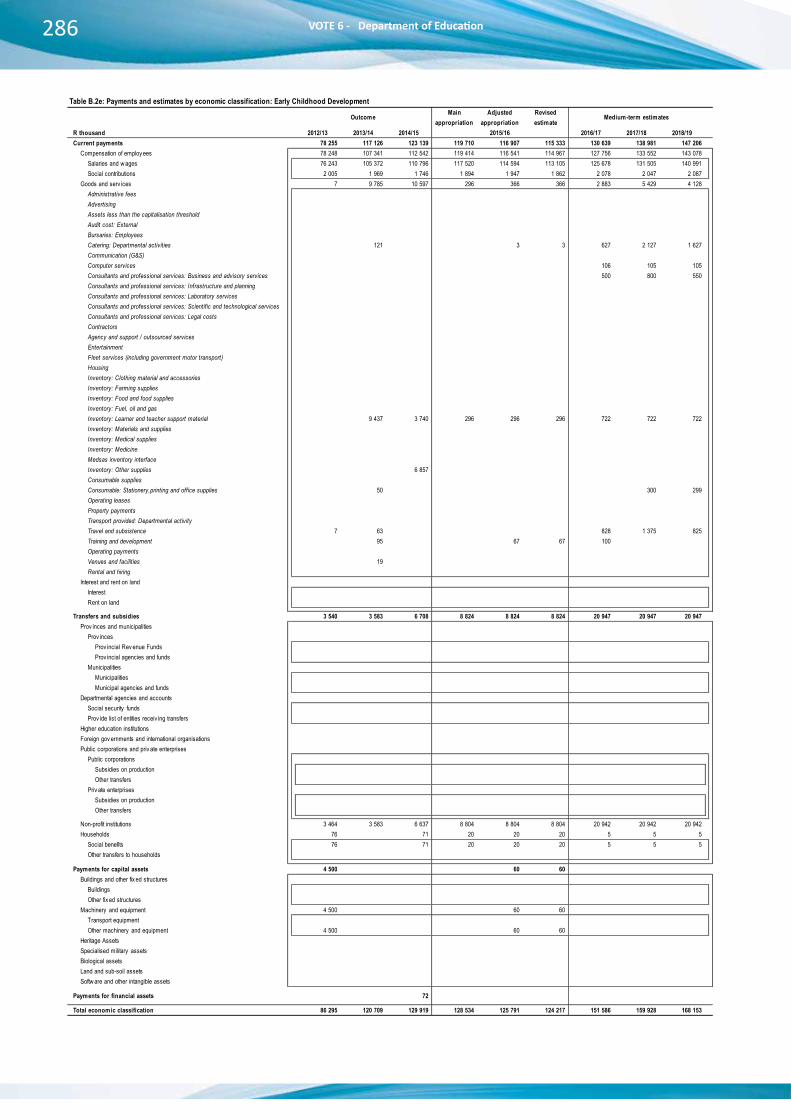
Vote 6
39
p28a Table B.2e: Payments and estimates by economic classification: Early Childhood Development
OutcomeMain
appropriationAdjusted
appropriationRevised estimate
Medium-term estimates
R thousand 2012/13 2013/14 2014/15 2016/17 2017/18 2018/19Current payments 78 255 117 126 123 139 119 710 116 907 115 333 130 639 138 981 147 206
Compensation of employ ees 78 248 107 341 112 542 119 414 116 541 114 967 127 756 133 552 143 078 Salaries and w ages 76 243 105 372 110 796 117 520 114 594 113 105 125 678 131 505 140 991 Social contributions 2 005 1 969 1 746 1 894 1 947 1 862 2 078 2 047 2 087
Goods and serv ices 7 9 785 10 597 296 366 366 2 883 5 429 4 128 Administrative fees – – – – – – – – – Advertising – – – – – – – – – Assets less than the capitalisation threshold – – – – – – – – – Audit cost: External – – – – – – – – – Bursaries: Employees – – – – – – – – – Catering: Departmental activities – 121 – – 3 3 627 2 127 1 627 Communication (G&S) – – – – – – – – – Computer services – – – – – – 106 105 105 Consultants and professional services: Business and advisory services – – – – – – 500 800 550 Consultants and professional services: Infrastructure and planning – – – – – – – – – Consultants and professional services: Laboratory services – – – – – – – – – Consultants and professional services: Scientific and technological services – – – – – – – – – Consultants and professional services: Legal costs – – – – – – – – – Contractors – – – – – – – – – Agency and support / outsourced services – – – – – – – – – Entertainment – – – – – – – – – Fleet services (including government motor transport) – – – – – – – – – Housing – – – – – – – – – Inventory: Clothing material and accessories – – – – – – – – – Inventory: Farming supplies – – – – – – – – – Inventory: Food and food supplies – – – – – – – – – Inventory: Fuel, oil and gas – – – – – – – – – Inventory: Learner and teacher support material – 9 437 3 740 296 296 296 722 722 722 Inventory: Materials and supplies – – – – – – – – – Inventory: Medical supplies – – – – – – – – – Inventory: Medicine – – – – – – – – – Medsas inventory interface – – – – – – – – – Inventory: Other supplies – – 6 857 – – – – – – Consumable supplies – – – – – – – – – Consumable: Stationery,printing and office supplies – 50 – – – – – 300 299 Operating leases – – – – – – – – – Property payments – – – – – – – – – Transport provided: Departmental activity – – – – – – – – – Travel and subsistence 7 63 – – – – 828 1 375 825 Training and development – 95 – – 67 67 100 – – Operating payments – – – – – – – – – Venues and facilities – 19 – – – – – – – Rental and hiring – – – – – – – – –
Interest and rent on land – – – – – – – – – Interest – – – – – – – – – Rent on land – – – – – – – – –
Transfers and subsidies 3 540 3 583 6 708 8 824 8 824 8 824 20 947 20 947 20 947 Prov inces and municipalities – – – – – – – – –
Prov inces – – – – – – – – – Prov incial Rev enue Funds – – – – – – – – – Prov incial agencies and funds – – – – – – – – –
Municipalities – – – – – – – – – Municipalities – – – – – – – – – Municipal agencies and funds – – – – – – – – –
Departmental agencies and accounts – – – – – – – – – Social security funds – – – – – – – – – Prov ide list of entities receiv ing transfers – – – – – – – – –
Higher education institutions – – – – – – – – – Foreign gov ernments and international organisations – – – – – – – – – Public corporations and priv ate enterprises – – – – – – – – –
Public corporations – – – – – – – – – Subsidies on production – – – – – – – – – Other transfers – – – – – – – – –
Priv ate enterprises – – – – – – – – – Subsidies on production – – – – – – – – – Other transfers – – – – – – – – –
Non-profit institutions 3 464 3 583 6 637 8 804 8 804 8 804 20 942 20 942 20 942 Households 76 – 71 20 20 20 5 5 5
Social benefits 76 – 71 20 20 20 5 5 5 Other transfers to households – – – – – – – – –
Payments for capital assets 4 500 – – – 60 60 – – – Buildings and other fix ed structures – – – – – – – – –
Buildings – – – – – – – – – Other fix ed structures – – – – – – – – –
Machinery and equipment 4 500 – – – 60 60 – – – Transport equipment – – – – – – – – – Other machinery and equipment 4 500 – – – 60 60 – – –
Heritage Assets – – – – – – – – – Specialised military assets – – – – – – – – – Biological assets – – – – – – – – – Land and sub-soil assets – – – – – – – – – Softw are and other intangible assets – – – – – – – – –
Payments for financial assets – – 72 – – – – – –
Total economic classification 86 295 120 709 129 919 128 534 125 791 124 217 151 586 159 928 168 153
2015/16
Tabchap29a
VOTE 6 - Department of Education286

Vote 6
39
p28a Table B.2e: Payments and estimates by economic classification: Early Childhood Development
OutcomeMain
appropriationAdjusted
appropriationRevised estimate
Medium-term estimates
R thousand 2012/13 2013/14 2014/15 2016/17 2017/18 2018/19Current payments 78 255 117 126 123 139 119 710 116 907 115 333 130 639 138 981 147 206
Compensation of employ ees 78 248 107 341 112 542 119 414 116 541 114 967 127 756 133 552 143 078 Salaries and w ages 76 243 105 372 110 796 117 520 114 594 113 105 125 678 131 505 140 991 Social contributions 2 005 1 969 1 746 1 894 1 947 1 862 2 078 2 047 2 087
Goods and serv ices 7 9 785 10 597 296 366 366 2 883 5 429 4 128 Administrative fees – – – – – – – – – Advertising – – – – – – – – – Assets less than the capitalisation threshold – – – – – – – – – Audit cost: External – – – – – – – – – Bursaries: Employees – – – – – – – – – Catering: Departmental activities – 121 – – 3 3 627 2 127 1 627 Communication (G&S) – – – – – – – – – Computer services – – – – – – 106 105 105 Consultants and professional services: Business and advisory services – – – – – – 500 800 550 Consultants and professional services: Infrastructure and planning – – – – – – – – – Consultants and professional services: Laboratory services – – – – – – – – – Consultants and professional services: Scientific and technological services – – – – – – – – – Consultants and professional services: Legal costs – – – – – – – – – Contractors – – – – – – – – – Agency and support / outsourced services – – – – – – – – – Entertainment – – – – – – – – – Fleet services (including government motor transport) – – – – – – – – – Housing – – – – – – – – – Inventory: Clothing material and accessories – – – – – – – – – Inventory: Farming supplies – – – – – – – – – Inventory: Food and food supplies – – – – – – – – – Inventory: Fuel, oil and gas – – – – – – – – – Inventory: Learner and teacher support material – 9 437 3 740 296 296 296 722 722 722 Inventory: Materials and supplies – – – – – – – – – Inventory: Medical supplies – – – – – – – – – Inventory: Medicine – – – – – – – – – Medsas inventory interface – – – – – – – – – Inventory: Other supplies – – 6 857 – – – – – – Consumable supplies – – – – – – – – – Consumable: Stationery,printing and office supplies – 50 – – – – – 300 299 Operating leases – – – – – – – – – Property payments – – – – – – – – – Transport provided: Departmental activity – – – – – – – – – Travel and subsistence 7 63 – – – – 828 1 375 825 Training and development – 95 – – 67 67 100 – – Operating payments – – – – – – – – – Venues and facilities – 19 – – – – – – – Rental and hiring – – – – – – – – –
Interest and rent on land – – – – – – – – – Interest – – – – – – – – – Rent on land – – – – – – – – –
Transfers and subsidies 3 540 3 583 6 708 8 824 8 824 8 824 20 947 20 947 20 947 Prov inces and municipalities – – – – – – – – –
Prov inces – – – – – – – – – Prov incial Rev enue Funds – – – – – – – – – Prov incial agencies and funds – – – – – – – – –
Municipalities – – – – – – – – – Municipalities – – – – – – – – – Municipal agencies and funds – – – – – – – – –
Departmental agencies and accounts – – – – – – – – – Social security funds – – – – – – – – – Prov ide list of entities receiv ing transfers – – – – – – – – –
Higher education institutions – – – – – – – – – Foreign gov ernments and international organisations – – – – – – – – – Public corporations and priv ate enterprises – – – – – – – – –
Public corporations – – – – – – – – – Subsidies on production – – – – – – – – – Other transfers – – – – – – – – –
Priv ate enterprises – – – – – – – – – Subsidies on production – – – – – – – – – Other transfers – – – – – – – – –
Non-profit institutions 3 464 3 583 6 637 8 804 8 804 8 804 20 942 20 942 20 942 Households 76 – 71 20 20 20 5 5 5
Social benefits 76 – 71 20 20 20 5 5 5 Other transfers to households – – – – – – – – –
Payments for capital assets 4 500 – – – 60 60 – – – Buildings and other fix ed structures – – – – – – – – –
Buildings – – – – – – – – – Other fix ed structures – – – – – – – – –
Machinery and equipment 4 500 – – – 60 60 – – – Transport equipment – – – – – – – – – Other machinery and equipment 4 500 – – – 60 60 – – –
Heritage Assets – – – – – – – – – Specialised military assets – – – – – – – – – Biological assets – – – – – – – – – Land and sub-soil assets – – – – – – – – – Softw are and other intangible assets – – – – – – – – –
Payments for financial assets – – 72 – – – – – –
Total economic classification 86 295 120 709 129 919 128 534 125 791 124 217 151 586 159 928 168 153
2015/16
Tabchap29a
Vote 6
40
Table B.2f: Payments and estimates by economic classification: Infrastructure Development
OutcomeMain
appropriationAdjusted
appropriationRevised estimate
Medium-term estimates
R thousand 2012/13 2013/14 2014/15 2016/17 2017/18 2018/19Current payments 18 447 21 764 103 183 39 989 97 232 97 445 40 000 42 850 47 893
Compensation of employ ees – – 4 658 18 000 9 000 8 916 20 000 21 000 22 050 Salaries and w ages – – 4 141 18 000 8 458 8 374 16 000 19 320 20 286 Social contributions – – 517 – 542 542 4 000 1 680 1 764
Goods and serv ices 18 447 21 764 98 525 21 989 88 232 88 529 20 000 21 850 25 843 Administrative fees – – – – – – – – – Advertising – – – – – – – – – Assets less than the capitalisation threshold – – – – – – – – – Audit cost: External – – – – – – – – – Bursaries: Employees – – – – – – – – – Catering: Departmental activities – – – – – – – – – Communication (G&S) – – – – – – – – – Computer services – – – – – – – – – Consultants and professional services: Business and advisory services – – – – – 3 162 – – – Consultants and professional services: Infrastructure and planning – – 110 – 328 367 – – – Consultants and professional services: Laboratory services – – – – – – – – – Consultants and professional services: Scientific and technological services – – – – – – – – – Consultants and professional services: Legal costs – – – – – – – – – Contractors – – 568 – 53 53 – – – Agency and support / outsourced services – – – – – – – – – Entertainment – – – – – – – – – Fleet services (including government motor transport) – – – – – – – – – Housing – – – – – – – – – Inventory: Clothing material and accessories – – – – – – – – – Inventory: Farming supplies – – – – – – – – – Inventory: Food and food supplies – – – – – – – – – Inventory: Fuel, oil and gas – – – – – – – – – Inventory: Learner and teacher support material – – – – – – – – – Inventory: Materials and supplies – – – – – – – – – Inventory: Medical supplies – – – – – – – – – Inventory: Medicine – – – – – – – – – Medsas inventory interface – – – – – – – – – Inventory: Other supplies – – 49 777 7 000 25 611 43 753 8 000 7 350 7 718 Consumable supplies – – 173 – – 213 – – – Consumable: Stationery,printing and office supplies – – – – – – – – – Operating leases – – – – – – – – – Property payments 18 447 21 764 17 041 14 989 62 240 40 272 12 000 14 500 18 125 Transport provided: Departmental activity – – – – – – – – – Travel and subsistence – – 161 – – 84 – – – Training and development – – 30 695 – – – – – – Operating payments – – – – – – – – – Venues and facilities – – – – – – – – – Rental and hiring – – – – – 625 – – –
Interest and rent on land – – – – – – – – – Interest – – – – – – – – – Rent on land – – – – – – – – –
Transfers and subsidies 64 015 75 673 9 355 – – – – – – Prov inces and municipalities – – – – – – – – –
Prov inces – – – – – – – – – Prov incial Rev enue Funds – – – – – – – – – Prov incial agencies and funds – – – – – – – – –
Municipalities – – – – – – – – – Municipalities – – – – – – – – – Municipal agencies and funds – – – – – – – – –
Departmental agencies and accounts – – – – – – – – – Social security funds – – – – – – – – – Prov ide list of entities receiv ing transfers – – – – – – – – –
Higher education institutions – – – – – – – – – Foreign gov ernments and international organisations – – – – – – – – – Public corporations and priv ate enterprises – – – – – – – – –
Public corporations – – – – – – – – – Subsidies on production – – – – – – – – – Other transfers – – – – – – – – –
Priv ate enterprises – – – – – – – – – Subsidies on production – – – – – – – – – Other transfers – – – – – – – – –
Non-profit institutions 64 015 75 673 9 355 – – – – – – Households – – – – – – – – –
Social benefits – – – – – – – – – Other transfers to households – – – – – – – – –
Payments for capital assets 448 314 325 867 380 558 740 340 789 901 790 484 672 886 635 063 667 599 Buildings and other fix ed structures 448 314 325 867 374 643 740 340 788 401 788 984 672 886 635 063 667 599
Buildings – – – – – – – – – Other fix ed structures 448 314 325 867 374 643 740 340 788 401 788 984 672 886 635 063 667 599
Machinery and equipment – – 5 915 – 1 500 1 500 – – – Transport equipment – – 5 915 – – – – – – Other machinery and equipment – – – – 1 500 1 500 – – –
Heritage Assets – – – – – – – – – Specialised military assets – – – – – – – – – Biological assets – – – – – – – – – Land and sub-soil assets – – – – – – – – – Softw are and other intangible assets – – – – – – – – –
Payments for financial assets – – – – – – – – –
Total economic classification 530 776 423 304 493 096 780 329 887 133 887 929 712 886 677 913 715 492
2015/16
Tabchap30a
VOTE 6 - Department of Education 287

Vote 6
41
Table B.2: Payments and estimates by economic classification: Examination And Education Related Services
OutcomeMain
appropriationAdjusted
appropriationRevised estimate
Medium-term estimates
R thousand 2012/13 2013/14 2014/15 2016/17 2017/18 2018/19Current payments 506 959 361 640 456 460 353 455 369 248 378 766 582 533 698 032 683 077
Compensation of employ ees 124 387 141 072 151 749 168 105 167 759 177 801 186 809 199 853 212 123 Salaries and w ages 113 695 128 882 138 930 154 412 153 161 163 226 171 329 183 376 194 722 Social contributions 10 692 12 190 12 819 13 693 14 598 14 575 15 480 16 477 17 401
Goods and serv ices 382 572 220 568 304 711 185 350 201 489 200 965 395 724 498 179 470 954 Administrative fees 6 10 1 13 2 000 2 000 13 230 13 237 13 230 Advertising 71 396 65 – – – 38 50 64 Assets less than the capitalisation threshold 18 758 23 6 657 353 352 26 817 26 775 19 774 Audit cost: External – – – – – – – – – Bursaries: Employees – – 1 117 12 100 – – – – – Catering: Departmental activities 15 295 19 960 2 650 13 854 16 477 16 527 12 010 22 934 15 238 Communication (G&S) 420 89 2 60 38 40 63 63 64 Computer services 12 232 21 859 26 322 70 563 37 434 35 574 35 050 59 746 53 576 Consultants and professional services: Business and advisory services 9 968 21 690 10 136 33 900 28 718 29 790 40 474 43 809 45 699 Consultants and professional services: Infrastructure and planning – – – – – – – – – Consultants and professional services: Laboratory services – – – – – – – – – Consultants and professional services: Scientific and technological services – – – – – – – – – Consultants and professional services: Legal costs – – – – – – – – – Contractors 10 070 6 698 315 60 55 55 19 585 227 242 Agency and support / outsourced services – – 10 739 – – – 300 500 500 Entertainment – – – – – – – – – Fleet services (including government motor transport) – – – – – – – – – Housing – – – – – – – – – Inventory: Clothing material and accessories – – – 14 – – 5 15 15 Inventory: Farming supplies – – – – – – – – – Inventory: Food and food supplies – – – – – – – – – Inventory: Fuel, oil and gas 6 – – – – – 10 11 11 Inventory: Learner and teacher support material 256 477 66 230 133 111 16 540 68 565 68 702 1 515 21 881 22 104 Inventory: Materials and supplies – 82 101 502 2 2 60 60 – Inventory: Medical supplies 498 499 – 1 011 1 503 1 503 790 764 506 Inventory: Medicine – – – – – – – – – Medsas inventory interface – – – – – – – – – Inventory: Other supplies – 2 479 3 – 4 681 4 680 13 551 8 733 12 093 Consumable supplies 1 117 306 360 1 394 683 683 1 654 1 806 2 043 Consumable: Stationery,printing and office supplies 2 684 2 713 3 038 3 004 5 459 5 479 96 522 135 006 136 267 Operating leases – – – – 18 18 264 279 296 Property payments 1 573 1 525 2 019 3 252 1 667 1 706 3 339 3 491 3 643 Transport provided: Departmental activity 43 216 50 167 64 242 580 6 750 6 711 1 067 1 280 1 280 Travel and subsistence 16 341 14 216 37 847 13 537 20 982 20 884 106 230 113 108 104 539 Training and development 7 792 8 325 9 824 4 523 3 653 3 653 21 638 41 650 36 980 Operating payments 1 381 1 576 2 459 2 676 2 312 2 422 902 905 940 Venues and facilities 3 407 990 296 1 110 139 184 610 1 849 1 850 Rental and hiring – – 41 – – – – – –
Interest and rent on land – – – – – – – – – Interest – – – – – – – – – Rent on land – – – – – – – – –
Transfers and subsidies 174 248 320 214 438 076 536 154 536 378 536 406 102 821 140 977 150 117 Prov inces and municipalities – – – – – – – – –
Prov inces – – – – – – – – – Prov incial Rev enue Funds – – – – – – – – – Prov incial agencies and funds – – – – – – – – –
Municipalities – – – – – – – – – Municipalities – – – – – – – – – Municipal agencies and funds – – – – – – – – –
Departmental agencies and accounts 7 829 7 033 – 8 645 8 869 8 867 28 058 30 157 32 268 Social security funds – – – – – – – – – Prov ide list of entities receiv ing transfers 7 829 7 033 – 8 645 8 869 8 867 28 058 30 157 32 268
Higher education institutions – – – – – – – – – Foreign gov ernments and international organisations – – – – – – – – – Public corporations and priv ate enterprises – – – – – – – – –
Public corporations – – – – – – – – – Subsidies on production – – – – – – – – – Other transfers – – – – – – – – –
Priv ate enterprises – – – – – – – – – Subsidies on production – – – – – – – – – Other transfers – – – – – – – – –
Non-profit institutions 40 497 90 300 69 058 89 530 89 530 89 530 57 934 93 991 101 020 Households 125 922 222 881 369 018 437 979 437 979 438 009 16 829 16 829 16 829
Social benefits 595 269 345 79 79 107 29 29 29 Other transfers to households 125 327 222 612 368 673 437 900 437 900 437 902 16 800 16 800 16 800
Payments for capital assets 275 402 509 884 1 015 1 111 2 814 21 142 22 094 Buildings and other fix ed structures – – – – – – – – –
Buildings – – – – – – – – – Other fix ed structures – – – – – – – – –
Machinery and equipment 275 402 509 884 1 015 1 111 2 414 21 142 22 094 Transport equipment – – – – – – – – – Other machinery and equipment 275 402 509 884 1 015 1 111 2 414 21 142 22 094
Heritage Assets – – – – – – – – – Specialised military assets – – – – – – – – – Biological assets – – – – – – – – – Land and sub-soil assets – – – – – – – – – Softw are and other intangible assets – – – – – – 400 – –
Payments for financial assets – – 28 – – 2 – – –
Total economic classification 681 482 682 256 895 073 890 493 906 641 916 285 688 168 860 151 855 288
2015/16
p31a
VOTE 6 - Department of Education288

Vote 6
41
Table B.2: Payments and estimates by economic classification: Examination And Education Related Services
OutcomeMain
appropriationAdjusted
appropriationRevised estimate
Medium-term estimates
R thousand 2012/13 2013/14 2014/15 2016/17 2017/18 2018/19Current payments 506 959 361 640 456 460 353 455 369 248 378 766 582 533 698 032 683 077
Compensation of employ ees 124 387 141 072 151 749 168 105 167 759 177 801 186 809 199 853 212 123 Salaries and w ages 113 695 128 882 138 930 154 412 153 161 163 226 171 329 183 376 194 722 Social contributions 10 692 12 190 12 819 13 693 14 598 14 575 15 480 16 477 17 401
Goods and serv ices 382 572 220 568 304 711 185 350 201 489 200 965 395 724 498 179 470 954 Administrative fees 6 10 1 13 2 000 2 000 13 230 13 237 13 230 Advertising 71 396 65 – – – 38 50 64 Assets less than the capitalisation threshold 18 758 23 6 657 353 352 26 817 26 775 19 774 Audit cost: External – – – – – – – – – Bursaries: Employees – – 1 117 12 100 – – – – – Catering: Departmental activities 15 295 19 960 2 650 13 854 16 477 16 527 12 010 22 934 15 238 Communication (G&S) 420 89 2 60 38 40 63 63 64 Computer services 12 232 21 859 26 322 70 563 37 434 35 574 35 050 59 746 53 576 Consultants and professional services: Business and advisory services 9 968 21 690 10 136 33 900 28 718 29 790 40 474 43 809 45 699 Consultants and professional services: Infrastructure and planning – – – – – – – – – Consultants and professional services: Laboratory services – – – – – – – – – Consultants and professional services: Scientific and technological services – – – – – – – – – Consultants and professional services: Legal costs – – – – – – – – – Contractors 10 070 6 698 315 60 55 55 19 585 227 242 Agency and support / outsourced services – – 10 739 – – – 300 500 500 Entertainment – – – – – – – – – Fleet services (including government motor transport) – – – – – – – – – Housing – – – – – – – – – Inventory: Clothing material and accessories – – – 14 – – 5 15 15 Inventory: Farming supplies – – – – – – – – – Inventory: Food and food supplies – – – – – – – – – Inventory: Fuel, oil and gas 6 – – – – – 10 11 11 Inventory: Learner and teacher support material 256 477 66 230 133 111 16 540 68 565 68 702 1 515 21 881 22 104 Inventory: Materials and supplies – 82 101 502 2 2 60 60 – Inventory: Medical supplies 498 499 – 1 011 1 503 1 503 790 764 506 Inventory: Medicine – – – – – – – – – Medsas inventory interface – – – – – – – – – Inventory: Other supplies – 2 479 3 – 4 681 4 680 13 551 8 733 12 093 Consumable supplies 1 117 306 360 1 394 683 683 1 654 1 806 2 043 Consumable: Stationery,printing and office supplies 2 684 2 713 3 038 3 004 5 459 5 479 96 522 135 006 136 267 Operating leases – – – – 18 18 264 279 296 Property payments 1 573 1 525 2 019 3 252 1 667 1 706 3 339 3 491 3 643 Transport provided: Departmental activity 43 216 50 167 64 242 580 6 750 6 711 1 067 1 280 1 280 Travel and subsistence 16 341 14 216 37 847 13 537 20 982 20 884 106 230 113 108 104 539 Training and development 7 792 8 325 9 824 4 523 3 653 3 653 21 638 41 650 36 980 Operating payments 1 381 1 576 2 459 2 676 2 312 2 422 902 905 940 Venues and facilities 3 407 990 296 1 110 139 184 610 1 849 1 850 Rental and hiring – – 41 – – – – – –
Interest and rent on land – – – – – – – – – Interest – – – – – – – – – Rent on land – – – – – – – – –
Transfers and subsidies 174 248 320 214 438 076 536 154 536 378 536 406 102 821 140 977 150 117 Prov inces and municipalities – – – – – – – – –
Prov inces – – – – – – – – – Prov incial Rev enue Funds – – – – – – – – – Prov incial agencies and funds – – – – – – – – –
Municipalities – – – – – – – – – Municipalities – – – – – – – – – Municipal agencies and funds – – – – – – – – –
Departmental agencies and accounts 7 829 7 033 – 8 645 8 869 8 867 28 058 30 157 32 268 Social security funds – – – – – – – – – Prov ide list of entities receiv ing transfers 7 829 7 033 – 8 645 8 869 8 867 28 058 30 157 32 268
Higher education institutions – – – – – – – – – Foreign gov ernments and international organisations – – – – – – – – – Public corporations and priv ate enterprises – – – – – – – – –
Public corporations – – – – – – – – – Subsidies on production – – – – – – – – – Other transfers – – – – – – – – –
Priv ate enterprises – – – – – – – – – Subsidies on production – – – – – – – – – Other transfers – – – – – – – – –
Non-profit institutions 40 497 90 300 69 058 89 530 89 530 89 530 57 934 93 991 101 020 Households 125 922 222 881 369 018 437 979 437 979 438 009 16 829 16 829 16 829
Social benefits 595 269 345 79 79 107 29 29 29 Other transfers to households 125 327 222 612 368 673 437 900 437 900 437 902 16 800 16 800 16 800
Payments for capital assets 275 402 509 884 1 015 1 111 2 814 21 142 22 094 Buildings and other fix ed structures – – – – – – – – –
Buildings – – – – – – – – – Other fix ed structures – – – – – – – – –
Machinery and equipment 275 402 509 884 1 015 1 111 2 414 21 142 22 094 Transport equipment – – – – – – – – – Other machinery and equipment 275 402 509 884 1 015 1 111 2 414 21 142 22 094
Heritage Assets – – – – – – – – – Specialised military assets – – – – – – – – – Biological assets – – – – – – – – – Land and sub-soil assets – – – – – – – – – Softw are and other intangible assets – – – – – – 400 – –
Payments for financial assets – – 28 – – 2 – – –
Total economic classification 681 482 682 256 895 073 890 493 906 641 916 285 688 168 860 151 855 288
2015/16
p31a
Vote 6
42
Outcome Main appropriation
Adjusted appropriation
Revised estimate Medium-term estimates
R thousand 2012/13 2013/14 2014/15 2016/17 2017/18 2018/19Current payments 4 873 6 732 6 336 8 095 8 095 9 262 6 986 8 041 12 092
Compensation of employees - - - - - - - - - Salaries and wagesSocial contributions
Goods and services 4 873 6 732 6 336 8 095 8 095 9 262 6 986 8 041 12 092 Administrative feesAdvertising 201 179 210 210 210 300 550 800 Minor Assets 1 115 301 301 471 Audit cost: ExternalBursaries: EmployeesCatering: Departmental activities 94 115 47 320 320 320 420 520 700 Communication (G&S) 160 162 200 400 Computer servicesConsultants and professional services: Business and advisory servicesConsultants and professional services: Infrastructure and planningConsultants and professional services: Laboratory servicesConsultants and professional services: Scientific and technological servicesConsultants and professional services: Legal costsContractorsAgency and support / outsourced services 762 2 EntertainmentFleet services (including government motor transport) 9 1 167 1 184 1 200 1 500
HousingInventory: Clothing material and accessoriesInventory: Farming suppliesInventory: Food and food supplies 3 972 6 220 5 668 6 900 6 900 6 900 3 002 3 202 4 200 Inventory: Fuel, oil and gasInventory: Learner and teacher support materialInventory: Materials and suppliesInventory: Medical suppliesInventory: MedicineMedsas inventory interfaceInventory: Other suppliesConsumable suppliesConsumable: Stationery,printing and office supplies 17 100 42 120 120 90 340 400 550
Operating leasesProperty paymentsTransport provided: Departmental activityTravel and subsistence 27 55 53 335 335 360 687 988 2 141 Training and developmentOperating payments 12 65 180 180 185 530 600 1 230 Venues and facilities 20 5 30 30 30 60 80 100 Rental and hiring
Interest and rent on land - - - - - - - - - Interest - - - - - - Rent on land - - - - - - - - -
Transfers and subsidies to1: 252 889 267 976 286 474 308 970 311 970 310 855 327 855 343 479 359 777 Provinces and municipalities - - - - - - - - -
Provinces2
Provincial Revenue Funds - - - - - - - - - Provincial agencies and funds - - - - - - - - -
Municipalities3
Municipalities - - - - - - - - - of which: Regional service council levies
Municipal agencies and fundsDepartmental agencies and accounts - - - - - - - - -
Social security funds - - - - - - - - - Provide list of entities receiving transfers4
Universities and technikonsForeign governments and international organisationsPublic corporations and private enterprises5 - - - - - - - - -
Public corporationsSubsidies on production - - - - - - - - - Other transfers - - - - - - - - -
Private enterprisesSubsidies on production - - - - - - - - - Other transfers - - - - - - - - -
Non-profit institutions 252 889 267 976 286 474 308 970 311 970 310 855 327 855 343 479 359 777 Households - - - - - - - - -
Social benefitsOther transfers to households
Payments for capital assets - 112 28 92 804 752 130 200 250 Buildings and other fixed structures - - - - - - - - -
Buildings - - - - - - - - - Other fixed structures - - - - - - - - -
Machinery and equipment - 112 28 92 804 752 130 200 250 Transport equipment - - - - - - - - - Other machinery and equipment 112 28 92 804 752 130 200 250
Heritage Assets - - - - - - - - - Specialised military assets - - - - - - - - - Biological assets - - - - - - - - - Land and sub-soil assets - - - - - - - - - Software and other intangible assets - - - - - - - - -
Payments for financial assets - - 110 - - - - - -
Total economic classification: National School Nutrition Programme 257 762 274 820 292 948 317 157 320 869 320 869 334 971 351 720 372 119
2015/16
Table B.3a: Payments and estimates by economic classification: National School Nutrition Programme: (Public Ordinary School Education)
VOTE 6 - Department of Education 289

Vote 6
43
Table B.3b: Payments and estimates by economic classification:Dinaledi Schools Grant: (Public Ordinary School Education)
Outcome Main appropriation
Adjusted appropriation
Revised estimate Medium-term estimates
R thousand 2012/13 2013/14 2014/15 2016/17 2017/18 2018/19Current payments 2 195 3 573 1 959 - - - - - -
Compensation of employees - - - - - - - - - Salaries and wagesSocial contributions
Goods and services 2 195 3 573 1 959 - - - - - - Administrative fees 60 AdvertisingMinor AssetsAudit cost: ExternalBursaries: EmployeesCatering: Departmental activities 36 266 257 Communication (G&S)Computer servicesConsultants and professional services: Business and advisory services 40 395
Consultants and professional services: Infrastructure and planningConsultants and professional services: Laboratory servicesConsultants and professional services: Scientific and technological servicesConsultants and professional services: Legal costsContractorsAgency and support / outsourced services 52 EntertainmentFleet services (including government motor transport)HousingInventory: Clothing material and accessoriesInventory: Farming suppliesInventory: Food and food suppliesInventory: Fuel, oil and gas
Inventory: Learner and teacher support material 2 087 2 547
Inventory: Materials and suppliesInventory: Medical suppliesInventory: MedicineMedsas inventory interfaceInventory: Other suppliesConsumable suppliesConsumable: Stationery,printing and office suppliesOperating leasesProperty paymentsTransport provided: Departmental activityTravel and subsistence 61 310 539 Training and development 565 Operating payments 250 Venues and facilities 11 100 151 Rental and hiring
Interest and rent on land - - - - - - - - - Interest - - - - - - - - Rent on land - - - - - - - - -
Transfers and subsidies to1: 2 989 4 000 6 088 - - - - - - Provinces and municipalities - - - - - - - - -
Provinces2
Provincial Revenue Funds - - - - - - - - - Provincial agencies and funds - - - - - - - - -
Municipalities3
Municipalities - - - - - - - - - of which: Regional service council levies
Municipal agencies and fundsDepartmental agencies and accounts - - - - - - - - -
Social security funds - - - - - - - - - Provide list of entities receiving transfers4
Universities and technikonsForeign governments and international organisationsPublic corporations and private enterprises5 - - - - - - - - -
Public corporationsSubsidies on production - - - - - - - - - Other transfers - - - - - - - - -
Private enterprisesSubsidies on production - - - - - - - - - Other transfers - - - - - - - - -
Non-profit institutions 2 989 4 000 Households - - - - - - - - -
Social benefitsOther transfers to households
Payments for capital assets - - - - - - - - - Buildings and other fixed structures - - - - - - - - -
Buildings - - - - - - - - - Other fixed structures - - - - - - - - -
Machinery and equipment - - - - - - - - - Transport equipment - - - - - - - - - Other machinery and equipment
Heritage Assets - - - - - - - - - Specialised military assets - - - - - - - - - Biological assets - - - - - - - - - Land and sub-soil assets - - - - - - - - - Software and other intangible assets - - - - - - - - -
Payments for financial assets - - - - - - - - -
Total economic classification: Dinaledi Schools Grant 5 184 7 573 8 047 - - - - - -
2015/16
VOTE 6 - Department of Education
Vote 6
44
Table B.3c: Payments and estimates by economic classification: Technical Secondary Schools Recapitalisation Grant: (Public Ordinary School Education)
Outcome Main appropriation
Adjusted appropriation
Revised estimate Medium-term estimates
R thousand 2012/13 2013/14 2014/15 2016/17 2017/18 2018/19Current payments - - - - - - - - -
Compensation of employees - - - - - - - - - Salaries and wagesSocial contributions
Goods and services - - - - - - - - - Administrative feesAdvertisingMinor AssetsAudit cost: ExternalBursaries: EmployeesCatering: Departmental activitiesCommunication (G&S)Computer servicesConsultants and professional services: Business and advisory servicesConsultants and professional services: Infrastructure and planningConsultants and professional services: Laboratory servicesConsultants and professional services: Scientific and technological servicesConsultants and professional services: Legal costsContractorsAgency and support / outsourced servicesEntertainmentFleet services (including government motor transport)Housing
Inventory: Clothing material and accessories
Inventory: Farming suppliesInventory: Food and food suppliesInventory: Fuel, oil and gas
Inventory: Learner and teacher support material
Inventory: Materials and suppliesInventory: Medical suppliesInventory: MedicineMedsas inventory interfaceInventory: Other suppliesConsumable suppliesConsumable: Stationery,printing and office suppliesOperating leasesProperty paymentsTransport provided: Departmental activityTravel and subsistenceTraining and developmentOperating paymentsVenues and facilitiesRental and hiring
Interest and rent on land - - - - - - - - - Interest - - - - - - - - Rent on land - - - - - - - - -
Transfers and subsidies to1: 19 594 20 963 22 219 - - - Provinces and municipalities - - - - - - - - -
Provinces2
Provincial Revenue Funds - - - - - - - - - Provincial agencies and funds - - - - - - - - -
Municipalities3
Municipalities - - - - - - - - - of which: Regional service council levies
Municipal agencies and fundsDepartmental agencies and accounts - - - - - - - - -
Social security funds - - - - - - - - - Provide list of entities receiving transfers4
Universities and technikonsForeign governments and international organisationsPublic corporations and private enterprises5 - - - - - - - - -
Public corporationsSubsidies on production - - - - - - - - - Other transfers - - - - - - - - -
Private enterprisesSubsidies on production - - - - - - - - - Other transfers - - - - - - - - -
Non-profit institutions 14 428 19 594 20 963 22 219 22 219 19 273 Households - - - - - - - - -
Social benefitsOther transfers to households
Payments for capital assets - - - - - - - - - Buildings and other fixed structures - - - - - - - - -
Buildings - - - - - - - - - Other fixed structures - - - - - - - - -
Machinery and equipment - - - - - - - - - Transport equipment - - - - - - - - - Other machinery and equipment
Heritage Assets - - - - - - - - - Specialised military assets - - - - - - - - - Biological assets - - - - - - - - - Land and sub-soil assets - - - - - - - - - Software and other intangible assets - - - - - - - - -
Payments for financial assets - - - - - - - - -
Total economic classification: Technical Secondary Schools Recapitalisation Grant 19 594 20 963 22 219 - - - - - -
2015/16
290
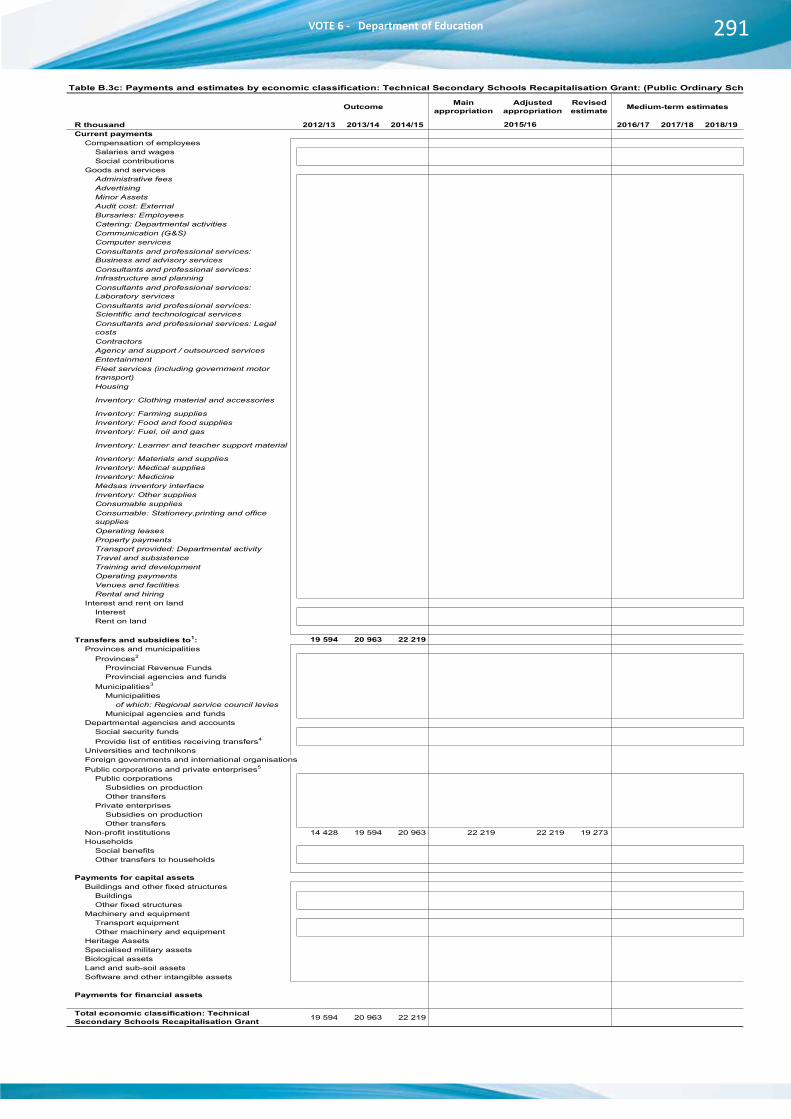
Vote 6
43
Table B.3b: Payments and estimates by economic classification:Dinaledi Schools Grant: (Public Ordinary School Education)
Outcome Main appropriation
Adjusted appropriation
Revised estimate Medium-term estimates
R thousand 2012/13 2013/14 2014/15 2016/17 2017/18 2018/19Current payments 2 195 3 573 1 959 - - - - - -
Compensation of employees - - - - - - - - - Salaries and wagesSocial contributions
Goods and services 2 195 3 573 1 959 - - - - - - Administrative fees 60 AdvertisingMinor AssetsAudit cost: ExternalBursaries: EmployeesCatering: Departmental activities 36 266 257 Communication (G&S)Computer servicesConsultants and professional services: Business and advisory services 40 395
Consultants and professional services: Infrastructure and planningConsultants and professional services: Laboratory servicesConsultants and professional services: Scientific and technological servicesConsultants and professional services: Legal costsContractorsAgency and support / outsourced services 52 EntertainmentFleet services (including government motor transport)HousingInventory: Clothing material and accessoriesInventory: Farming suppliesInventory: Food and food suppliesInventory: Fuel, oil and gas
Inventory: Learner and teacher support material 2 087 2 547
Inventory: Materials and suppliesInventory: Medical suppliesInventory: MedicineMedsas inventory interfaceInventory: Other suppliesConsumable suppliesConsumable: Stationery,printing and office suppliesOperating leasesProperty paymentsTransport provided: Departmental activityTravel and subsistence 61 310 539 Training and development 565 Operating payments 250 Venues and facilities 11 100 151 Rental and hiring
Interest and rent on land - - - - - - - - - Interest - - - - - - - - Rent on land - - - - - - - - -
Transfers and subsidies to1: 2 989 4 000 6 088 - - - - - - Provinces and municipalities - - - - - - - - -
Provinces2
Provincial Revenue Funds - - - - - - - - - Provincial agencies and funds - - - - - - - - -
Municipalities3
Municipalities - - - - - - - - - of which: Regional service council levies
Municipal agencies and fundsDepartmental agencies and accounts - - - - - - - - -
Social security funds - - - - - - - - - Provide list of entities receiving transfers4
Universities and technikonsForeign governments and international organisationsPublic corporations and private enterprises5 - - - - - - - - -
Public corporationsSubsidies on production - - - - - - - - - Other transfers - - - - - - - - -
Private enterprisesSubsidies on production - - - - - - - - - Other transfers - - - - - - - - -
Non-profit institutions 2 989 4 000 Households - - - - - - - - -
Social benefitsOther transfers to households
Payments for capital assets - - - - - - - - - Buildings and other fixed structures - - - - - - - - -
Buildings - - - - - - - - - Other fixed structures - - - - - - - - -
Machinery and equipment - - - - - - - - - Transport equipment - - - - - - - - - Other machinery and equipment
Heritage Assets - - - - - - - - - Specialised military assets - - - - - - - - - Biological assets - - - - - - - - - Land and sub-soil assets - - - - - - - - - Software and other intangible assets - - - - - - - - -
Payments for financial assets - - - - - - - - -
Total economic classification: Dinaledi Schools Grant 5 184 7 573 8 047 - - - - - -
2015/16
Vote 6
44
Table B.3c: Payments and estimates by economic classification: Technical Secondary Schools Recapitalisation Grant: (Public Ordinary School Education)
Outcome Main appropriation
Adjusted appropriation
Revised estimate Medium-term estimates
R thousand 2012/13 2013/14 2014/15 2016/17 2017/18 2018/19Current payments - - - - - - - - -
Compensation of employees - - - - - - - - - Salaries and wagesSocial contributions
Goods and services - - - - - - - - - Administrative feesAdvertisingMinor AssetsAudit cost: ExternalBursaries: EmployeesCatering: Departmental activitiesCommunication (G&S)Computer servicesConsultants and professional services: Business and advisory servicesConsultants and professional services: Infrastructure and planningConsultants and professional services: Laboratory servicesConsultants and professional services: Scientific and technological servicesConsultants and professional services: Legal costsContractorsAgency and support / outsourced servicesEntertainmentFleet services (including government motor transport)Housing
Inventory: Clothing material and accessories
Inventory: Farming suppliesInventory: Food and food suppliesInventory: Fuel, oil and gas
Inventory: Learner and teacher support material
Inventory: Materials and suppliesInventory: Medical suppliesInventory: MedicineMedsas inventory interfaceInventory: Other suppliesConsumable suppliesConsumable: Stationery,printing and office suppliesOperating leasesProperty paymentsTransport provided: Departmental activityTravel and subsistenceTraining and developmentOperating paymentsVenues and facilitiesRental and hiring
Interest and rent on land - - - - - - - - - Interest - - - - - - - - Rent on land - - - - - - - - -
Transfers and subsidies to1: 19 594 20 963 22 219 - - - Provinces and municipalities - - - - - - - - -
Provinces2
Provincial Revenue Funds - - - - - - - - - Provincial agencies and funds - - - - - - - - -
Municipalities3
Municipalities - - - - - - - - - of which: Regional service council levies
Municipal agencies and fundsDepartmental agencies and accounts - - - - - - - - -
Social security funds - - - - - - - - - Provide list of entities receiving transfers4
Universities and technikonsForeign governments and international organisationsPublic corporations and private enterprises5 - - - - - - - - -
Public corporationsSubsidies on production - - - - - - - - - Other transfers - - - - - - - - -
Private enterprisesSubsidies on production - - - - - - - - - Other transfers - - - - - - - - -
Non-profit institutions 14 428 19 594 20 963 22 219 22 219 19 273 Households - - - - - - - - -
Social benefitsOther transfers to households
Payments for capital assets - - - - - - - - - Buildings and other fixed structures - - - - - - - - -
Buildings - - - - - - - - - Other fixed structures - - - - - - - - -
Machinery and equipment - - - - - - - - - Transport equipment - - - - - - - - - Other machinery and equipment
Heritage Assets - - - - - - - - - Specialised military assets - - - - - - - - - Biological assets - - - - - - - - - Land and sub-soil assets - - - - - - - - - Software and other intangible assets - - - - - - - - -
Payments for financial assets - - - - - - - - -
Total economic classification: Technical Secondary Schools Recapitalisation Grant 19 594 20 963 22 219 - - - - - -
2015/16
VOTE 6 - Department of Education 291

Vote 6
45
Table B.3d: Payments and estimates by economic classification: Social Sector Expanded Public Works Programme Incentive: (Public Ordinary School Education)
Outcome Main appropriation
Adjusted appropriation
Revised estimate Medium-term estimates
R thousand 2012/13 2013/14 2014/15 2016/17 2017/18 2018/19Current payments 4 742 - 2 240 - - - - - -
Compensation of employees 4 742 - 2 240 - - - - - - Salaries and wages 4 742 2 240 Social contributions
Goods and services - - - - - - - - - Administrative feesAdvertisingMinor AssetsAudit cost: ExternalBursaries: EmployeesCatering: Departmental activitiesCommunication (G&S)Computer servicesConsultants and professional services: Business and advisory servicesConsultants and professional services: Infrastructure and planningConsultants and professional services: Laboratory servicesConsultants and professional services: Scientific and technological servicesConsultants and professional services: Legal costsContractorsAgency and support / outsourced servicesEntertainmentFleet services (including government motor transport)HousingInventory: Clothing material and accessoriesInventory: Farming suppliesInventory: Food and food suppliesInventory: Fuel, oil and gas
Inventory: Learner and teacher support material
Inventory: Materials and suppliesInventory: Medical suppliesInventory: MedicineMedsas inventory interfaceInventory: Other suppliesConsumable suppliesConsumable: Stationery,printing and office suppliesOperating leasesProperty paymentsTransport provided: Departmental activityTravel and subsistenceTraining and developmentOperating paymentsVenues and facilitiesRental and hiring
Interest and rent on land - - - - - - - - - Interest - - - - - - - - Rent on land - - - - - - - - -
Transfers and subsidies to1: - - - - - - - - - Provinces and municipalities - - - - - - - - -
Provinces2
Provincial Revenue Funds - - - - - - - - - Provincial agencies and funds - - - - - - - - -
Municipalities3
Municipalities - - - - - - - - - of which: Regional service council levies
Municipal agencies and fundsDepartmental agencies and accounts - - - - - - - - -
Social security funds - - - - - - - - - Provide list of entities receiving transfers4
Universities and technikonsForeign governments and international organisationsPublic corporations and private enterprises5 - - - - - - - - -
Public corporationsSubsidies on production - - - - - - - - - Other transfers - - - - - - - - -
Private enterprisesSubsidies on production - - - - - - - - - Other transfers - - - - - - - - -
Non-profit institutionsHouseholds - - - - - - - - -
Social benefitsOther transfers to households
Payments for capital assets - - - - - - - - - Buildings and other fixed structures - - - - - - - - -
Buildings - - - - - - - - - Other fixed structures - - - - - - - -
Machinery and equipment - - - - - - - - - Transport equipment - - - - - - - - - Other machinery and equipment
Heritage Assets - - - - - - - - - Specialised military assets - - - - - - - - - Biological assets - - - - - - - - - Land and sub-soil assets - - - - - - - - - Software and other intangible assets - - - - - - - - -
Payments for financial assets - - - - - - - - -
Total economic classification: Social Sector Expanded Public Works Programme Incentive 4 742 - 2 240 - - - - - -
2015/16
VOTE 6 - Department of Education292

Vote 6
45
Table B.3d: Payments and estimates by economic classification: Social Sector Expanded Public Works Programme Incentive: (Public Ordinary School Education)
Outcome Main appropriation
Adjusted appropriation
Revised estimate Medium-term estimates
R thousand 2012/13 2013/14 2014/15 2016/17 2017/18 2018/19Current payments 4 742 - 2 240 - - - - - -
Compensation of employees 4 742 - 2 240 - - - - - - Salaries and wages 4 742 2 240 Social contributions
Goods and services - - - - - - - - - Administrative feesAdvertisingMinor AssetsAudit cost: ExternalBursaries: EmployeesCatering: Departmental activitiesCommunication (G&S)Computer servicesConsultants and professional services: Business and advisory servicesConsultants and professional services: Infrastructure and planningConsultants and professional services: Laboratory servicesConsultants and professional services: Scientific and technological servicesConsultants and professional services: Legal costsContractorsAgency and support / outsourced servicesEntertainmentFleet services (including government motor transport)HousingInventory: Clothing material and accessoriesInventory: Farming suppliesInventory: Food and food suppliesInventory: Fuel, oil and gas
Inventory: Learner and teacher support material
Inventory: Materials and suppliesInventory: Medical suppliesInventory: MedicineMedsas inventory interfaceInventory: Other suppliesConsumable suppliesConsumable: Stationery,printing and office suppliesOperating leasesProperty paymentsTransport provided: Departmental activityTravel and subsistenceTraining and developmentOperating paymentsVenues and facilitiesRental and hiring
Interest and rent on land - - - - - - - - - Interest - - - - - - - - Rent on land - - - - - - - - -
Transfers and subsidies to1: - - - - - - - - - Provinces and municipalities - - - - - - - - -
Provinces2
Provincial Revenue Funds - - - - - - - - - Provincial agencies and funds - - - - - - - - -
Municipalities3
Municipalities - - - - - - - - - of which: Regional service council levies
Municipal agencies and fundsDepartmental agencies and accounts - - - - - - - - -
Social security funds - - - - - - - - - Provide list of entities receiving transfers4
Universities and technikonsForeign governments and international organisationsPublic corporations and private enterprises5 - - - - - - - - -
Public corporationsSubsidies on production - - - - - - - - - Other transfers - - - - - - - - -
Private enterprisesSubsidies on production - - - - - - - - - Other transfers - - - - - - - - -
Non-profit institutionsHouseholds - - - - - - - - -
Social benefitsOther transfers to households
Payments for capital assets - - - - - - - - - Buildings and other fixed structures - - - - - - - - -
Buildings - - - - - - - - - Other fixed structures - - - - - - - -
Machinery and equipment - - - - - - - - - Transport equipment - - - - - - - - - Other machinery and equipment
Heritage Assets - - - - - - - - - Specialised military assets - - - - - - - - - Biological assets - - - - - - - - - Land and sub-soil assets - - - - - - - - - Software and other intangible assets - - - - - - - - -
Payments for financial assets - - - - - - - - -
Total economic classification: Social Sector Expanded Public Works Programme Incentive 4 742 - 2 240 - - - - - -
2015/16
Vote 6
46
Table B.3e: Payments and estimates by economic classification: OSD for Therapists: (Public Special School Education)
Outcome Main appropriation
Adjusted appropriation
Revised estimate Medium-term estimates
R thousand 2012/13 2013/14 2014/15 2016/17 2017/18 2018/19Current payments - - 18 358 5 775 5 775 5 775 - - -
Compensation of employees - - 18 358 5 775 5 775 5 775 - - - Salaries and wages 18 358 5 775 5 006 5 006 Social contributions 769 769
Goods and services - - - - - - - - - Administrative fees - - Advertising - - Minor Assets - - Audit cost: External - - Bursaries: Employees - - Catering: Departmental activities - - Communication (G&S) - - Computer services - - Consultants and professional services: Business and advisory services - -
Consultants and professional services: Infrastructure and planning - -
Consultants and professional services: Laboratory services - -
Consultants and professional services: Scientific and technological services - -
Consultants and professional services: Legal costs - -
Contractors - - Agency and support / outsourced services - - Entertainment - - Fleet services (including government motor transport) - -
Housing - -
Inventory: Clothing material and accessories - -
Inventory: Farming supplies - - Inventory: Food and food supplies - - Inventory: Fuel, oil and gas - -
Inventory: Learner and teacher support material - -
Inventory: Materials and supplies - - Inventory: Medical supplies - - Inventory: Medicine - - Medsas inventory interface - - Inventory: Other supplies - - Consumable supplies - - Consumable: Stationery,printing and office supplies - -
Operating leases - - Property payments - - Transport provided: Departmental activity - - Travel and subsistence - - Training and development - - Operating payments - - Venues and facilities - - Rental and hiring - -
Interest and rent on land - - - - - - - - - Interest - - - - - - - - Rent on land - - - - - - - - -
Transfers and subsidies to1:Provinces and municipalities - - - - - - - - -
Provinces2
Provincial Revenue Funds - - - - - - - - - Provincial agencies and funds - - - - - - - - -
Municipalities3
Municipalities - - - - - - - - - of which: Regional service council levies
Municipal agencies and fundsDepartmental agencies and accounts - - - - - - - - -
Social security funds - - - - - - - - - Provide list of entities receiving transfers4
Universities and technikonsForeign governments and international organisationsPublic corporations and private enterprises5 - - - - - - - - -
Public corporationsSubsidies on production - - - - - - - - - Other transfers - - - - - - - - -
Private enterprisesSubsidies on production - - - - - - - - - Other transfers - - - - - - - - -
Non-profit institutionsHouseholds - - - - - - - - -
Social benefitsOther transfers to households
Payments for capital assets - - - - - - - - - Buildings and other fixed structures - - - - - - - - -
Buildings - - - - - - - - - Other fixed structures - - - - - - - - -
Machinery and equipment - - - - - - - - - Transport equipment - - - - - - - - - Other machinery and equipment
Heritage Assets - - - - - - - - - Specialised military assets - - - - - - - - - Biological assets - - - - - - - - - Land and sub-soil assets - - - - - - - - - Software and other intangible assets - - - - - - - - -
Payments for financial assets - - - - - - - - -
Total economic classification: OSD for Therapists - - 18 358 5 775 5 775 5 775 - - -
2015/16
VOTE 6 - Department of Education 293

Vote 6
47
Table B.3f: Payments and estimates by economic classification: Education Infrastructure Grant: (Infrastructure Development)
Outcome Main appropriation
Adjusted appropriation
Revised estimate Medium-term estimates
R thousand 2012/13 2013/14 2014/15 2016/17 2017/18 2018/19Current payments 17 771 32 710 102 459 37 989 95 632 95 845 38 000 40 350 44 768
Compensation of employees 441 7 325 4 658 18 000 9 000 8 916 20 000 21 000 22 050 Salaries and wages 441 7 325 4 141 18 000 8 458 8 374 16 000 19 320 20 286 Social contributions 517 542 542 4 000 1 680 1 764
Goods and services 17 330 25 385 97 801 19 989 86 632 86 929 18 000 19 350 22 718 Administrative fees - - - - - Advertising - - - - - Minor Assets 37 210 - - - - - Audit cost: External - - - - - Bursaries: Employees - - - - - Catering: Departmental activities - - - - - Communication (G&S) - - - - - Computer services - - - - - Consultants and professional services: Business and advisory services - 3 162 - - -
Consultants and professional services: Infrastructure and planning 110 328 367 - - -
Consultants and professional services: Laboratory services - - - - -
Consultants and professional services: Scientific and technological services - - - - -
Consultants and professional services: Legal costs - - - - -
Contractors 568 53 53 - - - Agency and support / outsourced services - - - - - Entertainment - - - - - Fleet services (including government motor transport) - - - - -
Housing - - - - -
Inventory: Clothing material and accessories - - - - -
Inventory: Farming supplies - - - - - Inventory: Food and food supplies - - - - - Inventory: Fuel, oil and gas - - - - -
Inventory: Learner and teacher support material - - - - -
Inventory: Materials and supplies - - - - - Inventory: Medical supplies - - - - - Inventory: Medicine - - - - - Medsas inventory interface - - - - - Inventory: Other supplies 49 777 7 000 25 611 43 753 8 000 7 350 7 718 Consumable supplies 173 - 213 - - - Consumable: Stationery,printing and office supplies - - - - -
Operating leases - - - - - Property payments 17 293 25 000 16 317 12 989 60 640 38 672 10 000 12 000 15 000 Transport provided: Departmental activity - - - - - Travel and subsistence 175 161 - 84 - - - Training and development 30 695 - - - - - Operating payments - - - - - Venues and facilities - - - - - Rental and hiring - 625
Interest and rent on land - - - - - - - - - Interest - - - - - - - - Rent on land - - - - - - - - -
Transfers and subsidies to1: 61 015 75 673 9 355 - - - - - - Provinces and municipalities - - - - - - - - -
Provinces2
Provincial Revenue Funds - - - - - - - - - Provincial agencies and funds - - - - - - - - -
Municipalities3
Municipalities - - - - - - - - - of which: Regional service council levies
Municipal agencies and fundsDepartmental agencies and accounts - - - - - - - - -
Social security funds - - - - - - - - - Provide list of entities receiving transfers4
Universities and technikonsForeign governments and international organisationsPublic corporations and private enterprises5 - - - - - - - - -
Public corporationsSubsidies on production - - - - - - - - - Other transfers - - - - - - - - -
Private enterprisesSubsidies on production - - - - - - - - - Other transfers - - - - - - - - -
Non-profit institutions 61 015 75 673 9 355 - - - - - Households - - -
Social benefits - - - - - Other transfers to households - - - - -
Payments for capital assets 433 562 367 835 376 752 724 564 785 936 785 723 657 122 621 285 654 508 Buildings and other fixed structures 433 273 367 545 370 837 724 564 784 436 784 223 657 122 621 285 654 508
Buildings - - - - - - - - - Other fixed structures 433 273 367 545 370 837 724 564 784 436 784 223 657 122 621 285 654 508
Machinery and equipment 289 290 5 915 - 1 500 1 500 - - - Transport equipment - - - - - - - - - Other machinery and equipment 289 290 5 915 1 500 1 500 - - -
Heritage Assets - - - - - - - - - Specialised military assets - - - - - - - - - Biological assets - - - - - - - - - Land and sub-soil assets - - - - - - - - - Software and other intangible assets - - -
Payments for financial assets - - - - - - - - -
Total economic classification: Education Infrastructure Grant 512 348 476 218 488 566 762 553 881 568 881 568 695 122 661 635 699 276
2015/16
VOTE 6 - Department of Education
Vote 6
48
Table B.3g: Payments and estimates by economic classification: EPWP intergrated grant to Provinces for infrastructure (Infrastructure Development)
Outcome Main appropriation
Adjusted appropriation
Revised estimate Medium-term estimates
R thousand 2012/13 2013/14 2014/15 2016/17 2017/18 2018/19Current payments - - - - - - - - -
Compensation of employees - - - - - - - - - Salaries and wagesSocial contributions
Goods and services - - - - - - - - - Administrative feesAdvertisingMinor AssetsAudit cost: ExternalBursaries: EmployeesCatering: Departmental activitiesCommunication (G&S)Computer servicesConsultants and professional services: Business and advisory servicesConsultants and professional services: Infrastructure and planningConsultants and professional services: Laboratory servicesConsultants and professional services: Scientific and technological servicesConsultants and professional services: Legal costsContractorsAgency and support / outsourced servicesEntertainmentFleet services (including government motor transport)HousingInventory: Clothing material and accessoriesInventory: Farming suppliesInventory: Food and food suppliesInventory: Fuel, oil and gas
Inventory: Learner and teacher support material
Inventory: Materials and suppliesInventory: Medical suppliesInventory: MedicineMedsas inventory interfaceInventory: Other suppliesConsumable suppliesConsumable: Stationery,printing and office suppliesOperating leasesProperty paymentsTransport provided: Departmental activityTravel and subsistenceTraining and developmentOperating paymentsVenues and facilitiesRental and hiring
Interest and rent on land - - - - - - - - - Interest - - - - - - - - Rent on land - - - - - - - - -
Transfers and subsidies to1: - - - - - - - - - Provinces and municipalities - - - - - - - - -
Provinces2
Provincial Revenue Funds - - - - - - - - - Provincial agencies and funds - - - - - - - - -
Municipalities3
Municipalities - - - - - - - - - of which: Regional service council levies
Municipal agencies and fundsDepartmental agencies and accounts - - - - - - - - -
Social security funds - - - - - - - - - Provide list of entities receiving transfers4
Universities and technikonsForeign governments and international organisationsPublic corporations and private enterprises5 - - - - - - - - -
Public corporationsSubsidies on production - - - - - - - - - Other transfers - - - - - - - - -
Private enterprisesSubsidies on production - - - - - - - - - Other transfers - - - - - - - - -
Non-profit institutionsHouseholds - - - - - - - - -
Social benefitsOther transfers to households
Payments for capital assets 1 000 3 000 2 629 2 523 3 108 3 108 2 567 - - Buildings and other fixed structures 1 000 3 000 2 629 2 523 3 108 3 108 2 567 - -
Buildings - - - Other fixed structures 1 000 3 000 2 629 2 523 3 108 3 108 2 567 - -
Machinery and equipment - - - - - - - - - Transport equipment - - - - - - - - - Other machinery and equipment
Heritage Assets - - - - - - - - - Specialised military assets - - - - - - - - - Biological assets - - - - - - - - - Land and sub-soil assets - - - - - - - - - Software and other intangible assets - - -
Payments for financial assets - - - - - - - - -
Total economic classification: EPWP Intergrated Grant to Provinces for Infrastructure 1 000 3 000 2 629 2 523 3 108 3 108 2 567 - -
2015/16
294

Vote 6
47
Table B.3f: Payments and estimates by economic classification: Education Infrastructure Grant: (Infrastructure Development)
Outcome Main appropriation
Adjusted appropriation
Revised estimate Medium-term estimates
R thousand 2012/13 2013/14 2014/15 2016/17 2017/18 2018/19Current payments 17 771 32 710 102 459 37 989 95 632 95 845 38 000 40 350 44 768
Compensation of employees 441 7 325 4 658 18 000 9 000 8 916 20 000 21 000 22 050 Salaries and wages 441 7 325 4 141 18 000 8 458 8 374 16 000 19 320 20 286 Social contributions 517 542 542 4 000 1 680 1 764
Goods and services 17 330 25 385 97 801 19 989 86 632 86 929 18 000 19 350 22 718 Administrative fees - - - - - Advertising - - - - - Minor Assets 37 210 - - - - - Audit cost: External - - - - - Bursaries: Employees - - - - - Catering: Departmental activities - - - - - Communication (G&S) - - - - - Computer services - - - - - Consultants and professional services: Business and advisory services - 3 162 - - -
Consultants and professional services: Infrastructure and planning 110 328 367 - - -
Consultants and professional services: Laboratory services - - - - -
Consultants and professional services: Scientific and technological services - - - - -
Consultants and professional services: Legal costs - - - - -
Contractors 568 53 53 - - - Agency and support / outsourced services - - - - - Entertainment - - - - - Fleet services (including government motor transport) - - - - -
Housing - - - - -
Inventory: Clothing material and accessories - - - - -
Inventory: Farming supplies - - - - - Inventory: Food and food supplies - - - - - Inventory: Fuel, oil and gas - - - - -
Inventory: Learner and teacher support material - - - - -
Inventory: Materials and supplies - - - - - Inventory: Medical supplies - - - - - Inventory: Medicine - - - - - Medsas inventory interface - - - - - Inventory: Other supplies 49 777 7 000 25 611 43 753 8 000 7 350 7 718 Consumable supplies 173 - 213 - - - Consumable: Stationery,printing and office supplies - - - - -
Operating leases - - - - - Property payments 17 293 25 000 16 317 12 989 60 640 38 672 10 000 12 000 15 000 Transport provided: Departmental activity - - - - - Travel and subsistence 175 161 - 84 - - - Training and development 30 695 - - - - - Operating payments - - - - - Venues and facilities - - - - - Rental and hiring - 625
Interest and rent on land - - - - - - - - - Interest - - - - - - - - Rent on land - - - - - - - - -
Transfers and subsidies to1: 61 015 75 673 9 355 - - - - - - Provinces and municipalities - - - - - - - - -
Provinces2
Provincial Revenue Funds - - - - - - - - - Provincial agencies and funds - - - - - - - - -
Municipalities3
Municipalities - - - - - - - - - of which: Regional service council levies
Municipal agencies and fundsDepartmental agencies and accounts - - - - - - - - -
Social security funds - - - - - - - - - Provide list of entities receiving transfers4
Universities and technikonsForeign governments and international organisationsPublic corporations and private enterprises5 - - - - - - - - -
Public corporationsSubsidies on production - - - - - - - - - Other transfers - - - - - - - - -
Private enterprisesSubsidies on production - - - - - - - - - Other transfers - - - - - - - - -
Non-profit institutions 61 015 75 673 9 355 - - - - - Households - - -
Social benefits - - - - - Other transfers to households - - - - -
Payments for capital assets 433 562 367 835 376 752 724 564 785 936 785 723 657 122 621 285 654 508 Buildings and other fixed structures 433 273 367 545 370 837 724 564 784 436 784 223 657 122 621 285 654 508
Buildings - - - - - - - - - Other fixed structures 433 273 367 545 370 837 724 564 784 436 784 223 657 122 621 285 654 508
Machinery and equipment 289 290 5 915 - 1 500 1 500 - - - Transport equipment - - - - - - - - - Other machinery and equipment 289 290 5 915 1 500 1 500 - - -
Heritage Assets - - - - - - - - - Specialised military assets - - - - - - - - - Biological assets - - - - - - - - - Land and sub-soil assets - - - - - - - - - Software and other intangible assets - - -
Payments for financial assets - - - - - - - - -
Total economic classification: Education Infrastructure Grant 512 348 476 218 488 566 762 553 881 568 881 568 695 122 661 635 699 276
2015/16
Vote 6
48
Table B.3g: Payments and estimates by economic classification: EPWP intergrated grant to Provinces for infrastructure (Infrastructure Development)
Outcome Main appropriation
Adjusted appropriation
Revised estimate Medium-term estimates
R thousand 2012/13 2013/14 2014/15 2016/17 2017/18 2018/19Current payments - - - - - - - - -
Compensation of employees - - - - - - - - - Salaries and wagesSocial contributions
Goods and services - - - - - - - - - Administrative feesAdvertisingMinor AssetsAudit cost: ExternalBursaries: EmployeesCatering: Departmental activitiesCommunication (G&S)Computer servicesConsultants and professional services: Business and advisory servicesConsultants and professional services: Infrastructure and planningConsultants and professional services: Laboratory servicesConsultants and professional services: Scientific and technological servicesConsultants and professional services: Legal costsContractorsAgency and support / outsourced servicesEntertainmentFleet services (including government motor transport)HousingInventory: Clothing material and accessoriesInventory: Farming suppliesInventory: Food and food suppliesInventory: Fuel, oil and gas
Inventory: Learner and teacher support material
Inventory: Materials and suppliesInventory: Medical suppliesInventory: MedicineMedsas inventory interfaceInventory: Other suppliesConsumable suppliesConsumable: Stationery,printing and office suppliesOperating leasesProperty paymentsTransport provided: Departmental activityTravel and subsistenceTraining and developmentOperating paymentsVenues and facilitiesRental and hiring
Interest and rent on land - - - - - - - - - Interest - - - - - - - - Rent on land - - - - - - - - -
Transfers and subsidies to1: - - - - - - - - - Provinces and municipalities - - - - - - - - -
Provinces2
Provincial Revenue Funds - - - - - - - - - Provincial agencies and funds - - - - - - - - -
Municipalities3
Municipalities - - - - - - - - - of which: Regional service council levies
Municipal agencies and fundsDepartmental agencies and accounts - - - - - - - - -
Social security funds - - - - - - - - - Provide list of entities receiving transfers4
Universities and technikonsForeign governments and international organisationsPublic corporations and private enterprises5 - - - - - - - - -
Public corporationsSubsidies on production - - - - - - - - - Other transfers - - - - - - - - -
Private enterprisesSubsidies on production - - - - - - - - - Other transfers - - - - - - - - -
Non-profit institutionsHouseholds - - - - - - - - -
Social benefitsOther transfers to households
Payments for capital assets 1 000 3 000 2 629 2 523 3 108 3 108 2 567 - - Buildings and other fixed structures 1 000 3 000 2 629 2 523 3 108 3 108 2 567 - -
Buildings - - - Other fixed structures 1 000 3 000 2 629 2 523 3 108 3 108 2 567 - -
Machinery and equipment - - - - - - - - - Transport equipment - - - - - - - - - Other machinery and equipment
Heritage Assets - - - - - - - - - Specialised military assets - - - - - - - - - Biological assets - - - - - - - - - Land and sub-soil assets - - - - - - - - - Software and other intangible assets - - -
Payments for financial assets - - - - - - - - -
Total economic classification: EPWP Intergrated Grant to Provinces for Infrastructure 1 000 3 000 2 629 2 523 3 108 3 108 2 567 - -
2015/16
VOTE 6 - Department of Education 295

Vote 6
49
Table B.3h: Payments and estimates by economic classification: HIV/AIDS Life Skills Education (Auxiliary and Associated Services)
Outcome Main appropriation
Adjusted appropriation
Revised estimate Medium-term estimates
R thousand 2012/13 2013/14 2014/15 2016/17 2017/18 2018/19Current payments 9 910 14 441 10 872 10 462 11 334 11 334 12 427 13 950 13 950
Compensation of employees 735 1 680 1 415 1 200 1 200 1 631 1 400 1 440 1 440 Salaries and wages 671 1 396 1 258 1 055 1 055 1 477 1 400 1 440 1 440 Social contributions 64 284 157 145 145 154 - - -
Goods and services 9 175 12 761 9 457 9 262 10 134 9 703 11 027 12 510 12 510 Administrative fees 10 1 - - - - - - Advertising - - - - - - - Minor Assets - - 40 40 - - - Audit cost: External - - - - - - - Bursaries: Employees - - - - - - - Catering: Departmental activities 3 046 2 720 1 432 1 752 1 172 1 041 3 000 3 000 3 000 Communication (G&S) 12 - - - - - - - Computer services - - - - - - - Consultants and professional services: Business and advisory services 1 028 2 540 510 1 900 2 788 2 788 1 000 1 237 1 237
Consultants and professional services: Infrastructure and planning - - - - - - -
Consultants and professional services: Laboratory services - - - - - - -
Consultants and professional services: Scientific and technological services - - - - - - -
Consultants and professional services: Legal costs - - - - - - -
Contractors 17 28 - - - - - - Agency and support / outsourced services 335 - - - - - - Entertainment - - - - - - - Fleet services (including government motor transport) - - - - - - -
Housing - - - - - - - Inventory: Clothing material and accessories 396 - - - - - - - Inventory: Farming supplies - - - - - - - Inventory: Food and food supplies - - - - - - - Inventory: Fuel, oil and gas - - - - - - -
Inventory: Learner and teacher support material 936 - - - - - -
Inventory: Materials and supplies - - 2 2 - - - Inventory: Medical supplies 498 500 - 1 011 1 403 1 403 520 500 500 Inventory: Medicine - - - - - - - Medsas inventory interface - - - - - - - Inventory: Other supplies - - - - 4 - - Consumable supplies 488 21 - - - - - - Consumable: Stationery,printing and office supplies 312 127 351 169 518 518 160 300 300
Operating leases - - - - - - - Property payments - - - - - - - Transport provided: Departmental activity 589 1 000 725 500 380 380 987 1 200 1 200 Travel and subsistence 1 329 3 027 1 305 1 630 2 511 2 197 2 743 2 767 2 767 Training and development 1 464 456 2 757 1 500 1 230 1 230 2 000 2 000 2 000 Operating payments 1 173 789 - 5 19 13 6 6 Venues and facilities 404 800 267 800 85 85 600 1 500 1 500 Rental and hiring
Interest and rent on land - - - - - - - - - Interest - - - - - - - - Rent on land - - - - - - - - -
Transfers and subsidies to1: - - 59 - - - - - - Provinces and municipalities - - - - - - - - -
Provinces2
Provincial Revenue Funds - - - - - - - - - Provincial agencies and funds - - - - - - - - -
Municipalities3
Municipalities - - - - - - - - - of which: Regional service council levies
Municipal agencies and fundsDepartmental agencies and accounts - - - - - - - - -
Social security funds - - - - - - - - - Provide list of entities receiving transfers4
Universities and technikonsForeign governments and international organisationsPublic corporations and private enterprises5 - - - - - - - - -
Public corporationsSubsidies on production - - - - - - - - - Other transfers - - - - - - - - -
Private enterprisesSubsidies on production - - - - - - - - - Other transfers - - - - - - - - -
Non-profit institutions - - - - - - Households - - 59 - - - - - -
Social benefits 59 - - - - - Other transfers to households - - - - - - -
Payments for capital assets - - - - 365 365 540 30 840 Buildings and other fixed structures - - - - - - - - -
Buildings - - - - - - - Other fixed structures - - - - - - - - -
Machinery and equipment - - - - 365 365 540 30 840 Transport equipment - - - - - - - - - Other machinery and equipment - 365 365 540 30 840
Heritage Assets - - - - - - - - - Specialised military assets - - - - - - - - - Biological assets - - - - - - - - - Land and sub-soil assets - - - - - - - - - Software and other intangible assets - -
Payments for financial assets - - - - - - - - -
Total economic classification: Auxiliary and Associated Services 9 910 14 441 10 931 10 462 11 699 11 699 12 967 13 980 14 790
2015/16
VOTE 6 - Department of Education
Vote 6
50
Table B.3i: Payments and estimates by economic classification: Infrastructure Enhancement Allocation (Infrastructure Development)
Outcome Main appropriation
Adjusted appropriation
Revised estimate Medium-term estimates
R thousand 2012/13 2013/14 2014/15 2016/17 2017/18 2018/19Current payments - - 724 2 000 1 600 1 600 2 000 2 500 3 125
Compensation of employees - - - - - - - - - Salaries and wagesSocial contributions
Goods and services - - 724 2 000 1 600 1 600 2 000 2 500 3 125 Administrative feesAdvertisingMinor AssetsAudit cost: ExternalBursaries: EmployeesCatering: Departmental activitiesCommunication (G&S)Computer servicesConsultants and professional services: Business and advisory servicesConsultants and professional services: Infrastructure and planningConsultants and professional services: Laboratory servicesConsultants and professional services: Scientific and technological servicesConsultants and professional services: Legal costsContractorsAgency and support / outsourced servicesEntertainmentFleet services (including government motor transport)HousingInventory: Clothing material and accessoriesInventory: Farming suppliesInventory: Food and food suppliesInventory: Fuel, oil and gasInventory: Learner and teacher support materialInventory: Materials and suppliesInventory: Medical suppliesInventory: MedicineMedsas inventory interfaceInventory: Other suppliesConsumable suppliesConsumable: Stationery,printing and office suppliesOperating leasesProperty payments 724 2 000 1 600 1 600 2 000 2 500 3 125 Transport provided: Departmental activityTravel and subsistenceTraining and developmentOperating paymentsVenues and facilitiesRental and hiring
Interest and rent on land - - - - - - - - - Interest - - - - - - - - Rent on land - - - - - - - - -
Transfers and subsidies to1: 12 000 - - - - - - - - Provinces and municipalities - - - - - - - - -
Provinces2
Provincial Revenue Funds - - - - - - - - - Provincial agencies and funds - - - - - - - - -
Municipalities3
Municipalities - - - - - - - - - of which: Regional service council levies
Municipal agencies and fundsDepartmental agencies and accounts - - - - - - - - -
Social security funds - - - - - - - - - Provide list of entities receiving transfers4
Universities and technikonsForeign governments and international organisationsPublic corporations and private enterprises5 - - - - - - - - -
Public corporationsSubsidies on production - - - - - - - - - Other transfers - - - - - - - - -
Private enterprisesSubsidies on production - - - - - - - - - Other transfers - - - - - - - - -
Non-profit institutions 12 000 Households - - - - - - - - -
Social benefitsOther transfers to households
Payments for capital assets - - 1 178 13 253 1 653 1 653 13 197 13 778 13 091 Buildings and other fixed structures - - 1 178 13 253 1 653 1 653 13 197 13 778 13 091
Buildings - - - - Other fixed structures - - 1 178 13 253 1 653 1 653 13 197 13 778 13 091
Machinery and equipment - - - - - - - - - Transport equipment - - - - - - - - - Other machinery and equipment
Heritage Assets - - - - - - - - - Specialised military assets - - - - - - - - - Biological assets - - - - - - - - - Land and sub-soil assets - - - - - - - - - Software and other intangible assets - - -
Payments for financial assets - - - - - - - - -
Total economic classification: Infrastructure Enhancement Allocation 12 000 - 1 902 15 253 3 253 3 253 15 197 16 278 16 216
2015/16
296

Vote 6
49
Table B.3h: Payments and estimates by economic classification: HIV/AIDS Life Skills Education (Auxiliary and Associated Services)
Outcome Main appropriation
Adjusted appropriation
Revised estimate Medium-term estimates
R thousand 2012/13 2013/14 2014/15 2016/17 2017/18 2018/19Current payments 9 910 14 441 10 872 10 462 11 334 11 334 12 427 13 950 13 950
Compensation of employees 735 1 680 1 415 1 200 1 200 1 631 1 400 1 440 1 440 Salaries and wages 671 1 396 1 258 1 055 1 055 1 477 1 400 1 440 1 440 Social contributions 64 284 157 145 145 154 - - -
Goods and services 9 175 12 761 9 457 9 262 10 134 9 703 11 027 12 510 12 510 Administrative fees 10 1 - - - - - - Advertising - - - - - - - Minor Assets - - 40 40 - - - Audit cost: External - - - - - - - Bursaries: Employees - - - - - - - Catering: Departmental activities 3 046 2 720 1 432 1 752 1 172 1 041 3 000 3 000 3 000 Communication (G&S) 12 - - - - - - - Computer services - - - - - - - Consultants and professional services: Business and advisory services 1 028 2 540 510 1 900 2 788 2 788 1 000 1 237 1 237
Consultants and professional services: Infrastructure and planning - - - - - - -
Consultants and professional services: Laboratory services - - - - - - -
Consultants and professional services: Scientific and technological services - - - - - - -
Consultants and professional services: Legal costs - - - - - - -
Contractors 17 28 - - - - - - Agency and support / outsourced services 335 - - - - - - Entertainment - - - - - - - Fleet services (including government motor transport) - - - - - - -
Housing - - - - - - - Inventory: Clothing material and accessories 396 - - - - - - - Inventory: Farming supplies - - - - - - - Inventory: Food and food supplies - - - - - - - Inventory: Fuel, oil and gas - - - - - - -
Inventory: Learner and teacher support material 936 - - - - - -
Inventory: Materials and supplies - - 2 2 - - - Inventory: Medical supplies 498 500 - 1 011 1 403 1 403 520 500 500 Inventory: Medicine - - - - - - - Medsas inventory interface - - - - - - - Inventory: Other supplies - - - - 4 - - Consumable supplies 488 21 - - - - - - Consumable: Stationery,printing and office supplies 312 127 351 169 518 518 160 300 300
Operating leases - - - - - - - Property payments - - - - - - - Transport provided: Departmental activity 589 1 000 725 500 380 380 987 1 200 1 200 Travel and subsistence 1 329 3 027 1 305 1 630 2 511 2 197 2 743 2 767 2 767 Training and development 1 464 456 2 757 1 500 1 230 1 230 2 000 2 000 2 000 Operating payments 1 173 789 - 5 19 13 6 6 Venues and facilities 404 800 267 800 85 85 600 1 500 1 500 Rental and hiring
Interest and rent on land - - - - - - - - - Interest - - - - - - - - Rent on land - - - - - - - - -
Transfers and subsidies to1: - - 59 - - - - - - Provinces and municipalities - - - - - - - - -
Provinces2
Provincial Revenue Funds - - - - - - - - - Provincial agencies and funds - - - - - - - - -
Municipalities3
Municipalities - - - - - - - - - of which: Regional service council levies
Municipal agencies and fundsDepartmental agencies and accounts - - - - - - - - -
Social security funds - - - - - - - - - Provide list of entities receiving transfers4
Universities and technikonsForeign governments and international organisationsPublic corporations and private enterprises5 - - - - - - - - -
Public corporationsSubsidies on production - - - - - - - - - Other transfers - - - - - - - - -
Private enterprisesSubsidies on production - - - - - - - - - Other transfers - - - - - - - - -
Non-profit institutions - - - - - - Households - - 59 - - - - - -
Social benefits 59 - - - - - Other transfers to households - - - - - - -
Payments for capital assets - - - - 365 365 540 30 840 Buildings and other fixed structures - - - - - - - - -
Buildings - - - - - - - Other fixed structures - - - - - - - - -
Machinery and equipment - - - - 365 365 540 30 840 Transport equipment - - - - - - - - - Other machinery and equipment - 365 365 540 30 840
Heritage Assets - - - - - - - - - Specialised military assets - - - - - - - - - Biological assets - - - - - - - - - Land and sub-soil assets - - - - - - - - - Software and other intangible assets - -
Payments for financial assets - - - - - - - - -
Total economic classification: Auxiliary and Associated Services 9 910 14 441 10 931 10 462 11 699 11 699 12 967 13 980 14 790
2015/16
Vote 6
50
Table B.3i: Payments and estimates by economic classification: Infrastructure Enhancement Allocation (Infrastructure Development)
Outcome Main appropriation
Adjusted appropriation
Revised estimate Medium-term estimates
R thousand 2012/13 2013/14 2014/15 2016/17 2017/18 2018/19Current payments - - 724 2 000 1 600 1 600 2 000 2 500 3 125
Compensation of employees - - - - - - - - - Salaries and wagesSocial contributions
Goods and services - - 724 2 000 1 600 1 600 2 000 2 500 3 125 Administrative feesAdvertisingMinor AssetsAudit cost: ExternalBursaries: EmployeesCatering: Departmental activitiesCommunication (G&S)Computer servicesConsultants and professional services: Business and advisory servicesConsultants and professional services: Infrastructure and planningConsultants and professional services: Laboratory servicesConsultants and professional services: Scientific and technological servicesConsultants and professional services: Legal costsContractorsAgency and support / outsourced servicesEntertainmentFleet services (including government motor transport)HousingInventory: Clothing material and accessoriesInventory: Farming suppliesInventory: Food and food suppliesInventory: Fuel, oil and gasInventory: Learner and teacher support materialInventory: Materials and suppliesInventory: Medical suppliesInventory: MedicineMedsas inventory interfaceInventory: Other suppliesConsumable suppliesConsumable: Stationery,printing and office suppliesOperating leasesProperty payments 724 2 000 1 600 1 600 2 000 2 500 3 125 Transport provided: Departmental activityTravel and subsistenceTraining and developmentOperating paymentsVenues and facilitiesRental and hiring
Interest and rent on land - - - - - - - - - Interest - - - - - - - - Rent on land - - - - - - - - -
Transfers and subsidies to1: 12 000 - - - - - - - - Provinces and municipalities - - - - - - - - -
Provinces2
Provincial Revenue Funds - - - - - - - - - Provincial agencies and funds - - - - - - - - -
Municipalities3
Municipalities - - - - - - - - - of which: Regional service council levies
Municipal agencies and fundsDepartmental agencies and accounts - - - - - - - - -
Social security funds - - - - - - - - - Provide list of entities receiving transfers4
Universities and technikonsForeign governments and international organisationsPublic corporations and private enterprises5 - - - - - - - - -
Public corporationsSubsidies on production - - - - - - - - - Other transfers - - - - - - - - -
Private enterprisesSubsidies on production - - - - - - - - - Other transfers - - - - - - - - -
Non-profit institutions 12 000 Households - - - - - - - - -
Social benefitsOther transfers to households
Payments for capital assets - - 1 178 13 253 1 653 1 653 13 197 13 778 13 091 Buildings and other fixed structures - - 1 178 13 253 1 653 1 653 13 197 13 778 13 091
Buildings - - - - Other fixed structures - - 1 178 13 253 1 653 1 653 13 197 13 778 13 091
Machinery and equipment - - - - - - - - - Transport equipment - - - - - - - - - Other machinery and equipment
Heritage Assets - - - - - - - - - Specialised military assets - - - - - - - - - Biological assets - - - - - - - - - Land and sub-soil assets - - - - - - - - - Software and other intangible assets - - -
Payments for financial assets - - - - - - - - -
Total economic classification: Infrastructure Enhancement Allocation 12 000 - 1 902 15 253 3 253 3 253 15 197 16 278 16 216
2015/16
VOTE 6 - Department of Education 297

Vote 6
51
Table B.3j: Payments and estimates by economic classification: Social Sector Expanded Public Works Programme Incentive: (Early Childhood Development)
Outcome Main appropriation
Adjusted appropriation
Revised estimate Medium-term estimates
R thousand 2012/13 2013/14 2014/15 2016/17 2017/18 2018/19Current payments - - - 1 000 940 940 3 000 - -
Compensation of employees - - - 1 000 870 870 3 000 - - Salaries and wages 1 000 870 870 3 000 - - Social contributions - - - - -
Goods and services - - - - 70 70 - - - Administrative fees - - - - - Advertising - - - - - Minor Assets - - - - - Audit cost: External - - - - - Bursaries: Employees - - - - - Catering: Departmental activities 3 3 - - - Communication (G&S) - - - - - Computer services - - - - - Consultants and professional services: Business and advisory services - - - - -
Consultants and professional services: Infrastructure and planning - - - - -
Consultants and professional services: Laboratory services - - - - -
Consultants and professional services: Scientific and technological services - - - - -
Consultants and professional services: Legal costs - - - - -
Contractors - - - - - Agency and support / outsourced services - - - - - Entertainment - - - - - Fleet services (including government motor transport) - - - - -
Housing - - - - - Inventory: Clothing material and accessories - - - - - Inventory: Farming supplies - - - - - Inventory: Food and food supplies - - - - - Inventory: Fuel, oil and gas - - - - - Inventory: Learner and teacher support material - - - - -
Inventory: Materials and supplies - - - - - Inventory: Medical supplies - - - - - Inventory: Medicine - - - - - Medsas inventory interface - - - - - Inventory: Other supplies - - - - - Consumable supplies - - - - - Consumable: Stationery,printing and office supplies - - - - -
Operating leases - - - - - Property payments - - - - - Transport provided: Departmental activity - - - - - Travel and subsistence - - - - - Training and development 67 67 - - - Operating payments - - - - - Venues and facilities - - - - - Rental and hiring
Interest and rent on land - - - - - - - - - Interest - - - - - - - - Rent on land - - - - - - - - -
Transfers and subsidies to1: - - - - - - - - - Provinces and municipalities - - - - - - - - -
Provinces2
Provincial Revenue Funds - - - - - - - - - Provincial agencies and funds - - - - - - - - -
Municipalities3
Municipalities - - - - - - - - - of which: Regional service council levies
Municipal agencies and fundsDepartmental agencies and accounts - - - - - - - - -
Social security funds - - - - - - - - - Provide list of entities receiving transfers4
Universities and technikonsForeign governments and international organisationsPublic corporations and private enterprises5 - - - - - - - - -
Public corporationsSubsidies on production - - - - - - - - - Other transfers - - - - - - - - -
Private enterprisesSubsidies on production - - - - - - - - - Other transfers - - - - - - - - -
Non-profit institutionsHouseholds - - - - - - - - -
Social benefitsOther transfers to households
Payments for capital assets - - - - 60 60 - - - Buildings and other fixed structures - - - - - - - - -
Buildings - - - - Other fixed structures - - - - - - - -
Machinery and equipment - - - - 60 60 - - - Transport equipment - - - - - - - - - Other machinery and equipment 60 60
Heritage Assets - - - - - - - - - Specialised military assets - - - - - - - - - Biological assets - - - - - - - - - Land and sub-soil assets - - - - - - - - - Software and other intangible assets - - -
Payments for financial assets - - - - - - - - -
Total economic classification: Infrastructure Enhancement Allocation - - - 1 000 1 000 1 000 3 000 - -
2015/16
VOTE 6 - Department of Education
Vote 6
52
Table B.3k: Payments and estimates by economic classification: Maths, Science & Technology Grant: (Public Ordinary School Education)
Outcome Main appropriation
Adjusted appropriation
Revised estimate Medium-term estimates
R thousand 2012/13 2013/14 2014/15 2016/17 2017/18 2018/19Current payments - - - 32 145 32 145 32 145 24 266 35 963 38 049
Compensation of employees - - - - 750 750 - - - Salaries and wages 750 750 - - - Social contributions - - - - -
Goods and services - - - 32 145 31 395 31 395 24 266 35 963 38 049 Administrative fees 200 35 35 150 150 150 Advertising - - - - - Minor Assets - - - - - Audit cost: External - - - - - Bursaries: Employees - - - - - Catering: Departmental activities 3 400 1 400 1 400 867 1 267 2 267 Communication (G&S) - - - - - Computer services - - 6 633 7 133 7 633 Consultants and professional services: Business and advisory services 800 4 375 4 375 3 420 4 120 3 620
Consultants and professional services: Infrastructure and planning - - - - -
Consultants and professional services: Laboratory services - - - - -
Consultants and professional services: Scientific and technological services - - - - -
Consultants and professional services: Legal costs - - - - -
Contractors - - - - - Agency and support / outsourced services - - - - - Entertainment - - - - - Fleet services (including government motor transport) - - - - -
Housing - - - - - Inventory: Clothing material and accessories - - - - - Inventory: Farming supplies - - - - - Inventory: Food and food supplies - - - - - Inventory: Fuel, oil and gas - - - - - Inventory: Learner and teacher support material 2 800 5 636 5 636 3 968 5 865 6 951
Inventory: Materials and supplies - - - - - Inventory: Medical supplies - - - - - Inventory: Medicine - - - - - Medsas inventory interface - - - - - Inventory: Other supplies 15 000 13 800 13 800 7 378 15 378 15 378 Consumable supplies - - - - - Consumable: Stationery,printing and office supplies -30 - - - -
Operating leases - - - - - Property payments - - - - - Transport provided: Departmental activity 1 100 100 100 - - - Travel and subsistence 3 300 2 325 2 300 1 600 2 000 2 000 Training and development 3 545 2 579 2 579 200 - - Operating payments 1 000 1 075 1 070 - - - Venues and facilities 1 000 100 100 50 50 50 Rental and hiring
Interest and rent on land - - - - - - - - - Interest - - - - - - - - Rent on land - - - - - - - - -
Transfers and subsidies to1: - - - - - - 9 200 - - Provinces and municipalities - - - - - - - - -
Provinces2
Provincial Revenue Funds - - - - - - - - - Provincial agencies and funds - - - - - - - - -
Municipalities3
Municipalities - - - - - - - - - of which: Regional service council levies
Municipal agencies and fundsDepartmental agencies and accounts - - - - - - - - -
Social security funds - - - - - - - - - Provide list of entities receiving transfers4
Universities and technikonsForeign governments and international organisationsPublic corporations and private enterprises5 - - - - - - - - -
Public corporationsSubsidies on production - - - - - - - - - Other transfers - - - - - - - - -
Private enterprisesSubsidies on production - - - - - - - - - Other transfers - - - - - - - - -
Non-profit institutions - - 9 200 - - Households - - - - - - - - -
Social benefits - - - - - Other transfers to households - - - - -
Payments for capital assets - - - - - - - - - Buildings and other fixed structures - - - - - - - - -
Buildings - - - - - - Other fixed structures - - - - - - - - -
Machinery and equipment - - - - - - - - - Transport equipment - - - - - - - - - Other machinery and equipment - - - - -
Heritage Assets - - - - - - - - - Specialised military assets - - - - - - - - - Biological assets - - - - - - - - - Land and sub-soil assets - - - - - - - - - Software and other intangible assets - - -
Payments for financial assets - - - - - - - - -
Total economic classification: Infrastructure Enhancement Allocation - - - 32 145 32 145 32 145 33 466 35 963 38 049
2015/16
298

Vote 6
51
Table B.3j: Payments and estimates by economic classification: Social Sector Expanded Public Works Programme Incentive: (Early Childhood Development)
Outcome Main appropriation
Adjusted appropriation
Revised estimate Medium-term estimates
R thousand 2012/13 2013/14 2014/15 2016/17 2017/18 2018/19Current payments - - - 1 000 940 940 3 000 - -
Compensation of employees - - - 1 000 870 870 3 000 - - Salaries and wages 1 000 870 870 3 000 - - Social contributions - - - - -
Goods and services - - - - 70 70 - - - Administrative fees - - - - - Advertising - - - - - Minor Assets - - - - - Audit cost: External - - - - - Bursaries: Employees - - - - - Catering: Departmental activities 3 3 - - - Communication (G&S) - - - - - Computer services - - - - - Consultants and professional services: Business and advisory services - - - - -
Consultants and professional services: Infrastructure and planning - - - - -
Consultants and professional services: Laboratory services - - - - -
Consultants and professional services: Scientific and technological services - - - - -
Consultants and professional services: Legal costs - - - - -
Contractors - - - - - Agency and support / outsourced services - - - - - Entertainment - - - - - Fleet services (including government motor transport) - - - - -
Housing - - - - - Inventory: Clothing material and accessories - - - - - Inventory: Farming supplies - - - - - Inventory: Food and food supplies - - - - - Inventory: Fuel, oil and gas - - - - - Inventory: Learner and teacher support material - - - - -
Inventory: Materials and supplies - - - - - Inventory: Medical supplies - - - - - Inventory: Medicine - - - - - Medsas inventory interface - - - - - Inventory: Other supplies - - - - - Consumable supplies - - - - - Consumable: Stationery,printing and office supplies - - - - -
Operating leases - - - - - Property payments - - - - - Transport provided: Departmental activity - - - - - Travel and subsistence - - - - - Training and development 67 67 - - - Operating payments - - - - - Venues and facilities - - - - - Rental and hiring
Interest and rent on land - - - - - - - - - Interest - - - - - - - - Rent on land - - - - - - - - -
Transfers and subsidies to1: - - - - - - - - - Provinces and municipalities - - - - - - - - -
Provinces2
Provincial Revenue Funds - - - - - - - - - Provincial agencies and funds - - - - - - - - -
Municipalities3
Municipalities - - - - - - - - - of which: Regional service council levies
Municipal agencies and fundsDepartmental agencies and accounts - - - - - - - - -
Social security funds - - - - - - - - - Provide list of entities receiving transfers4
Universities and technikonsForeign governments and international organisationsPublic corporations and private enterprises5 - - - - - - - - -
Public corporationsSubsidies on production - - - - - - - - - Other transfers - - - - - - - - -
Private enterprisesSubsidies on production - - - - - - - - - Other transfers - - - - - - - - -
Non-profit institutionsHouseholds - - - - - - - - -
Social benefitsOther transfers to households
Payments for capital assets - - - - 60 60 - - - Buildings and other fixed structures - - - - - - - - -
Buildings - - - - Other fixed structures - - - - - - - -
Machinery and equipment - - - - 60 60 - - - Transport equipment - - - - - - - - - Other machinery and equipment 60 60
Heritage Assets - - - - - - - - - Specialised military assets - - - - - - - - - Biological assets - - - - - - - - - Land and sub-soil assets - - - - - - - - - Software and other intangible assets - - -
Payments for financial assets - - - - - - - - -
Total economic classification: Infrastructure Enhancement Allocation - - - 1 000 1 000 1 000 3 000 - -
2015/16
Vote 6
52
Table B.3k: Payments and estimates by economic classification: Maths, Science & Technology Grant: (Public Ordinary School Education)
Outcome Main appropriation
Adjusted appropriation
Revised estimate Medium-term estimates
R thousand 2012/13 2013/14 2014/15 2016/17 2017/18 2018/19Current payments - - - 32 145 32 145 32 145 24 266 35 963 38 049
Compensation of employees - - - - 750 750 - - - Salaries and wages 750 750 - - - Social contributions - - - - -
Goods and services - - - 32 145 31 395 31 395 24 266 35 963 38 049 Administrative fees 200 35 35 150 150 150 Advertising - - - - - Minor Assets - - - - - Audit cost: External - - - - - Bursaries: Employees - - - - - Catering: Departmental activities 3 400 1 400 1 400 867 1 267 2 267 Communication (G&S) - - - - - Computer services - - 6 633 7 133 7 633 Consultants and professional services: Business and advisory services 800 4 375 4 375 3 420 4 120 3 620
Consultants and professional services: Infrastructure and planning - - - - -
Consultants and professional services: Laboratory services - - - - -
Consultants and professional services: Scientific and technological services - - - - -
Consultants and professional services: Legal costs - - - - -
Contractors - - - - - Agency and support / outsourced services - - - - - Entertainment - - - - - Fleet services (including government motor transport) - - - - -
Housing - - - - - Inventory: Clothing material and accessories - - - - - Inventory: Farming supplies - - - - - Inventory: Food and food supplies - - - - - Inventory: Fuel, oil and gas - - - - - Inventory: Learner and teacher support material 2 800 5 636 5 636 3 968 5 865 6 951
Inventory: Materials and supplies - - - - - Inventory: Medical supplies - - - - - Inventory: Medicine - - - - - Medsas inventory interface - - - - - Inventory: Other supplies 15 000 13 800 13 800 7 378 15 378 15 378 Consumable supplies - - - - - Consumable: Stationery,printing and office supplies -30 - - - -
Operating leases - - - - - Property payments - - - - - Transport provided: Departmental activity 1 100 100 100 - - - Travel and subsistence 3 300 2 325 2 300 1 600 2 000 2 000 Training and development 3 545 2 579 2 579 200 - - Operating payments 1 000 1 075 1 070 - - - Venues and facilities 1 000 100 100 50 50 50 Rental and hiring
Interest and rent on land - - - - - - - - - Interest - - - - - - - - Rent on land - - - - - - - - -
Transfers and subsidies to1: - - - - - - 9 200 - - Provinces and municipalities - - - - - - - - -
Provinces2
Provincial Revenue Funds - - - - - - - - - Provincial agencies and funds - - - - - - - - -
Municipalities3
Municipalities - - - - - - - - - of which: Regional service council levies
Municipal agencies and fundsDepartmental agencies and accounts - - - - - - - - -
Social security funds - - - - - - - - - Provide list of entities receiving transfers4
Universities and technikonsForeign governments and international organisationsPublic corporations and private enterprises5 - - - - - - - - -
Public corporationsSubsidies on production - - - - - - - - - Other transfers - - - - - - - - -
Private enterprisesSubsidies on production - - - - - - - - - Other transfers - - - - - - - - -
Non-profit institutions - - 9 200 - - Households - - - - - - - - -
Social benefits - - - - - Other transfers to households - - - - -
Payments for capital assets - - - - - - - - - Buildings and other fixed structures - - - - - - - - -
Buildings - - - - - - Other fixed structures - - - - - - - - -
Machinery and equipment - - - - - - - - - Transport equipment - - - - - - - - - Other machinery and equipment - - - - -
Heritage Assets - - - - - - - - - Specialised military assets - - - - - - - - - Biological assets - - - - - - - - - Land and sub-soil assets - - - - - - - - - Software and other intangible assets - - -
Payments for financial assets - - - - - - - - -
Total economic classification: Infrastructure Enhancement Allocation - - - 32 145 32 145 32 145 33 466 35 963 38 049
2015/16
VOTE 6 - Department of Education 299
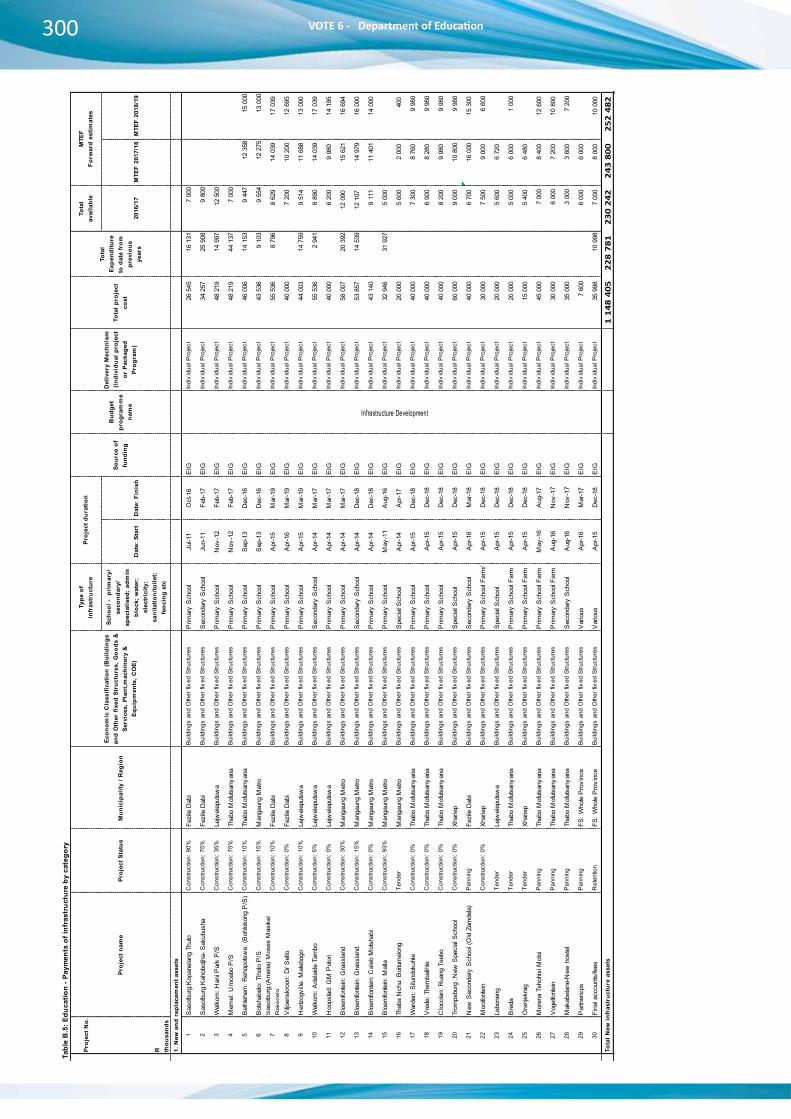
Vote
6
53
Tabl
e B
.5: E
duca
tion
- Pay
men
ts o
f inf
rast
ruct
ure
by c
ateg
ory
Proj
ect N
o.Ty
pe o
f in
fras
truc
ture
Tota
l av
aila
ble
R
thou
sand
s
Scho
ol -
pri
mar
y/
seco
ndar
y/
spec
ialis
ed; a
dmin
bl
ock;
wat
er;
elec
tric
ity;
sani
tatio
n/to
ilet;
fenc
ing
etc
Dat
e: S
tart
Dat
e: F
inis
h20
16/1
7M
TEF
2017
/18
MTE
F 20
18/1
9
1. N
ew a
nd r
epla
cem
ent a
sset
s
1S
asol
burg
:Kop
anel
ang
Thut
oC
onst
ruct
ion:
90%
Fezi
le D
abi
Build
ings
and
Oth
er fi
xed
Stru
ctur
esP
rimar
y S
choo
lJu
l-11
Oct
-16
EIG
Indi
vidu
al P
roje
ct
2
6 54
5
16
131
7 00
0
-
-
2S
asol
burg
:Kah
obot
jha-
Sak
ubus
haC
onst
ruct
ion:
75%
Fezi
le D
abi
Build
ings
and
Oth
er fi
xed
Stru
ctur
esS
econ
dary
Sch
ool
Jun-
11Fe
b-17
EIG
Indi
vidu
al P
roje
ct
3
4 25
7
25
908
9 80
0
-
-
3W
elko
m: H
ani P
ark
P/S
Con
stru
ctio
n: 3
5%Le
jwel
eput
swa
Build
ings
and
Oth
er fi
xed
Stru
ctur
esP
rimar
y S
choo
lN
ov-1
2Fe
b-17
EIG
Indi
vidu
al P
roje
ct
4
8 21
9
14
997
1
2 50
0
-
-
4M
emel
: Um
cebo
P/S
Con
stru
ctio
n: 7
5%Th
abo
Mof
utsa
nyan
aBu
ildin
gs a
nd O
ther
fixe
d St
ruct
ures
Prim
ary
Sch
ool
Nov
-12
Feb-
17E
IGIn
divi
dual
Pro
ject
48
219
4
4 13
7
7
000
-
-
5B
ethl
ehem
: Reh
opot
swe:
(Boh
loko
ng P
/S)
Con
stru
ctio
n: 1
0%Th
abo
Mof
utsa
nyan
aBu
ildin
gs a
nd O
ther
fixe
d St
ruct
ures
Prim
ary
Sch
ool
Sep
-13
Dec
-16
EIG
Indi
vidu
al P
roje
ct
4
6 00
6
14
153
9 44
7
12
358
1
5 00
0
6B
otsh
abel
o: T
lhol
o P
/SC
onst
ruct
ion:
15%
Man
gaun
g M
etro
Build
ings
and
Oth
er fi
xed
Stru
ctur
esP
rimar
y S
choo
lS
ep-1
3D
ec-1
6E
IGIn
divi
dual
Pro
ject
43
536
9 10
3
9
554
1
2 27
5
13
000
7S
asol
burg
:(Am
elia
) Mos
es M
asik
e/
Bek
ezel
aC
onst
ruct
ion:
10%
Fezi
le D
abi
Build
ings
and
Oth
er fi
xed
Stru
ctur
esP
rimar
y S
choo
lA
pr-1
5M
ar-1
9E
IGIn
divi
dual
Pro
ject
55
536
8 79
6
8
629
1
4 03
9
17
039
8V
iljoen
skro
on: D
r Sel
loC
onst
ruct
ion:
0%
Fezi
le D
abi
Build
ings
and
Oth
er fi
xed
Stru
ctur
esP
rimar
y S
choo
lA
pr-1
6M
ar-1
9E
IGIn
divi
dual
Pro
ject
40
000
-
7 2
00
1
0 20
0
12
695
9H
ertz
ogvi
lle: M
aleb
ogo
Con
stru
ctio
n: 1
0%Le
jwel
eput
swa
Build
ings
and
Oth
er fi
xed
Stru
ctur
esP
rimar
y S
choo
lA
pr-1
5M
ar-1
9E
IGIn
divi
dual
Pro
ject
44
003
1
4 75
9
9
514
1
1 68
8
13
000
10W
elko
m: A
dela
ide
Tam
boC
onst
ruct
ion:
5%
Lejw
elep
utsw
aBu
ildin
gs a
nd O
ther
fixe
d St
ruct
ures
Sec
onda
ry S
choo
lA
pr-1
4M
ar-1
7E
IGIn
divi
dual
Pro
ject
55
536
2 94
1
8
890
1
4 03
9
17
039
11H
oops
tad:
GM
Pol
ori
Con
stru
ctio
n: 0
%Le
jwel
eput
swa
Build
ings
and
Oth
er fi
xed
Stru
ctur
esP
rimar
y S
choo
lA
pr-1
4M
ar-1
7E
IGIn
divi
dual
Pro
ject
40
000
-
6 2
00
9 98
0
14
195
12B
loem
font
ein:
Gra
ssla
nd
Con
stru
ctio
n: 3
0%M
anga
ung
Met
roBu
ildin
gs a
nd O
ther
fixe
d St
ruct
ures
Prim
ary
Sch
ool
Apr
-14
Mar
-17
EIG
Indi
vidu
al P
roje
ct
5
8 00
7
20
392
1
2 09
0
15
621
1
6 69
4
13B
loem
font
ein:
Gra
ssla
nd
Con
stru
ctio
n: 1
5%M
anga
ung
Met
roBu
ildin
gs a
nd O
ther
fixe
d St
ruct
ures
Sec
onda
ry S
choo
lA
pr-1
4D
ec-1
8E
IGIn
divi
dual
Pro
ject
53
857
1
4 53
9
12
107
1
4 97
9
16
000
14B
loem
fiont
ein:
Cal
eb M
otsh
abi
Con
stru
ctio
n: 0
%M
anga
ung
Met
roBu
ildin
gs a
nd O
ther
fixe
d St
ruct
ures
Prim
ary
Sch
ool
Apr
-14
Dec
-18
EIG
Indi
vidu
al P
roje
ct
4
3 14
0
-
9
111
11
401
1
4 00
0
15B
loem
font
ein:
Mat
laC
onst
ruct
ion:
93%
Man
gaun
g M
etro
Build
ings
and
Oth
er fi
xed
Stru
ctur
esP
rimar
y S
choo
lM
ay-1
1A
ug-1
6E
IGIn
divi
dual
Pro
ject
32
946
3
1 92
7
5
000
-
-
16Th
aba
Nch
u: B
oitu
mel
ong
Tend
erM
anga
ung
Met
roBu
ildin
gs a
nd O
ther
fixe
d St
ruct
ures
Spe
cial
Sch
ool
Apr
-14
Apr
-17
EIG
Indi
vidu
al P
roje
ct
2
0 00
0
-
5
600
2
000
40
0
17W
arde
n: S
ilund
okuh
leC
onst
ruct
ion:
0%
Thab
o M
ofut
sany
ana
Build
ings
and
Oth
er fi
xed
Stru
ctur
esP
rimar
y S
choo
lA
pr-1
5D
ec-1
8E
IGIn
divi
dual
Pro
ject
40
000
-
7 3
00
8 76
0
9
980
18V
rede
: The
mba
lihle
Con
stru
ctio
n: 0
%Th
abo
Mof
utsa
nyan
aBu
ildin
gs a
nd O
ther
fixe
d St
ruct
ures
Prim
ary
Sch
ool
Apr
-15
Dec
-18
EIG
Indi
vidu
al P
roje
ct
4
0 00
0
-
6
900
8
280
9 9
80
19C
loco
lan:
Rua
ng T
sebo
Con
stru
ctio
n: 0
%Th
abo
Mof
utsa
nyan
aBu
ildin
gs a
nd O
ther
fixe
d St
ruct
ures
Prim
ary
Sch
ool
Apr
-15
Dec
-18
EIG
Indi
vidu
al P
roje
ct
4
0 00
0
-
8
200
9
980
9 9
80
20Tr
omps
burg
:New
Spe
cial
Sch
ool
Con
stru
ctio
n: 0
%Xh
arie
pBu
ildin
gs a
nd O
ther
fixe
d St
ruct
ures
Spe
cial
Sch
ool
Apr
-15
Dec
-18
EIG
Indi
vidu
al P
roje
ct
6
0 00
0
-
9
000
10
800
9 9
80
21N
ew S
econ
dary
Sch
ool (
Old
Zam
dela
)Pa
nnin
gFe
zile
Dab
iBu
ildin
gs a
nd O
ther
fixe
d St
ruct
ures
Sec
onda
ry S
choo
lA
pr-1
6M
ar-1
8E
IGIn
divi
dual
Pro
ject
40
000
-
6 7
00
1
6 00
0
15
300
22M
ooifo
ntei
nC
onst
ruct
ion:
0%
Xhar
iep
Build
ings
and
Oth
er fi
xed
Stru
ctur
esP
rimar
y S
choo
l Far
m/ S
ecA
pr-1
5D
ec-1
8E
IGIn
divi
dual
Pro
ject
30
000
-
7 5
00
9 00
0
6
600
23Le
bone
ngTe
nder
Lejw
elep
utsw
aBu
ildin
gs a
nd O
ther
fixe
d St
ruct
ures
Spe
cial
Sch
ool
Apr
-15
Dec
-18
EIG
Indi
vidu
al P
roje
ct
2
0 00
0
-
5
600
6
720
-
24B
reda
Tend
erTh
abo
Mof
utsa
nyan
aBu
ildin
gs a
nd O
ther
fixe
d St
ruct
ures
Prim
ary
Sch
ool F
arm
Apr
-15
Dec
-18
EIG
Indi
vidu
al P
roje
ct
2
0 00
0
-
5
000
6
000
1 0
00
25O
ranj
ekra
gTe
nder
Xhar
iep
Build
ings
and
Oth
er fi
xed
Stru
ctur
esP
rimar
y S
choo
l Far
mA
pr-1
5D
ec-1
8E
IGIn
divi
dual
Pro
ject
15
000
-
5 4
00
6 48
0
-
26M
oren
a Ts
hohi
si M
oloi
Pann
ing
Thab
o M
ofut
sany
ana
Build
ings
and
Oth
er fi
xed
Stru
ctur
esP
rimar
y S
choo
l Far
mM
ay-1
6A
ug-1
7E
IGIn
divi
dual
Pro
ject
45
000
-
7
000
8 40
0
12
600
27V
ogel
font
ein
Pann
ing
Thab
o M
ofut
sany
ana
Build
ings
and
Oth
er fi
xed
Stru
ctur
esP
rimar
y S
choo
l Far
mA
ug-1
6N
ov-1
7E
IGIn
divi
dual
Pro
ject
30
000
-
6
000
7 20
0
10
800
28M
akab
elan
e-N
ew h
oste
lPa
nnin
gTh
abo
Mof
utsa
nyan
aBu
ildin
gs a
nd O
ther
fixe
d St
ruct
ures
Sec
onda
ry S
choo
lA
ug-1
6N
ov-1
7E
IGIn
divi
dual
Pro
ject
35
000
-
3
000
3 60
0
7
200
29P
artn
ersi
psPa
nnin
gFS
: Who
le P
rovi
nce
Build
ings
and
Oth
er fi
xed
Stru
ctur
esV
ario
usA
pr-1
6M
ar-1
7E
IGIn
divi
dual
Pro
ject
7
600
-
6 0
00
6 00
0
30Fi
nal a
ccou
nts/
fees
Ret
entio
nFS
: Who
le P
rovi
nce
Build
ings
and
Oth
er fi
xed
Stru
ctur
esV
ario
usA
pr-1
5D
ec-1
8E
IGIn
divi
dual
Pro
ject
35
998
1
0 99
8
7
000
8 00
0
10
000
Tota
l New
infr
astr
uctu
re a
sset
s 1
148
405
22
8 78
1
230
242
24
3 80
0
252
482
Proj
ect n
ame
Mun
icip
ality
/ R
egio
n
Econ
omic
Cla
ssifi
catio
n (B
uild
ings
an
d O
ther
fixe
d St
ruct
ures
, Goo
ds &
Se
rvic
es, P
lant
,mac
hine
ry &
Eq
uipm
ents
, CO
E)
Bud
get
prog
ram
me
nam
ePr
ojec
t Sta
tus
Proj
ect d
urat
ion
Sour
ce o
f fu
ndin
g
MTE
FFo
rwar
d es
timat
es
Infrastructure Development
Del
iver
y M
echn
ism
(In
divi
dual
pro
ject
or
Pac
kage
d Pr
ogra
m)
Tota
l pro
ject
co
st
Tota
l Ex
pend
iture
to
dat
e fr
om
prev
ious
ye
ars
Tabc
hap3
2a
VOTE 6 - Department of Education300

Vote
6
54
Tabl
e B
.5: E
duca
tion
- Pay
men
ts o
f inf
rast
ruct
ure
by c
ateg
ory
Proj
ect N
o.Ty
pe o
f inf
rast
ruct
ure
Tota
l av
aila
ble
R
thou
sand
s
Scho
ol -
pri
mar
y/ s
econ
dary
/ sp
ecia
lised
; adm
in b
lock
; wat
er;
elec
tric
ity; s
anita
tion/
toile
t; fe
ncin
g et
c
Dat
e: S
tart
Dat
e: F
inis
h20
16/1
7M
TEF
2017
/18
MTE
F 20
18/1
9
2. U
pgra
des
and
addi
tions
1La
bora
tories
etc.
Vario
usFS
: Who
le Pr
ovinc
eBu
ilding
s an
d O
ther f
ixed
Stru
cture
sLa
bs, M
C, E
tcN
ov-1
5M
ar-1
7EI
GPa
ckag
ed P
roje
cts
179
274
15
457
1
4 50
6
14
869
1
6 45
6
2Ad
mini
strati
on B
locks
Vario
usFS
: Who
le Pr
ovinc
eBu
ilding
s an
d O
ther f
ixed
Stru
cture
sAd
min
Nov
-15
Mar
-17
EIG
Pack
aged
Pro
ject
s
3
92 1
69
3
0 07
2
16
918
1
7 34
1
61
565
3Ad
dition
al cla
ssro
oms
Vario
usFS
: Who
le Pr
ovinc
eBu
ilding
s an
d O
ther f
ixed
Stru
cture
sC
RN
ov-1
5M
ar-1
7EI
GPa
ckag
ed P
roje
cts
299
610
65
540
4
1 85
0
31
388
4
7 52
7
4Ab
lution
Fac
ilities
- Ed
ucato
rs&
Lear
ners
Vario
usFS
: Who
le Pr
ovinc
eBu
ilding
s an
d O
ther f
ixed
Stru
cture
sSa
nitati
onN
ov-1
5M
ar-1
7EI
GPa
ckag
ed P
roje
cts
210
347
31
750
3
3 85
0
25
388
3
2 79
2
5C
onne
ction
to M
unici
pality
Sew
erlin
esVa
rious
FS: W
hole
Prov
ince
Build
ings
and
Othe
r fix
ed S
tructu
res
Con
necti
on to
Mun
icipa
lity
Sew
erlin
esJa
n-15
Mar
-17
EIG
Pack
aged
Pro
ject
s
25 8
56
1
6 42
2
6
811
4 95
4
-
6C
onne
ction
to M
unici
pality
Sew
erlin
esVa
rious
FS: W
hole
Prov
ince
Build
ings
and
Othe
r fix
ed S
tructu
res
Con
necti
on to
Mun
icipa
lity
Sew
erlin
esJa
n-15
Mar
-17
IEA
Pack
aged
Pro
ject
s
-
-
4 1
97
7C
onve
rsitio
n to
Full S
ervi
ceVa
rious
FS: W
hole
Prov
ince
Build
ings
and
Othe
r fix
ed S
tructu
res
Sanit
ation
Apr-1
4M
ar-1
7EI
GPa
ckag
ed P
roje
cts
67
556
-
11
280
8
008
8 0
08
8Sp
ecial
Sch
ools
Vario
usFS
: Who
le Pr
ovinc
eBu
ilding
s an
d O
ther f
ixed
Stru
cture
sSp
ec/S
Nov
-15
Mar
-17
EIG
Pack
aged
Pro
ject
s
44 3
07
3
1 30
7
7
000
3 00
0
3
000
9G
rade
R F
acilit
iesVa
rious
FS: W
hole
Prov
ince
Build
ings
and
Othe
r fix
ed S
tructu
res
Gra
de R
Clas
sroo
ms
Jan-
14M
ar-1
7EI
GPa
ckag
ed P
roje
cts
125
896
43
563
3
8 50
4
28
050
5
1 79
5
10G
rade
R F
acilit
iesVa
rious
FS: W
hole
Prov
ince
Build
ings
and
Othe
r fix
ed S
tructu
res
Gra
de R
Clas
sroo
ms
Jan-
14M
ar-1
7IE
APa
ckag
ed P
roje
cts
-
828
1 9
41
11M
obile
Clas
sroo
ms
Vario
usFS
: Who
le Pr
ovinc
eBu
ilding
s an
d O
ther f
ixed
Stru
cture
sM
obile
Clas
sroo
ms
Jun-
15M
ar-1
7EI
GPa
ckag
ed P
roje
cts
24
100
19
978
4 00
0
4
100
-
12U
nacc
eptab
le str
uctur
esVa
rious
FS: W
hole
Prov
ince
Build
ings
and
Othe
r fix
ed S
tructu
res
Vario
usJu
n-11
Mar
-16
EIG
Pack
aged
Pro
ject
s
56 6
00
2
5 59
7
-
-
-
13N
utritio
n C
entre
sVa
rious
FS: W
hole
Prov
ince
Build
ings
and
Othe
r fix
ed S
tructu
res
Kitch
ens
Nov
-15
Mar
-17
EIG
Pack
aged
Pro
ject
s
1
98 2
18
2
8 53
3
13
401
1
6 08
1
43
353
14Pe
rimetr
e Fe
ncing
Vario
usFS
: Who
le Pr
ovinc
eBu
ilding
s an
d O
ther f
ixed
Stru
cture
sFe
nces
Nov
-15
Mar
-17
EIG
Pack
aged
Pro
ject
s
44 1
98
1
9 77
2
5
815
1
0 61
6
10
616
15Pr
oject
Man
agem
ent fe
es: I
liso
cons
ulting
Vario
usFS
: Who
le Pr
ovinc
eBu
ilding
s an
d O
ther f
ixed
Stru
cture
sVa
rious
Nov
-15
Mar
-17
EIG
Pack
aged
Pro
ject
s
44 4
00
3
1 21
0
4
567
5 48
1
3
882
16Pr
oject
Man
agem
ent fe
es: M
PS C
onsu
lting
Vario
usFS
: Who
le Pr
ovinc
eBu
ilding
s an
d O
ther f
ixed
Stru
cture
sVa
rious
Nov
-15
Mar
-17
EIG
Pack
aged
Pro
ject
s
3
433
4 11
9
2
918
17Bl
oem
fontei
n: E
urek
a H
ostel
: Exa
m P
rintin
gTe
nder
Man
gaun
g M
etro
Build
ings
and
Othe
r fix
ed S
tructu
res
Upg
rade
of fa
cilitie
sJu
n-14
Mar
-18
IEA
Pack
aged
Pro
ject
s
29 8
63
-
5 0
00
7 00
0
9
100
18H
alls
Vario
usFS
: Who
le Pr
ovinc
eBu
ilding
s an
d O
ther f
ixed
Stru
cture
sH
alls
Nov
-15
Mar
-17
EIG
Pack
aged
Pro
ject
s
1
90 5
00
8 20
4
-
-
19Al
terna
tive
Elec
trical
supp
lyVa
rious
FS: W
hole
Prov
ince
Build
ings
and
Othe
r fix
ed S
tructu
res
Elec
tricity
Sup
plyN
ov-1
5M
ar-1
7EI
GPa
ckag
ed P
roje
cts
15
000
2
632
3 81
6
20Pr
ovin
cial
Sch
ool W
ater
& S
anita
tion
Prog
ram
me
Vario
usFS
: Who
le Pr
ovinc
eBu
ilding
s an
d O
ther f
ixed
Stru
cture
sW
ater &
San
itatio
nN
ov-1
5M
ar-1
7EI
GPa
ckag
ed P
roje
cts
15
000
2
632
4 21
1
21Pa
rtner
ships
: Kag
iso T
rust
Vario
usFS
: Who
le Pr
ovinc
eBu
ilding
s an
d O
ther f
ixed
Stru
cture
sAd
min
Nov
-15
Mar
-17
EIG
Pack
aged
Pro
ject
s
26 7
00
1 70
0
20
000
5 00
0
22Pa
rtner
ships
: Kag
iso T
rust
Vario
usFS
: Who
le Pr
ovinc
eBu
ilding
s an
d O
ther f
ixed
Stru
cture
sC
lassr
oom
sN
ov-1
5M
ar-1
7EI
GPa
ckag
ed P
roje
cts
42
500
2
500
2
0 00
0
20
000
23Pa
rtner
ships
: Kag
iso T
rust
Vario
usFS
: Who
le Pr
ovinc
eBu
ilding
s an
d O
ther f
ixed
Stru
cture
sH
alls
Nov
-15
Mar
-17
EIG
Pack
aged
Pro
ject
s
1
14 2
23
8
5 22
3
20
000
2
9 00
0
24Pa
rtner
ships
: Kag
iso T
rust-
Shan
duka
Vario
usFS
: Who
le Pr
ovinc
eBu
ilding
s an
d O
ther f
ixed
Stru
cture
sVa
rious
Nov
-15
Mar
-17
EIG
Pack
aged
Pro
ject
s
1
00 0
00
7
5 37
2
42
000
1
6 00
0
20
000
25Ko
ffiefon
tein:
ERC
& D
istric
t War
ehou
seTe
nder
Xhar
iepBu
ilding
s an
d O
ther f
ixed
Stru
cture
sU
pgra
de o
f ERC
& W
areh
ouse
Jun-
15De
c-16
IEA
Indi
vidu
al P
roje
ct
3 3
00
-
5
00
1 15
0
650
26Te
mpe
War
ehou
seTe
nder
Man
gaun
g M
etro
Build
ings
and
Othe
r fix
ed S
tructu
res
Upg
radin
g of
roof
& str
uctur
eAp
r-16
Mar
-18
IEA
Indi
vidu
al P
roje
ct
4 5
00
-
5
00
1 25
0
750
27W
elkom
: Upg
radin
g of
Kopa
no C
omple
xC
onst
ruct
ion
Lejw
elepu
tswa
Build
ings
and
Othe
r fix
ed S
tructu
res
Upg
radin
g of
the o
ffices
Jun-
14De
c-18
IEA
Indi
vidu
al P
roje
ct
3 2
50
-
5
00
1 10
0
600
28Q
waq
wa:
Tsh
iya
ERC
Tend
erTh
abo
Mofu
tsany
ana
Build
ings
and
Othe
r fix
ed S
tructu
res
Upg
radin
g of
ERC
Apr-1
6M
ar-1
8IE
AIn
divi
dual
Pro
ject
1
100
-
Tota
l Upg
rade
s an
d ad
ditio
ns2
258
467
53
2 20
0
319
896
26
2 74
9
314
953
Proj
ect n
ame
Mun
icip
ality
/ Re
gion
Econ
omic
Cla
ssifi
catio
n (B
uild
ings
an
d O
ther
fixe
d St
ruct
ures
, Goo
ds &
Se
rvic
es, P
lant
,mac
hine
ry &
Eq
uipm
ents
, CO
E)
Bud
get
prog
ram
me
nam
ePr
ojec
t Sta
tus
Proj
ect d
urat
ion
Sour
ce o
f fu
ndin
g
MTE
FFo
rwar
d es
timat
es
Infrastructure Development
Del
iver
y M
echn
ism
(In
divi
dual
pro
ject
or
Pack
aged
Pro
gram
)
Tota
l pro
ject
co
st
Tota
l Ex
pend
iture
to
dat
e fr
om
prev
ious
ye
ars
VOTE 6 - Department of Education 301

Vote
6
55
Tabl
e B.
5: E
duca
tion
- Pay
men
ts o
f inf
rast
ruct
ure
by c
ateg
ory
Proj
ect N
o.Ty
pe o
f in
frast
ruct
ure
Tota
l av
aila
ble
R thou
sand
s
Scho
ol -
prim
ary/
se
cond
ary/
sp
ecia
lised
; adm
in
bloc
k; w
ater
; el
ectri
city
; sa
nita
tion/
toile
t; fe
ncin
g et
c
Date
: Sta
rtDa
te: F
inis
h20
16/1
7M
TEF
2017
/18
MTE
F 20
18/1
9
3. R
ehab
ilita
tion,
reno
vatio
ns a
nd re
furb
ishm
ents
1H
ostel
sVa
rious
FS: W
hole
Prov
ince
Build
ings
and
Othe
r fix
ed S
tructu
res
Hos
tels
Nov
-15
Mar
-18
EIG
Pack
aged
Pro
jects
208
576
2
2 71
3
39
622
2
0 66
8
17
586
2Re
nova
tions
Vario
usFS
: Who
le Pr
ovinc
eBu
ilding
s an
d O
ther f
ixed
Stru
cture
sRe
nova
tions
Nov
-15
Mar
-18
EIG
Pack
aged
Pro
jects
737
216
1
1 45
3
57
345
6
1 37
6
58
009
3Re
nova
tions
Vario
usFS
: Who
le Pr
ovinc
eBu
ilding
s an
d O
ther f
ixed
Stru
cture
sRe
nova
tions
Nov
-15
Mar
-17
EPW
PPa
ckag
ed P
roje
cts
3 00
0
4Pa
rtner
shi[p
sVa
rious
FS: W
hole
Prov
ince
Build
ings
and
Othe
r fix
ed S
tructu
res
Reno
vatio
nsN
ov-1
5M
ar-1
7EI
GPa
ckag
ed P
roje
cts
9 80
0
9
800
5M
ath L
abs
Vario
usFS
: Who
le Pr
ovinc
eBu
ilding
s an
d O
ther f
ixed
Stru
cture
sM
ath L
abs
Aug-
12M
ar-1
7EI
GPa
ckag
ed P
roje
cts
35
2 26
3
115
120
7 23
2
21
550
-
6M
ath L
abs
Vario
usFS
: Who
le Pr
ovinc
eBu
ilding
s an
d O
ther f
ixed
Stru
cture
sM
ath L
abs
Aug-
12M
ar-1
7IE
APa
ckag
ed P
roje
cts
-
-
-
-
7St
orm
dam
ages
Va
rious
FS: W
hole
Prov
ince
Build
ings
and
Othe
r fix
ed S
tructu
res
Vario
usN
ov-1
5M
ar-1
8EI
GPa
ckag
ed P
roje
cts
3
0 28
7
9
242
7 00
0
8
000
8 0
00
8Fa
rm s
choo
ls- R
efurb
ishm
ents
Vario
usFS
: Who
le Pr
ovinc
eBu
ilding
s an
d O
ther f
ixed
Stru
cture
sVa
rious
Nov
-15
Mar
-18
EIG
Pack
aged
Pro
jects
24
543
3 18
2
4
749
6 97
1
7
145
9Fa
cilitie
s M
anag
emen
tVa
rious
FS: W
hole
Prov
ince
Build
ings
and
Othe
r fix
ed S
tructu
res
Vario
usN
ov-1
5M
ar-1
8EI
GPa
ckag
ed P
roje
cts
2
7 70
0
4
236
1 73
3
7
500
9 3
75
10Fa
cilitie
s M
anag
emen
tVa
rious
FS: W
hole
Prov
ince
Build
ings
and
Othe
r fix
ed S
tructu
res
Vario
usN
ov-1
5M
ar-1
7EP
WP
Pack
aged
Pro
jects
2 56
7
11C
oney
Islan
d: F
encin
gTe
nder
Fezil
e Da
biBu
ilding
s an
d O
ther f
ixed
Stru
cture
sFe
ncing
& P
arkin
gJu
n-16
Mar
-17
IEA
Indiv
idua
l Pro
ject
700
30
0
400
12Q
waq
wa:
Ex
Parlia
men
t Buil
ding
Tend
erTh
abo
Mofu
tsany
ana
Build
ings
and
Othe
r fix
ed S
tructu
res
Roofi
ng a
nd in
stalla
tion
of the
plan
tJu
n-14
Mar
-18
IEA
Indiv
idua
l Pro
ject
2
300
1 20
0
750
5
0
13Q
waq
wa:
Wits
iesho
ek P
rimar
yTe
nder
Thab
o M
ofutsa
nyan
aBu
ilding
s an
d O
ther f
ixed
Stru
cture
sEl
ectric
al su
pply
&
park
ingJu
n-14
Oct-
17IE
AIn
divid
ual P
roje
ct
1 55
0
51
1 00
0
50
14Be
thleh
em: D
istric
t Offic
ePl
annin
gTh
abo
Mofu
tsany
ana
Build
ings
and
Othe
r fix
ed S
tructu
res
Reno
vatio
nsAp
r-16
Jun-
17IE
AIn
divid
ual P
roje
ct
80
0
600
-
15Sa
solbu
rg D
istric
t offic
ePl
annin
gFe
zile
Dabi
Build
ings
and
Othe
r fix
ed S
tructu
res
Roofi
ng a
nd P
aintin
gAp
r-16
Jun-
17IE
AIn
divid
ual P
roje
ct
65
0
650
-
Tota
l Reh
abili
tatio
n, re
nova
tions
and
refu
rbis
hmen
ts
1 39
9 38
5
175
797
12
2 74
8
128
514
10
0 16
5
4. M
aint
enan
ce a
nd re
pairs
1Da
y to
day
/ Gen
eral
main
tenan
ce
(Sch
ools)
Vario
usFS
: Who
le Pr
ovinc
eBu
ilding
s an
d O
ther f
ixed
Stru
cture
sM
ainte
nace
& re
pairs
to
facil
ities
Apr-1
5M
ar-1
8EI
GPa
ckag
ed P
roje
cts
9
5 84
4
36
713
1
0 00
0
12
000
1
5 00
0
2Da
y to
day
/ Gen
eral
main
tenan
ce
(Buil
dings
)Va
rious
FS: W
hole
Prov
ince
Build
ings
and
Othe
r fix
ed S
tructu
res
Mai
ntena
ce &
repa
irs
to fa
cilitie
sAp
r-15
Mar
-18
IEA
Pack
aged
Pro
jects
11
425
1 01
8
2
000
2 50
0
3
125
Tota
l Mai
nten
ance
and
repa
irs10
7 26
9
37
731
12
000
14
500
18 1
25
5.
Infra
stru
ctur
e tra
nsfe
rs -
curr
ent
1No
ne
Tota
l Inf
rast
ruct
ure
trans
fers
- cu
rren
t
6. In
frast
ruct
ure
trans
fers
- ca
pita
l
1No
ne
Tota
l Inf
rast
ruct
ure
trans
fers
- ca
pita
l
TOTA
L IN
FRA
STRU
CTU
RE4
913
526
74
5 72
8
684
886
64
9 56
3
685
725
Proj
ect n
ame
Mun
icip
ality
/ Re
gion
Econ
omic
Cla
ssifi
catio
n (B
uild
ings
an
d Ot
her f
ixed
Stru
ctur
es, G
oods
&
Serv
ices
, Pla
nt,m
achi
nery
&
Equi
pmen
ts, C
OE)
Budg
et
prog
ram
me
nam
ePr
ojec
t Sta
tus
Proj
ect d
urat
ion
Sour
ce o
f fu
ndin
g
MTE
FFo
rwar
d es
timat
es
Infrastructure Development
Infra
struc
ture
Deve
lopm
ent
Deliv
ery
Mec
hnis
m
(Indi
vidu
al p
roje
ct
or P
acka
ged
Prog
ram
)
Tota
l pro
ject
co
st
Tota
l Ex
pend
iture
to
dat
e fro
m
prev
ious
ye
ars
VOTE 6 - Department of Education302

Vote
6
56
Tabl
e B.5:
Edu
catio
n - P
ayme
nts o
f inf
rast
ruct
ure b
y cat
egor
y
Proj
ect N
o.Ty
pe o
f inf
rast
ruct
ure
Tota
l ava
ilabl
e
R thou
sand
s
Scho
ol -
prim
ary/
seco
ndar
y/ sp
ecial
ised;
ad
min
bloc
k; w
ater
; ele
ctric
ity;
sani
tatio
n/to
ilet;
fenc
ing
etc
Date
: Sta
rtDa
te: F
inish
2016
/17MT
EF 20
17/18
MTEF
2018
/19
7. No
n In
frast
ruct
ure
1HR
Cap
icitiat
ion -
COE
N/A
FS: W
hole
Prov
ince
CoE
Salar
ies &
Wag
esAu
g-12
Mar-1
7EI
GInf
rastr
uctur
e De
velop
men
tN/A
32 31
7
7 5
79
20 0
00
21
000
2
2 050
2Inv
entor
y: Sc
hool
Furn
iture
N/A
FS: W
hole
Prov
ince
Furn
iture
& eq
uipme
ntSc
hool
furnit
ure
Apr-1
4Ma
r-17
EIG
Infra
struc
ture
Deve
lopm
entN/
A
42
000
27
126
7 000
7 35
0
7
718
3Inv
entor
y: IT
Equ
ipmen
tN/
AFS
: Who
le Pr
ovinc
eIT
Equ
ipmen
tIT
Equ
ipmen
tNo
v-15
Mar-1
7EI
GInf
rastr
uctur
e De
velop
men
tN/A
1 0
00
-
1 00
0
-
-
Non
Infra
stru
ctur
e
7
5 317
34 7
05
2
8 000
28 3
50
2
9 768
TOTA
L IN
FRAS
TRU
CTU
RE &
NO
N-IN
FRAS
TRU
CTU
RE4
988
843
78
0 43
3
712
886
67
7 91
3
715
492
MTEF
Forw
ard
estim
ates
Deliv
ery M
echn
ism
(Indi
vidua
l pro
ject o
r Pa
ckag
ed P
rogr
am)
Tota
l pro
ject c
ost
Tota
l Ex
pend
iture
to
date
from
pr
evio
us ye
ars
Proj
ect n
ame
Muni
cipali
ty / R
egio
n
Econ
omic
Clas
sifica
tion
(Bui
ldin
gs an
d Ot
her f
ixed
Stru
ctur
es, G
oods
&
Serv
ices,
Plan
t,mac
hine
ry &
Equ
ipme
nts,
COE)
Budg
et
prog
ramm
e na
mePr
ojec
t Sta
tus
Proj
ect d
urat
ion
Sour
ce o
f fu
ndin
g
VOTE 6 - Department of Education 303

NOTES
304