voter partisanship and the effect of distributive spending
TRANSCRIPT

Voter Partisanship and the Effect of DistributiveSpending on Political Participation
Jowei Chen University of Michigan
Do distributive benefits increase voter participation? This article argues that the government delivery of distributive aidincreases the incumbent party’s turnout but decreases opposition-party turnout. The theoretical intuition here is thatan incumbent who delivers distributive benefits to the opposing party’s voters partially mitigates these voters’ ideologicalopposition to the incumbent, hence weakening their motivation to turn out and oust the incumbent. Analysis of individual-level data on FEMA hurricane disaster aid awards in Florida, linked with voter-turnout records from the 2002 (pre-hurricane) and 2004 (post-hurricane) elections, corroborates these predictions. Furthermore, the timing of the FEMA aiddelivery determines its effect: aid delivered during the week just before the November 2004 election had especially largeeffects on voters, increasing the probability of Republican (incumbent party) turnout by 5.1% and decreasing Democratic(opposition party) turnout by 3.1%. But aid delivered immediately after the election had no effect on Election Day turnout.
Do government distributive benefits increasevoter turnout? Scholars have long argued thatnon-means-tested entitlement programs cause
increased turnout among their beneficiaries. For exam-ple, the recipients of agricultural subsidies (Wolfingerand Rosenstone 1980), Social Security (Campbell 2002),and Medicare and veterans’ benefits (Mettler andStonecash 2008; Verba et al. 1993) exhibit higher turnoutrates than nonrecipients. At the aggregate level, countiesand congressional districts respond to increased distribu-tive spending with higher turnout (Ansolabehere andSnyder 2006; Matsubayashi and Wu 2009). A commonlyhypothesized explanation for this positive turnout effectis Lipset’s classic argument that one’s decision to turn outdepends upon the perceived “relevance of governmentpolicies to the individual” (1960, 190). Under this the-ory, as articulated by subsequent scholars (e.g., Campbell2002; Wolfinger and Rosenstone 1980), the delivery ofdistributive benefits motivates recipients to protect their
Jowei Chen is Assistant Professor of Political Science and Faculty Associate, Center for Political Studies, University of Michigan, 5700Haven Hall, 505 South State Street, Ann Arbor, MI ([email protected]).
I acknowledge the Hurricane Research Division of the Atlantic Oceanographic and Meteorological Laboratory (AOML), a Facility of theNational Oceanic and Atmospheric Administration (NOAA), for assistance with the hurricane surface-wind analysis data. I gratefullyacknowledge John Guthrie and Matthew Dutton of the Florida Senate Committee on Reapportionment for their generous assistance withprecinct-level GIS shapefiles and election results. I thank staff members of the Gannett Company, the Federal Emergency ManagementAgency, and the United States Court of Appeals for the Eleventh Circuit for facilitating release of the FEMA disaster assistance data. I thankChuck Shipan, Skip Lupia, Andrew Gelman, Karen Long Jusko, Keith Krehbiel, David Laitin, Daniel Butler, Claire Adida, Ken Shotts, BradGomez, and Jason Barabas for valuable comments on earlier drafts. Previous versions of this article were presented at the American PoliticsWorkshop at the University of Virginia and at the Political Economy Workshop at the University of Chicago Harris School. Replicationdata and code for the individual- and precinct-level results reported in this article are online at http://www.umich.edu/∼jowei/fema.
stake in these spending programs by participating in pol-itics through voting.
However, there is reason to question whether thispositive relationship between distributive benefits andturnout should hold for all voters, regardless of their par-tisanship. A voluminous literature on political behavior,beginning with The American Voter, argues that voters’responses to political events are conditioned by their par-tisanship. Voters’ partisan identification serves as a “per-ceptual screen through which the individual tends to seewhat is favorable to his partisan orientation” (Campbellet al. 1960, 133). Partisanship affects voters’ subjectivejudgments, such as their approval of presidential perfor-mance (Bartels 2002), as well as objective evaluations,such as assessments of the economy (Gerber and Huber2009, 2010).
This article draws upon the political participa-tion theory described by Lipset (1960), Wolfinger andRosenstone (1980), and Campbell (2002), revising and
American Journal of Political Science, Vol. 00, No. 0, xxx 2012, Pp. 1–18
C© 2012, Midwest Political Science Association DOI: 10.1111/j.1540-5907.2012.00613.x
1

2 JOWEI CHEN
extending this classic theory to account for voters’ parti-san biases in their retrospective evaluations. This article’stheory preserves these authors’ original intuition that therecipients of distributive benefits are motivated to vote inorder to protect their future benefits. But the theory alsorevises this argument by accounting for voters’ partisanbiases in deciding whether to turn out. The theory pre-dicts that distributive spending can affect voter turnoutin opposite directions, depending on the voter’s parti-sanship: voters who share the incumbent’s partisanshiprespond to benefits with increased turnout. But voterswho align with the challenger’s party respond to benefitswith decreased turnout.
The intuition behind this asymmetric result is as fol-lows. Each voter has an ideological preference for eitherthe left- or right-wing party, but voters also generallyprefer politicians who prioritize the delivery of distribu-tive benefits. Hence, a voter who receives benefits froma same-party incumbent will respond with increasedturnout in order to enhance the probability of reelect-ing the incumbent. By contrast, a voter who identifieswith the challenger’s party prefers to expel the incumbentfor ideological reasons. But if the incumbent delivers ben-efits to this opposite-party voter, the voter may respondby not turning out to vote, as the incumbent’s distributivegenerosity has mitigated the voter’s motivation to oustthe incumbent.
Borrowing from the retrospective voting literature(e.g., Ferejohn 1986; Fiorina 1981), this article’s theoryconsiders voters who retrospectively judge the incum-bent’s distributive policy. The voter observes the incum-bent’s disaster aid policy and evaluates the incumbent’sprioritization of disaster aid. Hence, an incumbent whodelivers pre-election aid develops a reputation as beinglikely to deliver such aid in the future, thus enhancingher favorability among voters regardless of partisanship.If the incumbent is right-wing, then this enhanced rep-utation may convince a left-wing voter to simply abstainfrom voting, as the incumbent’s superior record on dis-aster aid has weakened the voter’s overall aversion to theincumbent and motivation to oust her.
Empirically, this article tests these theoretical pre-dictions using detailed records of 1.1 million householdsthat applied for Federal Emergency Management Agency(FEMA) disaster assistance during the summer 2004 hur-ricane season, just prior to the November 2004 pres-idential election. I linked these FEMA applications toFlorida voter registration and past turnout records. Bycomparing individual voters’ turnout in the 2002 (pre-hurricane) and 2004 (post-hurricane) elections, I findthat the awarding of FEMA aid increases Republican (in-cumbent party) voters’ turnout while decreasing Demo-
cratic (challenger party) turnout in November 2004. I alsoanalyze FEMA aid awarded at the voting precinct level,finding that the awarding of FEMA aid causes a statisti-cally significant increase in President Bush’s vote share inNovember 2004.
Exploiting variation in the timing of the delivery ofFEMA aid helps to establish the causal direction of this ef-fect. First, FEMA awards delivered in the week just beforethe November 2004 election had an abnormally large ef-fect, increasing the probability of Republican (incumbentparty) turnout by 5.1% and decreasing Democratic (op-position party) turnout by 3.1%. Second, several placebotests investigate whether FEMA aid delivered immediatelyafter the November 2004 election is statistically related toElection Day turnout. The placebo tests find that post-election aid has no effect on Election Day turnout. Hence,the analysis of pre- and post-election aid supports thecausal argument that FEMA aid affects voter turnout, notvice versa.
This article proceeds as follows. The first section in-tuitively describes the article’s theory and explains thetwo testable predictions of this theory concerning theeffect of disaster aid on voter behavior. The online ap-pendix presents a formal model of this theory. The sec-ond section describes the process by which FEMA dis-tributed disaster aid to hurricane victims in 2004. Thethird section conducts several tests of the formal model’spredictions using individual-level data on FEMA aidapplications, linked to individual voter-turnout recordsand precinct-level election results. The final section ad-dresses the causal direction of the finding and robustnesschecks.
A Theory of Disaster Aid and VoterTurnout
This section intuitively presents this article’s theory andexplains the two testable predictions of the theory. Ad-ditionally, the online appendix presents a more detailedformal model that derives these two predictions. Becauseof space constraints, this section simply summarizes thekey features and assumptions of the model and informallyexplains the intuitive logic of the theory.
Politicians’ Ideologies and Types
To set up the theory, suppose the incumbent presi-dent is ideologically right-wing, and the challenger can-didate is left-wing. This illustrative setup mirrors the

DISTRIBUTIVE SPENDING AND POLITICAL PARTICIPATION 3
empirical context of this article, which examines the 2004election with a Republican incumbent and a Democraticchallenger.
The theory considers two types of politicians: thosewho prioritize disaster aid and those who do not. A presi-dent might not prioritize disaster aid because she insteadfocuses her attention and public resources on other pol-icy issues. The full formal model assumes that Naturerandomly chooses each politician’s type, and these twopolitician types are distinguished by their utility prefer-ences over delivering disaster aid. A politician’s type isindependent of her ideology.
Voters do not become aware of a politician’s type un-til they observe the president making a policy choice ondisaster aid. Hence, having observed the incumbent inoffice during the previous term, voters develop certaintyabout the incumbent’s type, but they remain uncertainabout the challenger’s type. As an illustrative example,voters might have been uncertain about President Bush’stype prior to September 2005. But after the intense publicscrutiny of FEMA’s response to Hurricane Katrina, votersupdated their beliefs and developed stronger and morespecific views about the Bush administration’s prioritiza-tion of hurricane relief efforts. In this sense, an incumbentwith a reputation for delivering disaster aid enjoys a “va-lence advantage,” independent of voters’ preferences overcandidates on the ideological dimension, as modeled byGroseclose (2001).
Voter Interests
Following Dixit and Londregan (1996), Persson andTabellini (2000), Stokes (2005), and other models of dis-tributive politics, the theory assumes that voters have ide-ological preferences as well as a preference for receivingdistributive benefits. Second, the act of turnout is costlyfor voters (e.g., Aldrich 1993). Hence, a voter turns outonly if her preference for her favored candidate is suffi-ciently strong.
Consequently, the delivery of hurricane aid to thevoter prior to the election can affect voter behavior inone of three ways. If the voter has a strong ideologicalpreference for the incumbent, then delivering aid prior tothe election may further motivate the voter to turn outin order to secure the incumbent’s reelection. If the voterhas a strong ideological preference for the challenger, thenpre-election aid from the incumbent may induce the voterto stay home by mitigating the voter’s hostility towardthe incumbent. And finally, if the voter is ideologicallyindifferent between the two candidates, then the deliveryof aid might sway the voter’s preference.
The Asymmetric Partisan Effects of DisasterAid on Turnout
Regardless of voter ideology, the delivery of pre-electiondisaster aid is an informative signal that enhances thevoter’s belief that the incumbent will again deliver aid inthe future. Hence, this enhanced belief always increasesthe voter’s expected utility from having the incumbentreelected.
Whether this enhanced belief increases or decreasesturnout depends on the voter’s ideological preferenceover the two candidates. If the voter is right-wing andalready prefers the incumbent on ideological grounds,then this enhanced belief induced by disaster aid simplyprovides yet an additional motivation to turn out andreelect the incumbent, thus increasing the probability ofturnout.
But disaster aid would have the opposite effect onturnout for a left-wing voter. If she turns out, the left-wing voter always prefers the left-wing challenger candi-date on ideological grounds. Hence, the left-wing voter’sprobability of turnout depends on how strongly sheprefers the challenger over the incumbent. The deliv-ery of pre-election disaster aid to the left-wing voterenhances the voter’s perception of the incumbent, thusmitigating the voter’s motivation to oust the incumbent.This decreased motivation to vote the incumbent outof office decreases the left-wing aid recipient’s proba-bility of turnout. This theory thus makes the followingprediction:
Hypothesis 1: The delivery of disaster aid prior to the elec-tion causes an increase in turnout for an incumbent-supporting recipient but a decrease in turnout for achallenger-supporting recipient.
This hypothesis is stated formally as Proposition 1 inthe formal model in the online appendix.
The Effects of Disaster Aid on theIncumbent’s Vote Share
In Hypothesis 1, the delivery of aid increases incumbentsupporters’ turnout while decreasing opposition turnout.Furthermore, as noted above, conditional on turning out,the partisan left-wing and right-wing voters support thechallenger and the incumbent in the election, respec-tively. Hence, disaster aid causes either an increase in theincumbent’s vote totals or a decrease in the challenger’svote totals, depending on whether the voter is left- orright-wing. In either case, the net effect on the incum-bent’s vote share is therefore always a positive one, a result

4 JOWEI CHEN
consistent with previous empirical findings in the dis-aster relief literature (e.g., Reeves 2011). Hypothesis 2summarizes this testable prediction:
Hypothesis 2: The delivery of disaster aid prior to the elec-tion causes an increase in the incumbent candidate’selectoral vote share.
The following section describes the context of theFEMA disaster aid data, and these data are used to testthe two predictions of the theory. This article focusesprimarily on testing Hypothesis 1, while Hypothesis 2 istested in the Alternative Causal Explanations section.
The Distribution of FEMA DisasterAid
This section describes three important characteristics ofFEMA disaster aid.
Presidential Disaster Declarations
First, residents of all 67 counties in Florida were eligi-ble to apply for FEMA aid. In the 12 weeks prior tothe November 2004 presidential election, Florida wasstruck by four hurricanes of at least Category II strength.Hurricanes Charley (Category IV), Frances (Category II),Ivan (Category III), and Jeanne (Category III) made land-fall throughout Florida, prompting President Bush to is-sue disaster declarations, with eligibility for individualdisaster aid, for all 67 of Florida’s counties during the2004 hurricane season.
Hence, consistent with previous literature on presi-dents’ disaster responses, the distribution of FEMA aiddoes not manifest from any strategic county-level target-ing of presidential disaster declarations within Florida.Reeves (2011) finds that the president is more likelyto issue disaster declarations in states that are elec-torally competitive, while Garrett and Sobel (2002) andDownton and Pielke (2001) observe a spike in decla-rations during election years. Both of these conditionsapply to this study: the FEMA aid analyzed in this arti-cle was delivered just prior to the November 2004 elec-tion, and Florida was a competitive swing state in boththe 2000 and 2004 presidential contests. The fact thatall 67 Florida counties were declared eligible for individ-ual aid is therefore consistent with past studies’ findingson the targeting of disaster declarations across differentstates.
The Universal Nature of FEMA Aid
Second, FEMA distributed hurricane disaster aid througha universal, non-means-tested program. After PresidentBush’s disaster declarations, Florida residents were el-igible to apply for aid under FEMA’s Individuals andHouseholds Program (IHP). Officially, IHP, authorizedby the Stafford Act of 1988 (P.L. 93–288) and the Disas-ter Mitigation Act of 2000 (P.L. 106–390), provides up to$25,000 of assistance to victimized households to pay for“necessary expenses and serious needs” not covered byinsurance (44 C.F.R. § 206.110a). FEMA most frequentlyawards IHP aid to households to fund temporary hous-ing, to repair damaged residences, to replace damagedproperty, such as furniture and electronics, and to pay formedical, funeral, and other personal expenses caused bythe hurricanes.
Disaster aid under IHP cannot be awarded or re-stricted on the basis of residents’ income, a statutory man-date codified in 42 USC § 5163 and 42 USC § 5174(b)(1)and implemented in 44 C.F.R. § 206.113. Instead, the pri-mary restrictions are that IHP aid only covers inspector-verified damage at an applicant’s primary residence,FEMA awards may not duplicate insurance payouts, andhouseholds may not receive more than $25,000 in to-tal aid. In particular, the prohibition against duplicatinginsurance payouts had the effect of disqualifying manywealthier homeowners from receiving some categories ofFEMA aid. Nevertheless, many households with flood in-surance still qualified for FEMA aid to cover uninsuredpossessions and expenses.
The universal nature of FEMA disaster aid is animportant distinction, given the previous literature onturnout. Scholars of political participation have foundthat social spending programs mobilize voter turnoutonly when benefits are distributed under universal,non-means-tested programs (e.g., Mettler 2005; Verba,Schlozman, and Brady 1995). For example, Mettler andStonecash (2008) find that the beneficiaries of universalprograms such as Veterans Benefits and Medicare voteat higher rates than nonbeneficiaries. By contrast, Soss(1999, 2002) and Bruch, Ferree, and Soss (2009) find thatmeans-tested welfare programs stigmatize voters, thuspossibly discouraging them from political participation.
Hence, this existing literature suggests that FEMAdisaster aid, which is universally available to hurricanevictims regardless of their income status, might mobi-lize recipients to vote in order to protect potential aid inthe future. Although voters cannot directly control theamount of aid delivered in the future, they can at leastmobilize to reelect a politician with a past history of sup-porting disaster relief policies. This article contributes to

DISTRIBUTIVE SPENDING AND POLITICAL PARTICIPATION 5
the past literature by explaining why this mobilizationlogic is conditional on recipients’ ideological proximityto the incumbent government: the delivery of benefitsby a Republican administration to Republican recipientsshould indeed mobilize their turnout. But the delivery ofbenefits by a Republican administration to Democraticrecipients may induce a decrease in their turnout, as therecipients’ stake in protecting their benefits decreases theirmotivation to oust the Republican incumbent.
The FEMA Aid Decision Process
Residents self-select into applying for IHP aid simply byproviding their names and contact information to FEMAin person, by telephone, or through FEMA’s website. Al-though applicants may describe the hurricane damage totheir property, they are not permitted to request a spe-cific aid amount. Nor does an applicant’s description ofdamage either limit or enhance the amount of aid his orher household is eligible to receive.
Instead, a FEMA inspector visits each applicant’s res-idence to complete a checklist of damaged property andto estimate the severity of any such damages. By protocol,FEMA personnel check for a standard list of damaged ar-eas in each home, regardless of whether the applicant hadreported damages in such areas. Specifically, the FEMAinspector assigns a score of “X,” “Y,” or “Z” to each roomand each area of the residence, indicating the severity ofthe hurricane damage. For each particular type of room(e.g., kitchen, living room) and for a particular level ofdamage (“X,” “Y,” or “Z”), FEMA awards a predeterminedamount of assistance, regardless of the actual value of theapplicant’s pre-hurricane property. Hence, the applicanthas no formal opportunities to strategically manipulatethe FEMA aid process by exaggerating the severity of hur-ricane damage.
In the aftermath of the 2004 Florida hurricanes,FEMA received applications for IHP aid from 1.1 mil-lion unique households. FEMA approved aid awards forabout 40% of these applications, distributing over $1.2billion in total assistance. The size of these awards variedwidely, ranging from under $100 to $25,000, dependingupon the FEMA inspectors’ assessments of damages. Fig-ure App.1 of the online appendix details the distributionof these awards.
By requiring inspectors to check for residential dam-age, FEMA’s inspection procedures effectively distributedIHP disaster aid most heavily to areas that experiencedthe most severe hurricane storms. This geographic pat-tern is illustrated in Figure App.2 of the online appendix,which depicts the maximum wind speeds observed dur-
ing Hurricane Charley, the first declared disaster of the2004 Atlantic hurricane season (FEMA Disaster #1539).The bright pink areas in this map represent the highestmeasured winds of over 130 miles per hour, reflecting thatHurricane Charley entered Florida’s Gulf coast throughCape Coral, traveled northeast across the state, and exitedFlorida’s Atlantic coast just south of Daytona Beach. Thegreen dots on the map identify the geocoded locations ofall Florida residents who applied for and successfully re-ceived some disaster aid under FEMA Disaster #1539. Al-though aid recipients appear throughout the entire state,this map illustrates that the vast majority of the recipi-ents were geographically concentrated along the center ofHurricane Charley’s path as the storm crossed Florida.
The Effect of FEMA Aid on IndividualVoter Turnout
This section analyzes the effect of FEMA disaster aidawards on individual voter turnout in November 2004. Itracked the turnout of FEMA aid applicants by matchingthe residential addresses listed on individual households’FEMA applications with the addresses listed on Floridavoter registration and turnout records. In the aftermathof the 2004 hurricane season, several Florida newspapersmade repeated requests under the Freedom of Informa-tion Act (FOIA) to access records on individual FEMAaid applicants. FEMA officials initially refused all of theseFOIA requests. However, several federal lawsuits, culmi-nating in the 11th U.S. Circuit Court of Appeals’ June 22,2007, decision in News-Press v. U.S. Department of Home-land Security (No. 05–16771 and No. 06–13306), forcedFEMA to turn over detailed records on the Florida FEMAaid applicants. These records contain the addresses of the1.1 million households that applied for aid and the dol-lar amounts awarded to the 40% of applicants who wereapproved for aid.
Using these data, I matched the FEMA applicant ad-dresses to Florida voter registration forms, on which vot-ers must self-report their residential addresses. I then usedthese records to identify all registered voters whose house-hold applied for FEMA aid in 2004. Finally, using voterhistory files provided by counties’ boards of elections, Itracked each registered voter’s turnout in the November2002 (pre-hurricane) and 2004 (post-hurricane) generalelections.
This section’s empirical analyses include only Floridaresidents who satisfied all four of the following criteria:(1) the individual lives in a household that applied forFEMA aid during the 2004 hurricane season; (2) FEMA
6 JOWEI CHEN
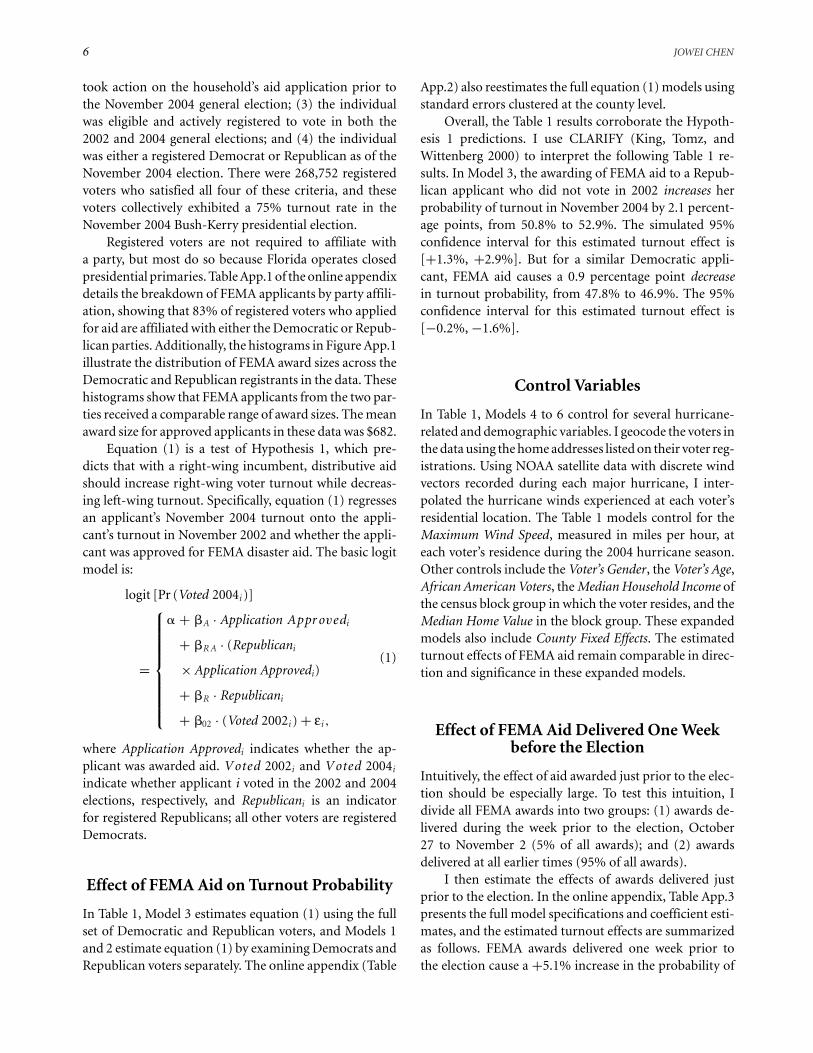
took action on the household’s aid application prior tothe November 2004 general election; (3) the individualwas eligible and actively registered to vote in both the2002 and 2004 general elections; and (4) the individualwas either a registered Democrat or Republican as of theNovember 2004 election. There were 268,752 registeredvoters who satisfied all four of these criteria, and thesevoters collectively exhibited a 75% turnout rate in theNovember 2004 Bush-Kerry presidential election.
Registered voters are not required to affiliate witha party, but most do so because Florida operates closedpresidential primaries. Table App.1 of the online appendixdetails the breakdown of FEMA applicants by party affili-ation, showing that 83% of registered voters who appliedfor aid are affiliated with either the Democratic or Repub-lican parties. Additionally, the histograms in Figure App.1illustrate the distribution of FEMA award sizes across theDemocratic and Republican registrants in the data. Thesehistograms show that FEMA applicants from the two par-ties received a comparable range of award sizes. The meanaward size for approved applicants in these data was $682.
Equation (1) is a test of Hypothesis 1, which pre-dicts that with a right-wing incumbent, distributive aidshould increase right-wing voter turnout while decreas-ing left-wing turnout. Specifically, equation (1) regressesan applicant’s November 2004 turnout onto the appli-cant’s turnout in November 2002 and whether the appli-cant was approved for FEMA disaster aid. The basic logitmodel is:
logit [Pr (Voted 2004i )]
=
⎧⎪⎪⎪⎪⎪⎪⎪⎪⎨⎪⎪⎪⎪⎪⎪⎪⎪⎩
� + �A · Application Appr ovedi
+ �R A · (Republicani
× Application Approvedi)
+ �R · Republicani
+ �02 · (Voted 2002i ) + εi ,
(1)
where Application Approvedi indicates whether the ap-plicant was awarded aid. Voted 2002i and Voted 2004i
indicate whether applicant i voted in the 2002 and 2004elections, respectively, and Republicani is an indicatorfor registered Republicans; all other voters are registeredDemocrats.
Effect of FEMA Aid on Turnout Probability
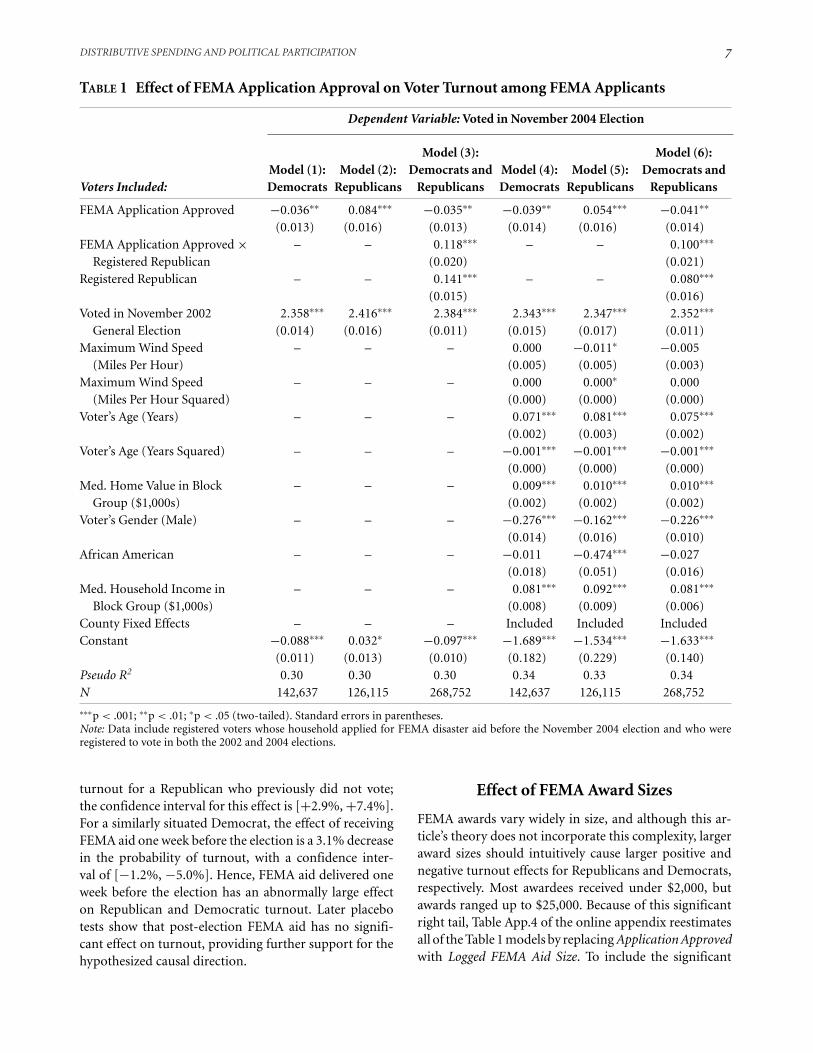
In Table 1, Model 3 estimates equation (1) using the fullset of Democratic and Republican voters, and Models 1and 2 estimate equation (1) by examining Democrats andRepublican voters separately. The online appendix (Table
App.2) also reestimates the full equation (1) models usingstandard errors clustered at the county level.
Overall, the Table 1 results corroborate the Hypoth-esis 1 predictions. I use CLARIFY (King, Tomz, andWittenberg 2000) to interpret the following Table 1 re-sults. In Model 3, the awarding of FEMA aid to a Repub-lican applicant who did not vote in 2002 increases herprobability of turnout in November 2004 by 2.1 percent-age points, from 50.8% to 52.9%. The simulated 95%confidence interval for this estimated turnout effect is[+1.3%, +2.9%]. But for a similar Democratic appli-cant, FEMA aid causes a 0.9 percentage point decreasein turnout probability, from 47.8% to 46.9%. The 95%confidence interval for this estimated turnout effect is[−0.2%, −1.6%].
Control Variables
In Table 1, Models 4 to 6 control for several hurricane-related and demographic variables. I geocode the voters inthe data using the home addresses listed on their voter reg-istrations. Using NOAA satellite data with discrete windvectors recorded during each major hurricane, I inter-polated the hurricane winds experienced at each voter’sresidential location. The Table 1 models control for theMaximum Wind Speed, measured in miles per hour, ateach voter’s residence during the 2004 hurricane season.Other controls include the Voter’s Gender, the Voter’s Age,African American Voters, the Median Household Income ofthe census block group in which the voter resides, and theMedian Home Value in the block group. These expandedmodels also include County Fixed Effects. The estimatedturnout effects of FEMA aid remain comparable in direc-tion and significance in these expanded models.
Effect of FEMA Aid Delivered One Weekbefore the Election
Intuitively, the effect of aid awarded just prior to the elec-tion should be especially large. To test this intuition, Idivide all FEMA awards into two groups: (1) awards de-livered during the week prior to the election, October27 to November 2 (5% of all awards); and (2) awardsdelivered at all earlier times (95% of all awards).
I then estimate the effects of awards delivered justprior to the election. In the online appendix, Table App.3presents the full model specifications and coefficient esti-mates, and the estimated turnout effects are summarizedas follows. FEMA awards delivered one week prior tothe election cause a +5.1% increase in the probability of
DISTRIBUTIVE SPENDING AND POLITICAL PARTICIPATION 7
TABLE 1 Effect of FEMA Application Approval on Voter Turnout among FEMA Applicants
Dependent Variable: Voted in November 2004 Election
Model (3): Model (6):Model (1): Model (2): Democrats and Model (4): Model (5): Democrats and
Voters Included: Democrats Republicans Republicans Democrats Republicans Republicans
FEMA Application Approved −0.036∗∗ 0.084∗∗∗ −0.035∗∗ −0.039∗∗ 0.054∗∗∗ −0.041∗∗
(0.013) (0.016) (0.013) (0.014) (0.016) (0.014)FEMA Application Approved × – – 0.118∗∗∗ – – 0.100∗∗∗
Registered Republican (0.020) (0.021)Registered Republican – – 0.141∗∗∗ – – 0.080∗∗∗
(0.015) (0.016)Voted in November 2002 2.358∗∗∗ 2.416∗∗∗ 2.384∗∗∗ 2.343∗∗∗ 2.347∗∗∗ 2.352∗∗∗
General Election (0.014) (0.016) (0.011) (0.015) (0.017) (0.011)Maximum Wind Speed – – – 0.000 −0.011∗ −0.005
(Miles Per Hour) (0.005) (0.005) (0.003)Maximum Wind Speed – – – 0.000 0.000∗ 0.000
(Miles Per Hour Squared) (0.000) (0.000) (0.000)Voter’s Age (Years) – – – 0.071∗∗∗ 0.081∗∗∗ 0.075∗∗∗
(0.002) (0.003) (0.002)Voter’s Age (Years Squared) – – – −0.001∗∗∗ −0.001∗∗∗ −0.001∗∗∗
(0.000) (0.000) (0.000)Med. Home Value in Block – – – 0.009∗∗∗ 0.010∗∗∗ 0.010∗∗∗
Group ($1,000s) (0.002) (0.002) (0.002)Voter’s Gender (Male) – – – −0.276∗∗∗ −0.162∗∗∗ −0.226∗∗∗
(0.014) (0.016) (0.010)African American – – – −0.011 −0.474∗∗∗ −0.027
(0.018) (0.051) (0.016)Med. Household Income in – – – 0.081∗∗∗ 0.092∗∗∗ 0.081∗∗∗
Block Group ($1,000s) (0.008) (0.009) (0.006)County Fixed Effects – – – Included Included IncludedConstant −0.088∗∗∗ 0.032∗ −0.097∗∗∗ −1.689∗∗∗ −1.534∗∗∗ −1.633∗∗∗
(0.011) (0.013) (0.010) (0.182) (0.229) (0.140)Pseudo R2 0.30 0.30 0.30 0.34 0.33 0.34N 142,637 126,115 268,752 142,637 126,115 268,752
∗∗∗p < .001; ∗∗p < .01; ∗p < .05 (two-tailed). Standard errors in parentheses.Note: Data include registered voters whose household applied for FEMA disaster aid before the November 2004 election and who wereregistered to vote in both the 2002 and 2004 elections.
turnout for a Republican who previously did not vote;the confidence interval for this effect is [+2.9%, +7.4%].For a similarly situated Democrat, the effect of receivingFEMA aid one week before the election is a 3.1% decreasein the probability of turnout, with a confidence inter-val of [−1.2%, −5.0%]. Hence, FEMA aid delivered oneweek before the election has an abnormally large effecton Republican and Democratic turnout. Later placebotests show that post-election FEMA aid has no signifi-cant effect on turnout, providing further support for thehypothesized causal direction.
Effect of FEMA Award Sizes
FEMA awards vary widely in size, and although this ar-ticle’s theory does not incorporate this complexity, largeraward sizes should intuitively cause larger positive andnegative turnout effects for Republicans and Democrats,respectively. Most awardees received under $2,000, butawards ranged up to $25,000. Because of this significantright tail, Table App.4 of the online appendix reestimatesall of the Table 1 models by replacing Application Approvedwith Logged FEMA Aid Size. To include the significant

8 JOWEI CHEN
fraction of applicants who were rejected and thus received$0, I add $1 to every award size before logging. Table App.5presents similar models using alternative specifications ofthe Logged FEMA Aid term.
The results in Table App.4 confirm that larger awardsizes indeed produce turnout effects of significantlygreater magnitude. For Democrats (Model 1), receivingan average-sized award of $682 causes a 1.5% decrease inturnout probability for a previous nonvoter. By contrast,Model 2 estimates that for Republicans, the same awardsize causes a 1.3% increase in turnout probability.
How substantively large are these turnout effects ofFEMA aid? In the most extreme case, the earlier resultsestimated that FEMA awards delivered one week prior tothe election cause a 5.1% increase in the probability ofRepublican turnout. This estimate implies that $13,373of FEMA aid produces one new Republican voter, anestimate that is nearly identical to Levitt and Snyder’s(1997) calculation that $14,000 of federal spending gen-erates one additional vote for an incumbent legislator.But for FEMA aid delivered temporally further awayfrom the election, the turnout effect is much smaller:$32,476 of aid increases Republican turnout by one voter.Hence, although delivering FEMA aid produces statisti-cally significant effects on Republican and Democraticturnout, disaster aid is likely not the most impactfultype of federal spending when compared to the manytypes of federal spending in the Levitt and Snyder (1997)data.
Robustness of Empirical Findings
Having illustrated the main statistical relationship be-tween FEMA aid delivery and voter turnout, this articleproceeds to evaluate the causal direction and the empiri-cal robustness of this main finding. To do so, this sectionexplores several placebo tests, potential omitted variables,and selection issues that arise in the FEMA aid data.Collectively, these additional empirical tests strengthenthis article’s main empirical argument that FEMA aidincreased turnout among incumbent supporters and de-creased turnout among opposition voters.
Causal Identification and Placebo Tests
What is the causal direction of the empirical relationshipbetween FEMA aid and increased turnout in November2004? Two potential alternative explanations for the mainfindings in Table 1 are reverse causality, whereby increased
turnout from 2002 to 2004 causes FEMA aid receipt, oran omitted variable that simultaneously causes FEMA aidreceipt and increased turnout from 2002 to 2004.
To test for these alternative causal explanations, thissection presents several placebo tests that take advan-tage of the temporal distribution of FEMA aid applica-tions. FEMA continued to accept aid applications throughDecember 2004, and although the majority of hurricanevictims applied for aid before November, 40,656 regis-tered Democrats and Republicans in the data did notapply until after the November general election.
The placebo test therefore examines whether FEMAaid that was awarded after the November election affectsElection Day turnout. Election turnout and post-electionFEMA aid should be correlated only if reverse causality oran omitted variable is driving the main Table 1 results. Theplacebo tests reestimate the equation (1) model using onlythe 40,656 registered voters who applied for aid during2004 but after the November election.
The placebo test results appear in Table 2. The sixlogit models estimated in Table 3 are identical to the sixmodels reported in Table 1, except that the data includeonly post-election applicants. Each of the six placebo testsin Table 2 finds no statistically significant effect of post-election FEMA aid on Election Day turnout. In contrastto the Table 1 results, Republicans who would later re-ceive FEMA aid after the election did not exhibit higherturnout than nonrecipients. Nor was there a significantturnout effect for Democrats who would subsequentlyreceive FEMA aid. The magnitudes of the ApplicationApprovedi coefficients estimated in the placebo tests arealso much smaller than in the Table 1 results and statisti-cally indistinguishable from zero. Thus, the placebo testsfail to find evidence of reverse causality in the main testsof equation (1).
Effect of Previous Turnout on ProgramParticipation
A possible selection issue in the main results is that indi-viduals may self-select into applying for FEMA aid basedon factors that are also related to their turnout. Such self-selection is plausible, given that civic skills, as describedby Verba, Schlozman, and Brady (1995), may explain bothturnout and applying for aid. If such self-selection occurs,then the population that applied for aid is not perfectlycomparable to those who did not apply for aid, thuspotentially limiting the external validity of this article’sfindings.
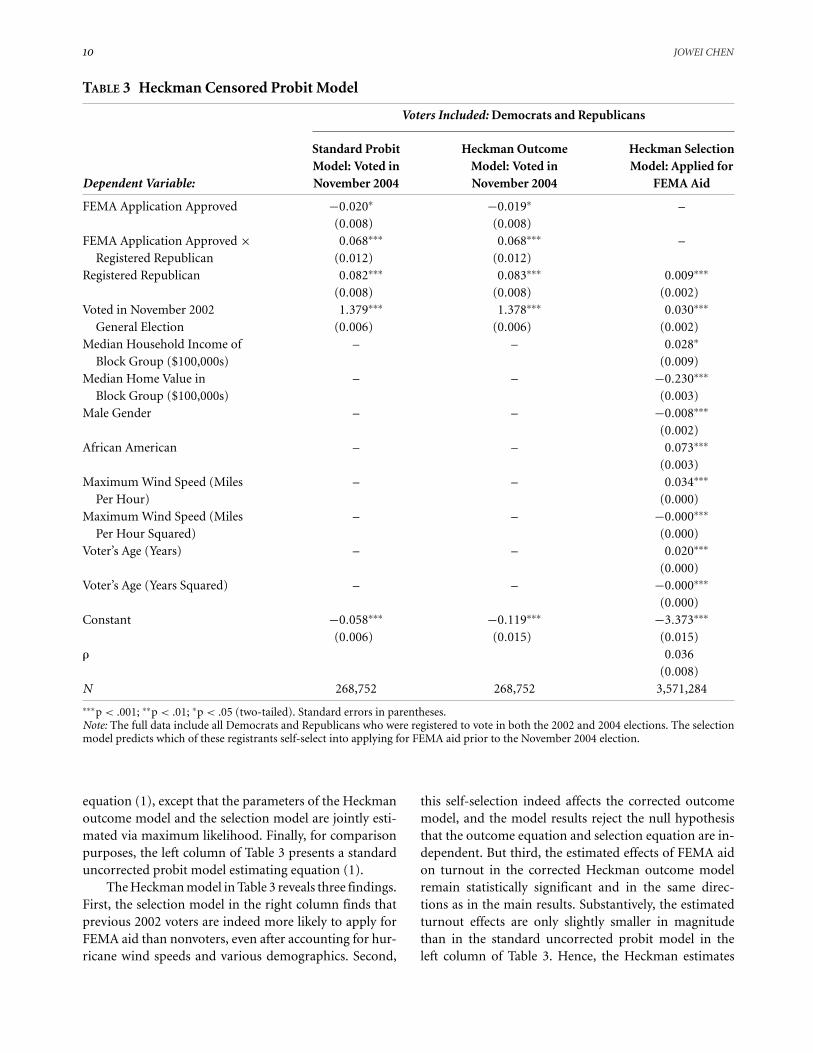
To test for and correct such self-selection bias,Table 3 employs a Heckman selection model. The

DISTRIBUTIVE SPENDING AND POLITICAL PARTICIPATION 9
TABLE 2 Placebo Test of Residents Who Applied for FEMA Aid after November 2004
Dependent Variable: Voted in November 2004 Election
Model (3): Model (6):Model (1): Model (2): Democrats and Model (4): Model (5): Democrats and
Voters Included: Democrats Republicans Republicans Democrats Republicans Republicans
FEMA Application Approved −0.011 −0.006 −0.011 0.017 −0.012 0.016(Post-November 2004) (0.034) (0.040) (0.034) (0.036) (0.041) (0.035)
FEMA Application Approved – – 0.005 – – −0.020(Post-November 2004) ×Registered Republican (0.053) (0.054)
Registered Republican – – 0.179∗∗∗ – – 0.139∗∗
(0.040) (0.043)Voted in November 2002 2.301
∗∗∗2.315
∗∗∗2.307∗∗∗ 2.291∗∗∗ 2.234∗∗∗ 2.269∗∗∗
General Election (0.036) (0.041) (0.027) (0.039) (0.044) (0.029)Maximum Wind Speed – – – 0.003 −0.006 −0.000
(Miles Per Hour) (0.014) (0.016) (0.010)Maximum Wind Speed – – – −0.000 0.000 −0.000
(Miles Per Hour Squared) (0.000) (0.000) (0.000)Voter’s Age (Years) – – – 0.071∗∗∗ 0.074∗∗∗ 0.071∗∗∗
(0.006) (0.007) (0.004)Voter’s Age (Years Squared) – – – −0.001∗∗∗ −0.001∗∗∗ −0.001∗∗∗
(0.000) (0.000) (0.000)Med. Home Value in – – – 0.008 0.005 0.006
Block Group ($1,000s) (0.006) (0.005) (0.004)Voter’s Gender (Male) – – – −0.260∗∗∗ −0.146∗∗∗ −0.207∗∗∗
(0.036) (0.040) (0.027)African American – – – −0.034 −0.397∗∗∗ −0.066
(0.044) (0.117) (0.040)Med. Household Income in – – – 0.091∗∗∗ 0.088∗∗∗ 0.087∗∗∗
Block Group ($1,000s) (0.019) (0.021) (0.014)County Fixed Effects – – – Included Included IncludedConstant −0.077
∗∗0.097
∗∗ −0.079∗∗ −1.671∗∗ −1.328∗ −1.558∗∗∗
(0.029) (0.034) (0.027) (0.515) (0.607) (0.388)Pseudo R2 0.29 0.28 0.29 0.33 0.32 0.32N 21,864 18,792 40,656 21,864 18,792 40,656
∗∗∗p < .001; ∗∗p < .01; ∗p < .05 (two-tailed). Standard errors in parentheses.Note: Data include registered voters whose household applied for FEMA disaster aid after the November 2004 election and who wereregistered to vote in both the 2002 and 2004 elections.
selection model compares individuals who selected intoapplying for FEMA aid against those who were eligiblebut chose not to apply. To estimate this selection model,I use Florida voter registration lists to identify all Floridaresidents who (1) were registered and eligible to vote inboth November 2002 and 2004, and (2) were registered aseither a Democrat or Republican. These two criteria pro-duce a full set of 3,571,284 individuals, representing theuniverse of previously registered voters who were eligibleto apply for FEMA aid in Florida. As previously noted,
only 268,752 (7.5%) of these individuals actually appliedfor aid prior to the November election.
The Heckman selection model results appear as fol-lows. The right column of Table 3 presents the selec-tion model, which estimates self-selection into applyingfor FEMA aid among the full set of 3.57 million eligi-ble residents. The middle column of Table 3 presents theHeckman probit outcome model, which predicts Novem-ber 2004 turnout for the 268,752 residents who appliedfor FEMA aid. This outcome model is identical in setup to
10 JOWEI CHEN
TABLE 3 Heckman Censored Probit Model
Voters Included: Democrats and Republicans
Standard Probit Heckman Outcome Heckman SelectionModel: Voted in Model: Voted in Model: Applied for
Dependent Variable: November 2004 November 2004 FEMA Aid
FEMA Application Approved −0.020∗ −0.019∗ –(0.008) (0.008)
FEMA Application Approved × 0.068∗∗∗ 0.068∗∗∗ –Registered Republican (0.012) (0.012)
Registered Republican 0.082∗∗∗ 0.083∗∗∗ 0.009∗∗∗
(0.008) (0.008) (0.002)Voted in November 2002 1.379∗∗∗ 1.378∗∗∗ 0.030∗∗∗
General Election (0.006) (0.006) (0.002)Median Household Income of – – 0.028∗
Block Group ($100,000s) (0.009)Median Home Value in – – −0.230∗∗∗
Block Group ($100,000s) (0.003)Male Gender – – −0.008∗∗∗
(0.002)African American – – 0.073∗∗∗
(0.003)Maximum Wind Speed (Miles – – 0.034∗∗∗
Per Hour) (0.000)Maximum Wind Speed (Miles – – −0.000∗∗∗
Per Hour Squared) (0.000)Voter’s Age (Years) – – 0.020∗∗∗
(0.000)Voter’s Age (Years Squared) – – −0.000∗∗∗
(0.000)Constant −0.058∗∗∗ −0.119∗∗∗ −3.373∗∗∗
(0.006) (0.015) (0.015)� 0.036
(0.008)N 268,752 268,752 3,571,284
∗∗∗p < .001; ∗∗p < .01; ∗p < .05 (two-tailed). Standard errors in parentheses.Note: The full data include all Democrats and Republicans who were registered to vote in both the 2002 and 2004 elections. The selectionmodel predicts which of these registrants self-select into applying for FEMA aid prior to the November 2004 election.
equation (1), except that the parameters of the Heckmanoutcome model and the selection model are jointly esti-mated via maximum likelihood. Finally, for comparisonpurposes, the left column of Table 3 presents a standarduncorrected probit model estimating equation (1).
The Heckman model in Table 3 reveals three findings.First, the selection model in the right column finds thatprevious 2002 voters are indeed more likely to apply forFEMA aid than nonvoters, even after accounting for hur-ricane wind speeds and various demographics. Second,
this self-selection indeed affects the corrected outcomemodel, and the model results reject the null hypothesisthat the outcome equation and selection equation are in-dependent. But third, the estimated effects of FEMA aidon turnout in the corrected Heckman outcome modelremain statistically significant and in the same direc-tions as in the main results. Substantively, the estimatedturnout effects are only slightly smaller in magnitudethan in the standard uncorrected probit model in theleft column of Table 3. Hence, the Heckman estimates
DISTRIBUTIVE SPENDING AND POLITICAL PARTICIPATION 11
TABLE 4 Effect of FEMA Application Approval on Voter Turnout among Previous Voters andPrevious Nonvoters
Dependent Variable: Voted in November 2004 Election
November 2002 Voters November 2002 Nonvoterswhose Party Affiliation is . . . whose Party Affiliation is . . .
Democrat or Democrat orDemocrat Republican Republican Democrat Republican Republican
Voters Included: Model (1) Model (2) Model (3) Model (4) Model (5) Model (6)
FEMA Application Approved −0.017 0.101∗∗∗ −0.017 −0.044∗∗ 0.074∗∗∗ −0.044∗∗
(0.024) (0.026) (0.024) (0.016) (0.019) (0.016)FEMA Application Approved × – – 0.118∗∗∗ – – 0.118∗∗∗
Registered Republican (0.036) (0.025)Registered Republican – – 0.179∗∗∗ – – 0.122∗∗∗
(0.025) (0.018)
Constant 2.260∗∗∗ 2.439∗∗∗ 2.260∗∗∗ −0.084∗∗∗ 0.038∗∗ −0.084∗∗∗
(0.017) (0.019) (0.017) (0.012) (0.014) (0.012)
Pseudo R2 0.30 0.30 0.30 0.30 0.30 0.30N 81,148 82,427 163,575 61,489 43,688 105,177
Total Applicants 81,148 82,427 163,575 61,489 43,688 105,177Applicants Awarded Aid 39,583 44,104 83,687 32,006 23,723 55,729Approval Rate 48.8% 53.5% 51.2% 52.1% 54.3% 54.0%
∗∗∗p < .001; ∗∗p < .01; ∗p < .05 (two-tailed). Standard errors in parentheses.Note: Data include registered voters whose household applied for FEMA disaster aid before the November 2004 election and who wereregistered to vote in both the 2002 and 2004 elections.
reveal that self-selection indeed affects the compositionof applicants in the data, but after correcting for selec-tion bias, the main results regarding increased Repub-lican turnout and decreased Democratic turnout stillhold.
Effect of Previous Turnout on FEMAApplication Approval
A related issue is that turnout in the previous electionis related to the approval of one’s FEMA application.Since Key (1949), political scientists have suggested thatvoters who exhibit higher turnout rates may receive fa-vorable treatment from the government. For example,Aldrich and Crook (2008) find that undesirable FEMAtrailer parks are targeted toward neighborhoods withlower voter turnout. If FEMA treats previous voters andnonvoters differently, then approved FEMA applicantsmay be dissimilar in political activeness to rejected ap-plicants in the data, thus raising the possibility that thisarticle’s main findings may not generalize to all types ofvoters.
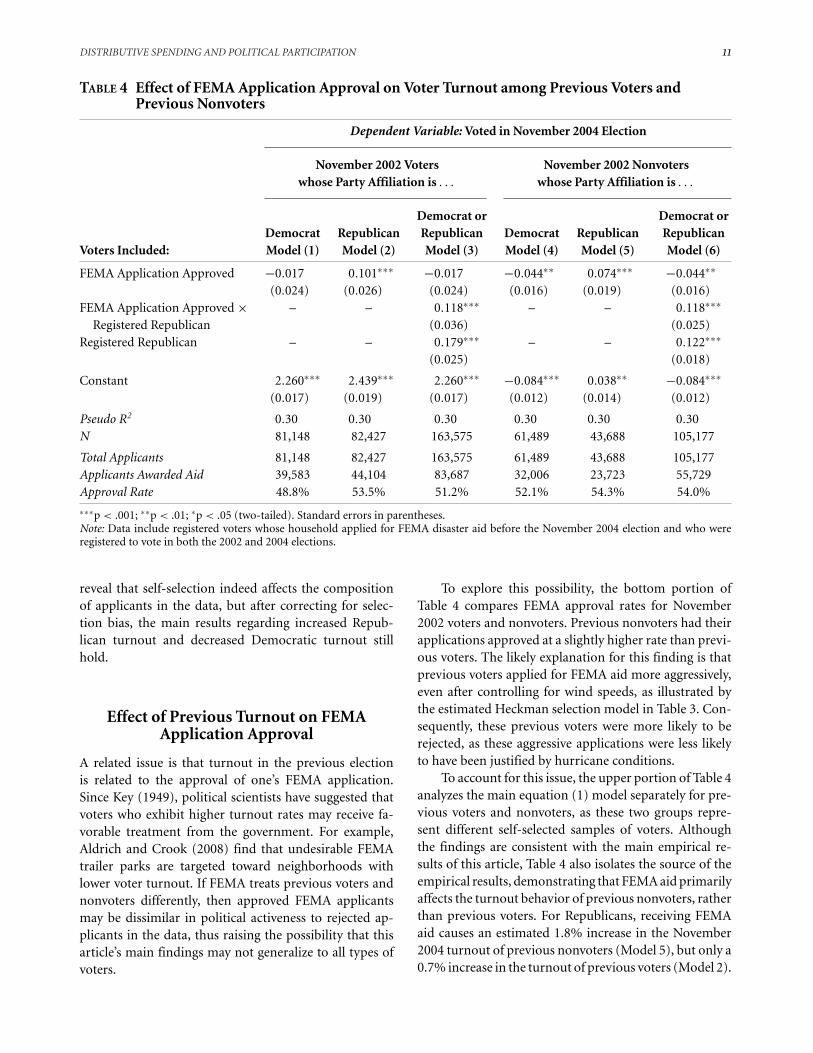
To explore this possibility, the bottom portion ofTable 4 compares FEMA approval rates for November2002 voters and nonvoters. Previous nonvoters had theirapplications approved at a slightly higher rate than previ-ous voters. The likely explanation for this finding is thatprevious voters applied for FEMA aid more aggressively,even after controlling for wind speeds, as illustrated bythe estimated Heckman selection model in Table 3. Con-sequently, these previous voters were more likely to berejected, as these aggressive applications were less likelyto have been justified by hurricane conditions.
To account for this issue, the upper portion of Table 4analyzes the main equation (1) model separately for pre-vious voters and nonvoters, as these two groups repre-sent different self-selected samples of voters. Althoughthe findings are consistent with the main empirical re-sults of this article, Table 4 also isolates the source of theempirical results, demonstrating that FEMA aid primarilyaffects the turnout behavior of previous nonvoters, ratherthan previous voters. For Republicans, receiving FEMAaid causes an estimated 1.8% increase in the November2004 turnout of previous nonvoters (Model 5), but only a0.7% increase in the turnout of previous voters (Model 2).
12 JOWEI CHEN
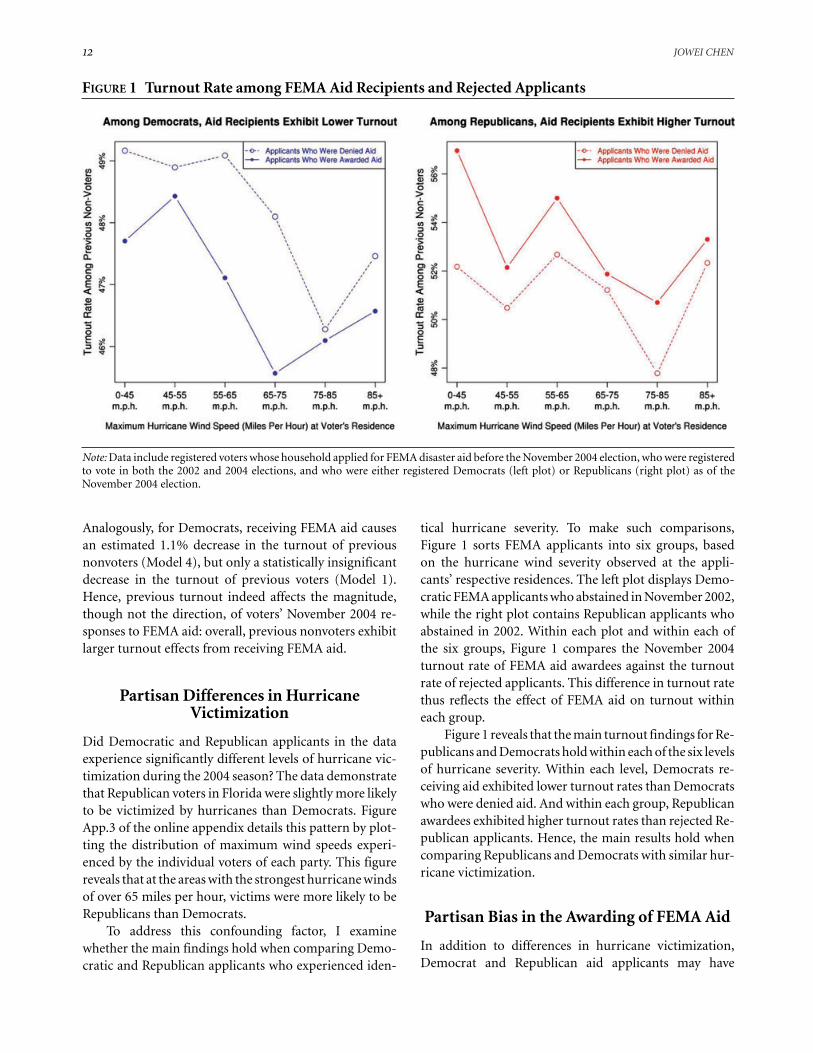
FIGURE 1 Turnout Rate among FEMA Aid Recipients and Rejected Applicants
Note: Data include registered voters whose household applied for FEMA disaster aid before the November 2004 election, who were registeredto vote in both the 2002 and 2004 elections, and who were either registered Democrats (left plot) or Republicans (right plot) as of theNovember 2004 election.
Analogously, for Democrats, receiving FEMA aid causesan estimated 1.1% decrease in the turnout of previousnonvoters (Model 4), but only a statistically insignificantdecrease in the turnout of previous voters (Model 1).Hence, previous turnout indeed affects the magnitude,though not the direction, of voters’ November 2004 re-sponses to FEMA aid: overall, previous nonvoters exhibitlarger turnout effects from receiving FEMA aid.
Partisan Differences in HurricaneVictimization
Did Democratic and Republican applicants in the dataexperience significantly different levels of hurricane vic-timization during the 2004 season? The data demonstratethat Republican voters in Florida were slightly more likelyto be victimized by hurricanes than Democrats. FigureApp.3 of the online appendix details this pattern by plot-ting the distribution of maximum wind speeds experi-enced by the individual voters of each party. This figurereveals that at the areas with the strongest hurricane windsof over 65 miles per hour, victims were more likely to beRepublicans than Democrats.
To address this confounding factor, I examinewhether the main findings hold when comparing Demo-cratic and Republican applicants who experienced iden-
tical hurricane severity. To make such comparisons,Figure 1 sorts FEMA applicants into six groups, basedon the hurricane wind severity observed at the appli-cants’ respective residences. The left plot displays Demo-cratic FEMA applicants who abstained in November 2002,while the right plot contains Republican applicants whoabstained in 2002. Within each plot and within each ofthe six groups, Figure 1 compares the November 2004turnout rate of FEMA aid awardees against the turnoutrate of rejected applicants. This difference in turnout ratethus reflects the effect of FEMA aid on turnout withineach group.
Figure 1 reveals that the main turnout findings for Re-publicans and Democrats hold within each of the six levelsof hurricane severity. Within each level, Democrats re-ceiving aid exhibited lower turnout rates than Democratswho were denied aid. And within each group, Republicanawardees exhibited higher turnout rates than rejected Re-publican applicants. Hence, the main results hold whencomparing Republicans and Democrats with similar hur-ricane victimization.
Partisan Bias in the Awarding of FEMA Aid
In addition to differences in hurricane victimization,Democrat and Republican aid applicants may have

DISTRIBUTIVE SPENDING AND POLITICAL PARTICIPATION 13
received disparate treatment by FEMA. If partisan biasoccurred, then such biased treatment by FEMA couldpossibly elicit either positive or negative reactions by vot-ers, thus affecting their turnout.
Indeed, Table 4 suggests the possibility of suchpartisan bias by illustrating that Republican applicants(53.7%) were awarded aid at a slightly higher rate thanDemocratic applicants (50.2%). But the higher approvalrate for Republicans also reflects the fact that Republicanswere victimized by hurricanes more severely. To examinemore carefully whether FEMA exhibited bias, Figure 2considers how FEMA treated applicants of each party af-ter controlling for two important predictors of disasteraid eligibility: (1) the hurricane severity at the applicant’shome and (2) the applicant’s income. Higher-income in-dividuals are more likely to carry flood insurance, thusdisqualifying them from receiving FEMA aid for damagesto insured property.
To control for these two factors, Figure 2 comparesthe average FEMA aid awarded to Republican and Demo-cratic applicants within each of three income categoriesand within each of six categories of hurricane wind sever-ity. In Figure 2, average Republican aid awards are de-picted in red triangles, while Democrats are in blue cir-cles. Overall, this figure illustrates that within each incomegroup and at each level of hurricane severity, Democraticand Republican applicants are treated similarly by FEMA,with no systematic pattern of Republican favoritism. Infact, the most notable partisan disparity occurs within thelowest income group, where Democrats receive slightlylarger aid awards, though the magnitude of these differ-ences is relatively small. In sum, after considering appli-cants’ hurricane severity and household income, thereis no strong evidence that FEMA engaged in individual-level targeting of Republican applicants in its distributionof aid. As a further illustration of this lack of Republicantargeting, Figure App.4 of the online appendix presentsadditional plots that sort applicants by their estimatedhome values, illustrating FEMA’s similar treatment ofDemocratic and Republican applicants within each levelof home values.
Partisan Differences in Efficacy of FEMAExperiences
A related issue is that even if FEMA awarded aid eq-uitably to Democrats and Republicans, Democratic ap-plicants could still have been treated less efficiently byFEMA’s inspectors. This potential concern is importantto explore because previous literature on social programshas found that inefficacious program administration can
cause political discouragement among clients. For ex-ample, Soss (1999) and Mettler and Stonecash (2008)find that poor beneficiaries of some means-tested pro-grams, including AFDC and food stamps, exhibit lowerpolitical participation because of the stigmatizing, in-efficacious, and unresponsive administration of suchprograms.
To explore whether FEMA treated Democratic appli-cants more inefficaciously than Republicans, I countedthe number of days that elapsed from the initial fil-ing of each application until FEMA’s inspection andfinal disposition of the application. While most appli-cants waited no more than one week for an inspection,some applicants in areas with especially severe hurri-cane damage waited up to several weeks for FEMA torespond.
The data reveal that Democrats were not treated moreslowly than Republicans. Figure App.5 of the online ap-pendix illustrates this pattern in greater detail, showingthe average wait term endured by Democratic and Re-publican applicants sorted by the hurricane wind severityat their respective homes. In fact, for applicants livingin areas of moderate hurricane damage (45 to 85 mile-per-hour winds), Republican applicants actually waitedslightly longer than Democrats for FEMA to respond,though these differences are not large.
Next, having found that Democratic applicationswere not processed less efficaciously, I examine whetherapplicants’ waiting times affected their November 2004turnout. Table App.6 of the online appendix reesti-mates all of the main Table 1 models while controllingfor each applicant’s Waiting Time for FEMA Response.The Waiting Time variable is never a significant predic-tor of turnout, and its inclusion in these models doesnot alter the main finding that FEMA aid decreasesturnout among Democrats and increases turnout amongRepublicans.
Spatial Autocorrelation
Hurricane victimization occurs in a geographically clus-tered fashion, and the damage from the 2004 hurri-cane season and the ensuing disaster aid from FEMAwere distributed unevenly throughout Florida. Hence,these geographic patterns raise the possibility that themain turnout results in Table 1 may be largely drivenby voters in a small number of localized areas withinFlorida. The following two robustness checks address thispossibility.
First, I test for spatial autocorrelation in the resid-uals of the main Table 1 turnout models. Specifically, I

14 JOWEI CHEN
FIGURE 2 The Awarding of FEMA Aid by Party, by Income Group, and by Hurricane Severity
Note: Data include all individuals who were registered to vote in both the 2002 and 2004 elections, and who were either registered Democrats(blue circles) or Republicans (red triangles) as of the November 2004 election.
calculate the residuals from Model 4 of Table 1, whichpredicts FEMA aid’s effect on Democratic turnout. Igeocoded the residuals using each voter’s residential ad-dress and display a map of these residuals in Figure App.6of the online appendix, with colors ranging from orangeto blue representing the most negative to most positiveresiduals, respectively. Figure App.6 also presents detailsof a Global Moran’s Index test for spatial autocorrela-tion. Similarly, Figure App.7 presents an analogous mapand Moran’s I calculations for the residuals of Model 5of Table 1, which predicts FEMA aid’s effect on Republi-can turnout. Together, these tests find no significant evi-dence of spatial autocorrelation in the residuals for eitherDemocratic or Republican voters.
As a second test, Table App.2 of the online appendixreestimates each of the full models from Table 1 usingstandard errors clustered by county. While these clusteredstandard errors are slightly larger than the nonclusteredresults estimated in Table 1, the reestimated effects ofFEMA aid on turnout remain statistically significant andin the same directions as before.
Republican Awardees’ Motivation forIncreased Turnout
A final test of this article’s theory concerns the motiva-tion of Republican FEMA recipients for increasing theirturnout. This test considers the possibility that Republi-can awardees increase their turnout not because FEMAaid enhances their esteem for the incumbent president,but instead, because of their dissatisfaction with theFEMA aid process. If Republican awardees were generallydissatisfied with their experiences with the FEMA admin-istration, then one would expect precincts receiving moreFEMA aid awards to exhibit more electoral opposition toPresident Bush, even in Republican-leaning precincts.
Measuring the electoral effects of FEMA aid alsorepresents a direct test of Hypothesis 2, which predictsthat by causing increased Republican turnout and de-creased Democratic turnout, FEMA aid should therebycause an increase in President Bush’s November 2004 voteshare. This hypothesis logically holds only if the Repub-lican FEMA recipients who increased their turnout rate
DISTRIBUTIVE SPENDING AND POLITICAL PARTICIPATION 15
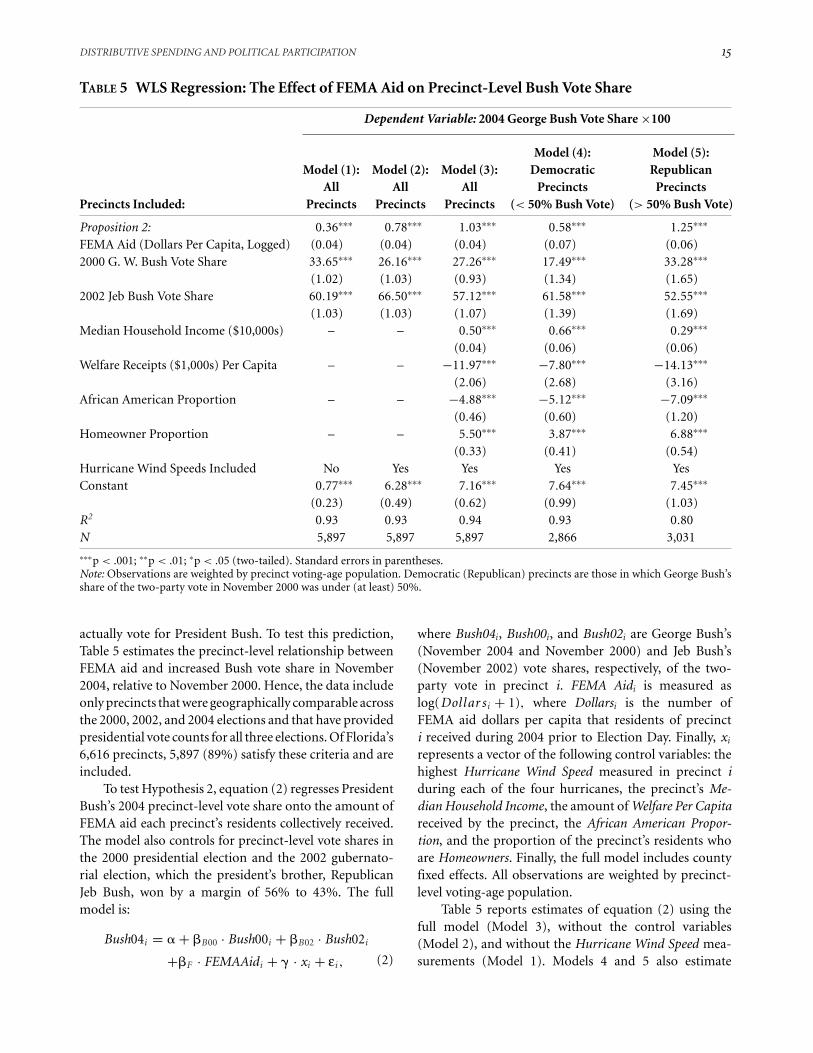
TABLE 5 WLS Regression: The Effect of FEMA Aid on Precinct-Level Bush Vote Share
Dependent Variable: 2004 George Bush Vote Share ×100
Model (4): Model (5):Model (1): Model (2): Model (3): Democratic Republican
All All All Precincts PrecinctsPrecincts Included: Precincts Precincts Precincts (< 50% Bush Vote) (> 50% Bush Vote)
Proposition 2: 0.36∗∗∗ 0.78∗∗∗ 1.03∗∗∗ 0.58∗∗∗ 1.25∗∗∗
FEMA Aid (Dollars Per Capita, Logged) (0.04) (0.04) (0.04) (0.07) (0.06)2000 G. W. Bush Vote Share 33.65∗∗∗ 26.16∗∗∗ 27.26∗∗∗ 17.49∗∗∗ 33.28∗∗∗
(1.02) (1.03) (0.93) (1.34) (1.65)2002 Jeb Bush Vote Share 60.19∗∗∗ 66.50∗∗∗ 57.12∗∗∗ 61.58∗∗∗ 52.55∗∗∗
(1.03) (1.03) (1.07) (1.39) (1.69)Median Household Income ($10,000s) – – 0.50∗∗∗ 0.66∗∗∗ 0.29∗∗∗
(0.04) (0.06) (0.06)Welfare Receipts ($1,000s) Per Capita – – −11.97∗∗∗ −7.80∗∗∗ −14.13∗∗∗
(2.06) (2.68) (3.16)African American Proportion – – −4.88∗∗∗ −5.12∗∗∗ −7.09∗∗∗
(0.46) (0.60) (1.20)Homeowner Proportion – – 5.50∗∗∗ 3.87∗∗∗ 6.88∗∗∗
(0.33) (0.41) (0.54)Hurricane Wind Speeds Included No Yes Yes Yes YesConstant 0.77∗∗∗ 6.28∗∗∗ 7.16∗∗∗ 7.64∗∗∗ 7.45∗∗∗
(0.23) (0.49) (0.62) (0.99) (1.03)R2 0.93 0.93 0.94 0.93 0.80N 5,897 5,897 5,897 2,866 3,031
∗∗∗p < .001; ∗∗p < .01; ∗p < .05 (two-tailed). Standard errors in parentheses.Note: Observations are weighted by precinct voting-age population. Democratic (Republican) precincts are those in which George Bush’sshare of the two-party vote in November 2000 was under (at least) 50%.
actually vote for President Bush. To test this prediction,Table 5 estimates the precinct-level relationship betweenFEMA aid and increased Bush vote share in November2004, relative to November 2000. Hence, the data includeonly precincts that were geographically comparable acrossthe 2000, 2002, and 2004 elections and that have providedpresidential vote counts for all three elections. Of Florida’s6,616 precincts, 5,897 (89%) satisfy these criteria and areincluded.
To test Hypothesis 2, equation (2) regresses PresidentBush’s 2004 precinct-level vote share onto the amount ofFEMA aid each precinct’s residents collectively received.The model also controls for precinct-level vote shares inthe 2000 presidential election and the 2002 gubernato-rial election, which the president’s brother, RepublicanJeb Bush, won by a margin of 56% to 43%. The fullmodel is:
Bush04i = � + �B00 · Bush00i + �B02 · Bush02i
+�F · FEMAAidi + � · xi + εi , (2)
where Bush04i, Bush00i, and Bush02i are George Bush’s(November 2004 and November 2000) and Jeb Bush’s(November 2002) vote shares, respectively, of the two-party vote in precinct i. FEMA Aidi is measured aslog(Dollar si + 1), where Dollarsi is the number ofFEMA aid dollars per capita that residents of precincti received during 2004 prior to Election Day. Finally, xi
represents a vector of the following control variables: thehighest Hurricane Wind Speed measured in precinct iduring each of the four hurricanes, the precinct’s Me-dian Household Income, the amount of Welfare Per Capitareceived by the precinct, the African American Propor-tion, and the proportion of the precinct’s residents whoare Homeowners. Finally, the full model includes countyfixed effects. All observations are weighted by precinct-level voting-age population.
Table 5 reports estimates of equation (2) using thefull model (Model 3), without the control variables(Model 2), and without the Hurricane Wind Speed mea-surements (Model 1). Models 4 and 5 also estimate

16 JOWEI CHEN
equation (2) separately for Democratic-leaning (Model1) and Republican-leaning (Model 2) precincts;Democratic-leaning precincts are those which supportedAl Gore over George Bush in November 2000, andRepublican-leaning precincts are those with more Bushvoters. Collectively, the results in Table 5 corroborate thetheoretical prediction of Hypothesis 2: in both Republicanand Democratic areas, the increase in Republican turnoutand the decrease in Democratic turnout caused by FEMAaid both appear to positively affect Bush’s vote share. InRepublican-leaning precincts (Model 5), a $100 per capitaincrease in FEMA aid causes a 1.0% increase in Bush’s2004 vote share; this estimate has a 95% confidence inter-val of +0.9% to +1.1%. In Democratic-leaning precincts(Model 4), a $100 per capita increase in aid causes a 0.5%increase in Bush’s 2004 vote share, with a confidence in-terval of +0.4% to +0.6%.
The online appendix presents two further robustnesschecks of these basic tests of Hypothesis 2. First, TableApp.7 reestimates all of the Table 5 models using clus-tered standard errors; although the estimated clusteredstandard errors are larger, the overall effects of FEMA aidon Bush vote share remain statistically significant. Second,Figure App.8 presents plots of the precinct-level data tographically illustrate the relationship between FEMA aidand Bush vote share. In each plot in this figure, the verti-cal axis measures each precinct’s residual Bush vote sharewhen George Bush’s (2004) precinct-level vote share is re-gressed onto its 2000 and 2002 Bush vote shares. In otherwords, the residual vote share measures each precinct’sunexpected support for President Bush in 2004, given theprecinct’s past pre-hurricane history of Republican vot-ing. The horizontal axis in each plot measures the amountof FEMA aid per capita received by the residents of eachprecinct. The dashed line in each plot represents thepopulation-weighted least-squares fit within each plot,illustrating the positive relationship between FEMA aidand Bush vote share.
Discussion
This article makes three new contributions to the ex-isting literature on distributive spending and politicalparticipation. First, it illustrates that one important ef-fect of government spending is the suppression of voterparticipation among opposition party constituents whilesimultaneously mobilizing core constituents. Past empir-ical studies have argued that distributive spending af-fects electoral outcomes by mobilizing core voter turnout(e.g., Cox and Kouser 1981; Nicther 2007) or by persuad-ing moderate or swing voters (e.g., Dixit and Londregan1996, 1998; Stokes 2005).
This article contributes to this literature by empiri-cally demonstrating that in addition to the core and swingvoter effects, distributive benefits may also enhance theincumbent party’s electoral prospects by suppressing theopposing party’s voter turnout. Previously, formal mod-els by Heckelman (1998), Morgan and Vardy (2006), andGans-Morse, Mazzuca, and Nichter (2009) have suggestedthe possibility of “negative turnout buying” or “buyingabstention,” whereby a party explicitly bribes opposi-tion voters to abstain from voting. Anecdotally, Cox andKousser (1981), Argersinger (1987), and Schaffer (2002)described historical instances in which parties may haveengaged in “negative turnout buying” strategies. Whilethe electoral impacts of FEMA aid certainly do not qual-ify as “negative turnout buying,” they nevertheless de-scribe a related situation in which distributive benefitspersuade opposition voters to abstain from participatingin an election. This article is the first to provide sys-tematic, individual-level evidence that a party’s deliveryof distributive benefits can indeed depress the electoralturnout of the opposition party’s voters.
Second, this article’s theory explains, and the em-pirical results illustrate, why a nonpartisan distributiveprogram can cause such partisan disparity in politi-cal participation. In studies of developing democraciesand political machines, a discussion of swing voter (e.g.,Dixit and Londregan 1996, 1998; Stokes 2005) and corevoter models (e.g., Cox and McCubbins 1986; Nichter2007) can safely presume that a political party often hasthe option of targeting distributive benefits to a chosenconstituency primarily on the basis of partisan or ideo-logical loyalties.
But a distinguishing feature of developed democra-cies is that norms of government transparency and ac-countability effectively preclude parties from engaging inextreme targeting of public spending. Indeed, at the in-dividual level, there is no evidence that FEMA favoredRepublican aid applicants over Democrats. Hence, thearticle’s theory assumes that a right-wing president can-not target aid to Republicans and discriminate againstDemocrats.
Why does this nonpartisan nature of FEMA aid causea partisan disparity in turnout effects? As disaster aid can-not be targeted to Republicans, a right-wing incumbentwho provides pre-election disaster relief can thereforecredibly develop a reputation among all voters for prior-itizing disaster aid. This enhanced reputation mitigates aleft-wing voter’s ideological opposition to the incumbentwhile augmenting the right-wing voter’s ideological pref-erence for the incumbent. Consequently, the left-wingaid recipient has less motivation to vote and expel theincumbent, while the right-wing recipient has increasedmotivation to vote and reelect the incumbent. Hence,

DISTRIBUTIVE SPENDING AND POLITICAL PARTICIPATION 17
these dynamics produce the counterintuitive result thata nonpartisan FEMA aid program actually causes dis-parate partisan effects on turnout for Republicans andDemocrats.
Finally, this article’s results explain why distributivespending can simultaneously boost incumbent politi-cians’ electoral fortunes (e.g., Pacek and Radcliff 1995)while also decreasing political participation among manyrecipients (e.g., Soss 1999). Examining cross-country vot-ing data, Radcliff (1992) and Pacek and Radcliff (1995)argue that large welfare states may protect incumbentpoliticians from being punished during economic busts.Singer (2011) presents similar findings by examining in-cumbent vote shares in U.S. state legislative elections.
This article helps to explain why these two observedeffects of welfare—depressed turnout but increased in-cumbent support—can emerge theoretically when oneaccounts for the partisan biases of the beneficiaries ofdistributive programs. The delivery of distributive bene-fits lowers the turnout of voters who were already disin-clined to support the incumbent government. This lowerturnout among opposition voters effectively increases theincumbent’s vote share and reelection chances. Hence,the findings suggest that politicians benefit electorallyeven when they deliver aid to voters who are ideologicallyopposed.
References
Aldrich, John. 1993. “Rational Choice and Turnout.” AmericanJournal of Political Science 37(1): 246–78.
Ansolabehere, Stephen, and James M. Snyder, Jr. 2006. “PartyControl of State Government and the Distribution of PublicExpenditures.” Scandinavian Journal of Economics 108(4):547–69.
Argersinger, Peter. 1987. “From Party Tickets to Secret Bal-lots: The Evolution of the Electoral Process in Marylandduring the Gilded Age.” Maryland Historical Review 82(3):214–39.
Bartels, Larry. 2002. “Beyond the Running Tally: Partisan Biasin Political Perceptions.” Political Behavior 24: 117–50.
Bruch, Sarah, Myra Ferree, and Joe Soss. 2009. “From Policyto Polity: Democracy, Paternalism, and the Incorporation ofDisadvantaged Citizens.” Institute for Research on Poverty,Paper 1362–09.
Campbell, Andrea. 2002. “Self-Interest, Social Security and theDistinctive Participation Patterns of Senior Citizens.” Amer-ican Political Science Review 96(3): 565–74.
Campbell, Angus, Philip Converse, Warren Miller, and DonaldStokes. 1960. The American Voter. New York: John Wiley andSons.
Cox, Gary, and Morgan Kousser. 1981. “Turnout and RuralCorruption: New York as a Test Case.” American Journal ofPolitical Science 25(4): 646–63.
Cox, Gary, and Mathew D. McCubbins. 1986. “Electoral Pol-itics as a Redistributive Game.” Journal of Politics 48(2):370–89.
Dixit, Avinash, and John Londregan. 1996. “The Determinantsof Success of Special Interests in Redistributive Politics.”Journal of Politics 58: 1132–55.
Dixit, Avinash, and John Londregan. 1998. “Ideology, Tactics,and Efficiency in Redistributive Politics.” Quarterly Journalof Economics 113: 497–529.
Downton, Mary W., and Roger A. Piekle, Jr. 2001. “Discre-tion without Accountability: Politics, Flood Damage, andClimate.” Natural Hazards Review 2(4): 157–66.
Ferejohn, John. 1986. “Incumbent Performance and ElectoralControl.” Public Choice 50(1): 1–26.
Fiorina, Morris P. 1981. Retrospective Voting in American Na-tional Elections. New Haven, CT: Yale University Press.
Gans-Morse, Jordan, Sebastian Mazzuca, and Simeon Nichter.2009. “Who Gets Bought? Vote Buying, Turnout Buying,and Other Strategies.” Presented at the annual meeting ofthe Midwest Political Science Association.
Garrett, Thomas A., and Russell S. Sobel. 2003. “The PoliticalEconomy of FEMA Disaster Payments.” Economic Inquiry41(3): 496–509.
Gerber, Alan, and Gregory Huber. 2009. “Do PartisanDifferences in Economic Forecasts Predict Real Eco-nomic Behavior?” American Political Science Review 103(3):407–26.
Gerber, Alan S., and Gregory A. Huber. 2010. “Partisanship,Political Control, and Economic Assessments.” AmericanJournal of Political Science 54(1): 153–73.
Groseclose, Tim. 2001. “A Model of Candidate Location WhenOne Candidate Has a Valence Advantage.” American Journalof Political Science 34(4): 862–86.
Heckelman, Jac. 1998. “Bribing Voters without Verification.”Social Science Journal 35: 435–43.
King, Gary, Michael Tomz, and Jason Wittenberg. 2000. “Mak-ing the Most of Statistical Analyses: Improving Interpreta-tion and Presentation.” American Journal of Political Science44(2): 341–55.
Levitt, Steven, and James Snyder. 1997. “The Impact of FederalSpending on House Election Outcomes.” Journal of PoliticalEconomy 105(1): 30–53.
Lipset, Seymour Martin. 1960. Political Man: The Social Basesof Politics. New York: Doubleday.
Matsubayashi, Tetsuya, and Jun-deh Wu. 2009. “Policy Feed-back and Voter Turnout.” Presented at the annual meetingof the Western Political Science Association.
Mettler, Suzanne B. 2005. Soldiers to Citizens: The G.I. Bill andthe Making of the Greatest Generation. New York: OxfordUniversity Press.
Mettler, Suzanne B., and Jeffrey M. Stonecash. 2008. “Gov-ernment Program Usage and Political Voice.” Social ScienceQuarterly 89(2): 273–93.
Morgan, John, and Felix Vardy. 2006. “Corruption, Competi-tion, and Contracts: A Model of Vote Buying.” IMF WorkingPaper.
Nichter, Simeon. 2008. “Vote Buying or Turnout Buying? Ma-chine Politics and the Secret Ballot.” American Political Sci-ence Review 102(1): 19–31.

18 JOWEI CHEN
Pacek, Alexander, and Benjamin Radcliff. 1995. “Economic Vot-ing and the Welfare State: A Cross-National Analysis.” Jour-nal of Politics 57(1): 44–61.
Persson, Torsten, and Guido Tabellini. 2000. Political Economics.Cambridge, MA: MIT Press.
Radcliff, Benjamin. 1992. “The Welfare State, Turnout, and theEconomy.” American Political Science Review 86: 444–56.
Reeves, Andrew. 2011. “Political Disaster: Unilateral Powers,Electoral Incentives, and Presidential Disaster Declarations.”Journal of Politics 73(4): 1142–51.
Schaffer, Frederic Charles. 2002. “Might Cleaning Up ElectionsKeep People Away from the Polls? Historical and Com-parative Perspectives.” International Political Science Review23(1): 69–84.
Soss, Joe. 1999. “Lessons of Welfare: Policy Design, PoliticalLearning and Political Action.” American Political ScienceReview 93(2): 363–80.
Soss, Joe. 2002. Unwanted Claims: The Politics of Participation inthe U.S. Welfare System. Ann Arbor: University of MichiganPress.
Stokes, Susan C. 2005. “Perverse Accountability: A FormalModel of Machine Politics with Evidence from Argentina.”American Political Science Review 99(3): 315–25.
Verba, Sidney, Kay Lehman Schlozman, and Henry E. Brady.1995. Voice and Equality: Civic Voluntarism in American Pol-itics. Cambridge, MA: Harvard University Press.
Verba, Sidney, Kay Lehman Schlozman, Henry Brady, and Nor-man H. Nie. 1993. “Citizen Activity: Who Participates? WhatDo They Say?” American Political Science Review 87(2):303–18.
Wolfinger, Raymond, and Steven Rosenstone. 1980. Who Votes?New Haven, CT: Yale University Press.
Supporting Information
Additional Supporting Information may be found in theonline version of this article:
Table App.1: Partisan Composition of FEMA AidApplicants
Table App.2: Re-estimation of Table 1 Models Using Clus-tered Standard Errors: Effect of FEMA Application Ap-proval on Voter Turnout Among FEMA ApplicantsTable App.3: Effect of FEMA Aid Delivered One WeekBefore the November 2004 ElectionTable App.4: Effect of FEMA Award Size on Voter TurnoutAmong FEMA ApplicantsTable App.5: Alternative Specifications of Logged FEMAAid ModelsTable App.6: Effect of FEMA Responsiveness on VoterTurnout Among ApplicantsTable App.7: Re-estimation of Table 5 Models Using Clus-tered Standard Errors WLS Regression: The Effect ofFEMA Aid on Precinct-Level Bush Vote ShareFigure App.1: Distribution of FEMA Aid AcrossIndividualsFigure App.2: FEMA Aid Recipients for HurricaneCharley (FEMA Disaster #1539)Figure App.3: Hurricane Wind Speeds Experienced byDemocratic and Republican VotersFigure App.4: The Awarding of FEMA Aid by Party, byHome Value Group, and by Hurricane SeverityFigure App.5: Efficacy of FEMA Application Process forDemocratic and Republican ApplicantsFigure App.6: Spatial Autocorrelation of Residuals fromTable 1, Model 4 (Democratic Applicants)Figure App.7: Spatial Autocorrelation of Residuals fromTable 1, Model 5 (Republican Applicants)Figure App.8: Effect of FEMA Aid on Bush Vote Share inDemocratic and Republican PrecinctsThe Formal ModelFormal Model Proofs
Please note: Wiley-Blackwell is not responsible for thecontent or functionality of any supporting materials sup-plied by the authors. Any queries (other than missingmaterial) should be directed to the corresponding authorfor the article.