voxel -based morphometry -the methods · voxel-based morphometry—the methods john ashburner and...
TRANSCRIPT

1eaa
btdmorpchn
NeuroImage 11, 805–821 (2000)doi:10.1006/nimg.2000.0582, available online at http://www.idealibrary.com on
Voxel-Based Morphometry—The MethodsJohn Ashburner and Karl J. Friston
The Wellcome Department of Cognitive Neurology, Institute of Neurology, Queen Square, London WC1N 3BG, United Kingdom
Received October 22, 1999
At its simplest, voxel-based morphometry (VBM) in-volves a voxel-wise comparison of the local concentra-tion of gray matter between two groups of subjects.The procedure is relatively straightforward and in-volves spatially normalizing high-resolution imagesfrom all the subjects in the study into the same stereo-tactic space. This is followed by segmenting the graymatter from the spatially normalized images andsmoothing the gray-matter segments. Voxel-wise para-metric statistical tests which compare the smoothedgray-matter images from the two groups are per-formed. Corrections for multiple comparisons aremade using the theory of Gaussian random fields. Thispaper describes the steps involved in VBM, with par-ticular emphasis on segmenting gray matter from MRimages with nonuniformity artifact. We provide eval-uations of the assumptions that underpin the method,including the accuracy of the segmentation and theassumptions made about the statistical distribution ofthe data. © 2000 Academic Press
INTRODUCTION
A number of studies have already demonstratedstructural brain differences among different patientpopulations using the technique of voxel-based mor-phometry (VBM) (Wright et al., 1995, 1999; Vargha-Khadem et al., 1998; Shah et al., 1998; Krams et al.,999; Abell et al., 1999; Woermann et al., 1999; Sowellt al., 1999; May et al., 1999). This paper summarizes,nd introduces some advances to, existing methodsnd provides evaluations of its components.Studies of brain morphometry have been carried out
y many researchers on a number of different popula-ions, including patients with schizophrenia, autism,yslexia, and Turner’s syndrome. Often, the morpho-etric measurements used in these studies have been
btained from brain regions that can be clearly defined,esulting in a wealth of findings pertaining to thesearticular measurements. These measures are typi-ally volumes of unambiguous structures such as theippocampi or the ventricles. However, there are aumber of morphometric features that may be more
805
difficult to quantify by inspection, meaning that manystructural differences may be overlooked. The impor-tance of the VBM approach is that it is not biased toone particular structure and gives an even-handed andcomprehensive assessment of anatomical differencesthroughout the brain.
Computational Neuroanatomy
With the increasing resolution of anatomical scans ofthe human brain and the sophistication of image pro-cessing techniques there have emerged, recently, alarge number of approaches to characterizing differ-ences in the shape and neuroanatomical configurationof different brains. One way to classify these ap-proaches is to broadly divide them into those that dealwith differences in brain shape and those that dealwith differences in the local composition of brain tissueafter macroscopic differences in shape have been dis-counted. The former use the deformation fields thatmap any individual brain onto some standard refer-ence as the characterization of neuroanatomy, whereasthe latter compare images on a voxel basis after thedeformation fields have been used to spatially normal-ize the images. In short, computational neuroanatomictechniques can either use the deformation fields them-selves or use these fields to normalize images that arethen entered into an analysis of regionally specific dif-ferences. In this way, information about overall shape(deformation fields) and residual anatomic differencesinherent in the data (normalized images) can be parti-tioned.
Deformation-Based and Tensor-Based Morphometry
We will use deformation-based and tensor-basedmorphometry in reference to methods for studyingbrain shapes that are based on deformation fields ob-tained by nonlinear registration of brain images. Whencomparing groups, deformation-based morphometry(DBM) uses deformation fields to identify differences inthe relative positions of structures within the subjects’brains, whereas we use the term tensor-based mor-phometry to refer to those methods that localize differ-ences in the local shape of brain structures (see Fig. 1).
1053-8119/00 $35.00Copyright © 2000 by Academic Press
All rights of reproduction in any form reserved.

sGiam
awpmma
806 ASHBURNER AND FRISTON
Characterization using DBM can be global, pertain-ing to the entire field as a single observation, or canproceed on a voxel-by-voxel basis to make inferencesabout regionally specific positional differences. Thissimple approach to the analysis of deformation fieldsinvolves treating them as vector fields representingabsolute displacements. However, in this form, in ad-dition to the shape information that is of interest, thevector fields also contain information on position andsize that is likely to confound the analysis. Much of theconfounding information can be removed by global ro-tations, translations, and a zoom of the fields in orderto analyze the Procrustes shape (Bookstein, 1997a) ofthe brain.
DBM can be applied on a coarse (global) scale tosimply identify whether there is a significant differ-ence in the global shapes (based on a small number ofparameters) among the brains of different populations.Generally, a single multivariate test is performed us-ing the parameters describing the deformations—usu-ally after parameter reduction using singular valuedecomposition. The Hotelling’s T2 statistic can be usedfor simple comparisons between two groups of subjects(Bookstein, 1997a, 1999), but for more complex exper-imental designs, a multivariate analysis of covariancecan be used to identify differences via the Wilk’s lstatistic (Ashburner et al., 1998).
The alternative approach to DBM involves producinga statistical parametric map that locates any regions ofsignificant positional differences among the groups ofsubjects. An example of this approach involves using a
2
FIG. 1. We refer to deformation-based morphometry to describemethods of studying the positions of structures within the brain(left), whereas we use the term tensor-based morphometry for look-ing at local shapes (right). Currently, the main application of tensor-based morphometry involves using the Jacobian determinants toexamine the relative volumes of different structures. However, thereare other features of the Jacobian matrices that could be used, suchas those representing elongation and contraction in different direc-tions. The arrows in the image on the left show absolute displace-ments after making a global correction for rotations and transla-tions, whereas the ellipses on the right show how the same circleswould be distorted in different parts of the brain.
voxel-wise Hotelling’s T test on the vector field de- f
cribing the displacements (Thompson and Toga, 1999;aser et al., 1999) at each and every voxel. The signif-
cance of any observed differences can be assessed byssuming that the statistic field can then be approxi-ated by a T2 random field (Cao and Worsley, 1999).
Note that this approach does not directly localize brainregions with different shapes, but rather identifiesthose brain structures that are in relatively differentpositions.
In order to localize structures whose shapes differbetween groups, some form of tensor-based morphom-etry (TBM) is required to produce statistical paramet-ric maps of regional shape differences. A deformationfield that maps one image to another can be considereda discrete vector field. By taking the gradients at eachelement of the field, a Jacobian matrix field is obtained,in which each element is a tensor describing the rela-tive positions of the neighboring elements. Morphomet-ric measures derived from this tensor field can be usedto locate regions with different shapes. The field ob-tained by taking the determinants at each point givesa map of the structure volumes relative to those of areference image (Freeborough and Fox, 1998; Gee andBajcsy, 1999). Statistical parametric maps of these de-terminant fields (or possibly their logs) can then beused to compare the anatomy of groups of subjects.Other measures derived from the tensor fields havealso been used by other researchers, and these aredescribed by Thompson and Toga (1999).
Voxel-Based Morphometry
The second class of techniques, which are applied tosome scalar function of the normalized image, are re-ferred to as voxel-based morphometry. The most prev-alent example of this sort of approach, described in thispaper, is the simple statistical comparison of gray mat-ter partitions following segmentation. Other variantswill be discussed later. Currently, the computationalexpense of computing very high resolution deformationfields (required for TBM at small scales) makes voxel-based morphometry a simple and pragmatic approachto addressing small-scale differences that is within thecapabilities of most research units.
Overview
This paper describes the steps involved in voxel-based morphometry using the SPM99 package (avail-ble from http://www.fil.ion.ucl.ac.uk). Following thise provide evaluations of the assumptions that under-in the method. This includes the accuracy of the seg-entation and the assumptions made about the nor-ality of the data. The paper ends with a discussion
bout the limitations of the method and some possible
uture directions.
807VOXEL-BASED MORPHOMETRY
VOXEL-BASED MORPHOMETRY
Voxel-based morphometry of MRI data involves spa-tially normalizing all the images to the same stereo-tactic space, extracting the gray matter from the nor-malized images, smoothing, and finally performing astatistical analysis to localize, and make inferencesabout, group differences. The output from the methodis a statistical parametric map showing regions wheregray matter concentration differs significantly betweengroups.
Spatial Normalization
Spatial normalization involves transforming all thesubjects’ data to the same stereotactic space. This isachieved by registering each of the images to the sametemplate image, by minimizing the residual sum ofsquared differences between them. In our implementa-tion, the first step in spatially normalizing each imageinvolves matching the image by estimating the opti-mum 12-parameter affine transformation (Ashburneret al., 1997). A Bayesian framework is used, wherebythe maximum a posteriori estimate of the spatial trans-formation is made using prior knowledge of the normalvariability of brain size. The second step accounts forglobal nonlinear shape differences, which are modeledby a linear combination of smooth spatial basis func-tions (Ashburner and Friston, 1999). The nonlinearregistration involves estimating the coefficients of thebasis functions that minimize the residual squareddifference between the image and the template, whilesimultaneously maximizing the smoothness of the de-formations.
It should be noted that this method of spatial nor-malization does not attempt to match every corticalfeature exactly, but merely corrects for global brainshape differences. If the spatial normalization was per-fectly exact, then all the segmented images would ap-pear identical and no significant differences would bedetected: VBM tries to detect differences in the re-gional concentration of gray matter at a local scalehaving discounted global shape differences.
It is important that the quality of the registration isas high as possible and that the choice of the templateimage does not bias the final solution. An ideal tem-plate would consist of the average of a large number ofMR images that have been registered to within theaccuracy of the spatial normalization technique. Thespatially normalized images should have a relativelyhigh resolution (1 or 1.5 mm isotropic voxels), so thatthe gray matter extraction method (described next) isnot excessively confounded by partial volume effects, inwhich voxels contain a mixture of different tissue
types.Image Partitioning with Correctionfor Smooth Intensity Variations
The spatially normalized images are next parti-tioned into gray matter (GM), white matter (WM), ce-rebrospinal fluid (CSF), and three other backgroundclasses, using a modified mixture model cluster analy-sis technique. We have extended a previously describedtissue classification method (Ashburner and Friston,1997) so that it includes a correction for image inten-sity nonuniformity that arises for many reasons in MRimaging. Because the tissue classification is based onvoxel intensities, the partitions derived using the oldermethod can be confounded by these smooth intensityvariations. Details of the improved segmentationmethod are provided in the Appendix.
Preprocessing of Gray Matter Segments
The gray matter images are now smoothed by con-volving with an isotropic Gaussian kernel. This makesthe subsequent voxel-by-voxel analysis comparable toa region of interest approach, because each voxel in thesmoothed images contains the average concentration ofgray matter from around the voxel (where the regionaround the voxel is defined by the form of the smooth-ing kernel). This is often referred to as “gray matterdensity,” but should not be confused with cell packingdensity measured cytoarchitectonically. We will referto “concentration” to avoid confusion. By the centrallimit theorem, smoothing also has the effect of render-ing the data more normally distributed, increasing thevalidity of parametric statistical tests. Whenever pos-sible, the size of the smoothing kernel should be com-parable to the size of the expected regional differencesbetween the groups of brains. The smoothing step alsohelps to compensate for the inexact nature of the spa-tial normalization.
Logit Transform
In effect, each voxel in the smoothed image segmentsrepresents the local concentration of the tissue (be-tween 0 and 1). Often, prior to performing statisticaltests on measures of concentration, the data are trans-formed using the logit transformation in order to ren-der them more normally distributed. The logit trans-formation of a concentration p is given by
logit~p! 51
2logeS p
1 2 pD .
For concentrations very close to either 1 or 0, it canbe seen that the logit transform rapidly approachesinfinite values. Because of this instability, it is advis-able to exclude voxels from subsequent analyses that
are too close to one or the other extreme. An improved
Gestddt
ltu(wm
m
808 ASHBURNER AND FRISTON
model for the data can be estimated using logisticregression (Taylor et al., 1998), but this is beyond thescope of this paper as it requires iterative reweightedleast-squares methods. Whether the logit transform isa necessary processing step for voxel-based morphom-etry will be addressed later.
Statistical Analysis
Statistical analysis using the general linear model(GLM) is used to identify regions of gray matter con-centration that are significantly related to the partic-ular effects under study (Friston et al., 1995b). The
LM is a flexible framework that allows many differ-nt tests to be applied, ranging from group compari-ons and identifying regions of gray matter concentra-ion that are related to specified covariates such asisease severity or age to complex interactions betweenifferent effects of interest. Standard parametric sta-istical procedures (t tests and F tests) are used to test
the hypotheses, so they are valid providing the resid-uals, after fitting the model, are independent and nor-mally distributed. If the statistical model is appropri-ate there is no reason why the residuals should not beindependent, but there are reasons why they may notbe normally distributed. The original segmented im-ages contain values between 0 and 1, of which most ofthe values are very close to either of the extremes. Onlyby smoothing the segmented images does the behaviorof the residuals become more normally distributed.
Following the application of the GLM, the signifi-cance of any differences is ascertained using the theoryof Gaussian random fields (Worsley et al., 1996; Fristonet al., 1995a). A voxel-wise statistical parametric map(SPM) comprises the result of many statistical tests,and it is necessary to correct for these multiple depen-dent comparisons.
EVALUATIONS
A number of assumptions need to hold in order forVBM to be valid. First of all, we must be measuring theright thing. In other words, the segmentation mustcorrectly identify gray and white matter, and conse-quently we have included an evaluation of the segmen-tation method. Also, confounding effects must be elim-inated or modeled as far as possible. For example, it isnot valid to compare two different groups if the imageswere acquired on two different scanners or with differ-ent MR sequences. In cases such as this, any groupdifferences may be attributable to scanner differencesrather than to the subjects themselves. Subtle but sys-tematic differences in image contrast or noise can eas-ily become statistically significant when a large num-ber of subjects are entered in a study. A third issue ofvalidity concerns the assumptions required by the sta-
tistical tests. For parametric tests, it is important that tthe data are normally distributed. If the data are notwell behaved, then it is important to know what theeffects are on the statistical tests. If there is doubtabout the validity of the assumptions, it is better to usea nonparametric statistical analysis (Holmes et al.,1996).
Evaluation of Segmentation
In order to provide a qualitative example of the seg-mentation, Fig. 2 shows a single sagittal slice throughsix randomly chosen T1-weighted images. The initialregistration to the prior probability images was via anautomatically estimated 12-parameter affine transfor-mation (Ashburner et al., 1997). The images were au-tomatically segmented using the method describedhere, and contours of extracted gray and white matterare shown superimposed on the images.
In order to function properly, the segmentationmethod requires good contrast between the differenttissue types. However, many central gray matter struc-tures have image intensities that are almost indistin-guishable from that of white matter, so the tissue clas-sification is not very accurate in these regions. Anotherproblem is that of partial volume. Because the modelassumes that all voxels contain only one tissue type,the voxels that contain a mixture of tissues may not bemodeled correctly. In particular, those voxels at theinterface between white matter and ventricles will of-ten appear as gray matter. This can be seen to a smallextent in Figs. 2 and 3.
A Comparison of the Segmentation—With andwithout Nonuniform Sensitivity Correction
Segmentation was evaluated using a number of sim-ulated images (181 3 217 3 181 voxels of 1 3 1 3 1mm) of the same brain generated by the BrainWebsimulator (Cocosco et al., 1997; Kwan et al., 1996; Col-ins et al., 1998) with 3% noise (relative to the brightestissue in the images). The contrasts of the images sim-lated T1-weighted, T2-weighted, and proton densityPD) images (all with 1.5-T field strength), and theyere segmented individually and in a multispectralanner.1 The T1-weighted image was simulated as a
spoiled FLASH sequence, with a 30° flip angle, 18-msrepeat time, 10-ms echo time. The T2 and PD imageswere simulated by a dual echo spin echo technique,with 90° flip angle, 3300-ms repeat time, and echotimes of 35 and 120 ms. Three different levels of imagenonuniformity were used: 0%RF—which assumes thatthere is no intensity variation artifact, 40%RF—whichassumes a fairly typical amount of nonuniformity, and100%RF—which is more nonuniformity than would
1 Note that different modulation fields that account for nonunifor-ity (see Appendix) were assumed for each image of the multispec-
ral data sets.

a
cg
cte
809VOXEL-BASED MORPHOMETRY
normally be expected. The simulated images were seg-mented, both with and without sensitivity correction(see Appendix for further details). Three partitionswere considered in the evaluation: gray matter, whitematter, and other (not gray or white), and each voxelwas assigned to the most likely partition. Because thedata from which the simulated images were derivedwere available, it was possible to compare the seg-mented images with images of “true” gray and whitematter using the k statistic (a measure of interratergreement),
k 5p0 2 pe
1 2 pe,
where p0 is the observed proportion of agreement andpe is the expected proportion of agreements by chance.If there are N observations in K categories, the ob-served proportional agreement is
p0 5 Ok51
K
fkk/N,
where fkk is the number of agreements for the kthategory. The expected proportion of agreements isiven by
pe 5 OK rkck/N 2,
FIG. 2. A single sagittal slice through six T1-weighted images (time, 4 ms echo time, and 0.6 ms inversion time). Contours of extra
k51
where rk and ck are the total number of voxels in thekth class for both the “true” and the estimated parti-tions.
The classification of a single plane of the simulatedT1-weighted BrainWeb image with the nonuniformityis illustrated in Fig. 3. It should be noted that nopreprocessing to remove scalp or other nonbrain tissuewas performed on the image. In theory, the segmenta-tion method should produce slightly better results ofthis nonbrain tissue is excluded from the computa-tions. As the algorithm stands, a small amount of non-brain tissue remains in the gray matter segment,which has arisen from voxels that lie close to graymatter and have similar intensities.
The resulting k statistics from segmenting the dif-ferent simulated images are shown in Table 1. Theseresults show that the nonuniformity correction madelittle difference to the tissue classification of the im-ages without any nonuniformity artifact. For imagescontaining nonuniformity artifact, the segmentationsusing the correction were of about the same quality asthe segmentations without the artifact and very muchbetter than the segmentations without the correction.
A by-product of the segmentation is the estimation ofan intensity nonuniformity field. Figure 4 shows a com-parison of the intensity nonuniformity present in asimulated T1 image with 100% nonuniformity (createdby dividing noiseless simulated images with 100% non-uniformity and no nonuniformity) with that recovered
scanner, with an MPRAGE sequence, 12° tip angle, 9.7 ms repeatd gray and white matter are shown superimposed on the images.
2-T
by the segmentation method. A scatterplot of “true”

810 ASHBURNER AND FRISTON
versus recovered nonuniformity shows a straight line,suggesting that the accuracy of the estimated nonuni-formity is very good.
Stability with Respect to Misregistrationwith the a Priori Images
In order for the Bayesian segmentation to work prop-erly, the image volume must be in register with a setof a priori probability images used to instate the pri-
FIG. 3. The classification of the simulated BrainWeb image. Thenonuniformity and the nonuniformity corrected version. From left tmatter used for the segmentation, gray matter segmented withoutcorrection, and the “true” distribution of gray matter (from which thmiddle, except that it shows white matter rather than gray. Withouwhite matter in posterior areas to be classified as gray. This was alsthe inferior–superior direction.
TAB
Single image
T1 T2 PD
0%RF—uncorrected 0.95 0.90 0.900%RF—corrected 0.95 0.90 0.9040%RF—uncorrected 0.92 0.88 0.7940%RF—corrected 0.95 0.90 0.90100%RF—uncorrected 0.85 0.85 0.67100%RF—corrected 0.94 0.90 0.88
Note. The different k statistics that were computed after segmenting
ors. Here we examine the effects of misregistration onthe accuracy of the segmentation, by artificially trans-lating (in the left–right direction) the prior probabilityimages by different distances prior to segmenting thewhole simulated volume. The 1-mm slice thickness,40% nonuniformity, and 3% noise simulated T1-weighted image (described above) was used for thesegmentation, which included the nonuniformity cor-rection. The k statistic was computed with respect to
row shows the original simulated T1-weighted MR image with 100%ight, the middle row shows the a priori spatial distribution of grayuniformity correction, gray matter segmented with nonuniformityimulated images were derived). The bottom row is the same as theonuniformity correction, the intensity variation causes some of theery apparent in the cerebellum because of the intensity variation in
1
Multispectral
T2/PD T1/T2 T1/PD T1/T2/PD
0.93 0.94 0.96 0.940.93 0.94 0.96 0.950.90 0.93 0.95 0.940.93 0.94 0.96 0.940.87 0.92 0.94 0.930.92 0.93 0.95 0.94
topo rnone st no v
LE
the simulated images are shown.

bHsp
m
aus
811VOXEL-BASED MORPHOMETRY
the true gray and white matter for the different trans-lations, and the results are plotted in Fig. 5.
In addition to illustrating the effect of misregistra-tion, this also gives an indication of how far a brain candeviate from the normal population of brains (that
FIG. 4. Top left: The true intensity nonuniformity field of thesegmentation algorithm. Bottom left: The recovered divided by thnonuniformity versus recovered nonuniformity, derived from voxelsNote that the plot is a straight line, but that its gradient is not bec
FIG. 5. Segmentation accuracy with respect to misregistration
twith the a priori images.constitute the prior probability images) in order for itto be segmented adequately. Clearly, if the brain can-not be adequately registered with the probability im-ages, then the segmentation will not be as accurate.This also has implications for severely abnormalbrains, as these are more difficult to register with theimages that represent the prior probabilities of voxelsbelonging to different classes. Segmenting these abnor-mal brains can be a problem for the algorithm, as theprior probability images are based on normal healthybrains. Clearly the profile in Fig. 5 depends on thesmoothness or resolution of the a priori images. By notsmoothing the a priori images, the segmentation woulde optimal for normal, young, and healthy brains.owever, the prior probability images may need to be
moother in order to encompass more variability whenatient data are to be analyzed.
Evaluation of the Assumptions about NormallyDistributed Data
The statistics used to identify structural differencesake the assumption that the residuals after fitting
ulated T1 image. Top right: The nonuniformity recovered by thetrue nonuniformity. Bottom right: A scatterplot of true intensityoughout the whole volume classified as either white or gray matter.e it is not possible to recover the absolute scaling of the field.
sime
thr
he model are normally distributed. Statistics cannot

dt
wilnushpiao
ws
812 ASHBURNER AND FRISTON
prove that data are normally distributed—it can onlybe used to disprove the hypothesis that they are nor-mal. For normally distributed data, a Q-Q plot of thedata should be a straight line. A significant deviationfrom a straight line can be identified by computing thecorrelation coefficient of the plot as described by John-son and Wichern (1998).
A Q-Q plot is a plot of the sample quantile versus thesample quantile that would be expected if the residualswere normally distributed. Computing the samplequantile involves first sorting the J residuals (after
ividing by the square root of the diagonal elements ofhe residual forming matrix) into increasing order (x1,
x2, . . . , xJ). The inverse cumulative distribution of eachof the J elements is then computed as
qj 5 Î2 erfinvS2j 2 3
8
J 1 14
2 1D ,
here erfinv is the inverse error function. A Q-Q plots simply a plot of q versus x and should be a straightine if the data in x are normally distributed. To testormality, the correlation coefficient for the Q-Q plot issed to test for any significant deviation from atraight line. A lookup table is used to reject the nullypothesis if the correlation coefficient falls below aarticular value, given a certain sample size. However,n this paper we simply use the correlation coefficients a “normality statistic” and examine its distributionver voxels.The data used to test the assumptions were T1-eighted MRI scans of 50 normal male right-handed
FIG. 6. Histograms of correlation coefficients taken over the whintensity over all images was greater than 0.05). The dotted linesnormally distributed. The solid lines show the histograms of the dataobtained using the logit transformed data. The plot on the left is baswhereas that on the right does model this confounding effect.
ubjects ages between 17 and 62 (median 26, mean 29),
whose structural scans had been acquired as part of anongoing program of functional imaging research. Thescans were performed on a Siemens Magnetom Visionscanner operating at 2 T. An MPRAGE sequence wasused with a 12° tip angle, 9.7-ms repeat time, 4-msecho time, and 0.6-ms inversion time, to generate sag-ittal images of the whole brain with voxel sizes of 1 31 3 1.5 mm. The images were spatially normalized,segmented, and smoothed using a Gaussian kernel of12 mm full width at half-maximum (FWHM).
Voxel-by-voxel correlation coefficients of the Q-Qplots were computed over all voxels of the data forwhich the mean intensity over all images was greaterthan 0.05. Voxels of low mean intensity were excludedfrom the computations, because they would not be in-cluded in the VBM analysis. This is because we knowthat these low-intensity voxels are most likely to devi-ate most strongly from the assumptions about normal-ity. Q-Q plots were computed using two different linearmodels. The first model involved looking at the resid-uals after fitting the mean, whereas the second wasmore complex, in that it also modeled the confoundingeffect of the total amount of gray matter in each vol-ume. Q-Q plots were computed both with and withoutthe logit transform. Histograms of the correlation co-efficients were computed over the whole-image vol-umes (717,191 voxels), along with histograms gener-ated from simulated Gaussian noise. These are plottedin Fig. 6 and show that the data do deviate slightlyfrom normally distributed. The logit transform ap-peared to make the residuals slightly more normallydistributed. The normality of the residuals was alsoimproved by modeling the total amount of gray matter
image volumes (using a total of 717,191 voxels for which the meanthe histograms that would be expected if the data were perfectly
thout the logit transform, and the dashed lines show the histogramsn the model that does not include global gray matter as a confound,
ole-arewi
ed o
as a confounding effect.
twfawbSvdsmffbpft
npvtcu(P
u
813VOXEL-BASED MORPHOMETRY
Testing the Rate of False Positives Using Randomization
The previous section showed that the data are notquite normally distributed, but it does not show howthe nonnormality influences any subsequent statistics.
Ultimately, we wish to protect against false-positiveresults, and in this part of the paper, we test howfrequently they arise. The statistics were evaluatedusing the same preprocessed structural brain images of50 subjects as were used in the previous section. Thesubjects were randomly assigned, with replacement, totwo groups of 12 and 38, and statistical tests performedusing SPM99b (Wellcome Department of CognitiveNeurology, London, UK) to compare the groups. Thenumbers in the groups were chosen as many studiestypically involve comparing about a dozen patientswith a larger group of control subjects. This was re-peated a total of 50 times, looking for both significantincreases and decreases in the gray matter concentra-tion of the smaller group. The end result is a series of100 parametric maps of the t statistic. Within each ofhese SPMs, the local maxima of the t statistic fieldere corrected for the number of dependent tests per-
ormed, and a P value was assigned to each (Friston etl., 1995a). Using a corrected threshold of P 5 0.05, weould expect about five local maxima with P valueselow this threshold by chance alone. Over the 100PMs, there were six local maxima with corrected Palues below 0.05. The same 50 subjects were ran-omly assigned to either of the two groups and thetatistics performed a further 50 times, but this timeodeling the total amount of gray matter as a con-
ounding effect. The results of this analysis producedour significant local maxima with corrected P valueselow 0.05. These results suggest that the inferencerocedures employed are robust to the mild deviationsrom normality incurred by using smooth image parti-ions.
Another test available within SPM is based on theumber of connected voxels in a cluster defined by arespecified threshold (extent statistic). In order to bealid, this test requires the smoothness of the residualso be spatially invariant, but this is known not to be thease by virtue of the highly nonstationary nature of thenderlying neuroanatomy. As noted by Worsley et al.
1999), this nonstationary smoothness leads to inexactvalues.
The reason is simply this: by chance alone, large size clusterswill occur in regions where the images are very smooth, andsmall size clusters will occur in regions where the image is veryrough. The distribution of cluster sizes will therefore be con-siderably biased towards more extreme cluster sizes, resultingin more false positive clusters in smooth regions. Moreover,true positive clusters in rough regions could be overlookedbecause their sizes are not large enough to exceed the criticalsize for the whole region.
Corrected probability values were assigned to each
cluster based on the number of connected voxels ex-ceeding a t value of 3.27 (spatial extent test). Approx-imately 5 significant clusters would be expected fromthe 100 SPMs if the smoothness was stationary. Eigh-teen significant clusters were found when the totalamount of gray matter was not modeled as a confound,and 14 significant clusters were obtained when it was.These tests confirmed that the voxel-based extent sta-tistic should not be used in VBM.
Under the null hypothesis, repeatedly computed tstatistics should assume the probability density func-tion of the Student t distribution. This was verified
sing the computed t fields, of which each t field con-tains 717,191 voxels. Plots of the resulting histogramsare shown in Fig. 7. The top row presents distributionswhen global differences in gray matter were not re-moved as a confound. Note that global variance biasesthe distributions of t values from any particular com-parison.
Further experiments were performed to test whetherfalse positives occurred evenly throughout the brain orwere more specific to particular regions. The tests weredone on a single slice through the same 50 subjects’preprocessed brain images, but used the total count ofgray matter in the brains as a confound. Each subjectwas randomly assigned to two groups of 12 and 38,pixel-by-pixel two-tailed t tests were done, and loca-tions of t scores higher than 3.2729 or lower than23.2729 were recorded (corresponding to an uncor-rected probability of 0.002). This procedure was re-peated 10,000 times, and Fig. 8 shows an image of thenumber of false positives occurring at each of the10,693 pixels. Visually, the false positives appear to beuniformly distributed. According to the theory, thenumber of false positives occurring at each pixel shouldbe 20 (10,000 3 0.002). An average of 20.171 falsepositives was found, showing that the validity of sta-tistical tests based on uncorrected t statistics is notseverely compromised.
DISCUSSION
Possible Improvements to the Segmentation
One of the analytic components described in thispaper is an improved method of segmentation that isable to correct for image nonuniformity that is smoothin all three dimensions. The method has been found tobe robust and accurate for high-quality T1-weightedimages, but is not beyond improvement. Currently,each voxel is assigned a probability of belonging to aparticular tissue class based only on its intensity andinformation from the prior probability images. There isa great deal of other information that could be incor-porated into the classification. For example, we knowthat if all a voxel’s neighbors are gray matter, thenthere is a high probability that it should also be gray
matter. Other researchers have successfully used
Tfa
814 ASHBURNER AND FRISTON
Markow random field models to include this informa-tion in the tissue classification model (Vandermeulenet al., 1996; Van Leemput et al., 1999b). A very simpleprior, that can be incorporated, is the relative intensityof the different tissue types. For example, if we aresegmenting a T1-weighted image, we know that thewhite matter should have a higher intensity than thegray matter, which in turn should be more intensethan that of the CSF. When computing the means for
FIG. 7. Histograms of t scores from randomly generated tests. Toa mean effect as a confound (47 degrees of freedom). Left: 50 histog
he mean (i.e., cumulative distribution over all voxels and volumes) ounction of the Student t distribution for 47/48 degrees of freedom islogarithmic scale.
FIG. 8. Left: Mean of 50 subjects’ preprocessed brain images. Rig
0.002 level, after 10,000 randomizations.each cluster, this prior information could sensibly beused to bias the estimates.
The Effect of Spatial Normalization
Because of the nonlinear spatial normalization, thevolumes of certain brain regions will grow, whereasothers will shrink. This has implications for the inter-pretation of what VBM is actually testing for. The
ot modeling mean effect (48 degrees of freedom). Bottom: Modelings of t scores testing randomly generated effects of interest. Center:e 50 histograms is plotted as a solid line, and the probability densitywn by the dotted line. Right: The same as center, except plotted on
Number of false positives occurring at each voxel at the uncorrected
p: Nramf thsho
ht:

a
815VOXEL-BASED MORPHOMETRY
objective of VBM is to identify regional differences inthe concentration of a particular tissue (gray or whitematter). In order to preserve the actual amounts ofgray matter within each structure, a further process-ing step that multiplies the partitioned images by therelative voxel volumes can be incorporated. These rel-ative volumes are simply the Jacobian determinants ofthe deformation field. This augmented VBM can there-fore be considered a combination of VBM and TBM, inwhich the TBM employs the testing of the Jacobiandeterminants. VBM can be thought of as comparing therelative concentration of gray matter (i.e., the propor-tion of gray matter to other tissue types within a re-gion). With the adjustment for volume change, VBMwould be comparing the absolute amounts of gray mat-ter in the different regions. As mentioned under “Spa-tial Normalization,” if the spatial normalization wasperfect, then no gray matter differences would be ob-served if a volume change adjustment was not applied.In this instance, all the information would be in thedeformation fields and would be tested using TBM.However, if the spatial normalization is only removingglobal differences in brain shape, the results of VBMshow relative gray matter concentration differences.As faster and more precise registration methodsemerge, then a TBM volume change adjustment maybecome more important. It is envisaged that, by incor-porating this correction, a continuum will arise withsimple VBM (with low-resolution spatial normaliza-tion) at one end of the methodology spectrum and sta-tistical tests based on Jacobian determinants at theother (with high-resolution spatial normalization).
Another perspective on what VBM is actually com-paring can be obtained by considering how a similaranalysis would be done using volumes of interest(VOI). To simplify the analogy, consider that thesmoothing kernel is the shape of a sphere (values of 1inside and 0 outside) rather than a 3D Gaussian pointspread function. After an image is convolved with thiskernel, each voxel in the smoothed image will contain acount of the gray matter voxels from the surroundingspherical VOI. Now consider the effects of the spatialnormalization and where the voxels within each VOIcome from in the original gray matter images. Thespheres can be thought of as being projected onto theoriginal anatomy, but in doing so, their shapes andsizes will be distorted. Without multiplying by the rel-ative voxel sizes, what would be measured would be theproportion of gray matter within each projected VOI(relative to other tissue types). With the multiplication,the total amount of gray matter within the VOI is beingmeasured.
Multivariate Voxel-Based Morphometry
Ideally, a procedure like VBM should be able to
utomatically identify any structural abnormalities ina single brain image. However, even with many hun-dreds of subjects in a database of controls, as it stands,the method may not be powerful enough to detect sub-tle abnormalities in individuals. A possibly more pow-erful procedure would be to use some form of voxel-wisemultivariate approach. Within a multivariate frame-work, in addition to images of gray matter concentra-tion, other image features would be included. The firstobvious feature to be included would be white matterconcentration. Other features could include local indi-ces of gyrification such as the curvature of the graymatter segment, image gradients, and possibly infor-mation from the spatial normalization procedure. Witha larger database of controls, more image features canbe included without seriously impacting on the degreesof freedom of the model. The Hotelling’s T2 test couldbe used to perform simple comparisons between twogroups. However, for more complex models, the moregeneral multivariate analysis of covariance would benecessary. By doing this, VBM and tensor-based mor-phometric techniques can be combined in order to pro-vide a more powerful method of localizing regionalabnormalities.
CONCLUSIONS
This paper has considered the various components ofvoxel-based morphometry. We have described andevaluated an improved method of MR image segmen-tation, showing that the modifications do improve thesegmentation of images with intensity nonuniformityartifact. In addition, we tested some of the assumptionsnecessary for the parametric statistical tests used bySPM99 to implement VBM. We demonstrated that thedata used for these analyses are not exactly normallydistributed. However, no evidence was found to sup-pose that (with 12-mm FWHM smoothed data) uncor-rected statistical tests or corrected statistical infer-ences based on peak height are invalid. We found thatthe statistic based on cluster spatial extent is not validfor VBM analysis, suggesting a violation of the station-ariness assumptions upon which this test is based.Until the spatial extent test has been modified to ac-commodate nonstationary smoothness, then VBMshould not use cluster size to assess significance (thepeak height test has already been modified).
APPENDIX
The Tissue Classification Method
Although we actually use a three-dimensional imple-mentation of the tissue classification method, whichcan also be applied to multispectral images, we willsimplify the explanation of the algorithm by describingits application to a single two-dimensional image.
The tissue classification model makes a number of
assumptions. The first is that each of the I 3 J voxels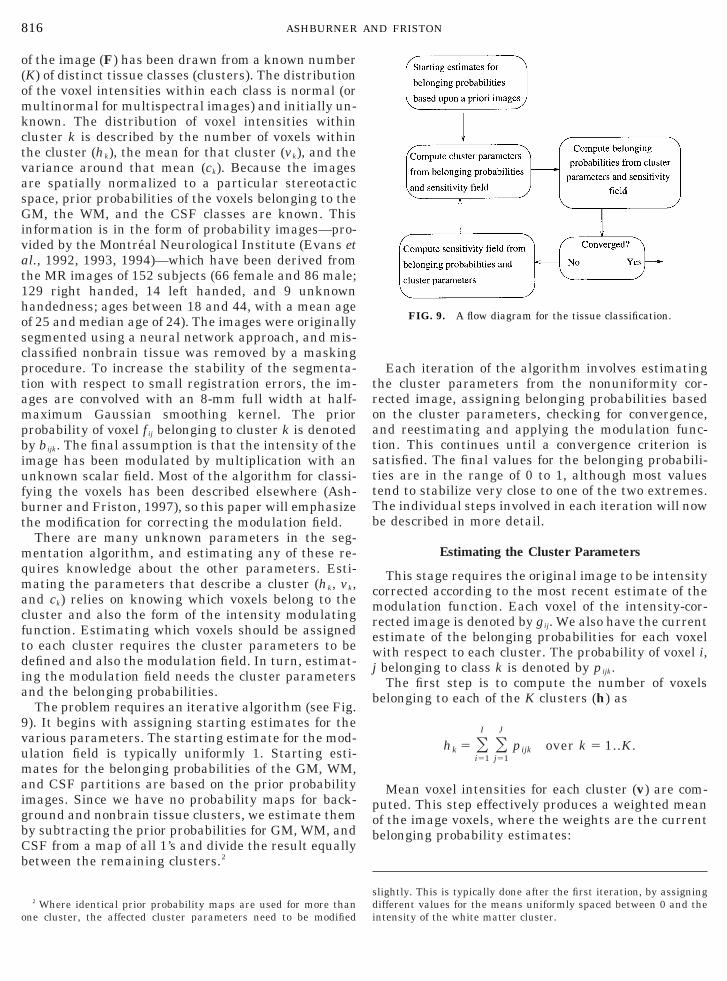
asGiv
iufbt
mqm
816 ASHBURNER AND FRISTON
of the image (F) has been drawn from a known number(K) of distinct tissue classes (clusters). The distributionof the voxel intensities within each class is normal (ormultinormal for multispectral images) and initially un-known. The distribution of voxel intensities withincluster k is described by the number of voxels withinthe cluster (hk), the mean for that cluster (vk), and thevariance around that mean (ck). Because the imagesre spatially normalized to a particular stereotacticpace, prior probabilities of the voxels belonging to theM, the WM, and the CSF classes are known. This
nformation is in the form of probability images—pro-ided by the Montreal Neurological Institute (Evans et
al., 1992, 1993, 1994)—which have been derived fromthe MR images of 152 subjects (66 female and 86 male;129 right handed, 14 left handed, and 9 unknownhandedness; ages between 18 and 44, with a mean ageof 25 and median age of 24). The images were originallysegmented using a neural network approach, and mis-classified nonbrain tissue was removed by a maskingprocedure. To increase the stability of the segmenta-tion with respect to small registration errors, the im-ages are convolved with an 8-mm full width at half-maximum Gaussian smoothing kernel. The priorprobability of voxel fij belonging to cluster k is denotedby bijk. The final assumption is that the intensity of themage has been modulated by multiplication with annknown scalar field. Most of the algorithm for classi-
ying the voxels has been described elsewhere (Ash-urner and Friston, 1997), so this paper will emphasizehe modification for correcting the modulation field.
There are many unknown parameters in the seg-entation algorithm, and estimating any of these re-
uires knowledge about the other parameters. Esti-ating the parameters that describe a cluster (hk, vk,
and ck) relies on knowing which voxels belong to thecluster and also the form of the intensity modulatingfunction. Estimating which voxels should be assignedto each cluster requires the cluster parameters to bedefined and also the modulation field. In turn, estimat-ing the modulation field needs the cluster parametersand the belonging probabilities.
The problem requires an iterative algorithm (see Fig.9). It begins with assigning starting estimates for thevarious parameters. The starting estimate for the mod-ulation field is typically uniformly 1. Starting esti-mates for the belonging probabilities of the GM, WM,and CSF partitions are based on the prior probabilityimages. Since we have no probability maps for back-ground and nonbrain tissue clusters, we estimate themby subtracting the prior probabilities for GM, WM, andCSF from a map of all 1’s and divide the result equallybetween the remaining clusters.2
2 Where identical prior probability maps are used for more than
one cluster, the affected cluster parameters need to be modifiedEach iteration of the algorithm involves estimatingthe cluster parameters from the nonuniformity cor-rected image, assigning belonging probabilities basedon the cluster parameters, checking for convergence,and reestimating and applying the modulation func-tion. This continues until a convergence criterion issatisfied. The final values for the belonging probabili-ties are in the range of 0 to 1, although most valuestend to stabilize very close to one of the two extremes.The individual steps involved in each iteration will nowbe described in more detail.
Estimating the Cluster Parameters
This stage requires the original image to be intensitycorrected according to the most recent estimate of themodulation function. Each voxel of the intensity-cor-rected image is denoted by gij. We also have the currentestimate of the belonging probabilities for each voxelwith respect to each cluster. The probability of voxel i,j belonging to class k is denoted by pijk.
The first step is to compute the number of voxelsbelonging to each of the K clusters (h) as
hk 5 Oi51
I Oj51
J
pijk over k 5 1..K.
Mean voxel intensities for each cluster (v) are com-puted. This step effectively produces a weighted meanof the image voxels, where the weights are the currentbelonging probability estimates:
slightly. This is typically done after the first iteration, by assigningdifferent values for the means uniformly spaced between 0 and the
FIG. 9. A flow diagram for the tissue classification.
intensity of the white matter cluster.

a
bpait
w
lg
dtpetw
l
817VOXEL-BASED MORPHOMETRY
vk 5¥ i51
I ¥ j51J pij kgij
hkover k 5 1..K.
Then the variance of each cluster (c) is computed inway similar to the mean:
ck 5¥ i51
I ¥ j51J pijk~gij 2 vk!
2
hkover k 5 1..K.
Assigning Belonging Probabilities
The next step is to recalculate the belonging proba-ilities. It uses the cluster parameters computed in therevious step, along with the prior probability imagesnd the intensity modulated input image. Bayes’ rules used to assign the probability of each voxel belongingo each cluster,
pijk 5rij kqij k
¥ l51K rij lqij l
over i 5 1..I, j 5 1..J, and k 5 1..K,
here pijk is the a posteriori probability that voxel i, jbelongs to cluster k given its intensity of gij; rijk is theikelihood of a voxel in cluster k having an intensity ofik; and qijk is the a priori probability of voxel i, j
belonging in cluster k.The likelihood function is obtained by evaluating the
probability density functions for the clusters at each ofthe voxels:
rijk 5 ~2pck!21/2expS2~gij 2 vk!
2
2ckD
over i 5 1..I, j 5 1..J, and k 5 1..K.
The prior (qijk) is based on two factors: the number ofvoxels currently belonging to each cluster (hk) and theprior probability images derived from a number of im-ages (bijk). With no knowledge of the a priori spatial
istribution of the clusters or the intensity of a voxel,hen the a priori probability of any voxel belonging to aarticular cluster is proportional to the number of vox-ls currently included in that cluster. However, withhe additional data from the prior probability images,e can obtain a better estimate of the priors:
qijk 5hkbij k
¥ l51I ¥m51
J blmk
over i 5 1..I, j 5 1..J, and k 5 1..K.
Convergence is ascertained by following the log-like-
ihood function:Oi51
I Oj51
J
log~ Ok51
K
rij kqij k!.
The algorithm is terminated when the change in log-likelihood from the previous iteration becomes negligi-ble.
Estimating and Applying the Modulation Function
Many groups have developed methods for correctingintensity nonuniformities in MR images, and thescheme we describe here shares common features.There are two basic models describing the noise prop-erties of the images: multiplicative noise and additivenoise. The multiplicative model describes images thathave noise added before being modulated by the non-uniformity field (i.e., the standard deviation of thenoise is multiplied by the modulating field), whereasthe additive version models noise that is added afterthe modulation (standard deviation is constant). Wehave used a multiplicative noise model, which assumesthat the errors originate from tissue variability ratherthan additive Gaussian noise from the scanner. Figure10 illustrates the model used by the classification.
Nonuniformity correction methods all involve esti-mating a smooth function that modulates the imageintensities. If the function is not forced to be smooth,then it will begin to fit the higher frequency intensityvariations due to different tissue types, rather than thelow-frequency intensity nonuniformity artifact. Thin-plate spline (Sled et al., 1998) and polynomial (VanLeemput et al., 1999a, b) basis functions are widelyused for modeling the intensity variation. In thesemodels, the higher frequency intensity variations arerestricted by limiting the number of basis functions. Inthe current model, we assume that the modulationfield (U) has been drawn from a population for whichwe know the a priori distribution. The distribution isassumed to be multinormal, with a mean that is uni-formly 1 and a covariance matrix that models smoothlyvarying functions. In this way, a Bayesian scheme isused to penalize high-frequency intensity variations byintroducing a cost function based on the “energy” of themodulating function. There are many possible formsfor this energy function. Some widely used simple costfunctions include the “membrane energy” and the“bending energy” (1997b), which (in three dimensions)have the forms h 5 ¥i ¥j51
3 l ((u(xi))/xji)2 and h 5 ¥i
¥j513 ¥k51
3 l((2u(xi))/xjixki)2, respectively. In these for-
mulae, u(xi)/xji is the gradient of the modulatingfunction at the ith voxel in the jth orthogonal directionand l is a user-assigned constant. However, for thepurpose of modulating the images, we use a smoothercost function that is based on the squares of the third
derivatives:
il
ct
rm
em
818 ASHBURNER AND FRISTON
h 5 OiOj51
3 Ok51
3 Ol51
3
lS 3u~xi!
xjixkixliD 2
.
This model was chosen because it produces slowlyvarying modulation fields that can represent the vari-ety of nonuniformity effects that we expect to encoun-ter in MR images (see Fig. 11).
To reduce the number of parameters describing thefield, it is modeled by a linear combination of low-frequency discrete cosine transform basis functions(chosen because there are no boundary constraints). Atwo (or three)-dimensional discrete cosine transform(DCT) is performed as a series of one-dimensionaltransforms, which are simply multiplications with theDCT matrix. The elements of a matrix (D) for comput-ng the first M coefficients of the DCT of a vector of
FIG. 10. The MR images are modeled as a number of distinct cluach cluster (top right). The intensity modulation is assumed to bultiplication of the modulation field with the image (bottom right)
ength I are given by
di1 51
ÎI, i 5 1..I,
dim 5 Î2
IcosSp~2i 2 1!~m 2 1!
2I D , i 5 1..I, m 5 2..M.
(1)
The matrix notation for computing the first M 3 Moefficients of the two-dimensional DCT of a modula-ion field U is X 5 D1
TUD2, where the dimensions of theDCT matrices D1 and D2 are I 3 M and J 3 M,espectively, and U is an I 3 J matrix. The approxi-ate inverse DCT is computed by U . D1XD2
T. Analternative representation of the two-dimensional DCTobtains by reshaping the I 3 J matrix U so that it is avector (u). Element i 1 ( j 2 1) 3 I of the vector is then
rs (top left), with different levels of Gaussian random noise added tomoothly varying (bottom left) and is applied as a straightforward
stee s.
equal to element i, j of the matrix. The two-dimensional

mmteul
f
819VOXEL-BASED MORPHOMETRY
DCT can then be represented by x 5 DTu, where D 5D2 V D1 (the Kronecker tensor product of D2 and D1)and u . Dx.
The sensitivity correction field is computed by esti-ating the coefficients (x) of the basis functions thatinimize a weighted sum of squared differences be-
ween the data and the model and also the bendingnergy of the modulation field. This can be expressedsing matrix terminology as a regularized weighted
east-squares fitting,
x 5 ~A 1TA1 1 A 2
TA2· · · 1 C 021! 21
3 ~A 1Tb1 1 A 2
Tb2· · · 1 C 021x0!,
where x0 and C0 are the means and covariance matri-ces describing the a priori distribution of the coeffi-cients. Matrix Ak and column vector bk are constructedor cluster k from
Ak 5 diag~pkc k21/2!diag~f!D and bk 5 pkc k
21/2vk,
where pk refers to the belonging probabilities for thekth cluster considered as a column vector. The objec-tive is to find the smooth modulating function (de-scribed by its DCT coefficients) that will bring the voxelintensities of each cluster as close as possible (in theleast-squares sense) to the cluster means, in which the
21/2
FIG. 11. Randomly generated modulation fields using the membrand the squares of the third derivatives (right).
vectors pkck are voxel-by-voxel weighting functions.
Computing AkTAk and Ak
Tbk could be potentially verytime consuming, especially when applied in three di-mensions. However, this operation can be greatlyspeeded up using the properties of Kronecker tensorproducts (Ashburner and Friston, 1999). Figure 12shows how this can be done in two dimensions usingMatlab as a form of pseudo-code.
energy cost function (left), the bending energy cost function (center),
FIG. 12. The algorithm for computing AkTAk (alpha_k) and Ak
Tbk
(beta_k) in two dimensions using Matlab as a pseudo-code. Thesymbol “*” refers to matrix multiplication, whereas “.*” refers toelement-by-element multiplication. “ ’ ” refers to a matrix transposeand “∧” to a power. The jth row of matrix “D2” is denoted by “D2( j, :)”,and the jth column of matrix “img2” is denoted by “img2(:, j)”. Thefunctions “zeros(a, b)” and “ones(a, b)” would produce matrices of sizea 3 b of either all 0 or all 1. A Kronecker tensor product of twomatrices is represented by the “kron” function. Matrix “F” is the I 3J nonuniformity corrected image. Matrix “P_k” is the I 3 J currentestimate of the probabilities of the voxels belonging to cluster k.Matrices “D1” and “D2” contain the DCT basis functions and havedimensions I 3 M and J 3 N. “v_k” and “c_k” are scalers and refer to
ane
the mean and variance of the kth cluster.

scuvs
e
Tat
820 ASHBURNER AND FRISTON
The prior distribution of the coefficients is based onthe cost function described above. For coefficients xthis cost function is computed from xTC0
21x, where (intwo dimensions),
C021 5 l~D-2
TD-2! # ~D 1TD1! 1 3l~D02
TD 02! # ~D9 1TD91!
1 3l~D92TD92 # ~D0 1
TD91! 1 l~D 2TD2! # ~-1
TD-1!,
where the notations D*1, D(1, and D-1 refer to the first,second, and third derivatives (by differentiating Eq. (1)with respect to i) of D1, and l is a regularization con-tant. The mean of the a priori distribution of the DCToefficients is such that it would generate a field that isniformly 1. For this, all the elements of the meanector are set to 0, apart from the first element that iset to =MN.Finally, once the coefficients have been estimated,
then the modulation field u can be computed from thestimated coefficients (x) and the basis functions (D1
and D2):
uij 5 On51
N Om51
M
d2jnxmnd1im over i 5 1..I and j 5 1..J.
he new estimates for the sensitivity-corrected imagesre then obtained by a simple element-by-element mul-iplication with the modulation field:
gij 5 fijuij over i 5 1..I and j 5 1..J.
ACKNOWLEDGMENTS
Many thanks for discussions with John Sled and Alex Zijdenbos atMcGill University who (back in 1996) provided the original inspira-tion for the image nonuniformity correction method described in theAppendix. The idea led on from work by Alex Zijdenbos on estimatingnonuniformity from white matter in the brain images. Thanks also toKeith Worsley for further explaining the work of Jon Taylor, ChrisCocosco for providing information on the MRI simulator, Peter Nee-lin and Kate Watkins for information about the ICBM probabilitymaps, and Tina Good and Ingrid Johnsrude for the data used in theevaluations. This work was supported by the Wellcome Trust. Mostof the software for the methods described in this paper are availablefrom the authors as part of the SPM99 package.
REFERENCES
Abell, F., Krams, M., Ashburner, J., Passingham, R. E., Friston,K. J., Frackowiak, R. S. J., Happe, F., Frith, C. D., and Frith, U.1999. The neuroanatomy of autism: A voxel based whole brainanalysis of structural scans. NeuroReport 10:1647–1651.
Ashburner, J., and Friston, K. J. 1997. Multimodal image coregis-tration and partitioning—A unified framework. NeuroImage6:209–217.
Ashburner, J., and Friston, K. J. 1999. Nonlinear spatial normaliza-
tion using basis functions. Hum. Brain Mapp. 7:254–266.Ashburner, J., Neelin, P., Collins, D. L., Evans, A. C., and Friston,K. J. 1997. Incorporating prior knowledge into image registration.NeuroImage 6:344–352.
Ashburner, J., Hutton, C., Frackowiak, R. S. J., Johnsrude, I., Price,C., and Friston, K. J. 1998. Identifying global anatomical differ-ences: Deformation-based morphometry. Hum. Brain Mapp.6:348–357.
Bookstein, F. L. 1997a. Landmark methods for forms without land-marks: Morphometrics of group differences in outline shape. Med.Image Anal. 1:225–243.
Bookstein, F. L. 1997b. Quadratic variation of deformations. In In-formation Processing in Medical Imaging (J. Duncan and G. Gindi,Eds.), pp. 15–28. Springer-Verlag, Berlin/Heidelberg/New York.
Bookstein, F. L. 1999. Brain Warping, Chap. 10, pp. 157–182. Aca-demic Press, San Diego.
Cao, J., and Worsley, K. J. 1999. The geometry of the Hotelling’s T2
random field with applications to the detection of shape changes.Ann. Stat. 27:925–942.
Cocosco, C. A., Kollokian, V., Kwan, R. K.-S., and Evans, A. C. 1997.Brainweb: Online interface to a 3D MRI simulated brain database.NeuroImage 5:S425.
Collins, D. L., Zijdenbos, A. P., Kollokian, V., Sled, J. G., Kabani,N. J., Holmes, C. J., and Evans, A. C. 1998. Design and construc-tion of a realistic digital brain phantom. IEEE Trans. Med. Imag.17:463–468.
Evans, A. C., Collins, D. L., and Milner, B. 1992. An MRI-basedstereotactic atlas from 250 young normal subjects. Soc. Neurosci.Abstr. 18:408.
Evans, A. C., Collins, D. L., Mills, S. R., Brown, E. D., Kelly, R. L.,and Peters, T. M. 1993. 3D statistical neuroanatomical modelsfrom 305 MRI volumes. In Proc. IEEE—Nuclear Science Sympo-sium and Medical Imaging Conference, pp. 1813–1817.
Evans, A. C., Kamber, M., Collins, D. L., and Macdonald, D. 1994. AnMRI-based probabilistic atlas of neuroanatomy. In Magnetic Res-onance Scanning and Epilepsy (S. Shorvon, D. Fish, F. Ander-mann, G. M. Bydder, and H. Stefan, Eds.), NATO ASI Series A,Life Sciences, Vol. 264. pp. 263–274. Plenum, New York.
Freeborough, P. A., and Fox, N. C. 1998. Modelling brain deforma-tions in Alzheimer disease by fluid registration of serial MR im-ages. J. Comput. Assisted Tomogr. 22:838–843.
Friston, K. J., Holmes, A. P., Poline, J.-B., Price, C. J., and Frith,C. D. 1995a. Detecting activations in PET and fMRI: Levels ofinference and power. NeuroImage 4:223–235.
Friston, K. J., Holmes, A. P., Worsley, K. J., Poline, J.-B., Frith,C. D., and Frackowiak, R. S. J. 1995b. Statistical parametric mapsin functional imaging: A general linear approach. Hum. BrainMapp. 2:189–210.
Gaser, C., Volz, H.-P., Kiebel, S., Riehemann, S., and Sauer, H. 1999.Detecting structural changes in whole brain based on nonlineardeformations—Application to schizophrenia research. NeuroImage10:107–113.
Gee, J. C., and Bajcsy, R. K. 1999. Brain Warping, Chap. 11, pp.183–198. Academic Press, San Diego.
Holmes, A. P., Blair, R. C., Watson, J. D. G., and Ford, I. 1996.Non-parametric analysis of statistic images from functional map-ping experiments. J. Cereb. Blood Flow Metab. 16:7–22.
Johnson, R. A., and Wichern, D. W. 1998. Applied MultivariateStatistical Analysis, 4th ed. Prentice–Hall, Upper Saddle River,NJ.
Krams, M., Quinton, R., Ashburner, J., Friston, K. J., Frackowiak,R. S., Bouloux, P. M., and Passingham, R. E. 1999. Kallmann’ssyndrome: Mirror movements associated with bilateral corticospi-
nal tract hypertrophy. Neurology 52:816–822.
S
S
S
821VOXEL-BASED MORPHOMETRY
Kwan, R. K.-S., Evans, A. C., and Pike, G. B. 1996. An extensibleMRI simulator for post-processing evaluation. In Conference onVisualisation in Biomedical Computing, pp. 135–140.
May, A., Ashburner, J., Buchel, C., McGonigle, D. J., Friston, K. J.,Frackowiak, R. S. J., and Goadsby, P. J. 1999. Correlation betweenstructural and functional changes in brain in an idiopathic head-ache syndrome. Nat. Med. 5:836–838.
hah, P. J., Ebmeier, K. P., Glabus, M. F., and Goodwin, G. 1998.Cortical grey matter reductions associated with treatment-resis-tant chronic unipolar depression. Br. J. Psychiatry 172:527–532.
led, J. G., Zijdenbos, A. P., and Evans, A. C. 1998. A non-parametricmethod for automatic correction of intensity non-uniformity inMRI data. IEEE Trans. Med. Imag. 17:87–97.
owell, E. R., Thompson, P. M., Holmes, C. J., Batth, R., Jernigan,T. L., and Toga, A. W. 1999. Localizing age-related changes inbrain structure between childhood and adolescence using statisti-cal parametric mapping. NeuroImage 9:587–597.
Taylor, J., Worsley, K. J., Zijdenbos, A. P., Paus, T., and Evans, A. C.1998. Detecting anatomical changes using logistic regression ofstructure masks. NeuroImage 7:S753.
Thompson, P. M., and Toga, A. W. 1999. Brain Warping, Chap. 18,pp. 311–336. Academic Press, San Diego.
Van Leemput, K., Maes, F., Vandermeulen, D., and Suetens, P.1999a. Automated model-based bias field correction of MR imagesof the brain. IEEE Trans. Med. Imag. 18:885–896.
Van Leemput, K., Maes, F., Vandermeulen, D., and Suetens, P.1999b. Automated model-based tissue classification of MR images
of the brain. IEEE Trans. Med. Imag. 18:897–908.Vandermeulen, D., Descombes, X., Suetens, P., and Marchal, G.1996. Unsupervised regularized classification of multi-spectralMRI. In Proceedings of the International Conference on Visualiza-tion in Biomedical Computing, pp. 229–234.
Vargha-Khadem, F., Watkins, K. E., Price, C. J., Ashburner, J.,Alcock, K. J., Connelly, A., Frackowiak, R. S. J., Friston, K. J.,Pembrey, M. E., Mishkin, M., Gadian, D. G., and Passingham,R. E. 1998. Neural basis of an inherited speech and languagedisorder. Proc. Natl. Acad. Sci. USA 95, 12695–12700.
Woermann, F. G., Free, S. L., Koepp, M. J., Ashburner, J., andDuncan, J. D. 1999. Voxel-by-voxel comparison of automaticallysegmented cerebral grey matter—A rater-independent comparisonof structural MRI in patients with epilepsy. NeuroImage 10:373–384.
Worsley, K. J., Marrett, S., Neelin, P., Vandal, A. C., Friston, J. J.,and Evans, A. C. 1996. A unified statistical approach for determin-ing significant voxels in images of cerebral activation. Hum. BrainMapp. 4:58–73.
Worsley, K. J., Andermann, M., Koulis, T., MacDonald, D., andEvans, A. C. 1999. Detecting changes in non-isotropic images.Hum. Brain Mapp. 8:98–101.
Wright, I. C., McGuire, P. K., Poline, J.-B., Travere, J. M., Murray,R. M., Frith, C. D., Frackowiak, R. S. J., and Friston, K. J. 1995. Avoxel-based method for the statistical analysis of gray and whitematter density applied to schizophrenia. NeuroImage 2:244–252.
Wright, I. C., Ellison, Z. R., Sharma, T., Friston, K. J., Murray, R. M.,and Mcguire, P. K. 1999. Mapping of grey matter changes in
schizophrenia. Schizophrenia Res. 35:1–14.