vqa: visual question answering - arxiv · 1 vqa: visual question answering aishwarya agrawal ,...
TRANSCRIPT

1
VQA: Visual Question Answeringwww.visualqa.org
Aishwarya Agrawal∗, Jiasen Lu∗, Stanislaw Antol∗,Margaret Mitchell, C. Lawrence Zitnick, Dhruv Batra, Devi Parikh
Abstract—We propose the task of free-form and open-ended Visual Question Answering (VQA). Given an image and a naturallanguage question about the image, the task is to provide an accurate natural language answer. Mirroring real-world scenarios, suchas helping the visually impaired, both the questions and answers are open-ended. Visual questions selectively target different areasof an image, including background details and underlying context. As a result, a system that succeeds at VQA typically needs amore detailed understanding of the image and complex reasoning than a system producing generic image captions. Moreover, VQAis amenable to automatic evaluation, since many open-ended answers contain only a few words or a closed set of answers that canbe provided in a multiple-choice format. We provide a dataset containing ∼0.25M images, ∼0.76M questions, and ∼10M answers(www.visualqa.org), and discuss the information it provides. Numerous baselines and methods for VQA are provided and comparedwith human performance. Our VQA demo is available on CloudCV (http://cloudcv.org/vqa).
F
1 INTRODUCTION
We are witnessing a renewed excitement in multi-disciplineArtificial Intelligence (AI) research problems. In particular,research in image and video captioning that combines Com-puter Vision (CV), Natural Language Processing (NLP), andKnowledge Representation & Reasoning (KR) has dramati-cally increased in the past year [16], [9], [12], [38], [26],[24], [53]. Part of this excitement stems from a belief thatmulti-discipline tasks like image captioning are a step towardssolving AI. However, the current state of the art demonstratesthat a coarse scene-level understanding of an image pairedwith word n-gram statistics suffices to generate reasonableimage captions, which suggests image captioning may not beas “AI-complete” as desired.What makes for a compelling “AI-complete” task? We believethat in order to spawn the next generation of AI algorithms, anideal task should (i) require multi-modal knowledge beyond asingle sub-domain (such as CV) and (ii) have a well-definedquantitative evaluation metric to track progress. For sometasks, such as image captioning, automatic evaluation is stilla difficult and open research problem [51], [13], [22].In this paper, we introduce the task of free-form and open-ended Visual Question Answering (VQA). A VQA systemtakes as input an image and a free-form, open-ended, natural-language question about the image and produces a natural-language answer as the output. This goal-driven task isapplicable to scenarios encountered when visually-impairedusers [3] or intelligence analysts actively elicit visual infor-mation. Example questions are shown in Fig. 1.Open-ended questions require a potentially vast set of AIcapabilities to answer – fine-grained recognition (e.g., “Whatkind of cheese is on the pizza?”), object detection (e.g., “How
• ∗The first three authors contributed equally.• A. Agrawal, J. Lu and S. Antol are with Virginia Tech.• M. Mitchell is with Microsoft Research, Redmond.• C. L. Zitnick is with Facebook AI Research.• D. Batra and D. Parikh are with Georgia Institute of Technology.
Does it appear to be rainy?
Does this person have 20/20 vision?
Is this person expecting company?
What is just under the tree?
How many slices of pizza are there?
Is this a vegetarian pizza?
What color are her eyes?
What is the mustache made of?
Fig. 1: Examples of free-form, open-ended questions collected forimages via Amazon Mechanical Turk. Note that commonsenseknowledge is needed along with a visual understanding of the sceneto answer many questions.
many bikes are there?”), activity recognition (e.g., “Is this mancrying?”), knowledge base reasoning (e.g., “Is this a vegetarianpizza?”), and commonsense reasoning (e.g., “Does this personhave 20/20 vision?”, “Is this person expecting company?”).VQA [19], [36], [50], [3] is also amenable to automaticquantitative evaluation, making it possible to effectively trackprogress on this task. While the answer to many questions issimply “yes” or “no”, the process for determining a correctanswer is typically far from trivial (e.g. in Fig. 1, “Does thisperson have 20/20 vision?”). Moreover, since questions aboutimages often tend to seek specific information, simple one-to-three word answers are sufficient for many questions. Insuch scenarios, we can easily evaluate a proposed algorithmby the number of questions it answers correctly. In this paper,we present both an open-ended answering task and a multiple-choice task [45], [33]. Unlike the open-ended task that requiresa free-form response, the multiple-choice task only requires an
arX
iv:1
505.
0046
8v7
[cs
.CL
] 2
7 O
ct 2
016

2
algorithm to pick from a predefined list of possible answers.We present a large dataset that contains 204,721 images fromthe MS COCO dataset [32] and a newly created abstractscene dataset [57], [2] that contains 50,000 scenes. The MSCOCO dataset has images depicting diverse and complexscenes that are effective at eliciting compelling and diversequestions. We collected a new dataset of “realistic” abstractscenes to enable research focused only on the high-levelreasoning required for VQA by removing the need to parsereal images. Three questions were collected for each image orscene. Each question was answered by ten subjects along withtheir confidence. The dataset contains over 760K questionswith around 10M answers.While the use of open-ended questions offers many benefits,it is still useful to understand the types of questions that arebeing asked and which types various algorithms may be goodat answering. To this end, we analyze the types of questionsasked and the types of answers provided. Through severalvisualizations, we demonstrate the astonishing diversity of thequestions asked. We also explore how the information contentof questions and their answers differs from image captions. Forbaselines, we offer several approaches that use a combinationof both text and state-of-the-art visual features [29]. As partof the VQA initiative, we will organize an annual challengeand associated workshop to discuss state-of-the-art methodsand best practices.VQA poses a rich set of challenges, many of which have beenviewed as the holy grail of automatic image understanding andAI in general. However, it includes as building blocks severalcomponents that the CV, NLP, and KR [5], [8], [31], [35],[4] communities have made significant progress on during thepast few decades. VQA provides an attractive balance betweenpushing the state of the art, while being accessible enough forthe communities to start making progress on the task.
2 RELATED WORK
VQA Efforts. Several recent papers have begun to study visualquestion answering [19], [36], [50], [3]. However, unlike ourwork, these are fairly restricted (sometimes synthetic) settingswith small datasets. For instance, [36] only considers questionswhose answers come from a predefined closed world of 16basic colors or 894 object categories. [19] also considersquestions generated from templates from a fixed vocabularyof objects, attributes, relationships between objects, etc. Incontrast, our proposed task involves open-ended, free-formquestions and answers provided by humans. Our goal is toincrease the diversity of knowledge and kinds of reason-ing needed to provide correct answers. Critical to achievingsuccess on this more difficult and unconstrained task, ourVQA dataset is two orders of magnitude larger than [19],[36] (>250,000 vs. 2,591 and 1,449 images respectively). Theproposed VQA task has connections to other related work:[50] has studied joint parsing of videos and corresponding textto answer queries on two datasets containing 15 video clipseach. [3] uses crowdsourced workers to answer questionsabout visual content asked by visually-impaired users. Inconcurrent work, [37] proposed combining an LSTM for the
question with a CNN for the image to generate an answer. Intheir model, the LSTM question representation is conditionedon the CNN image features at each time step, and the finalLSTM hidden state is used to sequentially decode the answerphrase. In contrast, the model developed in this paper explores“late fusion” – i.e., the LSTM question representation and theCNN image features are computed independently, fused viaan element-wise multiplication, and then passed through fully-connected layers to generate a softmax distribution over outputanswer classes. [34] generates abstract scenes to capture visualcommon sense relevant to answering (purely textual) fill-in-the-blank and visual paraphrasing questions. [47] and [52]use visual information to assess the plausibility of commonsense assertions. [55] introduced a dataset of 10k images andprompted captions that describe specific aspects of a scene(e.g., individual objects, what will happen next). Concurrentwith our work, [18] collected questions & answers in Chinese(later translated to English by humans) for COCO images. [44]automatically generated four types of questions (object, count,color, location) using COCO captions.Text-based Q&A is a well studied problem in the NLPand text processing communities (recent examples being [15],[14], [54], [45]). Other related textual tasks include sentencecompletion (e.g., [45] with multiple-choice answers). Theseapproaches provide inspiration for VQA techniques. One keyconcern in text is the grounding of questions. For instance,[54] synthesized textual descriptions and QA-pairs groundedin a simulation of actors and objects in a fixed set of loca-tions. VQA is naturally grounded in images – requiring theunderstanding of both text (questions) and vision (images).Our questions are generated by humans, making the needfor commonsense knowledge and complex reasoning moreessential.Describing Visual Content. Related to VQA are the tasksof image tagging [11], [29], image captioning [30], [17], [40],[9], [16], [53], [12], [24], [38], [26] and video captioning [46],[21], where words or sentences are generated to describe visualcontent. While these tasks require both visual and semanticknowledge, captions can often be non-specific (e.g., observedby [53]). The questions in VQA require detailed specificinformation about the image for which generic image captionsare of little use [3].Other Vision+Language Tasks. Several recent papers haveexplored tasks at the intersection of vision and languagethat are easier to evaluate than image captioning, such ascoreference resolution [28], [43] or generating referring ex-pressions [25], [42] for a particular object in an image thatwould allow a human to identify which object is being referredto (e.g., “the one in a red shirt”, “the dog on the left”). Whiletask-driven and concrete, a limited set of visual concepts (e.g.,color, location) tend to be captured by referring expressions.As we demonstrate, a richer variety of visual concepts emergefrom visual questions and their answers.
3 VQA DATASET COLLECTION
We now describe the Visual Question Answering (VQA)dataset. We begin by describing the real images and abstract

3
Is something under the sink broken?
yes yes yes
no no no
What number do you see?
33 33 33
5 6 7
Does this man have children?
yes yes yes
yes yes yes
Is this man crying? no no no
no yes yes
Has the pizza been baked?
yes yes yes
yes yes yes
What kind of cheese is topped on this pizza?
feta feta
ricotta
mozzarella mozzarella mozzarella
Do you think the boy on the ground has broken legs?
yes yes yes
no no yes
Why is the boy on the right freaking out?
his friend is hurt other boy fell down
someone fell
ghost lightning
sprayed by hose
How many pickles are on the plate?
1 1 1
1 1 1
What is the shape of the plate?
circle round round
circle round round
What kind of store is this?
bakery bakery pastry
art supplies grocery grocery
Is the display case as full as it could be?
no no no
no yes yes
How many bikes are there?
2 2 2
3 4 12
What number is the bus?
48 48 48
4 46
number 6
What does the sign say?
stop stop stop
stop stop yield
What shape is this sign?
octagon octagon octagon
diamond octagon round
Can you park here?
no no no
no no yes
What color is the hydrant?
white and orange white and orange white and orange
red red
yellow
How many glasses are on the table?
3 3 3
2 2 6
What is the woman reaching for?
door handle glass wine
fruit glass
remote
Are the kids in the room the grandchildren of the adults?
probably yes yes
yes yes yes
What is on the bookshelf?
nothing nothing nothing
books books books
How many balls are there?
2 2 2
1 2 3
What side of the teeter totter is on the ground?
right right
right side
left left
right side
Fig. 2: Examples of questions (black), (a subset of the) answers given when looking at the image (green), and answers given when notlooking at the image (blue) for numerous representative examples of the dataset. See the appendix for more examples.
scenes used to collect the questions. Next, we describe ourprocess of collecting questions and their corresponding an-swers. Analysis of the questions and answers gathered as wellas baselines’ & methods’ results are provided in followingsections.Real Images. We use the 123,287 training and validation im-ages and 81,434 test images from the newly-released MicrosoftCommon Objects in Context (MS COCO) [32] dataset. TheMS COCO dataset was gathered to find images containingmultiple objects and rich contextual information. Given thevisual complexity of these images, they are well-suited forour VQA task. The more diverse our collection of images, themore diverse, comprehensive, and interesting the resultant setof questions and their answers.Abstract Scenes. The VQA task with real images requires theuse of complex and often noisy visual recognizers. To attractresearchers interested in exploring the high-level reasoningrequired for VQA, but not the low-level vision tasks, wecreate a new abstract scenes dataset [2], [57], [58], [59]containing 50K scenes. The dataset contains 20 “paperdoll”human models [2] spanning genders, races, and ages with 8different expressions. The limbs are adjustable to allow forcontinuous pose variations. The clipart may be used to depictboth indoor and outdoor scenes. The set contains over 100objects and 31 animals in various poses. The use of this clipartenables the creation of more realistic scenes (see bottom rowof Fig. 2) that more closely mirror real images than previouspapers [57], [58], [59]. See the appendix for the user interface,
additional details, and examples.Splits. For real images, we follow the same train/val/testsplit strategy as the MC COCO dataset [32] (including test-dev, test-standard, test-challenge, test-reserve). For the VQAchallenge (see section 6), test-dev is used for debugging andvalidation experiments and allows for unlimited submission tothe evaluation server. Test-standard is the ‘default’ test data forthe VQA competition. When comparing to the state of the art(e.g., in papers), results should be reported on test-standard.Test-standard is also used to maintain a public leaderboard thatis updated upon submission. Test-reserve is used to protectagainst possible overfitting. If there are substantial differencesbetween a method’s scores on test-standard and test-reserve,this raises a red-flag and prompts further investigation. Resultson test-reserve are not publicly revealed. Finally, test-challengeis used to determine the winners of the challenge.For abstract scenes, we created splits for standardization, sep-arating the scenes into 20K/10K/20K for train/val/test splits,respectively. There are no subsplits (test-dev, test-standard,test-challenge, test-reserve) for abstract scenes.Captions. The MS COCO dataset [32], [7] already containsfive single-sentence captions for all images. We also collectedfive single-captions for all abstract scenes using the same userinterface1 for collection.Questions. Collecting interesting, diverse, and well-posedquestions is a significant challenge. Many simple questions
1. https://github.com/tylin/coco-ui

4
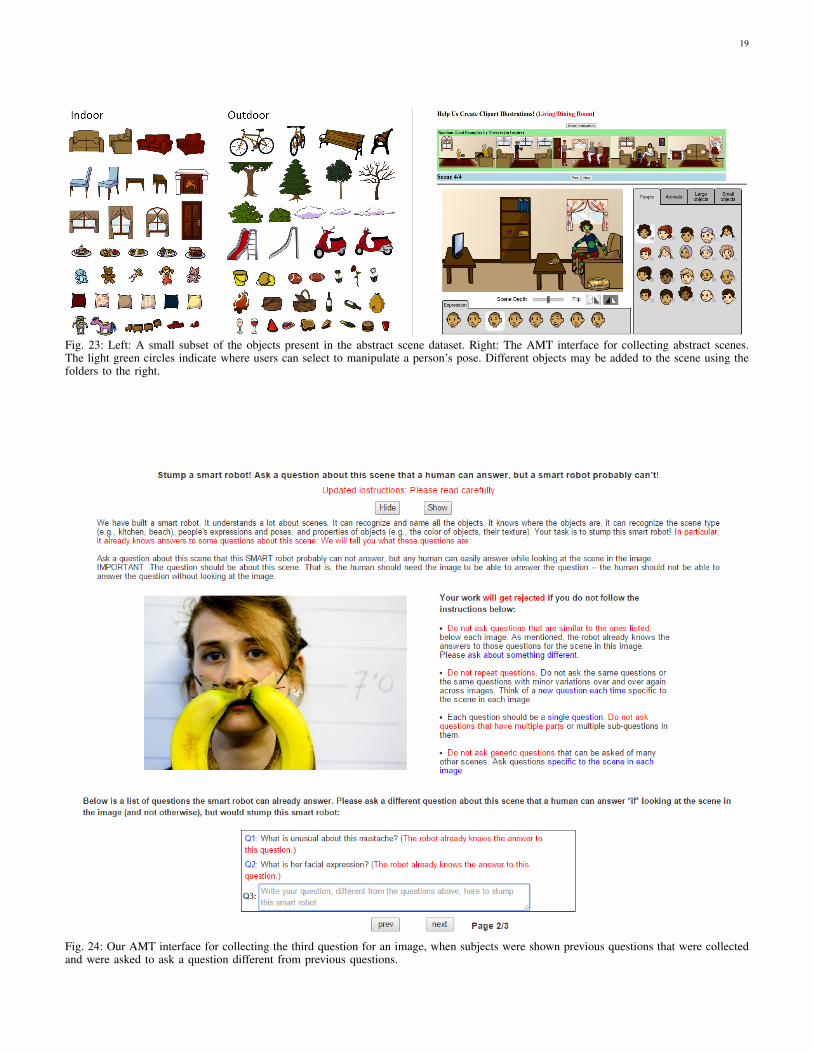
may only require low-level computer vision knowledge, suchas “What color is the cat?” or “How many chairs are presentin the scene?”. However, we also want questions that requirecommonsense knowledge about the scene, such as “Whatsound does the pictured animal make?”. Importantly, questionsshould also require the image to correctly answer and notbe answerable using just commonsense information, e.g.,in Fig. 1, “What is the mustache made of?”. By having awide variety of question types and difficulty, we may be ableto measure the continual progress of both visual understandingand commonsense reasoning.We tested and evaluated a number of user interfaces forcollecting such “interesting” questions. Specifically, we ranpilot studies asking human subjects to ask questions about agiven image that they believe a “toddler”, “alien”, or “smartrobot” would have trouble answering. We found the “smartrobot” interface to elicit the most interesting and diversequestions. As shown in the appendix, our final interface stated:
“We have built a smart robot. It understands a lot aboutimages. It can recognize and name all the objects, itknows where the objects are, it can recognize the scene(e.g., kitchen, beach), people’s expressions and poses, andproperties of objects (e.g., color of objects, their texture).Your task is to stump this smart robot!Ask a question about this scene that this smart robotprobably can not answer, but any human can easilyanswer while looking at the scene in the image.”
To bias against generic image-independent questions, subjectswere instructed to ask questions that require the image toanswer.The same user interface was used for both the real images andabstract scenes. In total, three questions from unique workerswere gathered for each image/scene. When writing a question,the subjects were shown the previous questions already askedfor that image to increase the question diversity. In total, thedataset contains over ∼0.76M questions.Answers. Open-ended questions result in a diverse set ofpossible answers. For many questions, a simple “yes” or “no”response is sufficient. However, other questions may require ashort phrase. Multiple different answers may also be correct.For instance, the answers “white”, “tan”, or “off-white” mayall be correct answers to the same question. Human subjectsmay also disagree on the “correct” answer, e.g., some saying“yes” while others say “no”. To handle these discrepancies,we gather 10 answers for each question from unique workers,while also ensuring that the worker answering a question didnot ask it. We ask the subjects to provide answers that are “abrief phrase and not a complete sentence. Respond matter-of-factly and avoid using conversational language or insertingyour opinion.” In addition to answering the questions, thesubjects were asked “Do you think you were able to answer thequestion correctly?” and given the choices of “no”, “maybe”,and “yes”. See the appendix for more details about the userinterface to collect answers. See Section 4 for an analysis ofthe answers provided.For testing, we offer two modalities for answering the ques-
tions: (i) open-ended and (ii) multiple-choice.For the open-ended task, the generated answers are evaluatedusing the following accuracy metric:
accuracy = min(# humans that provided that answer
3, 1)
i.e., an answer is deemed 100% accurate if at least 3 workersprovided that exact answer.2 Before comparison, all responsesare made lowercase, numbers converted to digits, and punctu-ation & articles removed. We avoid using soft metrics suchas Word2Vec [39], since they often group together wordsthat we wish to distinguish, such as “left” and “right”. Wealso avoid using evaluation metrics from machine translationsuch as BLEU and ROUGE because such metrics are typi-cally applicable and reliable for sentences containing multiplewords. In VQA, most answers (89.32%) are single word;thus there no high-order n-gram matches between predictedanswers and ground-truth answers, and low-order n-grammatches degenerate to exact-string matching. Moreover, theseautomatic metrics such as BLEU and ROUGE have been foundto poorly correlate with human judgement for tasks such asimage caption evaluation [6].For multiple-choice task, 18 candidate answers are createdfor each question. As with the open-ended task, the accuracyof a chosen option is computed based on the number ofhuman subjects who provided that answer (divided by 3 andclipped at 1). We generate a candidate set of correct andincorrect answers from four sets of answers: Correct: Themost common (out of ten) correct answer. Plausible: Togenerate incorrect, but still plausible answers we ask threesubjects to answer the questions without seeing the image.See the appendix for more details about the user interface tocollect these answers. If three unique answers are not found,we gather additional answers from nearest neighbor questionsusing a bag-of-words model. The use of these answers helpsensure the image, and not just commonsense knowledge, isnecessary to answer the question. Popular: These are the 10most popular answers. For instance, these are “yes”, “no”,“2”, “1”, “white”, “3”, “red”, “blue”, “4”, “green” for realimages. The inclusion of the most popular answers makes itmore difficult for algorithms to infer the type of question fromthe set of answers provided, i.e., learning that it is a “yes orno” question just because “yes” and “no” are present in theanswers. Random: Correct answers from random questionsin the dataset. To generate a total of 18 candidate answers,we first find the union of the correct, plausible, and popularanswers. We include random answers until 18 unique answersare found. The order of the answers is randomized. Examplemultiple choice questions are in the appendix.Note that all 18 candidate answers are unique. But since10 different subjects answered every question, it is possiblethat more than one of those 10 answers be present in the18 choices. In such cases, according to the accuracy metric,multiple options could have a non-zero accuracy.

5
Real Images Abstract Scenes
Fig. 3: Distribution of questions by their first four words for a random sample of 60K questions for real images (left) and all questionsfor abstract scenes (right). The ordering of the words starts towards the center and radiates outwards. The arc length is proportional to thenumber of questions containing the word. White areas are words with contributions too small to show.
4 VQA DATASET ANALYSIS
In this section, we provide an analysis of the questions andanswers in the VQA train dataset. To gain an understandingof the types of questions asked and answers provided, wevisualize the distribution of question types and answers. Wealso explore how often the questions may be answered withoutthe image using just commonsense information. Finally, weanalyze whether the information contained in an image captionis sufficient to answer the questions.The dataset includes 614,163 questions and 7,984,119 answers(including answers provided by workers with and withoutlooking at the image) for 204,721 images from the MS COCOdataset [32] and 150,000 questions with 1,950,000 answers for50, 000 abstract scenes.
4.1 Questions
Types of Question. Given the structure of questions generatedin the English language, we can cluster questions into differenttypes based on the words that start the question. Fig. 3 showsthe distribution of questions based on the first four words ofthe questions for both the real images (left) and abstract scenes(right). Interestingly, the distribution of questions is quitesimilar for both real images and abstract scenes. This helpsdemonstrate that the type of questions elicited by the abstractscenes is similar to those elicited by the real images. Thereexists a surprising variety of question types, including “Whatis. . .”, “Is there. . .”, “How many. . .”, and “Does the. . .”.Quantitatively, the percentage of questions for different typesis shown in Table 3. Several example questions and answersare shown in Fig. 2. A particularly interesting type of questionis the “What is. . .” questions, since they have a diverse set
2. In order to be consistent with ‘human accuracies’ reported in Section 4,machine accuracies are averaged over all
(109
)sets of human annotators
0%
5%
10%
15%
20%
25%
30%
0 2 4 6 8 10 12 14 16 18 20
Perc
enta
ge o
f Q
ues
tio
ns
# of Words in Question
Distribution of Question Lengths
Real Images
Abstract Scenes
Fig. 4: Percentage of questions with different word lengths for realimages and abstract scenes.
of possible answers. See the appendix for visualizations for“What is. . .” questions.Lengths. Fig. 4 shows the distribution of question lengths. Wesee that most questions range from four to ten words.
4.2 Answers
Typical Answers. Fig. 5 (top) shows the distribution ofanswers for several question types. We can see that a numberof question types, such as “Is the. . . ”, “Are. . . ”, and “Does. . . ”are typically answered using “yes” and “no” as answers. Otherquestions such as “What is. . . ” and “What type. . . ” have a richdiversity of responses. Other question types such as “Whatcolor. . . ” or “Which. . . ” have more specialized responses,such as colors, or “left” and “right”. See the appendix fora list of the most popular answers.Lengths. Most answers consist of a single word, with thedistribution of answers containing one, two, or three words,respectively being 89.32%, 6.91%, and 2.74% for real imagesand 90.51%, 5.89%, and 2.49% for abstract scenes. Thebrevity of answers is not surprising, since the questions tend toelicit specific information from the images. This is in contrast

6
Answers with Images
Answers without Images
Fig. 5: Distribution of answers per question type for a random sample of 60K questions for real images when subjects provide answers whengiven the image (top) and when not given the image (bottom).
with image captions that generically describe the entire imageand hence tend to be longer. The brevity of our answers makesautomatic evaluation feasible. While it may be tempting tobelieve the brevity of the answers makes the problem easier,recall that they are human-provided open-ended answers toopen-ended questions. The questions typically require complexreasoning to arrive at these deceptively simple answers (seeFig. 2). There are currently 23,234 unique one-word answersin our dataset for real images and 3,770 for abstract scenes.‘Yes/No’ and ‘Number’ Answers. Many questions are an-swered using either “yes” or “no” (or sometimes “maybe”)– 38.37% and 40.66% of the questions on real images andabstract scenes respectively. Among these ‘yes/no’ questions,there is a bias towards “yes” – 58.83% and 55.86% of‘yes/no’ answers are “yes” for real images and abstract scenes.Question types such as “How many. . . ” are answered using
numbers – 12.31% and 14.48% of the questions on real imagesand abstract scenes are ‘number’ questions. “2” is the mostpopular answer among the ‘number’ questions, making up26.04% of the ‘number’ answers for real images and 39.85%for abstract scenes.Subject Confidence. When the subjects answered the ques-tions, we asked “Do you think you were able to answerthe question correctly?”. Fig. 6 shows the distribution ofresponses. A majority of the answers were labeled as confidentfor both real images and abstract scenes.Inter-human Agreement. Does the self-judgment of confi-dence correspond to the answer agreement between subjects?Fig. 6 shows the percentage of questions in which (i) 7 ormore, (ii) 3−7, or (iii) less than 3 subjects agree on the answersgiven their average confidence score (0 = not confident, 1= confident). As expected, the agreement between subjects

7
7 or more same 3-7 same less than 3 same # of Questions
Fig. 6: Number of questions per average confidence score (0 = notconfident, 1 = confident) for real images and abstract scenes (blacklines). Percentage of questions where 7 or more answers are same,3-7 are same, less than 3 are same (color bars).
increases with confidence. However, even if all of the subjectsare confident the answers may still vary. This is not surprisingsince some answers may vary, yet have very similar meaning,such as “happy” and “joyful”.As shown in Table 1 (Question + Image), there is significantinter-human agreement in the answers for both real images(83.30%) and abstract scenes (87.49%). Note that on averageeach question has 2.70 unique answers for real images and2.39 for abstract scenes. The agreement is significantly higher(> 95%) for “yes/no” questions and lower for other questions(< 76%), possibly due to the fact that we perform exact stringmatching and do not account for synonyms, plurality, etc. Notethat the automatic determination of synonyms is a difficultproblem, since the level of answer granularity can vary acrossquestions.
4.3 Commonsense Knowledge
Is the Image Necessary? Clearly, some questions can some-times be answered correctly using commonsense knowledgealone without the need for an image, e.g., “What is the colorof the fire hydrant?”. We explore this issue by asking threesubjects to answer the questions without seeing the image (seethe examples in blue in Fig. 2). In Table 1 (Question), weshow the percentage of questions for which the correct answeris provided over all questions, “yes/no” questions, and theother questions that are not “yes/no”. For “yes/no” questions,the human subjects respond better than chance. For otherquestions, humans are only correct about 21% of the time.This demonstrates that understanding the visual informationis critical to VQA and that commonsense information aloneis not sufficient.To show the qualitative difference in answers provided withand without images, we show the distribution of answers forvarious question types in Fig. 5 (bottom). The distribution ofcolors, numbers, and even “yes/no” responses is surprisinglydifferent for answers with and without images.Which Questions Require Common Sense? In order to iden-tify questions that require commonsense reasoning to answer,we conducted two AMT studies (on a subset 10K questionsfrom the real images of VQA trainval) asking subjects –
1) Whether or not they believed a question required com-monsense to answer the question, and
Dataset Input All Yes/No Number Other
Question 40.81 67.60 25.77 21.22Real Question + Caption* 57.47 78.97 39.68 44.41
Question + Image 83.30 95.77 83.39 72.67
Question 43.27 66.65 28.52 23.66Abstract Question + Caption* 54.34 74.70 41.19 40.18
Question + Image 87.49 95.96 95.04 75.33
TABLE 1: Test-standard accuracy of human subjects when asked toanswer the question without seeing the image (Question), seeing justa caption of the image and not the image itself (Question + Caption),and seeing the image (Question + Image). Results are shown for allquestions, “yes/no” & “number” questions, and other questions thatare neither answered “yes/no” nor number. All answers are free-formand not multiple-choice. *These accuracies are evaluated on a subsetof 3K train questions (1K images).
2) The youngest age group that they believe a person mustbe in order to be able to correctly answer the question– toddler (3-4), younger child (5-8), older child (9-12),teenager (13-17), adult (18+).
Each question was shown to 10 subjects. We found that for47.43% of questions 3 or more subjects voted ‘yes’ to com-monsense, (18.14%: 6 or more). In the ‘perceived human agerequired to answer question’ study, we found the following dis-tribution of responses: toddler: 15.3%, younger child: 39.7%,older child: 28.4%, teenager: 11.2%, adult: 5.5%. In Figure 7we show several questions for which a majority of subjectspicked the specified age range. Surprisingly the perceivedage needed to answer the questions is fairly well distributedacross the different age ranges. As expected the questionsthat were judged answerable by an adult (18+) generally needspecialized knowledge, whereas those answerable by a toddler(3-4) are more generic.We measure the degree of commonsense required to answer aquestion as the percentage of subjects (out of 10) who voted“yes” in our “whether or not a question requires common-sense” study. A fine-grained breakdown of average age andaverage degree of common sense (on a scale of 0 − 100)required to answer a question is shown in Table 3. Theaverage age and the average degree of commonsense acrossall questions is 8.92 and 31.01% respectively.It is important to distinguish between:
1) How old someone needs to be to be able to answer aquestion correctly, and
2) How old people think someone needs to be to be able toanswer a question correctly.
Our age annotations capture the latter – perceptions of MTurkworkers in an uncontrolled environment. As such, the relativeordering of question types in Table 3 is more important thanabsolute age numbers. The two rankings of questions in termsof common sense required according to the two studies werelargely correlated (Pearson’s rank correlation: 0.58).
4.4 Captions vs. Questions
Do generic image captions provide enough information toanswer the questions? Table 1 (Question + Caption) showsthe percentage of questions answered correctly when human

8
3-4 (15.3%) 5-8 (39.7%) 9-12 (28.4%) 13-17 (11.2%) 18+ (5.5%)
Is that a bird in the sky? How many pizzas are shown? Where was this picture taken? Is he likely to get mugged if he walked down a dark alleyway like this?
What type of architecture is this?
What color is the shoe? What are the sheep eating? What ceremony does the cake commemorate?
Is this a vegetarian meal? Is this a Flemish bricklaying pattern?
How many zebras are there? What color is his hair? Are these boats too tall to fit under the bridge?
What type of beverage is in the glass? How many calories are in this pizza?
Is there food on the table? What sport is being played? What is the name of the white shape under the batter?
Can you name the performer in the purple costume?
What government document is needed to partake in this activity?
Is this man wearing shoes? Name one ingredient in the skillet. Is this at the stadium? Besides these humans, what other animals eat here?
What is the make and model of this vehicle?
Fig. 7: Example questions judged by Mturk workers to be answerable by different age groups. The percentage of questions falling into eachage group is shown in parentheses.
subjects are given the question and a human-provided captiondescribing the image, but not the image. As expected, theresults are better than when humans are shown the questionsalone. However, the accuracies are significantly lower thanwhen subjects are shown the actual image. This demonstratesthat in order to answer the questions correctly, deeper imageunderstanding (beyond what image captions typically capture)is necessary. In fact, we find that the distributions of nouns,verbs, and adjectives mentioned in captions is statisticallysignificantly different from those mentioned in our questions+ answers (Kolmogorov-Smirnov test, p < .001) for both realimages and abstract scenes. See the appendix for details.
5 VQA BASELINES AND METHODS
In this section, we explore the difficulty of the VQA datasetfor the MS COCO images using several baselines and novelmethods. We train on VQA train+val. Unless stated otherwise,all human accuracies are on test-standard, machine accuraciesare on test-dev, and results involving human captions (in grayfont) are trained on train and tested on val (because captionsare not available for test).
5.1 Baselines
We implemented the following baselines:
1) random: We randomly choose an answer from the top1K answers of the VQA train/val dataset.
2) prior (“yes”): We always select the most popular answer(“yes”) for both the open-ended and multiple-choicetasks. Note that “yes” is always one of the choices forthe multiple-choice questions.
3) per Q-type prior: For the open-ended task, we pick themost popular answer per question type (see the appendixfor details). For the multiple-choice task, we pick theanswer (from the provided choices) that is most similarto the picked answer for the open-ended task using cosinesimilarity in Word2Vec[39] feature space.
4) nearest neighbor: Given a test image, question pair, wefirst find the K nearest neighbor questions and associatedimages from the training set. See appendix for details onhow neighbors are found. Next, for the open-ended task,we pick the most frequent ground truth answer from thisset of nearest neighbor question, image pairs. Similar to
the “per Q-type prior” baseline, for the multiple-choicetask, we pick the answer (from the provided choices) thatis most similar to the picked answer for the open-endedtask using cosine similarity inWord2Vec[39] feature space.
5.2 Methods
For our methods, we develop a 2-channel vision (image) +language (question) model that culminates with a softmaxover K possible outputs. We choose the top K = 1000 mostfrequent answers as possible outputs. This set of answerscovers 82.67% of the train+val answers. We describe thedifferent components of our model below:Image Channel: This channel provides an embedding for theimage. We experiment with two embeddings –
1) I: The activations from the last hidden layer of VG-GNet [48] are used as 4096-dim image embedding.
2) norm I: These are `2 normalized activations from thelast hidden layer of VGGNet [48].
Question Channel: This channel provides an embedding forthe question. We experiment with three embeddings –
1) Bag-of-Words Question (BoW Q): The top 1,000 wordsin the questions are used to create a bag-of-words repre-sentation. Since there is a strong correlation between thewords that start a question and the answer (see Fig. 5),we find the top 10 first, second, and third words ofthe questions and create a 30 dimensional bag-of-wordsrepresentation. These features are concatenated to get a1,030-dim embedding for the question.
2) LSTM Q: An LSTM with one hidden layer is usedto obtain 1024-dim embedding for the question. Theembedding obtained from the LSTM is a concatenationof last cell state and last hidden state representations(each being 512-dim) from the hidden layer of the LSTM.Each question word is encoded with 300-dim embeddingby a fully-connected layer + tanh non-linearity whichis then fed to the LSTM. The input vocabulary to theembedding layer consists of all the question words seenin the training dataset.
3) deeper LSTM Q: An LSTM with two hidden layers isused to obtain 2048-dim embedding for the question. Theembedding obtained from the LSTM is a concatenation oflast cell state and last hidden state representations (each

9
Convolution Layer+ Non-Linearity
Pooling LayerConvolution Layer
+ Non-Linearity Pooling LayerFully-Connected MLP
4096 output units from last hidden layer(VGGNet, Normalized)
“How many horses are in this image?”
2×2×512 LSTM
Fully-Connected
1024
1024
Point-wisemultiplication
Fully-Connected
1000
Softmax
“2”
1024
Fully-Connected
1000
Fig. 8: Our best performing model (deeper LSTM Q + norm I). This model uses a two layer LSTM to encode the questions and the lasthidden layer of VGGNet [48] to encode the images. The image features are then `2 normalized. Both the question and image features aretransformed to a common space and fused via element-wise multiplication, which is then passed through a fully connected layer followedby a softmax layer to obtain a distribution over answers.
being 512-dim) from each of the two hidden layers of theLSTM. Hence 2 (hidden layers) x 2 (cell state and hiddenstate) x 512 (dimensionality of each of the cell states, aswell as hidden states) in Fig. 8. This is followed by afully-connected layer + tanh non-linearity to transform2048-dim embedding to 1024-dim. The question wordsare encoded in the same way as in LSTM Q.
Multi-Layer Perceptron (MLP): The image and questionembeddings are combined to obtain a single embedding.
1) For BoW Q + I method, we simply concatenate the BoWQ and I embeddings.
2) For LSTM Q + I, and deeper LSTM Q + norm I (Fig. 8)methods, the image embedding is first transformed to1024-dim by a fully-connected layer + tanh non-linearityto match the LSTM embedding of the question. Thetransformed image and LSTM embeddings (being in acommon space) are then fused via element-wise multi-plication.
This combined image + question embedding is then passed toan MLP – a fully connected neural network classifier with 2hidden layers and 1000 hidden units (dropout 0.5) in each layerwith tanh non-linearity, followed by a softmax layer to obtaina distribution over K answers. The entire model is learnedend-to-end with a cross-entropy loss. VGGNet parameters arefrozen to those learned for ImageNet classification and notfine-tuned in the image channel.We also experimented with providing captions as input to ourmodel. Similar to Table 1, we assume that a human-generatedcaption is given as input. We use a bag-of-words representationcontaining the 1,000 most popular words in the captions as thecaption embedding (Caption). For BoW Question + Caption(BoW Q + C) method, we simply concatenate the BoW Q andC embeddings.For testing, we report the result on two different tasks: open-ended selects the answer with highest activation from all
Open-Ended Multiple-Choice
All Yes/No Number Other All Yes/No Number Other
prior (“yes”) 29.66 70.81 00.39 01.15 29.66 70.81 00.39 01.15per Q-type prior 37.54 71.03 35.77 09.38 39.45 71.02 35.86 13.34nearest neighbor 42.70 71.89 24.36 21.94 48.49 71.94 26.00 33.56BoW Q 48.09 75.66 36.70 27.14 53.68 75.71 37.05 38.64I 28.13 64.01 00.42 03.77 30.53 69.87 00.45 03.76BoW Q + I 52.64 75.55 33.67 37.37 58.97 75.59 34.35 50.33LSTM Q 48.76 78.20 35.68 26.59 54.75 78.22 36.82 38.78LSTM Q + I 53.74 78.94 35.24 36.42 57.17 78.95 35.80 43.41deeper LSTM Q 50.39 78.41 34.68 30.03 55.88 78.45 35.91 41.13deeper LSTM Q + norm I 57.75 80.50 36.77 43.08 62.70 80.52 38.22 53.01
Caption 26.70 65.50 02.03 03.86 28.29 69.79 02.06 03.82BoW Q + C 54.70 75.82 40.12 42.56 59.85 75.89 41.16 52.53
TABLE 2: Accuracy of our methods for the open-ended and multiple-choice tasks on the VQA test-dev for real images. Q = Question, I= Image, C = Caption. (Caption and BoW Q + C results are on val).See text for details.
possible K answers and multiple-choice picks the answer thathas the highest activation from the potential answers.
5.3 Results
Table 2 shows the accuracy of our baselines and methods forboth the open-ended and multiple-choice tasks on the VQAtest-dev for real images.As expected, the vision-alone model (I) that completelyignores the question performs rather poorly (open-ended:28.13% / multiple-choice: 30.53%). In fact, on open-endedtask, the vision-alone model (I) performs worse than the prior(“yes”) baseline, which ignores both the image and question(responding to every question with a “yes”).Interestingly, the language-alone methods (per Q-type prior,BoW Q, LSTM Q) that ignore the image perform surprisinglywell, with BoW Q achieving 48.09% on open-ended (53.68%on multiple-choice) and LSTM Q achieving 48.76% on open-ended (54.75% on multiple-choice); both outperforming thenearest neighbor baseline (open-ended: 42.70%, multiple-

10
choice: 48.49%). Our quantitative results and analyses suggestthat this might be due to the language-model exploiting subtlestatistical priors about the question types (e.g. “What color isthe banana?” can be answered with “yellow” without lookingat the image). For a detailed discussion of the subtle biases inthe questions, please see [56].The accuracy of our best model (deeper LSTM Q + norm I(Fig. 8), selected using VQA test-dev accuracies) on VQA test-standard is 58.16% (open-ended) / 63.09% (multiple-choice).We can see that our model is able to significantly outper-form both the vision-alone and language-alone baselines. Asa general trend, results on multiple-choice are better thanopen-ended. All methods are significantly worse than humanperformance.Our VQA demo is available on CloudCV [1] – http://cloudcv.org/vqa. This will be updated with newer models as wedevelop them.To gain further insights into these results, we computedaccuracies by question type in Table 3. Interestingly, forquestion types that require more reasoning, such as “Is the” or“How many”, the scene-level image features do not provideany additional information. However, for questions that canbe answered using scene-level information, such as “Whatsport,” we do see an improvement. Similarly, for questionswhose answer may be contained in a generic caption we seeimprovement, such as “What animal”. For all question types,the results are worse than human accuracies.We also analyzed the accuracies of our best model (deeperLSTM Q + norm I) on a subset of questions with certainspecific (ground truth) answers. In Fig. 9, we show the averageaccuracy of the model on questions with 50 most frequentground truth answers on the VQA validation set (plot issorted by accuracy, not frequency). We can see that the modelperforms well for answers that are common visual objectssuch as “wii”, “tennis”, “bathroom” while the performanceis somewhat underwhelming for counts (e.g., “2”, “1”, “3”),and particularly poor for higher counts (e.g., “5”, “6”, “10”,“8”, “7”).In Fig. 10, we show the distribution of 50 most frequentlypredicted answers when the system is correct on the VQAvalidation set (plot is sorted by prediction frequency, notaccuracy). In this analysis, “system is correct” implies thatit has VQA accuracy 1.0 (see section 3 for accuracy metric).We can see that the frequent ground truth answers (e.g., “yes”,“no”, “2”, “white”, “red”, “blue”, “1”, “green”) are morefrequently predicted than others when the model is correct.Finally, evaluating our best model (deeper LSTM Q + normI) on the validation questions for which we have age annota-tions (how old a human needs to be to answer the questioncorrectly), we estimate that our model performs as well asa 4.74 year old child! The average age required on thesame set of questions is 8.98. Evaluating the same modelon the validation questions for which we have commonsenseannotations (whether the question requires commonsense toanswer it), we estimate that it has degree of commonsenseof 17.35%. The average degree of commonsense required onsame set of questions is 31.23%. Again, these estimates reflect
Open-Ended Human Age Commonsense
Question K = 1000 Human To Be Able To Be Able
Type Q Q + I Q + C Q Q + I To Answer To Answer (%)
what is (13.84) 23.57 34.28 43.88 16.86 73.68 09.07 27.52what color (08.98) 33.37 43.53 48.61 28.71 86.06 06.60 13.22what kind (02.49) 27.78 42.72 43.88 19.10 70.11 10.55 40.34what are (02.32) 25.47 39.10 47.27 17.72 69.49 09.03 28.72what type (01.78) 27.68 42.62 44.32 19.53 70.65 11.04 38.92is the (10.16) 70.76 69.87 70.50 65.24 95.67 08.51 30.30is this (08.26) 70.34 70.79 71.54 63.35 95.43 10.13 45.32how many (10.28) 43.78 40.33 47.52 30.45 86.32 07.67 15.93are (07.57) 73.96 73.58 72.43 67.10 95.24 08.65 30.63does (02.75) 76.81 75.81 75.88 69.96 95.70 09.29 38.97where (02.90) 16.21 23.49 29.47 11.09 43.56 09.54 36.51is there (03.60) 86.50 86.37 85.88 72.48 96.43 08.25 19.88why (01.20) 16.24 13.94 14.54 11.80 21.50 11.18 73.56which (01.21) 29.50 34.83 40.84 25.64 67.44 09.27 30.00do (01.15) 77.73 79.31 74.63 71.33 95.44 09.23 37.68what does (01.12) 19.58 20.00 23.19 11.12 75.88 10.02 33.27what time (00.67) 8.35 14.00 18.28 07.64 58.98 09.81 31.83who (00.77) 19.75 20.43 27.28 14.69 56.93 09.49 43.82what sport (00.81) 37.96 81.12 93.87 17.86 95.59 08.07 31.87what animal (00.53) 23.12 59.70 71.02 17.67 92.51 06.75 18.04what brand (00.36) 40.13 36.84 32.19 25.34 80.95 12.50 41.33
TABLE 3: Open-ended test-dev results for different question typeson real images (Q+C is reported on val). Machine performanceis reported using the bag-of-words representation for questions.Questions types are determined by the one or two words that startthe question. The percentage of questions for each type is shownin parentheses. Last and second last columns respectively show theaverage human age and average degree of commonsense required toanswer the questions (as reported by AMT workers), respectively.See text for details.
the age and commonsense perceived by MTurk workers thatwould be required to answer the question. See the appendixfor details.We further analyzed the performance of the model for differentage groups on the validation questions for which we have ageannotations. In Fig. 11, we computed the average accuracy ofthe predictions made by the model for questions belonging todifferent age groups. Perhaps as expected, the accuracy of themodel decreases as the age of the question increases (from61.07% at 3− 4 age group to 47.83% at 18+ age group).In Fig. 12, we show the distribution of age of questions fordifferent levels of accuracies achieved by our system on thevalidation questions for which we have age annotations. It isinteresting to see that the relative proportions of different agegroups is consistent across all accuracy bins with questionsbelonging to the age group 5-8 comprising the majority of thepredictions which is expected because 5-8 is the most commonage group in the dataset (see Fig. 7).Table 4 shows the accuracy of different ablated versions ofour best model (deeper LSTM Q + norm I) for both the open-ended and multiple-choice tasks on the VQA test-dev for realimages. The different ablated versions are as follows –
1) Without I Norm: In this model, the activations from thelast hidden layer of VGGNet [48] are not `2-normalized.Comparing the accuracies in Table 4 and Table 2, wecan see that `2-normalization of image features booststhe performance by 0.16% for open-ended task and by0.24% for multiple-choice task.
2) Concatenation: In this model, the transformed image andLSTM embeddings are concatenated (instead of element-wise multiplied), resulting in doubling the number of

11
0
10
20
30
40
50
60
70
80
90
100A
vera
ge A
ccu
racy
Fig. 9: Pr (system is correct | answer) for 50 most frequent ground truth answers on the VQA validation set (plot is sorted by accuracy, notfrequency). System refers to our best model (deeper LSTM Q + norm I).
0.1
1
10
100
Perc
enta
ge o
f co
rrec
t q
ues
tio
ns
Fig. 10: Pr (answer | system is correct) for 50 most frequently predicted answers on the VQA validation set (plot is sorted by predictionfrequency, not accuracy). System refers to our best model (deeper LSTM Q + norm I).
0
10
20
30
40
50
60
70
80
90
100
3--4 5--8 9--12 13-17 18+
Ave
rage
Acc
ura
cy
Age
Fig. 11: Pr (system is correct | age of question) on the VQA valida-tion set. System refers to our best model (deeper LSTM Q + normI).
0
10
20
30
40
50
60
70
80
90
100
0 30 60 90 100Dis
trib
uti
on
of
age
of
qu
esti
on
s p
er
accu
racy
bin
Accuracy
3--4 5--8 9--12 13--17 18+
Fig. 12: Pr (age of question | system is correct) on the VQA valida-tion set. System refers to our best model (deeper LSTM Q + normI).
parameters in the following fully-connected layer. Com-paring the accuracies in Table 4 and Table 2, we can seethat element-wise fusion performs better by 0.95% foropen-ended task and by 1.24% for multiple-choice task.
3) K = 500: In this model, we use K = 500 most frequentanswers as possible outputs. Comparing the accuracies inTable 4 and Table 2, we can see that K = 1000 performsbetter than K = 500 by 0.82% for open-ended task andby 1.92% for multiple-choice task.
4) K = 2000: In this model, we use K = 2000 most frequentanswers as possible outputs. Comparing the accuracies inTable 4 and Table 2, we can see that K = 2000 performsbetter then K = 1000 by 0.40% for open-ended task andby 1.16% for multiple-choice task.
5) Truncated Q Vocab @ 5: In this model, the inputvocabulary to the embedding layer (which encodes thequestion words) consists of only those question wordswhich occur atleast 5 times in the training dataset, thus re-ducing the vocabulary size from 14770 (when all questionwords are used) to 5134 (65.24% reduction). Remainingquestion words are replaced with UNK (unknown) tokens.Comparing the accuracies in Table 4 and Table 2, we cansee that truncating the question vocabulary @ 5 performsbetter than using all questions words by 0.24% for open-ended task and by 0.17% for multiple-choice task.
6) Truncated Q Vocab @ 11: In this model, the inputvocabulary to the embedding layer (which encodes thequestion words) consists of only those question wordswhich occur atleast 11 times in the training dataset,thus reducing the vocabulary size from 14770 (when allquestion words are used) to 3561 (75.89% reduction).Remaining question words are replaced with UNK (un-known) tokens. Comparing the accuracies in Table 4and Table 2, we can see that truncating the questionvocabulary @ 11 performs better than using all questionswords by 0.06% for open-ended task and by 0.02% formultiple-choice task.
7) Filtered Dataset: We created a filtered version of theVQA train + val dataset in which we only keep theanswers with subject confidence “yes”. Also, we keeponly those questions for which at least 50% (5 out of 10)answers are annotated with subject confidence “yes”. Theresulting filtered dataset consists of 344600 questions,

12
Open-Ended Multiple-Choice
All Yes/No Number Other All Yes/No Number Other
Without I Norm 57.59 80.41 36.63 42.84 62.46 80.43 38.10 52.62Concatenation 56.80 78.49 35.08 43.19 61.46 78.52 36.43 52.54K = 500 56.93 80.61 36.24 41.39 60.78 80.64 37.44 49.10K = 2000 58.15 80.56 37.04 43.79 63.86 80.59 38.97 55.20Truncated Q Vocab @ 5 57.99 80.67 36.99 43.38 62.87 80.71 38.22 53.20Truncated Q Vocab @ 11 57.81 80.42 36.97 43.22 62.72 80.45 38.30 53.09Filtered Dataset 56.62 80.19 37.48 40.95 60.82 80.19 37.48 49.57
TABLE 4: Accuracy of ablated versions of our best model (deeperLSTM Q + norm I) for the open-ended and multiple-choice tasks onthe VQA test-dev for real images. Q = Question, I = Image. See textfor details.
compared to 369861 questions in the original dataset, thusleading to only 6.83% reduction in the size of the dataset.The filtered dataset has 8.77 answers per question onaverage. We did not filter the test set so that accuracies ofthe model trained on the filtered dataset can be comparedwith that of the model trained on the original dataset. Therow “Filtered Dataset” in Table 4 shows the performanceof the deeper LSTM Q + norm I model when trainedon the filtered dataset. Comparing these accuracies withthe corresponding accuracies in Table 2, we can see thatthe model trained on filtered version performs worse by1.13% for open-ended task and by 1.88% for multiple-choice task.
6 VQA CHALLENGE AND WORKSHOP
We have set up an evaluation server3 where results may beuploaded for the test set and it returns an accuracy breakdown.We are organizing an annual challenge and workshop tofacilitate systematic progress in this area; the first instanceof the workshop will be held at CVPR 20164. We suggest thatpapers reporting results on the VQA dataset –
1) Report test-standard accuracies, which can be calculatedusing either of the non-test-dev phases, i.e., “test2015”or “Challenge test2015” on the following links: [oe-real| oe-abstract | mc-real | mc-abstract].
2) Compare their test-standard accuracies with those on thecorresponding test2015 leaderboards [oe-real-leaderboard| oe-abstract-leaderboard | mc-real-leaderboard | mc-abstract-leaderboard].
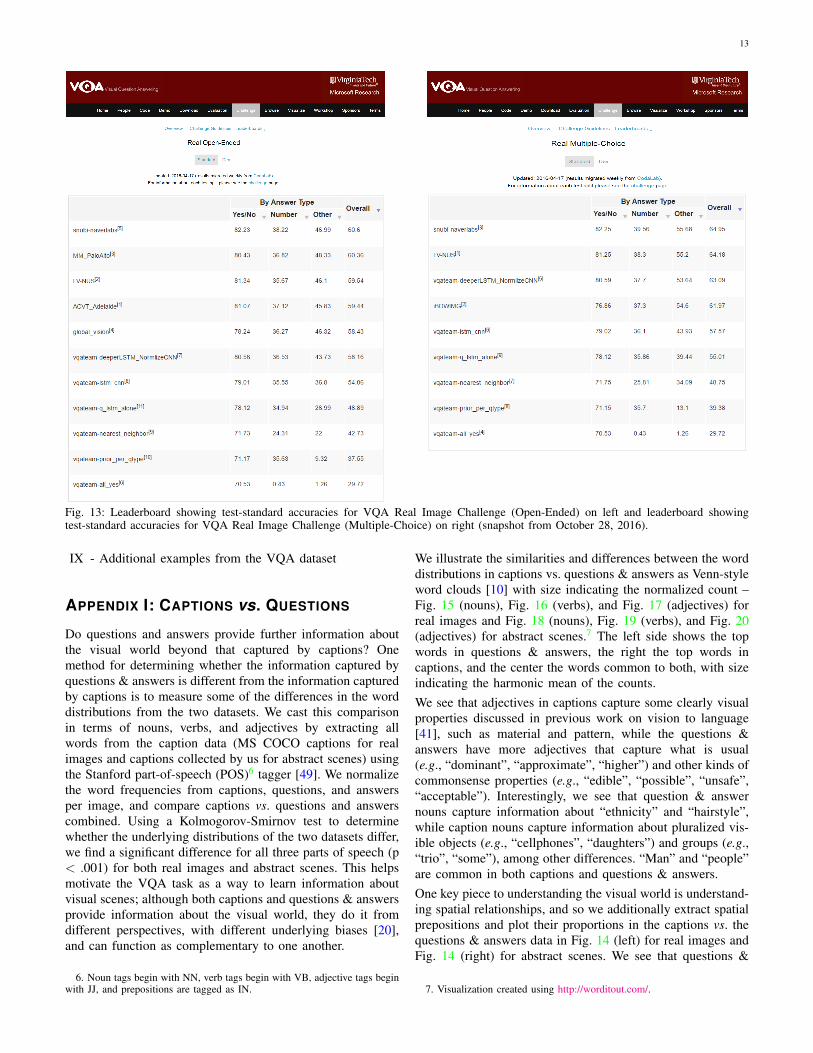
For more details, please see the challenge page5. Screenshotsof leaderboards for open-ended-real and multiple-choice-realare shown in Fig. 13. We also compare the test-standardaccuracies of our best model (deeper LSTM Q + norm I) forboth open-ended and multiple-choice tasks (real images) withother entries (as of October 28, 2016) on the correspondingleaderboards in Table 5.
7 CONCLUSION AND DISCUSSION
In conclusion, we introduce the task of Visual QuestionAnswering (VQA). Given an image and an open-ended, natural
3. http://visualqa.org/challenge.html4. http://www.visualqa.org/workshop.html5. http://visualqa.org/challenge.html
Open-Ended Multiple-Choice
All Yes/No Number Other All Yes/No Number Other
snubi-naverlabs 60.60 82.23 38.22 46.99 64.95 82.25 39.56 55.68MM PaloAlto 60.36 80.43 36.82 48.33 – – – –LV-NUS 59.54 81.34 35.67 46.10 64.18 81.25 38.30 55.20ACVT Adelaide 59.44 81.07 37.12 45.83 – – – –global vision 58.43 78.24 36.27 46.32 – – – –deeper LSTM Q + norm I 58.16 80.56 36.53 43.73 63.09 80.59 37.70 53.64iBOWIMG – – – – 61.97 76.86 37.30 54.60
TABLE 5: Test-standard accuracy of our best model (deeper LSTMQ + norm I) compared to test-standard accuracies of other entriesfor the open-ended and multiple-choice tasks in the respective VQAReal Image Challenge leaderboards (as of October 28, 2016).
language question about the image, the task is to providean accurate natural language answer. We provide a datasetcontaining over 250K images, 760K questions, and around10M answers. We demonstrate the wide variety of questionsand answers in our dataset, as well as the diverse set of AIcapabilities in computer vision, natural language processing,and commonsense reasoning required to answer these ques-tions accurately.The questions we solicited from our human subjects wereopen-ended and not task-specific. For some application do-mains, it would be useful to collect task-specific questions.For instance, questions may be gathered from subjects whoare visually impaired [3], or the questions could focused onone specific domain (say sports). Bigham et al. [3] created anapplication that allows the visually impaired to capture imagesand ask open-ended questions that are answered by humansubjects. Interestingly, these questions can rarely be answeredusing generic captions. Training on task-specific datasets mayhelp enable practical VQA applications.We believe VQA has the distinctive advantage of pushing thefrontiers on “AI-complete” problems, while being amenableto automatic evaluation. Given the recent progress in thecommunity, we believe the time is ripe to take on such anendeavor.Acknowledgements. We would like to acknowledge thecountless hours of effort provided by the workers on AmazonMechanical Turk. This work was supported in part by the ThePaul G. Allen Family Foundation via an award to D.P., ICTASat Virginia Tech via awards to D.B. and D.P., Google FacultyResearch Awards to D.P. and D.B., the National ScienceFoundation CAREER award to D.B., the Army ResearchOffice YIP Award to D.B., and a Office of Naval Researchgrant to D.B.
APPENDIX OVERVIEW
In the appendix, we provide:
I - Additional analysis comparing captions and Q&A dataII - Qualitative visualizations for “What is” questions
III - Human accuracy on multiple-choice questionsIV - Details on VQA baselinesV - “Age” and “Commonsense” of our model
VI - Details on the abstract scene datasetVII - User interfaces used to collect the dataset
VIII - List of the top answers in the dataset
13
Fig. 13: Leaderboard showing test-standard accuracies for VQA Real Image Challenge (Open-Ended) on left and leaderboard showingtest-standard accuracies for VQA Real Image Challenge (Multiple-Choice) on right (snapshot from October 28, 2016).
IX - Additional examples from the VQA dataset
APPENDIX I: CAPTIONS vs. QUESTIONS
Do questions and answers provide further information aboutthe visual world beyond that captured by captions? Onemethod for determining whether the information captured byquestions & answers is different from the information capturedby captions is to measure some of the differences in the worddistributions from the two datasets. We cast this comparisonin terms of nouns, verbs, and adjectives by extracting allwords from the caption data (MS COCO captions for realimages and captions collected by us for abstract scenes) usingthe Stanford part-of-speech (POS)6 tagger [49]. We normalizethe word frequencies from captions, questions, and answersper image, and compare captions vs. questions and answerscombined. Using a Kolmogorov-Smirnov test to determinewhether the underlying distributions of the two datasets differ,we find a significant difference for all three parts of speech (p< .001) for both real images and abstract scenes. This helpsmotivate the VQA task as a way to learn information aboutvisual scenes; although both captions and questions & answersprovide information about the visual world, they do it fromdifferent perspectives, with different underlying biases [20],and can function as complementary to one another.
6. Noun tags begin with NN, verb tags begin with VB, adjective tags beginwith JJ, and prepositions are tagged as IN.
We illustrate the similarities and differences between the worddistributions in captions vs. questions & answers as Venn-styleword clouds [10] with size indicating the normalized count –Fig. 15 (nouns), Fig. 16 (verbs), and Fig. 17 (adjectives) forreal images and Fig. 18 (nouns), Fig. 19 (verbs), and Fig. 20(adjectives) for abstract scenes.7 The left side shows the topwords in questions & answers, the right the top words incaptions, and the center the words common to both, with sizeindicating the harmonic mean of the counts.We see that adjectives in captions capture some clearly visualproperties discussed in previous work on vision to language[41], such as material and pattern, while the questions &answers have more adjectives that capture what is usual(e.g., “dominant”, “approximate”, “higher”) and other kinds ofcommonsense properties (e.g., “edible”, “possible”, “unsafe”,“acceptable”). Interestingly, we see that question & answernouns capture information about “ethnicity” and “hairstyle”,while caption nouns capture information about pluralized vis-ible objects (e.g., “cellphones”, “daughters”) and groups (e.g.,“trio”, “some”), among other differences. “Man” and “people”are common in both captions and questions & answers.One key piece to understanding the visual world is understand-ing spatial relationships, and so we additionally extract spatialprepositions and plot their proportions in the captions vs. thequestions & answers data in Fig. 14 (left) for real images andFig. 14 (right) for abstract scenes. We see that questions &
7. Visualization created using http://worditout.com/.

14
answers have a higher proportion of specific spatial relations(i.e., “in”, “on”) compared to captions, which have a higherproportion of general spatial relations (i.e., “with”, “near”).

15
Fig. 14: Proportions of spatial prepositions in the captions and question & answers for real images (left) and abstract scenes (right).
Fig. 15: Venn-style word clouds [10] for nouns with size indicating the normalized count for real images.
Fig. 16: Venn-style word clouds [10] for verbs with size indicating the normalized count for real images.
Fig. 17: Venn-style word clouds [10] for adjectives with size indicating the normalized count for real images.

16
Fig. 18: Venn-style word clouds [10] for nouns with size indicating the normalized count for abstract scenes.
Fig. 19: Venn-style word clouds [10] for verbs with size indicating the normalized count for abstract scenes.
Fig. 20: Venn-style word clouds [10] for adjectives with size indicating the normalized count for abstract scenes.

17
Dataset Accuracy Metric All Yes/No Number Other
MC majority vote 91.54 97.40 86.97 87.91Real MC average 88.53 94.40 84.99 84.64
Open-Ended 80.62 94.78 78.46 69.69
MC majority vote 93.57 97.78 96.71 88.73Abstract MC average 90.40 94.59 94.36 85.32
Open-Ended 85.66 95.32 94.17 74.12
TABLE 6: For each of the two datasets, real and abstract, first tworows are the human accuracies for multiple-choice questions whensubjects were shown both the image and the question. Majorityvote means we consider the answer picked by majority of the threesubjects to be the predicted answer by humans and compute accuracyof that answer for each question. Average means we compute theaccuracy of each of the answers picked by the subjects and recordtheir average for each question. The last row is the inter-humanagreement for open-ended answers task when subjects were shownboth the image and the question. All accuracies are evaluated on arandom subset of 3000 questions.
APPENDIX II: “WHAT IS” ANALYSIS
In Fig. 21, we show the distribution of questions startingwith “What is” by their first five words for both real imagesand abstract scenes. Note the diversity of objects referencedin the questions, as well as, the relations between objects,such as “holding” and “sitting on”. In Fig. 22, we showthe distribution of answers for “What is” questions endingin different words. For instance, questions ending in “eating”have answers such as “pizza”, “watermelon” and “hot dog”.Notice the diversity in answers for some questions, such asthose that end with “for?” or “picture?”. Other questions resultin intuitive responses, such as “holding?” and the response“umbrella”.
APPENDIX III: MULTIPLE-CHOICE HUMAN AC-CURACY
To compute human accuracy for multiple-choice questions,we collected three human answers per question on a randomsubset of 3,000 questions for both real images and abstractscenes. In Table 6, we show the human accuracies for mul-tiple choice questions. Table 6 also shows the inter-humanagreement for open-ended answer task. In comparison to open-ended answer, the multiple-choice accuracies are more or lesssame for “yes/no” questions and significantly better (≈ 15%increase for real images and ≈ 11% increase for abstractscenes) for “other” questions. Since “other” questions maybe ambiguous, the increase in accuracy using multiple choiceis not surprising.
APPENDIX IV: DETAILS ON VQA BASELINES
“per Q-type prior” baseline. We decide on different questiontypes based on first few words of questions in the real imagestraining set and ensure that each question type has at least 30questions in the training dataset. The most popular answer foreach question type is also computed on real images trainingset.“nearest neighbor” baseline. For every question in the VQAtest-standard set, we find its k nearest neighbor questions
in the training set using cosine similarity in Skip-Thought[27] feature space. We also experimented with bag of wordsand Word2Vec [39] feature spaces but we obtained the bestperformance with Skip-Thought. In this set of k questionsand their associated images, we find the image which is mostsimilar to the query image using cosine similarity in fc7 featurespace. We use the fc7 features from the caffenet model inBVLC Caffe [23]. The most common ground truth answerof this most similar image and question pair is the predictedanswer for the query image and question pair. We pick k = 4on the test-dev set.
APPENDIX V: “AGE” AND “COMMONSENSE”OF OUR MODEL
We estimate the age and degree of commonsense of our bestmodel (deeper LSTM Q + norm I), selected using VQA test-dev accuracies). To estimate the age, we compute a weightedaverage of the average age per question, weighted by theaccuracy of the model’s predicted answer for that question,on the subset of questions in the VQA validation set forwhich we have age annotations (how old a human needs tobe to answer the question correctly). To estimate the degreeof commonsense, we compute a weighted average of theaverage degree of commonsense per question, weighted by theaccuracy of the model’s predicted answer for that question, onthe subset of questions in the VQA validation set for which wehave commonsense annotations (whether the question requirescommonsense to answer it).
APPENDIX VI: ABSTRACT SCENES DATASET
In Fig. 23 (left), we show a subset of the objects that arepresent in the abstract scenes dataset. For more examples of thescenes generated, please see Fig. 28. The user interface usedto create the scenes is shown in Fig. 23 (right). Subjects useda drag-and-drop interface to create the scenes. Each objectcould be flipped horizontally and scaled. The scale of theobject determined the rendering order of the objects. Manyobjects have different attributes corresponding to differentposes or types. Most animals have five different discrete poses.Humans have eight discrete expressions and their poses maybe continuously adjusted using a “paperdoll” model [2].
APPENDIX VII: USER INTERFACES
In Fig. 24, we show the AMT interface that we used tocollect questions for images. Note that we tell the workers thatthe robot already knows the answer to the previously askedquestion(s), inspiring them to ask different kinds of questions,thereby increasing the diversity of our dataset.Fig. 25 shows the AMT interface used for collecting answersto the previously collected questions when subjects wereshown the corresponding images. Fig. 26 shows the interfacethat was used to collect answers to questions when subjectswere not shown the corresponding image (i.e., to help ingathering incorrect, but plausible, answers for the multiple-choice task and to assess how accurately the questions can beanswered using common sense knowledge alone).

18
Real Images Abstract Scenes
What is What is
Fig. 21: Distribution of questions starting with “What is” by their first five words for a random sample of 60K questions for real images(left) and all questions for abstract scenes (right). The ordering of the words starts towards the center and radiates outwards. The arc lengthis proportional to the number of questions containing the word. White areas are words with contributions too small to show.
Real Images
Abstract Scenes
Fig. 22: Distribution of answers for questions starting with “What is” for a random sample of 60K questions for real images (top) and allquestions for abstract scenes (bottom). Each column corresponds to questions ending in different words, such as “doing?”, “on?”, etc.
19
Fig. 23: Left: A small subset of the objects present in the abstract scene dataset. Right: The AMT interface for collecting abstract scenes.The light green circles indicate where users can select to manipulate a person’s pose. Different objects may be added to the scene using thefolders to the right.
Fig. 24: Our AMT interface for collecting the third question for an image, when subjects were shown previous questions that were collectedand were asked to ask a question different from previous questions.

20
Fig. 25: The AMT interface used to collect answers to a question when subjects were shown the image while answering the question.
Fig. 26: The AMT interface used to collect answers to a question when subjects were not shown the image while answering the questionusing only commonsense to collect the plausible, but incorrect, multiple-choice answers.
21
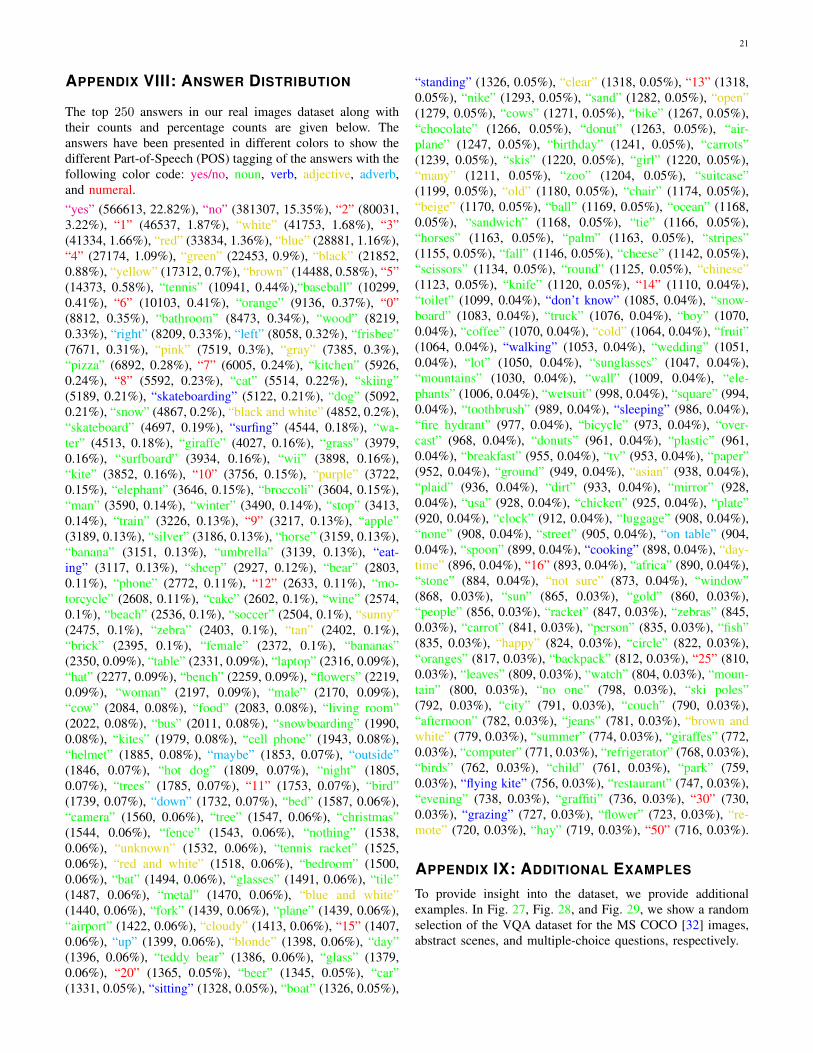
APPENDIX VIII: ANSWER DISTRIBUTION
The top 250 answers in our real images dataset along withtheir counts and percentage counts are given below. Theanswers have been presented in different colors to show thedifferent Part-of-Speech (POS) tagging of the answers with thefollowing color code: yes/no, noun, verb, adjective, adverb,and numeral.“yes” (566613, 22.82%), “no” (381307, 15.35%), “2” (80031,3.22%), “1” (46537, 1.87%), “white” (41753, 1.68%), “3”(41334, 1.66%), “red” (33834, 1.36%), “blue” (28881, 1.16%),“4” (27174, 1.09%), “green” (22453, 0.9%), “black” (21852,0.88%), “yellow” (17312, 0.7%), “brown” (14488, 0.58%), “5”(14373, 0.58%), “tennis” (10941, 0.44%),“baseball” (10299,0.41%), “6” (10103, 0.41%), “orange” (9136, 0.37%), “0”(8812, 0.35%), “bathroom” (8473, 0.34%), “wood” (8219,0.33%), “right” (8209, 0.33%), “left” (8058, 0.32%), “frisbee”(7671, 0.31%), “pink” (7519, 0.3%), “gray” (7385, 0.3%),“pizza” (6892, 0.28%), “7” (6005, 0.24%), “kitchen” (5926,0.24%), “8” (5592, 0.23%), “cat” (5514, 0.22%), “skiing”(5189, 0.21%), “skateboarding” (5122, 0.21%), “dog” (5092,0.21%), “snow” (4867, 0.2%), “black and white” (4852, 0.2%),“skateboard” (4697, 0.19%), “surfing” (4544, 0.18%), “wa-ter” (4513, 0.18%), “giraffe” (4027, 0.16%), “grass” (3979,0.16%), “surfboard” (3934, 0.16%), “wii” (3898, 0.16%),“kite” (3852, 0.16%), “10” (3756, 0.15%), “purple” (3722,0.15%), “elephant” (3646, 0.15%), “broccoli” (3604, 0.15%),“man” (3590, 0.14%), “winter” (3490, 0.14%), “stop” (3413,0.14%), “train” (3226, 0.13%), “9” (3217, 0.13%), “apple”(3189, 0.13%), “silver” (3186, 0.13%), “horse” (3159, 0.13%),“banana” (3151, 0.13%), “umbrella” (3139, 0.13%), “eat-ing” (3117, 0.13%), “sheep” (2927, 0.12%), “bear” (2803,0.11%), “phone” (2772, 0.11%), “12” (2633, 0.11%), “mo-torcycle” (2608, 0.11%), “cake” (2602, 0.1%), “wine” (2574,0.1%), “beach” (2536, 0.1%), “soccer” (2504, 0.1%), “sunny”(2475, 0.1%), “zebra” (2403, 0.1%), “tan” (2402, 0.1%),“brick” (2395, 0.1%), “female” (2372, 0.1%), “bananas”(2350, 0.09%), “table” (2331, 0.09%), “laptop” (2316, 0.09%),“hat” (2277, 0.09%), “bench” (2259, 0.09%), “flowers” (2219,0.09%), “woman” (2197, 0.09%), “male” (2170, 0.09%),“cow” (2084, 0.08%), “food” (2083, 0.08%), “living room”(2022, 0.08%), “bus” (2011, 0.08%), “snowboarding” (1990,0.08%), “kites” (1979, 0.08%), “cell phone” (1943, 0.08%),“helmet” (1885, 0.08%), “maybe” (1853, 0.07%), “outside”(1846, 0.07%), “hot dog” (1809, 0.07%), “night” (1805,0.07%), “trees” (1785, 0.07%), “11” (1753, 0.07%), “bird”(1739, 0.07%), “down” (1732, 0.07%), “bed” (1587, 0.06%),“camera” (1560, 0.06%), “tree” (1547, 0.06%), “christmas”(1544, 0.06%), “fence” (1543, 0.06%), “nothing” (1538,0.06%), “unknown” (1532, 0.06%), “tennis racket” (1525,0.06%), “red and white” (1518, 0.06%), “bedroom” (1500,0.06%), “bat” (1494, 0.06%), “glasses” (1491, 0.06%), “tile”(1487, 0.06%), “metal” (1470, 0.06%), “blue and white”(1440, 0.06%), “fork” (1439, 0.06%), “plane” (1439, 0.06%),“airport” (1422, 0.06%), “cloudy” (1413, 0.06%), “15” (1407,0.06%), “up” (1399, 0.06%), “blonde” (1398, 0.06%), “day”(1396, 0.06%), “teddy bear” (1386, 0.06%), “glass” (1379,0.06%), “20” (1365, 0.05%), “beer” (1345, 0.05%), “car”(1331, 0.05%), “sitting” (1328, 0.05%), “boat” (1326, 0.05%),
“standing” (1326, 0.05%), “clear” (1318, 0.05%), “13” (1318,0.05%), “nike” (1293, 0.05%), “sand” (1282, 0.05%), “open”(1279, 0.05%), “cows” (1271, 0.05%), “bike” (1267, 0.05%),“chocolate” (1266, 0.05%), “donut” (1263, 0.05%), “air-plane” (1247, 0.05%), “birthday” (1241, 0.05%), “carrots”(1239, 0.05%), “skis” (1220, 0.05%), “girl” (1220, 0.05%),“many” (1211, 0.05%), “zoo” (1204, 0.05%), “suitcase”(1199, 0.05%), “old” (1180, 0.05%), “chair” (1174, 0.05%),“beige” (1170, 0.05%), “ball” (1169, 0.05%), “ocean” (1168,0.05%), “sandwich” (1168, 0.05%), “tie” (1166, 0.05%),“horses” (1163, 0.05%), “palm” (1163, 0.05%), “stripes”(1155, 0.05%), “fall” (1146, 0.05%), “cheese” (1142, 0.05%),“scissors” (1134, 0.05%), “round” (1125, 0.05%), “chinese”(1123, 0.05%), “knife” (1120, 0.05%), “14” (1110, 0.04%),“toilet” (1099, 0.04%), “don’t know” (1085, 0.04%), “snow-board” (1083, 0.04%), “truck” (1076, 0.04%), “boy” (1070,0.04%), “coffee” (1070, 0.04%), “cold” (1064, 0.04%), “fruit”(1064, 0.04%), “walking” (1053, 0.04%), “wedding” (1051,0.04%), “lot” (1050, 0.04%), “sunglasses” (1047, 0.04%),“mountains” (1030, 0.04%), “wall” (1009, 0.04%), “ele-phants” (1006, 0.04%), “wetsuit” (998, 0.04%), “square” (994,0.04%), “toothbrush” (989, 0.04%), “sleeping” (986, 0.04%),“fire hydrant” (977, 0.04%), “bicycle” (973, 0.04%), “over-cast” (968, 0.04%), “donuts” (961, 0.04%), “plastic” (961,0.04%), “breakfast” (955, 0.04%), “tv” (953, 0.04%), “paper”(952, 0.04%), “ground” (949, 0.04%), “asian” (938, 0.04%),“plaid” (936, 0.04%), “dirt” (933, 0.04%), “mirror” (928,0.04%), “usa” (928, 0.04%), “chicken” (925, 0.04%), “plate”(920, 0.04%), “clock” (912, 0.04%), “luggage” (908, 0.04%),“none” (908, 0.04%), “street” (905, 0.04%), “on table” (904,0.04%), “spoon” (899, 0.04%), “cooking” (898, 0.04%), “day-time” (896, 0.04%), “16” (893, 0.04%), “africa” (890, 0.04%),“stone” (884, 0.04%), “not sure” (873, 0.04%), “window”(868, 0.03%), “sun” (865, 0.03%), “gold” (860, 0.03%),“people” (856, 0.03%), “racket” (847, 0.03%), “zebras” (845,0.03%), “carrot” (841, 0.03%), “person” (835, 0.03%), “fish”(835, 0.03%), “happy” (824, 0.03%), “circle” (822, 0.03%),“oranges” (817, 0.03%), “backpack” (812, 0.03%), “25” (810,0.03%), “leaves” (809, 0.03%), “watch” (804, 0.03%), “moun-tain” (800, 0.03%), “no one” (798, 0.03%), “ski poles”(792, 0.03%), “city” (791, 0.03%), “couch” (790, 0.03%),“afternoon” (782, 0.03%), “jeans” (781, 0.03%), “brown andwhite” (779, 0.03%), “summer” (774, 0.03%), “giraffes” (772,0.03%), “computer” (771, 0.03%), “refrigerator” (768, 0.03%),“birds” (762, 0.03%), “child” (761, 0.03%), “park” (759,0.03%), “flying kite” (756, 0.03%), “restaurant” (747, 0.03%),“evening” (738, 0.03%), “graffiti” (736, 0.03%), “30” (730,0.03%), “grazing” (727, 0.03%), “flower” (723, 0.03%), “re-mote” (720, 0.03%), “hay” (719, 0.03%), “50” (716, 0.03%).
APPENDIX IX: ADDITIONAL EXAMPLES
To provide insight into the dataset, we provide additionalexamples. In Fig. 27, Fig. 28, and Fig. 29, we show a randomselection of the VQA dataset for the MS COCO [32] images,abstract scenes, and multiple-choice questions, respectively.

22
What part of the body are these worn around?
neck neck neck
legs neck wrist
How many ties are there?
2 10
many
3 4 4
Does this look like a group of nerds?
no no no
no yes yes
What are the people throwing?
frisbee frisbee frisbee
balls rice
frsibee
Which player on the field head-butted the ball?
18 18
player on left
1 in front of goal number 13 number 22
What number is on the girl in black?
18 18 18
1 4 8
How many people are wearing an orange shirt?
3 3 3
1 3 3
Is this a trained elephant?
yes yes yes
yes yes yes
What is the type of meat under the bread?
beef roast beef roast beef
bologna ham tan
How much fluid is in the bottom of the bowl?
0 1 oz little
3 ounces a lot some
How many stories is this home?
1 1 2
2 3 3
Is the table large enough for 10 average people to eat at?
no no no
no yes yes
How many boats are visible?
3 4 5
2 3 4
How many umbrellas are in the image?
4 4 4
2 2
9734
Why does this male have his arms in this position?
balance for balance for balance
angry he’s carrying bags
hug
Are the clouds high in the sky?
yes yes yes
no no yes
Is it raining? no no no
yes yes Yes
Are there any people sitting on the bench?
No No No
No No Yes
What is the woman carrying?
umbrella umbrella umbrella
phone purse
suitcase
What is the most colorful object in the picture?
umbrella umbrella umbrella
art flower flowers
What is in the child’s mouth?
her thumb it’s thumg
thumb
candy cookie lollipop
What is the child harnessed to?
her thumb high chair
seat
bike child seat
seat
What color are the shoe laces?
Blue Blue
Light blue
Black Red
White
What is he sitting on?
Skateboard Skateboard Skateboard
Bench Chair Chair
What is the horse missing to be able to ride it?
saddle saddle saddle
saddle saddle saddle
What shape is the building on the right?
pyramid steeple triangle
rectangular square square
What red objects in front are almost covered by snow?
meters parking meters parking meters
car cars
shoes
Is it winter? yes yes yes
no yes yes
Does the car have a license plate?
yes yes yes
yes yes yes
Could the truck have a camper?
yes yes yes
yes yes yes
Is the picture hanging straight?
no yes yes
no yes yes
How many cabinets are on the piece of furniture?
4 4 4
3 3 6
Is this person trying to hit a ball?
yes yes yes
yes yes yes
What is the person hitting the ball with?
frisbie racket
round paddle
bat bat
racket
What type of trees are here?
palm palm palm
ash oak pine
Is the skateboard airborne?
yes yes yes
no yes yes
What is the animal in the water?
dog dog dog
duck duck
guppy
How many people are present?
15 15 15
2 3 3
What is on the ground?
snow snow snow
dirt dirt mud
Does the man have a backpack?
yes yes yes
no yes yes
What is the guy doing as he sits on the bench?
phone taking picture
taking picture with phone
reading reading smokes
What color are his shoes?
blue blue blue
black black brown
Is this photo taken in Antarctica?
no no no
no yes yes
Overcast or sunny? overcast overcast overcast
overcast overcast sunny
Is the woman on the back of the bicycle pedaling?
no no yes
no no yes
Why is the woman holding an umbrella?
sunny to block sun
uncertain
it’s raining it’s raining to stay dry
Is it sunny in this picture?
yes yes yes
yes yes yes
How many bikes on the floor?
2 2 2
3 3 bikes
4
Fig. 27: Random examples of questions (black), (a subset of the) answers given when looking at the image (green), and answers given whennot looking at the image (blue) for numerous representative examples of the real image dataset.
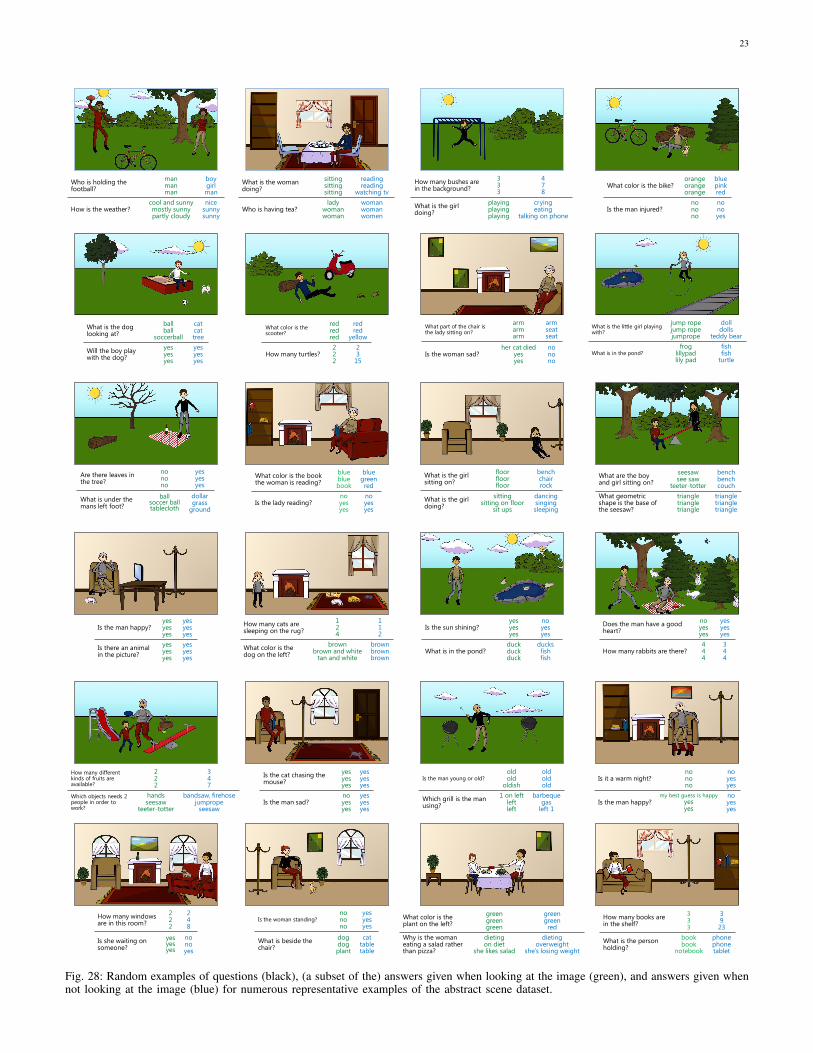
23
Who is holding the football?
man man man
boy girl man
How is the weather? cool and sunny mostly sunny partly cloudy
nice sunny sunny
What is the dog looking at?
ball ball
soccerball
cat cat tree
Will the boy play with the dog?
yes yes yes
yes yes yes
What is the little girl playing with?
jump rope jump rope jumprope
doll dolls
teddy bear
What is in the pond? frog
lillypad lily pad
fish fish
turtle
What part of the chair is the lady sitting on?
arm arm arm
arm seat seat
Is the woman sad? her cat died
yes yes
no no no
What color is the book the woman is reading?
blue blue book
blue green red
Is the lady reading? no yes yes
no yes yes
What are the boy and girl sitting on?
seesaw see saw
teeter-totter
bench bench couch
What geometric shape is the base of the seesaw?
triangle triangle triangle
triangle triangle triangle
What color is the bike? orange orange orange
blue pink red
Is the man injured? no no no
no no yes
What color is the scooter?
red red red
red red
yellow
How many turtles? 2 2 2
2 3
15
What is the woman doing?
sitting sitting sitting
reading reading
watching tv
Who is having tea? lady
woman woman
woman woman women
Are there leaves in the tree?
no no no
yes yes yes
What is under the mans left foot?
ball soccer ball tablecloth
dollar grass
ground
Is the sun shining? yes yes yes
no yes yes
What is in the pond? duck duck duck
ducks fish fish
How many bushes are in the background?
3 3 3
4 7 8
What is the girl doing?
playing playing playing
crying eating
talking on phone
How many cats are sleeping on the rug?
1 2 4
1 1 2
What color is the dog on the left?
brown brown and white
tan and white
brown brown brown
How many different kinds of fruits are available?
2 2 2
3 4 7
Which objects needs 2 people in order to work?
hands seesaw
teeter-totter
bandsaw, firehose jumprope
seesaw
Is the cat chasing the mouse?
yes yes yes
yes yes yes
Is the man sad? no yes yes
yes yes yes
Is the woman standing? no no no
yes yes yes
What is beside the chair?
dog dog plant
cat table table
How many books are in the shelf?
3 3 3
3 9
23
What is the person holding?
book book
notebook
phone phone tablet
What color is the plant on the left?
green green green
green green red
Why is the woman eating a salad rather than pizza?
dieting on diet
she likes salad
dieting overweight
she’s losing weight
Does the man have a good heart?
no yes yes
yes yes yes
How many rabbits are there? 4 4 4
3 4 4
Is it a warm night? no no no
no yes yes
Is the man happy? my best guess is happy
yes yes
no yes yes
Is the man happy? yes yes yes
yes yes yes
Is there an animal in the picture?
yes yes yes
yes yes yes
How many windows are in this room?
2 2 2
2 4 8
Is she waiting on someone?
yes yes yes
no no yes
Is the man young or old? old old
oldish
old old old
Which grill is the man using?
1 on left left left
barbeque gas
left 1
What is the girl sitting on?
floor floor floor
bench chair rock
What is the girl doing?
sitting sitting on floor
sit ups
dancing singing sleeping
Fig. 28: Random examples of questions (black), (a subset of the) answers given when looking at the image (green), and answers given whennot looking at the image (blue) for numerous representative examples of the abstract scene dataset.

24
Q: What is the color of freebee?
(a) yes (b) no
(c) 1 (d) 2 (e) 3 (f) 4
(g) white (h) red (i) blue (j) green
(k) brick (l) peach (m) hill (n) vitamin c
(o) brown (p) christleton (q) bonsai tree (r) black
Q: How old is the child?
(a) yes (b) no
(c) 1 (d) 2 (e) 3 (f) 4
(g) white (h) red (i) blue (j) green
(k) 6 (l) 12 (m) 10 (n) mechanics
(o) 5 (p) wait here (q) mad (r) recording studio
Q: Where is the kid pointing?
(a) yes (b) no
(c) 1 (d) 2 (e) 3 (f) 4
(g) white (h) red (i) blue (j) green
(k) park (l) up (m) floor mat (n) so people don't get wet
(o) down (p) mom (q) pharos (r) ketchup pickle relish mustard
Q: How many people are in the picture on side of refrigerator?
(a) yes (b) no
(c) 1 (d) 2 (e) 3 (f) 4
(g) white (h) red (i) blue (j) green
(k) 108 mph (l) banana, apple (m) 7 (n) 10 many
(o) fruit salad (p) full swing (q) 5 (r) vattenfall strom fur gewinner
Q: How many of the deer are sleeping?
(a) yes (b) no
(c) 1 (d) 2 (e) 3 (f) 4
(g) white (h) red (i) blue (j) yellow
(k) 5 (l) left of pond (m) 13 (n) plants and cat
(o) tree base (p) cement (q) 0 (r) green, blue and yellow
Q: What type of wildlife is this park overrun with?
(a) yes (b) no
(c) 1 (d) 2 (e) 3 (f) 4
(g) white (h) red (i) blue (j) yellow
(k) eating (l) deer (m) mosquitoes (n) soup
(o) birds (p) ants (q) girl’s (r) woman on right
Q: Is the girl standing?
(a) yes (b) no
(c) 1 (d) 2 (e) 3 (f) 4
(g) white (h) red (i) blue (j) yellow
(k) yes! (l) standing (m) hiding (n) sitting
(o) to sleep (p) bird nest (q) slide (r) park ranger
Q: Does the girl have a lot of toys?
(a) yes (b) no
(c) 1 (d) 2 (e) 3 (f) 4
(g) white (h) red (i) blue (j) yellow
(k) fork (l) deer (m) rock (n) y
(o) slide (p) yes 3 of them (q) no image (r) children and toys
Q: What sport are they playing?
(a) yes (b) no
(c) 1 (d) 2 (e) 3 (f) 4
(g) white (h) red (i) blue (j) green
(k) tennis (l) bodily functions (m) scissors (n) mississippi and meade
(o) baseball (p) frisbee (q) soccer (r) its advertising object
Q: What is the man in gray pant's job?
(a) yes (b) no
(c) 1 (d) 2 (e) 3 (f) 4
(g) white (h) red (i) blue (j) green
(k) cop (l) umpire (m) snowflake (n) banker
(o) chef (p) speedboat (q) 10: 32 (r) males
Q: Is this person's face painted?
(a) yes (b) no
(c) 1 (d) 2 (e) 3 (f) 4
(g) white (h) red (i) blue (j) green
(k) 4498 (l) not (m) camera film (n) keyboard, mouse, booklet
(o) stairs (p) n200 (q) public storage (r) pasta, sauce, meat
Q: How many umbrellas are in the photo?
(a) yes (b) no
(c) 1 (d) 2 (e) 3 (f) 4
(g) white (h) red (i) blue (j) green
(k) 20 (l) 54 (m) max payne (n) 62
(o) 12 (p) dresses (q) 3 to 5 (r) two way traffic
Q: Where is the blanket?
(a) yes (b) no
(c) 1 (d) 2 (e) 3 (f) 4
(g) white (h) red (i) blue (j) yellow
(k) fat (l) lying down (m) bed (n) utensils
(o) on bed (p) grass (q) ground (r) watching child
Q: What is for dessert?
(a) yes (b) no
(c) 1 (d) 2 (e) 3 (f) 4
(g) white (h) red (i) blue (j) yellow
(k) cake (l) pie (m) a (n) doll and dollhouse
(o) ice cream (p) yellow book (q) cheesecake (r) there are no fish
Q: Why does the little girl not look happy?
(a) yes (b) no
(c) 1 (d) 2 (e) 3 (f) 4
(g) white (h) red (i) blue (j) yellow
(k) indian (l) upset (m) dog left (n) smiling at it
(o) corner (p) to be pet (q) she fell (r) boy is playing with her toys
Q: Why is the boy playing with his sister's toys?
(a) yes (b) no
(c) 1 (d) 2 (e) 3 (f) 4
(g) white (h) red (i) blue (j) yellow
(k) he likes them (l) parking it (m) dogs (n) shelf
(o) he feeds them (p) lonely (q) bored (r) likes them
Q: Why are they standing?
(a) yes (b) no
(c) 1 (d) 2 (e) 3 (f) 4
(g) white (h) red (i) blue (j) yellow
(k) playing game (l) sheepskin (m) waiting (n) no where to sit
(o) firestone (p) rugby (q) forks (r) waiting for train
Q: Is the TV on?
(a) yes (b) no
(c) 1 (d) 2 (e) 3 (f) 4
(g) white (h) red (i) blue (j) yellow
(k) shag (l) jeopardy (m) sports (n) between big elephants
(o) edinburgh (p) strawberries (q) tv show (r) white streak on face
Q: How many legs does the dog have?
(a) yes (b) no
(c) 1 (d) 2 (e) 3 (f) 4
(g) white (h) red (i) blue (j) yellow
(k) outdoors (l) hiding (m) 45 (n) sitting in grass
(o) owls (p) 8 (q) 12 (r) arm of sofa
Q: Is the boy at the top of the ladder?
(a) yes (b) no
(c) 1 (d) 2 (e) 3 (f) 4
(g) white (h) red (i) blue (j) yellow
(k) not sure (l) yellow dog (m) bottom (n) behind trees
(o) a (p) girl on right (q) top (r) she's in middle
Fig. 29: Random examples of multiple-choice questions for numerous representative examples of the real and abstract scene dataset.

25
REFERENCES
[1] H. Agrawal, C. S. Mathialagan, Y. Goyal, N. Chavali, P. Banik, A. Mo-hapatra, A. Osman, and D. Batra. Cloudcv: Large-scale distributedcomputer vision as a cloud service. In Mobile Cloud Visual MediaComputing, pages 265–290. Springer International Publishing, 2015. 10
[2] S. Antol, C. L. Zitnick, and D. Parikh. Zero-Shot Learning via VisualAbstraction. In ECCV, 2014. 2, 3, 17
[3] J. P. Bigham, C. Jayant, H. Ji, G. Little, A. Miller, R. C. Miller, R. Miller,A. Tatarowicz, B. White, S. White, and T. Yeh. VizWiz: Nearly Real-time Answers to Visual Questions. In User Interface Software andTechnology, 2010. 1, 2, 12
[4] K. Bollacker, C. Evans, P. Paritosh, T. Sturge, and J. Taylor. Freebase:A Collaboratively Created Graph Database for Structuring HumanKnowledge. In International Conference on Management of Data, 2008.2
[5] A. Carlson, J. Betteridge, B. Kisiel, B. Settles, E. R. H. Jr., and T. M.Mitchell. Toward an Architecture for Never-Ending Language Learning.In AAAI, 2010. 2
[6] X. Chen, H. Fang, T. Lin, R. Vedantam, S. Gupta, P. Dollar, and C. L.Zitnick. Microsoft COCO captions: Data collection and evaluationserver. CoRR, abs/1504.00325, 2015. 4
[7] X. Chen, H. Fang, T.-Y. Lin, R. Vedantam, S. Gupta, P. Dollar, and C. L.Zitnick. Microsoft COCO Captions: Data Collection and EvaluationServer. arXiv preprint arXiv:1504.00325, 2015. 3
[8] X. Chen, A. Shrivastava, and A. Gupta. NEIL: Extracting VisualKnowledge from Web Data. In ICCV, 2013. 2
[9] X. Chen and C. L. Zitnick. Mind’s Eye: A Recurrent Visual Represen-tation for Image Caption Generation. In CVPR, 2015. 1, 2
[10] G. Coppersmith and E. Kelly. Dynamic wordclouds and vennclouds forexploratory data analysis. In ACL Workshop on Interactive LanguageLearning and Visualization, 2014. 13, 15, 16
[11] J. Deng, A. C. Berg, and L. Fei-Fei. Hierarchical Semantic Indexingfor Large Scale Image Retrieval. In CVPR, 2011. 2
[12] J. Donahue, L. A. Hendricks, S. Guadarrama, M. Rohrbach, S. Venu-gopalan, K. Saenko, and T. Darrell. Long-term Recurrent ConvolutionalNetworks for Visual Recognition and Description. In CVPR, 2015. 1, 2
[13] D. Elliott and F. Keller. Comparing Automatic Evaluation Measures forImage Description. In ACL, 2014. 1
[14] A. Fader, L. Zettlemoyer, and O. Etzioni. Paraphrase-Driven Learningfor Open Question Answering. In ACL, 2013. 2
[15] A. Fader, L. Zettlemoyer, and O. Etzioni. Open Question Answering overCurated and Extracted Knowledge Bases. In International Conferenceon Knowledge Discovery and Data Mining, 2014. 2
[16] H. Fang, S. Gupta, F. N. Iandola, R. Srivastava, L. Deng, P. Dollar,J. Gao, X. He, M. Mitchell, J. C. Platt, C. L. Zitnick, and G. Zweig.From Captions to Visual Concepts and Back. In CVPR, 2015. 1, 2
[17] A. Farhadi, M. Hejrati, A. Sadeghi, P. Young, C. Rashtchian, J. Hocken-maier, and D. Forsyth. Every Picture Tells a Story: Generating Sentencesfor Images. In ECCV, 2010. 2
[18] H. Gao, J. Mao, J. Zhou, Z. Huang, and A. Yuille. Are you talkingto a machine? dataset and methods for multilingual image questionanswering. In NIPS, 2015. 2
[19] D. Geman, S. Geman, N. Hallonquist, and L. Younes. A Visual TuringTest for Computer Vision Systems. In PNAS, 2014. 1, 2
[20] J. Gordon and B. V. Durme. Reporting bias and knowledge extraction.In Proceedings of the 3rd Workshop on Knowledge Extraction, at CIKM2013, 2013. 13
[21] S. Guadarrama, N. Krishnamoorthy, G. Malkarnenkar, S. Venugopalan,R. Mooney, T. Darrell, and K. Saenko. YouTube2Text: Recognizing andDescribing Arbitrary Activities Using Semantic Hierarchies and Zero-Shot Recognition. In ICCV, December 2013. 2
[22] M. Hodosh, P. Young, and J. Hockenmaier. Framing Image Descriptionas a Ranking Task: Data, Models and Evaluation Metrics. JAIR, 2013.1
[23] Y. Jia, E. Shelhamer, J. Donahue, S. Karayev, J. Long, R. Girshick,S. Guadarrama, and T. Darrell. Caffe: Convolutional architecture forfast feature embedding. arXiv preprint arXiv:1408.5093, 2014. 17
[24] A. Karpathy and L. Fei-Fei. Deep Visual-Semantic Alignments forGenerating Image Descriptions. In CVPR, 2015. 1, 2
[25] S. Kazemzadeh, V. Ordonez, M. Matten, and T. L. Berg. ReferItGame:Referring to Objects in Photographs of Natural Scenes. In EMNLP,2014. 2
[26] R. Kiros, R. Salakhutdinov, and R. S. Zemel. Unifying Visual-SemanticEmbeddings with Multimodal Neural Language Models. TACL, 2015.1, 2
[27] R. Kiros, Y. Zhu, R. Salakhutdinov, R. S. Zemel, A. Torralba, R. Urtasun,and S. Fidler. Skip-thought vectors. arXiv preprint arXiv:1506.06726,2015. 17
[28] C. Kong, D. Lin, M. Bansal, R. Urtasun, and S. Fidler. What Are YouTalking About? Text-to-Image Coreference. In CVPR, 2014. 2
[29] A. Krizhevsky, I. Sutskever, and G. E. Hinton. ImageNet Classificationwith Deep Convolutional Neural Networks. In NIPS, 2012. 2
[30] G. Kulkarni, V. Premraj, S. L. Sagnik Dhar and, Y. Choi, A. C. Berg,and T. L. Berg. Baby Talk: Understanding and Generating Simple ImageDescriptions. In CVPR, 2011. 2
[31] D. B. Lenat and R. V. Guha. Building Large Knowledge-Based Systems;Representation and Inference in the Cyc Project. Addison-WesleyLongman Publishing Co., Inc., 1989. 2
[32] T.-Y. Lin, M. Maire, S. Belongie, J. Hays, P. Perona, D. Ramanan,P. Dollar, and C. L. Zitnick. Microsoft COCO: Common Objects inContext. In ECCV, 2014. 2, 3, 5, 21
[33] X. Lin and D. Parikh. Don’t Just Listen, Use Your Imagination:Leveraging Visual Common Sense for Non-Visual Tasks. In CVPR,2015. 1
[34] X. Lin and D. Parikh. Don’t just listen, use your imagination: Leveragingvisual common sense for non-visual tasks. In CVPR, 2015. 2
[35] H. Liu and P. Singh. ConceptNet — A Practical CommonsenseReasoning Tool-Kit. BT Technology Journal, 2004. 2
[36] M. Malinowski and M. Fritz. A Multi-World Approach to QuestionAnswering about Real-World Scenes based on Uncertain Input. In NIPS,2014. 1, 2
[37] M. Malinowski, M. Rohrbach, and M. Fritz. Ask your neurons: A neural-based approach to answering questions about images. In ICCV, 2015.2
[38] J. Mao, W. Xu, Y. Yang, J. Wang, and A. L. Yuille. Explain Images withMultimodal Recurrent Neural Networks. CoRR, abs/1410.1090, 2014.1, 2
[39] T. Mikolov, I. Sutskever, K. Chen, G. S. Corrado, and J. Dean.Distributed Representations of Words and Phrases and their Compo-sitionality. In NIPS, 2013. 4, 8, 17
[40] M. Mitchell, J. Dodge, A. Goyal, K. Yamaguchi, K. Stratos, X. Han,A. Mensch, A. Berg, T. L. Berg, and H. Daume III. Midge: GeneratingImage Descriptions From Computer Vision Detections. In ACL, 2012.2
[41] M. Mitchell, K. van Deemter, and E. Reiter. Attributes in visualreference. In PRE-CogSci, 2013. 13
[42] M. Mitchell, K. Van Deemter, and E. Reiter. Generating Expressionsthat Refer to Visible Objects. In HLT-NAACL, 2013. 2
[43] V. Ramanathan, A. Joulin, P. Liang, and L. Fei-Fei. Linking People with“Their” Names using Coreference Resolution. In ECCV, 2014. 2
[44] M. Ren, R. Kiros, and R. Zemel. Exploring models and data for imagequestion answering. In NIPS, 2015. 2
[45] M. Richardson, C. J. Burges, and E. Renshaw. MCTest: A ChallengeDataset for the Open-Domain Machine Comprehension of Text. InEMNLP, 2013. 1, 2
[46] M. Rohrbach, W. Qiu, I. Titov, S. Thater, M. Pinkal, and B. Schiele.Translating Video Content to Natural Language Descriptions. In ICCV,2013. 2
[47] F. Sadeghi, S. K. Kumar Divvala, and A. Farhadi. Viske: Visualknowledge extraction and question answering by visual verification ofrelation phrases. In CVPR, 2015. 2
[48] K. Simonyan and A. Zisserman. Very deep convolutional networks forlarge-scale image recognition. CoRR, abs/1409.1556, 2014. 8, 9, 10
[49] K. Toutanova, D. Klein, C. D. Manning, and Y. Singer. Feature-rich part-of-speech tagging with a cyclic dependency network. In ACL, 2003. 13
[50] K. Tu, M. Meng, M. W. Lee, T. E. Choe, and S. C. Zhu. Joint Video andText Parsing for Understanding Events and Answering Queries. IEEEMultiMedia, 2014. 1, 2
[51] R. Vedantam, C. L. Zitnick, and D. Parikh. CIDEr: Consensus-basedImage Description Evaluation. In CVPR, 2015. 1
[52] R. Vendantam, X. Lin, T. Batra, C. L. Zitnick, and D. Parikh. Learningcommon sense through visual abstraction. In ICCV, 2015. 2
[53] O. Vinyals, A. Toshev, S. Bengio, and D. Erhan. Show and Tell: ANeural Image Caption Generator. In CVPR, 2015. 1, 2
[54] J. Weston, A. Bordes, S. Chopra, and T. Mikolov. Towards AI-Complete Question Answering: A Set of Prerequisite Toy Tasks. CoRR,abs/1502.05698, 2015. 2
[55] L. Yu, E. Park, A. C. Berg, and T. L. Berg. Visual madlibs: Fill-in-the-blank description generation and question answering. In ICCV, 2015.2
[56] P. Zhang, Y. Goyal, D. Summers-Stay, D. Batra, and D. Parikh. Yinand yang: Balancing and answering binary visual questions. CoRR,abs/1511.05099, 2015. 10
[57] C. L. Zitnick and D. Parikh. Bringing Semantics Into Focus UsingVisual Abstraction. In CVPR, 2013. 2, 3
[58] C. L. Zitnick, D. Parikh, and L. Vanderwende. Learning the VisualInterpretation of Sentences. In ICCV, 2013. 3
[59] C. L. Zitnick, R. Vedantam, and D. Parikh. Adopting Abstract Imagesfor Semantic Scene Understanding. PAMI, 2015. 3