vrnt-2018.04.30 - form 10-q
TRANSCRIPT

UNITED STATES SECURITIES AND EXCHANGE COMMISSIONWASHINGTON, D.C. 20549
FORM 10-Q (Mark One)
QUARTERLY REPORT PURSUANT TO SECTION 13 OR 15(d) OF THESECURITIES EXCHANGE ACT OF 1934
For the quarterly period ended April 30, 2018OR
TRANSITION REPORT PURSUANT TO SECTION 13 OR 15(d) OF THESECURITIES EXCHANGE ACT OF 1934
For the transition period from to .
Commission File No. 001-34807
Verint Systems Inc.(Exact Name of Registrant as Specified in its Charter)
Delaware
11-3200514(State or Other Jurisdiction of Incorporation or
Organization)
(I.R.S. Employer Identification No.)
175 Broadhollow Road, Melville, New York
11747(Address of Principal Executive Offices)
(Zip Code)
(631) 962-9600
(Registrant’s Telephone Number, Including Area Code) Indicate by check mark whether the registrant: (1) has filed all reports required to be filed by Section 13 or 15(d) of the Securities Exchange Act of 1934 during the preceding 12 months (or for such shorter period that the registrant was required to file such reports), and (2) has been subject to such filing requirements for the past 90 days. Yes No Indicate by check mark whether the registrant has submitted electronically and posted on its corporate Web site, if any, every Interactive Data File required to be submitted and posted pursuant to Rule 405 of Regulation S-T (§232.405 of this chapter) during the preceding 12 months (or for such shorter period that the registrant was required to submit and post such files). Yes
No Indicate by check mark whether the registrant is a large accelerated filer, an accelerated filer, a non-accelerated filer, a smaller reporting company, or an emerging growth company. See the definitions of “large accelerated filer,” “accelerated filer,” “smaller reporting company,” and “emerging growth company” in Rule 12b-2 of the Exchange Act.
Large accelerated filer Accelerated filer
Non-accelerated filer (Do not check if a smaller reporting company) Smaller reporting company
Emerging growth company

If an emerging growth company, indicate by check mark if the registrant has elected not to use the extended transition period for complying with any new or revised financial accounting standards provided pursuant to Section 13(a) of the Exchange Act.
Indicate by check mark whether the registrant is a shell company (as defined in Rule 12b-2 of the Exchange Act). Yes No There were 64,012,017 shares of the registrant’s common stock outstanding on May 15, 2018.
Table of Contents
i
Verint Systems Inc. and SubsidiariesIndex to Form 10-Q
As of and For the Period Ended April 30, 2018Page
Cautionary Note on Forward-Looking Statements Part I. Financial Information Item 1. Financial Statements (Unaudited) Condensed Consolidated Balance Sheets Condensed Consolidated Statements of Operations Condensed Consolidated Statements of Comprehensive Loss Condensed Consolidated Statements of Stockholders’ Equity Condensed Consolidated Statements of Cash Flows Notes to Condensed Consolidated Financial StatementsItem 2. Management's Discussion and Analysis of Financial Condition and Results of OperationsItem 3. Quantitative and Qualitative Disclosures About Market RiskItem 4. Controls and Procedures Part II. Other Information Item 1. Legal ProceedingsItem 1A. Risk FactorsItem 2. Unregistered Sales of Equity Securities and Use of ProceedsItem 3. Defaults Upon Senior SecuritiesItem 4. Mine Safety DisclosuresItem 5. Other InformationItem 6. Exhibits Signature
ii
1
1234567405455
57
57575757575759
60

Table of Contents
ii
Cautionary Note on Forward-Looking Statements This Quarterly Report on Form 10-Q contains “forward-looking statements” within the meaning of the Private Securities Litigation Reform Act of 1995, the provisions of Section 27A of the Securities Act of 1933, as amended (the “Securities Act”), and Section 21E of the Securities Exchange Act of 1934, as amended (the “Exchange Act”). Forward-looking statements include financial projections, statements of plans and objectives for future operations, statements of future economic performance, and statements of assumptions relating thereto. Forward-looking statements may appear throughout this report, including without limitation, Part I, Item 2, “Management’s Discussion and Analysis of Financial Condition and Results of Operations,” and are often identified by future or conditional words such as “will”, “plans”, “expects”, “intends”, “believes”, “seeks”, “estimates”, or “anticipates”, or by variations of such words or by similar expressions. There can be no assurance that forward-looking statements will be achieved. By their very nature, forward-looking statements involve known and unknown risks, uncertainties, assumptions, and other important factors that could cause our actual results or conditions to differ materially from those expressed or implied by such forward-looking statements. Important risks, uncertainties, assumptions, and other factors that could cause our actual results or conditions to differ materially from our forward-looking statements include, among others:
• uncertainties regarding the impact of general economic conditions in the United States and abroad, particularly in information technology spending and government budgets, on our business;
• risks associated with our ability to keep pace with technological changes, evolving industry standards, and customer challenges, such as the proliferation and strengthening of encryption, and the transition of portions of the software market to the cloud, to adapt to changing market potential from area to area within our markets, and to successfully develop, launch, and drive demand for new, innovative, high-quality products that meet or exceed customer needs, while simultaneously preserving our legacy businesses and migrating away from areas of commoditization;
• risks due to aggressive competition in all of our markets, including with respect to maintaining margins and sufficient levels of investment in our business;
• risks created by the continued consolidation of our competitors or the introduction of large competitors in our markets with greater resources than we have;
• risks associated with our ability to successfully compete for, consummate, and implement mergers and acquisitions, including risks associated with valuations, capital constraints, costs and expenses, maintaining profitability levels, expansion into new areas, management distraction, post-acquisition integration activities, and potential asset impairments;
• risks relating to our ability to effectively and efficiently enhance our existing operations and execute on our growth strategy and profitability goals, including managing investments in our business and operations, managing our cloud transition and our revenue mix, and enhancing and securing our internal and external operations;
• risks associated with our ability to effectively and efficiently allocate limited financial and human resources to business, developmental, strategic, or other opportunities, and risk that such investments may not come to fruition or produce satisfactory returns;
• risks that we may be unable to establish and maintain relationships with key resellers, partners, and systems integrators;
• risks associated with our reliance on third-party suppliers, partners, or original equipment manufacturers (“OEMs”) for certain components, products, or services, including companies that may compete with us or work with our competitors;
• risks associated with the mishandling or perceived mishandling of sensitive or confidential information and with security vulnerabilities or lapses, including information technology system breaches, failures, or disruptions;
• risks that our products or services, or those of third-party suppliers, partners, or OEMs which we use in or with our offerings or otherwise rely on, may contain defects or may be vulnerable to cyber-attacks;
• risks associated with our significant international operations, including, among others, in Israel, Europe, and Asia, exposure to regions subject to political or economic instability, fluctuations in foreign exchange rates, and challenges associated with a significant portion of our cash being held overseas;

Table of Contents
iii
• risks associated with a significant amount of our business coming from domestic and foreign government customers, including the ability to maintain security clearances for applicable projects and reputational risks associated with our security solutions;
• risks associated with complex and changing local and foreign regulatory environments in the jurisdictions in which we operate, including, among others, with respect to trade compliance, anti-corruption, information security, data privacy and protection, tax, labor, government contracts, and regulations related to our security solutions;
• risks associated with our ability to retain and recruit qualified personnel in regions in which we operate, including in new markets and growth areas we may enter;
• challenges associated with selling sophisticated solutions, including with respect to educating our customers on the benefits of our solutions or assisting them in realizing such benefits, and offering and maintaining a broad solution portfolio;
• challenges associated with pursuing larger sales opportunities, including with respect to longer sales cycles, transaction reductions, deferrals, or cancellations during the sales cycle, risk of customer concentration, our ability to accurately forecast when a sales opportunity will convert to an order, or to forecast revenue and expenses, and increased volatility of our operating results from period to period;
• risks that our intellectual property rights may not be adequate to protect our business or assets or that others may make claims on our intellectual property or claim infringement on their intellectual property rights;
• risks that our customers or partners delay or cancel orders or are unable to honor contractual commitments due to liquidity issues, challenges in their business, or otherwise;
• risks that we may experience liquidity or working capital issues and related risks that financing sources may be unavailable to us on reasonable terms or at all;
• risks associated with significant leverage resulting from our current debt position or our ability to incur additional debt, including with respect to liquidity considerations, covenant limitations and compliance, fluctuations in interest rates, dilution considerations (with respect to our convertible notes), and our ability to maintain our credit ratings;
• risks arising as a result of contingent or other obligations or liabilities assumed in our acquisition of our former parent company, Comverse Technology, Inc. (“CTI”), or associated with formerly being consolidated with, and part of a consolidated tax group with, CTI, or as a result of the successor to CTI’s business operations, Mavenir Inc. (“Mavenir”), being unwilling or unable to provide us with certain indemnities to which we are entitled;
• risks relating to the adequacy of our existing infrastructure, systems, processes, policies, procedures, and personnel and our ability to successfully implement and maintain enhancements to the foregoing and adequate systems and internal controls for our current and future operations and reporting needs, including related risks of financial statement omissions, misstatements, restatements, or filing delays; and
• risks associated with changing accounting principles or standards, tax rates, tax laws and regulations, and the continuing availability of expected tax benefits.
These risks, uncertainties, assumptions, and challenges, as well as other factors, are discussed in greater detail in “Risk Factors” under Item 1A of our Annual Report on Form 10-K for the year ended January 31, 2018. You are cautioned not to place undue reliance on forward-looking statements, which reflect our management’s view only as of the date of this report. We make no commitment to revise or update any forward-looking statements in order to reflect events or circumstances after the date any such statement is made, except as otherwise required under the federal securities laws. If we were in any particular instance to update or correct a forward-looking statement, investors and others should not conclude that we would make additional updates or corrections thereafter except as otherwise required under the federal securities laws.

Table of Contents
1
Part I
Item 1. Financial Statements
VERINT SYSTEMS INC. AND SUBSIDIARIESIndex to Condensed Consolidated Financial Statements (Unaudited)
Page
Condensed Consolidated Balance Sheets as of April 30, 2018 and January 31, 2018Condensed Consolidated Statements of Operations for the Three Months Ended April 30, 2018 and 2017Condensed Consolidated Statements of Comprehensive Loss for the Three Months Ended April 30, 2018 and 2017Condensed Consolidated Statements of Stockholders’ Equity for the Three Months Ended April 30, 2018 and 2017 Condensed Consolidated Statements of Cash Flows for the Three Months Ended April 30, 2018 and 2017Notes to Condensed Consolidated Financial Statements
234567

Table of Contents
2
VERINT SYSTEMS INC. AND SUBSIDIARIESCondensed Consolidated Balance Sheets
(Unaudited)
April 30, January 31,(in thousands, except share and per share data) 2018 2018Assets Current Assets: Cash and cash equivalents $ 382,237 $ 337,942Restricted cash and cash equivalents, and restricted bank time deposits 32,950 33,303Short-term investments 9,220 6,566Accounts receivable, net of allowance for doubtful accounts of $2.2 million and $2.2 million,
respectively 303,108 296,324Contract assets 87,963 —Inventories 17,954 19,871Deferred cost of revenue 8,501 6,096Prepaid expenses and other current assets 77,058 82,090
Total current assets 918,991 782,192Property and equipment, net 89,974 89,089Goodwill 1,376,264 1,388,299Intangible assets, net 207,777 226,093Capitalized software development costs, net 9,394 9,228Long-term deferred cost of revenue 4,478 2,804Other assets 93,486 82,915
Total assets $ 2,700,364 $ 2,580,620
Liabilities and Stockholders' Equity Current Liabilities: Accounts payable $ 76,256 $ 84,639Accrued expenses and other current liabilities 193,828 224,765Contract liabilities 332,139 196,107
Total current liabilities 602,223 505,511Long-term debt 770,717 768,484Long-term contract liabilities 28,354 24,519Other liabilities 135,799 149,770
Total liabilities 1,537,093 1,448,284Commitments and ContingenciesStockholders' Equity: Preferred stock - $0.001 par value; authorized 2,207,000 shares at April 30, 2018 and January 31,
2018, respectively; none issued. — —Common stock - $0.001 par value; authorized 120,000,000 shares. Issued 65,677,000 and 65,497,000
shares; outstanding 64,012,000 and 63,836,000 shares at April 30, 2018 and January 31, 2018,respectively. 66 65
Additional paid-in capital 1,534,622 1,519,724Treasury stock, at cost - 1,665,000 and 1,661,000 shares at April 30, 2018 and January 31, 2018,
respectively. (57,598) (57,425)Accumulated deficit (202,480) (238,312)Accumulated other comprehensive loss (123,421) (103,460)Total Verint Systems Inc. stockholders' equity 1,151,189 1,120,592Noncontrolling interests 12,082 11,744
Total stockholders' equity 1,163,271 1,132,336 Total liabilities and stockholders' equity $ 2,700,364 $ 2,580,620
See notes to condensed consolidated financial statements.

Table of Contents
3
VERINT SYSTEMS INC. AND SUBSIDIARIESCondensed Consolidated Statements of Operations
(Unaudited)
Three Months Ended
April 30,(in thousands, except per share data) 2018 2017Revenue: Product $ 105,864 $ 89,817Service and support 183,343 171,178 Total revenue 289,207 260,995Cost of revenue: Product 34,809 33,924Service and support 71,857 67,345Amortization of acquired technology 7,426 9,534 Total cost of revenue 114,092 110,803Gross profit 175,115 150,192Operating expenses: Research and development, net 52,152 46,233Selling, general and administrative 107,497 101,807Amortization of other acquired intangible assets 7,684 11,537 Total operating expenses 167,333 159,577Operating income (loss) 7,782 (9,385)Other income (expense), net: Interest income 793 330Interest expense (9,062) (8,988)Other expense, net (464) (1,889) Total other expense, net (8,733) (10,547)Loss before provision (benefit) for income taxes (951) (19,932)Provision (benefit) for income taxes 274 (892)Net loss (1,225) (19,040)Net income attributable to noncontrolling interests 990 746Net loss attributable to Verint Systems Inc. $ (2,215) $ (19,786)
Net loss per common share attributable to Verint Systems Inc.: Basic $ (0.03) $ (0.32)Diluted $ (0.03) $ (0.32)
Weighted-average common shares outstanding: Basic 63,928 62,485Diluted 63,928 62,485
See notes to condensed consolidated financial statements.

Table of Contents
4
VERINT SYSTEMS INC. AND SUBSIDIARIESCondensed Consolidated Statements of Comprehensive Loss
(Unaudited)
Three Months Ended
April 30,(in thousands) 2018 2017Net loss $ (1,225) $ (19,040)Other comprehensive (loss) income, net of reclassification adjustments: Foreign currency translation adjustments (13,628) 9,673Net (decrease) increase from foreign exchange contracts designated as hedges (6,583) 3,250Net increase (decrease) from interest rate swap designated as a hedge 220 (33)Benefit (provision) for income taxes on net increase (decrease) from foreign exchange contracts and
interest rate swap designated as hedges 78 (326)Other comprehensive (loss) income (19,913) 12,564Comprehensive loss (21,138) (6,476)Comprehensive income attributable to noncontrolling interests 1,038 972Comprehensive loss attributable to Verint Systems Inc. $ (22,176) $ (7,448)
See notes to condensed consolidated financial statements.

5
VERINT SYSTEMS INC. AND SUBSIDIARIESCondensed Consolidated Statements of Stockholders’ Equity
(Unaudited)
Verint Systems Inc. Stockholders’ Equity
Common Stock
AdditionalPaid-inCapital
Accumulated
Other Comprehensive
Loss
Total VerintSystems Inc.Stockholders’
Equity
TotalStockholders’
Equity(in thousands) SharesPar
ValueTreasury
StockAccumulated
Deficit
Non-controllingInterests
Balances at January 31, 2017 62,419 $ 64 $1,449,335 $(57,147) $ (230,816) $ (154,856) $ 1,006,580 $ 8,460 $ 1,015,040Net (loss) income — — — — (19,786) — (19,786) 746 (19,040)Other comprehensive income — — — — — 12,338 12,338 226 12,564Stock-based compensation -equity-classified awards — — 13,443 — — — 13,443 — 13,443Common stock issued for stockawards and stock bonuses 256 — — — — — — — —Initial noncontrolling interestrelated to business combination — — — — — — — 2,300 2,300Capital contributions bynoncontrolling interest — — — — — — — 350 350Dividends to noncontrollinginterest — — — — — — — (716) (716)Cumulative effect of adoption ofASU No. 2016-16 — — — — (869) — (869) — (869)Balances at April 30, 2017 62,675 $ 64 $1,462,778 $(57,147) $ (251,471) $ (142,518) $ 1,011,706 $ 11,366 $ 1,023,072
Balances at January 31, 2018 63,836 $ 65 $1,519,724 $(57,425) $ (238,312) $ (103,460) $ 1,120,592 $ 11,744 $ 1,132,336Net (loss) income — — — — (2,215) — (2,215) 990 (1,225)Other comprehensive (loss)income — — — — — (19,961) (19,961) 48 (19,913)Stock-based compensation -equity-classified awards — — 14,898 — — — 14,898 — 14,898Common stock issued for stockawards and stock bonuses 180 1 — — — — 1 — 1Treasury stock acquired (4) — — (173) — — (173) — (173)Capital contributions bynoncontrolling interest — — — — — — — 60 60Dividends to noncontrollinginterest — — — — — — — (760) (760)Cumulative effect of adoption ofASU No. 2014-09 — — — — 38,047 — 38,047 — 38,047Balances at April 30, 2018 64,012 $ 66 $1,534,622 $(57,598) $ (202,480) $ (123,421) $ 1,151,189 $ 12,082 $ 1,163,271
See notes to condensed consolidated financial statements.

Table of Contents
6
VERINT SYSTEMS INC. AND SUBSIDIARIESCondensed Consolidated Statements of Cash Flows
(Unaudited)
Three Months Ended
April 30,(in thousands) 2018 2017Cash flows from operating activities: Net loss $ (1,225) $ (19,040)Adjustments to reconcile net loss to net cash provided by operating activities: Depreciation and amortization 23,963 29,422Stock-based compensation, excluding cash-settled awards 16,443 17,620Amortization of discount on convertible notes 2,905 2,756Non-cash (gains) losses on derivative financial instruments, net (1,488) 370Other non-cash items, net (448) 4,605Changes in operating assets and liabilities, net of effects of business combinations: Accounts receivable 45,386 1,633Contract assets (18,811) —Inventories 2,434 (942)Deferred cost of revenue 2,449 977Prepaid expenses and other assets (3,477) 1,512Accounts payable and accrued expenses (3,027) 41Contract liabilities (4,543) 18,139Other, net (409) 2,668Net cash provided by operating activities 60,152 59,761
Cash flows from investing activities: Cash paid for business combinations, including adjustments, net of cash acquired — (13,922)Purchases of property and equipment (7,747) (7,159)Purchases of investments (2,792) (1,500)Maturities and sales of investments — 300Cash paid for capitalized software development costs (1,121) (148)Change in restricted bank time deposits, and other investing activities, net 398 454Net cash used in investing activities (11,262) (21,975)
Cash flows from financing activities: Repayments of borrowings and other financing obligations (1,275) (1,395)Purchases of treasury stock (173) —Dividends paid to noncontrolling interest (760) (716)Payments of contingent consideration for business combinations (financing portion) (2,584) (1,750)Other financing activities, net (15) 278Net cash used in financing activities (4,807) (3,583)Foreign currency effects on cash, cash equivalents, restricted cash, and restricted cash equivalents (1,495) (1,334)Net increase in cash, cash equivalents, restricted cash, and restricted cash equivalents 42,588 32,869Cash, cash equivalents, restricted cash, and restricted cash equivalents, beginning of period 398,210 369,329Cash, cash equivalents, restricted cash, and restricted cash equivalents, end of period $ 440,798 $ 402,198
Reconciliation of cash, cash equivalents, restricted cash, and restricted cash equivalents at end of period to the condensed consolidated balance sheets: Cash and cash equivalents $ 382,237 $ 340,091Restricted cash and cash equivalents included in restricted cash and cash equivalents, and restricted banktime deposits 32,541 11,796Restricted cash and cash equivalents included in other assets 26,020 50,311Total cash, cash equivalents, restricted cash, and restricted cash equivalents $ 440,798 $ 402,198
See notes to condensed consolidated financial statements.

Table of Contents
7
VERINT SYSTEMS INC. AND SUBSIDIARIESNotes to Condensed Consolidated Financial Statements
1. BASIS OF PRESENTATION AND SIGNIFICANT ACCOUNTING POLICIES Description of Business Unless the context otherwise requires, the terms “Verint”, “we”, “us”, and “our” in these notes to condensed consolidated financial statements refer to Verint Systems Inc. and its consolidated subsidiaries. Verint is a global leader in Actionable Intelligence solutions. Actionable Intelligence is a necessity in a dynamic world of massive information growth because it empowers organizations with crucial insights and enables decision makers to anticipate, respond, and take action. With Verint solutions and value-added services, organizations of all sizes and across many industries can make more informed, timely, and effective decisions. Today, over 10,000 organizations in more than 180 countries, including over 85 percent of the Fortune 100, use Verint solutions to optimize customer engagement and make the world a safer place.
Verint delivers its Actionable Intelligence solutions through two operating segments: Customer Engagement Solutions (“Customer Engagement”) and Cyber Intelligence Solutions (“Cyber Intelligence”). Please refer to Note 15, "Segment Information" for further details regarding our operating segments.
We have established leadership positions in Actionable Intelligence by developing highly-scalable, enterprise-class software and services with advanced, integrated analytics for both structured and unstructured information. Our innovative solutions are developed by a large research and development (“R&D”) team comprised of approximately 1,600 professionals and backed by more than 850 patents and patent applications worldwide.
To help our customers maximize the benefits of our technology over the solution lifecycle and provide a high degree of flexibility, we offer a broad range of services, such as strategic consulting, managed services, implementation services, training, maintenance, and 24x7 support. Additionally, we offer a broad range of deployment options, including cloud, on-premises, and hybrid, and software licensing and delivery models that include perpetual licenses and software as a service (“SaaS”).
Headquartered in Melville, New York, we support our customers around the globe directly and with an extensive network of selling and support partners.
Preparation of Condensed Consolidated Financial Statements
The condensed consolidated financial statements included herein have been prepared in accordance with accounting principles generally accepted in the United States of America (“GAAP”) and on the same basis as the audited consolidated financial statements included in our Annual Report on Form 10-K for the year ended January 31, 2018 filed with the U.S. Securities and Exchange Commission (“SEC”), except for the recently adopted accounting pronouncements described below. The condensed consolidated statements of operations, comprehensive loss, stockholders’ equity, and cash flows for the periods ended April 30, 2018 and 2017, and the condensed consolidated balance sheet as of April 30, 2018, are not audited but reflect all adjustments that are of a normal recurring nature and that are considered necessary for a fair presentation of the results for the periods shown. The condensed consolidated balance sheet as of January 31, 2018 is derived from the audited consolidated financial statements presented in our Annual Report on Form 10-K for the year ended January 31, 2018. Certain information and disclosures normally included in annual consolidated financial statements have been omitted pursuant to the rules and regulations of the SEC. Because the condensed consolidated interim financial statements do not include all of the information and disclosures required by GAAP for a complete set of financial statements, they should be read in conjunction with the audited consolidated financial statements and notes included in our Annual Report on Form 10-K for the year ended January 31, 2018 filed with the SEC. The results for interim periods are not necessarily indicative of a full year’s results.
Principles of Consolidation The accompanying condensed consolidated financial statements include the accounts of Verint Systems Inc., our wholly owned or otherwise controlled subsidiaries, and a joint venture in which we hold a 50% equity interest. The joint venture is a variable interest entity in which we are the primary beneficiary. Noncontrolling interests in less than wholly owned subsidiaries are reflected within stockholders’ equity on our condensed consolidated balance sheet, but separately from our stockholders’ equity. We hold an option to acquire the noncontrolling interests in two majority owned subsidiaries and we account for the option as

Table of Contents
8
an in-substance investment in the noncontrolling common stock of each such subsidiary. We include the fair value of the option within other liabilities and do not recognize noncontrolling interests in these subsidiaries.
We include the results of operations of acquired companies from the date of acquisition. All significant intercompany transactions and balances are eliminated.
Equity investments in companies in which we have less than a 20% ownership interest and cannot exercise significant influence, and which do not have readily determinable fair values, are accounted for at cost, adjusted for changes resulting from observable price changes in orderly transactions for an identical or similar investment of the same issuer, less any impairment. Use of Estimates The preparation of financial statements in conformity with GAAP requires our management to make estimates and assumptions, which may affect the reported amounts of assets and liabilities and the disclosure of contingent assets and liabilities at the date of the condensed consolidated financial statements and the reported amounts of revenue and expenses during the reporting period. Actual results could differ from those estimates.
Significant Accounting Policies
There have been no material changes in our significant accounting policies during the three months ended April 30, 2018, other than the impacts of adopting the accounting pronouncements described below, as compared to the significant accounting policies described in Note 1 to the consolidated financial statements included in our Annual Report on Form 10-K for the year ended January 31, 2018.
Goodwill, Other Acquired Intangible Assets, and Long-Lived Assets
For business combinations, the purchase prices are allocated to the tangible assets and intangible assets acquired and liabilities assumed based on their estimated fair values on the acquisition dates, with the remaining unallocated purchase prices recorded as goodwill. Goodwill is assigned, at the acquisition date, to those reporting units expected to benefit from the synergies of the combination.
We test goodwill for impairment at the reporting unit level, which can be an operating segment or one level below an operating segment, on an annual basis as of November 1, or more frequently if changes in facts and circumstances indicate that impairment in the value of goodwill may exist. As of April 30, 2018, our reporting units are Customer Engagement, Cyber Intelligence (excluding situational intelligence solutions), and Situational Intelligence, which is a component of our Cyber Intelligence operating segment.
In testing for goodwill impairment, we may elect to utilize a qualitative assessment to evaluate whether it is more likely than not that the fair value of a reporting unit is less than its carrying amount. If we elect to bypass a qualitative assessment, or if our qualitative assessment indicates that goodwill impairment is more likely than not, we perform quantitative impairment testing. For quantitative impairment testing performed prior to February 1, 2018, we performed a two-step test by first comparing the carrying value of the reporting unit to its fair value. If the carrying value exceeded the fair value, a second step was performed to compute the goodwill impairment. Effective with our February 1, 2018 adoption of Accounting Standards Update (“ASU”) No. 2017-04, Intangibles-Goodwill and Other (Topic 350) - Simplifying the Test for Goodwill Impairment, if our quantitative testing determines that the carrying value of a reporting unit exceeds its fair value, goodwill impairment is recognized in an amount equal to that excess, limited to the total goodwill allocated to that reporting unit, eliminating the need for the second step.
We utilize some or all of three primary approaches to assess the fair value of a reporting unit: (a) an income-based approach, using projected discounted cash flows, (b) a market-based approach, using valuation multiples of comparable companies, and (c) a transaction-based approach, using valuation multiples for recent acquisitions of similar businesses made in the marketplace. Our estimate of fair value of each reporting unit is based on a number of subjective factors, including: (a) appropriate consideration of valuation approaches (income approach, comparable public company approach, and comparable transaction approach), (b) estimates of future growth rates, (c) estimates of our future cost structure, (d) discount rates for our estimated cash flows, (e) selection of peer group companies for the public company and the market transaction approaches, (f) required levels of working capital, (g) assumed terminal value, and (h) time horizon of cash flow forecasts.
Acquired identifiable intangible assets include identifiable acquired technologies, customer relationships, trade names, distribution networks, non-competition agreements, sales backlog, and in-process research and development. We amortize the

Table of Contents
9
cost of finite-lived identifiable intangible assets over their estimated useful lives, which are periods of ten years or less. Amortization is based on the pattern in which the economic benefits of the intangible asset are expected to be realized, which typically is on a straight-line basis. The fair values assigned to identifiable intangible assets acquired in business combinations are determined primarily by using the income approach, which discounts expected future cash flows attributable to these assets to present value using estimates and assumptions determined by management. The acquired identifiable finite-lived intangible assets are being amortized primarily on a straight-line basis, which we believe approximates the pattern in which the assets are utilized, over their estimated useful lives.
Other Recently Adopted Accounting Pronouncements
In May 2014, the Financial Accounting Standards Board (“FASB”) issued ASU No. 2014-09, Revenue from Contracts with Customers (Topic 606). ASU No. 2014-09 supersedes the revenue recognition requirements in Topic 605, Revenue Recognition, and requires entities to recognize revenue when control of the promised goods or services is transferred to customers at an amount that reflects the consideration to which the entity expects to be entitled to in exchange for those goods or services. We adopted ASU No. 2014-09 as of February 1, 2018 using the modified retrospective transition method. Please refer to Note 2, “Revenue Recognition” for further details.
In January 2016, the FASB issued ASU 2016 01, Financial Instruments—Overall (Subtopic 825-10): Recognition and Measurement of Financial Assets and Financial Liabilities, associated with the recognition and measurement of financial assets and liabilities, with further clarifications made in February 2018 with the issuance of ASU No. 2018-03, Technical Corrections and Improvements to Financial Instruments—Overall (Subtopic 825-10): Recognition and Measurement of Financial Assets and Financial Liabilities. The amended guidance requires certain equity investments that are not consolidated and not accounted for under the equity method to be measured at fair value with changes in fair value recognized in net income rather than as a component of accumulated other comprehensive income (loss). It further states that an entity may choose to measure equity investments that do not have readily determinable fair values using a quantitative approach, or measurement alternative, which is equal to its cost minus impairment, if any, plus or minus changes resulting from observable price changes in orderly transactions for the identical or a similar investment of the same issuer. We adopted this amended guidance on February 1, 2018, using a prospective transition approach, which did not have an impact on our condensed consolidated financial statements.
We concluded that all equity investments within the scope of ASU No. 2016-01, previously accounted for under the cost method, do not have readily determinable fair values. Accordingly, the value of these investments beginning February 1, 2018 has been measured using the measurement alternative, as noted above. As of April 30, 2018, the carrying amount of our equity investments without readily determinable fair values was $5.2 million. During the three months ended April 30, 2018, we did not recognize any impairments or other adjustments.
In August 2016, the FASB issued ASU No. 2016-15, Statement of Cash Flows (Topic 230): Classification of Certain Cash Receipts and Cash Payments, which provides guidance with the intent of reducing diversity in practice in how certain cash receipts and cash payments are presented and classified in the statement of cash flows. The clarifications provided by this guidance did not have a material impact on our condensed consolidated statement of cash flows.
In November 2016, the FASB issued ASU No. 2016-18, Statement of Cash Flows (Topic 230): Restricted Cash. This update requires that a statement of cash flows explain the change during the period in the total of cash, cash equivalents, and amounts generally described as restricted cash or restricted cash equivalents. Therefore, amounts generally described as restricted cash and restricted cash equivalents should be included with cash and cash equivalents when reconciling the beginning-of-period and end-of-period total amounts shown on the statement of cash flows. We retrospectively adopted ASU No. 2016-18 on February 1, 2018 and as a result, we now include restricted cash and restricted cash equivalents with cash and cash equivalents when reconciling the beginning-of-period and end-of-period total amounts presented on the condensed consolidated statements of cash flows. Prior to adoption of this new guidance, we reported changes in restricted cash and restricted cash equivalents as cash flows from investing activities. We typically have restrictions on certain amounts of cash and cash equivalents, primarily consisting of amounts used to secure bank guarantees in connection with sales contract performance obligations, and expect to continue to have similar restrictions in the future.
As a result of the adoption of ASU No. 2016-18, we adjusted the previously reported condensed consolidated statement of cash flows for the three months ended April 30, 2017 as follows:

Table of Contents
10
Three Months Ended April 30, 2017
(in thousands)As previously
reported Adjustments As AdjustedNet cash provided by operating activities $ 59,761 $ — $ 59,761Net cash used in investing activities (22,118) 143 (21,975)Net cash used in financing activities (3,583) — (3,583)Foreign currency effects on cash, cash equivalents, restricted cash, andrestricted cash equivalents (1,332) (2) (1,334)Net increase in cash, cash equivalents, restricted cash, and restricted cashequivalents 32,728 141 32,869Cash, cash equivalents, restricted cash, and restricted cash equivalents,beginning of period 307,363 61,966 369,329Cash, cash equivalents, restricted cash, and restricted cash equivalents,end of period $ 340,091 $ 62,107 $ 402,198
In January 2017, the FASB issued ASU No. 2017-01, Business Combinations (Topic 805): Clarifying the Definition of a Business, which clarifies the definition of a business with the objective of adding guidance to assist entities with evaluating whether transactions should be accounted for as acquisitions (or disposals) of assets or businesses. If an entity determines that substantially all of the fair value of the gross assets acquired is concentrated in a single identifiable asset or a group of similar identifiable assets, then the set of transferred assets and activities is not a business. If this threshold is not met, in order to be considered a business the set of transferred assets and activities must include, at a minimum, an input and a substantive process that together significantly contribute to the ability to create outputs. Our February 1, 2018 prospective adoption of this standard will require future transactions to be evaluated under the new framework.
In August 2017, the FASB issued ASU No. 2017-12, Derivatives and Hedging (Topic 815) - Targeted Improvements to Accounting for Hedging Activities. This update better aligns risk management activities and financial reporting for hedging relationships, simplifies hedge accounting requirements, and improves disclosures of hedging arrangements. We early adopted this standard on February 1, 2018 on a prospective basis. The effects of this standard on our condensed consolidated financial statements were not material.
New Accounting Pronouncements Not Yet Effective
In June 2016, the FASB issued ASU No. 2016-13, Financial Instruments—Credit Losses (Topic 326). This new standard changes the impairment model for most financial assets and certain other instruments. Entities will be required to use a model that will result in the earlier recognition of allowances for losses for trade and other receivables, held-to-maturity debt securities, loans, and other instruments. For available-for-sale debt securities with unrealized losses, the losses will be recognized as allowances rather than as reductions in the amortized cost of the securities. The new standard is effective for annual periods, and for interim periods within those annual periods, beginning after December 15, 2019, with early adoption permitted. We are currently reviewing this standard to assess the impact on our condensed consolidated financial statements.
In February 2016, the FASB issued ASU No. 2016-02, Leases (Topic 842), which will require lessees to recognize assets and liabilities for leases with lease terms of more than 12 months. Consistent with current GAAP, the recognition, measurement, and presentation of expenses and cash flows arising from a lease by a lessee primarily will depend on its classification as a finance or operating lease. However, unlike current GAAP, which requires only capital leases to be recognized on the balance sheet, the new guidance will require both types of leases to be recognized on the balance sheet. The new guidance is effective for all periods beginning after December 15, 2018 and we are currently evaluating the effects that the adoption of ASU No. 2016-02 will have on our consolidated financial statements, but anticipate that the new guidance will significantly impact our condensed consolidated financial statements given our considerable lease obligations.
2. REVENUE RECOGNITION
On February 1, 2018, we adopted ASU No. 2014-09, Revenue from Contracts with Customers (Topic 606), using the modified retrospective method applied to those contracts that were not completed as of February 1, 2018. Results for reporting periods beginning after February 1, 2018 are presented under ASU No. 2014-09, while prior period amounts are not adjusted and continue to be reported in accordance with our historic accounting under prior guidance. For contracts that were modified before the effective date of ASU No. 2014-09, we recorded the aggregate effect of all modifications when identifying

Table of Contents
11
performance obligations and allocating the transaction price in accordance with the practical expedient provided for under the new guidance, which permits an entity to record the aggregate effect of all contract modifications that occur before the beginning of the earliest period presented in accordance with the new standard when identifying the satisfied and unsatisfied performance obligations, determining the transaction price, and allocating the transaction price to the satisfied and unsatisfied performance obligations.
Under the new standard, an entity recognizes revenue when its customer obtains control of promised goods or services, in an amount that reflects the consideration that the entity expects to receive in exchange for those goods or services. To determine revenue recognition for contracts that are within the scope of new standard, we perform the following five steps:
1) Identify the contract(s) with a customer A contract with a customer exists when (i) we enter into an enforceable contract with the customer that defines each party’s rights regarding the goods or services to be transferred and identifies the payment terms related to these goods or services, (ii) the contract has commercial substance, and (iii) we determine that collection of substantially all consideration for goods or services that are transferred is probable based on the customer’s intent and ability to pay the promised consideration. We apply judgment in determining the customer’s ability and intention to pay, which is based on a variety of factors including the customer’s historical payment experience or in the case of a new customer, published credit and financial information pertaining to the customer. Our customary business practice is to enter into legally enforceable written contracts with our customers. The majority of our contracts are governed by a master agreement between us and the customer, which sets forth the general terms and conditions of any individual contract between the parties, which is then supplemented by a customer purchase order to specify the different goods and services, the associated prices, and any additional terms for an individual contract. Multiple contracts with a single counterparty entered into at the same time are evaluated to determine if the contracts should be combined and accounted for as a single contract.
2) Identify the performance obligations in the contract Performance obligations promised in a contract are identified based on the goods or services that will be transferred to the customer that are both capable of being distinct, whereby the customer can benefit from the goods or services either on its own or together with other resources that are readily available from third parties or from us, and are distinct in the context of the contract, whereby the transfer of the goods or services is separately identifiable from other promises in the contract. To the extent a contract includes multiple promised goods or services, we must apply judgment to determine whether promised goods or services are capable of being distinct and are distinct in the context of the contract. If these criteria are not met the promised goods or services are accounted for as a combined performance obligation. Generally, our contracts do not include non-distinct performance obligations, but certain Cyber Intelligence customers require design, development or significant customization of our products to meet their specific requirements, in which case the products and services are combined into one distinct performance obligation.
3) Determine the transaction priceThe transaction price is determined based on the consideration to which we will be entitled in exchange for transferring goods or services to the customer. To the extent the transaction price includes variable consideration, we estimate the amount of variable consideration that should be included in the transaction price utilizing either the expected value method or the most likely amount method depending on the nature of the variable consideration. Variable consideration is included in the transaction price, if we assessed that a significant future reversal of cumulative revenue under the contract will not occur. Typically, our contracts do not provide our customers with any right of return or refund, and we do not constrain the contract price as it is probable that there will not be a significant revenue reversal due to a return or refund.
4) Allocate the transaction price to the performance obligations in the contractIf the contract contains a single performance obligation, the entire transaction price is allocated to the single performance obligation. However, if a series of distinct goods or services that are substantially the same qualifies as a single performance obligation in a contract with variable consideration, we must determine if the variable consideration is attributable to the entire contract or to a specific part of the contract. We allocate the variable amount to one or more distinct performance obligations but not all or to one or more distinct services that forms a part of a single performance obligation, when the payment terms of the variable amount relate solely to our efforts to satisfy that distinct performance obligation and it results in an allocation that is consistent with the overall allocation objective of ASU No. 2014-09. Contracts that contain multiple performance obligations require an allocation of the transaction price to each performance obligation based on a relative standalone selling price basis unless the transaction price is variable and meets the criteria to be allocated entirely to a performance obligation or to a distinct good or service that forms part of a single performance obligation. We determine standalone selling price (“SSP”)

Table of Contents
12
based on the price at which the performance obligation is sold separately. If the SSP is not observable through past transactions, we estimate the SSP taking into account available information such as market conditions, including geographic or regional specific factors, competitive positioning, internal costs, profit objectives, and internally approved pricing guidelines related to the performance obligation.
5) Recognize revenue when (or as) the entity satisfies a performance obligation We satisfy performance obligations either over time or at a point in time depending on the nature of the underlying promise. Revenue is recognized at the time the related performance obligation is satisfied by transferring a promised good or service to a customer. In the case of contracts that include customer acceptance criteria, revenue is not recognized until we can objectively conclude that the product or service meets the agreed-upon specifications in the contract.
We only apply the five-step model to contracts when it is probable that we will collect the consideration we are entitled to in exchange for the goods or services we transfer to our customers. Revenue is measured based on a consideration specified in a contract with a customer, and excludes taxes assessed by a governmental authority that are both imposed on and concurrent with a specific revenue-producing transaction, that are collected by us from a customer.
Shipping and handling activities that are billed to the customer and occur after control over a product has transferred to a customer are accounted for as fulfillment costs and are in included in cost of revenue. Historically, these expenses have not been material.
Nature of Goods and Services
We derive and report our revenue in two categories: (a) product revenue, including licensing of software products, and the sale of hardware products, and (b) service and support revenue, including revenue from installation services, post-contract customer support (“PCS”), project management, hosting services, cloud deployments, SaaS, application managed services, product warranties, business advisory consulting, and training services.
Our software licenses typically provide for a perpetual right to use our software, though we also sell term-based software licenses that provide our customers with the right to use our software for only a fixed term, in most cases between a one- and three-year time frame. Generally, our contracts do not provide significant services of integration and customization and installation services are not required to be purchased directly from us. The software is delivered before related services are provided and is functional without professional services, updates and technical support. We have concluded that the software license is distinct as the customer can benefit from the software on its own. Software revenue is typically recognized when the software is delivered or made available for download to the customer. We rarely sell our software licenses on a standalone basis and as a result SSP is not directly observable and must be estimated. We apply the adjusted market assessment approach, considering both market conditions and entity specific factors such as assessment of historical data of bundled sales of software licenses with other promised goods and services in order to maximize the use of observable inputs. Software SSP is established based on an appropriate discount from our established list price, taking into consideration whether there are certain stratifications of the population with different pricing practices. Revenue for hardware is recognized at a point in time, generally upon shipment or delivery.
Contracts that require us to significantly customize our software are generally recognized over time as we perform because our performance does not create an asset with an alternative use and we have an enforceable right to payment plus a reasonable profit for performance completed to date. Revenue is recognized over time based on the extent of progress towards completion of the performance obligation. We use labor hours incurred to measure progress for these contracts because it best depicts the transfer of the asset to the customer. Under the labor hours incurred measure of progress, the extent of progress towards completion is measured based on the ratio of labor hours incurred to date to the total estimated labor hours at completion of the distinct performance obligation. Due to the nature of the work performed in these arrangements, the estimation of total labor hours at completion is complex, subject to many variables and requires significant judgment. If circumstances arise that change the original estimates of revenues, costs, or extent of progress toward completion, revisions to the estimates are made. These revisions may result in increases or decreases in estimated revenues or costs, and such revisions are reflected in revenue on a cumulative catch-up basis in the period in which the circumstances that gave rise to the revision become known. We use the expected cost plus a margin approach to estimate the SSP of our significantly customized solutions.
Professional services revenues primarily consist of fees for deployment and optimization services, as well as training, and are generally recognized over time as the customer simultaneously receives and consumes the benefits of the professional services as the services are performed. Professional services that are billed on a time and materials basis are recognized over time as the services are performed. For contracts billed on a fixed price basis, revenue is recognized over time using an input method based
Table of Contents
13
on labor hours expended to date relative to the total labor hours expected to be required to satisfy the related performance obligation. We determine SSP for our professional services based on the price at which the performance obligation is sold separately, which is observable through past transactions.
Our SaaS contracts are typically comprised of a right to access our software, maintenance, and hosting fees. We do not provide the customer the contractual right to take possession of the software at any time during the hosting period under these contracts. The customer can only benefit from the SaaS license and the maintenance when combined with the hosting service as the hosting service is the only way for the customer to access the software and benefit from the maintenance services. Accordingly, each of the license, maintenance, and hosting services is not considered a distinct performance obligation in the context of the contract, and should be combined into a single performance obligation (“SaaS services”) and recognized ratably over the contract period. Our SaaS customer contracts can consist of fixed, variable, and usage based fees. Typically, we invoice a portion of the fees at the outset of the contract and then monthly or quarterly thereafter. Certain SaaS contracts include a nonrefundable upfront fee for setup services, which are not distinct from the SaaS services. Non-distinct setup services represent an advanced payment for future SaaS services, and are recognized as revenue when those SaaS services are satisfied, unless the nonrefundable fee is considered to be a material right, in which case the nonrefundable fee is recognized over the expected benefit period, which includes anticipated SaaS renewals. We determine SSP for our SaaS services based on the price at which the performance obligation is sold separately, which is observable through past SaaS renewal transactions. We satisfy our SaaS services by providing access to our software over time and processing transactions for usage based contracts. For non-usage based fees, the period of time over which we perform is commensurate with the contract term because that is the period during which we have an obligation to provide the service. The performance obligation is recognized on a time elapsed basis, by month for which the services are provided.
Customer support revenue is derived from providing telephone technical support services, bug fixes and unspecified software updates and upgrades to customers on a when-and-if-available basis. Each of these performance obligations provide benefit to the customer on a standalone basis and are distinct in the context of the contract. Each of these distinct performance obligations represent a stand ready obligation to provide service to a customer, which is concurrently delivered and has the same pattern of transfer to the customer, which is why we account for these support services as a single performance obligation. We recognize support services ratably over the contractual term, which typically is one year and develop SSP for support services based on standalone renewal contracts.
Our Customer Engagement solutions are generally sold with a warranty of one year for hardware and 90 days for software. Our Cyber Intelligence solutions are generally sold with warranties that typically range from 90 days to three years and, in some cases, longer. These warranties do not represent an additional performance obligation as services beyond assuring that the software license and hardware complies with agreed-upon specifications are not provided.
Disaggregation of Revenue
The following table provides information about disaggregated revenue for our Customer Engagement and Cyber Intelligence segments by product revenue and service and support revenue, as well as by the recurring or nonrecurring nature of revenue for each business segment. Recurring revenue is the portion of our revenue that is highly likely to continue in the future, and primarily consists of initial and renewal PCS, SaaS, application managed services, sales-and-usage based royalties, and subscription licenses recognized over time. The recurrence of these revenue streams in future periods depends on a number of factors including contractual periods and customers' renewal decisions. Nonrecurring revenue primarily consists of our perpetual and term-based licenses, which are recognized at a point in time, long-term customization projects that are recognized over time as control transfers to the customer using a percentage of completion (“POC”) method, consulting, implementation and installation services, training, and hardware.
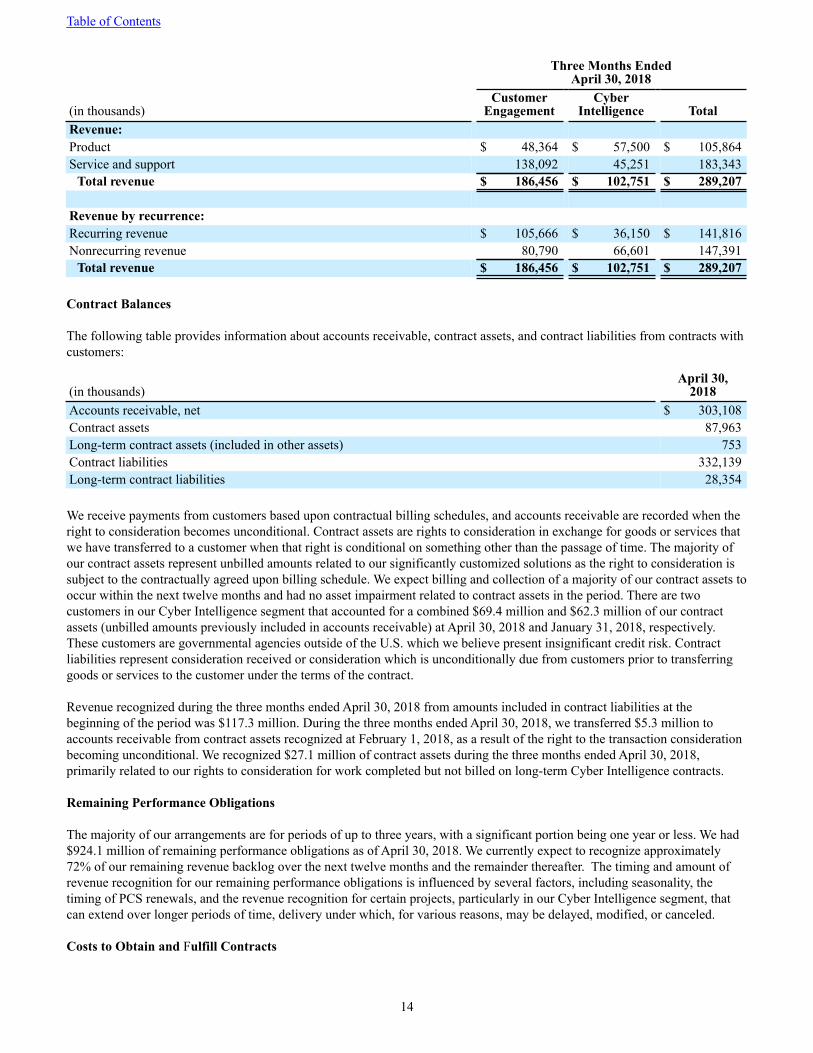
Table of Contents
14
Three Months EndedApril 30, 2018
(in thousands)Customer
EngagementCyber
Intelligence TotalRevenue:Product $ 48,364 $ 57,500 $ 105,864Service and support 138,092 45,251 183,343
Total revenue $ 186,456 $ 102,751 $ 289,207
Revenue by recurrence:Recurring revenue $ 105,666 $ 36,150 $ 141,816Nonrecurring revenue 80,790 66,601 147,391
Total revenue $ 186,456 $ 102,751 $ 289,207
Contract Balances
The following table provides information about accounts receivable, contract assets, and contract liabilities from contracts with customers:
(in thousands)April 30,
2018Accounts receivable, net $ 303,108Contract assets 87,963Long-term contract assets (included in other assets) 753Contract liabilities 332,139Long-term contract liabilities 28,354
We receive payments from customers based upon contractual billing schedules, and accounts receivable are recorded when the right to consideration becomes unconditional. Contract assets are rights to consideration in exchange for goods or services that we have transferred to a customer when that right is conditional on something other than the passage of time. The majority of our contract assets represent unbilled amounts related to our significantly customized solutions as the right to consideration is subject to the contractually agreed upon billing schedule. We expect billing and collection of a majority of our contract assets to occur within the next twelve months and had no asset impairment related to contract assets in the period. There are two customers in our Cyber Intelligence segment that accounted for a combined $69.4 million and $62.3 million of our contract assets (unbilled amounts previously included in accounts receivable) at April 30, 2018 and January 31, 2018, respectively. These customers are governmental agencies outside of the U.S. which we believe present insignificant credit risk. Contract liabilities represent consideration received or consideration which is unconditionally due from customers prior to transferring goods or services to the customer under the terms of the contract.
Revenue recognized during the three months ended April 30, 2018 from amounts included in contract liabilities at the beginning of the period was $117.3 million. During the three months ended April 30, 2018, we transferred $5.3 million to accounts receivable from contract assets recognized at February 1, 2018, as a result of the right to the transaction consideration becoming unconditional. We recognized $27.1 million of contract assets during the three months ended April 30, 2018, primarily related to our rights to consideration for work completed but not billed on long-term Cyber Intelligence contracts.
Remaining Performance Obligations
The majority of our arrangements are for periods of up to three years, with a significant portion being one year or less. We had $924.1 million of remaining performance obligations as of April 30, 2018. We currently expect to recognize approximately 72% of our remaining revenue backlog over the next twelve months and the remainder thereafter. The timing and amount of revenue recognition for our remaining performance obligations is influenced by several factors, including seasonality, the timing of PCS renewals, and the revenue recognition for certain projects, particularly in our Cyber Intelligence segment, that can extend over longer periods of time, delivery under which, for various reasons, may be delayed, modified, or canceled.
Costs to Obtain and Fulfill Contracts

Table of Contents
15
We capitalize commission expenses paid to internal sales personnel and agent commission expenses that are incremental to obtaining customer contracts. We have determined that these commission expenses are in fact incremental and would not have occurred absent the customer contract. Capitalized sales and agent commissions are amortized on a straight-line basis over the period the goods or services are transferred to the customer to which the assets relate, which ranges from immediate to as long as six years, if commission amounts paid upon renewal are not commensurate with amounts paid on the initial contract. A portion of the initial commission payable on the majority of Customer Engagement contracts is amortized over the anticipated PCS renewal period, which is generally four to six years, due to the commissions being paid on PCS renewal contracts not being commensurate with amounts paid on the initial contract.
Total capitalized costs to obtain contracts were $23.6 million as of April 30, 2018, of which $5.5 million is included in prepaid expenses and other current assets and $18.1 million is included in other assets on our condensed consolidated balance sheet. During the three months ended April 30, 2018, we expensed $10.2 million of sales and agent commissions, which are included in selling, general and administrative expenses and there was no impairment loss recognized for these capitalized costs.
We capitalize costs incurred to fulfill our contracts when the costs relate directly to the contract and are expected to generate resources that will be used to satisfy the performance obligation under the contract and are expected to be recovered through revenue generated under the contract. Costs to fulfill contracts are expensed to cost of revenue as we satisfy the related performance obligations. Total capitalized costs to fulfill contracts were $13.0 million as of April 30, 2018, of which $8.5 million is included in deferred cost of revenue and $4.5 million is included in long-term deferred cost of revenue on our condensed consolidated balance sheet. The amounts capitalized primarily relate to direct costs that enhance resources under our SaaS arrangements. During the three months ended April 30, 2018, we amortized $2.4 million of fulfillment costs. Financial Statement Impact of Adoption
We adopted ASU No. 2014-09 utilizing the modified retrospective method. The cumulative impact of applying the new guidance to all contracts with customers that were not completed as of February 1, 2018 was recorded as an adjustment to accumulated deficit as of the adoption date. As a result of applying the modified retrospective method to adopt the new standard, the following adjustments were made to accounts on the consolidated balance sheet as of February 1, 2018:
(in thousands)
Balance at January 31,
2018
Adjustments from
Adopting ASU No. 2014-09
Balance at February 1,
2018Assets:Accounts receivable, net $ 296,324 $ 53,682 $ 350,006Contract assets — 69,217 69,217Deferred cost of revenue 6,096 2,056 8,152Prepaid expenses and other current assets 82,090 (829) 81,261Long-term deferred cost of revenue 2,804 2,193 4,997Deferred income taxes 30,878 (2,248) 28,630Other assets 52,037 14,912 66,949
Liabilities:Accrued expenses and other current liabilities 220,265 (46,062) 174,203Contract liabilities 196,107 139,517 335,624Long-term contract liabilities 24,519 6,518 31,037Deferred income taxes 35,305 963 36,268
Stockholders' Equity:Total stockholders' equity 1,132,336 38,047 1,170,383
In connection with the adoption of the new revenue recognition accounting standard, we decreased our accumulated deficit by $38.0 million, due to uncompleted contracts at February 1, 2018, for which $17.2 million of revenue will not be recognized in future periods under the new standard. Upon adoption, we deferred $4.2 million of previously expensed contract costs and reversed $2.9 million of expenses due to the new standard precluding the recognition or deferral of costs to simply obtain an even profit margin over the contract term, which was acceptable under prior contract accounting guidance. We capitalized $16.9 million of incremental sales commission costs at the adoption date directly related to obtaining customer contracts and

Table of Contents
16
are amortizing these costs as we satisfy the underlying performance obligations, which for certain contracts can include anticipated renewal periods. The acceleration of revenue that was deferred under prior guidance as of February 1, 2018, was primarily attributable to being able to recognize minimum guaranteed amounts upon delivery of our software rather than over the term of the arrangement, the ability to recognize professional services revenue in advance of achieving billing milestones, no longer requiring the separation of promised goods or services, such as software licenses, technical support, or unspecified update rights on the basis of vendor specific objective evidence, and the impact of allocating the transaction price to the performance obligations in the contract on a relative basis using SSP rather than allocating under the residual method, which allocates the entire arrangement discount to the delivered performance obligations.
The net change in deferred income taxes of $3.2 million is primarily due to the deferred tax effects resulting from the adjustment to accumulated deficit for the cumulative effect of applying ASU No. 2014-09 to active contracts as of the adoption date.
We made certain presentation changes to our condensed consolidated balance sheet on February 1, 2018 to comply with ASU No. 2014-09. Prior to adoption of the new standard, we offset accounts receivable and contract liabilities (previously presented as deferred revenue on our consolidated balance sheet) for unpaid deferred performance obligations included in contract liabilities. Under the new standard, we record accounts receivable and related contract liabilities for noncancelable contracts with customers when the right to consideration is unconditional. Upon adoption, the right to consideration in exchange for goods or services that have been transferred to a customer when that right is conditional on something other than the passage of time were reclassified from accounts receivable to contract assets. In addition, we reclassified amounts related to billings in excess of costs and estimated earnings on uncompleted contracts, which under prior guidance was included in accrued expenses and other liabilities on our condensed consolidated balance sheet to contract liabilities upon adoption.
Impact of ASU No. 2014-09 on Financial Statement Line Items
The impact of adoption of ASU No. 2014-09 on our condensed consolidated balance sheet as of April 30, 2018 and on our condensed consolidated statement of operations for the three months ended April 30, 2018 was as follows:
As of April 30, 2018
(in thousands) As Reported
Balances without
Adoption of ASU No. 2014-09
Effect of Change Higher (Lower)
Condensed Consolidated Balance SheetAssets:Accounts receivable, net $ 303,108 $ 298,605 $ 4,503Contract assets 87,963 — 87,963Deferred cost of revenue 8,501 9,238 (737)Prepaid expenses and other current assets 77,058 79,059 (2,001)Long-term deferred cost of revenue 4,478 2,137 2,341Other assets 93,486 77,056 16,430
Liabilities:Accrued expenses and other current liabilities 193,828 234,568 (40,740)Contract liabilities 332,139 244,702 87,437Long-term contract liabilities 28,354 24,244 4,110Other liabilities 135,799 134,844 955
Stockholders' Equity:Total stockholders' equity 1,163,271 1,106,534 56,737
While the table below indicates that calculated revenue for the three months ended April 30, 2018 without the adoption of ASU No. 2014-09 would have been lower than the revenue we are reporting under the new accounting guidance, this lower calculated revenue results not only from the impact of the new accounting guidance, but also from changes we made to our business practices in anticipation of the new accounting guidance. These business practice changes adversely impact the calculation of revenue under the prior accounting guidance and include, among other things, the way we manage our
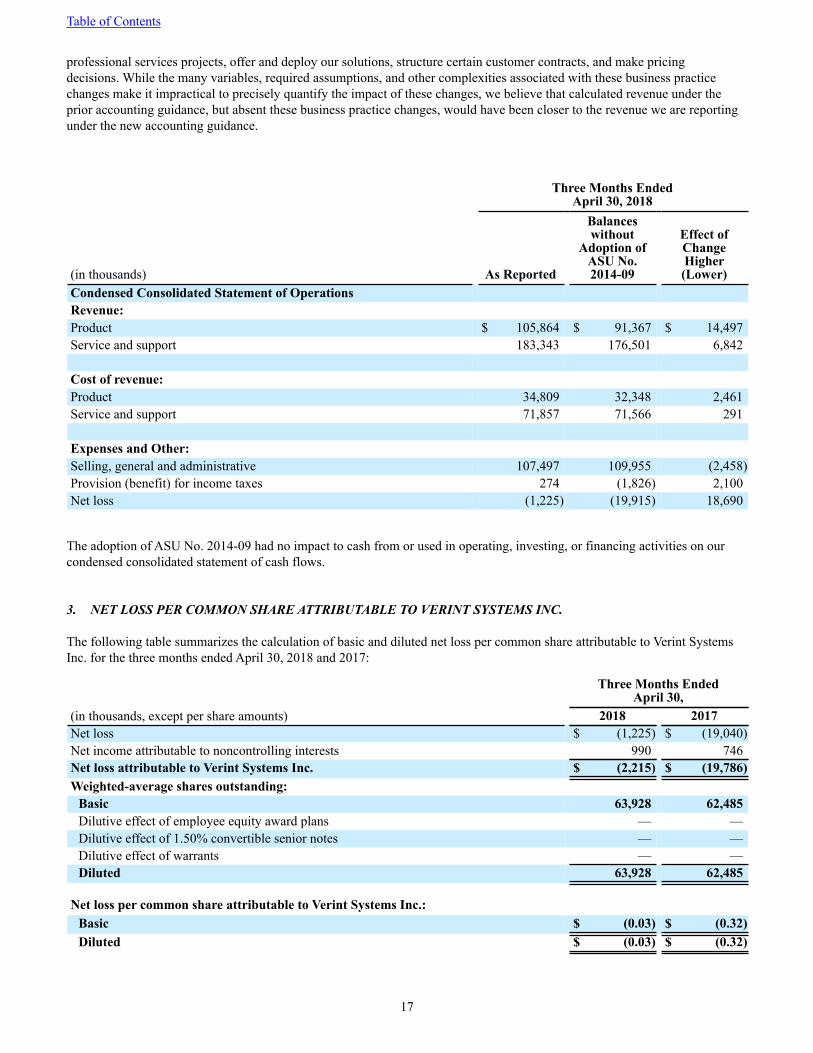
Table of Contents
17
professional services projects, offer and deploy our solutions, structure certain customer contracts, and make pricing decisions. While the many variables, required assumptions, and other complexities associated with these business practice changes make it impractical to precisely quantify the impact of these changes, we believe that calculated revenue under the prior accounting guidance, but absent these business practice changes, would have been closer to the revenue we are reporting under the new accounting guidance.
Three Months Ended April 30, 2018
(in thousands) As Reported
Balances without
Adoption of ASU No. 2014-09
Effect of Change Higher (Lower)
Condensed Consolidated Statement of OperationsRevenue:Product $ 105,864 $ 91,367 $ 14,497Service and support 183,343 176,501 6,842
Cost of revenue:Product 34,809 32,348 2,461Service and support 71,857 71,566 291
Expenses and Other:Selling, general and administrative 107,497 109,955 (2,458)Provision (benefit) for income taxes 274 (1,826) 2,100Net loss (1,225) (19,915) 18,690
The adoption of ASU No. 2014-09 had no impact to cash from or used in operating, investing, or financing activities on our condensed consolidated statement of cash flows.
3. NET LOSS PER COMMON SHARE ATTRIBUTABLE TO VERINT SYSTEMS INC. The following table summarizes the calculation of basic and diluted net loss per common share attributable to Verint Systems Inc. for the three months ended April 30, 2018 and 2017:
Three Months EndedApril 30,
(in thousands, except per share amounts) 2018 2017Net loss $ (1,225) $ (19,040)Net income attributable to noncontrolling interests 990 746Net loss attributable to Verint Systems Inc. $ (2,215) $ (19,786)Weighted-average shares outstanding:
Basic 63,928 62,485Dilutive effect of employee equity award plans — —Dilutive effect of 1.50% convertible senior notes — —Dilutive effect of warrants — —Diluted 63,928 62,485
Net loss per common share attributable to Verint Systems Inc.:
Basic $ (0.03) $ (0.32)Diluted $ (0.03) $ (0.32)

Table of Contents
18
We excluded the following weighted-average potential common shares from the calculations of diluted net loss per common share during the applicable periods because their inclusion would have been anti-dilutive:
Three Months Ended April 30,
(in thousands) 2018 2017Common shares excluded from calculation:
Stock options and restricted stock-based awards 1,587 2,1251.50% convertible senior notes 6,205 6,205Warrants 6,205 6,205
In periods for which we report a net loss attributable to Verint Systems Inc., basic net loss per common share and diluted net loss per common share are identical since the effect of all potential common shares is anti-dilutive and therefore excluded.
Our 1.50% convertible senior notes (“Notes”) will not impact the calculation of diluted net income per share unless the average price of our common stock, as calculated in accordance with the terms of the indenture governing the Notes, exceeds the conversion price of $64.46 per share. Likewise, diluted net income per share will not include any effect from the Warrants (as defined in Note 7, “Long-Term Debt”) unless the average price of our common stock, as calculated under the terms of the Warrants, exceeds the exercise price of $75.00 per share.
Our Note Hedges (as defined in Note 7, “Long-Term Debt”) do not impact the calculation of diluted net income per share under the treasury stock method, because their effect would be anti-dilutive. However, in the event of an actual conversion of any or all of the Notes, the common shares that would be delivered to us under the Note Hedges would neutralize the dilutive effect of the common shares that we would issue under the Notes. As a result, actual conversion of any or all of the Notes would not increase our outstanding common stock. Up to 6,205,000 common shares could be issued upon exercise of the Warrants. Further details regarding the Notes, Note Hedges, and the Warrants appear in Note 7, “Long-Term Debt”.
4. CASH, CASH EQUIVALENTS, AND SHORT-TERM INVESTMENTS
The following tables summarize our cash, cash equivalents, and short-term investments as of April 30, 2018 and January 31, 2018:
April 30, 2018
(in thousands) Cost Basis
GrossUnrealized
Gains
GrossUnrealized
LossesEstimatedFair Value
Cash and cash equivalents:Cash and bank time deposits $ 341,974 $ — $ — $ 341,974Money market funds 40,263 — — 40,263Total cash and cash equivalents $ 382,237 $ — $ — $ 382,237
Short-term investments:Corporate debt securities $ 2,010 $ — $ — $ 2,010Bank time deposits 7,210 — — 7,210Total short-term investments $ 9,220 $ — $ — $ 9,220

Table of Contents
19
January 31, 2018
(in thousands) Cost Basis
GrossUnrealized
Gains
GrossUnrealized
LossesEstimatedFair Value
Cash and cash equivalents:Cash and bank time deposits $ 337,756 $ — $ — $ 337,756Money market funds 186 — — 186Total cash and cash equivalents $ 337,942 $ — $ — $ 337,942
Short-term investments:Corporate debt securities (available-for-sale) $ 2,002 $ — $ — $ 2,002Bank time deposits 4,564 — — 4,564Total short-term investments $ 6,566 $ — $ — $ 6,566
Bank time deposits which are reported within short-term investments consist of deposits held outside of the U.S. with maturities of greater than 90 days, or without specified maturity dates which we intend to hold for periods in excess of 90 days. All other bank deposits are included within cash and cash equivalents.
There were no proceeds from maturities and sales of short-term investments during the three months ended April 30, 2018. During the three months ended April 30, 2017, proceeds from maturities and sales of short-term investments were $0.3 million.
5. BUSINESS COMBINATIONS
Three Months Ended April 30, 2018
There were no transactions during the three months ended April 30, 2018 which qualified as a business combination.
Year Ended January 31, 2018
During the year ended January 31, 2018, we completed seven business combinations:
• On February 1, March 20, October 3, November 3, December 19, and December 21, 2017, we completed acquisitions of businesses in our Customer Engagement operating segment. One of the transactions was an asset acquisition that qualified as a business combination, and in another, the sellers retained a noncontrolling interest.
• On July 1, 2017, we completed the acquisition of a business in our Cyber Intelligence operating segment.
These business combinations were not individually material to our consolidated financial statements.
The combined consideration for these business combinations was approximately $134.3 million, including $106.0 million of combined cash paid at the closings. For five of these business combinations, we also agreed to make potential additional cash payments to the respective former shareholders aggregating up to approximately $47.3 million, contingent upon the achievement of certain performance targets over periods extending through January 2022. The fair value of these contingent consideration obligations was estimated to be $25.9 million at the applicable acquisition dates. Cash paid for these business combinations was funded by cash on hand.
The purchase prices for these business combinations were allocated to the tangible and intangible assets acquired and liabilities assumed based on their estimated fair values on the acquisition dates, with the remaining unallocated purchase prices recorded as goodwill. The fair value assigned to identifiable intangible assets acquired were determined primarily by using the income approach, which discounts expected future cash flows to present value using estimates and assumptions determined by management.
Included among the factors contributing to the recognition of goodwill in these transactions were synergies in products and technologies, and the addition of skilled, assembled workforces. Of the $80.8 million of goodwill associated with these business combinations, $77.0 million and $3.8 million was assigned to our Customer Engagement and Cyber Intelligence

Table of Contents
20
segments, respectively. For income tax purposes, $14.5 million of this goodwill is deductible and $66.4 million is not deductible.
Transaction and related costs, consisting primarily of professional fees and integration expenses, directly related to these acquisitions, totaled $1.0 million and $0.1 million for the three months ended April 30, 2018 and 2017, respectively. All transaction and related costs were expensed as incurred and are included in selling, general and administrative expenses.
The purchase price allocations for those business combinations completed subsequent to April 30, 2017 have been prepared on a preliminary basis and changes to those allocations may occur as additional information becomes available during the respective measurement periods (up to one year from the respective acquisition dates). Fair values still under review include values assigned to identifiable intangible assets, deferred income taxes and reserves for uncertain income tax positions.
The following table sets forth the components and the allocations of the combined purchase prices for the business combinations completed during the year ended January 31, 2018, including adjustments identified subsequent to the respective valuation dates, none of which were material:
(in thousands) AmountComponents of Purchase Prices:
Cash $ 106,049Fair value of contingent consideration 25,874Other purchase price adjustments 2,380
Total purchase prices $ 134,303
Allocation of Purchase Prices: Net tangible assets (liabilities):
Accounts receivable $ 4,184Other current assets, including cash acquired 15,108Other assets 2,765Current and other liabilities (12,512)Deferred revenue - current and long-term (4,424)Deferred income taxes (8,540)
Net tangible liabilities (3,419)Identifiable intangible assets: Customer relationships 24,812Developed technology 29,614Trademarks and trade names 2,456
Total identifiable intangible assets 56,882Goodwill 80,840Total purchase price allocations $ 134,303
For these acquisitions, customer relationships, developed technology, and trademarks and trade names were assigned estimated useful lives ranging from two years to ten years, from three years to five years, and from one year to seven years, respectively, the weighted average of which is approximately 6.3 years.
Other Business Combination Information
The acquisition date fair values of contingent consideration obligations associated with business combinations are estimated based on probability adjusted present values of the consideration expected to be transferred using significant inputs that are not observable in the market. Key assumptions used in these estimates include probability assessments with respect to the likelihood of achieving the performance targets and discount rates consistent with the level of risk of achievement. At each reporting date, we revalue the contingent consideration obligations to their fair values and record increases and decreases in fair value within selling, general and administrative expenses in our condensed consolidated statements of operations. Changes in the fair value of the contingent consideration obligations result from changes in discount periods and rates, and changes in probability assumptions with respect to the likelihood of achieving the performance targets.

Table of Contents
21
For the three months ended April 30, 2018 and 2017, we recorded benefits of $0.8 million and charges of $3.5 million, respectively, within selling, general and administrative expenses for changes in the fair values of contingent consideration obligations associated with business combinations. The aggregate fair values of the remaining contingent consideration obligations associated with business combinations was $58.8 million at April 30, 2018, of which $19.5 million was recorded within accrued expenses and other current liabilities, and $39.3 million was recorded within other liabilities.
Payments of contingent consideration earned under these agreements were $3.1 million and $2.4 million for the three months ended April 30, 2018 and 2017, respectively.
6. INTANGIBLE ASSETS AND GOODWILL Acquisition-related intangible assets consisted of the following as of April 30, 2018 and January 31, 2018:
April 30, 2018
(in thousands) CostAccumulatedAmortization Net
Intangible assets, with finite lives:
Customer relationships $ 434,615 $ (285,600) $ 149,015Acquired technology 266,725 (215,404) 51,321Trade names 26,650 (19,327) 7,323Non-competition agreements 3,047 (2,929) 118Distribution network 4,440 (4,440) —
Total intangible assets $ 735,477 $ (527,700) $ 207,777
January 31, 2018
(in thousands) CostAccumulatedAmortization Net
Intangible assets, with finite lives:
Customer relationships $ 438,664 $ (281,592) $ 157,072Acquired technology 273,156 (212,571) 60,585Trade names 26,820 (18,570) 8,250Non-competition agreements 3,047 (2,861) 186Distribution network 4,440 (4,440) — Total intangible assets $ 746,127 $ (520,034) $ 226,093
The following table presents net acquisition-related intangible assets by reportable segment as of April 30, 2018 and January 31, 2018:
April 30, January 31,(in thousands) 2018 2018Customer Engagement $ 199,060 $ 213,963Cyber Intelligence 8,717 12,130
Total $ 207,777 $ 226,093 Total amortization expense recorded for acquisition-related intangible assets was $15.1 million and $21.1 million for the three months ended April 30, 2018 and 2017, respectively. The reported amount of net acquisition-related intangible assets can fluctuate from the impact of changes in foreign currency exchange rates on intangible assets not denominated in U.S. dollars.
Estimated future amortization expense on finite-lived acquisition-related intangible assets is as follows:

Table of Contents
22
(in thousands)
Years Ending January 31, Amount2019 (remainder of year) $ 39,0932020 42,6432021 34,6902022 30,6902023 23,5452024 and thereafter 37,116 Total $ 207,777
Goodwill activity for the three months ended April 30, 2018, in total and by reportable segment, was as follows:
Reportable Segment
(in thousands) TotalCustomer
EngagementCyber
IntelligenceThree Months Ended April 30, 2018:Goodwill, gross, at January 31, 2018 $ 1,455,164 $ 1,307,136 $ 148,028Accumulated impairment losses through January 31, 2018 (66,865) (56,043) (10,822)
Goodwill, net, at January 31, 2018 1,388,299 1,251,093 137,206Adjustments of prior period business combinations (335) (335) —Foreign currency translation and other (11,700) (11,226) (474)
Goodwill, net, at April 30, 2018 $ 1,376,264 $ 1,239,532 $ 136,732
Balance at April 30, 2018: Goodwill, gross, at April 30, 2018 $ 1,443,129 $ 1,295,575 $ 147,554Accumulated impairment losses through April 30, 2018 (66,865) (56,043) (10,822)
Goodwill, net, at April 30, 2018 $ 1,376,264 $ 1,239,532 $ 136,732
No events or circumstances indicating the potential for goodwill impairment were identified during the three months ended April 30, 2018.
7. LONG-TERM DEBT
The following table summarizes our long-term debt at April 30, 2018 and January 31, 2018:
April 30, January 31,(in thousands) 2018 2018
1.50% Convertible Senior Notes $ 400,000 $ 400,0002017 Term Loan 421,813 422,875Other debt 210 250Less: Unamortized debt discounts and issuance costs (46,846) (50,141)Total debt 775,177 772,984Less: current maturities 4,460 4,500
Long-term debt $ 770,717 $ 768,484
Current maturities of long-term debt are reported within accrued expenses and other current liabilities on our condensed consolidated balance sheet.
1.50% Convertible Senior Notes
On June 18, 2014, we issued $400.0 million in aggregate principal amount of 1.50% convertible senior notes due June 1, 2021 (“Notes”), unless earlier converted by the holders pursuant to their terms. Net proceeds from the Notes after underwriting discounts were $391.9 million. The Notes pay interest in cash semiannually in arrears at a rate of 1.50% per annum.

Table of Contents
23
The Notes were issued concurrently with our public issuance of 5,750,000 shares of common stock, the majority of thecombined net proceeds of which were used to partially repay certain indebtedness under our Prior Credit Agreement, as defined and further described below.
The Notes are unsecured and are convertible into, at our election, cash, shares of common stock, or a combination of both, subject to satisfaction of specified conditions and during specified periods. If converted, we currently intend to pay cash in respect of the principal amount of the Notes.
The Notes have a conversion rate of 15.5129 shares of common stock per $1,000 principal amount of Notes, which represents an effective conversion price of approximately $64.46 per share of common stock and would result in the issuance of approximately 6,205,000 shares if all of the Notes were converted. The conversion rate has not changed since issuance of the Notes, although throughout the term of the Notes, the conversion rate may be adjusted upon the occurrence of certain events.On or after December 1, 2020 until the close of business on the second scheduled trading day immediately preceding the maturity date, holders may surrender their Notes for conversion regardless of whether any of the other specified conditions for conversion have been satisfied.
As of April 30, 2018, the Notes were not convertible.
In accordance with accounting guidance for convertible debt with a cash conversion option, we separately accounted for the debt and equity components of the Notes in a manner that reflected our estimated nonconvertible debt borrowing rate. We estimated the debt and equity components of the Notes to be $319.9 million and $80.1 million, respectively, at the issuance date, assuming a 5.00% non-convertible borrowing rate. The equity component was recorded as an increase to additional paid-in capital. The excess of the principal amount of the debt component over its carrying amount (the “debt discount”) is being amortized as interest expense over the term of the Notes using the effective interest method. The equity component is not remeasured as long as it continues to meet the conditions for equity classification.
We allocated transaction costs related to the issuance of the Notes, including underwriting discounts, of $7.6 million and $1.9 million to the debt and equity components, respectively. Issuance costs attributable to the debt component of the Notes are presented as a reduction of long-term debt and are being amortized as interest expense over the term of the Notes, and issuance costs attributable to the equity component were netted with the equity component in additional paid-in capital. The carrying amount of the equity component, net of issuance costs, was $78.2 million at April 30, 2018.
As of April 30, 2018, the carrying value of the debt component was $357.2 million, which is net of unamortized debt discount and issuance costs of $39.1 million and $3.7 million, respectively. Including the impact of the debt discount and related deferred debt issuance costs, the effective interest rate on the Notes was approximately 5.29% at April 30, 2018.
Based on the closing market price of our common stock on April 30, 2018, the if-converted value of the Notes was less than the aggregate principal amount of the Notes.
Note Hedges and Warrants
Concurrently with the issuance of the Notes, we entered into convertible note hedge transactions (the “Note Hedges”) and sold warrants (the “Warrants”). The combination of the Note Hedges and the Warrants serves to increase the effective initial conversion price for the Notes to $75.00 per share. The Note Hedges and Warrants are each separate instruments from the Notes.
Note Hedges
Pursuant to the Note Hedges, we purchased call options on our common stock, under which we have the right to acquire from the counterparties up to approximately 6,205,000 shares of our common stock, subject to customary anti-dilution adjustments, at a price of $64.46, which equals the initial conversion price of the Notes. Our exercise rights under the Note Hedges generally trigger upon conversion of the Notes and the Note Hedges terminate upon maturity of the Notes, or the first day the Notes are no longer outstanding. The Note Hedges may be settled in cash, shares of our common stock, or a combination thereof, at our option, and are intended to reduce our exposure to potential dilution upon conversion of the Notes. We paid $60.8 million for the Note Hedges, which was recorded as a reduction to additional paid-in capital. As of April 30, 2018, we had not purchased any shares of our common stock under the Note Hedges.
Warrants

Table of Contents
24
We sold the Warrants to several counterparties. The Warrants provide the counterparties rights to acquire from us up to approximately 6,205,000 shares of our common stock at a price of $75.00 per share. The Warrants expire incrementally on a series of expiration dates beginning in August 2021. At expiration, if the market price per share of our common stock exceeds the strike price of the Warrants, we will be obligated to issue shares of our common stock having a value equal to such excess. The Warrants could have a dilutive effect on net income per share to the extent that the market value of our common stock exceeds the strike price of the Warrants. Proceeds from the sale of the Warrants were $45.2 million and were recorded as additional paid-in capital. As of April 30, 2018, no Warrants had been exercised and all Warrants remained outstanding.
The Note Hedges and Warrants both meet the requirements for classification within stockholders’ equity, and their respective fair values are not remeasured and adjusted as long as these instruments continue to qualify for stockholders’ equity classification.
Credit Agreements
Prior Credit Agreement
In April 2011, we entered into a credit agreement with certain lenders, which was amended and restated in March 2013, and further amended in February, March, and June 2014 (as amended, the “Prior Credit Agreement”). The Prior Credit Agreement provided for senior secured credit facilities, comprised of $943.5 million of term loans, of which $300.0 million was borrowed in February 2014 and $643.5 million was borrowed in March 2014 (together, the “2014 Term Loans”), the outstanding portion of which was scheduled to mature in September 2019, and a $300.0 million revolving credit facility (the “Prior Revolving Credit Facility”), scheduled to mature in September 2018, subject to increase and reduction from time to time, in accordance with the terms of the Prior Credit Agreement.
In June 2014, we utilized the majority of the combined net proceeds from the issuance of the Notes and the concurrent issuance of 5,750,000 shares of common stock to retire $530.0 million of the 2014 Term Loans and all $106.0 million of then-outstanding borrowings under the Prior Revolving Credit Facility.
The 2014 Term Loans incurred interest at our option at either a base rate plus a margin of 1.75% or an Adjusted LIBOR Rate, as defined in the Prior Credit Agreement, plus a margin of 2.75%.
2017 Credit Agreement
On June 29, 2017, we entered into a new credit agreement (the “2017 Credit Agreement”) with certain lenders and terminated the Prior Credit Agreement.
The 2017 Credit Agreement provides for $725.0 million of senior secured credit facilities, comprised of a $425.0 million term loan maturing on June 29, 2024 (the “2017 Term Loan”) and a $300.0 million revolving credit facility maturing on June 29, 2022 (the “2017 Revolving Credit Facility”), subject to increase and reduction from time to time according to the terms of the 2017 Credit Agreement. The maturity dates of the 2017 Term Loan and 2017 Revolving Credit Facility will be accelerated to March 1, 2021 if on such date any Notes remain outstanding.
The majority of the proceeds from the 2017 Term Loan were used to repay all $406.9 million that remained outstanding under the 2014 Term Loans at June 29, 2017 upon termination of the Prior Credit Agreement. There were no borrowings under the Prior Revolving Credit Facility at June 29, 2017.
The 2017 Term Loan was subject to an original issuance discount of approximately $0.5 million. This discount is being amortized as interest expense over the term of the 2017 Term Loan using the effective interest method.
Interest rates on loans under the 2017 Credit Agreement are periodically reset, at our option, at either a Eurodollar Rate or an ABR rate (each as defined in the 2017 Credit Agreement), plus in each case a margin.
On January 31, 2018, we entered into an amendment to the 2017 Credit Agreement (the “2018 Amendment”) providing for, among other things, a reduction of the interest rate margins on the 2017 Term Loan from 2.25% to 2.00% for Eurodollar loans, and from 1.25% to 1.00% for ABR loans. The vast majority of the impact of the 2018 Amendment was accounted for as a debt modification. For the portion of the 2017 Term Loan which was considered extinguished and replaced by new loans, we wrote off $0.2 million of unamortized deferred debt issuance costs as a loss on early retirement of debt during the three months ended January 31, 2018. The remaining unamortized deferred debt issuance costs and discount are being amortized over the remaining term of the 2017 Term Loan.

Table of Contents
25
For loans under the 2017 Revolving Credit Facility, the margin is determined by reference to our Consolidated Total Debt to Consolidated EBITDA (each as defined in the 2017 Credit Agreement) leverage ratio (the “Leverage Ratio”).
As of April 30, 2018, the interest rate on the 2017 Term Loan was 3.89%. Taking into account the impact of the original issuance discount and related deferred debt issuance costs, the effective interest rate on the 2017 Term Loan was approximately 4.06% at April 30, 2018. As of January 31, 2018 the interest rate on 2017 Term Loan was 3.58%.
We are required to pay a commitment fee with respect to unused availability under the 2017 Revolving Credit Facility at a rate per annum determined by reference to our Leverage Ratio.
The 2017 Term Loan requires quarterly principal payments of approximately $1.1 million, which commenced on August 1, 2017, with the remaining balance due on June 29, 2024. Optional prepayments of loans under the 2017 Credit Agreement are generally permitted without premium or penalty.
Our obligations under the 2017 Credit Agreement are guaranteed by each of our direct and indirect existing and future material domestic wholly owned restricted subsidiaries, and are secured by a security interest in substantially all of our assets and the assets of the guarantor subsidiaries, subject to certain exceptions.
The 2017 Credit Agreement contains certain customary affirmative and negative covenants for credit facilities of this type. The 2017 Credit Agreement also contains a financial covenant that, solely with respect to the 2017 Revolving Credit Facility, requires us to maintain a Leverage Ratio of no greater than 4.50 to 1. The limitations imposed by the covenants are subject to certain exceptions as detailed in the 2017 Credit Agreement.
The 2017 Credit Agreement provides for events of default with corresponding grace periods that we believe are customary for credit facilities of this type. Upon an event of default, all of our obligations owed under the 2017 Credit Agreement may be declared immediately due and payable, and the lenders’ commitments to make loans under the 2017 Credit Agreement may be terminated.
2017 Credit Agreement Issuance Costs
We incurred debt issuance costs of approximately $6.8 million in connection with the 2017 Credit Agreement, of which $4.1 million were associated with the 2017 Term Loan, and $2.7 million were associated with the 2017 Revolving Credit Facility, which were deferred and are being amortized as interest expense over the terms of the facilities under the 2017 Credit Agreement. As noted previously, during the three months ended January 31, 2018, we wrote off $0.2 million of deferred debt issuance costs associated with the 2017 Term Loan as a result of the 2018 Amendment. Deferred debt issuance costs associated with the 2017 Term Loan are being amortized using the effective interest rate method, and deferred debt issuance costs associated with the 2017 Revolving Credit Facility are being amortized on a straight-line basis.
Future Principal Payments on Term Loan
As of April 30, 2018, future scheduled principal payments on the 2017 Term Loan were as follows:
(in thousands)Years Ending January 31, Amount2019 (remainder of year) $ 3,1882020 4,2502021 4,2502022 4,2502023 4,2502024 and thereafter 401,625 Total $ 421,813
Interest Expense
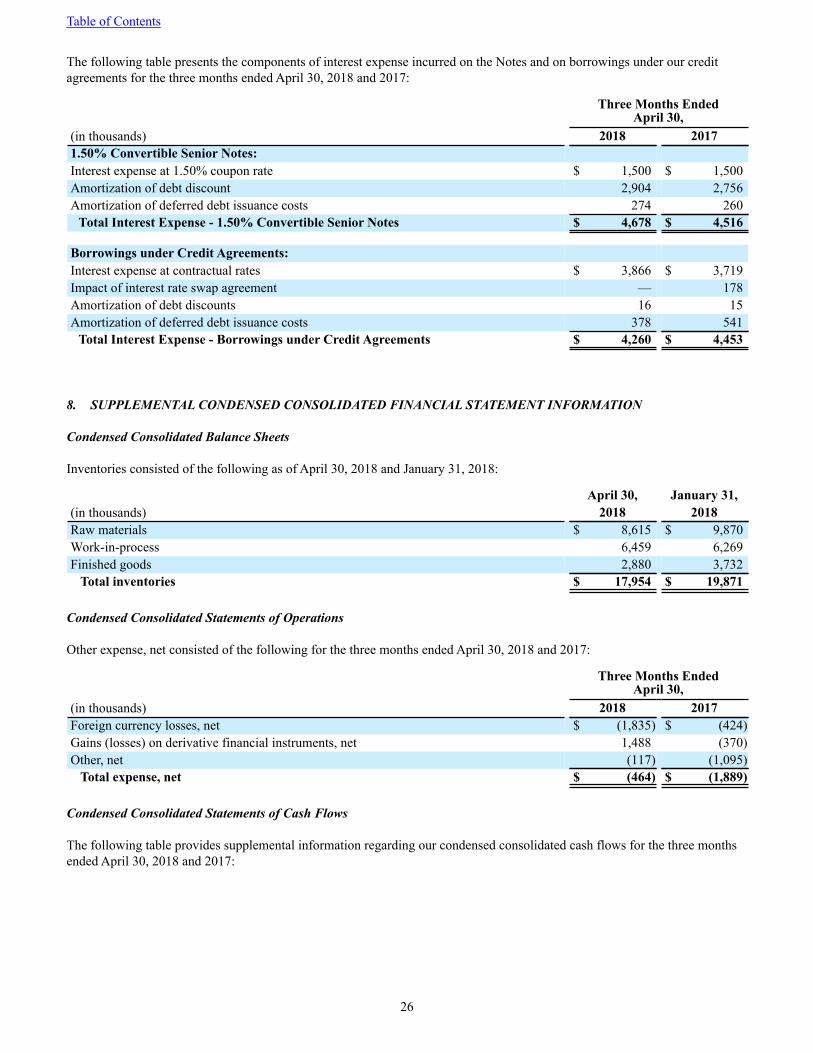
Table of Contents
26
The following table presents the components of interest expense incurred on the Notes and on borrowings under our credit agreements for the three months ended April 30, 2018 and 2017:
Three Months EndedApril 30,
(in thousands) 2018 20171.50% Convertible Senior Notes:Interest expense at 1.50% coupon rate $ 1,500 $ 1,500Amortization of debt discount 2,904 2,756Amortization of deferred debt issuance costs 274 260
Total Interest Expense - 1.50% Convertible Senior Notes $ 4,678 $ 4,516
Borrowings under Credit Agreements:Interest expense at contractual rates $ 3,866 $ 3,719Impact of interest rate swap agreement — 178Amortization of debt discounts 16 15Amortization of deferred debt issuance costs 378 541
Total Interest Expense - Borrowings under Credit Agreements $ 4,260 $ 4,453
8. SUPPLEMENTAL CONDENSED CONSOLIDATED FINANCIAL STATEMENT INFORMATION Condensed Consolidated Balance Sheets Inventories consisted of the following as of April 30, 2018 and January 31, 2018:
April 30, January 31,(in thousands) 2018 2018Raw materials $ 8,615 $ 9,870Work-in-process 6,459 6,269Finished goods 2,880 3,732 Total inventories $ 17,954 $ 19,871
Condensed Consolidated Statements of Operations Other expense, net consisted of the following for the three months ended April 30, 2018 and 2017:
Three Months EndedApril 30,
(in thousands) 2018 2017Foreign currency losses, net $ (1,835) $ (424)Gains (losses) on derivative financial instruments, net 1,488 (370)Other, net (117) (1,095) Total expense, net $ (464) $ (1,889)
Condensed Consolidated Statements of Cash Flows The following table provides supplemental information regarding our condensed consolidated cash flows for the three months ended April 30, 2018 and 2017:

Table of Contents
27
Three Months EndedApril 30,
(in thousands) 2018 2017Cash paid for interest $ 2,647 $ 3,962Cash payments of income taxes, net $ 4,999 $ 9,355
Non-cash investing and financing transactions:
Accrued but unpaid purchases of property and equipment $ 3,397 $ 2,956Inventory transfers to property and equipment $ 603 $ 225Liabilities for contingent consideration in business combinations, including measurementperiod adjustments $ 69 $ 1,900
9. STOCKHOLDERS’ EQUITY Dividends on Common Stock
We did not declare or pay any dividends on our common stock during the three months ended April 30, 2018 and 2017. Under the terms of our 2017 Credit Agreement, we are subject to certain restrictions on declaring and paying dividends on our common stock.
Share Repurchase Program
On March 29, 2016, we announced that our board of directors had authorized a common stock repurchase program of up to $150.0 million over two years. This program expired on March 29, 2018. We made a total of $46.9 million in repurchases under the program.
Treasury Stock Repurchased shares of common stock are recorded as treasury stock, at cost, but may from time to time be retired. We periodically purchase treasury stock from directors, officers, and other employees to facilitate income tax withholding by us or the payment of required income taxes by such holders in connection with the vesting of equity awards.
During the three months ended April 30, 2018, we acquired approximately 4,000 shares of treasury stock for a cost of $0.2 million. We did not acquire any treasury stock during the three months ended April 30, 2017.
At April 30, 2018, we held approximately 1,665,000 shares of treasury stock with a cost of $57.6 million. At January 31, 2018, we held approximately 1,661,000 shares of treasury stock with a cost of $57.4 million.
Accumulated Other Comprehensive Income (Loss) Accumulated other comprehensive income (loss) includes items such as foreign currency translation adjustments and unrealized gains and losses on certain marketable securities and derivative financial instruments designated as hedges. Accumulated other comprehensive income (loss) is presented as a separate line item in the stockholders’ equity section of our condensed consolidated balance sheets. Accumulated other comprehensive income (loss) items have no impact on our net income (loss) as presented in our condensed consolidated statements of operations.
The following table summarizes changes in the components of our accumulated other comprehensive income (loss) by component for the three months ended April 30, 2018:

Table of Contents
28
(in thousands)
UnrealizedGains (Losses)
on ForeignExchangeContracts
Designated asHedges
UnrealizedGain on
Interest RateSwap
Designated asHedge
ForeignCurrency
TranslationAdjustments Total
Accumulated other comprehensive income (loss) atJanuary 31, 2018 $ 3,312 $ — $ (106,772) $ (103,460)Other comprehensive (loss) income beforereclassifications (6,114) 220 (13,677) (19,571)Gains reclassified out of accumulated othercomprehensive income (loss) 390 — — 390Net other comprehensive (loss) income, current period (6,504) 220 (13,677) (19,961)Accumulated other comprehensive (loss) income at April 30, 2018 $ (3,192) $ 220 $ (120,449) $ (123,421)
All amounts presented in the table above are net of income taxes, if applicable. The accumulated net losses in foreign currency translation adjustments primarily reflect the strengthening of the U.S. dollar against the British pound sterling, which has resulted in lower U.S. dollar-translated balances of British pound sterling-denominated goodwill and intangible assets.
The amounts reclassified out of accumulated other comprehensive income (loss) into the condensed consolidated statement of operations, with presentation location, for the three months ended April 30, 2018 and 2017 were as follows:
Three Months Ended April 30,
(in thousands) 2018 2017 LocationUnrealized gains on derivative financialinstruments:Foreign currency forward contracts $ 37 $ 86 Cost of product revenue
40 75 Cost of service and support revenue220 482 Research and development, net136 278 Selling, general and administrative433 921 Total, before income taxes(43) (92) Provision for income taxes
$ 390 $ 829 Total, net of income taxes
10. INCOME TAXES Our interim provision (benefit) for income taxes is measured using an estimated annual effective income tax rate, adjusted for discrete items that occur within the periods presented.
On December 22, 2017, the Tax Cuts and Jobs Acts (“2017 Tax Act”) was enacted in the United States. The 2017 Tax Act significantly revises the Internal Revenue Code of 1986, as amended, and it includes fundamental changes to taxation of U.S. multinational corporations. The key provisions impacting our January 31, 2019 year include a reduction of the corporate tax rate from a top marginal rate of 35% to a flat rate of 21%, new limitations on the tax deductions for interest expense and executive compensation, elimination of the alternative minimum tax (AMT) and the ability to refund unused AMT credits over a four year period, and new rules related to uses and limitations of net operating loss carryforwards. New international provisions add a new category of deemed income from our foreign operations, eliminate U.S. tax on foreign dividends (subject to certain restrictions), and add a minimum tax on certain payments made to foreign related parties. Our estimated annual effective tax rate for the three months ended April 30, 2018 includes provisional amounts for certain 2017 Tax Act provisions related to our foreign operations. We expect to utilize a portion of our net operating loss carryforward and release the valuation allowance on the deferred tax asset for that net operating loss carryforward for a net impact of $0.
Compliance with the 2017 Tax Act will require significant complex computations not previously required by U.S. tax law. It is unclear how certain provisions of the 2017 Tax Act will be applied absent further legislative, regulatory, or accounting clarification and guidance. Also, on December 22, 2017, the staff of the SEC issued Staff Accounting Bulletin No. 118 (“SAB No. 118”). SAB No. 118 provides guidance on accounting for the tax effects of the 2017 Tax Act and allows registrants to

Table of Contents
29
record provisional amounts for a period of up to one year from the date of enactment of the 2017 Tax Act. We considered amounts related to the 2017 Tax Act to be reasonably estimated as of January 31, 2018 and, as of April 30, 2018, we did not have any significant adjustments to provisional amounts recorded as of January 31, 2018. We expect to refine and complete the accounting for the 2017 Tax Act during the year ending January 31, 2019 as we obtain, prepare, and analyze additional information and as additional legislative, regulatory, and accounting guidance and interpretations become available.
For the three months ended April 30, 2018, we recorded an income tax provision of $0.3 million on a pre-tax loss of $1.0 million, which represented a negative effective income tax rate of 28.8%. The income tax provision does not include income tax benefits on losses incurred by certain domestic and foreign operations where we maintain valuation allowances. Our pre-tax losses in domestic and foreign jurisdictions where we maintain valuation allowances and do not record tax benefits were higher than the pre-tax income in jurisdictions where we record a tax benefit.
For the three months ended April 30, 2017, we recorded an income tax benefit of $0.9 million on a pre-tax loss of $19.9 million, which represented an effective income tax rate of 4.5%. The income tax benefit does not include income tax benefits on losses incurred by certain domestic and foreign operations where we maintain valuation allowances. Our pre-tax losses in domestic and foreign jurisdictions where we maintain valuation allowances and do not record tax benefits were significantly higher than the pre-tax losses in jurisdictions where we record a tax benefit. We also recorded a discrete income tax benefit of $0.9 million for the adjustment of certain unrecognized tax benefits mainly due to an audit settlement.
As required by the authoritative guidance on accounting for income taxes, we evaluate the realizability of deferred income tax assets on a jurisdictional basis at each reporting date. Accounting guidance for income taxes requires that a valuation allowance be established when it is more-likely-than-not that all or a portion of the deferred income tax assets will not be realized. In circumstances where there is sufficient negative evidence indicating that the deferred income tax assets are not more-likely-than-not realizable, we establish a valuation allowance. We determined that there is sufficient negative evidence to maintain the valuation allowances against our federal and certain state and foreign deferred income tax assets as a result of historical losses in the most recent three-year period in the U.S. and in certain foreign jurisdictions. We intend to maintain valuation allowances until sufficient positive evidence exists to support a reversal.
We had unrecognized income tax benefits of $115.6 million and $115.7 million (excluding interest and penalties) as of April 30, 2018 and January 31, 2018, respectively. The accrued liability for interest and penalties was $5.7 million and $5.6 million at April 30, 2018 and January 31, 2018, respectively. Interest and penalties are recorded as a component of the provision for income taxes in our condensed consolidated statements of operations. As of April 30, 2018 and January 31, 2018, the total amount of unrecognized income tax benefits that, if recognized, would impact our effective income tax rate were approximately $105.8 million and $105.4 million, respectively. We regularly assess the adequacy of our provisions for income tax contingencies in accordance with the applicable authoritative guidance on accounting for income taxes. As a result, we may adjust the reserves for unrecognized income tax benefits for the impact of new facts and developments, such as changes to interpretations of relevant tax law, assessments from taxing authorities, settlements with taxing authorities, and lapses of statutes of limitation. Further, we believe that it is reasonably possible that the total amount of unrecognized income tax benefits at April 30, 2018 could decrease by approximately $6.5 million in the next twelve months as a result of settlement of certain tax audits or lapses of statutes of limitation. Such decreases may involve the payment of additional income taxes, the adjustment of deferred income taxes including the need for additional valuation allowances, and the recognition of income tax benefits. Our income tax returns are subject to ongoing tax examinations in several jurisdictions in which we operate. We also believe that it is reasonably possible that new issues may be raised by tax authorities or developments in tax audits may occur which would require increases or decreases to the balance of reserves for unrecognized income tax benefits; however, an estimate of such changes cannot reasonably be made.
11. FAIR VALUE MEASUREMENTS Assets and Liabilities Measured at Fair Value on a Recurring Basis Our assets and liabilities measured at fair value on a recurring basis consisted of the following as of April 30, 2018 and January 31, 2018:
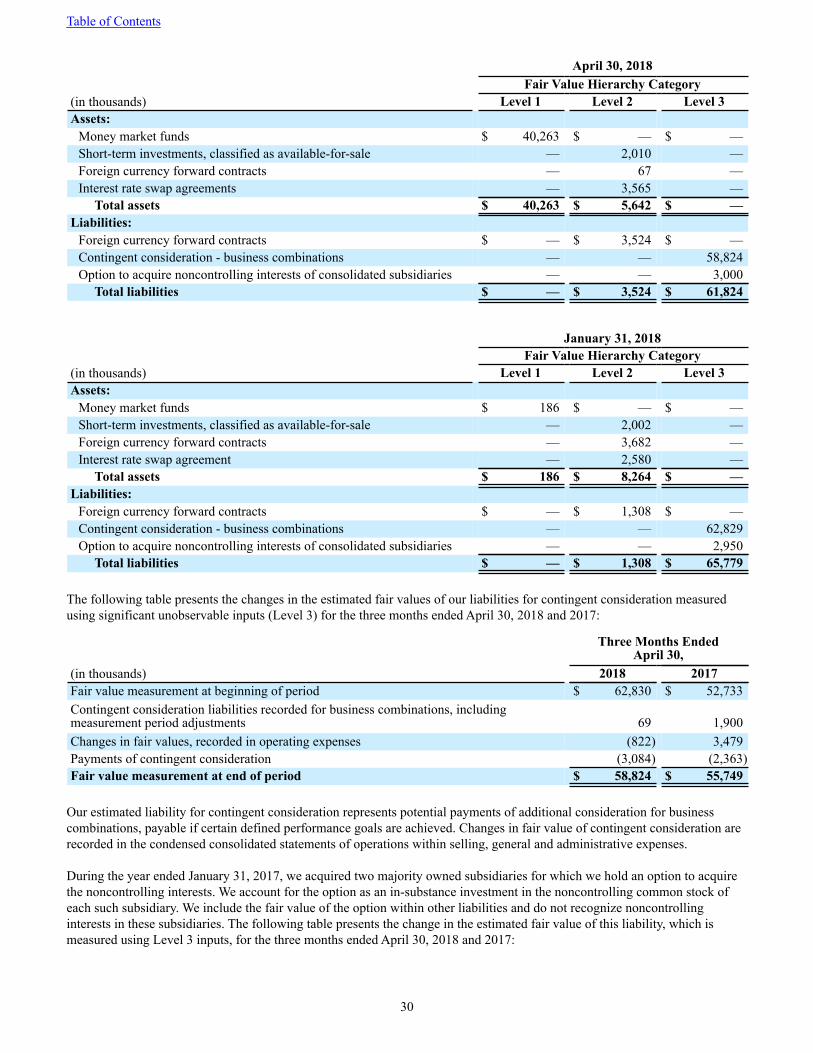
Table of Contents
30
April 30, 2018
Fair Value Hierarchy Category(in thousands) Level 1 Level 2 Level 3Assets:
Money market funds $ 40,263 $ — $ —Short-term investments, classified as available-for-sale — 2,010 —Foreign currency forward contracts — 67 —Interest rate swap agreements — 3,565 —
Total assets $ 40,263 $ 5,642 $ —Liabilities:
Foreign currency forward contracts $ — $ 3,524 $ —Contingent consideration - business combinations — — 58,824Option to acquire noncontrolling interests of consolidated subsidiaries — — 3,000
Total liabilities $ — $ 3,524 $ 61,824
January 31, 2018
Fair Value Hierarchy Category
(in thousands) Level 1 Level 2 Level 3Assets:
Money market funds $ 186 $ — $ —Short-term investments, classified as available-for-sale — 2,002 —Foreign currency forward contracts — 3,682 —Interest rate swap agreement — 2,580 —
Total assets $ 186 $ 8,264 $ —Liabilities:
Foreign currency forward contracts $ — $ 1,308 $ —Contingent consideration - business combinations — — 62,829Option to acquire noncontrolling interests of consolidated subsidiaries — — 2,950
Total liabilities $ — $ 1,308 $ 65,779
The following table presents the changes in the estimated fair values of our liabilities for contingent consideration measured using significant unobservable inputs (Level 3) for the three months ended April 30, 2018 and 2017:
Three Months EndedApril 30,
(in thousands) 2018 2017Fair value measurement at beginning of period $ 62,830 $ 52,733Contingent consideration liabilities recorded for business combinations, includingmeasurement period adjustments 69 1,900Changes in fair values, recorded in operating expenses (822) 3,479Payments of contingent consideration (3,084) (2,363)Fair value measurement at end of period $ 58,824 $ 55,749
Our estimated liability for contingent consideration represents potential payments of additional consideration for business combinations, payable if certain defined performance goals are achieved. Changes in fair value of contingent consideration are recorded in the condensed consolidated statements of operations within selling, general and administrative expenses.
During the year ended January 31, 2017, we acquired two majority owned subsidiaries for which we hold an option to acquire the noncontrolling interests. We account for the option as an in-substance investment in the noncontrolling common stock of each such subsidiary. We include the fair value of the option within other liabilities and do not recognize noncontrolling interests in these subsidiaries. The following table presents the change in the estimated fair value of this liability, which is measured using Level 3 inputs, for the three months ended April 30, 2018 and 2017:

Table of Contents
31
Three Months EndedApril 30,
(in thousands) 2018 2017Fair value measurement at beginning of period $ 2,950 $ 3,550Change in fair value, recorded in operating expenses 50 200Fair value measurement at end of period $ 3,000 $ 3,750 There were no transfers between levels of the fair value measurement hierarchy during the three months ended April 30, 2018 and 2017.
Fair Value Measurements Money Market Funds - We value our money market funds using quoted active market prices for such funds.
Short-term Investments, Corporate Debt Securities, and Commercial Paper - The fair values of short-term investments, as well as corporate debt securities and commercial paper classified as cash equivalents, are estimated using observable market prices for identical securities that are traded in less-active markets, if available. When observable market prices for identical securities are not available, we value these short-term investments using non-binding market price quotes from brokers which we review for reasonableness using observable market data; quoted market prices for similar instruments; or pricing models, such as a discounted cash flow model.
Foreign Currency Forward Contracts - The estimated fair value of foreign currency forward contracts is based on quotes received from the counterparties thereto. These quotes are reviewed for reasonableness by discounting the future estimated cash flows under the contracts, considering the terms and maturities of the contracts and market foreign currency exchange rates using readily observable market prices for similar contracts.
Interest Rate Swap Agreements - The fair value of our interest rate swap agreements are based in part on data received from the counterparty, and represents the estimated amount we would receive or pay to settle the agreements, taking into consideration current and projected future interest rates as well as the creditworthiness of the parties, all of which can be validated through readily observable data from external sources. Contingent Consideration - Business Combinations - The fair value of the contingent consideration related to business combinations is estimated using a probability-adjusted discounted cash flow model. These fair value measurements are based on significant inputs not observable in the market. The key internally developed assumptions used in these models are discount rates and the probabilities assigned to the milestones to be achieved. We remeasure the fair value of the contingent consideration at each reporting period, and any changes in fair value resulting from either the passage of time or events occurring after the acquisition date, such as changes in discount rates, or in the expectations of achieving the performance targets, are recorded within selling, general, and administrative expenses. Increases or decreases in discount rates would have inverse impacts on the related fair value measurements, while favorable or unfavorable changes in expectations of achieving performance targets would result in corresponding increases or decreases in the related fair value measurements. We utilized discount rates ranging from 3.0% to 5.0% in our calculations of the estimated fair values of our contingent consideration liabilities as of April 30, 2018 and January 31, 2018.
Option to Acquire Noncontrolling Interests of Consolidated Subsidiaries - The fair value of the option is determined primarily by using the income approach, which discounts expected future cash flows to present value using estimates and assumptions determined by management. This fair value measurement is based upon significant inputs not observable in the market. We remeasure the fair value of the option at each reporting period, and any changes in fair value are recorded within selling, general, and administrative expenses. We utilized discount rates of 13.0% and 13.5% in our calculation of the estimated fair value of the option as of April 30, 2018 and January 31, 2018, respectively.
Other Financial Instruments The carrying amounts of accounts receivable, contract assets, accounts payable, and accrued liabilities and other current liabilities approximate fair value due to their short maturities. The estimated fair values of our term loan borrowings were $425 million at April 30, 2018 and January 31, 2018. The estimated fair values of the term loans are based upon indicative bid and ask prices as determined by the agent responsible for the syndication of our term loans. We consider these inputs to be within Level 3 of the fair value hierarchy because we cannot

Table of Contents
32
reasonably observe activity in the limited market in which participations in our term loans are traded. The indicative prices provided to us as at each of April 30, 2018 and January 31, 2018 did not significantly differ from par value. The estimated fair value of our revolving credit borrowings, if any, is based upon indicative market values provided by one of our lenders. We had no revolving credit borrowings at April 30, 2018 and January 31, 2018.
The estimated fair values of our Notes were approximately $390 million and $389 million at April 30, 2018 and January 31, 2018, respectively. The estimated fair values of the Notes are determined based on quoted bid and ask prices in the over-the-counter market in which the Notes trade. We consider these inputs to be within Level 2 of the fair value hierarchy. Assets and Liabilities Not Measured at Fair Value on a Recurring Basis In addition to assets and liabilities that are measured at fair value on a recurring basis, we also measure certain assets and liabilities at fair value on a nonrecurring basis. Our non-financial assets, including goodwill, intangible assets and property, plant and equipment, are measured at fair value when there is an indication of impairment and the carrying amount exceeds the asset’s projected undiscounted cash flows. These assets are recorded at fair value only when an impairment charge is recognized.
12. DERIVATIVE FINANCIAL INSTRUMENTS Our primary objective for holding derivative financial instruments is to manage foreign currency exchange rate risk and interest rate risk, when deemed appropriate. We enter into these contracts in the normal course of business to mitigate risks and not for speculative purposes. Foreign Currency Forward Contracts
Under our risk management strategy, we periodically use foreign currency forward contracts to manage our short-term exposures to fluctuations in operational cash flows resulting from changes in foreign currency exchange rates. These cash flow exposures result from portions of our forecasted operating expenses, primarily compensation and related expenses, which are transacted in currencies other than the U.S. dollar, most notably the Israeli shekel. We also periodically utilize foreign currency forward contracts to manage exposures resulting from forecasted customer collections to be remitted in currencies other than the applicable functional currency, and exposures from cash, cash equivalents and short-term investments denominated in currencies other than the applicable functional currency. These foreign currency forward contracts generally have maturities of no longer than twelve months, although occasionally we will execute a contract that extends beyond twelve months, depending upon the nature of the underlying risk.
We held outstanding foreign currency forward contracts with notional amounts of $148.3 million and $153.5 million as of April 30, 2018 and January 31, 2018, respectively.
Interest Rate Swap Agreements
To partially mitigate risks associated with the variable interest rates on the term loan borrowings under the Prior Credit Agreement, in February 2016 we executed a pay-fixed, receive-variable interest rate swap agreement with a multinational financial institution under which we pay interest at a fixed rate of 4.143% and receive variable interest of three-month LIBOR (subject to a minimum of 0.75%), plus a spread of 2.75%, on a notional amount of $200.0 million (the “2016 Swap”). Although the Prior Credit Agreement was terminated on June 29, 2017, the 2016 Swap agreement remains in effect, and serves as an economic hedge to partially mitigate the risk of higher borrowing costs under our 2017 Credit Agreement resulting from increases in market interest rates. Settlements with the counterparty under the 2016 Swap occur quarterly, and the 2016 Swap will terminate on September 6, 2019.
Prior to June 29, 2017, the 2016 Swap was designated as a cash flow hedge for accounting purposes. On June 29, 2017, concurrent with the execution of the 2017 Credit Agreement and termination of the Prior Credit Agreement, the 2016 Swap was no longer designated as a cash flow hedge for accounting purposes and, because occurrence of the specific forecasted variable cash flows which had been hedged by the 2016 Swap agreement was no longer probable, the $0.9 million fair value of the 2016 Swap at that date was reclassified from accumulated other comprehensive income (loss) into the condensed consolidated statement of operations as income within other income (expense), net. Ongoing changes in the fair value of the 2016 Swap agreement are now recognized within other income (expense), net in the condensed consolidated statement of operations.

Table of Contents
33
In April 2018, we executed a pay-fixed, receive-variable interest rate swap agreement with a multinational financial institution to partially mitigate risks associated with the variable interest rate on our 2017 Term Loan for periods following the termination of the 2016 Swap in September 2019, under which we will pay interest at a fixed rate of 2.949% and receive variable interest of three-month LIBOR (subject to a minimum of 0.00%), on a notional amount of $200.0 million (the “2018 Swap”). The effective date of the 2018 Swap is September 6, 2019, and settlements with the counterparty will occur on a quarterly basis, beginning on November 1, 2019. The 2018 Swap will terminate on June 29, 2024.
During the operating term of the 2018 Swap, if we elect three-month LIBOR at the periodic interest rate reset dates for at least $200.0 million of our 2017 Term Loan, the annual interest rate on that amount of the 2017 Term Loan will be fixed at 4.949% (including the impact of our current 2.00% interest rate margin on Eurodollar loans) for the applicable interest rate period.
The 2018 Swap is designated as a cash flow hedge and as such, changes in its fair value are recognized in accumulated other comprehensive income (loss) in the condensed consolidated balance sheet and are reclassified into the condensed statement of operations within interest expense in the periods in which the hedged transactions affect earnings.
Fair Values of Derivative Financial Instruments
The fair values of our derivative financial instruments and their classifications in our condensed consolidated balance sheets as of April 30, 2018 and January 31, 2018 were as follows:
Fair Value atApril 30, January 31,
(in thousands) Balance Sheet Classification 2018 2018Derivative assets:Foreign currency forward contracts: Designated as cash flow hedges Prepaid expenses and other current assets $ 4 $ 3,682 Not designated as hedging instruments Prepaid expenses and other current assets 63 —Interest rate swap agreements: Designated as cash flow hedge Other assets 220 — Not designated as hedging instrument Prepaid expenses and other current assets 1,762 1,250
Other assets 1,583 1,330 Total derivative assets $ 3,632 $ 6,262
Derivative liabilities:Foreign currency forward contracts: Designated as cash flow hedges Accrued expenses and other current liabilities $ 2,900 $ — Not designated as hedging instruments Accrued expenses and other current liabilities 624 1,061
Other liabilities — 247 Total derivative liabilities $ 3,524 $ 1,308
Derivative Financial Instruments in Cash Flow Hedging Relationships
The effects of derivative financial instruments designated as cash flow hedges on accumulated other comprehensive loss (“AOCL”) and on the condensed consolidated statements of operations for the three months ended April 30, 2018 and 2017 were as follows:

Table of Contents
34
Three Months Ended April 30,
(in thousands) 2018 2017Net (losses) gains recognized in AOCL:Foreign currency forward contracts $ (6,149) $ 4,170Interest rate swap agreement 220 (33)
$ (5,929) $ 4,137
Net gains reclassified from AOCL to the condensed consolidated statements ofoperations:Foreign currency forward contracts $ 433 $ 921 For information regarding the line item locations of the net gains reclassified out of AOCL into the condensed consolidated condensed statements of operations, see Note 9, “Stockholders’ Equity”.
There were no gains or losses from ineffectiveness of these cash flow hedges recorded for the three months ended April 30, 2017. Effective with our February 1, 2018 adoption of ASU No. 2017-12, ineffectiveness of cash flow hedges is no longer recognized. All of the foreign currency forward contracts underlying the $3.2 million of net unrealized losses recorded in our accumulated other comprehensive loss at April 30, 2018 mature within twelve months, and therefore we expect all such losses to be reclassified into earnings within the next twelve months. Derivative Financial Instruments Not Designated as Hedging Instruments Gains (losses) recognized on derivative financial instruments not designated as hedging instruments in our condensed consolidated statements of operations for the three months ended April 30, 2018 and 2017 were as follows:
Classification in Condensed ConsolidatedStatements of Operations
Three Months EndedApril 30,
(in thousands) 2018 2017Foreign currency forward contracts Other (expense) income, net $ 761 $ (370)Interest rate swap agreements Other (expense) income, net 727 —
$ 1,488 $ (370)
13. STOCK-BASED COMPENSATION
Amended and Restated Stock-Based Compensation Plan
On June 22, 2017, our stockholders approved the Verint Systems Inc. Amended and Restated 2015 Long-Term Stock Incentive Plan (the “2017 Amended Plan”), which amended and restated the Verint Systems Inc. 2015 Long-Term Stock Incentive Plan (the “2015 Plan”). As with the 2015 Plan, the 2017 Amended Plan authorizes our board of directors to provide equity-based compensation in the form of stock options, stock appreciation rights, restricted stock, restricted stock units, performance awards, other stock-based awards, and performance compensation awards.
The 2017 Amended Plan amended and restated the 2015 Plan to, among other things, increase the number of shares available for issuance thereunder. Subject to adjustment as provided in the 2017 Amended Plan, up to an aggregate of (i) 7,975,000 shares of our common stock (on an option-equivalent basis), plus (ii) the number of shares of our common stock available for issuance under the 2015 Plan as of June 22, 2017, plus (iii) the number of shares of our common stock that become available for issuance as a result of awards made under the 2015 Plan or the 2017 Amended Plan that are forfeited, cancelled, exchanged, withheld or surrendered or terminate or expire, may be issued or transferred in connection with awards under the 2017 Amended Plan. Each stock option or stock-settled stock appreciation right granted under the 2017 Amended Plan will reduce the available plan capacity by one share and each other award will reduce the available plan capacity by 2.47 shares.
The 2017 Amended Plan expires on June 22, 2027.
Stock-Based Compensation Expense

35
We recognized stock-based compensation expense in the following line items on the condensed consolidated statements of operations for the three months ended April 30, 2018 and 2017:
Three Months Ended April 30,
(in thousands) 2018 2017Cost of revenue - product $ 117 $ 341Cost of revenue - service and support 729 1,252Research and development, net 1,509 3,031Selling, general and administrative 14,104 13,059
Total stock-based compensation expense $ 16,459 $ 17,683
The following table summarizes stock-based compensation expense by type of award for the three months ended April 30, 2018, and 2017:
Three Months Ended April 30,
(in thousands) 2018 2017Restricted stock units and restricted stock awards $ 14,895 $ 13,443Stock bonus program and bonus share program 1,548 4,177Total equity-settled awards 16,443 17,620Phantom stock units (cash-settled awards) 16 63
Total stock-based compensation expense $ 16,459 $ 17,683 Awards under our stock bonus and bonus share programs are accounted for as liability-classified awards, because the obligations are based predominantly on fixed monetary amounts that are generally known at inception of the obligation, to be settled with a variable number of shares of our common stock.
Restricted Stock Units We periodically award restricted stock units (“RSUs”) to our directors, officers, and other employees. These awards contain various vesting conditions and are subject to certain restrictions and forfeiture provisions prior to vesting. Some of these awards to executive officers and certain employees vest upon the achievement of specified performance goals or market conditions (performance stock units or “PSUs”).
The following table (“Award Activity Table”) summarizes activity for RSUs, PSUs, and other stock awards that reduce available Plan capacity under the Plans for the three months ended April 30, 2018:
(in thousands, except per share data)Shares or
Units
Weighted-Average
Grant DateFair Value
Outstanding, January 31, 2018 2,808 $ 41.18Granted 1,324 $ 42.39Released (180) $ 38.65Forfeited (100) $ 42.11
Outstanding, April 30, 2018 3,852 $ 41.69
With respect to our stock bonus program, activity presented in the table above only includes shares earned and released in consideration of the discount provided under that program. Consistent with the provisions of the Plans under which such shares are issued, other shares issued under the stock bonus program are not included in the table above because they do not reduce available plan capacity (since such shares are deemed to be purchased by the grantee at fair value in lieu of receiving an earned cash bonus). Activity presented in the table above includes all shares awarded and released under the bonus share program. Further details appear below under “Stock Bonus Program” and “Bonus Share Program”.
Our RSU awards may include a provision which allows the awards to be settled with cash payments upon vesting, rather than with delivery of common stock, at the discretion of our board of directors. As of April 30, 2018, for such awards that are

36
outstanding, settlement with cash payments was not considered probable, and therefore these awards have been accounted for as equity-classified awards and are included in the table above.
The following table summarizes PSU activity in isolation under the Plans for the three months ended April 30, 2018 and 2017 (these amounts are already included in the Award Activity Table above for 2018):
Three Months EndedApril 30,
(in thousands) 2018 2017Beginning balance 506 438Granted 174 204Released (72) (50)Forfeited (83) (79)
Ending balance 525 513
Excluding PSUs, we granted 1,150,000 RSUs during the three months ended April 30, 2018.
As of April 30, 2018, there was approximately $100.0 million of total unrecognized compensation expense, net of estimated forfeitures, related to unvested restricted stock units, which is expected to be recognized over a weighted-average period of 2.0 years.
Stock Bonus Program
Our stock bonus program permits eligible employees to receive a portion of their earned bonuses, otherwise payable in cash, in the form of discounted shares of our common stock. Executive officers are eligible to participate in this program to the extent that shares remain available for awards following the enrollment of all other participants. Shares awarded to executive officers with respect to the discount feature of the program are subject to a one-year vesting period. This program is subject to annual funding approval by our board of directors and an annual cap on the number of shares that can be issued. Subject to these limitations, the number of shares to be issued under the program for a given year is determined using a five-day trailing average price of our common stock when the awards are calculated, reduced by a discount determined by the board of directors each year (the “discount”). To the extent that this program is not funded in a given year or the number of shares of common stock needed to fully satisfy employee enrollment exceeds the annual cap, the applicable portion of the employee bonuses will generally revert to being paid in cash. Obligations under this program are accounted for as liabilities, because the obligations are based predominantly on fixed monetary amounts that are generally known at inception of the obligation, to be settled with a variable number of shares of common stock determined using a discounted average price of our common stock.
Awards under the stock bonus program for the performance period ended January 31, 2018 will consist of shares earned in respect of executive officer incentive plans and will be awarded without a discount, and are expected to be issued during the three months ending July 31, 2018.
In March 2018, our board of directors approved up to 125,000 shares of common stock, and a discount of 15%, for awards under our stock bonus program for the year ending January 31, 2019. There was no activity under the stock bonus program during the three months ended April 30, 2018 and 2017.
Bonus Share Program
Under our bonus share program, we may provide discretionary year-end bonuses to employees or pay earned bonuses that are outside the stock bonus program in the form of shares of common stock. Unlike the stock bonus program, there is no enrollment for this program and no discount feature. Similar to the accounting for the stock bonus program, obligations for these bonuses are accounted for as liabilities, because the obligations are based predominantly on fixed monetary amounts that are generally known, to be settled with a variable number of shares of common stock.
For bonuses in respect of the year ended January 31, 2018, the board of directors approved the use of up to 300,000 shares of common stock under this program, reduced by any shares used under the stock bonus program in respect of the performance period ended January 31, 2018. Shares awarded in respect of the bonus share program for the year ended January 31, 2018 are expected to be issued during the three months ending July 31, 2018.

37
For bonuses in respect of the year ending January 31, 2019, the board of directors has approved the use of up to 300,000 shares of common stock under this program, reduced by any shares used under the stock bonus program in respect of the performance period ending January 31, 2019.
The combined accrued liabilities for the stock bonus program and the bonus share program were $10.7 million and $9.2 million at April 30, 2018 and January 31, 2018, respectively.
14. COMMITMENTS AND CONTINGENCIES
Warranty Liability
The following table summarizes the activity in our warranty liability, which is included in accrued expenses and other liabilities in the condensed consolidated balance sheets, for the three months ended April 30, 2018 and 2017:
Three Months EndedApril 30,
(in thousands) 2018 2017Warranty liability at beginning of period $ 551 $ 962Provision charged to expenses 35 76Warranty charges (83) (97)Foreign currency translation and other (5) (12)Warranty liability at end of period $ 498 $ 929
Legal Proceedings
On March 26, 2009, legal actions were commenced by Ms. Orit Deutsch, a former employee of our subsidiary, Verint Systems Limited (“VSL”), against VSL in the Tel Aviv Regional Labor Court (Case Number 4186/09) (the “Deutsch Labor Action”) and against CTI in the Tel Aviv District Court (Case Number 1335/09) (the “Deutsch District Action”). In the Deutsch Labor Action, Ms. Deutsch filed a motion to approve a class action lawsuit on the grounds that she purported to represent a class of our employees and former employees who were granted Verint and CTI stock options and were allegedly damaged as a result of the suspension of option exercises during the period from March 2006 through March 2010, during which we did not make periodic filings with the SEC as a result of certain internal and external investigations and reviews of accounting matters discussed in our prior public filings. In the Deutsch District Action, in addition to a small amount of individual damages, Ms. Deutsch was seeking to certify a class of plaintiffs who were allegedly damaged due to their inability to exercise Verint and CTI stock options as a result of alleged negligence by CTI in its financial reporting. The class certification motions did not specify an amount of damages. On February 8, 2010, the Deutsch Labor Action was dismissed for lack of material jurisdiction and was transferred to the Tel Aviv District Court and consolidated with the Deutsch District Action.
On March 16, 2009 and March 26, 2009, respectively, legal actions were commenced by Ms. Roni Katriel, a former employee of CTI’s former subsidiary, Comverse Limited, against Comverse Limited in the Tel Aviv Regional Labor Court (Case Number 3444/09) (the “Katriel Labor Action”) and against CTI in the Tel Aviv District Court (Case Number 1334/09) (the “Katriel District Action”). In the Katriel Labor Action, Ms. Katriel was seeking to certify a class of plaintiffs who were granted CTI stock options and were allegedly damaged as a result of the suspension of option exercises during an extended filing delay period affecting CTI’s periodic reporting discussed in CTI’s historical SEC filings. In the Katriel District Action, in addition to a small amount of individual damages, Ms. Katriel was seeking to certify a class of plaintiffs who were allegedly damaged due to their inability to exercise CTI stock options as a result of alleged negligence by CTI in its financial reporting. The class certification motions did not specify an amount of damages. On March 2, 2010, the Katriel Labor Action was transferred to the Tel Aviv District Court, based on an agreed motion filed by the parties requesting such transfer.
On April 4, 2012, Ms. Deutsch and Ms. Katriel filed an uncontested motion to consolidate and amend their claims and on June 7, 2012, the District Court allowed Ms. Deutsch and Ms. Katriel to file the consolidated class certification motion and an amended consolidated complaint against VSL, CTI, and Comverse Limited. Following CTI’s announcement of its intention to effect the distribution of all of the issued and outstanding shares of capital stock of its former subsidiary, Comverse, Inc. (the “Comverse Share Distribution”), on July 12, 2012, the plaintiffs filed a motion requesting that the District Court order CTI to set aside up to $150.0 million in assets to secure any future judgment. The District Court ruled at such time that it would not

Table of Contents
38
decide this motion until the Deutsch and Katriel class certification motion was heard. Plaintiffs initially filed a motion to appeal this ruling in August 2012, but subsequently withdrew it in July 2014.
Prior to the consummation of the Comverse Share Distribution, CTI either sold or transferred substantially all of its business operations and assets (other than its equity ownership interests in us and its then-subsidiary, Comverse, Inc.) to Comverse, Inc. or unaffiliated third parties. On October 31, 2012, CTI completed the Comverse Share Distribution, in which it distributed all of the outstanding shares of common stock of Comverse, Inc. to CTI’s shareholders. As a result of the Comverse Share Distribution, Comverse, Inc. became an independent company and ceased to be a wholly owned subsidiary of CTI, and CTI ceased to have any material assets other than its equity interest in us. As of February 28, 2017, Mavenir Inc. became successor-in-interest to Comverse, Inc.
On February 4, 2013, we merged with CTI. As a result of the merger, we have assumed certain rights and liabilities of CTI, including any liability of CTI arising out of the Deutsch District Action and the Katriel District Action. However, under the terms of the Distribution Agreement between CTI and Comverse, Inc. relating to the Comverse share distribution, we, as successor to CTI, are entitled to indemnification from Comverse, Inc. (now Mavenir) for any losses we suffer in our capacity as successor-in-interest to CTI in connection with the Deutsch District Action and the Katriel District Action.
Following an unsuccessful mediation process, the proceeding before the District Court resumed. On August 28, 2016, the District Court (i) denied the plaintiffs’ motion to certify the suit as a class action with respect to all claims relating to Verint stock options and (ii) approved the plaintiffs’ motion to certify the suit as a class action with respect to claims of current or former employees of Comverse Limited (now Mavenir) or VSL who held unexercised CTI stock options at the time CTI suspended option exercises. The court also ruled that the merits of the case and any calculation of damages would be evaluated under New York law.
On December 15, 2016, CTI filed with the Supreme Court a motion for leave to appeal the District Court’s August 28, 2016 ruling. The plaintiffs did not file an appeal of the District Court’s August 28, 2016 ruling. On February 5, 2017, the District Court approved the plaintiffs’ motion to appoint a new representative plaintiff, Mr. David Vaaknin, for the current or former employees of VSL who held unexercised CTI stock options at the time CTI suspended option exercises in replacement of Ms. Deutsch.
On August 8, 2017, the Supreme Court partially allowed CTI’s appeal and ordered the case to be returned to the District Court to determine whether a cause of action exists in this case under New York law, based on CTI’s previously submitted expert opinion and the opinion of any expert the plaintiffs elect to introduce.
On November 28, 2017, the plaintiffs submitted an expert opinion regarding New York law. On January 3, 2018, CTI filed a motion to dismiss the motion to certify the class action on the basis that the New York law opinion submitted by the plaintiffs did not directly address the causes of action in question, or alternatively, to dismiss the portions of the opinion that did not specifically relate to CTI’s expert opinion. On January 22, 2018, the court ruled that the plaintiffs should submit a motion to amend their class certification motion and that CTI’s motion to dismiss would remain pending. Based on input from the court, the parties have agreed to enter into a further round of mediation in an effort to settle the matter.
From time to time we or our subsidiaries may be involved in legal proceedings and/or litigation arising in the ordinary course of our business. While the outcome of these matters cannot be predicted with certainty, we do not believe that the outcome of any current claims will have a material effect on our consolidated financial position, results of operations, or cash flows.
15. SEGMENT INFORMATION
Operating segments are defined as components of an enterprise about which separate financial information is available that is evaluated regularly by the enterprise’s chief operating decision maker (“CODM”), or decision making group, in deciding how to allocate resources and in assessing performance. Our Chief Executive Officer is our CODM.
We report our results in two operating segments—Customer Engagement Solutions (“Customer Engagement”) and Cyber Intelligence Solutions (“Cyber Intelligence”). Our Customer Engagement solutions help customer-centric organizations optimize customer engagement, increase customer loyalty, and maximize revenue opportunities, while generating operational efficiencies, reducing cost, and mitigating risk. Our Cyber Intelligence solutions are used for a wide range of applications, including predictive intelligence, advanced and complex investigations, security threat analysis, and electronic data and physical assets protection, as well as for generating legal evidence and preventing criminal activity and terrorism.

Table of Contents
39
We measure the performance of our operating segments based on segment revenue and segment contribution.
Segment revenue includes adjustments associated with revenue of acquired companies which are not recognizable within GAAP revenue. These adjustments primarily relate to the acquisition-date excess of the historical carrying value over the fair value of acquired companies’ future maintenance and service performance obligations. As the obligations are satisfied, we report our segment revenue using the historical carrying values of these obligations, which we believe better reflects our ongoing maintenance and service revenue streams, whereas GAAP revenue is reported using the obligations’ acquisition-date fair values. Segment revenue adjustments can also result from aligning an acquired company’s historical revenue recognition policies to our policies.
Segment contribution includes segment revenue and expenses incurred directly by the segment, including material costs, service costs, research and development, selling, marketing, and certain administrative expenses. When determining segment contribution, we do not allocate certain operating expenses which are provided by shared resources or are otherwise generally not controlled by segment management. These expenses are reported as “Shared support expenses” in our table of segment operating results, the majority of which are expenses for administrative support functions, such as information technology, human resources, finance, legal, and other general corporate support, and for occupancy expenses. These unallocated expenses also include procurement, manufacturing support, and logistics expenses.
In addition, segment contribution does not include amortization of acquired intangible assets, stock-based compensation, and other expenses that either can vary significantly in amount and frequency, are based upon subjective assumptions, or in certain cases are unplanned for or difficult to forecast, such as restructuring expenses and business combination transaction and integration expenses, all of which are not considered when evaluating segment performance.
Revenue from transactions between our operating segments is not material.
Operating results by segment for the three months ended April 30, 2018 and 2017 were as follows:
Three Months EndedApril 30,
(in thousands) 2018 2017Revenue:
Customer Engagement
Segment revenue $ 189,175 $ 174,700Revenue adjustments (2,719) (4,715)
186,456 169,985Cyber Intelligence
Segment revenue 102,795 91,034Revenue adjustments (44) (24)
102,751 91,010
Total revenue $ 289,207 $ 260,995
Segment contribution:
Customer Engagement $ 66,802 $ 59,308Cyber Intelligence 21,222 20,352
Total segment contribution 88,024 79,660
Reconciliation of segment contribution to operating income (loss):
Revenue adjustments 2,763 4,739Shared support expenses 41,909 36,928Amortization of acquired intangible assets 15,110 21,071Stock-based compensation 16,459 17,683Acquisition, integration, restructuring, and other unallocated expenses 4,001 8,624Total reconciling items, net 80,242 89,045
Operating income (loss) $ 7,782 $ (9,385)

Table of Contents
40
With the exception of goodwill and acquired intangible assets, we do not identify or allocate our assets by operating segment. Consequently, it is not practical to present assets by operating segment. The allocations of goodwill and acquired intangible assets by operating segment appear in Note 6, “Intangible Assets and Goodwill”.
Item 2. Management’s Discussion and Analysis of Financial Condition and Results of Operations The following management’s discussion and analysis is provided to assist readers in understanding our financial condition, results of operations, and cash flows. This discussion should be read in conjunction with our audited consolidated financial statements and the notes thereto included in our Annual Report on Form 10-K for the year ended January 31, 2018 and our unaudited condensed consolidated financial statements and notes thereto contained in this report. This discussion contains a number of forward-looking statements, all of which are based on our current expectations and all of which could be affected by uncertainties and risks. Our actual results may differ materially from the results contemplated in these forward-looking statements as a result of many factors including, but not limited to, those described under “Cautionary Note on Forward-Looking Statements”.
Overview
Our Business
Verint is a global leader in Actionable Intelligence solutions. Actionable Intelligence is a necessity in a dynamic world of massive information growth because it empowers organizations with crucial insights and enables decision makers to anticipate, respond, and take action. With Verint solutions and value-added services, organizations of all sizes and across many industries can make more informed, timely, and effective decisions. Today, over 10,000 organizations in more than 180 countries, including over 85 percent of the Fortune 100, use Verint solutions to optimize customer engagement and make the world a safer place.
We have established leadership positions in Actionable Intelligence by developing highly-scalable, enterprise-class software and services with advanced, integrated analytics for both structured and unstructured information. Our innovative solutions are developed by a large research and development (“R&D”) team comprised of approximately 1,600 professionals and backed by more than 850 patents and patent applications worldwide.
To help our customers maximize the benefits of our technology over the solution lifecycle and provide a high degree of flexibility, we offer a broad range of services, such as strategic consulting, managed services, implementation services, training, maintenance, and 24x7 support. Additionally, we offer a broad range of deployment options, including cloud, on-premises, and hybrid, and software licensing and delivery models that include perpetual licenses and software as a service (“SaaS”).
We conduct our business in two operating segments—Customer Engagement Solutions (“Customer Engagement”) and Cyber Intelligence Solutions (“Cyber Intelligence”). Our Customer Engagement solutions help customer-centric organizations optimize customer engagement, increase customer loyalty, and maximize revenue opportunities, while generating operational efficiencies, reducing cost, and mitigating risk. Our Cyber Intelligence solutions are used for a wide range of applications, including predictive intelligence, advanced and complex investigations, security threat analysis, and electronic data and physical assets protection, as well as for generating legal evidence and preventing criminal activity and terrorism.
Generally, we make business decisions by evaluating the risks and rewards of the opportunities available to us in the markets served by each of our segments. We view each operating segment differently and allocate capital, personnel, resources, and management attention accordingly. In reviewing each operating segment, we also review the performance of that segment by geography. Our marketing and sales strategies, expansion opportunities, and product offerings may differ materially within a particular segment geographically, as may our allocation of resources between segments. When making decisions regarding investments in our business, capital expenditures, or other decisions that may affect our profitability, we also consider the leverage ratio in our revolving credit facility. See “- Liquidity and Capital Resources” for more information.
Key Trends and Factors That May Impact our Performance
We see the following trends and factors which may impact our performance:
Customer Engagement

Table of Contents
41
• Many organizations have significant investments in existing legacy systems that they wish to protect. Our open portfolio is designed to easily integrate into customers’ current and evolving technology environments, and easily share data across the organization. Our open portfolio is also compatible with leading providers of contact center communications products, which provides organizations flexibility to select the most suitable solutions for their contact centers, while leveraging Verint’s portfolio for both the contact center and enterprise. We believe this compatibility is particularly important now as the contact center communications market is evolving with new entrants offering disruptive approaches to communications.
• Many organizations are looking to modernize their legacy customer engagement operations by transitioning to the cloud, adopting modern architectures that facilitate the orchestration of disparate systems and the sharing of data across enterprise functions. We offer organizations a smooth transition to the cloud, and through our hybrid cloud model, organizations can deploy solutions from our portfolio in public cloud (SaaS), private cloud and perpetual license models, or combinations of these models. Organizations are looking for solutions that incorporate machine learning and analytics to automate work and reduce manual labor. Our solutions enable organizations to draw on the power of automation to reduce repetitive, manual tasks, increase employee efficiency, and lower cost. Our growth will be impacted by the rate of adoption of our new solutions and the rate of market saturation for our legacy, more mature solutions.
Cyber Intelligence
• Security and intelligence organizations are finding it more difficult to detect, investigate and neutralize threats. Many of these organizations are seeking to deploy more advanced data mining solutions that can help them capture and analyze data from multiple sources to effectively and efficiently address the challenge of the increased complexity and sophistication of today’s security threats and encrypted communications. Verint has a long history of working closely with leading security organizations around the world and has designed its data mining software portfolio based on a deep understanding of our customers’ needs, proven intelligence methodologies and deep domain expertise in an effort to help them address these constantly evolving challenges. Our growth will be impacted by our ability to innovate and work with customers to address the more complex security and intelligence challenges.
• Many security organizations are seeking advanced data mining solutions that automate functions historically performed manually to improve the quality and speed of investigations and intelligence production. These organizations are also increasingly seeking artificial intelligence and other advanced data analysis tools such as predictive intelligence to gain intelligence faster with fewer analysts and data scientists, especially given the shortage of qualified personnel in today’s market. Our growth will be impacted by our ability to leverage automation and predictive intelligence technologies to improve the quality and speed of investigations and intelligence production.
Critical Accounting Policies and Estimates
Note 1, “Summary of Significant Accounting Policies” to the audited consolidated financial statements in our Annual Report on Form 10-K for the year ended January 31, 2018 describes the significant accounting policies and methods used in the preparation of the condensed consolidated financial statements appearing in this report. The accounting policies that reflect our more significant estimates, judgments and assumptions in the preparation of our condensed consolidated financial statements are described in “Management’s Discussion and Analysis of Financial Condition and Results of Operations” in Item 7 of our Annual Report on Form 10-K for the year ended January 31, 2018, and include the following:
• Revenue recognition;• Allowance for doubtful accounts;• Accounting for business combinations;• Impairment of goodwill and other intangible assets;• Income taxes;• Contingencies;• Accounting for stock-based compensation; and• Cost of revenue
On February 1, 2018, we adopted ASU No. 2014-09, Revenue from Contracts with Customers (Topic 606), using the modified retrospective method applied to those contracts that were not completed as of February 1, 2018. Results for reporting periods beginning after February 1, 2018 are presented under ASU No. 2014-09, while prior period amounts are not adjusted and continue to be reported in accordance with our historic accounting under prior guidance. For additional information regarding

Table of Contents
42
the adoption of this accounting standard, please refer to Note 2, “Revenue Recognition” to our condensed consolidated financial statements in Part I, Item 1 of this report for further details.
Please refer to Note 1, “Basis of Presentation and Significant Accounting Policies” in the notes to condensed consolidated financial statements in Part I, Item 1 of this report under the headings “Goodwill, Other Acquired Intangible Assets, and Long-Lived Assets” and “Other Recently Adopted Accounting Standards” for additional changes to our critical accounting policies and estimates during the three months ended April 30, 2018.
Results of Operations Seasonality and Cyclicality As is typical for many software and technology companies, our business is subject to seasonal and cyclical factors. In most years, our revenue and operating income are typically highest in the fourth quarter and lowest in the first quarter (prior to the impact of unusual or nonrecurring items). Moreover, revenue and operating income in the first quarter of a new year may be lower than in the fourth quarter of the preceding year, in some years, by a significant margin. In addition, we generally receive a higher volume of orders in the last month of a quarter, with orders concentrated in the later part of that month. We believe that these seasonal and cyclical factors primarily reflect customer spending patterns and budget cycles, as well as the impact of incentive compensation plans for our sales personnel. While seasonal and cyclical factors such as these are common in the software and technology industry, this pattern should not be considered a reliable indicator of our future revenue or financial performance. Many other factors, including general economic conditions, may also have an impact on our business and financial results.
Overview of Operating Results The following table sets forth a summary of certain key financial information for the three months ended April 30, 2018 and 2017:
Three Months Ended April 30,
(in thousands, except per share data) 2018 2017Revenue $ 289,207 $ 260,995Operating income (loss) $ 7,782 $ (9,385)Net loss attributable to Verint Systems Inc. $ (2,215) $ (19,786)Net loss per common share attributable to Verint Systems Inc.:
Basic $ (0.03) $ (0.32) Diluted $ (0.03) $ (0.32)
Three Months Ended April 30, 2018 compared to Three Months Ended April 30, 2017. Our revenue increased approximately $28.2 million, or 11%, to $289.2 million in the three months ended April 30, 2018 from $261.0 million in the three months ended April 30, 2017. The increase consisted of a $16.0 million increase in product revenue and a $12.2 million increase in service and support revenue. In our Customer Engagement segment, revenue increased $16.5 million, or approximately 10%, from $170.0 million in the three months ended April 30, 2017 to $186.5 million in the three months ended April 30, 2018. The increase consisted of a $11.1 million increase in product revenue and a $5.4 million increase in service and support revenue. In our Cyber Intelligence segment, revenue increased approximately $11.7 million, or 13%, from $91.0 million in the three months ended April 30, 2017 to $102.7 million in the three months ended April 30, 2018. The increase consisted of a $6.8 million increase in service and support revenue and a $4.9 million increase in product revenue. For additional details on our revenue by segment, see “—Revenue by Operating Segment”. Revenue in the Americas, in Europe, the Middle East and Africa (“EMEA”), and in the Asia-Pacific (“APAC”) regions represented approximately 51%, 28%, and 21% of our total revenue, respectively, in the three months ended April 30, 2018, compared to approximately 55%, 31%, and 14%, respectively, in the three months ended April 30, 2017. Further details of changes in revenue are provided below.
We reported operating income of $7.8 million in the three months ended April 30, 2018 compared to an operating loss of $9.4 million in the three months ended April 30, 2017. The increase was primarily due to a $24.9 million increase in gross profit, from $150.2 million to $175.1 million, partially offset by a $7.8 million increase in operating expenses, from $159.6 million to $167.4 million. The increase in operating expenses consisted of a $6.0 million increase in net research and development

Table of Contents
43
expenses and a $5.7 million increase in selling, general and administrative expenses, partially offset by a $3.9 million decrease in amortization of other acquired intangible assets. Further details of changes in operating income are provided below.
Net loss attributable to Verint Systems Inc. was $2.2 million, and diluted net loss per common share was $0.03, in the three months ended April 30, 2018 compared to net loss attributable to Verint Systems Inc. of $19.8 million, and net loss per common share of $0.32, in the three months ended April 30, 2017. These improved operating results in the three months ended April 30, 2018 were primarily due to a $17.2 million increase in operating income described above, and a $1.8 million decrease in total other expense, net, partially offset by a $1.2 million increase in provision for income taxes and a $0.2 million increase in net income attributable to our noncontrolling interests. Further details of these changes are provided below.
A portion of our business is conducted in currencies other than the U.S. dollar, and therefore our revenue and operating expenses are affected by fluctuations in applicable foreign currency exchange rates. When comparing average exchange rates for the three months ended April 30, 2018 to average exchange rates for the three months ended April 30, 2017, the U.S. dollar weakened relative to the euro, British pound sterling, Singapore dollar and our Israeli shekel rate (hedged and unhedged), resulting in an overall increase in our revenue, cost of revenue, and operating expenses on a U.S. dollar-denominated basis. For the three months ended April 30, 2018, had foreign currency exchange rates remained unchanged from rates in effect for the three months ended April 30, 2017, our revenue would have been approximately $5.7 million lower and our cost of revenue and operating expenses on a combined basis would have been approximately $8.1 million lower, which would have resulted in a $2.4 million increase in our operating income.
As of April 30, 2018, we employed approximately 5,500 professionals, including part-time employees and certain contractors, as compared to 5,100 at April 30, 2017.
Revenue by Operating Segment As described in Note 2, “Revenue Recognition” to our condensed consolidated financial statements in Part I, Item 1 of this report, calculated revenue for the three months ended April 30, 2018 without the adoption of ASU No. 2014-09 would have been lower than the revenue we are reporting under the new accounting guidance. However, the lower calculated revenue results not only from the impact of the new accounting guidance, but also from changes we made to our business practices in anticipation of the new accounting guidance. These business practice changes adversely impact the calculation of revenue under the prior accounting guidance and include, among other things, the way we manage our professional services projects, offer and deploy our solutions, structure certain customer contracts, and make pricing decisions. While the many variables, required assumptions, and other complexities associated with these business practice changes make it impractical to precisely quantify the impact of these changes, we believe that calculated revenue under the prior accounting guidance, but absent these business practice changes, would have been closer to the revenue we are reporting under the new accounting guidance.
The following table sets forth revenue for each of our two operating segments for the three months ended April 30, 2018 and 2017:
Three Months Ended April 30, % Change
(in thousands) 2018 2017 2018 - 2017Customer Engagement $ 186,456 $ 169,985 10%Cyber Intelligence 102,751 91,010 13%Total revenue $ 289,207 $ 260,995 11%
Customer Engagement Segment
Three Months Ended April 30, 2018 compared to Three Months Ended April 30, 2017. Customer Engagement revenue increased approximately $16.5 million, or 10%, from $170.0 million in the three months ended April 30, 2017 to $186.5 million in the three months ended April 30, 2018. The increase consisted of an $11.1 million increase in product revenue and a $5.4 million increase in service and support revenue. As a result of the adoption of the new revenue recognition accounting standard, we made certain changes to our Customer Engagement contracting and business processes that would have otherwise not occurred under the prior revenue recognition guidance. The application of ASU No. 2014-09 primarily resulted in differences in the timing and amount of revenue recognition for term-based licenses, minimum guaranteed amounts related to usage-based licenses, and professional services for which payment is contingent upon the achievement of milestones. Excluding the impact of ASU No. 2014-09, Customer Engagement revenue increased approximately $6.7 million, or 4%, from $170.0 million in the three months ended April 30, 2017 to $176.7 million in the three months ended April 30, 2018. However,

Table of Contents
44
please see the note at the top of this section regarding the adoption of ASU No. 2014-09. The increase consisted of a $7.0 million increase in product revenue, partially offset by a $0.3 million decrease in service and support revenue. The increase in product revenue primarily reflects a higher aggregate value of executed perpetual and term-based license arrangements, which comprises the majority of our product revenue and which can fluctuate from period to period, in the three months ended April 30, 2018 compared to the three months ended April 30, 2017. The decrease in service revenue was primarily attributable to a decrease in professional services revenue related to customer implementations and consulting revenue, in the three months ended April 30, 2018 compared to the three months ended April 30, 2017.
Cyber Intelligence Segment Three Months Ended April 30, 2018 compared to Three Months Ended April 30, 2017. Cyber Intelligence revenue increased approximately $11.7 million, or 13%, from $91.0 million in the three months ended April 30, 2017 to $102.7 million in the three months ended April 30, 2018. The increase consisted of a $6.8 million increase in service and support revenue and a $4.9 million increase in product revenue. As a result of the adoption of the new revenue recognition accounting standard, we made certain changes to our Cyber Intelligence software licensing offerings that would have otherwise not occurred under prior revenue recognition guidance. The application of ASU No. 2014-09 primarily resulted in differences in the timing and amount of revenue recognition for software licenses and a long-term customization project that was accepted by the customer in the current period, which had been previously recognized under prior revenue recognition accounting standards. Excluding the impact of ASU No. 2014-09, Cyber Intelligence revenue increased approximately $0.2 million, from $91.0 million in the three months ended April 30, 2017 to $91.2 million in the three months ended April 30, 2018. However, please see the note at the top of this section regarding the adoption of ASU No. 2014-09. The increase consisted of a $5.6 million increase in service and support revenue, partially offset by a $5.4 million decrease in product revenue. The increase in service and support revenue was primarily attributable to an increase in support revenue from existing customers and an increase in revenue from our SaaS offerings, partially offset by a decrease in progress realized during the current year on long-term projects for which revenue is recognized over time using the percentage of completion (“POC”) method. The decrease in product revenue was due to a decrease in progress realized during the current year on long-term projects with revenue recognized over time using the POC method, partially offset by an increase in product deliveries.
Volume and Price We sell products in multiple configurations, and the price of any particular product varies depending on the configuration of the product sold. Due to the variety of customized configurations for each product we sell, we are unable to quantify the amount of any revenue changes attributable to a change in the price of any particular product and/or a change in the number of products sold. Product Revenue and Service and Support Revenue We derive and report our revenue in two categories: (a) product revenue, including licensing of software products and sale of hardware products (which include software that works together with the hardware to deliver the product’s essential functionality), and (b) service and support revenue, including revenue from installation services, post-contract customer support, project management, hosting services, software as a service (“SaaS”), product warranties, consulting services, and training services.
The following table sets forth product revenue and service and support revenue for the three months ended April 30, 2018 and 2017:
Three Months Ended April 30, % Change
(in thousands) 2018 2017 2018 - 2017Product revenue $ 105,864 $ 89,817 18%Service and support revenue 183,343 171,178 7%Total revenue $ 289,207 $ 260,995 11%
Product Revenue
Three Months Ended April 30, 2018 compared to Three Months Ended April 30, 2017. Product revenue increased approximately $16.1 million, or 18%, from $89.8 million for the three months ended April 30, 2017 to $105.9 million for the

Table of Contents
45
three months ended April 30, 2018, resulting from an $11.1 million increase in our Customer Engagement segment and a $5.0 million increase in our Cyber Intelligence segment.
For additional information see “—Revenue by Operating Segment”. Service and Support Revenue Three Months Ended April 30, 2018 compared to Three Months Ended April 30, 2017. Service and support revenue increased approximately $12.1 million, or 7%, from $171.2 million for the three months ended April 30, 2017 to $183.3 million for the three months ended April 30, 2018. This increase was the result of a $6.7 million increase in our Cyber Intelligence segment and a $5.4 million increase in our Customer Engagement segment.
For additional information see “— Revenue by Operating Segment”.
Cost of Revenue The following table sets forth cost of revenue by product and service and support, as well as amortization of acquired technology for the three months ended April 30, 2018 and 2017:
Three Months Ended April 30, % Change
(in thousands) 2018 2017 2018 - 2017Cost of product revenue $ 34,809 $ 33,924 3%Cost of service and support revenue 71,857 67,345 7%Amortization of acquired technology 7,426 9,534 (22)%Total cost of revenue $ 114,092 $ 110,803 3%
We exclude certain costs of both product revenue and service and support revenue, including shared support costs, stock-based compensation, and asset impairment charges (if any), among others, as well as amortization of acquired technology, when calculating our operating segment gross margins.
Cost of Product Revenue Cost of product revenue primarily consists of hardware material costs and royalties due to third parties for software components that are embedded in our software solutions. When revenue is deferred, we also defer hardware material costs and third-party software royalties and recognize those costs over the same period that the product revenue is recognized. Cost of product revenue also includes amortization of capitalized software development costs, employee compensation and related expenses associated with our global operations, facility costs, and other allocated overhead expenses. In our Cyber Intelligence segment, cost of product revenue also includes employee compensation and related expenses, contractor and consulting expenses, and travel expenses, in each case for resources dedicated to project management and associated product delivery.
As with many other technology companies, our software products tend to have higher gross margins than our hardware products, so the mix of products we sell in a particular period can have a significant impact on our gross margins in that period.
Three Months Ended April 30, 2018 compared to Three Months Ended April 30, 2017. Cost of product revenue increased approximately $0.9 million, or 3%, from $33.9 million in the three months ended April 30, 2017 to $34.8 million in the three months ended April 30, 2018 primarily due to increased cost of product revenue in our Cyber Intelligence segment, driven primarily by increased revenue activity as discussed above. Our overall product gross margins increased to 67% in the three months ended April 30, 2018 from 62% in the three months ended April 30, 2017. Product gross margins in our Cyber Intelligence segment increased from 55% in the three months ended April 30, 2017 to 57% in the three months ended April 30, 2018, primarily due to a change in product mix. Product gross margins in our Customer Engagement segment increased from 77% in the three months ended April 30, 2017 to 82% in the three months ended April 30, 2018, primarily due to a change in product mix. Excluding the impact of the adoption of ASU No. 2014-09, our overall product gross margins increased to 65% in the three months ended April 30, 2018 from 62% in the three months ended April 30, 2017, primarily due to a change in product mix.
Cost of Service and Support Revenue

Table of Contents
46
Cost of service and support revenue primarily consists of employee compensation and related expenses, contractor costs, and travel expenses relating to installation, training, consulting, and maintenance services. Cost of service and support revenue also includes stock-based compensation expenses, facility costs, and other overhead expenses. In accordance with GAAPand our accounting policy, the cost of service and support revenue is generally expensed as incurred in the period in which the services are performed.
Three Months Ended April 30, 2018 compared to Three Months Ended April 30, 2017. Cost of service and support revenue increased approximately $4.6 million, or 7%, from $67.3 million in the three months ended April 30, 2017 to $71.9 million in the three months ended April 30, 2018. The increase was primarily due to increased employee compensation and related expenses in our Customer Engagement segment and an increase in costs associated with increased use of contractors in our Cyber Intelligence segment in the three months ended April 30, 2018 compared to the three months ended April 30, 2017. Our overall service and support gross margins were 61% in each of the three months ended April 30, 2018 and 2017. Excluding the impact of the adoption of ASU No. 2014-09, our overall service and support gross margins decreased to 60% in the three months ended April 30, 2018 from 61% in the three months ended April 30, 2017.
Amortization of Acquired Technology Amortization of acquired technology consists of amortization of technology assets acquired in connection with business combinations.
Three Months Ended April 30, 2018 compared to Three Months Ended April 30, 2017. Amortization of acquired technology decreased approximately $2.1 million, or 22%, from $9.5 million in the three months ended April 30, 2017 to $7.4 million in the three months ended April 30, 2018. The decrease was attributable to acquired technology intangible assets from historical business combinations becoming fully amortized, partially offset by amortization expense of acquired technology-based intangible assets associated with recent business combinations.
Further discussion regarding our business combinations appears in Note 5, “Business Combinations” to our condensed consolidated financial statements included under Part I, Item 1 of this report. Research and Development, Net Research and development expenses consist primarily of personnel and subcontracting expenses, facility costs, and other allocated overhead, net of certain software development costs that are capitalized as well as reimbursements under government programs. Software development costs are capitalized upon the establishment of technological feasibility and continue to be capitalized through the general release of the related software product. The following table sets forth research and development, net for the three months ended April 30, 2018 and 2017:
Three Months Ended April 30, % Change
(in thousands) 2018 2017 2018 - 2017Research and development, net $ 52,152 $ 46,233 13%
Three Months Ended April 30, 2018 compared to Three Months Ended April 30, 2017. Research and development, net increased approximately $6.0 million, or 13%, from $46.2 million in the three months ended April 30, 2017 to $52.2 million in the three months ended April 30, 2018. The increase was primarily due to a $3.5 million increase in employee compensation and related expenses as a result of increased R&D headcount and a $2.7 million increase in R&D contractor expenses primarily in our Cyber Intelligence segment, partially offset by a decrease in stock-based compensation expenses for R&D employees in the three months ended April 30, 2018 compared to the three months ended April 30, 2017.
Selling, General and Administrative Expenses Selling, general and administrative expenses consist primarily of personnel costs and related expenses, professional fees, sales and marketing expenses, including travel, sales commissions and sales referral fees, facility costs, communication expenses, and other administrative expenses. The following table sets forth selling, general and administrative expenses for the three months ended April 30, 2018 and 2017:

Table of Contents
47
Three Months Ended April 30, % Change
(in thousands) 2018 2017 2018 - 2017Selling, general and administrative $ 107,497 $ 101,807 6%
Three Months Ended April 30, 2018 compared to Three Months Ended April 30, 2017. Selling, general and administrative expenses increased approximately $5.7 million, or 6%, from $101.8 million in the three months ended April 30, 2017 to $107.5 million in the three months ended April 30, 2018. This increase was primarily attributable to a $4.9 million increase in employee compensation expenses due to increased headcount as a result of recent acquisitions, a $2.2 million increase in legal fees, a $1.3 million increase as a result of lower capitalized costs associated with the development of internal-use software, and a $1.0 million increase in stock-based compensation expense. These increases were partially offset by a $4.3 million decrease in the change in fair value of our obligations under contingent consideration arrangements, from a net expense of $3.5 million in the three months ended April 30, 2017 to a net benefit of $0.8 million during the three months ended April 30, 2018. The impact of contingent consideration arrangements on our operating results can vary over time as we revise our outlook for achieving the performance targets underlying the arrangements. This impact on our operating results may be more significant in some periods than in others, depending on a number of factors, including the magnitude of the change in the outlook for each arrangement separately as well as the number of contingent consideration arrangements in place, the liabilities requiring adjustment in that period, and the net effect of those adjustments. The net benefit recorded during the three months ended April 30, 2018 resulted from revised outlooks to several unrelated arrangements.
Amortization of Other Acquired Intangible Assets Amortization of other acquired intangible assets consists of amortization of certain intangible assets acquired in connection with business combinations, including customer relationships, distribution networks, trade names, and non-compete agreements.
The following table sets forth amortization of other acquired intangible assets for the three months ended April 30, 2018 and 2017:
Three Months Ended April 30, % Change
(in thousands) 2018 2017 2018 - 2017Amortization of other acquired intangible assets $ 7,684 $ 11,537 (33)%
Three Months Ended April 30, 2018 compared to Three Months Ended April 30, 2017. Amortization of other acquired intangible assets decreased approximately $3.8 million, or 33%, from $11.5 million in the three months ended April 30, 2017 to $7.7 million in the three months ended April 30, 2018 as a result of acquired customer-related intangible assets from historical business combinations becoming fully amortized, partially offset by an increase in amortization expense from acquired intangible assets from recent business combinations.
Further discussion regarding our business combinations appears in Note 5, “Business Combinations” to our condensed consolidated financial statements included under Part I, Item 1 of this report. Other Expense, Net The following table sets forth total other expense, net for the three months ended April 30, 2018 and 2017:

Table of Contents
48
Three Months Ended April 30, % Change
(in thousands) 2018 2017 2018 - 2017Interest income $ 793 $ 330 140%Interest expense (9,062) (8,988) 1%Other income (expense):
Foreign currency (losses) gains , net (1,835) (424) *Gains (losses) on derivatives 1,488 (370) *Other, net (117) (1,095) (89)%
Total other (expense) income, net (464) (1,889) (75)%Total other expense, net $ (8,733) $ (10,547) (17)%
* Percentage is not meaningful.
Three Months Ended April 30, 2018 compared to Three Months Ended April 30, 2017. Total other expense, net, decreased by $1.8 million from $10.5 million in the three months ended April 30, 2017 to $8.7 million in the three months ended April 30, 2018.
Interest expense increased from $9.0 million in the three months ended April 30, 2017 to $9.1 million in the three months ended April 30, 2018 primarily due to higher interest rates on outstanding borrowings.
We recorded $1.8 million of net foreign currency losses in the three months ended April 30, 2018 compared to $0.4 million of net foreign currency losses in the three months ended April 30, 2017. Foreign currency losses in the three months ended April 30, 2018 resulted primarily from the strengthening of the U.S. dollar against the euro, resulting in foreign currency losses on euro denominated net assets in certain entities which use a U.S. dollar functional currency, the strengthening of the U.S. dollar against the Singapore dollar, resulting in foreign currency losses on Singapore dollar-denominated net assets in certain entities which use a U.S. dollar functional currency, and the strengthening of the U.S. dollar against the British pound sterling, resulting in foreign currency losses on U.S. dollar-denominated net payables in certain entities which use a British pound sterling functional currency.
In the three months ended April 30, 2018, there were net gains on derivative financial instruments (not designated as hedging instruments) of $1.5 million, compared to net losses of $0.4 million on such instruments for the three months ended April 30, 2017. The net gains in the current period primarily reflected gains on an interest rate swap and contracts executed to hedge movements in the exchange rate between the U.S. dollar and the Singapore dollar.
Provision (Benefit) for Income Taxes The following table sets forth our provision (benefit) for income taxes for the three months ended April 30, 2018 and 2017:
Three Months Ended April 30, % Change
(in thousands) 2018 2017 2018 - 2017Provision (benefit) for income taxes $ 274 $ (892) (131)%
Three Months Ended April 30, 2018 compared to Three Months Ended April 30, 2017. Our effective income tax rate was negative 28.8% for the three months ended April 30, 2018, compared to an effective income tax rate of 4.5% for the three months ended April 30, 2017. On December 22, 2017, the Tax Cuts and Jobs Acts (“2017 Tax Act”) was enacted in the United States. The 2017 Tax Act significantly revises the Internal Revenue Code of 1986, as amended, and it includes fundamental changes to taxation of U.S. multinational corporations. New international provisions add a new category of deemed income from our foreign operations, eliminate U.S. tax on foreign dividends (subject to certain restrictions), and add a minimum tax on certain payments made to foreign related parties. Our estimated annual effective tax rate for the three months ended April 30, 2018 includes provisional amounts for certain 2017 Tax Act provisions related to our foreign operations. For the three months ended April 30, 2018, the pre-tax losses in domestic and foreign jurisdictions where we maintain valuation allowances and do not record tax benefits were higher than the pre-tax income in jurisdictions where we record a tax benefit. The result was an income tax provision of $0.3 million on a pre-tax loss of $1.0 million, which represented a negative effective income tax rate of 28.8%.

Table of Contents
49
For the three months ended April 30, 2017, the pre-tax loss in our jurisdictions where we recorded income tax benefits was significantly lower than the pre-tax losses in our domestic and foreign jurisdictions where we maintain valuation allowances and did not record the related income tax benefits. We also recorded a discrete income tax benefit of $0.9 million for the adjustment of certain unrecognized tax benefits mainly due to an audit settlement. The result was an income tax benefit of $0.9 million on a pre-tax loss of $19.9 million, which represented an effective income tax rate of 4.5%.
Liquidity and Capital Resources Overview Our primary recurring source of cash is the collection of proceeds from the sale of products and services to our customers, including cash periodically collected in advance of delivery or performance.
Our primary recurring use of cash is payment of our operating costs, which consist primarily of employee-related expenses, such as compensation and benefits, as well as general operating expenses for marketing, facilities and overhead costs, and capital expenditures. We also utilize cash for debt service and periodically for business acquisitions. Cash generated from operations, along with our existing cash, cash equivalents, and short-term investments, are our primary sources of operating liquidity, and we believe that our operating liquidity is sufficient to support our current business operations, including debt service and capital expenditure requirements.
On June 29, 2017, we entered into the 2017 Credit Agreement with certain lenders, and terminated our Prior Credit Agreement. The 2017 Credit Agreement was amended on January 31, 2018 (the “2018 Amendment”). Further discussion of our 2017 Credit Agreement and 2018 Amendment appears below, under “Financing Arrangements”.
We have historically expanded our business in part by investing in strategic growth initiatives, including acquisitions of products, technologies, and businesses. We may finance such acquisitions using cash, debt, stock, or a combination of the foregoing, however, we have used cash as consideration for substantially all of our historical business acquisitions, including approximately $103 million of net cash expended for business acquisitions during the year ended January 31, 2018.
We continually examine our options with respect to terms and sources of existing and future short-term and long-term capital resources to enhance our operating results and to ensure that we retain financial flexibility, and may from time to time elect to raise additional equity or incur additional debt.
A considerable portion of our operating income is earned outside the United States. Cash, cash equivalents, short-term investments, and restricted cash and bank time deposits (excluding any long-term portions) held by our subsidiaries outside of the United States were $355.3 million and $346.2 million as of April 30, 2018 and January 31, 2018, respectively, and are generally used to fund the subsidiaries’ operating requirements and to invest in growth initiatives, including business acquisitions. These subsidiaries also held long-term restricted cash and cash equivalents, and restricted bank time deposits of $26.0 million and $28.4 million at April 30, 2018 and January 31, 2018, respectively.
While we intend to continue to indefinitely reinvest a portion of our foreign subsidiaries’ earnings, we currently no longer intend to indefinitely reinvest all such earnings, which, as a result of the 2017 Tax Act, may now be repatriated without incurring additional U.S. federal income taxes. Accordingly, we recognized provisional deferred income tax expense of $15.0 million for the year ended January 31, 2018 for withholding taxes on certain unremitted foreign earnings, for which we are evaluating our plans for repatriation.
Should other circumstances arise whereby we require more capital in the United States than is generated by our domestic operations, or should we otherwise consider it in our best interests, we could repatriate future earnings from foreign jurisdictions, which could result in higher effective tax rates. We currently intend to indefinitely reinvest a portion of the earnings of our foreign subsidiaries to finance foreign activities. Except to the extent of the U.S. federal tax provided under the 2017 Tax Act and withholding taxes on certain identified cash that may be repatriated to the U.S., we have not provided for taxes on the outside basis difference of foreign subsidiaries nor have we provided for any additional withholding or other tax that may be applicable should a future distribution be made from any unremitted earnings of foreign subsidiaries. It is not practical to estimate this potential liability. The following table summarizes our total cash, cash equivalents, restricted cash, cash equivalents, and bank time deposits, and short-term investments, as well as our total debt, as of April 30, 2018 and January 31, 2018:

Table of Contents
50
April 30, January 31,(in thousands) 2018 2018Cash and cash equivalents $ 382,237 $ 337,942Restricted cash and cash equivalents, and restricted bank time deposits (excluding longterm portions) 32,950 33,303Short-term investments 9,220 6,566Total cash, cash equivalents, restricted cash and cash equivalents, restricted bank timedeposits, and short-term investments $ 424,407 $ 377,811Total debt, including current portions $ 775,177 $ 772,984
Condensed Consolidated Cash Flow Activity
The following table summarizes selected items from our condensed consolidated statements of cash flows for the three months ended April 30, 2018 and 2017:
Three Months EndedApril 30,
(in thousands) 2018 2017Net cash provided by operating activities $ 60,152 $ 59,761Net cash used in investing activities (11,262) (21,975)Net cash used in financing activities (4,807) (3,583)Effect of foreign currency exchange rate changes on cash and cash equivalents (1,495) (1,334)Net increase in cash and cash equivalents $ 42,588 $ 32,869
Our operating activities generated $60.2 million of cash during the three months ended April 30, 2018, which was partially offset by $16.1 million of net cash used in combined investing and financing activities during this period. Further discussion of these items appears below.
Net Cash Provided by Operating Activities Net cash provided by operating activities is driven primarily by our net income or loss, as adjusted for non-cash items and working capital changes. Operating activities generated $60.2 million of net cash during the three months ended April 30, 2018, compared to $59.8 million generated during the three months ended April 30, 2017.
Our cash flow from operating activities can fluctuate from period to period due to several factors, including the timing of our billings and collections, the timing and amounts of interest, income tax and other payments, and our operating results. Net Cash Used in Investing Activities
During the three months ended April 30, 2018, our investing activities used $11.3 million of net cash, including $8.9 million of payments for property, equipment and capitalized software development costs, $2.8 million of net purchases of short-term investments, partially offset by $0.4 million of net cash provided by other investing activities, consisting primarily of a net increase in restricted bank time deposits during the period. Restricted bank time deposits are typically deposits, which do not qualify as cash equivalents, used to secure bank guarantees in connection with sales contracts, the amounts of which will fluctuate from period to period.
During the three months ended April 30, 2017, our investing activities used $22.0 million of net cash, including $13.9 million of net cash utilized for business acquisitions, $7.3 million of payments for property, equipment, and capitalized software development costs, $1.2 million of net purchases of short-term investments, and $0.5 million of net cash used in other investing activities, consisting primarily of an increase in restricted bank time deposits during the period.
We had no significant commitments for capital expenditures at April 30, 2018.
Net Cash Used in Financing Activities For the three months ended April 30, 2018, our financing activities used $4.8 million of net cash, the most significant portions of which were payments of $2.6 million for the financing portion of payments under contingent consideration arrangements

Table of Contents
51
related to prior business combinations, $1.3 million repayments of borrowing and other financing obligations, and a $0.8 million dividend payment to a noncontrolling shareholder of one of our subsidiaries.
For the three months ended April 30, 2017, our financing activities used $3.6 million of net cash, the most significant portions of which were payments of $1.8 million for the financing portion of payments under contingent consideration arrangements related to prior business combinations, $1.4 million repayments of borrowing and other financing obligations, and a $0.7 million dividend payment to a noncontrolling shareholder of one of our subsidiaries. Liquidity and Capital Resources Requirements Based on past performance and current expectations, we believe that our cash, cash equivalents, short-term investments and cash generated from operations will be sufficient to meet anticipated operating costs, required payments of principal and interest, working capital needs, ordinary course capital expenditures, research and development spending, and other commitments for at least the next 12 months. Currently, we have no plans to pay any cash dividends on our common stock, which are not permitted under our 2017 Credit Agreement.
Our liquidity could be negatively impacted by a decrease in demand for our products and service and support, including the impact of changes in customer buying behavior due to circumstances over which we have no control. If we determine to make additional business acquisitions or otherwise require additional funds, we may need to raise additional capital, which could involve the issuance of additional equity or debt securities or increase our borrowings under our credit facility.
On March 29, 2016, we announced that our board of directors had authorized a common stock repurchase program of up to $150 million over two years following the date of announcement. This program expired on March 29, 2018 and we did not acquire any shares of treasury stock during the three months ended April 30, 2018 under the program.
Financing Arrangements
1.50% Convertible Senior Notes
On June 18, 2014, we issued $400.0 million in aggregate principal amount of 1.50% convertible senior notes due June 1, 2021, unless earlier converted by the holders pursuant to their terms. Net proceeds from the Notes after underwriting discounts were $391.9 million. The Notes pay interest in cash semiannually in arrears at a rate of 1.50% per annum.
The Notes were issued concurrently with our public issuance of 5,750,000 shares of common stock, the majority of the combined net proceeds of which were used to partially repay certain indebtedness under the Prior Credit Agreement.
The Notes are unsecured and rank senior in right of payment to our indebtedness that is expressly subordinated in right of payment to the Notes; equal in right of payment to our indebtedness that is not so subordinated; effectively subordinated in right of payment to any of our secured indebtedness to the extent of the value of the assets securing such indebtedness; and structurally subordinated to indebtedness and other liabilities of our subsidiaries.
The Notes are convertible into, at our election, cash, shares of common stock, or a combination of both, subject to satisfaction of specified conditions and during specified periods, as described below. If converted, we currently intend to pay cash in respect of the principal amount of the Notes.
The Notes have a conversion rate of 15.5129 shares of common stock per $1,000 principal amount of Notes, which represents an effective conversion price of approximately $64.46 per share of common stock and would result in the issuance of approximately 6,205,000 shares if all of the Notes were converted. The conversion rate has not changed since issuance of the Notes, although throughout the term of the Notes, the conversion rate may be adjusted upon the occurrence of certain events.
Holders may surrender their Notes for conversion at any time prior to the close of business on the business day immediately preceding December 1, 2020, only under the following circumstances:
• during any calendar quarter commencing after the calendar quarter which ended on September 30, 2014, if the closing sale price of our common stock, for at least 20 trading days (whether or not consecutive) in the period of 30 consecutive trading days ending on the last trading day of the immediately preceding calendar quarter, is more than 130% of the conversion price of the Notes in effect on each applicable trading day;

Table of Contents
52
• during the ten consecutive trading-day period following any five consecutive trading-day period in which the trading price for the Notes for each such trading day was less than 98% of the closing sale price of our common stock on such date multiplied by the then-current conversion rate; or
• upon the occurrence of specified corporate events, as described in the indenture governing the Notes, such as a consolidation, merger, or binding share exchange.
On or after December 1, 2020 until the close of business on the second scheduled trading day immediately preceding the maturity date, holders may surrender their Notes for conversion regardless of whether any of the foregoing conditions have been satisfied. Holders of the Notes may require us to purchase for cash all or any portion of their Notes upon the occurrence of a “fundamental change” at a price equal to 100% of the principal amount of the Notes being purchased, plus accrued and unpaid interest.
As of April 30, 2018, the Notes were not convertible.
Note Hedges and Warrants
Concurrently with the issuance of the Notes, we entered into convertible note hedge transactions (the “Note Hedges”) and sold warrants (the “Warrants”). The combination of the Note Hedges and the Warrants serves to increase the effective initial conversion price for the Notes to $75.00 per share. The Note Hedges and Warrants are each separate instruments from the Notes.
Note Hedges
Pursuant to the Note Hedges, we purchased call options on our common stock, under which we have the right to acquire from the counterparties up to approximately 6,205,000 shares of our common stock, subject to customary anti-dilution adjustments, at a price of $64.46, which equals the initial conversion price of the Notes. Our exercise rights under the Note Hedges generally trigger upon conversion of the Notes and the Note Hedges terminate upon maturity of the Notes, or the first day the Notes are no longer outstanding. The Note Hedges may be settled in cash, shares of our common stock, or a combination thereof, at our option, and are intended to reduce our exposure to potential dilution upon conversion of the Notes. We paid $60.8 million for the Note Hedges, which was recorded as a reduction to additional paid-in capital. As of April 30, 2018, we had not purchased any shares of our common stock under the Note Hedges.
Warrants
We sold the Warrants to several counterparties. The Warrants provide the counterparties rights to acquire from us up to approximately 6,205,000 shares of our common stock at a price of $75.00 per share. The Warrants expire incrementally on a series of expiration dates beginning in August 2021. At expiration, if the market price per share of our common stock exceeds the strike price of the Warrants, we will be obligated to issue shares of our common stock having a value equal to such excess. The Warrants could have a dilutive effect on net income per share to the extent that the market value of our common stock exceeds the strike price of the Warrants. Proceeds from the sale of the Warrants were $45.2 million and were recorded as additional paid-in capital. As of April 30, 2018, no Warrants had been exercised and all Warrants remained outstanding.
Credit Agreements On June 29, 2017, we entered into the 2017 Credit Agreement with certain lenders, and terminated the Prior Credit Agreement.
The 2017 Credit Agreement provides for $725.0 million of senior secured credit facilities, comprised of a $425.0 million term loan maturing on June 29, 2024 (the “2017 Term Loan”) and a $300.0 million revolving credit facility maturing on June 29, 2022 (the “2017 Revolving Credit Facility”), subject to increase and reduction from time to time according to the terms of the 2017 Credit Agreement. The majority of the proceeds from the 2017 Term Loan were used to repay all $406.9 million that remained outstanding under the 2014 Term Loans at June 29, 2017 upon termination of the Prior Credit Agreement. There were no borrowings under our Prior Revolving Credit Facility (as defined in Note 7, “Long-Term Debt” to our condensed consolidated financial statements included under Item 1 of this report) at June 29, 2017.
The maturity dates of the 2017 Term Loan and 2017 Revolving Credit Facility will be accelerated to March 1, 2021, if on such date any Notes remain outstanding.
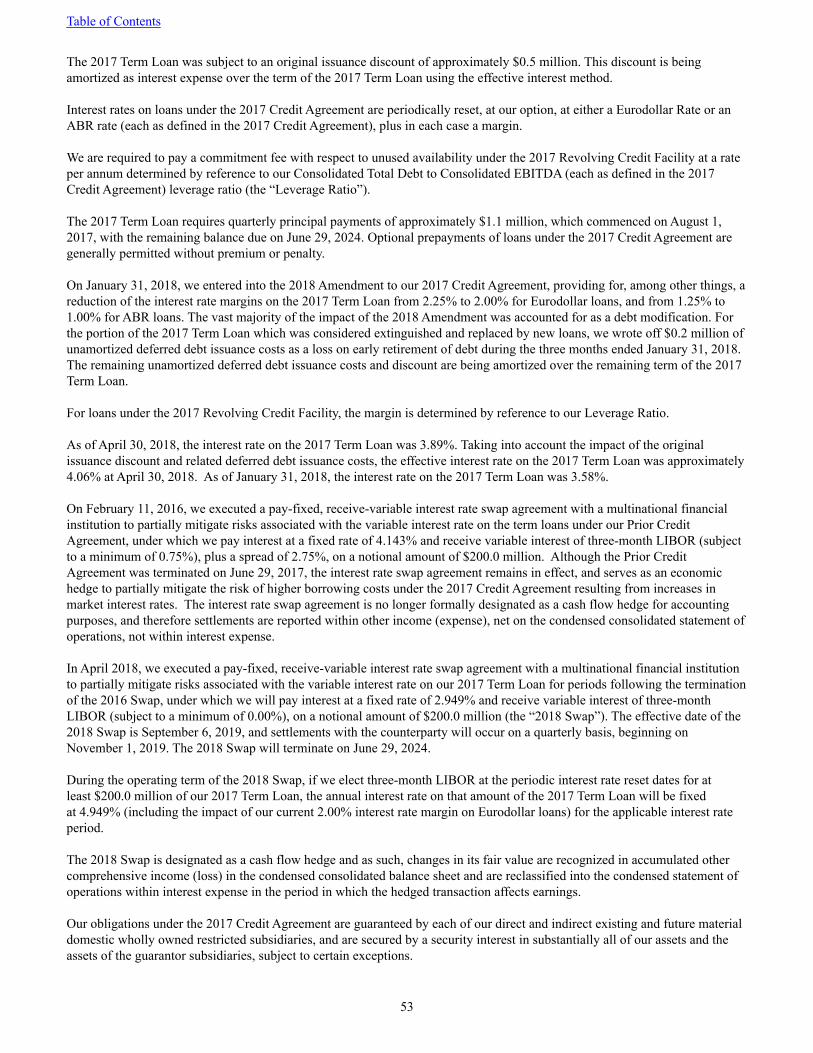
Table of Contents
53
The 2017 Term Loan was subject to an original issuance discount of approximately $0.5 million. This discount is being amortized as interest expense over the term of the 2017 Term Loan using the effective interest method.
Interest rates on loans under the 2017 Credit Agreement are periodically reset, at our option, at either a Eurodollar Rate or an ABR rate (each as defined in the 2017 Credit Agreement), plus in each case a margin.
We are required to pay a commitment fee with respect to unused availability under the 2017 Revolving Credit Facility at a rate per annum determined by reference to our Consolidated Total Debt to Consolidated EBITDA (each as defined in the 2017 Credit Agreement) leverage ratio (the “Leverage Ratio”).
The 2017 Term Loan requires quarterly principal payments of approximately $1.1 million, which commenced on August 1, 2017, with the remaining balance due on June 29, 2024. Optional prepayments of loans under the 2017 Credit Agreement are generally permitted without premium or penalty.
On January 31, 2018, we entered into the 2018 Amendment to our 2017 Credit Agreement, providing for, among other things, a reduction of the interest rate margins on the 2017 Term Loan from 2.25% to 2.00% for Eurodollar loans, and from 1.25% to 1.00% for ABR loans. The vast majority of the impact of the 2018 Amendment was accounted for as a debt modification. For the portion of the 2017 Term Loan which was considered extinguished and replaced by new loans, we wrote off $0.2 million of unamortized deferred debt issuance costs as a loss on early retirement of debt during the three months ended January 31, 2018. The remaining unamortized deferred debt issuance costs and discount are being amortized over the remaining term of the 2017 Term Loan.
For loans under the 2017 Revolving Credit Facility, the margin is determined by reference to our Leverage Ratio.
As of April 30, 2018, the interest rate on the 2017 Term Loan was 3.89%. Taking into account the impact of the original issuance discount and related deferred debt issuance costs, the effective interest rate on the 2017 Term Loan was approximately 4.06% at April 30, 2018. As of January 31, 2018, the interest rate on the 2017 Term Loan was 3.58%.
On February 11, 2016, we executed a pay-fixed, receive-variable interest rate swap agreement with a multinational financial institution to partially mitigate risks associated with the variable interest rate on the term loans under our Prior Credit Agreement, under which we pay interest at a fixed rate of 4.143% and receive variable interest of three-month LIBOR (subject to a minimum of 0.75%), plus a spread of 2.75%, on a notional amount of $200.0 million. Although the Prior Credit Agreement was terminated on June 29, 2017, the interest rate swap agreement remains in effect, and serves as an economic hedge to partially mitigate the risk of higher borrowing costs under the 2017 Credit Agreement resulting from increases in market interest rates. The interest rate swap agreement is no longer formally designated as a cash flow hedge for accounting purposes, and therefore settlements are reported within other income (expense), net on the condensed consolidated statement of operations, not within interest expense.
In April 2018, we executed a pay-fixed, receive-variable interest rate swap agreement with a multinational financial institution to partially mitigate risks associated with the variable interest rate on our 2017 Term Loan for periods following the termination of the 2016 Swap, under which we will pay interest at a fixed rate of 2.949% and receive variable interest of three-month LIBOR (subject to a minimum of 0.00%), on a notional amount of $200.0 million (the “2018 Swap”). The effective date of the 2018 Swap is September 6, 2019, and settlements with the counterparty will occur on a quarterly basis, beginning on November 1, 2019. The 2018 Swap will terminate on June 29, 2024.
During the operating term of the 2018 Swap, if we elect three-month LIBOR at the periodic interest rate reset dates for at least $200.0 million of our 2017 Term Loan, the annual interest rate on that amount of the 2017 Term Loan will be fixed at 4.949% (including the impact of our current 2.00% interest rate margin on Eurodollar loans) for the applicable interest rate period.
The 2018 Swap is designated as a cash flow hedge and as such, changes in its fair value are recognized in accumulated other comprehensive income (loss) in the condensed consolidated balance sheet and are reclassified into the condensed statement of operations within interest expense in the period in which the hedged transaction affects earnings.
Our obligations under the 2017 Credit Agreement are guaranteed by each of our direct and indirect existing and future material domestic wholly owned restricted subsidiaries, and are secured by a security interest in substantially all of our assets and the assets of the guarantor subsidiaries, subject to certain exceptions.

Table of Contents
54
The 2017 Credit Agreement contains certain customary affirmative and negative covenants for credit facilities of this type. The 2017 Credit Agreement also contains a financial covenant that, solely with respect to the 2017 Revolving Credit Facility, requires us to maintain a Leverage Ratio of no greater than 4.50 to 1. At April 30, 2018, our Leverage Ratio was approximately 2.6 to 1. The limitations imposed by the covenants are subject to certain exceptions as detailed in the 2017 Credit Agreement.
The 2017 Credit Agreement provides for events of default with corresponding grace periods that we believe are customary for credit facilities of this type. Upon an event of default, all of our obligations owed under the 2017 Credit Agreement may be declared immediately due and payable, and the lenders’ commitments to make loans under the 2017 Credit Agreement may be terminated.
Contractual Obligations
Our Annual Report on Form 10-K for the year ended January 31, 2018 includes a table summarizing our contractual obligations of approximately $1.2 billion as of January 31, 2018, including approximately $950 million for long-term debt obligations, including projected future interest. That table appears under Item 7, “Management’s Discussion and Analysis of Financial Condition and Results of Operations” in the report.
We believe that our contractual obligations and commercial commitments did not materially change during the three months ended April 30, 2018. Contingent Payments Associated with Business Combinations In connection with certain of our business combinations, we have agreed to make contingent cash payments to the former owners of the acquired companies based upon achievement of performance targets following the acquisition dates.
For the three months ended April 30, 2018, we made $3.1 million of payments under contingent consideration arrangements. As of April 30, 2018, potential future cash payments and earned consideration expected to be paid subsequent to April 30, 2018 under contingent consideration arrangements total $124.6 million, the estimated fair value of which was $58.8 million, including $19.5 million reported in accrued expenses and other current liabilities, and $39.3 million reported in other liabilities. The performance periods associated with these potential payments extend through January 2022. Off-Balance Sheet Arrangements As of April 30, 2018, we did not have any off-balance sheet arrangements that we believe have or are reasonably likely to have a current or future effect on our financial condition, changes in financial condition, revenue or expenses, results of operations, liquidity, capital expenditures or capital resources that are material to investors.
Recent Accounting Pronouncements
For a description of recent accounting pronouncements, and the potential impact of these pronouncements on our condensed consolidated financial statements, see Note 1, “Basis of Presentation and Significant Accounting Policies” to the condensed consolidated financial statements in Part I, Item 1 of this report.
Item 3. Quantitative and Qualitative Disclosures About Market Risk Market risk represents the risk of loss that may impact our financial condition due to adverse changes in financial market prices and rates. We are exposed to market risk related to changes in interest rates and foreign currency exchange rate fluctuations. To manage the volatility relating to interest rate and foreign currency risks, we periodically enter into derivative instruments including foreign currency forward exchange contracts and interest rate swap agreements. It is our policy to enter into derivative transactions only to the extent considered necessary to meet our risk management objectives. We use derivative instruments solely to reduce the financial impact of these risks and do not use derivative instruments for speculative purposes.
Interest Rate Risk on Our Debt
On June 29, 2017, we entered into the 2017 Credit Agreement with certain lenders and terminated our Prior Credit Agreement.The 2017 Credit Agreement provides for $725.0 million of senior secured credit facilities, comprised of a $425.0 million term loan maturing on June 29, 2024 (the “2017 Term Loan”) and a $300.0 million revolving credit facility maturing on June 29,

Table of Contents
55
2022 (the “2017 Revolving Credit Facility”), subject to increase and reduction from time to time according to the terms of the 2017 Credit Agreement.
Interest rates on loans under the 2017 Credit Agreement are periodically reset, at our option, at either a Eurodollar Rate or an ABR rate (each as defined in the 2017 Credit Agreement), plus in each case a margin. The margin for the 2017 Term Loan is fixed at 2.25% for Eurodollar loans, and at 1.25% for ABR loans. For loans under the 2017 Revolving Credit Facility, the margin is determined by reference to our Consolidated Total Debt to Consolidated EBITDA (each as defined in the 2017 Credit Agreement) leverage ratio. Because the interest rates applicable to borrowings under the 2017 Credit Agreement are variable, we are exposed to market risk from changes in the underlying index rates, which affect our cost of borrowing.
As of April 30, 2018, the interest rate on 2017 Term Loan was 3.89%. There were no borrowings outstanding under the 2017 Revolving Credit Facility at that date.
To partially mitigate risks associated with the variable interest rates on the term loan borrowings under the Prior Credit Agreement, in February 2016 we executed a pay-fixed, receive-variable interest rate swap agreement with a multinational financial institution under which we pay interest at a fixed rate of 4.143% and receive variable interest of three-month LIBOR (subject to a minimum of 0.75%), plus a spread of 2.75%, on a notional amount of $200.0 million (the “2016 Swap”). Although the Prior Credit Agreement was terminated on June 29, 2017, the 2016 Swap agreement remains in effect, and serves as an economic hedge to partially mitigate the risk of higher borrowing costs under our 2017 Credit Agreement resulting from increases in market interest rates. Settlements with the counterparty under the 2016 Swap occur quarterly, and the 2016 Swap will terminate on September 6, 2019.
Prior to June 29, 2017, the 2016 Swap was designated as a cash flow hedge for accounting purposes. On June 29, 2017, concurrent with the execution of the 2017 Credit Agreement and termination of the Prior Credit Agreement, the 2016 Swap was no longer designated as a cash flow hedge for accounting purposes and, because occurrence of the specific forecasted variable cash flows which had been hedged by the 2016 Swap agreement was no longer probable, the $0.9 million fair value of the 2016 Swap at that date was reclassified from accumulated other comprehensive income (loss) into the condensed consolidated statement of operations as income within other income (expense), net. Ongoing changes in the fair value of the 2016 Swap agreement are now recognized within other income (expense), net in the condensed consolidated statement of operations.
In April 2018, we executed a pay-fixed, receive-variable interest rate swap agreement with a multinational financial institution to partially mitigate risks associated with the variable interest rate on our 2017 Term Loan for periods following the termination of the 2016 Swap in September 2019, under which we will pay interest at a fixed rate of 2.949% and receive variable interest of three-month LIBOR (subject to a minimum of 0.00%), on a notional amount of $200.0 million (the “2018 Swap”). The effective date of the 2018 Swap is September 6, 2019, and settlements with the counterparty will occur on a quarterly basis, beginning on November 1, 2019. The 2018 Swap will terminate on June 29, 2024.
During the operating term of the 2018 Swap, if we elect three-month LIBOR at the periodic interest rate reset dates for at least $200.0 million of our 2017 Term Loan, the annual interest rate on that amount of the 2017 Term Loan will be fixed at 4.949% (including the impact of our current 2.00% interest rate margin on Eurodollar loans) for the applicable interest rate period.
The section entitled “Quantitative and Qualitative Disclosures About Market Risk” under Part II, Item 7A of our Annual Report on Form 10-K for the year ended January 31, 2017 provides detailed quantitative and qualitative discussions of the market risks affecting our operations. Other than as described above under “Interest Rate Risk on Our Debt”, we believe that our market risk profile did not materially change during the three months ended April 30, 2018.
Item 4. Controls and Procedures Evaluation of Disclosure Controls and Procedures Management conducted an evaluation under the supervision and with the participation of our Chief Executive Officer and Chief Financial Officer, of the effectiveness of our disclosure controls and procedures, as defined in Rules 13a-15(e) and 15d-15(e) under the Exchange Act, as of April 30, 2018. Disclosure controls and procedures are those controls and other procedures that are designed to ensure that information required to be disclosed in reports filed or submitted under the Exchange Act is recorded, processed, summarized, and reported, within the time periods specified by the rules and forms promulgated by the SEC. Disclosure controls and procedures include, without limitation, controls and procedures designed to ensure that such information is accumulated and communicated to management, including our Chief Executive Officer and

Table of Contents
56
Chief Financial Officer, as appropriate, to allow timely decisions regarding required disclosure. As a result of this evaluation, our Chief Executive Officer and Chief Financial Officer concluded that our disclosure controls and procedures were effective as of April 30, 2018. Changes in Internal Control Over Financial Reporting
We adopted the new revenue recognition accounting standard effective February 1, 2018, on a modified retrospective basis. As a result, we implemented changes to our internal controls over financial reporting, including implementation of a new global revenue management solution, the development of new policies based on the five-step model provided in the new revenue standard, new training, ongoing contract review requirements, and controls around information used in disclosures. We also implemented changes to our processes and control activities related to commission expense capitalization and amortization due to the adoption of the new revenue standard. In addition to changes to these ongoing processes and control activities, we implemented specific control procedures for the transition to the new revenue recognition accounting standard.
There were no other changes to our internal control over financial reporting (as defined in Rules 13a-15(f) and 15d-15(f) under the Exchange Act) that occurred during the three months ended April 30, 2018, that materially affected, or are reasonably likely to materially affect, our internal control over financial reporting.
Inherent Limitations on Effectiveness of Controls
Our management, including our Chief Executive Officer and Chief Financial Officer, does not expect that our disclosure controls or our internal control over financial reporting will prevent or detect all errors and all fraud. A control system, no matter how well conceived and operated, can provide only reasonable, not absolute, assurance that the objectives of the control system will be achieved. Further, the design of a control system must reflect the impact of resource constraints, and the benefits of controls must be considered relative to their costs. Because of the inherent limitations in all control systems, no evaluation of controls can provide absolute assurance that all control issues and instances of fraud, if any, have been detected. These inherent limitations include the possibility that judgments in decision-making can be faulty, and that breakdowns can occur because of simple errors. Additionally, controls can be circumvented by individual acts, by collusion of two or more people, or by management override of the controls. The design of any system of controls also is based in part upon certain assumptions about the likelihood of future events, and there can be no assurance that any design will succeed in achieving its stated goals under all possible conditions. Over time, controls may become inadequate because of changes in conditions or deterioration in the degree of compliance with policies or procedures. Because of the inherent limitations in a cost-effective control system, misstatements due to error or fraud may occur and not be detected.

Table of Contents
57
Part II
Item 1. Legal Proceedings
See Note 14, “Commitments and Contingencies” of the Notes to the condensed consolidated financial statements under Part I, Item 1 for information regarding our legal proceedings.
Item 1A. Risk Factors There have been no material changes to the Risk Factors described in Part I “Item 1A. Risk Factors” in our Annual Report on Form 10-K for the year ended January 31, 2018. In addition to the other information set forth in this Quarterly Report, you should carefully consider the risks discussed in our Annual Report on Form 10-K, which could materially affect our business, financial condition, or operating results. The risks described in our Annual Report on Form 10-K are not the only risks facing us, however. Additional risks and uncertainties not currently known to us or that we currently deem to be insignificant also may materially and adversely affect our business, financial condition, or operating results in the future.
Item 2. Unregistered Sales of Equity Securities and Use of Proceeds
Purchases of Equity Securities by the Issuer and Affiliated Purchasers
On March 29, 2016, we announced that our board of directors had authorized a common stock repurchase program of up to $150 million over two years. This program expired on March 29, 2018. We made a total of $46.9 million in repurchases under the program.
From time to time, we have purchased treasury stock from directors, officers, and other employees to facilitate income tax withholding and payment requirements upon vesting of equity awards during a Company-imposed trading blackout or lockup periods.
Share repurchase activity during the three months ended April 30, 2018 was as follows:
Period
TotalNumber of
SharesPurchased
AveragePrice Paid
per Share (1)
Total Number ofShares Purchasedas Part of PubliclyAnnounced Plans
or Programs
Approximate Dollar Value of
Shares that May Yet Be Purchased
Under the Plans or Programs
(in thousands)February 1, 2018 - February 28, 2018 — — — —March 1, 2018 - March 31, 2018 — — — —April 1, 2018 - April 30, 2018 4,222 $ 40.93 — —Total 4,222 $ 40.93 — —
(1) Represents the approximate weighted-average price paid per share.
Item 3. Defaults Upon Senior Securities
None.
Item 4. Mine Safety Disclosures Not applicable.
Item 5. Other Information

Table of Contents
58
Not applicable.

Table of Contents
59
Item 6. Exhibits
The following exhibit list includes agreements that we entered into or that became effective during the three months ended April 30, 2018:
Number Description
Filed Herewith /Incorporated byReference from
10.1 Verint Systems Inc. Stock Bonus Program* Form 10-K filed on March 29, 201810.2 Form of Time-Based Restricted Stock Unit Award Agreement for Grants
Subsequent to March 2018*Form 10-K filed on March 29, 2018
10.3 Form of Performance-Based Restricted Stock Unit Award Agreement for Grants Subsequent to March 2018*
Form 10-K filed on March 29, 2018
10.4 Summary of the Terms of Verint Systems Inc. Executive Officer Annual Bonus Plan For the Fiscal Year Ending January 31, 2019 and Subsequent*
Form 10-K filed on March 29, 2018
31.1 Certification of Chief Executive Officer pursuant to Section 302 of the Sarbanes-Oxley Act of 2002
Filed herewith
31.2 Certification of Chief Financial Officer pursuant to Section 302 of the Sarbanes-Oxley Act of 2002
Filed herewith
32.1 Certification of Chief Executive Officer pursuant to Securities Exchange Act Rule 13a-14(b) and 18 U.S.C. Section 1350 (1)
Filed herewith
32.2 Certification of Chief Financial Officer pursuant to Securities Exchange Act Rule 13a-14(b) and 18 U.S.C. Section 1350 (1)
Filed herewith
101.INS XBRL Instance Document Filed herewith101.SCH XBRL Taxonomy Extension Schema Document Filed herewith101.CAL XBRL Taxonomy Extension Calculation Linkbase Document Filed herewith101.DEF XBRL Taxonomy Extension Definition Linkbase Document Filed herewith101.LAB XBRL Taxonomy Extension Label Linkbase Document Filed herewith101.PRE XBRL Taxonomy Extension Presentation Linkbase Document Filed herewith
(1) These exhibits are being “furnished” with this periodic report and are not deemed “filed” with the SEC and are not incorporated by reference in any filing of the company under the Securities Act of 1933, as amended or the Securities Exchange Act of 1934, as amended.
* Denotes a management contract or compensatory plan or arrangement required to be filed as an exhibit to this form pursuant to Item 6 of this report.

Table of Contents
60
Signature
Pursuant to the requirements of the Securities Exchange Act of 1934, the Registrant has duly caused this report to be signed on its behalf by the undersigned thereunto duly authorized.
Verint Systems Inc. June 7, 2018 /s/ Douglas E. Robinson Douglas E. Robinson Chief Financial Officer (Principal Financial Officer and
Principal Accounting Officer)

Exhibit 31.1
CERTIFICATION BY THE CHIEF EXECUTIVE OFFICER PURSUANT TO SECTION 302 OF THESARBANES-OXLEY ACT OF 2002
I, Dan Bodner, certify that: 1. I have reviewed this quarterly report on Form 10-Q of Verint Systems Inc.; 2. Based on my knowledge, this report does not contain any untrue statement of a material fact or omit to state a material fact necessary to make the statements made, in light of the circumstances under which such statements were made, not misleading with respect to the period covered by this report; 3. Based on my knowledge, the financial statements, and other financial information included in this report, fairly present in all material respects the financial condition, results of operations and cash flows of the registrant as of, and for, the periods presented in this report; 4. The registrant's other certifying officer and I are responsible for establishing and maintaining disclosure controls and procedures (as defined in Exchange Act Rules 13a-15(e) and 15d-15(e)) and internal control over financial reporting (as defined in Exchange Act Rules 13a-15(f) and 15d-15(f)) for the registrant and have:
a) Designed such disclosure controls and procedures, or caused such disclosure controls and procedures to be designed under our supervision, to ensure that material information relating to the registrant, including its consolidated subsidiaries, is made known to us by others within those entities, particularly during the period in which this report is being prepared; b) Designed such internal control over financial reporting, or caused such internal control over financial reporting to be designed under our supervision, to provide reasonable assurance regarding the reliability of financial reporting and the preparation of financial statements for external purposes in accordance with generally accepted accounting principles; c) Evaluated the effectiveness of the registrant's disclosure controls and procedures and presented in this report our conclusions about the effectiveness of the disclosure controls and procedures, as of the end of the period covered by this report based on such evaluation; and d) Disclosed in this report any change in the registrant's internal control over financial reporting that occurred during the registrant's most recent fiscal quarter (the registrant's fourth fiscal quarter in the case of an annual report) that has materially affected, or is reasonably likely to materially affect, the registrant's internal control over financial reporting; and
5. The registrant's other certifying officer and I have disclosed, based on our most recent evaluation of internal control over financial reporting, to the registrant's auditors and the audit committee of the registrant's board of directors (or persons performing the equivalent functions):
a) All significant deficiencies and material weaknesses in the design or operation of internal control over financial reporting which are reasonably likely to adversely affect the registrant's ability to record, process, summarize and report financial information; and b) Any fraud, whether or not material, that involves management or other employees who have a significant role in the registrant's internal control over financial reporting.
Dated: June 7, 2018 By: /s/ Dan Bodner Dan Bodner President and Chief Executive Officer Principal Executive Officer

Exhibit 31.2
CERTIFICATION BY THE CHIEF FINANCIAL OFFICER PURSUANT TO SECTION 302 OF THESARBANES-OXLEY ACT OF 2002
I, Douglas E. Robinson, certify that: 1. I have reviewed this quarterly report on Form 10-Q of Verint Systems Inc.; 2. Based on my knowledge, this report does not contain any untrue statement of a material fact or omit to state a material fact necessary to make the statements made, in light of the circumstances under which such statements were made, not misleading with respect to the period covered by this report; 3. Based on my knowledge, the financial statements, and other financial information included in this report, fairly present in all material respects the financial condition, results of operations and cash flows of the registrant as of, and for, the periods presented in this report; 4. The registrant's other certifying officer and I are responsible for establishing and maintaining disclosure controls and procedures (as defined in Exchange Act Rules 13a-15(e) and 15d-15(e)) and internal control over financial reporting (as defined in Exchange Act Rules 13a-15(f) and 15d-15(f)) for the registrant and have:
a) Designed such disclosure controls and procedures, or caused such disclosure controls and procedures to be designed under our supervision, to ensure that material information relating to the registrant, including its consolidated subsidiaries, is made known to us by others within those entities, particularly during the period in which this report is being prepared; b) Designed such internal control over financial reporting, or caused such internal control over financial reporting to be designed under our supervision, to provide reasonable assurance regarding the reliability of financial reporting and the preparation of financial statements for external purposes in accordance with generally accepted accounting principles; c) Evaluated the effectiveness of the registrant's disclosure controls and procedures and presented in this report our conclusions about the effectiveness of the disclosure controls and procedures, as of the end of the period covered by this report based on such evaluation; and d) Disclosed in this report any change in the registrant's internal control over financial reporting that occurred during the registrant's most recent fiscal quarter (the registrant's fourth fiscal quarter in the case of an annual report) that has materially affected, or is reasonably likely to materially affect, the registrant's internal control over financial reporting; and
5. The registrant's other certifying officer and I have disclosed, based on our most recent evaluation of internal control over financial reporting, to the registrant's auditors and the audit committee of the registrant's board of directors (or persons performing the equivalent functions):
a) All significant deficiencies and material weaknesses in the design or operation of internal control over financial reporting which are reasonably likely to adversely affect the registrant's ability to record, process, summarize and report financial information; and b) Any fraud, whether or not material, that involves management or other employees who have a significant role in the registrant's internal control over financial reporting.
Dated: June 7, 2018 By: /s/ Douglas E. Robinson Douglas E. Robinson Chief Financial Officer Principal Financial Officer

Exhibit 32.1
CERTIFICATION PURSUANT TO 18 U.S.C. SECTION 1350,AS ADOPTED PURSUANT TO SECTION 906 OF THE SARBANES-OXLEY ACT OF 2002
In connection with the Quarterly Report of Verint Systems Inc. (the “Company”) on Form 10-Q for the period ended April 30, 2018 (the “Report”), I, Dan Bodner, President and Chief Executive Officer of the Company, hereby certify, pursuant to 18 U.S.C. Section 1350, as adopted pursuant to Section 906 of the Sarbanes-Oxley Act of 2002, that to my knowledge: (1) the Report fully complies with the requirements of Section 13(a) or 15(d) of the Securities Exchange Act of 1934, as amended; and (2) the information contained in the Report fairly presents, in all material respects, the financial condition and results of operations of the Company.
Dated: June 7, 2018 /s/ Dan Bodner Dan Bodner President and Chief Executive Officer Principal Executive Officer
This certification accompanies this Report on Form 10-Q pursuant to Section 906 of the Sarbanes-Oxley Act of 2002 and shall not, except to the extent required by such Act, be deemed filed by the Company for purposes of Section 18 of the Securities Exchange Act of 1934, as amended (the “Exchange Act”). Such certification will not be deemed to be incorporated by reference into any filing under the Securities Act of 1933, as amended, or the Exchange Act, except to the extent that the Company specifically incorporates it by reference.
Exhibit 32.2
CERTIFICATION REQUIRED BY 18 U.S.C. SECTION 1350,AS ADOPTED PURSUANT TO SECTION 906 OF THE SARBANES-OXLEY ACT OF 2002
In connection with the Quarterly Report of Verint Systems Inc. (the “Company”) on Form 10-Q for the period ended April 30, 2018 (the “Report”), I, Douglas E. Robinson, Chief Financial Officer of the Company, hereby certify, pursuant to 18 U.S.C. Section 1350, as adopted pursuant to Section 906 of the Sarbanes-Oxley Act of 2002, that to my knowledge: (1) the Report fully complies with the requirements of Section 13(a) or 15(d) of the Securities Exchange Act of 1934, as amended; and (2) the information contained in the Report fairly presents, in all material respects, the financial condition and results of operations of the Company.
Dated: June 7, 2018 /s/ Douglas E. Robinson Douglas E. Robinson Chief Financial Officer Principal Financial Officer
This certification accompanies this Report on Form 10-Q pursuant to Section 906 of the Sarbanes-Oxley Act of 2002 and shall not, except to the extent required by such Act, be deemed filed by the Company for purposes of Section 18 of the Securities Exchange Act of 1934, as amended (the “Exchange Act”). Such certification will not be deemed to be incorporated by reference into any filing under the Securities Act of 1933, as amended, or the Exchange Act, except to the extent that the Company specifically incorporates it by reference.