vŠb – technical university of ostrava - vsb.czkatedry.fmmi.vsb.cz/opory_fmmi_eng/aem/metallurgy...
TRANSCRIPT

VŠB – Technical University of Ostrava
METALLURGY OF PURE METALS
Study support
Jaromír Drápala, Lumír Kuchař†
Ostrava, 2015

Title: Metallurgy of Pure Metals Author: Jaromír Drápala, Lumír Kuchař Issue: first, 2015 Number of pages: 227 Number of copies: -
Study document for the study branch of Material Engineering, Faculty of Metallurgy and Material Engineering
Translation of the study support was funded by project Operational Programme of Education for Competitiveness Title: ModIn - Modular Innovation of the Bachelor's and Master's Programs at the Faculty of Metallurgy and Materials Engineering VŠB - TU Ostrava No. CZ.1.07/2.2.00/28.0304 Implementation: VŠB – Technical University of Ostrava The project is co-financed by the ESF and the state budget of Czech Republic © Jaromír Drápala VŠB – Technical University of Ostrava
ISBN

v
Contents
INTRODUCTION............................................................................. IX
1. PURE METALS AND CLASSIFICATION OF THE METHODSOF PREPARATION OF PURE SUBSTANCES ............................. 1
1.1. Purity, properties and significance of pure substances .................................... 11.1.1. Methods of the description of purity ........................................................................... 31.1.2. Effect of impurities on the properties of substances .................................................... 4
2. GENERAL CHARACTERISTICS AND CLASSIFICATION OFMETHODS OF SEPARATION AND REFINING OF SUB-STANCES ............................................................................................ 9
2.1. Main methods of production of pure metals and substances ........................ 10
3. SORPTION...................................................................................... 163.1. Significance of sorption processes in the separation and refining of
substances ..................................................................................................... 163.2. Adsorption .................................................................................................... 163.3. Ion exchange, ion exchangers ....................................................................... 183.4. Chromatography............................................................................................ 24
4. EXTRACTION ................................................................................ 284.1. Physico-chemical nature of extraction and its importance ............................ 284.2. Mutual solubility of two liquids .................................................................... 294.3. Separation laws ............................................................................................. 314.4. Isothermal equilibrium in a ternary liquid system ......................................... 334.6. Extraction methods ....................................................................................... 374.7. Extraction systems ........................................................................................ 394.8. Application of extraction in the metallurgy of pure substances ........................
5. CRYSTALLISATION ...................................................................... 435.1. Crystallisation from solutions. Equilibrium, mechanism and kinetics of
crystallisation ................................................................................................ 435.2. Solubility of salts ........................................................................................... 445.3. Isothermal evaporation and crystallisation .................................................... 455.4. Cyclic separation of salts by crystallisation from solutions .......................... 455.5. Freezing-out .................................................................................................. 47
6. CRYSTALLISATION FROM MELTS .......................................... 486.1. Distribution coefficients in crystallisation ..................................................... 52
vi
6.1.1. Determination of the equilibrium distribution coefficients from phase diagrams ..... 536.1.2. The distribution coefficients of admixtures in copper ................................................ 556.1.3. Correlation dependence of distribution coefficients ................................................... 626.2. Interphase (kinetic) distribution coefficient .................................................. 646.3. The effective distribution coefficient ............................................................ 666.4. Criteria of the stability of the crystal–melt interface ..................................... 686.5. Directional crystallisation .............................................................................. 726.6. Zone melting .................................................................................................. 756.7. Mass transfer in crystallisation ...................................................................... 816.8. Crystallisation methods of refining and production of single crystals of
metals, alloys and special materials ............................................................... 846.8.1. General classification ................................................................................................. 846.8.2. The Bridgman method ................................................................................................ 886.8.3. Zone melting methods ................................................................................................. 886.8.4. Drawing the crystal from the melt .............................................................................. 916.8.5. Preparation of single crystals with a homogeneous or given distribution of
admixtures ................................................................................................................... 936.8.6. Verneuil method .......................................................................................................... 946.8.8. Preparation of single crystals from the solid phase-recrystallisation methods ......... 966.8.9. Preparation of crystals in zero gravity conditions ..................................................... 976.8.10. Rapid solidification ..................................................................................................... 97
7. EVAPORATION, CONDENSATION, TRANSPORTREACTIONS .................................................................................... 99
7.1. The theory of separation of compounds by evaporation and condensation .. 997.2. The relationship between the composition of the vapour and the solution . 1037.3. Change of the composition of solutions and vapours in relation to
temperature and composition–boiling temperature and composition–vapour pressure diagrams ............................................................................ 104
7.4. The physical–chemical nature of sublimation and distillation processes .... 1087.5. The removal of admixtures by evaporation in vacuum ............................... 1117.6. Principle of the rectification process ........................................................... 1127.7. Using rectification for the refining and separation of metals and
compounds .................................................................................................. 1157.8. Distillation by means of chemical transport reactions ................................. 1157.9. Distillation of metals by means of a reversible endothermic exchange
reaction ........................................................................................................ 1167.10. Distillation of metals through sub-compounds ............................................ 1187.11. Distillation by synthesis and dissociation of volatile compounds. Iodide
reaction ........................................................................................................ 1207.12. Suitability of the iodide process for different groups of metals .................. 123
8. ELECTROLYSIS ........................................................................... 1268.1. Significance of electrolytic method of separation and refining of metals ... 1268.2. The rate of the electrode process. Electrochemical and diffusion kinetics . 1268.3. Polarisation curves of reduction of cations ................................................. 130

vii
8.4. Simultaneous discharge of the ions of the main metal and admixtures ....... 1338.5. Conditions for the removal of admixtures in electrolysis ............................ 1348.6. Removal of nonmetallic admixtures from cathodic metals in electrolysis .. 1378.7. Anodic dissolution. Electrolytic refining of metals ..................................... 1388.8. Amalgamation method of separation and refining of metals ....................... 139
9. ELECTROTRANSPORT .............................................................. 1429.1. Refining of admixtures from solid metals by electrotransport .................... 1439.2. Refining of admixtures from metallic melts by electrotransport ................. 1459.3. Refining of metals by electrotransport through the oxide layer .................. 1469.4. Applications of electrotransport in zone melting ........................................ 148
10. DIFFUSION .................................................................................... 15110.1. Separation of gas substances by diffusion and thermal diffusion ............... 15110.2. High-voltage electrodialysis ........................................................................ 152
11. SELECTIVE PRECIPITATION, OXIDATION ANDREDUCTION ................................................................................. 154
12. DEGASIFICATION OF METALS ............................................... 15712.1. Gases in metals ............................................................................................ 15712.2. Vacuum refining of metals ........................................................................... 160
13. METHODS OF TESTING PURE METALS ............................... 16313.1. Analytical methods ...................................................................................... 16313.2. Gravimetry and titration .............................................................................. 16413.3 Polarography ............................................................................................... 16413.4. Emission spectral analysis ........................................................................... 16513.5. Absorption spectrophotometry .................................................................... 16613.6. Atomic absorption spectrometry (AAS) ...................................................... 16713.7. Fluorescence spectroscopy .......................................................................... 16713.8 Local microanalysis ..................................................................................... 16813.9. Radiometric methods ................................................................................... 16913.10. Determination of gases in metals ................................................................. 17113.11. Evaluation of analytical methods of determination of pure metals ............. 17213.12. Resistance of metals and semiconductors ................................................... 17413.13. Methods of examination of the structure and perfection of crystals ........... 176
REFERENCES ......................................................................................... 179SYMBOLS ................................................................................................ 190APPENDICES........................................................................................... 194INDEX ....................................................................................................... 225
ix
Introduction
New areas of advanced science and technology, for example, semi-conductors, microelectronics, optoelectronics, superconducting materials,vacuum technology, nuclear metallurgy, space industry and technology,require materials, metals and their special alloys and compounds withhigh chemical purity and defined physical and structural parametersand specific applied properties. These can be found and achievedmainly in high purity substances and elements with the basic pu-rity of the order of 6N (99.9999%) and higher, i.e., with the totalcontent of impurities and admixtures below 1 ppm (10–4%) and lower.
The metallurgy of pure metals is a subject of university coursesconcerned with the methods of refining in preparation of high pu-rity substances. Special attention is paid not only to the high de-gree of chemical purity attainable by chemical or physico-chemicalhydrometallurgical methods, such as sorption, extraction, crystallisationfrom aqueous solutions, electrolysis, and also by pyrometallurgicalmethods such as crystallisation from melts, evaporation, condensationand transport reactions, electro-transport, diffusion separation ofsubstances, removal of gases from melts and vacuum refining of metals.
In the production of high purity metals by crystallisation refin-ing methods, zone melting and directional crystallisation as the mainmethods of preparation of defined super purity metals, the controlledredistribution of the impurities and admixtures present in the mainsubstance also takes place at the melt-crystal interface in the sin-gle crystal state. The distribution coefficient is the main materialparameter which is in fact a measure of the distribution of the admixturein the crystallisation process. The determination of the distributioncoefficient, its properties and correlation with the proton numberof the admixture of the distribution coefficient is the subject of specialattention in this book. The Appendix summarizes the values of thedistribution coefficients in binary diagrams, mainly copper, aluminium,iron and its transformation, selected noble, refractory and radioactivemetals and lanthanides and semiconductors.
The book is concerned with a wide range of problems in theoryand practice of production of high purity metals not only for teaching

x
in the universities of the Czech Republic and Slovakia but also fortechnical practice and solution of the problems of applied and ba-sic research and examination of the reasons for the formation of primaryheterogeneities of castings and their testing.
The authors are grateful to Cambridge International Science Pub-lishing Ltd for publishing the book and to Victor Riecansky for trans-lating and editing the book. This book was written on the basis ofthe research project of the Ministry of Education, Youth and Sportsof the Czech Republic, No. 6198910013 ‘Processes of preparationand properties of high-purity and special refined structural mate-rials’ at the Faculty of Metallurgy and Materials Engineering of theVSB–Technical University of Ostrava.

1. PURE METALS AND CLASSIFICATION OF
THE METHODS OF PREPARATION OF PURE
SUBSTANCE
2. GENERAL CHARACTERISTICS AND
CLASSIFICATION OF METHODS OF
SEPARATION AND REFINING OF
SUBSTANCES
Time needed to study: 120 minutes
Aim: After studying this chapter
You will understand the importance and usefulness of preparation of highly pure materials. You will be introduced to the methods of classification of purity of substances. Thanks to many practical examples you will understand, why it is necessary to deal with
metallurgy of pure materials. You will know the effect of impurities on the properties of materials. You will be introduced to the principles of the separation of substances in order to enhance
their purity. You will be introduced to new terms from the field of pure substances preparation. You will know how to classify methods of refining processes. You will be able to classify the particular methods of the 1st and the 2nd refining stage. You will be introduced to principles needed for pure metals manufacturing processes.
Reading:

1
1. PURE METALS AND CLASSIFICATION OF THEMETHODS OF PREPARATION OF PURE SUBSTANCES
1.1. Purity, properties and significance of pure substances
A pure substance is a physically and chemically homogeneous substanceor a chemical compound consisting of a specific type of atoms orions or molecules and having only its own typical complex of constantproperties. Repeated refining operations are efficient only when theyresult in the efficient establishment of the properties of the puresubstances with the minimum number of operations.
The absolutely pure substance (this term relates to high puritymetals and semiconductors and also other materials as regards purity)exists only theoretically. In reality, it is possible to find substanceswhose purity approaches the absolutely pure substances to differentdegrees. It may be concluded that the closer the substance is to theabsolutely pure condition, the stronger is the effect of its singularproperties. When trying to attain absolute purity it is necessary toface insurmountable obstacles. As the number of the impurity atomsin a substance decreases it becomes more difficult to remove themand, consequently, with a decrease of the concentration there are alsochanges in the potential rate of removal of impurities up to infinity.With an increase in purity there are also problems with maintainingthe already achieved purity.
The aim of producing high purity metals is, for example, the effortto determine exact constants characterising the physical propertiesof these metals. For example, 100 years ago it was possible to produce,as a result of a significant effort, a small amount of high-purity Agwhich made it possible to determine more accurately its relative atomicdensity. This silver was used as an international reference material.In the Twenties of the former century, the method of fractionaldistillation (rectification) was used to produce pure zinc was the totalcontent of all impurities smaller than 0.05%. The increase of thepurity of metals does not influence only the physical properties ofmetals, for example, density, melting point T
m, boiling point T
b, etc.,
2
but also other properties, for example, electrical conductivity, corrosionresistance, and others, which are of considerable importance especiallyin technical applications of pure metals. In addition, in a numberof cases, an increase of the purity of metals results in the appearanceof new properties, such as heat resistance, formability, etc., whichwere unaffected or masked by even very small contents of interstitialand substitutional impurities presented in commercially produced and,consequently, commercial purity metal.
A frequent example mentioned in connection with the actual degreeof purity of metals and examination of its effect on the propertiesis usually represented by aluminium.
The melting point of aluminium TAlm increases up to a constant value
with an increase of the purity of aluminium. For example, aluminiumwith a content of 99.2–99.5% Al has a melting point in the range657–658 °C. Purer aluminium with 99.6% Al has a melting point of658.7 °C, and aluminium with a purity of 99.97% Al 659.8°C. Latermeasurements taken for pure aluminium with a content of99.996 % Al [7] gave a melting point of 660.24 °C, i.e. 933.4 K.The latest data [10] indicate a melting point of 660.452 °C for superpure aluminium.
Similarly, the degree of purity of aluminium also determines thedensity of aluminium: with increasing purity the density of aluminiumdecreases. For example, a metal with a purity of 99.25% Al has adensity of 2.727 kg dm–3 at 20 °C, at a purity of 99.4% Al it is2.706 kg dm–3, and at a purity of 99.75% Al it is 2.703 kg dm–3. Thedensity of pure aluminium with 99.971% Al is 2.6996 kg dm–3, andthat of high-purity aluminium with 99.996% Al is 2.6989 kg dm–3.
The recrystallisation temperature of formed aluminium dependsstrongly on its purity. Aluminium with a purity of 99.99% Alrecrystallises at 100 °C, but aluminium with a purity of 99.996%Al shows recrystallisation already at room temperature. Zone-refinedsuper pure aluminium [1,4] with a purity of 99.999% Al after formingat the temperature of liquid nitrogen (–196 °C) starts to showrecrystallisation already at a temperature of –50 °C.
An increase in the purity of aluminium also increases electricalconductivity, light reflection, formability and plasticity and also corrosionresistance. This results in new areas of application.
The increase of the importance of high purity substances has beenthe result of the development of new areas of technology, for example,nuclear technology, aerospace and also microelectronics andoptoelectronics, with special techniques of wave transfer and energyquanta and also memory or other properties of pure substances. In

3
these special areas it is not possible to ignore materials defined withrespect to purity, not only chemical, but also physical, dislocation-free, structural, nuclear, semiconductor, isotope, etc. Taking into accountthe areas of application, this type of purity can often be defined moreeasily as the purity for a purpose.
The purity for a purpose is defined from the viewpoint of the presenceof impurities unsuitable or, on the other hand, suitable for obtainingthe given or required properties. For example, silicon, used forsemiconductor applications, must contain a minimum concentrationof admixtures of the first, second, third, fifth and sixth group of theperiodic table of elements, and the relatively high concentration ofadmixtures of the fourth group (Ge) is not harmful, because this elementdoes not have any significant negative effect on the electrical andsemiconductor properties of the main element. A nuclear purity materialshould not contain admixtures unsuitable for nuclear application. Asan example, zirconium, used as a cladding material, should not containhafnium because of its high absorption cross-section with respectto thermal neutrons. The concept of isotopic purity describes the degreeof enrichment or separation of isotopes of a specific type, for example,separation of 238
92 U as an unfissionable isotope of natural or enriched
uranium from 92235 U as a fissionable isotope of uranium in processing
nuclear fuel. In the case of artificially prepared single crystals, itis necessary to evaluate their structural perfection, the angle ofdisorientation of grains and the density and distribution of dislocations.
1.1.1. Methods of the description of purity
In most cases, the chemical purity of metals or the concentrationof admixtures in the range of pure metals is described by a nine-point system proposed by van Arkel (see the table on page 4).
The designation of the concentration of impurities in ppm:1 ppm = 10–4 % of admixtures, i.e. the purity at which for 1 million(106) atoms of the main substance there is 1 atom of the admixture.For even lower concentrations, it is necessary to use the term ppb,i.e. parts per billion; 1 ppb = 10–7% of admixtures, i.e. for 1 billion(109) of the atoms of the main substance there is 1 atom of theadmixture. For super low concentrations of the admixtures, it isrecommended to use the unit ppt, i .e. parts per tril l ion,1 ppt = 10–10% of admixtures, i.e. for 1 trillion (1012) of the atomsof the main substance there is 1 atom of the admixture.
This extreme dilution is used in practice in the identification of

4
trace content of isotopes of radionuclides in the living environment.In this case, the unit ppt is used at present for the measurement ofexhalation of the radon isotope from soil (permission for building).For example, it is also used for accidental escape of substance fromthe fuel cycle a nuclear power station or contaminated gaseous productsor fission fragments.
Another method of definition of purity, in particular in semiconductortechnology, is the unit cm–3 which expresses the total number of theatoms of impurities and admixtures in 1 cm3 of the main semiconductor.The current requirements on the silicon suitable for microelectronicspermit the maximum total content of 1014 of all atoms of the admixturesin 1 cm–3 of silicon, which represents the purity of approximately8 N, i.e., approximately 10 ppb of the present impurities. Siliconwith a diamond-like structure has a lattice constant of a = 5.429 ·10–10 m, which represents a total of 5 · 1022 of silicon atoms in1 cm3. After doping with 1 ppm of a dopant (microalloying addition),5 · 1016 atoms of the admixture penetrate into Si. In this case, only1 atom of the dopant is available for 1 million atoms of Si. For thegiven purity of semiconductor Si of 8 N only ‘one’ atom of the harmfulimpurity is permissible for ‘one hundred million’ of Si atoms.
1.1.2. Effect of impurities on the properties of substances
Nuclear engineering requires functionally essential pure metals, startingwith uranium as the main and, at present, already classic nuclearfuel material, through coating materials, moderators, shielding materialsup to structural materials and alloys for the fabrication of differentparts of nuclear reactors. These materials must not or, on the other
noitangiseD )%(ytiruP )%(tnetnocytirupmI
N1N2N3N4N5N6N7N8N9N01N11N21
99–0999
9.9999.99
999.999999.99
99999.99999999.99
9999999.9999999999.99
999999999.999999999999.99
1–011
1.010.0
100.01000.0
10000.0100000.0
1000000.010000000.0
100000000.01000000000.0
mpp0001mpp001mpp01mpp1bpp001bpp01bpp1tpp001tpp01tpp1

5
hand, must absorb thermal neutrons which maintain the course of
the controlling fission reaction of 92235 U which, in addition to the energy
gain, produces 2 or 3 neutrons required for the further fission process.Therefore, nuclear fuel in particular should not contain admixtureswhich would absorb neutrons.
The suitability of different chemical elements for absorbing thermalneutrons is usually characterised by the effective cross-section forthe absorption of thermal neutrons σ
a (m2) which basically includes
part of the term nuclear purity. In this case, it is important to considerthe so-called isotope purity because generally efficient cross-sectionsfor the absorption of thermal neutrons of the individual isotopes ofthe same element mutually differ, sometimes by several orders ofmagnitude. For example, the value of σ
a for hydrogen isotopes
11H = 0.33 and 2
1H = 0.00055 · 10–28 m2, or in the case of tungsten
isotopes 19074
W = 10, 18274
W = 0.5, 18474
W = 0.0024 and for 18674
W =37 · 10–28 m2.
A typical example of nuclear purity is the application of zirconium,characterised by a small absorption efficient cross-section σZr
a =
0.18 · 10–28 m2, as a coating material of fuel elements. In the naturalcondition, zirconium contains 2–3% of hafnium which is its chemicalanalogue and always accompanies zirconium in the nature. Theabsorption efficient cross-sections of zirconium and hafnium mutuallydiffer by the ratio σZr
a: σHf
a ~1:600. This means that the almost trace
content of hafnium in zirconium makes the latter unsuitable forapplication in the natural condition in nuclear technology. Therefore,nuclear technology has necessitated the application of zirconium greatlydepleted in hafnium. Of course, this results in a need for the developmentof special methods of refining of zirconium, i.e. the removal of hafniumfrom zirconium. However, this has resulted in a number of quite seriousdifficulties because the chemical properties of zirconium and hafniumare very similar.
Another suitable example of nuclear purity is a structural materialof the primary circuits of nuclear reactors made of stainless steelcontaining nickel in which cobalt is usually present as a geneticaccompanying admixture. If stainless steel is used in chemical industry,the presence of Co is not detrimental. Co is characterised by a relativelylarge absorption efficient cross-section σCo
a = 35·10–28 m2 and the neutrons,
absorbed by cobalt, lead to the formation of the radioactive isotope6027
Co with the decay half-time of 5.2 years, which is characterisedby dangerous gamma radiation. Therefore, cobalt is undesirable withrespect of the absorption of neutrons, and also owing to the fact that

6
steels, subjected to long-term neutron radiation in thermal reactors,are also a source of high-intensity radiation of 60
27Co which from the
viewpoint of operation complicates simple maintenance and, also therepair of the reactor. Therefore, in the primary production of nickelit is necessary to include efficient, multistage refining to decreasethe cobalt content as the undesirable admixture in nickel in stainlesssteels used in reactors. Similarly, the presence of copper is also anundesirable factor. Under the effect of the neutron flux copper greatlydecreases the mechanical properties of structural components of thereactor.
In nuclear power engineering, in particular, in fast reactors, it hasbeen necessary to use metallic melts for the transfer of heat. Liquidmetals Na (tNa
m = 97.8 °C) or Li (tLi
m = 180 °C) or certain eutectic
Na–K alloys (with the eutectic temperature of approximately 11 °C)are characterised by low vapour tension at elevated temperatures andare used for the transfer of heat from the heated sections of the nuclearreactor. For these applications, the metals must be purified to removeinterstitial and metallic admixtures, i.e. they must be refined to ahigh degree of purity in order to prevent, in particular, pitting corrosionin steel pipes and exchangers.
In reactor and space technology, extensive use is made of importantheat-resisting, high-melting and, at the same time, high-toughnessand formability metals and pseudoalloys of metals such as titanium,very light but also toxic beryllium, and other metals. Satisfactoryformability of these metals, which is an essential condition for formingthese metals, can be achieved only after deep refining to removeadmixture elements resulting in brittleness of the metals, such as,for example, interstitial elements oxygen, nitrogen, hydrogen, andcarbon. Therefore, operation with beryllium is carried out in protectivesuits in an inert medium.
Applications in microelectronics include the use of many typesof high-purity and structurally defined materials, including elementarysemiconductors or intermetallic phases and chemical compounds. Therequirements on the refining of semiconductor materials to removeadmixtures are extremely high. The semiconductor materials includea number of the highest purity compounds, primarily silicon andgermanium, and also the elements forming semiconductor compoundsof the type AIIIBV such as AlSb, GaAs, GaP, InP, type AIIBVI such assulphides, oxides, selenides, tellurides CdTe, CdS and AIBVII and manymore complicated (Bi
2Sb
3) and ternary (Cd
xHg
1-xTe) or polycomponent
compounds of various elements. In the technology of preparation ofmicroelectronic semiconductor components special attention is given,

7
in addition to microalloying, to the diffusion processes to ensure theformation of p–n junctions, and also to the epitaxy and evaporationof superfine chemically and structurally defined nanolayers. Thesetechnologies require extremely high purity of the initial compoundsand chemical substances.
Semiconductor materials have replaced in electronics vacuum valvesused as rectifiers, have enabled the direct conversion of thermal andlight energy, for example, the conversion of solar to electric energy.In addition, semiconductors have been used to solve a number ofproblems in the area of automation and remote control, they are playingthe functions of memory components in computing technologies, etc.This list must be supplemented by the area of miniaturisation inmicroelectronics and other special branches. In order to evaluate theimportant role played by the semiconductors at the present time andin future technologies, it is necessary to examine the problems asto why it is necessary to carry out the efficient refining of semiconductormaterials to remove impurities to the highest possible and obtainabledegree of purity.
Conductivity is divided into hole and electron conductivity. However,semiconductor crystals often genetically contain in many cases impuritiesand admixtures whose presence, already in the trace amount, has asignificant negative effect on the change of the electrical propertiesof the semiconductor. Depending on the nature of the atoms of theadmixture, the semiconductor may be characterised by the formationof a surplus of electrons or by a shortage of electrons, i.e. the formationof holes.
The intensity of the effect of the admixtures on the electricalconductivity of semiconductors may be indicated by the fact that 1%of the atoms of the admixture may increase the conductivity of thesemiconductor at room temperature by up to 1 million times. Therefore,when refining the semiconductor compounds to remove the admixtures,it is necessary to eliminate random admixtures to enable in subsequentmetallurgical treatment intentional alloying of the compounds evenwith a very small or defined content of the admixture elements ofthe p- or n-type. This microalloying is carried out to ensure the requiredsemiconducting properties of the compounds. The high degree of puritymust be characteristic not only of the actual semiconductors, suchas germanium and silicon, but also of a large number of metallicelements and non-metals used either for the microalloying of germaniumor silicon, the formation of superfine layers by epitaxy or evaporation,or for the synthesis of intermetallic compounds with the semiconductingproperties, and also for compounds using semiconductor technology

8
such as contact materials, solders and conducting parts or joints.In addition, it is also important to describe the area of electronic
devices and equipment operating in the conditions of deep vacuum(10–3 to 10–8 Pa). In addition to the general high purity of the materialsused for the fabrication of this type of equipment, it is also necessaryto ensure the minimum gas content of electrically conducting andhigh-melting metals, such as for example, Cu, Ni, Co, Ag, W, Mo,Ta, etc. The extremely low gas content is important not only for ensuringhigh vacuum in equipment (for example, i.e. on ion pumps coatedwith a gold layer) but also for ensuring their long life and long-termreliability (for example, in space technology).
9
2. GENERAL CHARACTERISTICS ANDCLASSIFICATION OF METHODS OF SEPARATION
AND REFINING OF SUBSTANCES
In order to obtain high-purity metals and semiconductor compounds,it is necessary to carry out deep refining of the main component toremove admixtures. Therefore, it is essential to use the efficientcombination of the methods based on different physical, chemicaland physical–chemical properties of substances, ensuring the separationof impurities and admixtures from the main compound. In particular,the problem of refining and purification is very complicated in casesin which the refined material and the admixture are characterisedby very similar physical–chemical characteristics, and when thebehaviour of the compound of these metals in a specific chemicalor physical process is similar. These problems must be examined indetail when it is necessary to carry out separation or purificationof various couples of metals, such as zirconium and hafnium, niobiumand tantalum, tungsten and molybdenum and, in particular, in theseparation of rare earth metals, spent nuclear fuel, etc.
The methods used in current technology used for the preparationof high-purity materials are many and are often based on a smalldifference of the physical–chemical properties and behaviour of boththe actual elements and compounds of these elements. For the separationof the admixtures and impurities from the metals and semiconductors,it is necessary to use hydrometallurgical and also pyrometallurgicaland electrometallurgical methods and techniques based on:– the different solubility of the individual elements or their compounds
(liquid extraction, crystallisation from the solution, directionaland zone crystallisation from melts, selective precipitation, dissolutionof gases in metals);
– the different volatility of elements and their compounds (distillation,sublimation, rectification, iodide refining, vacuum refining);
– the difference of ionisation potentials (distillation in the form ofsub-compounds);
– electrochemical distribution potentials (electrolysis, electrolyticrefining, amalgamation electrolysis);

10
– sorption characteristics (adsorption, ion exchange, chromatography);– the difference of the oxidation and reduction potentials (selective
oxidation and reduction);– diffusion rate (separation of the isotopes on cascades);– electromagnetic properties (separation in a magnetic field).
A concentration gradient of the admixtures in the adjacent phasesalways appears:– during extraction in two liquid phases;– during solidification the difference in the composition of the
liquid and solid phases at the crystal–melt interface;– during distillation the difference in the composition of the
liquid and gas phases.Consequently, there is a large number of refining processes which
must be combined when selecting the most suitable procedures foreach specific basic substance.
2.1. Main methods of production of pure metals andsubstances
1. Evaporation and condensationSeparation of highly volatile Evaporationsubstances and impuritities Distillation
SublimationSeparation of evaporated main Fractional distillationcomponent or condensationSeparation of mixtures by Rectificationre-distillation Transport reactions
2. Separation between two phasesSeparation between solid and Zone meltingliquid phase of main component Directional crystallisation
Freezing-outSeparation between two solvents Liquid–liquid extraction
3. Separation on the basis of different solubilityFractionated crystallisation
4. Exchange reactionsIon exchangeChromatography
5. Chemical reactionsSeparation of non-noblecomponents by oxidation Partial chlorination refiningReduction by gases Reduction by hydrogen, CO,
CH4, etc.

11
DeoxidationElectrochemical reduction Electrolysis of aqueous solutions
Amalgamation electrolysisSalt melt electrolysis
Reduction by metals MetallothermyThermal dissociation Dissociation of iodides
Below, we propose the classification of the main processes of refiningmetals and certain substances to remove impurities and admixtures[7]. In this classification of the refining procedures for the separationand refining of substances, the processes are divided into groups 1to 8 on the basis of the physical–chemical properties utilised in theseparation of components.1. Sorption– adsorption– ion exchange– chromatography2. Extraction– liquid extraction3. Crystallisation– crystallisation from solutions– crystallisation from melts– directional crystallisation*– zone melting*– freezing-out4. Evaporation and condensation– sublimation– distillation– rectification*– distillation by means of transport chemical reactions*5. Electrolysis– electrolytic precipitation with preliminary cleaning of the electrolyte*– electrolytic refining*– amalgamation electrolysis*– electric transfer*6. Diffusion– diffusion– thermal diffusion– high-voltage dialysis7. Selective precipitation, oxidation and reduction– selective precipitation– selective oxidation and reduction

12
8. Removal of gases– vacuum extraction– electron beam melting*
Comment: the processes indicated by * are used for higher degrees ofrefining.
This classification is simple and natural. However, a significantdisadvantage is that one typical group may contain processes completelydiffering in their nature. For example, the group of the distillationprocesses, in which the components are separated on the basis oftheir different volatility, include both simple distillation and sublimationprocesses and also more complicated processes of the type ofrectification or transport reactions.
The individual refining processes may be used in appropriatecombinations either directly for elements and also for chemicalcompounds of these elements. It should be mentioned that if a simplesubstance is characterised by a high boiling point and efficientdistillation of this substance would be difficult, this substance canbe transformed into a component which can be distilled far moreefficiently. For example, the melting point of Ga is 29.8 °C but Gais characterised by a very low vapour tension to temperatures of~1500 °C. This is greatly inconvenient for the distillation operations,but Ga can be transformed to, for example, trichloride GaCl
3, with
a boiling point of 201.3 °C, and purification of this component bythe distillation method can be carried out quite easily and using asimple procedure: from the refined chloride, the metal can be precipitatedby electrolysis from the aqueous solution or reduced by hydrogen.In all cases in which it is not possible to purify the simple substanceor compounds as such, they can be defined by transformation to anintermediate component. This intermediate component is subsequentlyefficiently purified and then transformed back to the initial substance(for example, the reaction utilising subchlorides of refining metalsin transport reactions).
In order to produce pure metals and semiconductor materials,purification is usually carried out in two stages:
1. Deep purification of chemical intermediate compounds resultingin the formation of pure metals and semiconductors;
2. Additional refining of the resultant metals and substances.The first stage of purification of the substances is based mainly
on the processes of hydrometallurgy; electrometallurgy and distillation:1. Absorption and ion exchange
13
2. Extraction with organic solvents, liquid extraction3. Re-extraction4. Multiple precipitation of elements in the form of low-solubility
compounds5. Precipitation of admixtures from solutions6. Multiple recrystallisation from solutions7. Electrolytic refining from aqueous or organic electrolytes8. RectificationThe products of the first stage of purification are usually chemical
compounds, cathodic metals, powder metals and distilled compoundswith a commercial purity of up to 3 N.
The second stage of purification is characterised in most casesby a combination of pyrometallurgical and electrometallurgicalprocedures:
1. Electrolytic refining of aqueous or organic electrolytes or salt melts;
2. Distillation and rectification3. Distillation through sub-compounds and subsequent reduction4. Thermal dissociation of unstable compounds5. Directional crystallisation6. Zone melting7. Electron beam melting in high vacuum for separation of volatile
admixtures and gases, plasma melting, ion melting in inert orreaction inert atmospheres, etc.
In some cases, it is possible to obtain approximately the same resultin the refining metals using different purification methods. For example,to obtain aluminium with a purity of 99.999 to 99.9999 % Al fortransitional contacts of silicon power rectifiers, one can use eitherthe zone refining of electrolytically refined metal or distillation inthe form of a sub-component, or additional electrolytic refining ininorganic solvents.
An important aspect is the selection of the most efficient purificationmethod on the basis of the required properties of the produced materialand the productivity of methods for each specific refining case.
However, in most cases it is not possible to obtain the requiredresults in purification of metals and semiconductors using only onemethod in each purification stage and, consequently, it is necessaryto combine efficiently the individual refining methods. This is especiallythe case in the mutual separation or refining of rare earth metals(lanthanides) where, because of the differences in the required propertiesand defined purity, it is necessary to combine efficiently the hydro-metallurgical extraction and ion exchange methods with the methods

14
of fractional crystallisation and methods of electrolytic refining insalt melts, pyrometallurgical methods of selective oxidation and metal-thermic reduction should be combined with methods of selectiveevaporation and condensation with the methods of zone refining andpreparation of crystals of the individual lanthanides with a defineddegree of purity.
The rules which must be maintained in the processes of preparationof pure metals:1. The individual stages of the refining processes must be selected
in such a manner as toa) ensure that it would be possible distinguish continuously during
refining processes the chemical, physical–chemical and physicalproperties of refined substances;
b) ensure that the number of the individual basic operations, resultingin the required purity of the substances, is as small as possiblefor the given combination;
2. The processes must be easy to realise from the technical viewpoint:a) if resistant structural materials are not available, it is necessary
to find a solution preventing contact between the walls of equipmentand refined metal at higher temperatures;
b) it is important to prevent the penetration of impurities (contamination)from the surrounding environment and from the atmosphere.
3. Purification must be carried out as long as possible by the chemicalmethod
a) it is necessary to prefer processes with a low consumption of chemicalagents
b) it must be possible to produce chemical agents with high purity;c) it is important to ensure efficient capture of waste.4. The refining of substances to remove the most powerful impurities
must be started as soon as possible, but not too early because theattained purity should be maintained
5. The processes of production must be characterised by highproductivity, economic efficiency and safety
6. It is necessary to ensure a continuous working procedure withcontinuous production.

15
dohteM lateM
latoTfotnetnoc
seitirupmi)mpp(
dohteM lateM
latoTfotnetnoc
seitirupmi)mpp(
htiwnoitadixOsnoitidda
gMnM
tPuA
010103
03–02
fonoitaicossiDsedidoi
rZfHrChTlA
001051002001
03
lanoitcarFnoitallitsid
dCgM
nZaC
KiLaN
0150101
03–010101
sisylortcelE
gnitlemenoZ
gnitlemmuucaV
uCeFaGiSeGuCeFiN
010011.0
10.010.0
010101
Table 1 Approximate purity of metals obtained in selected refining methods

Summary of terms:
Definition of high purity substances Pure material Technical and purpose purity (semiconductor, isotopic, technical, nuclear purity) Significance of pure substances Description of purity by van Arkel Effect of impurities on the properties of substances General characteristics and classification of separation and refining methods First and second stages of purification of the substances Rules maintained in the processes of pure metals preparation Principles of physical and chemical processes of the separation of substances Classification of separation and refining methods Extraction, sorption, crystallization, evaporation and condensation Electrolysis, diffusion, selective precipitation, oxidation and reduction Removal of gases
Questions:
After studying this chapter you will be able to clear up the following terms: 1. What does the subject “Metallurgy of pure metals“ include? 2. Define the term “pure substance”. 3. What is the difference between technical and purpose purity? 4. What types of purpose purity do you know? 5. Specify a negative influence of admixtures and impurities in nuclear technology. 6. Specify a negative influence of admixtures and impurities in semiconductor technology. 7. What is the influence of impurities on physical, chemical and mechanical properties of
materials? 8. What principles are used in the metallurgy of pure metals for refining of substances? 9. Classify the particular basic procedures of refining of substances. 10. Which methods belong to the first stage of purification of substances? 11. Which methods belong to the second stage of purification of substances? 12. What are the rules maintained in the processes of pure materials manufacture?
Exercises for solving:
1. How many percent of impurities are in a substance designated as 4N7? 2. What level of purity has a substance containing 5 ppb of admixtures? 3. How many atoms of impurities are in 1cm3 of silicon containing 5 ppb of dopants
(admixtures) with conductivity of “n” type? Which admixtures these probably are?
3. SORPTION
4. EXTRACTION
Time needed to study: 240 minutes
Aim: After studying this chapter
You will know principles of sorption processes in the separation of substances You will be introduced to the methods of the adsorption, ion exchange and chromatography You will know the principles and importance of the extraction in the separation of substances You will understand the significance of mutual solubility of two liquids You will be introduced to the separation laws in the extraction (separation constant,
separation ratio) On the basis of the binodal curve in the ternary system, you will understand the way of
separating the particular components between phases You will be introduced to the practical methods for performing the extraction Some extraction systems for analytical purposes and for obtaining pure substances for many
metals will be presented using a lot of examples ¨
Reading:

16
3. SORPTION
3.1. Significance of sorption processes in the separationand refining of substances
Sorption is a process characterised by the absorption of gases, vapoursor dissolved substances by the sorption agent, i.e. the sorbent, atthe liquid–gas, solid–gas or solid–liquid interface. Sorption includesboth adsorption, characterised by bonding on the surface of the solidor at the phase boundary, and absorption, characterised by absorptionby the entire volume of the sorbent. The processes represent the basisof the methods of adsorption, ion exchange and chromatography [11].Sorption is used extensively in the separation of rare earth metals–ion exchange, separation of zirconium and hafnium, extraction ofuranium from highly diluted solutions of uranium compounds, thepreparation of demineralised (deionised) water for semiconductortechnology, selective separation of the individual admixtures fromthe solutions of the main substance, etc.
3.2. Adsorption
Adsorption is a process taking place on the surface of the solid substanceor liquid (adsorbent) based on the increase of the surface concentrationof the molecules of the adsorbed substance (adsorbate) which maybe represented by a gas or a substance dissolved in the solution. Theadsorption of the molecules of the adsorbate on the adsorbent is causedby binding forces between the particles of the surface of the adsorbentand the molecules of the adsorbate falling on the surface. The bondedmolecule remains on the surface for a specific period of time, referredto as the dwell time, which depends on the bonding energy andtemperature. The molecules, adsorbed on the surface, result in theformation of a gas layer with special properties: the adsorbed moleculesduring the dwell time carry out random thermal motion in relationto the plane of the surface. On the surface of the adsorbent thereare absorbed substances decreasing its surface tension in relationto the surrounding medium. To obtain a strong adsorption effect, it

17
is necessary to ensure the maximum possible surface of the adsorbent;the materials with a highly ragged surface, porous and spongy substancesare suitable for this purpose.
The most frequently used adsorbents in practice include speciallyprocessed active coal (charcoal or animal charcoal) with high porosityand, consequently, the extremely large surface of the pores. For example,the internal surface of pores in 1 g of efficiently absorbing activecoal reaches 400–900 m2. The nature of porosity is also important.When producing pure compounds of metals, semiconductor materialsand some other substances, good results are obtained with highlyporous or highly dispersed silica gel, clay, kaolin, and some otheralumosilicates.
If the bonding absorption forces are relatively low, the adsorbedmolecules and, consequently, surface particles, retain their individualproperties. This is physical absorption. When, during absorption, amolecule receives or transfers an electron or dissociates into an atom,which is chemical bonded with the surface particles, chemisorptiontakes place. In chemisorption, bonding is far stronger and the appropriatevalues of the absorption heat are relatively high. Chemisorption hasthe nature of a chemical reaction and the absorption heat correspondsto the reaction heat of this reaction.
The amount of the dissolved substance, adsorbed by a certain amountof the given adsorbent, depends on the nature of the dissolved substanceand, consequently, the conditions of the process, i.e. the concentrationof the dissolved substance and temperature. The dependence of thesurface concentration of the molecules in absorption on the volumeconcentration of the molecules above the surface of the adsorbentin the equilibrium condition is described by absorption isotherms(Fig. 1). The maximal amount of the substance adsorbed by the givenamount of the adsorbent at the moment of its saturation (region IIIin Fig. 1) characterises the absorption capacity of the adsorbent. In
Fig. 1 Adsorption isotherm.
Concentration ofsubstance in solution
Co
nce
ntr
atio
n o
fa
dso
rbe
d s
ub
sta
nce
18
absorption from the solutions, the substances characterised by a lowersolubility in the given solvent are usually characterised by strongerabsorption.
Absorption is utilised in analytical methods, in separation of mixtures,separation of dissolved compounds from solutions, in vacuum technology,and in catalytic reactions.
3.3. Ion exchange, ion exchangers
The methods of ion exchange are based on the reversible exchangeof ions between the external liquid phase and the solid ion phase.The solid phase consists of an insoluble but permeable polymer networkor crystal lattice, containing bonded groups with a charge and mobilecounter-ions with the opposite charge. These counter-ions may besubstituted by other ions from the external liquid phase. If selectiveexchange forces operate, enrichment with one or several componentstakes place. The method is suitable for substances which are at leastpartially ionised [12].
Ion exchangers (ionex, ionite) are macromolecular, networkcompounds with a suitable grain size, containing a large number ofion groups as substitutes on the framework of the polymer, capableof exchanging counter-ions.
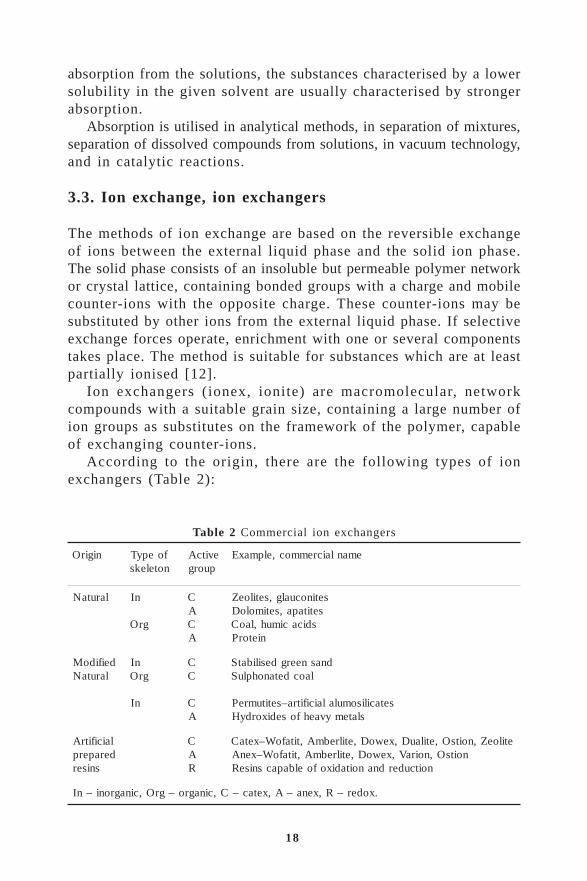
According to the origin, there are the following types of ionexchangers (Table 2):
Table 2 Commercial ion exchangers
nigirO foepyTnoteleks
evitcApuorg
emanlaicremmoc,elpmaxE
larutaN nI
grO
CACA
setinocualg,setiloeZsetitapa,setimoloD
sdicacimuh,laoCnietorP
deifidoMlarutaN
nIgrO
nI
CC
CA
dnasneergdesilibatSlaocdetanohpluS
setacilisomulalaicifitra–setitumrePslatemyvaehfosedixordyH
laicifitrAderaperp
sniser
CAR
etiloeZ,noitsO,etilauD,xewoD,etilrebmA,titafoW–xetaCnoitsO,noiraV,xewoD,etilrebmA,titafoW–xenA
noitcuderdnanoitadixofoelbapacsniseR
.xoder–R,xena–A,xetac–C,cinagro–grO,cinagroni–nI
19
Natural – compounds present in nature, mineral ion exchangers, humicacids.
Modified natural substances – stabilised green sand, coal–cellulose.Artificially prepared substances – artificial alumosilicates, organic
and resin ion exchangers.On the basis of the origin and properties of the functional groups,
the ion exchangers can be divided into:Cation exchangers – cation exchange resins, containing acid functional
groups;Anion exchangers – anion exchange resins, containing basic functional
groups;Amphoteric ion exchangers –mixed, containing both types of
functional groups on the same macromolecular frameworkRedox resins, redox ion exchangers – conventional ion exchangers
cap ions capable of oxidation and reduction, redox ion exchangers-resins containing the group capable of reduction and oxidationbonded directly on the polymer framework of the resin
Selective ion exchangers – containing active groups capable ofreacting only with a small group of the ions, in the ideal caseonly with one type.
According to the external form:granular – spherical particles, pearl-shaped particles, or networks
of an irregular shape, the size of the particles from several millimetresto 10–2 or 10–3 mm;
non-granular – ion exchangers in the form of membranes, filters, papers,fibres, foam, sheets, cloth, etc.The artificially produced ion exchangers based on synthetic resins
produced by polycondensation or polymerisation are used on anincreasing scale because of their excellent properties, for example,high exchange capacity, chemical resistance and mechanical strength.Their structure is similar to plastics and electrochemical activity isthe result of the introduction of active groups. The skeleton is formedby open carbon or cyclic chains. Modern ion exchangers contain asthe matrix, for example, polystyrene with a certain amount of divinylbenzene. The most important exchange active groups in organic ionexchangers are:cation exchangers: active group: sulphonic (–SO
3H), carbonyl (–COOH),
phosphonic (–PO/OH/2), hydroxyl (–OH), arsonic (–AsO/OH/
2)
anion exchangers: active group primary amine (–NH2), secondary amine
(–NH); (–NH+/CH3/
3) group
amphoteric exchangers: active group (–N/CH2A–COOH/
2), (HO
3S –
matrix –N+/CH3/
3)

20
The reactionCation exchangers: RH Na RNa H+ ++ + (1)Anion exchangers: 2 24
22 4 lRCl SO R SO C+ +− − (2)
Amphoteric ionexchangers: HR OH KCl KR Cl H O2 2 2+ + (3)
where R is the carrier – the skeleton of the exchanger with ions.The ion exchange between the solution and the exchanger is reversible.
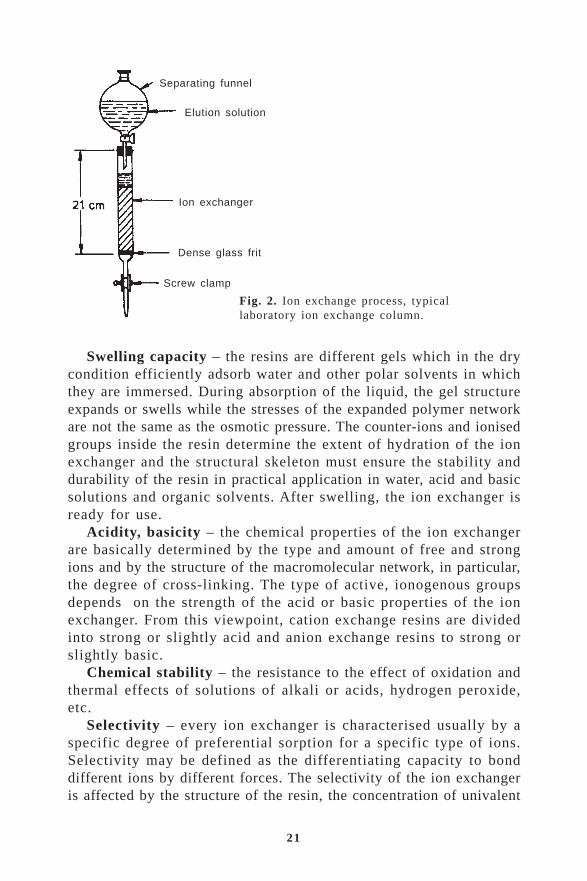
The ion exchange process takes place in the majority of cases ina vertical column represented by, for example, a glass tube of suitabledimensions filled with an ion exchanger, with the supply of a liquidmedium on the surface of the column of the exchanger, Fig. 2.
The dynamic method of application of the ion exchangers consistsof three stages:– sorption in the column – the exchange of the ions between the
solutions supplied into the column and the ions originally bondedby the exchangers with a possible addition of a complex makingagent to ensure selective sorption;
– rinsing the column of the exchanger in order to complete sorptionwith water or another solvent in order to rinse-out the remainderof the original solution;
– desorption – elution, i.e. reversed displacement of the ion, bondedon the ion exchanger, by means of a suitable elution solution. Duringelution, the eluent with the content of one or several types of ionsadsorbed in the column in the first stage of the exchange cycleflows out of the column. The suitable composition of the dilutionsolution can also be obtained by the so-called selective elution,i.e. the case in which only one type of ions is released from themixture of the ions sorbed by the ion exchangers. As a result ofelution, the ion exchanger is returned back to the working condition.In the ion exchange, one equivalent of a different ion with the
same type of charge is released by the ion exchanger into the solutionper every equivalent of the specific ion, and adsorbed from the solution.
Physical-chemical characteristics of ion exchangers
Exchange capacity is the content of counter-ions or the capacityto retain the counter-ions in the unit volume or unit mass of the resin.The total capacity is the theoretical value for a specific material andcan be calculated from the number of functional groups in the massunit of the dry substance.
21
Swelling capacity – the resins are different gels which in the drycondition efficiently adsorb water and other polar solvents in whichthey are immersed. During absorption of the liquid, the gel structureexpands or swells while the stresses of the expanded polymer networkare not the same as the osmotic pressure. The counter-ions and ionisedgroups inside the resin determine the extent of hydration of the ionexchanger and the structural skeleton must ensure the stability anddurability of the resin in practical application in water, acid and basicsolutions and organic solvents. After swelling, the ion exchanger isready for use.
Acidity, basicity – the chemical properties of the ion exchangerare basically determined by the type and amount of free and strongions and by the structure of the macromolecular network, in particular,the degree of cross-linking. The type of active, ionogenous groupsdepends on the strength of the acid or basic properties of the ionexchanger. From this viewpoint, cation exchange resins are dividedinto strong or slightly acid and anion exchange resins to strong orslightly basic.
Chemical stability – the resistance to the effect of oxidation andthermal effects of solutions of alkali or acids, hydrogen peroxide,etc.
Selectivity – every ion exchanger is characterised usually by aspecific degree of preferential sorption for a specific type of ions.Selectivity may be defined as the differentiating capacity to bonddifferent ions by different forces. The selectivity of the ion exchangeris affected by the structure of the resin, the concentration of univalent
Fig. 2. Ion exchange process, typicallaboratory ion exchange column.
Separating funnel
Elution solution
Ion exchanger
Dense glass frit
Screw clamp

22
ions and the valency of another ion. During charging operations,including the exchange of the counter-ions of the resin in the hydrogenform of the ions M with charge n from the solution of an electrolyte,the following reaction takes place:
H R M M H/S/ / / / / / /+ − + − ++ +1 1
n nn n
n SN NR (4)
where R are the negatively charged exchange groups in the resinnetwork, the argument /N/ indicates the solution, the argument /S/the solid phase. Equilibrium is established when there are no longerstatistical changes in the ratio Mn+/H+ in the resin phase. In equilibrium,the concentrations of the ions in the solution and the ion exchangerare determined by the selectivity coefficient K
HM/n which is also referred
to as the concentration exchange constant:
KHM/n
n+/R/
+
+/R/
n+=
[M ] [H ]
[H ] [M ] (5)
where /R/ is the resin phase. The selectivity coefficient expressesthe selectivity for the ions of Mn+ in relation to the hydrogen ionsfrom the solution containing the equivalent concentration of boththese ions. As a suitable example, one can mention the selectivityof certain ions from a Dowex ion exchanger:
M/nHK For univalent ions: Li<H<Na<NH
4<K<Rb<Cs<Ag
For bivalent ions: Mg<Zn<Co<Cu<Cd<Ni<Mn<Ca<Sr<<Pb<Ba
For trivalent ions: Cr<Ce = LaAccording to this sequence, the sorption capacity of the ions by thegiven ion exchanger decreases.
The distribution coefficient of ion exchange KI is the ratio of
the number of ions in the resin CM/R/
in grams to the number of theions in the solution C
M/N/ expressed in ml:
M/R/
M/N/
C=
CIK (6)
In exchange of ions with different charges, the distribution coefficientdepends greatly on the concentration of the external solution andincreases with dilution of the solution. For example, in the exchangeof a bivalent ion by an univalent ion, the concentration of the univalentions increases and the univalent ion enters the resin and displacesthe bivalent ion. In the case of a cation exchange resin, this favourablesituation makes it possible to regenerate the ion exchange resin byhydrogen or sodium ions after saturation of the resin with calcium

23
or magnesium ion. This takes place in, for example, softening ordeionisation of water.
If a certain amount of an ion exchange resin populated by the ionsA is introduced into the solution of an electrolyte containing ionsB, a certain proportion of the ions A in the resin is substituted bythe ions B and the same amount of the ions B in the solution issubstituted by the ions A:
/R/ /N/ /N/ /R/A + B A + B (7)
/R/ is the ion exchange resin, /N/ is the solution.The graphical representation of ion exchange is the exchange
isotherm, Fig. 3, which is the dependence of the equivalent fractionof the ions A in the ion exchange resin on the equivalent fractionof the ions A in the solution. The equilibrium exchange isothermspecifies the proportion of one of the two competing ions as a functionof the proportion of the equivalent of this ion in the solution. Inthis case, the division factor for the selective condition is given bythe ratio of the areas I and II that come into contact at theappropriate point of the isotherm.
The efficiency of ion exchange, i.e. the degree of purification ofthe solution and the rate of the process, depends on the propertiesof the ion exchange resin, the condition of saturation with the counter-ions, the grain size, the composition of the supplied solution, thesize of the column, the flow rate of the solution, and temperature.The best results are obtained with a low flow rate of the solutionfrom the column, the smaller grain size of the ion exchange resin,the low concentration of admixtures in the solution, high temperatureof the solution, a high value of the ratio of the height of the columnto its cross-section.
Ion exchange is used in the following applications in the metallurgyof pure substances and also environmental protection:– the deep purification of the solution of salts of refined elements
to remove admixtures;– the separation of two elements, with one of the elements remaining
in the solution and the other element adsorbed by the ion exchangeresin (Zr–Hf, Ta–Nb, Pr–Nd, separation of lanthanides, actinides,);
– concentration or obtaining an important element in ion exchangeresin from a large volume of the diluted solution (Au, U);
– preparation of deionised and demineralised water for semiconductortechnology;
– removal of harmful substances from industrial effluents;

24
– extraction of the required ions of metals from waste industrialsolutions.
3.4. Chromatography
Chromatography also belongs to sorption processes and is used forthe deep purification of substances in metallurgy, chemical technology,analytical chemistry, biology, etc. All the chromatographic methodsare based on the different speed of movement of the components ofthe mixture through a porous sorption medium. The components tobe separated are distributed between two phases, where one of thephases is stationary, is characterised by a large volume of surface,and forms the ‘bed’ of the chromatographic column, whereas the otherphase is fluid, mobile, and passes through or along the stationaryphase. The transfer of mass between the moving and stationary phasesis caused by the fact that the molecules from the mixture are adsorbedon the surface of the particles or in pores, or transfer into the layerof the liquid on the surface or inside the pores.
The separation of the components of the specimens is based onthe fact that the speed of movement of individual dissolved moleculesthrough the column or a thin layer of the sorbent depends directlyon the distribution coefficient of the components, which is the ratioof the equilibrium concentration of the components in the stationaryphase to the concentration of the components in the moving phase.The distribution coefficient of chromatography of each componentdetermines its content in the moving phase at any time and, consequently,the time during which the component remains in the stationary phase.This time subsequently determines the delay or a decrease in the speed
Fig. 3 Ion exchange isotherm.Equivalent fraction of ions Ain solution
Eq
uiv
ale
nt
fra
ctio
n o
f io
ns
Ain
io
n e
xch
an
ge
r1.0
0.5
0 0.5 1.0
25
of movement of the dissolved substance. If the differences in selectivedeceleration are significant, each component moves through the columnor along the thin layer of the stationary phase at the speed whichdepends on its special sorption properties. If the components areseparated, they leave the column at different times. The columns arefilled with a fine-grained powder material of the same grain size,with the characteristic surface layer of the stationary phase whichmay have the following nature:– adsorption – adsorption chromatography– ion exchangers – ion exchange chromatography– gel with the defined micropores – gel chromatography– the thin liquid film – separation chromatography
The complete separation of the components of the mixture is obtainedas a result of the so-called elution development of a chromatogram.A small amount of a mixture is placed in the upper part and a mobilephase is introduced into the column at a continuous, constant rate.This phase is represented either by a gas (gas chromatography) ora liquid – liquid chromatography. The mobile phase carries the individualcomponents of the mixture at different rates, the components are delayedby the stationary phase with different efficiency, i.e. the values ofthe distribution coefficient of chromatography differ. From the column,the components leave more or less separated in the eluate (solution).The efficiency of separation of two substances increases with an increaseof the difference of the elution time and volume and with a decreaseof the weight of the elution peaks of the chromatogram, Fig. 4.
Adsorption chromatography is based on the application of theadsorbent as a stationary phase. In adsorption, intermolecular forces,for example, van der Waals forces, electrostatic forces between thedipoles, etc, operate.
The separation of polar substances is carried out using polaradsorbents, for example, silica gel or aluminium oxide, whereas theseparation of non-polar substances is carried out using non-polaradsorbents, for example, active coal. Other adsorbents include cellulose,kaolin, talc, B
2O
3, graphite.
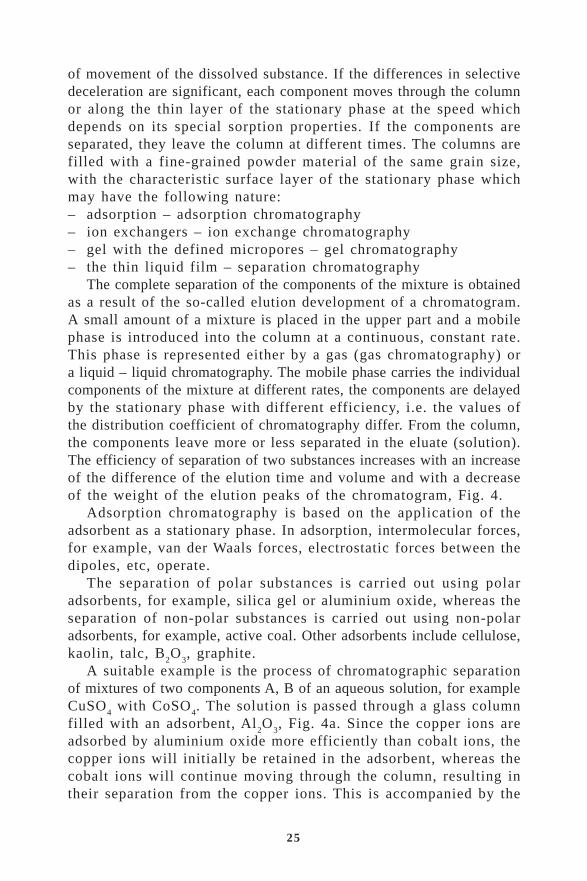
A suitable example is the process of chromatographic separationof mixtures of two components A, B of an aqueous solution, for exampleCuSO
4 with CoSO
4. The solution is passed through a glass column
filled with an adsorbent, Al2O
3, Fig. 4a. Since the copper ions are
adsorbed by aluminium oxide more efficiently than cobalt ions, thecopper ions will initially be retained in the adsorbent, whereas thecobalt ions will continue moving through the column, resulting intheir separation from the copper ions. This is accompanied by the

26
formation of two interfaces of movement of the ions: the leadinginterface of the cobalt ions and the lagging interface of the copperions. This nonuniform distribution of the components along the heightof the layer of the adsorbent results in the chromatogram shown inFig. 4c. The adsorption affinity of these two molecules determineswhich of the two substances will be bonded more strongly on thesurface of the adsorbent.
In desorption, the molecules of the dissolved substance are forcedto move forward by the effect on the flow of the moving phase. Thisforce acts on all components for the same period of time during whichthey are in the moving phase. Only the molecules with a high affinityfor the adsorbent are selectively retarded. For complete separation,i.e., separation of copper from cobalt in the present case, a pure solvent(distilled water) can be passed through the column. In this case, thecobalt ions which are adsorbed far less efficiently washed-out fromthe upper part of the column and transferred into its lower part. Asa result of passing a sufficient amount of the solvent, it is possibleto separate completely and gradually wash out both types of ions.
In the presence of three or more components in the separated mixture,the chromatogram becomes more complicated. The primarychromatogram with three components consists of four bands, withthe upper band containing all three components, the central band twocomponents and the lower band only one component with the lowestadsorption capacity. In adsorption on aluminium oxide, cations aredivided according to the following sequence: As3+, Sb3+, Bi3+, (Cr3+,Fe3+, Hg2+), Pb2+, Cu2+, Ag+, Zn2+, (Co2+, Ni2+, Cd2+, Fe2+), Ti2+, Mn2+,and the cations given in brackets cannot be separated. This seriesis independent of the anions present in the solution, e.g. SO
42–,
Cl–, NO3–, PO
43–.
In separation liquid–liquid chromatography, the components ofthe specimens are separated between the stationary liquid phase, trappedusually in the inert structure of the solid particles, for example, silica
Fig. 4 Principle of chromatography: a) initial condition; b) distribution of componentsafter chromatography; c) final chromatogram.
Co
lum
n h
eig
ht
Concentration
a b c

27
gel, quartzite, Al2O
3, filter paper, powder cellulose, etc, and between
the moving liquid phase. Both liquids are selected in such a mannerthat they are characterised by limited miscibility.
Because of the relatively high rate of separation, separationchromatography is used in a number of cases for the efficient separationof compounds, in particular organic compounds, phenols, amino acids,fatty acids, for the separation of unstable biological materials andcompounds with a large relative molecular mass. The columns withsorbed tributylphosphate on silicone quartzite have been used, forexample, for the separation of traces of arsenic from germanium,traces of scandium from calcium and also traces of nickel frommolybdenum. Columns with tri-n-octylamine are used for the separationof traces of cobalt from nickel and traces of Fe3+ from manganese.In ion exchange chromatography, ion exchangers are used as thestationary phase. Both the pH of the solution and the structure ofion exchange resins, i.e. their selectivity, determine the speed ofmovement of cations or anions in the column. Therefore, with a changeof the pH of the solution and the application of different liquid phases,such as chlorides, cyanides, organic solutions, it is possible to obtainindividual cations or anions trapped at different heights of the column.
The methods of ion exchange chromatography are especially effectivefor the separation of elements with very similar properties, for example,lanthanides. A solution of the mixture of lanthanide compounds ispassed through a column with ion exchange resins with a solutionof citric acid. The individual cations of the lanthanides mutually differonly slightly by the degree of adsorption and, consequently, the speedof movement in the column. Therefore, in the ion exchangers theyare gradually sorbed with the formation of individual zones alongthe height of the column. During elution, i.e. washing with the solvent,the separated solutions of eluated elements gradually leave the bottompart of the column with relatively high purity. Initially, the solutionof the heaviest lanthanide with the lowest adsorption capacity isdischarged, this is followed by solutions of the elements with loweratomic masses. Gas chromatography is used not only in the separationof easily volatile compounds such as, for example, inorganic halidesof metals, chlorides of titanium, silicon, tantalum, niobium, zirconium,hafnium, etc, but also as a method in analytical chemistry. Sorptionprocesses, i.e. adsorption, ion exchange, chromatography, are ofconsiderable importance for the separation and deep refining ofintermediate compounds especially in the primary hydrometallurgicalstage, and these compounds are used in the second refining stageas initial materials for obtaining high-purity substances.
28
4. EXTRACTION
4.1. Physico-chemical nature of extraction and itsimportance
In a wider sense of the word, extraction is the process of selectiveleaching of compounds into the liquid phase. For any type of extractionprocess, it is important that the solvent is in the liquid conditionand the mixture to be extracted maybe gaseous, liquid or solid. Theextraction of the gas by the liquid is absorption. Extraction of solidcompounds by liquid compounds is leaching used widely mainly inhydrometallurgy. The extraction of a dissolved compound from oneliquid phase to another is liquid extraction or also liquid–liquidextraction, or extraction from liquid into liquid. This method is ofconsiderable importance in the technology of separation and productionof pure substances [3].
Liquid extraction is a process of leaching the dissolved substancefrom one liquid solvent by another liquid solvent which is not misciblewith it. The liquid from which the dissolved substance is extractedis in most cases an aqueous solution. The liquid used for the extractionof the dissolved substance is the extrahent. The extraction agent isusually an organic phase which is formed either by a pure solventor contains a reagent represented by a component with chemical reactionwith the leached substance, and a diluent which is part of the extractionagent, for example, for decreasing viscosity. In a number of cases,the solvent may be a reagent and the diluent in the process of extractionis not always inert in relation to the substance being extracted. Thecomponent which is soluble in both phases is separated between themat a specific ratio. Equilibrium is obtained when the free energy ofthe component in both phases is identical.
Liquid extraction is used for:– separation of a mixture of two substances with concentration of
each mixture in a different solvent (aqueous and organic);– extraction of the main component of the mixture into the organic
solvent with the admixture left in the aqueous solution, or viceversa;
– extraction of the admixture into the organic solvent with the maincomponent remaining in the aqueous solution.

29
Extraction is a rapid, relatively simple and convenient processand is used widely. Extraction separation may be used for both verylow (trace) concentrations and high concentrations of elements inthe solution. The individual components can be selectively extractedfrom aqueous solutions into organic solvents or extracted from theorganic into aqueous phase. The required efficiency of separationis obtained by selecting suitable experimental conditions which are:pH of the solutions, the type of masking agent (CaCl
2), the solvent
and the extraction agent.
4.2. Mutual solubility of two liquids
There are liquid systems whose components are mutually insoluble(non-miscible), such as, for example, water–oil, water–mercury, andothers, and but there are also liquid systems those components arecharacterised by limited solubility, for example, water–aniline, water-phenol, etc. However, many systems are characterised by completemutual solubility of the components, for example, water–alcohol.
The mutual limited solubility of two liquids is observed in systemsin which the formation of a solution is accompanied by the absorptionof a large amount of heat. The change of the external conditions,in particular, temperature, affects the mutual solubility of the liquids.An increase of temperature increases solubility, if dissolution isaccompanied by the absorption of heat, otherwise, it decreases solubility.
Figure 5 shows the temperature–composition diagram for a phenol–water system characterised by mutual limited solubility of thecomponents. In the diagram, the points P correspond to the saturatedsolution of phenol in water, and the points Q to the saturated solutionof water in phenol. Since the concentration of the saturated solutionof one component in another increases with increasing temperature,the points P and Q will become closer during heating until finallyat the so-called critical dissolution or mixing temperature (point K)they become identical. The region situated inside the QKP curve isheterogeneous and consists of two phases. The points outside theregion represent a homogeneous system; in this region the componentsare characterised by complete miscibility. The lines connecting thepoints P
1P
2K and Q
1Q
2K is referred to as the solubility curve, the
liquation curve or also the binodal curve. At low temperatures, thesystem is heterogeneous and divided into two phases: phase Q witha high phenol content (the phenol phase), and phase P with a highwater content (aqueous phase).
Heating of the system is accompanied by the change of the

30
composition of the phenol phase along the curve QQ1Q
2Q
3 and the
composition of the aqueous phase changes along the curve PP1P
2P
3.
In this case, the phase Q is in equilibrium with phase P at the giventemperature. In the phenol–water system for composition V, thetemperature corresponding to the point Y on the binodal curve isthe minimum temperature of complete mixing. For composition W,this point is represented by Z.
During gradual heating of the solution with composition V theamount of the aqueous phase will decrease and at point Y the phasedisappears and the system becomes homogeneous. The same can bementioned for gradual heating of the solution with composition W;the amount of the phenol phase will decrease and at point Z the phasedisappears and the system becomes homogeneous. The direction ofthe process is controlled by the position of the point correspondingto the composition of the system, i.e. to the right or left of the CKconnecting line.
The problem of the mutual solubility of the liquids or of theirinsolubility is of considerable importance for liquid extraction. Thecompounds of similar composition, structure and size of the moleculesare usually characterised by good mutual solubility. In extraction,the molecules of the extracting solvent do not have to be polar, ifthe polarisation bond is typical for the molecules of the solvent fromwhich the extract is obtained, and vice versa. For example, if extraction
Fig. 5 Temperature–composition diagram of the phenol–water system.
Liquid I
Heterogeneous region Liquid II
C5H5OHphenol
Water content [wt.%] H2O
Tem
pe
ratu
re [
oC
]tk

31
takes place from an aqueous solution, the other solvent (extrahent)must be a non-polar liquid of organic origin. The main requirementfor the extrahent is chemical inertness in relation to water and verylow solubility in water. The extracted substance must be dissolvedin both liquids, more in one and less in the other. This is alwaysassociated with well-known difficulties because if the given substanceis characterised by high solubility in one of the contacting phases(for example, polar), it is then characterised by very low solubilityin the other phase (non-polar).
If a substance is characterised by high solubility in a polar solvent,the molecules of the substance must also be polar. However, thissubstance will be characterised by low solubility in a non-polar liquid.For example, the acetates of copper and calcium and also salts ofinorganic acids of these metals are characterised by high solubilityin water. However, they are not sufficiently extracted by means ofhydrocarbons because the salts are polar.
These difficulties may be eliminated if the dissolved metal istransferred into a compound which has both polar and non-polar group.Complicated compounds assume solubility of the main part (polaror non-polar). For example, the salts of copper and other salts ofhigh-molecular fatty acids are capable of extraction from the aqueousmedium by hydrocarbons, and the extraction capacity increases withincreasing length of the hydrocarbons chain, i.e. with increasing non-polar part. Therefore, for example, copper acetate is not extractedand the copper salt of oleic acid is extracted incompletely. Also, thesalt of valeric acid is extracted far more efficiently, whereas the coppersalts of higher fatty acids are extracted almost completely.
4.3. Separation laws
If a small amount of the third component is introduced into the systemof two non-mixing layers, then after establishment of equilibriumthis component appears in both phases in a specific concentration.If the concentration of the third component is low, the size of theirfractions in both phases is the same. An increase of the amount ofthis component in the system results in a proportional increase ofits concentration in both liquid phases.
The separation constant KD for a pair of ideal solutions in extraction
is given by the ratio of molar fractions of the dissolved substancein the organic x
/p/ and aqueous phases x
/N/:

32
KD =x
x/p/
/N/ (8)
The separation constant is independent of the total actualconcentration of the component in the individual phases, providedone or both phases are not saturated with this component. If morethan one component is separated through the phase boundary (at lowconcentrations of these components), then according to the Nernstlaw of independent separation it applies that each component willbe separated independently of other compounds.
For every given temperature, the ratio of the concentrations ofthe third component in two equilibrium liquid phases is constant.This is the principle of the separation laws. For example, let us considerthe water–carbon disulphide system where H
2O and CS
2 are mutually
insoluble. If an iodine crystal is introduced into this two-componentsystem, then when equilibrium is established the iodine will be presentin both layers. However, its concentration in carbon disulphide willbe approximately 600 times higher in comparison with that in water.However, if different amounts of iodine are introduced into the system,the ratio of the concentrations of iodine in one of the layers to theconcentrations in the other layer will remain constant at constanttemperature, and when introducing small amounts of iodine:
KDII
I
=X
/CS /
/H O/
2
2
X(9)
where 2/ CS /IX is the concentration of iodine in carbon disulphide.
However, in the concentrated solutions of the third component,the value of K
D does not remain constant. The introduction of certain
quantities of the third component changes the mutual solubility ofthe first two phases and this complicates the relationship betweenthe composition of the equilibrium liquid layers and may contributeto the formation of a homogeneous or a three-layer system.
The separation ratio DC
of a substance between the organic andthe aqueous phase is given by the following equation
2
A/org/
A/H O/
=C
CD
C (10)
The numerator contains the total concentration of component Ain all its chemical forms in the organic phase and the denominatoris the total concentration of component A in all chemical forms inthe aqueous phase. The efficiency of extraction depends on the separation

33
ratio DC and also on the volume of the individual phases and the
number of extraction processes only if the separation ratio is high.If the volume of the aqueous phase is V, the volume of the organic
phase Vorg
and the original concentration of the component in the aqueousphase is C
O, the concentration is given by the following equation:
1
1o o
orgC orgC
VC C C
VD V VD
V
= =+ + (11)
The concentration of the component remaining after single extraction(shaking) depends evidently on two factors: the separation ratio D
C
and the ratio of the volumes of the two phases. A component canbe removed by extraction to the required extent by repeated shakingor by the method of continuous extraction. After n extraction cycles,the concentration of the component remaining in the aqueous phaseis given by the following equation:
n
n oC org
VC C
D V V
=
+ (12)
The separation into the individual phases is the result of attractionand repulsion exerted by the molecules or ions of the competing liquidphases on the dissolved substance and on each other. The followingphysical interactions are important:– dispersion interaction– dipole–dipole interaction– induction interaction– hydrogen bond
4.4. Isothermal equilibrium in a ternary liquid system
The concentrated solutions containing three components can be examinedmore efficiently using a ternary diagram indicating the compositionof each component of the system (Fig. 6). In order to obtain informationon the distribution in ternary systems, attention will be paid toinvestigating the process of addition of substance A into a heterogeneousmixture of components B, C.
It is assumed that the components A and B and also A and C mixtogether completely, and the components B and C are characterisedby limited mutual solubility. All binary systems of the componentsB and C, whose composition is indicated by the points distributedbetween P and Q (Fig. 6) are divided into two phases with the

34
composition corresponding to P and Q. We examine the system whosegeneral composition is given by W. This mixture is divided into phasesP and Q with ratio WQ:WP in accordance with the lever rule. Afteradding component A to the system W, the ratio the phases WQ:WPgradually changes. The amount of one of the phases decreases inuntil it reaches the composition at which the system W contains theamount of component A which is such that the phase with the highconcentration completely disappears. The system will be homogeneous.
This condition is indicated in the diagram by W' which is the mixingor saturation point in the A–B–C ternary diagram. The binodal curvePW'X'Z'Y'Q in the ternary diagram for the given temperature is thesolubility isotherm. In the region restricted by the straight line PQand the binodal curve PW'X'Z'Q, the system is always heterogeneous(two-phase region), and in the remaining part of the diagram the systemis homogeneous. In the heterogeneous region, any system will bedivided into two coexisting phases whose composition is indicatedby the points distributed on the binodal curve.
In the temperature–composition diagram for the binary extractionsystem, the coexisting phases are situated on the horizontal line, i.e.parallel to the axis x, because both binary phases are characterisedby the same temperature, for example, the connecting line Q
2P
2 in
Fig 5. However, in the ternary diagram, this line is usually not horizontal.The angle of the connecting line changes depending on the natureof the component. As an example, Fig. 6 shows the line segmentP'Q' as the line connecting the coexisting phases.
As mentioned previously, in the case of a low concentration of
Fig. 6 Binodal curve in the ternary diagram of the A–B–C system.
Heterogeneous
region
A
B C
35
the third component A, its distribution constant KDA
in the systemof two liquid non-miscible phases has a constant value. The distributionconstant represents the ratio of the concentration of this componentQ' and P' and this can be exposed by the following equation:
KDA =concentration Ain phaseQ’
concentration Ain phaseP’=
Q’Q"
PP’P" (13)
However, in some cases, the distribution constant may also havethe values K
DA = 1, or K
DA<> 1. Therefore, for the case shown in
Fig.6, KDA
> 1.
4.5. Principle of extraction from solutions in the ternarysystem
A mixture of two liquids A and B with almost complete miscibilitycan be divided in many cases into components by means of extraction.For this purpose, a solvent (extrahent) is added to the mixture. Thesolvent does mix completely with a mixture and is capable of dissolvingone of the components to the required extent. In the ternary diagrams,the pure solvent S is usually placed in the right bottom corner ofthe triangle, component B, characterised by limited solubility in thesolid, is placed in its left corner, and component A, characterisedby complete solubility in the solvent is placed in the upper tip ofthe diagram (Fig. 7).
With gradual addition of the solvent S to the mixture of A andB (indicated by point F in Fig. 7), the point, corresponding to thetotal composition of the ternary system, moves on the straight lineFS. If one considers the same part of the solvent and the mixtureF, the total composition corresponds to the point M
1, and M
1S = FM
1.
Point M1 represents a heterogeneous mixture which is divided into
two phases after the establishment of an equilibrium. The compositionof these two phases indicated by the points P
1 and Q
1. Phase Q
1 is
characterised by a high content of the solvent and is usually referredto as the extracted phase, the extract, or also the phase of the solvent.Phase P
1 with a low content of the solvent is the raffinate of the
residual phase.The precipitation of the solvent from the extract Q
1, which takes
place in either by distillation or rinsing, results in the formation ofan extract without the solvent, whose composition is indicated bythe point E
1 in Fig. 7. The same procedure is used to obtain the raffinate
R1 (residue) from the raffinate phase P
1. Using this method, extraction,
with subsequent dissociation of the phases and the removal of the

36
solvent from them, is used for the separation of the initial mixtureF into the mixtures E
1 and R
1. In comparison with the initial mixture
F, the mixture E1 is characterised by the higher content of the component
A and the mixture R1 by the lower content of the component A. In
the case of the component B the ratio is reversed. Consequently, singlestage extraction is characterised only by the partial separation ofthe components from the mixtures A and B.
Further addition of the extrahent S to the raffinate R1 or to the
phase P1
results (after separation of the phases and the removal ofthe extrahent) in the formation of the new raffinate R
2 with an even
higher content of the component B in comparison with R1. Using
this method, it is possible to obtain, from the initial mixture, thecomponent B of almost any degree of purity after multistage extraction.
As regards the extract, containing component A, the maximumattainable degree of purity of this component is indicated by the pointE
m (Fig. 7), where E
mS is the tangent from the point S to the binodal
curve.In order to increase the purity of the extract, i.e., to produce it
with the highest possible content of component A, the extracted productis subjected to additional treatment with the so-called rinsing solution.This solution, which does not dissolve the component A, must havethe capacity of dissolving efficiently the component of the raffinateB which contaminated the extract. This results in the formation ofa high-purity extract.
The results of extraction depend on the following factors:– the size of the two-phase region;
Fig. 7 Composition and amount of products obtained in extraction.
Solvent
A
B S

37
– the angle of the line connecting the coexisting phases, i.e. onthe value of the distribution ratio;
– on temperature;– on the nature of the solvent–extrahent.
4.6. Extraction methods
The dissolved substances are usually transferred from one liquid solutionto another one because it is necessary to separate or purify the requiredcomponent. In some cases, the required component is removed fromthe initial solution in which the undesirable compounds are then retained.In other cases, the required solution remains in the original solutionand impurities are extracted. Extraction can also be used for producinganother solution from which the required component can be removedmore easily in comparison with the original solution. Shaking is usedwhen it is possible to obtain high values of the distribution ratioof the required component. Subsequently, the efficient removal ofthe required component requires only a small number of extractioncycles by shaking. For example, if the distribution ratio is higherthan 4, three extraction cycles are sufficient in order to remove thecomponent to 99%. Shaking is usually carried out using a separationfunnel which is pear-shaped. Both phases are efficiently shaken inthe funnel, the phase is subjected to gravitational separation by settlingand, subsequently, the phase is discharged through a stopcock. Inthe case of a low distribution ratio and a high separation factor:
aD
DDc
c
= 1
2
(14)
where Dc1
and Dc2
are the distribution ratios of both components,and in this case the continuous extraction methods are efficient. Thesemethods are based on the continuous flow of the non-miscible solventthrough the extracted solution. If the solvent is volatile, it can beeliminated and returned back by distillation and condensation. Despitethe fact that in the short period of time in which the two phases aretogether in contact it may not be possible to obtain the distributionequilibrium, the dissolved component is continuously removed bythe extracted phase. The statistical parameters of the process of liquidextraction are usually characterised by the number of extraction stepsrequired for obtaining the necessary efficiency of separation.
The extraction stage is every stage of processing the liquid containingthe extracted compound, by the new amount of the extracting agent.The stage is equilibrium if extraction results in the equilibrium
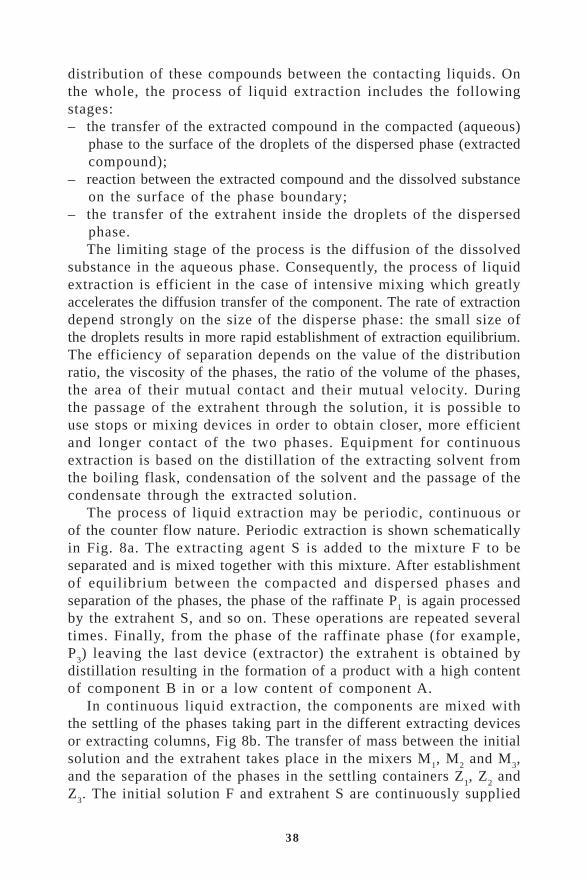
38
distribution of these compounds between the contacting liquids. Onthe whole, the process of liquid extraction includes the followingstages:– the transfer of the extracted compound in the compacted (aqueous)
phase to the surface of the droplets of the dispersed phase (extractedcompound);
– reaction between the extracted compound and the dissolved substanceon the surface of the phase boundary;
– the transfer of the extrahent inside the droplets of the dispersedphase.The limiting stage of the process is the diffusion of the dissolved
substance in the aqueous phase. Consequently, the process of liquidextraction is efficient in the case of intensive mixing which greatlyaccelerates the diffusion transfer of the component. The rate of extractiondepend strongly on the size of the disperse phase: the small size ofthe droplets results in more rapid establishment of extraction equilibrium.The efficiency of separation depends on the value of the distributionratio, the viscosity of the phases, the ratio of the volume of the phases,the area of their mutual contact and their mutual velocity. Duringthe passage of the extrahent through the solution, it is possible touse stops or mixing devices in order to obtain closer, more efficientand longer contact of the two phases. Equipment for continuousextraction is based on the distillation of the extracting solvent fromthe boiling flask, condensation of the solvent and the passage of thecondensate through the extracted solution.
The process of liquid extraction may be periodic, continuous orof the counter flow nature. Periodic extraction is shown schematicallyin Fig. 8a. The extracting agent S is added to the mixture F to beseparated and is mixed together with this mixture. After establishmentof equilibrium between the compacted and dispersed phases andseparation of the phases, the phase of the raffinate P
1 is again processed
by the extrahent S, and so on. These operations are repeated severaltimes. Finally, from the phase of the raffinate phase (for example,P
3) leaving the last device (extractor) the extrahent is obtained by
distillation resulting in the formation of a product with a high contentof component B in or a low content of component A.
In continuous liquid extraction, the components are mixed withthe settling of the phases taking part in the different extracting devicesor extracting columns, Fig 8b. The transfer of mass between the initialsolution and the extrahent takes place in the mixers M
1, M
2 and M
3,
and the separation of the phases in the settling containers Z1, Z
2 and
Z3. The initial solution F and extrahent S are continuously supplied

39
into the mixer M1 in which they are mixed together. The resulting
heterogeneous mixture is continuously added to the settling containersZ
1 in which the phases are separated. The raffinate phase travels from
Z1 to the next mixer M
2 into which the solvent is also added
(continuously). The heterogeneous mixture which forms in the mixerM
2, is continuously transferred into the settling container Z
2 which
operates on the same principle as Z1, etc. In each settling container,
the extract phase Q1, Q
2, Q
3 is produced. The final phase of the raffinate
P3 from the last settling container is transferred to the distillation
column in order to remove the extracted substance and obtained thepure refined product.
The application of the separation methods developed for the liquid-liquid system can also be extended to the separation of substanceswhose separation constants differ only slightly. This is possible usingthe so-called counter flow extraction which is a multiple separationprocess with a large number of steps, perfectly discontinuous, andconsisting of stages. It requires equipment with 100, 200 or even400 separation chambers in which extraction and transfer of the phasescan be carried out automatically. Equipment operates in such a mannerthat both phases are automatically mixed and one of the phases (moving)is transferred into the next chamber. The substances with a high valueof K
D are characterised by the highest speed and are followed by
the compounds with lower values of KD. This method is used mainly
for the separation of complicated mixtures of organic compounds.
4.7. Extraction systems
The simplest methods of extraction of metallic ions are based onthe formation of neutral, hydrophobic molecules. These reactions maytake place either in the aqueous phase or at the phase boundary.Important agents used in this case include chelates, mono- or diestersof phosphoric acid, carbonic or sulphonic acid distributed in an inert
Fig. 8 Scheme of liquid extraction.
a) Periodic b) Continuous

40
organic solvent. The chelates are important compounds for extractionbecause they may compensate the charge of metallic ions or may occupyits own coordination position (neutral chelates or internal complexes).These substances include, for example, enols of diketone, dithizone,8-hydroxiquinoline, etc. In particular, the d-2-ethylhexyl of phosphoricacid is an excellent extraction agent for a number of metals suchas lanthanides and actinides.
The next group of extraction systems enclose the formation ofsolvents in organic dissolvents. This is accompanied by the formationof donor and acceptor compounds whose strength depends on thebasicity of the organic solvent. Suitable examples of these types ofsolvents include ether, alcohols, esters of carbonic acid, ketonesand aldehydes. This method may be used for the extraction of complexacid of metals by ether, for example H[FeCl
4]. Recently, the extraction
agents containing phosphorus, for example, trialkylphosphinoxideR
3PO, alkyldialkylphosphonate (RO)R
2PO, dialkylalkylphosphonate
(RO)R2PO, trialkylphosphate (RO)
3PO have been used. One of the
most important extraction agents of this type is tributylphosphate(C
4H
9O)
3PO, denoted as TBF. It is characterised by high volatility,
high resistance to mineral acid and efficient mixing with organicsolvents. The following reactions take place during extraction fromnitrate solutions:
M3+ + 3 NO3 + 3 (TBF) = [M(NO
3)
3.3 TBF] (15)
MO2
2+ + 2 NO3 + 2 (TBF) = [MO
2(NO
3)
2.2 TBF] (16)
Tables 3 and 4 give several examples of extraction separation.
4.8. Application of extraction in the metallurgy of puresubstances
Extraction is the first step of separation and refining of compoundsbecause the resultant purity is not very high. It is used in thehydrometallurgical production of metals where a metal is transferredfrom solutions containing also a large number of compounds of severalmetals selectively using suitable extraction organic agents into theorganic phase, i.e. the phase which does not mix with the remainingaqueous phase. After separation of both phases, the metal is transferredfrom the organic phase using, for example, an acid, back to the aqueousphase and this is accompanied by the regeneration of the appliedorganic solvent. Recently, this technology has been used for the

41
separation of a number of metals, U, Th, Zr, Hf, Nb, Ta, Cu, Zn,Ni, Co, lanthanides, actinides, etc.
The chlorides are the simplest and cheapest salts and a numberof available solvents can be used for their extraction. Consequently,systematic investigations have been carried out into the distributionratios of chlorides of a large number of metals mostly characterisedby high solubility in water or in oxidised and salt solutions. In themajority of cases, isoamylalcohol (i-C
5H
11OH) was used as a sufficiently
universal solvent of the mineral salts, and CaCl2 was used as the
salt soluble in water.The extraction from liquid into liquid is one of the relatively efficient
processes of obtaining, separating and purifying compounds. It isusually carried out as the counter flow multistage separation processand it is highly promising in particular for the production of a numberof selectively operating solvents, complex making agents, separatorsof salts, i.e. systems with high values of the separation factor.
Table 3 Some extraction systems for analytical applications
noidetcartxE dnuopmocxelpmoCtneganoitcartxE
tnevloS
eF +3 SNC(enatanaycoihT –) rehtE
lA +3 gM, +2 eF, +3 eniloniuqixordyh–8 mrohporolhC
hT +4 uC, +2 mixoidlyhtecaiD mrohporolhC
iN +2 dP, +2 OU,2
+2 nicroser–)ozalydiryp–2(–4 dicaforetselyhtE
nM +2 uC, +2 bP, +2 nozabracoihtlynehpiD edirolhcartetnobraC
eF +3 oC, +2 iN, +2 enelyhtemartetmuinommAetamabracoihtid
mrohporolhC
htraeeraRsedinitcA
dicacirohpsohpfolyxehlyhte-2-id enatpeh-n
rZ +4 iT, +4 etahpsohplytubirT etahpsohplyhtubirT
eF +3 oC, +2 uC, +2 enimalytcoirT nezneB

42
Table 4 Examples of extraction separation
tnemelE elpmasfonigirO suoeuqafonoitisopmoCesahp
cinagrofonoitisopmoCesahp
gA uA,uC,bPfosetartnecnoC H–N82
OS4
CniZD6H
6
sA etiryP H2
OS4
aN,IK,2
OS3
lCCninanegotnaX4
uA egdulscitylortcelE ONH,lCH–N63
rehtE
eB stcudorpnoissiF 8–7Hp,ATDE lCHCnienotecalytecA3
iB nS,bPfosyollA ONH3
aeruoiht, lCHC3
dC nZ H,IK–M1.02
OS4
rehtelyporposI
eC stcudorpnoissiF 0.3–7.2Hp lCHCniATT+FBT3
oC iN lCH FBT
uC ,eF,lA:slairetamytiruphgiHnZ,nS,iS,bS
7Hp,CDD lCHC3
aG etixuaB lCH–N6 rehtE
eG hsa,slareniM lCH–N9 lCC4
nl serO H–N812
OS4
rBH–N2, C6H
6
oM slareniM aN2S
2O
4etartrat, etateca-lytneposI
iN syollA lyhtenimixoidlytecaiDlohocla
lCHC3
bS bP,nS BnimadoR rehtelyporposI
eS serO ATDE eneuloT
rS stcudorpnoissiF 8Hp KBIM–ATT
aT serO FH CniegnarolyhteM6H
6
hT dnasetizanoM 9.6–7.6Hp,NAP etatecalyhtE
hT serO ONH3
ON(lA,3)
3FBT–enaxeH
U seronaeL NCS – ONH,ATDE,3
FBT
U rZfosyollA ON(lA,FH3)
3FBT
rZ leetS 8–3Hp enelyxniATT
rZ leufraelcuntnepS OlCH4
H,2O
2lCHCnienotecalytecA3
–KBIM,3notalehc–ATDE,enozihtid–ZD,etamabracoihtidlyhteid–CDD:snoitaiverbbAATT,etahpsohplytubirt–FBT,lothpan–2–ozalydiryp–2–1NAP,enoteklytubosilyhtem
.enotecaroulfirtlyoneht-2

Summary of terms:
Significance of sorption processes in the separation and refining of substances Sorption, adsorption, chemisorption Ion exchange, ion exchangers Ion exchangers – cation exchangers, anion exchangers, amphoteric exchangers, redox ion exchangers Adsorption isotherm Stages of the exchange cycle – sorption in the column, rinsing, desorption (elution) Exchange capacity, swelling capacity of ion exchangers, selectivity Selectivity coefficient, distribution coefficient of ion exchange Ion exchange isotherm Chromatography Chromatography – separation liquid–liquid, ion exchange, gas, liquid Chromatographic column, chromatogram Physico-chemical nature of extraction and its importance Liquid–liquid extraction Mutual solubility of two liquids, binodal curve Separation laws in the extraction Separation constant, separation ratio, separation factor in the extraction Isothermal equilibrium in a ternary liquid system Principle of the extraction from the liquid in ternary system Extraction methods, extraction systems Solvent (extrahent), extract, raffinate, rinsing solution Periodical, continual, counter flow extraction – principle, difference Extraction stage, extraction systems Application of extraction in the metallurgy of pure substance
Questions:
After studying this chapter you will be able to clear up the following terms: 1. What differences are between the sorption, adsorption, desorption a chemisorption? 2. What types of the ion exchangers do you know? 3. What is the adsorption isotherm? 4. Describe the technological process in the ion exchange. 5. What do the terms ‘exchange capacity, swelling capacity of ion exchangers, selectivity’
mean? 6. What difference is between selectivity coefficient and distribution coefficient in the ion
exchange? 7. Describe the isotherm at the ion exchange by Fig. 3. 8. What is the principle of chromatography? 9. What kinds of the chromatography do you know?
10. Describe the chromatographic column and the method of separation of A and B substances (Fig. 4).
11. Where can be the sorption processes in the separation of substances applied? 12. On what principle the liquid–liquid extraction is based? 13. Define the term ‘mutual solubility of two liquids’. 14. What is the binodal curve and its significance? 15. What differences are between separation constant, separation ratio and separation factor in
the extraction? 16. Describe the isothermal equilibrium in a ternary liquid system. 17. What differences are between solvent (extrahent), extract, raffinate and rinsing solution? 18. What difference is between periodical and continual extraction? 19. For which metals the liquid extraction in metallurgy of pure substances is used? 20. What does the abbreviation TBF mean?
Exercises for solving:
1. Explain the principle of chromatography and the process of separation of substances A and
B as depicted in Fig. 4. 2. Explain the change in water solubility in phenol and phenol solubility in water during
cooling of the system from 70 °C temperature to room temperature as described in Fig. 5. 3. Determine the separation constant of A component for the isotherm specified in Fig. 6. 4. Explain the change in the composition and amount of products obtained in the extraction
for the initial water solution (point F) as described in Fig. 7.

5. CRYSTALLIZATION
Time needed to study: 60 minutes
Aim: After studying this chapter
You will understand the principle of refining of substances through crystallization. You will be introduced to the method of crystallization from solutions. You will know mechanisms of nucleation and crystals growth. You will understand the isothermal evaporation diagram. You will be able to design the procedure for the separation of salts by the cyclic crystallization process. You will know the freezing-out method.
Reading:

43
5. CRYSTALLISATION
The crystallisation refining methods are based on the different solubilityof the admixtures in the liquid and solid phases. In the productionof pure metals and semiconductor materials, crystallisation is usedin two consecutive purification stages:– crystallisation from aqueous solutions – selective crystallisation
in the first stage of purification;– crystallisation from melts – the most important method of the second
stage of purification and final refining of metals and semiconductormaterials [1].In crystallisation from solutions, the metal salt is transferred from
the solution into the crystalline phase. Crystallisation takes placefrom the supersaturated solution. The admixtures which have beentransferred into the solution together with the refined substance arepresent usually in the solution at low concentrations away fromsaturation and, consequently, do not crystallise and remain in thesolution. The situation in which it is necessary to carry out separationof two or more substances present in the solution in higherconcentrations is more complicated. Even in this case, it is possibleto carry out their separation on the basis of their different solubilityby the method of selective crystallisation followed by recrystallisationof the already separated salts.
5.1. Crystallisation from solutions. Equilibrium,mechanism and kinetics of crystallisation
If a dissolved substance is brought into contact with water, it is graduallytransferred into the solution. This process continues until theconcentration of the substance in the solution reaches a specific valuewhich is independent of the amount of the solid substance. Theequilibrium is established between the solid substance and the solution.The solution becomes saturated. The disruption of this equilibriumwith the precipitation of crystals from the solution takes place iftemperature is reduced or if a part of the solvent is removed as aresult of evaporation. The solution becomes supersaturated in relationto the dissolved substance and after establishment of equilibrium thissubstance crystallises with precipitation in the solid phase. This process
44
continues until the solution becomes again saturated at the giventemperature and equilibrium is established between the substanceand its solution.
The crystallisation process consists of two stages:– the formation of nuclei of crystallisation with a decrease of
temperature as a result of the disruption of phase equilibrium;– the growth of the resultant nuclei to large crystals.
The mechanism of the formation of nuclei may be described asfollows: in the saturated solution, the molecules of the liquid arein continuous and disordered motion and possess a specific internalenergy for the given temperature. The solution is characterised bythe formation of clusters of molecules with a similar spatial arrangementas in the solid substance. As a result of thermal motion, these clustersof the molecules either form or breakup out at the same rate. Witha decrease of energy, i.e. with a decrease of temperature, the clustersbecome more stable. They meet more frequently and, consequently,increase in size. This facilitates the formation, in the solution, ofcrystalline nuclei as a source of actual crystallisation.
The growth mechanism of crystals is based on adsorption, surfacediffusion and the growth of steps on the surface of the nucleus. Thegrowth of crystals is reflected as a regular process of growth of newareas. The rate of growth of the crystals is determined by the rateof diffusion transfer of the substance from the volume of the solutionto the surface of the growing crystal and depends on the degree ofsupersaturation and on temperature.
5.2. Solubility of salts
For refining separation of substances (metal salts) by crystallisationfrom solutions it is necessary to know their solubility in water. Thestrongest effect on the solubility of solid substances is exerted bytemperature. The increase of solubility with increasing temperaturemay take place in cases in which the dissolution process occurssimultaneously with the absorption of heat. The decrease of solubilitywith increasing temperature is observed when dissolution takes placewith the release of heat. If dissolution is not accompanied by a thermaleffect, the change of temperature will have no effect on solubility,i.e. solubility does not change with temperature. If the sign of dissolutionenthalpy changes, the direction of the solubility curve will also change,i.e. it must have a maximum or a minimum of solubility.

45
5.3. Isothermal evaporation and crystallisation
For crystallisation from the solution to take place, there must be initiallyevaporation in order to produce a saturated solution from the non-saturated solution and subsequent cooling of the solution should resultin supersaturation and crystallisation. The isothermal solubility curvesare very important for the expected behaviour of the solutions subjectedto isothermal evaporation.
If an unsaturated solution of two simple salts in the equimolarquantity, for example, point X in Fig. 9, evaporates at a constanttemperature, the component A whose equilibrium straight line isintersected by the straight line OD, is the first to be separated.Consequently, the solution is enriched in component B. Furtherevaporation results in further precipitation of component A and thecomposition of the solution changes, as indicated by the arrow, untilthe composition of point C is reached. This indicates the start ofprecipitation of both component A and B and the composition of thesolution remains constant. The resultant of evaporation is a mixtureof both components.
5.4. Cyclic separation of salts by crystallisation fromsolutions
The separation of two salts in practice is carried out on the basisof different solubility of the salts with a change of temperature. Asa result of gradual evaporation at high temperature and cooling tolow temperatures it is often possible to obtain sufficient separationof salts. This cyclic process will be demonstrated on the exampleof the simple NaCl–KCl system, Fig. 10, which does not result inthe formation of a binary salt and in which the individual salts crystalliseseparately at all temperatures higher than 0 °C. In Fig. 10, the curvesac and cb represent the solubility curve for NaCl and KCl at a
Fig. 9 Diagram of isothermal evaporation.

46
Fig. 10 Separation NaCl and KCl salts by means of the cyclic crystallisation process.
temperature of 0 °C, and the curves a 'c ' and c 'b ' are valid for atemperature of 100 °C.
As a result of evaporation of the initial saturated solution x at100 °C, the composition changes along the curve xx '. With furtherevaporation, NaCl starts to crystallise from the solution and thecomposition of the solution changes in the direction x'c'. In the vicinityof point c ', the crystallised NaCl separates from the solution whichis then cooled to 0 °C. During this process, the composition of themixture changes in the direction c 'y. Since the curve is situated inthe region of potassium chloride and corresponds to its saturatedsolution, potassium chloride will precipitate until the solution reachesthe composition corresponding to point y at a temperature of 0 °C.At this point solid potassium chloride is separated from the solution.If this is followed by cyclic evaporation of the solution, at compositiony ' NaCl starts to be separate and crystallisation continues until thepoint c' is again reached. Subsequently, the salt is separated and theisolated product is cooled down. This cycle of operations in whichNaCl is the first to precipitate and is followed by the precipitationof potassium chloride can be repeated until all the solution is usedup. In each evaporation cycle it is also possible to supply a new solutionto the system.
In general, it may be said that if the ratio of two salts in the solutionsaturated by both salts at any temperature t
1 and t
2 is the same, there
will be no separation of these salts. However, if this ratio differs,separation is possible only in cases in which the ratio increases
KCl content [g/100 g H2O]
Na
Cl
con
ten
t [g
/10
0 g
H2O
]

47
sufficiently with temperature. For example, in separation of salts K2SO
4
and KCl, the ratio KCl:K2SO
4 at 0 °C is 23.9 and at 100 °C it is
only 24.2. The difference is too small to result in an efficient process.In separation of several salts forming a solution and characterised
by different solubility in water, it is efficient to use fractionalcrystallisation based on the fact that different salts saturate the solutionat different temperatures.
5.5. Freezing-out
Directional freezing-out is one of the specific processes of separationof aqueous solutions of salts. It is accompanied by the precipitationof crystals from a large volume of salt solutions (for example, seawater)whose melting point, depending on the concentration of salts in them,is several degrees centigrade lower than the temperature of crystallisationof the pure solvent (for example, pure water). This occurs in the naturein the formation of glaciers with huge reserves of crystalline ice formedfrom fresh water. A similar process of directional freezing-out fromthe melt is also utilised in the refining of metallic Ga whose meltingpoint is 29.774 °C.
Summary of terms:
Crystallization from solutions Crystallization from aqueous solution with salt addition Equilibrium, mechanism and kinetics of crystallization, solutions of salts, solubility Isothermal evaporation and crystallization Cyclic separation of salts by crystallization from solutions Fractional crystallization Freezing-out method
Questions:
After studying this chapter you will be able to clear up the following terms: 1. Explain the term saturated and supersaturated solution and their importance during
crystallization. 2. What is a mechanism of origination of clusters and crystals growth in solutions? 3. Explain the process of separation of salts on the basis of the cyclic process of the
crystallization from solutions using the isothermal evaporation diagram – see Fig. 9 and Fig. 10.

6. CRYSTALLIZATION FROM MELTS
Time needed to study: 360 minutes
Aim: After studying this chapter
You will understand polyatomic and monoatomic theory of melt structures. You will know the importance of the Richards rule. You will be introduced to the fundamentals of the crystallization process kinetics. A significant material parameter of crystallization will be defined: the equilibrium distribution coefficient. You will understand the difference between equilibrium, kinetic and effective distribution coefficient. You will be introduced to the methods for determination of equilibrium distribution coefficients from binary diagrams. You will understand the difference between van Laar and Hayes-Chipman equation. Through practical examples you will be introduced to the retrograde character of the solidus curve. You will understand the methods of directional crystallization and zone melting. You will understand the principle of the refining and preparation of crystals from the melt: The Bridgman method The Czochralski method The Verneuil method Plasma melting Electron beam zone melting (floating zone method) Preparation of crystals for gas phase
Reading:

48
6. CRYSTALLISATION FROM MELTS
Crystallisation from melts is the process of transition of metals andalloys from the liquid L (melt) to the solid state S (crystal). The currenttheories of the structure of melts include the monoatomic conceptin which the structural unit is the atom or the molecule, and thepolyatomic concept in which the structural unit is a group of atoms(clusters of atoms). The polyatomic concept can be used, for example,for calculating the coefficient of self-diffusion of elements in themelt, the viscosity of the melt, the change of the volume during theL–S transformation, etc.
The structural components of microinhomogeneous melts are:– a cluster of atoms, with the atoms in the clusters vibrating;– the equilibrium zone of broken bonds between the clusters.This zone is the element of the space and can be characterised
by the volume or number of broken bonds. The volume of the zoneof broken bonds at the melting point is not large and its value forthe majority of metals is 1–6% which approximately corresponds tothe experimental data on the change of the volume of metal withthe change of state [13]. The broken bonds between the clusters arethe reason for the formation of a large number of activated atoms,i.e. the atoms on the surface of the clusters with at least one brokenbond. The activated atoms in comparison with the atoms in the volumeof the clusters are characterised by high mobility and are transferredinto a specific zone. The zone of the activated atoms cannot, however,exist independently because it is part of space and mass. Theconcentration of the activated atoms in different metals at the meltingpoint (TA
m ) is relatively high, 10–40%. With increase of temperature
of the melt, the dimensions of the clusters decrease and this isaccompanied by an increase of the number of activated atoms whichrepresents 100% of mass at the evaporation temperature (TA
b ).
From the viewpoint of the polyatomic concept of the structureof the melt, crystallisation or melting can be regarded as a transitionof the system from one equilibrium state to another:
Substance (clusters of atoms) Crystallisation Substance
be
(crystal lattice)
Space (breaking of bondsttween clusters) Melting Space (lattice vacancy)
→←
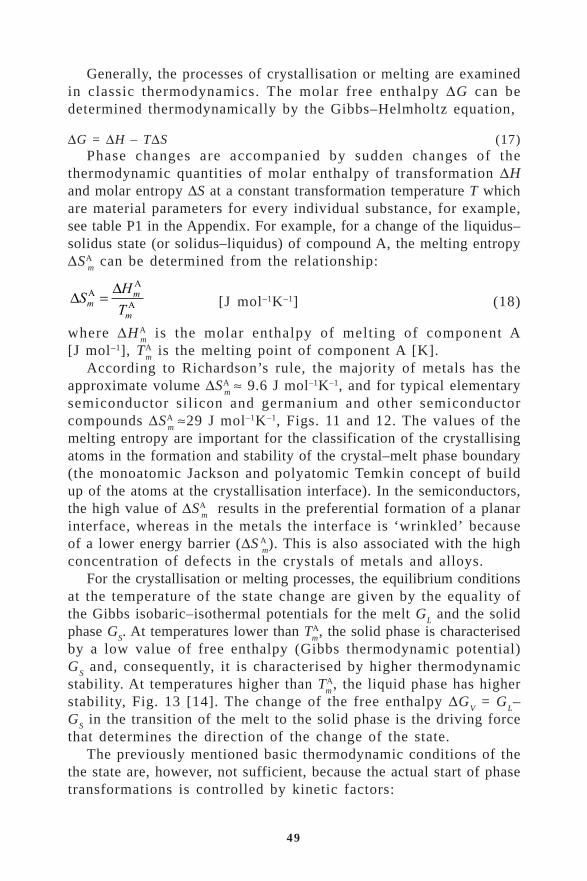
49
Generally, the processes of crystallisation or melting are examinedin classic thermodynamics. The molar free enthalpy ∆G can bedetermined thermodynamically by the Gibbs–Helmholtz equation,
∆G = ∆H – T∆S (17)Phase changes are accompanied by sudden changes of the
thermodynamic quantities of molar enthalpy of transformation ∆Hand molar entropy ∆S at a constant transformation temperature T whichare material parameters for every individual substance, for example,see table P1 in the Appendix. For example, for a change of the liquidus–solidus state (or solidus–liquidus) of compound A, the melting entropy∆SA
m can be determined from the relationship:
∆∆
SH
Tm
m
m
AA
A= [J mol–1K–1] (18)
where ∆HAm is the molar enthalpy of melting of component A
[J mol–1], TAm is the melting point of component A [K].
According to Richardson’s rule, the majority of metals has theapproximate volume ∆SA
m ≈ 9.6 J mol–1K–1, and for typical elementary
semiconductor silicon and germanium and other semiconductorcompounds ∆SA
m ≈29 J mol–1K–1, Figs. 11 and 12. The values of the
melting entropy are important for the classification of the crystallisingatoms in the formation and stability of the crystal–melt phase boundary(the monoatomic Jackson and polyatomic Temkin concept of buildup of the atoms at the crystallisation interface). In the semiconductors,the high value of ∆SA
m results in the preferential formation of a planar
interface, whereas in the metals the interface is ‘wrinkled’ becauseof a lower energy barrier (∆S A
m). This is also associated with the high
concentration of defects in the crystals of metals and alloys.For the crystallisation or melting processes, the equilibrium conditions
at the temperature of the state change are given by the equality ofthe Gibbs isobaric–isothermal potentials for the melt G
L and the solid
phase GS. At temperatures lower than T
mA, the solid phase is characterised
by a low value of free enthalpy (Gibbs thermodynamic potential)G
S and, consequently, it is characterised by higher thermodynamic
stability. At temperatures higher than TmA, the liquid phase has higher
stability, Fig. 13 [14]. The change of the free enthalpy ∆GV = G
L–
GS in the transition of the melt to the solid phase is the driving force
that determines the direction of the change of the state.The previously mentioned basic thermodynamic conditions of the
the state are, however, not sufficient, because the actual start of phasetransformations is controlled by kinetic factors:
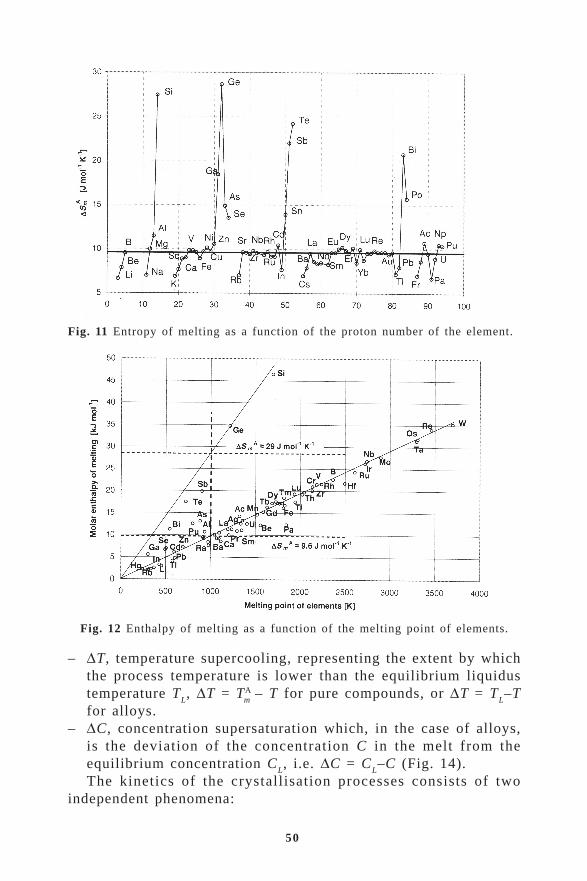
50
Fig. 11 Entropy of melting as a function of the proton number of the element.
Fig. 12 Enthalpy of melting as a function of the melting point of elements.
– ∆T, temperature supercooling, representing the extent by whichthe process temperature is lower than the equilibrium liquidustemperature T
L, ∆T = T
mA – T for pure compounds, or ∆T = T
L–T
for alloys.– ∆C, concentration supersaturation which, in the case of alloys,
is the deviation of the concentration C in the melt from theequilibrium concentration C
L, i.e. ∆C = C
L–C (Fig. 14).
The kinetics of the crystallisation processes consists of twoindependent phenomena:

51
– nucleation, i.e. the formation of crystallisation nuclei (homogeneousor heterogeneous nucleation);
– the growth of crystals, i.e. the rate of displacement of the differenttypes of crystal–melt interface (planar, cellular, dendritic) in relationto the temperature gradient.
Fig. 14 Main types of binary diagrams and solidification curves. a) unlimited solubility(ideal type), b) peritectic type, c) eutectic type, d) retrograde solubility of the soliduscurve, e) curve of cooling the pure substance A and alloy π, f) curve of coolingfor alloy µ in the case of the eutectic reaction.
Fig. 13 Dependence of the free volume enthalpy GV of the solid and liquid phases
on temperature.
52
Each of these phenomena is a sum of several partial phenomenaof which the phenomena with the lowest rate limit the rate of themain process. The nucleation process may include the collection ofthe present types of atoms by diffusion or other types of motion whosemutual internal arrangement corresponds to the new phase at thesolidification front.
The growth of crystals includes the transport of atoms by the ‘old’phase (melt), the ‘jump’ of these atoms to different types of phaseboundary and the transport of atoms through the new phase (solidsubstance). The majority of these partial phenomena are thermallyactivated processes which means that the energy barriers are overcomeby the thermal motion of activated atoms or of groups of these atoms.
6.1. Distribution coefficients in crystallisation
The concentration conditions in the process of solidification of alloyscan be evaluated by means of the appropriate equilibrium diagramsof binary or polycomponent systems. The existence of a temperaturedifference between the liquidus and solidus, Fig. 14, indicates thatat every temperature in the given range the solid and liquid phaseswith different chemical compositions are in thermodynamic equilibrium.This shows that the process of solidification is accompanied, at thecrystal–melt boundary, by the distribution of the impurities andadmixtures between the two phases. Assuming that the admixture ischaracterised by unlimited solubility in the melt and in the solid phase(Fig. 14a), the composition of the two phases changes continuouslyduring the solidification process, and the equilibrium between themis represented by the solidus and liquidus curves in the A–B binarysystem or by appropriate areas of the polycomponent systems.
The measure of distribution of the admixtures between the solidand liquid phase is the equilibrium distribution coefficients kA
oB of
the admixture B in the main substance A, defined as the isothermalratio (T = T
S = T
L) of the concentration of the admixture element
B in the solid phase XSB
(solidus) and in the liquid phase XLB
(liquidus):
A BB
B
So
L
Xk
X= (19)
where the concentration is given in molar fractions or in atomic %.The equilibrium distribution coefficient is lower than 1, kA
oB<1,
for systems in which the admixture element B decreases the meltingpoint TA
m of the main component A, Fig. 15a, – eutectic systems. For
the systems in which the admixture element B increases the melting

53
point, the distribution coefficient is higher than 1, kAoB
> 1, Fig. 15b– peritectic types of binary diagrams.
The different solubility of the admixtures and impurities in themelt and the crystal results, because of transfer phenomena, in thedistribution of the element of the matrix (A) and of the admixture(B). This results in the formation, in every primary crystallisation,of different segregation micro- and macroheterogeneities with a negativeeffect on the properties of solidified substances.
The above-defined distribution coefficient is the main materialparameter for the refining of substances by crystallisation processes,such as zone melting and directional solidification, being selectivecrystallisation processes.
6.1.1. Determination of the equilibrium distributioncoefficients from phase diagrams
The main apparatus for the calculation of phase diagrams isthermodynamics. The laws of thermodynamics can be used for thedetermination of the conditions of equilibrium of both phases andfor calculating the form of the curves of the phase diagrams [15–17, Calphad].
The phase data characterising the equilibrium composition of thecoexisting phases are usually presented in graphical form as binarydiagrams, i.e. a set of the curves T(X) in a functional dependenceof the temperature and composition of the phases of the given system[18], or, very seldom, by the numerical values of the coordinatesof the points (T,X) for which the system is in equilibrium. In the
Fig. 15 Definition of the equilibrium distribution coefficient: a) admixture reducesmelting point TA
m (kA
oB <1), b) admixture increases the melting point TA
m (kA
oB >1).
kA oB
<1 kAoB
>1

54
second case, it is necessary to have suitable mathematical facilitiesenabling the qualified interpolation of these points, includingsimultaneous optimisation by means of the criteria of the coexistenceof the phase and thermodynamics data [19].
In order to determine the values of the equilibrium distributioncoefficients, i t is necessary to express, thermodynamically ormathematically, the form of the solidus and liquidus curves. For thispurpose, the authors of [6, 7] developed a procedure which can beused for expressing with sufficient accuracy the form of these curvesby a polynomial of the second or higher degree, especially in theregion adjacent to the main component A in the functional dependencesT
S = f(X
SB), T
L = f(X
LB) so that they correspond to the actual conditions.
2 A, , , B , , BS L S L S L S L S L mT a X b X T= + + (20)
For more complicated types of solidus and liquidus curves, to carryout more accurate modelling, it is possible to use, for example, theequation of the cubic parabola (21)
3 2 A, , , B , , B , , BS L S L S L S L S L S L S L mT a X b X c X T= + + + (21)
or in the case of the retrograde nature of the solid, which is foundespecially in semiconductor systems, by the exponential logarithmicfunction (22):
,, B , , , ,( ) exp( )S Lb
S L S L S L S L S LX a T c T= ∆ ∆ (22)
The solubility curves of the admixture in the solid solution, forexample, in aluminium alloys and others, are efficiently modelledby the exponential function.
The regression parameters of the equations (20)–(22) are determinedby the experimental input data from the binary diagrams of the A–B systems on the basis of the original studies by different authors.The form of the curves is controlled thermodynamically, for example,using the criterion proposed by Hayes and Chipman [20,7]:
( ) ( )2A
AB B A1
m
th L om
TT x k R
H∆ = −
∆(23)
where ∆Tth is the thermodynamically calculated deviation of the liquidus
temperature from the melting point of the pure component TAm at
concentration xLB
, ∆HAm is the molar enthalpy of melting of the pure
component A. Equation (23) is valid only in the limiting regions adjacentto the melting point.
The extrapolation of the functional form of the solidus and liquiduscurves into the range of diluted solutions (X
SB→0, X
LB→0), used in

55
particular in the preparation of high-purity metals, gives from equation(20) the limiting value of the equilibrium distribution coefficientk A
oBlim
A Blim
Lo
S
bk
b= (24)
The unconventional view regarding the functional form of the solidusand liquidus curves T
S,L = f(X
S,LB) and the functional dependence
k AoB
= f(T, X) is clearly indicated by the bilogarithmic form of thebinary diagram, Fig. 16. In this representation, the temperature axisgives the value of deviation ∆T from the melting point TA
m of the pure
component (∆T = TAm
– T). The horizontal axis gives the range of theconcentration of the admixture B up to the limiting region of unitsof ppm which is especially significant for the metallurgy of high-purity substances with a purity of 5 N or higher. The graph also indicatesthat the value of k A
oBlim is constant in the majority of cases in the given
limiting region from ∆T = TA m – T < 1 K, sometimes up to
10 K.
6.1.2. The distribution coefficients of admixtures in copper
A suitable example of the results of mathematical analysis of thesolidus and liquidus curves and of the calculations of the distributioncoefficients kA
oB are the copper–admixture B binary systems, Fig. 17.
Fig. 16 Bilogarithmic representation of the binary diagram of the A–B system anddetermination of the value k A
oB lim by graphic extrapolation.

56
Fig
. 17
So
lid
us
and
liq
uid
us
curv
es i
n c
op
per
–ad
mix
ture
B b
inar
y s
yst
ems
in t
he
reg
ion
ad
jace
nt
to t
he
cop
per
sid
e.

57
Fig. 18 Types of binary phase diagrams of the copper–admixture system.

58
The determination of the values of the equilibrium distributioncoefficients of the admixtures in copper was carried out on the basisof the data on the available copper–admixture binary diagrams. Inreviews [10,21,22,23] various authors published approximately 68binary copper–admixture systems of which 48 were compiled in completeor partial binary diagrams which can be divided into three main groups,Fig. 18.
The first group (1) consists of the admixture elements increasingthe melting point of copper. The distribution coefficient of these elementsis kCu
oB > 1 and with copper they form:
1a) The unlimited series of solid solutions in the entire concentrationrange, as in the Cu–Ni, –Pd, –Rh, –Pt systems.
1b) The binary diagrams of the peritectic types Cu–V, –Fe, –Co, –Ir.On the basis of the position of the admixture elements in the periodic
table of elements and the correlation relationship kCuoB
on the protonnumber Z of the admixture kCu
oB = f(Z), Fig. 20, it was unambiguously
predicted that kCuoB
> 1 will also be typical of the following admixturesin copper: Ru, Ta, Os and probably also W, Re for which binarydiagrams have not as yet been constructed.
The second group (2) is represented by the admixture elementsdecreasing the melting point of copper and they have kCu
oB < 1. They
can be divided into:2a) The diagrams of copper with admixture elements characterised
by unlimited miscibility in copper in the entire concentration range(the ideal type of diagram or with a minimum on the solidus andliquidus curves) as in the case of the Cu–Mn, –Au systems.
2b) The admixture elements with limited miscibility in copper in thesolid state which form on the adjacent side of copper binary diagramsof the eutectic type, as in the case of the Cu–Li, –Mg, –Al, –P,–Cr, –As, –Nb, –Mo, –Ag, –Sb, –Hg systems.
2c) The binary systems of copper with admixture elements –Be,–Si, –Ti, –Zn, –Ga, –Ge, –Cd, –In, –Sn which also decrease themelting point of copper, and the liquidus curves of the systemscontain the peritectic reaction.
2d) The admixtures of this group are characterised by very limitedsolubility in copper and their distribution coefficient is considerablylower than unity, kCu
oB <<1, i.e. they are –B, –O, –S, –Ca, –Se,
–Sr, –Y, –Zr, –Te, –Ba, –La, –Ce, –Pr, –Nd, –Sm, –Eu, –Gd,–Yb, –Hf, –Tl, –Pb, –Bi, –Th, –U, –Pu.The groups 2c and 2d include from the position of the elements
in the periodic system but, in particular, on the basis of correlation

59
Table 5 Calculated parameters aS, b
S, a
L, b
L of equation (20) for Cu–admixture B
systems and limiting values of the equilibrium distribution coefficients kCuoBlim
andthe values kCu
oBEP for the eutectic or peritectic temperatures; t
mCu = 1084.87 °C,
∆HmCu
= 13263 J mol–1
mt = 1084.87 °C, mH = 13263 J mol .
Admix- ture B
CulimBok
CuB EPok aS bS aL bL
Valid to tempera-
ture t [°C]
Ag 0.345 0.081 -8.2434 -22.5990 0.0452 -7.8045 779.1 Al 0.807 0.915 -0.0542 -2.5568 -0.0617 -2.0632 1032 As 0.160 0.377 0.2639 -60.1710 -0.6788 -9.6178 685 Au 0.640 1.00 0.0559 -6.6373 0.0138 -4.2471 889 B 0.06 0.022 -241.0618 -176.6626 0.3878 -10.5650 1013 Be 0.329 0.684 0.6327 -23.7207 -0.0549 -7.8022 866 Bi 0.0001 0.0001 22209967.3 -137998.3660 0.1838 -11.7136 900 Cd 0.275 0.070 -55.2317 -31.7620 -0.0890 -8.7492 549 Ce 0.027 0.049 -158.5567 -421.4238 -1.4097 -11.1908 870 Co 1.436 1.647 -0.0432 3.6593 0.0380 5.2549 1112 Cr 0.546 0.571 0.2437 -9.5326 -0.0770 -5.1996 1074.8 Fe 1.318 1.314 -0.1057 2.8993 -0.1857 3.8214 1096 Ga 0.664 0.768 -0.2918 -5.6058 -0.1998 -3.7209 915 Ge 0.332 0.685 0.0988 -22.9387 -0.4170 -7.6117 824 H 0.119 0.331 -5.0000 -48.5000 -17.5248 -5.7596 1075 Hf 0.053 0.052 -82.0291 -207.5623 -0.1916 -11.0182 988 Hg 0.093 0.331 5.1343 -111.0107 -1.2018 -10.3004 660 Ho 0.0031 0.0021 -353518.1247 -3670.9952 -1.1238 -11.4183 875 In 0.453 0.479 -2.3544 -13.5935 -0.5568 -6.1607 710 Ir 2.863 2.001 -0.1219 7.6129 -2.1295 21.7944 1138 Li 0.270 0.203 1.4223 -31.7660 0.1985 -8.5854 1000
Mg 0.202 0.301 -0.8704 -45.6739 -0.2748 -9.2330 725 Mn 0.449 0.684 0.2383 -14.1723 -0.0797 -6.3653 950 Nb 0.186 0.5 18.6363 -50.5636 -75.0888 -9.3322 1080 Ni 1.478 1 -0.0007 3.7680 -0.0187 5.5698 1455 O 0.019 0.018 -750.4835 -607.7045 0.3031 -11.6330 1066 P 0.091 0.223 2.5604 -114.7884 -0.8414 -10.4141 714 Pb 0.023 0.007 -7932.2808 -480.6312 0.1817 -11.2925 955 Pd 1.083 1 0.0338 0.9481 0.0469 1.0268 1200 Pt 2.026 1 0.0611 5.8596 -0.0550 11.8697 1400 Pu 0.018 0.075 385.7680 -614.9797 -2.2159 -11.0102 855 Rh 2.15 1 -0.0106 6.2506 -0.0231 13.4351 1963 S 0.024 0.016 -13198.3242 -477.0766 -0.5210 -11.3235 1067 Sb 0.088 0.308 7.5739 -119.4973 -0.6664 -10.4910 645 Sc 0.027 0.039 -25.0016 -421.1709 -0.4340 -11.2740 865 Si 0.415 0.698 -0.4531 -15.7790 -0.5004 -6.5501 852 Sn 0.176 0.498 2.1268 -53.5702 -0.5850 -9.4427 798 Sm 0.161 0.50 0.1500 -56.8250 -2.3744 -9.1177 860 Te 0.011 0.002 -240512.4654 -1109.9723 0.8460 -11.7539 1050 Th 0.0007 0.0013 52773.1847 -17248.3894 -1.4328 -11.3848 935 Ti 0.308 0.365 0.1528 -26.1529 -0.0467 -8.0583 885 Tl 0.024 0.019 162.7098 -473.3210 0.2332 -11.4439 968 V 2.46 2 47.2954 6.0762 182.0335 15.0116 1120 Y 0.0072 0.0091 -6098.8293 -1610.7522 -0.7884 -11.5550 871
Yb 0.0015 0.003 3408.7481 -7612.0060 -1.1029 -11.5609 859 Zn 0.723 0.963 -0.0441 -4.3582 -0.0495 -3.1501 902 Zr 0.019 0.014 -2594.3073 -589.6262 -0.1993 -11.4144 972
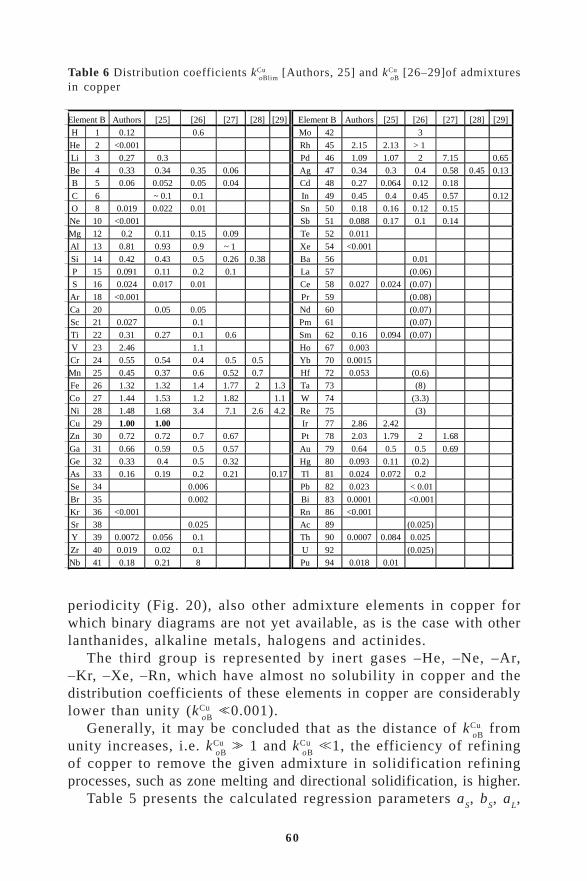
60
periodicity (Fig. 20), also other admixture elements in copper forwhich binary diagrams are not yet available, as is the case with otherlanthanides, alkaline metals, halogens and actinides.
The third group is represented by inert gases –He, –Ne, –Ar,–Kr, –Xe, –Rn, which have almost no solubility in copper and thedistribution coefficients of these elements in copper are considerablylower than unity (kCu
oB <<0.001).
Generally, it may be concluded that as the distance of kCuoB
fromunity increases, i.e. kCu
oB >> 1 and kCu
oB <<1, the efficiency of refining
of copper to remove the given admixture in solidification refiningprocesses, such as zone melting and directional solidification, is higher.
Table 5 presents the calculated regression parameters aS, b
S, a
L,
Table 6 Distribution coefficients kCuoBlim
[Authors, 25] and kCuoB
[26–29]of admixturesin copper
limBo Bo
Element B Authors [25] [26] [27] [28] [29] Element B Authors [25] [26] [27] [28] [29]
H 1 0.12 0.6 Mo 42 3
He 2 <0.001 Rh 45 2.15 2.13 > 1
Li 3 0.27 0.3 Pd 46 1.09 1.07 2 7.15 0.65
Be 4 0.33 0.34 0.35 0.06 Ag 47 0.34 0.3 0.4 0.58 0.45 0.13
B 5 0.06 0.052 0.05 0.04 Cd 48 0.27 0.064 0.12 0.18
C 6 ~ 0.1 0.1 In 49 0.45 0.4 0.45 0.57 0.12
O 8 0.019 0.022 0.01 Sn 50 0.18 0.16 0.12 0.15
Ne 10 <0.001 Sb 51 0.088 0.17 0.1 0.14
Mg 12 0.2 0.11 0.15 0.09 Te 52 0.011
Al 13 0.81 0.93 0.9 ~ 1 Xe 54 <0.001
Si 14 0.42 0.43 0.5 0.26 0.38 Ba 56 0.01
P 15 0.091 0.11 0.2 0.1 La 57 (0.06)
S 16 0.024 0.017 0.01 Ce 58 0.027 0.024 (0.07)
Ar 18 <0.001 Pr 59 (0.08)
Ca 20 0.05 0.05 Nd 60 (0.07)
Sc 21 0.027 0.1 Pm 61 (0.07)
Ti 22 0.31 0.27 0.1 0.6 Sm 62 0.16 0.094 (0.07)
V 23 2.46 1.1 Ho 67 0.003
Cr 24 0.55 0.54 0.4 0.5 0.5 Yb 70 0.0015
Mn 25 0.45 0.37 0.6 0.52 0.7 Hf 72 0.053 (0.6)
Fe 26 1.32 1.32 1.4 1.77 2 1.3 Ta 73 (8)
Co 27 1.44 1.53 1.2 1.82 1.1 W 74 (3.3)
Ni 28 1.48 1.68 3.4 7.1 2.6 4.2 Re 75 (3)
Cu 29 1.00 1.00 Ir 77 2.86 2.42
Zn 30 0.72 0.72 0.7 0.67 Pt 78 2.03 1.79 2 1.68
Ga 31 0.66 0.59 0.5 0.57 Au 79 0.64 0.5 0.5 0.69
Ge 32 0.33 0.4 0.5 0.32 Hg 80 0.093 0.11 (0.2)
As 33 0.16 0.19 0.2 0.21 0.17 Tl 81 0.024 0.072 0.2
Se 34 0.006 Pb 82 0.023 < 0.01
Br 35 0.002 Bi 83 0.0001 <0.001
Kr 36 <0.001 Rn 86 <0.001
Sr 38 0.025 Ac 89 (0.025)
Y 39 0.0072 0.056 0.1 Th 90 0.0007 0.084 0.025
Zr 40 0.019 0.02 0.1 U 92 (0.025)
Nb 41 0.18 0.21 8 Pu 94 0.018 0.01

61
Fig. 20 Periodic correlation dependence of the distribution coefficients koBCu of the
admixtures in copper on the proton number of the admixture.
bL of the equations of the type of (20) of the solidus and liquidus
for the individual admixtures in copper from the data base preparedby the authors of the present book [24], including the temperaturerange of validity (from the melting point of copper tCu
m = 1084.87 °C
up to the given temperature). Using the curves plotted in this manner,it was possible to determine the limiting values of the equilibriumdistribution coefficients of the admixtures in copper kCu
olim and the
values of the distribution coefficients kCuoBEP
valid for the eutectic orperitectic temperature, Table 5.
Table 6 presents, in dependence on the increasing proton numberof the admixture, the limiting values of the equilibrium distribution
Fig. 19 Examined binary diagrams of main elements.
H HeLi Be B C N O F NeNa Mg Al Si P S Cl ArK Ca Sc Ti V Cr Mn Fe Co Ni Cu Zn Ga Ge As Se Br Kr
Rb Sr Y Zr Nb Mo Tc Ru Rh Pd Ag Cd In Sn Sb Te I KrCs Ba La Hf Ta W Re Os Ir Pt Au Hg Tl Pb Bi Po At RnFr Ra Ac Rf Db Sg Bh Hs Mt
Ce Pr Nd Pm Sm Eu Gd Tb Dy Ho Er Tm Yb LuTh Pa U Np Pu Am Cm Bk Cf Es Fm Md No Lr
0.001
0.01
0.1
1
10
0 10 20 30 40 50 60 70 80 90 100Proton number of admixture B
Dis
trib
utio
n co
effic
ient
k o
Cu
authors
[25]
[26]
[27]
[28]
[29]
others
He Ne Ar
Sc
Ga
Kr Xe
Sm
Ho
Yb
IrPt
Au
Bi Rn
U
Be Mg
Al
P
Ti
V
MnCr
Fe
CoNi
CuZn
Ge
As
SeY
Zr
Mo
Pd
AgCd
In
Sn
Sb
Te
La
Ce
Pr Nd Hg
TlPb Th
H
BC
O
Si
S
Ca
Br
Sr
Nb
Rh
Pm Hf
TaW
Re
Li
B
Pu
Ac

62
coefficients of the admixtures in copper k CuoBlim
and the predicted orcorrelated values of kCu
oB, including the values of kCu
oB obtained by other
authors [25–29, 6,7].The calculations were carried out at the Department of Non-ferrous
Metals, Refining and Recycling of the VSB-Technical University inOstrava systematically over a period of 30 years on the basis oftheoretical and experimental investigations of the A–B systems formore than 50 basic substances (see Fig. 19 and Fig. P1–P7 in theAppendix), and arranged into groups on the basis of the technicalclassification of the elements:Iron FeGeneral non-ferrous metals Co,Ni,Cu,Ga,Cd,Zn,Hg,In,Sn,Sb,PbLight metals Mg, AlNoble metals Ag,Au,Ru,Rh,Pd,Os,Ir,PtRefractory metals Ti,Zr,Hf,V,Nb,Ta,Cr,Mo,W,ReDispersed metals Sc,Y,LaLanthanides Ce,Pr,Nd,Sm,Gd,Tb,Dy,Ho,Er,Tm,
Yb,LuRadioactive metals U, Th, PuSemiconductors Si,Ge,Se,Te (GaAs, GaSb, CdTe)
The tables P2–P7 in the Appendix show in the alphabetical orderthe basic metals A in relation to the proton number Z the actualcalculated limiting values of the equilibrium distribution coefficientsof the admixtures, obtained by extrapolation methods using the solidusand liquidus curves of the binary diagrams, published in the literaturethroughout the world [10, 21–23]. In the systems for which thereis not sufficient initial data or there are no data for binary diagrams,correlations were used to process the prognosis of the values by meansof the signs <1 or >1 or ≈1. This also relates to the values for theinert gases helium, neon, argon, krypton, xenon and radon (<0.001).
6.1.3. Correlation dependence of distribution coefficients
Another significant function of the equilibrium distribution coefficientsis the inclusion of these coefficients in different correlation relationshipsfor a number of physical properties of the admixture elements, suchas, for example, melting point, standard sublimation energy, tetrahedral,covalent or ion radii, the lattice energy, the valency of the atomsor the maximum solubility of the admixtures in the solid, etc. However,the most important function is the periodic correlation dependenceof the distribution coefficients of the admixtures in the main substanceson the proton number of the admixtures. The distribution coefficient

63
represents an entire complex of the properties of the admixture elementmanifested during its implantation in the lattice of the main substance.
A suitable example of the correlation dependence is the periodiccorrelation dependence of the values of the distribution coefficientsof the admixtures in copper on the proton number of the admixtures,Fig. 20, which consists of the values of kCu
oB (from Table 6). In this
graphical relationship, the minima of the curves are represented bythe values of kCu
oB of the inert gases He, Ne, Ar, Kr, Xe and Rn, which
are separated by the individual periods from each other. In the firstthree short periods, maxima are found for the values of kCu
oB of the
admixtures H, Li and Al. In large periods, the maxima are evidentin the elements V, Co, Ni (period 4), Mo, Rh (period 5), and Ta,W, Re, Ir (period 6). For the lanthanides, the number of binary diagramswith copper available at present is very small. However, on the basisof the correlation of kCu
oB with the proton number it may be expected
that their values of kCuoB
will be smaller than 0.1.Similar periodic correlations were already plotted previously and
verified for more than 50 basic elements [6,7,30,31], see the Appendix(Fig. P8–P17). The priority of the discovery of periodicity kAl
oB on
the proton number of the admixtures in aluminium (Fig. P8) [32, 33]was granted by V.N. Vigdorovich [34] to Kuchar already in 1966.
Researchers at the VSB – Technical University of Ostrava havedeveloped a database of the investigated binary systems containingthe limiting values of the equilibrium distribution coefficientskA
o Blim, the values of the distribution coefficients for eutectic kA
oBE or
peritectic reactions kAoBP
, the parameters of the curves of the solidusa
S, b
S and liquidus a
L, b
L (20) and the temperature range of validity
of both curves from tA m
to T. This database [24] contains at presentinformation on more than 1300 binary systems and the authors ofthe book have the information available for experts working in thearea of refining substances by crystallisation methods, for metallurgistsworking with liquid phases and for casting technology.
The periodic correlation dependences of the equilibrium distributioncoefficients of the admixtures in basic metals on the proton numberof the admixtures generally make it possible to:– determine the unknown values of kA
oB and predict the distribution
of the admixtures during both selective and general crystallisationprocesses;
– indicate the suitability of practical realisation of zone melting ordirectional crystallisation for the preparation of high puritysubstances;
– select suitable initial materials for these processes;

64
– carry out preliminary evaluation of the attainable degree of refining;– carry out objective control of crystallisation processes in refining
metallurgy;– carry out controlled microalloying and doping of the admixtures
during the growth of single crystals and commercial alloys thusincreasing the physical–metallurgical properties;
– calculate the concentration supercooling in solidified materialsat the crystal–melt boundary and, consequently, predict the growthstructure;
– predict the main types of binary diagrams;– predict the distribution capacity and enrichment of foreign admixtures
with kAoB
> 1 in dendrite arms, build up of admixtures withkA
oB < 1 in the spaces between the dendrites, in the mother liquid
during dendritic segregation which almost always accompaniesthe actual solidification of substances;
– calculate the decrease or increase of the melting point of the maincomponent at the given concentration of the admixture;
– determine the width of the solidification range which must be knownfor controlling the production processes of commercial alloys inconventional or continuous casting and solidification of substances.The distribution coefficients are the main material parameter of
solidifying substances. All theoretical and experimental results havebeen applied not only in refining processes but also in other materialregions if they utilise the crystallisation processes taking place atthe crystal–melt interface.
6.2. Interphase (kinetic) distribution coefficient
In the real crystallisation process, there is no thermodynamic equilibriumof the individual phases at the crystal–melt interface. The phasetransformation takes place at a specific rate so that the liquid andsolid phases are characterised by the presence of concentration gradients,and the temperature at the interface is somewhat lower than theequilibrium temperature.
The phase boundary is characterised by the occurrence of twoprocesses, i.e. the actual phase transformation and the transport processesof the participating phases (mass and energy transfer). In thesolidification of pure metals and the majority of other substances,the rate of crystallisation determines the removal of latent heat fromthe interface. The admixtures with kA
oB < 1, which are implanted in
the crystal during solidification with a lower concentration in comparisonwith the liquid phase, enrich the melt in front of the phase boundary
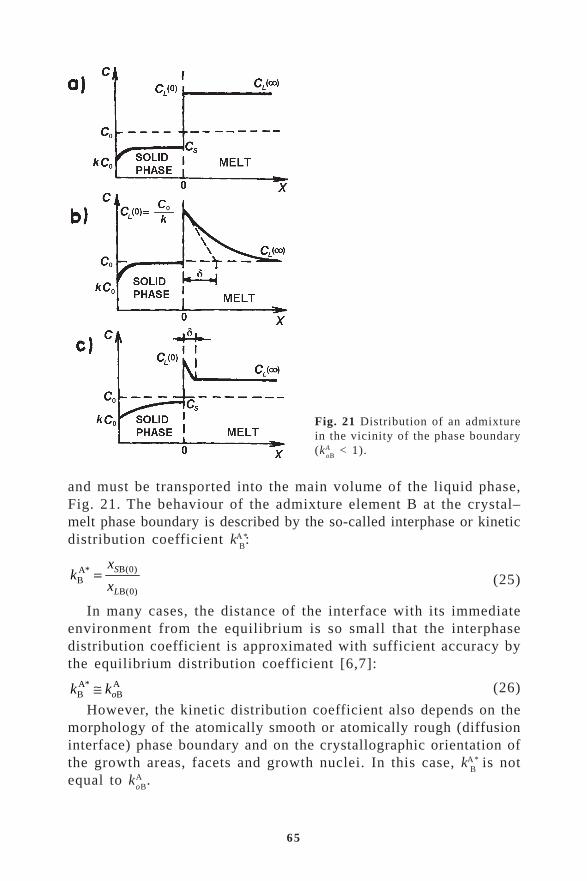
65
Fig. 21 Distribution of an admixturein the vicinity of the phase boundary(kA
oB < 1).
and must be transported into the main volume of the liquid phase,Fig. 21. The behaviour of the admixture element B at the crystal–melt phase boundary is described by the so-called interphase or kineticdistribution coefficient kA*
B:
B(0)A*B
B(0)
S
L
xk
x= (25)
In many cases, the distance of the interface with its immediateenvironment from the equilibrium is so small that the interphasedistribution coefficient is approximated with sufficient accuracy bythe equilibrium distribution coefficient [6,7]:
A* AB Bok k≅ (26)
However, the kinetic distribution coefficient also depends on themorphology of the atomically smooth or atomically rough (diffusioninterface) phase boundary and on the crystallographic orientation ofthe growth areas, facets and growth nuclei. In this case, kA*
B is not
equal to kAoB
.

66
6.3. The effective distribution coefficient
The processes taking place during crystallisation at the interface betweenthe liquid and solid phases result in changes of the concentrationin the melt in the immediate vicinity of the interface, Fig. 21. Theconcentration of the admixture in the melt is equalised by the effectof different types of convection in the main volume of the melt andby diffusion in the limiting layer with thickness δ. The relationshipfor the effective distribution coefficient of the admixture in the mainsubstance was derived by Burton, Prim and Slichter [35] from theequation of continuity and for suitable boundary conditions:
( )A
A BB
A AB B
B
1 exp
oef
So o
L L
kk
vk k
D
= − δ ρ+ − ρ
(27)
where v is the macroscopic speed of movement of the phase boundary[cm s–1], δ is the thickness of the sublaminar diffusion layer [cm],D
LB is the diffusion coefficient of the admixture B in the melt
[cm2 s–1], ρS, ρ
L are the densities of the solid and liquid substances
[kg m–3].The theory proposed by Burton, Prim and Slichter assumes that
the solidification front is characterised by the formation of a thindiffusion layer δ whose thickness changes in relation to the intensity
Fig. 22 Dependence of the effective distribution coefficient kA ef B
on the rate of growthand on the δ/D
LB ratio for different values of kA
oB.
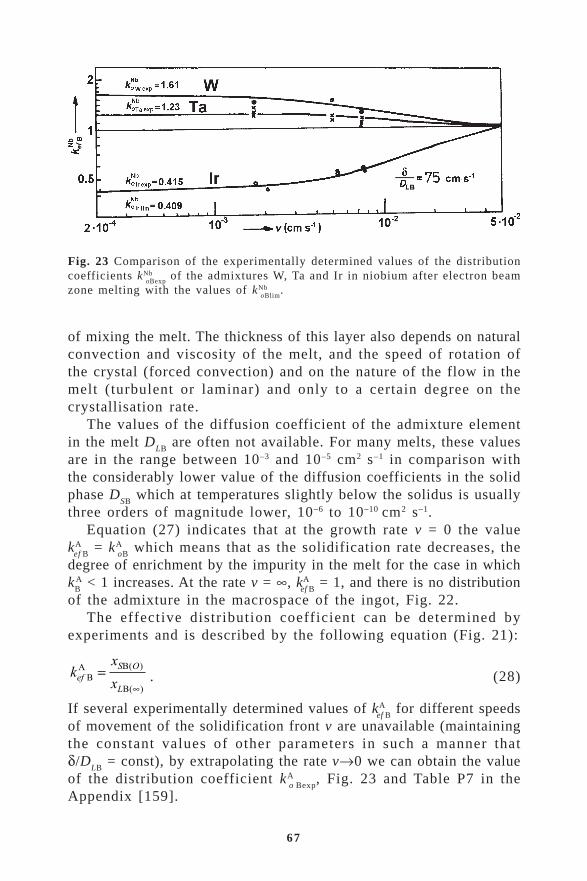
67
of mixing the melt. The thickness of this layer also depends on naturalconvection and viscosity of the melt, and the speed of rotation ofthe crystal (forced convection) and on the nature of the flow in themelt (turbulent or laminar) and only to a certain degree on thecrystallisation rate.
The values of the diffusion coefficient of the admixture elementin the melt D
LB are often not available. For many melts, these values
are in the range between 10–3 and 10–5 cm2 s–1 in comparison withthe considerably lower value of the diffusion coefficients in the solidphase D
SB which at temperatures slightly below the solidus is usually
three orders of magnitude lower, 10–6 to 10–10 cm2 s–1.Equation (27) indicates that at the growth rate v = 0 the value
kA ef B
= kAoB
which means that as the solidification rate decreases, thedegree of enrichment by the impurity in the melt for the case in whichk
BA < 1 increases. At the rate v = ∞, kA
ef B = 1, and there is no distribution
of the admixture in the macrospace of the ingot, Fig. 22.The effective distribution coefficient can be determined by
experiments and is described by the following equation (Fig. 21):
kx
xefS O
LB
A B
B
=∞
( )
( ). (28)
If several experimentally determined values of kA ef B
for different speedsof movement of the solidification front v are unavailable (maintainingthe constant values of other parameters in such a manner thatδ/D
LB = const), by extrapolating the rate v→0 we can obtain the value
of the distribution coefficient kAo Bexp
, Fig. 23 and Table P7 in theAppendix [159].
Fig. 23 Comparison of the experimentally determined values of the distributioncoefficients kNb
oBexp of the admixtures W, Ta and Ir in niobium after electron beam
zone melting with the values of kNboBlim
.

68
In order to ensure that the process of refining of the main substanceto remove the admixture is efficient, it is necessary to select theminimum possible speed of movement of the solidification interfaceand to reduce the thickness of the diffusion layer δ it is necessaryto increase the intensity of forced convection of the melt (by mixingthe melt by electromagnetic methods, high frequency current,mechanically, or by rotating the crystal and the melt, etc).
6.4. Criteria of the stability of the crystal–melt interface
In addition to the actual transformation, represented by nucleation,the liquid–solid phase boundary is also characterised by the occurrenceof transport processes in the phases contributing to the phasetransformation. Both the actual mass of the solidifying substance withmass and concentration changes at of the liquid–solid interface, andalso the energy (melting enthalpy) which is released during crystallisationat the interface, are transported.
a) Temperature conditions of crystallisation
For the continuous growth of the crystal it is necessary to ensure
Fig. 24 Conditions of formation of concentration supercooling: a) part of the binarydiagram of the A–B system, b) concentration profile of component B at solidificationinterface, c) the distribution of the equilibrium isoliquidus temperature T
L and real
liquidus temperature TA at the solidification interface.

69
the constant removal of the latent heat of solidification (solidificationenthalpy) from the phase boundary. However, this is only possiblein the presence of a specific temperature gradient in the region atthe centre of the solid–liquid interface at which the movement ofthe interface starts. During solidification of pure substances the rateof crystallisation of the transformation is generally given by the removalof heat from the interface. At the melt–solid interface, two differenttypes of heat removal may form from the viewpoint having a controllingeffect on the crystallisation process:– the heat is removed only by the solid phase – the temperature gradient
in both the solid and liquid phases is positive. In the case of alow growth rate, the interface is flat and is characterised by theoccurrence of directional crystallisation.
– the melt is supercooled, the transfer of heat takes place throughthe solid phase and the melt, the temperature gradient in the meltis negative, the growth rate is high and at the interface the dendriticgrowth of the crystals takes place.The temperature gradient grad T
L [K cm–1] is positive if the
temperature in front of the solidification plane is higher than at thephase boundary. If the temperature gradient is negative, the temperaturein front of the solidification plane is lower than the solidificationtemperature and the melt is supercooled.
b) Concentration supercooling in crystallisation
The examination of the A–B binary system with the distributioncoefficient kA
oB < 1, Fig. 24a, shows that in the system the liquidus
temperature decreases with increasing concentration of the componentB. The admixture B with kA
oB < 1 is enriched in the melt ahead of
the solid–liquid crystallisation interface, Fig. 24b. The concentrationof the admixture B changes, according to theoretical calculations,with the distance x from the interface in an exponential manner andevery point in the melt ahead of the solidification interface has theknown concentration of the admixture B. This is characterised bythe formation of an approximately exponential increase of temperaturedT
L/dx at the distance x ahead of the solidification front, because
every corresponding point of this so-called isoliquidus TL also has
the defined equilibrium temperature, according to the appropriatebinary diagram, curve T
L in Fig 24c. Cooling of the molten metal
results in the formation, in the melt of the temperature gradientgrad T
L= dT
A /dx, indicating the increasing linear course of the actual
temperature TA, Fig. 24c, which increases in the melt in front of the

70
interface. Because of this positive temperature gradient, temperatureT
A in certain areas ahead of the solidification interface is lower than
the temperature of the isoliquidus TL, Fig. 24c.
According to B. Chalmers, this phenomenon is referred to as theconcentration supercooling and in Fig. 24c it is indicated by the cross-hatched region between the curve of the isoliquidus T
L and the actual
temperature in the melt TA represented by the temperature gradient
grad TL. This region is characterised by the concentration supercooling.
In the presence of a steep temperature gradient and a low degreeof enrichment of the admixture B in front of the phase boundary andin the case of low solidification rate v, the actual temperature T
A in
the melt is higher than the isoliquidus temperature TL, i.e., in the
limiting case, TA represents the tangent to the curve T
L at the point
x = 0. Only in this case can the phase boundary be regarded as planarwhich, according to Tiller, is the limiting condition for the stabilityof the plane the interface when there is no concentration supercoolingin the given system. This condition of the stability of the planar interfacecan be expressed by the following relationship [36]:
grad B BA
B BA
T
v
m C k
D kL L
L
≤−( )0 1
(29)
where grad TL is the gradient of temperature at the solidification front
in the direction into the melt [K m–1], v is the speed of movementof the solidification front [ms–1]; m
LB is the tangent to the liquidus
curve at the concentration C0; D
LB is the diffusion coefficient of the
admixture in the melt; C0 is the initial concentration of the admixture
in the alloy; kAB is the distribution coefficient.
The movement of the surface of the interface between the solidusand the liquidus phase, i.e. the adsorption of the atoms on the matrixof the metallic atom with the regular structure takes place by thediffusion transfer of heat and in the case of alloys is also by masstransfer. Consequently, the flat (planar) interface remains stable onlyup to a specific critical growth rate and temperature gradient. Themaintenance of the equilibrium condition on the moving solidificationfront results in the destabilisation of the growth surface in the solidifyingmelt leading to the corresponding increase of the growth rate or adecrease of the temperature gradient.
The tendency for a decrease in the degree of supersaturation andthe associated concentration supercooling in the vicinity of thesolidification front increases the surface of the crystal and resultsin the loss of stability. Consequently, the solidification interface ischaracterised by the formation of a cellular or dendritic structure.

71
The concentration supercooling of the melt is of primary importancefor the formation of solidification nuclei and the atomic kinetics andgrowth anisotropy. It also affects the morphology of the interface,the size of the crystals and primary grains and the distribution ofdefects in the crystal. The formation of regions with the supercooledmelt leads to the instability of solidification and in real alloys itis a condition for the formation of branched structures of the cellularand dendritic type, Fig. 25.– the flat (smooth) surface of the interface may form only during
crystallisation of very pure metals and isotropic atomic kineticsof growth, Fig. 25a;
– the layer (stepped) surface formed during the anisotropic atomickinetics of growth observed in metals with the different depositionof the atoms in different crystallographic directions or in the presenceof foreign atoms with the preferential absorption on specific crystalplanes, Fig. 25b;
– the cellular surface of the interface is characteristic of concentrational
Fig. 25 Relationship of the degree ofconcentration supercooling with themorphology of growth structures ofcrystals.

72
supercooling caused by the buildup of the atoms of admixturesahead of the solidification front. According to Tiller, the phaseboundary is characterised by the formation of a small number ofthe regular projections already in the presence of a low degreeof concentrational supercooling, Fig. 25c, which results subsequentlyin the formation of cells of an irregular shape, Fig. 25d. A furtherincrease of concentrational supercooling leads to the formationof cells of the regular hexagonal form at the solidification front,Fig. 25e.
– the dendritic surface forms at relatively large concentration differencesin the content of admixtures in the solidifying substance, in thepresence of a very flat or even a negative temperature gradient.The solidification front is characterised by the formation ofprojections with the preferential direction of growth and with asmall radius of curvature, which penetrate into the melt at thehigher rate, Fig. 25f. Between these are projections of the crystalscharacterised by primary, secondary and tertiary growing crystalsinto the melt, there is a relatively large amount of the liquatedmother liquor (segregate), enriched with the admixture withkA
B < 1. In addition to front growth there is also lateral growth
accompanied by the well-known branching of crystals growingthrough the melt. These crystals of the tree shape are referred toas dendrites. If there is no extensive lateral branching (for example,in the case of preferential heat removal), long-axis columnar crystalsform on the microscale, for example, in the solidification of themelt in the ingot mould at the interface growing in the directionfrom the cooling wall of the mould into the melt.The result of cellular and, in particular, dendritic growth is the
formation of inhomogeneities in the chemical composition knownin metallurgy as dendritic microsegregation. At the nodal points ofthe hexagonal cells, as in the case of inter-dendritic spaces, thereis intensive concentration of the admixture with the distributioncoefficients kA
B < 1. The admixtures with kA
B > 1 result in preferential
enrichment of the axis of the dendrites (or cells).
6.5. Directional crystallisation
At the present time, the processes of crystallisation from the melt
*In the following text, the distribution coefficient will not be specified indetailed by means of the arguments A
B, because it is always the distribution
of the admixture B in the basic substance A.
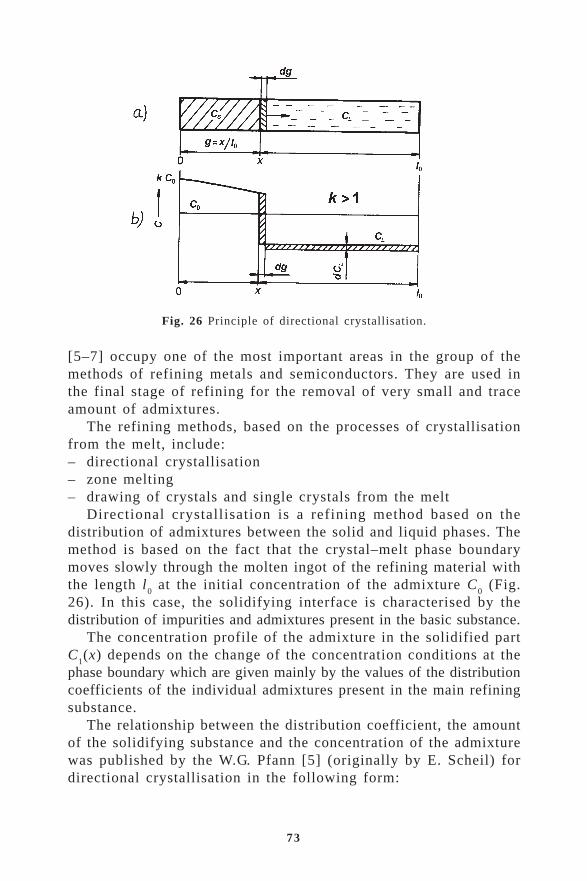
73
Fig. 26 Principle of directional crystallisation.
[5–7] occupy one of the most important areas in the group of themethods of refining metals and semiconductors. They are used inthe final stage of refining for the removal of very small and traceamount of admixtures.
The refining methods, based on the processes of crystallisationfrom the melt, include:– directional crystallisation– zone melting– drawing of crystals and single crystals from the melt
Directional crystallisation is a refining method based on thedistribution of admixtures between the solid and liquid phases. Themethod is based on the fact that the crystal–melt phase boundarymoves slowly through the molten ingot of the refining material withthe length l
0 at the initial concentration of the admixture C
0 (Fig.
26). In this case, the solidifying interface is characterised by thedistribution of impurities and admixtures present in the basic substance.
The concentration profile of the admixture in the solidified partC
1(x) depends on the change of the concentration conditions at the
phase boundary which are given mainly by the values of the distributioncoefficients of the individual admixtures present in the main refiningsubstance.
The relationship between the distribution coefficient, the amountof the solidifying substance and the concentration of the admixturewas published by the W.G. Pfann [5] (originally by E. Scheil) fordirectional crystallisation in the following form:

74
C1(x) = C
0k (1–g)k–1 (30)
where C1(x) is the concentration of the admixture in the crystal; C
0
is the initial concentration of the admixture in the entire volume ofthe melt; k is the distribution coefficient of the element B in themain substance A*, g is the relative part of the solidified crystal(g = x/l
0), x the distance from the beginning of the ingot.
In the derivation of the equation, Pfann use the followingassumptions:– the diffusion of admixture D
LB in the melt is complete and ideal
– the diffusion of admixture DSB
in the solid phase is equal to zero– the admixture forms a solid solution with the main substance,– during solidification, the density of the material does not change
(ρS
/ρL = 1)
At x = 0, the newly formed concentration is C1(0) = C
0k. As the
distance of the value of the distribution coefficient from 1 increases(k << 1, k >> 1), the distribution efficiency of the given admixturein the entire volume of the ingot increases.
In refining by directional crystallisation special attention is givento important admixtures whose distribution coefficient is lower than1. In this case, the movement of the solidification boundary throughthe solidifying crystal is accompanied by gradual enrichment of themelt with the admixture with k < 1, i.e. in the enrichment of theend part of the solidified ingot with the total length l
0. On the other
hand, the beginning of the ingot is depleted in the admixture withk < 1 (Fig. 27). The situation is reversed in the case of admixtureswith k > 1 which enrich the initial parts of the solidifying ingot andthe end part of the ingot is depleted in these admixtures.
However, conventional directional solidification is a one-off process.If the ingot with the resultant concentration profile C
1(x) is remelted,
this results, due to convection flows in the melt, in the equalisationof the concentration of the admixture in the entire volume of themelt to the initial value C
0. After repeated directional crystallisation,
the identical concentration profile C1(x) forms along the entire length
of the ingot.In order to ensure efficient directional solidification, the contaminated
part of the ingot must be removed. In practice, this is carried outby two methods:
a) the first method is based on the sectioning of the solidifiedingot, i.e. the removal of the contaminated part. This is followedby the assembling of cleaner sections and several ingots, with subsequentrepeated remelting by directional solidification.

75
b) the second method is based on melting the material in a boatof a special design. This design enables the removal of the enrichedfraction λ of the mother melt from the end part of the ingot, Fig.31, which would be last to solidify and which is expected to havea higher concentration of the admixtures with k < 1. After the removalof the enriched portion λ, the initial level C
0 of the admixture is
reduced in the boat to Cp. If this process is repeated several times,
it is the multiple directional solidification with the removal of material[7,37].
6.6. Zone melting
Zone melting is a variant of directional solidification used for therefining of substances to obtain high purity and takes place duringthe controlled distribution of impurities and admixtures present inthe ingot by the periodic repetition of the refining crystallisationprocess in the restricted part, the zone, of the melted ingot, Fig. 29a.
In zone melting, in an ingot with length l0 only a defined part
is melted, i.e. a narrow zone, with the width b. The molten zone with
Fig. 27 Concentration profiles of directional crystallisation for different valuesof the distribution coefficient k.

76
Fig. 28 Concentration profiles of zone melting after a single passage of the zonefor different values of the distribution coefficients k.
the concentration of the admixture in the melt CL, which travels through
the ingot, is characterised by two interfaces between the melt andthe solid phase:– the melting front (x+b), in which the initial solid phase of the
concentration C0 is melted in the zone;
– the solidification front, in the area (x), where the material withconcentration C
L melted in the zone and homogenised by convection
in the melt, is again solidified, with a new concentration C1(x).
The concentration profiles of the distribution of the admixturewhich gradually formed as a result of the repeated passage of thezones, can be described for the first passage of the zone (Fig. 28)of the ingot by the equation derived by Pfann:
C x C kkx
b1 0 1 1( ) ( )exp= − − −
(31)
where C0
is the initial concentration of the given admixture in theentire volume of the ingot; b is the width of the zone; C
1(x) is the
new concentration of the admixture in the solidified part of the ingotin the area x after the single passage of the zone. In the case withx = 0, C
1(0) = kC
0.
For multiple zone melting, on the basis of the law of the conservationof mass, derived by Reiss and Lord, it was possible to derive an equation

77
for calculating the concentration in the crystal after the n-th passageof the zone. The equation proposed by Reiss and Lord defines therelationship between the change of the concentration of the admixturein the advancing zone and the difference between the flow of theadmixture arriving in the zone and the flow of the admixture leavingthe zone. The equation was derived using the following simplifyingassumptions: the width of the zone b does not change, the cross-section of the zone is constant, k is constant, there is no change ofthe volume during solidification, mixing of the melt is perfect andthere is no diffusion in the solid phase. The final equation has thefollowing form:
C xk
bC x dx C x dxn n n
xx b
( ) ( ) ( )= −
−
+
∫∫ 1
00(32)
but is not valid for the entire length of the ingot. When the meltingfront of the zone reaches the end of the ingot, this final residue ofthe melt is characterised by directional solidification.
The comparison of the concentration profiles of zone melting anddirectional solidification for k < 1 indicates (Fig. 29) that the degreeof depletion in the admixture in the narrow zone in zone refiningis, as a result of the smaller volume of the zone, lower in comparisonwith the mother liquid can spread widely along the entire length duringdirectional solidification. Consequently, after the single passage ofthe zone, the level of the concentration of the foreign admixturesin the ingot subjected to a single zone of the melting is higher incomparison with directional solidification. If the width of the zoneb were equal to the total length of the ingot l
0, the equation of zone
melting (31) changes in the form to the equation of directionalsolidification (30).
Figure 30 shows the increase of the refining effect after 1–20 passagesof the zone. Comparison with directional solidification and itsconcentration profile indicates that zone melting is an efficient methodof refining only if the process is carried out as a multiple refiningprocess. Depending on the parameters of b, k and l
0, it is possible
to obtain the final or limiting distribution [7].A shortcoming of zone melting and also directional solidification
when used as the refining method is the joint presence of the impuritieswith k > 1 and k < 1 in the main substances. Therefore, prior to selectingthese refining methods, it is necessary to evaluate the presence ofall impurities in the main substance and their possible distributionin relation to the values of the distribution coefficients or select adifferent method of removal of these impurities.
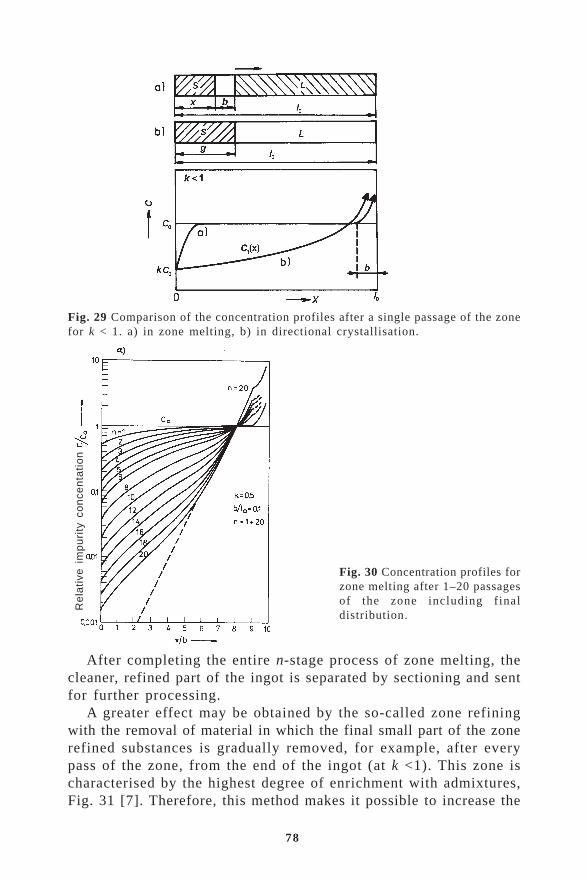
78
Fig. 29 Comparison of the concentration profiles after a single passage of the zonefor k < 1. a) in zone melting, b) in directional crystallisation.
Fig. 30 Concentration profiles forzone melting after 1–20 passagesof the zone including finaldistribution.
After completing the entire n-stage process of zone melting, thecleaner, refined part of the ingot is separated by sectioning and sentfor further processing.
A greater effect may be obtained by the so-called zone refiningwith the removal of material in which the final small part of the zonerefined substances is gradually removed, for example, after everypass of the zone, from the end of the ingot (at k <1). This zone ischaracterised by the highest degree of enrichment with admixtures,Fig. 31 [7]. Therefore, this method makes it possible to increase the
Re
lati
ve i
mp
uri
ty c
on
cen
tati
on

79
yield of refined material.Zone melting is used, in addition to the production of high
purity substances, also for the preparation of microalloyed parts ofthe zone refined ingot of zone grown single crystals or for growingsingle crystals of high purity substances (silicon, germanium, refractorymetals, etc.).
A suitable example is represented by the experimental results obtainedfor zone refined copper. In the determination of the effective distributionof admixtures in zone refining of copper and for analysis of this process,it is necessary to know the concentration profiles of the distributionof the impurities and admixtures along the length of the zone-meltedingot. The most suitable method for the determination of theconcentration profile after zone refining in which very lowconcentrations of the admixtures are used is the application of selectingradionuclides as a marker admixture. For example, this method wasused by the authors of the book to investigate the distribution ofradionuclides 124mSb and 110mAg in copper [25] and 95mZr and 110mAgin aluminium [6,32].
The starting material was copper of commercial purity 4N5, inwhich the radionuclide of antimony in the amount of approximately5·10–3 wt.% was added as a marker admixture. Zone melting was carriedout in an induction high-frequency equipment in a graphite boat placedin a silica tube in the shielding atmosphere of purified argon. Thespecimen was subjected to triple zone remelting with a mean travelspeed of the zone of 19 cm h–1; after each remelting special radiometricequipment was used to measure the distribution of the radionuclide
Fig. 31 Principle of directional crystallisation with removal of the material andexperimental set-up: 1) melting space, 2) discharge, 3) trough, 4) intermediate wallwith capillary orifice, 5) collection space.
section A–A
k<1
C0
Cp
C1(x)
C2(x)
g [%]
10
1.0
0.1
0.01
0.0010 20 40 60 80 100

80
of antimony in 1 cm intervals from the upper and lower side of theingot along its entire length. Figure 32 shows the concentration profileof the 124Sb radionuclide after individual passages of the zone. Theconcentration curves were process by the Buris–Stockman–Dillon method[38], based on the application of equation (32), to calculate the meanvalue of the effective distribution coefficients of the radionuclideof antimony in copper kCu
ef Sb= 0.35+0.06 which, according to the Burton–
Prim–Slichter equation (27), confirms the theoretical assumptionkCu
o Sb = 0.17 (see Table 6).
In zone refining, with respect to the length of the remelted ingot,the admixtures with k > 1 always buildup at the beginning of theingot, Fig. 33, but the admixtures with k <1 buildup always at theend of the ingot, which was confirmed not only in the previouslymentioned experiment with the distribution of 124mSb in the zone refiningof copper, but also generally. As the difference between the distributioncoefficients and unity increases, the intensity of the distribution processin the macrospace of the ingot increases.
In the presence of a dendritic microstructure, generally in realingot and castings, admixtures with k > 1 accumulate at the axesof the dendrites, and impurities with k < 1 accumulate in the inter-dendritic spaces. However, depending on the restricted dimensionsof the dendrite arms, their concentration profiles are considerably
Fig. 32 Distribution of 124mSb radionuclide in a copper ingot after horizontal zonemelting after 0, 1, 2 and 3 passes of the zone (for k < 1).
x [cm]

81
less distinctive and are normally identified by metallurgists as thewell-known dendritic segregation microinhomogeneities by meansof microprobe analysis, autoradiography or other microstructural andmetallographic methods – see Fig. 34.
As regards the grains and their dimensions in cast structures,enrichment with admixtures and impurities with k <1 takes place atthe grain boundaries and if the degree of enrichment exceeds theconcentration of the solid solution α of the given admixture in themain substance, the enriched admixtures effectively precipitate fromthis substance either as eutectic or other complex phases at the grainboundaries, and the intensity of this precipitation increases with anincrease of the value of k <<1 from unity.
6.7. Mass transfer in crystallisation
In addition to the change of concentration, described by the distributioncoefficient k, the melt–crystal interfaces also characterised by a changeof the density of the main material of the matrix.
At normal pressure, the volumes of the substances V and theirdensity ρ are a function of temperature. With increasing temperature,the volume V
S of the majority of typical metals (aluminium, copper,
iron, etc.) increases with a decrease of density ρS. With the change
of the solid–liquid state, the volume of the metal VS and the density
Fig. 33 Distribution of radionuclide 95mZr in aluminium after horizontal meltingafter 1 to 7 passages of the zone (for k >1) [6, 39].
1.75
1.5
1.25
1.0
0.75
0.5
Re
lativ
e c
on
cen
tra
tion
Cn/
C0
(95Z
r in
Al)
x [cm]

82
Fig. 34 Dendritic structure. a) Dendrites from an ingot of low alloy steel, b)autoradiograph of distribution (10–3 %) of radionuclides 59Fe in Al with purity 4N(kAl
oFe = 0.03). Increased concentration of Fe is found in inter-dendritic spaces (white
areas) of the dendritic and cellular structure.
of metal ρS changes abruptly to V
L and ρ
L, with a further linear change
in the melt. In the case of semiconductors germanium, silicon, andelements Sb, Ga, Bi and in some semiconductor compounds (GaAs,InAs, AlSb), as in the case of water, the change of the state L→Sincreases the volume and decreases their density abruptly, Table 7.The physical processes of the change of the volume and density arereversible [40, 41].
Mathematically, the relative change of densities ρS and ρ
L and
volumes VS and V
L at the melting point can be expressed by the
dimensionless mass transfer coefficient
αρρ
= =S
L
L
S
V
V (33)
This coefficient α is higher than unity (α > 1) for the majority ofmetals and lower than unity (α < 1) for semiconductor substances,Table 7, and characterises the mass transfer which takes place inall crystallisation processes. The same Table gives the relative changeof the volume of the substances α with the change of the stateL–S:
α =−
⋅V V
VL S
S
100 [%] (34)
In horizontal zone melting or directional solidification which isaffected uniformly by gravitation, mass transfer takes place and affectsthe shape of the ingot. A decrease of the volume in melting, i.e. atα < 1, results in the displacement of mass in the direction of movement

83
of the zone. On the other hand, the increase of the volume duringmelting, i.e. in the majority of metals with α > 1, results in masstransfer in the opposite direction, i.e. against the direction of movementof the zone. If the molten zone moves in an open horizontal boat,the ingot is usually wedge-shaped. This change after the single passageof the zone is small, but after repeated passages it may becomeconsiderable, Fig. 35a [7]. This may also result in overflowing ofthe material at the end of the boat. However, in certain cases, thisprocess may be desirable, for example, in the zone melting with removalof the material, Chapter 6.6, Fig. 31. However, in the majority ofcases it is necessary to prevent mass transfer. This can be carriedout by, for example, deflecting the boat with the ingot being meltedfrom the horizontal plane by the critical angle θ
cr, Fig. 35b. As a
result of deflection, the effect of the parameter α is eliminated andthe resultant ingot is characterised by the constant cross-section alongthe entire length.
The critical angle of deflection of the boat θcr
in the case of zonemelting can be expressed by the equation:
θα
cr arctg=−2 10h
b
( ) (35)
and in the case of directional solidification
Table 7 Coefficients α of mass transfer and relative change of the volume of substancesα with the change of the state L→S
ecnatsbuS α 1> )%( ecnatsbuS α 1> )%( ecnatsbuS <α 1 )%(
iLaN
KbRuCgAuAgM
nZdCgHeFlAlTbPeS
510.1520.1620.1520.1340.1430.1
50.1140.1740.1740.1530.1440.1360.1330.1430.1
81.1
5.15.26.25.2
52.44.3
40.51.47.47.45.34.462.662.383.3
81
eSgHeTgHeTdC
IuCaG
2eT
3
nI2
eT3
eTeGeTnSeTbPeSbP
SbPiB2
eT3
iB2
eS3
bS2
eT3
bS2
eS3
bS2S
3
860.1210.1400.1
90.150.1
910.1760.1940.1130.1260.1880.1630.1140.1230.1290.1131.1
77.632.1
4.010.950.5
9.17.69.41.32.68.8
85.31.481.381.91.31
iSeGaGiBbS
bSlAbSaG
bSnIsAaG
sAnlgM
2nS
gM2
bP
548.0449.0869.0769.0199.0178.0409.0578.0398.0929.0579.0779.0
5.01–65.5–42.3–
3.3–59.0–9.21–
6.9–5.21–7.01–
1.7–5.2–3.2–
α α
0.895
[%] [%] [%]α

84
θα
cr = arctg( )2 10
0
h
l
−(36)
where h0 is the height of the melt in the boat.
When calculating θcr
, the convection and surface tension of themelt which try to make the surface of the melt round are ignored.
In the case of vertical arrangement in a closed system (meltingin a vessel) or melting by the floating zone (FZ) method (section6.8.3), mass transfer also takes place. This may result in crackingof the closed end of the vessel. For materials those volume decreasesafter melting (α<1), the recommended direction of melting in thevessel is from bottom to top, Fig. 36a. When melting materials withα > 1, the direction of melting in the vessel should be from top tobottom, Fig. 36b. In melting by the FZ method, the shape and stabilityof the zone are affected, in addition to the changes of the densityof the melt α, also by the combined effect of gravitation and surfacetension.
6.8. Crystallisation methods of refining and production ofsingle crystals of metals, alloys and special materials
6.8.1. General classification
There are more than 100 technologies used for refining differentmaterials, for the preparation of crystals of metals, non-metals, theircompounds and alloys with the required content of alloying elements[8,9]. Crystalline and amorphous substances can be prepared fromthe gas, liquid or solid phase. Crystallisation from the melt is usuallypreferred due to a very large number of advantages because this methodcan be used to produce large crystals defined by their external shape,
Fig. 35 a) Displacement of mass in directional solidification and zone melting forsubstances with α < 1 (Ge, Si, Bi) after the multistage process with build-up ofthe substance on the end of the ingot; b) The boat inclined under critical angleθ
cr (preventing wedging of the ingot).
a
bθ
cr
l0
l0

85
Fig. 36 Recommended directions of movement of the zone in vertical zone meltingin the vessel. a) after melting the volume of the melt decreases (α < 1), b) aftermelting the volume of the melt increases (α > 1).
a
b
Initial height ofsolid phase
Moltenzone
Solidphase
Bubble
Heating
Molten zone
Solidphase
dimensions, the degree of chemical purity and structural perfection.In the majority of cases, the crystals are used directly as the initialmaterials for further technological processing (for example, productionof integrated circuits, electrical engineering, electronic or optoelectronicelements). The crystallisation methods, based on the principles ofdirectional solidification and zone melting, are used in productionfor the refining of the main substances to the maximum possible purityand for the production of crystals with the homogeneous or givendistribution of the admixtures.
When designing equipment for refining of substances by thecrystallisation methods, it is therefore necessary to propose the optimumparameters which affect the degree of separation of the admixtureand the time required for obtaining this degree, selecting a more suitableshape of the solidification vessel, the method of heating and cooling,and the mechanism of the process. For example, in refining by zonemelting, to obtain the required yield of the material of the given purityin the shortest possible time and with the minimum expenditure, itis necessary to select the number of passages of the zone n, the lengthof the zone b, the distance between the zones, the speed of movementof the zone v and the method of stirring the melt. The small lengthof the zone and the small distance between the zones reduce the timerequired for individual passages. As a result of an increase of thespeed of movement of the zone, the effective distribution coefficientk
ef in the macrospace of the ingot approaches 1 and, consequently,
86
the efficiency of the process decreases.The procedure for proposing a method of refining by crystallisation
from the melt is based on:– knowledge of the distribution coefficients of the admixtures in
the main substances;– the selection of the yield, i.e. the proportion of the material which
should have the relative concentration of the admixtures lowerthan the specified consumption;
– the determination of the minimum ratio n/v, ensuring the requiredyield;
– the determination of the maximum permissible refining time;– the determination of the maximum length of the ingot l
0.
When selecting refining methods, it is therefore necessary to selectthe shape and dimensions of the solidification mould, the heatingmethod, the arrangement of the process, the displacement mechanism,the method of mixing the melt, and the suitable atmosphere or vacuum.
Classification of the methods of refining and production of crystals
a) on the basis of the position of the solidification mould or crystal– horizontal (Fig. 37b)– vertical
b) according to the size of the volume of the molten charge– directional crystallisation – the Bridgman method (Fig. 37a)
– the Czochralski method (Fig. 37c)– the zone melting – in a solidification mould (Fig.37d)
– the floating zone (FZ) method (Fig. 37e)
c) according to the atmosphere used– vacuum– inert atmosphere (He, Ne, Ar, N
2)
– reaction atmosphere (H2, N
2, O
2, CO, S
2, As
2, Cl
2, I
2)
d) according to the pressure in the melting chamber– a very low pressure (a high vacuum)– reduced pressure– atmospheric pressure– high-pressure (melting in an autoclave)
e) according to the material of the solidification mould (in order toprevent contamination of the crystal)– the crucibleless method (FZ)– the autocrucible (the crucible is made from the same material

87
as the crystal (Fig. 37f)– oxide materials (quartz, Al
2O
3-corundum, MgO, CaO, ZrO
2...)
– graphite (for materials which do not form carbides)– copper (copper-plated, water-cooled boat or solidification mould)– boron nitride (for semiconductor materials)– noble metals (platinum, iridium)
f) according to the heating method– resistance heating– induction (high frequency and low frequency heating)– gas heating– electric arc heating– plasma heating (low-temperature plasma, high-frequency plasma)– electron beam heating (the beam of accelerated electrons)– ion heating (ion beam)– heating by radiation (solar furnaces, laser)– freezing-out
g) according to the mixing method– the rotation of the crucible and the crystal– induced high frequency current– mechanical– magnetic, electromagnetic.
Fig. 37 Methods of refining and production of crystals from the melt.
a
b
c
d
e
fL
SL
SL
S
L
S
LSLS S
b
l0

88
Below, we present a brief review of several selected methods ofrefining and preparation of single crystals.
6.8.2. The Bridgman method
The Bridgman method is one of the simplest methods and, consequently,is used widely. It is available in the horizontal or vertical arrangement.Figure 37a shows the vertical arrangement with a seed in the lowerpart, referred to as the Bridgman–Stockbarger method.
The vessel (crucible) with the charge and the seed in the lowerpart is placed in the heating zone of the furnace. During slow passageof the crucible (or boat) with molten metal through a steep temperaturegradient, gradual directional solidification of the melt and, consequently,growth of the crystal takes place. There are three main types of thearrangement:– the crucible moves in a stationary furnace from the region of
temperatures required for melting of the metal into the region ofthe crystallisation temperature of the metal.
– the moving furnace moves through the rigidly secured crucible(boat); this is efficient in particular for operation in vacuum.
– the furnace and the crucible with the melt do not move. Gradualdirectional crystallisation is achieved by a controlled decrease ofthe temperature of the furnace (the method of the horizontal gradientfreezing or the method of electrodynamic gradient freezing).
6.8.3. Zone melting methods
There are two main arrangements of zone melting: horizontal or vertical.Equipment for refining of metals by horizontal zone melting in
a boat consists of three sections: a boat with a charge, a heating sourcecapable of forming a narrow molten zone in the charge, and a mechanismfor moving the boat or the heating source. The material of the boatand the atmosphere of this furnace must not contaminate molten metal.In single crystal production, an oriented seed is placed in the boatand it is necessary to maintain the constant length of the zone duringthe entire passage or, in some cases, repeated passages of the zonethrough the specimens. In order to maintain the constant length ofthe zone, there should be a steep temperature gradient at both endsof the molten zone.
The heating source include resistance heating, high frequency inducedcurrent, electric arc, electron beam accelerated by the electric field,the flux of photons (laser), focused solar energy (solar heating), etc.

89
Fig. 38 Equipment for plasma melting of metals. 1) solidification mould, 2) plasmatorch, 3) external jacket, 4) carrier pipe, 5) internal jacket, 6) front end of thesolidification mould, 7) furnace flange, 8) guide screw, 9) carrier, 10) electric drive,11) cooler.
water
gas
water
shift
water
The zone melting of refractory metals is carried out in most casesby electron or plasma heating resulting in higher temperatures andenabling efficient control of the process. Induction heating is themost suitable method for metals with medium melting points.Homogeneity of the melt can be ensured by electromagnetic stirring.
Plasma heating is used in the production of special alloys and,in particular, in the metallurgy of high-purity alloys. Plasma formsas a result of thermal ionisation of the gases – argon, nitrogen, hydrogenand other inert gases in the electric arc. Generators of low-temperatureplasma include plasma torches working with the electric arc concentratedby a nozzle with the joint aerodynamic effect of the flowing gases.In 1967, the VSB-TU of Ostrava (Czech Republic) developed [42]a plasma torch with the continuous stabilisation of the electric arcrunning between a water-cooled cathode produced from thoriatedtungsten and a copper nozzle used as an anode. Other types of plasmatorch (plasmatrons) are based on the ionisation of gas in the highfrequency field operating with frequencies of up to several tens ofMHz.
The Department of Non-ferrous Metals, Refining and Recyclingof the VSB-TU of Ostrava developed, for special applications in thepreparation of high purity metals by zone melting, a plasma furnacewith a horizontal, copper, water-cooled solidification mould operatingwith a low-temperature plasma torch (Fig. 38). The furnace can beused for melting metals with medium melting points (Fe, Co, Ni)and with high melting points (Ti to Mo), and for special high-alloyedalloys (Fe–N, Ni–Ti, Al–Fe–Mo, etc.) which cannot be often preparedby other methods because of the high volatility of components (Cr).

90
This furnace operates with a slight excess pressure of the atmosphereof the ionised gas or a mixture of gases (Ar, Ar–N
2, Ar–H
2) and produces
temperatures of up to 10 000 K in the plasma arc.Plasma heating is used on an increasing scale for the intensification
of metallurgical processes, for the refining of metals and preparationof single crystals of refractory metals, alloys and compounds. Theplasma-forming gas also ensures additional refining of metals by thereactions Ar++e– with the melt, the reaction of oxygen and hydrogenin plasma with admixture elements in the melt, and the removal ofvolatile substances from the superheated melt [43,44].
Vertical zone melting
Crucibleless zone melting, i.e. the floating zone method (FZ), Fig.39, is one of the most efficient and widely used methods of refiningand preparation of crystals of reactive substances and refractory metals.The narrow molten zone is produced by, for example, high frequency,electron beam, laser and solar heating. Electron beam zone meltingin high vacuum using suitably oriented nuclei (seeds) can be usedfor the preparation of single crystals of refractory metals: W, Mo,Ta, Nb, V, Zr, Ti, Re. The zone is maintained in the suspended statemainly by surface tension forces. The stability of the zone dependson gravitation, surface tension and density of the melt, the concentrationof the admixturs and the direction of movement of the zone. Thestability of the zone is maintained using an external magnetic fieldwith the so-called support frequency. The gradual melting of layerson the original single crystal bar is carried out in individual stages.
In electron beam zone melting, in addition to the effect of zonerefining, a significant role is played by secondary processes. Theycause the generation of gases and evaporation of admixtures witha high vapour tension in the conditions of working vacuum of10–3–10–6 Pa. The single crystals of metals, produced by this method,are not perfect, especially when the bar diameter is large. Duringthe growth of the crystal and its solidification, samples contains asteep temperature gradient, the crystal–melt interface is curved and,consequently, mechanical stresses form in the crystal. Nevertheless,this method has been used for the growth of single crystals of W,Mo, Ta and Nb with large, slightly disoriented subgrains and withthe dislocation density of less than 104 cm–2 inside the subgrains.
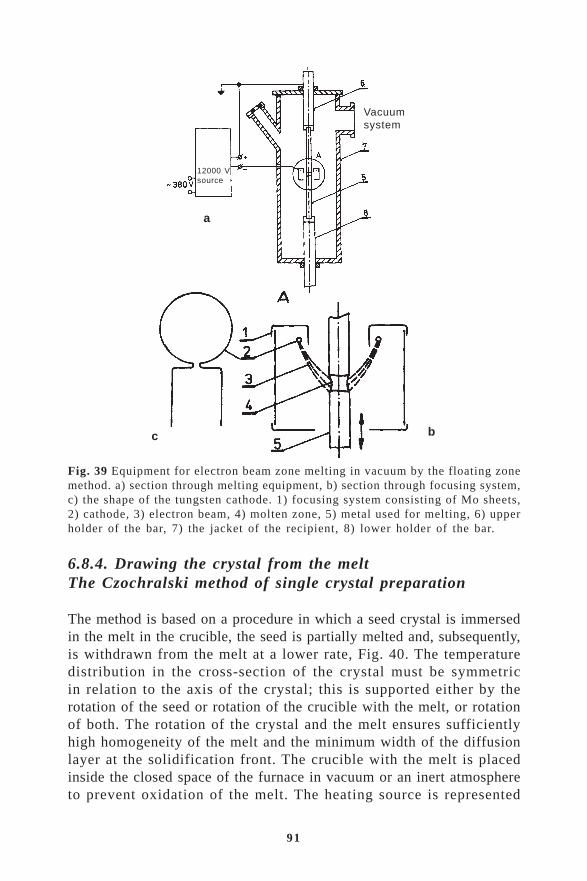
91
Fig. 39 Equipment for electron beam zone melting in vacuum by the floating zonemethod. a) section through melting equipment, b) section through focusing system,c) the shape of the tungsten cathode. 1) focusing system consisting of Mo sheets,2) cathode, 3) electron beam, 4) molten zone, 5) metal used for melting, 6) upperholder of the bar, 7) the jacket of the recipient, 8) lower holder of the bar.
a
bc
Vacuumsystem
12000 Vsource
6.8.4. Drawing the crystal from the meltThe Czochralski method of single crystal preparation
The method is based on a procedure in which a seed crystal is immersedin the melt in the crucible, the seed is partially melted and, subsequently,is withdrawn from the melt at a lower rate, Fig. 40. The temperaturedistribution in the cross-section of the crystal must be symmetricin relation to the axis of the crystal; this is supported either by therotation of the seed or rotation of the crucible with the melt, or rotationof both. The rotation of the crystal and the melt ensures sufficientlyhigh homogeneity of the melt and the minimum width of the diffusionlayer at the solidification front. The crucible with the melt is placedinside the closed space of the furnace in vacuum or an inert atmosphereto prevent oxidation of the melt. The heating source is represented

92
Fig. 40 Equipment for theCzochralski method of drawingsingle crystals from the melt. a)section through melting equipment,b) temperature distribution in theaxis of the crucible, 1) electricresistance heater, 2) inspectionwindow, 3) drawing bar, 4) seedholder, 5) connection of vacuumsystem, 6) single crystal, 7) melt,8) si l ica crucible, 9) crucibleholder.
a
b
by resistance or induction heating. The usual drawing rate is1·10–4–1·10–3 cm s–1 at a rotation speed of 0.1 to 1 s–1. The temperatureof the melt in the crucible should be maintained at required valueslightly above the melting point of the given metal with a relativelyhigh accuracy of +1 K.
The temperature distribution along the axis of the crucible in theCzochralski solidification equipment is shown schematically in Fig.40b. The isotherm, corresponding to the solidification temperatureof the substance, is situated above the surface of the melt. Thetemperature in the crucible increases in the direction to the bottomof the crucible. The single crystal seed and the growing crystal areused for the efficient removal of heat from the solidification front.The form of the surface of the melt is affected by gravitation andthe surface tension of the melt. The rate of withdrawal of the crystal,the speed of rotation and the temperature of the melt in the cruciblealso affect the shape of the crystal–melt phase boundary. At a hightemperature of the melt or a high withdrawal speed, the solidificationisotherm is situated above the surface of the melt resulting in a decreaseof the diameter of the crystal. On the other hand, a decrease of thetemperature of the melt and the speed of withdrawal increases thediameter of the crystal which is utilised in practice.
The Czochralski solidification method can be used for producinglarge single crystals from the melt (in the case of silicon, the diameterto 30 cm, length up to 200 cm) and also the required geometrical
93
shape. The preparation of dislocation-free single crystals of siliconis carried out using the so-called Dash method (formation of a neck)when the annihilation of dislocations from the seed takes place inthe narrow part between the seed and the actual crystal. The preparationof dislocation-free crystals or crystals with a low dislocation densityshould be carried out using the initial material with high chemicalpurity, a perfect seed, a low growth rate, a small axial temperaturegradient, a flat phase boundary, and a minimum temperature gradientin the radial direction. The advantage of the method is that the growthconditions can be controlled quite easily, regulated and also automated.The crystal grows in the free space so that there are no problemswith contamination and difficulties associated with the growth ofsingle crystals in the crucible or boat (formation of mechanical stressesin the crystal during solidification and cooling, difficult handlingof the crystal, etc). The concentration profile of the admixtures alonglength of the crystal is identical with the concentration profile indirectional solidification. The crystals prepared by the Czochralskimethod are, however, often characterised by a layered structure, i.e.transverse growth chemical inhomogeneity, resulting from the fluctuationof the temperature of the melt at the phase boundary caused by theproblems with temperature regulators or uplift convection.
6.8.5. Preparation of single crystals with a homogeneous orgiven distribution of admixtures
Single crystals with the homogeneous distribution of admixtures oralloying elements in the axial direction in the macrovolume of theingot in the directional solidification can be obtained basically bytwo methods based on:– maintaining a constant concentration of the admixture in the vicinity
of the solidification front under the condition kef = const.
– programmable change of kef in the process of single crystal growth.
In the first method, the constant content of an element in the meltcan be ensured by external supply from the solid, liquid or gas phase,by means of the composition calculated in advance. The floating cruciblemethod is used in the Czochralski method (Fig. 41) on the basis ofthe procedure in which the constant concentration of the elementsin the internal vessel, in which solidification takes place, is ensuredas a result of constant supply of the melt from the external crucible.The concentration of the admixture in the external and internal cruciblesand the ratio of their dimensions are determined by the value of k
ef.
This makes it possible to obtain the constant concentration of the

94
admixture along the entire length of the crystal. A similar procedurecan be used in homogenising in zone melting (the method of the startingcharge).
The second method is based on the Burton–Prim–Slichter equation(27), according to which the value of k
ef can be affected by the change
of the solidification rate and the speed of rotation of the crystal andthe crucible, i.e. forced convection in the melt. Selection of theprogramme for obtaining a homogeneously alloyed crystal in the axialdirection is based on the determination of the dependence of the rateof solidification and rotation speed on the drawing time or the lengthof the crystal. This method can be efficiently combined with the floatingcrucible method where by selecting the suitable form of the internalcrucible it is possible to produce single crystals with a programmeddistribution of elements. A similar procedure is used for the preparationof oriented dendritic ribbons of semiconductors produced by rapidwithdrawal from the melt.
6.8.6. Verneuil method
This method belongs in the group of the oldest solidification methodsfor the preparation of single crystals of oxides, in particular ruby,sapphire, etc. It is still used extensively in industry. A charge in theform of a fine powder is placed in a hopper with a vibration feedersituated above the upper part of a plasma torch. The hopper is connectedthrough a funnel with the system of nozzles of an oxygen–hydrogentorch. The powder is regularly discharged through the axis of thenozzle. As a result of heating by the flame, the powder melts andfalls on the seed heated by the flame. The rotational and translational
Fig. 41 The floating crucible method.
L
L
S

95
movement of the holder of the seed ensures the required growth rateof the single crystal. The surrounding furnace is used for gradualcooling of the grown single crystal.
The selection of materials is limited mainly to oxide materials,in particular of ceramic nature. Despite improvements, the limit ofthe structural perfection of produced single crystals is lower than,in, for example, the method based on photon heating. This heatingis based on the focusing the beam of a high-power light source (plasmatorch or sun) to the solidification space.
6.8.7. Preparation of single crystals from the gas phase, thevapour–liquid–solid (VLS) method
A droplet of a solvent is placed on a crystal substrate and at the giventemperature, the droplet is additionally saturated by means of a chemicaltransport reaction (see section 7.8), resulting in the formation of asupersaturated solution. The resultant concentration gradient leadsto diffusion in the droplet and to crystallisation on the substrate.The result is the growth of a sharp-tip ‘whisker single crystal’, withthe tip of the crystal covered by the solvent.
The first stage of growth of this crystal is the formation of nuclei.In the preparation of crystals from the gas phase, the condition forthe growth of nuclei is the essential supersaturation of the vapours.According to the current views regarding crystal growth mechanisms,the bonding of atoms to the crystal takes place on steps formed bya screw dislocation. In this case, the formation of a closely spacedplane is never completed and results in spiral growth of the crystal,i.e. a whisker crystal. Theoretically, a single screw dislocation issufficient for the growth of a crystal at low supersaturation.Crystallisation from the gas phase was used to obtain whisker crystalsof Ge, Si, Fe, Sn, Zn, Ag, Cu, Ni, etc, with the mechanical strengthclose to the theoretical value.
The single crystals of refractory metals with a low vapour tensionare efficiently produced from the gas phase of their volatile compounds.This is carried out by chemical transport reactions of compoundsin the gas phase (Chapter 7) on the surface of the crystal substrate.This method has also been used to produce, for example, single crystalsof W, Mo, Nb, Ta and other refractory metals. The initial materialare halides of these metals, for example, chlorides or fluorides. Inthis method, the chloride or fluoride of the appropriate refractorymetal is placed in the evacuated space and heated to transfer it tothe gas phase. Using a hydrogen flow, the vapours of tungsten

96
hexachloride WCl6 are supplied to the heated tungsten fibre
(approximately 1000 °C) where WCl6 is reduced. The reduced tungsten
settles on the heated fibre. When selecting suitable cooling rates,temperature and concentration conditions, a single crystal grows onthe seed. As a result of the combined reduction of the mixtures ofchlorides, it was possible to obtain alloys of the type W–Mo, Mo-Nb, W–Nb and superconducting layers of Nb
3Sn on a metallic substrate.
6.8.8. Preparation of single crystals from the solid phase-recrystallisation methods
The physical principle of crystallisation is based on overcoming atomicbonds in the deformed crystal lattice, the formation of nuclei of newgrains and subsequent growth by the transfer of atoms from the disruptedareas to thermodynamically more stable positions as a result of theformation of relatively perfect crystals. Recrystallisation is accompaniedby a decrease of internal stresses. The rate of grain growth dependsdirectly on the initial purity of metal. The grain size afterrecrystallisation annealing depends greatly on the degree of priorplastic deformation. The maximum growth of the grains is recordedat low, so-called critical degrees of deformation (2–10%), and alsoat deformations higher than 90%.
The recrystallisation methods of preparation of single crystals inthe form of fibres, wires and ribbons can be divided into:– the methods utilising the polymorphous transformation of the metal
in the solid state Fe (see Appendix), U, Ti, Zr, lanthanides. Inthis case, the accompanying phenomenon from the point of differentsolubility of the admixture in high-temperature C
v and low-
temperature Cn phases is the so-called transformation distribution
coefficient at ktr = C
v/C
n of the admixtures present in the main
substance [6];– the methods of recrystallisation annealing of metals after the critical
degree (5–10%) of plastic deformation (aluminium, tungsten) orafter 80–95% deformation (molybdenum, titanium...);
– the methods of secondary recrystallisation utilising the rapid growthof crystal grains at a specific temperature gradient after alloyingwith suitable high-melting finely dispersed particles (for example,ThO
2 in W...), thus preventing the growth of further parasitic grains.
In comparison with the method of preparation of single crystalsfrom the gas or liquid phase, recrystallisation methods are characterisedby advantages and disadvantages. The disadvantages include the factthat it is not possible to obtain crystals of large cross-sections nor
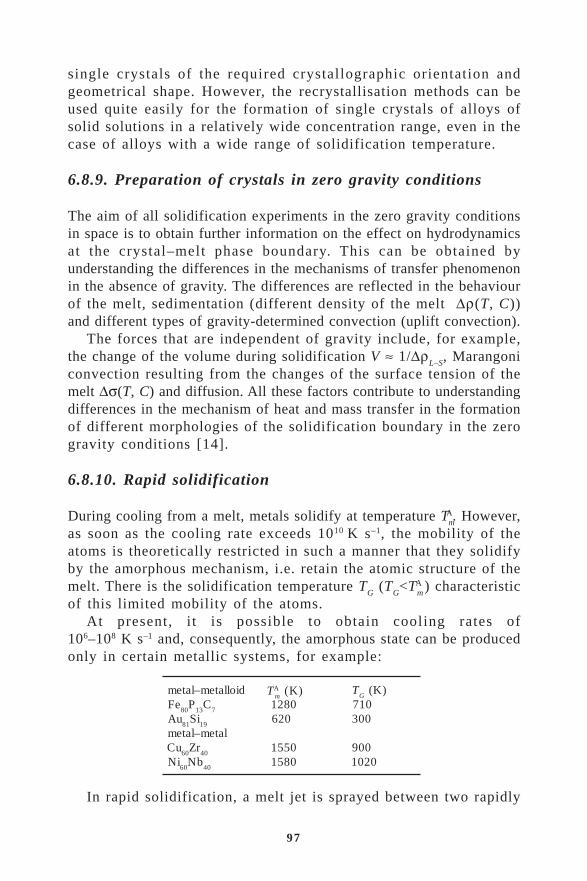
97
single crystals of the required crystallographic orientation andgeometrical shape. However, the recrystallisation methods can beused quite easily for the formation of single crystals of alloys ofsolid solutions in a relatively wide concentration range, even in thecase of alloys with a wide range of solidification temperature.
6.8.9. Preparation of crystals in zero gravity conditions
The aim of all solidification experiments in the zero gravity conditionsin space is to obtain further information on the effect on hydrodynamicsat the crystal–melt phase boundary. This can be obtained byunderstanding the differences in the mechanisms of transfer phenomenonin the absence of gravity. The differences are reflected in the behaviourof the melt, sedimentation (different density of the melt ∆ρ(T, C))and different types of gravity-determined convection (uplift convection).
The forces that are independent of gravity include, for example,the change of the volume during solidification V ≈ 1/∆ρ
L–S, Marangoni
convection resulting from the changes of the surface tension of themelt ∆σ(T, C) and diffusion. All these factors contribute to understandingdifferences in the mechanism of heat and mass transfer in the formationof different morphologies of the solidification boundary in the zerogravity conditions [14].
6.8.10. Rapid solidification
During cooling from a melt, metals solidify at temperature T m
A. However,as soon as the cooling rate exceeds 1010 K s–1, the mobility of theatoms is theoretically restricted in such a manner that they solidifyby the amorphous mechanism, i.e. retain the atomic structure of themelt. There is the solidification temperature T
G (T
G<T
mA ) characteristic
of this limited mobility of the atoms.At present, i t is possible to obtain cooling rates of
106–108 K s–1 and, consequently, the amorphous state can be producedonly in certain metallic systems, for example:
In rapid solidification, a melt jet is sprayed between two rapidly
diollatem–latemeF
08P
31C
7
uA18
iS91
latem–latemuC
06rZ
04
iN06
bN04
TAm
)K(0821
026
05510851
TG
)K(017003
0090201
T mA (K)

98
rotating cooled copper rolls. In this case, the amorphous(microcrystalline) solid metallic ribbon with a thickness of severalmillimetres and several centimetres wide solidifies between the rollsduring several microseconds. In fact, the ribbon is injected into thespace behind the rolls. In this case, coiling is the technical problem.
Amorphous metals, the so-called metallic glasses, formed duringrapid solidification, are homogeneous materials (k
ef→1) without grain
boundaries and are characterised by high strength and elasticity. Incontrast to commercial glasses, they can be compressed by up to 50%.They are characterised by high corrosion resistance, electricalconnectivity and can be easily magnetised and, taking into accountlow electric losses, they already replace conventional transformersheets. In heating to temperatures higher than recrystallisationtemperature, amorphous materials may change to the crystalline stateand, consequently, it is important to consider the stability of metallicglasses.
The results of these rapid solidification technologies (in additionto metallic glasses) are also structural variants of microcrystallinematerials with the grain size smaller than 1 µm which, like theamorphous materials, are characterised by the following characteristics:– wider range of the solid solution;– the limiting solubility of alloying elements and admixtures is
displaced without causing precipitation of specific phases;– refinement of the precipitated phases;– the formation of metastable phases because of suppression of
diffusion processes.The processes of rapid solidification are used at present for processing
not only magnetically soft materials but also for modification of,for example, the properties of aluminium alloys based on superduraluminAl–4.5Cu with 1–3% Li. In the case of aluminium it is also possibleto obtain a higher solubility of iron, nickel and manganese (3–8%),the solubility of chromium, zirconium and cobalt in copper is increased,and in steels it is possible to increase the solubility of carbon, boron,silicon and phosphorus. Similarly, for special applications it is possibleto produce improved types of dispersion-hardened materials with ahigher concentration of ultrafine precipitates. The processes of rapidsolidification also indicate the trends for materials with the applicationof trace elements and rare earth metals (lanthanides) in promisingareas of electrical engineering and microelectronic materials.
Summary of terms:
Crystallization from melts Theory of melt structure Thermodynamic laws in crystallization Kinetic factors in crystallization Temperature under-cooling, concentration super-saturation Nucleation and crystal growth Richards rule Retrograde solubility Basic and admixture element Solidus, liquidus, solvus, crystal, melt, solid and liquid phase Equilibrium distribution coefficient in crystallization – definition Dependencies of equilibrium distribution coefficients on temperature, concentration and
proton number of admixtures Determination of the equilibrium distribution coefficients from phase diagram Determination of the equilibrium distribution coefficients from thermodynamic data Van Laar equation for the ideal solutions Hayes-Chipman equation for dilute solutions Temperature and concentration dependencies of equilibrium distribution coefficients Distribution coefficient and crystallization conditions Kinetic distribution coefficient - definition Effective distribution coefficient - definition Distributing number – definition Directional crystallisation Zone melting Mass transfer in crystallisation Crystallisation methods of refining and production of single crystals of metals and alloys Bridgman method Czochralski method of single crystal preparation Zone melting methods Vertical zone melting (floating zone method) Preparation of single crystals with a homogeneous or given distribution of admixtures Verneuil method Preparation of single crystals from the gas phase, the vapour–liquid–solid (VLS) method Preparation of single crystals from the solid phase – recrystallisation methods Rapid solidification
Questions:
After studying this chapter you will be able to clear up the following terms: 1. What are clusters? 2. Define the homogenous and heterogenous nucleation. 3. Which thermodynamic values are applied in the phase transformation?
4. What is a relation between melting entropy, melting enthalpy and melting temperature of a pure substance?
5. Which kinetic factors are decisive for phase transformations? 6. Define equilibrium, kinetic and effective distribution coefficient. 7. What is the distributing number in crystallization? 8. What is the distribution coefficient value in a case when an admixture increases the melting
point of the basic metal? 9. How can be the equilibrium distribution coefficient value determined thermodynamically? 10. How can be the equilibrium distribution coefficient value determined from the binary
diagram? 11. For what conditions the Hayes-Chipman equation applies? 12. In which types of binary diagrams does retrograde solubility occur? 13. Which model equations are used for modelling of solidus and liquidus curves in binary
systems? 14. Define the equilibrium distribution coefficient ko limB
A. What is the importance of bilogaritmic plotting of ΔT = f(X) function?
15. What is the principle of the directional crystallization, equation, crystallization profile? 16. What is the principle of the zone melting, equation, crystallization profile? 17. Describe the principle of directional crystallization with removal of the material and
experimental set-up 18. What is the importance of the mass transfer in crystallization? 19. General classification of the methods of refining and production of single crystals of
metals, alloys and special materials 20. Describe the Bridgman method. 21. Describe the Czochralski method of drawing the crystal from the melt. 22. Describe the “Floating zone” method. 23. Describe the principle of plasma melting of metals. 24. Describe the Verneuil method. 25. Describe the methods for the preparation of single crystals from the gas phase, the
vapour–liquid–solid (VLS) method. 26. Describe the methods for the preparation of crystals from the solid phase –
recrystallization methods.
Exercises for solving:
1. Perform modelling of a selected binary system in order to determine the equilibrium
distribution coefficient koBA of an admixture element B in a basic substance and its
function dependencies on temperature T and concentration of element B. Design an optimal type of model equations for the description of solidus and liquidus curves.
2. Perform modelling of a selected binary system in order to determine the equilibrium distribution coefficient according to the theory of dilute solutions. Compare the results with a real diagram and give reasons for an agreement, possibly the found-out differences.
3. Calculate the retrograde coefficient α according to Romanenko for the selected element. Use Table A1 (page 194) and the database of distribution coefficients as input data (Tables A2 to A6).
4. Calculate the solidus curve course using the retrograde coefficient α according to Romanenko for the selected binary system. Choose the real liquidus points as input data.
7. EVAPORATION, CONDENSATION, TRANSPORT REACTIONS
Time needed to study: 240 minutes
Aim: After studying this chapter
You will be introduced to the basic terms of separation of substances through evaporation and
condensation. On the basis of p – T – X diagrams you will be able to determine the composition of solutions
and vapours in distillation. You will know what limitations have the systems with the azeotropic point. You will know the physical-chemical processes in sublimation and distillation. New values, as distribution coefficient, distribution number, coefficient of relative volatility
in distillation will be defined. You will be introduced to the separation of impurities through vacuum extraction. You will know the principle of the rectification and function of the rectification column
including practical applications. You will know about perspective methods of deep refining of substances through chemical
transport reactions. Actually, these will be: - Distillation of metals by means of a reversible endothermic exchange reaction. - Distillation of metals through sub-compounds. - Distillation by synthesis and dissociation of volatile compounds. - Van Arkel iodide method.
You will be introduced to a number of practically performed chemical transport reactions in order to refine concrete metals
Reading:

99
7. EVAPORATION, CONDENSATION, TRANSPORTREACTIONS
7.1. The theory of separation of compounds byevaporation and condensation
The phenomena of evaporation, sublimation, distillation and condensationare of great importance in the separation and refining of metals andtheir compounds. They are based on different tension (pressure) ofthe vapours of the separated elements, the main metal, the compoundsand the admixture.
The processes of evaporation and condensation are the main methodsin, for example, refining of magnesium, calcium, zinc and other metalscharacterised by high vapour tension. The industrial methods ofseparation of liquid chlorides, for example TiCl
4 and SiCl
4, are also
based on their different ability to transfer to the gas state. The processesof distillation and, in particular, the processes of redistillation orrectification, are used in the refining of intermediate products in theproduction of semiconductor materials, for example germanium (refiningof GeCl
4). Deep purification to remove admixtures is also carried
out by the distillation or sublimation of the main substance in theform of volatile compounds, for example, lower halogenides, whichdissociate after the separation of the pure component in differenttypes of transport reactions.
In subsequent sections, the term distillation will refer to the processof evaporation from liquids or melt and sublimation will be the directtransfer of substances from the solid to gas state.
The mathematical expression of the dependence of the pressureof saturated the vapours p of a substance on temperature T resultsfrom the laws of chemical thermodynamics and, in the final relationship,is described by the Clausius–Clayperon equation:
(0)ln ln ...evH Tp T I
RT R R
∆ α β= − + + + (37)

100
where ∆Hev(0)
is the molar enthalpy of evaporation of the substanceat temperature T = 0 K; α, β are temperature coefficients; I is theintegration constant.
For the majority of cases in technology, it is possible to ignorethe change of the enthalpy of evaporation with temperature. If∆H
ev = ∆H
ev(0) (where ∆H
ev is the change of the enthalpy of evaporation
of the substance at the boiling point), the temperature coefficientsα, β can be ignored and equation (37) changes to the following form:
log 2.303
evHp I
RT
−∆= + (38)
or, in general
log pT
A= − +β (39)
In this equation B = ∆Hev
/19.15. The empirical values of B andA can be found in thermodynamic tables.
The activity of the component in a solution is a function of theconcentration of this component which, in the overall form, characterisesthe degree of cohesion of the molecules or atoms of the component.On the basis of the activity it is possible to evaluate the deviationof the properties of the given component of the solution from itsproperties in the ideal solution at the same molar concentration.
Therefore, the activity ai of the component i is the value proportional
to concentration, i.e. the molar fraction xi
ai = γ
i x
i(40)
In equation (40), the term γi is the activity coefficient of component
i.According to the Raoult law, this term characterises the deviation
of the properties of the examined component in the given solutionfrom its properties in the ideal solution. Since the deviation of theproperties of the real solution from the properties of the ideal solutionis associated with the activity of the component in the solution, andthe activity of the given component in the solution is determinedby the vapour tension of this component in the saturated vapoursabove the solution: as the activity increases, the vapour pressure alsoincreases, and vice versa. Consequently, it is possible to determinethe activity of the component as the ratio of the tension of its vapoursabove the solution p
i to the tension of the saturated vapours of the
same component in the pure state pi0:
(41)a
p
pii
i
=0

101
For the ideal systems, governed by the Raoult law, the activitycoefficient is equal to 1. If the activity coefficient is higher or lowerthan 1, the activity of the component in the solution and the tensionof its vapours above the solution correspond to the higher or lowervalues than indicated by the Raoult law. Using this method, the deviationof the properties of the examined component in the given solution(the vapour tension in the present case) from the properties in thecorresponding ideal solution can be expressed either by the activityor activity coefficient. On the other hand, after measuring the vapourtension, it is possible to calculate the activity of the given componentin the solution.
In alloys close to the ideal solution, when the curves of activityof their component approximately corresponds to the Raoult law, itis possible to expected the approximate equality of the attractive forcesbetween the atoms of different types.
Figure 42 shows the curves of the vapour tension of metals inrelation to temperature, calculated on the basis of equation (39), whichmay be used to divide the metals approximately on the basis of theirvapour tension into four groups:I. Volatile – mercury, rubidium, cesium, potassium, cadmium,
sodium, zinc, magnesiumII. Medium volatility – strontium, lithium, calcium, barium, antimony,
leadIII. Low volatility – tin, manganese, chromium, silver, beryllium,
aluminium, copper, gold, iron, nickel.IV. Very low volatility – platinum, molybdenum, niobium, tantalum,
tungsten.From this approximate classification of the metals based on the
tension of their saturated vapours it is possible to evaluate the potentialcapacity for separation of these metals by distillation. The easiestmutual separation takes place in the case of the metals of the groupI and IV, whereas the metals of the groups II and III are more difficultto separate. The experiments show that, for example, the metals suchas beryllium, aluminium and magnesium, present in the same group,are very difficult to separate during distillation. This also relatesto the mutual separation of zinc and cadmium or magnesium fromthe admixtures of alkaline metals present in them. Refining of thesemetals by subsequent rectification distillation has been technicallymastered.

102
Fig. 42a. Temperature dependence of the vapour tension of some metals.
Fig. 42b. Temperature dependence of the vapour tension of some metals.
Temperature [K]
Pre
ssu
re [
Pa
]
Liquid
LiquidSolid
Temperature [K]
Pre
ssu
re [
Pa
]
White
Red
tmA
tmA
Solid

103
7.2. The relationship between the composition of thevapour and the solution
The activities of metals in alloys, or the activities of componentsin solutions, determine the intensity of the condensation processes.It is also important to examine the problem of the relationship betweenthe composition of the vapour above the solution and the compositionof the solution, if the latter contains both components. Generally,the relative content of the components in the vapour differs fromtheir average composition in the solution.
Returning to the ideal systems, the composition of the vapour abovethe solution is equal to the composition of the solution only in theA–B system in which the components have the same vapour tensionin the pure condition, i .e. when p 0
A = p 0
B. However, this case is
exceptional. Usually, the composition of the vapours differs fromthe composition of the solutions and the difference increases withincreasing difference of the tension of the vapours above the purecomponents. In the simplest systems, the dominant component in thegas phase in comparison with a liquid phase is always the componentcharacterised by the higher vapour tension in the pure condition.
It is assumed that it is component B. Figure 43 shows (dashedlines) the symmetric curves expressing the dependence of thecomposition of the vapour on the composition of the solution in theideal system. The diagonal of the square corresponds to the case inwhich the composition of the vapour and the solution is identical.The deviation from the diagonal increases with an increase in thedifference of the pressures of the vapours of the components in thepure condition.
Fig. 43. Composition of equilibriumsolutions and vapours in varioussystems.Composition of solution
Co
mp
osi
tio
n o
f va
po
urs
.
.
.
.
. . . .

104
In systems characterised by a deviation from the Raoult law, whichare characterised by the nonlinear dependence of the compositionof the vapour on the composition of the solution, the dependenceof the composition of the vapour on the composition of the solutionis indicated by complicated curves. These curves are shown by solidcurves in Fig 43. The positive deviation of the vapour pressure causescurvature in the upper part of the curves, negative curvature in thelower part. The curvature of the curves increases with an increaseof the magnitude of the deviation of the vapour pressure from thelinear dependence. The solutions, corresponding to the maximum orminimum points, are referred to as azeotropic (constantly boiling).They play a significant role in the distillation processes. These solutionsare indicated by the points of intersection of the curves with the diagonalof the square in Fig 43.
7.3. Change of the composition of solutions and vapoursin relation to temperature and composition–boilingtemperature and composition–vapour pressure diagrams
Figure 44 shows the typical diagrams of the composition of the solution–boiling temperature and the composition of the solution–vapour pressuresystems. The diagrams, representing the relationship between the boilingpoint and the composition of the mixture, always contain two curves,one of which corresponds to the temperatures and composition ofthe liquid phase (melt) and the other one to the composition of thevapour. In this case, the lower curves correspond to the compositionof the solution and the upper curves the composition of the vapour.In the composition–vapour pressure diagrams, the position of the curvesis reversed. The systems with the minimum on the curves of the boilingpoints are characterised by the maximum on the vapour pressure curves,and vice versa.
Initially, attention will be given to a system that is similar to thefirst type (Fig. 45a), i.e. it is governed by the Raoult law. If the solution(melt) with the composition N
1 is heated, the solution starts to boil
when temperature t1 is reached. The composition of the vapour,
equilibrium with the solution, is N3. Because the content of component
B in the vapour is higher than the content in the solution, afterevaporation of a certain amount of the solution the remaining partof the solution will contain a high content of component A and itscomposition will be, for example, N
2. The solution of this composition
can be brought to boiling only if the temperature is increased to t2.
The vapour which is in equilibrium with the solution, has composition
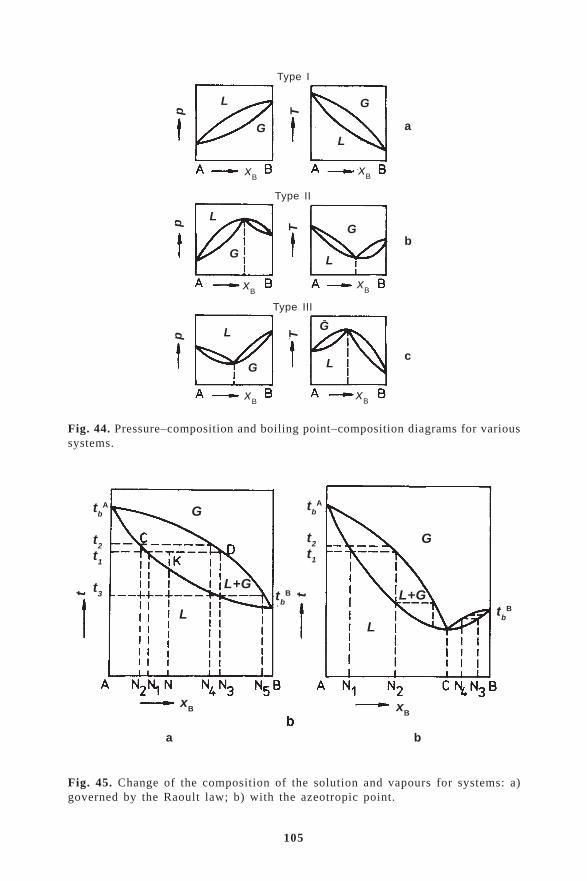
105
Fig. 44. Pressure–composition and boiling point–composition diagrams for varioussystems.
Type I
Type II
Type III
a
b
c
a b
Fig. 45. Change of the composition of the solution and vapours for systems: a)governed by the Raoult law; b) with the azeotropic point.
p
L
G
T
L
G
p L
G
T
L
G
p L
G
T
L
G
tbA
t2
t1
t3t tbB
G
L
L+G
xB xB
tbB
G
L+G
L
tbA
t2
t1
t
xB
xB
xB
xB
xB
xB

106
N4. It also contains a higher content of component B than the solution.
Consequently, the remainder of the solution is enriched with componentA and the boiling point increases. The consequence of evaporationis finally the formation of an almost pure component A and the boilingtemperature is t
bA.
The gas phase will now be discussed. If the vapour formed fromthe solution with the composition N
3 is condensed and the resultant
condensate is subjected to distillation, boiling will take place attemperature t
3 and the vapour will have a higher content of component
B (composition N5). The repetition of this process of condensation
and distillation may result in the situation in which the separatedvapours is represented by the almost completely pure component andthe boiling point will the t
bB. This method makes it possible to separate
the binary mixtures in the systems of this type by the method of repeateddistillation up to pure components.
In the systems of the second and third type (Fig. 44b and 44c)which are not controlled by the Raoult law and are characterised bya minimum or a maximum, and in which these points are referredto as azeotropic points, the separation into pure components by thismethod is not possible.
We examine the process of distillation in a system belonging totypes with azeotropic point C, i.e. the system has a minimum (Fig.45b). If the solution with the composition between points A and C(i.e. the solution differing from azeotropic) is subjected to, for example,distillation N
1, the vapour situated in equilibrium will have the
composition N2 and the content of component B in this vapour will
be higher than in the solution. The remainder, enriched with componentA, will boil at a higher temperature, for example, t
2. By continuing
distillation it is possible to ensure that the remainder will containthe pure component A.
The pure component B can never be produced from the solutionwith composition N
1. Repeated condensation and distillation of the
vapours may result only in composition C, and as a result of repeateddistillation it is possible to obtain only the vapour of the samecomposition C, because in azeotropic solutions the composition ofthe vapour is equal to the composition of the liquid. Consequently,the solution with composition N
1 can be divided by distillation only
to pure component A and azeotropic solution C. This conclusion isvalid for all solutions with the composition between A and C.
In condensation of alloys whose components in the pure state arecharacterised by greatly differing vapour pressures, the formationof azeotropic mixtures is less likely and the vapour usually contains

107
an insignificant amount of the volatile substance. In these alloys itis possible to obtain the most efficient separation. On the other hand,the metals with similar vapour pressures in a wide temperature rangeare more difficult to separate. The alloys of these metals arecharacterised by higher susceptibility for the formation of azeotropicsystems. Almost complete separation of the components is thecharacteristic feature of the melt of the binary alloys of metals, Al–Zn, Al–Mg, Cu–Zn, Cu–Cd, Cu–Bi, Cu–Li, Sn–Bi, Cu–Pb, Pb–Zn.On the other hand, separation of the melts of the following binaryalloys is not possible or is incomplete: Al–Be, Al–Si, Cu–Ni, Cu–Si, Cu–Fe, Fe–Ni, Fe–Co, Ni–Co, Pb–Sn. The alloys Pb–Zn, Cu–Pband Cu–Fe are characterised by limited solubility in the liquid stateand are not governed by the previously described relationships. Itis very difficult to separate by distillation the alloys forming, forexample, silicides and alloys with intermetallic compounds, for example,Fe–Si, Pb–Ca.
In distillation, the metal vapours are removed from the evaporationspace into the condensation space. Condensation starts at a temperatureat which the partial pressure of metal in the gas is equal to the partialpressure of the vapour of the pure metal:
pM
= p0M
(42)
Condensation starts with the formation of condensation nuclei andcontinues by the growth of these nuclei or by the formation of newones. The condensation nuclei form by the mechanism in which atemperature decrease is accompanied by a decrease of the kineticenergy of metallic molecules and the contacting molecules remainin the form of liquid droplets acting as condensation nuclei. Thisphenomenon takes place during a change of energy because the formationof a liquid particle is accompanied by volume work and consumptionof energy for the formation of a new surface.
In condensation, it is necessary to ensure that the metal whichwas originally in the gas phase is transferred back to the liquid (oralready solid) condensate with maximum efficiency. The resultantliquid droplets may condense more efficiently if they are larger. Theoutgoing gas takes away the amount of vapours which decreases witha decrease of the temperature of the gas. If it is required to producethe metal in the liquid phase, the gas should be cooled down to themelting point of metal. However, at this temperature, there may stillbe a large amount of the metal in the form of vapour and, consequently,the loss of metal increases with an increase in the amount of the

108
outgoing gas from the condenser. If it is required to condense metallicvapours from highly diluted gases, the dew point is very low andmay approached the melting point. Consequently, the cooling rangeis also very narrow and a large part of metal remains in the gas state.
On the basis of the above results, it is possible to summarise thefollowing conditions of efficient condensation:– the partial pressure of metal vapours should be as high as possible,
the dew point should be approximately equal to the melting point;– the cooling rate of the gas should be low to ensure the formation
of larger condensed articles;– the gas should contain the minimum amount of foreign condensation
nuclei.These principles must be taken into account when designing
distillation and condensation systems and in the application oftechnology of production and refining of metals by distillation methods.
7.4. The physical–chemical nature of sublimation anddistillation processes
Sublimation can take place in cases in which the substance heatedto a temperature lower than the melting point is characterised bya sufficiently high vapour pressure. In sublimation, the admixturescharacterised by higher volatility than the main substance (usuallymetal), may already separate at a lower temperature, whereas theadmixtures with low volatility remain in the remainder after sublimation.
Distillation is a process of evaporation of liquids and makes itpossible to separate solutions or melts into their main parts characterisedby different vapour pressures. The principle of this refining andseparation method is the different composition of the equilibriumliquid and vapours. The quantification characteristics of refining orseparation are represented here by the separation coefficients ofdistillation K
F:
Kx
xK
x
xFG
LF
G
LA
A
AB
B
B
= =; (43)
where xLB
and xGB
is the molar amount of the substance B in the solution(L) and in vapours (G). As the difference between the values of K
FA
and KFB
and 1 increases, the efficiency of refining also increases.Because refining of the substances by distillation is accompanied
by the redistribution of the main metal A and the admixture B betweenthe gas and liquid phases, the so-called distribution number is ofconsiderable importance for deep refining of substances:

109
bK
KRF
F
= A
B(44)
In distillation of the solutions whose vapours are governed by thelaws of ideal gases, i.e. also by the Raoult law, the distribution numberb
R may be represented as the coefficient of relative volatility
bp
pR id = A
B
0
0 (45)
where p0A and p0
B are the pressures of the saturated vapours of the
main substance and the admixture.In real solutions, taking into account the interaction of the main
metal and the admixture, their activity also decreases and, consequently,the pressure of the saturated vapours drops. Consequently, in distillationof real solutions, the distribution number or the coefficient of relativevolatility must be expressed by the equation:
bp
pR id = A A
B B
0
0
γγ (46)
Because pure substances are mostly melts in which one atom ofadmixture B belongs to 106–109 atoms of the main component A, thenwithout a large error the concentration of the admixture tends to zeroand the activity coefficient γ
A may be equal to one. Consequently:
bp
p
bR x
R id
( )→ = =0
0
0A
B B Bγ γ (47)
This shows that the coefficient of relative volatility (distributionnumber) in distillation of admixture B with a very low concentrationis to a certain degree affected by the value of the activity coefficientγ
B of this admixture. However, research shows that the behaviour
of admixtures during efficient refining of substances by means ofdistillation is rarely governed by the laws of ideal gases.
In distillation, the concentration of admixtures in the remainingliquid phase is uniform, especially as a result of the efficient diffusionof admixtures in this phase, and the admixtures therefore do not buildupin the surface layer because it is possible to obtain a very pure maincomponent (with purity higher than in sublimation), without the riskof contamination of the distillate with admixtures. The characteristicfeature of distillation is also that it may be carried out as a continuousprocess whereas sublimation is only a discontinuous, periodic process.
The rate of the sublimation process and of distillation is affectedby a large number of factors. The most important factors are the

110
composition of the alloy (content of the admixtures), the size of thesurface, temperature and residual pressure. The rate of evaporationincreases with an increase of the concentration (activity) of thecomponent in the alloy and with increasing vapour pressure of thecomponent. On the other hand, taking into account the fact thatevaporation is independent of the nature of deviation from the Raoultlaw, providing the activity of the components of the alloy decreases,the rate of evaporation decreases regularly.
Since evaporation takes place from the surface layers, the surfaceof the metal should be as ragged as possible to ensuring a high rateof the evaporation process. Increasing temperature increases the rateof evaporation of metal but for different components (admixtures)of the melt, the extent of this acceleration may differ. Therefore,with increasing temperature it is necessary to consider the risk ofpossible contamination of the condensate (sublimate, distillate) withadmixtures with lower volatility.
Special attention will be given to the effect of residual pressure.The rate of evaporation, like the rate of any physical chemical process,depends strongly on the rate of removal of the resultant productsfrom the reaction zone. In our case, the residual gases inhibit evaporationbecause they reduce the rate of diffusion of the gases in the directionof the condenser (the condenser is part of the distillation system inwhich condensation takes place, i.e. a change of the state of the gasphase to the liquid phase). As the residual pressure and, consequently,the density of residual gases increase, the rate of diffusion of vapoursto the condenser decreases and, consequently, the rate of evaporationdrops. On the other hand, as the residual pressure decreases, the speedof approach of the evaporating metal to the condenser increases and,consequently, the evaporation rate increases. Therefore, distillationand sublimation should be carried out in vacuum because in this casesuitable rates of evaporation for practice are already obtained atrelatively low temperatures.
Vacuum has a beneficial effect on the continues removal of metalvapours from the reaction space. The processes of sublimation anddistillation are characterised by sufficiently higher rates for practicalpurposes only when the equilibrium pressure of the vapours of distilledmetal is the same or higher than the residual pressure in the system.The main task of vacuum is not only the protection of evaporatedmetal against oxidation but also to reduce the partial pressure of gasesand, consequently, the content of these gases in the metals subjectedto vacuum treatment.
111
7.5. The removal of admixtures by evaporation in vacuum
When examining of sublimation and distillation it is usually assumedthat the admixtures are characterised by low vapour pressures or higherboiling point than the main metal. However, cases are often encounteredin which distillation or sublimation may be used for the removal ofcertain admixtures without affecting the main metal. In these cases,the admixtures can be removed from the main metal by heating themetal in vacuum, for example, highly volatile admixtures such aszinc and cadmium from lead, zinc and cadmium from silicon, arsenicand antimony from germanium, etc.
The vapour pressure of the admixtures greatly decreases and therate of removal of admixtures is lower if they react chemically withthe main metal. For example, the vapour pressure of arsenic aboveits solution in a silicon melt is higher than the vapour pressure ofphosphorus above its solution in the silicon melt. This may be explainedthat the fact that phosphorus forms with silicon a considerably strongerchemical bond than silicon with arsenic, thus reducing the activityof phosphorus in the alloy.
The rate of evaporation of admixtures from the main metal dependson the residual pressure above the solution and the rate of diffusionof the admixtures to the surface of the metal. For efficient removalof admixtures it is necessary to ensure that the residual pressure inthe system is (if possible) lower than the equilibrium pressure andthe evaporation area should be large.
In certain cases, good results with the removal of admixtures byevaporation are obtained by heating the purified material in a gasstream with which the admixture may react with the formation ofa volatile compound and evaporate. Usually, hydrogen is used forthese purposes: it reduces many oxides, sulphides, selenides, halogenides.The reduced admixtures evaporate and halogenides, sulphur and seleniumare removed in the form of HCl, H
2S, etc. Moist hydrogen is used,
for example, for the removal of boron from silicon, whereas hydrogenreact with boron with the formation of volatile hydride BH
3. Similarly,
by passing the vapours of SiCl4 above molten silicon, it is possible
to purify silicon to remove the admixtures forming volatile halogenides:
3 SiCl4 + Al
4Si
3 → 4 AlCl
3 + 6 Si (48)
The separation of compounds with different volatility may be carriedout efficiently by the continuous counterflow process, in which theoperations of distillation and condensation are repeated many times.
112
This process is referred to as rectification which takes place in therectification column. The rectification column is a continuously orperiodically operating system used for the separation of two- or morecomponent mixtures. Rectification and distillation are based on thedifferent volatility of components, and theoretically it is possibleto obtain any degree of separation with the result close to 100%.Distillation can be efficiently for separating two elements of the liquidphase if their boiling points differ by more than 50 °C. Rectificationmakes it possible to separate elements with the boiling points differingby no more than 0.5 °C. At present, rectification is one of the mostwidely used methods of distillation separation of pure components.The method is relatively simple, equipment is compact, the processis continuous. Because of all these factors, rectification is a widelyused method in industry in the production of pure metals andsemiconductor materials.
To ensure that the separated mixture can be subjected to rectification,the components of the mixture must fulfil a number of conditions;– they must be stable in the rectification conditions– the boiling point of these components must not be too high;– if possible, they should be characterised by high relative volatility;– they should not form an azeotropic mixture together;– if possible, the difference between the boiling and melting points
of the components should be large.The last requirement is very important because to ensure efficient
rectification, it is necessary to condense part of the vapours leavingthe column and return them back the form of a melt. This is difficultto realise if the melting and boiling points are similar and it iscompletely impossible if the substance does not melt but is directlytransferred to the vapours, i.e. sublimates. Certain elements, Hg, Zn,Cd, Li, Br, can be rectified directly in the main form. However, ina number of cases, the process can be carried out only using volatilecompounds. At present, rectification is used in industry in refiningof TiCl
4, SiCl
4, GeCl
4, for the separation of compounds of Zr and
Hf and for purification of a number of metals.
7.6. Principle of the rectification process
If the flow of the vapours leaving the evaporating surface in distillationmaintains the direction of movement identical up to the moment ofreaching the condensation surface, rectification is based on the factthat the flow of the liquid – condensed vapours (condenser)-flowsagainst the advancing flow of the vapours. Distillation is accompanied

113
Fig. 46. Rectification column.
only by evaporation and condensation, whereas rectification ischaracterised, as a result of close contact of both phases, by the transferof heat and mass and, consequently, the maximum contact surfaceof these media is important, Fig. 46.
Figure 46 shows the diagram of the rectification column consistingof four main components: 1 boiler, 2 heating element, 3 column,4 condenser. The rectification column has a number of horizontalbarriers 5 in the form of trays in five or more distillation levels.The solution to be rectified is heated and supplied through the gate6 to one of the central levels, fills the level and flows down througha pipe into a tray on a lower level. On this level, the solution meetsthe rising vapour which bubbles through the solution, passes throughthe pipes 8, close with lids ensuring efficient contact between thevapours and the liquid. In contact with the liquid, the less volatilecomponent transfers its evaporation enthalpy to the liquid and condensesto the liquid. Consequently, the content of the component with theboiling temperature higher than that of the vapour in the condenserdecreases. At the same time, the liquid receives part of the heat andforms vapours characterised by a higher content of the componentwith the lower boiling component that of the liquid. Consequently,the vapour passing through the pipe 8 into higher levels is enrichedwith the more volatile component that the liquid flowing into thelower levels through the pipe 7. This process is repeated on eachlevel and, consequently, in the column with a large number of levelsand with efficient regulation of the operating conditions of the column

114
vapours leaving the upper part of the column contain an almost puremore volatile component and the liquid, flowing into the boiler, isformed by a substance with a lower volatility. This liquid is representedby, for example, the so-called distillation residue discharged fromthe boiler through the gate 9.
A suitable example of the application of rectification is thepurification of TiCl
4 to remove the admixtures, mostly chlorides with
a low boiling point. The boiling point of TiCl4 is 136 °C and, for
example, the boiling point of SiCl4 is 57 °C. Tetrachlorides are
characterised by sufficiently high volatility, a large difference betweenthe boiling and melting points and not form together azeotropic mixtures,because the TiCl
4–SiCl
4 system is governed by the Raoult law.
Consequently, rectification can be used with high efficiency. As indicatedby the temperature–composition diagram of the TiCl
4-SiCl
4 system
(Fig. 47), the vapour is in equilibrium with the liquid; at the giventemperature, the vapour is always enriched with low-boiling SiCl
4.
The first stage of rectification takes place in the conditions ensuringthe separation of SiCl
4 from TiCl
4 which forms the distillation residue.
For the separation of other admixtures, i.e. chlorides less volatilethan TiCl
4, it is necessary to repeat rectification. Another example
of the application of rectification is the well-known separation ofzinc ( tZn
b = 906 °C) from cadmium with high volatili ty ( t
bCd =
768 °C).The theory of rectification of, in particular, two-component mixtures
has been developed quite sufficiently and it is supported by a largenumber of analytical, graphic and calculation methods. The applicabilityof rectification depends basically on the following factors:– the distribution number b
R which is typical of the given solution
and depends on the composition of the system (concentration ofthe admixture);
– the number of levels in the column;– the efficiency of operation of every level of the column, which
is associated with the rate of the process and design of the individuallevels (trays).In the rectification of multicomponent mixtures, it is necessary
to use several columns after each other. The products are taken fromthe top of the rectification column (distillate) and from the bottomof the rectification column (distillation residue) or from a certainheight (lateral removal).
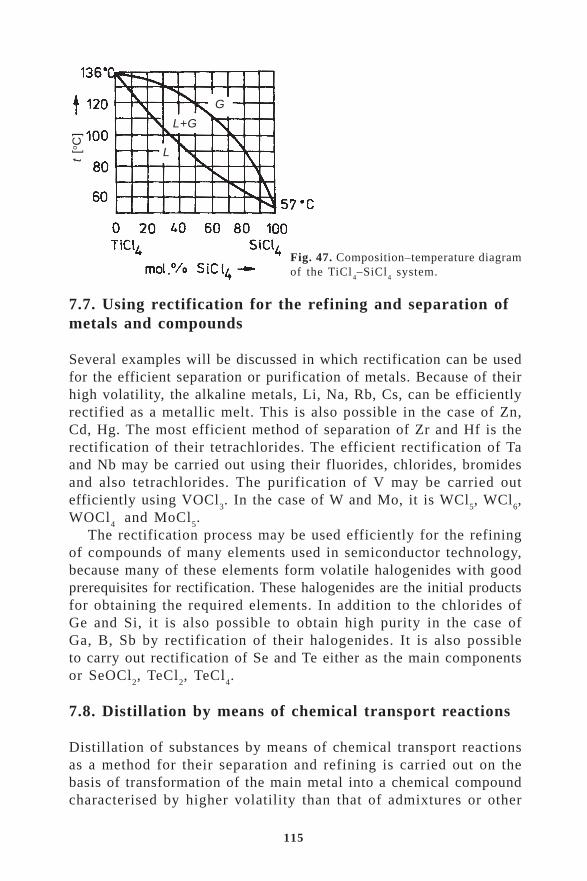
115
7.7. Using rectification for the refining and separation ofmetals and compounds
Several examples will be discussed in which rectification can be usedfor the efficient separation or purification of metals. Because of theirhigh volatility, the alkaline metals, Li, Na, Rb, Cs, can be efficientlyrectified as a metallic melt. This is also possible in the case of Zn,Cd, Hg. The most efficient method of separation of Zr and Hf is therectification of their tetrachlorides. The efficient rectification of Taand Nb may be carried out using their fluorides, chlorides, bromidesand also tetrachlorides. The purification of V may be carried outefficiently using VOCl
3. In the case of W and Mo, it is WCl
5, WCl
6,
WOCl4
and MoCl5.
The rectification process may be used efficiently for the refiningof compounds of many elements used in semiconductor technology,because many of these elements form volatile halogenides with goodprerequisites for rectification. These halogenides are the initial productsfor obtaining the required elements. In addition to the chlorides ofGe and Si, it is also possible to obtain high purity in the case ofGa, B, Sb by rectification of their halogenides. It is also possibleto carry out rectification of Se and Te either as the main componentsor SeOCl
2, TeCl
2, TeCl
4.
7.8. Distillation by means of chemical transport reactions
Distillation of substances by means of chemical transport reactionsas a method for their separation and refining is carried out on thebasis of transformation of the main metal into a chemical compoundcharacterised by higher volatility than that of admixtures or other
Fig. 47. Composition–temperature diagramof the TiCl
4–SiCl
4 system.
G
L+G
Lt [o
C]

116
components. In the subsequent dissociation of a compound with lowvolatility, it is possible to produce distilled metal which is usuallycharacterised by a considerably higher purity in comparison with directdistillation, if this can be carried out [43].
The principle of distillation by means of chemical transport reactionsis based on the reversible reaction between the substance (A) andthe gas or vapour (B) with the formation of a gaseous product (C):
m rS L G GA B C[ , ] [ ] [ ]+ (49)
If in one area of equipment this reaction takes place from leftto right and in the other area in the opposite direction, in the formerpart the amount of the solid or liquid phase decreases and in theupper part of equipment increases. This process results in the distillationor transfer of the given substance from one part of equipment to anotherby means of a chemical transport reaction.
7.9. Distillation of metals by means of a reversibleendothermic exchange reaction
The metals and elements characterised by the very low vapour pressureat temperatures used in practice, may be distilled by means of areversible exchange reaction of the following type:
m n m nm G
T
T n G G Me + M Me + Ma[ ] [ ] [ ] [ ]1
2cond a X X →← (50)
where Me is the non-volatile metal with valency n; Ma is the volatilemetal with valency m; X is a halogenide.
The distillation of metals by means of the so-called indirectdistillation makes it possible to reduce greatly amount of heat requiredfor the transfer of metals from the solid to gas state. The principleof this method is therefore based on the combination of the stronglyendothermic process of direct evaporation and the exothermic reaction.Schematically, these reactions may be described by the followingequations:
m m m HG Me Me[ ] [ ]cond ev →← − ∆ (51)
n n m n HG m G n G G b Me Ma Me Ma[ ] [ ] [ ] [ ]+ →← + +X X ∆ (52)
where ∆Hev
is the change of the enthalpy of evaporation of the metal;∆H
b in the change of the enthalpy of the exothermic reaction.
The joint occurrence of these reactions results in the transfer ofmetal Me into a gas compound in the form of MeX;

117
Fig. 48 Distilation of metal [Me] by a reversible endothermic reaction (T1>T
2):
mMe[cond]
+nMaXm[G]
mMeXn[G]
+nMa[G]
.
m n m n m H Hm G
T
T n G G b Me [cond] + →← − − Ma Me + Ma[ ] [ ] [ ]X X ev1
2∆ ∆(( ) (53)
Therefore, this process is less endothermic than direct evaporationand, consequently, it takes place at a considerably lower temperature.This process is a reversible and, consequently, after transport in coolingto temperature T
2 the re-condensed non-volatile metal (Me) and the
vapours of the volatile halogenide of the metal (MaX) form againin a new area as the product of the reaction. In order to ensure thatthe reaction is reversible, both the metals and halogenides must notform mutually stable compounds in the conditions of the reactiontaking place.
The distillation of metals by their stable halogenides is realisedin practice by passing the vapours of the halogenides of the volatilemetal above the non-volatile metal. The resultant transport gas mixturecools down in a different area of the apparatus and this results ina reverse process and the non-volatile metal condenses completelyor partially free from halogenides or contains a certain amount ofthese halogenides (depending on the properties of the reactingcompounds and the process conditions), Fig. 48.
Since the reaction of indirect distillation is endothermic, increaseof temperature supports the occurrence of this reaction, and a decreaseof pressure increases the reaction rate. The efficiency of separationand refining of metals in indirect distillation depends on the affinityof the metal and individual admixtures for the individual halogenides,i.e. on the decrease of the Gibbs energy with the formation ofhalogenides and on the concentration of each element in the alloy.A suitable example is the refining of beryllium, titanium and nickel:
Be + 2 NaCl Cl + 2 Na[ ] [ ] 2[ ] [ ]S G G G →← Be (54)
Ti + NaCl TiCl + Na[ ] [ ] [ ] [ ]S G G G4 44 →← (55)
Ni + HCl NiCl + H[ ] [ ] [ ] [ ]S G G G2 2 2 →← (56)
nMaXm[G]
mMe[cond]nMeXn[G]+nMa[G] mMe[cond]
nMaXm[G]
T1T

118
In the vacuum conditions, the activity of these reactions is quitehigh in the range T
1 at the evaporation temperature and the temperature
of condensation of chlorides at 800 °C and in the range T2 at the
temperature of the reaction of 1000 to 1250 °C. It should be stressedthat at the reaction temperature T
2 = 1400 °C, the amount of distilled
titanium is 500 times larger than the amount which would have beenobtained in simple evaporation of metallic titanium in the sametemperature conditions.
7.10. Distillation of metals through sub-compounds
Another method of obtaining a high degree of purification and separationof metals by means of chemical transport reactions is distillationor sublimation of sub-compounds of metals. The sub-compounds arehighly volatile non-saturated compounds of metals with a reducedvalency. The compounds with reduced valency form in cases in whichnot all valency electrons of the atom take part in the chemical reaction,and only those characterised by the weakest bonding with the coreparticipate, i.e. those characterised by the lowest value of the ionisationpotential. The sub-compounds form at higher temperatures, mainlyin the inert atmosphere or in vacuum, with the simultaneous reactionof the atom of the metal with some of the chemical compounds ofthe same metal, for example, halogenide:
Me Me Me+ →← X XT
T
1
22 (57)
In this case, the process becomes less endothermic in comparisonwith simple sublimation or distillation. The reaction may be describedas the sum of two reactions:
Me Me[cond] [ ] →← −G evH∆ (58)
Me + Me Me[ ] [ ] 2 [ ]G G G bHX X →← + ∆ (59)
Me + Me Me[cond] [ ] 2 [ ]X XG
T
T G ev bH H1
2
→← − −( )∆ ∆ (60)
On the whole, the reaction remains endothermic but in comparisonwith direct distillation it is less endothermic so that the distillationprocess may be realised at a considerably lower temperature. Thepreviously mentioned reaction (59) is reversible. At a high temperature(T
1) reaction (60) takes place in the direction of formation of volatile
sub-compounds. After cooling to temperature (T2), the sub-compound
formed in this manner dissociates into a metal and its compound witha high valency, Fig. 49. In this case, the carrier of distilled metal

119
Fig. 49 Diagram of distillation of metal through sub-compounds, transfer of metalto the cold zone, T
1 > T
2: Me
[cond]+MeX
[G] Me
2 X
[G].
is the volatile compound with reduced valency (sub-compound) ofthe same metal. An increase of temperature and a decrease of pressureaccelerate the reaction of formation of the sub-compound and,consequently, the process of transport distillation of the metal.
The formation of compounds of the univalent subchloride AlClat higher temperatures (T
1 ≈ 1000 °C) is a consequence of the chemical
reaction of metallic aluminium with AlCl3 compound with a higher
valency:
2 Al + AlCl AlCl[cond] 3[ ] [ ]G
T
T G1
23 →← (61)
The compounds of the univalent metal usually exist in the gasstate (in the inert atmosphere or in vacuum). With a decrease oftemperature (T
2 ≈ 600 °C), the equilibrium of the reaction of the
formation of sub-compounds of metals is displaced the left and thesecompounds dissociate into the transported metal (aluminium) and itscompounds with a higher valency (AlCl
3).
The capacity of aluminium to form volatile compounds with a lowervalency, in particular, subfluorides and subchlorides, may be utilisedfor the separation of aluminium from other metals and for deep refiningto remove admixtures. The refining of aluminium by means of sub-compounds takes place in special distillation columns in accordancewith the reactions:
AlF + 2 Al 3 AlF 2 Al + AlF3[ ] [ ] [ ] [ ] 3[ ]1 2
G LT
GT
L G → → (62)
AlCl + 2 Al 3 AlCl 2 Al + AlC3[ ] [ ] [ ]C
[ ]G L G S1000 600 C → →° ll3[ ]G (63)
Other examples:
Si + SiCl 2 Si Cl[ ] 4[ ] 2[ ]S G G →← (64)
Ti + TiCl 2 Ti Cl[ ] 4[ ] 2[ ]S G G →← (65)
MeX[G]
T1 T2
Me[cond]
Me2X[G]
Me[cond]
MeX[G]
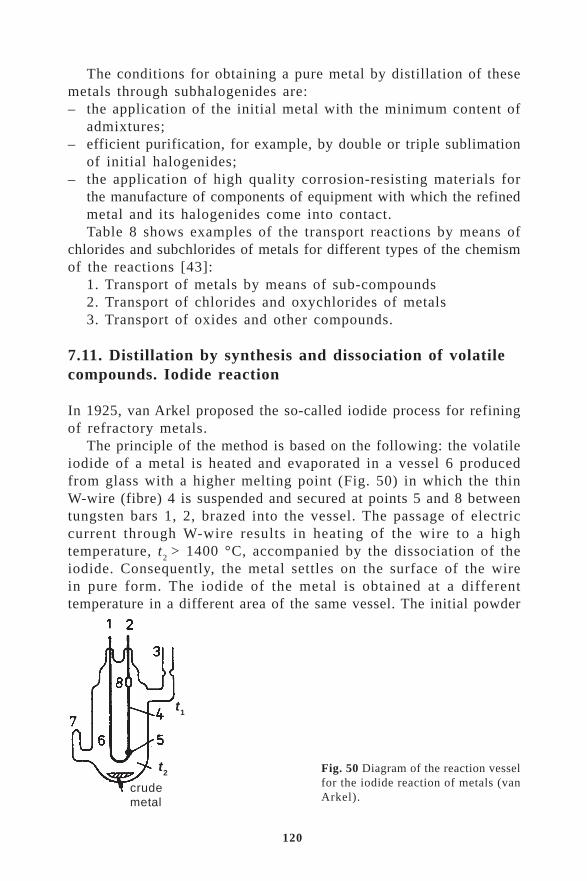
120
The conditions for obtaining a pure metal by distillation of thesemetals through subhalogenides are:– the application of the initial metal with the minimum content of
admixtures;– efficient purification, for example, by double or triple sublimation
of initial halogenides;– the application of high quality corrosion-resisting materials for
the manufacture of components of equipment with which the refinedmetal and its halogenides come into contact.Table 8 shows examples of the transport reactions by means of
chlorides and subchlorides of metals for different types of the chemismof the reactions [43]:
1. Transport of metals by means of sub-compounds2. Transport of chlorides and oxychlorides of metals3. Transport of oxides and other compounds.
7.11. Distillation by synthesis and dissociation of volatilecompounds. Iodide reaction
In 1925, van Arkel proposed the so-called iodide process for refiningof refractory metals.
The principle of the method is based on the following: the volatileiodide of a metal is heated and evaporated in a vessel 6 producedfrom glass with a higher melting point (Fig. 50) in which the thinW-wire (fibre) 4 is suspended and secured at points 5 and 8 betweentungsten bars 1, 2, brazed into the vessel. The passage of electriccurrent through W-wire results in heating of the wire to a hightemperature, t
2 > 1400 °C, accompanied by the dissociation of the
iodide. Consequently, the metal settles on the surface of the wirein pure form. The iodide of the metal is obtained at a differenttemperature in a different area of the same vessel. The initial powder
Fig. 50 Diagram of the reaction vesselfor the iodide reaction of metals (vanArkel).
t2
t1
crudemetal
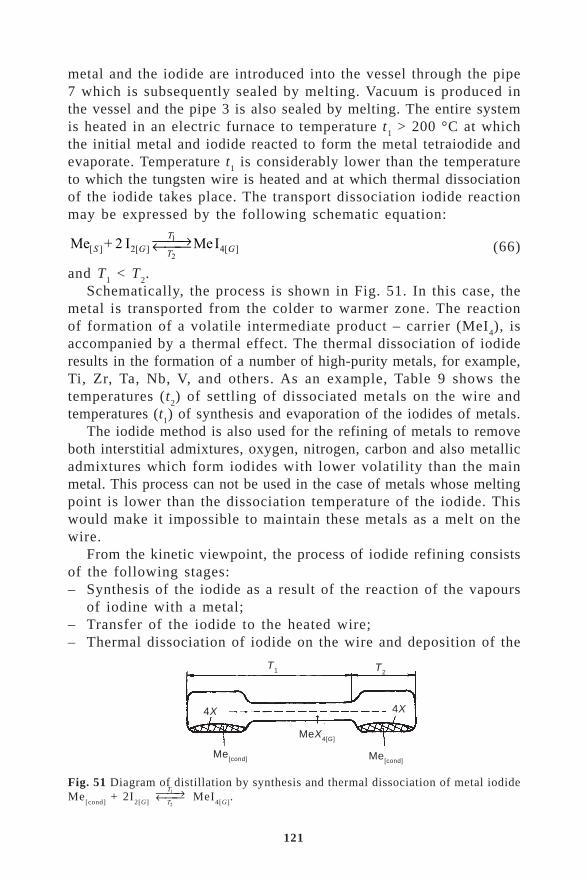
121
metal and the iodide are introduced into the vessel through the pipe7 which is subsequently sealed by melting. Vacuum is produced inthe vessel and the pipe 3 is also sealed by melting. The entire systemis heated in an electric furnace to temperature t
1 > 200 °C at which
the initial metal and iodide reacted to form the metal tetraiodide andevaporate. Temperature t
1 is considerably lower than the temperature
to which the tungsten wire is heated and at which thermal dissociationof the iodide takes place. The transport dissociation iodide reactionmay be expressed by the following schematic equation:
Me + 2 Me[ ] 2[ ] 4[ ]1
2S G
T
T GI I →← (66)
and T1 < T
2.
Schematically, the process is shown in Fig. 51. In this case, themetal is transported from the colder to warmer zone. The reactionof formation of a volatile intermediate product – carrier (MeI
4), is
accompanied by a thermal effect. The thermal dissociation of iodideresults in the formation of a number of high-purity metals, for example,Ti, Zr, Ta, Nb, V, and others. As an example, Table 9 shows thetemperatures (t
2) of settling of dissociated metals on the wire and
temperatures (t1) of synthesis and evaporation of the iodides of metals.
The iodide method is also used for the refining of metals to removeboth interstitial admixtures, oxygen, nitrogen, carbon and also metallicadmixtures which form iodides with lower volatility than the mainmetal. This process can not be used in the case of metals whose meltingpoint is lower than the dissociation temperature of the iodide. Thiswould make it impossible to maintain these metals as a melt on thewire.
From the kinetic viewpoint, the process of iodide refining consistsof the following stages:– Synthesis of the iodide as a result of the reaction of the vapours
of iodine with a metal;– Transfer of the iodide to the heated wire;– Thermal dissociation of iodide on the wire and deposition of the
Fig. 51 Diagram of distillation by synthesis and thermal dissociation of metal iodideMe
[cond] + 2I
2[G]
T
T
1
2
→← MeI4[G]
.
T1 T2
4X 4X
Me[cond]
MeX4[G]
Me[cond]

122
Table 8. Transport reaction of chlorides and subchlorides of metals
tnemelEtropsnarTdnuopmoc
noitcaertropsnarTsnoitidnoC
t1/t
2]Cº[
sdnuopmoc-busfosnaemybslatemfotropsnarT.1
eBB
aGrZbNaTiToM
WuAlAiSiSeFoCuC
lCaNlCB3
lCaG3
lCrZ4
lCbN5
lCaT5
lCiT3
lC2
lC2
lC2
lClA3
lCiS4
lClA3
lCHlCHlCH
lCeB=lCaN2+eB2
aN2+lCB+B23
lCB3=lCaG+aG23
lCaG3=lCrZ3+rZ4
lCrZ4=3
lCbN4+bN5
lCbN5=5
lCaT4+aT5
lCaT5=4
lCiT2+iT3
lCiT3=2
lC2/5+oM2
lCoM=5
lC3+W2
lCW=6
lC3+uA22
uA=2
lC6
lClA+lA23
lClA3=lCiS+iS4
lCiS2=2
lClA+iS3
lCiS=2
lClA+lCeF=lCH2+eF2
H+2
lCoC=lCH2+oC2
H+2
H2/1+lCuC=lCH2+uC32
12/0001
0001/0021 A
004/0041004/0041
006/0001
12/0001008/0001
006/009005/006
slatemfosedirolhcyxodnasedirolhcfotropsnarT.2
lCV3
lCOVlCbN3
lCObN2
lCaT3
lCOiTlCoM3
lCOlAlCOrClCOeF
lC2
lCV4
lCbN5
lCbN5
lCaT5
lCHlCoM5
lCbN5
lCrC4
lC+2
lCH
lCV3
lC2/1+2
lCV=4
lCV2+lCOV4
lCOV=3
lCV2+3
lCbN3
lCbN+5
lCbN2=4
lCObN2
lCbN+5
lCObN=3
lCbN+4
lCaT3
lCaT+5
lCaT2=4
lCiT=lCH2+lCOiT3
H+2O
lCoM3
lCoM+5
lCoM2=4
lCbN+lCOlA5
lA2/1=2
lC6
lCObN+lCrC+lCOrC24
lC+2
OrC=2
lC2
lCrC2+3
lCeF=lCH2+lCOeF3
H+2O
052/003007/008553/093053/004063/085055/056052/003083/004048/0001
053~
sdnuopmocrehtodnasedixofotropsnarT.3
OeBaT
2O
5
aT2O
5
aT2O
5
lA2O
3
lA2
3OeF
2O
3
OiS2
OWeF4
SoM2
OiT2
lCHlC2
lCHlCaT5
lCHlC2
lCHlCaT5
lCHlC2
lCH
lCeB=lCH2+OeB2
H+2O
aT2O
5lC3+2
lCOaT2=3
O2/3+2
aT2O
5lCOaT2=lCH6+3
H3+2O
aT2O
5lCaT3+5
lCOaT5=3
lA2O
3lClA2=lCH6+3
H3+2O
lA2O
3lC3+2
lClA2=3
O2/3+2
eF2O
3lCeF2=lCH6+3
H3+2O
OiS2
lCaT2+5
lCiS=4
lCOaT2+3
oWeF4
lCeF=lCH6+2
lCOW+4
H3+2O
SoM2
lC2/7+2
lCoM=5
S+2
lC2
OiT2
lCH4+4
lCiT=4
H2+2O
008/0001 D
007/059 A
006/0001 D
056/057 A
12/0001 D
12/0421 D
008/0001 A,D
12/0501
008/05912/0001
detaehanosmroflatem–D;lessevdelaesaniecalpsekatssecorp–A:tnemmoC.eriw

123
metal on the wire;– Transfer of released iodine from the wire back to the iodine container.The kinetics of association of volatile iodide, i.e. the rate of depositionof metal, is affected by the following factors:– Amount of iodine in the vessel;– Reaction temperature in the vessel;– Temperature of heated wire;– Formation of lower iodides.
The metals which can be efficiently refined by the van Arkel method,in which all the previously mentioned reactions take place in thesingle reaction vessel, include Ti, Zr, Hf. At temperatures at whichthe refining process is realised by volatile iodides, various compoundsof the metals to be refined, such as nitrides, carbonitrides, silicidesand also other intermetallic compounds, such as oxides, carbides,do not take part in these iodide transport reactions. The iodides ofthe bivalent metals, if they form, are characterised by insignificantvapour pressure and, consequently, do not take part in the transferprocess.
The iodide process can also be used for the production of alloys,if the reaction vessel is filled with a powder mixture of metals. Forexample, this method was used to produce alloys: Zr–Sn, Zr–Al, Ti-Zr, Zr–Hf, Zr–Cr, Zr–Ni, with a different concentration of thecomponents.
7.12. Suitability of the iodide process for different groupsof metals
Below, there is a brief survey of the suitability of using the iodide
Table 9 Pure metals produced by thermal dissociation of their iodides
tnemelE
noitcaeRerutarepmet
lessevnit
1]C°[
noitaicossiDerutarepmet
eriwnot
2]C°[
tnemelE
noitcaeRerutarepmet
lessevnit
1]C°[
noitaicossiDerutarepmet
eriwnot
2]C°[
eBrCuCfHbNeF
004008004008063005
008001100110061
0090011
iSaTiTrC
VrZ
002005002058009002
000100110041051100310041

124
process for different groups of metals in accordance with the periodictable of elements. For the metals of the group I and II there are novolatile compounds which would dissociate visibly below the meltingpoint of the metals. An exception from the elements of group II isberyllium which settles if the metallic fibre is heated in the vapoursof BeI
2. Of the elements of group III, more suitable conditions for
production of boron exist in its reaction with bromide. The groupIII also includes lanthanides. Their melting points are relatively highand, consequently, it may be possible to produce metals from theseiodides. This method has been used for the preparation of yttrium.The elements of group IV (Si, Ti, Zr, Hf) are normally produced bydissociation of their iodides. The metals produced by this methodare characterised by high ductility and good machinability. From themetals of group V (V, Nb, Ta), it is possible to produce only a limitednumber of compounds, for example, vanadium from iodides. However,since the vanadium tri-iodide VI
3 is unstable, it is evident that the
vanadium dioxide forms, which like a compound is characterised bylow volatility, like a series of bivalent compounds of the type MeI
2
and, consequently, the quartz reaction vessel must be heated to800 ºC. More favourable conditions exist in the case of Nb and Tawhich can be produced not only by thermal dissociation of the iodidesbut also chlorides. Chromium can be produced using a similar methodas in the case of vanadium. Of the elements of group VII, it has notas yet been possible to prepare manganese by this method, becausethe iodide of this element is characterised by low volatility, but onthe other hand Re, as a refractory metal, can be produced by thedissociation of its chlorides. Of the elements of the group VIII, inparticular the elements of the iron group, only iron can be producedby dissociation of iodide like iron. So far, nickel and cobalt couldnot be refined by the iodide method. This may be explained by thefact that these metals probably do not form iodides and their di-iodideshave low volatility.
In practice, nickel of relatively high purity is obtained by dissociationof nickel tetracarbonyl Ni(CO)
4
Ni+ 4 CO Ni(CO)C
C 4
60
200
°
° →← (67)
The carbonyl method is also suitable for the preparation of ironpowder of only commercial purity from pentacarbonyl Fe(CO)
5,
contaminated of course with carbon, oxygen and traces of admixturesof other metals, capable of forming carbonyl.
The iodide process may be used efficiently for the deposition ofvery thin layers with a thickness of up to 10 µm on the substrate
125
of various semiconductor materials. The efficiently purified iodideof a specific element is subjected to thermal dissociation on the surfaceof the substrate, heated to a suitable reaction temperature. This resultsin the formation of single crystal layers so that the technology canbe used for the preparation of miniature semiconductor componentsapplied in radio engineering, in computers and automation systems.
A classic example is at present the deposition of single crystallayers on silicon. The efficiently purified tetrachloride SiCl
4 or SiHCl
3
is reduced by hydrogen on the surface of the substrate, heated to1000–1200 °C:
SiCl + 2 H Si+ 4 HCl4 2 → (68)
SiHCl + H Si+ HCl23 3→ (69)
Reaction (69) requires a small amount of hydrogen for reduction.Similarly, in the metallurgy of semiconductors it is possible to depositon substrates of more complicated shapes gradually several differentlayers with different semiconductor, semi-insulating or dielectricproperties.

Summary of terms:
Distillation, sublimation, condensation Tension (pressure) of the vapours, pressure of the saturated vapour, dew point Theory of separation of compounds by evaporation and condensation Composition of the vapour and the solution Composition–boiling temperature and composition–vapour pressure diagrams Physical–chemical nature of sublimation and distillation processes Clausius–Clapeyron equation Activity of the component in the vapour and the solution system p – X and T – X equilibrium diagrams Azeotropic point, azeotropic mixture Distribution coefficient in distillation Distribution number in distillation Coefficient of relative volatility in distillation Rate of evaporation, residual pressure in the system Removal of admixtures by evaporation in vacuum Principle of the rectification process Rectification, rectification column Using rectification for the refining and separation of metals and compounds Chemical transport reactions Reversible endothermic exchange reaction Sub-compound Distillation by means of chemical transport reactions Distillation of metals by means of a reversible endothermic exchange reaction Distillation of metals through sub-compounds Distillation by synthesis and dissociation of volatile compounds Iodide process, van Arkel method Carbonyl method
Questions:
After studying this chapter you will be able to clear up the following terms: 1. What is the difference between the distillation, sublimation and condensation? 2. Which metals have a high vapour pressure and which ones have an enormously low vapour
pressure? 3. Characterize the Clausius–Clapeyron equation and its significance? 4. What is the difference between the activity and activity coefficient of the component? 5. Explain behaviour of the concrete solutions and tell a deviation from Raoult law, as
depicted in Fig. 43. 6. What is an azeotropic point? 7. What types of p – X and T – X diagrams in the liquidus – gaseus system do you know? 8. What is the difference between the distribution coefficient, distribution number, coefficient
of relative volatility in distillation?
9. Which parameters affect the sublimation and distillation process? 10. Which methods can be used for removing impurities (admixtures) in vacuum? 11. What is evaporation rate of impurities from basic metal in vacuum extraction dependent
on? 12. Describe the principle of the rectification process and the function of the rectification
column. 13. Where is the rectification process used in practice? 14. What are the methods of refining of substances through distillation by means of chemical
transport reactions? 15. Explain the chemical basis and the principle of the reversible endothermic exchange
reaction. 16. What is a principle of distillation of metals through sub-compounds? Give examples. 17. Explain the principle of distillation by synthesis and the dissociation of volatile
compounds. 18. Design the technological procedure for refining of zirconium using the van Arkel iodide
method. 19. What is a method for obtaining nickel with high purity? 20. What is a method for obtaining silicon with high purity?
Exercises for solving:
1. Design the technological procedure for the separation of elements A and B according to Fig. 45, if the initial mixture contained 50 % B.
2. Calculate the distribution coefficient and distribution number in distillation this mixture for temperatures proposed by you.
3. How many necessary steps are there to obtain min. 99.99 % SiCl4, if the initial substance contained 1 mol. % TiCl4? Interpolate the liquidus curve and gaseous curve at first by an appropriate polynomial according to the data in Fig. 47.
4. The rectification column has 15 trays. Design the technological procedure and temperatures on the particular trays when separating zinc from cadmium, copper and iron.

8. ELECTROLYSIS
Time needed to study: 180 minutes
Aim: After studying this chapter
You will be introduced to the significant methods of refining of substances using electrolysis. You will recall electrochemical voltage series of elements and Faraday laws.
Reading:

126
8. ELECTROLYSIS
8.1. Significance of electrolytic method of separation andrefining of metals
Electrolysis is one of the efficient and widely used methods of separationand refining of metals. The advantage of this method in comparisonwith other methods is that it makes it possible to carry out the processon large scale and almost continuously [45]. In addition to this, theapplication of electrolytic method of separation and refining of metalsis not limited by the temperatures of sublimation or boiling pointof metals. Electrolysis may be carried out in water and water-freesolutions, in salt melts, using solid or liquid electrodes. Pure metalscan be produced by electrolysis either by means of insoluble anodes(electrolytic precipitation) or soluble anodes (electrolytic refining).
The electrolytically produced and refined metals can be used ina number of cases directly as metallic cathodes in various areas oftechnology. Electrolysis is used in most cases only for the first stageof purification and the resultant cathode metal is the initial materialfor its further deep refining, for example, by vacuum remelting, zonemelting, distillation by means of chemical transport reactions, etc.At present, electrolytic precipitation and refining from aqueous solutionsis used for the preparation of a number of pure metals, such as copper,nickel, zinc, lead, indium, gallium, noble metals silver, gold. Electrolysisof salt melts of oxygen-free acids is used to produce aluminium,magnesium and other light metals.
8.2. The rate of the electrode process. Electrochemical anddiffusion kinetics
For general evaluation of the sequence of precipitation of cationson the cathode or the transfer of atoms to the ion condition on theanode it is necessary to use the so-called electrochemical voltageseries, i.e. the values of electrode potentials obtained in the equilibriumconditions, i.e. the standard potentials. The electrolytic voltage series

127
(Table 10) shows that: as the cation becomes more positive, theprobability of its discharge on the cathode increases and the probabilityof anodic dissolution of the corresponding metal decreases.
In both anode dissolution and in the precipitation of metal on thecathode, it is not the elementary act but in fact electrode processesrepresenting complicated electrochemical phenomena. The electrodeprocess contains all changes which take place if the potential differsfrom the equilibrium potential.
The individual stages of the electrode process are:– the transfer of the ion from the volume of the solution to the surface
of the electrode to the distance at which the electrochemical reactions,reduction or oxidation of the ion may take place. In most cases,this stage takes place at the expense of diffusion which occursas a result of the difference of the concentration of the dissolvedsubstance in the volume of the solution and on the surface of theelectrode. Here the concentration of the ion of the dissolved substanceis lower because the substance is being used up during theelectrochemical reaction. Without continuous supply of the ionsto the surface of the electrode, the electrode process cannot takeplace.
– the actual electrochemical reaction in which the ions of the substancechange their charge. On the cathode, the electrons transfer fromthe electrode to the ion and reduce this ion; on the anode, theion of the substance transfers its charge and oxidises.
– the formation of a new substance, the final product of electrolysis.If this product is a gas (for example, hydrogen), the final stageis the formation of molecules from atoms, the formation of bubblesand their removal from the surface of the electrode. If the productof electrolysis is a solid substance (a reduced metal), the finalstage is characterised by the formation of the crystal of the metal.The simultaneous discharge of two or more different cations maylead to the formation of a solid solution of the alloy or anintermetallic compound. Finally, if the product of the process isthe ion remaining in the solution (for example, in the reductionof Fe3+ to Fe2+) the final stage consists of the displacement of thisproduct from the area of formation, i.e. from the surface of theelectrode to the entire volume of the solution.Depending on which stage is characterised by the lowest rate, there
is the electrochemical and diffusion kinetics of the electrode processcharacterised by different relationships.
The electrolytic precipitation of metals is quantitatively determinedby Faraday laws. These laws specify the relationship between the
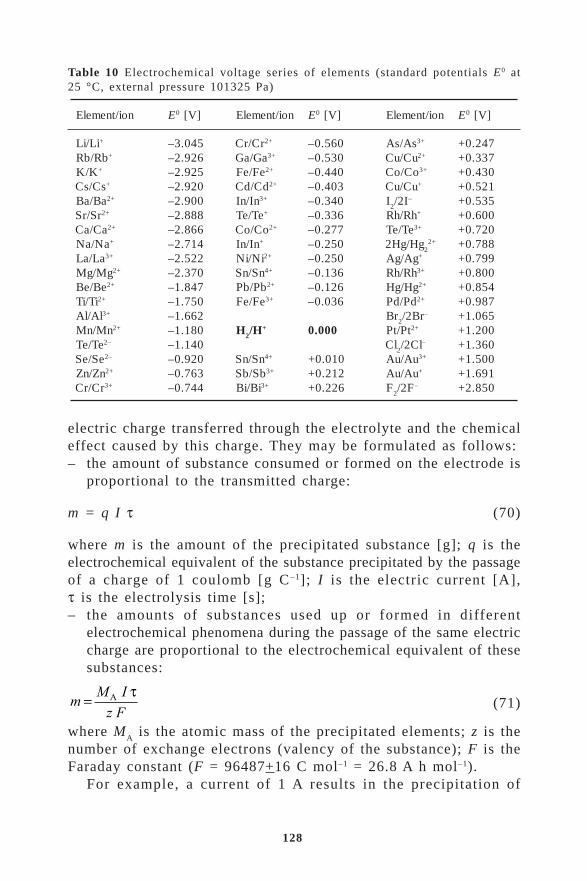
128
electric charge transferred through the electrolyte and the chemicaleffect caused by this charge. They may be formulated as follows:– the amount of substance consumed or formed on the electrode is
proportional to the transmitted charge:
m = q I τ (70)
where m is the amount of the precipitated substance [g]; q is theelectrochemical equivalent of the substance precipitated by the passageof a charge of 1 coulomb [g C–1]; I is the electric current [A],τ is the electrolysis time [s];– the amounts of substances used up or formed in different
electrochemical phenomena during the passage of the same electriccharge are proportional to the electrochemical equivalent of thesesubstances:
mM I
z F = A
τ(71)
where MA is the atomic mass of the precipitated elements; z is the
number of exchange electrons (valency of the substance); F is theFaraday constant (F = 96487+16 C mol–1 = 26.8 A h mol–1).
For example, a current of 1 A results in the precipitation of
Table 10 Electrochemical voltage series of elements (standard potentials E0 at25 °C, external pressure 101325 Pa)
noi/tnemelE E0 ]V[ noi/tnemelE E0 ]V[ noi/tnemelE E0 ]V[
iL/iL +
bR/bR +
K/K +
sC/sC +
aB/aB +2
rS/rS +2
aC/aC +2
aN/aN +
aL/aL +3
gM/gM +2
eB/eB +2
iT/iT +2
lA/lA +3
nM/nM +2
eT/eT –2
eS/eS –2
nZ/nZ +2
rC/rC +3
540.3–629.2–529.2–029.2–009.2–888.2–668.2–417.2–225.2–073.2–748.1–057.1–266.1–081.1–041.1–029.0–367.0–447.0–
rC/rC +2
aG/aG +3
eF/eF +2
dC/dC +2
nI/nI +3
eT/eT +
oC/oC +2
nI/nI +
iN/iN +2
nS/nS +4
bP/bP +2
eF/eF +3
H2 H/ +
nS/nS +4
bS/bS +3
iB/iB +3
065.0–035.0–044.0–304.0–043.0–633.0–772.0–052.0–052.0–631.0–621.0–630.0–
000.0
010.0+212.0+622.0+
sA/sA +3
uC/uC +2
oC/oC +3
uC/uC +
I2
I2/ –
hR/hR +
eT/eT +3
gH/gH22
+2
gA/gA +
hR/hR +3
gH/gH +2
dP/dP +2
rB2
rB2/ –
tP/tP +2
lC2
lC2/ –
uA/uA +3
uA/uA +
F2
F2/ –
742.0+733.0+034.0+125.0+535.0+006.0+027.0+887.0+997.0+008.0+458.0+789.0+560.1+002.1+063.1+005.1+196.1+058.2+

129
0.5 g H2, 8 g O
2, 63.54 g Cu in 96487 seconds, or in the dissolution
of 65.4 g Zn, 107.87 g Ag.The rate of the electrochemical reactions is controlled by the
exponential law. For the cathodic reaction
K k z e Kzc
+ + → (72)
the equation for the rate of the electrochemical reaction has the followingform
I K az F
RTc cc= −
1 exp
α ϕ(73)
For the anodic reaction
A a z e Aza
− − → (74)
the equation for the rate of the electrochemical reaction is:
I K az F
RTa aa= −
2 exp
β ϕ(75)
where Ic, I
a are the rates of the electrochemical reactions, expressing
current density [A cm–2]; α, β are other kinetics factors, whose valuesare in the range 0–1, and for which α+β = 1; z
c, z
a is the valency
of the cation and the anion; K1, K
2 are constants of the electrochemical
reactions; ϕ is the potential [V]; ac, a
a are the activities of the reacting
substances.The rate of the diffusion process can be expressed by the following
relationship:
Ic=K
d(a–a
s) (76)
where Kd is the rate constant of convective diffusion; a is the activity
of diffusing particles in the volume of the solution; as is the activity
of diffusing particles of the surface of the cathode.The identical equation (76) may also be written for the anode.
The rate of diffusion depends on:– the temperature– the nature of the dissolved substance and the solvent;– the intensity of movement of the solution around the electrode,
which in the case of the cathode is expressed by constant Kd.
This shows that if the rate of mixing of the solution is changed,i.e. the rate of diffusion, the same electrode process can be transferredfrom the region of diffusion kinetics to the electrochemical regionand vice versa.
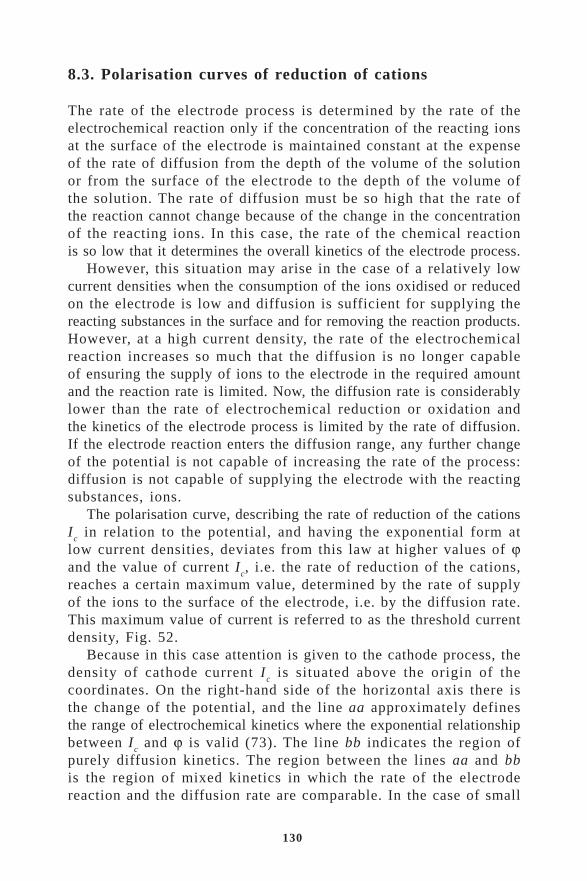
130
8.3. Polarisation curves of reduction of cations
The rate of the electrode process is determined by the rate of theelectrochemical reaction only if the concentration of the reacting ionsat the surface of the electrode is maintained constant at the expenseof the rate of diffusion from the depth of the volume of the solutionor from the surface of the electrode to the depth of the volume ofthe solution. The rate of diffusion must be so high that the rate ofthe reaction cannot change because of the change in the concentrationof the reacting ions. In this case, the rate of the chemical reactionis so low that it determines the overall kinetics of the electrode process.
However, this situation may arise in the case of a relatively lowcurrent densities when the consumption of the ions oxidised or reducedon the electrode is low and diffusion is sufficient for supplying thereacting substances in the surface and for removing the reaction products.However, at a high current density, the rate of the electrochemicalreaction increases so much that the diffusion is no longer capableof ensuring the supply of ions to the electrode in the required amountand the reaction rate is limited. Now, the diffusion rate is considerablylower than the rate of electrochemical reduction or oxidation andthe kinetics of the electrode process is limited by the rate of diffusion.If the electrode reaction enters the diffusion range, any further changeof the potential is not capable of increasing the rate of the process:diffusion is not capable of supplying the electrode with the reactingsubstances, ions.
The polarisation curve, describing the rate of reduction of the cationsI
c in relation to the potential, and having the exponential form at
low current densities, deviates from this law at higher values of ϕand the value of current I
c, i.e. the rate of reduction of the cations,
reaches a certain maximum value, determined by the rate of supplyof the ions to the surface of the electrode, i.e. by the diffusion rate.This maximum value of current is referred to as the threshold currentdensity, Fig. 52.
Because in this case attention is given to the cathode process, thedensity of cathode current I
c is situated above the origin of the
coordinates. On the right-hand side of the horizontal axis there isthe change of the potential, and the line aa approximately definesthe range of electrochemical kinetics where the exponential relationshipbetween I
c and ϕ is valid (73). The line bb indicates the region of
purely diffusion kinetics. The region between the lines aa and bbis the region of mixed kinetics in which the rate of the electrodereaction and the diffusion rate are comparable. In the case of small

131
deviations from the equilibrium potential, the process is controlledby the electrochemical kinetics (Fig. 52): with increase of cathodicpolarisation, the reaction rate increases and the diffusion rate startsto decrease because it does not manage to supply the sufficient numberof ions per unit time to the electrode surface. With an increase ofthe degree of polarisation this rate reduction becomes greater and,consequently, the rate of the electrode process is more and more limitedby diffusion. Finally, there are suitable conditions for the thresholdcurrent density I
p(c) where the diffusion rate has already reached the
maximum possible value. Here the curve is parallel to the horizontalaxis which indicates that it is not possible to change the reactionrate by increasing the polarisation. In these conditions:
d
d
Icϕ
= 0 (77)
If the solution contains only one type of cations capable of reductionon the cathode, a further increase of the degree of polarisation cannotcause any other electrochemical process up to the value of thepolarisation voltage at which hydrogen starts to generate at the expenseof dissociation of water molecules. If the solution contains salts oftwo different metals whose ions can reduce on the cathode, thepolarisation curve is more complicated, Fig. 53a. In accordance withthe nature of the metals M
I and M
II and the activity of their ions
in the solution, the metals will have different equilibrium potentials,indicated on the graph. It may be seen that the potential of M
I is
more positive than that of MII.
With a further increase of the degree of cathodic polarisation ofthe electrode, the equilibrium potential ϕ
eq is reached initially. When
the gradually increasing potential of the electrode is more negativethan equilibrium potential for M
I, the reduction of the cations M
I
takes place and the current Ic, indicating the rate of reduction will
start to flow. In the case of a low degree of polarisation, the processis controlled by electrochemical kinetics. With an increase of thedegree of polarisation, starting from a specific potential, the rateof the process is inhibited by diffusion. The curve, expressing thelaw of electrochemical kinetics (broken curve I), and the observedpolarisation curve (solid line) separate. Finally, at a specific degreeof polarisation, the conditions of threshold current density I
p(I) form
for the cations MI. All this takes place at the potentials more negative
than ϕeq(I)
but more positive than ϕeq(II)
. Therefore, the MII2+ ions do
not take part in the reduction.When the electrode potential becomes more negative than the
132
equilibrium value for the ions MII2+, the ions start to reduce. At a
potential only slightly more negative than ϕeq(II)
, the rate of reductionof the ions M
II2+ will be controlled by the electrochemical kinetics.
The layer, adjacent to the cathode, depleted to the maximum extentin ions M
I2+ is rich in ions M
II2+ and the reaction M
II2+→M
II develops
without obstacles. At this potential, both types of cations are reducedon the electrode: the ions M
I2+ at the limiting rate, determined by
the values of Ip(I)
and the ions MII2+, with the rate given by the laws
of electrochemical kinetics. This law is indicated in Fig. 53a by thebroken line II. The observed current density represents the sum ofthe coordinates of the curves II and I
p(I). Therefore, if the potential
increases to more negative values above ϕeq(II)
, the current densityincreases. A further increase of the negative polarisation results inthe same changes of the reduction rate M
II2+ as those described previously
for MI2+. Finally, suitable conditions form for the threshold current
density also for the ions MII2+, I
p(II). In this case, the density of the
current on the cathode is:
I I Ip c p p( ) ( ) ( )= +I II (78)
The two types of ions capable of reduction produced two waveson the polarisation curve, with both the waves changing to a platform,corresponding to the threshold current density of these ions. If thesolution contains more types of ions, more waves appear on thepolarisation curve.
The above considerations indicate that the simultaneous dischargeof two or more ions is possible if the cathode potential is more negativethan the standard potential for these processes in the given specificconditions. The density of cathodic current indicating the rate of thereaction, will be equal to the sum of the current densities of all parallelcathodic reactions.
Fig. 52 Cathodic polarisation curve characterised by the electrochemical diffusionkinetics.
ϕϕϕϕϕeq
I p(c
)
Ic[A cm-2]
ϕ[V]

133
8.4. Simultaneous discharge of the ions of the main metaland admixtures
Up to now, polarisation curves were used to examine the simultaneousdischarge of two or more cations whose concentration in the solution/electrolyte was the same. When discussing the possibility of transferof the admixtures from the electrolyte into the cathodic precipitate,the concentration of their ions in the solution is many times smallerthan the concentration of the ions of the main metal. Therefore, theadmixtures may be more electropositive and also more electronegativethan the main metal. This case of the simultaneous discharge of theions of the main metal and the admixtures will now be discussed.
It is evident that the discharge of the ions of the main metal andadmixtures always takes place simultaneously on the surface of theelectrode at the given total potential of the cathode. In the electrolysisconditions in the production of pure metals, when the concentrationof the admixtures in the cathodic precipitate is very low, almost allmetal admixtures form either diluted solid solutions of the admixturesin the main metal or solid solutions of intermetallic compounds.
The discharge of the ions of the admixtures also takes place ifthe concentration in the solution is low. If we consider the high densityof cathodic current used in experiments, it may be expected that theions of many admixtures precipitate in the conditions of technicalelectrolysis or beyond the threshold current density. The electrolysisof the water solutions is usually carried out at a current density ofapproximately 500 A m–2 and the threshold current density, for example,for the sulphate solutions of copper at admixture concentrations inthe solution experienced in practice, it is several units of A m–2.
This question will be examined in greater detail by means ofpolarisation curves. It is assumed that the polarisation curves of the
Fig. 53 Polarisation curve. a) reduction of two cations; b) precipitation of mainmetal and admixtures.
ϕeq (I) ϕeq (II)
Ik
[A cm-2]
–ϕ [V]–ϕ
ϕ
Ik
Ik
I''kI p
(I)
I p(I
I)
134
main metal (curve 3) and of two different admixtures (curves 1 and2) are situated in the manner shown in Fig. 53b. It is assumed thatthe standard potentials of both admixtures are ϕ
p1 and ϕ
p2. The potential
of the cathode at the given moment at the current density Ic is denoted
by ϕc.
At a sufficiently high concentration of the ions of the first admixturein the solution and with an increase of the cathodic potential, therewould be only be the discharge of the ions of the admixture inaccordance with curve 1, but since the concentration of the ions ofthe admixture in the solution is very low, the threshold current isalready obtained at a low current density and a horizontal sectionappears on the polarisation curve. The cathode potential increaseswithout any increase of the current density up to the start of precipitationof the main metal. A further increase of the cathode potential alreadyleads to the simultaneous precipitation of the main metal and thefirst admixture. The overall polarisation curve may not be identicalwith curve 3 and must be displaced upwards by the value of thethreshold current density of the first admixture in parallel with thecurve 3. However, since this current density is low, it may be assumed,without causing any error, that the total polarisation curve is identicalwith curve 3. The second admixture starts to precipitate together withthe main metal and the first admixture starts to precipitate only afterreaching current density I
c and, subsequently, the admixtures precipitate
at the threshold current density. Thus, both the admixtures with themore positive and negative equilibrium potential may precipitate atthe threshold current.
The degree of contamination of the metal within the admixturesprecipitated under the effect of threshold current, is directly proportionalto the concentration of the admixtures in the solution and indirectlyproportional to the cathodic current density of the main metal. Theprecipitation of the admixtures under effect of threshold current becomesmore likely with increase in the negativity of the equilibrium potentialof the main metal and with increase in the degree of polarisationof precipitation of the metal. For instance, in electrolysis of nickelthe effect of the threshold current results in the precipitation of greatlydiffering admixtures taking their electrochemical properties into account,e.g. copper, lead, cadmium and zinc.
8.5. Conditions for the removal of admixtures inelectrolysis
As mentioned previously, the rate of precipitation of the main metal

135
and the admixtures on the cathode is determined by:– the rate of supply of the ions to the surface of the cathode as a
result of convective diffusion;– the rate of actual discharge of the ions and precipitation of the
metal.In the conditions in which the precipitation of the main metal is
accompanied by the precipitation of admixtures in low concentrations,these admixtures form usually substitutional or interstitial solid solutions.In the majority of cases, the formation of solid solutions leads toextensive depolarisation leading to more efficient precipitation ofmany admixtures with considerably higher electronegativity incomparison with the main metal. This is limited only by the rate ofconvective diffusion.
Depending on the stages controlling the rate of precipitation ofthe admixtures and the main metal, there are four main types ofrelationship governing the simultaneous discharge of their ions:– if the admixture and the main metal are discharged with a very
low degree of polarisation, the precipitation of these componentsis determined by the rate of convective diffusion. If the valencyof these metals is the same, the constant of convective diffusionis the same for both metals. The relative content of the admixturesin the cathode precipitate is directly proportional to its concentrationin the solution;
– if the discharge of the main metal is accompanied by clearly visiblepolarisation, then a large amount of the admixtures is dischargedat the threshold current density. This case is observed most frequentlyin practice. Since the rate of precipitation of the main metal isdetermined by the discharge stage, then for the same valency ofthe admixtures and the parent metal, the rate of precipitation ofthe admixture is higher and the result is a cathodic precipitatecontaminated by the admixtures to a considerably greater extentthan the electrolyte. The content of the admixtures in the cathodicprecipitate during precipitation in the conditions of the thresholdcurrent density increases with a decrease of cathodic current density,and vice versa. Therefore, in the case of preliminary electrolysisat a low current density, it is possible to remove the majority ofthe admixtures without greatly depleting the electrolyte in the mainmetal, i.e. it is possible to purify the electrolyte to remove admixtures;
– in the case in which the rates of precipitation of the main metaland of the admixture are determined by the rate of discharge, theconstant of the rate of discharge of the main metal must be higherthan that of the admixture. However, if the constant of the rate
136
of discharge of the admixture is higher than that of the main metal,then the admixture, because of its low concentration in the solution,will be unavoidably discharged at the threshold current densityand this may lead to contamination of the cathode precipitate withadmixtures. If the constant of the rate of discharge of the ionsof the main metal is higher than that of the admixture, the precipitatewill be ‘cleaner’ than the electrolyte. In this case, the constantof discharge depends on the chemical individuality of the admixture;
– in another case, the limiting factor is diffusion of the main metal.This is the least favourable situation for producing pure metal.Therefore, it is necessary to carry out electrolysis at a very lowcurrent density in cases in which the admixture is less electropositivethan the main metal.In the electrolytic production of high-purity metals it is very important
to carry out to deep purification of the electrolyte to remove admixturesof secondary cations. This is usually carried out by the electrochemicalmethod of the so-called preliminary electrolysis of the electrolyte.In electrochemical purification of the electrolyte it is recommendedto use the following methods:– preliminary electrolysis at a low current density in which the
threshold current results in the discharge of the cations of the moreelectropositive admixtures and their removal from the cathode region.
– electrolysis using an electrically charged diaphragm encircling thecathode. From the layer of the electrolyte in the vicinity of thecathode the cations of the more electropositive admixtures on thesurface of the diaphragm are discharged, resulting in furtherprecipitation of the pure metal on the cathode at a considerablyhigher current density. The diaphragm may be produced from, forexample, perforated graphite.
– the purification of the electrolyte to remove the ions of the moreelectropositive admixtures may be carried out by cementation (i.e.internal electrolysis), which is the process of displacement of theions of a more noble metal by another less noble metal from thesolution, with the former being transferred from the ions to themetallic condition, and the latter vice versa. Cementation may beused for both producing noble metals from the solutions and forpurification of electrolytes to remove admixtures. Suitable examplesis the cementation of copper with iron or gold with zinc, displacementof copper and cadmium by zinc from a zinc electrolyte or of lead,tin, copper and nickel by indium from an indium electrolyte.Cementation takes place when the electrode potential of the displacingmetal is far more electronegative than that of the metal being
137
displaced.
8.6. Removal of nonmetallic admixtures from cathodicmetals in electrolysis
In order to obtain high-purity metals by electrolytic precipitation,it is necessary to form suitable conditions in which the cathodeprecipitate does not receive admixtures of metals, gases or metalloids.In electrolytic refining of metals of the group of iron, chromium,manganese and a number of other metals from aqueous solutions,the discharge of the cations of the metal is accompanied by the dischargeof the hydrogen ions. The resultant hydrogen-charged metal must besubsequently processed by vacuum annealing or vacuum remelting.As regards the metalloids, S, Se, Te, C, Si and O can transfer tothe cathode. Sulphur is present in the cathode metal in the form ofsulphates or sulphides. The formation of the cathode layer of metalsin the absence of S is possible only when using pure chloride or nitrateelectrolytes. Carbon, silicon, selenides, tellurides and basic salts ofarsenic, antimony, bismuth and also noble metals are transferred tothe cathode only by means of the cataphoresis transfer of solid particlesfrom the electrolyte on the surface of the cathode. The basic conditionfor producing high-purity metals in electrolysis is the complete opticaltransparency of the solutions. In justified cases, the electrolysis ofpure metals is carried out using diaphragms, separating the cathodespace from the anode space. The material of the diaphragms isrepresented by low-porosity cloth produced from plastics insolublein the electrolyte or semi-transparent layers of colloidal cellophane.
It is very difficult to obtain an oxygen-free electrolytic precipitate.Oxygen is transferred into cathode layers in the form of hydroxidesor in most cases in the form of oxides inclusions from the solution.The oxygen content of electrolytic copper varies from ten thousandthsto thousandths of a percent. The removal of traces of oxygen canbe carried out by the electrolysis of salt melts or by reduction remeltingof the cathode precipitate in vacuum. Electrolytic precipitation ofmetals from salt melts at temperatures higher than the melting pointof these melts creates more suitable conditions for producing metalsof the highest purity.
8.7. Anodic dissolution. Electrolytic refining of metals
In anodic dissolution of an alloy consisting of several components,the metal with the highest electronegativity is the first to dissolve

138
and is followed gradually by metals with lower electronegativity, etc,in accordance with the electrochemical voltage series (Table 10). Ofcourse, this sequence may change depending on the content (activity)of each component in the alloy, and also in cases in which the alloyform eutectics, solid solutions or intermetallic compounds. In anodicdissolution of the alloy, the ionisation of the admixtures is more difficult.This is favourable for the production of high-purity metals by electrolyticrefining of the initial metals containing a relatively small amountof metallic admixtures.
In electrolytic refining, the main metal is subjected to anodicdissolution with the formation of appropriate cations in the electrolytewhich are discharged (precipitate) on the cathode in the metallic formin accordance with the reactions (72) and (74).
In the initial anodic alloy which is to be subjected to electrolyticrefining, the main metal is usually characterised by higherelectronegativity than the admixtures and, consequently, the admixturesdo not anodically dissolved and buildup in the anode space. If theanodic metal contains admixtures with higher electronegativity thanthe parent metal, the admixtures will undergo preferential anodicdissolution and will be transformed into the electrolyte in the formof appropriate cations, provided solid solutions or intermetallic phasesof these admixtures do not form. However, these admixtures do notdischarge on the cathode in the presence of the ions of the main metalin the electrolyte, due to the fact that their electrode potential ismore negative than the potential of the main metal.
Depending on the nature of metal, electrolytic refining may alsobe carried out in aqueous electrolytes and salt melts, using solid orliquid and also molten metals as electrodes. In aqueous electrolyteswith solid electrodes, electrolytic refining is carried out on metalscharacterised by more electropositive electrode potentials in comparisonwith hydrogen (Cu, Ag, Ni, Co, Mn, Cr ...), and the soluble electrodesare represented by cast anode plates produced from commercial puritymetal (Fig. 54).
Of considerable importance is the electrolytic refining of metalsin salt melts. The absence of hydrogen ions in salt melts enableselectrolytic refining of metals such as, for example, aluminium andmagnesium. Aluminium is refined in the electrolytes formed by fluoridesalts NaF + AlF
3, Na
3AlF
6 + LiF, etc, fluoride salts and also chloride
salts BaCl2 + NaCl. For the production of high-purity aluminium it
is usually recommended to use a three-layer electrolysis system inwhich the anode is represented by, for example, an alloy of aluminiumwith copper with the intensity ~0.2 kg dm–3 higher than the intensity
139
of the electrolyte. Pure cathode metal (with the intensity0.2–0.3 kg dm–3 lower) flows on the surface of the electrolyte (Fig.54b). Process temperature is usually 800 °C, i.e. this temperatureis higher than the melting point of aluminium. Current density is4000–5000 A m–2. This method may be used to produce aluminiumwith the purity of up to 5N (99.999%) aluminium. The metal preparedby this method usually represents the starting material for furtherrefining, for example, by zone melting.
Another efficient method is the electrolytic refining of salt meltsof refractory metals at temperatures lower than the melting point ofthese metals. This relates in particular to Be, Ti, Zr, Nb. On the cathode,the metal precipitates in the crystalline form as a cathode spongemass.
8.8. Amalgamation method of separation and refining ofmetals
The amalgamation method is based on the electrolysis of aqueoussolutions with a mercury cathode. From electrolysis with solid cathodes,it differs by a relatively high excess voltage of precipitation of hydrogenon the mercury cathode. The metals, precipitating on the cathode,dissolve in mercury, i.e. they form amalgams, and the dissolutionof certain metals is accompanied by the generation of heat. Consequently,the discharge potentials of their ions on the mercury cathode are moreelectropositive than the normal potentials. The combination of thisphenomenon with the high excess voltage required for dischargingH+ ions on mercury also enables precipitation of alkali metals andalkali earth metals on the mercury cathode by electrolysis of aqueoussolutions.
The formation of amalgams of nickel, cobalt, iron and chromiumis very difficult and is accompanied by heat absorption. Therefore,the potentials of their precipitation on the mercury cathode are farmore negative than the normal potentials. Consequently, it is possibleto separate from them also more electropositive elements. The followingdo not precipitate from the acid aqueous solutions on the mercurycathode: Al, Be, B, Ti, U, Nb, Ta, V, Zr, P, Si, alkali metals, alkaliearths and lanthanides. However, they can be separated from theelements, precipitating on the mercury cathode. Of course, this isonly one of the aspects of the amalgamation process. The anodic process,i.e. dissociation of the amalgam by anodic dissolution together withthe cathodic process provides extensive possibilities for using theamalgamation process in the separation and refining of metals.
140
The increase of the metal concentration in the amalgam or theincrease of temperature result in significant changes of the anodepotential. The special feature are the changes of the potential duringthe dissociation of the amalgams of Cr, Ni, Co and Fe. At roomtemperature, these metals become passive in dissolution in mercury,and with the temperature increasing to 78–83 °C the metals showdepassivation and, consequently, the potentials of the dissolved metalsare displaced by tenths of a volt to the side of electronegative values.
In amalgamation electrolysis, the values of the potential dependon current density, the concentration of the metal in the amalgamand on temperature. During electrolysis, the potentials are only slightlydisplaced to more electropositive values. As soon as the metal is almostcompletely transferred from the amalgam into the solution, there isa significant change of the potential to the values required for theoxidation of mercury. However, the almost complete precipitationof the metals from the amalgam takes place only at low current densitiesof 50–100 A m–2 and at a high current density there is a jump-likechange of the potential, provided the amalgam still contains tens ofmilligrams of metal. If the amalgam contains two metals, after thetransition of the metal with the more electronegative potential to thesolution, the potential ‘jumps’ up to the value required for the oxidationof the next element. With increase of the content of the metal withthe more electropositive potential in the amalgam, the amount of themetal with the electronegative potential remaining in the amalgamincreases. Electrolysis with the mercury electrode is used in the refiningof a number of metals, such as Ga, Tl, In, etc.
The electrolytic refining of metals by the amalgamation methodis usually carried out in an electrolyser with bipolar mercury electrodes,Fig. 55. The electrolyser is produced from a non-conducting materialand is separated by a diaphragm into two sections A and B in sucha manner that the mercury in section A is not in contact with themercury in section B. The mercury in the sections A and B is usedas a bipolar electrode: in section I, mercury in section A operatesas a cathode, in section II as an anode; similarly, in section B mercuryis a cathode and in section III an anode. The electrolyte of sectionI contains the soluble anode from the pre-purified metal, and theelectrolyte of section III contains a metallic or graphite electrode(cathode) on which the refined metal settles. The electrolyser maycontains several bipolar electrodes, so that it is possible to increasethe efficiency of refining of metals.
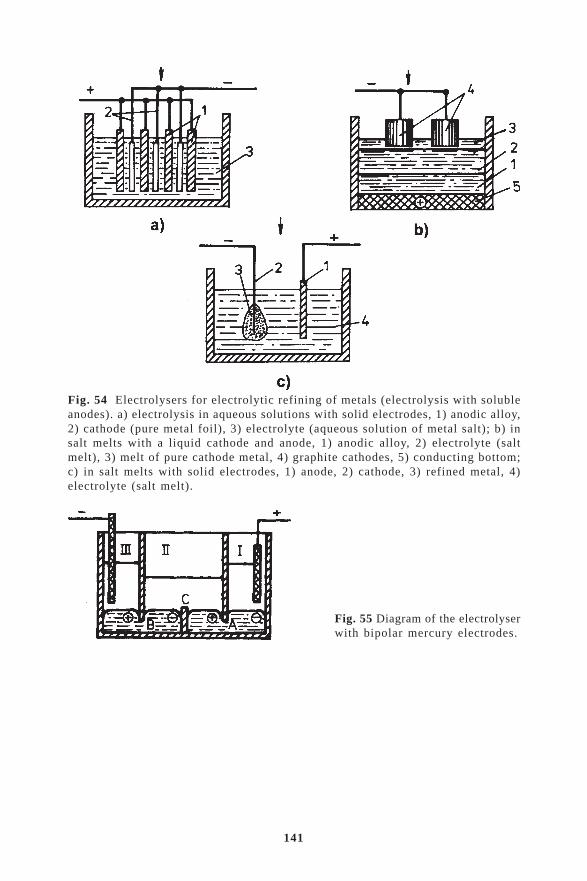
141
Fig. 54 Electrolysers for electrolytic refining of metals (electrolysis with solubleanodes). a) electrolysis in aqueous solutions with solid electrodes, 1) anodic alloy,2) cathode (pure metal foil), 3) electrolyte (aqueous solution of metal salt); b) insalt melts with a liquid cathode and anode, 1) anodic alloy, 2) electrolyte (saltmelt), 3) melt of pure cathode metal, 4) graphite cathodes, 5) conducting bottom;c) in salt melts with solid electrodes, 1) anode, 2) cathode, 3) refined metal, 4)electrolyte (salt melt).
Fig. 55 Diagram of the electrolyserwith bipolar mercury electrodes.

Summary of terms:
Significance of electrolytic method of separation and refining of metals Electrochemical voltage series of elements, standard potentials Electrochemical and diffusion kinetics Faraday laws Electrochemical reactions on the cathode and on the anode, diffusion kinetics Rate of the electrochemical reaction Polarisation curves of reduction of cations Conditions for the removal of admixtures in electrolysis Depolarization, electrolyte, cathode, anode, diaphragm, cementation Removal of non-metallic admixtures from cathodic metals in electrolysis Anodic dissolution Electrolytic refining of metals Electrolysis in aqueous solutions with solid electrodes Electrolysis in salt melts with a liquid cathode and anode Electrolysis in salt melts with solid electrodes Amalgamation method with bipolar mercury electrodes
Questions:
After studying this chapter you will be able to clear up the following terms: 1. What is the importance of electrolysis in separation and refining of substances? 2. What is a difference between electrolytic precipitation and electrolytic refining? 3. On the basis of Table 10 specify which cations will be preferentially discharged on the
cathode. 4. On which quantities does the rate of the electrochemical reactions depend? 5. On which quantities does the rate of diffusion at electrolysis depend? 6. Explain the character of the cathodic polarization curve – see Fig. 52. 7. What will be the electrolysis process like in the presence of more cations in the solution in
the case described in Fig. 53 a) and 53 b)? 8. Which elements can be refined electrolytically in aqueous solutions? 9. Which elements can be obtained electrolytically from aqueous solutions? 10. Which elements can be obtained electrolytically from salt melts? 11. Which elements can be obtained advantageously via electrolytic amalgamation? 12. What is three-layer electrolysis and for which metal is it used typically? 13. Describe the principle of various types of electrolysers – see Figs. 54 and 55.
Exercises for solving:
1. What electric current is necessary for separating of 10 g of copper from CuSO4 solution? 2. How many grams of Mn will be theoretically separated from MnCl2 solution using 10A
current for a period of 1 hour? 3. For what a period will be an object with 100cm2 surface area covered with a Cu layer of
0.01 mm thickness, if 5A current is fed into CuSO4 solution?

9. ELECTROTRANSPORT
10. DIFFUSION
11. SELECTIVE PRECIPITATION, OXIDATION AND REDUCTION
12. DEGASIFICATION OF METALS
Time needed to study: 180 minutes
Aim: After studying this chapter
You will understand the electro-transport method for enhancement of purity of substances. You will be introduced to the separation of gas substances by thermal diffusion. You will know the principle of electro-dialysis and function of the three-chamber electro-dialyser. You will understand the principle of the selective preparation, oxidation and reduction in refining of substances. You will know how gases in metals affect their properties. You will know how oxygen, nitrogen and hydrogen behave in metals.
Reading:

142
9. ELECTROTRANSPORT
Electrotransport as the phenomenon of controlled displacement ofthe atoms of elements in solid or molten metals under the effect ofa direct electrical field may be regarded as one of the methods ofrefining metals. During electrotransport, as in the case of electrolysis,the passage of direct electric current through the specimens of metalresults in the transfer of certain elements – admixtures in thedirection to the cathode or anode in accordance with their charge.The similarity between electrotransport and electrolysis is, however,greatly limited, in particular, owing to the fact that the passage ofelectric current through the metallic specimen is determined by thedirectional motion of free electrons. Only a very small amount ofelectric current is transferred by ionised atoms of the main metalor admixtures present in them. The energy efficiency of electrotransportis consequently low and, therefore, to obtained a steep concentrationgradient, it is necessary to ensure the long-term effect of direct currentwhich is the main shortcoming of electrotransport as the refiningmethod. However, a positive feature is the relatively simple procedureof the method which may result in very high purity (up to 8 N).
The main applications of using electrotransport for refining ofmetals are:– electrotransport in solid metals– electrotransport in metal melts– electrotransport through a layer of oxides– electrotransport in zone melting of metals.
Owing to the fact that a concentration gradient forms along thelength of the specimen in refining of metal by electrotransport, thespecimen is characterised by the occurrence, during the process, ofreversed diffusion of the admixture component 1, and for dilutedsolutions it can be written that:
v
D
z e
kT1
1
1= (79)

143
where v1 is the velocity, z
1 is the valency of the admixture component
1, e is the electron charge, k is the Boltzmann constant, D1 is the
diffusion coefficient, T is temperature.However, in refining, the speed of motion of the admixture element
1 is not as important as the concentration exchange which the electricfield E is capable of realising. This exchange is described quantitativelyby expressing the flow of the substance under the effect of the fieldE. The equation has the following form
q DdC
dlv C ED = +1
11 1 (80)
where qD is the flow of the substance [mol cm–2 s–1], C
1 is the is
concentration of the admixture component 1 [mol cm–3], l is the lengthto which the concentration C
1 corresponds, E is the intensity of the
electric field [V cm–1].In the case of a sufficiently long time of the effect of the direct
electrical field, the first member in equation (80) characterises diffusionand the second member the amount of the transported admixturecomponent 1. Both these terms are balanced and provide the zeroflow, corresponding to the maximum obtainable purity of the compound.
9.1. Refining of admixtures from solid metals byelectrotransport
A metallic bar with length l0 carries direct electric current which
results in heating of the bar to the required temperature and, at thesame time, in the transfer of the admixture, as indicated by Fig. 56.If τ
0 is the duration of the initial stage, corresponding to the initial
concentration of admixture C0, and the duration of electrotransport
changes τ1< τ
2 < τ∞ refining takes place in the initial part of the bar
(Fig. 56). The maximum purity corresponds to the duration of
Fig. 56 Distribution of admixtures alongthe length of a metallic bar subjectedto electrotransport in relation to theduration of the effect of direct current.
C
l0
x
τ0 τ1
τ2
τ2
τ∞
l00
τ1

144
electrotransport required for the establishment of equilibrium, seeequation (80).
The concentration of the admixture in the initial half of the lengthof the specimen generation to the initial concentration is defined bythe general equation:
C
C C lC x dxm( )
/
( , )τ τ0 0 0 0
1 22= ∫ (81)
where Cm(τ)
is the concentration of the admixture in the initial halfof the specimen, reached in the period τ, C
(x,τ) is the concentration
of the admixture as the function of distance (x) from the beginningof the specimen and the duration of electrotransport (τ).
Equation (81) was used for processing the data on electrotransportof interstitial admixtures from the viewpoint of the possible refiningof a number of metals, in particular, refractory metals to remove selectedinterstitial admixtures. In all cases, the length of the bar l
0 = 10 cm
and the intensity of the electric field E = 0.2 V cm–1 were selected.The values of C
m/C
0 were calculated for a distance of 5 cm from the
beginning of the bar for the duration after one day, after five days,and after the infinitely long time of electrotransport. The experimentalresults are presented in Table 11.
As indicated by Table 11, in all cases, with the exception of theTi–O, Ta–C, W–C systems, there was deep refining already afterelectrotransport for 5 days. The identical method was used for theanalysis of other systems for which reliable data are available in theliterature. The calculations for the Co–C, Ti–C and Y–O systems showthat deep refining takes place after 5 days of electrotransport, butin the case of the Fe–H, Fe–D, Ni–O and Ta–H systems, only the
Table 11 Relative concentration of interstitial admixtures in electrotransport insolid metals
metsyS )C°(erutarepmeT v1/D
1mc( 1– ) C
mC/
0rabfoflahtsrifehtni
yad1 syad5 ∞
O–iTH–dPN–hTO–hTC–eFC–iNC–aTC–W
7231281
025157610041004100620062
2.39175914421257.5
59.094.0
01·1.2 11–
5400.001·2.4 4–
37.001·9.4 32–
57.0
57.001·5.3 4–
01·3.3 52–
01·1.1 3–
01·5.1 91–
560.001·9.4 32–
41.0
870.001·1.1 8–
01·3.3 52–
01·1.1 8–
01·5.1 91–
01·2.1 5–
01·9.4 32–
7600.0
[°C] [cm–1]

145
medium degree of refining is obtained.The results of a number of experiments show that the v
1/D
1 ratio
for the given system decreases with increasing temperature. Sincethe result of refining is proportional to the value of v
1/D
1, the
theoretically attainable degree of refining should increase with decreasingtemperature. However, on the other hand, the mobility of ionisedatoms in solid metals increases with increasing temperature.Consequently, in experiments it is always necessary to define thetemperature resulting in optimum refining conditions. Since theelectrotransport in solid metals takes place in defined conditions,it is possible to obtain, by electrotransport, the efficient removal ofinterstitial admixtures in certain metals. In the case of substitutionalelements, it is possible to obtain a high degree of refining only aftera very long process time. This restricts the range of application ofelectrotransport in practice. However, electrotransport in solid substancesis also regarded as a long-term process taking place in practice inthe presence of the direct field. Consequently, electrotransport contributesto, for example, ‘ageing’ of semiconductor components.
9.2. Refining of admixtures from metallic melts byelectrotransport
The electrotransport of metal melts is carried out using equipmentconsisting of a pipe sealed at one end and filled with metal melts,whereas the other end of the pipe is connected with a container holdingthe metallic melt. After applying a low-intensity direct field diffusiontransfer of certain admixtures takes place in the melts. The concentrationof the admixtures in the section of the metal situated in the pipewhich is in contact with the container, remains, however, almostcompletely constant, if the container is sufficiently large and the thermalconvection takes place.
The electrotransport of admixture elements in selected melts oflow-melting metals was investigated by Belashchenko. He obtainedthe values of v
1/D
1, presented in Table 12.
All the dissolved metals are characterised by the valuev
1/D
1 > 12 cm–1 and, consequently, they can be easily removed after
5 days of electrotransport. Nevertheless, it is important to considerthe process of thermal convection, decreasing the efficiency ofpurification. The efficiency of convection increases with increasingintensity of the electric field.
The electrotransport in metallic melts at the intensity of the electricfield of 0.05 V cm–1 or lower (in order to reduce the intensity of

146
convection) and the appropriate length of the pipe (> 20 cm) maybe utilised sufficiently for removing a number of dissolved admixturesfrom metallic melts. In particular, the admixtures with high valuesof v
1/D
1 are removed easily. However, electrotransport is characterised
by low efficiency in the separation of the isotopes of the same metalin metallic melts.
9.3. Refining of metals by electrotransport through theoxide layer
This type of electrotransport may be compared to a certain degreewith the electrolytic refining of metals in aqueous solutions because,in this case, the electrolyte is represented by the solid layer of themetal oxide. A number of experiments has been carried out withelectrotransport through the layer of iron oxides. Iron specimens weresubjected to partial oxidation in order to produce a layer of FeO witha thickness of approximately 0.6 mm on two flat surfaces. The specimenwas placed between two iron sheets (Fig. 57), heated to 1000 °C,followed by passing direct current with a density of 50 A cm–2 for24 hours. The cross section of the specimen after the passage of currentwas used to examine the layer of deposited iron on longitudinal planesAB and A'B', and the thickness of the layer was proportional to theduration of the experiment and the density of current passing throughthe specimen. On the other hand, thickness decreased as a result ofdecay of anodic sheets of the planes CD and C'D'. The passage ofdirect current along the planes AB and A'B' resulted in the formationof a cathodic layer and in the dissolution of the anodic sheets alongthe planes CD and C'D'.
The mechanism of electrotransport through the layer of FeO maybe described probably as follows: the initial stage is characterisedby the migration of the Fe2+ ion from the anodic surface under theeffect of the electric field through the lattice of FeO to the cathodic
Table 12 Values of v1/D
1 in electrotransport of admixtures in melts of low-melting
metals, t = 300–350ºC, E = 0.02 V cm–1
tnevloS latemdevlossiD v1/D
1mc[ 1– ]
dCnInSbPiB
nI,nS,bP,iB,uA,gA,eT,oC,iNgA,eT,oC,iN
aC,dC,bS,uA,gA,eT,oC,iNnS,eS,dC,bS,uA,gA,eT,oCnS,eS,dC,uA,gA,eT,oC,iN
3241419.17.3

147
Fig. 57 Experimental setup in electro-transport through the iron oxide layer.
surface where it receives two negative charges and changes to theiron atom; correspondingly, the given area of the lattice of FeO ischaracterised by the formation of a hole which, in contrast to theFe2+ ion, moves in the direction of the anode surface. The iron atomof the anode plate enters into reaction with the hole and releasestwo negative electrical charges. The anode plate dissolved and theresulting Fe2+ ion travels to the cathode surface, etc.
Refining of iron to remove admixtures by means of electrotransportthrough the FeO layer was carried out using electrolytic iron witha purity of 99.988% Fe as anodic metal. The experiments at a currentdensity of 70 A cm–2, a temperature of 985 °C, duration 70 hours,resulted in a cathodic deposit with a thickness of 2 mm, analysedin a mass spectrograph. Table 13 shows the results of analysis incomparison with the analysis of initial anodic iron.
Table 13 shows that by electrotransport through the layer of FeO
Table 13 Analysis of init ial iron and iron after refining by electrotransport[at. ppm]
erutximdA latemlaitinI latemdenifeR erutximdA latemlaitinI latemdenifeR
aTbSbPgAoMbNrZeSsAaGiNoCnMrC
24.0
24.0
33.04.0
44405070308
22.07.04.03.01.04.0
411
05077.0
01
ViTaC
KlC
SP
iSgMaN
BOC
20301
1002004
07057
013.0
1053071
1.0301
1002
041
057013.0
1––
148
it is possible to purify efficiently metallic iron to remove a numberof admixture elements. For example, the content of Mo, V, Ti, S,P decreases by more than a factor of 10, the content of Sn, Nb, As,Ga, Cr, Sb by a factor of 2–3. However, a number of other elementsremain unchanged, even after electrotransport; they include, for example,Ni, Si, Co, Na, B, Ca.
There are two factors which may be used to explain the efficiencyof purification by electrotransport through the layer of FeO:– the insolubility of certain elements in the solid layer of the iron
oxides resulting in the buildup of these elements at the anode-oxide interface (S, P, As);
– the admixtures dissolving in FeO are characterised by a lower speedof motion of the ions in the FeO lattice in comparison with thespeed of motion of the Fe2+ ion.The identical process of electrotransport through the layer of oxides
may also be used for other metals whose oxides are characterisedby electrical conductivity at the temperature lower than the meltingpoint of the metal. The advantage of this purification method is thefact that there is no danger of contamination of the refined metalby the material of the boat, the atmosphere, etc., because refiningis carried out in the solid state. However, the metal to be purifiedalways contains a certain amount of oxides which may be removedonly subsequently, for example, by vacuum remelting of metals.However, at the same time, it must be remembered that similar processesof the redistribution of the admixtures by electrotransport in the solidstate through the oxide layer may also take place in technical practiceas undesirable processes, sometimes during accidental occurrenceof a direct current field. Of course, this has a negative effect in changingthe homogeneity of the substance and increases, for example, thesusceptibility to corrosion.
9.4. Applications of electrotransport in zone melting
The passage of direct current through a metallic bar refined by zonemelting results in most cases in the positive effect of refining, despitethe fact that the proportion of the current resulting in the displacementof ionised atoms in the metal is not large. Since zone melting is along-term process, the duration of the process is to a certain extentcomparable with the duration of the process of electrotransport and,consequently, the application of electrotransport is advantageous [3].
As regards the investigations carried out in this area, it is importantto mention the method of electron beam zone melting of tungsten

149
than with the application of the electric field of direct current usingthe specimens of tungsten wire with a diameter of 1.5 mm, 350 mmlong. In the experiments, the number of passages of the molten zoneand the intensity and direction of the electric field were varied. Theresults of experiments were evaluated by measuring the ratio of theresistance of tungsten wire specimens at room temperature and atthe liquid helium temperature ρ
298 K/ρ
4.2 K, Fig. 58.
Figure 58 shows that the additional direct electric field improvesin all cases the efficiency of refining of tungsten and the ratio ofthe resistance values increases. A positive effect is also exerted bythe increase of the intensity of the electric field from 0.125 to0.250 V cm–1, corresponding to a current density of 500 and1000 A cm–2. However, the positive effect of the additional field isevident only when the field is oriented in the direction against thedirection of movement of the zone. The field oriented in the directionof the movement of the zone has a negative effect on the purity oftungsten.
Experiments were carried out with the refining of cerium byelectrotransport combined with electron beam zone melting. In simpleelectrotransport at 700–750 °C, the admixtures Fe, Cu, Si and O aredisplaced to the anode. In the zone melting of cerium withoutelectrotransport, the admixtures Cu, Si and Fe are transferred inaccordance with their values of k <1 to the end of the ingot.
It may be concluded that electrotransport as the refining method
Fig. 58 Refining of W by electron beam zone melting combined with electrotransport(1 – E = 0 V cm–1; 2 – E = 0.125 V cm–1; 3 – E = 0.25 V cm–1).
Γ =
ρ2
98
K /ρ
4.2
K
n

150
may be used with sufficient efficiency for the removal of only certainadmixtures from solid metals. However, the method is efficient inrefining a large number of metallic melts, if it is possible to preventconvection in the metallic melt in the case of a high intensity ofthe electric field. One of the disadvantages of electrotransport is thelow productivity of the method. Consequently, electrotransport is usedpreferentially in the refining of small amounts of metals where ahigh degree of purity is required.
151
10. DIFFUSION
10. 1. Separation of gas substances by diffusion and thermaldiffusion
The separation and purification of gas components may be carriedout utilising their different rates of diffusion through porous barriers(membranes). Gases with higher diffusion rates concentrate on oneside of the membrane, on the other side gases with lower diffusionrates. Multiple repetition of this process in the chamber with a largenumber of porous membranes makes it possible to obtain a high degreeof separation of the gases.
At a low concentration of the gases diffusing through the porousmembranes (when the dimensions of the pores are small in comparisonwith the free path of the molecules) the ratio of the rates of diffusionv
A and v
B of any gases A and B at the given temperature and pressure
is inversely proportional to the ratio of the density ρ of these gasesor their molecular masses M
A, M
B
v
v
M
MA
B
B
A
B
A
= =ρρ
(82)
Therefore, as the gas becomes heavier or the molecular mass ofthe gas increases, the rate of diffusion of the gas through the porousmembrane decreases and, consequently, the concentration of the gasbehind the membrane decreases.
Another form of utilisation of the diffusion processes for separationof the gas components is thermal diffusion. If a container with a mixtureof gases is heated on one side and on the other side it is cooled,there will be a difference between the composition of the mixturein the hot and cold zones. The differences in the composition increasewith an increase of the temperature gradient between the two zones.The hot zone is characterised by the concentration of the componentswith lower molecular mass and vice versa.

152
Diffusion through porous membranes (diffusion cascades) and thermaldiffusion are used in practice in particular in the separation of isotopesin the form of gas compounds, for example
92235UF
6 from
92238UF
6 in
the enrichment process (despite the fact that ultracentrifuges are usedin this case).
10.2. High-voltage electrodialysis
High-voltage electrodialysis is the process of deep refining of substances,for example, electrolytes, from which admixtures are precipitatedby the application of an external direct high-voltage electrical field[3]. Electrodialysis is based on the acceleration of diffusion of ionsthrough a semi-permeable membrane. The direct electrical field makesit possible to increase greatly the degree and rate of purification ofsubstances.
Figure 59 shows the schematic section through electrodialysisequipment consisting of a vessel separated by membranes or diaphragmsinto three chambers. The membranes are permeable to the electrolyteand impermeable to the solid refined phase. The central chamber containsa suspension of the refined substance in water, the outer chamberscontain pure water and electrodes. After application of the directexternal electric potential to the individual electrodes, the anionsfrom the central chamber penetrate through the membrane to thepositively charged electrode and the cations penetrate the negativelycharged electrode. Basis compounds form in the cathode chamber,acids build up in the anode chamber. According to the degree ofsaturation in the outer chambers, the solutions are discharged fromthem and the chambers are filled with pure ionised water. This makesit possible to increase the rate of removal of the admixtures fromthe electrolyte in the central chamber.
Fig. 59 Scheme of a three-chamber electrodialyser (1 – anode chamber, 2 – middlechamber, 3 – cathode chamber, 4 – platinum electrode, 5 – diaphragm, 6 – stirrer,7 – seal).

153
The process of electrodialysis is characterised by a relatively highrate and efficiency at a potential gradient of 150–250V cm–1 and atthe total voltage on the terminals of equipment of 1500–1800 V. Currentusually does not exceeds units of amperes. The efficiency of the processdepends not only on the magnitude of high voltage but also on therate of exchange of water in the chambers. At high concentrationsof the ions in the anode or cathode chamber, reverse diffusion ofions into the central chamber may take place. In the case of ‘weak’electrolytes, the efficiency also depends on the degree of dissociationof the electrolyte. The efficiency of high-voltage dialysis may beincreased by, for example, the application of a five-chamberelectrodialyser where two other small chambers are used as collectorsof precipitated and removed ions of the admixtures thus preventingreversed diffusion.
High-voltage electrodialysis is used in the refining of a numberof substances such as, for example, SiO
2, TiO
2, NiCO
3, MgO, to remove
the admixtures present in the electrolyte, such as sulphides, chloridesNaCl, KCl, CaCl
2, MgCl
2. The removal of the admixtures insoluble
in water, for example, iron, aluminium, copper, is carried out usingcomplexing substances which selectively transfer the admixtures tothe soluble condition. In biological applications, dialysis units include,for example, artificial kidney components.
.
154
11. SELECTIVE PRECIPITATION, OXIDATION ANDREDUCTION
In selective precipitation from solutions of low-solubility compounds,the sequence of precipitation of these compounds is determined bychanges of the isobaric potential of the process. In the first instance,precipitation takes place in metals in which the formation of low-solubility compounds is accompanied by the maximum decrease offree energy or isobaric potential ∆Z0.
It is assumed that the components A and B that are in a solutionform a low-solubility compound A
mB
n in accordance with the reaction
m n m nA B A B+ = (83)
The equilibrium of the reaction at a given temperature is establishedon the condition that the sum of the potentials of the initial compoundsis equal to the isobaric potential of the final product. The isobaricpotential of the solid phase with a constant composition is consequentlyconstant. The reaction of precipitation of low-solubility compoundsA
mB
n takes place if the activity (concentration) of the initial compounds
A and B in the solution (or in the melt) satisfies the condition
m Z mRT a n Z nRT a Zm n
∆ ∆ ∆A A B B A B0 0 0+ + + = ln ln (84)
where ∆Z0 is the change of the standard isobaric potential, aA, a
B
is the activity of the components, and the activity of the solid phase(compound) A
mB
n is assumed to be equal to 1. The relationship between
the activities of the initial components in the solution in equilibriumwith the precipitated low-solubility compound is expressed by theequation
ln ln aZ m Z n Z
nRTn
a
mm n
A
A B A B B=− −( )
−∆ ∆ ∆0 0 0
(85)
The equation also shows
a aZ m Z n Z
RT
Z
RTm n pm nA B
A B B B=− −
=
exp exp
∆ ∆ ∆ ∆0 0 0 0
(86)

155
where aAm, a
Bm is the susceptibility of the given compound to solubility,
i.e. the stability of the given compound, ∆Z0p is the change of the
isobaric potential of the reaction in the standard conditions.It is evident that as the absolute value of the standard isobaric
potential of the reaction of formation of the low-solubility compoundincreases, the solubility of the resultant compound decreases.
A suitable example is the reaction of formation of hydroxides becausefor the majority of metals they are low-solubility compounds, Table14:
Me + OH Me(OH) ]n
n Sn+ − →← [ (87)
In precipitation of hydroxides of metals from the solutions, thehydroxides of the metal with the lowest pH (more acid solution) andalso those with lower solubility are the first to precipitate. Thisrelationship, determining the sequence of precipitation of salts, isalso valid for other compounds. In precipitation of two salts fromthe solution with the same anion, the ratio of the content of twocompounds in the solid phase characterised by isomorphous precipitationis proportional to the ratio of the concentrations of these compoundsin the solution.
Selective reduction or oxidation, i.e. transition of ions to loweror higher valency, may be used to increase the differences in theproperties of similar elements, for example, facilitate the transitionof one of the elements into the solution or decrease its volatility
Table 14 Equilibrium pH values of formation of hydroxides of several metals
noitcaersisylordyH∆Ζ0
p
g·Jk(qe)
amAan
B
ytilibuloS1·lom( 1– )
Hp
oC +3 H3+2
)HO(oC=O3
H3+ +
bS +3 H3+2
)HO(bS=O3
H3+ +
nS +2 H2+2
)HO(nS=O2
H2+ +
eF +3 H3+2
)HO(eF=O3
H3+ +
lA +3 H3+2
)HO(lA=O3
H3+ +
iB +3 H3+2
)HO(iB=O3
H3+ +
uC +2 H2+2
)HO(uC=O2
H2+ +
nZ +2 H2+2
)HO(nZ=O2
H2+ +
iN +2 H2+2
)HO(iN=O2
H2+ +
gM +2 H2+2O )HO(gM=
2H2+ +
5.77–2.37–0.27–2.17–4.26–8.75–8.75–5.64–4.93–2.23–
01·0.3 14–
01·0.4 24–
01·0.5 62–
01·0.4 83–
01·9.1 33–
01·3.6 33–
01·6.5 02–
01·5.4 71–
01·0.1 51–
01·5.5 21–
01·7.5 11–
01·1.1 11–
01·3.2 9–
01·0.2 01–
01·9.2 9–
01·3.6 9–
01·4.2 7–
01·2.2 6–
01·4.1 5–
01·1.1 4–
0.12.14.16.11.39.35.49.51.74.8
Z0p
noitcaersisylordyhehtfolaitnetopcirabosidradnatsehtfoegnahc–seitreporplaudividninosdnepedhcihwsetardyhfonoitamrofforotcafnegordyh–Hp
noitulosnilatemdetatipicerpfosnoifoytivitcanodnaam
Aan
Bdnuopmocehtfoytilibats–
∆Z0p
–
∆Z0p
aAma
Bn
aAma
Bn
[kJ geq
] [mol l–1]

156
in comparison with the other element. For example, in the extractionof germanium tetrachloride GeCl
4 by hydrochloric acid, it is even
possible to extract all admixtures, with the exception of AsCl3. However,
the solubility of arsenic rapidly increases if the As3+ ion is transferredby oxidation to As5+. This may be carried out by adding chloridesor nitric acid. The resultant AsCl
5 is almost completely soluble in
concentrated hydrochloric acid.The separation of zirconium from hafnium is carried out utilising
differences in the volatility of ZrCl4 and ZrCl
3. In heating of ZrCl
4,
containing admixture of HfCl4 with zirconium powder in vacuum to
400–450 °C, the majority of zirconium tetrachloride is reduced toZrCl
3 with relatively low volatility. HfCl
4 is not reduced and at the
same time may be obtained in the form of a hafnium concentratewith the ratio Hf : Zr > 10 together with part of the non-reducedZrCl
4. In the remaining ZrCl
3, the Hf : Zr ratio decreases from 2 to
0.05. Subsequently, ZrCl3 can be transferred back to ZrCl
4 at a
temperature of 550 °C. ZrCl4 contains less hafnium than the initial
specimen.Selective oxidation and reduction of metals, of their oxides or
other compounds in classic pyrometallurgical reduction and refiningprocesses [43], including deoxidation processes in the refining meltingof metals and alloys, are well known from the theory of metallurgicalprocesses.
157
12. DEGASIFICATION OF METALS
In the production of pure metals, it is necessary to pay special attentionnot only to the presence of gases in them but also to the methodsand means of decreasing the concentration of gases dissolved in metals.The presence of the gases nitrogen, oxygen, hydrogen and also ofcarbon and other interstitial admixtures in metals, even in very smallquantities, has a strong negative effect on the physical and mechanicalproperties of metals, especially plasticity and brittleness, for exampleU, Ti, Zr, V, Ta, Cr, W and Mo. Therefore, sections of electrical vacuumdevices operating in a high vacuum of 10–3 up to 10–6 Pa and at highertemperatures are made of structural material such as, for example,Cu, W, Mo, Ta where the maximum permissible content of gases islimited.
12.1. Gases in metals
The nature of gases present in metals, i.e. the nature and strengthof bonding of gases with metals, may differ:– adsorption of gases by the surface of metals (physical adsorption
and chemisorption);– dissolution of gases in metals;– chemical reaction of gases with metals.
The diffusion of gases is a process leading to the equilibriumcondition by the equalisation of the gas pressure in the metal, bothin the solid state and in melting in the given medium. The rate ofdiffusion of gases in metals for diatomic gases oxygen, hydrogenand nitrogen may be expressed by the equation
fnp
d
H
RTDD= −
exp∆2
(88)
where– f
D is the amount of the gas diffusing at partial pressure p through
the unit area of metal during unit time at a temperature T;– ∆H
D is the change of enthalpy of diffusion in the metal–gas system;

158
– n is a constant;– d is the thickness of the metal layer.
This equation indicates that the rate of diffusion of the gas isinversely proportional to the thickness of the metal layer throughwhich the gas passes. The rate of diffusion increases with increasingtemperature and gas pressure. The formation of oxides and other layerschanges the dependence of diffusion on pressure. When a compact‘protective’ layer forms on the surface of metal, diffusion is no longerdependent on pressure.
The diffusion of gases takes place preferentially and directly throughthe crystal lattice of the metal, not along the grain boundaries. Thegases diffusing into the metals are capable of dissolving in them.They are implanted in the lattice with the formation of solid solutions,mostly interstitial. In the majority of cases, the dissolution of gasesin metals is an endothermic process and, consequently, the solubilityof gases in metals usually increases with increasing temperature. Duringcooling of metals, the gases escape from the metals and this resultsin a number of difficulties in both crystallisation (formation of bubbles,etc.) and in solid state transformations (flakes in steel, etc.).
The temperature dependence of the isobaric solubility of diatomicgases in metal is described by the equation
sH
RTS= −
const. exp∆2 (89)
and the dependence of solubility on pressure (according to Sievertslaw) is expressed by the equation:
s p = const . (90)
where ∆HS is the molar enthalpy of dissolution of the gas; s is the
solubility of the gas; p is the partial pressure of gas above the melt.The square root of partial pressure p in equation (90) expresses
the dissociation of the gas molecule into two atoms. The cube rootis used in equation (90) for a molecule with three atoms, etc. Theprocess of dissolution of gas may take place at positive or negativevalues of the enthalpy of dissolution ∆H
S, i.e. the process may be
endothermic or exothermic. In the endothermic dissolution process,the solubility of gas in metal increases with increasing temperature,Fig. 60.
In the molten state, the majority of metals dissolve oxygen whichforms oxides of, for example, copper, cobalt, silver, vanadium, titanium,etc. However, oxygen does not dissolve in noble metals, gold, mercuryand platinum. Oxidation of metals may also take place as a result

159
of reactions with the vapours of water or other gases CO, CO2, SO
2.
More complicated gases, containing oxygen, dissociate into atomsprior to dissolution in the metal. During cooling of the metal, theexcess oxygen precipitates as an oxide or free gas, for example, insilver.
Nitrogen is characterised by preferential dissolution in metals alreadyat low temperatures. At higher temperatures, nitrogen forms nitrideswith the metallic elements Fe, Mn, Al, Mg, Cr, V, W, Mo, Zr, Ti... At temperatures below 1200 °C, nitrogen is almost insoluble incopper, nickel and cobalt. Aluminium is capable of dissolving at700 °C 1 cm3 of nitrogen in 100 g of metal which represents~1.2·10–3 wt.% of nitrogen in aluminium. The nitrogen, formed inthe metals, can be divided into three groups:– ion (Li
3N, K
3N, Be
3N
2, Ca
3N
2)
– covalent (AlN, BN, Si3N
4)
– admixture (TiN).Hydrogen dissolves in all technically important metals and is the
Fig. 60 Dependence of the solubility of hydrogen in some metals on temperature(endothermic dissolution process).
Temperature [oC]
Ga
s so
lub
ility
[cm
3 1
00
g–
1]
40
30
20
10
0200 600 1000 1400
Mo Al
Ni
Cu
Fe
160
only gas diffusing in metals at room temperature. Prior to dissolution,the hydrogen molecule dissociates into the atomic gas. The solubilityof hydrogen in metals (cm3/100 g of metal) depends on temperature,Fig. 60, which shows that the solubility of hydrogen at the meltingpoint of metals changes in a jump [13, 41]. The characteristic typesof reactions of hydrogen with metals are:– the formation of solid solutions Fe, Cu, Al, Ni, Co, Cr, Mo, Ag,
Pt;– the formation of exothermic hydrides in which hydrogen precipitate
in the form of a positive ion TiH2, LaH
3, NbH, TaH, PdH, VH;
– the formation of exothermic hydrides with metals of groups I andII – NaH, CaH
2, BaH
2, LiH;
– endothermic covalent hydrides B2H
5, SiH
4, TeH
2.
12.2. Vacuum refining of metals
In vacuum refining of metals there is a difference between the boilingpoint of the metal to be refined and the boiling point of the admixturesor impurities that are present in the metal and are to be removed.The metals with lower boiling points are removed either by vacuumdistillation, but this may be accompanied by the evaporation of notonly the metals regarded as impurities but also metals regarded asalloying elements, for example, chromium in electron beam or plasmamelting of W–Cr–Co alloys or manganese and copper in vacuum meltingof other high-temperature alloys. Consequently, these alloys cannotbe efficiently and reproducibly melted without large losses of evaporatingor sublimating metals or compounds.
In practice, there are sometimes cases in which a large reductionof pressure results directly in the sublimation of refined metal. Innon-ferrous metallurgy, this method is mainly used for refining of,for example, calcium, high-purity magnesium for the reduction ofuranium, or tellurium for application in semiconductor compounds,etc.
In vacuum, the metals are refined not only by distillation in theelemental condition but also by means of easily evaporating ordissociating compounds.
With a decrease of the total pressure in the gas phase, the equilibriumand actual amount of dissolved gas in metal also decreases. In thepresence of total vacuum, the gas content of the metal should be equalto zero. However, this applies only to a very thin layer of the melt.The gas may escape from the melt in vacuum only from the surfacelayer. Inside the melt, the high metallic static pressure prevents the

161
release of gas in the form of bubbles. Therefore, in this case it appliesthat sufficiently effective and rapid degassing of the melt is possibleonly when the surface of the melt is renewed by suitable movementof the melt. Otherwise, the gas can travel to the surface only by meansof diffusion and this greatly reduces the rate of the process.
Bubbling of the melt with inert gases is an efficient method ofnot only mixing the melt but also reducing the partial pressure ofthe gases dissolved in the melt which may diffuse from these bubblesinto the melt during rising of the bubbles of the inert gas throughthe melt.
The gases forming compounds with a metal, for example, Cu2O
in copper, Al2O
3 or AlCl
3 in aluminium, etc., can be removed only
to a limited extent by the effect of vacuum. The amount of the gasesremaining in the melt is determined by the equilibrium of theirdissociation:
2 2 2 Me Me X[ ] [ ] [ ]X L L G= + (91)
where Me is some bivalent metal, and X is the diatomic gas.Of the metals forming compounds with metals, the most important
is oxygen whose removal from metal is referred to as deoxidation.However, deoxidation cannot be carried out exclusively in vacuum,and its efficiency may be increased by adding a suitable reductionagent, for example, carbon, whose product is the gaseous carbon oxideand vacuum is very important for its removal.
The most radical method of decreasing the total level of the gasesin metals is vacuum zone melting at a very low residual pressure(lower than 1 Pa) in the melting chamber. Other refining methods,for example, distillation in nitrogen, melting in an induction furnace,electrolysis, etc., do not enable significant changes in the contentof gases in the metals [43].
Electron beam vacuum melting is a highly efficient method ofdegassing metals enabling a very rapid decrease of the gas contentin both non-ferrous metals and, in particular, in refractory metalsW, Mo, Ta, Nb, Ti, Zr, Re and their alloys. Electron beam heatingis utilised in particular in zone refining and melting of these alloysand metals. Electron beam melting is carried out at temperatures ofup to 5000 °C and at a working vacuum of 10–2–10–4 Pa. The processenables a large decrease of the gas content and removal of easilyvolatile compounds from the main electron beam remelted metal.In electron beam melting of the metal to be used for refining, thedroplets of molten metal fall into a water-cooled solidification mould.In the working vacuum, there is not only removal of gases oxygen,

162
hydrogen, and nitrogen from the metal, but the high working temperaturealso results in the operation of metal admixtures with high vapourtension (Mg, Zn, Pb, Cu, Sn). In addition to this, the carbon contentdecreases as a result of its reactions with the residual oxygen presentin the metal with the formation of gaseous carbon monoxide. Furtherrefining of the metal also takes place by the evaporation of volatileadmixtures from the surface of molten metal in the solidification mould.Consequently, it is possible to remove 30-50% of volatile admixturesfrom the metal bath.
In refining of refractory metals by electron beam vacuum melting,the total content of the gases present in the melt decreases byapproximately a factor of 100, the oxygen content decreases from10–2 to 10–4%, and the concentration of the admixtures nickel, ironand also of other metals decreases by approximately an order ofmagnitude. This refining process results in a large increase of theplasticity of metals and in a large (15–20 times) increase of the durabilityof structural parts of electronic and electric vacuum systems.

Summary of terms:
Electrotransport Electrotransport in solid state substances Electrotransport in metallic melts Electrotransport through the oxides layer Electrotransport in zone melting Separation of gas substances by diffusion and thermal diffusion High-voltage electrodialysis Electrodialyser Selective preparation Selective oxidation and reduction Degasification of metals Sieverts law Vacuum refining of metals
Questions:
After studying this chapter you will be able to clear up the following terms: 1. What is a difference between electro-transport and electrolysis? 2. Explain the principle of electro-dialysis. 3. What are essential differences between the selective preparation, selective oxidation and
reduction? 4. What influence has the pH value on formation of metal hydroxides? 5. Which equation can be used for the description of the dependency of gas solubility on
pressure? 6. What is a difference in the behavior of oxygen, nitrogen and hydrogen in transitive metals?
Exercise for solving:
1. Explain the character of the dependency of hydrogen solubility in some metals on
temperature. Why do step changes occur at a specific temperature? – see Fig. 60.

13. METHODS OF TESTING PURE METALS
Time needed to study: 120 minutes
Aim: After studying this chapter
You will be introduced to the principles of the basic analytical methods for testing of chemical purity of materials. You will know about physical methods for testing of global chemical purity. You will be introduced to the methods of examination of the structure and perfection of crystals.
Reading:

163
13. METHODS OF TESTING PURE METALS
13.1. Analytical methods
The methods of analytical chemistry occupy a significant positionin the inspection of the purity and quality of metals, alloys andcompounds. The main task in the analysis of pure substances is thequalitative and quantitative determination of the content of admixturesand accompanying elements with maximum accuracy. Consequently,the analytical methods are not only the means of inspection but alsothe integral part of every research or industrial practice, and alsoin other areas, in addition to chemical production.
The currently available methods of the chemical analysis of puremetals will be analysed below. The maximum efficiency of analysiscan be achieved by the combined application of different chemicalanalytical methods of determining the content of elements; this isgiven in Table 15, including the sensitivity of these methods [47].
Table 15 Range of application of some analytical methods
dohteMegnarnoitacilppA
]%[
noitartit,yrtemivarG 01ot001 2–
yhpargoraloP 01ot1 5–
ypocsortcepsnoissimE 01ot1 6–
ypocsortcepsemalF 01ot1 8–
yrtemotohportcepsnoitprosbA 01ot1 6–
yrtemotohpnoitprosbacimotA 01ot1 8–
yrtemiroulF 01ot1 8–
yrtemortcepsssaM 01 3– 01ot 01–
sisylananoitavitcA 01 3– 01ot 21–

164
The analytical determination of the content of elements in specimensmay be divided into the following stages:– sampling, preparation and dissociation of specimens.– separating by the chemical method or on the basis of different
physical principles;– the actual determination of the content of admixtures, measurement
of the selected physical or chemical properties.
13.2. Gravimetry and titration
The principle of gravimetry (weight analysis): the component of thespecimen to be investigated is transferred into a low-solubility reactionproduct and the amount of the product is determined by after conversionto the substance of the defined composition by drying or baking.
The separation of the component to be determined may be carriedout by the following procedure:– leaching with water or another solution agent– expulsion of the component to be determined by increasing
temperature (annealing, calcination).– electrolytic precipitation of metals on a platinum cathode or anode.
The titration methods are based on measuring the volume of thesolution with the known efficiency of the volumetric solution, whichis added in small amounts to the solution of the substance to bedetermined up to equivalent point, i.e. the condition in which theadded volume of the volumetric solution is equal to the theoreticalrequired amount for the reaction with the substance to be determined.
On the basis of the type of reaction:– acidobasic titration– reduction–oxidation titration– titration based on the formation of complexes and compounds with
a low degree of dissociation– precipitation titration
13.3 Polarography
Polarography is an electrochemical method used for the examinationof the dependence of electric current on voltage supplied to a coupleof electrodes immersed in the electrolysis solution. One of theseelectrodes is characterised by efficient polarisation, usually it is amercury droplet electrode, ensuring reproducibility of the measurements.The method is based on the formation of diffusion current whosevalue is proportional to the content of the substance in the solution
165
to be analysed. The intensity of diffusion current is recorded on apolarogram characterised by the formation of the so-called polarographicwaves, whose position characterises the type of substance presentin the solution and enables its qualitative determination. Consequently,the height of the wave determines the amount of the substance presentin the solution, i.e. quantitative determination. Polarographic analysishas the following advantages:– it enables the simultaneous determination of several components
in the solution, both qualitative and quantitative– the method is objective, highly accurate, sensitive, was good repro-
ducibility– a small amount of solution (0.005 ml) is sufficient for analysis– the consumption of chemical agents is minimal.
13.4. Emission spectral analysis
Emission spectroscopy (ES) includes methods based on the spontaneousemission of particles (atoms) of the analysed substance by the absorptionof non-radiation energy (for example, thermal energy) resulting inthe transition of these particles to the excited condition. During transitionfrom the excited condition to the condition with a lower energy (forexample, the ground condition), the particles emit a characteristicenergy quantum which is recorded as an emission line with a specificwavelength. The absolute value of the quantum (the wavelength ofthe emission line) is given by the qualitative nature of the particles,and the intensity is given by the concentration of the particles. Thereis atomic emission spectroscopy (AES), based on the emission ofradiation of electroneutral atoms or ions, and molecular emissionspectrometry (MES), based on the emission of radiation of moleculesor particles. AES is divided into spectrometry in the region of opticalspectra (vacuum ultraviolet range from 100 to 200 nm, ultravioletrange from 200 to 380 nm, visible range from 380 to 760 nm, andinfrared region above 760 nm), and the spectrometry of x-ray radiation,0.01–10 nm.
Analysis carried out in equipment consisting of an excitation source,a spectrometer for the separation of individual frequencies, a systemof lenses or mirrors, providing for the conduction of radiation fromthe source to the spectral device (detector), used for the measurementof radiation current for the individual frequencies, and finally, if thedetector is in the form of a photographic sensitive layer – auxiliaryevaluation equipment, projectors, line photometers, microscopes.Depending on the supplied energy, the excitation sources are divided
166
into flame and electrical. In the case of the flame sources, the analysedcompound is supplied in the form of aerosol into the flame of gasfuels, combusted in oxygen or in air. The electric source of radiationis the low-temperature plasma of electric discharge excited in arc,spark or high frequency oscillators (direct current arc has a temperatureof 5500–6500°C). The spectrometers manufactured commercially byvarious companies are capable of determining simultaneously up to20 analysed elements in the matrix, for example, in aluminium, theymake it possible to determine the content of the elements Cu, Fe,Si, Mn, Mg, Zn, Ni, Cr, Ti, Pb, Bi, Sn, Be, V, Ca, B, Ga, Zr, Cd.
13.5. Absorption spectrophotometry
Absorption spectrophotometry (AS) is an analytical method basedon the absorption of electromagnetic radiation in the visible andultraviolet ranges of the spectrum. The measured substance absorbsthe characteristic quanta of electromagnetic radiation energy, thusincreasing the content of the internal energy of the particles of thesubstance, atoms or molecules. The radiation, not absorbed by thesubstance, falls on the detector which transforms the radiation energyto electric current. The determined signal must be in a definedrelationship to the gradient of current falling on the detector(photoelectric cell) and, also to absorbance A, in order to use thelinear relationship of this quantity to concentration C: (Lambert–Baer law of absorption spectroscopy):
logΦΦ
0
= =A C lε (92)
where Φ0 is the flux entering into the medium to be measured;Φ is the light flux, leaving the measurement medium (weakened byabsorption); A is absorbance; ε is absorption (extinction) factor;C is concentration; l is the thickness of the layer of the measuredsubstance.
Light absorption is measured by photoelectric methods, i.e. themeasurement of photoelectric current formed as a result of the incidenceof radiation, passed through the absorbing medium, on the detectorin the visible or ultraviolet range, or colorimetric methods, i.e. thevisual comparison of the colour of the investigated solution with thecolour of the solution of the known composition. Equipment formeasuring absorption consists of a radiation source usually representedby a deuterium or halogen discharge tube, a monochromator, a filter,a grid and a prism used for the dissociation of polychromatic radiation

167
into a sequence of individual wavelengths, a collimator (forming thebeam), measuring cells with the solution to be measured, sensors(photoelectric cells, diodes, multipliers), an amplifier and an evaluationdevice. Up to 80 elements can be determined by the photoelectricmethod. The method is fast, sensitive and suitable for the determinationof trace concentrations (of the order of parts per million).
13.6. Atomic absorption spectrometry (AAS)
The AAS is based on the examination of the absorption of atomicspectra by free atoms in the gas condition, in most cases in a flame.The Kirchoff law indicates that the free atoms in the gas conditionare capable of absorbing the radiation of the wavelengths identicalwith those which they themselves emit. In the flame, or using someflame-free technology, for example, an electrically heated measuringcell, the specimen evaporates and is atomised. Subsequently, thegas plasma is subjected to interaction with the emission radiationof the analysed element (the monochromator of the selected emissionline of the given specimen) emited by the source, i.e. a hollow cathode.The detector indicates the current of monochromatic radiation weakenedby absorption by atoms which is proportional to the concentrationof the analysed element in the specimen. Under suitable selectedexperimental conditions, this method may be used for the quantitativedetermination of almost all metallic elements of the periodic systemof elements. Because of its speed, sensitivity, accuracy and specificfeatures of determination of a large number of elements, atomicabsorption spectroscopy is used on an increasing scale in advancedanalytical laboratories in many industries.
13.7. Fluorescence spectroscopy
Fluorescence spectroscopy includes the methods based on themeasurement of fluorescent radiation emitted by the analysed substance.The common feature of these methods is the primary absorption ofenergy which increases the total internal energy of the moleculesor atoms of the analysed substance and subsequently it is emittedby them as secondary fluorescent radiation. On the basis of the absolutevalue of the energy quanta of fluorescent radiation, the fluorescencemethod may be divided into:– x-ray fluorescence spectrometry. Characteristic radiation in this
case is excited by an x-ray lamp or a beam of electrons acceleratedby a voltage of approximately 10 kV. Using the method, it is possible

168
to analyse elements with the proton number higher than 11. Inthe method, measurements are taken of the dependence of theintensity of fluorescent radiation of the substance on the appropriatewavelength, i.e. qualitative analysis, and its concentration, i.e.quantitative analysis. Detectors are represented by scintillationdetectors, gas proportional detectors or silicon or germaniumsemiconductor detectors. Commercially produced analysers containup to 30 channels, operate in the automatic mode and are veryfast. The high output of the x-ray lamps makes it possible to excitethe radiation of elements in concentrations of the order of 10–3
%. The elements which can be easily analysed include Fe, Mn,Si, Ca, Mg, Al, P, Cr, Ti, Na, K, Ba, Zn, Cu, Ni, V, S, Co, W,Mo, Nb, Ta.
– atomic fluorescence spectrometry (AFS) works in the visible andultraviolet ranges of the spectrum.
– fluorimetry – the analysed particle is the molecule. The sourceof ultraviolet radiation is usually a mercury high-pressure dischargelamp.
13.8 Local microanalysis
Local microanalysis is used for examining the chemical compositionof microvolumes inside or on the surface. In most cases, it is carriedout using spectral analytical methods, such as electron microanalysis,Auger spectrometry, the mass spectrometry of secondary ions, themass spectrometry of the ion field, electron-induced desorption, etc.The principle of the majority of these methods is that the focusedbeam of exciting radiation or particles hits the specimen in the analysedarea resulting in various physical effects which are subsequently detectedand analysed. The exciting beam may be represented by acceleratedelectrons, ions, protons, and photons of x-ray, visible or ultravioletradiation. Analysis may be carried out using excited electrons withdifferent energies, characteristic x-radiation, secondary ions, etc.
The electron microanalyser is a vacuum x-ray spectrometer withenergy dispersion, supplemented with a scanning electron microscope.The focused electron beam hits the specific area of the specimenand induces characteristic x-radiation there. The method can be usedfor elements with the proton number of 4 (beryllium) or higher.
Auger electron spectrometry (AES) is the analysis of electronsemitted during the mutual interaction of ionising radiation, mostfrequently electrons, with the specimen. Auger spectrometry ischaracterised by the especially high depth resolution (0.5–2.0 nm).

169
The method is used for examination of microinhomogeneities onlyin a thin layer on the surface of the specimen.
Mass spectrometry is a method for separating the individualcomponents of the specimen in the form of analysed particles, capableof independent existence in the gas phase. It is the method of two-dimensional separation on the basis of the mass of the componentsand also their concentration in the specimen. The division processis carried out in electric and magnetic fields of a mass spectrometer.Ionisation of the microvolumes is carried out by, for example, theimpact of electrons, high-frequency spark discharge or laser. Aphotosensitive plate is used for recording the spectral lines, whereeach line corresponds to a specific isotope of the elements (qualitativeanalysis). Quantitative analysis is carried out by spectrometry or themethod of the last visible line on the photoplate from a series ofspectra with gradually decreasing exposure intensity. The massspectrometry of solids makes it possible to determine up to 75 elementssimultaneously.
The mass spectrometry of secondary ions (SIMS method) ischaracterised by the formation of free ions from solid substancesbombarded with primary ions. In the case of accurately determinedparameters of the primary ions, secondary particles, characteristicof the overall composition of the surface layers of the investigatedspecimen, are emitted. This method makes it possible to analyse metallicconducting, semiconductor and non-conducting materials, and canalso be used for the determination of the isotope composition. Itcan be used to determine all elements of the periodic system. Theabsolute sensitivity of the method is 10–16–10–19 g and can be usedin the concentration range 1–10%.
13.9. Radiometric methods
The radiometric analytical methods are based on the directproportionality between the mass of the radioisotope and the intensityof radiation of the isotope. The radioisotope may be present in theanalytical substance and, consequently, it is radiometric titration ormethods of isotopic dilution. The radioisotope may also be producedartificially in the specimen and this is the method of activation analysis.Another group of methods is based on the measurement of the intensityof external radioactive radiation after its absorption or scatteringby the investigated substance.
The radiometric analytical methods are simple and fast, selective,characterised by high sensitivity and are nondestructive. They are

170
suitable for the determination of trace amounts of admixtures in high-purity materials, for example, in semiconductors, in structural materialsof nuclear reactors and space materials, and also in biomaterials.In analysis, it is necessary to measure the radiation emitted by thesubstances or emitted by their radionuclide formed by activation,or measurements are taken of the changes of external radiation (α,β, γ, neutron) after its absorption or backscattering by the analysedsubstance, or it is necessary to utilise the ionisation caused by radioactiveradiation. The detectors of the individual types of radiation includethe ionisation chamber, the Geiger–Müller counter, the scintillationprobe with a photomultiplier for α particles – ZnS (Ag) scintillator,for β-radiation NaI(Tl), for γ-radiation, the crystal of anthracene andsemiconductor detectors Si(Tl), Ge(Tl) with thallium.
In the methods based on the scattering and absorption of radiation,the source of radiation is usually 242Cm (half-life 162 days) or 241Am(458 years); they are both suitable for the determination of lighterelements. γ-emitters are usually represented by radionuclides 90Sr/90Y used for the analysis of binary and multicomponent alloys. Using170Tm, it is possible to determine the ash content of coal. Neutronanalysis is used as a source of fast neutrons 241Am/Be, 226Ra/Be, 210Po/Be.
Radionuclide x-ray fluorescence analysis – this method is basedon the excitation and detection of characteristic x-radiation. Suitableemitters are 90Sr/90Y, 147Pm, 204Tl, 85Kr, 3H. The target is usually producedfrom C, Cu, Ag, Au, Al, Sn. In the determination of lighter elements,good results have been obtained with 3H/Zr and 3H/Ti sources. Atpresent, the x-ray fluorescence analysis systems are produced withtwo radionuclide sources, for example, with the source 239Pu, whichis suitable for the determination of Pb, Cu, Zn, Mn, Cr, Fe, Co, Ni,and with the source 109Cd, for the determination of Mo, Nb, Zr.Radionuclide x-ray fluorescence analysis is used widely in mining,for example, for the inspection of mined ores, in flotation plants,in metallurgy of steel and non-ferrous metals, with a limiting sensitivityof up to 0.001%.
The methods based on the measurement of the natural activity ofradioactive isotopes of elements with the long half-time found innature: K, Rb, In, La, Sm, Re, Ru, Th, U, Rn, Ac, C, Po, Zr, Sn,W, Bi. The measurement of exhalation of radon from bedrock is basedon a similar principle.
In radioactivation analysis, the analysed element of the admixtureis activated in the same manner as the stable isotopes of the elementspresent in the specimen for the artificial radioactive isotopes by a

171
nuclear reaction after irradiation with neutrons, protons, deuterons,or high-energy quanta. The resultant radioisotopes differ in the half-life, the type and energy of radiation. This method may be used tonot only identify the individual elements but also determine the amountof these elements.
Of greatest importance is neutron activation analysis (NAA). Inirradiation with a flux of neutrons, the latter are trapped by atomicnuclei. When trapping a single neutron, the new resultant unstablenucleus has the same sequence number but is heavier by one massunit. After a specific time of existence (10–20–10–12 s), the nucleusis stabilised by the emission of a single photon, proton, alpha particleor two neutrons. Activation is carried out using radioisotope neutronsources, neutron generators, or in most cases a nuclear reactor witha neutron flux of 1015–1020 m–2 s–1 fitted with experimental channelsfor placing the specimens to be irradiated. If the analysis is carriedout without destruction of the specimen, it is instrumental activationanalysis (IAA). This method is used widely in analysis of a largenumber of materials (high-purity metals, rock, biological materials,food, etc), especially in the determination of elements present in traceconcentrations in the main compound. By activation in the reactorit is possible to obtain, for radiometric measurements, the radioisotopesof all elements important in metallurgy: Mn (10–11/g), Na, Cu, Al,As, Sb, Ga, V, Ta, W, Au (10 –10/g), Cd, Zn, Ba, Ni, Co, P, U(10–9/g), Ag, Hg, Tl, Te, Cr, Mo, Zr (10–8/g). The method can alsobe used for determination of the lanthanides and elements of the platinumgroup present in the investigated substance, because they arecharacterised by large activation efficient cross sections. Theradionuclides, formed as a result of radiation, emit in the majorityof cases β-radiation with different energies, are characterised by differentβ and their activity differs by several orders of magnitude.
The concentration gradients (Fig. 32 and 33) and segregationmicroinhomogeneities, formed during the solidification of metals andindicated by means of radionuclides, are determined by thenondestructive slit method and by the destructive sectioning method[159]. The distribution of the marker atoms is also indicated byautoradiographic examination (Fig. 34b).
13.10. Determination of gases in metals
The content of the gas admixtures or of reaction products with otherelements in metals may have a detrimental effect on the propertiesof materials. In metal melts and also in solid metals, gases as nitrogen,
172
hydrogen, oxygen, and also carbon are present either as interstitialsolid solutions or in the atomic or molecular form, as chemicalcompounds (nonmetallic inclusions), or as absorption or surfacecompounds. In addition, the metals may contain other gases suchas CO, CO
2, CH
4, H
2S, inert gases and water vapours.
The methods of gas analysis may be divided into:– absorption methods – volumetry, nanometry, electrochemistry,
photometry, thermochemistry;– combustion methods – the determination of the volume changes
formed as a result of the combustion of the analysed substanceor determination of the calorific effect of the chemical reactiontaking place on the solid catalyst (thermometry)
– gas chromatography – the diffusion process taking place betweentwo immiscible phases on the basis of absorption or separation;
– distillation methods – fractional condensation in analytical columns;– diffusion methods – separation of the isotopes– measurement of density – the application of gas balance and
effusiometers, or the measurement of the velocity of sound andlight interference;
– magnetometric methods – determination of the oxygen concentrationin gases;
– measurement of the heat conductivity of gases;– optical methods – absorption methods for the analysis of non-ferrous
metals, emission methods for the analysis of inert gases;– mass spectrometry of gas compounds;– the activation neutron analysis – the method is used mainly for
the determination of oxygen and nitrogen in metals. It is basedon the nuclear reaction 16O (n,p) 16N. In most cases, the detectoris in the form of a scintillation crystal NaI(Tl). The measurementtime is 20–30 sec, the limiting sensitivity is up to 10–5 % of oxygen.In the case of nitrogen, the irradiation and measurement time isapproximately 10 min, sensitivity is 10 ppm of nitrogen.
13.11. Evaluation of analytical methods of determinationof pure metals
The most universal method of analysis of metals is spark massspectrometry. In analysis, it is possible to determine 70–75 elements(admixtures), with the limiting sensitivity of 10–6–10–8 wt.%, withthe consumption of several milligrams of the analysed substance.However, quantitative determination requires standards which in manycases are not available.
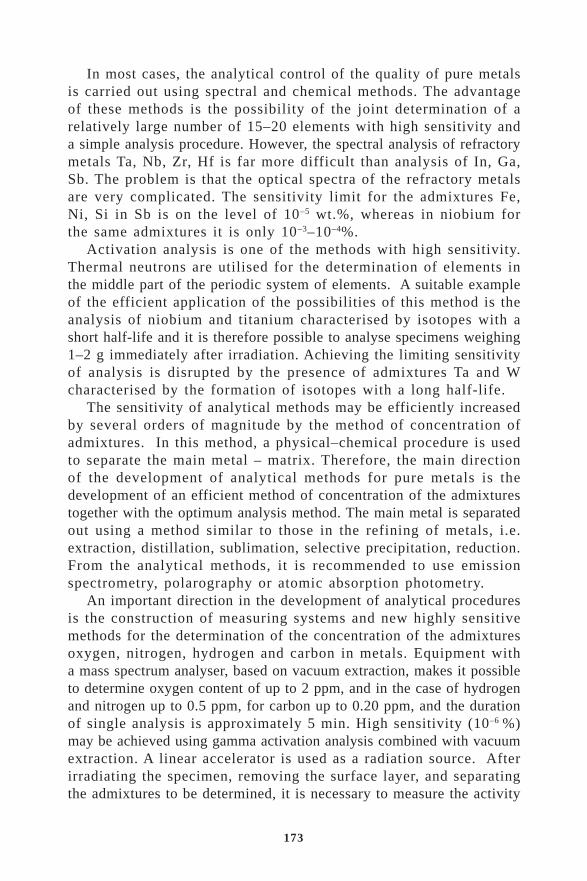
173
In most cases, the analytical control of the quality of pure metalsis carried out using spectral and chemical methods. The advantageof these methods is the possibility of the joint determination of arelatively large number of 15–20 elements with high sensitivity anda simple analysis procedure. However, the spectral analysis of refractorymetals Ta, Nb, Zr, Hf is far more difficult than analysis of In, Ga,Sb. The problem is that the optical spectra of the refractory metalsare very complicated. The sensitivity limit for the admixtures Fe,Ni, Si in Sb is on the level of 10–5 wt.%, whereas in niobium forthe same admixtures it is only 10–3–10–4%.
Activation analysis is one of the methods with high sensitivity.Thermal neutrons are utilised for the determination of elements inthe middle part of the periodic system of elements. A suitable exampleof the efficient application of the possibilities of this method is theanalysis of niobium and titanium characterised by isotopes with ashort half-life and it is therefore possible to analyse specimens weighing1–2 g immediately after irradiation. Achieving the limiting sensitivityof analysis is disrupted by the presence of admixtures Ta and Wcharacterised by the formation of isotopes with a long half-life.
The sensitivity of analytical methods may be efficiently increasedby several orders of magnitude by the method of concentration ofadmixtures. In this method, a physical–chemical procedure is usedto separate the main metal – matrix. Therefore, the main directionof the development of analytical methods for pure metals is thedevelopment of an efficient method of concentration of the admixturestogether with the optimum analysis method. The main metal is separatedout using a method similar to those in the refining of metals, i.e.extraction, distillation, sublimation, selective precipitation, reduction.From the analytical methods, it is recommended to use emissionspectrometry, polarography or atomic absorption photometry.
An important direction in the development of analytical proceduresis the construction of measuring systems and new highly sensitivemethods for the determination of the concentration of the admixturesoxygen, nitrogen, hydrogen and carbon in metals. Equipment witha mass spectrum analyser, based on vacuum extraction, makes it possibleto determine oxygen content of up to 2 ppm, and in the case of hydrogenand nitrogen up to 0.5 ppm, for carbon up to 0.20 ppm, and the durationof single analysis is approximately 5 min. High sensitivity (10–6 %)may be achieved using gamma activation analysis combined with vacuumextraction. A linear accelerator is used as a radiation source. Afterirradiating the specimen, removing the surface layer, and separatingthe admixtures to be determined, it is necessary to measure the activity

174
of elements directly in the gas phase.The main assumption for the applicability of a specific analytical
method is, in particular, good reproducibility of the results. It isalways important to consider the aim for which the given methodshould be used. An important question is that of standards, calibration,equipment facilities and the possibility of occurrence of errors inthe preparation, analysis or evaluation of samples.
13.12. Resistance of metals and semiconductors
Electrical resistance and resistivity are important characteristics ofthe purity of materials and they are determined by the composition,physical properties and structural inhomogeneity of metals, alloys,elementary semiconductors or their compounds. The determinationof resistivity provides important information on the given substance,its electronic structure, phase changes, or the type of magnetic ordering.An advantage of the method is the relatively easy measurement procedureof resistivity and a high relative accuracy of measurements whichreaches 10–6. However, only the total effect of the admixtures on theproperties of the material is determined.
In semiconductor materials, where the requirements on purity areextremely high and the total content of admixtures is usually lowerthan 10 ppm, it is no longer possible to use direct analytical methodsfor the determination of the presence of admixtures. In addition tothis, intentional microalloying of semiconductors results in the electronicor hole conductivity, and it is therefore necessary to consider primarilythe concentration and distribution of charge carriers (homogeneityof the crystal), their mobility and life-time of minor carriers. Thebest results in these applications have been obtained using the methodsof measuring resistivity ρ
p (or conductivity σ
p) of semiconductors,
measurement of Hall voltage UH or Hall constant R
H for the
determination of the type and concentration of current carriers insemiconductors.
In most cases, the resistivity of semiconductors is measured usingthe compensation four- or two-point method. Resistivity is determinedfrom the magnitude of the current passing through the semiconductor,the geometrical dimensions of the specimen and from the voltagedrop between the measuring electrodes spaced at a specific distance.The resultant measured value is used for the direct calculation ofthe concentration of major current carriers using the equation(C*
maj >> C*
min):

175
ρµp
C e= 1
maj*
maj (93)
where C*maj
(C*min
) is the concentration of the major (minor) carriersof the current of electrons in semiconductors of type n, holes of typep [cm–3]; µ
maj is the mobility of the major carriers [cm2 V–1 s–1]; e
is the electron charge (1.602·10–19 C).In the evaluation of the purity and perfection of the structure of
metallic materials, it is recommended to use the method of measuringresidual resistivity ρ
0 at a temperature of 0 K, or the ratio of the
resistivity at room temperature ρ295 K
and the liquid helium temperatureρ
4.2 K. Residual resistivity ρ
0, which appears in all compounds, is caused
by crystal lattice defects (vacancies, dislocations...) and by the presenceof admixtures and undesirable elements. The value of ρ
0 is also affected
by the structural inhomogeneity of the sample, internal stresses, etc.The method is based on the Matthiessen law according to which
electrical resistance consists of two components: the componentdependent on the scattering of electrons by thermal oscillations ofthe atoms, and the component determined by the scattering of electronson admixtures and lattice defects. Because the thermal scattering ofelectrons at the liquid helium temperature is small, the value of theelectrical resistance of the crystal is in fact determined only by thesecond component. Therefore, the ratio of the resistivityΓ = ρ
295 K/ρ
4.2 K may be used approximately as the measure of the total
purity and structural perfection of metals. The value of Γ is usuallyexpressed in terms of commercial purity metals, in hundreds or thousandsfor pure metals and several tens of thousands for superpure metals,Table 16 [48,105].
At present, the measurements of the resistivity of metals are takenin most cases by means of the contact potentiometric or contactlessmethod. Disadvantages of the contact four-point method include highsensitivity to the experiment conditions, the quality of brazed contacts,the shape and external defects in the sample. The effect ofsuperconducting admixtures and compounds in the main metal is alsonegative. Nevertheless, the method is used widely in the complexand accurate rapid determination of the quality of crystals and singlecrystals and of their relative purity in relation to standard specimens.In the contactless method, stringent requirements are imposed on theequipment and devices. The method of alternating magnetisation isbased on the change of the impedance of the coil by inserting a metalliccore. The specimen to be measured is inserted into the magnetic field,generated by a coil powered with a current of specific frequency.
176
Currents are induced in the specimen and influence the main excitationcurrent of the coil. This is reflected in a change in the impedanceof the coil in relation to the values measured without the specimen.The magnitude of this change depends on the resistivity and geometricaldimensions of the specimen.
These methods are often used for the determination of the totalpurity, especially in refractory metals, for the examination of therefining effect of solidification processes, and for the examinationof the axial and radial homogeneity and structural perfection of crystalsand single crystals.
13.13. Methods of examination of the structure and perfectionof crystals
A number of methods are used for the examination of the structure,crystallographic orientation and perfection of metallic crystals:– metallographic examination of the macro- and microstructure of
crystals by optical microscopy;– electron microscopy using emission or scanning electron microscopes;– x-ray diffraction for the determination of crystal orientation;– x-ray topography for the examination of the structure and perfection
of crystals.
tnemelEfonigirOsnemiceps
nemicepSretemaid
)mm(
foseulaV Γ ehtfosessapforebmunehtrofenoz n
0 1 2 3 5
netsgnuT RTVS
erutaretiL
5.346
002200804
00601057310098
0006200012 00093
00381 00002
munedbyloM RTerutaretiL
68
1305
32106
051 032047
08720003
mulatnaT VSerutaretiLerutaretiL
4
3
9
401
6172
5593043
18187255
muiboiN LP 5.5 053 0562
airtsuA,eesnalP–LP,cilbupeRhcezC,cetseVanifaS–VS,vonzoRalseT–RT
Table 16. Values of Γ = ρ295 K
/ρ4.2 K
for several refractory metals after electron beamzone refining in a vacuum of 10–3 Pa, v = 5·10–3 cm s–1
[mm]

177
Optical metallographic microscopes (resolution up to 0.2 µm) maybe used for the examination of the following main details of the crystalstructure: the shape and dimensions of grains, the dendritic or otherinhomogeneity, the shape and nature of distribution of etched images,inclusions, twins; microhardness tests can be carried out. Using specialthermal chambers, it is possible to examine directly the processesof recrystallisation and phase transformations, crystallisation processes,grain growth, etc. There are a large number of etching procedureswhich can be used to develop the grain and subgrain boundaries,dendritic, cellular or other microstructures or substructures, growthof dislocations, and the dislocations formed during plastic deformation.The colour etching method, based on the electrolytic oxidation ofthe surface of the section in special solutions or by of ion etching,is used for the identification of the orientation of grains and texturesor nonmetallic inclusions in crystals.
In electron microscopes, light radiation is replaced by an electronbeam which falls on and partially penetrates into the specimen. Thisresults in the scatter and refraction of electrons or electrons maybe reflected. The resolution power of transmission electron microscopesat an accelerating voltage from 100 kV to 1 MV is up to 0.35 nm.Replicas (imprints or thin foils) are used as preparations. These systemsare used in the examination of various defects, dislocations, inclusionsor precipitates. In scanning electron microscopes, a narrow electronbeam travels in rows on the specimen. After the electrons impactedthe specimen, they are reflected or secondary electron or x-radiationforms. The main advantage of scanning electron microscopes is thatthey require almost no preparation of specimens and enable sharpimages of the surface of examined object to be obtained at a largedepth. They may be supplemented by an x-ray spectrograph forexamination of the distribution of the individual elements in thespecimen or an electron microanalyser.
The optical method is used for the approximate determination ofthe orientation of single crystals and bicrystals. This method is basedon the reflection of the light beam from etches planes on the surfaceof the crystal. Selective etching procedures may be used to producesuitable etch pits which are reflected on the screen in the form oftypical reflection images. From the shape and sequence of the resultantinflection images during rotation of the specimen around its axis andfrom the angles of two crystal planes it is possible to determine theorientation of the crystal and the crystallographic deviation of orientationfrom the crystal axis quite rapidly, without destruction of the specimenand with a reproducible accuracy of <2°.

178
X-ray diffraction is based on the bending or diffraction of x-radiationduring its impact on the examined metal and makes it possible todetermine the arrangement of the atoms in the metal lattice anddetermine the lattice parameters with a relatively high accuracy.According to the method used, monochromatic or polychromatic x-radiation is used. The main methods of electron diffraction are:– Laue method – determination of the crystal axes in metallic crystals– back reflection method – determination of the lattice parameters
from the Bragg equation, internal stress, deformation of the metallattice, crystal orientation.
– Debye–Scherrer method – determination of the type of lattice inpowder materials and polycrystalline metals, differentiation of thecrystal and amorphous structure, identification of different typesof crystals, qualitative and quantitative analysis.The direct methods of examination of crystal defects include x-
ray diffraction topography used for the examination of the dislocationstructure of semiconductor crystals with a low dislocation density.The Berg–Barrett method makes it possible to determine the size ofthe subgrains of single crystals and their angular disorientation, examineplastic deformation and stability of the crystal structure. In this method,it is possible to obtain a very accurate image from the viewpointof perfection of the structure as a result of the reflection ofx-radiation from the polished surface of the single crystal. Atcharacteristic irradiation, a topogram is produced from the entire surfaceby discrete rotation of the specimen along the axis situated on thesurface of the section. On the basis of the width dark and light areason the topogram and the magnitude of their shift, it is possible todetermine the angles of disorientation of two adjacent grains. Themethod also makes it possible to detect different inclusions (for example,carbides) which form as bright spot on the topogram. The Lang methodis used for determination of mean dislocation density (for example,in silicon). This method determines imperfections in the crystal structureas a result of the scatter of x-radiation on lattice defects. Point defects– vacancies and interstitial atoms are studied using an ion projector,magnification 106 to 107, resolution 0.3 nm.
This list does not cover all the possible methods of the determinationof the physical and physical–chemical properties of substances. Themethods of determination of the properties are efficiently combinedin order to accelerate and improve the accuracy of determination bycomputing which is also capable of carrying out a number of otherstatistical or correlation operations, especially in connection withcomprehensive data banks of comparison data.

Summary of terms:
Analytical methods for testing of the chemical purity of metals Gravimetry and titration Polarography Emission spectral analysis Absorption spectrophotometry Atomic absorption spectrometry Fluorescence spectrometry (x-ray, atomic, fluorimetry) Local microanalysis (electron, Auger, mass spectrometry) Radiometric methods (Geiger–Müller counter, scattering and absorption of radiation, radionuclide x-ray fluorescence analysis, neutron activation analysis, instrumental activation analysis) Optical metallographic microscopy Transmission electron microscopy Scanning electron microscopes X-ray diffraction Laue method Back reflection method Debye-Scherrer method Berg-Barrett method Lang method
Questions:
After studying this chapter you will be able to clear up the following terms: 1. What is a difference between gravimetry and titration methods? 2. What is a difference between polarography and emission spectral analysis? 3. What is a difference between the absorption spectrophotometry and the atomic absorption
spectrometry? 4. What kinds of the fluorescence spectrometry do you know? 5. What kinds of the local microanalysis do you know? 6. What kinds of radiometric methods do you know? 7. Which methods are used for determination of gases in metals? 8. For what purposes is the method of concentration of admixtures used? 9. Can be purity of metals determined using the resistivity measurements? 10. Which methods are used for investigation of structures and microstructures? 11. Which methods are used for determination of orientation of single crystals? 12. What is a difference between the transmission and scanning electron microscopies?
Exercise for solving:
1. Calculate the concentration of majority carriers, provided you know the resistivity of silicon, the movability of donors is 1350 cm2·V-1·s-1 and of acceptors is 480 cm2·V-1·s-1. Plot in a bilogaritmic scale for the resistivity range 10-3 to 104 Ω·cm.

References
[1] Chaudron G.: Monographies sur les métaux de haute pureté. Masson, Paris, T.1 – 1972, 540 p., T.2 – 1977, 644 p. T.3 – 1977, 714 p., in French.
[2] Chalmers, B.: Physical metallurgy. New York, London. 1962, 455 p.[3] Belyaev A.I.: Physico-chemical principles of refining of metals and
semiconductors. Ed. Metallurgiya, Moscow, 1973, 222 p., in Russian.[4] Dimitrov O.: Les Métaux de haute pureté. Presses Universitaires de France,
Paris, 1978, 178 p., in French.[5] Pfann, W.G.: Zone melting. New York, London, 1958, 366 p. [6] Barthel, J., Buhrig, E., Hein, K. and Kuchař, L.: Kristallisation aus
Schmelzen. Leipzig, VEB Deutscher Verlag für Grundstoffindustrie, 1983, 356 p., in German. Spravochnik "Kristallizacija iz rasplavov". Moscow, Ed. Metallurgiya, 1987, 320 p., in Russian.
[7] Kuchař, L.: Metallurgy of pure metals. Part 1. Crystallization processes. Textbook of theVŠB-TU of Ostrava, 1. Ed., 1988, 2. Ed. 1992, 338 p., in Czech.
[8] Wilke, K.-Th.: Kristallzüchtung. VEB Deutscher Verlag der Wissenschaften, Berlin, 1973, 924 p., in German.
[9] Hurle, D.T.J.: Handbook of crystal growth. vol. 1, 2, 3. North-Holland, 1994.[10] Massalski T.B.: Binary Alloy Phase Diagrams. American Soc. for Metals,
Metals Park, Ohio, 1986, 2224 p.[11] Dean J. A.: Chemical separation methods. SNTL, Prague, 1974, 401 p., in
Czech.[12] Juračka F.: Ion enchangers. SNTL, Prague, 1965, 150 p., in Czech. [13] Grígerová, T., Lukáč, I. and Kořený, R.: Casting of non-ferrous metals. Alfa
Bratislava, 1998, 421 p., in Slovak.[14] Feuerbacher, B., Hamacher, H. and Naumann, R.J.: Materials sciences in
space. Springer Verlag, Berlin, 1986, p. 164.[15] Kaufman. L. and Bernstein, H.: Computer calculation of phase diagrams.
Academic Press, New York - London, 1970, 326 p.[16] Hultgren, R. et al.: Selected values of the thermodynamic properties of binary
alloys. American Society for Metals, Ohio, 1973, 1436 p.[17] Alper, A.A.: Phase diagrams, materials science and technology. Academic
Press, London, 1970, 358 p.[18] Drápala, J., Byczanski, P. and Kuchař, L.: Computer calculation of
equilibrium solidus and liquidus curves, Transactions of the VŠB-Technical University of Ostrava, Metallurgical Series, 30, 1984, No. 1, p. 73–79, in Czech.
[19] Vřešťál, J. and Kuchař, L.: Addition distribution thermodynamics in liquid and solid phases of alloys. Hutnické listy, vol. 45, 1990, No. 4, p. 286–292, in Czech.
[20] Hayes, A. and Chipman, J.: Trans. AIME, 135, 1939, p. 85.[21] Hansen M.: Constitution of Binary Alloys. New York, 1958.[22] Elliott R.P.: Constitution of Binary Alloys. New York, 1965.[23] Shunk F.A.: Constitution of Binary Alloys. New York, 1969.[24] Drápala, J. and Kuchař, L.: Metallurgy of pure metals. Exercise instructions.
Textbook of the VŠB-TU of Ostrava, 1990, 166 p., in Czech.
179
[25] Kuchař, L., Kuchař, L. jr. and Drápala, J.: Contribution of copper refining by crystallization methods. Acta Metallurgica Slovaca, vol. 4, Special Issue, 1998, No, 3, p. 101–109, in Czech.
[26] Alexandrov B.N., Rybalchenko, L.F. and Dukin, V.V.: IAN SSSR, Metally, 1970, No. 4, p. 70–75, in Russian.
[27] Vigdorovich, V.N., Marychev, V.V. and Shirobokova, T.G.: IAN SSSR, Metally, 1970, No. 2, p. 129–134, in Russian.
[28] Tolmie, E.D. and Robins, D.A.: J. Inst. Metals, 85, 1957, No. 5, p. 171.[29] Gerlach J., Powlek F. und Rogala, D.: Zonengeschmolzenen Kupfer. Metall,
1964, No. 11, p. 1158, in German.[30] Kuchař, L.: Importance of distribution coefficients of admixtures in metals
for segregations and refining processes. In: Metal 94, Ostrava, II, p. 1–19, in Czech.
[31] Drápala, J., Kuchař, L. and Burchanov, G.S.: Distribution coefficients of impurities in metals: Periodic dependence on the atomic number of impurity. Inorganic materials, vol. 34, 1998, No. 2, p. 114–127.
[32] Kuchař, L.: Verteilungskoeffizienten beim Zonenschmelzen von Aluminium. Bergakademie, 14, 1962, 9, p. 622–631, in German.
[33] Kuchař, L.: Segregation coefficients in aluminium. Hutnické listy, XVII, 1962, 9, p. 639–648, in Czech.
[34] Vigdorovich, V.N.: Refining of metals and semiconductors by crystallization. Metallurgiya, Moscow, 1969, p. 39, in Russian.
[35] Burton J.A., Prim R.C. and Slichter W.R.: Journ. Chem. Phys., 21, 1953, p. 1987.
[36] Tiller, W.A. and Rutter, J.W.: Canad. Journ. Phys., 34, 1956, p. 96.[37] Kuchař, L., Drápala, J., Duží, P., Ivanov, J.M., Kostava, N.I. and Dvinin,
S.J.: Equipment for refining of volatile substances. Patent No. 276366, 20.3.1992, Prague, in Czech.
[38] Burris, L., Stockman, C.H. and Dillon, J.G.: Trans. AIME, 1955, p. 1017–1023.
[39] Kuchař, L.: Equilibrium and effective distribution coefficients of the 95Zr radionuclide in zone melted aluminium. Metallic materials, vol. VI, 1968, No. 6, p. 571–578, in Czech.
[40] Gorelik, S.S. and Dashevski, M.J.: Material science of semiconductors and dielectrics. Ed. Metallurgiya, Moscow, 1988, p. 208, in Russian.
[41] Smithells Metals Reference Book. Six edition, Butterworths, London, 1983.[42] Dembovský, V.: Plasma metallurgy, SNTL, Prague, 1978, 260 p., in Czech.[43] Kuchař, L.: Metallurgy of non-ferrous metals. Part I. Pyrometallurgy. ES
VŠB Ostrava, 1987, 335 p., in Czech.[44] Kuchař, L. and Drápala, J.: Manufacture of high-purity metals by
crystallization methods. Hutnické listy, vol. 40, 1985, No. 7, p. 498–507, in Czech.
[45] Ackermann, G. et al.: Elektrolytgleichgewichte und Elektrochemie. Lehrbuch 5, Lehrwerk Chemie, Leipzig, 1988, 292 p.
[46] Belashczenko D. K. and Grigoryev G. A.: Izv. VUZ, Chernaya Metallurgiya, 1962, No. 1, p. 124.
[47] Tomík, B., Poljak B. and Jirkovský R.: Analytical chemistry for metallurgists. SNTL/Alfa, Prague, 1988, 261 p., in Czech.
180

[48] Drápala, J.: Preparation of single crystals of refractory metals with defined purity and properties. Thesis, VŠB–TU of Ostrava, 1985, 217 p., in Czech.
[49] Kuchař, L., Wozniaková, B. and Drápala, J.: Segregation behaviour during the zone melting of refractory metals. Journal of Crystal Growth, vol. 52, 1981, p. 359–366.
[50] Drápala, J., Kuchař, L. and Kursa, M.: Preparation of high purity metals by crystallization methods. Journal de physique IV, Colloque C7, vol. 5, 1995, p. C7–143 – C7–148.
[51] Kuchař, L. and Wozniaková, B.: Distribution coefficients of admixtures in silber. Transactions of the VŠB-Technical University of Ostrava, Metallurgical Series, XXVIII, 1982, No. 1, p. 1–9, in Czech.
[52] Kuchař, L., Drápala, J. and Wozniaková, B.: Distribution coefficients of admixtures in copper, silber and gold. Metallic materials, 21, 1983, No.1, p. 80–89, in Czech.
[53] Kuchař, L. and Revel, G: Coefficient de partage des impurités présentes dans l’aluminium, Comptes Rendus Acad. Sc. Paris, t.262, 1966, serie C, p. 1365–1367, in French.
[54] Kuchař, L.: Deplacement du zirconium 95Zr au cours de la zone fondue de l'aluminium. Comptes Rendus Acad. Sc. Paris, t.262, 1966, serie C, p. 1466–1469, in French.
[55] Kuchař, L.: Distribution coefficients of admixtures by zone melting of aluminium. Zone melting. In: Proceedings, Ed. V.N.Vigdorovich, Metallurgiya, Moscow, 1966, p. 145–158, In Russian.
[56] Kuchař, L.: A zónásau olvasztott alumínium megoszlási együtthatói. Kohászati Lapok, 1964, No. 2, p. 65–69, in Hungarian.
[57] Kuchař, L.: Une méthode de détermination des coefficients de partage théoriques. Aplication au systéme aluminium–yttrium. Comptes Rendus Acad. Sc. Paris, t.262, 1966, serie C, p. 393–396, in French.
[58] Kuchař, L. and Czoboly, E.: Computational and empirical determination of distribution coefficient of zinc in aluminium. Transactions of the VŠB–Technical University of Ostrava, Metallurgical Series, XI, 1965, No. 5, p. 771–784, in Czech.
[59] Kuchař, L.: New method of the visualization of binary diagrams of alloys and determination of distributing coefficients applied in aluminium–yttrium system. Transactions of the VŠB-Technical University of Ostrava, Metallurgical Series, XIII, 1967, No. 1, p. 31–40, in Czech.
[60] Kuchař, L. and Revel, G.: Contribution to the theory of the preparation of high-purity aluminium by zone melting. Transactions of the VŠB-Technical University of Ostrava, Metallurgical Series, XIII, 1967, special issue, p. 3–18, in Czech.
[61] Kuchař, L. and Habrman, P.: Verteilung von 55Fe und 110mAg beim horizontalen Breitbandgiessen von Aluminium. Transactions of the VŠB-Technical University of Ostrava, Metallurgical Series, XXXIX, 1993, No. 1, p. 27–34, in German.
[62] Kuchař, L., Drápala, J. and Kuchař jr., L. Distribution of admixtures in aluminium alloys and calculation of solidification interval. Transactions of the Technical University of Košice, 1999, no. 3, p. 38–45, in Czech.
181
[63] Drápala, J., Kuchař, L. and Wozniaková, B.: Distribution coefficients of admixtures in gold. Transactions of the VŠB-Technical University of Ostrava, Metallurgical Series, XXX, 1984, No. 1, p. 53–60, in Czech.
[64] Kuchař, L., Drápala, J. and Luňáček, J.: Purification methods of Cd, Te and CdTe and periodicity of distribution coefficients of admixtures. Journal of Crystal Growth, 161, 1996, p. 94–103.
[65] Kuchař, L., Wozniaková, B., Duží, P. and Drápala, J.: Distributing of 124Sb and 110Ag in iron, cobalt and copper during the arc zone melting. Transactions of the VŠB-Technical University of Ostrava, Metallurgical Series, XXIV, 1978, No. 2, p. 81–86, in Czech.
[66] Kuchař, L., Drápala, J. and Kuchař, L. jr.: Behaviour of admixtures by crystallization of chromium, vanadium and rhenium. In: High-Purity Materials in Science and Technology, Dresden, 1985, p. 49–50.
[67] Kuchař, L. and Buhrig, E.: Distributing of antimony 124Sb in the zone melting of copper. Transactions of the VŠB-Technical University of Ostrava, Metallurgical Series, XVII, 1971, No. 2, p. 1–13, in Czech.
[68] Kuchař, L. and Tac Le Cao: Equilibrium distribution coefficients of copper–admixture binary systems. Transactions of the VŠB-Technical University of Ostrava, Metallurgical Series, XVIII, 1972, No. 3, p. 65–76, in Czech.
[69] Kuchař, L. and Repiská, L.: Method of the calculation of the distribution coefficient of phosphorus in iron for purposes of zone melting and refining. Transactions of the VŠB-Technical University of Ostrava, Metallurgical Series, XI, 1965, No. 5, p. 785–794, in Czech.
[70] Repiská, L. and Kuchař, L.: Distribution coefficients in zone refining of iron. The application to Fe–C, Fe–Be systems. Transactions of the VŠB-Technical University of Ostrava, Metallurgical Series, XVI, 1970, No. 1, p. 25–44, in Slovak.
[71] Kuchař, L. and Balušek, M.: Preparation of pure iron by arc zone melting. Transactions of the VŠB-Technical University of Ostrava, Metallurgical Series, XVI, 1970, No. 1, p. 45–59, in Czech.
[72] Kuchař, L., Repiská, L., Komorová, L. and Baffyová, Z.: Computation of the solidus and liquidus curves in the iron–admixture binary diagrams in the range of low concentrations of admixtures. Transactions of the VŠB-Technical University of Ostrava, Metallurgical Series, XXVI, 1980, No. 1, p. 119–136, in Czech.
[73] Repiská, L., Kuchař, L. and Baffyová, Z.: Distribution of admixtures in the region of iron phase tranformations. Metallic materials, vol. 19, 1981, No. 5, p. 552–560 in Slovak.
[74] Baffyová, Z., Repiská, L. and Kuchař, L.: Studying the Fe–Sb binary diagram and distribution of 124Sb isotope in iron. Transactions of the VŠB-Technical University of Ostrava, Metallurgical Series, XXX, 1984, No. 2, p. 1–12, in Czech.
[75] Kuchař, L. and Repiská, L.: Studying the iron – admixture system in the region of transformations Feδ–γ and Feγ–α. Transactions of the VŠB-Technical University of Ostrava, Metallurgical Series, XXX, 1984, No. 2, p. 35–53, in Czech.
[76] Drápala, J.: Zachowanie sie domieszek przy krystalizacji żelaza. Inzynieria materialowa, XV, 1994, No. 2, p. 29–33, in Polish.
182
[77] Kuchař, L., Buhrig, E. and Duží, P.: Modelling of the solidus and liquidus curves in the GaAs–Ga system. Transactions of the VŠB-Technical University of Ostrava, Metallurgical Series, XXXI, 1985, No. 1, p. 15–27, in Czech.
[78] Drápala, J., Buhrig, E., Kuchař, L. and John, M.: On concentration undercooling in the GaAs–Ga system. Transactions of the VŠB-Technical University of Ostrava, Metallurgical Series, XXXII, 1986, No. 1, p. 191–202, in Czech.
[79] Chmelařová, M., Drápala, J. and Kuchař, L.: Study of distribution coefficients of admixtures in gallium arsenide. Transactions of the VŠB-Technical University of Ostrava, Metallurgical Series, XXXVI, 1990, No. 1, p. 107–127, in Czech.
[80] Buhrig, E., Kuchař, L., Duží, P. und Hein, K.: Beitrag zür Systematisierung der Solidus- und Liquiduskurven und Verteilungskoeffizienten der Systeme Germanium – Verunreinigung. Transactions of the VŠB-Technical University of Ostrava, Metallurgical Series, XXVIII, 1982, No. 1, p. 59–82, in German.
[81] Kuchař, L.: Das Verhalten von Verunreinigungen bei der Kristallisation von Germanium. In: 100 Jahre Germanium, Freiberger Forschungshefte, A767, DVG Leipzig, 1987, p. 53–72, in German.
[82] Luňáček, J. and Kuchař, L.: Distribution coefficients of admixtures in silicon and germanium and their relations to generalized moment of admixtures. Transactions of the VŠB-Technical University of Ostrava, Mining and geological series, XXXVII, 1991, No. 2, p. 223–238.
[83] Luňáček, J. and Kuchař, L.: Correlation of distribution coefficients of admixtures in germanium and silicon on the generalized moment. Metallic materials, vol. 30, 1992, No. 5, p. 393–403, in Czech.
[84] Drápala, J. and Kuchař, L.: Distribution coefficients in semiconductors. Journal of Electrical Engineering, vol. 50, 1999, No. 2/s, p. 11–15.
[85] Kuchař, L. and Wozniaková, B.: Periodical dependence of distribution coefficients of admixtures in hafnium. Transactions of the VŠB-Technical University of Ostrava, Metallurgical Series, XXIV, 1978, No. 2, p. 19–24, in Czech.
[86] Ojha, V. and Kuchař, L.: Calculation of binary diagrams from the thermodynamic data for which the component behaviour is ideal. Transactions of the VŠB-Technical University of Ostrava, Metallurgical Series, XXXII, 1986, No. 1, p. 83–96, in Czech.
[87] Branžovský, J., Drápala, J. and Kuchař, L.: Equilibrium distribution coefficients of admixtures in indium. Transactions of the VŠB-Technical University of Ostrava, Metallurgical Series, XXX, 1984, No. 2, p. 19–26, in Czech.
[88] Branžovský, J. and Kuchař, L.: Determination of distribution coefficient of silver in indium. Transactions of the VŠB-Technical University of Ostrava, Metallurgical Series, XXX, 1984, No. 2, p. 27–34, in Czech.
[89] Kuchař, L., Drápala, J. and Branžovský, J.: Bestimmung von Verteilungskoeffizienten in Indium mittels radioaktiver Nuklide. Isotopenpraxis, vol. 20, 1984, No. 6, p. 207–210, in German.
[90] Drápala, J. and Kuchař, L.: Refining of precious metals by crystallization methods. Metallic materials, 35, 1997, No. 3, p. 162–173, in Czech.
183
[91] Kuchař, L. jr., Kuchař, L. and Drápala, J.: Distribution coefficients of admixtures in gadolinium. In: Proceedings of the 4th Intern. Conference of the VŠB Ostrava, section: Metallurgy of non-ferrous metals and nuclear metallurgy, Ostrava, 1990, p. 22, in Czech.
[92] Kuchař, L. and Kuchař, L. jr.: Distribution of admixtures by zone refining of lanthanides Transactions of the Technical University of Košice, vol. 2, 1992, No. 1, p. 89–99 in Czech.
[93] Kuchař, L.jr., Kuchař, L., Drápala, J., Burkhanov, G.S. and Chistyakov, O.D.: The distribution coefficients of admixtures and dysprosium in gadolinium. Transactions of the VŠB-Technical University of Ostrava, Metallurgical Series, XXXVIII, 1992, No. 1, p.19–27, in Czech.
[94] Kuchař, L. and Kuchař, L.jr.: Distribution of admixtures by zone refining of lanthanum. Hutnické listy, 47, 1992, No. 11, s 24–30, in Czech.
[95] Kuchař, L. and Kuchař, L.jr.: Periodical dependence of distribution coefficients of admixtures in rare-earth metals. Metallurgy and Foundry Engineering, AGH Cracow, 19, 1993, No. 1, p. 81–98.
[96] Kuchař, L. and Drápala, J.: Systematic study of distribution coefficients of admixtures in rare-earth metals during crystallization and refining processes. International Journal of Materials & Product Technology. vol. 8, 1993, No. 1, p. 58–70.
[97] Kuchař, L.jr., Kuchař, L., Drápala, J., Burkhanov, G.S. and Chistyakov, O.D.: The distribution coefficients of admixtures in gadolinium. International Journal of Materials & Product Technology, vol. 9, 1994, No. 4/5/6, p. 323–330.
[98] Kuchař, L., Drápala, J., and Kuchař, L.jr.: Distribution coefficients of admixtures in rare-earth metals. Vysokochistye veshchestva, No. 2, 1996, p. 50–58, in Russian.
[99] Kuchař, L., Duží, P. and Wozniaková, B.: Gleichgewichtsverteilungs-koeffizienten in Molybdän und Niob, Neue Hütte, vol. 21, 1976, No. 5, p. 297–300, in German.
[100] Drápala, J. and Kuchař, L.: Study of refining grade of the electron beam zone melted refractory metals W, Mo and Nb by the help of mass spectral analysis. Transactions of the VŠB-Technical University of Ostrava, Metallurgical Series, XXIV, 1978, No. 1, p. 1–13, in Czech.
[101] Kuchař, L., Duží, P., Drápala, J., Barthel, J., Eichler, K., Jurisch, M., Löser, W., Ovsijenko, D.E. and Sosnina, E.J.: Makrosegregation, Mikrosegregation und Substruktur in zonengeschmolzenem Molybdän. Transactions of the VŠB-Technical University of Ostrava, Metallurgical Series, Teil I, II, III, XXX, 1984, No. 1, p. 17–52, in German.
[102] Wozniaková, B. and Kuchař, L.: Distribution coefficients of admixtures in niobium. Transactions of the VŠB-Technical University of Ostrava, Metallurgical Series, XXIII, 1977, No. 1, p. 1–9, in Czech.
[103] Kuchař, L. and Wozniaková, B.: Verteilung von Iridium im zonen-geschmolzenen Niob. Neue Hütte, vol. 23, 1978, No. 6, p. 212–214, in German.
[104] Kuchař, L., Wozniaková, B. and Drápala, J.: Determination of distribution coefficient of Ir, Ta and W in niobium and Ta in tungsten by the help of
184

activation analysis. Transactions of the VŠB-Technical University of Ostrava, Metallurgical Series, XXIV, 1978, No. 2, p. 59–65, in Czech.
[105] Drápala, J., Cigáň, A. and Kuchař, L.: High purity niobium for super-conductor electronics. Transactions of the VŠB-Technical University of Ostrava, Mining and geological series, XXXVII, 1991, No. 2, p. 239–256, in Czech.
[106] Kuchař, L. and Dimitrov, O.: Ségragation du cuivre et de l or au cours de la zone fondue du nickel en nacelle de cuivre refroidie. Comptes Rendus Acad. Sc. Paris, t. 262, 1966, serie C, p. 718–721, in French.
[107] Kuchař, L., Deschamps, N., Wache, A., Dubois, B. and Dimitrov, O.: Purification du nickel par fusion de zone sur nacelle métallique refroidie. Les Mémoires Scientifiques de la Revue de Métallurgie, vol. 64, 1967, No. 9, p. 785–794, in French.
[108] Dimitrov, O. and Kuchař, L.: On the zone melting of nickel. Transactions of the VŠB-Technical University of Ostrava, Metallurgical Series, XVI, 1970, No. 1, p. 1–24, in Czech.
[109] Wozniaková, B. and Kuchař, L.: Distribution coefficients of admixtures in nickel. Annales de chimie – France, science des matériaux, 1981, No. 6, p. 301–307.
[110] Drápala, J. and Kuchař, L.: Distributing of admixtures in nickel during crystallization. Transactions of the VŠB-Technical University of Ostrava, Metallurgical Series, XXX, 1984, No. 2, p. 55–66, in Czech.
[111] Krištofová, D., Kuchař, L. and Kárník, T.: Distribution coefficients of admixtures in lead and their significance for zone refining. Transactions of the VŠB-Technical University of Ostrava, Metallurgical Series, XXXVI, 1990, No. 1, p. 167–189, in Czech.
[112] Kuchař, L. and Drápala, J.: To the theory of palladium refining by means of crystallisation procedures. Hutnické listy, 51, 1996, No. 12, p. 21–25, in Czech.
[113] Drápala, J. and Kuchař, L.: Distribution coefficients of admixtures in palladium. Transactions of the VŠB-Technical University of Ostrava, Metallurgical Series, 42, 1996, No. 1, p.27–35, in Czech.
[114] Drápala, J. and Kuchař, L.: Distribution coefficients of admixtures in platinum. Metallic materials, 35, 1997, No.2, p. 108–119, in Czech.
[115] Wozniaková, B. and Kuchař, L.: Study of η−ε transformation of Pu–Fe and Pu–Al alloys. Transactions of the VŠB-Technical University of Ostrava, Metallurgical Series, XXII, 1976, No. 2, p. 207–218, in Czech.
[116] Wozniaková, B. and Kuchař, L.: Survey of the plutonium – admixture systems in solidus a liquidus portion. Transactions of the VŠB-Technical University of Ostrava, Metallurgical Series, XXIV, 1978, No. 2, p. 67–80, in Czech.
[117] Krištofová, D., Kuchař, L. and Wozniaková, B.: Effective distribution coefficients in plutonium. Transactions of the VŠB-Technical University of Ostrava, Metallurgical Series, XXVI, 1979, No. 1, p. 99–117, in Czech.
[118] Kuchař, L. and Wozniaková, B.: Periodical dependence of equilibrium distribution coefficients of admixtures in plutonium on the atomic number of admixture. Jaderná energie, vol. 25, 1979, No. 10, p. 382–387, in Czech.
185

[119] Kuchař, L. and Drápala, J. Distribution coefficients of admixtures in magnesium. Metallic materials, 2004, vol. 42, No. 2, p. 132–142, in Czech.
[120] Kuchař, L. jr. and Kuchař, L.: Study of solidus and liquidus curves in Re –Rh, –Os, –Ir, –Pt, –Tc binary systems in the part nearly rhenium. Transactions of the VŠB-Technical University of Ostrava, Metallurgical Series, XXXIV, 1988, No. 1, p. 109–124, in Czech.
[121] Kuchař, L. and Habrman, P.: Verteilung von 114mIn und 110mAg beim Zonen-schmelzen von Antimon. Transactions of the VŠB-Technical University of Ostrava, Metallurgical Series, XXXIX, 1993, No. 1, p. 35–42, in German.
[122] Kuchař, L., Kuchař, L.jr. and Drápala, J.: Theory of antimony refining by zone melting. Acta Metallurgica Slovaca, vol. 4, Special Issue, No.3, 1998, p. 110–118.
[123] Drápala, J., Kuchař, L. and Kuchař, L.jr.: Refining of scandium by crystallization methods. Acta Metallurgica Slovaca, vol. 2, 1996, No. 3, p. 202–210, in Czech.
[124] Duží, P., Kuchař, L., Buhrig, E. and Drápala, J.: Contribution to correlations of equilibrium distribution coefficients of impurities in silicon. Transactions of the VŠB-Technical University of Ostrava, Metallurgical Series, XXXII, 1986, No. 1, p. 163–189, in Czech.
[125] Hadamovsky, H.-F.: Werkstoffe der Halbleitertechnik. VEB Deutscher Verlag für Grundstoffindustrie, Leipzig, 1985, 368 p., in German.
[126] Drápala, J. and Kuchař, L.: Distribution coefficients in silicon and germanium. In: Silicon '98, TECON Scientific, s.r.o., Rožnov p. R., 1998, p. 213–217.
[127] Drápala, J., Kuchař, L., Losertová, M., Vašek, P. und Kursa, M.: Verteilungs-koeffizienten bei der Kristallisation von Halbleitern. In: 49. Berg- und Hüttenmännischer Tag, Kolloquium 1–Kristallisation und Technik Halbleiterwerkstoffe, Technische Universität Bergakademie Freiberg, 1998, p. 84, in German.
[128] Drápala, J. and Kuchař, L.: Determining the distribution coefficient of tantalum in tungsten. Transactions of the VŠB-Technical University of Ostrava, Metallurgical Series, XXIV, 1978, No. 1, p. 15–27, in Czech.
[129] Drápala, J. and Kuchař, L.: Study of distribution of admixtures in tantalum. Metallic materials, 22, 1984, No. 6, p. 751–759, in Czech.
[130] Drápala, J. and Kuchař, L.: Distribution coefficients of admixtures in tantalum. Transactions of the VŠB-Technical University of Ostrava, Metallurgical Series, XXXI, 1985, No. 1, p. 1–13, in Czech.
[131] Drápala, J. und Kuchař, L.: Verteilungskoeffizienten von Beimengungen im Tantal beim Elektronenstrahl – Zonenschmelzen. Neue Hütte, vol. 32, 1987, No. 4, p. 154–156, in German.
[132] Kuchař, L., Drápala, J., Kuchař, L.jr., Pavlova, G.S. and Ivanov, Y.M.: Study of distribution coefficients of admixtures in tellurium. Transactions of the VŠB-Technical University of Ostrava, Metallurgical Series, XXXII, 1986, No. 1, p. 97–109, in Czech.
[133] Kuchař, L., Ivanov, Y.M. and Drápala, J.: Distribution of admixtures in cadmium telluride. Transactions of the VŠB-Technical University of Ostrava, Metallurgical Series, XXXII, 1986, No. 1, p. 111–124, in Czech.
186

[134] Kuchař, L., Drápala, J. and Ivanov, Y.M.: Contribution to the refinery of semiconductor materials by means normal freezing with material removal. Transactions of the VŠB-Technical University of Ostrava, Metallurgical Series, XXXII, 1986, No. 1, p. 125–138, in Czech.
[135] Lejbov, V.A., Drápala, J., Ivanov, J.M. and Kuchař, L.: CdTe radiation dosimeters and technological presumptions of their production. Transactions of the VŠB-Technical University of Ostrava, Metallurgical Series, XXXV, 1989, No. 1, p. 69–80, in Czech.
[136] Menšík, J. and Kuchař, L.: Distributing of W, Mo and Cr in the electron beam zone melted titanium. Transactions of the VŠB-Technical University of Ostrava, Metallurgical Series, XXII, 1976, No. 1, p. 9–20, in Czech.
[137] Repiská, L. and Kuchař, L.: Analysis of equilibrium diagrams titanium– admixture. Transactions of the VŠB-Technical University of Ostrava, Metallurgical Series, XXII, 1976, No. 2, p. 1–9, in Czech.
[138] Drápala, J., Luňáček, J., Kuchař, L. and Kuchař, L.jr.: Systematic study and periodic dependence of equilibriua distribution coefficients of admixtures on the atomic number of admixtures and their importance for crystallization. Materials Science and Engineering, A173, 1993, p. 73–77.
[139] Luňáček, J. and Kuchař, L.: Periodical dependence of equilibrium distribution coefficients of admixtures in titanium on atomic number of admixture. Metallic materials, vol. 31, 1993, No. 3, p. 164–175, in Czech.
[140] Duží, P. and Kuchař, L.: Distribution of iron and aluminium in zone melted uranium. Hutnické listy, XXIV, 1969, No.6, p. 437–441, in Czech.
[141] Kuchař, L. and Wozniaková, B.: Study of solidus and liquidus in binary systems of uranium with carbon, manganese and vanadium. Jaderná energie, 16, 1970, No. 8, p. 256–261, in Czech.
[142] Wozniaková, B. and Kuchař, L.: A contribution to U–C, U–Mn, U–V binary systems. Transactions of the VŠB-Technical University of Ostrava, Metallurgical Series, XVI, 1970, 2, p. 79–100, in Czech.
[143] Kuchař, L. and Duží, P.: Preparation of low-alloyed uranium alloys by zone melting. Transactions of the VŠB-Technical University of Ostrava, Metallurgical Series, XVII, 1971, No. 3, p. 23–39, in Czech.
[144] Wozniaková, B. and Kuchař, L.: Survey of the uranium – admixture systems in solidus and liquidus portion. Transactions of the VŠB-Technical University of Ostrava, Metallurgical Series, XVII, 1971, No. 3, p. 41–52, in Czech.
[145] Kuchař, L., Duží, P. and Wozniaková, B.: Distribution of admixtures during zone melting of low-alloyed uranium. Jaderná energie, 17, 1971, No. 7, p. 217–221, in Czech.
[146] Kuchař, L.: Periodicity of the distribution coefficients of admixtures in uranium. Nuclear energy, 19, 1973, No. 5, p. 156–160, in Russian.
[147] Wozniaková, B. and Kuchař, L.: Transformation curves in the U–Zr, U–Cr, U–Fe, U– Mo, U–Nb, U–V binary systems. Transactions of the VŠB-Technical University of Ostrava, Metallurgical Series, XIX, 1973, No. 2, p. 9–97, in Czech.
[148] Wozniaková, B. and Kuchař, L.: Computation of transformation curves in binary systems. Application on uranium–admixture systems, Nuclear energy, 19, 1973, No.8, p. 257–265, in Russian.
187

[149] Drápala, J., Kuchař, L. and Ježka, D.: Study of the uranium–admixture binary systems in portion of the solidus and liquidus curves. Transactions of the VŠB-Technical University of Ostrava, Metallurgical Series, XXXIII, 1987, No. 1, p. 1–17, in Czech.
[150] Drápala, J. and Kuchař, L.: Study of transformation curves in the uranium – admixture binary systems. Transactions of the VŠB-Technical University of Ostrava, Metallurgical Series, XXXIII, 1987, No. 1, p. 19–32, in Czech.
[151] Drápala, J. and Kuchař, L.: Survey of uranium–admixture binary systems and distribution of admixtures in uranium. Jaderná energie, 37, 1991, No. 8, p. 297–306, in Czech.
[152] Kuchař, L. and Drápala, J.: Die Verteilungskoeffizienten von Tantal in Wolfram beim Elektronenstrahlzonenschmelzen. Neue Hütte, 24, 1979, No. 5, p. 185–188, in German.
[153] Drápala, J. and Kuchař, L.: Periodical dependence of distribution coefficient of admixtures in tungsten. Annales de chimie, science des matériaux, 1981, No. 6, p. 611–617.
[154] Drápala, J. and Kuchař, L.: Distribution coefficients of admixtures in tungsten. Transactions of the VŠB-Technical University of Ostrava, Metallurgical Series, XXIX, 1983, 1, p. 1–9, in Czech.
[155] Wozniaková, B. and Kuchař, L.: The transformation curves of Zr–Al, Zr–Fe, Zr–Sn binary systems used in nuclear industry. Transactions of the VŠB-Technical University of Ostrava, Metallurgical Series, XVIII, 1972, No. 3, p. 49–63, in Czech.
[156] Kuchař, L. and Wozniaková, B.: Some zirconium–admixture binary systems Application on the Zr–V system. Transactions of the VŠB-Technical University of Ostrava, Metallurgical Series, XX, 1974, No. 3, p. 1–14, in Czech.
[157] Kuchař, L. and Wozniaková, B.: Systematics of zirconium – admixture binary systems. Hutnické listy, XXXI, 1976, No. 5, p. 342–347.
[158] Drápala, J. and Kuchař, L. Contribution to retrograde solubility of admixtures in binary systems. In: Metal 99, Tanger s.r.o., Ostrava, 1999, vol. III, p. 159–164, in Czech.
[159] Drápala, J. and Kuchař, L.: Experimental evaluation of distribution coefficients of admixtures in metals. Metallic materials, 38, 2000, in Czech.
[160] Kuchař, L. and Drápala, J.. Binary systems of aluminium – admixture and their importance for metallurgy. Ed. Delta Print Děčín, Vysoká škola báňská – TU Ostrava, Děčín, 2003, 218 p.
[161] Drápala, J., Kuchař, L., Tomášek, K. and Trojanová, Z. Magnesium, its alloys and Mg – admixture binary systems. ES Vysoké školy báňská – TU Ostrava, Ostrava, 2004, 172 p.
[162] Kuchař, L., Drápala, J. and Kuchař, L. jr. Distribution of admixtures in aluminium alloys and calculation of solidification interval. Transactions of the Technical University of Košice, 1999, no. 4, p. 11–18.
[163] Drápala, J. a Máchová, K. Equilibrium distribution coefficients of admixtures in refractory metals. Acta Metallurgica Slovaca, 2001, 7, no. 4, p. 441–448.
[164] Drápala, J. and Kuchař, L.. Distribution coefficients of admixtures in tin. Acta Metallurgica Slovaca, 2004, 10, no. 1, p. 59–66.
188

[165] Drápala, J. and Kuchař, L. Distribution coefficients in iron–admixture system and their significance for segregation and metallurgy. Acta Metalurgica Slovaca, special issue, 2004, no. 1, vol. 10, p. 291–304.
[166] Bujnošková, K., Drápala, J. and Krybus, K. The influence of technological processing on structural characteristics of tungsten and molybdenum single crystals. Acta Metalurgica Slovaca, special issue, 2004, no. 1, vol. 10, p. 870–873.
[167] Bujnošková, K. and Drápala, J. Study of microsegregation in molybdenum and tungsten single crystals alloyed by iridium or rhenium. Machine Dynamics Problems, 2004, vol. 28, no. 3, p. 69–75.
[168] Bujnošková, K. and Drápala, J. Segregation phenomena in refractory metals during zone melting. Acta Metalurgica Slovaca, 2005, no. 3, vol. 11, p. 301–310.
[169] Bujnošková, K. and Drápala, J. Influence of crystallization conditions on segregation characteristics of alloying elements in molybdenum and tungsten single crystals. Gornyi informatsionno–analiticheskii bulleten’. No. 2 Funktsional’nye metallicheskie materialy. 2007, p. 169–176.
[170] Bujnošková, K., Drápala, J. and Burkhanov, G.S. Preparation and structural characteristic of low-alloyed tungsten and molybdenum single crystals. Acta Metallurgica Slovaca, vol. 13, 2007, No. 1, Special issue, p. 633–639.
[171] Drápala, J., Kuchař, L., Kursa, M. and Kárník, T. Metallurgical aspects of preparation of high purity metals with defined properties. Hutnické listy, 1999, no. 7–8, p. 120–125, in Czech.
[172] Drápala, J. and Kuchař, L. Solidus and liquidus curves and distribution coefficients of admixtures in iron and prediction of the solidification interval in low-alloyed steels. Hutnické listy, LV, 2000, No. 4–7, p. 59–65, in Czech.
[173] Kuchař, L. and Drápala, J. Experimental evaluation of distribution coefficients of admixtures in metals. Metallic materials, 2001, vol. 39, no. 1, p. 64–76, in Czech.
[174] Drápala, J. and Bujnošková, K. Contribution to the refining metallurgy of refractory metals. Hutnické listy, LVII, 2002, No. 6–8, p. 62–65, in Czech.
189

190
A – absorbanceA
r– nucleon number
a – lattice constant, lattice parameter [nm]a
D– division factor at extraction
ai
– activity of component ia
io – standard activity of component i
b – width of (molten) zone [cm]b
R– distribution number at distillation
C – general notation of the concentration of the elementin the given phase
C*maj
– concentration of major charge carriers [cm–3]C
LB, C
SB– concentration of the element B in the liquid or solid
CL(0) – concentration of the element in the liquid phase
at the boundary (x=0)C
L(∞) – concentration of the element in the liquid in the main
volume of the meltC
M– concentration of ions
Cn(x) – concentration of the element in area x after
n-th solidification processC
0– average initial concentration of the element in the
compoundD – diffusion coefficient [cm2 s–1]D
LB, D
SB– diffusion coefficient of element B in the liquid or
solid [cm2 s–1]D
C– distribution ratio at extraction
E – intensity of the electrical field [V cm–1]Eo – standard electrode potential [V]e – elementary charge (e =1.602 · 10–19C)F – Faraday constant (F = 96487 C mol–1)G – Gibbs energy (free enthalpy) [J]G
L, G
S– the molar free enthalpy of the liquid or solid phase
[J mol–1]G
V– the molar volume free enthalpy [J mol–1]
g – relative part of the solidified crystalgrad T
L– temperature gradient in the liquid [K cm–1]
∆HD
– the change of molar enthalpy of diffusion[J mol–1]
SYMBOLS

191
∆HAm
– molar enthalpy of melting of substance A[J mol–1]
∆HS
– the change of molar enthalpy of the solution of gases[J mol–1]
∆Hev
– the change of molar enthalpy of evaporation ofsubstance [J mol–1]
I – electrical current [A]I
a, I
c– current density (rate of electrochemical reactions
of anions or cations) [A cm–2]I
p– limiting current densities [A cm–2]
K – rate constantK
d– rate constant of convective diffusion
KD
– distribution coefficient at extractionK
F– distribution coefficient at distillation
KH
– selective coefficient at ion exchangeK
I– distribution coefficient at ion exchange
k – Boltzmann constant (k = 1.38054 · 10–23 J K–1)k – distribution coefficient (general)kA
oB– equilibrium distribution coefficient of element B
in main substance AkA
o Blim– limiting value of the equilibrium distribution
coefficient of element B in main substance AkA
oE,P– equilibrium distribution coefficient at eutectic or
peritectic temperaturekA*
B– kinetic distribution coefficient of element B in main
substance AkA
efB, k
ef– effective distribution coefficient of element B in main
substance Ak
tr– equilibrium distribution coefficient of element B in
main substance A in phase transformationl – length [cm]l
o– length of crystal (ingot) [cm]
MA
– relative atomic (molecular) mass of substance Am – mass (weight) [kg]m
LB– tangent to the liquidus curve
nA
– amount of substance A [mol]p – pressure [Pa]po – atmospheric pressure (po=101325 Pa)p
i– partial pressure of vapour of component i above
the solution [Pa]p
io – partial pressure of vapour of component i above
pure solvent [Pa]

192
pH – hydrogen factorQ – amount of heat [J]q – electrochemical equivalent [g C–1]q
D– diffusion flow, diffusion rate [mol cm–2 s–1]
R – molar (universal) gas constant(R = 8.314 J mol–1 K–1)
RH
– Hall constant [m3 C–1]s – solubility of gas∆S – change of entropy [J mol–1 K–1]∆SA
m– molar entropy of melting of element A
[J mol–1 K–1]t – temperature [ºC]T – thermodynamic temperature [K]TA
b , tA
b– boiling point of element A [K,ºC]
TAm, tA
m– melting point of element A [K,ºC]
TL,T
S– liquidus or solidus temperature [K]
TE, T
P– temperature of eutectic or peritectic reaction [K]
∆Tth
– thermodynamic change of temperature from TAm [K]
∆T – deviation of temperature from TAm [K]
UH
– Hall voltage [V]V – volume [cm3]v – rate, macroscopic rate of solidification [cm s–1]v
A– rate of diffusion of compound A in the gas medium
[cm s–1]w
A– mass fraction of substance A
WA
– mass fraction of substance A in the gas phase [wt.%]x, x
B– molar fraction of component B
xGB
– molar fraction of component B in the gas phaseX, X
B– molar fraction of component B [mol.%]
XSB
, XLB
– molar fraction of component B in the solid or liquid[mol.%]
∆ZoA
– change of standard isobaric potential [J mol–1]∆Zo
p– change of standard isobaric potential of chemical
reaction [J mol–1]z
a, z
k– valency of the anion or cation
α – mass transfer coefficientα* – relative change of the volume of the substance with
the change of state [%]α
D– distribution factor at extraction
βR
– distribution number at distillationβ
Rid– the relative volatility coefficient
Γ – ratio of residual resistivity
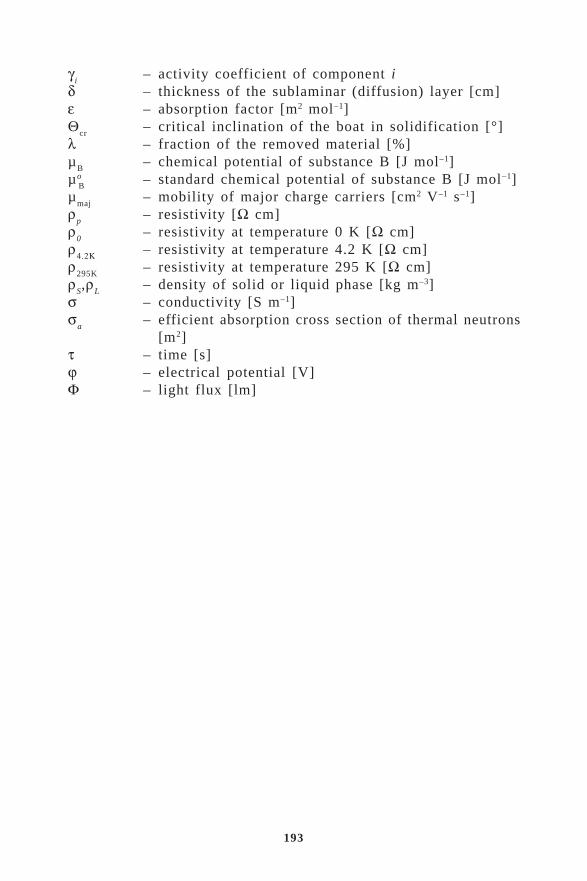
193
γi
– activity coefficient of component iδ – thickness of the sublaminar (diffusion) layer [cm]ε – absorption factor [m2 mol–1]Θ
cr– critical inclination of the boat in solidification [°]
λ – fraction of the removed material [%]µ
B– chemical potential of substance B [J mol–1]
µ oB
– standard chemical potential of substance B [J mol–1]µ
maj– mobility of major charge carriers [cm2 V–1 s–1]
ρp
– resistivity [Ω cm]ρ
0– resistivity at temperature 0 K [Ω cm]
ρ4.2Κ – resistivity at temperature 4.2 K [Ω cm]ρ
295K– resistivity at temperature 295 K [Ω cm]
ρS,ρ
L– density of solid or liquid phase [kg m–3]
σ – conductivity [S m–1]σ
a– efficient absorption cross section of thermal neutrons
[m2]τ – time [s]ϕ – electrical potential [V]Φ – light flux [lm]

194
APPENDICES
The tables A2–A6 summarise the values of the distribution coefficientsof admixtures in 50 main elements. The admixture elements togetherwith their proton numbers are listed in the left column of the tables.The main elements are arranged in the first row of the tables inalphabetical order. The values of k
o, presented in the appropriate
tables, are limiting values of the equilibrium distribution coefficientsof the appropriate admixture elements determined by extrapolationfrom the solidus and liquid curves of the binary systems publishedin the world literature. In systems for which there is still insufficientinformation on the binary diagram, the values of k
o were predicted
by appropriate signs "<",">" or "~". This also relates to inert gasesHe, Ne, Ar, Kr, Xe and Rn. In the case of lanthanides, some of thevalues of the distribution coefficients in the lathanide–lanthanidesystems were calculated using the theory of ideal solutions.
The values of the distribution coefficients presented in thesetables are a summary of a systematic study of the metal–admixturebinary systems of the former Department of Non-Ferrous Metals andNuclear Metallurgy of the VSB-TU Ostrava carried out within theframework of scientific and research activities in the last 40 years.
The values of the distribution coefficients represent thefundamental material parameter not only for refining high-puritysubstances by crystallisation methods, i.e., zone refining and directionalsolidification, where they are used for optimising the refiningmetallurgical process, but also for microalloying special alloys. Inmetallurgical practice, they can be used for an objective evaluationof the segregation characteristics (micro-inhomogeneity in dendriticor cellular growth, etc.) in primary solidification formations.

195
Table A1. Melting point, heat of fusion and entropy of fusion for elements
Element ElementNo. A [K] No. A [K]3 Li 453.6 3000 6.61 55 Cs 301.59 2096 6.954 Be 1556 12220 7.85 56 977 7660 7.845 B 2365 22600 9.56 57 La 1191 11300 9.49
58 1071 9200 8.5911 Na 370.8 2597 7.00 59 Pr 1204 10000 8.3112 Mg 923 9210 9.98 60 Nd 1294 10900 8.4213 Al 933.45 10711 11.47 62 Sm 1347 11100 8.2414 Si 1693 46473 27.45 63 1095 10500 9.59
64 1586 15200 9.5819 K 336.71 2321 6.89 65 Tb 1629 16300 10.0120 Ca 1115 8540 7.66 66 Dy 1685 17200 10.2121 Sc 1814 16100 8.88 67 Ho 1747 17200 9.8522 Ti 1943 17500 9.01 68 Er 1802 17200 9.5423 V 2183 21500 9.85 69 Tm 1818 18400 10.1224 2136 21004 9.83 70 1092 9200 8.4225 Mn 1519 14600 9.61 71 Lu 1936 19300 9.9726 1811 16161 8.92 72 2495 21767 8.7227 Co 1768 17166 9.71 73 Ta 3293 31400 9.5428 Ni 1728 17500 10.13 74 W 3695 35250 9.5429 Cu 1357.87 13263 9.77 75 Re 3459 34000 9.8330 692.58 7322 10.57 76 3306 31800 9.6231 Ga 302.77 5590 18.46 77 2720 26200 9.6332 Ge 1213 34742 28.64 78 Pt 2042 19700 9.6533 As 883 13150 14.89 79 Au 1337.43 12552 9.3934 Se 494 6694 13.55 80 Hg 239.16 2295 9.60
81 577 4142 7.1837 Rb 312.48 2192 7.01 82 Pb 600.5 4774 7.9538 Sr 1042 10050 9.64 83 Bi 544.37 11297 20.7539 Y 1795 17200 9.58 84 Po 800 12560 15.7040 2133 20064 9.4141 Nb 2742 26800 9.77 87 Fr 300 2100 7.0042 Mo 2896 27630 9.54 88 Ra 973 8400 8.6344 Ru 2607 24300 9.32 89 Ac 1323 14200 10.7345 Rh 2236 21600 9.66 90 Th 2023 19228 9.5046 Pd 1828 16736 9.16 91 Pa 1844.78 12341 6.6947 Ag 1234.93 11297 9.15 92 U 1406 12560 8.9348 594.1 6192 10.42 93 Np 916.84 9630 10.5049 In 429.63 3283 7.64 94 Pu 912.5 9462 10.3750 Sn 505 7029 13.9251 Sb 903.75 19874 21.9952 Te 722.57 17489 24.20
Tm
A ∆Hm
A ∆Sm
A Tm
A ∆Hm
A ∆Sm
A
[J mol-1] [J mol-1 K-1] [J mol-1] [J mol-1 K-1]
Ba
Ce
EuGd
Cr Yb
Fe Hf
Zn OsIr
Tl
Zr
Cd

196
Tab
le A
2. E
qu
ilib
riu
m d
istr
ibu
tio
n c
oef
fici
ents
of
adm
ixtu
res
in A
l, A
u,
Cd
, C
e, C
o,
Cr,
Cu
, D
y, E
r
Ad
mix
ture
Ag
Al
Au
Co
Cu
Dy
Er
1 H
<0.1
1.16
0.15
0.12
2 H
e<0
.001
<0.0
01<0
.001
<0.0
01<0
.001
<0.0
01<0
.001
<0.0
01<0
.001
<0.0
013
Li0.
50.
580.
581.
880.
27<1
4 B
e0.
280.
120.
018
0.54
0.22
0.33
5 B
0.16
0.12
<10.
010.
073
0.06
<1<1
6 C
0.6
0.28
0.01
1~0
.17
N<0
.11.
570.
178
O0.
09<1
<0.1
~0.0
30.
019
9 F
10
Ne
<0.0
01<0
.001
<0.0
01<0
.001
<0.0
01<0
.001
<0.0
01<0
.001
<0.0
01<0
.001
11
Na
0.01
7~0
.01
0.09
12
Mg
0.61
0.31
0.56
1.40
0.67
~0.1
0.20
0.47
0.71
13
Al
0.52
10.
36<0
.1<0
.10.
670.
800.
810.
0714
S
i<0
.10.
094
0.03
50.
310.
470.
440.
4215
P
0.01
<0.1
<0.1
<0.1
0.02
~0.0
90.
091
16
S0.
017
<0.0
1<0
.1<0
.1~0
.01
~0.0
30.
024
<117
C
l18
<0
.001
<0.0
01<0
.001
<0.0
01<0
.001
<0.0
01<0
.001
<0.0
01<0
.001
<0.0
0116
K
19
Ca
<0.1
0.06
0.08
8<0
.1<1
0.05
21
Sc
0.39
0.23
0.70
1.70
0.03
~0.0
50.
027
<122
Ti
0.97
9.1
1.82
<0.1
0.30
0.43
0.42
0.31
0.18
23
V~1
3.71
1.70
1.83
0.76
0.63
2.46
0.28
24
~11.
71.
56<0
.10.
390.
871
0.54
<125
M
n1.
060.
760.
590.
170.
240.
650.
580.
45<1
<126
0.
10.
020.
87<0
.10.
040.
960.
661.
32<1
<127
C
o1.
890.
020.
72<0
.1<0
.11
0.56
1.44
<1<1
28
Ni
0.58
0.00
680.
700.
04<0
.10.
970.
411.
48<1
<129
C
u0.
560.
140.
630.
090.
070.
62~0
.51
0.08
<130
0.
490.
430.
360.
39<0
.10.
550.
72<1
<131
G
a0.
410.
086
0.11
0.25
<0.1
0.40
0.87
0.66
0.33
<132
G
e0.
190.
080.
063
0.01
<0.1
0.50
0.41
0.33
<1<1
33
As
0.19
<0.1
0.02
6<0
.10.
140.
16<1
<134
S
e0.
20<0
.01
<0.1
<0.1
<1<1
36
<0.0
01<0
.001
<0.0
01<0
.001
<0.0
01<0
.001
<0.0
01<0
.001
<0.0
01<0
.001
38
Sr
<0.1
0.04
5~0
.01
<0.1
<0.1
~0.0
2539
Y
0.08
0.02
7<0
.12.
010.
020.
230.
0072
1.05
0.97
40
0.05
11.
971.
010.
060.
077
0.01
9>1
0.44
41
Nb
4.59
2.24
0.23
0.33
0.18
42
Mo
0.31
1.56
>10.
840.
83<1
43
Tc<1
>1<1
1.15
>1
Cd
Ce
Cr
Ar
Cr
Fe Zn Kr
Zr

197
Ad
mix
ture
Ag
Al
Au
Co
Cu
Dy
Er
44
Ru
>1<1
1.06
0.58
0.64
0.69
>1<1
45
Rh
>1<1
1.68
0.82
0.44
2.15
<10.
0646
Pd
1.95
<12.
290.
030.
450.
271.
09<1
47
Ag
10.
320.
961.
860.
170.
180.
34<1
48
0.73
0.06
20.
501
0.27
<149
In
0.56
0.01
20.
480.
200.
44<0
.10.
450.
360.
3850
S
n0.
460.
010.
170.
111.
20.
270.
080.
18<1
0.08
51
Sb
0.28
0.03
40.
038
0.02
0.15
0.12
0.08
8<1
<152
Te
0.11
<0.0
1<0
.01
<0.1
<0.1
0.01
1<1
<154
<0
.001
<0.0
01<0
.001
<0.0
01<0
.001
<0.0
01<0
.001
<0.0
01<0
.001
<0.0
0156
<0
.10.
2557
La
0.00
620
0.00
9<0
.11.
13<0
.10.
21~0
.06
58
0.01
0.00
320.
007
<0.1
10.
10.
10.
027
0.69
0.65
59
Pr0.
0019
0<0
.11.
150.
19~0
.08
0.75
0.71
60
Nd
0.02
20
0.01
2<0
.10.
30~0
.07
0.85
0.44
61
Pm<0
.10.
780.
7362
S
m0.
04<0
.10.
017
<0.1
1.19
0.09
~0.1
80.
160.
820.
7863
0
<0.1
0.84
0.67
0.63
64
0.06
7<0
.10.
049
<0.1
1.40
0.07
4~0
.19
0.93
0.87
65
Tb0.
100.
016
0.06
<0.1
0.17
0.96
0.89
66
Dy
0.1
<0.1
0.15
<0.1
<0.1
10.
9267
H
o0.
13<0
.10.
26<0
.10.
190.
003
1.05
0.96
68
Er0.
18<0
.10.
19<0
.10.
021.
081
69
Tm0.
210.
0075
0.25
<0.1
1.80
0.40
1.11
1.02
70
0.11
<0.1
0.24
<0.1
0.00
20.
70.
6671
Lu
0.27
0.33
<0.1
0.22
1.2
1.1
72
<12.
92<1
<10.
10.
063
0.05
3<1
73
Ta6.
070.
570.
250.
43>2
<1<1
74
W>1
1.09
1.41
>275
R
e<1
1.22
1.45
>176
>1
1.45
1.20
>177
>1
<0.1
0.80
0.52
2.86
78
Pt2.
410.
391.
980.
030.
640.
252.
0379
A
u1.
170.
035
10.
54<0
.10.
180.
089
0.64
<1<1
80
Hg
0.51
0.17
0.22
0.35
0.09
381
0.
28<0
.10.
15<0
.10.
330.
024
82
Pb0.
270.
056
0.01
30.
036
<0.1
0.02
30.
39<1
83
Bi
0.2
0.03
30.
011
0.00
20.
31<0
.10
86
Rn
<0.0
01<0
.001
<0.0
01<0
.001
<0.0
01<0
.001
<0.0
01<0
.001
<0.0
01<0
.001
90
Th0.
016
0.05
0.00
121.
470.
240.
0007
1.72
1.21
92
U0.
310.
0024
0.02
5<0
.1<0
.10.
08~0
.025
93
Np
<0.1
94
Pu0.
0035
<0.1
0.74
<0.1
~0.0
50.
018
Cd
Ce
Cr
Cd
Xe
Ba
Ce Eu Gd
Yb
Hf
Os Ir Tl

198
Tab
le A
3. E
qu
ilib
riu
m d
istr
ibu
tio
n c
oef
fici
ents
of
adm
ixtu
res
in F
e, G
a, G
d,
Ge,
Hf,
Ho
, In
, Ir
, L
a, L
u
Ad
mix
ture
Ga
Ge
Ho
InL
aM
g
1 H
~0.3
>11.
150.
922
He
<0.0
01<0
.001
<0.0
01<0
.001
<0.0
01<0
.001
<0.0
01<0
.001
<0.0
013
Li~0
.003
~0.0
6>1
0.68
4 B
e0.
64~0
.081
<0.0
15
B0.
05<0
.1~1
70.
15<1
6 C
0.19
~0.1
0.32
~0.2
0.36
7 N
>1>1
8 O
0.15
>1~0
.001
2.59
>19
F10
N
e<0
.001
<0.0
01<0
.001
<0.0
01<0
.001
<0.0
01<0
.001
<0.0
01<0
.001
11
Na
<11.
24>1
12
Mg
0.62
0.48
~0.0
001
0.38
1.21
~0.1
0.60
113
A
l0.
88<1
0.04
0.01
0.60
<1<1
~0.5
<0.1
0.29
14
Si
0.66
<0.1
0.49
5.5
0.17
<10.
0015
15
P0.
140.
1<1
16
S0.
06<0
.1~0
.001
<1<0
.117
C
l<0
.118
<0
.001
<0.0
01<0
.001
<0.0
01<0
.001
<0.0
01<0
.001
<0.0
01<0
.001
16
K<1
19
Ca
0.95
0.63
0.04
621
S
c0.
060.
86<1
~0.1
0.88
2.18
22
Ti0.
350.
520.
630.
39<1
1.27
23
V0.
860.
46<1
0.43
0.05
<10.
2424
0.
900.
260.
460.
350.
76<0
.125
M
n0.
69<1
0.12
<1<1
<10.
041.
3726
1
0.35
0.05
0.14
<1<1
0.46
0.03
27
Co
0.84
<1<0
.10.
33<1
<10.
33<0
.128
N
i0.
69<1
0.06
00.
04<1
<1<0
.10.
0021
29
Cu
0.78
<0.1
0.33
00.
27~0
.06
0.33
<0.1
0.00
0730
0.
770.
15<1
00.
46<0
.10.
2431
G
a0.
811
0.47
0.04
0.18
0.27
0.32
0.08
232
G
e0.
79<0
.1<0
.11
0.21
<1<1
<0.1
0.05
533
A
s0.
210.
02<1
34
Se
~0.0
0136
<0
.001
<0.0
01<0
.001
<0.0
01<0
.001
<0.0
01<0
.001
<0.0
01<0
.001
38
Sr
0.00
4539
Y
0.06
1.27
0.03
1.03
<0.1
1.61
0.19
40
0.28
0.13
0.80
0.42
3.77
41
Nb
0.37
0.82
0.78
0.87
1.27
42
Mo
0.73
0.83
0.48
0.93
>143
Tc
1.03
<1
FeG
dH
fIr
<10-7
<10-7
<10-6
<10-7
<10-5
<10-6
Ar
<10-
7
<10-6
<10-6
~3.1
0-7
Cr
<10-6
Fe<1
0-5
<10-6
Zn Kr
<10-7
<10-6
Zr

199
Ad
mix
ture
Ga
Ge
Ho
InL
aM
g
44
Ru
1.04
<10.
9245
R
h0.
680.
82<1
46
Pd0.
470.
360.
25<1
~0.6
80.
023
47
Ag
0.04
20.
45<1
<1~0
.09
0.32
0.22
0.10
48
~0.1
0.45
<10.
780.
430.
4349
In
0.21
0.03
0.60
00.
481
0.41
0.43
50
Sn
0.28
00.
020.
44<1
0.69
<0.1
0.26
51
Sb
0.15
0<1
<0.1
~0.0
1<0
.152
Te
0<1
2.82
<0.1
54
<0.0
01<0
.001
<0.0
01<0
.001
<0.0
01<0
.001
<0.0
01<0
.001
<0.0
0156
0.
36<0
.10.
0013
57
La0.
05<1
0.04
~0.0
81
0.02
558
0.
020.
670.
030.
530.
67~0
.09
0.9
0.02
559
Pr
<10.
050.
731.
040.
027
60
Nd
0.08
0.80
0.02
0.77
1.1
0.14
61
Pm<1
0.75
1.63
62
Sm
0.01
0.86
0.8
1.52
0.22
63
<10.
65<1
64
0.07
10.
871.
610.
2165
Tb
0.06
1.04
0.92
>10.
2766
D
y1.
060.
950.
3567
H
o<0
.11.
111
0.38
68
Er0.
11.
14~0
.11.
02<0
.10.
3469
Tm
<0.1
1.06
0.51
70
0.85
0.68
~0.1
0.06
171
Lu
<0.1
1.14
0.59
72
0.22
10.
4373
Ta
0.44
<1~0
.008
0.76
0.78
<0.1
74
W0.
830.
440.
6575
R
e1.
100.
381.
1676
1.
410.
241.
4877
1.
110.
171
<0.1
0.02
678
Pt
0.72
<0.1
<1~0
.10.
260.
7679
A
u0.
360.
25<1
<0.1
~0.2
5<0
.10.
1280
H
g0.
08~0
.000
10.
590.
037
81
<0.1
0.31
01.
060.
280.
2982
Pb
<0.1
0.24
~0.0
017
1.04
4<0
.10.
2483
B
i<0
.1<0
.10
0.33
~0.0
10.
280.
081
86
Rn
<0.0
01<0
.001
<0.0
01<0
.001
<0.0
01<0
.001
<0.0
01<0
.001
<0.0
0190
Th
0.06
2.20
0.28
<0.1
1.20
0.12
92
U<0
.10.
550.
0593
N
p94
Pu
0.21
~0.5
0.71
0.14
FeG
dH
fIr
~3.1
0-7
Cd
<10-5
Xe
~3.1
0-7
Ba
<10-6
Ce Eu Gd
Yb
Hf
Os Ir
~5.1
0-7
7.8.
10-6
Tl
<10-7

200
Tab
le A
4. E
qu
ilib
riu
m d
istr
ibu
tio
n c
oef
fici
ents
of
adm
ixtu
res
in M
o,
Nb
, N
d,
Ni,
Os,
Pb
, P
d,
Pr,
Pt,
Pu
Ad
mix
ture
Mo
Nb
Nd
Ni
Pb
Pd
Pr
Pt
Pu
1 H
>10.
371.
062
He
<0.0
01<0
.001
<0.0
01<0
.001
<0.0
01<0
.001
<0.0
01<0
.001
<0.0
01<0
.001
3 Li
0.22
0.24
0.35
4 B
e0.
010.
250.
500.
018
0.04
6<1
5 B
0.03
80.
034
0.01
8~0
.10.
33~0
.16
C0.
038
0.41
0.19
0.30
0.68
~0.3
<17
N0.
019
0.77
8 O
0.20
0.06
2<1
9 F
10
Ne
<0.0
01<0
.001
<0.0
01<0
.001
<0.0
01<0
.001
<0.0
01<0
.001
<0.0
01<0
.001
11
Na
~0.0
10.
7212
M
g0.
053
0.01
20.
340.
580.
630.
213
A
l0.
420.
380.
85~0
.30.
50<1
0.71
3.85
14
Si
0.08
00.
14<1
0.41
0.03
0.06
0.1
15
P0.
018
0.00
190.
56<0
.116
S
0.17
00.
031
17
Cl
18
<0.0
01<0
.001
<0.0
01<0
.001
<0.0
01<0
.001
<0.0
01<0
.001
<0.0
01<0
.001
16
K19
C
a0.
650.
0052
0.67
~0.0
2<1
<0.1
21
Sc
0.02
2<0
.11.
160.
058
~0.1
0.71
1.72
~0.1
3.06
22
Ti0.
600.
570.
320.
490.
390.
451.
112.
0523
V
0.73
0.60
0.94
0.69
0.49
1.03
24
0.57
0.44
0.77
0.83
<10.
670.
551.
0925
M
n~0
.20.
58<1
0.43
0.79
0.71
0.13
26
0.27
0.13
0.05
0.91
0.50
0.62
0.69
0.07
27
Co
0.22
0.02
31.
030.
440.
580.
690.
0428
N
i0.
042
0.06
81
~0.1
0.05
80.
55<1
0.54
0.16
29
Cu
0.06
80.
790.
083
0.66
<10.
880.
7030
0.
230.
620.
140.
790.
26<1
31
Ga
0.17
0.34
0.04
0.49
0.14
0.36
<1<1
2.34
32
Ge
0.06
30.
180.
070.
460.
048
<1~0
.133
A
s0.
180.
220.
023
<1<0
.134
S
e0.
011
36
<0.0
01<0
.001
<0.0
01<0
.001
<0.0
01<0
.001
<0.0
01<0
.001
<0.0
01<0
.001
38
Sr
0.55
<0.1
~0.1
<0.1
39
Y~0
.05
1.49
0.01
3~0
.10.
261.
76~0
.140
0.
140.
410.
050.
541.
172.
184.
3741
N
b0.
871
0.51
0.43
1.31
1.47
42
Mo
11.
095
0.84
0.76
1.50
1.39
43
Tc0.
371.
11<1
1.41
>1
Os
Ar
Cr
Fe Zn Kr
Zr

201
Ad
mix
ture
Mo
Nb
Nd
Ni
Pb
Pd
Pr
Pt
Pu
44
Ru
0.34
0.39
1.21
0.86
1.17
1.47
0.25
45
Rh
0.27
0.32
1.22
~0.5
0.28
1.26
1.38
0.18
46
Pd0.
170.
540.
510.
111
0.88
0.53
47
Ag
0.15
0.39
<0.1
0.06
40.
670.
120.
5348
<0
.10.
32~0
.7<1
49
In0.
500.
200.
740.
68<1
<150
S
n0.
390.
300.
280.
620.
57<1
0.39
51
Sb
0.26
0.29
0.23
0.33
0.47
0.18
0.21
52
Te<1
0.12
<1<0
.154
<0
.001
<0.0
01<0
.001
<0.0
01<0
.001
<0.0
01<0
.001
<0.0
01<0
.001
<0.0
0156
0.
60.
082
0.11
<157
La
~0.0
70.
054
0.91
<0.1
<0.1
0.21
~0.1
~0.1
58
0.31
0.84
0.02
40.
180.
910.
9059
Pr
0.96
<0.1
<0.1
0.31
1<0
.160
N
d1
0.10
1.09
0.55
61
Pm1.
051.
1162
S
m0.
131.
020.
170.
161.
120.
8363
0.
840.
027
0.26
0.9
<0.1
64
0.08
81.
030.
093
0.18
0.29
1.29
0.05
65
Tb1.
360.
271.
5366
D
y1.
460.
381.
6367
H
o1.
510.
301.
768
Er
1.2
<0.1
0.30
1.77
69
Tm70
0.
890.
52<0
.171
Lu
<0.1
72
0.47
0.54
0.05
20.
461.
22>1
5.49
73
Ta1.
321.
280.
620.
311.
912.
1574
W
1.54
1.22
1.64
0.85
1.60
1.73
75
Re
0.85
0.96
2.20
~1.0
51.
782.
0276
0.
790.
621.
101
3.46
0.06
>10.
1977
0.
240.
391.
960.
711.
920.
031.
1178
Pt
0.23
0.44
<10.
94~0
.51.
300.
071
0.26
79
Au
0.01
70.
410.
260.
011
0.91
0.12
0.71
80
Hg
~0.1
0.67
0.28
<181
0.
290.
301.
170.
084
0.29
<182
Pb
0.13
10.
410.
28~0
.183
B
i0.
1<0
.10.
780.
330.
21<0
.186
R
n<0
.001
<0.0
01<0
.001
<0.0
01<0
.001
<0.0
01<0
.001
<0.0
01<0
.001
<0.0
0190
Th
0.04
64.
440
<0.1
~0.0
11.
39~0
.10.
6092
U
0.19
0.53
0.03
20.
040.
540.
190.
5493
N
p0.
420.
7094
Pu
~0.1
50.
800.
11<0
.10.
510.
83~0
.11
Os
Cd
Xe
Ba
Ce Eu Gd
Yb
Hf
Os Ir Tl

202
Tab
le A
5. E
qu
ilib
riu
m d
istr
ibu
tio
n c
oef
fici
ents
of
adm
ixtu
res
in R
e, R
h,
Ru
, S
b,
Sc,
Si,
Sm
, S
n,
Ta,
Tb
Ad
mix
ture
Re
Rh
Ru
Sb
Sc
Si
Sm
Sn
Ta
Tb
1 H
>1>1
2 H
e<0
.001
<0.0
01<0
.001
<0.0
01<0
.001
<0.0
01<0
.001
<0.0
01<0
.001
3 Li
0.29
0.01
<1<1
4 B
e0.
05<1
~0.1
<1<1
5 B
0.01
4~0
.09
0.04
5<1
0.27
<10.
048
<16
C0.
190.
140.
162.
34~0
.07
0.52
7 N
0.69
8 O
1.87
<10.
10>1
9 F
<0.1
10
Ne
<0.0
01<0
.001
<0.0
01<0
.001
<0.0
01<0
.001
<0.0
01<0
.001
<0.0
0111
N
a<0
.05
<1<1
12
Mg
0.01
50.
630.
700.
4913
A
l0.
037
~0.2
0.14
0.13
0.02
<10.
430.
081
<114
S
i0.
065
~0.0
80.
011
1<1
0.11
<115
P
~0.0
1~0
.03
0.02
60.
35<1
16
S0.
054
<0.1
17
Cl
<0.0
5<0
.1<0
.118
<0
.001
<0.0
01<0
.001
<0.0
01<0
.001
<0.0
01<0
.001
<0.0
01<0
.001
16
K<0
.05
<1<1
19
Ca
0.32
0.35
<1<1
21
Sc
0.13
~0.1
0.09
11.
2222
Ti
0.08
50.
570.
33<1
0.51
0.06
30.
61<1
23
V0.
150.
71<1
0.20
<10.
4724
0.
210.
660.
660.
22<1
0.32
0.33
25
Mn
<1<1
<1<1
<126
~0
.50.
630.
930.
10
<10.
090.
3427
C
o0.
320.
330.
53<0
.05
0.02
0<1
0.22
28
Ni
0.22
0.68
0.63
0.02
4<1
0<1
0.01
30.
36<1
29
Cu
~0.4
0.48
~0.2
0.04
50
<10.
006
<130
~0
.25
00.
340.
032
31
Ga
~0.1
0.16
<10.
010.
300.
170.
2532
G
e~0
.05
<0.1
0.37
0.11
0.39
<1<1
33
As
0.61
0.24
<1<1
34
Se
~0.0
1<0
.5<0
.1<1
36
<0.0
01<0
.001
<0.0
01<0
.001
<0.0
01<0
.001
<0.0
01<0
.001
<0.0
0138
S
r0.
170.
39<1
39
Y<0
.1~0
.1~0
.05
0.63
1.36
>140
0.
026
0.46
0.12
1.14
1.95
0.15
41
Nb
0.12
0.98
0.57
0.17
0.80
42
Mo
0.19
1.5
0.82
0.18
0.83
43
Tc0.
49>1
<1<1
<10-7
<10-7
<10-6
<10-7
~8.1
0-6
~10-5
<10-6
Ar
<10-7
~2.1
0-6
~4.1
0-6
Cr
~8.1
0-6
~8.1
0-6
Fe Zn
~2.1
0-5
Kr
<10-7
Zr
<10-8
~6.1
0-8

203
Ad
mix
ture
Re
Rh
Ru
Sb
Sc
Si
Sm
Sn
Ta
Tb
44
Ru
0.61
1.12
10.
020.
030.
48<1
45
Rh
0.38
10.
84<1
<10.
31<1
46
Pd0.
057
0.76
0.34
<10.
070.
44<1
47
Ag
0.72
~0.2
0.28
<10
<10.
034
0.89
48
~0.6
0<1
0.21
<149
In
~0.5
0.53
0.42
0.39
0.73
50
Sn
0.27
0.37
0.01
0.03
1<1
51
Sb
0.18
10.
02<1
1.95
0.46
52
Te~0
.01
0.07
<1<1
54
<0.0
01<0
.001
<0.0
01<0
.001
<0.0
01<0
.001
<0.0
01<0
.001
<0.0
0156
<0
.1<1
0.23
0.29
57
La~0
.09
~0.0
20.
210.
880.
6358
0.
050.
540.
8659
Pr
<160
N
d0.
300.
560.
9561
Pm
62
Sm
163
0.
80.
6964
0.
021
<0.1
0.65
1.20
0.97
65
Tb0.
022
1.29
166
D
y<0
.11.
361.
0367
H
o1.
691.
0868
Er
0.02
5~0
.10.
741.
471.
1269
Tm
70
~0.1
~0.1
71
Lu72
0.
011
~0.8
0.42
73
Ta0.
131.
180.
6<1
174
W
0.34
1.70
0.88
<10.
98<1
75
Re
15.
221.
48<1
<10.
580.
0676
0.
87~2
.51.
45<1
0.77
<177
0.
641.
531.
02<1
0.24
<178
Pt
0.40
0.98
0.62
<10.
26<1
79
Au
0.26
~0.2
<10
0.02
0.03
60.
23<1
80
Hg
~0.1
<10.
20<1
81
<10.
058
<182
Pb
0.15
0.55
0.05
8<1
83
Bi
~0.0
1~0
.01
0.24
0<0
.10.
2786
R
n<0
.001
<0.0
01<0
.001
<0.0
01<0
.001
<0.0
01<0
.001
<0.0
01<0
.001
90
Th0.
04~0
.08
0.74
0.01
31.
3292
U
0.05
80.
03~0
.10.
540.
140.
020
93
Np
94
Pu<0
.1~0
.10.
730.
87
Cd
~10-5
~4.1
0-4
~8.1
0-6
Xe
<10-7
Ba
Ce Eu Gd
Yb
Hf
~10-7
Os Ir Tl
~10-4
~5.1
0-4
<10-7
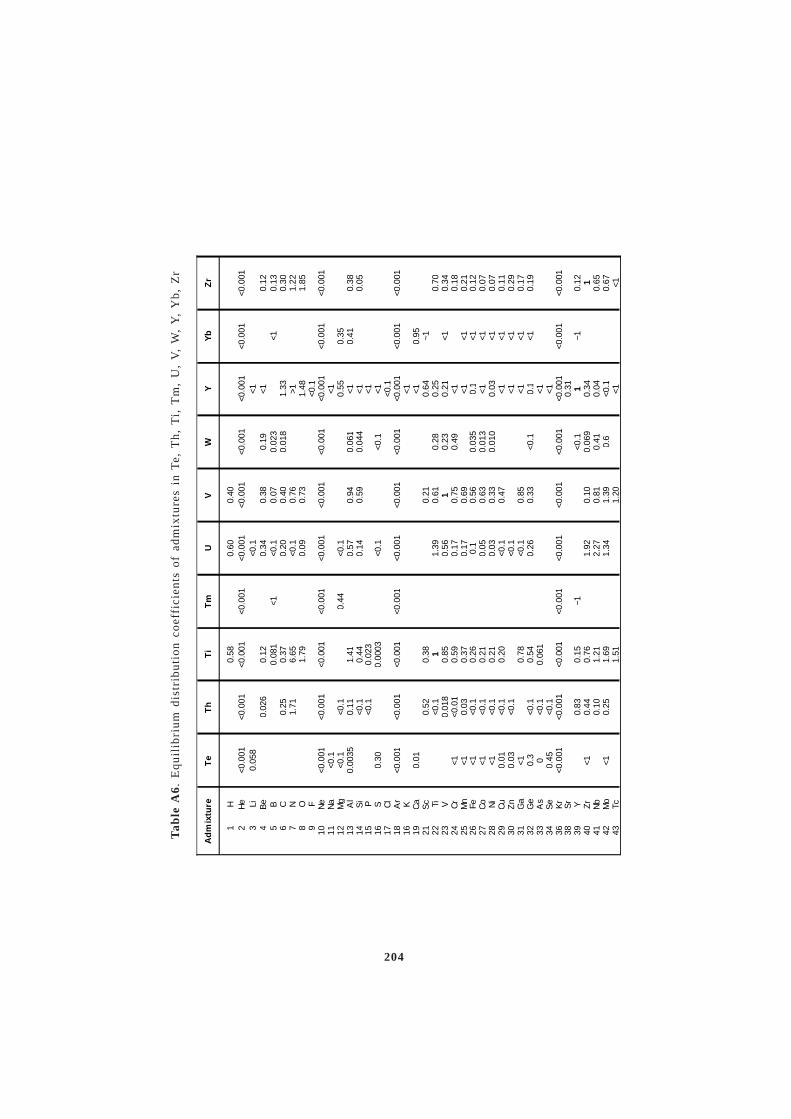
204
Tab
le A
6. E
qu
ilib
riu
m d
istr
ibu
tio
n c
oef
fici
ents
of
adm
ixtu
res
in T
e, T
h,
Ti,
Tm
, U
, V
, W
, Y
, Y
b,
Zr
Ad
mix
ture
Te
Th
Ti
Tm
UV
WY
1 H
0.58
0.60
0.40
2 H
e<0
.001
<0.0
01<0
.001
<0.0
01<0
.001
<0.0
01<0
.001
<0.0
01<0
.001
<0.0
013
Li0.
058
<0.1
<14
Be
0.02
60.
120.
340.
380.
19<1
0.12
5 B
0.08
1<1
<0.1
0.07
0.02
3<1
0.13
6 C
0.25
0.37
0.20
0.40
0.01
81.
330.
307
N1.
716.
65<0
.10.
76>1
1.22
8 O
1.79
0.09
0.73
1.48
1.85
9 F
<0.1
10
Ne
<0.0
01<0
.001
<0.0
01<0
.001
<0.0
01<0
.001
<0.0
01<0
.001
<0.0
01<0
.001
11
Na
<0.1
<112
M
g<0
.1<0
.10.
44<0
.10.
550.
3513
A
l0.
0035
0.11
1.41
0.57
0.94
0.06
1<1
0.41
0.38
14
Si
<0.1
0.44
0.14
0.59
0.04
4<1
0.05
15
P<0
.10.
023
<116
S
0.30
0.00
03<0
.1<0
.1<1
17
Cl
<0.1
18
<0.0
01<0
.001
<0.0
01<0
.001
<0.0
01<0
.001
<0.0
01<0
.001
<0.0
01<0
.001
16
K<1
19
Ca
0.01
<10.
9521
S
c0.
520.
380.
210.
64~1
22
Ti<0
.11
1.39
0.61
0.28
0.25
0.70
23
V0.
018
0.85
0.56
10.
230.
21<1
0.34
24
<1<0
.01
0.59
0.17
0.75
0.49
<10.
1825
M
n<1
0.03
0.37
0.17
0.69
<1<1
0.21
26
<1<0
.10.
260.
10.
560.
035
0.1
<10.
1227
C
o<1
<0.1
0.21
0.05
0.63
0.01
3<1
<10.
0728
N
i<1
<0.1
0.21
0.03
0.33
0.01
00.
03<1
0.07
29
Cu
0.01
<0.1
0.20
<0.1
0.47
<1<1
0.11
30
0.03
<0.1
<0.1
<1<1
0.29
31
Ga
<10.
78<0
.10.
85<1
<10.
1732
G
e0.
3<0
.10.
540.
260.
33<0
.10.
1<1
0.19
33
As
0<0
.10.
061
<134
S
e0.
45<0
.1<1
36
<0.0
01<0
.001
<0.0
01<0
.001
<0.0
01<0
.001
<0.0
01<0
.001
<0.0
01<0
.001
38
Sr
0.31
39
Y0.
830.
15~1
<0.1
1~1
0.12
40
<10.
440.
761.
920.
100.
069
0.34
141
N
b0.
101.
212.
270.
810.
410.
040.
6542
M
o<1
0.25
1.69
1.34
1.39
0.6
<0.1
0.67
43
Tc1.
511.
20<1
<1
Yb
Zr
Ar
Cr
Fe Zn Kr
Zr

205
Ad
mix
ture
Te
Th
Ti
Tm
UV
WY
44
Ru
0.02
0.54
0.23
1.03
0.45
<1<1
0.19
45
Rh
0.02
0.40
0.20
0.72
0.09
3<1
<10.
1346
Pd
0.01
00.
600.
320.
640.
046
<1<1
0.22
47
Ag
~0.0
070.
690.
46<1
0.30
48
~0.9
00.
39<0
.1<1
0.33
<149
In
0.17
0.36
0.79
0.41
0.29
50
Sn
~0.6
50.
90<0
.10.
840.
11<1
0.27
51
Sb
~0.4
80.
40<0
.10.
28<1
52
Te1
0.19
<1<1
0.12
54
<0.0
01<0
.001
<0.0
01<0
.001
<0.0
01<0
.001
<0.0
01<0
.001
<0.0
01<0
.001
56
<10.
7557
La
0.68
0.35
0.01
50.
6858
<1
0.48
0.25
0.65
0.13
0.06
60.
720.
980.
4159
Pr
0.53
0.09
40.
71<1
1.1
60
Nd
0.65
0.18
0.75
0.7
0.86
61
Pm0.
73<1
1.26
62
Sm
0.77
0.73
1.25
0.31
63
0.63
<10.
9964
0.
770.
180.
860.
072
0.83
1.18
0.13
65
Tb0.
760.
880.
841.
866
D
y0.
810.
140.
910.
061
0.86
1.94
0.47
67
Ho
<10.
940.
950.
052
0.97
2.02
68
Er0.
840.
180.
990.
046
0.98
2.09
0.53
69
Tm0.
111
<12.
2470
<1
0.67
<11
71
Lu0.
841.
08<1
2.52
72
0.58
0.92
1.98
0.18
0.13
0.28
<11.
1373
Ta
0.03
2.13
2.83
0.90
0.79
0.01
0.82
74
W<0
.11.
981.
281.
761
<10.
4075
R
e0.
031.
610.
832.
070.
43<1
0.27
76
<0.1
0.74
0.50
2.54
0.44
<10.
2177
<0
.10.
570.
241.
060.
15<1
<10.
0978
Pt
0.02
0.32
0.28
0.75
0.09
0<1
<10.
1279
A
u0.
002
0.05
0.37
0.55
0.49
<1<1
0.14
80
Hg
0.05
<0.1
<181
<1
<182
Pb
0.13
0.06
0.39
<0.1
0.38
0.47
~0.1
883
B
i0.
0002
<0.1
0.39
0.05
4<1
0.26
86
Rn
<0.0
01<0
.001
<0.0
01<0
.001
<0.0
01<0
.001
<0.0
01<0
.001
<0.0
01<0
.001
90
Th1
0.25
0.01
9<0
.11.
450.
5592
U
0.24
0.80
10.
077
0.00
1<1
0.64
93
Np
0.68
<194
Pu
0.43
0.28
0.54
0.34
0.25
0.50
Yb
Zr
Cd
Xe
Ba
Ce Eu Gd
Yb
Hf
Os Ir Tl
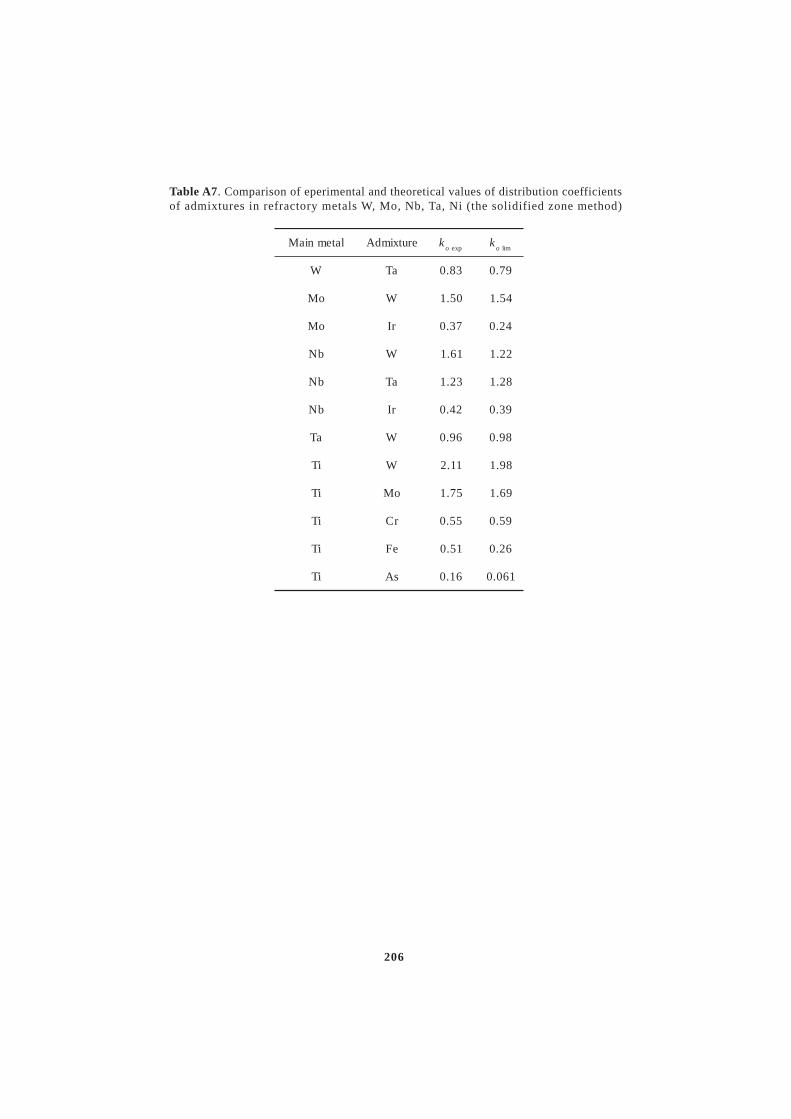
206
Table A7. Comparison of eperimental and theoretical values of distribution coefficientsof admixtures in refractory metals W, Mo, Nb, Ta, Ni (the solidified zone method)
latemniaM erutximdA ko pxe
ko mil
W aT 38.0 97.0
oM W 05.1 45.1
oM rI 73.0 42.0
bN W 16.1 22.1
bN aT 32.1 82.1
bN rI 24.0 93.0
aT W 69.0 89.0
iT W 11.2 89.1
iT oM 57.1 96.1
iT rC 55.0 95.0
iT eF 15.0 62.0
iT sA 61.0 160.0

207
Fig
. A
1. T
yp
es o
f al
um
iniu
m–
adm
ixtu
re b
inat
y s
yst
ems
in t
he
liq
uid
s an
d s
oli
du
s re
gio
ns.
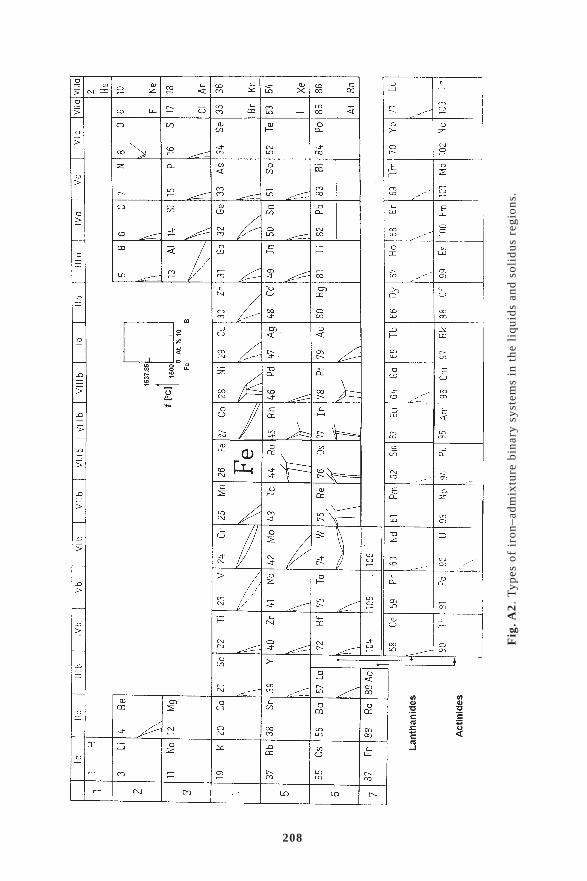
208
Fig
. A2.
Typ
es o
f ir
on–a
dmix
ture
bin
ary
syst
ems
in t
he l
iqui
ds a
nd s
olid
us r
egio
ns.
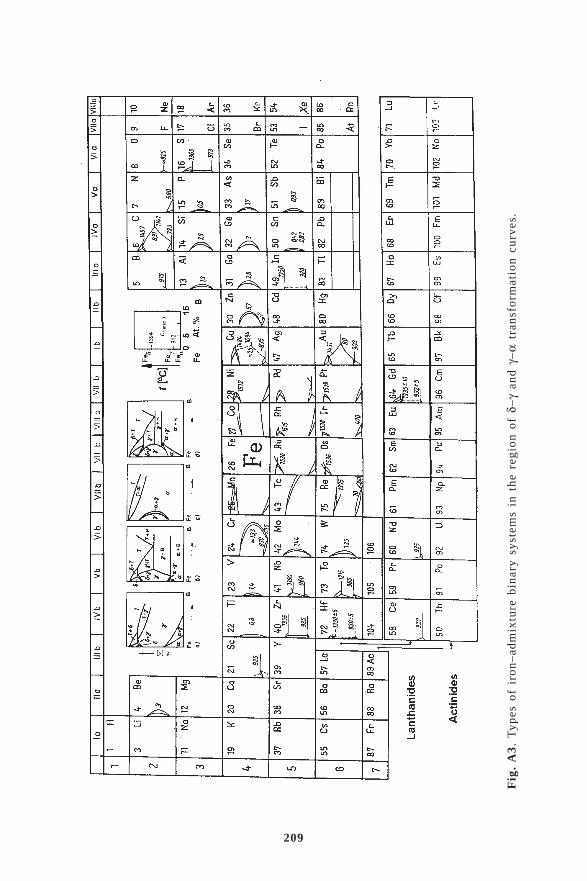
209
Fig
. A
3.
Ty
pes
of
iro
n–
adm
ixtu
re b
inar
y s
yst
ems
in t
he
reg
ion
of
δ–γ
and
γ–
α t
ran
sfo
rmat
ion
cu
rves
.

210
Fig
. A4.
Typ
es o
f ni
ckel
–adm
ixtu
re b
inar
y sy
stem
s in
the
liq
uids
and
sol
idus
reg
ions
.
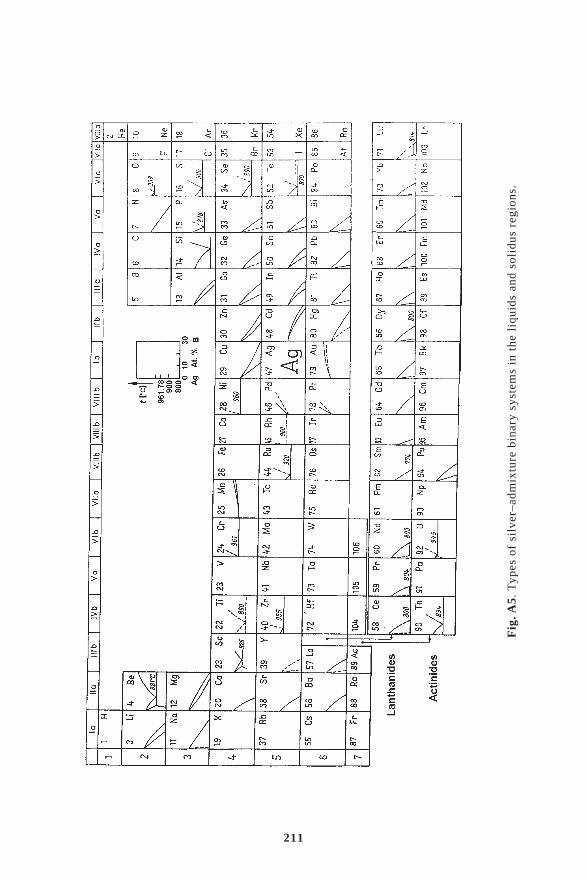
211
Fig
. A5.
Typ
es o
f si
lver
–adm
ixtu
re b
inar
y sy
stem
s in
the
liq
uids
and
sol
idus
reg
ions
.

212
Fig
. A6.
Typ
es o
f go
ld–a
dmix
ture
bin
ary
syst
ems
in t
he l
iqui
ds a
nd s
olid
us r
egio
ns.

213
Fig
. A
7. T
yp
es o
f tu
ng
sten
–ad
mix
ture
bin
ary
sy
stem
s in
th
e li
qu
ids
and
so
lid
us
reg
ion
s.

214
Fig
. A
8.
Per
iod
ic c
orr
elat
ion
dep
end
ence
of
dis
trib
uti
on
co
effi
cien
ts o
f th
e ad
mix
ture
in
alu
min
ium
on
th
e p
roto
n n
um
ber
of
the
adm
ixtu
re.
0.001
0.01
0.11
10
010
20
30
40
50
60
70
80
90
100
Pro
ton
nu
mb
er
of
ad
mix
ture
s
ko B
Au
tho
rs
Ku
ch
ar
1983
Revel
Vig
do
rovic
h
Oth
ers
Ku
ch
ar
1999
Hf
NaAl
Y
Sc
Ge
Ga
Zn
Cu
Ni
Co
Fe
Mn
Cr
V
Ti
Sc
Ca
Si
Mg
He N
e A
r K
r X
e
Rn
Li
Al
B
Be
Pu
U
Th
BiP
b
Hg
Au
Pt
Re
W
Ta
Lan
than
ides
Sb
Sn
In
Cd
Ag
Mo
Nb
Zr

215
Fig. A9. Periodic correlation dependence of the distribution coefficients of theadmixtureS in iron, cobalt and nickel on the proton number of the admixture.
0.001
0.01
0.1
1
10
Proton number
k oB
He
Be
C
Ne
Al
Si
P
S
Ar
Ti
Kr Xe
Sm
Rn
Pu
Th
H
O
Mg
ScB
Fe
Ce
La
NdTb
Gd Er
Hf
TaAu
PtIr
Os
WRe
YAg
Sn
InZrAs
NbPd
Cd
RhRuTc
MoGeV
Mn
Fe
Ni
GaCr
Zn
CuCo
0.001
0.01
0.1
1
10
k oB
H
Be
C
Al
Mg
Si
P
Sc
Ti
As
GeV
MnCu
CoNiCr
Y
Zr
Nb
Mo
Th
Rh
PdRu
Sn
Sb Ce SmGd
Er
Hf
Ta
WOs
IrPt
Re
Au
B S
Co
GaZn
Fe
0.001
0.01
0.1
1
10
Proton number
k oB
H
Li
Be
Ni
B
C
O
Mg
Al
Si
P
Ca
Sc
Ti
V
Mn
Co
He Ne Ar Kr
CuZnGa
Ge
As
Y
Zr
Nb
MoTc Rh
Ru
Pd
Ag
In
SnSb
Ce
Eu
Gd
H
Xe
Ta
W
Re
Os
Ir
Pt
Au
Hg
Tl
Pb
Rn
Th
U
Pu
NiFe
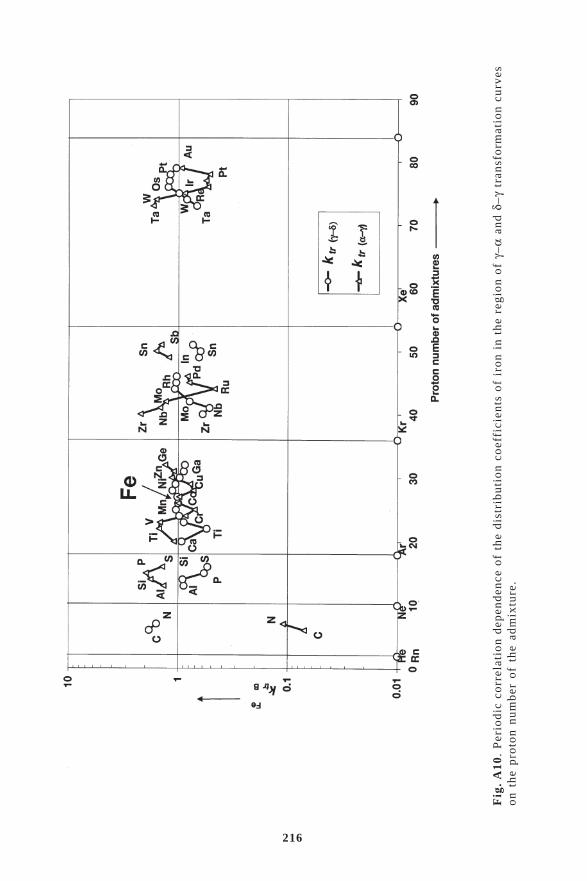
216
Fig
. A
10.
Per
iod
ic c
orr
elat
ion
dep
end
ence
of
the
dis
trib
uti
on
co
effi
cien
ts o
f ir
on
in
th
e re
gio
n o
f γ–
α a
nd
δ–
γ tr
ansf
orm
atio
n c
urv
eso
n t
he
pro
ton
nu
mb
er o
f th
e ad
mix
ture
.
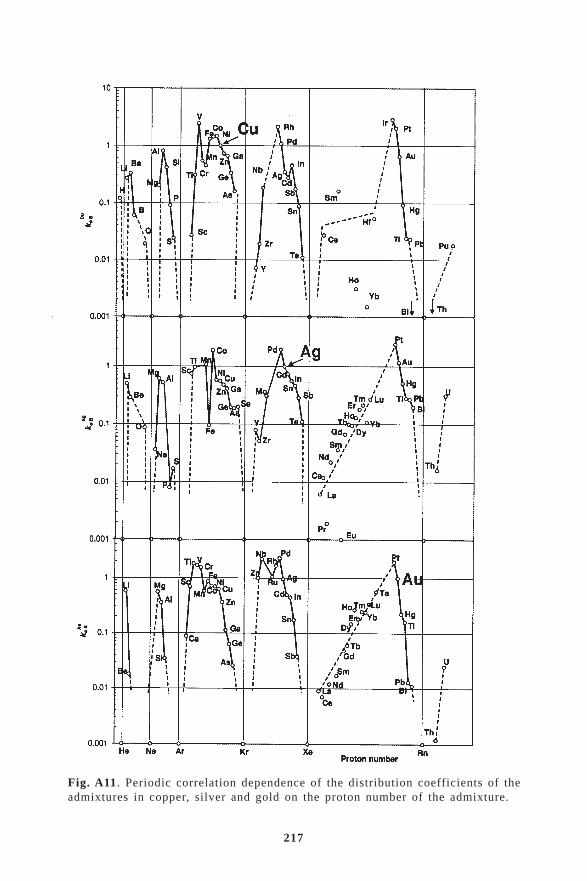
217
Fig. A11. Periodic correlation dependence of the distribution coefficients of theadmixtures in copper, silver and gold on the proton number of the admixture.

218
Fig. A12. Periodic correlation dependence of the distribution coefficients of theadmixtures in tungsten, molybdenu, tantalum and niobium on the proton numberof the admixture.

219
Fig. A13. a) Periodic correlation dependence of distribution coefficients of admixturesin silicon on proton number of admixture elements; b) Solidus curves in silicon– admixture binary systems with retrograde solubility.
a
b

220
Fig. A14. Periodic correlation dependence of the distribution coefficients of theadmixtures in titanium, zirconium and hafnium on the proton number of the admixture.
0.001
0.01
0.1
1
10
0 10 20 30 40 50 60 70 80 90 100
k oB
O Al
Si
TiV
Cr
FeCo
Ni
N
C
Zr
Nb
Mo
RuRh
Pd Hf
Ta WRe
Os
Tm
Pt
Au
Th
U
B
Be
Sc Mn
Cu
GaGe
YTe
Tc
Sn
CeGd
Dy
Er
Pb
Pu
Ti
H
P
As
Ag
CdSb La
Pr
Nd
IrBi
0.001
0.01
0.1
1
10
0 10 20 30 40 50 60 70 80 90 100
k oB
O
Al
Si
Ti
V
CrFe
Co Ni
N
C
ZrNb
Mo
Ru
RhPd
HfTa
WRe
Os
IrPt
Au
ThU
BZr
Be
Sc
Mn
Cu
Zn
GaGe
Y Te
Ag SnCe
Gd
Dy ErBi
Pu
0.001
0.01
0.1
1
10
Proton number
k oB
O
Al
Si
Ti
V
Cr
Fe
Co
Ni
C
Zr NbMo
Pd
HfTa
W Re
OsPt
Au Th
U
B
Hf
Mn
Cu
Ga
Ge
Y
Sn Ce
He Ne Ar Kr Xe Rn

221
Fig. A15. Periodic correlation dependence of the distribution coefficients of theadmixtures in yttrium, lanthanum and cerium on the proton number of the admixture.
0.001
0.01
0.1
1
10
0 10 20 30 40 50 60 70 80 90 100
ko
B
O
Mg
TiV
Fe
Ni
Y
Zr
Nb
InHf
Tb
Dy
GdHo
Er
Pb
Ta
Th
Sc
Sr
Ge
Te
Sn
La
CeSm
Nd
Pu
C
Y
0.001
0.01
0.1
1
10
0 10 20 30 40 50 60 70 80 90 100
k oB
V
YNb
Cd In
Gd
Tl Bi
ThPu
C
La
Sc
MnFe
Ga
Ag
CeLa
NdMg Ca
SmH
0.001
0.01
0.1
1
10
Proton number
k oB
Mg
Ti
V
Fe
Y
Ru Eu
Tl
GdTh
N
Ce
Sc
Mn
CuAg
In
Ce
PrLaTmSm
Pu
Bi
He Ne Ar Kr Xe Rn
SiC
H
Cr

222
Fig. A16. Periodic correlation dependence of the distribution coefficients of theadmixtures in uranium, plutonium and thorium on the proton number of the admixture.
0.001
0.01
0.1
1
10
0 10 20 30 40 50 60 70 80 90 100
ko
B
Al
Ti
V
Si
Fe
Co
C
ZrNb
Mo
RuRh
Hf
Ta
WRe
Os
Ir
Pt
Au
Th
U
O
Be
Mn
Ni
Ge Pd
Ce
Pu
U
H Np
Cr
0.001
0.01
0.1
1
10
0 10 20 30 40 50 60 70 80 90 100
k oB Si
Ti
Fe
Co
Ni
Zr
Ru
Rh
Hf
Sm
Pt
Os
ThU
Al
Pu
Sc
Mn
Cu
Ga
Pd
Ce
NdNp
PuAm
Mg
0.001
0.01
0.1
1
10
Proton number
k oB
Al
V
Mn
N
Zr
Pd
Rh
Nb
Ru
Hf
Ta
Pr
Re
Lu
Pt
Au
Th
UC
Th
Be
ScY
In
La
Ce
Nd
Pb
Pu
Gd
Tb Dy
HoEr
He Ne Ar Kr Xe Rn

223
Fig. A17. Periodic correlation dependence of the distribution coefficients of theadmixtures in osmium, iridium and platinum on the proton number of the admixture.
0.001
0.01
0.1
1
10
0 10 20 30 40 50 60 70 80 90 100
ko
B
Ti ZrNb
Mo Ru
Hf
Ta
WOs
Ir
U
Os
C
VFe
Co
Pd
AlRh
Re
Pt
LaY
NiScB
Pr
0.001
0.01
0.1
1
10
0 10 20 30 40 50 60 70 80 90 100
k oB
Cr NbMo Ru
RhHf
TaW
ReOs
IrPt
U
Ti
Ir
Fe
CoCu Zr Ag
CAu
Mg
Pd
Sc
Al
Y
Bi
YbCe
La
0.001
0.01
0.1
1
10
Proton number
k oB
Al
Si
Ti V Cr
Fe Ni
Zr
NbMo
RuRh
Pd
Ta
WRe
Ir PtAu
U
Be
Pt
MnCuCo
Sb
AgSn
Gd
He Ne Ar Kr Xe Rn
C
YSc
B
Bi
Hf
Ge LaPuTh

224

225
Index
A
absorbance 166absorption spectrophotometry 166activation analysis 169adsorbate 16adsorbent 16adsorption 16amalgamation 139anodic dissolution 137atomic absorption spectrometry 167atomic emission spectroscopy 165atomic fluorescence spectrometry 168Auger electron spectrometry 168azeotropic point 106
B
back reflection method 178Berg–Barrett method 178bipolar mercury electrode 140Bragg equation 178Bridgman method 86Bridgman–Stockbarger method 88Buris–Stockman–Dillon method 80Burton–Prim–Slichter equation 80, 94
C
carbonyl method 124cementation 136chemical stability 21chemical transport reactions 118chromatography 24
adsorption 25gel 25ion exchange 25separation 25
Clausius–Clayperon equation 99coefficient of relative volatility 109colorimetric methods 166concentration exchange constant 22
concentration of admixtures 173condensation 99conductivity 7
electron 7hole 7
counter-ions 18critical degrees of deformation 96critical dissolution 29crystallisation 43
directional 73from aqueous solutions 43from melts 43, 48, 84
Czochralski method 86Czochralski solidification equipment 92
D
Dash method 93Debye–Scherrer method 178deoxidation 161depolarisation 135desorption 20diffusion kinetics 127, 130dimensionless mass transfer
coefficient 82distillation
by synthesis and dissociation 120by a reversible endothermic exchange
reaction 116by chemical transport reactions 115through sub-compounds 118
distribution coefficient of ionexchange 22
distribution number 108, 114
E
effective distribution coefficient 66electric source 166electrochemical kinetics 131electrochemical voltage series 126electrolyser 140

226
electrolysis 126electrolytic method 126electrolytic precipitation 126electrolytic refining 126, 138electrolytic voltage series 126electron beam vacuum melting 161electron beam zone melting 148electron microanalyser 168electron microanalysis 168electron microscopy 176electrotransport 142elution 20emission spectroscopy 165equivalent point 164evaporation 99exchange capacity 20extraction 28, 37
liquid 28
F
Faraday constant 128Faraday law 127flame source 166floating crucible method 94floating zone method 84, 90fluorescence spectroscopy 167fluorimetry 168fractional condensation 172freezing-out 47
G
gas chromatography 172Geiger–Müller counter 170Gibbs isobaric–isothermal potential 49Gibbs thermodynamic potential 49Gibbs–Helmholtz equation 49gravimetry 164
H
Hall constant 174Hall voltage 174Hayes–Chipman criterion 54high-voltage electrodialysis 152hole conductivity 174
I
indirect distillation 116instrumental activation analysis 171internal electrolysis 136interphase distribution coefficient 64iodide process 120ion exchange 16, 18ion exchangers
amphoteric 19artificially produced 19cation 19
ionex 18ionisation chamber 170isobaric potential 154isoliquidus temperature 70isothermal solubility curves 45isotope purity 5isotopic dilution 169
J
Jackson concept 49
K
Kirchoff law 167
L
Lambert–Beer law 166Lang method 178lanthanides 124Laue method 178local microanalysis 168
M
mass spectrometry 169mass spectrometry of secondary ions
169Matthiessen law 175melting entropy 49metallic glasses 98method of the starting charge 94mixing temperature 29molar enthalpy of evaporation 100molar free enthalpy 49molecular emission spectrometry 165
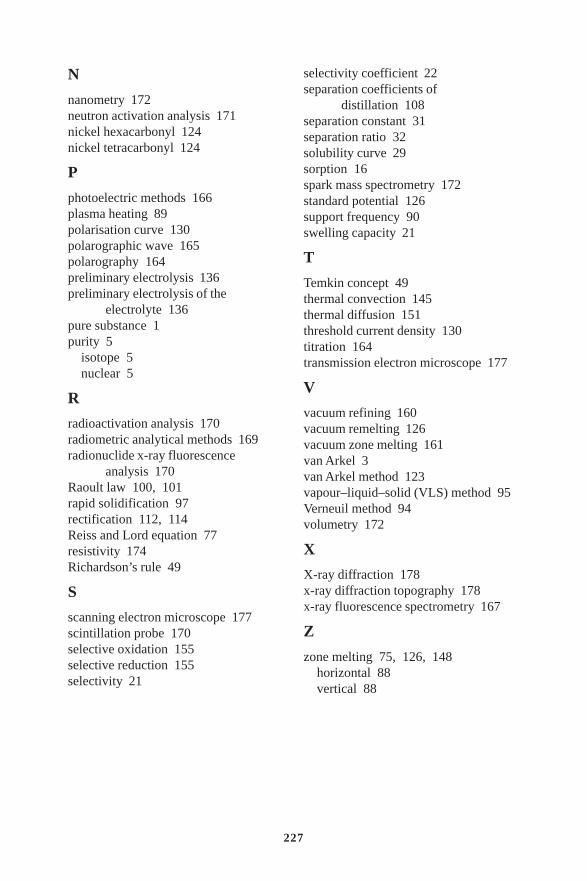
227
N
nanometry 172neutron activation analysis 171nickel hexacarbonyl 124nickel tetracarbonyl 124
P
photoelectric methods 166plasma heating 89polarisation curve 130polarographic wave 165polarography 164preliminary electrolysis 136preliminary electrolysis of the
electrolyte 136pure substance 1purity 5
isotope 5nuclear 5
R
radioactivation analysis 170radiometric analytical methods 169radionuclide x-ray fluorescence
analysis 170Raoult law 100, 101rapid solidification 97rectification 112, 114Reiss and Lord equation 77resistivity 174Richardson’s rule 49
S
scanning electron microscope 177scintillation probe 170selective oxidation 155selective reduction 155selectivity 21
selectivity coefficient 22separation coefficients of
distillation 108separation constant 31separation ratio 32solubility curve 29sorption 16spark mass spectrometry 172standard potential 126support frequency 90swelling capacity 21
T
Temkin concept 49thermal convection 145thermal diffusion 151threshold current density 130titration 164transmission electron microscope 177
V
vacuum refining 160vacuum remelting 126vacuum zone melting 161van Arkel 3van Arkel method 123vapour–liquid–solid (VLS) method 95Verneuil method 94volumetry 172
X
X-ray diffraction 178x-ray diffraction topography 178x-ray fluorescence spectrometry 167
Z
zone melting 75, 126, 148horizontal 88vertical 88