vtt symposium 266 - teknologiasta tulosta symposium 266 keywords: contamination ... changes to iso...
TRANSCRIPT

VTT SYMPOSIUM 266
41st R3-Nordic SymposiumCleanroom technology, contamination control and cleaning


VTT SYMPOSIUM 266 Keywords: Contamination control, cleanroom, air, hygiene, cleaning, disinfection, cleanroom clothing, hygi-enic design, pharmaceutical industry, electronics, hospital, operating theatre, food industry
41st R3-Nordic Symposium Cleanroom technology, contamination
control and cleaning
Dipoli, Espoo, Finland, May 25–26, 2010
Edited by Gun Wirtanen & Satu Salo
Program committee: Kari Leonsaari, Sirkka Malmioja, Antti Mikkola, Raimo Pärssinen & Satu Salo
Organised by R3-Nordic
The Nordic Society of Cleanroom Technology

ISBN 978-951-38-7595-4 (soft back ed.) ISSN 0357–9387 (soft back ed.)
ISBN 978-951-38-7596-1 (URL: http://www.vtt.fi/publications/index.jsp) ISSN 1455–0873 (URL: http://www.vtt.fi/publications/index.jsp)
Copyright © VTT 2010
JULKAISIJA – UTGIVARE – PUBLISHER
VTT, Vuorimiehentie 5, PL 1000, 02044 VTT puh. vaihde 020 722 111, faksi 020 722 4374
VTT, Bergsmansvägen 5, PB 1000, 02044 VTT tel. växel 020 722 111, fax 020 722 4374
VTT Technical Research Centre of Finland Vuorimiehentie 5, P.O. Box 1000, FI-02044 VTT, Finland phone internat. +358 20 722 111, fax + 358 20 722 4374
Cover photos (three round photos): Nordic Society of Cleanroom Technology Edita Prima Oy, Helsinki 2010

3
Preface R3-Nordic, the Nordic Society of Cleanroom Technology, is a non-profit, inde-pendent association for the promotion of new technologies in cleanroom tech-nology and contamination control in the Nordic countries. The aim of the annual R3-Nordic Symposium is to provide knowledge within the pharmaceutical, food and electronic industries as well as hospitals. The topics at the 41st R3-Nordic Contamination Control Symposium are hygienic design, ergonomics, planning, auditing, sterilization techniques, rapid test methods, risk assessment, macro-particles, cleaning of clean rooms, protective clothing, monitoring techniques, contamination control, cleanroom technology and management, regulations and standards in clean and controlled rooms. The venue of the annual symposium 2010 is Dipoli in Espoo.
The persons involved in the Programme Committee are Kari Leonsaari, Sirkka Malmioja, Antti Mikkola, Raimo Pärssinen and Satu Salo. The editors of the proceedings would like to express their gratitude to the speakers for preparing the abstracts published in the journal Renhetsteknik as well as the extended ab-stracts or full papers published in these proceedings. We wish that this event will be fruitful in giving new ideas to all participants and exhibitors.

4
Contents
Preface 3
PLENARY SESSION 7
Aerosols Basics for Better Air Quality 8 Kaarle Hämeri 9
PIC/S Guide to Good Practices for the Preparation of Medicinal Products in Health Establishments (PE 010-3) – A GMP for Hospital Pharmacies? 10 Kirsti Torniainen
Viral Risks 11 Pentti Huovinen
Hygiene in the Food and Clinical Sector – Why Are They Not the Same? 12 John Holah
Ergonomics and Cleanroom Work 16 Susanna Järvelin
PHARMACEUTICAL SESSION 25
Lean Engineering for Pharmaceutical Plants – A Praxis Oriented Approach for a Lean Engineering and Realization Process 27 Rüdiger Mechsner
Start-up of New Modern Facility (Case) 28 Maija Hietava-Lorenzi
Inspection Observations 31 Ritva Haikala
Applications of Single-use Systems and Technologies in Biopharmaceutical Processes 32 Bruce Rawlings
Isolator for Sterility Testing Operation: Process Description and Validation 34 Kasper Carlsen
IMD Technology with an Example of a Successful Application 39 Gilberto Dalmaso
Risk Management in Pharma and Medical Device Industry 48 Pasi Grönroos

5
A Comparison of Data Acquired from a Test Chamber during Simultaneous Measurements by Standard DPC, STA-Sampler and IMD-A 52 Bengt Ljungqvist and Berit Reinmüller
Alternative Method for Airborne Contamination Control in Only Few Hours 60 Diane de Pastre, Quitterie Desonqueres and Esmeralda Carvalho
Changes Affecting EU GMP and the FDA’s CGMP Non-viable Particle Cleanliness in Cleanrooms 61 Tony Harrison
Maintaining a Spore Free Cleanroom 67 Karen Rossington
ELECTRONICS SESSION 69
Control of Macroparticles in a Clean Manufacturing Environment 71 Pasi Tamminen
Changes to ISO 14644 for Cleanrooms 94 Tony Harrison
Nano- and Micro Structured Plastic Thin Film for Optical and Functional Surface Applications 102 Samuli Siitonen and Valtteri Kalima
GENERAL SESSION 105
HEPA Filter Integrity Testing: ISO 14644-3 and Real Practice 107 Alexander Fedotov
ISO 21501-4 the New Standard for Calibration of Airborne Particle Counters for Clean Spaces – Will My Existing Particle Counter Comply 120 Patrik Bengtsson
Design of Purified Water Systems and Its Sampling for Modern On-line Analyzing Technology 121 Christoffer Meyer
How to Clean Clean? 122 Leila Kakko
Cleanroom Design and Construction 130 Jukka Vasara
HOSPITAL SESSION 135
High Tech Hospital 137 Salme Nurmi, Seppo Enbom, Kimmo Heinonen, Gun Wirtanen, Satu Salo and Hannu Salmela

6
Clothing Systems Used in Operating Rooms – A Question of Patient Safety 142 Bengt Ljungqvist and Berit Reinmüller
Contamination Risks due to Door Openings in Operating Rooms 148 Bengt Ljungqvist, Berit Reinmüller, Jan Gustén, Linda Gustén and Johan Nordenadler
Some Observations on the Impact of Clothing Systems on the Concentration of Airborne Bacteria-Carrying Particles during Surgery 161 Jonas Hallberg Borgqvist
Hygiene Monitoring with the Portable Microbe Enrichment Unit (PMEU) 164 Elias Hakalehto
Cleanrooms and Clean Zones in Hospitals 177 Alexander Fedotov
The Effects of using a Particle Counter in a Cytotoxic Environment. Is It Dangerous for the Operator? 191 Nikolaj Emil Damm
Gowning in Operating Room – Standards and experience 193 Dennis Andersen
Larger Climatised Zoned Ultra Clean Air Will be the Future in Modern Operating Theatres 194 Kjell Rösjö
FOOD SESSION 197
VTT's Renovated Pilot Plant Facilities – New Possibilities for Cleaner Food Processing and Research 199 Juhani Sibakov, Mai Järvinen, Satu Salo and Gun Wirtanen
Complementary Assay in Hygiene Testing – Chemical Residue Test 208 Juha Lappalainen
Environmental Listeria Plate Petrifilms in Detection of Listeria species from Environmental Samples 210 Liina Kutsar, Satu Salo and Gun Wirtanen
The BD BACTEC System for Automatic Culture, Reading and Reporting of Results of Sterile Samples 221 Ann-Charlotte Merkel
Laboratory Study of Garment Treatment using Ozone 222 Savvas Yennaris

7
PLENARY SESSION

Aerosols Basics for Better Air Quality
8

9
Aerosols Basics for Better Air Quality
Kaarle Hämeri Department of Physics, University of Helsinki, Finland
PIC/S Guide to Good Practices for the Preparation of Medicinal Products in Health Establishments (PE 010-3) – A GMP for Hospital Pharmacies?
10
PIC/S Guide to Good Practices for the Preparation of Medicinal Products in Health
Establishments (PE 010-3) – A GMP for Hospital Pharmacies?
Kirsti Torniainen The Turku University Hospital, Finland

Viral Risks
11
Viral Risks
Pentti Huovinen National institute for health and welfare, Finland
Hygiene in the Food and Clinical Sector – Why Are They Not the Same?
12
Hygiene in the Food and Clinical Sector – Why Are They Not the Same?
John Holah Campden BRI, U.K.
Abstract
This presentation intends to compare and contrast the actions of the food and clinical sectors in controlling contamination; for the food industry this represents pathogens in food products, for the clinical sector, healthcare acquired infections (HCAI’s). Firstly, however, a confession. Whilst I have over 25 years experience in the food sector my knowledge of the clinical sector needs expanding!
Poor practices in both the clinical and food sectors can unfortunately cost lives. The food industry is perhaps under more pressure, however, as food poi-soning incidents may lead to the loss of confidence in the brand and, ultimately, loss of the business. Prevention of contamination to the patient and food product is thus critical, which has lead in the food industry to the concept of ‘getting it right first time’.
The fundamental question is should the approach to hygiene by these two sec-tors be any different? A food factory has an input of raw materials which it turns into a safe, wholesome food product. A hospital has an input of an ill patient that is then successfully cured. They both have an infrastructure (buildings, equip-ment, staff) and good manufacturing/clinical practices to maintain them (clean-ing and disinfection, personal hygiene, maintenance). They both have a process (food production/clinical procedures) and quality assurance mechanisms to en-sure its success.
The food industry is predominantly governed by hazard analysis, risk assess-ment and control practices, indeed this is legally required and is typified by Haz-ard Analysis and Critical Control Point (HACCP). This has lead to the assump-tion that all possible vectors of contamination are important and should be con-

Hygiene in the Food and Clinical Sector – Why Are They Not the Same?
13
trolled. In fact, the question that many ready-to-eat (RTE) food manufacturers are asking is how can I rank the importance of the transfer vectors and thus how can I maximise my product safety control whilst maintaining an overview of costs. Recent Campden BRI studies have indicated a mechanism for how this can be best undertaken. The clinical approach appears sporadic with no agree-ment of the primary vectors of contamination to the patient other than via hand transfer of transient pathogens. In the UK each Trust manager for infection con-trol has their own views and undertakes control of environmental sources of contamination (primarily surfaces and air) dependent on their own assessment of risk. Only when a vector of contamination has been ‘demonstrated’ to be impor-tant in the control of HCAI’s do infection control staff adopt control programmes.
The food industry is heavily regulated at a European level. The European Regulation EC 852/2004 on the hygiene of foodstuffs provides requirements on both the design of food premises and the good manufacturing/hygiene practices that should be adopted to maintain it. The Machinery Safety Directive 2006/42/EC requires that all machines and associated equipment used in food processing (and in pharmaceutical and cosmetic manufacturing) should be hy-gienically designed and cleanable such that they should not transfer hazards to the consumers of products processed. Finally, the Materials in contact with foodstuffs EC/1935/2004 regulations are beginning to define what is an accept-able material to be in contact with the food during manufacture and sale. There appears to be little in the clinical sector with only the Council Directive 93/42/EEC concerning medical devices making broad statements such as The devices and manufacturing processes must be designed in such a way as to eliminate or reduce as far as possible the risk of infection to the patient, user and third parties and the choice of materials used, particularly as regards toxic-ity .. and compatibility with tissues, cells and body fluids. Over and above this, the food industry has many sources of international information and guidance on hygienic infrastructure, from e.g. CODEX ALIMENTARIUS and the European Hygienic Engineering Design Group.
With respect to hazard control mechanisms, both cleaning and disinfection and personnel hygiene programmes are practiced in food and healthcare, though the approaches are very different. In the food industry, where the product type allows, cleaning and disinfection is primarily a wet process, which has been established as the most effective in reducing soiling and microbial contamina-tion. In UK hospital cleaning is predominantly dry using microfibre cloths, a technique that could possibly be adopted for dry food producers. Disinfection is

Hygiene in the Food and Clinical Sector – Why Are They Not the Same?
14
very different, however. It would be seen as inconceivable in the food industry that disinfection of food plants was not essential, whilst many infection control specialists in the healthcare sector believe that the value of disinfection is ques-tionable. The clinical sector has, however, pioneered the adoption of techniques designed to eliminate HCAI’s in side wards, within 4 hours, to expedite the fast turn around of patient beds. Techniques using vapourised hydrogen peroxide and ozone are now being trialled in the UK food industry for ‘wholeroom’ disinfection.
The approach to the monitoring and verification of cleaning and disinfection programmes is also very different. The clinical sector has relied on ‘visual’ as-sessment of cleaning; though there may be some differentiation between the frequency of assessments in different areas of perceived clinical risk e.g. operat-ing theatres will be assessed more frequently than public areas. For the food industry, assessment of cleaning and/or disinfection by ATP, total viable count (TVC) and presence of pathogens is virtually mandatory, particularly in RTE food manufacture.
Personnel hygiene would appear to be the same in both sectors, with the food industry having adopted the best, 6 step handwash approach from the work of Ayliff et al. back in 1976. There are certainly differences in training and compli-ance, however. Food employees undertake stringent induction training in many food manufacturers where the use of ultraviolet light sensitive creams is finding favour in demonstrating the effectiveness of handwashing. Compliance is very high in terms of entering food manufacturing areas, probably in excess of 95% and has to be monitored for audit purposes. Compliance within production areas for hand hygiene procedures following the touching of potentially contaminated surfaces is, however, unknown. This contrast with the clinical sector where compliance can be below 50%, though the use of more automated handwash systems could improve this in the future.
Plant maintenance procedures are becoming more complex in the food sector with food factories typically having to purchase replacement materials that are certified food safe, recording where they are used for traceability, recording the number of tools and materials taken to and, more importantly, leaving the job, and a sign off procedure to say that the plant is clean and free of hazards such that production can recommence.
In summary, the food industry approach to food safety is built on legislative control, conservatism and collectivism. Food companies, retailers, academics and often government agencies collectively agree best practice, which is then implemented in food manufacturing. This is then audited by both health inspec-

Hygiene in the Food and Clinical Sector – Why Are They Not the Same?
15
tors and retailers to ensure best practices are maintained. At a retail level, best practices are agreed at a world level via the Global Food Safety Initiative (http://www.mygfsi.com/) and retail audit bodies are beginning the process of bringing factories that supply major retailers up to a minimal best practice level. The concept of adopting food manufacturing best practices can also help in a due diligence defence in court to any food safety charges
This conservatism, however, stifles innovation, with the food industry reluc-tant to take on new technologies unless they have been agreed collectively. In-novation is strong in the health sector, however, and in view of the lack of hygi-enic design/practices legislation and guidance, is seen as the main way in which HCAI’s can be reduced in the future. In the UK government funding initiatives are in place to encourage the creation of ideas for improving practices and the development of new technologies to facilitate this. The government has also established a Rapid Review Panel (http://www.hpa.org.uk/ProductsServices/ InfectiousDiseases/ServicesActivities/RapidReviewPanel/) to assess new tech-nologies such that potentially useful ones are adopted and trialed by showcase hospitals.
But surely there can only be one conclusion. Both sectors need to further en-force a programme where:
Hazards are identified
An infrastructure is created in which they can be controlled
The routes of contamination transfer to the product/patient are understood
Appropriate hygienic control practices are applied and validated.
Monitoring and verification programmes are in place to ensure that control prac-tices are effective.
It is hoped that forums such as this R3 Nordic Symposium may help endorse and foster this message.

Ergonomics and Cleanroom Work
16
Ergonomics and Cleanroom Work
Susanna Järvelin Faculty of Health Sciences, University of Eastern Finland, Finland
Abstract
According to the International Ergonomics Association (IEA) ergonomics is the scientific discipline concerned with the understanding of interactions among humans and other elements of a system. Ergonomics is the profession that ap-plies theory, principles, data and methods to optimize human well-being and overall system performance. It is a multidisciplinary field that is based on physi-ology, psychology and technical sciences. In ergonomics, work is observed sys-tematically, and interaction between people and work method is studied. The aim of ergonomics is to make work and work conditions to correspond with physical, psychological and social qualities together with the needs of employ-ees. As a result, work ability, health and occupational competence are enhanced and maintained, as well as injuries and sick leaves decreased. Clean room as a work environment is a challenge to ergonomics because of the controlled and standardized conditions. This emphasizes the importance of designing and pay attention to ergonomics during it.
1. What is ergonomics?
Ergonomics is the application of scientific information concentrating on design-ing systems, processes, equipment and environments for human use. This matches the job to the worker and the product to the users (Pheasant 1991, IEA 2000, McPhee 2005). Ergonomics is a systems-oriented discipline which now extends across all aspects of human activity (IEA 2000).
Ergonomics can be defined as a study of human work, a science of work. The word “ergonomics” is derived from the Greek words ergon (work) and nomos
Ergonomics and Cleanroom Work
17
(laws). Other terms used, especially in the United States, are “human factors engineering” or “human factors” (Pheasant 1991, Dul and Weerdmeester 1994, IEA 2000).
Ergonomics is the profession that applies theory, principles and the design of the system in order to optimize human well-being and overall system perform-ance (IEA 2000). The aim of ergonomics is to make work and work conditions to correspond with physical, psychological and social qualities together with the needs of employees. As a result work is efficient, healthy and safe, and the prod-ucts are comfortable and easy to use. At the individual level, work ability, health and occupational competence are improved and maintained, as well as injuries and sick leaves are decreased (Pheasant 1991, McPhee 2005).
There are three domains of specialization within the ergonomics, which repre-sent deeper competencies in specific human attributes or characteristics in hu-man interaction. The first domain is physical ergonomics, which is concerned with human anatomical, anthropometric, physiological and biomechanical char-acteristics as they are related to physical activity. Relevant topics include work-ing postures, material handling, repetitive movements, work related muscu-loskeletal disorders, workplace layout, and safety and health (IEA 2000).
Second domain is cognitive ergonomics, which is concerned with mental processes such as perception, memory, reasoning, and motor response, as they affect interactions between humans and other elements of a system. The most significant topics are mental workload, decision-making, skilled performance, human-computer interaction, human reliability, work stress and training as these may relate to human-system design (IEA 2000).
The third domain is organizational ergonomics. It is concerned with the opti-mization of sociotechnical systems, including their organizational structures, policies, and processes. Relevant topics include communication, crew resource management, work design, design of working times, teamwork, participatory design, community ergonomics, cooperative work, new work paradigms, virtual organizations, telework, and quality management (IEA 2000).
2. Clean room work and ergonomics
According to McFadden (2010), clean room is a controlled environment where products are manufactured. Clean rooms are planned and manufactured using strict protocol and methods. They are frequently found in electronics, pharma-ceutical, biopharmaceutical, medical device industries and other critical manu-
Ergonomics and Cleanroom Work
18
facturing environments. To avoid contamination of the products there are strict rules and procedures to follow (McFadden 2010). These require high occupa-tional competence from the workers and continuous concentration to tasks when working in clean room facilities.
Clean room as a work environment is a challenge to ergonomics because of the controlled and standardized conditions. Therefore the importance of work design and attention to the ergonomics is emphasized. So far only limited infor-mation is available about this. Mostly studies of ergonomics in clean room work-ing have been performed in occupational health care and the results have rarely been reported. Even if there are no results to be used, common knowledge and principles of ergonomics can be enforced also in the context of clean room ergo-nomics.
3. Stress factors at work
The nature of stress at work can be physical, physiological, or social. The aim is to achieve a balance between stress factors at work and the individual character-istics of the employee with the help of ergonomics. Strain at work is influenced by stress factors (the source of stress) and their magnitude, as well as individual characteristics and health (Ilmarinen et al. 2008). When the physical, mental and social strains are adequate, the employee is able to do ones job without prob-lems, and the work itself can maintain the employee’s performance. Harmful or inadequate strain is due to too much or too little stress, respectively. Typically, several stress factors combined produce over-strain but sometimes even one single factor can be too much. Inadequate strain can decrease worker’s ability to function and when prolonged even lead to work related sicknesses that are commonly connected to the musculoskeletal system. Furthermore, inadequate strain can decrease productivity and quality of work (Peltomäki et al. 2002, Il-marinen et al. 2008).
3.1 Physical stress factors
The physical stress factors at work are connected to a work postures and move-ments, when muscle strength are needed to perform at work tasks. Physical strain is caused by muscle work that is required in different stages of work. The volume of strain is affected by the extent of muscle mass, the quality and dura-tion of muscle labour, the application of force, and the individual characteristics

Ergonomics and Cleanroom Work
19
of an employee. Also a poorly organised work can lead to over-strain (Peltomäki et al. 2002, McPhee 2005). If the stress is adapted to a worker’s ability of func-tion, the body is able to adapt to the stress and to recover afterwards. If the stress is overbearing compared to the ability of function, an employee suffers from fatigue and recovery is slowed down. Fatigue is excessive, when the body can-not recover from the work during leisure time and before the start of a next work shift (McPhee 2005).
The physical stress factors at work are physically demanding work, handling of heavy loads, static and difficult work postures, continuous sitting or standing and repetitive work. Also physical, chemical and biological risk factors are in-cluded to physical stress factors at work. All these factors can be found in clean room work.
There are physically demanding work tasks in the clean room, for example in cleaning. Physical over-strain can be prevented by taking into consideration the ergonomics of work and individual characteristics of an employee. The aim of ergonomic action is to develop the working environment, equipment, methods, and the organisation of work. The target of this action is to minimize the volume of static muscle work and repetitive work. This can be achieved by the adequate working methods under the guidance of an occupational physiotherapist and by keeping breaks regularly during the work day.
In the clean room work there are many difficult working postures and move-ments which may induce musculoskeletal symptoms and disorders if they are not noticed. Strain caused by unsuitable work postures is related to static muscle work that puts strain on the musculoskeletal system. Jobs that involve static work postures are typically office work and electronic industry. In the clean room work the static and difficult working positions may commonly occur when working by the laminar flow hood.
In general, the varied working postures are better than the fixed ones (Pheas-ant 1991). To minimize the physical strain caused by static and difficult working positions in clean room work, it is substantial to take notice to the height of the working surfaces, which should be adjustable when possible (e.g. the adjustable laminar flow hood). Also it is important to prop elbows up on the table or on the arm rest. When continuous standing is needed, one device to minimize the harm-ful strain is to use a plastic carpet under feet to make surface softer. Also, it is important to pay attention to the selection of the working shoes.
Jobs or tasks are considered to be repetitive work when small muscle groups are working and continuously leads to a condition that equals static tension. Re-
Ergonomics and Cleanroom Work
20
petitive work occurs typically in food and trading industry, as well as in stor-ages. It appears for example in assemblage and in dropping work. The proper size and design of the tools and mini pauses are essential in the repetitive work. The task or job rotations are important for the diversify of workers´ activities and to limit physical overuse symptoms (McPhee 2005).
However, ergonomic measures are not sufficient enough, if the employee does not posses adequate professional skills and individual charasteristics. Education and efficient orientation as well as taking care of physical health guaranteeing good condition of the blood circulation and musculoskeletal systems, helps to sustain work related strains. The best results are achieved by systematic actions that maintain workability, and by focusing the attention on ergonomics and the functionality of the work community, and by trying to enhance the resources and professional skills of the employees. In the clean room work the significance of design of work environment and organizing the work are emphasized when try-ing to minimize the harmful work strain.
3.2 Psychological and social strain at work
Apart from physical work strain, harmful work strain can also be psychological or social over- or under -strain. The psychological or social over strain is due to various kinds of stress factors at work. People experience work related stress when they perceive that there is an imbalance between the demands and the resources they are able to cope with. These demands can be work-related or personal, or both. Although the experience of stress is psychological, stress also affects people’s physical health (Cox et al. 2000, McPhee 2005).
The stress is important for coping daily stressful events successfully, but it is also important to be able to recover from the stress. When stress is protracted, it causes a risk of various health problems (McEwen 1998, Lundberg 2005, Kivimäki et al. 2006). At the individual level the signs of stress may be ex-pressed by increased feelings of anxiety, depression, aggression or confusion. Also physical symptoms like increased blood pressure, heart rate and muscle tension, as well as back problems and headaches may exist. In addition smoking and drinking alcohol and sleep disorders may be increased and physical activity may decrease. Stress may also induce changes in behaviour. At the organisa-tional level absenteeism may occur, as well as high staff turnover, poor time-keeping, disciplinary problems, harassment, reduced productivity, accidents,
Ergonomics and Cleanroom Work
21
errors, and increased costs from compensation or health care (Cox et al. 2000, McPhee 2005).
The psychological stress factors at work can be derived from work tasks, work environment, employment or work organization. Everything that complicates and distracts work can be seen as psychologically straining. The psychological stress factors at work task contents can be responsibility for people, attention and concentration to work, busy and demanding working pace, commitment to work and post, demanding job and frustration (Cox et al. 2000).
Risks for accidents and health problems at work environment and working alone and isolated are psychological stress factors, as well as shift work or un-comfortable work hours, unsatisfactory salary and ambivalence about attachment at the employment content. At organizational context stress can be derived from communication problems, poor atmosphere and human relationships, poor man-agement and inadequate feedback. Also the objectives of work can be unclear and the possibilities to influence to work are limited and responsibility should be taken on factors that cannot be influenced (Cox et al. 2000).
There are also many psychological stress factors at the clean room work. The work tasks and aseptics require continuous attention and concentration. For ex-ample, there is a considerable responsibility for human life in pharmaceutical industry. Also time pressure, a brute and noisy work environment and working isolated are often suggested to be psychological stress factors in the clean room work. To minimize the psychological over strain it is necessary to assure the worker’s sufficient occupational competence to clean room working. The ade-quate orientation to clean room work and co-operation with occupational health care professionals is essential. The regular conversations with superior and em-ployees make possible to identify the symptom of stress at an early stage.
Social work strain is composed of work atmosphere, human relations, social rules and values, and leadership manners. The more common stress factors are solitary work or over-strain in human relations in customer service occupations, poor communication and co-operation, the lack of justice, and continuously in-creasing harassment and distraction situations. Shift work and night shifts have an impact on personal life and make a risk factor for health. Positive interaction at work, reasonable working demands, and individual means to cope are factors that help to manage at work.
In the clean room work social work strain is commonly a consequence of working alone or poor communication possibilities.
Ergonomics and Cleanroom Work
22
4. Conclusion
There are many physical, psychological and social stress factors in the clean room work. If they are ignored, the quality and productivity of work may de-crease. At the same time employee may have musculoskeletal or mental symp-toms and diseases which lead to sick leave or disability to work. All these con-sequences cause expenses to the employer. It is possible to influence to the stress factors by good planning and designing of work environments and tasks. Also the work surfaces and equipments should be appropriate for the job, as well as the occupational competence of the workers. The breaks during work day should not be forgotten. They are significant for decreasing harmful work load.
The recognition of over-strain situations, their prevention, and early interfer-ence decrease sick leaves, enhances enjoyment at work, and increase productiv-ity of work. Policy, work safety, and occupational health organisations play an essential role in factors connected to work strain. With tight co-operation and versatile working manners the whole work community can be developed with the help of ergonomics, work physiology and work psychology. In the regulation and prevention of work strain, attention should be focused on developing work-ing conditions, and supporting the employee’s ability to function. Permanent results are only achieved if both the employer and the employee invest on ac-tions that maintain work ability.
Ergonomics can be noticed even in the standardized and controlled conditions in the clean room. This requires co-operation with employer, employee and er-gonomists. It is important to remember that consideration of ergonomics is not collided with the requirements of the work productivity. The ergonomics is also good for business!
References
Cox T, Griffiths A, Rial-Gonzalez E. 2000. Research on Work-related Stress. Report of
European Agency for Safety and Health at Work. 2010. Stress. http://osha.europa.eu/en/publications/reports/203 (23.2.2010)
Dul J, Weerdmeester B. 1994. Ergonomics for beginners. A quick reference guide. Taylor Francis. London.

Ergonomics and Cleanroom Work
23
Ilmarinen J, Gould R, Järvikoski A, Järvisalo J. 2008. Diversity of Work Ability. In: Gould
R, Ilmarinen J, Järvisalo J, Koskinen S. (Eds.) Dimensions of Work ability. Re-
sults of the Health 2000 Survey. Finnish Centre for Pensions. The Social Insur-
ance Institution. National Public Health Institute. Finnish Institute of Occupa-tional Health. Vaasa. Pp. 13–24.
International Ergonomics Association. 2000. http://www.iea.cc/browse.php?contID=what_ is_ergonomics (5.1.2010)
Kivimäki M, Leino-Arjas P, Kaila-Kangas L, Luukkonen R, Vahtera J, Elovainio M, Härmä
M, Kirjonen J. Is Incomplete Recovery From Work a Risk Marker of Cardiovas-
cular Death? Prospective Evidence from Industrial Employees. Psychosom Med 2006; 68:402–407.
Lundberg U. Stress hormones in health and illness: The roles of work and gender. Psy-choneuroendocrinology 2005: 30; 1017–1021.
McEwen B. Protecting and damaging effects of stress mediators. N Engl J Med 1998; 338: 171–179.
McFadden R. 2010. A Basic Introduction to clean rooms. http://www.coastwidelabs.com/ Technical%20Articles/Cleaning%20the%20Cleanroom.htm (19.2.2010)
McPhee B. 2005. Practical Ergonomics. Application of ergonomics principles in the work-place.
Peltomäki P, Hussi T, Julin H, Launis K, Liira J, Räsänen K. 2002. Maintenance of work
ability research and assessment: Summaries. Ministry of Social Affairs and
health. Finnish Institute of Occupational Health. Social Insurance Institution. Re-port 7. Helsinki.
Pheasant S. 1991. Ergonomics, work and health. Macmillan Press ltd.

Ergonomics and Cleanroom Work
24
PHARMACEUTICAL SESSION
25
PHARMACEUTICAL SESSION

PHARMACEUTICAL SESSION
26
Lean Engineering for Pharmaceutical Plants – A Praxis Oriented Approach for a Lean Engineering and Realization Process
27
Lean Engineering for Pharmaceutical Plants – A Praxis Oriented Approach for a Lean
Engineering and Realization Process
Rüdiger Mechsner M+W Process Industries, Swizerland
Abstract
To plan and to operate a pharmaceutical venture is an investment and therefore under stringent economic, technical and regulatory pressure.
Same as for manufacturing itself, also for engineering, time, money and re-sources have to be optimized as far as possible. Applying “lean” means to estab-lish a holistic mindset that helps to systematically identify and eliminating wastes. This presentation considers the principles of how to apply this mindset on engineering and realisation of pharmaceutical installations. The most com-mon traps that usually create wastes are shown. An analysis of the lifecycle of engineering demonstrates the advantages of a rolling planning that automatically realizes necessary corrections of work in progress; this in contrary to a so called ballistic behaviour that requires the maximum accuracy in the beginning of planning tasks and its progressing work is not being changed until finished.
The maxim of putting the engineering itself under the lean concept will natu-rally support the result of the planning: A lean plant concept for lean manufac-turing.

Start-up of New Modern Facility (Case)
28
Start-up of New Modern Facility (Case)
Maija Hietava-Lorenzi Maijatek, France
1. Basic requirements of a new pharmaceutical facility
Every pharmaceutical facility or plant is unique. However, the basic level of the safety of the products produced in that facility should be a common goal to all pharmaceutical facilities. The facility should be designed to build quality into the products. Therefore, first, the quality should be built into the facility and the system. What does it mean to “build quality into a facility”? For a new facility, is it sufficient enough only to validate the manufacturing processes after the construction?
To be successful in getting what is expected and at the same time complying with all the regulatory requirements, the quality building should start as early as possible. It should in fact already start at the designing stage of the new facility and all of it should be in place at the moment of the manufacturing of the first batch for the market or clinical trial. It is certain that the goal to build quality will also help to minimize those countless chances of things going wrong and to foresee up front even those smallest details, which could mysteriously delay or stall a start-up and endanger an on-time and on-cost launch of a facility.
What is quality and how to build quality into a facility during the design, con-struction, commissioning, qualification as well as the validation stages? What is included in this demanding process? Small companies do not normally have in-house capacity and knowledge for sufficient understanding of each of the details involved, as well as planning around the predicted problems. How is this small organization, which is staffed for ongoing operations but not for the step change represented by a new facility, going to be able to handle the demanding and complex approach to build quality? Furthermore, how to keep the balance be-

Start-up of New Modern Facility (Case)
29
tween the increasing authority requirements and the amount and level of docu-mentation.
2. The start-up of Ark Therapeutics Oy new, modern facility
This presentation discusses the start-up of a modern multipurpose facility GMP3, designed and equipped by Ark Therapeutics Oy, Kuopio Finland (ATO) for the manufacturing of injectable recombinant gene therapy vectors used in human clinical trials and for commercial sale. It defines the tools which were used when building quality into the new facility and systems. The in-house ca-pacity of ATO was reinforced by outside professionals. An experienced consult-ing company in facility constructions and start-up was contracted for the task.
In ATO the facility was built for the well known processes, which made the design work interesting as well as challenging. The GMP3 facility project was divided into two main stages: the first consisted of the design stage until the performance qualification. The second stage consisted of the performance quali-fications, process validations and establishing most of the procedures related to the new facility activities. The first stage was “mastered” by the consulting com-pany. The second stage was planned and led by the ATO personnel, because of its thorough knowledge of the products, manufacturing processes and their par-ticularities.
For building quality into a facility all the stages of the project must be well de-fined and sufficiently controlled and documented in order to show that all the requirements and specifications set up for the facility are met. In order to define this complex project of construction and start-up of a facility and its very sophis-ticated processes various documents were established to describe the project in its minutest details. The master documents such as The Quality Activity Plan, The Overall User Requirement Specifications, The Commissioning and Qualifi-cation Plan, The Validation Master Plan and The Project Execution Plans for the first and second stages of the project were established. They explain how the work was to be planned and executed, what the requirements for the sub-contractors and documentation were, how the responsibilities were divided be-tween ATO and the consulting company, the organization of the project, the qualification and training requirements of the personnel etc. One of the impor-tant details in relation to the documentation was the qualification of personnel for the project. The responsible persons of the project had to insure that each

Start-up of New Modern Facility (Case)
30
person participating in the project was qualified for the assignment at hand, and therefore each one's qualification was checked and documented.
Risk analysis was the key tool for setting the limits for commissioning, quali-fication and the level of documentation. It was used at the very beginning of the project to categorize the critical and less critical issues of the project. As the project proceeded the importance of the tests became more significant as well, and subsequently the number and details of the documentation also increased. For instance the number of test steps and the pertaining documentation were increased for the qualification relative to commissioning tests.
3. Milestones of the facility project
The realized milestones of the facility project at Ark Therapeutics Oy:
- 2007: contract with the consultanting company - 2007: design stage and project defining documents - 2008: construction of the facility - 2008–2009: commissioning and qualification - 2009: end of stage one (until PQ) - 2009–2010: stage two

Inspection Observations
31
Inspection Observations
Ritva Haikala Fimea, Finland

Applications of Single-use Systems and Technologies in Biopharmaceutical Processes
32
Applications of Single-use Systems and Technologies in Biopharmaceutical
Processes
Bruce Rawlings Pall Life Sciences, U.K.
Abstract
The presentation will provide an overview of the current technologies and ap-proaches most widely implemented within industry in the field of single-use systems. Furthermore, we will show real examples of specific applications in-cluding the benefits of implementation from the end-users perspective. A short review of other key areas will also be discussed such as regulatory position, challenges for implementation and key considerations prior to implementation. Finally we will present an outlook for the future trends and requirements for single-use systems.
1. Introduction
Single-use technologies are being widely implemented in many applications within biopharmaceutical manufacturing, providing users with faster, more flexible, more cost effective and safer operations. In recent years, the main ap-plications where single-use technologies have been implemented are in the up-stream (bioreactor) area as well as downstream (buffer/fluid management) and around formulation and filling applications. Furthermore, there is a trend from the relatively simple applications such as media/buffer management to more demanding applications with direct product contact and more challenging steps for separation technologies. Suppliers of single-use technologies and solutions are developing products and services to facilitate continuous improvement and optimisation of processes.
Applications of Single-use Systems and Technologies in Biopharmaceutical Processes
33
2. Presentation overview
We will begin by reviewing a typical or generic process for protein production and summarise the developments which have occurred over the last few years in respect to the actual process. Furthermore, certain industry drivers (cost pres-sure, speed to market and added flexibility) are also forcing drug developers and producers to review and optimise their operations. The combination of process development and industry drivers provide challenges and bottlenecks (e.g. re-sources, sub-optimal unit operations and shortage of trained personnel) which need to be addressed. The process improvements, industry drivers and associated bottlenecks drive suppliers to develop and introduce new products and solutions to address the issues.
We will present a general overview of the developments in technologies, solu-tions and services provided around single-use implementation with the goal of enabling the seamless integration into processes with minimum burden on the users. This means addressing regulatory requirements, such as extractables analysis, and providing appropriate manufacturing, supply chain and technical support both pre and post implementation.
Examples will be shown of real life solutions from upstream through to for-mulation and filling, including the specific advantages and benefits provided through single-use technology implementation.
Finally, we will take a look forward into the future of single-uses technologies and solutions, to assess the needs in the coming years for further development in this area.

Isolator for Sterility Testing Operation: Process Description and Validation
34
Isolator for Sterility Testing Operation: Process Description and Validation
Kasper Carlsen Life Science, Getinge, Denmark
Abstract
The lecture embraces a process description and an informative case describing validation of an isolator for a new installation for sterility testing validated re-cently. The lecture will also include a description of the practical challenges related to sterility testing operations as well as regulatory requirements.
The purpose of the lecture is to present the problems that need to be addressed in the aseptic handling, the reasons to choose an isolator among different alterna-tives, a description of the installation and daily handling of the samples. Finally the presentation will exemplify a step-by-step validation. The method of valida-tion comprises activities as BI’s, smoke study, and cycle performed with an empty chamber as well as PQ with a defined load.
Key features of the installation and validation will be clarified; dedicated bio-decontamination unit, Rapid transfer systems, particle counter and air sampling.
Sterility testing as the last QC test for injectable products brings a continuity in the control of aseptic processing and it must be performed with at least the same environmental quality than the in-process controls. Isolator technology gives this quality and a full traceability.
1. Sterility testing
According to the Pharmacopoeias (USP 71), Sterility testing is the last manda-tory control to be performed on sterile drugs and ophthalmic products before their release for patients. It must be performed avoiding the risk of both false positive and false negative results.

Isolator for Sterility Testing Operation: Process Description and Validation
35
The test can be defined as the most fundamental test performed within sterile manufacturing pharmaceutical industry. It’s a method to establish the presence or absence of viable micro organisms (bacteria and fungi).
2. False positive
A false positive result causes added work for the busy QA/QC lab and adds sig-nificant costs as it delays or prevents release of the product for sale. A false negative result could place a non sterile product on the market, with the potential liability issues that this entails.
Definition of false positive:
- Contamination not representative of the product quality during test procedure.
- It indicates a non sterility in spite the fact that samples of product are sterile.
When a false positive test is detected it requires:
- A qualitative research of the origin of the contamination (labour, equipment)
- A new sterility test must be done (Labour, samples, equipment)
- A new delay of 14 days of incubation/quarantine before putting product on market place
- Eventual lost of product batch in case of failed investigation.
Possible causes of the false positive tests.
- Improper bio decontamination of the equipment (non proper installation)
- Improper sterilization of culture media, rinsing fluid, canisters (non proper installation or supplier)
- Improper bio decontamination of outside surfaces of the testing articles (samples, canisters, -rinsing fluid bottles, etc.)
- Contaminated environment (incorrect HEPA filtered air)
- Aseptic mishandling of the operator especially when the manual work is important.

Isolator for Sterility Testing Operation: Process Description and Validation
36
3. Background for using isolators for performing work of sterility tests
Due to the demanding characteristics of the test and the serious consequences that could result from a positive sterility test, the test is required to be performed under carefully controlled aseptic conditions. Traditionally, sterility testing was performed by personnel within class A laminar airflow located in Class B clean room. However there are problems inherent with this traditional method, e.g. in terms of possible entrance of filtered air, only manual disinfection is done, per-sonnel borne contamination can easily be introduced on operator gowning.
Isolators address many of these risks by forming a physical barrier between operator in surrounding room and enclosure for the performing work.
4. Regulations and guidelines are directly and indirectly arguing in favour of using isolator technology
4.1 Sterility Testing – FDA cGMP September 2004
“The testing laboratory environment should employ facilities and controls com-parable to those used for aseptic filling operation. Poor or deficient sterility test facilities or controls can result In test failure.
If production facilities and controls are significantly better than those for ste-rility testing, the danger exists of mistakenly attributing a positive sterility test result to a faulty laboratory even when the product tested could have, in fact, been non sterile. Therefore, a manufacturing deficiency may go undetected.
The use of isolators for sterility testing minimizes the chance of a false posi-tive result.”
4.2 Testing Facilities USP <71>
“Isolators are free standing environments that allow aseptic manipulations to be made from outside the controlled environment. Isolator systems protect the test article and Sterility Test supplies from contamination during aseptic handling.”

Isolator for Sterility Testing Operation: Process Description and Validation
37
The investment cost of an isolator is higher than the traditional laminar air-flow units but can easily be motivated due to substantial savings on associated costs on downgraded clean room and gowning.
In accordance with USP <1208> and ISO 13408-6 the surrounding room is not required to be classified
4.3 Sterility Testing – Validation of Isolator Systems <USP 1208>
“Isolators for Sterility Testing need not be installed in a classified clean room, but it is important to place the isolator in an area that provides limited access to the non essential staff”.
4.4 ISO 13408-6, Aseptic processing of health care products – Isolator systems
“Isolator systems dedicated to sterility testing may be located in a non-classified room with restricted access.”
5. Validation of isolators
ISPE Commissioning and qualification guideline volume 5. Validation of the used technique for sterility testing is essential, also embrac-
ing use of an isolator. This work is often broken down into FAT (Factory Accep-tance Test), IQ (Installation qualification), OQ (operational qualification) and PQ (performance qualification) in accordance with the V-model.
The purpose of the IQ is to establish that the critical components are installed correctly and in accordance with design documentation requirements (i.e., speci-fications, purchase orders, contracts, bid packages, etc.). Supporting documents should be in place and of suitable quality, and instruments should be calibrated.
The purpose of OQ is to establish, through documented testing, that all critical components and “direct impact” systems are capable of operating within estab-lished limits and tolerances. The OQ verifies that specific parameters are work-ing as intended, such as temperature, flow and pressure, hence checking if the system and all utilities are performing as intended.

Isolator for Sterility Testing Operation: Process Description and Validation
38
The purpose of the PQ is to verify that the pharmaceutical grade utility, envi-ronment, equipment, or support system produce the required output. The PQ must not be confused with PV (process validation).
In case of isolators, monitoring sterility for a longer period of time should be underlying data for PV.
Content of each step can vary but the purpose remains the same.

IMD Technology with an Example of a Successful Application
39
IMD Technology with an Example of a Successful Application
Gilberto Dalmaso A&LCO Industries, Italy
Abstract
An optical-based airborne microbial detection instrument, BioVigilant’s IMD-A system, has been designed for real-time environmental monitoring. The instru-ment detects airborne microbes, using the intrinsic fluorescence produced by their biological markers (e.g. NADH and riboflavin for vegetative cells and dipi-colinic acid for spores). The intended applications include pharmaceutical and hospital aseptic facilities.
In order to validate the IMD-A instrument for its capability of detecting air-borne bacteria, a series of prescribed USP<1223>tests were completed in a test chamber using aerosolized bacterial cells and spores, in which the IMD-A in-strument and a conventional viable microbial air sampler (Andersen 6-stage sampler) were operated side-by-side.
The presentation will also outline some examples of successful application for IMD-A in aseptic facilities as an environmental monitoring tool for contamina-tion control.
1. Introduction
Currently, pharmaceutical manufacturing environments have relied on growth media methods to detect airborne microbial contamination. These methods re-quire a number of days to elapse while samples, collected intermittently, are incubated. Advances in technology now promise both an instantaneous and con-tinuous means for detecting airborne microbes.
IMD Technology with an Example of a Successful Application
40
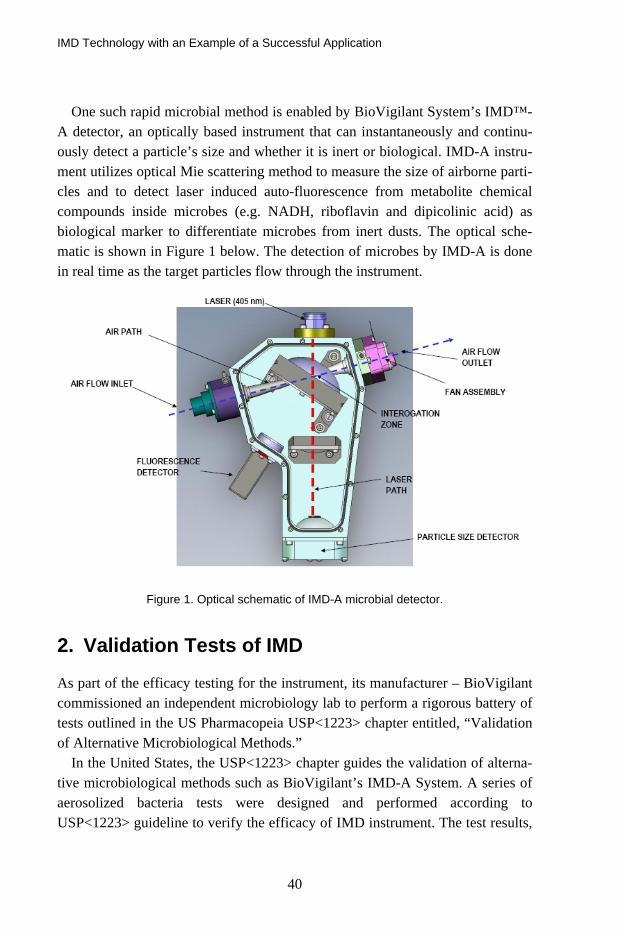
One such rapid microbial method is enabled by BioVigilant System’s IMD™-A detector, an optically based instrument that can instantaneously and continu-ously detect a particle’s size and whether it is inert or biological. IMD-A instru-ment utilizes optical Mie scattering method to measure the size of airborne parti-cles and to detect laser induced auto-fluorescence from metabolite chemical compounds inside microbes (e.g. NADH, riboflavin and dipicolinic acid) as biological marker to differentiate microbes from inert dusts. The optical sche-matic is shown in Figure 1 below. The detection of microbes by IMD-A is done in real time as the target particles flow through the instrument.
Figure 1. Optical schematic of IMD-A microbial detector.
2. Validation Tests of IMD
As part of the efficacy testing for the instrument, its manufacturer – BioVigilant commissioned an independent microbiology lab to perform a rigorous battery of tests outlined in the US Pharmacopeia USP<1223> chapter entitled, “Validation of Alternative Microbiological Methods.”
In the United States, the USP<1223> chapter guides the validation of alterna-tive microbiological methods such as BioVigilant’s IMD-A System. A series of aerosolized bacteria tests were designed and performed according to USP<1223> guideline to verify the efficacy of IMD instrument. The test results,

IMD Technology with an Example of a Successful Application
41
filed as part of BioVigilant’s Drug Master File (DMF) submissions to the U.S. FDA, can be referenced by pharmaceutical manufacturers to validate IMD-A instruments for use in their manufacturing areas. The USP<1223> guideline includes criteria as follows:
Accuracy is a measure of the test instrument’s ability to faithfully measure at least 70% or more of the counts the reference instrument(s) gathers.
Precision investigates whether, as a function of overall quantity, the target in-strument can repeatably measure similarly (based on % Relative Standard Deviation) among replicates of a given concentration.
Specificity-1 confirms the instrument’s ability to detect microorganisms for environmental monitoring applications.
Limit of Detection determines if the IMD-A instrument(s) has a lower detec-tion limit compared to the reference method(s) when a 95% confidence inter-val is applied.
Limit of Quantification measures the lowest concentration for which the test instrument records counts relative to the reference method(s).
Linearity is a measure of whether the target instrument increases counts over concentrations relative to the reference instrument(s) (i.e. the correlation co-efficient of their linear regression).
Range determines the interval between the upper and lower levels of micro-organisms detected by the IMD-A instrument in comparison to the opera-tional interval of the reference method(s).
Because BioVigilant offers two models, separate test batteries were performed for each model. The IMD-A 200-1 small, lightweight unit samples 1.1 liters per minute while the larger IMD-A 220-4 instrument samples at 28.3 liters per min-ute, or the equivalent of 1 cubic foot per minute. Likewise, the traditional meth-ods to which these IMD-A instruments were compared also differed in line with their respective features and flow rates.
A six-stage Andersen viable air sampler was selected for the IMD-A 200-1 testing. This comparative instrument employs a sieve impaction method, six consecutive agar plates, and environmental air aspirated at 28.3 lpm to achieve one of the highest collection efficiencies (Jensen et al., 1992) of traditional air sampling methods.

IMD Technology with an Example of a Successful Application
42
In both cases, IMD-A counts and Colony Forming Units (CFUs) from nutrient media plate counts were collected and compared between the IMD-A instrument and the comparative sampler(s) respectively, using five common microbial spe-cies to challenge the instruments: Bacillus atrophaeus spores, Corynebacterium afermentans, Escherichia coli, Micrococcus lylae, and Staphylococcus epider-midis. These bacteria were chosen from a survey of pharmaceutical manufactur-ers for bacterial types commonly found in the facility environmental monitoring. These species include Gram-positive, Gram-negative, spore-forming and non-spore-forming bacteria. In the test, each bacterium was aerosolized at distinct concentrations with no fewer than 10 replicates (n = 10) per concentration.
The tests were conducted in a 2 700-liter chamber specially designed for aero-sol studies. The bacteria were aerosolized with a Salter Laboratories nebulizer, and distributed homogenously within the chamber using mixing fans. The cham-ber was cleaned between runs using standard sanitization procedures and a lami-nar flow of HEPA-filtered air. All laboratory procedures used were documented and employees appropriately trained in accordance with FDA’s Good Labora-tory Practices.
BioVigilant facilities were used to perform the balance of USP<1223>-required tests. These included tests for robustness, ruggedness and specificity:
Robustness tests small but deliberate variations in method parameters (in the case of IMD-A, in environmental conditions, i.e., variations in temperature and humidity) to ensure that the IMD-A instrument remains unaffected.
Ruggedness tests the degree of precision of test results obtained by analysis of the “same” samples under a variety of normal test conditions.
Variability from instrument to instrument, operator to operator, and environ-ment to environment was determined by testing two equivalent IMD-A mod-els in three different environments using two operators.
Specificity-2 investigates the potential of detecting microbial interferents that may be common in cleanroom environments.
2.1 Findings
Of the 121 tests challenging the IMD-A 200-1 and the comparative method with the five bacteria in dry form, the IMD-A unit passed 120 of the tests, a 99% rate of passing. The one instance where the unit did not pass was at the highest con-

IMD Technology with an Example of a Successful Application
43
centration using Stapylococcus epidermidis. The reason is likely due to the need to impose a shorter sampling period to the traditional sampler being used for the comparison due to its susceptibility to saturate, yielding plate colonies too nu-merous to count. Table 1 is a summary of the USP<1223> test results of the 5 bacteria.
It should be noted that in the early phases of testing, BioVigilant also chal-lenged the IMD-A 200-1 with nebulized liquid solution of Bacillus atrophaeus spores. In these 17 cases, the unit did not meet the test criteria. Subsequent re-search revealed independent studies that have reported Bacillus atrophaeus spores showing lower levels of intrinsic fluorescence after becoming wet (Kun-nil et al., 2005). The sudden exposure to water induces a germination process which reduces the presence of fluorescing agents inside spores. Thus, the sensi-tivity to wetted spores is decreased as compared to naturally occurring spores in the environment. Since controlled pharmaceutical environments are less likely to bear such wetted spore bacteria, aerosolization with dry forms is considered a more representative test (Nicholson et al., 2000).
Results for the larger IMD-A 220-4 instrument were equally positive. Of 345 tests comparing the IMD-A counts to the CFUs reported by the three traditional viable samplers, the IMD-A 220-4 passed 325 of the tests, for a 94% rate of passing. Of the 20 cases where the IMD-A 220-4 instrument did not meet the acceptance criteria, 15 were related to substantive differences in sampling time, the isolated cause of the sampling problem mentioned earlier with the IMD-A 200-1 testing. Because the limited operational ranges of the reference samplers imposed shortened sampling times at higher concentrations, the normalized data were not truly comparable.
Once excluded, the overall rate of passing increases to 98% with only a few instances remaining where the instrument did not meet the criteria
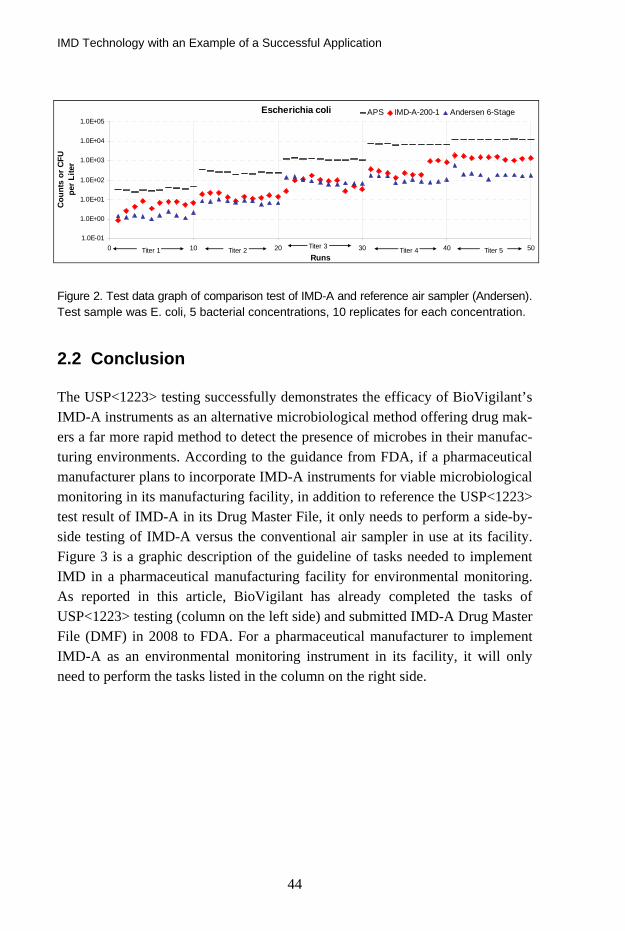
Figure 2 shows an example of experimental graph generated from the test. In this case, bacteria E. coli were aerosolized into the test chamber in a series of 5 concentrations (marked titer 1, etc). The counts obtained by IMD-A-200-1, ref-erence method (Andersen 6-stage air sampler/agar plate) and reference particle counter (APS) are depicted in Figure 2.
IMD Technology with an Example of a Successful Application
44
Escherichia coli
1.0E-01
1.0E+00
1.0E+01
1.0E+02
1.0E+03
1.0E+04
1.0E+05
0 10 20 30 40 50Runs
Cou
nts
or C
FU p
er L
iter
APS IMD-A-200-1 Andersen 6-Stage
Titer 1 Titer 2 Titer 3 Titer 4 Titer 5
Figure 2. Test data graph of comparison test of IMD-A and reference air sampler (Andersen). Test sample was E. coli, 5 bacterial concentrations, 10 replicates for each concentration.
2.2 Conclusion
The USP<1223> testing successfully demonstrates the efficacy of BioVigilant’s IMD-A instruments as an alternative microbiological method offering drug mak-ers a far more rapid method to detect the presence of microbes in their manufac-turing environments. According to the guidance from FDA, if a pharmaceutical manufacturer plans to incorporate IMD-A instruments for viable microbiological monitoring in its manufacturing facility, in addition to reference the USP<1223> test result of IMD-A in its Drug Master File, it only needs to perform a side-by-side testing of IMD-A versus the conventional air sampler in use at its facility. Figure 3 is a graphic description of the guideline of tasks needed to implement IMD in a pharmaceutical manufacturing facility for environmental monitoring. As reported in this article, BioVigilant has already completed the tasks of USP<1223> testing (column on the left side) and submitted IMD-A Drug Master File (DMF) in 2008 to FDA. For a pharmaceutical manufacturer to implement IMD-A as an environmental monitoring instrument in its facility, it will only need to perform the tasks listed in the column on the right side.

IMD Technology with an Example of a Successful Application
45
Figure 3. Division of tasks guideline for implementing IMD in a pharmaceutical manufactur-ing facility. BioVigilant has completed the tasks of testing according to USP<1223> and submitted Drug Master File (DMF) in 2008. The remaining tasks for a pharmaceutical cus-tomer to do in order to implement IMD in its facility are listed in the column on the right side.
Rapid methods like BioVigilant’s IMD-A systems help pharmaceutical manu-facturers realize real-time process monitoring. They may also be applicable in other areas where environmental monitoring of microbial contamination is cru-cial, such as hospital, pharmacy and other areas where contamination control is essential.
3. IMD Application in Environmental Monitoring
IMD instrument affords the user real time microbial detection capability, which might be beneficial for enhancing the situational awareness in a critical envi-ronment (e.g. hospital and a pharmaceutical parenteral drug manufacturing facil-ity). As an example, IMD instruments can be installed in a parenteral drug fill line in a pharmaceutical manufacturer to monitor the bio burden in the critical area and alert the operators of a potential microbial excursion.
In addition, IMD could be a useful tool in pinpointing the source of microbial contamination and improving the performance of an aseptic facility by identify-ing possible route of microbial excursion. To illustrate this type of application,

IMD Technology with an Example of a Successful Application
46
we would like to present the data from a case study of using IMD to do a survey of microbial distribution pattern in an aseptic facility. The site of this study was a small scale clean room for aseptic filling of parenteral drugs. The room was rectangular in shape, as shown schematically in Figure 4, with a door at one corner of the room [coordinate (7, s3)]. Two filling stations (laminar flow hoods) were located against a wall at coordinates (3, s1) and (6, s1). The goal of the study was to map out the distribution of microbes inside the room and pinpoint potential excursion routes. To achieve this goal, an IMD instrument was used to survey the room in a grid search pattern: the room was divided into a 4 × 7 grid (total 28 sampling points inside the room); an IMD was brought into the room and used to take biologic counts at each point of the grid in a serial fashion; the IMD biologic counts were superimposed on the grid search pattern of the room, as shown in Figure 4.
1 2 3 4 5 6 7S1
S30
2
4
6
8
10
12
14
Figure 4. IMD microbial distribution map of a clean room surveyed by IMD. The IMD bio-logic counts of each point are superimposed on the grid search pattern in the room (x and y axes), the vertical axis (z) indicates the total biologic count (per liter of air) of each grid point. Two laminar flow hoods are at grid points (3, s1) and (6, s1), door is at (7, s3).
From this grid pattern survey result by IMD instrument (Figure 4), several sali-ent points can be observed for evaluation of the overall performance of this clean room and suggestions of potential areas for improvement:

IMD Technology with an Example of a Successful Application
47
(1) The overall performance of this clean room was adequate. The microbial counts at the two filling stations [grid points (3, s1) and (6, s1)] were low, ensuring aseptic filling operation.
(2) The microbial counts near the entrance door of the room [grid point (7, s3)] were highest. This indicates that the door was a route from micro-bial excursion into the room. Possibly, this clean room was not main-tained at a positive air pressure as per general clean room requirement.
(3) Possible improvements of this clean room suggested by this survey:
a. Maintain the room at positive air pressure;
b. Improve air filtration system of the room to further reduce mi-crobial counts, especially in the area near the filling stations [grid points (4, s1)–(5, s1)].
Furthermore, after the improvement of the room is done, an IMD instrument can potentially be brought in to verify the effectiveness of the improvement.
In summary, a real time airborne microbial detector such as IMD can poten-tially be a useful apparatus in the field of contamination control for routine envi-ronmental monitoring as well as a diagnostic tool for root cause analysis of a microbial containment failure and for facility improvement.
References
Jensen, P.A., Todd, W.F., Davis, G.N. and Scarpino, P.V. 1992. “Evaluation of eight
bioaerosol samplers challenged with aerosols of free bacteria.” Am. Ind. Hyg. Assoc. J. (53): 660–667.
Kunnil, J., Sarasanandarajah, S., Chacko, E and Reinisch, L. 2005. “Fluorescence Quan-
tum Efficiency of dry Bacillus globigii spores”, Optics Express, Vol. 13, No. 22: 8969–8979.
Nicholson, W.L., Munakata N., Horneck G., Melosh, H.J. and Setlow, P, 2000. “Resis-
tance of Bacillus Endospores to Extreme Terrestrial and Extraterrestrial Envi-ronments,” Microbiology and Molecular Biology Reviews.
Risk Management in Pharma and Medical Device Industry
48
Risk Management in Pharma and Medical Device Industry
Pasi Grönroos PG Quality Oy, Finland
Abstract
Risk management in Pharmaceutical industry and Medical Device industry is acting very important role nowadays. It is not easy to use risk management as a development tool nor to understand its’ real purpose. Risk management is used to improve safety and at the same time to reduce or even eliminate any possible risks that could cause harm to the patient, user or third party.
In this section risk management will be handled from the following views:
− Risk management – Why? − Risk management – What? − Risk management – When? − Risk management – How? − Risk management as a process − An example of risk management in cleanroom.
1. General
Risk management in Pharmaceutical industry and Medical Device industry is acting very important role nowadays. It is not easy to use risk management as a development tool nor to understand its’ real purpose.
Guidelines and requirements for risk management in Pharma and Medical De-vice industry are based directives or standards such as:
− Pharma: o ICH Q9/Quality Risk Management

Risk Management in Pharma and Medical Device Industry
49
− Medical Devices: o ISO 14791/Medical devices. Application of risk management
to medical devices o ISO 13485/Medical devices. Quality management systems.
Requirements for regulatory purposes o 98/79/EC In Vitro Diagnostic Devices o 93/42/EEC Medical Devices o 90/385/EEC Active Implantable Medical Devices o QSR/21 CFR Part 820 - Quality System Regulation
− General: o ISO 9001/ISO 14001/OHSAS 18001
In this section risk management will be handled from the following views:
− Risk management – Why? − Risk management – What? − Risk management – When? − Risk management – How? − Risk management as a process.
2. Risk management – Why?
Risk management is used to improve safety and at the same time to reduce or even eliminate any possible risks that could cause harm to the patient, user or third party.
BUT risk management is a development tool to improve procedures and func-tions. It is a systematic process and needs hard work and does not include any secret items.
There are many reasons other than regulatory requirements for using risk management like:
− It is a good tool for develop and produce high class products or processes
− Could be found critical points by risk assessment
− Could be used through the whole organization and processes
− Could be found potential risks in advance than make corrective actions af-terwards
− It is easy to include to the quality management system.

Risk Management in Pharma and Medical Device Industry
50
3. Risk management – What?
Risk management process should be implemented to the whole life cycle of product i.e. from design to post-production activities.
It is very important that risk management process is based on top manage-ment’s commitment and they:
− understand purpose of risk management − allocate resources for risk management and take care of competencies − make sure of implementation of instructions − integrate it part of quality management system.
4. Risk management – When?
Risk management could be used in many different situations and should be used at least in the following cases:
− If you have to change your product, process or part of it
− If you are developing a new product/process
− If you are uncertain to do changes and you like to confirm your goals by risk management
− In case of deviation, corrective and preventive actions and near-misses
− Risk concerning costs should also be evaluated.
5. Risk management – How?
Risk management process should always be created according to each organiza-tion. There is a lot of information available, but concentrate to items, which are important to you and helps you to go forward.
You should also remember that a perfect risk management system does not exist – there are many ways to implement and use it.
Any changes or any new product development could or even should be started by risk assessment.
Create appropriate process to your organization and choose suitable tools and PRACTISE.

Risk Management in Pharma and Medical Device Industry
51
6. Risk management as a process
Risk management process contains the following parts:
− Risk assessment o Identification of hazards o Risk identification o Risk analysis o Risk evaluation
− Risk control o Risk reduction o Risk acceptance
− Risk communication through the whole process − Risk review

A Comparison of Data Acquired from a Test Chamber during Simultaneous Measurements by Standard DPC, STA-Sampler and IMD-A
52
A Comparison of Data Acquired from a Test Chamber during Simultaneous
Measurements by Standard DPC, STA-Sampler and IMD-A
Bengt Ljungqvist and Berit Reinmüller Building Services Engineering, KTH, Sweden
Abstract
A comparison of data acquired from simultaneous measurements by IMD-A, standard OPC and STA-sampler during evaluations in a test chamber will be presented. Pros and cons of different instruments will be discussed.
1. Introduction
Guidelines for are given how to evaluate environmental monitoring methods by FDA and USP. To use new methods for environmental monitoring during asep-tic manufacturing of sterile products might present some challenges.
The present guidelines for environmental microbial monitoring of air in Grade A zones or critical areas, recommend active air sampling of not less than one cubic meter of air during a short period, often interpreted as not more than 10 minutes. According to ISO 14698-1 the recommended methods are filtration or impaction sampling with a collection efficiency of viable particles down to an aerodynamic diameter of 1 micron.
When selecting sampling locations for environmental monitoring, a docu-mented risk analysis should be performed. However, little is mentioned that the sampling location(s) should be representative of the area or region to be moni-tored. A positive control that indicates that the sampling location respond to disturbances in the region to be monitored is not yet required, nor is a negative
A Comparison of Data Acquired from a Test Chamber during Simultaneous Measurements by Standard DPC, STA-Sampler and IMD-A
53
control to show that non-relevant disturbances do not cause “false positive” re-sults. The capture region of an air sampling device is usually very small, e.g., often equal to a sphere with the diameter of the inlet diameter of the sampling probe. The air movements in the actual sampling region (unidirectional or mix-ing) affect the sampling efficacy.
In Grade A or critical areas the microbiological burden should be very low; less than 1 colony forming unit per cubic meter should be detected. For instru-ments with real time results appropriate sampling times or sampling volumes have to be set. Knowledge of the sampling equipment and its collection efficacy is very important when results from different methods should be compared.
The opinion of the authors is that in pharmaceutical manufacturing, the moni-toring of airborne viable particles is more relevant than e.g., monitoring of air-borne number of cells. One bacteria-carrying particle cannot contaminate more than one unit of a pharmaceutical product. Real-time monitoring has a great advantage when corrective actions need to be taken.
A study has been performed during conditions similar to Grade A areas, i.e., very low concentration of airborne viable particles.
2. Material and methods
2.1 Test conditions
The test chamber was supplied with HEPA-filtered air (H14) with vertical uni-form flow at a velocity of approx 0.22 m/s. To establish the basic particle levels of contamination, tests were carried out in the empty test chamber.
The sampling period for all samples was set to 10 minutes. To receive environmental conditions similar to Grade A (< 1CFU/m3), the test
chamber was used for evaluation of a surgical clothing systems of cleanroom quality in combination with special undergarments- washed and sterilized 25 and 50 times respectively. The concentration of airborne particulates and viable par-ticles (as aerobic CFU) was measured in the exhaust air, as described by Ljungqvist and Reinmüller (2004).
To increase the level of airborne particles, eight test cycles were performed with the test subjects wearing cleanroom undergarment, head cover and textile boots.
During the activity measurements the test subjects performed standardized cy-cles of movements that included arm movements, walk in place and knee bends at a set speed. These movements are, in principle, comparable with those de-
A Comparison of Data Acquired from a Test Chamber during Simultaneous Measurements by Standard DPC, STA-Sampler and IMD-A
54
scribed in IES-RP-CC003.2 (1993). Prior to each cycle of movement, the test subject stood still to avoid the influence of particle generation from the previous test cycle. The evaluated clothing systems had five test subjects performing the standardized cycles of movements four times. In total 40 test cycles with clean-room quality clothing were carried out.
2.2 Monitoring equipment
In the test chamber, the total number of airborne particulates was counted and sized using a particle counter (DPC; HiacRoyco 245), the total number of inert and viable particles respectively were sized and counted using an IMD-A, and viable particles were collected using a slit sampler (FH3®, d50-value 1.6 µm). All instruments were connected to the exhaust duct and operated according to the manufacturers’ instructions.
The characteristics of the monitoring equipment were as follows: − DPC; HiacRoyco 245, sampling volume flow 1cft/min, lowest particle
size counted 0.5 micron. − FH3®, sampling volume flow 50 L/min, d50-value 1.6 µm. − IMD-A, sampling volume flow 1.2 L/min, lowest particle size
counted 0.5 micron, determining particles either as inert or as viable.
2.3 Microbial methods
Microbial growth medium for STA tests was standard medium Tryptic Soy Agar (TSA) in 9 cm Petri dishes. The TSA plates were incubated for not less than three days at 32˚C followed by not less than two days at room temperature. The recorded number of CFU was characterized by phase contrast direct microscopy.
3. Results
Some results are shown in the following graphs.

A Comparison of Data Acquired from a Test Chamber during Simultaneous Measurements by Standard DPC, STA-Sampler and IMD-A
55
≥0.5 and ≥5µm particles DPC IMD-A 25 washes & sterilizations
1
10
100
1000
10000
0 2 4 6 8 10 12 14 16 18 20 22 24 26
Test subject
Num
ber p
er 0
.1 m
3
DPC ≥0.5µm
IMD-A ≥0.5µm
DPC ≥5µm
IMD-A ≥5µm
≥0.5 and ≥5µm particles DPC and IMD-A 50 washes & sterilizations
1
10
100
1000
10000
0 1 2 3 4 5 6 7 8 9 10111213141516171819202122232425
Test subject
Num
ber p
er 0
.1 m
3
DPC ≥0.5µm
IMD-A ≥0.5µm
DPC ≥5µm
IMD-A ≥5µm

A Comparison of Data Acquired from a Test Chamber during Simultaneous Measurements by Standard DPC, STA-Sampler and IMD-A
56
0,1
1
10
100
0 2 4 6 8 10 12 14 16 18 20 22
Test subject
Num
ber p
er 0
.1 m
3STA d50 <2µmIMD-A ≥0.5µmIMD-A ≥5µm
CFU STA and viable particles IMD-A 25 washes & sterlizations
CFU STA and viable particles IMD-A 50 washes and sterilizations
0,1
1
10
100
0 2 4 6 8 10 12 14 16 18 20 22
Test subject
Num
ber p
er 0
.1 m
3
STA d50 <2µm
IMD-A ≥0.5µm
IMD-A ≥5µm
≥0.5 an ≥5µm particles DPC and IMD-A Underwear
1
10
100
1000
10000
21a
22a
23a
24a
Averag
e
Test subject
Num
ber p
er 0
.1 m
3
DPC ≥0.5µm
IMD-A ≥0.5µm
DPC ≥5µm
IMD-A ≥5µm

A Comparison of Data Acquired from a Test Chamber during Simultaneous Measurements by Standard DPC, STA-Sampler and IMD-A
57
CFU STA and viable particles IMD-A Underwear
0,1
1
10
100
1000
10000
21a
21b
22a
22b
23a
23b
24a
24b
Averag
e
Test subject
Num
ber
per
0.1
m3
STA d50 <2µm
IMD-A ≥0.5µm
IMD-A ≥5µm
CFU and viable particles
0
5
10
15
20
0 10 20 30 40 50 60
Number per test cycle
Test
cyc
le
>0.5 µm <5 IMD-A>5 µm IMD-ACFU
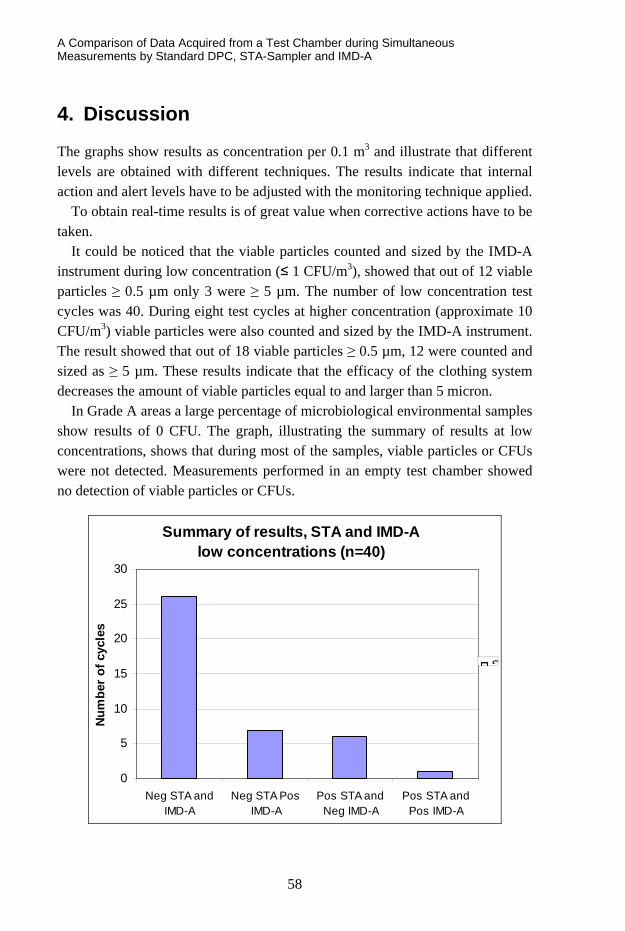
A Comparison of Data Acquired from a Test Chamber during Simultaneous Measurements by Standard DPC, STA-Sampler and IMD-A
58
4. Discussion
The graphs show results as concentration per 0.1 m3 and illustrate that different levels are obtained with different techniques. The results indicate that internal action and alert levels have to be adjusted with the monitoring technique applied.
To obtain real-time results is of great value when corrective actions have to be taken.
It could be noticed that the viable particles counted and sized by the IMD-A instrument during low concentration (≤ 1 CFU/m3), showed that out of 12 viable particles ≥ 0.5 µm only 3 were ≥ 5 µm. The number of low concentration test cycles was 40. During eight test cycles at higher concentration (approximate 10 CFU/m3) viable particles were also counted and sized by the IMD-A instrument. The result showed that out of 18 viable particles ≥ 0.5 µm, 12 were counted and sized as ≥ 5 µm. These results indicate that the efficacy of the clothing system decreases the amount of viable particles equal to and larger than 5 micron.
In Grade A areas a large percentage of microbiological environmental samples show results of 0 CFU. The graph, illustrating the summary of results at low concentrations, shows that during most of the samples, viable particles or CFUs were not detected. Measurements performed in an empty test chamber showed no detection of viable particles or CFUs.
Summary of results, STA and IMD-Alow concentrations (n=40)
0
5
10
15
20
25
30
Neg STA andIMD-A
Neg STA PosIMD-A
Pos STA andNeg IMD-A
Pos STA andPos IMD-A
Num
ber
of c
ycle
s
S

A Comparison of Data Acquired from a Test Chamber during Simultaneous Measurements by Standard DPC, STA-Sampler and IMD-A
59
References
IES-RP-CC003.2 (1993) Garments System Considerations for Cleanrooms and Other Controlled Environments, IES Institute of Environmental Sciences, Illinois.
ISO 14498-1 (2003) Cleanrooms and associated controlled environments – Biocontami-
nation control – Part1: General Principles and Methods. International Organiza-tion for Standards, Geneva.
Ljungqvist, B. and Reinmüller, B. (2004) Cleanroom Clothing Systems; People as a Con-
tamination Source, PDA/DHI Publishing, LLC, River Grove, IL. ISBN 1-930114-58-3.

Alternative Method for Airborne Contamination Control in Only Few Hours
60
Alternative Method for Airborne Contamination Control in Only Few Hours
Diane de Pastre, Quitterie Desonqueres and Esmeralda Carvalho Bertin Technologies, France
Abstract
In the context of environmental contamination control and especially of air con-trol in cleanrooms, Bertin Technologies (France) has developed a technology dedicated to the monitoring of airborne bio-particles. The goal is to propose a sampling method compatible with Rapid Microbiological Methods in order to get reliable and specific data on airborne biological agents and go beyond im-paction method limits.
With this cyclonic technology, airborne particles are separated from the air and collected into a sterile liquid media. This liquid sample is directly compati-ble with rapid analysis such as immunoassay, PCR assay, phase cytometry and also standard culture methods. This sampler is validated according ISO14698-1 (Health Protection Agency HPA, Porton Down, UK).
This technology aims at going beyond the traditional impaction method (impac-tion on agar plates) in terms of time-to-result, more information than only cultiva-ble flora (VNC, viruses, allergens) and no saturation of the collection media.
With the Coriolis® technology, many studies have been carried out for the sampling of airborne bio-particles in hospitals, pharmaceutical, food and biotech industries to detect bacteria, virus, pollens, allergens or non-cultivable pathogens with alternative methods (Pneumocystis, Aspergillus, Respiratory Syncytial Vi-rus (RSV), bacteriophage, Legionella, Stachybortrys chartarum).
A focus could be done on one application or one market depending on the ses-sion.

Changes Affecting EU GMP and the FDA’s CGMP Non-viable Particle Cleanliness in Cleanrooms
61
Changes Affecting EU GMP and the FDA’s CGMP
Non-viable Particle Cleanliness in Cleanrooms
Tony Harrison HACH, U.K.
Abstract
EU GMP and the FDA’s CGMP set the target cleanliness levels for non-viable particles in pharmaceutical cleanrooms. Both documents refer the reader to ISO 14644 for the methods to determine these cleanliness levels. ISO 14644 is cur-rently under revision and the ISO Technical Committee has assigned a Working Group to make recommendations as to how the inappropriate statistical analysis tools in the current document can be improved. In addition to this focus, the new ISO 14644 will direct users to use the already existing but little-known standard for calibration and verification of air particle counters, ISO 21501-4. Cleanroom owners and classification companies would be well advised to consult their air particle counter and cleanroom monitoring system supplier(s) in order to deter-mine the potential modifications required to comply with these changes affecting compliance to EU GMP and the FDA’s CGMP.
1. Cleanroom contamination
For decades, in an attempt to improve drug quality and protect patients’ lives, the non-viable particle cleanliness levels in pharmaceutical cleanrooms has been closely measured and monitored. In parallel the viable microbial contamination levels have also been closely measured and monitored through the use of settle plates and the subsequent detection of colony forming units.

Changes Affecting EU GMP and the FDA’s CGMP Non-viable Particle Cleanliness in Cleanrooms
62
The main risk to patients’ safety is widely considered to be viable particles, i.e. microbes that are capable of replication. The presence of one microbe may not be a threat in itself to a patient’s immune system, but a viable microbe will of course multiply in the right conditions and form a colony of microbes, potentially leading to infection and sickness in the patients who receive the infected drug dose.
Measuring and reporting viable particles provides it’s own challenges, not least of which is the delay between the time the viable particle is collected on the settle plates and the time when a decision can be made as to whether there are colony forming units present or not. Different species of microbes favour differ-ent environmental conditions for growth and replication. Some species favour a low temperature environment, some prefer a higher temperature to stimulate growth. Even the acidity of the environment can have an effect and samples that are incubated and declared clear of viable particles can later be found to contain microbes that flourish when exposed to a change in pH.
One common factor that affects all microbes is the presence of water. Without water, microbes will not flourish and this gives an added challenge to the collec-tion and incubation of microbes, i.e. the nutrient in settle plates tends to dry out when it is exposed in the cleanroom and this can be a particular issue for active air samplers where the settle plate is exposed to a forced stream of drying air.
2. Non-viable particle counting as a surrogate
In an attempt to gather a more ‘real-time’ indication of potential viable particle contamination several studies have been undertaken to link the levels of non-viable particles present in the air to the likelihood of viable contamination. Many microbiologists would agree that this link, whilst giving an indication, is not a hard and fast rule.
In an attempt to improve the link between non-viable particle counting data and the potential presence of viable particle contamination EU GMP Annex 12 calls for particular attention to particles that are 5micron or larger. It is widely accepted that the likelihood of a microbe floating freely in the air unattached to anything is slim. The logic behind monitoring for 5micron particles is that a non-viable particle of this size could possibly be carrying a viable particle.
In theory, there should be no 5micron particles in the air of a correctly de-signed and operated EU GMP Grade A/ISO 14644 Class 5/FDA CGMP1 Class 100 cleanroom and their presence is a sign of either a failure in the cleanroom air filtering system, or, more commonly, poor practice of the cleanroom operating staff.
Changes Affecting EU GMP and the FDA’s CGMP Non-viable Particle Cleanliness in Cleanrooms
63
3. The problem with 5micron particles
The problem with monitoring 5micron particles lies in the statistical viability of the data collected. In metrology terms, it is considered impossible to provide statistically sound evidence of the total absence of something, i.e. you cannot report zero with any confidence. This problem has been behind the changes wit-nessed in EU GMP Annex 12 over the last few years, where the original target of zero particles of 5micron or larger to a now more statistically sound target of twenty particles.
4. Why 1m3 sample size?
Although we didn’t realise it, the requirement to capture 1m3 samples at each location in an EU GMP Grade A/ISO 14644 Class 5/FDA CGMP1 Class 100 cleanroom has been with us long before EU GMP Annex 12 changed to mandate this sample size.
Both EU GMP and the FDA CGMP1 set the target levels of contamination for the different grades of cleanrooms. Both then indicate that the correct method of determining these contamination levels is to be found in ISO 14644. In deter-mining the required sample size ISO 14644 Annex B directs us to take a minimum sample at each location to allow a statistically sound calculation of the particulate cleanliness level. This minimum sample volume is based on the minimum number of particles that would be considered large enough to allow statistical analysis. The minimum number of particles laid down in Annex B of ISO 14644-1 for this ‘sound statistical analysis’ is determined to be twenty particles.
If we now refer to the maximum particulate cleanliness level required by EU GMP Annex 12 for Grade A area of 20 particles/m3 at 5microns or larger, we can now see that, in order to capture the statistically sound sample of 20 particles, we must sample 1m3, i.e. if we take a sample of 1m3, there should be, at worst case, 20 particles at 5microns or larger, thus supporting a statistically sound calculation of the cleanliness level in that cleanroom.
In fact, if we go back to earlier versions of GMP Annex 13, we can see that the maximum allowable number of particles for Grade A area was 1 particle/m3 at 5microns or larger. Thus, following the direction of ISO 14644, the logical con-clusion would have been that we should capture a sample of 20 m3 at each sam-pling location to ensure that we capture sufficient particles to determine the cleanroom cleanliness class supported by sound statistical analysis!

Changes Affecting EU GMP and the FDA’s CGMP Non-viable Particle Cleanliness in Cleanrooms
64
5. ISO 14644 to change – the implications
Ironically, the recent periodic review process of ISO 14644 by ISO TC 209 Working Group 1 has cast doubt on the statistical validity of the models used to determine the cleanliness class of cleanrooms when samples are taken from be-tween two and nine locations only. Currently ISO 14644 directs us to apply the Student’s T test and calculate the Upper Confidence Level.
The statistical model used in ISO 14644 actually is only sound when applied to cleanrooms where the contamination levels are uniform across the room. Whilst this may be true of some cleanrooms, this is definitely not the case for many cleanrooms and certainly not true if the room is to be classified in opera-tion or in a manned state where the contamination levels will vary widely be-tween areas where cleanroom staff and machinery operate and areas where there is no activity, particularly in areas of non-unidirectional/laminar air flow. In fact applying the current statistical model in ISO 14644 it is possible for a cleanroom to fail it’s target classification if there is one sample point that is markedly lower in particulate contamination than all the rest, even if all sample locations are individually within the required limits.
For this reason, the current draft of a proposed revision to ISO 14644 pro-duced by Working Group 1 now contains a different statistical model. Clean-room classifiers are now asked to sample at more locations than was previously required using the ‘square root’ calculation contained in the existing ISO docu-ment. The logic behind this change is that a larger number of sample locations will yield more sampling data and therefore a more statistically sound represen-tation of the overall cleanroom cleanliness. The Student T test and Upper Confi-dence Calculation have both been removed entirely.
6. New calibration requirements for air particle counters
Traditionally it has been very difficult to attain counter-to-counter correlation of particle count results between particle counters, even if they are the same model from the same manufacturer. In addition, there was no way to verify that the calibration of an air particle counter was accurate.
Since 2007 there has been a new standard for calibrating and verifying the calibration of air particle counters used to classify cleanrooms to ISO 14644. The current draft revision of ISO 14644 now requires the user to use this new

Changes Affecting EU GMP and the FDA’s CGMP Non-viable Particle Cleanliness in Cleanrooms
65
calibration standard titled “ISO 21501-4 Determination of particle size distribu-tion – Single particle light interaction methods – Part 4: Light scattering airborne particle counter for clean spaces”5.
The benefits are that there are now methods available that will promote counter-to-counter correlation and allow particle counter calibration to be veri-fied against a traceable standard.
7. Implications of these changes affecting EU GMP2 and FDA CGMP1
As mentioned earlier in this article, while EU GMP and FDA CGMP1 state the target cleanliness levels for cleanrooms, they both refer the reader to ISO 14644 for the methods to determine these cleanliness levels.
The Standard Operating Procedures (SOP) used by pharmaceutical QC teams in their environmental monitoring to determine the cleanroom cleanliness will have been written around not only the limits defined in EU GMP and the FDA’s CGMP1 documents but also around the methods laid down in ISO 14644.
In addition, many portable air particle counters and cleanroom monitoring sys-tems contain embedded software that allows the user to automate the calcula-tions laid down in ISO 14644.
Added to these facts is the reality that the majority of air particle counters manufactured before 2007 will not have been designed to pass the more strin-gent calibration and verification laid down in ISO 21501-4.
The timeline for the publication of the revised ISO 14644 will see the final document in print sometime during early 2011. Cleanroom owners and classifi-cation companies would be well advised to consult their air particle counter and cleanroom monitoring system supplier(s) in order to determine the potential modifications required to comply with these changes affecting compliance to EU GMP and the FDA’s CGMP1.

Changes Affecting EU GMP and the FDA’s CGMP Non-viable Particle Cleanliness in Cleanrooms
66
References
1. Food and Drug Administration. Guidance for industry. Sterile drug products produced
by aseptic processing – current good manufacturing practice, 2004. U.S. De-
partment of Health and Human Services Food and Drug Administration Center
for Drug Evaluation and Research (CDER) Center for Biologics Evaluation and
Research (CBER) Office of Regulatory affairs (ORA) Division of Drug Informa-
tion, HFD-240 Center for Drug Evaluation and Research Food and Drug Ad-ministration 5600 Fishers Lane Rockville, MD 20857 USA.
2. European Commission. EudraLex. The Rules Governing Medicinal Products in the
European Union. Volume 4. EU Guidelines to Good Manufacturing Practice.
Medicinal products for human and veterinary use, Annex 1: Manufacture of Ster-
ile Medicinal Products, 14th February 2008. European Commission Enterprise
and Industry Directorate-General, B-1049 Bruxelles / Europese Commissie, B-
1049 Brussel – Belgium.
3. European Commission. Ad Hoc GMP Inspections Services Group. EC Guide to Good
Manufacturing Practice. Revision to Annex 1. Manufacture of Sterile Medicinal Products, 30th May 2003.
4. ISO 14644-1:1999(E) Cleanrooms and associated controlled environments – Part 1:
Classification of air cleanliness 1st May 1999. International Organization for
Standardization Case Postale 56 • CH-1211 Genève 20 • Switzerland.
5. ISO 21501-4 Determination of particle size distribution – Single particle light interaction
methods – Part 4: Light scattering airborne particle counter for clean spaces
2007. International Organization for Standardization Case Postale 56 • CH-1211
Genève 20 • Switzerland.

Maintaining a Spore Free Cleanroom
67
Maintaining a Spore Free Cleanroom
Karen Rossington Shield Medicare, U.K.
Abstract
The manufacture of sterile pharmaceutical products is governed in the European Union by the requirements of EU Good Manufacturing Practice for Medicinal Products. The cGMP guide gives very specific details on the environmental and microbial requirements for aseptic processing. However, little or no guidance is given on how to create and maintain the correct level of microbial contamination in the aseptic suite.
One of the most difficult requirements in a life science cleanroom is the con-trol of bacterial spores. They can enter the cleanroom on people and on compo-nents at a surprisingly high rate. Research has shown that 40% of consumables, as they are taken from stores, are contaminated with bacterial spores.
This presentation focuses on two important issues – creating and maintaining a spore-free environment and preventing spore contamination that may result from the use of disinfectants. The presentation will look at the GMP require-ments that are relevant to contamination control, different sporicidal disinfec-tants, sporicidal test methods, details of transfer disinfection and good hand hy-giene techniques.

Maintaining a Spore Free Cleanroom
68

ELECTRONICS SESSION
69
ELECTRONICS SESSION


Control of Macroparticles in a Clean Manufacturing Environment
71
Control of Macroparticles in a Clean Manufacturing Environment
Pasi Tamminen Nokia Corporation, Finland
Abstract
Macroparticles having an equivalent diameter greater than 5μm have to be under control when products with high visual quality are manufactured. Large size particles are also challenging for joint technologies where joint thickness is less than tens of microns. This paper presents control and measurement methods to assess risks macroparticles can create in manufacturing.
1. Introduction
International cleanroom standards such as the ISO 14644-1 give guidance and requirements for cleanrooms and other similar controlled environments. A high volume consumer product manufacturing can have similar needs for contaminant control as stated in the standardisation, but due to high rate material flows and large scale manufacturing normal methods used in cleanrooms may not be prac-tical. High volume manufacturing areas do not have laminar air flow, there can be thousands of operators working and a lot of materials with high particle release rate can flow through the processes. A modern manufacturing has to be also very flexible and fixed installations providing clean air or preventing air movements can not be implemented due to the continuous changes with the processes.
Even the cleanroom standardisation may not give straight answers for a high volume manufacturing the same guidelines as for cleanrooms shall apply and particle contamination control program can be built accordingly. However, more tailoring is needed for the control program. How much tailoring is needed de-pends on the level of required cleanness and amount of separate processes. Typi-

Control of Macroparticles in a Clean Manufacturing Environment
72
cally only limited amount of processes with consumer products requires e.g. ISO 6 or 7 class cleanness and these can be built separately and controlled based on the ISO 14644-1. The rest of the processes with cleanness requirement e.g. more than the ISO 7 may require the most tailoring to get the processes under control without major cost or efficiency penalties. This is required especially when the critical particle size is more than 5 µm.
ISO classification limits the airborne particle size classification to 5 µm. The larger particles are called as macroparticles and in the annex E.3 “M descriptor” format is presented as a supplementary method to present the required level of cleanness for these particles [1]. The annex E specifies also that a specific sam-pling and measurement methods may be needed for the macroparticles. These are required due to a different behaviour and densities with the large particles when compared to the particle sizes under the ISO classification.
This paper presents results, measurement methods and control principles for macroparticles control in a high volume consumer product manufacturing. These products can have optical parts, displays and smooth surfaces having high visual quality requirements. The main focus is with visible particles and the first part of the paper defines a critical particle size based on a human visual acuity. The next part analyses airborne particle sampling methods for process control purposes. The third part of the paper presents a particle fallout method to assess macro particle deposition risks. The last part of the paper presents principles how measurement data and risk assessment information can be used to control the cleanness. Cleanroom environments are not included in this study.
2. Critical particle size
Two different criteria can be used to specify a critical macroparticle size. From a visual quality point of view human capability and probability to see a particle in different environments is one way to specify the minimum particle size of inter-est. Another approach is to use production process requirements to specify the critical particle range. If the particle critical production processes are separated and built in a controlled cleanroom with a low macroparticle concentration the critical particle size may be specified from visual quality point of view.
A human capability to see a particle with a certain optical size depends on the person visual acuity, contrast of the particle and type of illumination. Human visual acuity is specified and measured with good contrast black characters on a white background when the surface is illuminated with a light intensity of 480lx.

Control of Macroparticles in a Clean Manufacturing Environment
73
With this arrangement it has been specified that a normal human visual acuity can distinguish a spatial pattern on a surface where the pattern is separated by a visual angle of one minute of arc (0.01677° angle). Visual acuity increases when the level of illumination increases or when a person has time to adapt to the en-vironment. A human can also detect a pattern or lines better than a point object. For this reason visual acuity is not a fixed value and there is variation in human capabilities to see small objects. The smallest object a human can see is limited by the retina resolution and eye optical precision. In an optimal situation the smallest object human can see is about 10 µm. However, the visual acuity de-creases with aging (presbyopia) and a non-optimal contrast or illumination in-creases the smallest dimensions to detect [2].
Normal visual acuity can be used to calculate a typical object size human can see at a certain distance, Figure 1. In most cases the size of an object should be at least 30 µm before it can be detected. Even then a distance between the object and eye should be less than 10 cm and luminous intensity and contrast high enough. Therefore, 30 µm can be set as the critical macroparticle size.
Figure 1. Object size versus detection distance with normal visual acuity
The critical particle size and detection distance have to be known from product visual quality control point of view. Visual inspections can be made during manual handling of the products or separate sample based quality checks can be used. In both cases a human is doing the task with or without auxiliary tools. In a high volume production auxiliary tools, such as magnifying glasses, are not common due to tight phase time requirements and inspections have to be as an
Control of Macroparticles in a Clean Manufacturing Environment
74
integral part of operations. A typical distance to assemble and handle product parts is more than 30 cm due to the ergonomics. At this distance only larger than about 80 μm particles can be seen with a high acquisition. In this case visual inspection can not always alone provide the required quality level and particle contaminants must be controlled by preventing particle deposition on the prod-uct surfaces.
3. Airborne particle concentration
The ISO 14644-1 standard gives guidance to control and measure airborne parti-cles. For macroparticles the standard proposes that “Factors such as the density, shape, volume, and aerodynamic behaviour of the particles need to be taken into account” [1]. These parameters are now analysed in example environments. Target of the analyses is to understand how the macroparticles behave and how this effects on the particle control.
3.1 Airborne particle counters
An airborne particle counter measures particle concentration in an air sample and reports the concentration for selected channels. The counters available from different suppliers have typically four to six channels which can be set to meas-ure particles from 0.3 μm up to 25 μm. Smaller than 0.3 μm particles are chal-lenging to measure with optical systems and requires more customized meas-urement setups. On the other side the over 25 μm particles are also challenging to measure with a good accuracy as the concentration of these particles can be low and a particle size and mass can effect on the counting accuracy. The best counting efficiency is reported to be with about 1 μm size particles [3].
The counters report the concentration by using a cumulative or differential calculation. The most common way is to use the cumulative count where the concentration values are given as a number of particles in a cubic meter having the particle optical size equal or larger than the limit, e.g. count of ≥ 0.3 μm particles (pcs/m3). The differential count informs the amount of particles for each channel, e.g. the count of particles between 0.3 μm – 5 μm (pcs/m3). An air sample peed varies between the counters and the most common options are 2.83 l/min, 10 l/min, 28.3 l/min and 50 l/min. Higher air sample speed helps to take larger air samples in a shorter time and by that way can increase counting accuracy if the par-ticle concentration is low.

Control of Macroparticles in a Clean Manufacturing Environment
75
The following analyses focuses to verify what channels can be used to measure the concentration of macroparticles, what kind of air sample speed is needed to cap-ture the macroparticles and what is the accuracy of airborne particle measurements.
3.2 Behaviour of macroparticles
An aerodynamic behaviour of macroparticles was analysed in an ISO 7.6 classi-fied environment with a controlled air movement and less than 100V/m electro-static fields. An airborne particle counter with 28.3 l/min air sample capability was set to measure particle concentrations for 20 minutes. Dust particles col-lected from a manufacturing process was released two minutes before the count-ing was started and behaviour of two particle size groups was analysed. A cumu-lative count for 1 μm and 5 μm particles is shown in Figure 2. The over 5 μm size particles are falling down due to the gravitation force and the concentration stabilises to about 5 000 pcs/m3
level within three minutes. At the same time the 1 μm particle concentration has only minor drop as the gravitation has less effect on the smaller particles. The same behaviour was observed also when the air-borne particle counter was placed to measure particles in a non-cleanroom envi-ronment, Figure 3. Dust particles were released artificially after two minutes and a sudden increase in particle concentration can be seen in the third air sample. The cumulative count of both 5 μm and 10 μm particles drops in five minutes close to the level it was before the particle release. For the 1 μm particles it takes more than 10 minutes to get the same level as before the particle release.

Control of Macroparticles in a Clean Manufacturing Environment
76
Figure 2. Dynamics of airborne particles.
Figure 3. Dynamics of airborne particles, non-cleanroom environment.

Control of Macroparticles in a Clean Manufacturing Environment
77
Based on the figures 2 and 3 there is a different behaviour with small and large particles due to the gravitation force and air movement. An interesting point is to know how well the small airborne particle concentration data correlates with the data got for larger particles. 19 separate particle concentration measurements consisting of totally of 163 28.3 l/min air samples were analysed, Figure 4. A correlation between 0.5 μm, 1 μm, 5 μm and 10 μm cumulative data sets were calculated and is shown in the Table 1. The 0.5 μm particle data has a good cor-relation with the 1 μm data and a fair correlation with the 5 μm data. There is a good correlation also between the 1 μm and 5 μm data, but the 10 μm data seems not to correlate anymore with the 0.5 μm, 5 μm and 1 μm data sets. One reason for a low correlation with the 10 μm data is the poor accuracy of airborne particle counters to count large particles. There can be also a lot of quantization error if only a few over 10 μm particles are in one air sample. Based on the cor-relation data > 1 μm channel data could be used fairly well to estimate the be-haviour of > 5 μm channel particles. > 10 μm particles can be used for control purposes only if concentration of the large particles is high enough to get statis-tically reliable data. In practice this means that there has to be a continuous gen-eration of macroparticles in the area measurements are taken.
Figure 4. Cumulative airborne particle data with 161 air samples.

Control of Macroparticles in a Clean Manufacturing Environment
78
Table 1. Airborne particle data correlation in a cleanroom with 163 air samples.
3.3 Comparison of airborne particle counters
Airborne particle counters are calibrated according to the JIS 9921 and ISO 21501-4 standards [4, 5]. The standards require testing only the smallest particle channel, but counter manufacturers can use own calibration methods for larger channels. The standards allow also 30% to 70% count efficiencies for the smallest channel and close to 100% efficiency is typically met only between the second smallest and largest channels [3]. With the reference particles used for calibration the main requirements for counters are: counting efficiency 100%±10% (when particle size is 1.5 to 2 times the 1st channel), instrument resolution < 15%, particle size setting error < 10%, coincidence loss < 10% and sampling flow rate < 5% [5].
Most of the airborne counters use a laser light and a light sensor to detect par-ticles. The reflected particle signal pulse is based on the scattered light, and the non-uniform nature of the light source results in variations in light scatter for identical particles [3]. Particles used in the calibration can be also very different if compared to the real world particles and the signal pulse the counter sends can vary based on the shape and reflection properties of the particle. All the varying characteristics increase uncertainty with the airborne particle counting.
Uncertainly of the airborne particle counting was tested by using several counters parallel in a test chamber. Four particle counters with 28.3 l/min air sample speed were compared to two counters with 2.83 l/min air sample speed. All equipment were calibrated and had particle channels set to measure cumula-tive counts for 0.5 μm, 1 μm, 5 μm and 10 μm. The counters were placed 10 cm-15 cm distance of each other and the particle concentration was compared at least 13 minutes. The comparison was done with the > 1 μm and > 5 μm size particles and an example result is shown in the Figure 5. A smaller hand held particle counter with 2.83 l/min sample speed reported lower cumulative counts for the 1 μm channel than the other counter with 28.3 l/min air sample capabil-ity. With the 5 μm channel the smaller counter reported higher values than the 28.3 l/min model. There were similar differences between the 28.3 l/min and 2.83 l/min counters in all comparisons. Counters with the 2.83 l/min air sample
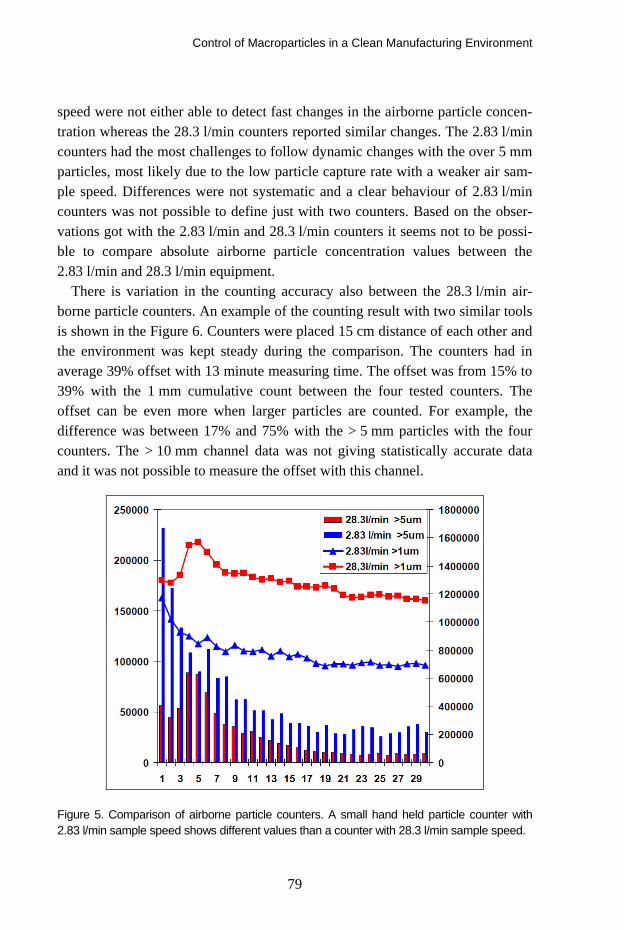
Control of Macroparticles in a Clean Manufacturing Environment
79
speed were not either able to detect fast changes in the airborne particle concen-tration whereas the 28.3 l/min counters reported similar changes. The 2.83 l/min counters had the most challenges to follow dynamic changes with the over 5 mm particles, most likely due to the low particle capture rate with a weaker air sam-ple speed. Differences were not systematic and a clear behaviour of 2.83 l/min counters was not possible to define just with two counters. Based on the obser-vations got with the 2.83 l/min and 28.3 l/min counters it seems not to be possi-ble to compare absolute airborne particle concentration values between the 2.83 l/min and 28.3 l/min equipment.
There is variation in the counting accuracy also between the 28.3 l/min air-borne particle counters. An example of the counting result with two similar tools is shown in the Figure 6. Counters were placed 15 cm distance of each other and the environment was kept steady during the comparison. The counters had in average 39% offset with 13 minute measuring time. The offset was from 15% to 39% with the 1 mm cumulative count between the four tested counters. The offset can be even more when larger particles are counted. For example, the difference was between 17% and 75% with the > 5 mm particles with the four counters. The > 10 mm channel data was not giving statistically accurate data and it was not possible to measure the offset with this channel.
Figure 5. Comparison of airborne particle counters. A small hand held particle counter with 2.83 l/min sample speed shows different values than a counter with 28.3 l/min sample speed.

Control of Macroparticles in a Clean Manufacturing Environment
80
Figure 6. A comparison of 28.3 l/min airborne particle counters. Similar counters from two suppliers measuring the same environment.
3.4 Airborne particle counting
Based on the tests the airborne particle counter result depends on the air sample speed and calibration of the counter. The results vary also depending on the measured particle type, used channels and dynamics of the airborne particle con-centration. If there are random particles releases the counter should have at least 28.3 l/min air sample speed to be able to follow the changes. Small particles are also staying longer in air and if the > 1 μm channel is used to monitor cleanness in a dynamic area the average concentration values can be much higher than e.g. with the > 5 μm channel. Therefore, when the macroparticles are the main con-cern smaller than 5 μm particles represent poorly the dynamics of particle con-centration and should not be used alone for process control. On the other hand, over 10 μm particles seem to be challenging to measure accurate with particle counters, especially if the concentration of the large particles is low. It is also hard to predicts how the visible > 30 μm particles correlates with the 1 μm or 5 μm particle concentrations as there is a different behaviour already between the 1 μm and 5 μm size particles.
Control of Macroparticles in a Clean Manufacturing Environment
81
Airborne particle concentration is challenging to use for comparison of cleanness between separate locations if the same counter can not be used. Due to e.g. different particles and equipment calibrations the offset can be even tens of percents.
4. Particle deposition
Airborne concentration information can be used to monitor cleanness of the area but it should also correlate with the required quality targets. Particles in air are not typically a major risk from a product visual quality point of view, but the risk realizes when the particle will settle down on a particle critical surface. In an ideal case the airborne particle concentration correlates well with the deposition risks. Cleaning the particles from critical surfaces is also a common method to improve product quality. Particle deposition and removal methods will be dis-cussed in the following chapters.
4.1 Airborne particle concentration and deposition risks
Airborne concentration is typically controlled in a cleanroom and clean process areas. A particle deposition on critical surfaces can be estimated by using the airborne concentration data and the simplified equation 1.
Count = Pm3 • t • [∇ Vair + ∇ Vg + ∇ VE] • B • Asurface, (1)
where; Count = the number of particles on a target surface [pcs/target area], A = the area of the target surface [m2], Pm3 = the particle concentration [pcs/m3], t = time [s],∇Vair = the gradient of the air speed (speed & direction of the particle) [m/s], ∇Vg = the gradient of the gravitational speed (speed & direction of the particle) [m/s], ∇ VE = the speed and direction of the particles due to the electro-static forces [m/s] and B = the ratio of particles which will hit and stay on the surface [value is between 0 and 1].
The movement and speed of particles should be known in order to calculate the number of particles touching the surface in a certain time. The surface area and deposition time are typically known but the particle speed and ratio of parti-cles staying on the surface are challenging to measure. Particle movement con-sists of an air movement, gravitation and e-field forces. Air movements can be measured but the value can have a lot of variation due to e.g. turbulences. The gravitation force pulls the particles downwards but depending on the shape the particle may ride differently in the air. The E-field effect is even more challeng-

Control of Macroparticles in a Clean Manufacturing Environment
82
ing to estimate as the particle charge may be either positive or negative and the particles will be either pulled towards or rejected by the electrostatic field. In most cases the static field can be removed or limited to below 100V/m and the E-field effect can be omitted.
According to the results presented in the chapters 3.2 and 3.3 typically only smaller than 10 μm particles can be measured reproducible with the airborne particle counters. Therefore, the equation 1 is not very applicable to count depo-sition risks for visible range particles. The equation 1 is neither very accurate with the below 10 μm particles due to several unknown parameters effecting on the count.
4.2 Fallout rate and deposition risks
Airborne concentration has several unknown parameters and only < 10 μm size particle data which to use to estimate particle deposition risks. A more straight-forward method to estimate deposition risks is to measure directly the fallout of visible particles. The fallout is the number of particles settling on a known sur-face in a certain time. This data can be used to calculate a particle deposition on known critical surfaces according to the equation 2.
Count = PFallout • Atarget • t • (1+ Efield • C ), (2)
where; Count = the number of particles per square centimeter per hour [pcs/cm2/h], Atarget = area of the target surface [cm2], PFallout = the fallout rate is a number of particles falling in one square centimeter in one hour [pcs/cm2/h], t = time [h], Efield = static field strength [kV/m]), C = a multiplier based on local experimental tests (C ≥ 0 depending on e.g. the particle shape, particle polarity, distance, particle charge).
The effect of static fields needs also to be measured if the particle critical sur-faces have static charges. In most cases the static fields can be removed or lim-ited to below 100 V/m and E-field effect can be omitted (C = 0). The only un-known parameter which needs to be measured is the fallout rate PFallout. This needs to be measured at the same location as the particle critical surface exposes to a particle deposition.

Control of Macroparticles in a Clean Manufacturing Environment
83
4.2.1 Fallout rate method
There is one standard available for particle fallout measurement (ASTM E1216 – Standard Practice for Sampling for Particulate Contamination by Tape Lift). This method bases on the tape samples and optical microscope inspection of the particles.
Particle fallout measurements were done in this study with an alternative method. A black color glass plate was used to collect particles in risk locations. The plate was cleaned and a high resolution picture was taken of the surface. The initial picture was used to measure the number of residual particles after cleaning. On the next step the plate was placed in a particle critical process for one-two hours to expose to particle fallout. After one-two hours particle collec-tion a second picture was taken of the plate, Figure 7. Particle fallout is the dif-ference in the particle count between the two images. Pictures were taken with a high resolution camera and 100 mm macro objective. Plate was illuminated with a LED light source in such a way that the contrast between the background and particles was more than 50/256 in 8bit greyscale.
Figure 7. Left side: fallout plate after 1h particle deposition. Right side: magnification.
Particles were counted automatically from images with the Image-Pro Analyser software. The count was calculated by using particle length or area as a meas-urement criteria. An example measurement of one particle is shown in the Figure 8. The image resolution was 5 μm and the minimum particle length to be meas-ured was set to 50 μm (0.05 mm). Measurement accuracy is the weakest with the smallest objects and for 50 μm particles it was found to be ±10%. The smallest particle size is defining the total accuracy of the measurement as the smallest
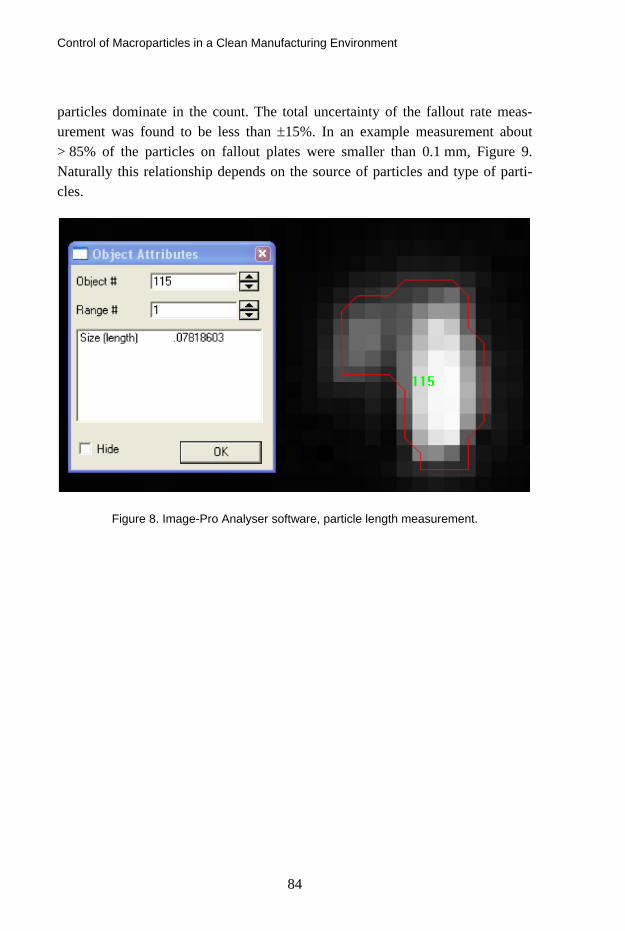
Control of Macroparticles in a Clean Manufacturing Environment
84
particles dominate in the count. The total uncertainty of the fallout rate meas-urement was found to be less than ±15%. In an example measurement about > 85% of the particles on fallout plates were smaller than 0.1 mm, Figure 9. Naturally this relationship depends on the source of particles and type of parti-cles.
Figure 8. Image-Pro Analyser software, particle length measurement.

Control of Macroparticles in a Clean Manufacturing Environment
85
Figure 9. Particle length distribution with four fallout samples in different environments.
4.3 Comparison of airborne concentration and particle fallout data
Airborne particle concentration and fallout values were compared to each other in a cleanroom environment with unidirectional air flow and in a non-cleanroom environment with random air flows, Figures 10 and 11. An airborne particle counter was set beside of seven fallout plates and 15 one minute long air sam-ples were collected. The correlation of airborne and fallout data is less than 0.7 in the laminar air flow environment. Similar results were got also in a nonclean-room environment where data correlation is below 0.6. The low correlation may result from different behaviour of the over 50 μm visible and 5 μm~10 μm in-visible particles. The result indicates also that the airborne particle concentration data can not be used to estimate visible range particle deposition risks on critical surfaces.

Control of Macroparticles in a Clean Manufacturing Environment
86
Figure 10. Comparison of airborne particle concentration and particle fallout. Environment had a laminar air flow and strong artificial particle releases to increase particle concentration.
Figure 11. Comparison of airborne particle concentration and particle fallout in a non-cleanroom environment. Uncontrolled air flows.

Control of Macroparticles in a Clean Manufacturing Environment
87
4.4 Fallout method and cleaning tests
High pressure air blow is one of the most common methods to remove visible particles from surfaces. The air blow effect can be assisted with ionisation. An ioniser provides positive and negative ions and will neutralise static charges which are visible to the ionised air stream. Purpose of the air stream is to move the ions further away, neutralise and release particles and move the particles away from the surface. In this study the particle fallout method was used to ana-lyse ioniser cleaning efficiency. Fallout plates were contaminated with dust par-ticles, ionised and counted with a camera system before and after ionisation. The ioniser was set to blow ionised air for four seconds in a 45 degree angle on to the plate, it had 2.5 bar pressure and the distance to the plate was 13 cm. The ioniser was calibrated and capable to neutralise 13pF charge plate in less than two seconds.
In the first test particle cleaning efficiency was compared between neutral and charged surfaces. Neutral glass plates were placed on a table and contaminated all at the same time. Half of the plates were then ionised without a static charge and the rest of the plates were charged up to 2kV potential with an induction and ionised in a similar way. The average particle removal rates and 95% confidence limits for the average are presented in the Figure 12. The neutral plates had in average 96% and the charged plates 92% cleaning efficiency. The difference in the cleaning efficiency between the neutral and charged surface is not big, but statistically significant. Static charges keep some of the particles tightly against the surface and cleaning efficiency is weaker.

Control of Macroparticles in a Clean Manufacturing Environment
88
Figure 12. Comparison of cleaning efficiency with a neutral and charged (2kV) plate.
In the second test neutral glass plates with different particle size distributions in each were cleaned with an ioniser. Three plates were compared to each other, Figure 13 a). The plate 1 had the largest amount of small particles (shorter than 0.1 mm) and the plate 3 had mainly larger particles. The plate 2 had large and small particles evenly. In all three plates particles larger than 0.9 mm2
were all moving away and a clear drop with cleaning efficiency was observed when the particle size was less than 0.03 mm2. With particle length measurement a similar behaviour was observed and longer than 0.3 mm particles are more or less all moving away, Figure 13 b). The smaller the particle is the less ionised air stream has effect on it. Similar results were got also with stronger air speed and with pulsed air stream. Ionised air stream seems not to be able to remove the smallest visible particles away from surfaces. On the other hand, ionisation seems to be a very efficient cleaning method for the larger particles.

Control of Macroparticles in a Clean Manufacturing Environment
89
Figure 13. a) Cleaning efficiency with different particle size distributions. b) Particle distri-bution before and after ionisation.
5. Control of macroparticles
5.1 Airborne particles and process control
Airborne particle measurements can be used to control the amount of macropar-ticles. A main limitation is that the concentration does not estimate directly macroparticle deposition on critical surfaces as the airborne concentration meas-ures mainly invisible range particles which behave in a different way than the visible over 30 μm size particles. However, when the concentration value in-creases/decreases it most likely increases/decreases also the amount of macroparticles in the area. Concentration data can be used to build up trend charts for statistical process control and the trend charts inform how the concen-tration changes when process improvements or new processes are used in the controlled area.
The cumulative count of > 5 μm is often the best airborne particle counter channel to estimate the amount of macroparticles in manufacturing. These parti-cles have faster fallout than the > 1 μm range particles and measurement accu-racy is still reasonable if compared to the over 10 μm size particles. The > 5 μm particles have fairly high dynamics with concentration and often about 10 meas-urement samples are needed in one place to calculate the average concentration. Calculation of the 95% confidence limits is a good method to estimate reliability of the average when the measured environment has a lot of variation. 28.3 l/min air samples are needed to follow the changes in concentration as the large air

Control of Macroparticles in a Clean Manufacturing Environment
90
sample improves particle capture rate and there will be more particles counted during each air sample.
An example of the trend chart is shown in the Figure 14. There are four meas-urement locations (a non-cleanroom area) controlled with daily measurements. Each measurement point is an average of 10 measurements with 28 l/min air samples. One of the trend lines (Area 1) has the 95% confidence limits visible to validate accuracy of the average.
Figure 14. Trend charts for four measurement locations.
A trend chart can be used for process control only if the data collection methods are standardised. Measurement locations and the time of the measurement should be kept the same to limit random variation. Measurements have to be done also in a “quiet” area not having people movements or processes too close. Typically about 2m~3m free distance has to be kept around the measurement point to eliminate random changes. Air movements should be also measured at the measurement location. Direction and speed of the air can be checked for example by using smoke tube tests.
Control of Macroparticles in a Clean Manufacturing Environment
91
5.2 Risk analyses with the fallout method
The airborne particle data can be used for process monitoring purposes but parti-cle deposition risks require other methods. The fallout measurement is a good method to estimate macroparticle deposition risks in manufacturing. Fallout estimates a long term average particle deposition on product surface when the analysed location has not too much dynamics with the particle movements. The more variation there is with particle movement the longer time fallout plates must be kept in the location to get statistically accurate data. Fallout can be also just a few particles per square centimetre in one hour in a relatively clean envi-ronment. In that case a longer particle collection time or more fallout plates are needed to get statistically reliable data. In a non-cleanroom environment five samples with 5 cm2
particle collecting area (together 25 cm2) has given reliable data with one hour deposition time.
A particle critical part has an area of 35 cm2 and it is exposed to a particle fall-
out 10s during product handling and manufacturing. The average number of over 50 μm particles falling on this area and an expected visual failure rate needs to be analysed.
At first a clean neutral fallout plate with 25 cm2 particle collection area is
placed beside particle critical surfaces in a real process. Plate is kept in that posi-tion for one hour to get particle deposition. After one hour the plate is taken out and the over 50 μm long particles are counted with a method presented in the chapter 4.2.1. The fallout is 12 pcs/cm2/h and the average number of particles hitting the critical surfaces during the 10s expose time is calculated with the equation 2. In this case the average particle count is 1.2 pcs/part. The critical surface is cleaned with ionisation and the expected cleaning efficiency is calcu-lated to be 95% for the over 50 μm particles. In this case the final particle count on the surface is 0.06 pcs/part which means about 6% failure rate.
Due to a high estimated failure rate the process is improved and a clean cabin having filtered laminar air flow is installed over the part handling area. The fall-out measurement is repeated, but now the fallout plate is kept 2h in the process in order to collect enough particles. The new fallout value is now 1.4 pcs/cm2/h and the average particle count on the critical surface is 0.006 pcs/part after ioni-sation. This equals to a 0.6% failure rate. To improve the process even more the exposure time of the part is decreased to 3s and the failure rate can be estimated to decrease to 0.2%.

Control of Macroparticles in a Clean Manufacturing Environment
92
6. Conclusion
Over 5 μm particles are classified as macroparticles by the ISO 14644-1 clean-room standard. These macroparticles are the main challenge when visual quality of products is maintained in a non-cleanroom environment. Human can see typi-cally only over 30 μm size particles and the main focus with macroparticle con-trol should be to prevent these particles to deposit on particle critical surfaces.
Airborne particle concentration is the main method to measure process clean-ness in a cleanroomenvironment. The same method would be good also for macroparticles, but macroparticles are challenging to measure with particle counters due to the relative low concentration and fast fallout behaviour in the air. Smaller than 5 μm particles have a slow fallout and those represent poorly behaviour of macroparticles. On the other hand larger that 10 μm particles are challenging to measure with counters as the concentration is often too low to get statistically reliable data. Airborne particle concentration was also found to be a poor value to estimate over 50 μm size particle deposition on critical surfaces.
Cumulative count of larger than 5 μm particles was found to be the best counter channel for macroparticle control. One method to use the over 5 μm particle concentration data for macroparticle control is to use trend charts. The trend chart can be monitored and if the concentration of > 5 μm particles de-crease also the concentration of macroparticles most likely decreases. Absolute value of the concentration can not define accurately visible range particle depo-sition risks.
Six tested airborne particle counters were found to give different responses when dynamic processes were measured. Small hand held particle counters with 2.83 l/min air sample speed had the most variation. These hand held equipment were not either able to follow particle concentration changes as well as the 28.3 l/min equipment. Both the 2.83 l/min and the 28.3 l/min equipment gave also different absolute concentration values in the same environment. The difference was about +/-40% with > 1 μm particles and even +/-75% with the > 5 μm parti-cles. The difference was estimated to come from different equipment calibra-tions, different particle counting techniques, air sample speed differences and quantization errors. Based on the tested particle counters the absolute concentra-tion value should not be compared one-to-one between the counters due to an unknown offset.
A fallout method measures directly particle deposition on surfaces and pro-vides a tool for particle contamination risk analyses. It is a complementary

Control of Macroparticles in a Clean Manufacturing Environment
93
method for the airborne particle concentration control. Fallout can be measured by using particle collection plates, a camera system and a particle counting soft-ware. The reported fallout unit is pcs/cm2/h. This value estimates a long term average particle deposition on product surfaces and can be translated into a fail-ure level when the area of the particle critical surface and the deposition time are known in the position of the fallout sample. The fallout method was also used to analyse particle cleaning efficiency with a high pressure ionised air. Based on the analyses ionisation is able to remove more or less all longer than 0.3 mm particles, but cleaning efficiency drops with smaller particles. For the 50 μm size particles cleaning efficiency can be only about 65%. It is challenging to remove all visible particles with cleaning and the main focus with the visible range parti-cle control should be to prevent particle deposition on product surfaces.
References
[1] ISO 14644-1, Cleanrooms and associated controlled environments, 2007.
[2] August C., Measuring Vision and Vision Loss. Chapter 51 in Volume 5 of Duane’s Clinical Ophthalmology, 2001.
[3] Lighthouse, technical papers, http://www.golighthouse.com/tech_papers.asp.
[4] JSA JIS B 9921, Light Scattering Automatic Particle Counter, 1997.
[5] ISO 21501-4, Determination of particle size distribution – Single particle light interac-tion methods – Light scattering airborne particle counter for clean spaces, 2007.

Changes to ISO 14644 for Cleanrooms
94
Changes to ISO 14644 for Cleanrooms
Tony Harrison HACH, U.K.
Abstract
ISO 21501 [5] is a new family of standards describing the instruments and cali-bration requirements for determining particle size distribution using light inter-action methods. It represents the culmination of work by instrumentation manu-facturers and industry users and comes at a critical time for the life sciences in-dustry with the increasing trend for real-time air particle monitoring in clean rooms using light scattering air particle counters.
1. Airborne particle counters and ISO 21501
In comparison to liquid particle counters, the calibration of airborne particle counters presents greater challenges due to the need to generate air samples con-taining sub-microscopic particles of homogenous size and distribution. Although the technology of air particle counting is well understood, the ability to calibrate any two air particle counters so that they produce the same results when sam-pling the same air sample has proven challenging, bringing into question the accuracy of these instruments. ISO 21501 [5] now delivers a calibration method that can significantly improve the repeatability and reproducibility of airborne particle counters.
2. Liquidborne particle counters and ISO 21501
ISO 21501(5) also applies to liquidborne particle counters used for determina-tion of particulate contamination in infusions and injections. Until recently, the calibration requirements [known as “IST” methods] for liquidborne particle

Changes to ISO 14644 for Cleanrooms
95
counters used to test infusions and injections were described in detail in the United States Pharmacopoeia (USP) chapter <788>. However, in the interest of international harmonization of the pharmacopoeias, the details of these IST cali-bration methods have been removed in order to simplify the text of USP <788>. ISO 21501(5) now offers an alternative to these IST tests and establishes calibration methods to ensure accurate, repeatable performance of liquidborne particle counters.
3. Background
Optical instrumentation has been used to determine particle contamination in air and liquids in the life science industry for many years. In addition, the correla-tion between airborne particles and final product quality has long been recog-nized in the semiconductor, Flat Panel Display and Hard Disk storage manufac-turing industries, where improvement of air quality (reduction of particulate contamination) has led to increases in final product yield.
Differing techniques are used to determine the number and size of particles depending on the size of particles that are of interest (see Figure 1).
Figure 1. Particle size range and counting techniques.
In Liquid particle counting for infusions and injections, the sizes of interest are => 10 μm and => 25 μm, whereas for the life science industry, the sizes of inter-est for cleanroom air particle cleanliness are => 0.5 μm and => 5 μm. Higher sensitivities are required for semiconductor manufacturing plants where clean-room and minienvironment air is routinely monitored at 0.1 μm and lower. Hard Disk manufacturers typically monitor to around 0.2 μm to 0.3 μm and Flat Panel Display manufacturing environments to 0.3 μm and 1.0 μm.

Changes to ISO 14644 for Cleanrooms
96
USP <788>, EU 2.9.19 and JP 6.07 recognise that light obscuration is suitable for liquid particle counting in infusions and injections, whereas ISO 14644-1 [4] recognises that light scattering particle counters are appropriate for determining airborne contamination in cleanrooms.
For cleanroom users aseptically manufacturing pharmaceutical products for the European and American markets, there is a requirement to follow the guide-lines in EU GMP [2] and cGMP [1] respectively. Both documents define the airborne particulate count limits for different cleanroom operations, but neither defines the methods required to determine these count limits, nor do they define the instrument to be used and how it should be calibrated. However, EU GMP [2] states that ISO 14644-1 [4] should be used for methodology to deter-mine cleanroom air particle cleanliness classification and that ISO 14644-2 should be used for methodology for demonstrating continued compliance. The introduction in ISO 21501-4 [5] states “Monitoring particle contamination lev-els is required in various fields, e.g. in the electronic industry, in the pharmaceu-tical industry, in the manufacturing of precision machines and in medical opera-tions. Particle counters are useful instruments for monitoring particle contami-nation in air. The purpose of this part of ISO 21501 is to provide a calibration procedure and verification method for particle counters, so as to minimize the inaccuracy in the measurement result by a counter, as well as the differences in the results measured by different instruments.” The scope of ISO 21501-4 [5] states, “Instruments that conform to this part of ISO 21501 are used for the clas-sification of air cleanliness in cleanrooms and associated controlled environ-ments in accordance with ISO 14644-1”. So the importance of ISO 21501 [5] to cleanroom users looking to follow the guidance in GMP [2] is evident.
Equally the scope of ISO 21501-2 states “Instruments that meet this standard are used for the evaluation of cleanliness of pharmaceutical products (injec-tions, water for injections, infusions), as well as the measurements of num-ber/size distribution of particles in various liquids.” So the importance of ISO 21501 [5] to those in the pharmaceutical industry manufacturing injections, wa-ter for injections or infusions is also evident.
4. What standards exist? What is ISO 21501 replacing?
ISO 14644 [4] is a widely used standard for cleanroom classification using opti-cal particle counters. Despite the existence of ISO 14644 [4], prior to the ratifi-

Changes to ISO 14644 for Cleanrooms
97
cation and introduction of ISO 21501 [5] at the beginning of 2007, there were no ISO standards dealing with calibration and performance of the particle counters (OPC) used to classify cleanrooms to ISO 14644 [4]. Comprehensive non-ISO standards and calibration methods guidelines did exist however and have been employed by most major particle counter manufacturers. In summary, these standards are:
− ASTM F 328-98(2003) “Standard Practice for Calibration of an Air-borne Particle Counter Using Monodisperse Spherical Particles” (with-drawn May 2007).
− IEST-RP-CC014.1 “Calibration and Characterization of Optical Air-borne Particle Counters” (providing actual methods to perform the cali-bration).
− JIS B 9921:1997 “Light scattering automatic particle counter”, a Japa-nese standard which comprehensively deals with OPC design perform-ance, most notably in the area of counting efficiency.
The counting efficiency parameter has presented the most significant variable when it came to the actual count accuracy of individual OPC’s, especially air-borne counters.
5. Counting Efficiency
OPC’s typically feature a number of size channels into which particle counts are binned, each channel being calibrated to count particles greater than a specific particle size. Particle sizes are typically expressed in micrometers (μm). The term counting efficiency primarily refers to the ability of the OPC instrument to count particles at a specified size. Typically, calibration involves passing a con-tinuous stream of standard, mono-sized particles through the OPC’s sensor, which results in a stream of electrical pulses, each pulse being proportional to the size of each particle. The mono-sized standard particles produce a distribu-tion of pulse heights, the median of which is typically regarded as the appropri-ate channel calibration threshold for that size. Therefore, in the real world a par-ticle exactly the same size as a given channel would have a 50% probability of being counted (see Figure 2a). As a result, OPC’s calibrated in this manner are said to have a counting efficiency of 50%. Note however that this does not mean that the OPC will only count half of the particles in the real world.

Changes to ISO 14644 for Cleanrooms
98
ISO 21501 [5] makes use of the specification for counting efficiency accepted in the JIS B 9921 standard. This states that the counting efficiency should be 50% +/-20% (i.e. between 30% 70%) in the first channel (Figure 2). Addi-tionally, particles of between 1.5 X to 2.0 X the channel 1 particle size should be counted with an efficiency of 100% +/-10% (i.e. between 90% 110%) in the first channel (Figure 2b.)
ISO21501 Limits 50% +/ - 20% (30% to 70%)
Channel 1 size (um)
OPC smallest specified size.
Noise
N ISO21501 Limits 50% +/ - 20% (30% to 70%)
Channel 1 size (um)
OPC smallest specified size.
Noise
N At 1.5 x to 2 x the particle counters minimum specified size all particles should be counted in the first channel. ISO21501 allowed limits are 90% to 110%
Channel 1 size (um)Noise
N At 1.5 x to 2 x the particle counters minimum specified size all particles should be counted in the first channel. ISO21501 allowed limits are 90% to 110%
Channel 1 size (um)Noise
N
Figure 2a. The 50% calibration point. Figure 2b. Verifying 100% efficiency at a higher size.
6. Why was a new standard required?
Prior to ISO 21501 [5], it was not required that counting efficiency be checked at each calibration interval. There are many things that can impact counting effi-ciency during the lifetime of an OPC; for example a slight opto-mechanical mis-alignment of the illumination source can go undetected. Therefore, the situation exists where even though a given OPC may correctly size particles, it may be undercounting – in effect missing some of the particles. The new ISO 21501 [5] standard requires (among other elements) that the all-critical counting efficiency element be checked during calibration. To check counting efficiency, it is neces-sary that once calibrated for sizing characteristics using traceable size standards, the OPC under test must be run and compared to either an Electrostatic Classi-fier or an OPC instrument with higher sensitivity than the OPC under test. This OPC is considered to be a “secondary standard”, having been formally compared to an Electrostatic Classifier and verified as having 100% counting efficiency at the size of interest, i.e the channel 1 size of the OPC to be certified.
Changes to ISO 14644 for Cleanrooms
99
The full list of elements that ISO 21501 [5] requires to be tested in addition to the basic size calibration are as follows:
− Counting efficiency − Sizing resolution − False count rate − Concentration limit − Sampling flow rate − Sampling time − Sampling volume.
7. What is ISO 21501 and what improvements will it bring?
To quote from the ISO 21501 [5] standard: “The purpose of this part of ISO 21501 is to provide a calibration procedure
and verification method for particle counters, so as to minimize the inaccuracy in the measurement result by a counter, as well as the differences in the results measured by different instruments.”
Simply put, the ISO 21501 [5] standard will ensure that OPC instruments will size and count particles correctly, using a traceable reference instrument. Differ-ent OPC models from different manufacturers will therefore closely correlate in terms of actual particle counts recorded. This presents a significant step forward in providing traceable, accurate OPC tools to classify and validate cleanrooms to ISO 14644 [4].
8. Who should adopt ISO 21501?
Manufacturers of products requiring processing or assembly of goods and mate-rials within a cleanroom environment classified under ISO 14644 [4] should require that OPC instruments used be calibrated to the ISO 21501 [5] standard. This is particularly applicable to the pharmaceutical manufacturing industries employing sterile processing or filling lines.
Users of cleanrooms or optical particle counters with questions or concerns regarding the transition to ISO 21501 [5] should contact their particle counter supplier or cleanroom certifier.

Changes to ISO 14644 for Cleanrooms
100
References
1. Food and Drug Administration. Guidance for industry. Sterile drug products produced
by aseptic processing – current good manufacturing practice, 2004. U.S. De-
partment of Health and Human Services Food and Drug Administration Center
for Drug Evaluation and Research (CDER) Center for Biologics Evaluation and
Research (CBER) Office of Regulatory affairs (ORA) Division of Drug Informa-
tion, HFD-240 Center for Drug Evaluation and Research Food and Drug Ad-ministration 5600 Fishers Lane Rockville, MD 20857 USA.
2. European Commission. EudraLex. The Rules Governing Medicinal Products in the
European Union. Volume 4. EU Guidelines to Good Manufacturing Practice.
Medicinal products for human and veterinary use, Annex 1: Manufacture of Ster-
ile Medicinal Products, 14th February 2008. European Commission Enterprise
and Industry Directorate-General, B-1049 Bruxelles / Europese Commissie, B-1049 Brussel – Belgium.
3. European Commission. Ad Hoc GMP Inspections Services Group. EC Guide to Good
Manufacturing Practice. Revision to Annex 1. Manufacture of Sterile Medicinal Products, 30th May 2003.
4. ISO 14644-1:1999(E) Cleanrooms and associated controlled environments – Part 1:
Classification of air cleanliness 1st May 1999. International Organization for Standardization Case Postale 56 • CH-1211 Genève 20 • Switzerland.
5. ISO 21501-4 Determination of particle size distribution – Single particle light interaction
methods – Part 4: Light scattering airborne particle counter for clean spaces
2007. International Organization for Standardization Case Postale 56 • CH-1211
Genève 20 • Switzerland.
Additional information
The ISO 21501 family of standards extends beyond air particle counters to in-clude both scattering and extinction type liquid counters. The standard is split into four parts and all are available from ISO at http://www.iso.org
ISO 21501 Determination of particle size distribution – Single particle light interaction methods:

Changes to ISO 14644 for Cleanrooms
101
− Part 2: Light scattering liquid-borne particle counter − Part 3: Light extinction liquid-borne particle counter − Part 4: Light scattering airborne particle counter for clean spaces.
Hach Ultra manufactures a range of ISO 21501 compliant particle counters and are currently in the process of deploying an ISO 21501 field service capability for the calibration of existing products.
Particle counter owners and users with specific questions or concerns regarding IS0 21501 are invited to email the Hach Ultra ISO 21501 support team at [email protected]. Through this email address, one can access a panel of experts regarding ISO 21501 and receive prompt and accurate answers to ques-tions.

Nano- and Micro Structured Plastic Thin Film for Optical and Functional Surface Applications
102
Nano- and Micro Structured Plastic Thin Film for Optical and Functional Surface
Applications
Samuli Siitonen and Valtteri Kalima Nanocomb Oy, Finland
Lower energy consumption, longer lifetime, smaller size and greater reliability of lighting applications are features which can be implemented by using modern LED sources and nano- and micro-optics. Typically, if illumination is created by LEDs, a powerful collimation or balance lens are necessary in lighting modifica-tion. Nano- and micro structured lens enable power-efficiency and cost-efficiency solutions for large application environment.
Thin foil optical component creates new possibilities to implement lighting solutions to a number of special conditions, such as relations with the clean-room conditions. Flat surfaces provide an efficient use of space and facilitate cleaning and reduce the need for maintenance. LED light based micro-optical general lighting solutions are typically non heat generating compared to tradi-tional solution like fluorescence lamp lighting.
Figure 1. Nano- and micro-structured LED lens matrix for general lighting.

Nano- and Micro Structured Plastic Thin Film for Optical and Functional Surface Applications
103
Special design know-how combined with a high-level experience in nano- and micro lithographic and tooling processes allow producing customized flat plastic lens structures for devices and general lighting. A full mass production capabil-ity of reel-to-reel UV embossing, provides the entire supply chain from design to production of thin foil type optical components. Manufacturing technologies enable the production of microelements also for illumination and brightness enhancement of micro-displays including systems, for instance, from camera screens and measurement tools to mobile devices. One such application is in camera flash lenses. All micro- and nano-structured optical components are pro-duced in ISO 5 or ISO 7 class clean room environments.
Figure 2. Reel-to-reel UV embossing equipments with on-line quality control system in clean room environment.
High volume production capacities provide manufacturing of functional surfaces on cost-effect plastic foil. The main functional specifications of these surfaces are non-reflecting and dirt resistant (hydrophobic) properties by controlling the structure and the chemistry of the surface. The toughness and abrasion resistance of structured surfaces can be modified by using nano- and micro-structures and material features. High technology UV reel-to-reel manufacturing process en-ables the replication of large area functional surfaces. High volume and low cost of the micro and nano featured plastic foils is not limited only for high technol-ogy end products, but it can be used in disposable products such as self cleaning packing laminates and other cleantech solutions.

Nano- and Micro Structured Plastic Thin Film for Optical and Functional Surface Applications
104
Figure 3. (a) SEM images of UV reel to reel embossed nano-structured antireflection surface on top of the plastic thin film material and (b) micro-structured self cleaning sur-face on plastic material.

GENERAL SESSION
105
GENERAL SESSION

106
HEPA Filter Integrity Testing: ISO 14644-3 and Real Practice
107
HEPA Filter Integrity Testing: ISO 14644-3 and Real Practice
Alexander Fedotov Invar-project Company, Russia
Abstract
Standard ISO 14644-3 “Cleanrooms and associated controlled environments – Part 3: Test methods”, Annex B.6 describes procedure of installed HEPA filter integrity testing. But in fact this procedure is overcomplicated and requires op-erations that are not necessary for common practice of cleanroom testing. No-body follows this procedure that is more theoretical then practical.
One should clearly define what is necessary for research purposes, manufac-turers of filters or testing equipment and for wide practice of cleanroom qualifi-cation. It is necessary to consider difference between automatic and manual methods of sampling. Presentation discusses the practical approach of cleanroom HEPA filter on-site testing and gives a simple method for it. There is nothing new in this method. It summarizes with simple words what testing engineers should really do.
1. ISO 14644-3 scope of application and criteria
There are two different kinds HEPA and ULPA filter integrity tests:
− FAT – Factory Acceptance Test; − SAT – Site Acceptance Test.
FAT is to be made at manufacturer site uses and uses test rigs – complicated and expensive equipment. Manufacture can and must provide comprehensive testing of his products (FAT).

HEPA Filter Integrity Testing: ISO 14644-3 and Real Practice
108
FAT procedure is described in EN 1822-1-2009 “High efficiency air filters (HEPA and ULPA) – Part 1: Classification, performance testing, marking”.
Some important changes were made in EN-1822-1-2009 version in compari-son with previous one. Standard sets three groups of filter elements (E, H, U) instead of previous two groups (H and U): Group E (E10; E11; E12 insteaf of H10; H11; H12)
EPA filters Efficient Particulate Air filter
Group H (H13;H14) HEPA filters High Efficient Particulate Air filter
Group U (U15; U16; U17) ULPA filters Ultra Low Penetration Air filter
SAT is to be made at the point of use in cleanrooms.
SAT at user’s site must check (confirm or reject) FAT results at place of use with simpler procedures and equipment.
The purpose of SAT is to check:
− filter compliance with specification; − absence of damages occurred during shipping and handling; − absence of damages caused by installation process.
The scope of ISO 14644-3 is SAT – integrity testing of installed HEPA and ULPA.
There are two requirements for FAT an SAT procedures:
− SAT procedure should be always simpler than FAT, at least not more complicated;
− But criteria for FAT and SAT estimation must be the same!
Otherwise testing has no sense.

HEPA Filter Integrity Testing: ISO 14644-3 and Real Practice
109
Table 1. Classification of HEPA and ULPA filter according to EN 1822-1.
Overall value Local value Filter class Efficiency
(%) Penetration
(%) Efficiency
(%) Penetration
(%)
E10 ≥ 85 ≤ 15 - -
E11 ≥ 95 ≤ 5 - -
E12 ≥ 99.5 ≤ 0.5 - -
H13 ≥ 99.95 ≤ 0.05 ≥ 99.75 ≤ 0.25
H14 ≥ 99.995 ≤ 0.005 ≥ 99.975 ≤ 0.025
U15 ≥ 99.999 5 ≤ 0.000 5 ≥ 99.997 5 ≤ 0.002 5
U16 ≥ 99.999 95 ≤ 0.000 05 ≥ 99.999 75 ≤ 0.000 25
U17 ≥ 99.999 995 ≤ 0.000 005 ≥ 99.999 9 ≤ 0.000 1
Filter must satisfy both requirements during FAT to confirm given class. For example, filter can pass local value 0.025% for class H14 but fail overall value 0.005%. So filters must pass both criteria during SAT too (for filter H13-U17). But ISO 14644-3 describes procedure only for local efficiency testing that is not enough.
2. ISO 14644-3 filter testing procedure
Standard sets two stages of filter testing (item B.6.3.1):
1) “The clean side of the filter should be scanned for potential leak. During scanning with a DPC, detection of more then observed acceptable counts Ca in sample acquisition time Ts indicates the potential presence of a leak. In this case, the second stage should be performed. If there are no indications of potential leaks, further investigations are not necessary.”
2) “The probe should be returned to the place of maximum particle count under each potential leak and a stationary re-measurement should be performed. During the stationary re-measurement with the DPC, detection of more then the observed acceptable counts (Ca) in sustained residence time Tr indicates the presence of leak”.
Let’s follow these two stages.
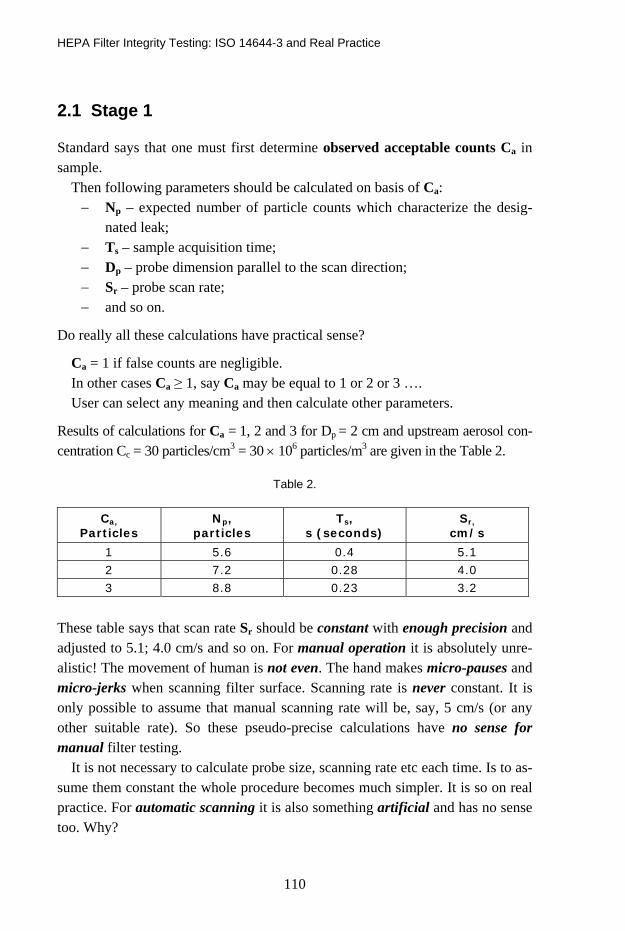
HEPA Filter Integrity Testing: ISO 14644-3 and Real Practice
110
2.1 Stage 1
Standard says that one must first determine observed acceptable counts Ca in sample.
Then following parameters should be calculated on basis of Ca: − Np – expected number of particle counts which characterize the desig-
nated leak; − Ts – sample acquisition time; − Dp – probe dimension parallel to the scan direction; − Sr – probe scan rate; − and so on.
Do really all these calculations have practical sense?
Ca = 1 if false counts are negligible. In other cases Ca ≥ 1, say Ca may be equal to 1 or 2 or 3 …. User can select any meaning and then calculate other parameters.
Results of calculations for Ca = 1, 2 and 3 for Dp = 2 cm and upstream aerosol con-centration Cc = 30 particles/cm3 = 30 × 106 particles/m3 are given in the Table 2.
Table 2.
Ca,
Particles Np,
particles Ts,
s (seconds) Sr,
cm/s
1 5.6 0.4 5.1 2 7.2 0.28 4.0 3 8.8 0.23 3.2
These table says that scan rate Sr should be constant with enough precision and adjusted to 5.1; 4.0 cm/s and so on. For manual operation it is absolutely unre-alistic! The movement of human is not even. The hand makes micro-pauses and micro-jerks when scanning filter surface. Scanning rate is never constant. It is only possible to assume that manual scanning rate will be, say, 5 cm/s (or any other suitable rate). So these pseudo-precise calculations have no sense for manual filter testing.
It is not necessary to calculate probe size, scanning rate etc each time. Is to as-sume them constant the whole procedure becomes much simpler. It is so on real practice. For automatic scanning it is also something artificial and has no sense too. Why?

HEPA Filter Integrity Testing: ISO 14644-3 and Real Practice
111
For Ca = 1, 2 and 3 standard requires to keep precise scanning rate 5.1; 4.0 and 3.2 cm/s, assuming that concentration of upstream aerosol of Cc = 30 × 106 particles/m3 and is always constant. But it is not true! This concentration fluctu-ates much more then what is considered by precision of scanning rate! So all this has no sense for high precision automatic controlled systems too. Of course, studies of aerosol distribution in air ducts, chambers, boxes, valves etc for nu-merous cases gives endless job for investigators but it is absolutely useless for practice.
What for should we first select artificially value of Ca and the calculate all these Ts, Sr and so on?
Why not to use constant values of scan rate Sr = 5 cm/s and simply count par-ticles before and after filter, then calculate efficiency and compare with table of EN 1822-1?
2.2 Stage 2
For stage 1 of testing Ca should be selected and can be equal to 1, 2, 3 etc. But for stage 2 it should be calculated and may be equal to 86, 121 or any other number. Different values have the same symbol. For standard this is not a good practice.
3. Philosophy of ISO 146443-3
The whole philosophy of installed integrity filter testing is to estimate only local penetration by following:
1) To set some theoretically acceptable level Ca for number of penetrating particles;
2) To find the potential leak;
3) To estimate whether this potential leak is really a leak.
Level Ca is to be defined each time. Then filter is to be tested whether it com-plies with this level or not. This is something contrary to accepted procedure, when at first real penetration should be determined by filter scanning and then real data should be compared with standard.
ISO 14644-3 does not consider integral penetration. So it does not give the whole picture of filter efficiency.
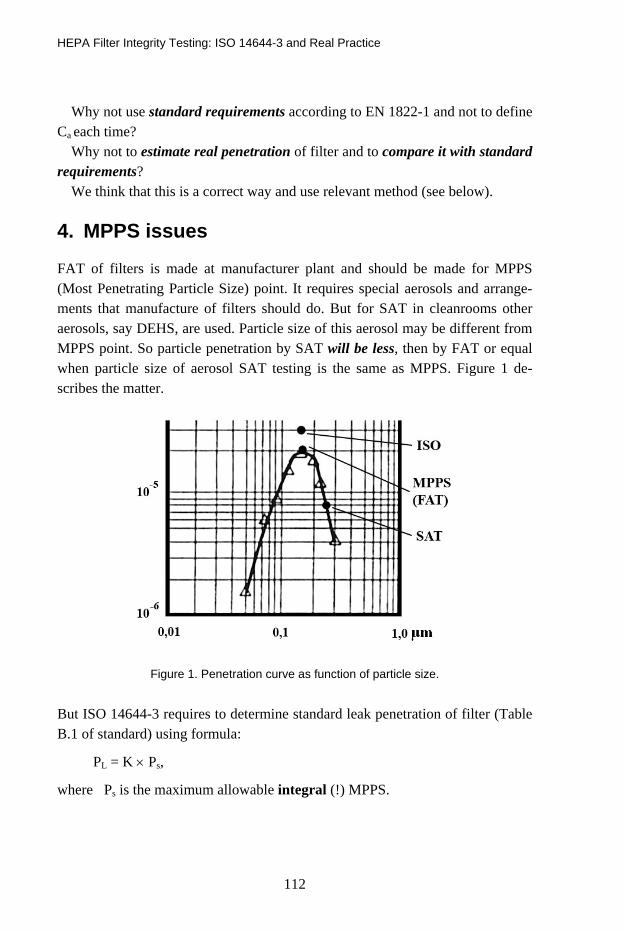
HEPA Filter Integrity Testing: ISO 14644-3 and Real Practice
112
Why not use standard requirements according to EN 1822-1 and not to define Ca each time?
Why not to estimate real penetration of filter and to compare it with standard requirements?
We think that this is a correct way and use relevant method (see below).
4. MPPS issues
FAT of filters is made at manufacturer plant and should be made for MPPS (Most Penetrating Particle Size) point. It requires special aerosols and arrange-ments that manufacture of filters should do. But for SAT in cleanrooms other aerosols, say DEHS, are used. Particle size of this aerosol may be different from MPPS point. So particle penetration by SAT will be less, then by FAT or equal when particle size of aerosol SAT testing is the same as MPPS. Figure 1 de-scribes the matter.
Figure 1. Penetration curve as function of particle size.
But ISO 14644-3 requires to determine standard leak penetration of filter (Table B.1 of standard) using formula:
PL = K × Ps,
where Ps is the maximum allowable integral (!) MPPS.

HEPA Filter Integrity Testing: ISO 14644-3 and Real Practice
113
ISO 14644-3 K in function of Ps:
Maximum allowable
penetration, Ps (MPPS)
≤ 5 x 10⁻⁴ ≤ 5 x 10⁻⁵ ≤ 5 x 10⁻⁶ ≤ 5 x 10⁻⁷ ≤ 5 x 10⁻⁸
Factor K 10 10 30 100 300
Note: EN 1822-1 defines penetration using %, ISO 14644-3 does not use %, so 0.005% = 5 × 10⁻³ % in EN 1822-1 is equivalent to 5 × 10⁻⁵ in ISO 14644-3.
4.1 Example
MPPS integral penetration for filter H14 is 0,005% or 5 × 10⁻⁵.
Factor K = 10 according to table B.1 of standard. Then PL = 10 × 5 × 10-5 = 5 × 10⁻⁴.
This PL value is to be used in further filter estimation. But this penetration is more then MPPS and real penetration at SAT point! It allows filter to be worse then it is at MPPS point. But actually filter is better at SAT procedure then at FAT for MPPS point (see Figure 1)! So standard gives unrealistic estimation. Distance between SAT and ISO points may be factor 100 or so. This is joy for Bad Filter Manufacturer.
5. Terms, definitions and others
What is observed acceptable counts Ca? Acceptable means something fixed that serves as criteria for estimation. Observed means real value that was registered during testing. But what is observed acceptable count? There are other mixings of sense and mistakes in the text that press user to guess and look for the sense. Different people can guess or understand different way. That is not good for standard.
Item B.6.3.3 says that “The performance of the dilution system used should be verified at the beginning and at the end of each period of use” with reference to IEST-RP-CC07.1:1992. How to do it at the customer’s site and what is it for?
Modern dilutors are stable and do not need often calibration. Period of calibra-tion should be pointed in the specification for dilutor by manufacture, and not in the standard. It should not be shorter then one year.

HEPA Filter Integrity Testing: ISO 14644-3 and Real Practice
114
6. ULPA filters
Is it always worth to determine local penetration on-site? To answer this ques-tion let’s make some calculations. N2m is the number of particles that will be sampled when:
− probe will pass given point,
− local penetration of filter is equal to its limit value PLlim for given up-stream aerosol concentration C1.
PLlim is the limit for local penetration according to EN 1822-1. Table 3 shows results of calculations for:
C1 = 108 particles/m3, Scan rate v = 3 cm/s, Particle counter flow rate 28.3 l/min, Size of probe that is parallel to direction of probe movement W = 1.5 cm.
Table 3.
Filter class H14 U15 U16 U17
PLlim, 0,025 0,0025 0,00025 0,0001
N2m 5,9 0,59 0,059 0,024
Test for local penetration has sense only for H14 filters if upstream aerosol con-centration C1 = 108 particles/m3, and scan rate v = 3 cm/s. For ULPA filter num-ber of particles is much les then 1. What to do?
There are only two solutions:
− to reduce scan rate, − to increase upstream aerosol concentration, that is aerosol challenge.
It means that for filter U16 scan rate should be 0.03 cm/s = when C1 = 108 parti-cles/m3. Time for testing of one filter will be about 30 hours. It may be arranged by automatic testing, but test time will be too long. Is it practical? – Hardly. Another way is to increase upstream aerosol concentration:
− for U15 up to 1 Mio particles/m3, − for U16 up to 10 Mio particles/m3, − for U17 up to 24 Mio particles/m3.
HEPA Filter Integrity Testing: ISO 14644-3 and Real Practice
115
Such load will contaminate filter and can cause molecular contamination in cleanrooms.
How to test ULPA filters? It is an open question for standardization.
7. General remarks
Sometimes I fall in doubt whether everything I say is true. Every certification company says that it certifies cleanrooms and filters according to ISO 14644-3. Some companies started to declare it even much earlier then ISO 14644-3 was approved and final text became available for public. It seems that cleanroom certification companies do not actually follow ISO 14644-3. May be they even did not read it at all. But all they refer on it in their certification reports! If I am not correct I would be very much grateful to watch the real example of use of ISO 14644-3 procedure. But we still cannot find it! Another matter is that ISO standard is a responsible document.
It is possible to define several stages of work with some standards:
− At the first stage user accepts standard on trust and thinks, that stan-dard it true and correct and hopes that it gives good tool for work;
− At the second stage user thinks that he is not clever enough to under-stand this wise standard;
− At the third stage he does not pay attention to standard or starts im-provisation because he must certify cleanrooms and prepare report;
− It is dangerous because different people make different improvisa-tions, which results are not the same. It eliminates the main goal of standard that to give everybody uniform procedure;
− At the final stage people feel disappointment and use standard only for formal reference and not for real testing.
We need clear and transparent standards that can serve as guidance for everyone and everyone could obtain the same result in the same conditions.
8. Proposals
1) To make application to ISO/TC 209 to arrange special WG on filters and to spread EN 1822 family of standards for globe scale, approving them as ISO standards;

HEPA Filter Integrity Testing: ISO 14644-3 and Real Practice
116
2) To make additional Annex to ISO 14644-3 for installed filter integrity test-ing or to make special standard;
3) To initiate special discussion regarding on-site testing of ULPA filters.
9. Procedure for installed filters integrity testing
9.1 Scope of application
The procedure is designated for on-site integrity testing of installed HEPA and ULPA filters (Site Acceptance Test – SAT). The result of testing should confirm (reject) filter class given in specification, to find local defects and estimate pene-tration. For filters H13-U17 test aerosols should be used. Filter H10-H12 (now E10-E12) should be tested only for overall penetration. For them atmosphere aerosol can be used. This test helps to define filter defects that were occurred during shipping, handling and installing operations. This procedure does not describe well-known details. It gives scheme of action.
Procedure consists of two parts:
− testing of overall penetration (efficiency); − testing of local penetration (efficiency).
Criteria of filter classification are given in EN 1822-1. Procedure describes only manual operations, but it can be transferred for automatic operations.
9.2 Instruments to be used:
− aerosol particle counter (one or two) with sample rate not less the 28 l/min; − test aerosol; − aerosol generator; − dilutor; − isokinetyc probe.
9.3 Testing of overall penetration
9.3.1. Filter class according to EN 1822-1 should be taken form filter specification. 9.3.2. To introduce test aerosol into the duct upstream the filter and estimate
upstream aerosol concentration C1.

HEPA Filter Integrity Testing: ISO 14644-3 and Real Practice
117
9.3.3 To scan downstream filter surface with overlapping movements of probe and define overall number N2 of particles that passed the filter during scanning process.
Scan rate is v. Distance between probe and filter surface 3–5 cm. Downstream aerosol concentration C2 will be:
C2 = N2 × 1 000/(28,3 × Ts),
where TS is scanning time, min, 1000 l/m3 is the factor to recalculate liters in m3. 9.3.4. Overall penetration will be:
Pint = (C2/C1) × 100%.
9.3.5. To compare calculated overall penetration and overall penetration accord-ing to EN 1822-1 and define whether filter passes this test or not.
9.4 Testing of local penetration
9.4.1. To repeat items 3.1 and 3.2. 9.4.2. To define air volume that will be sampled when probe is passing given
point (point with possible defect):
Vw = F × tw/60,
where F is particle counter sampling rate; tw is time when probe is passing given point, s – seconds; 60 seconds in minute.
tw = W/v,
where W – size of probe that is parallel to direction of probe movement; v – scanning rate, cm/c.
9.4.3. To define upstream aerosol concentration C1 and number of particles Nw1 that are in the volume Vw of upstream aerosol:
Nw1 = C1 × Vw,
9.4.4. To define acceptable concentration Cacc of downstream aerosol for given filter class:
Cacc = C1 × PLacc,
where PLacc is local penetration limit for given filter class according to EN 1822-1. 9.4.5. To define acceptable number Nacc of particles that can be in volume Vw
of downstream aerosol:
Nacc = Cacc × Vw,

HEPA Filter Integrity Testing: ISO 14644-3 and Real Practice
118
9.4.6. To define points with potential leaks. The procedure can be done in two different ways: a) Particle counter has “beep-mode”
Such particle counter gives “beep-signal” if number of particles during given times exceeds predetermined number. In our case number Nacc dur-ing time tw is time when probe is passing given point (samples volume Vw). If number of particles during time tw will exceed Nacc, particle counter will give “beep-signal” and this pointed should be tested for local efficiency. This procedure requires one operator who scans the filter.
b) Particle counter has not “beep-mode” This procedure requires two operators: one scans the filter, the other watches indication of particle counter. If number of particles will exceed will exceed Nacc during time tw, then this pointed should be tested for local efficiency. It is a rough procedure but it gives visible results that are enough precise for many applications.
9.4.7. Testing of local penetration at point with potential leaks 9.4.7.1 To define number of particles Nw2 that were sampled during time tw. 9.4.7.2 To calculate local penetration:
PL = (Nw2/Nw1) × 100%.
9.4.7.3 To compare calculated local penetration and local penetration according to EN 1822-1 and define whether filter passes this test or not.
9.5 Examples
9.5.1. Testing of overall penetration Filter H14 should be tested. Limit for overall penetration according to EN
1822-1 is 0.005%. Concentration of upstream aerosol is 108 particles/m3. Scan-ning time is 5 min. During scanning of filter N2 = 18 were registered.
Solution
Downstream aerosol concentration is:
C2 = N2 × 1 000/(28.3 × Ts) = 18 × 1 000/(28.3 × 5) = 130 particles/m3
Overall penetration is:
Pint = (C2/C1) × 100% = 130/108 100% = 1.3 × 10⁻⁴%.

HEPA Filter Integrity Testing: ISO 14644-3 and Real Practice
119
Limit for overall penetration for this filter is 0.005% = 5 × 10⁻³%. Filter passed the test. 9.5.2. Testing of local penetration Filter H14 should be tested. Limit for local penetration according to EN 1822-
1 is 0.025% or 2.5 × 10⁻⁴. Concentration of upstream aerosol C1 = 108 parti-cles/m3. Scanning rate v = 5 cm/s, Size of probe that is parallel to direction of probe movement W = 1.5 cm. Particle counter has “beep-mode”.
Solution
Calculation of acceptable number Nacc of particles that can be in volume Vw of downstream aerosol.
Time when probe is passing given point:
tw = W/v = 1.5/5 = 0.3 s.
Air volume that will be sampled when probe is passing given point (point with possible defect):
Vw = F × tw/60 = 28.3 × 0.3/60 = 0.14 liters = 1.4 × 10⁻⁴ m3.
Number of particles that are in the volume Vw of upstream aerosol:
Nw1 = C1 × Vw = 108 × 1,4 × 10-4 = 1,4 × 10⁴
Acceptable concentration Cacc of downstream aerosol for filter H14:
Cacc = C1 × PLacc = 108 × 2,5 × 10-4 = 2,5 × 10⁴.
Acceptable number Nacc of particles that can be in volume Vw of downstream aerosol:
Nacc = Cacc × Vw = 2,5 × 104 × 1,4 × 10-4 = 3,5.
Testing of local penetration at point with potential leaks
Particle counter gave “beep-signal” in some point and local penetration in this point should be estimated. In this point number of particles Nw2 that were sampled during time tw,
Nw2 = 3.
Local penetration is:
PL = (Nw2/Nw1) × 100% = (3/(1.4 × 104)) × 100% = 2.1 × 1 0-4 × 100% = 2.1 × 10⁻²% = 0.021%.
Filter formally passes the test close to the limit. It recommended to examine carefully area around this point.

ISO 21501-4 the New Standard for Calibration of Airborne Particle Counters for Clean Spaces – Will My Existing Particle Counter Comply
120
ISO 21501-4 the New Standard for Calibration of Airborne Particle Counters
for Clean Spaces – Will My Existing Particle Counter Comply
Patrik Bengtsson Brookhaven, Sweden
Abstract
This lecture will give a brief description of the new ISO 21501-4 calibrations stan-dard followed by some examples on the consequences when it is applied on elder instruments. It will also give some practical examples on how to handle this.
ISO 21501-4 is stricter in many respects compared to previous standards. The benefit of this is that new particle counters manufactured according to this stan-dard from different manufacturers will correlate better. In addition to this count-ers will also in general perform better.
The minor disadvantage is that many instruments manufactured before the standard came into effect will fail when calibrated against the new standard.
There are several tests where the demands are higher and hence the likelihood of failure for elder instruments will increase. Many instruments will typically fail one or more of the following tests: Size calibration, Verification of size set-ting, Counting efficiency, Size resolution and Response rate.
In the lecture there will be practical examples of this and also data showing how these different tests in some cases together narrows the accepted outcome. The aim with the lecture is to give the users of particle counters a better under-standing of how the demands in ISO can affect their existing installed base and give some ideas on how to form a rational for becoming ISO 21501-4 compliant without necessary throwing away all elder instruments.

Design of Purified Water Systems and Its Sampling for Modern On-line Analyzing Technology
121
Design of Purified Water Systems and Its Sampling for Modern On-line
Analyzing Technology
Christoffer Meyer Millipore, Denmark
Abstract
Purified Water (PW) is the most important reagent in a laboratory. In order to finally have a solution that fulfills all requirements from users or authorities there are many aspects that need to be taken into account.
This presentation goes briefly through some of very basic elements that should be predefined before design can actually take place: standards from application, selection of technology, material selection, PW storage and distribution, moni-toring, qualification/validation needs specification and so on.

How to Clean Clean?
122
How to Clean Clean?
Leila Kakko Tampere University of Applied Sciences, Finland
Abstract
Cleaning the cleanrooms is an essential element of contamination control. Deci-sions need to be made about the details of cleanroom maintenance and cleaning. Cleaning of a cleanroom should be performed on a daily basis. Improper clean-ing of the cleanroom can lead to contamination and a loss in end user product quality. Proper selection of equipment and materials is important for proper cleaning. Only products that have proven cleanroom performance records should be considered for use in cleanrooms. Applications and procedures need to be written and agreed upon by cleanroom management. There are many problems associated with cleaning, e.g.; who should do the cleaning, when should it be done, how often and when? All these questions should be answered and taken care of before good product quality can be reached. But first it has to be decided how clean the facility has to be and how it should be measured. New cleanrooms should be designed around to make them easier to clean. It makes them cheaper to maintain.
1. Introduction
In this paper I describe the Finnish way of professional cleaning and how the procedures can be done. To start with, there are some standards and definitions just to show you the backgrounds. Cleaning as a part of contamination control explains some reasons why cleaning should be done properly. Different kind of dirt has been explained to ensure differences in choosing the right cleaning method. Some examples of good procedures are mentioned.
How to Clean Clean?
123
2. Cleaning standards and determinations
In Finland there have been standards to determine cleaning vocabulary since 1983 and for cleaning machines since 1989. In 2010 the Finnish Standards As-sociation SFS has published new vocabulary of cleaning industry (SFS 5967) [1] which combines the old ones and has some more determinations. The standard determines cleaning as a cleansing, protection and maintenance of surfaces, as well as arrangement works done indoors in a professional way. In the same stan-dard the cleanroom cleaning is determined as a cleaning to be done in spaces where the cleanliness and the space is defined by the standards, for example standard SFS-EN ISO 14644-1.
Cleaning can be determined as an assistance work for main operations. It is the main operation only for service supplies. Cleanroom cannot be clean without cleaning. Whyte (2003) [2] gives in his book reasons why a cleanroom must be cleaned. He wonders why so much money and effort is used to design and con-struction but only some thought may go into making and keeping the room clean. Cleanroom surfaces do get dirty and must be cleaned even if they seem to be clean and no visible dirt can be seen.
Ramstorp explains that the purpose of cleaning cleanrooms and clean zones is to release, collect and remove all undesired contaminants from surfaces with the regard to cleanliness. [3]
3. Contaminants and dirt
The vocabulary of cleaning industry defines dirt as follows “Dirt is uncleanness that reduces the value of the use of surfaces” [1]. The same thing can be said about substances or physical risk factors that are found in the wrong place and/or at the wrong time.
Dirt can be divided into groups consisting of solid materials, chemicals and physical conditions. It is important to define what is to be considered as a con-taminant and what is to be considered as a critical contaminant. [1, 4]
The need to remove dirt depends on the surface or place where it is, as well the activities that take place in that space. Professional cleaner knows how and when dirt must be removed. Even in cleanrooms some dust might be acceptable when it is high up but in process table it can be dangerous. Different kind of dirt and its urgency of cleaning is shown in Figure 1.

How to Clean Clean?
124
Dirt can be:
• Water soluble
• Organic solvents soluble
• Does not soluble
• Microbesharmful
dangerous
acceptable
disturbing
NEED TO REMOVE DIRT
Figure 1. The need to remove dirt and its consistence.
Dirt finds its way to a surface mainly two different routes. By landing on it like a dust particle lands a surface or dirty surface touches the clean one and smears it, for example fingerprints. Normally in office building the major part of dirt (80%) enters the room from outside on shoes and only 20% originate with people. [4]
If cleanroom entering from outside is blocked, so the main dirt comes with people or the products. In many cases the dirt in cleanroom might be particles and microbes attached to them and the main force that hold particles to clean-room surfaces is the London – Van der Waal’s force as an inter-molecular force. Electrostatic forces might occur, but it depends on the type of materials used. After wet cleaning, some biofilm can form. It can form if the surface has not been dried and some residues of detergent have been left there. [2, 4] Particulate contaminants can be divided into ”dead/nonviable particles” and ”live/viable particles”. They can be more or less harmful, depending on the nature of what is being produced or handled.
One way to classify contaminants is by substance and energy as in Table 1.
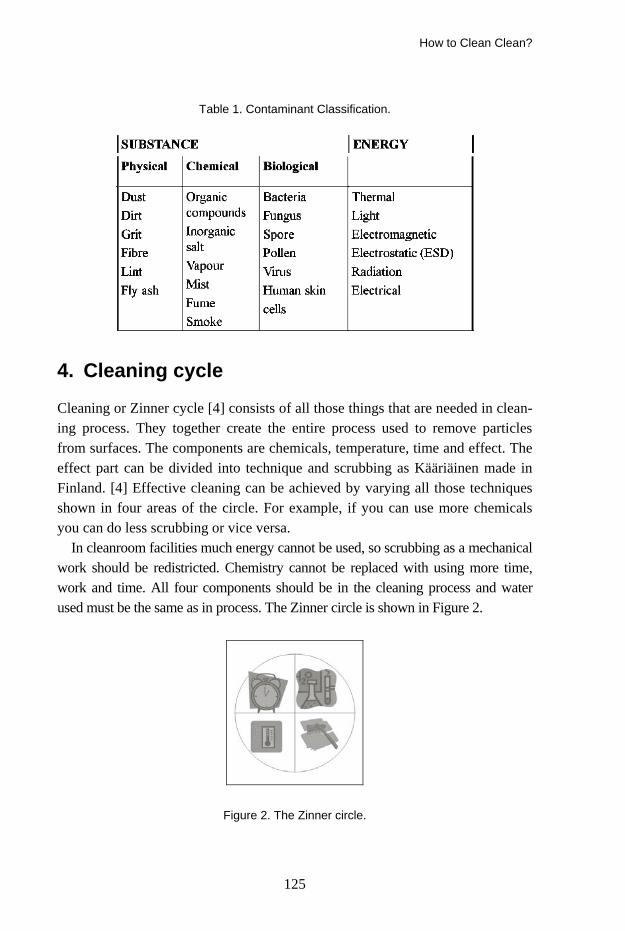
How to Clean Clean?
125
Table 1. Contaminant Classification.
4. Cleaning cycle
Cleaning or Zinner cycle [4] consists of all those things that are needed in clean-ing process. They together create the entire process used to remove particles from surfaces. The components are chemicals, temperature, time and effect. The effect part can be divided into technique and scrubbing as Kääriäinen made in Finland. [4] Effective cleaning can be achieved by varying all those techniques shown in four areas of the circle. For example, if you can use more chemicals you can do less scrubbing or vice versa.
In cleanroom facilities much energy cannot be used, so scrubbing as a mechanical work should be redistricted. Chemistry cannot be replaced with using more time, work and time. All four components should be in the cleaning process and water used must be the same as in process. The Zinner circle is shown in Figure 2.
Figure 2. The Zinner circle.
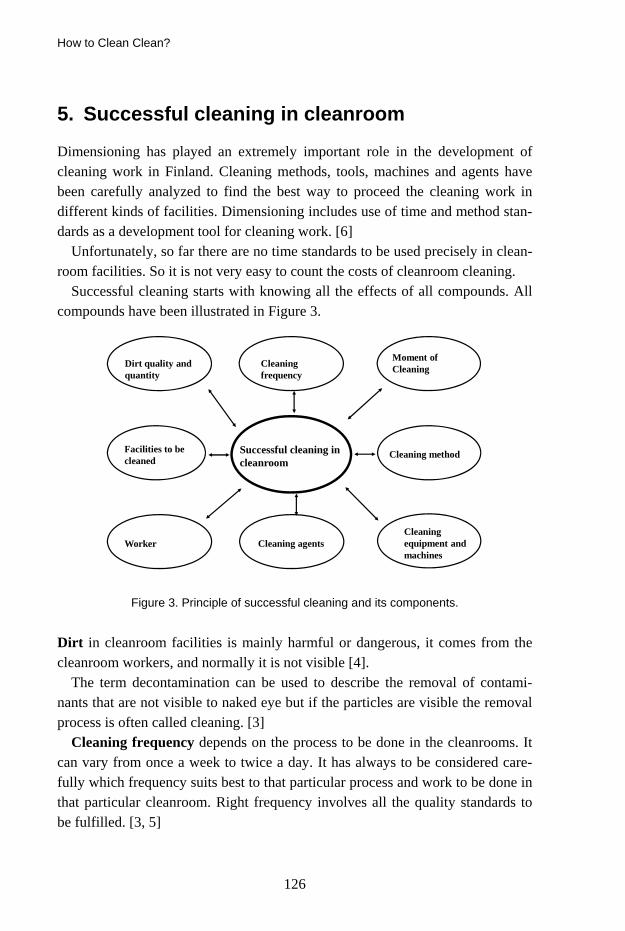
How to Clean Clean?
126
5. Successful cleaning in cleanroom
Dimensioning has played an extremely important role in the development of cleaning work in Finland. Cleaning methods, tools, machines and agents have been carefully analyzed to find the best way to proceed the cleaning work in different kinds of facilities. Dimensioning includes use of time and method stan-dards as a development tool for cleaning work. [6]
Unfortunately, so far there are no time standards to be used precisely in clean-room facilities. So it is not very easy to count the costs of cleanroom cleaning.
Successful cleaning starts with knowing all the effects of all compounds. All compounds have been illustrated in Figure 3.
Dirt quality and quantity
Facilities to be cleaned
Worker
Cleaning frequency
Cleaning method
Cleaning equipment and machines
Cleaning agents
Moment of Cleaning
Successful cleaning in cleanroom
Figure 3. Principle of successful cleaning and its components.
Dirt in cleanroom facilities is mainly harmful or dangerous, it comes from the cleanroom workers, and normally it is not visible [4].
The term decontamination can be used to describe the removal of contami-nants that are not visible to naked eye but if the particles are visible the removal process is often called cleaning. [3]
Cleaning frequency depends on the process to be done in the cleanrooms. It can vary from once a week to twice a day. It has always to be considered care-fully which frequency suits best to that particular process and work to be done in that particular cleanroom. Right frequency involves all the quality standards to be fulfilled. [3, 5]

How to Clean Clean?
127
Choosing the right time for cleaning to be done can be very hard. Quite of-ten the proper cleaning by cleaning professionals can be done after the clean-room workers have finished their work. But at the same time it must be remem-bered that also the cleanroom workers do some cleaning during their workday. LAF-benches should be cleaned after each work. [3, 5]
Cleaning method and program should be chosen to be the most suitable for that clean room regarding the surfaces and products made in that space. At the same time the classified cleanliness must be defined and the desired cleanliness level should be obtained. Damp and moist methods are recommended. In damp wiping wiped surface dries immediately and it does not leave drop stains. Moist wiping leaves some moist onto the surface but it dries by itself. Using these methods the surface can be disinfected soon after wiping. The water used should be cleaned water (filtered or ionic). [3, 5]
Cleaning equipment and machines should be chosen by purpose. High qual-ity is the starting point and all the surfaces must be smooth and tight as well as easy to clean.
Using the trolleys depends on the space to be cleaned. If trolleys are needed, they should have a proper place for storage. All equipment and machines should be cleaned after work. In certain places electrostatic forces must be considered. Cleaning cloths should be folded so that there is always clean surface available to each stroke. [3, 5]
Cleaning agents variation needs to be done considering the cleanroom regula-tions. The right dosage is crucial and the cleaning agent should be added to the water when making up a cleaning solution. Then there is no foam forming. Cleaning solu-tions should be applied with a cloth and not sprayed directly to the surface. [3, 5]
Worker should have the right attitude to do cleanroom cleaning. He or she must have good knowledge about hygiene and the ways to work in cleanroom. Always work from the clean area towards less clean areas. Airflow should be considered, so the work goes from the filter outwards and downwards. The cleaner’s movements should be considered and done in the same direction, in right order and with patience. Exact plans should be obeyed. Orders should be good and clear enough to follow. While cleaning, no touching of the clean surface can be done. Regular all day cleaning reduces the need of periodic cleaning. [3, 5]
Facilities to be cleaned can vary very much depending on the field of busi-ness. Some facilities might be old and worn and others brand new. Cleaning in different facilities makes a difference to the work itself. Worn surfaces need more work to be clean. Production areas can be divided into critical areas and

How to Clean Clean?
128
more general areas. Cleaning instructions should take into special account the critical areas. [3, 5]
6. Working instructions to cleanroom cleaning
Proper working instructions for cleanroom cleaning must be much specified, all details should be mentioned. In the working plan there should be at least these things:
− Time of cleaning − Work order − Materials used − Equipment and detergents used − Schedule of the works to be done − Checking list − In the text specified method explanations − Who made the instructions?
o The name of that person o When? The date.
7. Cleaning costs
There are no actual cleaning standards for cleanrooms, but when existing stan-dards can be used for calculation of cleaning time, more help time should be added to cleaning time. The need of more help time comes from the time needed to clothing and some tasks should be done twice, for example wiping the floors with a cleaning agent and then again with a disinfectant.
How often the cleanroom should be cleaned depends on the processes to be done in that space. Offices might be cleaned once a week while a cleanroom needs to cleaned twice a day.
Critical control points need more attention and that might increase the costs. Existing control points vary in different kinds of cleanrooms. So every space should be calculated on their own.
When supplying cleaning equipment and agents the word cleanroom might tri-ple the price of the product. Some equipment from the field of food technology could be as good as so called “cleanroom products”. They are quite often easy to sanitize or sterilize. The used amount of cleaning agent can nowadays be only 2 milliliters per 5 liters water. So there might be cleanrooms that do not need actual cleanroom agents at all. More important is to use the right kind of water.

How to Clean Clean?
129
References
1. SFS 5967 2010, Vocabulary of cleaning industry. Finnish Standards Association SFS.
2. Whyte, W. 2003. Cleanroom Technology, Fundamentals of Design, testing and Opera-tion, Chichester, John Wiley & Sons, Ltd.
3. Ramstorp, M. 2000. Introduction to Contamination Control and Cleanroom Technology, Weinheim, WILEY-VCH.
4. Kääriäinen, P. 1998. Dirt. In: Kujala (ed.) Cleaning manual. Finnish Association of Cleaning Technology 1:8.
5. Kääriäinen, P. 1998. Cleaning methods. In: Kujala (ed.) Cleaning manual. Finnish Association of Cleaning Technology 1:8.
7. Yltiö, H. 1998. Dimensioning cleaning work. In: Kujala (ed.) Cleaning manual. Finnish Association of Cleaning Technology 1:8.
8. Kakko L. 2007. Cleaning and indoor air. In: Abstracts of the International Conference on Healthy Air – Better Work; 2007 May 29–31; Helsinki, Finland.

Cleanroom Design and Construction
130
Cleanroom Design and Construction
Jukka Vasara Insinööritoimisto Granlund Kuopio Oy, Finland
1. Cleanroom standards
Previously the most commonly used cleanroom standard was US Federal Stan-dard 209, first published in 1963. The last version of the standard was FED STD 209E (purity classes were 1 ... 100 000). A new standard EN ISO 14644-1 was established and published on 14.2.2000. EN is the mark for an approved stan-dard of the European Committee for Standardization, CEN. ISO is the mark for an approved standard of the International Organization for Standardization.
2. EN ISO 14644 structure
Part 1: Classification of air cleanliness
Part 2: Specifications for testing and monitoring to prove continued compliance with ISO 14644-1
Part 3: Metrology and test methods
Part 4: Design, construction, and start-up
Part 5: Operations
Part 6: Terms and definitions
Part 7: Enhanced clean devices
Part 8: Classification of airborne molecular contamination.

Cleanroom Design and Construction
131
3. EN-ISO 14644-1 (particles / m3 air)
ISO classi-
fication
FED 209E 0,1 µm 0,2 µm 0,3 µm 0,5 µm 1 µm 5 µm
1 10 2 2 100 24 10 4 3 1 1 000 237 102 35 8 4 10 10 000 2 370 1 020 352 83 5 100 100 000 23 700 10 200 3 520 832 29 6 1 000 10 00 000 237 000 102 000 35 200 8 320 293 7 10 000 352 000 83 200 2 930 8 1 00 000 3 520 000 832 000 29 300 9 35 200 000 8 320 000 293 000
4. GMP-Grades
Good Manufacturing Practice (GMP): EU guidance on good manufacturing practice for medicinal products Grade A, B, C and D. Typical Grade operations are:
A: Product preparation and filling (usually in a laminar flow cabinet) B: Grade-A background environment C: Preparation of sterile filtered solutions, preparation of terminally sterilized
products D: Material preparation.
5. Occupancy states
As-built:
Condition where the installation is complete, with all services connected and functioning but with no production equipment, materials, or personnel present.
At-rest:
Condition where the installation is complete with equipment installed and operating in a manner agreed upon by the customer and supplier but with no personnel present.

Cleanroom Design and Construction
132
In-operation:
Condition where the installation is functioning in the specified manner, with the specified number of personnel present and working as agreed in the manner agreed upon.
6. GMP and EN ISO correlation of particle sizes
GMP EN-ISO 14644-1 FED 209E A 5 100 B 5 100 C 7 10 000 D 8 100 000
7. Purpose of protection
When designing a new clean room it is important to understand the main factor of upkeeping the cleanliness:
Protecting process or product from particles − Particle classification EN-ISO 14644-1
Protecting process or product from particles, bacteria and viruses − GMP-class and cleanliness classification EN-ISO 14644-1
Protecting personnel and containing biological agents − Biohazard classification
Any combination of the above.
8. Particle concentrations
In these different locations the number of particles in one liter of air is typically:
− Highway 1 billion − City 100 million − Rural area 1 million − Polar ice pack 10 000 − Cleanroom 3.5 (class 5) − Cleanroom 350 (class 7).

Cleanroom Design and Construction
133
9. Layout design
Efficient design layout is a key to success. Areas and volumes should be mini-mized because of operating costs, but space should be enough to perform all the necessary functions. Personnel and material flows should be separated. Gowning and airlock facilities should be adequate. Cleanroom construction should be consistent in all areas and fit for purpose for the cleanliness classification. Pres-sure differences and the problems caused by excess over pressure should be taken into account. Technology needs a lot of space (AHU-rooms, ducts).
10. General construction
Typical cleanroom wall constructions are galvanized sheet steel with a bonded polyurethane surface finish or powder coated sheet steel. Floor materials are vinyl or epoxy resins. Lighting should be flush mounted units, recessed into the ceiling, with glass surfaces maintained from above. Supply air HEPA filters supplied fresh air from a central HVAC unit (HEPA replaced room side at about 8 ... 15-year intervals). Low level air extracts at junction with floor. Cell prepa-ration area exhaust air is HEPA filtered. For inspection all facilities should have viewing partitions between rooms, zones, from the external viewing corridor, and even from above.
11. Facility environmental requirements, storage conditions
GMP does not provide conditions – the process determines the requirements. General guidance values:
Temperature + 20 C + 16 … + 25 C
Humidity (rh) 35% 25 …. 50%
Excess pressure + 15 Pa - 30 … + 60 Pa
Pressure difference 10 Pa 0 … 20 Pa Requirements should be carefully considered, such as the precise moisture re-quirements, this example representing an expensive operating cost.
If process requirements are critical, they should be clearly defined.

Cleanroom Design and Construction
134
12. Air change rates
Class 1 Air change Flow
8 10 … 25 turbulent 7 15 … 40 turbulent 6 20 … 100 turbulent 5 25 … 400 turbulent (B) or laminar (A) 4 200 … 600 laminar 3 600 … laminar
Air change rates are affected by the size of process emissions, heat loads, proc-ess requirements, the number of personnel and operating mode.
13. Building information modeling BIM
Building information modeling covers geometry, spatial relationships, light analysis, geographic information, quantities and properties of building compo-nents (for example manufacturers’ details). BIM can be used to demonstrate the entire building life cycle, including the processes of construction and facility operation. Quantities and shared properties of materials can be extracted easily. Systems, assemblies and sequences can be shown in a relative scale with the entire facility or group of facilities.
Illustration of a design gives users an opportunity to understand their role in the design process and their effect on the final product.
Some examples of recently designed cleanrooms.

HOSPITAL SESSION
135
HOSPITAL SESSION

136

High Tech Hospital
137
High Tech Hospital
Salme Nurmi, Seppo Enbom, Kimmo Heinonen, Gun Wirtanen*, Satu Salo* and Hannu Salmela
VTT, Finland *VTT Expert Services Ltd, Finland
1. Introduction
Hygiene, holistic management has become an important component of a com-prehensive health care, infectious disease prevention and resolution. MRSA spread of record in 2008 and it still caused a nation-wide problem is a serious threat to Finnish health care. In Finland, hospital infections annually cause an estimated 1 500 deaths and the management of 195–492 million euros in addi-tional costs. One infection per case treatment cost increase is in the United States and Great Britain, 9 400 EUR 3 700 EUR. In Finland, only the surgical wound infections in operating expenses for the years 1988–1990 was 200 million euros. (Finnish Medical Journal 18–19/2008 vsk 63). Previous estimates of nosocomial infections caused by the additional costs at the European level are the tens of billions of euros annually. Prevention of hospital infections is estimated to be economically profitable one preventive health-care activities.
Better economic and therapeutic outcome in the health sector is needed to reach new solutions that improve productivity and develop financial and human resources. This requires technology to large-scale systemic innovation, ie, a completely new types of approaches that affect the sector deeper practices of all actors. Demanding high-care hospital hygiene measures designed to ensure medical personnel are healthy and safe working conditions and promote the pa-tient's healing process.

High Tech Hospital
138
2. Projects
The aim of the projects is to develop comprehensive concepts for managing high level hygiene in hospitals. The study takes advantage of best practices used in high-tech industry to benchmark and adapt new operation models for health care sector. The project recognises and assesses potential risks in the hygiene value chains and generates tentative proposals for improvement. The project will focus on the following work packages: state-of-the-art, high hygiene zones, protective clothing and drapes, cleaning, service and maintenance, hospital logistics, man-agement, reporting and exploitation. Boosting the hygiene level impacts posi-tively in reducing the number and costs caused by hospital epidemics as well as improves personnel and patient safety, and the overall economy of the health care sector.
Figure 1. High Tech Hospital projects.
High Tech Hospital projects develop a high hygiene, holistic management, iden-tify problem areas and develop preliminary improvement solutions by develop-ing new end-products and using high-tech industries (including electronics and

High Tech Hospital
139
pharmaceuticals) to operate the identified cleaner production practices. Essential are project products and services, hygiene risk assessment service providers and end-users point of view, the life cycle of products and services as well as optimal management of multi-use and recycling opportunities. These actions will con-tribute to improving hospital environment hygiene level, developed infections prevent the conduct and management measures.
High hospital hygiene management is influenced by several factors, including, among others nursing practises, logistics, facilities, equipment and care for pa-tients and staff uniforms characteristics and maintenance practices. The project examines the activities cited above, as well as hygiene factors for each compo-nent of patient care overall hygiene standards.
2.1 Concepts for managing high level hygiene in hospitas
“Concepts for managing high level hygiene in hospitals” is a research project which will research and develop high hygiene holistic management of the health sector and the creation of a new high level of hygiene management concept for hospitals. In creating the management concept VTT utilizes its strong expertise in technology and the pharmaceutical industry proven procedures and tries to apply them in the hospital environment. The project aims to develop a high hy-giene, holistic management, identify problem areas and develop preliminary improvement solutions. These actions will help to improve hospital hygiene, in particular the high hygiene level cure methods. When the level of hygiene im-proves, it will have a positive impact of nosocomial infections and the cost of health care management and improve overall profitability.
2.2 New products and services for high level hygiene
“New products and services for high level hygiene” is a product development industrial company group project, which will immediately benefit results from the research project and develop high hygiene products and service concepts for new national and international business. The aim is rapid and efficient exploita-tion of the research result in development of new products and services. The project develops businesses related to the management of high hygiene products, services, processes and concepts, and thus generates new business for hospitals and companies in the cluster of health care value chains. The future service con-
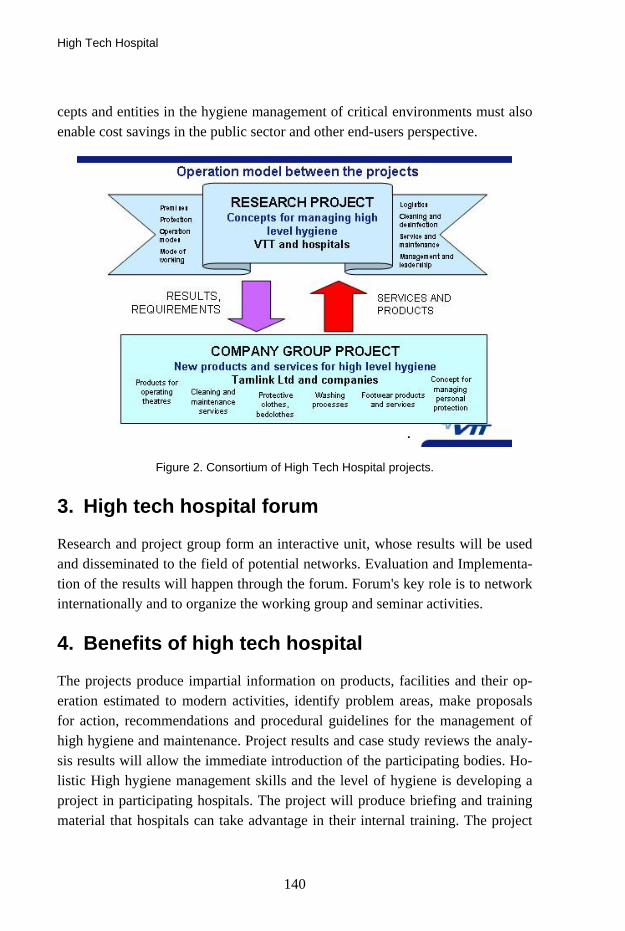
High Tech Hospital
140
cepts and entities in the hygiene management of critical environments must also enable cost savings in the public sector and other end-users perspective.
Figure 2. Consortium of High Tech Hospital projects.
3. High tech hospital forum
Research and project group form an interactive unit, whose results will be used and disseminated to the field of potential networks. Evaluation and Implementa-tion of the results will happen through the forum. Forum's key role is to network internationally and to organize the working group and seminar activities.
4. Benefits of high tech hospital
The projects produce impartial information on products, facilities and their op-eration estimated to modern activities, identify problem areas, make proposals for action, recommendations and procedural guidelines for the management of high hygiene and maintenance. Project results and case study reviews the analy-sis results will allow the immediate introduction of the participating bodies. Ho-listic High hygiene management skills and the level of hygiene is developing a project in participating hospitals. The project will produce briefing and training material that hospitals can take advantage in their internal training. The project

High Tech Hospital
141
will create conditions for health technology companies developing new products and services for markets in Finland and internationally. The project results will create the conditions for cost savings in more efficient hospital infection control. Health care overall economy improves, which will benefit the health sector op-erators, consumers and society.
Results of the project will be protective materials and products such as protec-tive wear clothing and footwear, bedding and drapes of medical staff and pa-tients. Maintenance services, the key findings of new service concepts and enti-ties such as washing, cleaning, sterilization and logistics processes together gar-ment care. The deliverables of these projects will be improved services for scheduled cleaning and disinfecting of the premises as well as of cleaning meth-ods for ventilation systems, cleaning services and equipment. These projects are aiming at a holistic human security concept for management of hospital envi-ronments.
Figure 3. High Tech Hospital Forum.
Clothing Systems Used in Operating Rooms – A Question of Patient Safety
142
Clothing Systems Used in Operating Rooms – A Question of Patient Safety
Bengt Ljungqvist and Berit Reinmüller Building Services Engineering, KTH, Sweden
Abstract
Clothing systems used in operating rooms are compared to clothing systems used in food industry and in pharmaceutical manufacturing. For all these indus-tries the control of the concentration of airborne bacteria-carrying particles are of vital importance. The emission of large particles with regard to clothing system quality is commented. Results from the study can be used to calculate expected concentrations of airborne aerobic colony forming units in the operation room when clothing system and number of people in the room are known. The study shows that the commonly used protective clothing systems need to be upgraded in operation rooms where patients, sensitive to infections undergo operations.
1. Introduction
Today, clothing and clothing systems for cleanrooms and associated controlled environments are mainly tested with regard to material properties such as parti-cle generation, particle filtration, and resistance to wear and tear-related damage. Increasing cleanliness demands during operation of infection sensitive patients require in-depth knowledge regarding the performance of operation clothing systems.
A dispersal chamber or “body-box” has been used to study cleanroom garment protection efficiency by, e.g., Whyte et al. (1976), Hoborn (1981), Whyte and Bailey (1985), Ljungqvist and Reinmüller (2004) and Whyte and Hejab (2007). Measurements are carried out in order to relate airborne dispersal of total par-

Clothing Systems Used in Operating Rooms – A Question of Patient Safety
143
ticulates and/or viable particles to the quality of fabrics and the design of the evaluated clothing system.
The authors have performed tests on selected clothing systems in a modified dispersal chamber with regard to the efficacy of the clothing system to retain particles from people. Results are reported from tests carried out with cleanroom clothing systems and surgical laundered and sterilized by steam 1, 25, and 50 times, respectively, see Ljungqvist and Reinmüller (2004). However, it should be mentioned that according to practice at Swedish hospitals surgical clothing systems need not be sterilized after laundering. Comparison of the source strengths for people dressed in various clothing systems are shown in Table 1 and Table 2.
The source strength is described as the number of total or viable (Colony Forming Units (CFU)) airborne particulates per second emitted from one person. Data are given as mean values based on several test subjects dressed in specific clothing systems. It can be noted from Table 1 that the particulate levels reach higher values at 25 washes and sterilizing cycles than after 50. This might be explained by the fact that after certain number of washes and sterilizing cycles the fabric releases particles. With time, the particles released from the fabric seem to be washed away.
Table 1. Comparison of data (mean values per person) of the source strength (number of particles per second and CFU per second) from people dressed in various clothing sys-tems laundered and sterilized once, 25 times and 50 times, respectively (from Ljungqvist and Reinmüller 2004).
Number per second from one (1) person Clothing system Contaminant
1 wash 25 washes 50 washes Particles ≥ 0.5 µm 4 060 13 875 12 207 Particles ≥ 5 µm 270 535 698
Surgical clothing system; polyester (50%) and cotton (50%) CFU 1.7 4.2 9.0
Particles ≥ 0.5 µm 585 3 950 2 860
Particles ≥ 5 µm 9 70 36
High quality cleanroom clothing system; polyester (99%) and carbon fiber (1%) CFU 0.38 0.49 1.14

Clothing Systems Used in Operating Rooms – A Question of Patient Safety
144
Table 2. Comparison of data (mean values per person) of the source strength (number of particles per second and CFU per second) from people dressed in clothing systems for the food industry laundered once, and 40 times, respectively (from Ljungqvist and Rein-müller 2008).
Number per second from one (1) person Clothing system Contaminant
New 1 wash 40 washes Particles ≥ 0.5 µm 99 885 49 531 Particles ≥ 5 µm 2 790 1 780 Particles ≥ 25 µm 738 506
Food industry polyester (65%) and cotton (35%)
CFU 11.8 13.8 Particles ≥ 0.5 µm 24 368 17 249 Particles ≥ 5 µm 1 571 1 048 Particles ≥ 25 µm 462 329
Food industry polyester (65%) and cotton (35%) in combination with special underwear; polyester (100%) CFU 9.0 12.6
2. Material and Methods
Containment tests in the dispersal chamber have been carried out to evaluate a cleanroom quality clothing systems for operation rooms – washed and sterilized 25 and 50 times respectively – by measuring the concentration of airborne par-ticulates and viable particles (as aerobic CFU) in the exhaust air, see Ljungqvist and Reinmüller 2004.
During the measurements the test subjects (young men) performed standard-ized cycles of movements that included arm movements, walk in place and knee bends at a set speed. These movements are, in principle, comparable with those described in IES-RP-CC003.2 (1993). Prior to each cycle of movement, the test subject stood still to avoid the influence of particle generation from the previous test cycle. The evaluated clothing systems had five test subjects performing the standardized cycles of movements four times.
By using the air volume flow in the dispersal chamber and the measured con-centrations, the source strengths of each clothing system was estimated. The source strengths reported are mean values per clothing system in total number of airborne particles (≥ 0.5 µm and ≥ 5 µm) per second and person and airborne aero-bic colony forming units (CFUs) per second and person.
Clothing Systems Used in Operating Rooms – A Question of Patient Safety
145
Both in the test chamber and in the operating room the total number of air-borne particulates was determined using a particle counter (DPC; HiacRoyco 245), and viable particles collected using a slit sampler (FH3®, d50-value 1.6 µm). All instruments were connected to the exhaust duct and operated according to the manufacturers’ instructions. Microbial growth medium for all tests was standard medium Tryptic Soy Agar (TSA) in 9 cm Petri dishes. The TSA plates were incubated for not less than three days at 32˚C followed by not less than two days at room temperature. The recorded number of CFU was characterized by phase contrast direct microscopy.
2.1 Clothing systems evaluated in test chamber
The clothing systems evaluated here are surgical clothing system, cleanroom qual-ity, XR60 (99% polyester, 1% carbon fiber) in combination with special under-garment, XA80 100% polyester) and have been supplied by Berendsen Textil Service AB, Sweden. The clothing systems were evaluated in the dispersal cham-ber after being laundered and sterilized by steam 25 and 50 times respectively.
2.2 Clothing systems evaluated in operating rooms
Measurements have also been performed in one operating room during ongoing surgery with mainly the same operating team (7–9 people), dressed in three dif-ferent clothing systems. The operating room was supplied with HEPA-filtered air with an air volume flow of 0.65 m3/s. The air movements in the room could be characterized as turbulent mixing.
The three clothing systems were
1. Common surgical clothing system, 50% cotton and 50% polyester.
2. Common surgical clothing system, 70% cotton and 29% polyester and 1% carbon fiber.
3. Surgical clothing of cleanroom quality (99% polyester, 1% carbon fiber) with underwear also tested in the test chamber.
3. Results
Table 3 presents data from the evaluation in the test chamber of the surgical clothing system in cleanroom quality.

Clothing Systems Used in Operating Rooms – A Question of Patient Safety
146
Table 3. Data (mean values per person) of the source strength (number of particles per second and CFU per second) from people dressed in surgical clothing systems of clean-room quality laundered and sterilized 25 times and 50 times, respectively (from Ljungqvist and Reinmüller 2004).
Number per second from one (1) person Clothing system Contaminant
25 washes 50 washes Particles ≥ 0.5 µm 146 158 Particles ≥ 5 µm 7 9
Operating room clothing of cleanroom quality with
undergarments CFU 0.2 0.2
Table 4 shows the mean values per person of the source strength for the clothing systems based on measured concentrations in the operating room.
Table 4. Results from operating room (mean values per person) of the source strength (CFU per second) from people dressed in three clothing systems).
Clothing system Contaminant Number per second from
one (1) person Surgical polyester (50%) and cotton (50%) CFU 2.2 Surgical polyester (30%) and cotton (70%) CFU 7.9 Surgical clothing cleanroom quality polyester (99%) with underwear CFU 0.2
4. Discussion and Conclusions
A comparison between data shows that the source strength varies with the cloth-ing systems. Values of the two clothing systems for food manufacturing are much higher than those for clothing systems used in pharmaceutical cleanrooms and operating rooms. Furthermore, the results show that the source strength val-ues of the clothing systems for food manufacturing washed once and 40 times are in the same range and the results are comparable to surgical clothing systems washed 50 times. The results show that the evaluated clothing systems used in food manufacturing have poor product protection efficiency from the contamina-tion source, people. Rather high amounts of particles equal and larger than 0.25 μm are emitted to ambient air.

Clothing Systems Used in Operating Rooms – A Question of Patient Safety
147
The reported study shows that the commonly used protective clothing systems in operation rooms need to be upgraded when used during orthopaedic and trauma surgery (e.g., large bones and large joints with implantation of foreign material). When patients are highly sensitive to infections it is of vital impor-tance that the concentration of airborne bacteria carrying particles is as low as possible through e.g., the use of clean air suits.
Cleanroom clothing systems in combination with special offer a significant more efficient barrier against bacteria-carrying particles than commonly used surgical clothing systems.
Acknowledgements
The following companies and organizations contributed to the study in operating rooms: Berendsen Textil Service AB, Chalmers Technical University, Ramböll Sverige AB, and Miclev AB.
References
Hoborn, J. (1981), Humans as Dispersers of Microorganisms – Dispersion patterns and
Prevention. Ph.D. Thesis, Department of Clinical Bacteriology, Inst. of medical Mi-crobiology, University of Göteborg, Sweden.
IES-RP-CC003.2 (1993), Garments System Considerations for Cleanrooms and Other Controlled Environments. IES Institute of Environmental Sciences, Illinois.
Ljungqvist, B. and Reinmüller, B. (2004), Cleanroom Clothing Systems; People as a Con-tamination Source. PDA/DHI Publishing, LLC, River Grove, IL. ISBN 1-930114-58-3.
Ljungqvist, B. and Reinmüller, B. (2008) Evaluation of product protection efficiency for two clothing systems used in food manufacturing. RenhetsTeknik, No. 3, pp. 14–17.
Whyte, W. and Bailey, P. (1985) Reduction of Microbial Dispersion by Clothing. Journal of Parenteral Science and Technology, 39, pp. 51–60.
Whyte, W., and Hejab, M. (2007) Particle and microbial airborne dispersion from people. European Journal of Parenteral and Pharmaceutical Sciences, 12 (2), pp. 39–46.
Whyte, W., Vesley, D. and Hodgson, R. (1976) Bacterial dispersion to operating room clothing. J. Hyg., Camb., 76, pp. 367–378.

Contamination Risks due to Door Openings in Operating Rooms
148
Contamination Risks due to Door Openings in Operating Rooms
Bengt Ljungqvist1, Berit Reinmüller1, Jan Gustén2, Linda Gustén3 and Johan Nordenadler1, 4
1Building Services Engineering, KTH, Stockholm 2Building Services Engineering, CTH, Gothenburg
3Västfastigheter, Gothenburg 4Projektengagemang AB, Stockholm
Published with the kind permission of European Journal of Parenteral and Phar-maceutical Sciences
Abstract
In view of the ongoing discussions concerning the need for guidelines and con-tamination control in operating rooms, dispersion of airborne contaminants through door openings is discussed in this paper.
Some mathematical models are described. The increase of the concentration of viable particles is predicted. The results show the importance of air cleanliness outside the operating room door in connecting areas/rooms when operations susceptible to infections are performed.
1. Introduction
When converting or building new operating rooms or surgical suites, area re-strictions often occur. This implies that operating rooms might have door open-ings towards uncontrolled areas, such as corridors.
The main task of the ventilation system in an operating room is to provide an appropriate indoor climate for personnel and patients, to remove odours and released anesthetic gases, and to reduce the concentration of airborne contami-

Contamination Risks due to Door Openings in Operating Rooms
149
nants, inert as well as viable. The purpose of reduction of viable particles (bacte-ria-carrying particles) in the air within operating rooms is to reduce the risk of infection to the patients.
This paper discusses the increase of bacteria-carrying particles in the operat-ing room due to door openings. The study is performed for conventional ventila-tion systems with air volume flows of 0.5–0.7 m3/s and modern supply systems with projected air velocities of less than 0.3 m/s, which usually gives an air vol-ume flow of 3.0 m3/s.
2. Mathematical treatment
2.1 Airflows through doorways
Air flows through doorways have been discussed in several papers, see Shaw and Whyte [1] Kiel and Wilson [2], Wilson and Kiel [3], Isfält et al. [4], Ljungqvist and Reinmüller [5, 6], Blomqvist [7] and Schulz [8]. The driving mechanisms for air flows are typically a combination of density differences, mechanical ventilation, motion of a person through the opening and the motion of the door itself. In most practical situations, the density differences are caused by temperature differences.
Experimental results given by Kiel and Wilson [2] show, for typical door swing speeds, that the pumping exchange could be neglected entirely above a temperature difference of 3–5ºC. At a temperature difference of zero, the volume pumped increased linearly with the speed of the moving door. The typical ex-change volume is about 50% of the swept volume of the door.
When small temperature differences occur, the air flow through a doorway can be estimated only approximately from the relationship describing density driven flow. At higher temperature differences (> 4ºC) the estimation will be more accurate. The theoretical velocity profile through a doorway with tempera-ture differences is schematically shown in Figure 1.
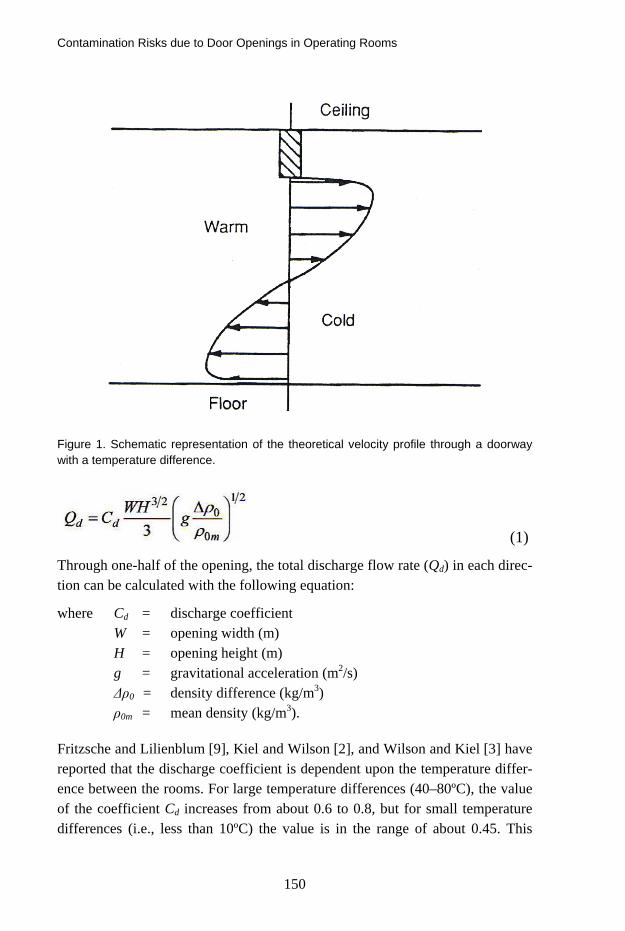
Contamination Risks due to Door Openings in Operating Rooms
150
Figure 1. Schematic representation of the theoretical velocity profile through a doorway with a temperature difference.
(1)
Through one-half of the opening, the total discharge flow rate (Qd) in each direc-tion can be calculated with the following equation:
where Cd = discharge coefficient W = opening width (m) H = opening height (m) g = gravitational acceleration (m2/s) Δρ0 = density difference (kg/m3) ρ0m = mean density (kg/m3).
Fritzsche and Lilienblum [9], Kiel and Wilson [2], and Wilson and Kiel [3] have reported that the discharge coefficient is dependent upon the temperature differ-ence between the rooms. For large temperature differences (40–80ºC), the value of the coefficient Cd increases from about 0.6 to 0.8, but for small temperature differences (i.e., less than 10ºC) the value is in the range of about 0.45. This

Contamination Risks due to Door Openings in Operating Rooms
151
value should be compared with the experimentally estimated value of 0.8, given by Shaw and Whyte [1], for temperature differentials of around 1–10ºC.
Etheridge and Sandberg [10] give a review of flow through large openings where theoretical models and experimental results are described. Values of the coefficient Cd are given in the range 0.4–0.8. A value of about 0.65 has been taken by various sources for a door opening and is in agreement with theoretical considerations. In the following, a discharge coefficient of 0.65 is chosen for door openings. With the aid of the equation of state for an ideal gas, the density relation in Equation (1) can be expressed as a function of temperature
(2)
where ΔT = temperature difference (ºC, K) T1 = temperature (K) T0 = reference temperature (K).
Equation (1) applies to an opening of fixed dimensions at a time when steady flow is fully established. In the case of an opening and closing door, the opening width is given by W sin θ, where θ is the angular position of the door. It can be assumed that the flow adjusts to the changing opening size and will be propor-tional to the exchange flow at steady state, Qd. This gives that Equation (1) can be written in an integral form over the total opening time, which is the sum of the opening time, the fully open door hold time and the closing time. Assuming that the discharge coefficient does not vary significantly with the door position and that the door swing speed is constant, the total volume (Vd) in and out through the door opening becomes:
(3)
where th = open hold time (s) t0 = opening time (s) tc = closing time (s) θ0 = max. opening angle (rad) te = equivalent time (s). For example if the maximum door opening angel is π/2, Equation (3) becomes.

Contamination Risks due to Door Openings in Operating Rooms
152
(4)
It could be mentioned that a sliding door moving at a constant velocity would result in a factor of 0.5 rather than 2/π in Equation (4).
2.2 Concentrations of airborne contaminants in operating rooms
Here airborne contaminants have reference to bacteria-carrying particles, also called Colony Forming Units (CFU).
With the assumption that: the air movements in the operating room and the ambient area (corridor) are turbulent mixing, supply air is HEPA filtered, the discharge flow rates through the door opening in each direction have the same value when the door between the operating room and the corridor is open, and the concentration of airborne contaminants in the corridor has a constant level, an expression for the concentration in the operating room becomes:
(5)
where
c = concentration of bacteria-carrying particles in the operating room (CFU/m3)
t = time (s)
Qd = flow rate through door opening in each direction (m3/s)
Qm = air volume flow in the operating room due to mechanical ventilation (m3/s)
V = operating room volume (m3)
S = total source strength of bacteria-carrying particles in the operating room (CFU/s)
cc = constant concentration of bacteria-carrying particles in the corridor (am-bient area) (CFU/m3).

Contamination Risks due to Door Openings in Operating Rooms
153
The boundary condition is
Where c0 = initial concentration of bacteria-carrying particles in the operating room (CFU/m3)
Assuming that when the door is open, one person is entering and one person is leaving the operating room, i.e., the total source strength is constant; a solution of the differential equation in Equation (5) is obtained. The expression of the concentration when the door is open becomes
When the door is closed there is no flow rate through the door opening, i.e., Qd = 0, and the expression becomes:
(7)
If there is a different number of persons in the operating room after the door is closed than before the door is opened, a correction of the total source strength S and the concentration c0 should be performed.
The air volume flow due to mechanical ventilation, Qm, should always be the maximum air flow through the operating room. When the pressure difference to the ambient rooms is zero, the mechanical air volume flow, Qm, is the same as the supply and the exhaust air volume flow because they are equal. When the operating room has a positive pressure difference to ambient rooms, the me-chanical air volume flow, Qm, equals the supply air volume flow. In the same manner, when the pressure difference is negative, the mechanical air volume flow, Qm, equals the exhaust air volume flow.
(8)
When the door is open only for a short time period the concentration reduced by the air volume flow through the mechanical ventilation system could be ne-glected. This gives the following approximate expression:

Contamination Risks due to Door Openings in Operating Rooms
154
The equivalent time, te, is dependent on opening time, open hold time, clos-ing time and maximum door opening angle, see Equation (3). For a sliding door a modification of Equation (4) should be used.
As mentioned earlier, at a temperature difference of zero between rooms, the typical exchange volume when the door is moving, is about 50% of the swept volume of the door. With the same assumptions as in Equation (8) an approxi-mate expression becomes:
(9)
where Vd = air volume pumped by moving door (50% of the swept volume of the door) (m3).
It should be noted that the concentrations expressed in Equation (8) and Equa-tion (9) only give estimations of occurring maximum levels due to concentration reduction when the air volume flow through the mechanical ventilation system is neglected.
3. Some Calculations
In an operating room with a volume of 125 m3 and an air volume flow (me-chanical ventilation) of 0.65 m3/s, the temperature was 20˚C. Two doors were in direct connection to an ambient corridor, in which the temperature was measured at 23.5˚C. The dimensions of the two doors were 1.0 · 2.0 m2 (small door) and 1.1 · 2.4 m2 (large door).
The air flow through a doorway can be calculated with the aid of Equation (1) in combination with Equation (2) when there is a temperature difference. With the above given data, the air flows in each direction become:
Through the small door, 0.21 m3/s Through the large door 0.30 m3/s.
In the operating room there were four persons working and the mean concentra-tion of bacteria-carrying particles was estimated as 48 CFU/m3, which gives the source strength for one person as 8 CFU/s. This value indicates – according to Ljungqvist and Reinmüller [11] – that the clothing systems (mixed cotton and polyester) have been washed 25–50 times.

Contamination Risks due to Door Openings in Operating Rooms
155
During activity in the corridor the concentration of bacteria-carrying particles was measured as ca 180 CFU/m3.
With the assumption that the air movements are turbulent, the concentration of bacteria-carrying particles as a function of time in the operating room can, when one door is opened at a time, be calculated with the aid of Equation (6). Results of such calculations with above given data are shown in Figure 2.
When converting or building new operating rooms in Sweden, air supply sys-tems providing unidirectional air flow are currently installed, with projected air velocities of 0.25 m/s to 0.30 m/s. with an air volume flow of about 3.0 m3/s. When the air velocity is below 0.3 m/s the air flow pattern above the operating table often occurs in a disordered manner, which resembles that of a total mixing air flow, according to investigations by Nordenadler [12].
Assuming that such an air supply system is installed in the operating room discussed here. Additionally, the source strength for one person is 5 CFU/s, which is the mean value of surgical clothing systems washed different times according to Ljungqvist and Reinmüller [11].
45
50
55
60
0 5 10 15 20 25 30 35
Time (s)
Con
cent
ratio
n (C
FU/m
3 ) Large doorSmall door
Figure 2. Concentration of bacteria-carrying particles as a function of time in the operating room when one door is opened at a time (small or large door). Air volume flow (mechani-cal ventilation) in the operating room is 0.65 m3/s.
With four persons working in the operating room, the concentration of bacteria-carrying particles in the operating room when doors are closed will be around 7 CFU/m3. With above given data in the same manner as in Figure 2 when one

Contamination Risks due to Door Openings in Operating Rooms
156
door at a time is opened the concentrations of bacteria-carrying particles in the operating room can be calculated. The results are shown in Figure 3.
0
5
10
15
20
0 5 10 15 20 25 30 35
Time (s)
Con
cent
ratio
n (C
FU/m
3 ) Large doorSmall door
Figure 3. Concentration of bacteria-carrying particles as a function of time in the operating room when one door is opened at a time (small or large door). Air volume flow (mechani-cal ventilation) in the operating room is 3.0 m3/s.
0
5
10
15
0 50 100 150 200
Time (s)
Con
cent
ratio
n (C
FU/m
3 )
Figure 4. Decrease in concentration (bacteria-carrying particles) in the operating room with closed doors and an air volume flow (mechanical ventilation) of 3.0 m3/s. The initial concentration is 12 CFU/m3 and source strength concentration is 7 CFU/m3.
If the large door has been opened 15 seconds and the small door has been closed, the concentration in the operating room with an air flow of 3.0 m3/s will be

Contamination Risks due to Door Openings in Operating Rooms
157
12 CFU/m3, see Figure 3. If the large door is closed, the decrease in concentra-tion can be calculated with aid of Equation (7). The concentration decays expo-nentially with time and as such reaches the value 7 CFU/m3 depending on the source strength, see Figure 4.
Figure 4 shows that the time necessary is about 2 minutes when 95% of the decrease of concentration has elapsed.
An approximate expression for increase of concentration in the operating room, when one door is opened, is given in Equation (8). Comparisons between the approximate expression in Equation (8) and Equation (6) are given in Figure 5 and Figure 6. In Figure 5 the small door is open and the large door is closed, while in Figure 6 the larger door is open and the small door is closed. In both cases, the air volume flow (mechanical ventilation) in the operating room is 3.0 m3/s. From Figure 5 and Figure 6 it can be noted that the approximate expression gives appropriate values for short door opening times (< 10 seconds).
0
5
10
15
20
25
0 5 10 15 20 25 30 35
Time (s)
Con
cent
ratio
n (C
FU/m
3 )
Eq. (8)Eq. (6)
Figure 5. Increase of concentration (bacteria-carrying particles) in the operating room, when the small door is open and the large door is closed. Comparison between approxi-mate expression in Equation (8) and Equation (6), when the air volume flow (mechanical ventilation) is 3.0 m3/s.
When the temperature difference between the operating room and the corridor is zero, i.e., isothermal conditions, the concentration in the operating room can be calculated with the aid of Equation (9). When one door at a time is opened and with the same data used earlier, the concentration in the operating room during isothermal conditions will be:
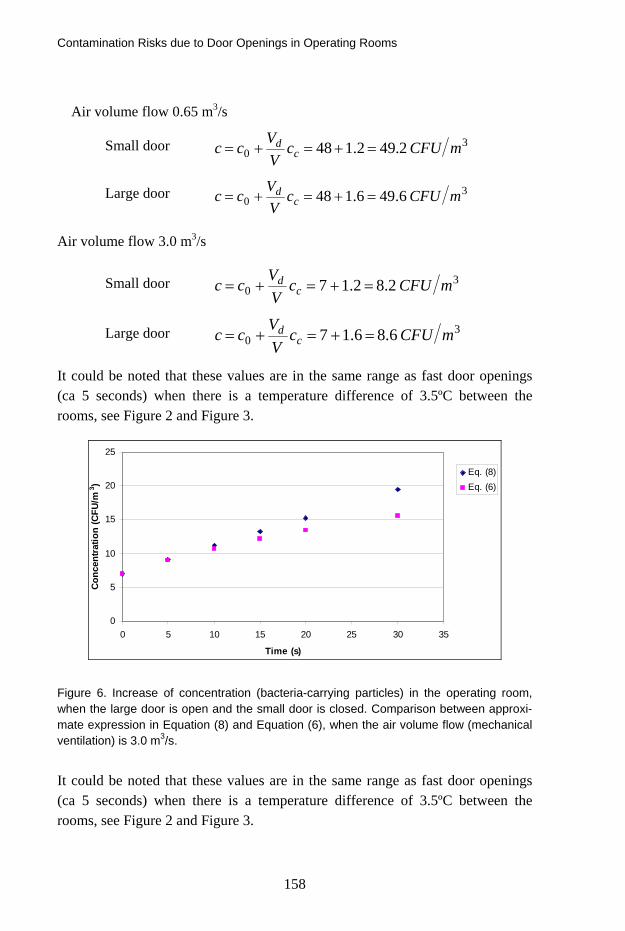
Contamination Risks due to Door Openings in Operating Rooms
158
Air volume flow 0.65 m3/s
Small door 30 2.492.148 mCFUc
VVcc c
d =+=+=
Large door 30 6.496.148 mCFUc
VVcc c
d =+=+=
Air volume flow 3.0 m3/s
Small door 30 2.82.17 mCFUc
VVcc c
d =+=+=
Large door 30 6.86.17 mCFUc
VVcc c
d =+=+=
It could be noted that these values are in the same range as fast door openings (ca 5 seconds) when there is a temperature difference of 3.5ºC between the rooms, see Figure 2 and Figure 3.
0
5
10
15
20
25
0 5 10 15 20 25 30 35
Time (s)
Con
cent
ratio
n (C
FU/m
3 )
Eq. (8)Eq. (6)
Figure 6. Increase of concentration (bacteria-carrying particles) in the operating room, when the large door is open and the small door is closed. Comparison between approxi-mate expression in Equation (8) and Equation (6), when the air volume flow (mechanical ventilation) is 3.0 m3/s.
It could be noted that these values are in the same range as fast door openings (ca 5 seconds) when there is a temperature difference of 3.5ºC between the rooms, see Figure 2 and Figure 3.
Contamination Risks due to Door Openings in Operating Rooms
159
4. Discussion and conclusions
The equivalent door opening time when the door opening angle is π/2 (90º) will accordingly to Equation (3) and Equation (4) become:
(10)
Studies have showed that the opening time (t0) and closing time (tc) are about the same, 3 seconds, but the open hold time can differ. Three main cases of open hold time have been observed here, referred to as fast, average and slow, which are 2 seconds, 5 seconds and 12 seconds respectively.
With the above given data used in Equation (10) three equivalent door open-ing times could be calculated.
Fast; seconds68.58.32 ≈=+=et
Average, seconds98.88.35 ≈=+=et
Slow seconds168.158.312 ≈=+=et
When the air volume flow (mechanical ventilation) is 0.65 m3/s, the increase of concentration in the operating room with the above calculated equivalent door opening times, will be relatively small, see Figure 2.
On the other hand, when the air volume flow (mechanical ventilation) is 3.0 m3/s, the concentration in the operating room, when average and slow equivalent times occur, will be around and over the maximum recommended value (10 CFU/m3) for operations susceptible to infections, see Figure 3.
The performed calculations show that operating rooms used for operations susceptible to infections should not have door openings in direct connection to uncontrolled areas such as corridors when temperature differences occur be-tween the rooms. Preferably, preparation rooms or locker rooms should be used between such operating rooms and corridors.
In general, the number of door openings should be a minimum and the door open hold time should be as short as possible, i.e., the equivalent door opening time should be minimized.

Contamination Risks due to Door Openings in Operating Rooms
160
References
1. Shaw, B. H., Whyte, W. Air Movement Through Doorways – The Influence of Tempera-
ture and its Control by Forced Airflow, Building Services Engineering 1974; 42: 210–218.
2. Kiel, D. E., Wilson, D. J. Combining Door Swing Pumping with Density Driven Flow, ASHRAE Transactions 1989; 95, Part 2.
3. Wilson, D. J., Kiel, D. E. Gravity Driven Counterflow Through an Open Door in a Sealed Room, Building and Environment, 1990; 25(4): 379–388.
4. Isfält, E., Ljungqvist, B., Reinmüller, B. Simulation of Airflows and Dispersion of Con-
taminants Through Doorways in a Suite of Cleanrooms, European Journal of Par-enteral Sciences 1996; 1(3): 67–73.
5. Ljungqvist, B., Reinmüller, B. Design of HEPA-Filters Above Autoclaves and Freeze-Dryers, PDA Journal of Pharmaceutical Science and Technology 1998; 52: 340–343.
6. Ljungqvist, B., Reinmüller, B. Practical Safety Ventilation in Pharmaceutical and Biotech Cleanrooms, PDA, Bethesda, MD, DHI Publishing LLC, River Grove, IL. 2006.
7. Blomqvist, C. Unconventional Supply of Ventilation Air. Lic. thesis, Centre of Built Envi-ronment, Högskolan i Gävle and KTH, 2000 (in Swedish).
8. Schulz, L. Secondary Safety-Barrier Performance in Laboratory Ventilation,. An Ex-
perimental Study, Lic. Thesis, Document D:60:2001, Building Services Engineer-ing, Chalmers University of Technology, 2001 (in Swedish).
9. Fritzsche, C., Lilienblum, W. Neue Messungen zur Bestimmung der Kälteverluste an Kühlrahmtüren, Kältetechnik – Klimatisierung 1968; 20(9): 279–286.
10. Etheridge, D., Sandberg, M. Building Ventilation. Theory and Measurement. John Wiley & Sons Ltd., Chichester, 1996.
11. Ljungqvist, B., Reinmüller, B. Cleanroom Clothing Systems; People as a Contamina-tion Source, PDA, Bethesda, MD, DHI Publishing LLC, River Grove, IL, 2004.
12. Nordenadler, J. Safety Ventilation in Operating Rooms. Air supply systems providing
unidirectional air flow, Lic. Thesis, Bulletin no 71, Building Services Engineering, KTH, Stockholm, 2008 (in Swedish).

Some Observations on the Impact of Clothing Systems on the Concentration of Airborne Bacteria – Carrying Particles during Surgery
161
Some Observations on the Impact of Clothing Systems on the Concentration of
Airborne Bacteria – Carrying Particles during Surgery
Jonas Hallberg Borgqvist KTH, Sweden
Abstract
In the view of the increasing number of resistant bacteria in hospitals the effect of different operating room clothing systems on air cleanliness during surgery has been discussed.
To investigate how clothing systems of cleanroom quality affect the number of airborne bacteria-carrying particles in comparison to ordinary surgical cloth-ing systems, tests have been performed in a test chamber (body-box) and in an operating room during surgery.
The results show that as well mechanical ventilation as clothing system have an effect on the concentration of airborne bacteria-carrying particles, where the choice of clothing system can play an important role for the safety of the patient.
1. Introduction
During surgery the patient is exposed to the risk of being infected by airborne bacteria. Personnel and patient is the greatest source of airborne bacteria-carrying particles in an operating room. There are two ways to reduce the risk from airborne bacteria. One is to regulate the mechanical ventilation, where the air flow affects the number of airborne bacteria-carrying particles. The other way is through the choice of clothing system worn by the personnel in the oper-ating room, where the clothing system act as an filter between the air in the room
Some Observations on the Impact of Clothing Systems on the Concentration of Airborne Bacteria – Carrying Particles during Surgery
162
and the carrier. The purpose of this investigation is to examine the impact of clothing systems on air cleanliness.
2. Materials and methods
The total number of airborne particles and airborne aerobic bacteria-carrying particles have been measured respectively for two different clothing systems, one clothing system of conventional quality and one of cleanroom quality. Tests have been performed in a test chamber (body-box). The test chamber consists of two parts, one semi-open changing room part and one closed body-box part. In the body-box the clothing system of cleanroom quality where tested after 25 and 50 washing and sterilization cycles respectively.
Tests have also been performed during two ongoing surgical procedures. The results are given in total number of airborne particles per cubic meter and air-borne aerobic colony forming units (CFU) per cubic meter.
3. Results
The results from the measurements in the body-box show that the total number of airborne particles as well as the number of airborne aerobic colony forming units are in the same order of magnitude for 25 and 50 washing and sterilization cycles respectively for clothing system of cleanroom quality.
The results from the measurements performed during ongoing surgery show that CFU-levels for clothing system of cleanroom quality is about 1/10th of the levels measured for clothing system of conventional quality.
4. Discussion and conclusions
Source strength has been used as a measure for comparison of the results from the measurements in the body-box with the measurements in the operating room. Source strength has been calculated as total number of airborne particles per seconds and CFU per seconds from one person in the respective clothing system.
The calculations from the body-box tests and the operating room tests both show that clothing system of cleanroom quality have significantly lower values of source strength than clothing system of conventional quality.
The comparison of source strength for clothing system of conventional quality shows that the mean value form the body-box tests is higher than the mean value

Some Observations on the Impact of Clothing Systems on the Concentration of Airborne Bacteria – Carrying Particles during Surgery
163
from the operating room. This difference depends on that the level of activity has been decidedly higher in the body-box tests than the level of activity during the surgical procedures. This comparison is less useful for clothing system of cleanroom quality as the expected value in the operating rooms will be below the level of detection for the measuring instrument.
To reduce the level of airborne CFU in operating rooms there are two techni-cal measures: mechanical ventilation and clothing system. The reported results show that the choice of clothing system in this regard plays a decisive role and that it can be useful to classify clothing systems in accordance with the concept of source strength.
To ensure a high level of safety for the patient in operating rooms, continued work should be directed to develop a clothing system of cleanroom quality which also meets the demands from personnel on easy mobility and comfort.

Hygiene Monitoring with the Portable Microbe Enrichment Unit (PMEU)
164
Hygiene Monitoring with the Portable Microbe Enrichment Unit (PMEU)
Elias Hakalehto Department of Biosciences, University of Eastern Finland, Finland
Abstract
The PMEU (Portable Microbe Enrichment Unit) technology (Samplion Oy, Ku-opio and Siilinjärvi, Finland) is a microbe cultivation method producing advan-tageous growth conditions for individual bacterial cells. Therefore, monitoring of bacterial populations and the presence of potential contaminants is optimised in terms of speed and accuracy. Hygienically important isolates of various bacte-rial strains have been cultivated aerobically, microaerobically or anaerobically using standard broth media in PMEU enhanced enrichment technology, or by PMEU Spectrion ® or PMEU Scentrion ® sensored units equipped with optical, IR, UV or gas sensors. The units were produced by Samplion Oy according to the ISO 9001:2009 accepted protocol. The reference cultivations were carried out using standard microbiological procedures. The PMEU Spectrion ® is being validated by the VTT of Finland. PMEU versions facilitated ultra-fast detection of coliformic bacteria, bacilli, salmonellas, staphylococci, streptococci, campy-lobacteria and other groups. The PMEU Scentrion ® equipped with gas sensors for volatile organic compounds detected the contaminants at concentrations of bacterial levels around 10–1 000 cfu/ml in 2–5 hours. Also the hospital valida-tion studies in Austria and Finland are summarized. Moreover, The PMEU has been demonstrated to help the environmentally stressed cells to recover and be-come viable in the enrichment cultures. Hygiene sampling was carried out using a specific sampling syringe serving also as an enrichment container in the PMEU.

Hygiene Monitoring with the Portable Microbe Enrichment Unit (PMEU)
165
1. Introduction
The idea of designing a cultivator where microbial enrichment could be started on the sampling site has fascinated us for many years. In order to avoid losses in time and in sample quality, a new tool for microbiology lab and field research, the Portable Microbe Enrichment Unit (PMEU) was developed. During the ten years of subsequent we have observed that this equipment represents whole ide-ology, the “PMEU Technology”. It has helped us to transform microscopic metabolic events into a larger and better observable scale, and also assisted us in enhancing the recovery and growth of many kinds of bacteria and other mi-crobes. The detection processes are now lasting only days instead of weeks, and hours instead of days. If we follow the microbes from the real start and practi-cally every minute after that, the microbiological reactions often take place rela-tively fast in the natural or otherwise “authentic” environment compared with the laboratory observations. The microbe detection is also seen as a process, which consists of separate unit tasks:
1. Sampling 2. Sample transport/storage 3. Pre-enrichment 4. Enrichment 5. Detection 6. Recognition/Identification 7. Characterisation/Analysis.
1.1 Microbe enrichment in small scale surfaces – principles of the PMEU come from the nature
Microbial world is invisible, thus the laws of nature need to be applied to the small scale. For example, in meteorology we talk about climate and microcli-mate. In the microscopic world we could formulate it “microbe climate”. This means the particular circumstances around the cells, which develop when the microbial are stabilized. The microbes are influencing their circumstances by themselves. For example, on the surfaces of the mucous membranes of the duo-denal tract in the small intestines a nutrient flow is transported into the human body. In this part of the alimentary tract microbes are not as numerous as in the colon. However, the facultatively anaerobic coliforms seem to exercise coopera-

Hygiene Monitoring with the Portable Microbe Enrichment Unit (PMEU)
166
tion in keeping the pH oscillating around six as demonstrated by the simulation in the PMEU (Hakalehto et al. 2008). This balance is beneficial both for the host and the microbiota.
In the PMEU device the concept of “microbe climate” is used for understand-ing the conditions preferably in every droplet of the liquid culture broth. Thus a small “ecosystem” is created into and around these droplets which are aerated or gassed effectively thus enabling more efficient nutrient and waste molecule dif-fusion in the vessel. For the description of the PMEU and the sampling and en-richment syringe, see Figures 1 and 2.
1.2 How to use the PMEU in practise
The PMEU idea originated from the need for getting as authentic information about the microbes in the samples as possible. This was accomplished by bring-ing the onset of the analysis down to the sampling site. Nowadays it is the possi-ble to transform the information from that site via internet, because newest PMEU versions possess Ethernet connections. This facilitates rapid analysis, early warning, and fast decision making. That is important, for example, in pro-tecting food processes and products, or water sources from spreading contamina-tions (Hakalehto et al. 2010 a, b). On the other hand, also control of the spread of contaminations in the clean rooms or other environments could be developed toward real-time basis. These principles have been suggested for monitoring hospital infections (Hakalehto, 2006). In the PMEU technology, sampling with the surface active material coated syringe pistons is made effective and fast. They can be used for collecting hygiene samples from different surfaces, or mould samples from buildings, or skin and textile samples from the workers in clean room production lines. In any case the samples are then transferred to the cultivation in the PMEU in the same syringes where it was collected. Also the liquid or any suspension samples are easily moved for the detection and moni-toring steps inside the PMEU.
During the cultivation it is possible to monitor growth either optically or by the gaseous emissions. The latter verification process was originally developed for screening up the hospital infections (Hakalehto et al. 2009). It is also possi-ble to further apply the samples from the PMEU syringes into immunological analysis such as in the research on the salmonellas (Hakalehto et al. 2007) or for the PCR studies like in the monitoring of campylobacter contaminations in the waters (Pitkänen et al. 2009). In fact it is possible to use the PMEU as a pre-

Hygiene Monitoring with the Portable Microbe Enrichment Unit (PMEU)
167
treatment equipment and an accelerator of microbial recovery and growth in almost any processes. It can aid in the source-tracking experiments where the ori-gin of the contamination is to be revealed (Kühn et al. 1993, Heitto et al. 2009).
2. Hospital hygiene monitoring with the PMEU
PMEU method has been used for the detection of gastrointestinal coliforms (E.coli and Klebsiella sp.) (Hakalehto et al. 2008), salmonellas (Hakalehto et al. 2007), campylobacteria (Pitkänen et al. 2009), hospital infection strains including facultative coliforms, staphylococci, streptococci and Bacillus cereus (Hakalehto et al. 2009, 2010c), and enterococci (Heitto et al. 2009). This method can be applied to generate suitable conditions for rapid recovery and growth of all kinds of bacteria. Pressurized gas bottles are used to provide suitable gas conditions for aerobes, facultatives, microaerobic strains as well as obligate anaerobes.
2.1 Hygienic studies with PMEU Spectrion ®
The hygienic control by using the PMEU Spectrion ® (Figure1) has been vali-dated by the State Research Centre of Finland (VTT). The validation statement is N:o S-02231. The results from these cultivations indicated that about 9 hours cultivation times were adequate for the bacterial detection. However, this was measured in selective conditions with non-stressed cultures. That result was obtained with PMEU Spectrion ® infra red sensors which result is further im-proved by optical sensors. In corresponding experiments with PMEU Scentrion ® monitoring the volatile organic compounds (VOC) from the selective RVS cul-tures we achieved the detection of Salmonella strains in less than 10 hours when starting from single cells in the samples (Hakalehto et al. 2010 a, b).

Hygiene Monitoring with the Portable Microbe Enrichment Unit (PMEU)
168
Figure 1. PMEU Spectrion ®, Samplion Oy, Kuopio, Finland.
2.2 Characterization of the contamination
The assessment of the hygienic levels and the sterility of different surfaces, ma-terials, water, air or corresponding samples could be carried out by using the PMEU enrichment and surface sampling syringes (Figure 2).
The PMEU method is now validated by VTT, Technical Research Centre of Finland, for the analysis of water samples (Report VTT-S-01705-10) (Wirtanen and Salo, 2010) and it also follows the guidelines of international standardiza-tion (SFS-EN ISO 9308-3) to fulfil the needs for rapid, quantitative control of hygiene indicator bacteria. In the case of pathogenic bacteria, the PMEU method has been validated for the detection of waterborne Campylobacter sp. in studies conducted by the Finnish National Institute for Health and Welfare (THL) (Pit-känen et al. 2009). In these experiments the PMEU experiment was compared with the conventional static enrichment of the international standard ISO 17995:2005. The stressed C. jejuni in drinking water produced significantly higher yields of bacterial cells in the PMEU cultivation with the Bolton broth.
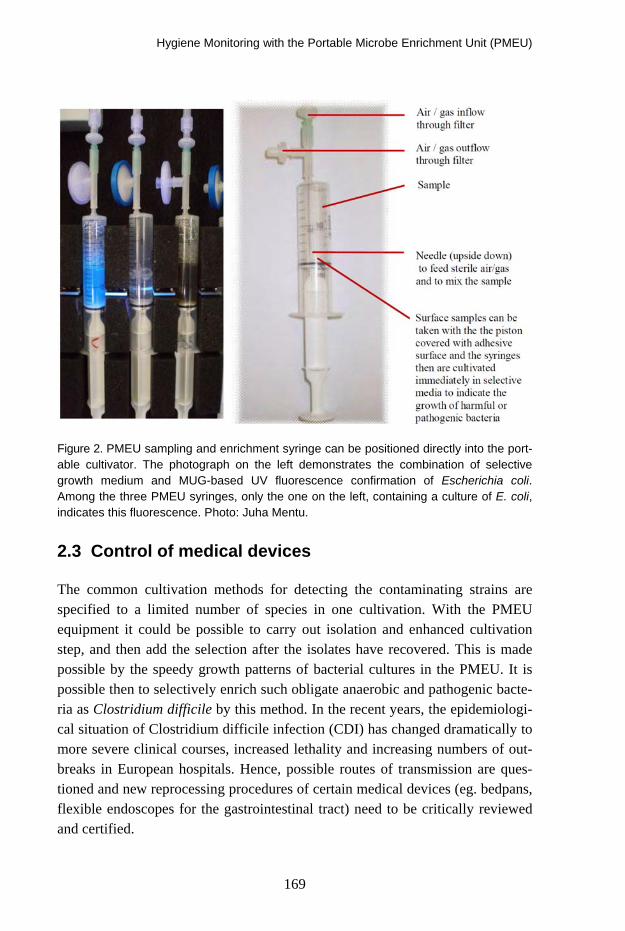
Hygiene Monitoring with the Portable Microbe Enrichment Unit (PMEU)
169
Figure 2. PMEU sampling and enrichment syringe can be positioned directly into the port-able cultivator. The photograph on the left demonstrates the combination of selective growth medium and MUG-based UV fluorescence confirmation of Escherichia coli. Among the three PMEU syringes, only the one on the left, containing a culture of E. coli, indicates this fluorescence. Photo: Juha Mentu.
2.3 Control of medical devices
The common cultivation methods for detecting the contaminating strains are specified to a limited number of species in one cultivation. With the PMEU equipment it could be possible to carry out isolation and enhanced cultivation step, and then add the selection after the isolates have recovered. This is made possible by the speedy growth patterns of bacterial cultures in the PMEU. It is possible then to selectively enrich such obligate anaerobic and pathogenic bacte-ria as Clostridium difficile by this method. In the recent years, the epidemiologi-cal situation of Clostridium difficile infection (CDI) has changed dramatically to more severe clinical courses, increased lethality and increasing numbers of out-breaks in European hospitals. Hence, possible routes of transmission are ques-tioned and new reprocessing procedures of certain medical devices (eg. bedpans, flexible endoscopes for the gastrointestinal tract) need to be critically reviewed and certified.

Hygiene Monitoring with the Portable Microbe Enrichment Unit (PMEU)
170
Campylobacter coli PMEU enrichment 16.12.2005
1
10
100
1000
10000
100000
1E+06
1E+07
1E+08
1E+09
1E+10
1E+11
0 1 2 3 4 5 6 7 8 9 10 11 12 13 14 15 16 17 18 19 20 21 22 23 24 25 26 27 28 29 30 31 32 33 34 35 36 37 38 39 40 41 42 43 44 45 46 47 48
enrichment time (h)
colo
ny c
ount
(cfu
/ml)
aerobe tube a aerobe tube b microaerobic tube a microaerobic tube b aerobe PMEU culture a aerobe PMEU culture bmicroaerobic PMEU culture a microaerobic PMEU culture b microaerobe PMEU ref culture
Figure 3. The cultivation of Campylobacter coli in a selective Bolton liquid medium in the PMEU. The growth in microaerobic conditions resulted in 10–100 fold densities by the PMEU when compared with the corresponding tube cultures. Consequently, it took 10–15 hours more time for the latter ones to produce fully grown cultures. The aerobic cultures did not grow in the PMEU because of excessive oxygen concentration for the microaero-bic species.
The use of enrichment syringe compartments and the pistons for sampling, en-richment and further analysis of the samples is also adding safety when dealing with hazardous microbes (Figure 3). The channels of the colonoscopies could be rinsed for collecting the samples which then could be taken into the syringes for the cultivations. In the present experiments we found out that this bacterium was cultured in continuous anaerobic gas stream, where the growth occurred in less than 19 hours in the PMEU equipment. For tracking the C.difficile we screened, besides the patient rooms in a large Austrian hospital, also the biopsy-channels of the colonoscopes, used at patients with no known CDI at the time of examina-tion, as well as after the reprocessing the equipment (Hell 2009, Hell et al. 2010).
2.4 Surface studies with the PMEU
In a series of experiments we collected surface samples from the microbiology laboratory. The specimen areas were disinfected several times daily but were

Hygiene Monitoring with the Portable Microbe Enrichment Unit (PMEU)
171
also subjected to outfalls from the experimentations with samples containing various microbial strains. Nevertheless, the original levels of contamination are supposed to be only a few cfu’s if . The results indicated the verification of the contamination in about 8–11 hours with the PMEU Spectrion ®. Samples were collected aseptically with the PMEU sampling and enrichment syringes from sample areas of 10 × 10 cm. The careful sampling took about 32 seconds, whereas the collection of samples with cotton swabs averaged 66 seconds. In this experiment the sampling syringes were moisturized with sterile water, and the samples were collected with both vertical and horizontal movements. Then the syringes were positioned into the PMEU unit and cultivated 20 hours. The growth curves and further inoculations of the fully grown cultures (dilution -6) to the CHROMagar Orientation plates (Becton, Dickinson & Co., USA) are presented in the Fig 4.
Figure 4. Microbial contaminations of various laboratory surfaces monitored by the PMEU method.

Hygiene Monitoring with the Portable Microbe Enrichment Unit (PMEU)
172
3. Studies on the microflora
The PMEU method has been used for screening the microflora of clinical sam-ples for monitoring the prevailing strains and their interactions (Pesola et al. 2009, Pesola and Hakalehto 2010, Hakalehto et al. 2010 c, d).
Figure 5. Enterobacterial strains isolated from fecal samples collected from healthy in-fants by only direct plating (DP) to BD CHROMagarTM Orientation plates (Becton, Dick-inson & Co., Sparks, MD, USA), both by direct plating and after 8 hours of enrichment (ENR) in MacConkey broth (Becton, Dickinson & Co.) and only after enrichment. Modified from Pesola et al., 2009.
3.1 Detection of the pathogens
Besides the strains in the normal flora, the PMEU method could be used for rapid detection and characterization of pathogenic micro-organisms. For exam-ple, the antibiotic susceptibilities of various intestinal pathogens or potential pathogens were monitored by using the enhanced enrichment method (Hakalehto et al. 2010c, Pesola and Hakalehto 2010). The mechanisms of the pathogenic functions were characterized in the case of Salmonella infections by simulating the antigenic production on the bacterial cell surfaces (Hakalehto et al. 2000, Hakalehto et al. 2007).

Hygiene Monitoring with the Portable Microbe Enrichment Unit (PMEU)
173
3.2 Patient samples
The validation project for monitoring the hospital blood cultures has been initi-ated at the Kuopio University Hospital, Finland. The participating units in the hospital are the Neonatal Intensive Care Unit and the Pediatric Haematology and Oncology Ward at the Department of Pediatrics. These studies originated from the preliminary experiments using the PMEU for the identification of patient blood samples from the former department (Hakalehto et al. 2009).
Figure 6. Hospital infection strains isolated from the neonatal patients of Kuopio Univer-sity Hospital incubated in the PMEU in BHI broth medium. The initial bacterial concentra-tion was approximately 1 × 10E6 cfu/ml. Bacterial growth led to evaporation of metabolic substances, which were detected by the semiconductor sensor of the ChemPro100i®, and presented as curves indicating the emissions as a function of cultivation time. BHI broth was used as a negative control (lowest curve). The figures of the Y-axis indicate the amount of the evaporated substances in Chempro units. Emission curves represent dif-ferent Klebsiella mobilis, Staphylococcus aureus, Staphylococcus epidermidis, coagulase negative Staphylococcus sp. and Streptococcus agalactiae strains. The growth of all strains was detected before 4 hours of cultivation. Also the lesser concentrations of 0.5–300 cfu/ml were detected in about five hours. These experiments led also to the devel-opment of the PMEU Scentrion ® equipment, which is able to monitor the growth on the basis of the volatile organic compounds emitted from the enrichment cultures. Modified from Hakalehto et al., 2009.

Hygiene Monitoring with the Portable Microbe Enrichment Unit (PMEU)
174
Figure 8. The gas emission pattern from the PMEU Scentrion ® Salmonella cultivation presenting the typical emission pattern for this species. The most important thing is to have the visualization of the bacterial growth on line from the screen to evaluate the time point to take sample(s) for other investigations. Secondly, Scentrion records a log-file from each individual sample as a function of time. Typically, when 10 samples are grow-ing, a new measurement is taken in every 35–40 minutes from each sample. Thus it is possible to generate a growth-curve using suitable software. According to the responses of the measuring sensor cells to different metabolites of various bacteria it is possible to classify the strains.
4. Concluding remarks
In order to investigate the changes in the microbe contents of various objects in the hospital environment it is of crucial importance to research their physiologi-cal activities. These functions are monitored by the PMEU technology in such a way that the micro-organisms are recovered and grown in optimal conditions directly from fresh samples. These cultivations can take place in aerobic, mi-croaerobic or anaerobic mode. The growth of the culture is continuously moni-tored by UV, IR, or optical sensing in the PMEU Spectrion ®, or by screening and classifying the gaseous emissions by the PMEU Scentrion ®.

Hygiene Monitoring with the Portable Microbe Enrichment Unit (PMEU)
175
References
1. Hakalehto, E. 2006. Semmelweis’ present day follow-up: Updating bacterial sampling and enrichment in clinical hygiene, Review, Pathophysiology 13: 257–267.
2. Hakalehto, E., Gopal, V., Miskala, M., Paakkanen, H. & Heitto, A. 2010a. Recovery and
enhanced enrichment in detection of contaminating Salmonella strains in meat, eggs and other protein rich foods, Manuscript in preparation.
3. Hakalehto, E., Heitto, A., Heitto, L., Humppi, T., Rissanen, K., Jääskeläinen, A., Paak-
kanen, H. & Hänninen, O. 2010b. Monitoring of water distribution system with
portable PMEU enrichment unit – measurement of volatile compounds of coli-
formic indicator bacteria and Salmonella sp. in tap water, Manuscript submitted for publication.
4. Hakalehto, E., Hell, M, Bernhofer, C., Heitto, A., Pesola, J., Humppi, T. & Paakkanen,
H. 2010c. Growth and gaseous emissions of pure and mixed small intestinal bacterial cultures: Effects of bile and vancomycin, Pathophysiology 17: 45–53.
5. Hakalehto, E., Hujakka, H., Airaksinen, S., Ratilainen, J. & Närvänen, A. Growth-phase
limited expression and immunological detection of Salmonella type 1 fimbriae.
2000. In: E. Hakalehto, Characterization of Pectinatus cerevisiiphilus and P. fris-
ingiensis surface components. Use of synthetic peptides in the detection of
some gram-negative bacteria, PhD Thesis, Kuopio University Publications C, Natural and Environmental Sciences 112, Kuopio, Finland.
6. Hakalehto, E., Humppi, T. & Paakkanen, H. 2008. Dualistic acidic and neutral glucose
fermentation balance in small intestine: Simulation in vitro, Pathophysiology 15: 211–220.
7. Hakalehto, E., Pesola, J., Heitto, A., Bhanj Deo, B., Rissanen, K., Sankilampi, U.,
Humppi, T. & Paakkanen, H. 2009. Fast Detection of bacterial growth by using
portable microbe enrichment unit (PMEU) and ChemPro100i® gas sensor, Pathophysiology 16: 57–62.
8. Hakalehto, E., Pesola, J., Heitto, L., Närvänen, A. & Heitto, A. 2007. Aerobic and an-
aerobic growth modes and expression of type 1 fimbriae in Salmonella, Patho-physiology 14: 61–69.
Hygiene Monitoring with the Portable Microbe Enrichment Unit (PMEU)
176
9. Hakalehto, E., Vilpponen-Salmela, T., Kinnunen, K. & von Wright, A. 2010d. Lactic acid bacteria enriched from human gastric biopsies, Manuscript in preparation.
10. Hell, M. 2009. Überprüfung von Koloskopen auf Clostridium difficile in der Routine-
aufbereitung in einer zentralen internistischen Endoskopieeinheit, 6. Fachtagung der ÖGSV, Hafnersee, 07.–08. Mai 2009.
11. Hell, M., Bernhofer, C., Allerberger, F., Indra, A., Huhulescu, S., Maaß, M. & Hakalehto, E.
2010. Testing of routinely reprocessed Colonoscopes for Clostridium difficile-
Contamination in the Endoscopy-Unit of a Department for Internal Medicine – Evaluation of Examination- and Analysis-Methods, Manuscript in preparation.
12. Kühn I., Ayling-Smith B., Tullus K. & Burman L.G. 1993. The use of colonization rate
and epidemic index as tools to illustrate the epidemiology of faecal Enterobacte-riaceae strains in Swedish neonatal wards. J Hosp Infect. 23:287–297.
13. Pesola, J. & Hakalehto, E. 2010. Stabilization of intestinal enterobacterial microflora
after wide-spectrum antibiotic treatment of neonatal sepsis and multiple antim-icrobials in infancy: a case study. Manuscript submitted for publication.
14. Pesola, J., Vaarala, O., Heitto, A. & Hakalehto, E. 2009. Enrichment in portable en-
richment unit in rapid characterization of infant intestinal enterobacterial micro-biota, Microbial Ecology in Health and Disease 21: 203–210.
15. Pitkänen, T., Bräcker, J., Miettinen, I.T., Heitto, A., Pesola, J. & Hakalehto, E. 2009.
Enhanced enrichment and detection of thermotolerant Campylobacter species
from water using the Portable Microbe Enrichment Unit (PMEU) and realtime PCR, Can J Microbiol. 55(7): 849–858
16. Wirtanen, G. & Salo, S. 2010. PMEU-laitteen validointi koliformeilla (Report VTT-S-01705-10) VTT Expert Services Oy, Espoo, Finland.

Cleanrooms and Clean Zones in Hospitals
177
Cleanrooms and Clean Zones in Hospitals
Alexander Fedotov “Invar-project” Company, Russia
Abstract
Hospital infections cause serious problems that are still not properly solved. Presentation discusses the whole problem of hospital infections including per-sonal hygiene and air cleanliness, sources of microbial contamination in hospi-tals, correlation between number of particles and microorganisms in air and on surfaces; protective measures; classification of hospital rooms and requirements for air cleanliness; methods to achieve necessary level of air cleanliness for dif-ferent room classes.
1. Disaster for patients
Hospitals are infected by pathogenic microorganisms. Stay at hospitals is dan-gerous for humans. It is sad to say, but it is a fact that hospital infections kill many people and take a lot funds. Healthy person who occurred to be operated at hospital because of accident may be infected and become ill.
1.1 United Kingdom
5 000 people die a year in UK because of hospital infections. It costs more than GBP 1 billion/year and exceeds value of preventing a fatal road traffic accident. About 8% of hospital patients were infected in 2006 (data of Prof. R. James [1]).
1.2 France
Every year 60 000–100 000 people become infected during stay at hospitals or 6–10% of total number of patients. From 5 000 to 10 000 people dye every year
Cleanrooms and Clean Zones in Hospitals
178
because of hospital infections. These numbers are similar to victims of traffic accidents (7 800 people in 2002) [2].
1.3 Russia
About half of deaths after operations are caused by infections (Prof. Yu. Biryukov from Moscow Medical Academy).
2. Hospital infections: history of protection
The problem of hospital infections is very old and it remains sharp in spite of many efforts to solve it. History of fight against hospital infections has its own logic and can be divided on three periods.
2.1 Pre-antiseptic period
It is known that up to the half of operated persons for amputation died because of infections till the middle of XIX century. Operations in small hospitals, at home or in the field conditions were less dangerous. It points that high concen-tration of patients in one place leads to cross-contamination and spreading of infections. Fresh air and absence of other people dramatically improved situa-tion, but hospitals were really dangerous places.
2.2 Antiseptic era
Detailed description of antiseptic and other protective measures were done in the presentation of A. Hambraeus at R3 Nordic Symposium in Gothenburg, 2009 [3].
British surgeon Lister offered antisepsis technology that included soaking of in-struments, sutures and sponges in carbolic acid and lowered mortality after ampu-tation from 40% to 15% during the years 1864 to 1866. It was really a break-through that marked the beginning of antiseptic epoch in surgery. The core sense of this era was a wide acceptance of hygienic principles by routine hospital prac-tice. Lister also tried to use carbolic spray for air disinfection but it gave no result.
American surgeon G. E. Brewer modernized autoclaves and introduced gloves. It gave reduction from 39% to 3,2% between 1895 and 1899.
Cleanrooms and Clean Zones in Hospitals
179
2.3 Clean air and aseptic principles
Next step forward required proper cleaning of air. The good influence of fresh air for patients was known long ago. In 19th cen-
tury it was understood that microbial contamination of air caused infections. Lister was a forward thinking surgeon and knew importance of clean air in fight against infections. But proper technologies of air treatment were not found and problem of air cleaning could not be solved at that period of time. Lister’s at-tempts to use carbolic spray gave no result because rather big droplets of acid could not cover significant number of viable particles (microorganisms). Macro technology could not solve the problem. The solution was found later thanks to researches of micro contamination world.
It was known also from long ago that placing of chopped onions reduced risk of infections. Onion is a natural disinfectant. It emits bacteria killing matter on molecular level. Diffusion of these molecular into air gave significant effect in contrary to carbolic spray. Everyone knows how strong this emission can be, detecting it by one’s own nose. This method meant antibacterial fight on mo-lecular level and gave results, but still limited and not always pleasant.
The next step was done in the middle of XX century. Hospital infections rate was influenced by new factors:
− New kinds of operations came to wide surgical practice (hip joint and knee implants; cardio surgery etc); these operations took a lot of time (4–8 hours) and size of wound were rather big; it meant that risk of infections during operation became much higher;
− Surgery applications widened to really industrial scale serving many pa-tients in big hospitals; so danger of cross-contamination between people (patients and hospital staff) became much stronger;
− Antibiotics gave breakthrough in protection of patients but at the same time some antibiotics resistant micro-organisms colonized hospitals and a person who never carried such microorganisms had high risk to be infected by them during stay at hospitals. MSRA (Methicillin-resistant Staphylococcus aureus) and other bacteria became real disaster at present hospital practice. Syndrome of sick buildings, especially old buildings colonized by Aspergil-lus, stressed the problem. Stay at hospital became dangerous even more then at Lister times.
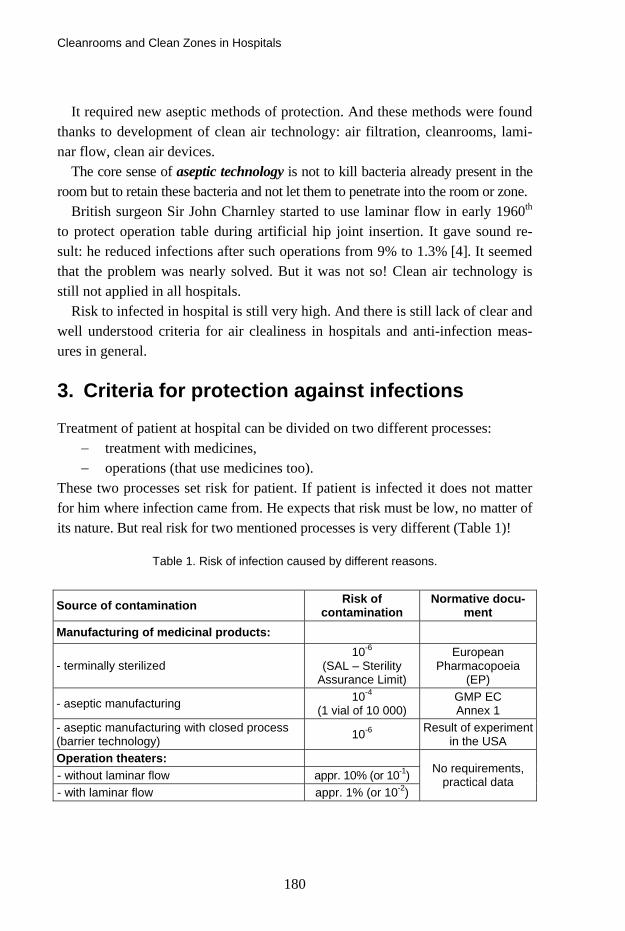
Cleanrooms and Clean Zones in Hospitals
180
It required new aseptic methods of protection. And these methods were found thanks to development of clean air technology: air filtration, cleanrooms, lami-nar flow, clean air devices.
The core sense of aseptic technology is not to kill bacteria already present in the room but to retain these bacteria and not let them to penetrate into the room or zone.
British surgeon Sir John Charnley started to use laminar flow in early 1960th to protect operation table during artificial hip joint insertion. It gave sound re-sult: he reduced infections after such operations from 9% to 1.3% [4]. It seemed that the problem was nearly solved. But it was not so! Clean air technology is still not applied in all hospitals.
Risk to infected in hospital is still very high. And there is still lack of clear and well understood criteria for air clealiness in hospitals and anti-infection meas-ures in general.
3. Criteria for protection against infections
Treatment of patient at hospital can be divided on two different processes: − treatment with medicines, − operations (that use medicines too).
These two processes set risk for patient. If patient is infected it does not matter for him where infection came from. He expects that risk must be low, no matter of its nature. But real risk for two mentioned processes is very different (Table 1)!
Table 1. Risk of infection caused by different reasons.
Source of contamination Risk of contamination
Normative docu-ment
Manufacturing of medicinal products:
- terminally sterilized 10-6
(SAL – Sterility Assurance Limit)
European Pharmacopoeia
(EP)
- aseptic manufacturing 10-4
(1 vial of 10 000) GMP EC Annex 1
- aseptic manufacturing with closed process (barrier technology) 10-6 Result of experiment
in the USA Operation theaters: - without laminar flow appr. 10% (or 10-1) - with laminar flow appr. 1% (or 10-2)
No requirements, practical data

Cleanrooms and Clean Zones in Hospitals
181
To achieve necessary sterility assurance in manufacturing of sterile products GMP EC, Annex 1, gives mandatory requirements for air cleanliness in different zones both for particles and microorganisms (Table 2). But risk during opera-tions is much higher and is not controlled by proper mandatory norms. This is the main contradiction in protection against infections in hospitals.
Is 1% of infection good enough or not? In comparison with EC requirements for manufacturing of sterile medicinal products this risk is too high. What does this 1% mean for a person? If one falls into this 1% them it becomes 100% form him and all statistics can be thrown into litter. So safety dictates one clear rule: to reduce risk as much as possible by all means that can be used at present state of technology.
Table 2. GMP EC requirements for air cleanliness sterile production.
Maximum permitted number of particles per m3 equal to or greater than the tabulated size
At rest In operation
Grade 0,5 μm 5,0 μm 0,5 μm 5,0 μm
Limits for microbial
contamination in operation air sample
cfu/m3
A 3 520 20 3 520 20 < 1
B 3 520 29 352 000 2 900 10
C 352 000 2 900 3 520 000 29 000 100
D 3 520 000 29 000 Not defined Not defined 200
People still have discussions on clear topics:
− is there any correlation between number of particles and microorgan-isms in the air;
− is it necessary to control particle concentration at hospitals;
− whether laminar flow is necessary at all;
− what is the main, hygiene or clean air.
Wasting time for these discussions people sometimes forget the anti-infection fight is really complex. Microorganisms are viable matter that tries to survive, mutate and sets new problems that require efforts of different specialists. Let’s try to clarify these questions.

Cleanrooms and Clean Zones in Hospitals
182
4. Particles and microorganisms in air
Particles carry microorganisms. How many particles are there in the indoor air? Table 3 shows some numbers.
Table 3. Particle concentration in air.
Description of room
Cleanliness Class
Number of particles ≥ 0.5 μm in 1 m3 of air
Room without air filtration - 20–50 Mio
Supporting rooms in sterile production
ISO 8 ≥ 3.5 Mio
Zone with laminar flow ISO 5 ≥ 3 500
How many micro-organisms are in air in comparison with particles? NASA textbook NHB 5340 answers this question:
One particle among 1 000 particles with sizes ≥ 0.5 μm in cleanzones 5 ISO carries micro-organism. One particle among 40 000 particles with sizes ≥ 0.5 μm in cleanrooms 8 ISO carries micro-organism:
Deposition on surfaces, 1 m2
Class 5 ISO
or
Class 8 ISO
12 900 microorganisms in a week or 80 in 1 hour
323 000 microorganisms in a
week or 2 000 in 1 hour
This is an approximate estimation but it describes the whole picture. 2 000 mi-cro-organisms can be deposited on 1 m2 of surface in clean room class 8 ISO. It gives understanding how many particles can come into the open wound. If the wound has sizes 20 × 20 cm = 0.04 m2, then during 6 hours 480 micro-organisms can come into the wound class 8 ISO room. For class 5 ISO similar calculation gives 20 micro-organisms. It is not ideal, but it shows effect of laminar flow.
4.1 Correlation between viable and non viable particles
What for do we try to find this correlation? We try becausee:
− air cleanliness for particles is described by well known and accepted standards;

Cleanrooms and Clean Zones in Hospitals
183
− specifying of cleanliness class to room or zone give clear instrument to design, construct and test them;
− particle counting is a rapid process and gives real time results in con-trary to testing microbial contamination.
But does really such correlation exist? To answer this question let’s look into the nature of air contamination (Figure 1) [5].
Figure 1. Nature of air contamination.
Most microorganisms have sizes from 0.5 to 20 µm. These sizes drop into the range of particles sizes from 0.1 to 100 µm. It is known also that microorgan-isms do not travel themselves in the air. They are deposited on particles. So there are two kinds of particles in the air: viable and non-viable particles. And both are retained by filters, especially HEPA filters.
It means that air filtration reduces number of viable and non-viable particles. The cleaner air is, the less number of viable and non-viable particles will present in it. So correlation between them obviously exists, but it cannot be described by strict mathematical formula with constant factor of linear picture. It is not a de-terministic, it is a more complex stochastic world that can be described with
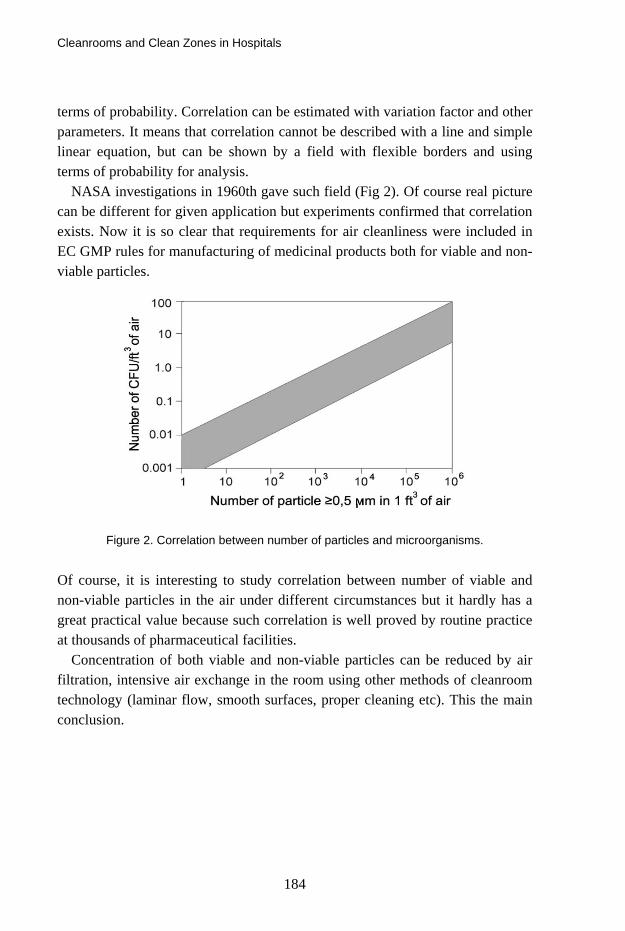
Cleanrooms and Clean Zones in Hospitals
184
terms of probability. Correlation can be estimated with variation factor and other parameters. It means that correlation cannot be described with a line and simple linear equation, but can be shown by a field with flexible borders and using terms of probability for analysis.
NASA investigations in 1960th gave such field (Fig 2). Of course real picture can be different for given application but experiments confirmed that correlation exists. Now it is so clear that requirements for air cleanliness were included in EC GMP rules for manufacturing of medicinal products both for viable and non-viable particles.
Figure 2. Correlation between number of particles and microorganisms.
Of course, it is interesting to study correlation between number of viable and non-viable particles in the air under different circumstances but it hardly has a great practical value because such correlation is well proved by routine practice at thousands of pharmaceutical facilities.
Concentration of both viable and non-viable particles can be reduced by air filtration, intensive air exchange in the room using other methods of cleanroom technology (laminar flow, smooth surfaces, proper cleaning etc). This the main conclusion.

Cleanrooms and Clean Zones in Hospitals
185
5. Sources of microbial contamination
Details of this topic were discussed in author’s presentation at R3 Nordic Sym-posium in Gothenburg in 2009 [6]. Here we repeat the table that gives the whole picture (Table 4).
Table 4. Reasons of hospital infections.
Route for contamination
Direct contact Cross-contact Source of contamination Presence
of direct contact
Measures for protec-
tion
Carrier of contamination
Measures for protection
- - Particles in air Masks
Air filtration Hospital personal and other patients:
hands, mouth, nose, others
+ Hygiene Surfaces Hands
Personal Cleanliness
Hygiene
Patient itself + Hygiene Surfaces Hands
Cleanliness Hygiene
Food for patients + Hygiene
Clean food ? ?
Medicinal products and medical devices
+ GMP - -
Materials +/- Cleanliness Particles in air
Hands Air filtration
Hygiene
Surfaces +/- Cleanliness Particles in air
Hands Air filtration
Hygiene
Indoor air +/- Air filtration Particles in air Air filtration
Cross-contamination is especially dangerous. This route of spreading contami-nation is not obvious but it may be the reason why hygiene measures do not always give sufficient effect, say, for protection against antibiotic resistant mi-croorganisms.
Cleanrooms and Clean Zones in Hospitals
186
6. Protective measures
6.1 Hygiene
This means cleanliness of hands, bodies, pure food and beverages, garments etc. This protects patient against direct contamination. This is a necessary and effec-tive measure. But it is not enough.
6.2 Face masks
What does face mask really do? Human distributes particles and droplets form the mouth and nose. When
breathing and speaking this pollution spreads from human on distances 2–4 meters in the direction where the human looks and speaks. Coughing and sniff-ing distributes pollutions far away.
6.3 Surfaces
Surfaces attract contamination. Viable and non-viable can be deposited on sur-faces. Clean surface quickly becomes contaminated if the air is contaminated. Often and thorough cleaning of surfaces reduces contamination in air and helps to fight against infection.
Cleaning of surfaces requires intensive manual work. But it does not remove particles from air.
6.4 Air filtration and cleanrooms
Air filtration is the most effective way to eliminate airborne particles. In con-junction with proper construction and operating procudures it may provide nec-essary level of air cleanliness. Together win hygiene precautions it can provide good protection against infection.
Concentration of both viable and non-viable particles can be reduced by air filtration, intensive air exchange in the room using other methods of cleanroom technology (laminar flow, smooth surfaces, proper cleaning etc). This the main conclusion.

Cleanrooms and Clean Zones in Hospitals
187
7. Classification of hospital rooms
Russian standard GOST R 52539 “Air cleanliness in hospitals. General require-ments” sets classification and requirements for different rooms and zones in hospitals. The complete text in English may be taken from the author.
All hospital premises are divided on five groups depending on risk for patients:
Group 1 – Operating rooms with aseptic technique and unidirectional air-flow with extensive wound and long-duration surgery;
Group 2 – Intensive care units, with unidirectional airflow, for the patients after bone marrow transplantation, patients with immunodefi-ciency etc;
Group 3 – Operating rooms without unidirectional airflow, or with unidi-rectional airflow but less sectional area than for group 1;
Group 4 – Rooms with no special protective measures required for the pa-tient in question, personnel and other patients;
Group 5 – Rooms for infected patients (isolation wards).
8. Requirements for air cleanliness
Requirements for air cleanliness and methods to achieve them were set by GOST R 52539 are shown in Table 5.

Cleanrooms and Clean Zones in Hospitals
188
Table 5. Requirements for air cleanliness in hospitals.
Group of rooms Class of
room (zone) cleanliness
Type of airflow
Air-exchange
rate
Classes of Filters
Zone of the operating table
5 ISO U Not
specified F7+F9+H14
1
Zone around the operating table
6 ISO N 30–40 F7+F9+H13
Zone of the patient’s bed
5 ISO U Not
specified F7+F9+F14
2 Zone around the patient’s bed
6 ISO N 30–40 F7+F9+H13
3 8 ISO N 12–20 F7+F9
4* – N 1–3 F7+F9
5 8 ISO N 12–20 F7+F9
* In rooms of group 4, natural ventilation is the most common. For compulsory venti-lation, it is recommended to apply filters of the classes mounted in rooms of groups 3 and 5, but to provide less of air exchange rate.
N o t e s
1 U – unidirectional airflow, N – non-unidirectional airflow.
2 In order to extend service life of filters of class F7, it is recommended to provide a preliminary stage of filtration by means of filters G3 (G4).
3 Air exchange rates shown in the table are reference ones and reflect only the re-quirements to air cleanliness.
The main requirements include following:
a) Laminar zone for operating theater of group 1 should have cross section not less then 9,0 m2 to cover patient, operating team and table for instru-ments. Velocity of laminar flow should be 0,24–0,3 m/s.
b) Laminar zone in rooms group 2 should cover patient’s bed and have ve-locity 0,24–0,3 m/s.
c) It is recommended to arrange laminar zones in operating theaters in rooms group 3 but with smaller cross section (3,0–4,0 m2).

Cleanrooms and Clean Zones in Hospitals
189
d) Rooms group 4 are normally served with natural ventilation
e) Isolators for infected patients (group 5) should have negative pressure and cleanliness class according to their purpose (operation theaters, wards).
f) Cleanliness should be provided by laminar flow in 5 ISO zones and by proper air exchange rate for rooms with lower requirements. Types and sequence of filters should be chosen depending on cleanliness class (see comments below).
Detailed requirements are described in GOST R 52539.
8.1 Filters
Different air filters have different particles penetration or effectiveness. Classifi-cation of air filters are set by EN 779-2002 and EN 1822-1-2009 standards. It is important to use types and sequence of filters that provide best filtration effi-ciency and long service time final HEPA filters. GOST R 52539 (Table 6) offers optimal solution to use sequence F7 – F9 – HEPA filter.
Some designers use sequences F5 – F9 – HEPA filter or F6 – F7 –HEPA filter. Approximate estimation using mean values of Table 1 EN 779-2002 showed
that overall penetration of two consequent filters will be:
- for F5 – F9 equal to 2,5%, - for F6 – F9 equal to 1,5%, - for F7 – F9 equal to 0,75%.
So F7–F9 gives 3 times less dust load on final filter that protects it from con-tamination and provides long service life. But it is recommended to protect F7 filter with coarse filter G4 that should be installed at the entrance of air condi-tioning unit.
8.2 Some practical observations
Testing of cleanrooms and clean zones in hospital points on typical mistakes in:
- layout of premises;
- construction of laminar zone in operation room;
- too high positioning of laminar zone;
Cleanrooms and Clean Zones in Hospitals
190
- too high temperature and fluctuations of temperature in operation room;
- application of non-effective air cleaning devices;
- poor procedures of cleanroom operation (cleaning, personal behavior, dressing, hygiene etc).
References
1. James, R. Superbugs: media type or a threat to healthcare systems? – Presentation at Cleanroom Europe Conference in Stuttgart, 24 March 2009.
2. Dorchies, F. France: standard on air cleanliness in hospitals – Cleanroom Technology, April 2005.
3. Hambraeus, A. Prevention of postoperative infections – Hygienic measures and venti-
lation. Proceedings of R3 Nordic 40th Symposium, 2009, Gothenburg, Sweden. Pp. 229–235.
4. Cleanroom design. Edited by W. White, published by John Wiley and sons, 1992.
5. Cleanrooms (in Russian). Edited by A. Fedotov, Moscow, 2003.
6. Fedotov, A. Air cleanliness in hospitals: Problems and solutions (Russian standard GOST R 52539).

The Effects of using a Particle Counter in a Cytotoxic Environment. Is It Dangerous for the Operator?
191
The Effects of using a Particle Counter in a Cytotoxic Environment. Is It
Dangerous for the Operator?
Nikolaj Emil Damm Holm & Halby A/S, Denmark
Abstract
Due to strengthen regulatives [1] it is now mandatory for hospital pharmacies to perform continuous particle counting in the duration of their production in Class A environments [2]. The intension of this abstract, is to focus on the possible contaminated air being sampled with a particle counter from the Bio Safety Cabinet (BSC) near the work space in a Cytotoxic environment [3]. In order to demonstrate compliance with the standards, air is being sucked through the par-ticle counter and into the surrounding area of the production. Often a small 0.2 µ filter is installed in the counter to prevent clear contamination/exposure to the operator/surroundings. But is this safe?
There is at present two possibilities to avoid possible contamination/exposure of the operators working in the clean room. This can either be done by a build-in particle counter [4] that has a vacuum source, often going to the void area. Ex-haust air is therefore in no proximity of the personnel. Or, this can be done with a handheld particle counter [5] placed next to the BSC, with a possibility to ex-haust air via tubing directly to the ventilation system.
But is the exposure a genuine problem? In Denmark 2005 app. 200 persons is responsible for manufacturing more than 40 000 Cytotoxic [6] treatments a year in hospital pharmacies (Estimate of 2 000 treatments per employee) [7]. Re-search shows that 1–9 mg/L CP was to be found in the urine of the pharmacy employees [8] furthermore a Danish study of nurses, working with Cytotoxic materials [9] showed increased risk of Leukemia and Myeloid Leukemia. Yet
The Effects of using a Particle Counter in a Cytotoxic Environment. Is It Dangerous for the Operator?
192
again, other literature claims no evidence for assessing cancer risk and acute toxicity [10].
An ongoing experiment led by Professor Dr. Handlos in collaboration with Holm & Halby A/S, Denmark is to determine the level of these risks. Further-more the author of this abstract has taken the initiative via R3 Nordic, to form a European committee which purpose is to publish a Best Guide for “Particle Counting in European Hospital Pharmacy Production” [11].
References
1. EU GMP Annex 1, revised in 2008.
2. Production can vary between 10–30 minutes (Roskilde Sygehus Apotek, P.B. Demant).
3. Best Practice Guide for Pharmacetical Production, Published by PHSS UK, Tony Harrisson.
4. Typically a Facility Management System (FMS), e.g. Pharmagraph EnVigil software.
5. Met One 3400, 1or 1.77 Cfm counter.
6. Fluorouracil (5FU), Gemcitabin (Gemzar) and Cyclophosphamid is the the main part (> 50%) of the production (Rigshospitalet, Denmark, 2004. Ref: Proff. V. Handlos).
7. Professor Vagn Handlos, Rigshospitalet, Denmark.
8. Ennslin 1994, Ennslin 1997, Wick 2003.
9. Skov, Denmark 1992.
10. Literature reviewed from 1966–2004 about Pharmacy Staff, physicians, nurses. No
evidence for assessing cancer risk and acute toxicity. Small increase in risk of
spontaneous abortion 1.3 cases among 897.(J Oncol Pharm Practice 2005 (11), pp. 69–78.
11. R3 Nordic, Lau Denmark, Particle Group.

Gowning in Operating Room – Standards and Experience
193
Gowning in Operating Room – Standards and Experience
Dennis Andersen De Forenede Dampvaskerier A/S, Denmark
Abstract
With the increased focus on hygiene in the operating room, clothing has become a major important factor. The particles and microorganisms which are released into the air in the operating room from the staff, clothing, drapes, consumables etc. should be limited in relation to the hygiene standards required during a par-ticular infection-sensitive operation. There are now published a certain standard for barrier work suits, surgical gowns and drapes. This standard, named EN 13795, will be reviewed in relation to the analytical methods used. Meanwhile a comparative analysis of disposable items versus reusable items will be reviewed. The analysis deals with barrier properties, physical properties, environmental conditions and comfort.

Larger Climatised Zoned Ultra Clean Air Will be the Future in Modern Operating Theatres
194
Larger Climatised Zoned Ultra Clean Air Will be the Future in Modern
Operating Theatres
Kjell Rösjö AET-arbeidsmiljö og energiteknikk as, Norway
Abstract
Ultra clean air ceilings were developed with the objective of reducing wound infections from airborne colony forming units, especially for orthopaedic sur-gery. Current designs confine themselves to this single objective, which has been achieved to more or less a certain degree. Infections have been reduced to low levels, however for most of the systems in use much thanks to the frequent pro-phylactic use of antibiotics. For many procedures the risk still are not at accept-able levels. One of the important reasons for this is the fact that the Ultra clean air ceilings until now to a certain degree helps, but not without serious compro-mises made by the manufacturers. The author has of this reason invented, pat-ented and installed further significant developments of the ultra clean air ceil-ings. As with earlier designs, the airflow system creates a clean zone over the patient to prevent contamination. Where this theatre differs is that it comprises a number of zones where the air temperature, air humidity, air velocity, volume, direction and even cleanliness can be individually delivered and regulated manually or even automatically. The reason why the new patented technique is beneficial is that the patient, the surgeon and the anaesthetist all have conflicting requirements. The surgeon likes cool dry air for comfort. He is the one who gen-erally dictates the theatre conditions. The anaesthetist, who is sedentary during operations finds these conditions too cold and might complain. The patient, who is the most important party present, requires to be warm in order for his body to function most effectively. Hypothermia might cause an extended serious period

Larger Climatised Zoned Ultra Clean Air Will be the Future in Modern Operating Theatres
195
in getting awake and might even be deadly! Finally the patient's wound site will have temperature and humidity requirements of its own to minimise the chance of infection and to avoid evaporative cooling. The invention provides for all of these conflicting requirements. Many ceilings of this type are now in operation in Scandinavia, and are very well approved, some with a 5 year warranty of a 5 cfu limit.
The lecture Larger Climatised Zoned Ultra Clean Air will be the Future in Modern Operating Theatres will cover:
1) Design principles of modern Modular Laminar Air Flow Ceilings for operating Theatres, and their properties
2) Systems advantages and benefits
3) Results compared to the traditional systems to day
4) The negative sides of all types of ventilation systems for operating thea-tres including the conventional Laminar Air Flow systems
5) Risks that comes from the standard and the low velocity op-ceilings
6) What can be our target! Or are you willing to be the patient or working in draft under cooled air for years?
7) New 5th generation of solutions, which are at head, solves the still exist-ing serious problems, and can bring the negative compromises to an end
8) What is really the future needs in the operating theatres and how will it be solved.

Larger Climatised Zoned Ultra Clean Air Will be the Future in Modern Operating Theatres
196

FOOD SESSION
197
FOOD SESSION

VTT’s Renovated Pilot Plant Facilities – New Possibilities for Cleaner Food Processing and Research
198
VTT’s Renovated Pilot Plant Facilities – New Possibilities for Cleaner Food Processing and Research
199
VTT’s Renovated Pilot Plant Facilities – New Possibilities for Cleaner Food Processing
and Research
Juhani Sibakov1, Mai Järvinen1, Satu Salo2 and Gun Wirtanen2 1VTT Technical Research Centre of Finland, Finland
2VTT Expert Services Oy, Finland
1. Introduction
VTT is the biggest multitechnological applied research organisation in Northern Europe, which creates new technology and science-based innovations in co-operation with domestic and foreign partners. In the food sector, VTT aims to deliver technological solutions for high quality products, which meet consumer needs, mainly by developing health-promoting foods with good sensory properties.
VTT’s core competencies in food science include knowledge on: a) Process-ing of cereals, berries and vegetables by enzymes, microbes and dry fractiona-tion, b) Enzymatic engineering of bulk and interfacial biopolymer structures for improved food quality, c) Development of probiotics and the technology related to their use, d) In vitro platform for physiological responses, including a gut model, food metabolomics and the measurement of satiety, e) Understanding of the role of healthiness in food choices, f) Testing of consumer acceptance of new food technologies, products & services, and g) Upgrading the value of side streams, such as milling by-products, brewers spent grains and oil plant residues.
Many of these competencies involve a lot of laboratory research and analytical equipment. We are specialized in applied research, so the scale-up possibilities from the small laboratory scale into intermediate pilot scale (ca. 1–10 kg/h) are essential, because we want to serve both academic and industrial fields. For ex-ample, industrial companies are able to test new kinds of processes or the manu-facture of new products in the pilot scale, without interrupting their production lines and avoiding the wastage of raw materials. We have equipment for a broad range of processing possibilities, mainly focused on modification of ingredients, such as cereals and berries. The modification can be enzymatic, thermomechani-cal and/or physical. We have pilot scale fermentation vessels, mills, air classi-

VTT’s Renovated Pilot Plant Facilities – New Possibilities for Cleaner Food Processing and Research
200
fier, extruder, as well as freeze-, fluidised bed- and spray dryers. In addition, we have separate facilities for pilot scale brewing and baking.
VTT’s facilities for pilot scale food processing were built in 1986. Since then the requirements for better hygiene and process safety have tightened signifi-cantly. In Finland, the facilities for commercial food production are governed by the statute of food surveillance (Finnish Government, 321/2006). On the other hand, the facilities for food research are not governed by the same statute, i.e. they are not governmentally monitored as far as the production is not aiming at commercial markets. Despite this exception in the food law, we wanted to en-sure that our products are manufactured and monitored by the newest standards of hygiene and safety.
2. How to renovate food processing facilities to meet the new standards of hygiene and safety?
Prior to renovation our hall for pilot-scale bioprocessing had several deficien-cies; e.g. the food and non-food processes weren’t isolated from each other, and the surfaces and equipment were difficult to keep clean. The site of VTT was already full of buildings, so to build a completely new hall was out of the ques-tion. That’s why we needed to specify a certain section, which will be isolated from the non-food processing area. The absolute prerequisite was to obtain a separated, over-pressurised area for food processing, because we wanted to pro-duce samples for clinical trials and for tasting in fair stands.
First the idea was to enclose all of our food processing equipment into huge clean room containers, which would have ensured a laminar, HEPA (High Effi-ciency Particulate Air filter) -filtered air flow through the processing area. How-ever, we decided to reject this idea, because our mills, for example, would have produced such large quantities of dust that this kind of clean room wouldn’t work as well as it does, e.g., in the electronics industry.
When conducting experimental research it’s essential to have sufficient amount of electric sockets, water taps and sinks, compressed air inlets and a possibility to use steam for sterilisation. It would have been difficult to include all of these requirements into plastic covered containers. That’s why we decided to isolate the food processing area by a brick wall, to replace all the surfaces inside this area, and to set up a completely new ventilation system.

VTT’s Renovated Pilot Plant Facilities – New Possibilities for Cleaner Food Processing and Research
201
2.1 Replacement of surfaces
The floor of the pilot hall was not suitable for maintaining a high level of hy-giene, because if water was spilled to the floors, it did not flow in the direction of sinks, but on contrary towards the perimeters and corners. In addition, the floor coatings were not made of hygienic materials. Thus, the whole floor was dug up and new drains were installed (Figure 1). The drains were sunk with a five degree bevelling for a one meter distance to ensure that all the water flows into drains. The rest of the floor was made entirely flat, so that the process equipments would hold still and work properly.
Figure 1. Replacement of floors and drains.
The coating material of the floor had to meet the criteria for both high hygiene and safety at work. We selected an acryl-based concrete coating (Table 1), be-cause it’s easy to clean, it tolerates most of the disinfection chemicals, and it isn’t slippery when wet. Other surfaces, such as walls, roofs, windows, doors and platings were also selected according to the requirements for good hygiene. The doors had an in-built system that seals the doorsteps, when the door is closed.

VTT’s Renovated Pilot Plant Facilities – New Possibilities for Cleaner Food Processing and Research
202
Table 1. The surface materials, which were used in the renovation of VTT’s new food processing facilities. All the surfaces were selected to meet the criteria for hygienic and safe working.
Surface Description
Floor Nanten® acryl-based concrete coating + 45º rounding in the corners between floor and walls
Walls Pukkila wall tiles + Pukkila Habenit 60™ jointing material specially designed for food industry
Roof / Ceiling Ecophon Hygiene Foodtec™ A C3
Window frames Aluminum profile windows, not possible to open inwards
Doors Painted steel doors with in-built sealed doorsteps
Other surfaces Polished stainless steel for plating and encasement
It was challenging to plan the new facilities, because all the former constructions had either to be encased or removed. For example the electric wires and water pipes were encased above the ceiling. To ease the cleaning of walls, the electric sockets were installed as near the ceiling as possible. Light fittings were also embedded into ceilings to ensure that dust wouldn’t accumulate in the lamps. Supporting structures, such as pillars and the joints of wall elements, were up-holstered with polished stainless steel plates. Wall tiles wouldn’t have lasted on the surfaces of supporting structures and joints, as these move according to changes in temperature. This is an especially important aspect in Finland, as the outdoor temperature changes radically between the four seasons.
2.2 Special case: Installation of freeze dryer
The pilot scale freeze dryer was integrated into the wall so that material inlet, control unit and adjustment valves were taken inside the food processing hall. The technical unit, which contains pumps and pipes and easily gets dirty, was left outside the hall. All the junctions were seamed with silicone and covered with polished stainless steel plates (Figure 2).

VTT’s Renovated Pilot Plant Facilities – New Possibilities for Cleaner Food Processing and Research
203
Figure 2. The ‘wall-integrated’ freeze dryer during installation.
2.3 Designing of ventilation and dust-removal system
A well planned ventilation and dust-removal system is the baserock for contami-nant-free air. As previously mentioned, over-pressurisation was a prerequisite to keep the air inside the food processing facilities free of contaminants. An auto-mated ventilation system was integrated with an efficient dust-removal system so that the food processing area will always be at over-pressure compared to the area outside, i.e. the non-food processing area.
The difference in pressure between the food processing facilities and non-food processing area was set up to +20 Pa. Because the mills produce a huge amount of cereal-based dust, they had to be closed into a separate room with a lower pressure compared to other food processing equipment. The difference in pres-sure was set up to be -10 Pa, so that the dust produced by the mills won’t end up in other food processes. However, the milling room is still at +10 Pa over-pressure compared to the non-food processing area (Figure 3).
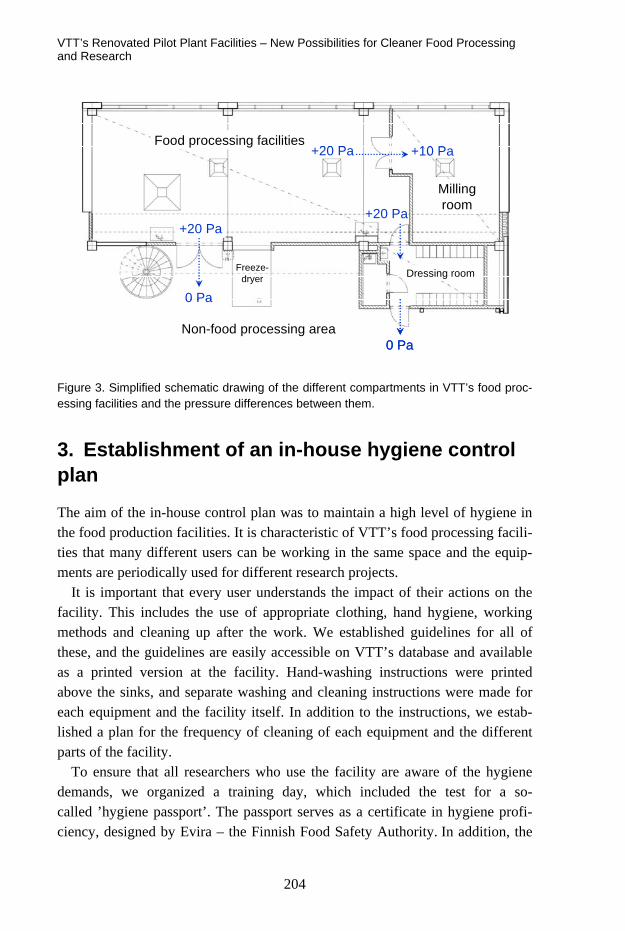
VTT’s Renovated Pilot Plant Facilities – New Possibilities for Cleaner Food Processing and Research
204
Food processing facilities
Freeze-dryer
Millingroom
Dressing room
0 Pa
0 Pa
+10 Pa
Non-food processing area
+20 Pa+20 Pa
+20 PaFood processing facilities
Freeze-dryer
Millingroom
Dressing room
0 Pa
0 Pa
+10 Pa
Non-food processing area
+20 Pa+20 Pa
+20 Pa
Figure 3. Simplified schematic drawing of the different compartments in VTT’s food proc-essing facilities and the pressure differences between them.
3. Establishment of an in-house hygiene control plan
The aim of the in-house control plan was to maintain a high level of hygiene in the food production facilities. It is characteristic of VTT’s food processing facili-ties that many different users can be working in the same space and the equip-ments are periodically used for different research projects.
It is important that every user understands the impact of their actions on the facility. This includes the use of appropriate clothing, hand hygiene, working methods and cleaning up after the work. We established guidelines for all of these, and the guidelines are easily accessible on VTT’s database and available as a printed version at the facility. Hand-washing instructions were printed above the sinks, and separate washing and cleaning instructions were made for each equipment and the facility itself. In addition to the instructions, we estab-lished a plan for the frequency of cleaning of each equipment and the different parts of the facility.
To ensure that all researchers who use the facility are aware of the hygiene demands, we organized a training day, which included the test for a so-called ’hygiene passport’. The passport serves as a certificate in hygiene profi-ciency, designed by Evira – the Finnish Food Safety Authority. In addition, the

VTT’s Renovated Pilot Plant Facilities – New Possibilities for Cleaner Food Processing and Research
205
hygienic level of the facility will be controlled frequently with hygiene tests of the surfaces of the equipment and other surfaces in different parts of the facility.
3.1 How to ensure the safety of the food products processed in VTT’s pilot plant?
For food safety, hygienic working conditions are just one factor, but there are also other important issues to consider. One has to ensure that the ingredients are microbiologically, chemically and physically safe. It is also important to take care of appropriate packaging and storing. We made guidelines for the receiving and handling of ingredients to ensure good quality and to avoid contaminations.
The traceability of each product is necessary also in the research environment. The ingredients must be inspected on reception. If the lot is up to standards, it can be accepted and stored in the food ingredient storage with identification, and the information of the ingredient is written in the stock bookkeeping. When the researcher uses the ingredient for his/her project, he/she marks the lot number in the product bookkeeping. In the product bookkeeping, the researcher marks also the date of the production and the storage place.
4. Testing the air flows and microbiological quality of air
The over-pressurisation was tested by spraying an artificial smoke towards the doors between non-food processing are and the food processing facilities. It was noticed that +20 Pa difference between these areas was sufficient to keep the smoke out of the isolated side. In addition, +10 Pa difference between the mill-ing room and other food processes was enough to ensure that the dust didn’t flow to a wrong direction.
The microbial contaminants of the air were analysed by Klotz FH5 impactor (Markus Klotz GmbH, Germany, Figure 4), which sucks a certain amount of air, e.g. 100 or 1 000 litres, through a holder occupied by an agar plate ideal for the growth of yeasts & moulds or bacteria. In our test, samples from 100 litres of air contained only 2–3 colony forming units of bacteria. Moulds and yeasts were not present in 100 l of air. There were no significant differences between different sampling places.

VTT’s Renovated Pilot Plant Facilities – New Possibilities for Cleaner Food Processing and Research
206
Figure 4. Sampling of air-borne microbes by Klotz FH5 impactor.
5. Discussion
Although the facility was constructed to meet the latest standards of hygienic food processing, the actual level of hygiene is in the hands of employees. There-fore, it’s important to keep up with the cleaning plan, and to train all new users for hygienic working methods. It also has to be kept in mind that over-pressurisation must operate continuously to guarantee that the air stays clean of contaminants. The flues in ventilation and dust removal systems have to be maintained once a year. After the maintenance, all the surfaces must be cleaned and disinfected carefully.
At the moment, it’s still difficult to evaluate how easy it will be to maintain the required purity of the air, because the facilities are brand-new and there is hardly any dirt in the ventilation system and filters. The filters form a critical control point, and their performance is regularly monitored to ensure that the performance is sufficient for obtaining a pure airflow.
There is also a potential risk related to the space above the ceiling. In our solu-tion, the ceiling is not 100% air-tight, so there’s a risk that microbes may grow there, especially if the conditions are warm and humid. However, this space is under a pressure from the food processing area, so air shouldn’t flow across the ceiling towards the food processing area.

VTT’s Renovated Pilot Plant Facilities – New Possibilities for Cleaner Food Processing and Research
207
Current analyses of microbial counts were performed during a relatively dry springtime, which doesn’t usually foster the growth of microorganisms. In addi-tion, the tested air volume of 100 litres will be increased to 1 000 litres to im-prove the reliability. Microbiological analyses of different surfaces are used to monitor the efficiency of cleaning. The frequency and quality of cleaning will be adjusted according to these microbiological results. Acquisition of these data has only just started at the time of writing of this article, so our cleaning plans are still flexible.
6. Acknowledgements
The renovation of VTT’s new food processing facilities was mostly funded by Senate Properties. VTT also allocated money for the monitoring and quality control by the actual end-users from the early planning to the actual renovation. In other words, the end-users were able to contribute to the plans and select the best materials for each purpose. VTT also defrayed the costs related to the estab-lishment of the in-house control plan.
The planning group consisted of the following persons: architect Santtu Mäkelä (Arkkitehtitoimisto Timo Jokinen Oy), construction engineer Markku Mäkelä (Insinööritoimisto Konstru Oy), hpac engineer Lasse Foudila (Inssit line Ky), electrical engineer Pasi Tamminen (Sähköinsinööritoimisto Ahonen Oy) and automation engineer Sami Palmu (Fidelix Oy). Kai Metsola (KJM Consult Oy) served as an external supervisor of the renovation works. In addition to au-thors, the following persons from VTT contributed to planning and quality con-trol: research engineer Arvi Wilpola, real estate manager Pasi Hopia and real estate coordinator Timo Almgren.
The main contractor was ISS Sevices A/S, who was responsible for the overall construction work and installed the water pipe lines and drains, as well as the ventilation and dust removal systems. Sähköarina Helsinki Oy made the electrical installation and Fidelix Oy delivered the automation system for the ventilation.

Complementary Assay in Hygiene Testing – Chemical Residue Test
208
Complementary Assay in Hygiene Testing – Chemical Residue Test
Juha Lappalainen Aboatox Oy, Finland
1. Introduction
Disinfection is required in food plant operations where wet surfaces provide conditions for the growth of microbes. The intention is to minimize the risk of spoiled products caused by pathogens or other harmful microbes. The hygienic status of the production lines is measured with different methods like plate count techniques, ATP test and protein residue test. Traces of detergents can be present when samples for the hygiene monitoring are collected. These traces can inter-fere with the hygiene monitoring methods resulting in false negative results. Prolonged exposure to a detergent or disinfectant leads also to resistance by the micro organisms to the cleaning chemical used. For these reasons the food in-dustry should pay more attention to the monitoring of detergent residues.
2. Hygiene test performance
There is very little published data available about the potential measurement errors with the hygiene monitoring methods used in the food industry. The ease of use and the test price are often two most important features of the tests and scientific research is focused on comparison of the different method results rather than pointing out specific sources of errors. Unfortunately ease of use means very often that a system that works well in optimal conditions but may not perform as well on the day to day conditions. The tests have been modified during the years to reduce the measurement errors. In the contact plate count methods different neutralizers have been added to the medium. However, it is well known that there is not a universal neutralizer. The systems work with some chemicals and with some organisms but not with all simultaneously. In the ATP

Complementary Assay in Hygiene Testing – Chemical Residue Test
209
method at least one manufacturer uses genetically modified luciferase enzyme that is more resistant to tensides (a common detergent or disinfectant) and this makes the test more reliable. In general, not a single system can work perfectly if the chemical residue concentration in the sample reaches the ready-to-use concentration of the detergents and disinfectants. To prevent the errors in hy-giene monitoring the authorities have instructed not to leave any residues on the surfaces prior to starting the production but the testing instructions are not so clearly defined.
3. Prevention of measurement errors
With the cultivation method it is very laborious and complicated to prove the presence of the chemicals on the production surfaces. With luminescence ATP method it is fairly simple and therefore it is somewhat strange that this has not been adopted in the quality control programs. In this system ATP standard is added to the measurement mixture after the sample measurement and the per-formance of the reagent is tested in each sample tube.
If cultivation method is used or the ATP test system can not be used with the standard addition system there is another way do to easily determine the pres-ence of the residues: the photobacteria test. The sample surface is swabbed and the inhibition of the light output of luminescent bacteria is measured after a short contact with the swab. The result is compared to the result obtained with a clean water sample. If the light output of the sample has reduced more than 50% com-pared to the control sample the surface contains significant amounts of residues and should be washed or rinsed again.
4. Conclusions
The cleaning and disinfection in the food industry is carried out in order to pro-duce safe products with long shelf life. The microbiological cleaning is followed regularly and therefore it would be of great importance that the performance of the methods is also followed and the assumption of “clean status” is not derived by measurement error. The freedom from the risk of chemical residues that are not allowed in any quantity prior starting the production is not achieved by cleaning instructions only. Reliable methods to detect residues are also needed and the risk of producing resistance by the micro organisms to the cleaning chemical used can be minimized.

Environmental Listeria Plate Petrifilms in Detection of Listeria species from Environmental Samples
210
Environmental Listeria Plate Petrifilms in Detection of Listeria species from
Environmental Samples
Liina Kutsar, Satu Salo and Gun Wirtanen Tallinn University of Technology, Estonia
VTT Expert Services Ltd, Finland
Abstract
Food safety and high hygiene level is a priority to food manufactures. Petrifilm Environmental Listeria (EL) plates are designed to detect the majority of envi-ronmental Listeria e.g. Listeria monocytogenes, Listeria innocua, and Listeria welshimeri in environmental samples and to aid in efficient hygiene monitoring of food processing plants. The presence of L. innocua provides evidence that environmental conditions are suitable for the occurrence of L. monocytogenes. L. ivanovii, L. grayi/murrayi and L. seeligeri should also grow on EL Petrifilms but according to the instructions these strains do not form typical colonies. In practice EL Petrifilms were used in a cluster hygiene survey carried out within the SAFOODNET-project (FP6-022808-2006) in 2009. The results obtained with EL Petrifilms were confirmed using verification test mentioned in the ISO-standard method 11290-1. Pure cultures of different Listeria species were also used on EL Petrifilms. In addition some of the samples were contaminated with milk residues in combination with several mixtures of Listeria species. The re-sults of these tests showed that some Listeria species formed atypical colonies on the EL Petrifilms. These tests showed that milk residues affected the occur-rence of typical colonies on EL Petrifilms. The results of this study including interpretation obtained from 3M will be discussed at this presentation.
Environmental Listeria Plate Petrifilms in Detection of Listeria species from Environmental Samples
211
1. Introduction
Traditional techniques of microbiological analysis do not meet the current needs of having immediate analytical results in order to be able to make decisions in the process of food manufacturing, especially in HACCP application systems concerned with quality assurance. The development of modern techniques is showing new alternatives but it is important that the advantages for each of these new methodologies are considered for each application (Rosmini, Signorini, Schneider and Bonazza, 2004).
Six clearly distinguishable species of Listeria are recognised: L. monocyto-genes, L. innocua, L. welshimeri, L. seeligeri, L. ivanovii and L. grayi. The most commonly occurring species in food are L. innocua and L. monocytogenes. L. monocytogenes is the main human pathogen of the Listeria genus and can cause a variety of infections and it can be transmitted with contaminated dairy products and cause serious foodborne infections. L. monocytogenes is widely distributed in the environment and occurs in almost all food raw materials from time to time. It should be noted that L. monocytogenes is known to grow at the temperatures used in refrigeration. The food industry ia always reacting on posi-tive findings of the species, they are not waiting for specific information on sero-types of the species. Many manufacturers use the presence of Listeria spp. as a general indicator for the presence of L. monocytogenes (Bell and Kyriakides, 2002b). L. monocytogenes is serious concern to food manufactures.
Traditional microbiological detection methods for detecting Listeria species are time-consuming, e.g. conformation of L. monocytogenes, can easily take 1–2 weeks. Therefore tremendous efforts are being made to develop rapid and sensi-tive detection methods (Datta, 2003). One modern rapid technique, Petrifilm ® system (3M, Microbiology Products, USA), for detection micro-organisms, has been proposed as a substitute of standard plate count (Rosmini, Signorini, Schneider and Bonazza, 2004). The 3M™ Petrifilm™ Environmental Listeria (EL) Plate is a sample-ready culture medium containing selective agents, nutri-ents, a cold-water-soluble gelling agent, and a chromogenic indicator that facili-tates Listeria colony detection. The presence of indicator Listeria such as L. innocua provides evidence that environmental conditions are suitable for the occurrence of L. monocytogenes. The 3M Petrifilm EL plate detects the majority of environmental Listeria, consisting of L. monocytogenes, L. innocua, and L. welshimeri. L. ivanovii, L. grayi/murrayi and L. seeligeri grow but do not form typical colonies.
Environmental Listeria Plate Petrifilms in Detection of Listeria species from Environmental Samples
212
Many organisms in the environment can be stressed by environmental condi-tions or sanitizers. Buffered peptone water (BPW) is used as a repair broth in conjunction with the 3M Petrifilm EL plate to resuscitate stressed Listeria with-out increasing their numbers. Repair in BPW is not an enrichment step (3M Mi-crobiology, 2006). 3M Petrifilm EL Plate has been validated by the AOAC Re-search Institute (AOAC-RI) for the detection of Listeria on environmental sur-faces in food processing plants. Validation studies compared the 3M Petrifilm EL Plate’s performance to the United States Department of Agriculture Food Safety and Inspection Service Most Probable Number (USDA-FSIS MPN) Method. AOAC-RI found that the 3M Petrifilm EL Plate’s performance is equivalent to that of the USDA-FSIS MPN Method for detecting Listeria species on environmental surfaces such as stainless steel, plastic, ceramic tile, and sealed concrete (3M Microbiology, 2006). The aim of this paper was to evaluate EL Petrifilms Plate (3M Microbiology, US) as a detection method of Listeria spe-cies from environmental samples.
2. Materials and methods
In the first test pure cultures of 9 Listeria species (from VTT culture collection, Finland) and mixes of them (test series in Table 2.1) were inoculated, diluted in peptone saline (LabMTM, UK), and 1 ml of diluted cultures were spread into the sterilized stainless steel surfaces. To imitate the situation in dairy factory where milk residues could be found in surfaces, in sample number two 1 ml milk (UHT, Valio) was spread and mix with diluted culture in stainless steel plate (Figure 2.1). After 5 min drying time surfaces (area 10 × 10 cm2) were swabbed with sterile cotton swabs (Selefa Trade, Sweden) and swabs were put into 3 ml BPW broth (Buffered Peptone Water). Tubes with swabs were mixed 1 min and then incubated 1 h at 25°C. After incubation tubes were mixed again and poured directly into EL Petrifilms which were incubated in 37°C for 28 h (+ 2 h). Three replicates of each sample were made. The culturing of controls on Brain Heart Infusion (BHI, BD / DifcoTM, France) agar plates was made from the same dilu-tions using two replicates of each sample.

Environmental Listeria Plate Petrifilms in Detection of Listeria species from Environmental Samples
213
Table 2.1. First test samples series.
No Sample Cultured dilution series Culturing
1. L .monocytogenes KKL 17D1 1 × 10⁻³ to 1 × 10⁻⁸
2. L. monocytogenes KKL 17D1 + 1 ml milk 1 × 10⁻³ to 1 × 10⁻⁸
3. L .innocua E772 1 × 10⁻³ to 1 × 10⁻⁸ 4. L. welshimeri E956 1 × 10⁻³ to 1 × 10⁻⁸ 5. L. grayi E931 1 × 10⁻³ to 1 × 10⁻⁸ 6. L. ivanovii E771 1 × 10⁻³ to 1 × 10⁻⁸ 7. L .seeligeri HY18A1 1 × 10⁻³ to 1 × 10⁻⁸
8. L. monocytogenes E783 1 × 10⁻³ to 1 × 10⁻⁸ 9. L. monocytogenes K92III 1 × 10⁻³ to 1 × 10⁻⁸
10. L.monocytogenes HYRLT1 16 1 × 10⁻³ to 1 × 10⁻⁸
11. L. monocytogenes KKL 17D1 + L.innocua E772 + L. welshimeri E956 1 × 10⁻³ to 1 × 10⁻⁸
12. L. grayi E931+ L. ivanovii E771+ L. seeligeri HY18A1 1 × 10⁻³ to 1 × 10⁻⁸
EL P
etrif
ilm, B
HI a
gar p
late
a. b. c. d.
Figure 2.1 Sampling from surface for further cultivation to EL Petrifilm a. bacteria suspen-sion and milk on surface; b. spreading sample; c. taking sample with swab; d. taken sam-ple in BPW.
Second test was carried out with different amounts of milk residues and pure culture mixes of L. monocytogenes on surfaces. L. monocytogenes KKL 17D1 (isolated from environmental sample) was diluted in peptone saline. Milk (UHT,

Environmental Listeria Plate Petrifilms in Detection of Listeria species from Environmental Samples
214
Valio) was diluted in peptone saline. 1 ml of L. monocytogenes dilution and 1 ml of milk dilution was spread on sterilized stainless steel surface (Figure 2.1). Af-ter 5 min drying the area was swabbed and the swab put in 3 ml buffered pep-tone water, mixed 1 min, incubated 1–1.5 h in 25°C, mixed and poured on EL Petrifilm. Petrifilms were incubated at 37°C for 28 h (+ 2 h). Culturing of con-trols the cultivation on BHI agar plates was made from same dilutions, two par-allels from each sample (Table 2.2).
Table 2.2. Second test samples series.
No Sample Cultured dilu-tion series Culturing
1. L .monocytogenes KKL 17D + 1 ml milk 1 × 10⁻⁴ - 1 × 10⁻⁷
2. L .monocytogenes KKL 17D + 1 ml dilution (75% milk, 25% PS) 1 × 10⁻⁴ - 1 × 10⁻⁷
3. L .monocytogenes KKL 17D + 1 ml dilution (50% milk, 50% PS) 1 × 10⁻⁴ - 1 × 10⁻⁷
4. L .monocytogenes KKL 17D + 1 ml dilution (25% milk, 75% PS) 1 × 10⁻⁴ - 1 × 10⁻⁷
5. L .monocytogenes KKL 17D + 1 ml dilution (10% milk, 90% PS) 1 × 10⁻⁴ - 1 × 10⁻⁷
6. L .monocytogenes KKL 17D + 1 ml PS 1 × 10⁻⁴ - 1 × 10⁻⁷ EL
Pet
rifilm
, BH
I aga
r pla
te
3. Results and discussion
Aim of the first test was to verify that EL Petrifilm plate detects the majority of environmental Listeria species i.e. L. monocytogenes, L. innocua, and L. wel-shimeri. This test should also prove that L. ivanovii, L. grayi/murrayi and L. seeligeri grow but do not form typical colonies. Typical colonies in EL Petri-films should be intense red-violet and those colonies remaining grey or light pink, as shown in Figure 3.1, should not be interpreted as Listeria. According to 3M Microbiology instructions, several factors influence the rate at which the chromogenic indicator changes to intense red-violet, including the strain and the nature and degree of stress to which the organism has been exposed. Prior to the full 30 h incubation, if any colonies are present but are not intense red-violet then incubating should be continued up to 30 h. At the maximum incubation
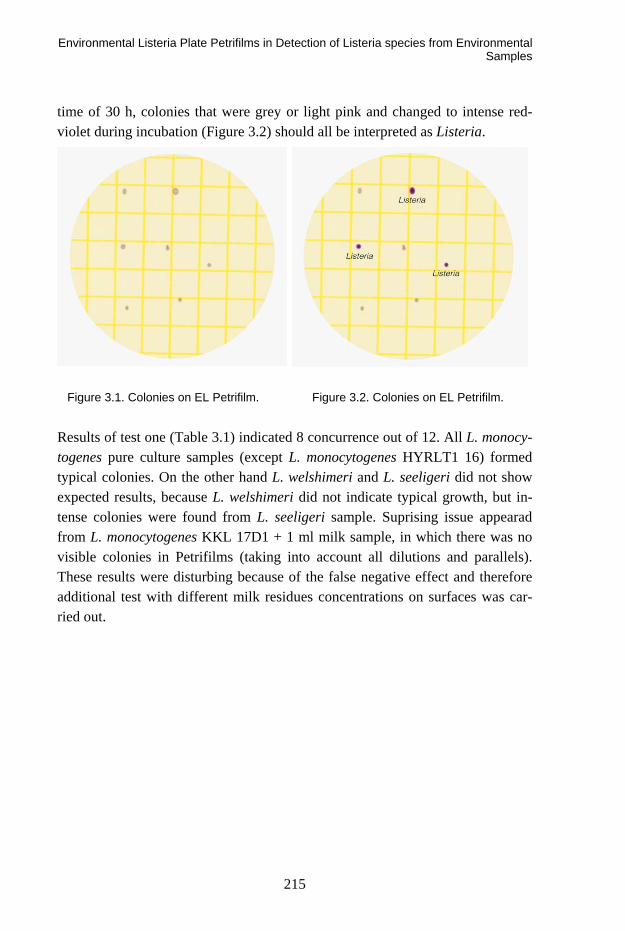
Environmental Listeria Plate Petrifilms in Detection of Listeria species from Environmental Samples
215
time of 30 h, colonies that were grey or light pink and changed to intense red-violet during incubation (Figure 3.2) should all be interpreted as Listeria.
Figure 3.1. Colonies on EL Petrifilm. Figure 3.2. Colonies on EL Petrifilm.
Results of test one (Table 3.1) indicated 8 concurrence out of 12. All L. monocy-togenes pure culture samples (except L. monocytogenes HYRLT1 16) formed typical colonies. On the other hand L. welshimeri and L. seeligeri did not show expected results, because L. welshimeri did not indicate typical growth, but in-tense colonies were found from L. seeligeri sample. Suprising issue appearad from L. monocytogenes KKL 17D1 + 1 ml milk sample, in which there was no visible colonies in Petrifilms (taking into account all dilutions and parallels). These results were disturbing because of the false negative effect and therefore additional test with different milk residues concentrations on surfaces was car-ried out.

Environmental Listeria Plate Petrifilms in Detection of Listeria species from Environmental Samples
216
Table 3.1. Results of the first test.
No Sample Growth on Petrifilm EL Petrifilm EL evaluation
Growth on BHI
1. L .monocytogenes KKL 17D1 intense typical colonies + +
2. L. monocytogenes KKL 17D1 + 1 ml milk no visible colonies -, should be
typical colonies +
3. L .innocua E772 typical colonies + +
4. L. welshimeri E956 fuzzy colonies -, should be intense colonies +
5. L. grayi E931 light colonies + +
6. L. ivanovii E771 typical colonies + +
7. L .seeligeri HY18A1 typical colonies -, should not form typical
colonies +
8. L. monocytogenes E783 typical colonies + +
9. L. monocytogenes K92III typical colonies + +
10. L.monocytogenes HYRLT1 16 very fuzzy colonies -, should be
intense colonies +
11.
L. monocytogenes KKL 17D1 + L.innocua E772 + L. welshimeri E956
intense typical colonies + +
12.
L. grayi E931+ L. ivanovii E771+ L. seeligeri HY18A1 only few colonies + +
The objective of second test was to clarify the effect of milk residues on EL Petrifilms in detecting Listeria from surfaces. Results of EL Petrifilms from dilution 10-4 were too numerous to count, but visual estimation indicated that samples with diluted milk (concentrations 50–100%) in surface gave light colo-nies on Petrifilms. One the other hand, samples with 0–25% milk concentrations in surface showed more intense colour on EL Petrifilms. Same cultivation series on BHI agar plates demonstrated similar grow in all samples with different amount of milk residues. EL Petrifilms from dilution 10-7 had countable colonies and the test series was taking under observation. According to the results in Ta-ble 3.2 and illustrative pictures in Figure 3.3 it can be seen that milk residues in
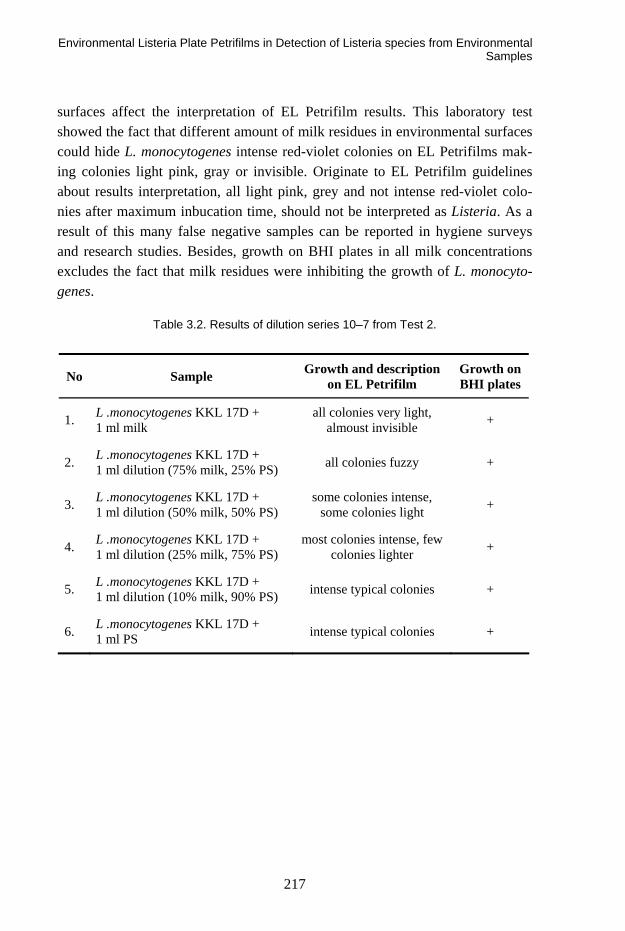
Environmental Listeria Plate Petrifilms in Detection of Listeria species from Environmental Samples
217
surfaces affect the interpretation of EL Petrifilm results. This laboratory test showed the fact that different amount of milk residues in environmental surfaces could hide L. monocytogenes intense red-violet colonies on EL Petrifilms mak-ing colonies light pink, gray or invisible. Originate to EL Petrifilm guidelines about results interpretation, all light pink, grey and not intense red-violet colo-nies after maximum inbucation time, should not be interpreted as Listeria. As a result of this many false negative samples can be reported in hygiene surveys and research studies. Besides, growth on BHI plates in all milk concentrations excludes the fact that milk residues were inhibiting the growth of L. monocyto-genes.
Table 3.2. Results of dilution series 10–7 from Test 2.
No Sample Growth and description on EL Petrifilm
Growth on BHI plates
1. L .monocytogenes KKL 17D + 1 ml milk
all colonies very light, almoust invisible +
2. L .monocytogenes KKL 17D + 1 ml dilution (75% milk, 25% PS) all colonies fuzzy +
3. L .monocytogenes KKL 17D + 1 ml dilution (50% milk, 50% PS)
some colonies intense, some colonies light +
4. L .monocytogenes KKL 17D + 1 ml dilution (25% milk, 75% PS)
most colonies intense, few colonies lighter +
5. L .monocytogenes KKL 17D + 1 ml dilution (10% milk, 90% PS) intense typical colonies +
6. L .monocytogenes KKL 17D + 1 ml PS intense typical colonies +
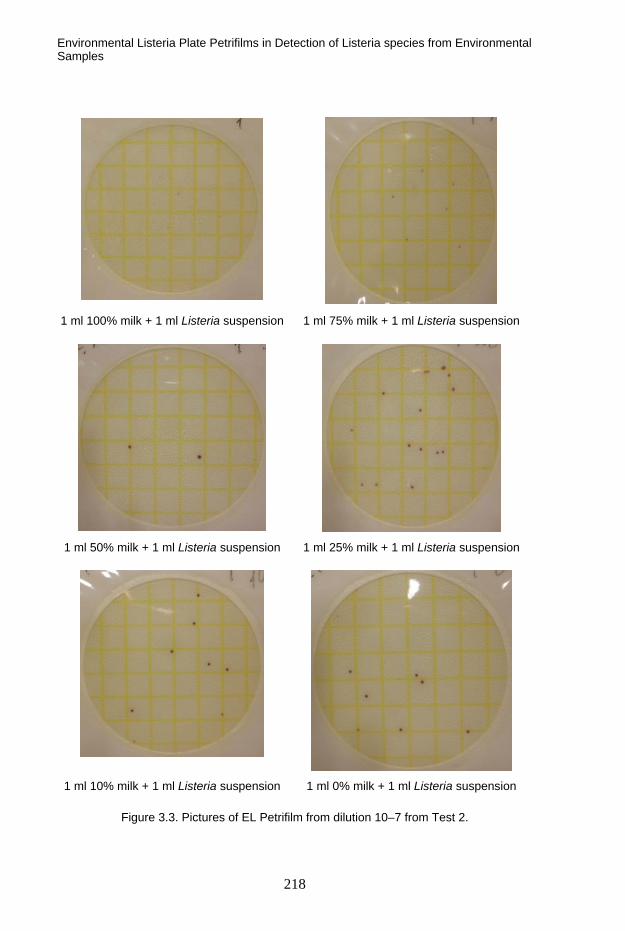
Environmental Listeria Plate Petrifilms in Detection of Listeria species from Environmental Samples
218
1 ml 100% milk + 1 ml Listeria suspension 1 ml 75% milk + 1 ml Listeria suspension
1 ml 50% milk + 1 ml Listeria suspension 1 ml 25% milk + 1 ml Listeria suspension
1 ml 10% milk + 1 ml Listeria suspension 1 ml 0% milk + 1 ml Listeria suspension
Figure 3.3. Pictures of EL Petrifilm from dilution 10–7 from Test 2.

Environmental Listeria Plate Petrifilms in Detection of Listeria species from Environmental Samples
219
Several EL Petrifilm validation studies (McNamara, Kupskiook and Zook, 2005; Groves, Nyachuba and Donnelly, 2007; Zook, Horter and Gambrel-Lenarz, 2006) have indicated good results comparing EL Petrifilm method to standard methods in detecting Listeria from environmental surfaces. Therefore EL Petri-film method is proposed as an equal method to standard methods and suggested to use in detecting Listeria, because it is rapid, trustworthy and often cost-saving. It is recommended to perform inhouse validation to find out the suitabil-ity with the application in question. For the conclusive evaluation, additional tests with different residues and bacteria strains should be performed.
4. Conclusion
EL Petrifilm Plate method offers rapid alternative to standard methods for de-tecting Listeria species from environmental surfaces. According to laboratory validation test results some misinterpretation with EL Petrifilm method can however occur. Therefore it is recommended to perform comparison tests with both the used and the alternative methods before starting to use a new method. Various applications can have parameters affecting to the test method.
References
Bell, C. and Kyriakides, A. 2002b. Listeria monocytogenes. In: Blackburn, C.W. and
McClure, P.J. (eds.) Foodborne pathogens: Hazards, risk analysis and control. UK: CRC Press LLC and Woodhead Publishing Ltd. Pp. 337–361.
Groves, E., Nyachuba, G. and Donnelly, C.W. 2007. Comparison of 3M™ Petrifilm™
Environmental Listeria Plates with Selective Enrichment Methods for the Detection
and Recovery of Listeria monocytogenes on Environmental Surfaces. Journal of Food Science, Vol. 72, No. 9, pp. M346–M354.
McNamara, A. M, Kupskiook, B. and Zook, C. 2005 Evaluation of 3M™Petrifilm™Environmental
Listeria Plate method for detection and enumeration of Listeria monocytogenes
compared to the USDA-MPN and the VIDAS®LIS methods. University of Wiscon-sin-River Falls Microbiology Symposium.

Environmental Listeria Plate Petrifilms in Detection of Listeria species from Environmental Samples
220
Rosmini, M. R., Signorini, M. L., Schneider, R. and Bonazza, J. C. 2006. Evaluation of
two alternative techniques for counting mesophilic aerobic bacteria in raw milk. Food Control, Vol. 15, pp. 39–44.
Zook, C., Horter, B. and Gambrel-Lenarz, S. 2006. Validation of 3M™ Petrifilm™ Envi-
ronmental Listeria Plate Method. 3M Company. Microbiological Methods Session, P-504, AOAC INTERNATIONAL 2006 Annual Meeting.
3M™ Petrifilm™ Environmental Listeria Plate Receives Validation from the AOAC™
Research Institute. 2006. 3M Company. Microbiological Methods Session, P-504, AOAC INTERNATIONAL 2006 Annual Meeting.
The BD BACTEC System for Automatic Culture, Reading and Reporting of Results of Sterile Samples
221
The BD BACTEC System for Automatic Culture, Reading and Reporting of Results
of Sterile Samples
Ann-Charlotte Merkel BD Diagnostics, Sweden

Laboratory Study of Garment Treatment using Ozone
222
Laboratory Study of Garment Treatment using Ozone
Savvas Yennaris Veterinary Services, Cyprus
Abstract
Ozone has well-documented bactericidal properties, can be generated cheaply, and although toxic, rapidly dissociates to oxygen. Thus, as a decontamination agent, gaseous ozone offers potential advantages over chlorine-releasing agents and other disinfectants. The use of gaseous ozone is increasingly being employed in many areas where decontamination of surfaces and materials is necessary.
The use of ozone in food industry has developed extensively and is used either in combination with other methods or on its’ own both in gaseous form or dis-solved in water. Further work is needed in order to optimize its’ use and over-come the difficulties caused by the potential toxicity of ozone when inhaled and its’ oxidizing potential. However, ozone is considered an environmentally friendly method and should gradually replace other methods used so far in order to improve the hygienic state of equipment and extend products’ shelf life.
This study investigates the potential use of ozone as a practical way to decon-taminate garments used in food industry by reducing the number of microorgan-isms present on them. It was carried out at VTT in Finland within the SAFEFOODERA-funded project PUFFIN. For the purpose of the study we used garments made of three different types of material (PE/Cotton). These garments used in the food and pharmaceutical industry were provided and washed by Ber-endsen Textil Services. The garments were contaminated using four different types of microorganisms (Listeria monocytogenes, Bacillus cereus, Salmonella enterica subsp. enterica serotype, Aspergillus niger) and two different kind of soiling material (blood and nutrient broth). Contaminated garments were then treaded using the ELOZO DH400™ ozone chamber using three different protocols.

Laboratory Study of Garment Treatment using Ozone
223
Results indicate that ozone treatment of such garments can be an efficient way to reduce their contamination load and therefore minimize the transfer of patho-genic microorganisms in food during processing and handling. The amounts of all four types of microorganisms were reduced and in many parameter combina-tions even destroyed totally in the ozone chamber. Significant differences were observed between blood soiled and nutrient broth soiled sleeves since the or-ganic material (blood) had reduced the killing effect of ozone. The general out-come was that, although ozone treatment can not replace the conventional wash-ing of heavily contaminated clothes with high levels of organic debris, it can be used to disinfect ‘clean’ clothes and reduce the level of microorganisms to a safer level during the working day. It is necessary to optimize the treatment pro-tocol (ozone levels and duration) for best results.


Series title, number and report code of publication
VTT Symposium 266 VTT-SYMP-266
Author(s) Gun Wirtanen & Satu Salo Title
41st R3-Nordic Symposium Cleanroom technology, contamination control and cleaning Abstract R3-Nordic, the Nordic Society of Cleanroom Technology, is a non-profit, inde-pendent association for the promotion of new technologies in cleanroom technol-ogy and contamination control in the Nordic countries. The aim of the annual R3-Nordic Symposium is to provide knowledge within the pharmaceutical, food and electronic industries as well as hospitals. The topics at the 41st R3-Nordic Con-tamination Control Symposium are hygienic design, ergonomics, planning, audit-ing, sterilization techniques, rapid test methods, risk assessment, macroparticles, cleaning of clean rooms, protective clothing, monitoring techniques, contamina-tion control, cleanroom technology and management, regulations and standards in clean and controlled rooms. The venue of the annual symposium 2010 is Dipoli in Espoo. The persons involved in the Programme Committee are Kari Leonsaari, Sirkka Malmioja, Antti Mikkola, Raimo Pärssinen and Satu Salo The editors of the proceedings would like to express their gratitude to the speakers for preparing the abstracts published in the journal Renhetsteknik as well as the extended ab-stracts or full papers published in these proceedings.
ISBN 978-951-38-7595-4 (soft back ed.) 978-951-38-7596-1 (URL: http://www.vtt.fi/publications/index.jsp)
Series title and ISSN Project number VTT Symposium 0357-9387 (soft back ed.) 1455-0873 (URL: http://www.vtt.fi/publications/index.jsp)
102838
Date Language Pages May 2010 English 223 p.
Name of project Commissioned by 41st R3-Nordic Symposium R3-Nordic
Keywords Publisher Contamination control, cleanroom, air, hygiene, cleaning, disinfection, cleanroom clothing, hygienic design, ergonomics, pharmaceutical industry, electronics, hospital, operating theatre, food industry
VTT Technical Research Centre of Finland P.O. Box 1000, FI-02044 VTT, Finland Phone internat. +358 20 722 4520 Fax +358 20 722 4374
VTT CREATES BUSINESS FROM TECHNOLOGY�Technology�and�market�foresight�•�Strategic�research�•�Product�and�service�development�•�IPR�and�licensing�•�Assessments,�testing,�inspection,�certification�•�Technology�and�innovation�management�•�Technology�partnership
•�•�•��VTT�SYMPO
SIUM
�266�41
ST R3-N
OR
dIc
�SYMPO
SIUM
.�cleA
NR
OO
M�Tec
hN
OlO
gY,�c
ON
TAM
INA
TION
�cO
NTR
Ol�A
Nd
�cleA
NIN
gISBN 978-951-38-7595-4 (soft back ed.) ISBN 978-951-38-7596-1 (URL: http://www.vtt.fi/publications/index.jsp)ISSN 0357-9387 (soft back ed.) ISSN 1455-0873 (URL: http://www.vtt.fi/publications/index.jsp)
R3-Nordic, the Nordic Society of Cleanroom Technology, is a non-profit, indepen-dent association for the promotion of new technologies in cleanroom technology and contamination control in the Nordic countries. The aim of the annual R3-Nordic Symposium is to provide knowledge within the pharmaceutical, food and electronic industries as well as hospitals. The topics at the 41st R3-Nordic Contamination Con-trol Symposium are hygienic design, ergonomics, planning, auditing, sterilization techniques, rapid test methods, risk assessment, macroparticles, cleaning of clean rooms, protective clothing, monitoring techniques, contamination control, clean-room technology and management, regulations and standards in clean and control-led rooms.