vtt technical research centre of finland ltd nils-olof nylund 130416.pdf · vtt technical research...
TRANSCRIPT

VTT TECHNICAL RESEARCH CENTRE OF FINLAND LTD
Introduction to electric vehicles.
Why and why not EVs? How about other
ways of transportation in the future?
Tampere University of Technology
Industrial Perspectives 13.4.2016
Nils-Olof Nylund, Research Professor www.teslamotors.com

2 14/04/2016 2
Outline
Setting the stage
Alternative energies for transport
EU policies and guidelines
Examples of 2030/2050 targets and scenarios
EV numbers
Features of electric passenger cars
Features of electric buses
Summary

3 14/04/2016 3
Elements determining
the environmental impacts of traffic
Community structure
Traffic volumes and
choice of transport
mode
Energy for transport
Vehicles and user
behaviour
Policy orientation Technology orientation
Co
ns
um
er
leve
l
S
ys
tem
le
ve
l
4 14/04/2016 4
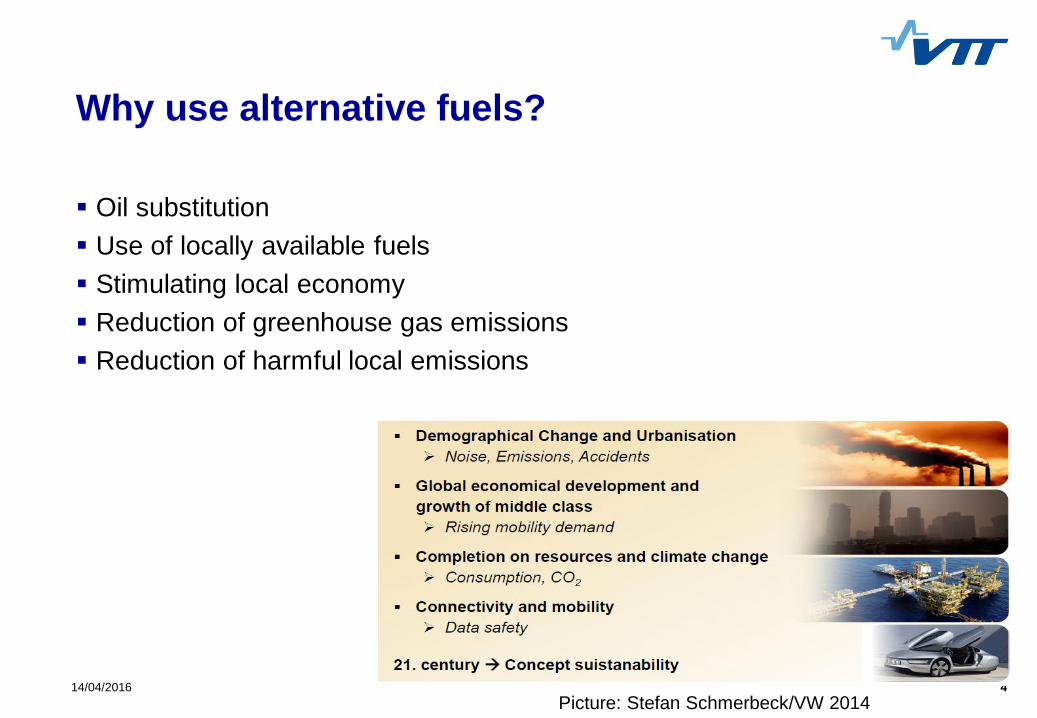
Why use alternative fuels?
Oil substitution
Use of locally available fuels
Stimulating local economy
Reduction of greenhouse gas emissions
Reduction of harmful local emissions
Picture: Stefan Schmerbeck/VW 2014

5
Reducing CO2 emissions
═ * * Total emission
Transport work
(km)*
Energy consumption
(MJ/km)*
Carbon intensity
(g CO2/MJ)
Reduce
transport work
”Modal shift” &
energy efficiency
Renewable
energy
Action
*passenger km/ton km

6
Hierarchy of fuels
Aviation
Marine
Heavy-duty road vehicles
Rail
Light-duty road vehicles &
urban services
Ne
ed
fo
r liq
uid
fu
els
Po
ssib
ility fo
r ele
ctrific
atio
n in
cre
ase
s

7
As for technology options:
Remember: In reality, one size doesn’t fit all!

Marc Steen/JRC 2014
Liquid biofuels and methane are the most versatile alternatives!

9 14/04/2016 9
Fast fueling/charging
Diesel refueling
70 l/min
~40 MW
Fast charging of E-buses
650 kW (planned)
Opbrid/Busbaar V3

10 14/04/2016 10
Electric timber truck (just joking!)

11 14/04/2016 11
Renewable energy for transport
The options are:
Liquid and gaseous biofuels
Renewable electricity
Renewable hydrogen
Electrofuels
Power-to-gas
Power-to-liquids

12 14/04/2016 12
The 2011 EU White Paper on Transport
A vision for a competitive and sustainable transport system
Growing transport and supporting mobility while reaching a 60% GHG
emission reduction target
Ten goals grouped in three main groups:
Developing and deploying new and sustainable fuels and propulsion
systems
Optimising the performance of multimodal logistic chains, including by
making greater use of more energy-efficient modes
Increasing the efficiency of transport and of infrastructure use with
information systems and market-based incentives
http://ec.europa.eu/transport/strategies/2011_white_paper_en.htm

13 14/04/2016 13
2020 climate and energy package &
Directive 2009/28/EC ”RES”
10 % renewable energy in transport by 2020

14
No 2030 target for renewable energy in transport!

15 14/04/2016 15
Directive 2014/94/EU (October 2014) on the
deployment of alternative fuels infrastructure

http://www.iea.org/evi/Global-EV-Outlook-2015-Update_2page.pdf
World vehicle registrations in 2014 89.3 million

17 14/04/2016 17
Alternative fuel vehicle registrations within EU
EVs
BEV + PHEV
HEVs Gaseous
fuels
2014 69 996 176 525 238 666
2015 146 161 217 261 218 713
Change +109 % +23 % -8 %
Total share*) 1.0 1.5 1.5
Total EU 28 registrations 14.4 million units
http://www.acea.be/statistics

18 14/04/2016 18
Projections for 2050 – Reference scenario 2013
Passenger cars
https://ec.europa.eu/energy/en/statistics/energy-trends-2050

© OECD/IEA 2015
ETP 2016 analysis Energy demand in the transportation sector Focus on urban areas
19 January 2015
Transport Contact Group
Pierpaolo Cazzola International Energy Agency
© OECD/IEA 2015
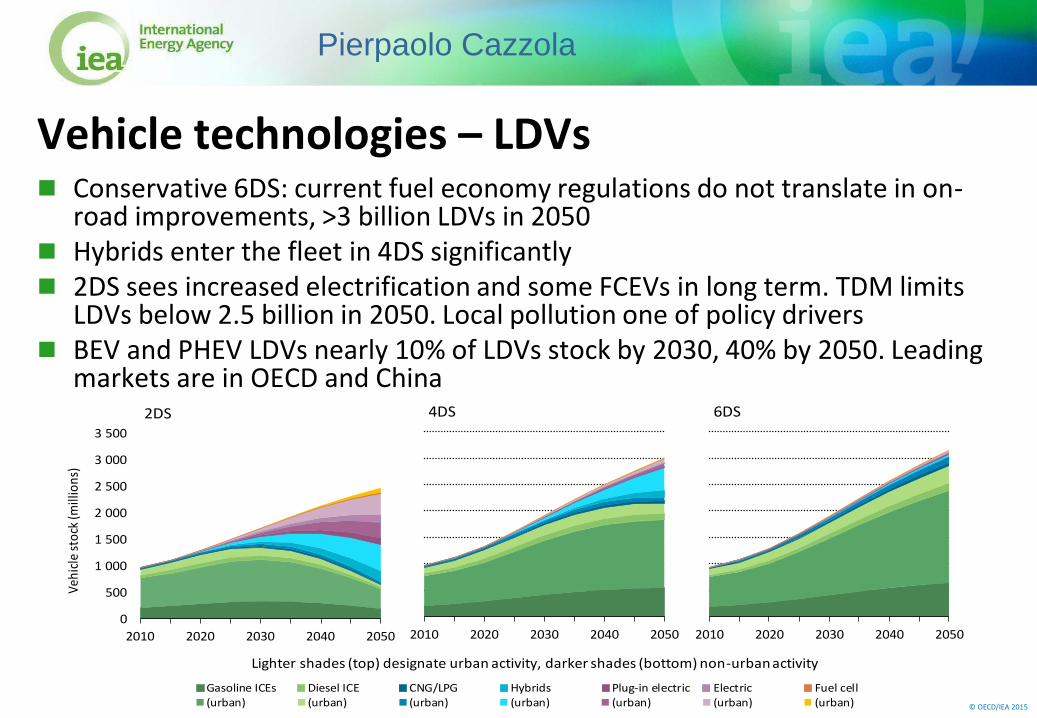
Vehicle technologies – LDVs
0
500
1 000
1 500
2 000
2 500
3 000
3 500
2010 2020 2030 2040 2050
Veh
icle
sto
ck (m
illio
ns)
2DS
Lighter shades (top) designate urban activity, darker shades (bottom) non-urban activity
2010 2020 2030 2040 2050
4DS
2010 2020 2030 2040 2050
6DS
Two-wheelers are all urban by assumption
Conservative 6DS: current fuel economy regulations do not translate in on-road improvements, >3 billion LDVs in 2050
Hybrids enter the fleet in 4DS significantly 2DS sees increased electrification and some FCEVs in long term. TDM limits
LDVs below 2.5 billion in 2050. Local pollution one of policy drivers BEV and PHEV LDVs nearly 10% of LDVs stock by 2030, 40% by 2050. Leading
markets are in OECD and China
Gasoline ICEs Diesel ICE CNG/LPG Hybrids Plug-in electric Electric Fuel cell(urban) (urban) (urban) (urban) (urban) (urban) (urban)
Pierpaolo Cazzola
21 14/04/2016 21
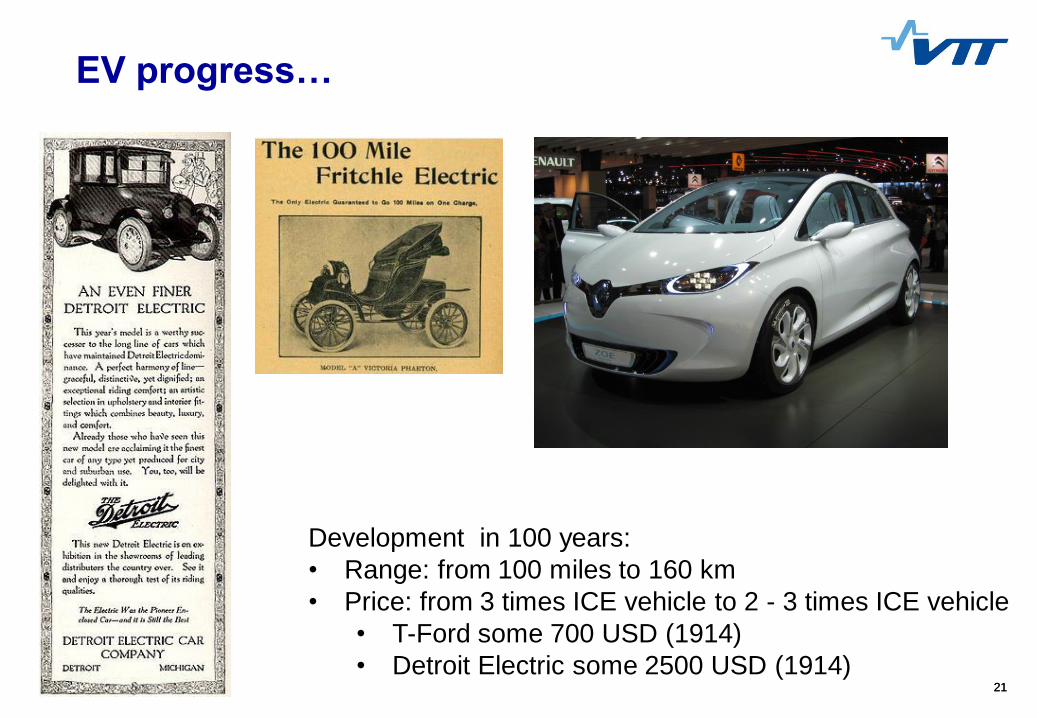
Development in 100 years:
• Range: from 100 miles to 160 km
• Price: from 3 times ICE vehicle to 2 - 3 times ICE vehicle
• T-Ford some 700 USD (1914)
• Detroit Electric some 2500 USD (1914)
EV progress…

22
Conditions for EV break-through
Sufficient offerings of EVs
Satisfactory performance (driving range) corresponding to people’s
needs
Affordable and cost effective EVs
Adequate recharging infrastructure
Easiness of use and recharging
Added value in comparison to ICE vehicles
What about the carbon intensity of power generation?

23 14/04/2016 23
Different kinds of EVs
These two (Reva, Think)
didn’t turn people on
This one (Tesla S) certainly did!

24 14/04/2016 24
Example on tax-free vehicle prices
Baseline petrol vehicle 17 340 €
BEV 39 490 €
Price factor 2.3
25 14/04/2016 25
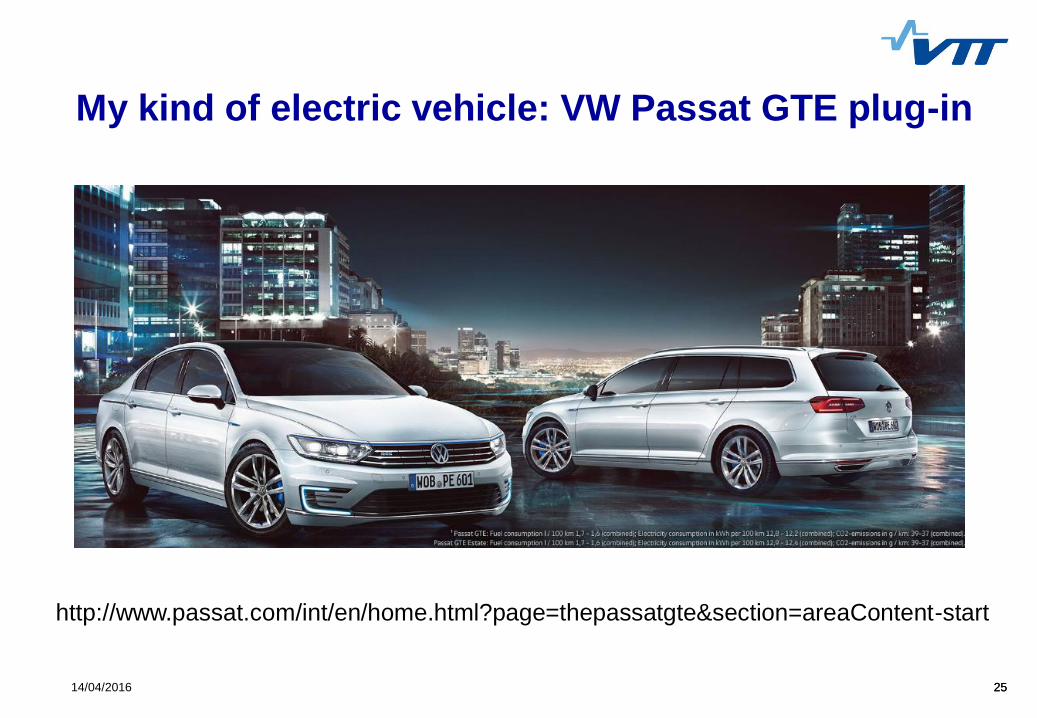
My kind of electric vehicle: VW Passat GTE plug-in
http://www.passat.com/int/en/home.html?page=thepassatgte§ion=areaContent-start

26 14/04/2016 26
Norway is at the forefront of EV implementation,
but……
Bus drivers annoyed over
EVs filling up bus lanes

27 14/04/2016 27
The Finnish charging operator VIRTA

28 14/04/2016 28
Energy demand of EVs
In Finland, 2.5 million EVs (whole passenger car fleet)
would correspond to roughly 10 % of total electricity use
29 14/04/2016 29
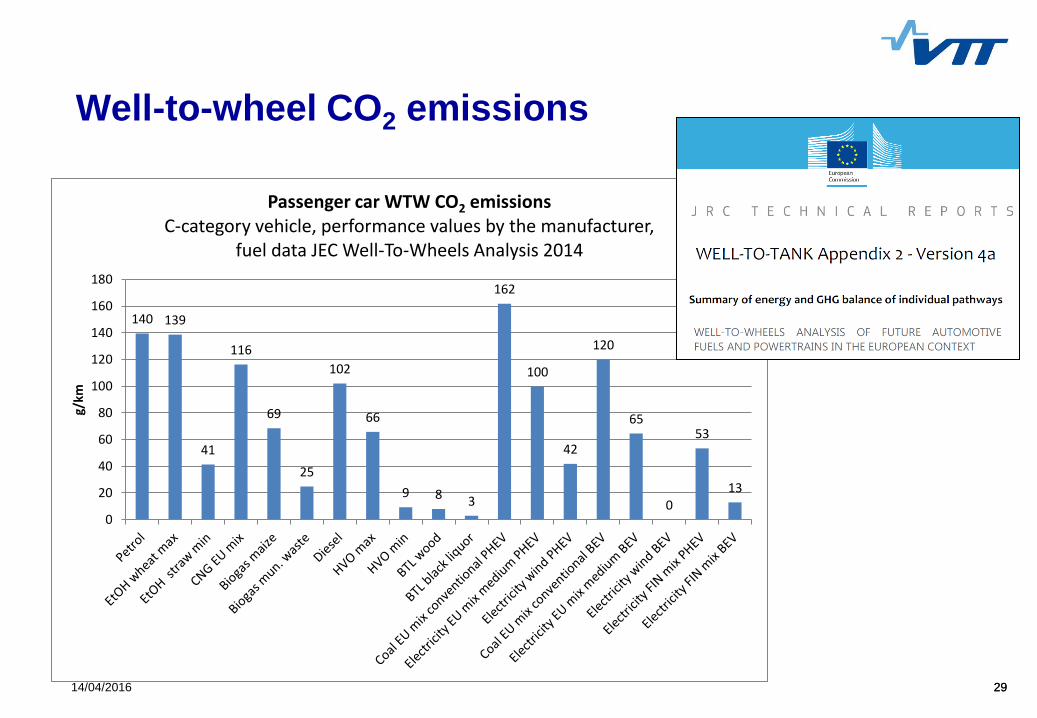
Well-to-wheel CO2 emissions
140 139
41
116
69
25
102
66
9 8 3
162
100
42
120
65
0
53
13
0
20
40
60
80
100
120
140
160
180
g/km
Passenger car WTW CO2 emissionsC-category vehicle, performance values by the manufacturer,
fuel data JEC Well-To-Wheels Analysis 2014
30 14/04/2016 30
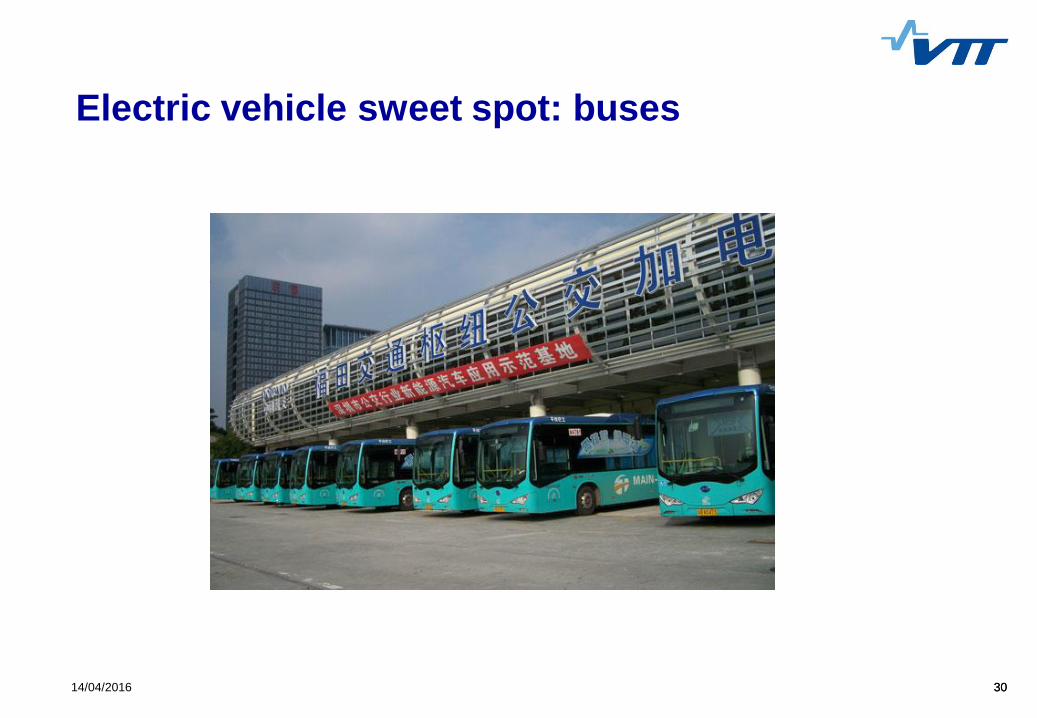
Electric vehicle sweet spot: buses
31 14/04/2016 31
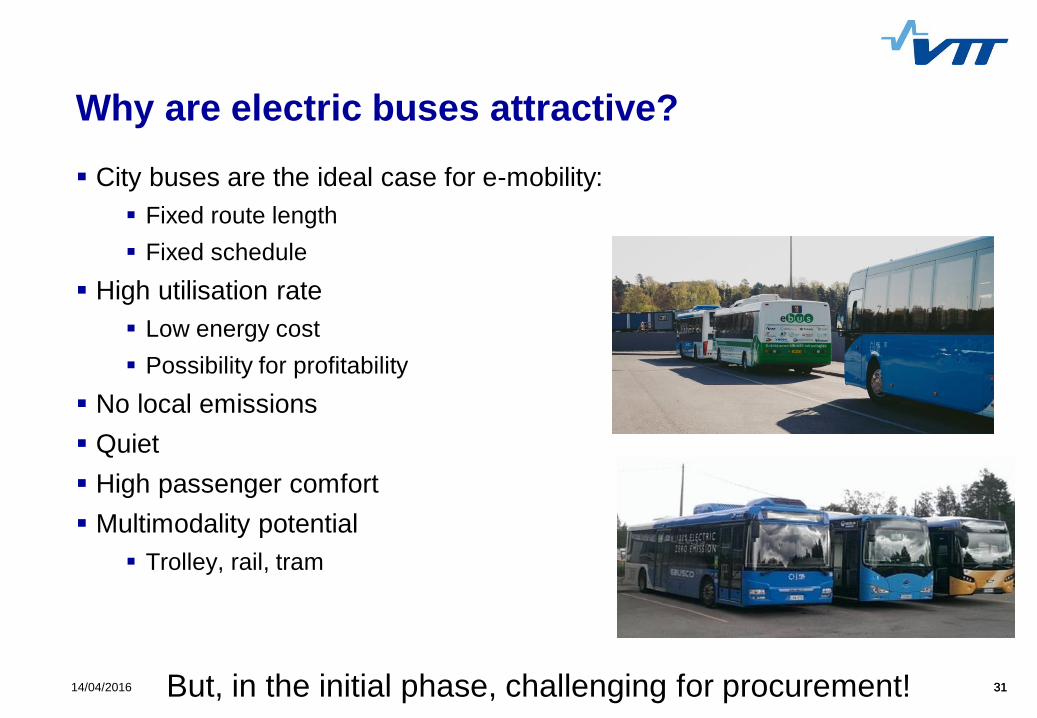
Why are electric buses attractive?
City buses are the ideal case for e-mobility:
Fixed route length
Fixed schedule
High utilisation rate
Low energy cost
Possibility for profitability
No local emissions
Quiet
High passenger comfort
Multimodality potential
Trolley, rail, tram
But, in the initial phase, challenging for procurement!

32 14/04/2016 32
Volvo is going full ahead with electric buses
Magnus Broback/2015

33 14/04/2016 33
The transport system
How do electric buses fit into the public transport system?
- Ministry of Transport
- Helsinki Region Transport
- City of Espoo
- Transdev, Aalto University
The energy supply
How can electric buses be charged and how is the grid
affected?
- Smart grid, grid services and smart bus depot
- Utilities (Fortum), Siemens, charger manufacturers
- Rail traffic synergy, cities
- VTT, TUT, LUT
The vehicle
How do electric buses perform?
- Transdev, VTT
- Bus manufacturers (BYD, Caetano, Ebusco, VDL)
- Component manufacturers (Visedo, Tamware, Vacon)
- Transport Safety Agency
”System”: eBusSystem – the Espoo
demonstration
Public sector Private sector Bus operator Research
34 14/04/2016 34
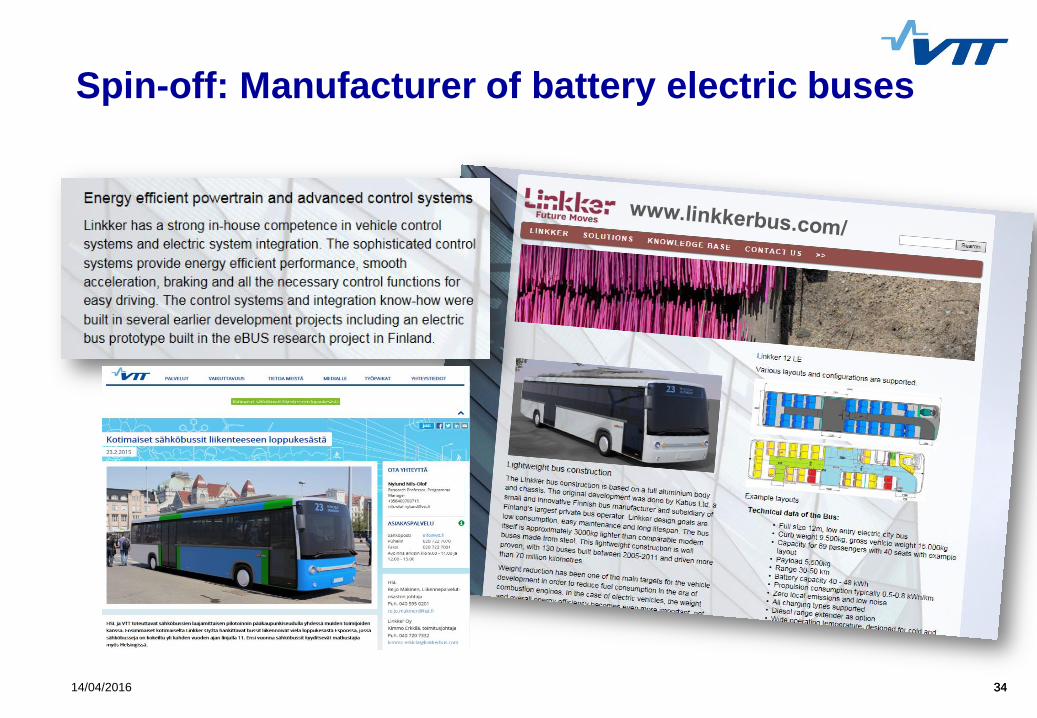
Spin-off: Manufacturer of battery electric buses

Linkker LinkLight
Linkker 12
Low Entry
Aluminum chassis and body
Curb weight 9.500kg
GVW 15.000kg
Payload 5.500kg
Unique lightweight construction

23
55 51 16 ??
12 Linkker buses for Helsinki Region Transport

37 14/04/2016 37
Summary
Electric vehicles are definitely embedded in the roadmaps for future transport
Pace of market penetration is still a question mark
Electric propulsion is best suited for light-duty vehicles and for urban services
The 2020 energy and climate targets do not pose any insuperable challenges
Several alternative vehicle technologies are already on the market
The 2030 energy and climate targets, without any renewable energy targets for transport, have caused some confusion
Going towards 2050 we need progress in energy efficiency, energy diversity and low-carbon energy carriers, as well as a new way to operate the transport system
One single energy carrier cannot meet all needs
It is not electric vehicles vs. biofuels
It is both electric vehicles and biofuels!
When implementing EVs, keep in mind cost effectiveness and the fact that technology is moving rapidly
Electric buses are cost effective already today

TECHNOLOGY FOR BUSINESS