vtvi na p`' - ir.unimas.my of clustering using self... · acknowledgement thank god for all...
TRANSCRIPT

C. )
vtvI na P`' 0-v. 0
Faculty of Cognitive Science and Human Development
COMPARISIONS OF CLUSTERING USING SELF - ORGANIZING MAP, ADAPTIVE RESONANCE THEORY
AND SAMMON MAPS
Drusilla Allyn Ak Lunyut
QA 76.87 D794 2005
Bachelor of Science with Honours (Cognitive Science)
2005

UNIVERSITI MALAYSIA SARAWAK
BORANG PENGESAHAN STATUS TESIS
JUDUL: icLF -(', RGANt2rN6 MAP
ýºfAG'1ýVi ßE..:;,; ANýF 1NCCý(Zý qNC SAMrý+ar, i Mitý
Saya
SESI PENGAJIAN : °°" a. cý.:
ý F; U'>> ý±. A Iil: 7 P. ý lýý LINYLiý
(HURUF BESAR)
mengaku membenarkan tesis * ini disimpan di Pusat Khidmat Maklumat Akademik, Universiti Malaysia Sarawak dengan syarat-syarat kegunaan seperti berikut:
1. Tesis adalah hakmilik Universiti Malaysia Sarawak 2. Pusat Khidmat Maklumat Akademik, Universiti Malaysia Sarawak dibenarkan
membuat salinan untuk tujuan pengajian sahaja 3. Membuat pendigitan untuk membangunkan Pangkalan Data Kandungan Tempatan 4. Pusat Khidmat Maklumat Akademik, Universiti Malaysia Sarawak dibenarkan
membuat salinan tesis ini sebagai bahan pertukaran antara institusi pengajian tinggi 5. ** sila tandakan (4)
SULIT
TERHAD
TIDAK TERHAD
ý
ý
(mengandungi maklumat yang berdarjah keselamatan atau kepentingan seperti tennaktub di dalam AKTA RAHSIA RASMI 1972)
(Mengandungi maklumat Terhad yang telah ditentukan oleh organisasi/badan di mana penyelidikan dijalankan)
(TANDATMNGAN PENULIS)
Alamat Tetap: t. K<�- Ir Fr
i,. ý"ý tlý. r", ýnr ý-{ j MiliA jln
KwaI, ,, 7
Tarikh Tarikh: Zý 0i ? ti uý
Catatan: " Tesis dimaksudkan sebagai tcsis bagi I, jarah Doktor falsafah, Sarjana dan Sarjana Muda " "lika tcsis ini surr alau TERI IAD. sila lantpirkan surat daripada pihak berkuasa/cxganisasi berkenaan dengan mcnyatakan sekali schah dan tcmpoh tcsis ini pc. ýrlu dikelaskan schagai SULIT atau TERHAD

P. KHIDMAT MAKLUMAT AKADEMM( UNIMAS
11111111 IYIIIflIIIRlIII Pusat Khidmat Makiumat Akademik UNIVERSITI MALAYSIA SARAWAK
94300 Kota Samarahan
1000143943
COMPARISONS OF CLUSTERING USING SELF-ORGANIZING MAP, ADAPTIVE RESONANCE THEORY AND SAMMON MAPS
DRUSILLA ALLYN AK LUNYUT
This project is submitted in partial fulfilment of the requirements for a Bachelor of Science (Honours) in Cognitive Science
Faculty of Cognitive Sciences and Human Development, University Malaysia Sarawak
2005
1

The project entitled Comparisons of Clustering using Self-organizing Map, Adaptive Resonance Theory and Sammon Maps was prepared by Drusilla Allyn ak Lunyut and submitted to the Faculty of Cognitive Sciences and Human Development in partial fulfilment of the requirements for a Bachelor of Science (Honours) in Cognitive Science
Received for examination by:
(Mr. Shafiq Fikri bih Abdullah)
Date:
.? ýs.... ý sý ..
11

ACKNOWLEDGEMENT
Thank God for all His blessings!
To begin with, I would like to thank my supervisor, Mr. Shafiq Fikri bin Abdullah for the advice and comments he gave as I carried out this research. I am so pleased that he managed to find the time to read, check and comment my work. I would also thank him for his ideas which helped me a lot in completing this study.
Secondly, I would like to acknowledge the help and support I received from my beloved parents and my other family members for being so understanding and supportive. They helped me going through the ups and downs in solving the problems I faced during the process of completing this study. To my parents, the financial support and the emotional support you gave will be mostly appreciated.
I would also like to extend my gratitude to the lecturers of University Malaysia Sarawak (UNIMAS) especially the Cognitive Sciences Program lecturers for being so kind to teach and share their experience they have in their own expertise. They also taught me in building my ability to think creatively and critically as well.
Last but not least, I would like to forward my thanks to my fellow classmates and friends - Prisscilla J., Lenie C., Angelia R., Zuria, J, Maziah M. and Shirley G. They too helped me a lot in terms of ideas and comments. They taught me many new things which are essential for me in going through this study. Finally, thanks also to my love one, Mack Vember Peter George for his supports.
111

Pusat Khidmat Makfumat Akadettdk UNIVERSITI MALAYSIA SARAWAK 44 i(tii Kota Samarahan
TABLE OF CONTENTS
Acknowledgement Table of content List of figures List of tables Abstract Abstrak
Introduction 1.1 Introduction 1.2 Problem statement 1.3 Objectives
1.3.1 General objective 1.3.2 Specific objectives
1.4 Scope of study 1.5 Significance of study 1.6 Definition of key-terms
1.6.1 Self-organizing map (SOM) 1.6.2 Adaptive resonance theory (ART) 1.6.3 Sammon maps 1.6.4 Clustering
1.7 Conclusion
2 Literature Review 2.1 Introduction 2.2 Self-organizing map 2.3 Adaptive resonance theory 2.4 Sammon maps 2.5 Clustering 2.6 Conclusion
3 Research Methodology 3.1 Introduction 3.2 Data set used 3.3 N-gram tool 3.4 Neural network tools 3.5 Classification performance 3.6 Conceptual framework 3.7 Conclusion
4 Results and Discussions
iii iv vi ix I
xi
1 1 2 3 3 3 4 4 5 5 5 6 6 6
7 7 8
11 15 19 23
24 24 24 27 29 31 33 33
35
iv

4.1 Introduction 35 4.2 Results 36
4.2.1 SOM outputs 36 4.2.2 ART-2 outputs 45 4.2.3 Sammon maps outputs 50
4.3 Discussions 54 4.4 Conclusion 60
5 Summary, Recommendation, Conclusion 61 5.1 Introduction 61 5.2 Summary 61 5.3 Research Conclusions 62 5.4 Recommendation 64 5.5 Conclusion 65
6 References in
7 Appendix xiv Appendix A Sammon maps source code xiv Appendix B Indicator for protein input and their relative genogroup xx Appendix C 66 20-dimensional input patterns xxii
V

LIST OF FIGURES
Figure 2.1 The SOM algorithm
Figure 2.2 ART basic architecture
Figure 2.3 The idea of the adaptive learning
Figure 2.4 Sammon Maps algorithm
Figure 2.5 Example of clustering output
Figure 2.6 Tree of classification types
Figure 2.7 Clustering Methodology
Figure 3.1 Example of protein sequences
Figure 3.2 Example of n-gram converted data
Figure 3.3 N-gram algorithm
Figure 3.4 Example of a protein sequence in FASTA format
Figure 3.5 Part of the SNNS input pattern file
8
12
13
16
20
20
21
26
26
27
28
30
Figure 3.6 The benchmark used in this research to compare the result for each algorithm 32
V1

Figure 3.7 Conceptual framework 33
Figure 4.1 Result of SOM using parameters; epoch = 20, h=0.2, nodes = 20 by 20 37
Figure 4.2 Result of SOM using parameters; epoch = 20, h=0.2, nodes = 35 by 35 38
Figure 4.3 Result of SOM using parameters; epoch = 20, h=0.5, nodes = 35 by 35 39
Figure 4.4 Result of SOM using parameters; epoch = 20, h=0.9, nodes = 35 by 35 40
Figure 4.5 Result of SOM using parameters; epoch = 20, h=0.2, nodes = 50 by 50 41
Figure 4.6 Result of SOM using parameters; epoch = 50, h=0.2, nodes = 35 by 35 42
Figure 4.7 Result of SOM using parameters; epoch = 50, h=0.5, nodes = 35 by 35 43
Figure 4.8 Result of SOM using parameters; epoch = 50, h=0.9, nodes = 35 by 35 44
Figure 4.9 2D Sammon maps output with MF = 0.2,18 epochs, error = 0.252605 51
Figure 4.10 2D Sammon maps output with MF = 0.3,17 epochs, error = 0.256786 52
Figure 4.11 2D Sammon maps output with MF = 0.5,3 epochs, error = 0.252796 52
Figure 4.12 2D Sammon maps output with MF = 0.7,3 epochs, error = 0.236585 53
Figure 4.13 2D Sammon maps output with MF = 0.9,3 epochs, error = 0.250146 53
Figure 4.14 Illustration of SOM cluster compared to the available benchmark 55
vii

Figure 4.15 Illustration of ART-2 cluster compared to the available benchmark 56
Figure 4.16 Illustration of Sammon Maps cluster compared to the available benchmark 58
Vlll
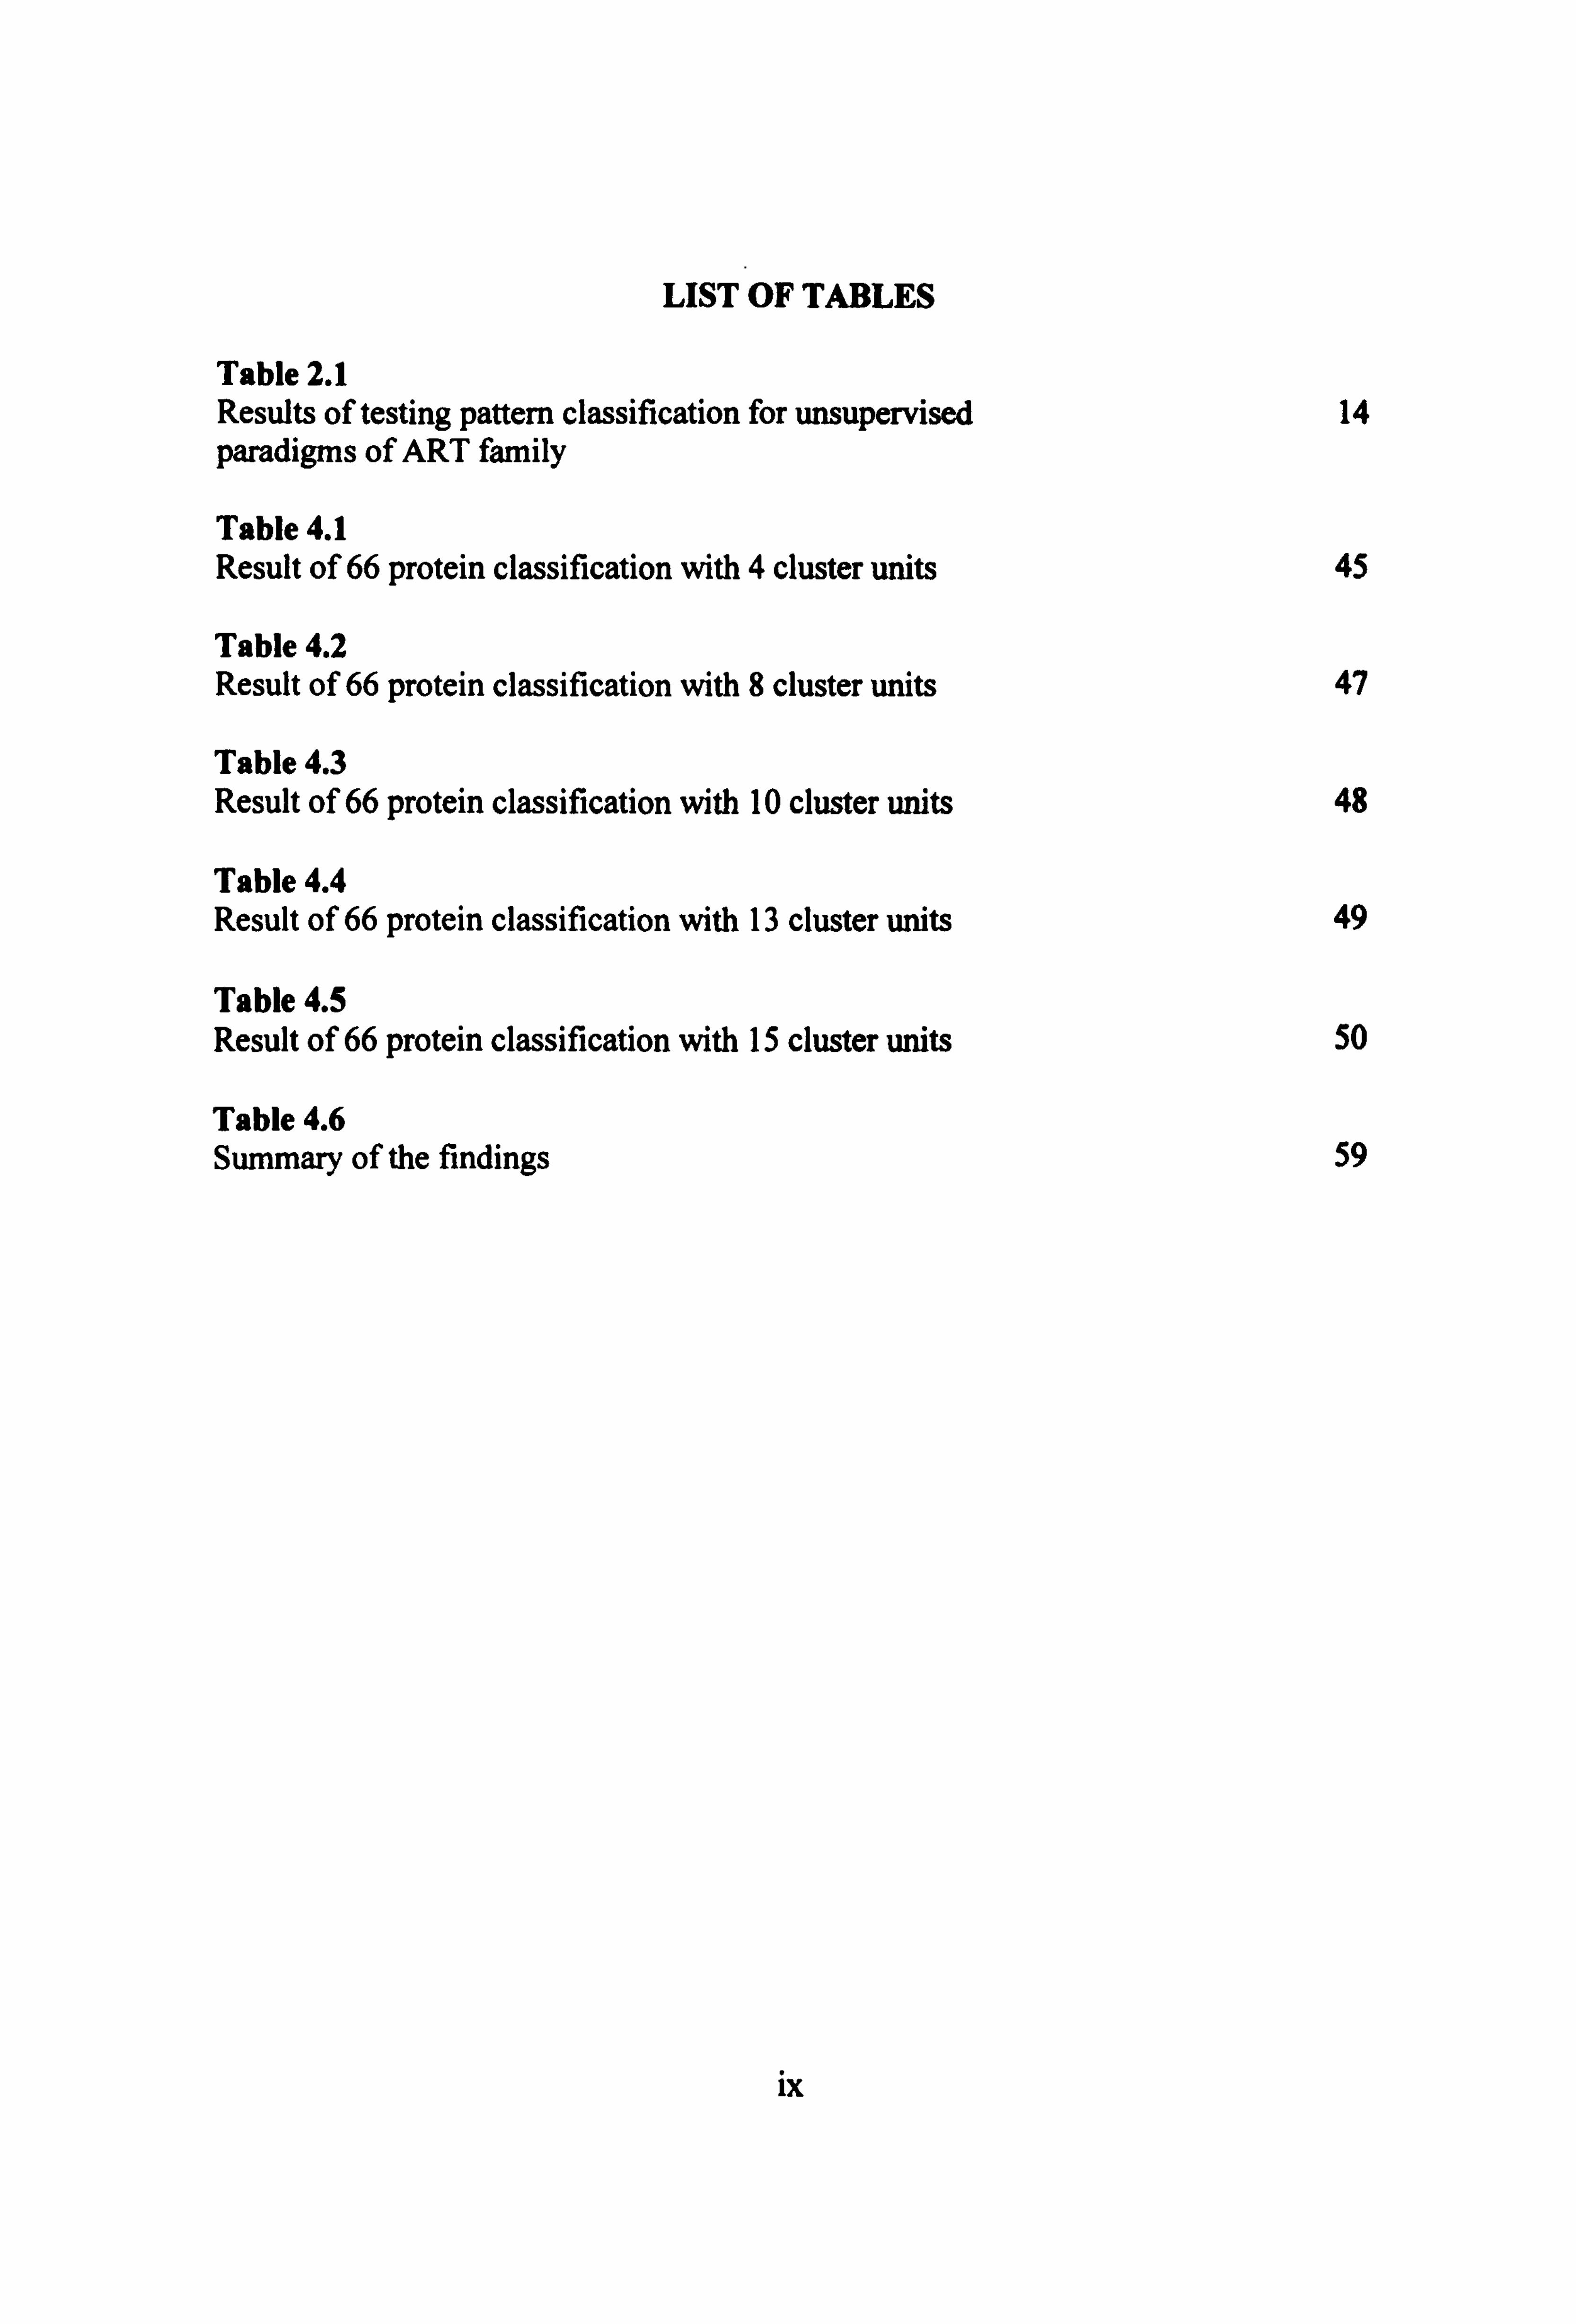
LIST OF TABLES
Table 2.1 Results of testing pattern classification for unsupervised paradigms of ART family
Table 4.1 Result of 66 protein classification with 4 cluster units
Table 4.2 Result of 66 protein classification with 8 cluster units
Table 4.3 Result of 66 protein classification with 10 cluster units
Table 4.4 Result of 66 protein classification with 13 cluster units
Table 4.5 Result of 66 protein classification with 15 cluster units
Table 4.6 Summary of the findings
14
45
47
48
49
50
59
ix

ABSTRACT
COMPARISONS OF CLUSTERING USING SELF-ORGANIZING MAP, ADAPTIVE RESONANCE THEORY AND SAMMON MAPS
DRUSILLA ALLYN AK LUNYUT
This study aims to identify which algorithm among Self-organizing Map (SOM), Adaptive Resonance Theory (ART-2) and Sammon Maps best in clustering 66 protein sequences data properly. The data used consists of protein sequences for viruses which cause the hand, foot and mouth disease for the year 1997 - 2000 within the Asia-Pacific region which includes countries like Malaysia (Sarawak), Singapore and Australia. Raw data which is in alphabetic form is converted into real value form before being presented to the three algorithms. This conversion is done by using n- gram tool. The output data is then being aligned to fit the format for each algorithm's tool. For SOM and ART-2, the tool used is called SNNS v4.2 (Stuttgart Neural Network Simulator) which was developed at University of Stuttgart. While Sammon Maps program is developed using C programming language. Trial and error method is used to determine the suitable and optimal parameters for each algorithm. Results from each algorithm are compared with a benchmark obtained from the study by Cardosa et al. (2003). Comparison is done by observation where the number of misclassified proteins is counted. Hence, the more misclassified proteins counted, the poorer the performance of the algorithm is. The findings show that SOM is the best classifier with 3 mistakes with configuration 50 epochs, 35 X 35 dimension and learning height 0.9. Then followed by Sammon Maps with 7 mistakes with 3 epochs and MF = 0.7. ART-2 yields the poorest performance with a total of 9 mistakes for 4 or 8 number of cluster units.
X

ABSTRAK
COMPARISONS OF CLUSTERING USING SELF-ORGANIZING MAP, ADAPTIVE RESONANCE THEOR YAND SAMMON MAPS
DR USILLA ALL YN AK L UNYUT
Kajian ini bertujuan untuk mengenalpasti algoritma yang manakah di antara Self-
organizing Map (SOM), Adaptive Resonance Theory-2 (ART-2) dan Sammon Maps
yang dapat mengelompokkan 66 susunan protein dengan betul berpandukan dengan
maklumat pengelasan yang sedia ada. Data yang digunakan terdiri daripada susunan protein virus yang telah menyebabkan penyakit tangan, kaki dan mulut dari tahun 1997hingga 2000 yang merebak di kawasan negara-negara Asia-Pasifik yang merangkumi Negara Malaysia (Sarawak), Singapura dan Australia. Data awal berbentuk huruf-huruf perlu ditukar bentuk kepada data berangka terlebih dahulu
sebelum diberi kepada ketiga-tiga agoritma tersebut. Ini dilakukan dengan
menggunakan alat n-gram. Output data tersebut kemudiannya disusun semula mengikut kehendak format ke semua algoritma yang terlibat. Untuk SOM dan ART- 2, alatan yang digunakan dipanggil SNNS v4.2 (Stuttgart Neural Network Simulator)
yang direka di University of Stuttgart. Manakala program Sammon Maps akan dihasilkan dengan menggunakan aturcara C. Kaedah cuba-cuba akan digunakan
untuk menentukan parameter yang optimal dan sesuai untuk setiap algoritma. Keputusan yang terhasil dari setiap algoritma akan dibandingkan dengan satu keputusan yang sedia ada oleh Cardosa et at. (2003). Perbandingan dilakukan melalui pemerhatian dengan mengira protein yang dikelompokkan pads kelompok yang salah. Maka semakin banyak protein yang salah dikelompokkan, semakin teruk
prestasi algoritma tersebut. Penemuan yang diperolehi menunjukkan algoritma SOM
adalah yang terbaik dalam tugas penggelompokkan dengan 3 kesalahan pada konfigurasi 50 epoch, berdimensi 35 X 35 dan kadar pembelajaraan 0.9. Seterusnya diikuti oleh Sammon Maps dengan jumlah kesalahan 7, berkonfigurasi 3 epoch dan
nilai MF=0.7. ART-2 memperoleh prestasi yang paling kurang baik dengan 9 kesalahan dan 4 atau 8 unit kelompok.
X1

CHAPTER 1
INTRODUCTION
1.1 Introduction
This research proposes the study of different types of artificial neural network
namely, Self-Organizing Maps (SOM), Adaptive Resonance Theory (ART) and
Sammon Maps in data classification. To be exact, this research is to compare the
ability of each neural network in clustering data correctly to its group. Many
researches on different approaches of clustering have been carried out. This research
will implement the unsupervised neural network to determine the performance of data
classification. Data classification involves large amount of data which will be
grouped into several cluster according to their similarity of features.
1

1.2 Problem Statement
Nowadays, data clustering can be considered the most important unsupervised
learning problem. It deals with finding a structure in a collection of unlabeled data. In
World Wide Web (WWW) as such, document classification is essential in clustering
web log data to discover groups of similar access patterns. Apart from this, in
marketing, finding groups of customers with similar behavior given a large database
of customer data is not an easy work. Generally, in an organization, data involved is
usually in large amount.
Some requirements that a clustering algorithm should satisfy are:
" Scalable;
" Coping with different types of attributes (features);
" Identify clusters with subjective shape;
" Minimal requirements for domain knowledge in order to determine input
parameters;
" Capable to deal with noise and outliers;
" Insensitive to the order of input records;
" High dimensional data processing; and
2

" Understandable and easy to use
However, most of the current clustering algorithms are not able yet to satisfy
all the requirements sufficiently. Thus, the study to compare the protein classification
using the three mechanism of clustering and determine the best mechanism is
essential.
1.3 Objectives
1.3.1 General Objective
This study aims to compare the performance of the three clustering algorithms
in protein sequences data. The best algorithm which performs well will be
determined.
1.3.2 Specific Objectives
" Apply the foot and mouth diseases data set to SOM, ART and Sammon
Maps
" Compare the clustering efficiency for each of the algorithm
3

1.4 Scope of Study
The study involves only three clustering algorithms - SOM, ART2 and
Sammon Maps. The development of SOM and ART 2 software is not necessary since
this study will implement the existing software packages from the net. However, the
Sammon Maps program will be developed in order to fulfill the study. The data of 66
protein sequences will be used where the original data in the form of text will be
extracted using the N-gram tool into real value data before being presented to the
algorithms. The description of each cluster of protein will not be made. Only the
clustering performance will be analyzed. The best algorithm that clusters the protein
accurately will be determined.
1.5 Significance of Study
In a system, data involved are often large. Clustering system in an
organization is essential to help human to sort out things and classify them according
to the similarity of the groups. In clustering task, similar data will be group together.
The similarity of the data is referred to the features of the data. When interpreting the
results of the clustering, prediction on the similar type of data can be done. A network
which is already trained by a training data can be used to test other new related data.
4

This study could help to determine the best clustering method to gain accurate
and efficient results. The weaknesses of an algorithm will need further research in
order to improve them as well as modifying and integrating them with other
algorithm to get more reliable clustering algorithms.
1.6 Definition of Key-terms
1.6.1 Self-Organizing Map (SOM)
According to Wikipedia on-line Encyclopedia (2005), the self-organizing map
or SOM (sometimes known as Kohonen map) by Teuvo Kohonen is a method for
unsupervised learning, based on a network of artificial neurons whose weights are
modified to match input vectors in a training set. It is a competitive network with
winner-take-all process.
1.6.2 Adaptive Resonance Theory (ART)
It is a non-supervised two-layer neural net architecture in which information
reverberates back and forth between the layers. ART comes in many versions where
all of them can be categorized into supervised and unsupervised algorithm. It
attempts to tackle the stability and plasticity dilemma where stability refers to the
ability to recognize patterns insensitively to noise and plasticity refers to the ability of
the algorithm to learn new patterns (Keller, 2004).
5

1.6.3 Sammon Maps
It is an iterative method based on gradient search. It maps points in high-
dimensional input space into low-dimensional (usually 2-dimensional) output
projection (Valkonen et al., 2002).
1.6.4 Clustering
Based on the article entitled `Clustering: An introduction', clustering is "the
process of organizing into groups whose members are similar in some way"
(Matteucci, n. d. ). Therefore, a cluster is a collection of objects which are "similar"
between them and "different" from the object belonging to other clusters.
1.7 Conclusion
In conclusion, this chapter has explained on the problem statement of the
research, the objectives, the scope and the significance of study and a brief definition
of the key-terms which are frequently used in the later chapters.
6

CHAPTER 2
LITERATURE REVIEW
2.1 Introduction
In reviewing the literature, the reviewed topics include the algorithms of
SOM, ART and Sammon Maps as well as the applications for each neural network in
the world nowadays. Previous papers presented which are related to comparison of
difference neural network structures will also be reviewed. The literature was
analyzed with the goal of finding possible answers of which neural network
architectures is the best in clustering data.
7

2.2 Self-Organizing Map
Self-Organizing Map (SOM) was introduced by Teuvo Kohonen in 1982. It is
an unsupervised learning neural network. The SOM has been proven useful in many
applications. Tomayo et al. (1998) applies SOM in interpreting patterns of gene. They
described SOM as a type of mathematical cluster analysis which is suitable for
identifying and classifying complex features and multidimensional data. In addition,
according to them, SOM also facilitates easy visualization and interpretation.
The algorithm of SOM is shown below:
1. Initialize input nodes, output nodes and connection weights
Set topological neighbourhood parameters
Set learning rate parameters
2. For each input vector x,
3. Compute distance dj between the input and each output node j N-1
dý (x; (t) - w11(t))2
Where N= number of input vectors or dimension
xi(t) = input vector for i-th input unit at time t
w;, (t) = weight vector for input node i to input node j at
time t
4. Find index j such that dj is a minimum (j is winning node)
5. For all units j within a specified neighbourhood, updated weight
8

wij(t+l) = w11(t) + rl(Xi-wij(t))
Where it = learning rate
6. Update learning rate q
7. Reduce radius of topological neighbourhood at specified times.
8. Test stopping condition
If false, repeat 2-7
Else, Stop.
Figure 2.1: The SOM algorithm (Ramsey, 1997)
The winner is a node with weight vector is closest to the input vector. The
winner's weight then adjusted to make them closer to the input vector. The
neighbours of the winning neuron are also changed. The process therefore repeated
for each input vector for a number of cycles.
Based on the algorithm, SOM seems to have the ability to preserve its
topology mapping from high-dimensional space to output neuron means that the
mapping preserves the relative distance between the points. The output neuron is
usually form a 2-dimensional lattice (M = (m1,... mpxq)) and therefore the mapping is
a mapping from a high dimensional space onto a plane.
Some applications of SOM are in "exploratory data analysis, pattern
recognition, speech analysis, robotics, industrial and medical diagnostics,
instrumentation and control". For example, in a research article from BMC
9

Bioinformatics, the distinction of gene expression patterns as results of a reanalysis of
lymphoma study are easily shown by clustering of the SOM (Wang et al., 2002). The
research tested the two-level analysis on public data from diffuse massive B-cell
lymphomas. The SOM is used for the first level and later followed by the hierarchical
clustering and the K-means clustering. Using supervised clustering analysis, there are
three gene patterns found: a germinal centre-related, a proliferation and an
inflammatory. However, using the two-level analysis, the patterns ware easily
distinguished. All the patterns from the supervised clustering were matched and one
novel pattern: a plasma cell differentiation-related found. The SOM acts as
intermediate step to analyze genome-wide gene expression data so that the gene
expression can more easily be revealed. The SOM also summarises the complicated
data in a way that allows classification evaluation by the clinician.
Guerrero, V. P., Lopez, C., Moya, F., and Herrero, V. (2003) presented a paper
on comparison of five neural models for document clustering. The neural models
were Fuzzy C-means, Fuzzy ART, Fuzzy ART for Fuzzy Cluster, Fuzzy Max-Min
and the Kohonen (SOM) neural network. The testbed used are generated from LISA,
a bibliographic database. Those documents consist of literature references from LIS
articles. The best results of document clustering obtained was from the Kohonen (also
know as SOM) neural network which organizes the cluster topologically with input
data treated as vectors and uses the basis of distance. On the other hand, the Fuzzy
ART and the Fuzzy Max-Min were the worst in the classification task.
10

A study by Granger, E., Savaria, Y., Lavoie, P., and Cantin, M. (n. d. ) on
"comparison of Self-organizing Neural Networks for fast clustering of Radar Pulses"
pointed out that the Self-organizing Feature Mapping (SOFM) obtained the best
clustering score for the Radar data presented. The purpose of radar electronic
measures (ESM) is "to search for, intercept, locate and analyze radar signals in the
context of military surveillance" (Granger et al., n. d. ). The study compares the Fuzzy
ART net, Fuzzy Min-Max Clustering, Integrated Adaptive Fuzzy Clustering and Self-
organizing Feature Mapping (SOFM). The comparisons made were on the clustering
quality, convergences time (measured via computer simulation) and computational
complexity (via estimation of worst-case running time). Although SOFM obtained
the highest score, however it converged very slowly and the complexity are about
18000 elementary operations of each input. The second highest score owned by
Fuzzy ART (FA) which converges 14 times faster than SOFM and only perform 2500
elementary operations per input pattern.
2.3 Adaptive Resonance Theory
ART net has been introduced by Carpenter and Grossberg in 1987 (Carpenter,
G. A. & Grossberg, S., 2002). This network is use for clustering of input vectors.
There are several types of ART network, namely ART!, ART-2, ART-2a, ART-3 and
so on. Usually ART! is a binary version of ART which can only manipulate binary
input vectors and ART-2 is the analogue version which manipulates real valued input
11