vulnerabilities in the residential real estate sectors …...implies that households, construction...
TRANSCRIPT

Vulnerabilities in the residential real estate sectors of the EEA countries September 2019

Vulnerabilities in the residential real estate sectors of the EEA countries / September 2019 Contents 1
Executive summary 3
1 Residential real estate markets: relevance for the real economy and macroprudential policy 5
2 Methodology for the assessment of residential real estate vulnerabilities and macroprudential policies 11
2.1 Risk assessment 11
2.2 Macroprudential policy assessment 13
2.2.1 Assessment of policy appropriateness 13
2.2.2 Assessment of policy sufficiency 15
3 Cross-country risk analysis 17
3.1 An indicator-based approach to real estate cycle indentification 18
Box 1 Housing cycles – evidence from literature 19
3.2 Developments in the collateral stretch 25
3.3 Developments in the funding stretch 32
3.4 Developments in the household stretch 44
3.5 Structural factors relevant for the housing sector and mortgage lending 50
4 Country analysis of risks and policies for a subset of ESRB Member States 57
4.1 Interaction between vulnerabilities 57
4.2 Policy assessment 62
4.2.1 Policy appropriateness 63
4.2.2 Policy sufficiency 67
Austria 73
Belgium 76
Czech Republic 79
Denmark 82
Estonia 85
Contents
Vulnerabilities in the residential real estate sectors of the EEA countries / September 2019 Contents 2
Finland 87
France 90
Germany 94
Iceland 97
Ireland 101
Luxembourg 103
Malta 106
Netherlands 109
Norway 112
Portugal 115
Slovenia 118
Slovakia 121
Sweden 124
United Kingdom 128
Imprint and acknowledgements 131
Vulnerabilities in the residential real estate sectors of the EEA countries / September 2019 Executive summary 3
Housing is a key sector of the real economy and represents a major part of household wealth and bank lending. Financial crises relating to housing occur relatively frequently, possibly combined with other types of crisis events, and can have severe repercussions to the real economy and households’ welfare. National authorities, the European Central Bank (ECB) and the European Systemic Risk Board (ESRB) have a responsibility to help prevent the build-up of financial stability risks in different parts and sectors of the EU financial system. To fulfil this responsibility, the ESRB has analysed vulnerabilities relating to the residential real estate (RRE) sector across EU countries.
The risk and policy assessment of European RRE sectors aims at identifying the main trends in various risk indicators across the European Economic Area countries (the EU28 as well as Iceland, Liechtenstein and Norway) and the respective macroprudential policy action that these countries have taken to mitigate the financial stability risks identified.
According to the cross-country assessment of vulnerabilities, most countries were found to be in a firm or mature expansionary phase of the RRE cycle, while a few countries are still recovering after the global financial crisis. As the outlook for European economies weakens, the risk of an economic downturn grows, potentially impacting the real estate cycle and leading to a crystallisation of the RRE vulnerabilities identified. The cross-country assessment concluded that 19 European countries presented vulnerabilities, which warranted further risk analysis as well as an assessment of macroprudential policies to address these vulnerabilities.
In the country-analysis, most countries were identified as having medium-level RRE risks, while several countries were found to be in the high risk category and one country was deemed low risk. The high overall risk levels resulted from a combination of high stock vulnerabilities and medium/high flow vulnerabilities with a direct or indirect impact on financial system stability (DK, NL, LU, NO, SE). The medium overall risk levels resulted from a combination of medium stock vulnerabilities and medium/high flow vulnerabilities (AT, BE, CZ, DE, EE, FI, FR, IE, IS, MT, PT, SK, UK). The overall low risk resulted from a combination of a low stock vulnerabilities associated with low/medium flow vulnerabilities (SI). The stock vulnerabilities stem from concerning levels of household indebtedness and/or the overvaluation of house prices, while the flow vulnerabilities are attributable to a combination of dynamics of house price, housing lending and/or concerns over the lending standards of new loans.
In the country analysis an assessment of macroprudential policy responses to the identified financial stability risks related to the RRE was also performed. The policy analysis found that most of the countries had implemented both capital- and borrower-based macroprudential instruments to mitigate these risks, in line with their macroprudential policy objectives. In particular, the policy assessment found that in eight countries, the macroprudential policies implemented in relation to the identified risks were appropriate and sufficient (AT, EE, IE, MT, PT, SK, SI, UK). The policy measures in three countries were assessed to be fully appropriate and partially sufficient (DK, SE, NO). Finally, in the remaining eight countries the policy stance relative to the intensity of risks identified was assessed to be partially appropriate and partially sufficient (BE, CZ, DE, FI, FR, IS, NL, LU). In this last category, policy is considered partially appropriate either because of some
Executive summary

Vulnerabilities in the residential real estate sectors of the EEA countries / September 2019 Executive summary 4
lacking in policy action or because of the policy framework which does not provide the appropriate policy instruments.
Housing market dynamics and vulnerabilities are also strongly impacted by the interaction of various social and economic policies that need to be considered as well. The housing sector is highly regulated by policies that target the availability and affordability of dwellings, as well as safety and environmental regulation and urban planning. Importantly, fiscal policy has an impact on house prices and household indebtedness through the tax incentives it may create for holding property or contracting mortgages. Moreover, monetary policy plays a key role by influencing interest rates and margins charged on mortgages, with an impact on bank profitability (and thereby capital levels), household expenses and housing price dynamics. Implicit or explicit state guarantees for the various actors in the RRE market may also further influence RRE prices. Macroprudential policy may thus need to be complemented by actions in other areas to fulfil the mandate of ensuring financial stability.
Vulnerabilities in the residential real estate sectors of the EEA countries / September 2019 Residential real estate markets: relevance for the real economy and macroprudential policy 5
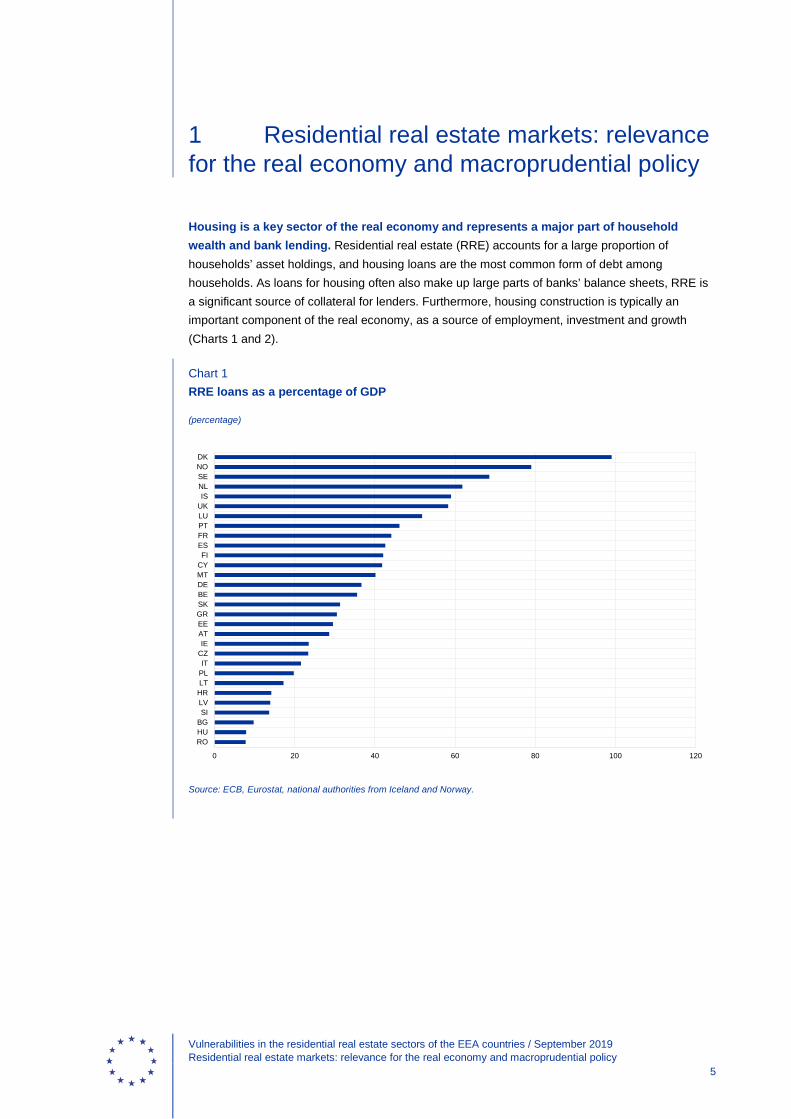
Housing is a key sector of the real economy and represents a major part of household wealth and bank lending. Residential real estate (RRE) accounts for a large proportion of households’ asset holdings, and housing loans are the most common form of debt among households. As loans for housing often also make up large parts of banks’ balance sheets, RRE is a significant source of collateral for lenders. Furthermore, housing construction is typically an important component of the real economy, as a source of employment, investment and growth (Charts 1 and 2).
Chart 1 RRE loans as a percentage of GDP
(percentage)
Source: ECB, Eurostat, national authorities from Iceland and Norway.
0 20 40 60 80 100 120
ROHUBGSILVHRLTPLIT
CZIE
ATEEGRSKBEDEMTCYFI
ESFRPTLUUKIS
NLSENODK
1 Residential real estate markets: relevance for the real economy and macroprudential policy

Vulnerabilities in the residential real estate sectors of the EEA countries / September 2019 Residential real estate markets: relevance for the real economy and macroprudential policy 6
Chart 2 RRE loans as a percentage of total bank loans
(percentage)
Source: ECB, national authorities from Iceland and Norway.
Similarly to business activity, real estate markets are prone to “boom-bust” cycles, but the housing cycle is not necessarily synchronised with the business cycle. The RRE markets are subject to boom-bust cycles. These are usually characterised by reinforcing and procyclical patterns in price developments and risk-taking behaviours among lenders and borrowers.1 The housing cycle tends to resemble the business cycle, but it typically has a different amplitude or is slightly longer, meaning the two may not be synchronised. Moreover, there is some evidence that although the housing cycle can be considered independent, it can be correlated to a certain extent with a medium-term business cycle2.
Excessive risk-taking, leverage and misaligned incentives in the upturn of the real estate cycle may lead to externalities in the downturn, with implications for both financial stability and the real economy. The relevance of the housing market with respect to the real economy implies that households, construction companies and lenders, as agents of this market, may not internalise the full economic effects of their behaviour. In the event of a downturn in the real estate sector, the potential economic losses may therefore be borne by a larger share of society. When house prices are on the rise, asymmetric information can cause banks to differentiate poorly between good and bad borrowers, while bank competition and property overvaluation relative to
1 Buiter, W. H. (2008). “Housing wealth isn't wealth” (No. w14204). National Bureau of Economic Research. Jordà, Ò.,
Schularick, M., and Taylor, A. M. (2015). “Leveraged bubbles”. Journal of Monetary Economics, 76, S1-S20. 2 Rünstler, G. and Vlekke, M. (2016), “Business, housing and credit cycles”, Working Paper Series, No 1915, ECB, June.
0 10 20 30 40 50 60
BGIT
HRHUSI
CYROATIS
GRLUPLLVFRLTEEBEDEESFI
CZNOPTGBMTSENLSKIE
DK
Vulnerabilities in the residential real estate sectors of the EEA countries / September 2019 Residential real estate markets: relevance for the real economy and macroprudential policy 7
fundamentals can exacerbate this tendency. One particular strand of literature, for example, points to the fact that prior to a crisis, lending standards tend to deteriorate as loan volumes increase3.
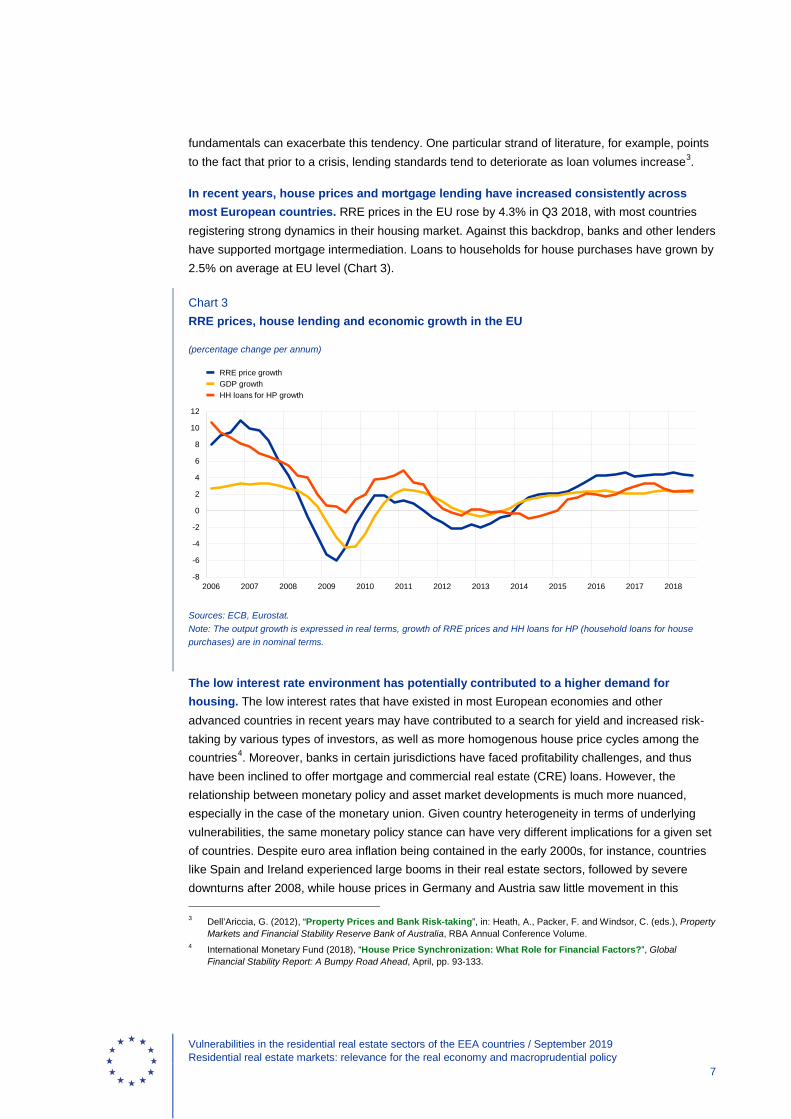
In recent years, house prices and mortgage lending have increased consistently across most European countries. RRE prices in the EU rose by 4.3% in Q3 2018, with most countries registering strong dynamics in their housing market. Against this backdrop, banks and other lenders have supported mortgage intermediation. Loans to households for house purchases have grown by 2.5% on average at EU level (Chart 3).
Chart 3 RRE prices, house lending and economic growth in the EU
(percentage change per annum)
Sources: ECB, Eurostat. Note: The output growth is expressed in real terms, growth of RRE prices and HH loans for HP (household loans for house purchases) are in nominal terms.
The low interest rate environment has potentially contributed to a higher demand for housing. The low interest rates that have existed in most European economies and other advanced countries in recent years may have contributed to a search for yield and increased risk-taking by various types of investors, as well as more homogenous house price cycles among the countries4. Moreover, banks in certain jurisdictions have faced profitability challenges, and thus have been inclined to offer mortgage and commercial real estate (CRE) loans. However, the relationship between monetary policy and asset market developments is much more nuanced, especially in the case of the monetary union. Given country heterogeneity in terms of underlying vulnerabilities, the same monetary policy stance can have very different implications for a given set of countries. Despite euro area inflation being contained in the early 2000s, for instance, countries like Spain and Ireland experienced large booms in their real estate sectors, followed by severe downturns after 2008, while house prices in Germany and Austria saw little movement in this 3 Dell’Ariccia, G. (2012), “Property Prices and Bank Risk-taking”, in: Heath, A., Packer, F. and Windsor, C. (eds.), Property
Markets and Financial Stability Reserve Bank of Australia, RBA Annual Conference Volume. 4 International Monetary Fund (2018), “House Price Synchronization: What Role for Financial Factors?”, Global
Financial Stability Report: A Bumpy Road Ahead, April, pp. 93-133.
-8
-6
-4
-2
0
2
4
6
8
10
12
2006 2007 2008 2009 2010 2011 2012 2013 2014 2015 2016 2017 2018
RRE price growthGDP growthHH loans for HP growth

Vulnerabilities in the residential real estate sectors of the EEA countries / September 2019 Residential real estate markets: relevance for the real economy and macroprudential policy 8
period. This underscores the relevance of macroprudential policy in complementing monetary policy5.
Although output gaps in European countries have been generally positive, economic growth seems to be losing momentum, which could dampen housing demand and prices. The increase in housing prices has also been backed by the upturn of the business cycle. Output gaps have turned positive in most EU countries (Chart 4), unemployment rates in several countries are low and disposable income has grown by 4.6% on average in annual terms in Europe (in 2017). Nevertheless, recent forecasts point to a deceleration in economic growth rates (Chart 5), which could indicate that a number of countries have reached the peak of their business cycles. This entails a careful assessment of policies, since a potential economic downturn could lead to a deterioration of the housing market and the financial situation of households. Lenders should ensure they are resilient enough to withstand a materialisation of vulnerabilities stemming from RRE exposures.
Chart 4 Output gaps in European countries
(gap between actual and potential gross domestic product at 2010 reference levels)
Sources: European Commission, AMECO database, national authorities of Iceland.
5 Zhu, B., Betzinger, M., & Sebastian, S. (2017), “Housing market stability, mortgage market structure, and monetary policy:
Evidence from the euro area”, Journal of Housing Economics, Vol. 37, pp. 1-21.
-10
-8
-6
-4
-2
0
2
4
6
EE LT IS LV HU MT RO SI CZ UK PL DE PT HR CY SE SK BG AT EU NL BE IE EA DK FR ES LU FI IT GR
201720182019

Vulnerabilities in the residential real estate sectors of the EEA countries / September 2019 Residential real estate markets: relevance for the real economy and macroprudential policy 9
Chart 5 Revisions of economic growth forecasts across the EU
(percentages)
Source: Eurostat. Notes: The chart shows GDP growth forecasts for 2019 for EU countries, as published by the European Commission in the two recent forecast rounds. Red (green) bars denote a downward (upward) revision since summer 2018.
The impact of a downturn in real estate markets on financial stability and the real economy can be both direct and indirect. First, slumps in real estate markets are characterised by a lowering of collateral values due to house price drops, which in turn increase the losses that lenders face in the event of default. Second, household wealth and the prospects of the construction sector are negatively affected, which may depress consumption and discourage investment. Overall economic activity would then decrease, leading to a weakened economic outlook, higher default rates and potential fiscal imbalances. Lenders’ willingness to provide credit diminishes, while borrowers’ risk of default increases and they incur losses. This can result in a classical financial accelerator mechanism, with second-round effects such as private agents needing to adjust their balance sheets and less access to financing from a banking sector in need of recovery.
Financial crises related to housing are relatively frequent and often severe, with real estate being either a trigger or an amplifier. Housing busts are common causes of banking crises and typically have severe consequences.6 Recessions following RRE busts are common, and tend to be particularly deep and prolonged. Claessens et al. (2008) indicate that output losses during recessions associated with housing busts are three times higher than those during recessions without this type of contraction7. The severe repercussions can range from reduced asset quality and credit contraction to decreases in consumption and bank failures, which may even lead to government bail-outs of financial institutions. Moreover, the systemic nature of a real estate crisis can further exacerbate its negative consequences8. It can also be difficult to disentangle the 6 For an illustration of how RRE-related crises have impacted real GDP growth, see ESRB and Hartmann, P. (2015), “Real
estate markets and macroprudential policy in Europe”, Working Paper Series, No 1796, ECB, May. 7 Claessens, S., Kose, A. and Terrones, M. (2008), “What happens during recessions, crunches and busts?” IMF Working
Paper Series, No 08/274, International Monetary Fund. 8 Lo Duca et al. (2017), “A new database for financial crises in European countries”, ESRB Occasional Paper Series,
No13, July.

Vulnerabilities in the residential real estate sectors of the EEA countries / September 2019 Residential real estate markets: relevance for the real economy and macroprudential policy 10
triggers of a downturn from its amplifiers, as crises are often complex events that materialise due to a combination of various types of risk. The financial crisis of 2007-2008 is a vivid example of a crisis that was triggered by imbalances in the US housing markets, but which spread due to complex interlinkages and interactions in the financial system and had a severe impact on the global economy and financial stability. In Europe, the subsequent real estate market downturns were rather consequences of the contagion effect from the US crisis and amplified the macroeconomic shocks.
National authorities, the ECB9 and the ESRB have a responsibility to help prevent the build-up of financial stability risks in different parts and sectors of the EU financial system and economy. Given the importance of RRE for financial and macroeconomic stability, taking a forward-looking approach and seeking to prevent the build-up of vulnerabilities is especially important. At the EU level, the ESRB has a mandate to “[…] contribute to ensuring financial stability and mitigating the negative impacts on the Internal Market and the real economy”.10 Similar mandates are given to national macroprudential authorities across countries in the EU.
To fulfil this responsibility, the ESRB has analysed vulnerabilities across EEA countries relating to the RRE sector.11 The present report is a continuation of the previous work the ESRB has done on the RRE sector12. In view of its mandate and given the importance of the multiple interactions between economic and social policies affecting housing market dynamics, the ESRB has analysed vulnerabilities related to the RRE sector in a large set of European countries (the EU28, Iceland, Norway and Liechtenstein). Furthermore, the current analysis took stock of the relevant macroprudential policies implemented by the national competent authorities and assessed the potential need for future policy action to mitigate identified systemic risks.
However, housing market dynamics and vulnerabilities are also strongly impacted by the interaction of various social and economic policies that need to be considered as well. The housing sector is highly regulated by policies that target the availability and affordability of dwellings, as well as safety and environmental regulation and urban planning. Importantly, fiscal policy impacts house prices and household indebtedness through the tax incentives it may create for holding property or contracting mortgages. Moreover, monetary policy plays a key role by influencing interest rates and margins charged on mortgages, with an impact on bank profitability (and thereby capital levels), household expenses and housing price dynamics. Implicit or explicit state guarantees for the various actors in the RRE market may also further influence RRE prices.13 Macroprudential policy may thus need to be complemented by actions in other areas to fulfil the mandate of ensuring financial stability.
9 Council Regulation (EU) No 1024/2013 of 15 October 2013 conferring specific tasks on the European Central Bank
concerning policies relating to the prudential supervision of credit institutions (OJ L 287, 29.10.2013, p. 63). 10 Recital 10 of Regulation (EU) No 1092/2010 of the European Parliament and of the Council of 24 November 2010 on
European Union macro-prudential oversight of the financial system and establishing a European Systemic Risk Board (OJ L 331, 15.12.2010, p. 1).
11 An ESRB project team was created to undertake this analysis. Participants in the project team are ackowledged in the Imprint and acknowledgements section of this report.
12 ESRB (2016), Vulnerabilities in the EU residential real estate sector. 13 This could include, for example, facilitation of mortgage lending for social reasons, such as young or first-time buyers of
houses.

Vulnerabilities in the residential real estate sectors of the EEA countries / September 2019 Methodology for the assessment of residential real estate vulnerabilities and macroprudential policies 11
The analysis draws on the ESRB methodology for the assessment of real estate (RE) vulnerabilities, which was operationalised for the purpose of this assessment. In March 2016, the ESRB Working Group on Real Estate Methodologies (WG-REM) was established with a medium-term mandate to gradually develop a quantitative framework for the operative assessment of both RE vulnerabilities and the effectiveness of the related macroprudential policies across European countries. The current analysis is based on the methodology described in the ESRB report “Methodologies for the assessment of real estate vulnerabilities and macroprudential policies”. This methodology consists of a risk assessment (three steps: analysis of cyclical position of RRE markets, evaluation of scoreboard and horizontal ratings, and integration of additional information and adjusted risk ratings by stretches), an assessment of policy appropriateness (three steps: identification of macroprudential instruments to address real estate-related risks, assessment of selected macroprudential instruments given the identified risks and consideration of additional country-specific factors), and an assessment of policy sufficiency.
2.1 Risk assessment
The RRE risk assessment methodology consists of three steps and is centred around three risk dimensions called “stretches”. The risk assessment proposed by the WG-REM includes a mechanical evaluation of key risk indicators (referred to as the “scoreboard”) and an expert-based evaluation of the final risk levels. The risk assessment is preceded by a careful identification of the cyclical position of the RRE markets. The risk assessment is organised across the following risk dimensions: the collateral stretch, which focuses on house price developments and potential price misalignments, the funding stretch, which covers developments in lending, and the household stretch, which focuses on fragilities in households’ balance sheets.
Step 0 – Analysis of the cyclical position of residential real estate markets
The assessment of the cyclical position of RRE markets is an important element in both the risk and policy assessment. The information content of statistical indicators and the timing of materialisation of vulnerabilities may differ depending on the cyclical position of the RRE markets and their connection with the financial and business cycles. In order to identify the cyclical position of the RRE markets, the WG-REM methodology suggests considering a variety of indicators that are relevant for the forward-looking analysis of the RRE cycle (in particular house price growth, mortgage lending and estimates of house price overvaluation) and complementing them with model evidence where available.
2 Methodology for the assessment of residential real estate vulnerabilities and macroprudential policies

Vulnerabilities in the residential real estate sectors of the EEA countries / September 2019 Methodology for the assessment of residential real estate vulnerabilities and macroprudential policies 12
Step 1 – Evaluation of scoreboard and horizontal ratings
The first step in the RRE risk assessment consists of a statistical evaluation of key risk indicators for the individual stretches using the scoreboard. The risk indicators include house price indicators, indicators on lending conditions and household balance sheet indicators. The scoreboard takes the form of a heat map, where each indicator is assessed against critical thresholds. These thresholds are guided by model evidence and the distribution of the indicators, and their plausibility is checked on the basis of expert judgement. Based on the thresholds, each indicator is assigned a rating from 0 to 3. The average rating of indicators in each stretch as well as the average rating across all indicators (composite indicators) is then assigned one of the following risk levels: “limited”, “low”, “medium”, or “high”. The economic interpretation to be assigned to each rating is described in Table 1.
Step 2 – Integration of additional information and adjusted risk ratings by stretches
The second step provides an adjustment of the mechanical risk rating for other relevant information on the basis of expert judgement. The additional information includes a set of country-specific indicators that convey information on a range of cyclical, structural and institutional drivers of the domestic RRE market. The complementary set of indicators includes e.g. alternative valuation measures of price dynamics (for the collateral stretch), and information on lending standards and drivers of lending dynamics (for the funding stretch). For the household stretch, information is collected on the share of floating rate loans in new loans and in the outstanding stock of loans, as well as the resilience of households. In order to frame the risk and policy discussions, the systemic importance of RRE in a country is also assessed.
The final outcome of Steps 1 and 2 is a combined reading of the three stretches, which may highlight the potential need for macroprudential action depending on the interactions between the stretches. Specifically, four rating categories are envisaged: “limited”, “low”, “medium” and “high” risk. Both the “medium” and “high” categories highlight the existence of vulnerabilities that may need to be addressed by macroprudential policies.

Vulnerabilities in the residential real estate sectors of the EEA countries / September 2019 Methodology for the assessment of residential real estate vulnerabilities and macroprudential policies 13
Table 1 Economic interpretation of ratings by stretch
Stretch Economic interpretation of risk rating
Collateral Limited risk: undervalued markets and/or negative or stagnating price dynamics
Low risk: fairly valued prices and moderate price dynamics growth
Medium risk: tentative signs of price overvaluation; house price growth stronger than relevant macro variables
High risk: clear price overvaluation and/or exuberant price dynamics
Funding Limited risk: tight financing conditions with large spreads and/or negative/stagnating lending dynamics
Low risk: appropriate financing conditions against backdrop of moderate lending and spreads
Medium risk: robust lending dynamics and/or relatively compressed spreads
High risk: exuberant lending dynamics and clearly compressed spreads
Household Limited risk: household balance sheets are sound
Low risk: household balance sheets are sound according to some metrics
Medium risk: household balance sheets cause concern
High risk: household balance sheets show clear weaknesses
2.2 Macroprudential policy assessment
The assessment of macroprudential policies is conditional on the level of the identified systemic risk and comprises the appropriateness and sufficiency of existing or upcoming measures. The policy assessment links the outcome of the risk assessment to the implementation of policy instruments. As such, it benefits from identification of the nature of the risks and the cyclical position of the RRE markets, as well as from the discussion on the structural and institutional features. The policy assessment consists of the following two pillars: the appropriateness of the activated measures, in terms of the selection of instruments and their timing, and the sufficiency of the activated measures, in terms of calibration and effectiveness with respect to the policy objectives.
2.2.1 Assessment of policy appropriateness
The assessment of policy appropriateness is performed in three steps. First, we identify the instruments that would address the risks given the objectives set by the national authorities and the identified risks. Second, the choice of instruments is evaluated against the position in the real estate cycle and the potential transmission channels of the envisaged macroprudential measures. Third, country-specific elements, such as the institutional framework and other policy areas, are taken into account to reach the final assessment of appropriateness.
Steps 3-5 of the policy appropriateness assessment follow Steps 0-2 of the risk assessment.

Vulnerabilities in the residential real estate sectors of the EEA countries / September 2019 Methodology for the assessment of residential real estate vulnerabilities and macroprudential policies 14
Step 3 – Identification of macroprudential instruments to address real estate-related risks
National authorities in the European countries have at their disposal capital-based macroprudential instruments, and depending on the country, potentially various types of borrower-based macroprudential instruments. The capital-based measures refer to regulatory capital requirements for the exposures of banks to real estate. They include risk weight (RW) floors, loss-given-default (LGD) floors or targeted capital buffers. The legal framework for the implementation of these instruments is harmonised in the EU, and is provided by the EU Capital Requirements Directive (CRD IV) and the Capital Requirements Regulation (CRR). The borrower-based instruments directly affect the availability, terms and conditions of lending. Depending on respective national laws, the different borrower-based instruments which may be available in individual countries include limits on loan-to-value (LTV), debt-service-to-income (DSTI), and debt/loan-to-income (D/LTI) ratios, amortisation requirements and maturity limits. Activation of these measures is at national discretion and subject to national legal or macroprudential frameworks.
Other macroprudential instruments designed to counter broader-based systemic risk can also mitigate spillover risks from real estate to the wider economy. This is the case for large exposure limits, liquidity measures or additional general capital requirements such as the countercyclical capital buffer or the systemic risk buffer. Some national authorities also use regular stress-testing of the banking sectors to test capital adequacy from a macroprudential perspective and calibrate buffers.
Step 4 – Assessment of selected macroprudential instruments given the identified risks
The choice of policy instruments should be governed by the timing of application and the strength of the transmission channels of different macroprudential instruments with regards to the identified risks. The choice of the policy instruments should reflect the specific identified risks, the position in the real estate cycle and the potential size of spillover effects of the RRE markets to the financial system and the real economy. Lags in implementation of the instruments should also be considered. Combination of instruments may help to better target the existing vulnerabilities, address shortcomings related to individual instruments and prevent their potential circumvention. Macroprudential instruments can be used in a time-varying way in response to cyclical developments, or some may be used as a permanent feature of the prudential regulatory framework.
Step 5 – Consideration of additional country-specific factors
The assessment of policy appropriateness should also take into account the country-specific institutional and legal frameworks as well as policies that are beyond the control of the national authorities. The possibility to implement the appropriate instruments may be constrained by the prevalent national institutional framework and legislation, as it is particularly the case for borrower-based instruments. For this reason, the legal and institutional limitations might induce policymakers to opt for a “second best” policy or alternative forms of policy intervention. Additionally, monetary and fiscal policies, urban planning influencing the supply of housing, or the

Vulnerabilities in the residential real estate sectors of the EEA countries / September 2019 Methodology for the assessment of residential real estate vulnerabilities and macroprudential policies 15
depth of the rental market, can each influence the choice (and the effectiveness) of macroprudential tools. Finally, also the structure of the banking sector and cross-border banking activities need to be accounted for when choosing a policy mix.
The final outcome of Steps 3–5 is one of the following ratings of the policy appropriateness: fully appropriate, partially appropriate or not appropriate (Table 2).
Table 2 WG-REM criteria for determining policy appropriateness
Assessment of policy appropriateness Rules for the assessment
Fully appropriate The following four conditions are jointly met:
a) the policy objectives are consistent with the identified vulnerabilities according to the proposed framework;
b) the policy mix meets the policy objectives according to the proposed framework;
c) leakages and circumvention are duly considered and, to the extent possible, addressed;
d) interactions with other policy areas are taken into account.
Partially appropriate Conditions a) and b) are met; either c) or d) or both are not: or a) is met, but b) is not because country-specific conditioning factors constrain the feasibility of policy instruments.
Not appropriate The conditions for partial appropriateness are not met, or no policy is in place to address the identified vulnerabilities.
2.2.2 Assessment of policy sufficiency
Policy sufficiency is linked to the existing level of systemic risk generated by RRE vulnerabilities, the objectives of macroprudential policies and the expected effects on key target variables over time. The assessment of policy sufficient is dependent on the outcome of the evaluation of policy appropriateness for the purpose of this analysis. For instance if a policy mix has not been assessed to be fully appropriate it automatically cannot be assessed as fully sufficient.
In order for a policy mix to be viewed as fully sufficient, conditional on policy objectives and related target variables, an appropriate policy has been calibrated that mitigates systemic risks stemming from the RRE sector to a large extent and for which the expected benefits largely exceed the expected costs over time (Table 3).
In view of the multi-fold connections of the RRE with the economy and the welfare conditions in a country, it is important to note that although the scope of macroprudential policy is systemic risk, it has its limits in containing risks that come from areas beyond the financial sector. For example misalignments in households’ incentives or limited housing supply could be sources of systemic risk. In such cases, other policies may be needed to complement the macroprudential measures in order to ensure an efficient mitigation of systemic risk.

Vulnerabilities in the residential real estate sectors of the EEA countries / September 2019 Methodology for the assessment of residential real estate vulnerabilities and macroprudential policies 16
Step 6 – Tracking of the benefits and costs of macroprudential policy
The assessment of policy sufficiency should include a comprehensive cost-benefit framework. The assessment of policy sufficiency should consider both qualitative and quantitative criteria in a comprehensive cost-benefit framework that can be equally applied to both capital- and borrower-based instruments. Benefits can be measured in terms of cycle smoothing or crisis probability reduction. While the capacity of policy measures to tame the RRE cycle is more intuitive and possibly easier to quantify, the reduction in the probability of a financial crisis in surrounded by more uncertainty. A critical aspect of policy sufficiency is that costs are typically easier to quantify than benefits.
Step 7 – Additional country-specific information
However, a number of additional considerations need to be taken into account to deem a policy targeting RRE-related risks as sufficient. There is a minimum data requirement for indicators and models for calibration. Sometimes, the impact of measures can be relaxed through exemptions. Interactions with other policy areas are also highly relevant for the evaluation of the transmission channel. Last but not least, the assessment of policy implementation should consider the position in the real estate cycle.
In practice, it is challenging for national authorities to quantify policy sufficiency. Most European countries have had relatively little experience with macroprudential instruments implemented in line with clearly defined macroprudential objectives. Moreover, the availability of tools designed specifically to measure policy sufficiency is scarce, with many authorities resorting extensively to expert judgement and various combinations of quantitative and qualitative indicators. A sound calibration of policy tools is also dependent on the availability of relevant data.
Table 3 WG-REM criteria for determining policy sufficiency
Assessment of policy sufficiency Rules for the assessment
Fully sufficient Conditional on policy objectives and related target variables, an appropriate policy has been calibrated that mitigates systemic risks stemming from the RRE sector to a large extent and for which the expected benefits largely exceed the expected costs over time, as informed by methods ideally meeting most of the listed principles and other considerations.
Partially sufficient Conditional on policy objectives and related target variables, an appropriate policy has been calibrated that mitigates systemic risks stemming from the RRE sector to some extent and for which the expected benefits somewhat exceed the expected costs over time, as informed by methods ideally meeting most of the listed principles and other considerations.
Not sufficient The conditions for full or partial sufficiency are not met.

Vulnerabilities in the residential real estate sectors of the EEA countries / September 2019 Cross-country risk analysis 17
According to the cross-country risk analysis, most countries are in a firm or mature14 expansionary phase of the RRE cycle, while a few countries are still recovering after the global financial crisis. Risk indicators show that most economies are in a firm expansionary phase of the housing cycle, while a few countries are either in a mature phase of expansion or still recovering after the financial crisis. In general, economies that are in an expansionary phase of the housing cycle exhibit house price increases, sometimes coupled with signs of overvaluation and positive developments in mortgage lending, construction sector activity or the macroeconomic environment in general.
The cross-country analysis starts with the identification of the cyclical position of RRE markets and the evaluation of the scoreboard of indicators. The analysis of the cyclical position of countries reveals that in many of the expanding economies, vulnerabilities associated with house prices and household indebtedness have been accumulating for some time. The scoreboard assigns mechanical risk ratings based on a minimum dataset that is comparable across countries, and that is easy to quantify and benchmark.
The mechanical risk assessment is supplemented with additional country-specific information. The mechanical ratings are adjusted using mainly alternative indicators or additional information on house price overvaluation, on lending standards collected from national authorities and on the composition of household debt, all of which are taken into account using expert judgement. Other relevant quantitative and qualitative country-specific factors are also considered. In the case of the collateral stretch, in addition to overvaluation information, short-term house price growth, income development, demographics and regulations affecting new construction or the rental market are also analysed in terms of the impact they could have on the sustainability of current house price dynamics. For the funding stretch, in addition to detailed information on lending standards, short-term credit dynamics and bank credit risk indicators are incorporated, of which risk weights of internal ratings-based (IRB) banks are particularly relevant. In the case of the household stretch, the level and dynamics of household debt are the most relevant risk factors. In the analysis, the information value of some indicators was emphasised (e.g. lending standards), while that of others was downplayed (e.g. assets to debt or debt service to income, due to data limitations).
The cross-country risk analysis concludes that 19 European countries have RRE-related vulnerabilities, which are assessed as either medium or high. These vulnerabilities warrant further analysis in terms of their interaction in generating potential risks to financial stability as well as the macroprudential policies to address them.
14 The firm and mature phases of expansion were defined according to the WG-REM methodology.
3 Cross-country risk analysis

Vulnerabilities in the residential real estate sectors of the EEA countries / September 2019 Cross-country risk analysis 18
3.1 An indicator-based approach to real estate cycle indentification
The housing cycle has been backed by the upturn of the business cycle and the recovery of banks’ balance sheets, and is sensitive to potential reversals of economic activity. In 2017, the disposable income of European Economic Area (EEA) households rose year-on-year by 4% on average, while unemployment rates declined across European countries. Consumer confidence has also grown significantly in the past two years, in spite of a recent dip, and the European Commission reports that the intention to purchase a home over a 12-month forward-looking horizon has been trending upwards (Chart 7). Furthermore, the cost of financing as reflected in market interest rates is still hovering close to historical lows, given the low interest rate environment. All these conditions have created incentives for households to take out new loans, including for house purchases. At the same time, non-performing loan (NPL) ratios have dropped considerably in the EU banking sector, which has encouraged construction investment and CRE lending. As the business cycle approaches maturity, the risk of a downturn increases and the real estate cycle is more susceptible, potentially leading to a crystallisation of the identified vulnerabilities.
An indicator-based approach was used to identify the countries’ respective real estate cycle phase. Countries in firm or mature expansion typically exhibit robust price growth (CZ, HR, HU, IE, IS, NL, PT, SI), intensified investment in dwellings (MT, EE, IS, Chart 6), growth in real estate transaction activity (EE, PT, LU, HR) or a higher issuance of building permits (IE, BG, PT, MT, Chart 6). However, notable increases in building permits could also alleviate some of the price pressures in the market where they grow from historically low levels (IE). The positive construction developments should in the near term contribute to attenuate price pressures as supply slowly responds to rising demand. However, in certain situations, such as the one experienced by some countries during the last financial crisis, house prices could be also fuelled by new construction following a speculative or buy to let demand for housing. In some countries, robust housing lending growth might amplify the cycle as well (CZ, MT, LU, HU, SK, EE) or there are only moderate signs of credit growth which need to be carefully monitored amid price increases (AT, DE). Countries in a mature phase of expansion typically register flattening or decreasing price levels (FI) and signs of overvaluation (BE, DK, SE, NO, UK). In these cases, credit dynamics are usually still trending upwards at high (SE) or moderate levels (FI, NO, UK), and household debt levels are often high by international comparison. Some countries are also still in a recovery phase, and have substantial legacy issues related to high NPL ratios (GR, CY) and high (if decreasing) levels of household indebtedness. Countries in the recovery phase are typically still deleveraging and exhibit negligible real estate activity as well as continuing negative dynamics in house prices (IT), household lending (ES) or both (CY, GR) (Figure 1).
Vulnerabilities in the residential real estate sectors of the EEA countries / September 2019 Cross-country risk analysis 19
Box 1 Housing cycles – evidence from literature
The real estate cycle is typically analysed as a component of the financial cycle, alongside credit and asset prices. Even though the real estate and financial cycles tend to co-move (Borio and McGuire, 2004)15, there is evidence that the characteristics of the real estate cycle can differ quite significantly from those of the financial cycle, as documented more extensively in literature. This has implications for the reinforcement dynamics between house prices and lending, as one may lead or lag the other by some time.
The real estate cycle is typically based on the assessment of house prices. The ESRB has indicated that price-based indicators (i.e. housing prices) tend to signal emerging vulnerabilities well in advance and turn somewhat before quantity-based measures such as the credit-to-GDP gap16. In addition, these seem to be good indicators of forthcoming financial crises (Barrell et al., 2010, Borio and Drehmann, 2009).17
The literature on housing cycles focuses mainly on three key aspects: the length of the boom and bust phases, their respective amplitudes and the comparison or interaction of the RRE cycle with the other financial and business cycle components. Moreover, “there is some empirical evidence that the correlation between house price and mortgage loan growth rates and correlation between price growth and construction investment growth seem to depend on the phase of the housing cycle. In particular, the correlation between house price growth and mortgage lending growth rates is higher in recovery, while house price growth and construction investment growth seem to be more tightly linked in downturn and recession phases” (ESRB, 201918, Table A and Table B).
How long is the housing cycle?
Several studies have tried to quantify how long housing cycle phases typically last (Table A). These studies find that contractions and expansions both tend to be long, and that contractions are typically more protracted (Bracke, 2013), which is consistent with boom-bust theories of house price fluctuations. According to these studies, housing markets are characterised by imperfections and behavioural anomalies that cause house prices to periodically overshoot. Contractions often act as adjustment periods after long expansions, so the longer an expansion, the less likely that the subsequent contraction will be short. Ceron and Suarez (2006)19 estimate that housing cycles feature persistent high and low volatility phases that last around six years on average and occur with around the same unconditional frequency over time. More recent papers (Bracke, 2013 and
15 Borio, C., and McGuire, P. (2004), “Twin peaks in equity and housing prices?”, BIS Quarterly Review, Bank for International
Settlements, March. 16 ESRB (2014), The ESRB handbook on operationalising macroprudential policy in the banking sector, p. 67. 17 Barrell, R., Davis, P., Karim, D. and Liadze, I. (2010), “The impact of global imbalances: Does the current account balance
help to predict banking crises in OECD countries?”, NIESR Discussion Papers, No 351, National Institute of Economic and Social Research, March. Borio, C. and Drehmann, M. (2009), “Assessing the risk of banking crises – revisited”, BIS Quarterly Review, Bank for International Settlements, March.
18 ESRB Working Group on Real Estate Methodologies (2019, forthcoming), Methodologies for the assessment of real estate vulnerabilities and macroprudential policies – residential real estate.
19 Ceron, J. A., & Suarez, J. (2006), “Hot and Cold Housing Markets: International Evidence”, CEPR Discussion Papers, Centre for Economic Policy Research, September.

Vulnerabilities in the residential real estate sectors of the EEA countries / September 2019 Cross-country risk analysis 20
Drehmann et al., 2012)20 employ the turning point analysis to identify the timing of the peaks and troughs of housing price cycles. They find that, on average, the boom phase lasts five to six years, while the contraction phase is slightly shorter at around four years. Drehmann et al. (2012) also compute the lengths of the housing cycle phases for a subsample representing the period after financial liberalisation. They conclude that the boom phases have become longer, lasting around nine years. Galati et al. (2016)21 estimate the length of the entire housing cycle to be between 10 and 15 years, using an unobserved component model, for the United States and the five largest euro area countries over the period 1970-2014.
Table A Estimated length of housing cycle phases22
Table B Average developments in the various phases of RRE cycles23
20 Bracke, P. (2013), “How long do housing cycles last? A duration analysis for 19 OECD countries”, Journal of Housing
Economics, Vol. 22, Issue 3, pp. 213-230. Drehmann, M., Borio, C., and Tsatsaronis, K. (2012), “Characterising the financial cycle: don’t lose sight of the medium term!”, BIS Working Papers, No 380, Bank for International Settlements, June.
21 Galati, G., Hindrayanto, I., Koopman, S. J. and Vlekke, M. (2016), “Measuring financial cycles in a model-based analysis: Empirical evidence for the United States and the euro area”, Economics Letters, Vol. 145, Issue C, pp. 83-87.
22 Bracke, P. (2013), “How long do housing cycles last? A duration analysis for 19 OECD countries”, Journal of Housing Economics, Vol. 22, Issue 3, pp. 213-230. Drehmann, M., Borio, C., and Tsatsaronis, K. (2012), “Characterising the financial cycle: don’t lose sight of the medium term!”, BIS Working Papers, No 380, Bank for International Settlements, June.
Cunningham, R. and Kolet, I. (2011), “Housing market cycles and duration dependence in the United States and Canada”, Applied Economics, 43(5), 569-586. Galati, G., Hindrayanto, I., Koopman, S. J. and Vlekke, M. (2016), “Measuring financial cycles in a model-based analysis: Empirical evidence for the United States and the euro area”, Economics Letters, Vol. 145, Issue C, pp. 83-87.
23 ESRB Working Group on Real Estate Methodologies (2019), Methodologies for the Assessment of Real Estate Vulnerabilities and Macroprudential Policies – Residential Real Estate, forthcoming.
Paper No. of countries Period of analysisAverage expansion phase
(no.quarters)Average contraction phase
(no.quarters)Bracke (2013) 19 OECD countries 1970q1-2010q1 24 18Drehmann et al. (2012) 7 developed countries 1960q1-2011q4 19 15
1985q1-2011q4 37 20Cunningham and Kolet (2011) USA and Canada - 137 cities 1975-2005 20 16
Average housing cycle (no. years)Galati et al. (2016) USA and 5 euro area countries 1970–2014 10 to 15
Average annual real growth of RRE prices (%)
Average annual real growth of mortgage loans (%)
Average annual change of HH debt-to-GDP ratio (p.p.)
Average annual growth of construction investment (%)
Average duration (quarters)
Number of episodes
Expansion 7.6 11.4 -0.3 4.3 8.2 72 Downturn -5.1 4.1 5.4 -6.1 8.3 50 Recession -6.1 3.1 5.1 -2.7 8.1 63 Recovery 6.5 8.4 -1.3 3.9 12.0 66

Vulnerabilities in the residential real estate sectors of the EEA countries / September 2019 Cross-country risk analysis 21
Table C Correlations between variables across different phases of RRE cycles 24
The intensity of housing cycle fluctuations
“Hot” housing phases produce fast appreciation of property prices, high transaction volumes and overbuilding, whereas “cold” phases are characterised by low transaction volumes and slow nominal price adjustment (Leamer, 2007)25. It seems fairly safe to conclude that an “overheated” economy – perhaps because of an unusually long house price upturn – is more likely to initiate a housing price downturn.
Both Drehmann et al. (2012) and Galati et al. (2016) focused on this feature in their studies. As a matter of fact, their main results highlight an increase since the mid-1980s in the amplitude, persistence and virulence of these cycles (subject to variations over time and across countries), particularly between the euro area and the United States. In Drehmann et al. (2012), the expansion amplitude of the housing cycle is 48% (through to peak), which is less than half of that of credit and equity prices; on the other hand, the amplitude during the contraction phase is around 16%, higher than that of credit but still much lower than the amplitude of equity prices.
The early warning properties of housing cycles
The length and amplitude of housing cycle phases are relevant as the estimation of the housing cycle position can give an indication regarding the build-up of vulnerabilities. The related peaks of financial cycles and real estate cycles are likely to coincide with the start of financial crises, which can result in serious damage to economic activity. Some studies have looked into the potential early warning power of housing cycles as part of a larger assessment of the financial cycle. Schuler et al. (2017)26 find that the housing price cycle is a good predictor of vulnerabilities in-sample, but a weak predictor out-of-sample; their conclusion is that only a broad measure of the financial cycle has good early warning properties. Drehmann et al. (2012) indicate that housing price growth rates have good explanatory power in an early warning exercise that also takes into account other financial cycle components.
24 ESRB Working Group on Real Estate Methodologies (2019), Methodologies for the Assessment of Real Estate
Vulnerabilities and Macroprudential Policies – Residential Real Estate, forthcoming. 25 Leamer, E. (2007), “Housing IS the Business Cycle”, NBER Working Papers, No 13428, National Bureau of Economic
Research, September. 26 Schüler, Y., Hiebert, P. and Peltonen, T. (2015), “Characterising the financial cycle: a multivariate and time-varying
approach”, Working Paper Series, No 1846, ECB, September.
Prices and loans growth
Prices and debt
Prices and construction
Mortgage loans and debt
Loans and construction
Debt and construction
Expansion 0.6 -0.3 0.4 -0.2 0.4 -0.3 Downturn 0.2 -0.4 0.7 -0.2 0.1 -0.5 Recession 0.3 -0.4 0.6 -0.3 0.1 -0.3 Recovery 0.5 -0.2 0.2 0.0 0.1 -0.3

Vulnerabilities in the residential real estate sectors of the EEA countries / September 2019 Cross-country risk analysis 22
The relationship between housing prices and other financial cycle components
In order to better capture the financial cycle, combinations of credit and property prices would fit the bill well, whereas equity prices have slightly different characteristics that make it harder to integrate them in the aggregate measure (Drehmann et al., 2012).
Galati et al. (2016) use an unobserved component model to estimate the financial cycles and show that credit and real house prices exhibit similar medium-term cyclical behaviour. They find that both persistence and length do not vary much between the two. Schuler et al. (2017) look at the power cohesion of financial cycle indicators in pairs and observe that housing prices in relation with credit, equity prices or bond prices exhibit a strong medium-term component, with the common frequency of these pairs being between 8 and 20 years.
There can be several underlying driving forces behind an expansionary real estate cycle. House price growth dynamics can further intensify as a result of continuing tensions between demand and supply. Demand factors relate to demographic changes, income growth, favourable mortgage lending conditions or tax incentives. For instance, population growth caused by net migration tends to lead to higher real house prices, while the recent low interest rate environment has facilitated households’ path to ownership across Europe. On the other hand, housing supply can prove to be quite inelastic in the short run, leading to potential mismatches with demand. Housing supply constraints can manifest as complex functional of geographical conditions (land availability concerns, such as in LU or MT) and institutional factors (legal obstacles to issuing building permits, such as in CZ or NL). Developments in the rental market can also impact prices: short-term rentals spurred by tourism create concerns in some countries (e.g. PT or IS), while strict, long-term regulation of the rental market has contributed to house price levels in others (DK, SE). Additionally, it has been documented that during all phases of the real estate cycle, there tends to be a correlation between house price growth and mortgage lending growth on the one hand, and between housing price growth and construction investment growth on the other hand (see Box 1). This currently seems to be the case in many countries, which exhibit a combination of these elements (HU, LT, MT, EE, BG, IS).

Vulnerabilities in the residential real estate sectors of the EEA countries / September 2019 Cross-country risk analysis 23
Figure 1 Real estate cycle indentification
Source: ESRB assessment. Note: Cut off date 2018.
Expansion Downturn
RecessionRecovery
Firm: AT, BG, CZ, DE, EE, FR, HR, HU, IE, IS, LT, LV, LU, MT, NL, PL, PT, RO, SI, SKHouse price growth (AT, BG, CZ, DE, EE, HR, HU, IE, IS, LT, LV, MT, NL, NO, PL, PT, RO, SI, SK)Overvaluation (AT, CZ, DE, FR, IS, LU, NL, SK)Investment in dwellings (MT, EE, IS, BG, SE, NL, PL, CZ, IE, UK, SK, PT, DE, FR, AT)Building permits (IE, BG, PT, MT, HR, CZ, NL, AT, RO, LV, EE, PL, DE)Real estate transaction activity (EE, PT, LU, HR, FR)Housing lending (CZ, MT, LU, HU, SK, EE, FR)Deteriorating lending standards or data gaps (AT, CZ, DE, IS, NL, PT, FR, LU, SK)Mature: BE, FI, DK, UK, NO, SE, LIOvervaluation (BE, DK, UK, NO, SE)Household indebtedness (BE, FI, DK, UK, NO, SE, LI)Investment in dwellings (FI, DK, UK)Building permits (BE, FI)House price growth or housing lending growth (BE, SE, NO, DK, UK)
CY, ES, GR, ITHouse price growth (ES)Investment in dwellings (CY, ES, IT)Building permits (ES, CY, GR, IT )Real estate transaction activity (CY)High legacy NPL ratios (CY, GR)
No countries identified.
No countries identified.

Vulnerabilities in the residential real estate sectors of the EEA countries / September 2019 Cross-country risk analysis 24
Chart 6 Growth rates of investment in construction of dwellings and building permits for residential construction
(left-hand scale: year-on-year growth, percentages; right-hand scale: annual growth in percentage points)
Sources: Eurostat, national authorities in Iceland. Notes: Data are from Q2 2018. For building permits data for BG, DK, DE, EE, FR, HR, HU, LT, LV,PL, PT, RO, SI, SK data are from Q3 2018 and data for IT are from Q1 2018.
Chart 7 Consumer confidence and intention to purchase a home in the next 12 months
(left-hand scale: confidence indicator, indexes; right-hand scale: purchase or build home intention within next 12 months)
Source: European Commission. Note: Last data point is Q4 2018.
-0.4
-0.3
-0.2
-0.1
0.0
0.1
0.2
0.3
0.4
0.5
0.6
-30
-20
-10
0
10
20
30
40
50
60
70
IS IE BG BE PT CY GR MT HR CZ ES IT NL AT RO LV FI EE PL DE SI SK HU FR UK LT LU NO DK SE
Bulding permitsInvestment in dwellings as a percentage of GDP
-92
-90
-88
-86
-84
-82
-80
-78
-76
-74
-72
-70
-25
-20
-15
-10
-5
0
2000 2001 2002 2003 2004 2005 2006 2007 2008 2009 2010 2011 2012 2013 2014 2015 2016 2017 2018
Confidence IndicatorIntention to purchase or build a home within the next 12 months
Vulnerabilities in the residential real estate sectors of the EEA countries / September 2019 Cross-country risk analysis 25
3.2 Developments in the collateral stretch
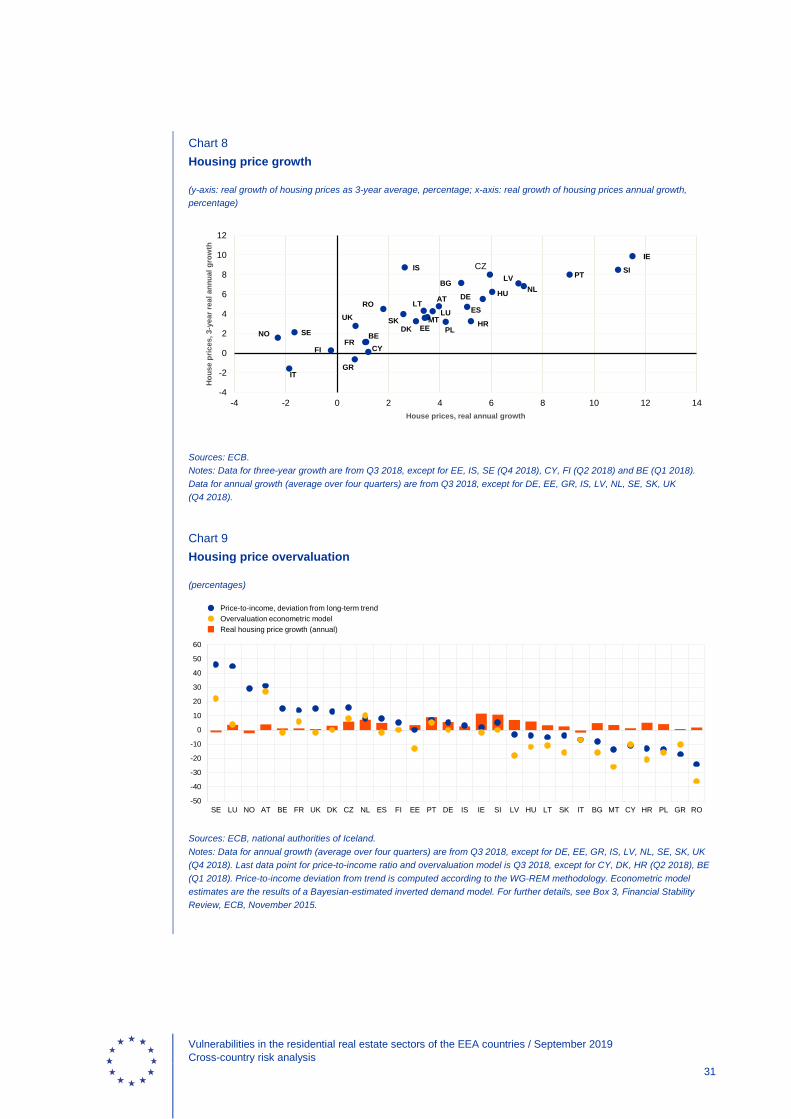
Housing prices27 have been growing robustly in most European countries against the backdrop of economic and financial recovery. In some countries, prices of residential properties have picked up after moderate or significant drops following the recent financial crisis (e.g. IE, LV, PT), while in several others they have continued on a longer-lasting upward trend (e.g. AT, DE).The scoreboard shows that in many countries, real housing prices grew by more than 5% annually over the past three years (BG, CZ, DE, HU, IE, IS, LV, NL, PT, SI). In most of these countries, the annual housing price dynamics over the last year have remained above 5% (BG, CZ, DE, HU, IE, LV, NL, PT, SI) (Chart 8). While the low interest rate environment, the improvement in economic activity and the recovery of the banking sectors across European countries have contributed to the inflation of RRE prices, house price dynamics in many countries have outpaced those of incomes, raising questions about the sustainability of such developments. There is also evidence that house prices seem to be growing more strongly (or are already registering signs of overvaluation) in capital cities and large urban areas. In some countries, these developments have already had spillover effects on the surrounding regions.
Some signs of price overvaluation already seem to be present in several European countries. Approaches to estimating house price overvaluation are challenging given the technical difficulties of defining and establishing the fundamental values. For this reason, the scoreboard takes into account several measures of overvaluation, where available. The deviation of the price-to-income ratio from its long-term value points to similar results as the econometric model, which links real house prices to fundamental determinants such as income, interest rates and a proxy for housing supply. In a low interest rate environment, however, the results of econometric models which use the interest rate as an explanatory variable must be interpreted with care, as it may be far from a “fundamental” level itself. In such cases, a degree of underestimation may be possible. The deviation of the price-to-income ratio from its long-term value may, on the other hand, be partially misleading for countries in which this ratio has been subject to strong dynamics due to economic transition in the recent past. Considered together, both the deviation of the price-to-income ratio from the long-term value, as a relatively straightforward indicator, and the econometric model indicated that around seven countries had some signs of visible overvaluation (AT, CZ, FR, LU, NL, PT and SE) (Chart 9). Alternative and simpler indicators of overvaluation were useful in complementing those provided by the scoreboard, such as the level of housing prices relative to the previous maximum and the difference between the cumulative growth rates of prices and wages over the most recent expansionary phase of house prices. However, these indicators are also very dependent on the level of RRE prices before the financial crisis, which can vary significantly among countries. Additional evidence of overvaluation in capital cities was also considered relevant (DK, HU, NL) given the concentration of economic activity in large urban areas.
House price dynamics may be driven by demand pressures as well as supply constraints. Apart from the positive economic and financial conditions (Chart 10), various other factors have contributed to the recent house price dynamics. Some of these factors may increase the magnitude of a potential reversal of house price expansion, and can therefore be considered as amplifying the 27 Throughout this report, growth rates of housing prices refer to real growth rates, adjusted using the consumer price index
(CPI).
Vulnerabilities in the residential real estate sectors of the EEA countries / September 2019 Cross-country risk analysis 26
vulnerabilities connected to house price growth in certain countries. Some of the factors may, on the other hand, have the opposite effect, so may be seen as mitigating these vulnerabilities. In this sense, amplifying factors may include cyclical construction investment or foreign demand driven by excessive liquidity, which can both unwind in case of negative development and contribute to house price declines. Structural factors may include land supply constraints and increased demand as a result of higher natality. Demand pressures caused by migration and urbanisation or by short-term rentals, sometimes generated by tourism development in certain regions (PT or IS), can substantially fuel house price growth. Furthermore, factors such as a highly regulated rental market (SE, DK), which creates a shortage of dwellings on purchase in certain countries, legal obstacles to issuing building permits (CZ, NL) or the interest rate deductibility of mortgages (DK, SE, NL) may amplify the identified vulnerabilities. Concerning the supply of housing, despite some important pick-ups in investment directed towards housing, regulatory constraints are present in many European countries, preventing a timely adjustment of supply. Laws that regulate urban planning, zoning or the green belt can have a significant impact on the construction of new dwellings, which is even more relevant in countries with little land availability. In countries where price overvaluation or housing price growth are fairly strong, building permits have actually been decreasing over the past year (LU, NO, DK, SE, FR). Nevertheless, some of these drivers of house prices are structural factors that would generally remain unchanged over the real estate cycle. In this vein, they can for example support the expansionary phase or the cycle, but not amplify shocks during the downturn.
Medium-term house price developments indicate that many countries have medium or high risk levels connected to the collateral stretch. The scoreboard indicates that eight countries have medium risk levels and seven countries have high risk levels (Table 4). Further expert-based adjustments result in seven countries having high risk (AT, CZ, DE, LU, PT, SE, SI) and 11 having medium risk (BE, DK, EE, FR, HU, IE, IS, NL, NO, SK, UK) (Tables 5 and 6).

Vulnerabilities in the residential real estate sectors of the EEA countries / September 2019 Cross-country risk analysis 27
Table 4 Scoreboard indicators (Step 1) for the collateral stretch
Country
Residential real estate price index (36m real growth,
Residential price index relative to
trend
House-price-to-income ratio
(deviation from
Econometric model (overvaluation in
%)
Average rating across price indicators
AT 4.8 1.1 31.0 27.0 2.25
BE 0.6 0.9 15.0 -2.0 0.5
BG 7.2 1.2 -8.0 -16.0 1.3
CY 0.1 0.9 -11.0 -10.0 0.0
CZ 8.0 1.1 16.0 8.0 2.8
DE 5.5 1.2 5.0 0.0 1.8
DK 3.2 1.0 13.0 0.0 1.3
EE 3.6 1.1 0.0 -13.0 1.0
ES 4.7 1.0 8.0 -2.0 0.5
FI 0.3 0.9 5.0 0.0 0.5
FR 1.1 0.9 14.0 6.0 1.0
UK 2.8 1.0 15.0 -2.0 0.8
GR -0.6 0.9 -17.0 -10.0 0.0
HR 3.2 1.1 -13.0 -21.0 1.0
HU 6.2 1.2 -4.0 -12.0 1.3
IE 9.9 1.1 2.0 -2.0 1.5
IS 8.7 1.1 3.3 1.7
IT -1.6 0.9 -7.0 -7.0 0.0
LI
LT 4.3 1.0 -5.0 -11.0 0.3
LU 4.3 1.0 45.0 4.0 1.8
LV 7.1 1.3 -3.0 -18.0 1.3
MT 3.7 1.0 -14.0 -26.0 0.5
NL 6.8 1.0 8.0 10.0 1.5
NO 1.6 1.0 29.0 1.0
PL 3.2 1.1 -14.0 -16.0 0.8
PT 8.0 1.2 7.0 5.0 2.0
RO 4.5 1.2 -24.0 -36.0 1.0
SE 2.1 1.0 46.0 22.0 1.8
SI 8.5 1.3 5.0 0.0 2.0
SK 4.0 1.1 -4.0 -16.0 0.8
Low 2.5 1.00 4.0 0.0 1.0
Medium 5.0 1.04 10.0 6.0 1.2
High 7.5 1.08 16.0 12.0 1.7
Source: ECB. Notes: Last data point for RRE price index is Q3 2018, except for EE, IS, SE (Q4 2018), CY, FI (Q2 2018) and BE (Q1 2018). Last data point for price-to-income ratio and overvaluation model is Q3 2018, except for CY, FI(Q2 2018) and BE (Q1 2018). The average rating for the stretch ranges from 0 to 3 and is an equally weighted average of a discrete transformation of the individual indicators in one stretch. All indicators are given the same weight, implying that the indicators of house price overvaluation are given the same weight as the indicators of house price dynamics. Each indicator is assigned a rating from 0 to 3 based on the threshold it breaches (0 being no threshold breached, 3 being the highest threshold breached and indicating high risk).

Vulnerabilities in the residential real estate sectors of the EEA countries / September 2019 Cross-country risk analysis 28
Table 5 Other factors considered (Step 2) in the collateral stretch
Country
Average rating across price indicators
Residential estate price
index, (12m real growth, av. %)
Alternative evidence of overvaluation provided by
NAs or other indicators (dummy variable)
Share of investment in
dwellings (relative to GDP, %)
Regulated rental market
("x" where applicable)
Legal supply constrainsts ("x" where applicable)
Rate of net migration (per
1000 inhabitants)
Transaction dynamics
(yearly changes, %)
Tax deductibility of mortgages
("x" where applicable)
Combined rating
AT high 4.0 high 4.2 4.0 0.0 high
BE limited 1.1 medium 5.4 9.0 x medium
BG medium 4.8 3.1 -0.5 x low
CY limited 1.2 5.4 9.3 23.7 limited
CZ high 5.9 high 4.8 x 3.6 x high
DE high 5.7 high 5.7 x 4.8 2.9 high
DK medium 3.1 medium 4.8 x x 3.2 8.9 x medium
EE low 3.4 4.8 5.3 55.0 x medium
ES limited 5.1 6.1 7.1 16.3 low
FI limited -0.2 6.4 2.1 1.6 x low
FR low 1.1 medium 5.9 -0.6 12.3 medium
UK limited 0.7 medium 3.9 3.9 1.2 medium
GR limited 0.7 0.6 1.4 limited
HR low 5.2 -3.3 13.0 low
HU medium 6.0 medium 1.8 8.3 medium
IE medium 11.5 1.9 x 9.0 10.9 medium
IS medium 2.6 medium 3.7 18.6 x medium
IT limited -1.9 4.5 1.1 1.6 x limited

Vulnerabilities in the residential real estate sectors of the EEA countries / September 2019 Cross-country risk analysis 29
Country
Average rating across price indicators
Residential estate price
index, (12m real growth, av. %)
Alternative evidence of overvaluation provided by
NAs or other indicators (dummy variable)
Share of investment in
dwellings (relative to GDP, %)
Regulated rental market
("x" where applicable)
Legal supply constrainsts ("x" where applicable)
Rate of net migration (per
1000 inhabitants)
Transaction dynamics
(yearly changes, %)
Tax deductibility of mortgages
("x" where applicable)
Combined rating
LI NA sings of overvaluation, but diminishing house price growth (anecdotal evidence) low
LT limited 3.4 2.6 -1.2 0.0 low
LU high 3.7 medium 3.0 x x 16.3 16.9 x high
LV medium 7.1 1.4 -2.5 0.9 low
MT limited 3.5 5.1 35.3 low
NL medium 7.3 medium 5.6 x x 5.0 12.6 x medium
NO low -2.3 medium 4.1 x medium
PL limited 4.2 3.0 0.6 low
PT high 9.0 2.9 x 1.1 20.6 high
RO low 1.8 -2.8 12.5 low
SE high -1.7 high 5.1 x 8.5 1.7 x high
SI high 10.9 2.0 7.2 1.3 high
SK limited 2.6 medium 2.5 0.7 x medium
Sources: ESRB assessment, ECB, Eurostat, national authorities, European Mortgage Federation. Notes: The additional indicators were considered differently for the combined rating, depending on relevance and availability for all countries, with the alternative overvaluation measures having slightly more weight. Last data point for RRE price index 1y (average over four quarters) is Q3 2018, except for DE, EE, GR, IS, LV, NL, SE, SK, UK (Q4 2018). Last data point for net migration is 2018 and for transaction activity it is 2017. The alternative estimate of house price overvaluation is based on information collected from the resources of the NAs (national financial stability reports) or resources of other international institutions (country analysis published by IMF and EC). These estimates were also considered in view of other indicators of house price overvaluation such as price-to-previous-peak ratio over the period 2000-2018. The ratings “medium” and “high” of the alternative indicator for overvaluation were established on the basis of expert judgement. The information regarding the rental market, supply constraints and mortgage tax deductibility was collected from national authorities. More details can be found in the country summaries .

Vulnerabilities in the residential real estate sectors of the EEA countries / September 2019 Cross-country risk analysis 30
Table 6 Reasons for adjusttments from Step 1 to Step 2, in the collateral stretch
Collateral stretch
Step 1 - scoreboard risk result
Reasons
Step 2 - adjusted
risk result
AT high NA high
BE limited signs of overvaluation as indicated by NAs and IMF, tax deductibility and high real estate transaction rate
medium
BG medium statistically unreliable evidence of house price overvalution low
CY limited NA limited
CZ high NA high
DE high NA high
DK medium NA medium
EE low tax deductibility and high real estate transaction rate medium
ES limited recent dynamics in house prices low
FI limited tax deductibility and high share of investment in dwellings low
FR low overvaluation concerns dilluted by the scoreboard averaging, as house price growth rates in Paris area has been particularly high, nationally high real estate transaction rate
and high share of investment in dwellings
medium
UK limited overvaluation concerns diluted by the scoreboard averaging, concerns about overvaluation in the London area
medium
GR limited NA limited
HR low NA low
HU medium NA medium
IE medium NA medium
IS medium NA medium
IT limited NA limited
LI NA sings of overvaluation, but diminishing house price growth (anecdotal evidence) low
LT limited demand and supply mismatch which tends to induce a lot of house price volatility low
LU high NA high
LV medium statistically unreliable evidence of house price overvalution low
MT limited recent dynamics with demand supported by fast-growing economic sectors which increase demand for real estate, net migration, buoyant tourism and tax beneifts
low
NL medium NA medium
NO low signs of overvaluation, particularly in Oslo, and tax deductibility medium
PL limited recent growth of house prices indicates that house price developments are not benign low
PT high NA high
RO low NA low
SE high NA high
SI high NA high
SK limited signs of overvaluation and concerns about the strong short-term dynamics, as indicated by NAs
medium
Source: ESRB assessment.
Vulnerabilities in the residential real estate sectors of the EEA countries / September 2019 Cross-country risk analysis 31
Chart 8 Housing price growth
(y-axis: real growth of housing prices as 3-year average, percentage; x-axis: real growth of housing prices annual growth, percentage)
Sources: ECB. Notes: Data for three-year growth are from Q3 2018, except for EE, IS, SE (Q4 2018), CY, FI (Q2 2018) and BE (Q1 2018). Data for annual growth (average over four quarters) are from Q3 2018, except for DE, EE, GR, IS, LV, NL, SE, SK, UK (Q4 2018).
Chart 9 Housing price overvaluation
(percentages)
Sources: ECB, national authorities of Iceland. Notes: Data for annual growth (average over four quarters) are from Q3 2018, except for DE, EE, GR, IS, LV, NL, SE, SK, UK (Q4 2018). Last data point for price-to-income ratio and overvaluation model is Q3 2018, except for CY, DK, HR (Q2 2018), BE (Q1 2018). Price-to-income deviation from trend is computed according to the WG-REM methodology. Econometric model estimates are the results of a Bayesian-estimated inverted demand model. For further details, see Box 3, Financial Stability Review, ECB, November 2015.
AT
BECY
DE
EE
ES
FIFR
GR
IE
IT
LTLU
LV
MT
PT SI
SK
BG
CZ
DKUK
HR
HU
PL
RO
SE
IS
NL
NO
-4
-2
0
2
4
6
8
10
12
-4 -2 0 2 4 6 8 10 12 14
Hou
se p
rices
, 3-y
ear r
eal a
nnua
l gro
wth
House prices, real annual growth
-50
-40
-30
-20
-10
0
10
20
30
40
50
60
SE LU NO AT BE FR UK DK CZ NL ES FI EE PT DE IS IE SI LV HU LT SK IT BG MT CY HR PL GR RO
Price-to-income, deviation from long-term trendOvervaluation econometric modelReal housing price growth (annual)

Vulnerabilities in the residential real estate sectors of the EEA countries / September 2019 Cross-country risk analysis 32
Chart 10 Cost of financing and wage growth
(percentages)
Sources: ECB, Eurostat, Iceland national authorities. Notes: Data for three-month market interest rate is intended to be illustrative, as it is not entirely representative for the actual cost of lending for households for house purchases. Data for three-month market interest rate are from Q4 2018 for EA countries and BG, whereas for non EA ones data are from Q1 2018. As for annual wage and salary growth, data are from Q3 2018, with the exception of IE, LU, NL, PL and NO, where the last data point is Q2 2018. For BG, the EURIBOR was used given that the economy operates under a currency board and the calculation and publication of data on national money market rates was discontinued from 1 July 2018.
3.3 Developments in the funding stretch
Following the recent global financial crisis, RRE exposures in several countries contributed significantly to the accumulation of NPLs in banks’ balance sheets. Overall, European banks’ current RRE portfolios register relatively low NPL ratios. With the exception of countries with legacy issues and which still have very large outstanding NPL exposures (GR and CY), the average European NPL ratio for RRE portfolios was around 3% in Q2 2018. However, the share of non-performing RRE exposures in total non-performing loans as of 2018 Q3 is still significant in countries where a real estate boom was part of the underpinning vulnerabilities prior to the onset of the crisis, such as IE (51%), CY (46%) or ES (35%), Chart 14.
In some countries, household lending for house purchases has picked up considerably. The scoreboard shows that real housing credit in a few countries has grown by more than 6%28 per year over the past three years (CZ, LU, MT, RO, SK) (Table 7). The recent annual dynamics of real housing lending (adjusted for sales and securitisation) are also strong in many economies (BG, CZ, FR, LT, LU, MT, RO, SE, SK). By contrast, there are several countries in which the annual growth of household credit for house purchases has been negative or close to zero over the medium term (CY, ES, GR, HR, IE, LV, PT). Euro area data on new housing lending (excluding renegotiations) points to increased production of household loans for house purchases, including in countries
28 The threshold indicates medium risk according to the WG-REM methodology.
-2
-1
0
1
2
3
4
-25
-20
-15
-10
-5
0
5
10
15
20
25
RO CZ PL HU LV IS SK SI MT CY BG EE IE LT LU FI PT DE GR HR DK NL AT ES FR BE IT NO SE
Three month market interest rateAnnual wage and salary growth

Vulnerabilities in the residential real estate sectors of the EEA countries / September 2019 Cross-country risk analysis 33
where stock dynamics do not reflect this due to large repayment volumes. This is particularly relevant given the evidence that repayments associated with loans granted during previous boom periods can substantially underestimate current dynamics of outstanding credit29. In Q2 2018, new lending (excluding renegotiations) over one year increased by roughly 15% to 30%, relative to the previous stock of housing lending, in AT, BE, EE, FI, FR, LT, SI and SK (Chart 11).
There are also indications that credit dynamics may be coupled with eased lending standards. The scoreboard points to the fact that compressed lending spreads on housing loans for households can be a widespread funding vulnerability. In seven countries, these lending spreads were below 1.5%30, pointing to a medium or high vulnerability. In only one of these countries, however, this is also coupled with medium or high growth in housing credit (SK). In FI, the average spread has dropped below 1%, while in PT, IS, IT, SK and FR, it is slightly above this value. In the ECB bank lending survey (BLS) for euro area31 countries, it can also be observed that credit standards for loans to households for house purchases have eased in 2018, mainly as a result of increased bank competition and banks’ greater perception of risk (Table 10 and Chart 12).
However, a comprehensive assessment of lending standards in terms of loan characteristics is hampered by data gaps and a lack of harmonised definitions. The analysis of lending standards benefited information collected from the national authorities on a bilateral basis, mainly with regard to LTV, LTI and DSTI ratios, maturities and the share of non-amortising housing loans. To carefully assess vulnerabilities connected to these characteristics, the distributions rather than the averages or medians were seen as more relevant, as vulnerabilities are usually concentrated in the upper tails. Furthermore, determining risky values of these ratios is to some extent a country-specific task and is hampered by inconsistent definitions of the elements that go into the computation of these indicators. A country-by-country assessment of the credit characteristics of new housing loans points to the build-up of vulnerabilities in 15 Member States (AT, BE, CZ, DK, FI, FR, IE, IS, LU, NL, PT, SE, SK, UK, SI), whereas an assessment of a potential build-up of such risks in DE is hampered by data gaps. Due to the associated uncertainty about the credit characteristics of new loans, such data gaps are to be considered as a vulnerability of its own. Where this information is available, the assessment of the credit characteristics of outstanding housing loans points to accumulated vulnerabilities in six countries (BE, DK, FR, NL, SE, HU), while in Hungary this is a legacy issue. However, as the detailed collection of data on new loans was not common practice in the past, the assessment of stock vulnerabilities is not automatically penalised due to data gaps. Instead, we suggest that potentially risky loans that were granted in past boom periods may have either materialised into losses or have been largely repaid in the countries, unless other information is available.
Overall, European banks are well capitalised but increasing risks need to be carefully considered in the case of institutions using IRB32 models. RRE exposures represent a significant part of bank assets in most countries, with the median share amounting to 40% 29 Adalid, R. and Falagiarda, M. (2018), “How repayments manipulate our perceptions about loan dynamics after a
boom”, Working Paper Series, No 2211, ECB, December. 30 The threshold indicates medium risk according to the WG-REM methodology. 31 ECB (2018), The euro area bank lending survey – Third quarter of 2018. 32 Internal-ratings-based approach refers to guidelines under CRD IV/CRR that allow banks to use their own estimated risk
parameters for the calculation of capital requirements.

Vulnerabilities in the residential real estate sectors of the EEA countries / September 2019 Cross-country risk analysis 34
(Q4 2018). Capital adequacy ratios range from 15% to 32% (Q3 2018). However, in the case of IRB RRE bank portfolios, average risk weights are quite heterogeneous across countries, varying form 6.3% to 35.2% (Q3 2018). In terms of relevance, IRB models are used for a substantial part of the RRE portfolios: we observe that 13 out of the 31 countries have a share of IRB portfolios of loans for house purchases of over 50% (the coverage of the IRB models for household portfolios being higher than that for total loans) (Table 11). The purpose of IRB models would be to adjust risk weights in line with estimated risk parameters, like the PD (probability of default) and LGD (loss given default), in order to capture specific features of bank portfolios. Nevertheless, the results based on these models can be influenced by the choice of estimation techniques or sample limitations (i.e. low default portfolios, short time series), which may even render them procyclical at times. Some of the countries with low loan spreads also have relatively lower risk weights (DE, ES, FR), which may potentially amplify the vulnerabilities connected to these loans depending on their credit characteristics.
In the current low interest rate environment, the funding risk for credit providers related to a large share of fixed interest rate loans is acknowledged. Risks to credit providers relating to a large share of fixed interest rate housing loans in certain countries (BE, DE, FR) need to be considered, particularly given the prolonged low interest rate environment and a “back-to-normal” scenario where interest rates may increase33. In such cases, banks might not have sufficiently hedged the interest rate risk associated with their holdings of fixed rate housing loans. Increases in funding costs could have severe effects on the liquidity positions and profitability of such banks.
With regard to bank funding of RRE exposures, extensive covered bond financing can have both positive and negative effects. In many Member States, legislation governing the use of covered bonds (Chart 13) stipulates that housing loans which back covered bond issuances must meet stricter criteria in terms of credit quality (i.e. lower LTVs or maturities). In this regard, the use of covered bonds would ensure a higher quality of RRE loan portfolios. From the banks’ perspective, as long as the issuance of covered bonds does not rely too much on short-term refinancing, the covered bond model could be a stabilising factor. It should be noted that the risk of changes in investor sentiment on the bond market, coupled with a macroeconomic downturn, could in principle affect banks’ balance sheets and increase the probability of bank runs on unsecured debt. In certain jurisdictions, however, covered bonds tend also to remain on banks’ balance sheets for a long time, as they may be retained for refinancing operations with the central bank. In this case, the risk of an investor run-off is contained. Finally, with high asset encumbrance, there is a risk that in a severe downturn the holders of the covered bonds are not fully repaid, leading to an even greater potential loss for unsecured debtors.34
33 ESRB (2016), Macroprudential policy issues arising from low interest rates and structural changes in the EU
financial system. 34 Covered bonds are double recourse instruments, with investors having claims on both the encumbered assets and the
overall bank assets. The covered bond markets in Europe, however, differ from one another (more details in Section 4). While in Denmark, a corresponding bond is issued for every mortgage loan, in other European jurisdictions covered bonds are backed by a dynamic pool of mortgages and banks need to ensure the proper management of interest rate risk and liquidity risk for these portfolios.

Vulnerabilities in the residential real estate sectors of the EEA countries / September 2019 Cross-country risk analysis 35
Banks engaged in RRE lending are also interconnected across borders35, which may create vulnerabilities for parent banks in the case of a macroeconomic shock in another economy. Subsidiaries and branches of AT banks grant a significant share of RRE loans in CZ (16%), SK (12%) and PL (3.5%) as of Q3 2018, while the UK has banks with large RRE exposures located in countries outside the EEA (Chart 15). The connections are also very strong between the Nordic countries: SE, for example, has highly relevant shares of RRE exposures in DK (11%), NO (9%) and FI (7%), while DK is mostly exposed to NO (7%) and FI (5%) as of Q3 2018. A financial or economic downturn in another economy can generate spillover effects for the domestic banking sector. This also has important implications for the design of policy measures, which may need to ensure reciprocation for a level playing field and reduce the incentive of parent banks for arbitrage.
Medium-term developments related to mortgage financing indicate that some countries have medium or high risk levels connected to the funding stretch. The scoreboard indicates that one country has a high risk level and three countries have medium risk levels (Table 7). Further expert-based adjustments result in one country having high risk (SK) and 15 countries having medium risk (AT, BE, CZ, DE, DK, EE, FI, FR, IS, LU, MT, NL, RO, SE, UK) (Tables 8 and 9).
35 Data reported in this paragraph are computed based on Common Reporting Framework (COREP) data (reported EU-wide
for the 200 largest banks) as the sum of IRB (COREP Template C_09.02.a, row 090, column 010, section 999) and SA (difference between COREP Template C_09.01.a, row 090, column 010, section 999 and COREP Template C_09.01.a, row 095, column 010, section 999) retail non-SME exposures.
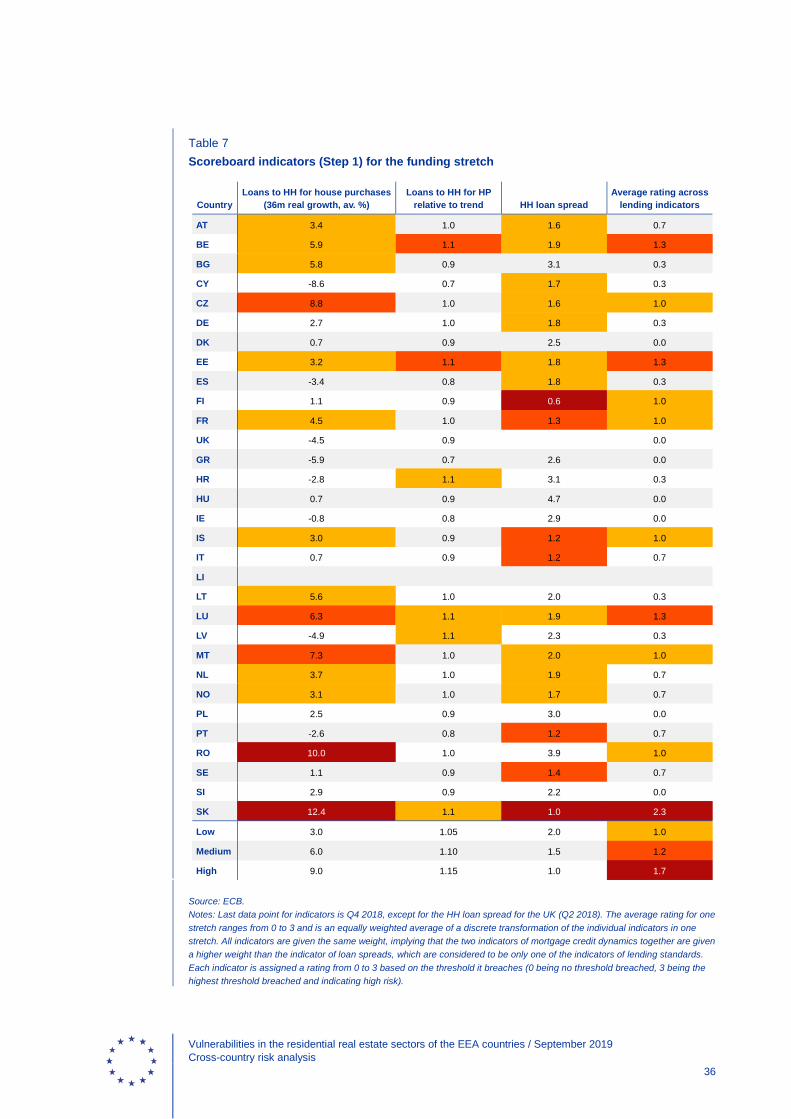
Vulnerabilities in the residential real estate sectors of the EEA countries / September 2019 Cross-country risk analysis 36
Table 7 Scoreboard indicators (Step 1) for the funding stretch
Country Loans to HH for house purchases
(36m real growth, av. %) Loans to HH for HP
relative to trend HH loan spread Average rating across
lending indicators
AT 3.4 1.0 1.6 0.7
BE 5.9 1.1 1.9 1.3
BG 5.8 0.9 3.1 0.3
CY -8.6 0.7 1.7 0.3
CZ 8.8 1.0 1.6 1.0
DE 2.7 1.0 1.8 0.3
DK 0.7 0.9 2.5 0.0
EE 3.2 1.1 1.8 1.3
ES -3.4 0.8 1.8 0.3
FI 1.1 0.9 0.6 1.0
FR 4.5 1.0 1.3 1.0
UK -4.5 0.9 0.0
GR -5.9 0.7 2.6 0.0
HR -2.8 1.1 3.1 0.3
HU 0.7 0.9 4.7 0.0
IE -0.8 0.8 2.9 0.0
IS 3.0 0.9 1.2 1.0
IT 0.7 0.9 1.2 0.7
LI
LT 5.6 1.0 2.0 0.3
LU 6.3 1.1 1.9 1.3
LV -4.9 1.1 2.3 0.3
MT 7.3 1.0 2.0 1.0
NL 3.7 1.0 1.9 0.7
NO 3.1 1.0 1.7 0.7
PL 2.5 0.9 3.0 0.0
PT -2.6 0.8 1.2 0.7
RO 10.0 1.0 3.9 1.0
SE 1.1 0.9 1.4 0.7
SI 2.9 0.9 2.2 0.0
SK 12.4 1.1 1.0 2.3
Low 3.0 1.05 2.0 1.0
Medium 6.0 1.10 1.5 1.2
High 9.0 1.15 1.0 1.7
Source: ECB. Notes: Last data point for indicators is Q4 2018, except for the HH loan spread for the UK (Q2 2018). The average rating for one stretch ranges from 0 to 3 and is an equally weighted average of a discrete transformation of the individual indicators in one stretch. All indicators are given the same weight, implying that the two indicators of mortgage credit dynamics together are given a higher weight than the indicator of loan spreads, which are considered to be only one of the indicators of lending standards. Each indicator is assigned a rating from 0 to 3 based on the threshold it breaches (0 being no threshold breached, 3 being the highest threshold breached and indicating high risk).

Vulnerabilities in the residential real estate sectors of the EEA countries / September 2019 Cross-country risk analysis 37
Table 8 Other factors considered (Step 2) in the funding stretch
Country
Average rating across lending
indicators
Loans to HH for house purchases adjusted for
sales and securitisations (36m real growth, av. %)
Loans to HH for house purchases adjusted for
sales and securitisations (12m real growth, av. %)
Lending standards – existing loans,
collected by Nas (dummy variable)
Lending standards – new loans, collected
by Nas (dummy variable)
RWs (IRB) (%)
Capital adequacy (Tier 1) (%)
NPL ratio of RRE
exposures (%) Combined
rating
AT limited 2.8 2.6 high 16.6 17.4 2.3 medium
BE medium 3.4 3.4 medium high 13.0 19.7 2.4 medium
BG limited 5.3 8.8 19.4 9.4 low
CY limited -0.9 -2.0 15.2 low
CZ low 7.2 6.7 medium 21.9 17.8 1.2 medium
DE limited 2.7 2.4 data gaps 13.0 19.2 1.1 medium
DK limited 0.8 1.0 medium medium 15.0 22.0 3.2 medium
EE medium 3.4 3.3 32.2 1.0 medium
ES limited -3.7 -3.1 13.5 15.2 4.1 limited
FI low 1.4 0.2 medium 23.9 medium
FR low 4.0 3.4 medium medium 11.8 17.6 3.4 medium
UK limited 2.1 1.1 medium 10.5 20.9 1.8 medium
GR limited -3.8 -4.0 16.3 45.1 limited
HR limited -0.8 1.5 20.3 5.0 limited
HU limited 1.0 7.2 medium 16.6 10.1 low
IE limited -2.6 -2.0 35.2 21.7 9.1 low
IS low medium medium
IT limited 1.2 0.9 17.8 16.2 5.0 limited
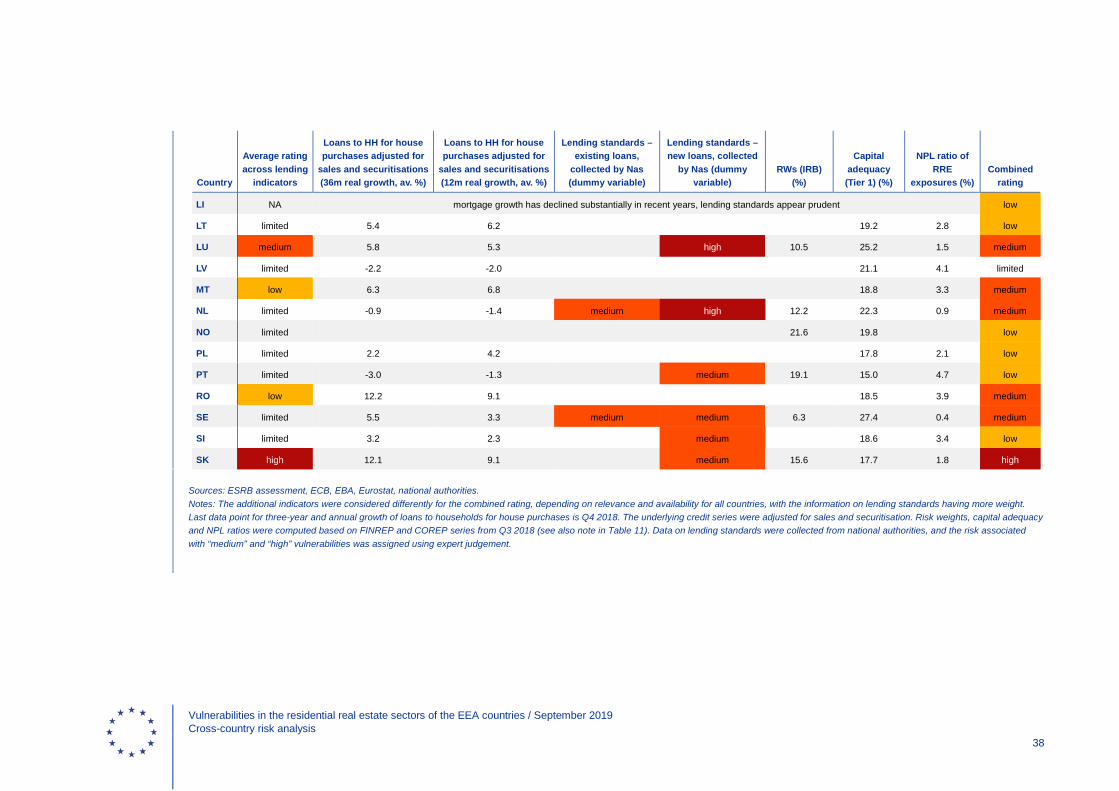
Vulnerabilities in the residential real estate sectors of the EEA countries / September 2019 Cross-country risk analysis 38
Country
Average rating across lending
indicators
Loans to HH for house purchases adjusted for
sales and securitisations (36m real growth, av. %)
Loans to HH for house purchases adjusted for
sales and securitisations (12m real growth, av. %)
Lending standards – existing loans,
collected by Nas (dummy variable)
Lending standards – new loans, collected
by Nas (dummy variable)
RWs (IRB) (%)
Capital adequacy (Tier 1) (%)
NPL ratio of RRE
exposures (%) Combined
rating
LI NA mortgage growth has declined substantially in recent years, lending standards appear prudent low
LT limited 5.4 6.2 19.2 2.8 low
LU medium 5.8 5.3 high 10.5 25.2 1.5 medium
LV limited -2.2 -2.0 21.1 4.1 limited
MT low 6.3 6.8 18.8 3.3 medium
NL limited -0.9 -1.4 medium high 12.2 22.3 0.9 medium
NO limited 21.6 19.8 low
PL limited 2.2 4.2 17.8 2.1 low
PT limited -3.0 -1.3 medium 19.1 15.0 4.7 low
RO low 12.2 9.1 18.5 3.9 medium
SE limited 5.5 3.3 medium medium 6.3 27.4 0.4 medium
SI limited 3.2 2.3 medium 18.6 3.4 low
SK high 12.1 9.1 medium 15.6 17.7 1.8 high
Sources: ESRB assessment, ECB, EBA, Eurostat, national authorities. Notes: The additional indicators were considered differently for the combined rating, depending on relevance and availability for all countries, with the information on lending standards having more weight. Last data point for three-year and annual growth of loans to households for house purchases is Q4 2018. The underlying credit series were adjusted for sales and securitisation. Risk weights, capital adequacy and NPL ratios were computed based on FINREP and COREP series from Q3 2018 (see also note in Table 11). Data on lending standards were collected from national authorities, and the risk associated with “medium” and “high” vulnerabilities was assigned using expert judgement.

Vulnerabilities in the residential real estate sectors of the EEA countries / September 2019 Cross-country risk analysis 39
Table 9 Reasons for adjustments from Step 1 to Step 2, in the funding stretch
Funding stretch
Step 1 - scoreboard risk result
Reasons
Step 2 - adjusted
risk result
AT limited concerns about lending standards for new loans - LTV tail distribution medium
BE medium NA medium
BG limited strong short-term house lending growth low
CY limited legacy issues related to NPLs low
CZ low concerns about lending standards for new loans - DSTI and DTI tail distributions medium
DE limited concerns about lending standards given data gaps and pick-up of credit growth medium
DK limited concerns about lending standards - large share of loans with deferred amortisation medium
EE medium NA medium
ES limited NA limited
FI low concerns about lending standards for new loans - LTI and DSTI tail distributions, interconnectedness with Nordic financial system
medium
FR low concerns about lending standards for new loans - LTV and DSTI tail distributions medium
UK limited concerns about lending standards for new loans - concentration close to limit, low risk weights of RRE exposures of IRB banks
medium
GR limited NA limited
HR limited NA limited
HU limited legacy issues related to lending standards for oustanding loans - LTV tail distribution low
IE limited legacy issues related to NPLs low
IS low concerns about lending standards for new loans - DTI tail distribution medium
IT limited NA limited
LI NA mortgage growth has declined substantially in recent years, lending standards appear prudent
low
LT limited strong short-term house lending growth, interconnectedness with Nordic financial system
low
LU medium NA medium
LV limited NA limited
MT low strong short-term house lending growth and large RRE exposure concentration medium
NL limited concerns about lending standards for new loans - LTV tail distribution, and low risk weights of RRE exposures of IRB banks
medium
NO limited moderate short-term house lending growth, interconnectedness with Nordic financial system
low
PL limited moderate short-term house lending growth low
PT limited concerns about lending standards for new loans - maturity tail distribution low
RO low strong short-term house lending growth medium
SE limited concerns about lending standards for new and outstanding loans - DTI tail distribution, interconnectedness with Nordic financial system
medium
SI limited concerns about lending standards for new loans - LTV, DSTI and LTI tail distribution low
SK high NA high
Source: ESRB assessment.

Vulnerabilities in the residential real estate sectors of the EEA countries / September 2019 Cross-country risk analysis 40
Chart 11 Growth rates of household loans for house purchases (outstanding and new loans)
(annual growth rates, percentages)
Sources: ECB, Iceland national authorities. Notes: Last data point is Q2 2018. Pure new loans (excluding renegotiations) over the past 12 months relative to stock 12 months earlier were computed by dividing the share of pure new loans to households for household purchases according to bank business volumes by the lending for house purchases vis-à-vis euro area households (outstanding amount at the end of the period, stocks).
Table 10 Credit conditions for household loans for house purchases in selected euro area countries
(net percentages)
Source: ECB.
-35
-25
-15
-5
5
15
25
35
-10
-8
-6
-4
-2
0
2
4
6
8
10
SK MT LU IS LT FR BE EE SI DE AT FI IT CY NL LV IE PT GR ES
Pure new household loans for house purchases (12m flows/stock of credit t-12m)Household loans for house purchases, adjusted for sales and securitisations (real annual growth rate)
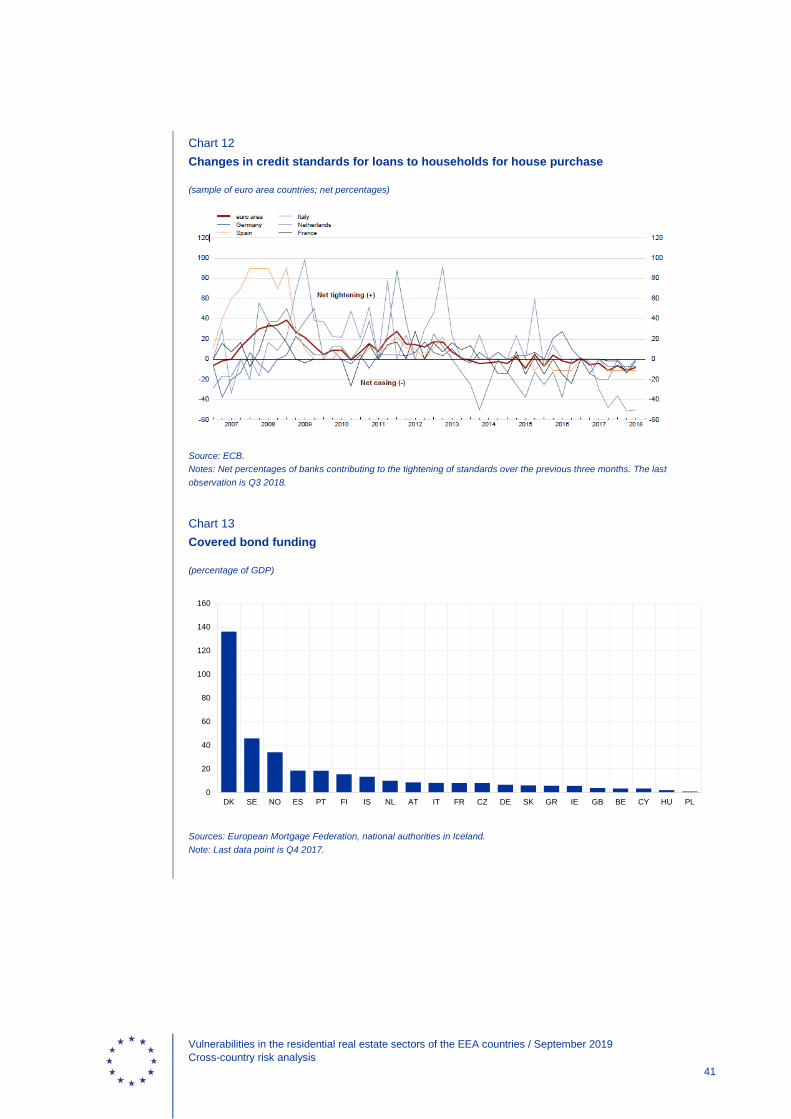
Vulnerabilities in the residential real estate sectors of the EEA countries / September 2019 Cross-country risk analysis 41
Chart 12 Changes in credit standards for loans to households for house purchase
(sample of euro area countries; net percentages)
Source: ECB. Notes: Net percentages of banks contributing to the tightening of standards over the previous three months. The last observation is Q3 2018.
Chart 13 Covered bond funding
(percentage of GDP)
Sources: European Mortgage Federation, national authorities in Iceland. Note: Last data point is Q4 2017.
0
20
40
60
80
100
120
140
160
DK SE NO ES PT FI IS NL AT IT FR CZ DE SK GR IE GB BE CY HU PL

Vulnerabilities in the residential real estate sectors of the EEA countries / September 2019 Cross-country risk analysis 42
Chart 14 Share of non-performing RRE exposures in total NPLs and the NPL ratio
(percentages)
Sources: EBA, national authorities in Iceland. Notes: Based on FINREP series from Q3 2018, except for CY and IE (2018 Q2), collected for a sample of the largest 200 banks in Europe. The data are reported at the highest level of consolidation. The series “RRE exposures” is collected from FINREP Template F_18.00.a, row 160, column 10, the series “RRE non-performing exposures” is from FINREP Template F_18.00.a, row 160, column 60, the series “Total exposures” is from FINREP Template F_18.00.a, row 70, column 10, and the series “Total non-performing exposures” is from FINREP Template F_18.00.a, row 70, column 60.”
Chart 15 Cross-border RRE exposures in Europe
(percentages)
Source: EBA. Notes: Based on COREP series from Q3 2018, collected for a sample of the largest 200 banks in Europe. The data are reported at the highest level of consolidation. The exposures are the sum of exposures under SA and IRB approaches. From “Geographical breakdown of exposures by residence of the obligor (SA exposures)” we computed the difference between “Retail of which Secured by mortgages on immovable property – Exposures in default” and “Secured by mortgages on immovable property Of which SME – Exposures in default” (COREP Template C_09.01.b, rows 090 and 095, column 020) for the SA approach. The IRB exposures are from “Original exposure pre conversion factors” (COREP Template C_09.02, row 070, column 010) from “Geographical breakdown of exposures by residence of the obligor (IRB exposures) – Retail Secured by real estate property”.
0
10
20
30
40
50
60
IE CY UK LV LT ES GR HU BE SK MT DK CZ EE RO NL SE PT AT FR BG PL HR DE IT SI LU
Share RRE NPLsRRE NPL %Total NPL ratio
0
10
20
30
40
50
60
70
80
90
100
AT ES SE BE FR NL IT DK GR LU PT DE GB IE SI BG CY EE FI
DomesticEEAOther

Vulnerabilities in the residential real estate sectors of the EEA countries / September 2019 Cross-country risk analysis 43
Table 11 Bank risk indicators
Country
RWs for SA HH
exposures (average %)
RWs for SA RRE
exposures (average %)
RWs for IRB HH
exposures (average %)
RWs for IRB RRE
exposures (average %)
Share of RRE exposures under IRB
(%)
Share of HH exposures under IRB
(%)
NPL ratio HH
exposures (%)
NPL ratio RRE
exposures (%)
Total capital ratio (%)
AT 51.50 43.71 22.37 16.58 61.38 83.02 3.46 2.28 17.44
BE 48.80 37.94 14.13 12.95 94.57 95.92 2.31 2.38 19.75
BG 63.75 45.12 - - - - 10.53 9.42 19.36
CY 30.96 37.65 - - - 34.23 50.40 - 15.18
CZ 68.73 - 26.65 21.93 100.00 98.73 1.97 1.22 17.76
DE 53.78 37.96 16.49 13.00 89.39 81.86 1.73 1.11 19.25
DK 40.35 34.30 14.98 15.04 100.00 99.28 4.07 3.17 21.98
EE 66.87 34.68 - - - - 0.99 1.03 32.25
ES 44.43 36.56 17.92 13.52 65.54 71.96 4.30 4.06 15.16
FI - 13.53 - - - - - - 23.86
FR 44.40 36.57 14.93 11.80 81.78 83.80 3.34 3.43 17.63
UK 23.28 38.57 14.47 10.46 89.65 88.25 2.06 1.79 20.94
GR 48.91 44.29 - - - - 46.30 45.07 16.30
HR 56.68 35.80 - - - - 6.12 4.98 20.28
HU 57.28 - - - - - 10.76 10.13 16.63
IE 39.73 55.42 35.15 35.15 81.69 85.61 8.92 9.12 21.75
IS - - - - - -
IT 55.06 37.62 18.72 17.77 84.28 80.14 7.33 4.98 16.16
LT 63.86 - - 3.14 2.77 19.25
LU 45.62 72.04 12.08 10.48 89.29 61.44 1.53 1.47 25.17
LV 59.72 34.74 - - - - 4.01 4.10 21.06
MT 36.15 40.66 - - - - 4.01 3.29 18.84
NL 43.38 43.89 13.45 12.16 96.47 97.32 1.09 0.90 22.30
NO 32.59 47.74 21.70 21.60 93.53 88.78 19.82
PL 63.89 68.78 - - - - 4.02 2.06 17.80
PT 44.93 36.90 21.21 19.13 44.29 79.12 6.00 4.67 14.98
RO 54.50 34.56 - - - - 4.83 3.95 18.53
SE 41.59 34.82 8.19 6.26 96.44 97.23 0.59 0.37 27.36
SI 65.77 36.94 - - - - 3.60 3.37 18.65
SK 63.59 42.36 23.46 15.62 99.67 88.63 3.47 1.81 17.66
Sources: EBA, national authorities in Iceland. Notes: HH exposures refer to household exposures. Indicators are computed using FINREP and COREP series from Q3 2018, except for CY and IE (Q2 2018). The indicators are based on data reported on a consolidated basis, using a sample of 200 banks, so they do not reflect the entire picture of the banking sector at country level. Moreover, the RWs for IRB banks reflect the results of bank-internal models and do not incorporate the macroprudential RW floors or add-ons in the countries which have set such measures. To compute the share of RRE IRB exposures in total RRE exposures, the RRE IRB exposures

Vulnerabilities in the residential real estate sectors of the EEA countries / September 2019 Cross-country risk analysis 44
were considered to be “Secured by immovable property non-SME – with own estimates of a or conversion factors – Total Exposures – Original exposure pre conversion factors” (COREP Template C_08.01.a, row 010, column 020, section 014) and the RRE SA exposures were considered to be “Secured by mortgages on immovable property – Residential property – Total Exposures – Original exposure pre conversion factors” (COREP Template C_07.00.a, row 010, column 010, section 010). The average RW for IRB banks was computed as a ratio between “Secured by immovable property non-SME – with own estimates of LGD or conversion factors – Total Exposures – Risk weighted exposure amount after SME-supporting factor” (COREP Template C_08.01.a, row 010, column 260, section 014) and “Secured by immovable property non-SME – with own estimates of LGD or conversion factors – Total Exposures – Original exposure pre conversion factors” (COREP Template C_08.01.a, row 010, column 020, section 014). The average RW for SA banks was computed as a ratio between “Secured by mortgages on immovable property – Risk weighted exposure amount after SME-supporting factor” (COREP Template C_07.00.a, row 010, column 220, section 010) and “Secured by mortgages on immovable property – Residential property – Total Exposures – Original exposure pre conversion factors” (COREP Template C_07.00.a, row 010, column 010, section 010). Similarly, the COREP templates were used for total household exposure, but are not reported for space considerations. The total capital ratio was computed as the ratio between “Own funds” (COREP Template C_01.00, row 010, column 010) and “Total risk exposure amount” (COREP Template C_02.00, row 010, column 010).
3.4 Developments in the household stretch
Household debt is notably high in many European countries, and positive lending growth may generate further pressure if it surpasses output dynamics. As captured in the scoreboard, household debt as a percentage of income has surpassed 85%36 in 15 of the European countries, and in many countries the risk level is deemed high by cross-country comparison (BE, CY, DK, ES, FI, UK, IE, IS, LU, NL, NO, PT, SE). The ratio of debt to income has exhibited relevant increases in several countries over the past three years (FR, UK, LU, SE, SK; Q3 2018). While some countries exhibit relatively high holdings of financial assets (e.g. BE, IS, NL), this is not the case for all of the countries with high indebtedness (e.g. CY, FI, LU).37 Debt-service-to-income ratios (computed at macro level) indicate slightly lower levels of risk, potentially due to the favourable impact of financing costs (Table 12). However, this indicator must be interpreted with caution, taking into account the potential increase in the cost of servicing debt in future. In a year-on-year comparison, household debt to GDP registered decreases in 2017 (Chart 16), but in most countries this was the result of faster economic growth relative to the expansion of debt. As economic growth may be losing momentum across the EU according to recent forecast adjustments, the dynamics of debt should be carefully monitored. However, some countries have also seen notable downward adjustments of nominal debt levels (CY, IE, LT, RO), coupled with strong nominal GDP increases
Certain household loan characteristics point to increased household vulnerabilities in many of the countries with high levels of indebtedness. High levels of household indebtedness can generate disruptions in the case of a surge in interest rates or a drop in income, especially when coupled with a deterioration of asset values in household balance sheets. Debtors who have taken loans with variable interest rates may therefore be particularly vulnerable. There are many countries with a share of variable interest rate loans of around 90% of new loans (BG, CY, EE, FI, GR, LT, LV, MT, NO). As monetary policies across Europe gradually normalise, household interest rate payments in these jurisdictions are expected to adjust as well. Furthermore, unexpected developments stemming from (geo)political risks may also put upward pressure on the cost of finance. In some countries, the accumulation of debt is also favoured by non-amortising loans 36 ibid. 37 Differences in the national pension systems and statistical conventions related to them, however, distort the comparison of
household financial assets between countries.

Vulnerabilities in the residential real estate sectors of the EEA countries / September 2019 Cross-country risk analysis 45
(Chart 17). Several countries with high levels of household indebtedness have particularly high shares of loans with deferred amortisation (DK, NL, SE). On the other hand, in some jurisdictions, a significant share of households is partially protected by the fixation of interest rates for a considerable duration of the loans (BE, DE, FR38). However, this does not impact the risk of loss of employment, which may result in significant income loss for households and an adjustment in consumption.
Many countries with high household indebtedness also have high levels of home ownership through mortgages, which may amplify negative feedback loops for consumption in the event of negative economic developments. In some countries, significant home ownership rates can lead to a concentration of mortgages in household debt. In these cases, an increase in debt service payments or a decrease in income may cause households to adjust their consumption in order to safeguard an owner-occupied dwelling that is mortgaged. Countries with a high share of ownership through mortgage in the variety of options for tenancy also happen to be those with high levels of household indebtedness, such as IS, NO, NL, SE or DK. On the other hand, in other countries where renting is almost as common as ownership, the indirect effects of real estate developments for households could be weaker (AT, DE).
Medium-term developments related to household indebtedness indicate that some countries have medium or high risk levels connected to the household stretch. The scoreboard indicates that nine countries have high risk levels and four have medium risk levels (Table 12). Further expert-based adjustments result in six countries having high risk (CY, DK, LU, NL, NO, SE) and 13 having medium risk (BE, EE, ES, FI, FR, GR, IE, IS, LI, MT, PT, SK, UK) (Tables 13 and 14).
38 In France, due to stringent lending standards, the unemployment risk among borrowers is low. Furthermore, in case of
unemployment, the replacement rate is one of the highest in Europe.
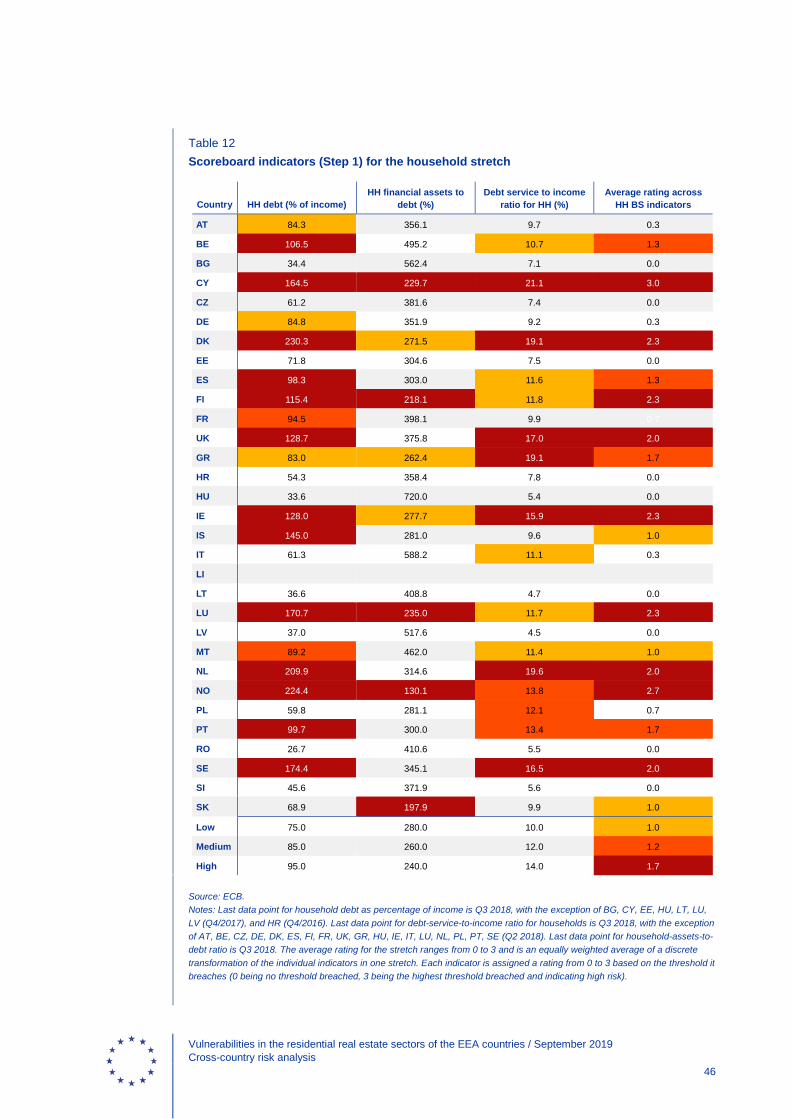
Vulnerabilities in the residential real estate sectors of the EEA countries / September 2019 Cross-country risk analysis 46
Table 12 Scoreboard indicators (Step 1) for the household stretch
Country HH debt (% of income) HH financial assets to
debt (%) Debt service to income
ratio for HH (%) Average rating across
HH BS indicators
AT 84.3 356.1 9.7 0.3
BE 106.5 495.2 10.7 1.3
BG 34.4 562.4 7.1 0.0
CY 164.5 229.7 21.1 3.0
CZ 61.2 381.6 7.4 0.0
DE 84.8 351.9 9.2 0.3
DK 230.3 271.5 19.1 2.3
EE 71.8 304.6 7.5 0.0
ES 98.3 303.0 11.6 1.3
FI 115.4 218.1 11.8 2.3
FR 94.5 398.1 9.9 0.7
UK 128.7 375.8 17.0 2.0
GR 83.0 262.4 19.1 1.7
HR 54.3 358.4 7.8 0.0
HU 33.6 720.0 5.4 0.0
IE 128.0 277.7 15.9 2.3
IS 145.0 281.0 9.6 1.0
IT 61.3 588.2 11.1 0.3
LI
LT 36.6 408.8 4.7 0.0
LU 170.7 235.0 11.7 2.3
LV 37.0 517.6 4.5 0.0
MT 89.2 462.0 11.4 1.0
NL 209.9 314.6 19.6 2.0
NO 224.4 130.1 13.8 2.7
PL 59.8 281.1 12.1 0.7
PT 99.7 300.0 13.4 1.7
RO 26.7 410.6 5.5 0.0
SE 174.4 345.1 16.5 2.0
SI 45.6 371.9 5.6 0.0
SK 68.9 197.9 9.9 1.0
Low 75.0 280.0 10.0 1.0
Medium 85.0 260.0 12.0 1.2
High 95.0 240.0 14.0 1.7
Source: ECB. Notes: Last data point for household debt as percentage of income is Q3 2018, with the exception of BG, CY, EE, HU, LT, LU, LV (Q4/2017), and HR (Q4/2016). Last data point for debt-service-to-income ratio for households is Q3 2018, with the exception of AT, BE, CZ, DE, DK, ES, FI, FR, UK, GR, HU, IE, IT, LU, NL, PL, PT, SE (Q2 2018). Last data point for household-assets-to-debt ratio is Q3 2018. The average rating for the stretch ranges from 0 to 3 and is an equally weighted average of a discrete transformation of the individual indicators in one stretch. Each indicator is assigned a rating from 0 to 3 based on the threshold it breaches (0 being no threshold breached, 3 being the highest threshold breached and indicating high risk).

Vulnerabilities in the residential real estate sectors of the EEA countries / September 2019 Cross-country risk analysis 47
Table 13 Other factors considered (Step 2) in the household stretch
Country
Average rating across HH BS
indicators HH debt, % of income,
(36m change pp)
Share of variable rate loans – new lending
(%) Home ownership ratio
of mortgagors (%) Combined
rating
AT limited -0.6 43.9 24.3 low
BE medium 4.0 14.0 42.9 medium
BG limited -3.1 98.0 2.9 limited
CY high -32.3 94.5 19.8 high
CZ limited 4.3 45.0 20.7 low
DE limited -0.1 12.1 26.2 limited
DK high -18.2 47.2 47.8 high
EE limited 1.0 86.2 20.0 medium
ES medium -9.2 33.9 29.5 medium
FI high 4.1 97.9 42.3 medium
FR limited 5.5 23.1 31.0 medium
UK high 5.0 8.1 35.5 medium
GR medium -10.6 66.7 15.7 medium
HR limited -6.8 6.0 5.8 limited
HU limited -10.7 4.4 16.0 limited
IE high -33.0 29.9 32.9 medium
IS low -40.2 0.0 63.9 medium
IT limited -0.6 32.2 13.6 limited
LI NA high household debt relative to GDP and high level of wealth medium
LT limited 2.0 98.2 11.1 low
LU high 12.6 41.3 43.3 high
LV limited -8.3 96.3 10.8 low
MT low 0.3 58.8 21.4 medium
NL high -10.6 18.11 60.8 high
NO high 93.0 62.3 high
PL limited -0.7 100.0 11.1 limited
PT medium -13.2 80.2 37.3 medium
RO limited -4.6 72.6 1.1 low
SE high 12.1 60.2 52.2 high
SI limited 0.1 46.7 12.0 limited
SK low 14.0 1.9 11.8 medium
Sources: ESRB assessment, ECB, Eurostat, national authorities. Notes: Last data point for household debt as a percentage of income is Q3 2018, with the exception of BG, CY, EE, HU, LT, LU, LV (Q7 2017), and HR (Q4 2016). The last data on variable interest loans are from Q1 2019. For NL, 50% of all mortgage loans are interest-only, and the share of regular amortising loans (linear and annuities) is slightly higher than 25%. 20% of the loans are not amortised regularly, but instead repaid in full at maturity from a savings deposit that is pledged as secondary collateral to the loan. Last data point for home ownership is 2017, with the exception of IS, NO, UK, IE (2016). Household debt to income growth was considered of medium-risk importance if it was materially positive (above 5 pp) but below 10 pp, and of high risk importance if it was in double digits (above 10 pp).

Vulnerabilities in the residential real estate sectors of the EEA countries / September 2019 Cross-country risk analysis 48
Table 14 Reasons for adjustments from Step 1 to Step 2, in the household stretch
Household stretch
Step 1 – scoreboard risk result
Reasons
Step 2 – adjusted
risk result
AT limited indebtedness level and debt composition (variable rate and FX loans) low
BE medium NA medium
BG limited NA limited
CY high NA high
CZ limited indebtedness level in peer country comparison low
DE limited NA limited
DK high NA high
EE limited indebtedness level in peer country comparison medium
ES medium NA medium
FI high indebtedness level in peer country comparison medium
FR limited indebtedness level and positive dynamics medium
UK high indebtedness level medium
GR medium NA medium
HR limited NA limited
HU limited NA limited
IE high indebtedness level and negative dynamics medium
IS low indebtedness level and debt composition (CPI indexed loans) medium
IT limited NA limited
LI NA high household debt relative to GDP and high level of wealth medium
LT limited indebtedness level in peer country comparison low
LU high NA high
LV limited indebtedness level in peer country comparison and debt composition (variable rate loans)
low
MT low indebtedness level medium
NL high NA high
NO high NA high
PL limited NA limited
PT medium NA medium
RO limited debt composition (variable rate loans) low
SE high NA high
SI limited NA limited
SK low indebtedness level in peer country comparison and positive dynamics medium
Source: ESRB assessment.

Vulnerabilities in the residential real estate sectors of the EEA countries / September 2019 Cross-country risk analysis 49
Chart 16 Dynamics of the household debt to GDP ratio
(percentages)
Source: Eurostat. Note: A GDP increase is reflected as a negative contribution to the debt-to-GDP ratio. Last data point is Q3 2018.
Chart 17 Household debt and loan characteristics
(percentages)
Sources: ECB, national authorities’ information collected by the ESRB. Notes: Household debt to income data are for Q3 2018 (BG, CY, EE, HU, LT, LU, LV, SK at Q4 2017 and HR at Q4 2016). Data on variable interest rate loans are from Q1 2019. For NL, 50% of all mortgage loans are interest-only, and the share of regular amortising loans (linear and annuities) is slightly higher than 25%. 20% of the loans are not amortised regularly, but instead repaid in full at maturity from a savings deposit that is pledged as secondary collateral to the loan. The value of the savings deposit at maturity is set to be equal to the loan amount. Although these mortgage types are not regular amortising mortgages, they should not be treated in the same way as interest-only loans. As the net exposure decreases over time, their impact on household vulnerability and bank credit risk differs from that of interest-only loans. Data for share of non-amortising loans are from Q2 2018, with the exception of LU (Q4 2017), AT (Q1 2017) and SE, FR (2007) and data is not available for NO, IS, IT, PL, HR, SI, DE, BG, HU and RO.
-15
-10
-5
0
5
10
15
SK LU SE BG FR BE FI IS NO UK DE IT SI DK EE AT NL HR MT PT ES PL LV GR CZ HU CY IE LT RO
Household debt to GDP growthHousehold debt contributionGDP contribution
0
50
100
150
200
250
DK NO NL SE LU CY IS UK IE FI BE PT ES FR MT DE AT GR EE SK IT CZ PL HR SI LV LT BG HU RO
Household debt to incomeShare of variable interest rate loansShare of non-amortizing loans

Vulnerabilities in the residential real estate sectors of the EEA countries / September 2019 Cross-country risk analysis 50
3.5 Structural factors relevant for the housing sector and mortgage lending
Developments on the housing markets can be impacted by a full range of factors. Some of these factors, which may be considered structural, may be associated with a lower volatility of the RRE markets. Determining the extent to which these factors mitigate or amplify the real estate cycle requires a careful understanding of country-specific circumstances.
Demographic changes and supply-side restrictions may generate vulnerabilities in the RRE sector, and government policies targeting these issues can have either a mitigating or an amplifying effect. High migration flows, in addition to being procyclical, can also be an amplifying factor for housing demand and RRE prices. These effects can be further exacerbated if the housing supply does not catch up with the increase in demand, for instance, due to labour shortages in the construction sector, inefficient processes of issuing permits or zoning restrictions. Governments and relevant authorities can mitigate these risks by addressing the policies which put pressure on the supply side and providing alternative housing options. In addition, generous unemployment benefit schemes can act as a mitigating factor by preventing housing loan defaults in times of financial stress. Nonetheless, most European countries have mortgage tax deduction policies or other home ownership schemes in place that may incentivise household indebtedness. Furthermore, property tax policies tend to skew households’ preferences towards ownership, which can also amplify RRE price increases.
National RRE markets are shaped by household mobility, which can be either cyclical or structural. Demographic changes can have a substantial effect on price evolutions. Households can move either across borders, through international migration, or within a country, through relocation from e.g. rural to urban areas or smaller to bigger cities. The national dispersion of price evolution may be explained by these types of developments in some countries. Population growth relative to housing capacity can exert strong demand pressures. In several European countries, net migration has contributed considerably to overall population growth, which in turn creates additional housing demand (Chart 18). Moreover, countries which have experienced substantial migration are typically among those which also register steady and high housing price growth rates. The degree to which migrating populations intend to settle in countries will contribute to the cyclical effect of this development on housing demand. Housing price volatility may therefore increase if large population movements are only temporary.
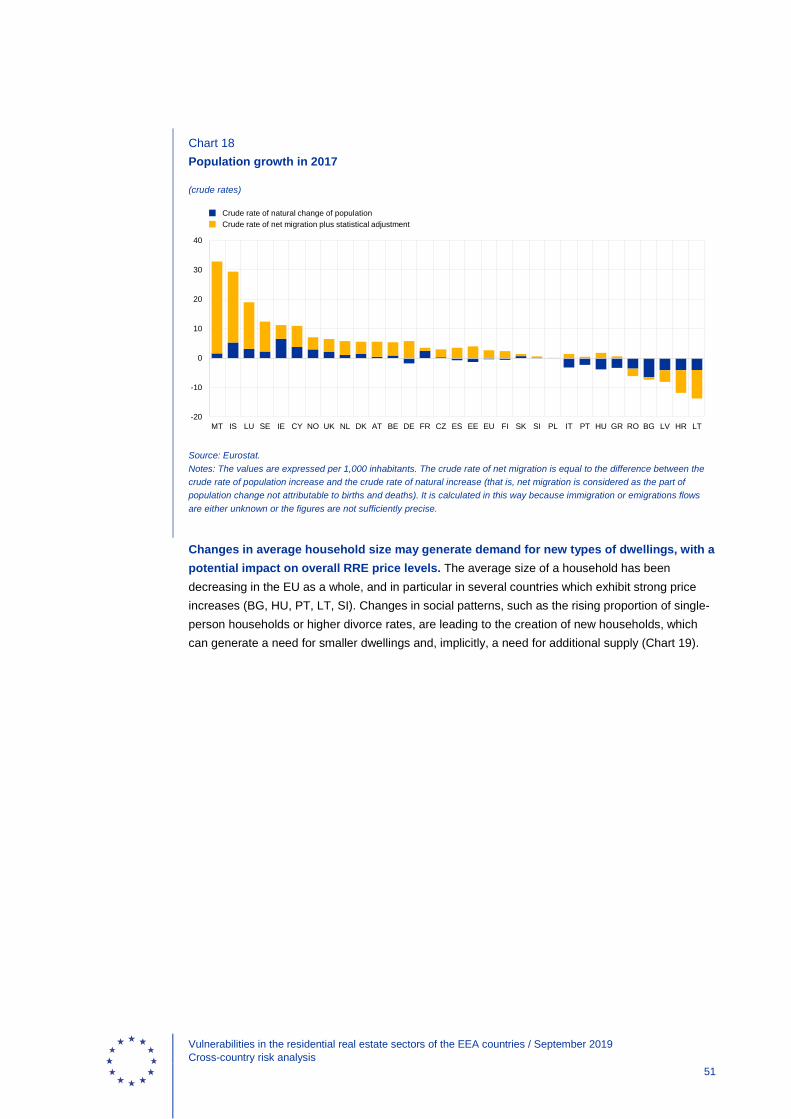
Vulnerabilities in the residential real estate sectors of the EEA countries / September 2019 Cross-country risk analysis 51
Chart 18 Population growth in 2017
(crude rates)
Source: Eurostat. Notes: The values are expressed per 1,000 inhabitants. The crude rate of net migration is equal to the difference between the crude rate of population increase and the crude rate of natural increase (that is, net migration is considered as the part of population change not attributable to births and deaths). It is calculated in this way because immigration or emigrations flows are either unknown or the figures are not sufficiently precise.
Changes in average household size may generate demand for new types of dwellings, with a potential impact on overall RRE price levels. The average size of a household has been decreasing in the EU as a whole, and in particular in several countries which exhibit strong price increases (BG, HU, PT, LT, SI). Changes in social patterns, such as the rising proportion of single-person households or higher divorce rates, are leading to the creation of new households, which can generate a need for smaller dwellings and, implicitly, a need for additional supply (Chart 19).
-20
-10
0
10
20
30
40
MT IS LU SE IE CY NO UK NL DK AT BE DE FR CZ ES EE EU FI SK SI PL IT PT HU GR RO BG LV HR LT
Crude rate of natural change of populationCrude rate of net migration plus statistical adjustment

Vulnerabilities in the residential real estate sectors of the EEA countries / September 2019 Cross-country risk analysis 52
Chart 19 Average household size
Source: Eurostat.
In turn, housing price evolutions can also shape living habits, as low housing affordability can impede young people from living independently. Recent developments show that the share of young Europeans living with their parents has increased in the majority of EU Member States (Chart 20). This is noticeable in countries exhibiting house price overvaluation, while the pattern is slightly different for central and eastern European countries, where the real estate markets are still developing and supply may not be too constrained.
Chart 20 Share of young adults aged 18-34 living with their parents
(percentages)
Source: Eurostat.
2.0
2.1
2.2
2.3
2.4
2.5
2.6
2.7
2.8
2.9
3.0
2008 2009 2010 2011 2012 2013 2014 2015 2016 2017
EUBGLVHULT
SIESPTMTRO
10
20
30
40
50
60
70
80
DK NO SE NL IS FR BE EU IE LU CY RO HU PL ES PT IT GR MT SK HR FI UK EE DE AT LT LV CZ BG SI
20082017

Vulnerabilities in the residential real estate sectors of the EEA countries / September 2019 Cross-country risk analysis 53
Household vulnerabilities associated with indebtedness can be further amplified by high home ownership rates facilitated through mortgage lending. In countries where home ownership rates are high and these have been mostly facilitated through mortgage lending (Chart 21), adjustments in collateral might generate additional risks. This also depends, of course, on national specificities regarding the strength of the collateral channel. In a country such as FR, the home ownership rate is not negligible, but given the guarantee scheme in place39, the collateral channel is rather weak. In addition, European countries which record the highest rates of home ownership financed through a mortgage or housing loan also tend to have generous social benefit schemes, thereby reducing the likelihood of default in times of stress. Households which take out a mortgage tend to be young, educated and have higher income levels, which can further mitigate the risk of default. Nonetheless, owners with a mortgage loan or another type of loan in central and eastern European countries still bear a much larger housing cost burden than their counterparts from northern and western Europe (Chart 22).
Chart 21 Population by tenure choice
Source: Eurostat. Note: In certain countries a high share of rental market is regulated (DK, NL).
39 In France, housing loans are typically collateralised through a guarantee scheme. The guarantees are issued by private
entities, which are either credit institutions (owned by the biggest banks) or insurance companies (tied with banks as well). The debtor does not choose the type of collateral to pledge. Instead, debtors with good credit profiles are selected to be issued a guarantee. The selected debtors pay an initial fee for the guarantee. In case of default, the bank receives the guarantee from the fund and the fund should calculate the recovery of the loan. In theory, if no amicable solution can be found with the debtor, the guarantor can register a mortgage by court order and the property may be sold to repay the loan.
0%
10%
20%
30%
40%
50%
60%
70%
80%
90%
100%
IS NO NL SE DK BE LU FI PT UK IE FR ES DE AT MT CZ EE CY SK HU GR IT SI LT PL LV HR BG RO
Owner, with mortgage or loanOwner, no outstanding mortgage or housing loan
Tenant, rent at market priceTenant, rent at reduced price or free

Vulnerabilities in the residential real estate sectors of the EEA countries / September 2019 Cross-country risk analysis 54
Chart 22 Ownership rates and housing cost burden for owners with mortgage or another type of loan
(percentages)
Source: Eurostat. Notes: The chart shows the ownership rate (y axis) and the proportion of owners with a mortgage or loan (x axis) as a percentage of the total population. The size of a bubble indicates the share of owners with a mortgage or loan having housing cost burden higher than 40% of disposable income.
Fiscal measures such as tax advantages for mortgage lending or property tax relief may exacerbate housing demand. A key feature of many national tax systems is direct and indirect housing subsidies – the latter most commonly in the form of mortgage interest deductibility. Tax deductibility reduces the net cost of servicing debt, and gives households the possibility and the incentive to borrow more. Experience points to a moderate effect of tax deductibility on RRE price volatility, possibly as a result of increasing post-tax returns on (speculative) housing investment40. Furthermore, it tends to shift preferences towards home ownership and encourage household indebtedness, which is in turn related to higher RRE prices. For instance, Croatia recorded rapid RRE price growth (7.6%) in 2017 following the introduction by the government of a housing loan subsidy in the same year. Conversely, by eliminating tax incentives for primary residence in 2013 and introducing subsidies for tenants, Spain observed a shift in preferences towards renting, reflected in the larger housing rent growth (8.9% in 2017) compared with house price growth. Overall, about a third of EU countries have some level of mortgage tax relief for owner-occupiers, with the most generous arrangements available in NL and SE (Table 15).
40 Van den Noord, P. (2005), “Tax incentives and house price volatility in the euro area: theory and evidence”, Économie
Internationale, No 101, pp. 29-45. Catte, P., Girouard, N., Price, R. and André, C. (2004), “Housing markets, wealth and the business cycle”, OECD Economics Department Working Papers, No 394, December.
BE
BGCZ
DK
DE
EE
IEGRES
FR
HR
ITCY
LV
LT
LU
HU MT
NL
AT
PL
PT
RO
SI
SK
FI SE
UK
ISNO
40
50
60
70
80
90
100
110
-10 0 10 20 30 40 50 60 70 80
Ow
ners
hip
rate
Owner with mortgage or loan

Vulnerabilities in the residential real estate sectors of the EEA countries / September 2019 Cross-country risk analysis 55
Table 15 Mortgage tax relief in European countries
Mortgage tax relief Countries
None AT, CY, DE, ES, GR, HR, HU, IE, LT, LV, MT, PL, PT, RO, SI, UK
Bounded and Limited BG, CZ, EE, FI, IS, IT, LU, NO, SK
Bounded BE, DK
High or Unbounded NL, SE
Source: ESRB.
Property tax can act as an amplifying or mitigating factor of housing price dynamics, while government dependence on this type of revenue can shape policymaking in this area. The UK has the largest dependency on property taxes across the EU, followed by FR (12.7% and 10.3% of total tax revenue, respectively), while EE collects less than 1% of its total tax revenue from property-related taxes. Generally, central eastern European countries rely less on property taxation than their western and southern European counterparts (Chart 23). Overall, tax revenue from property taxation has remained quite stable over the last five years (Chart 24), with strong increases in GR, BE, IT and LU. However, when interpreting these figures, it should be noted that the share of property taxes in total tax revenues may be inversely affected by property price developments and the dynamics of other tax revenues.41 In DK, in 2001, authorities abolished the housing taxation system that linked the payable tax amount to the current market value of a dwelling, which led to strong RRE price growth and overvaluation. A new law will re-establish this type of property tax from 2021, which is expected to have a dampening effect on prices that have departed from fundamentals, especially in prime areas. The effect of the 2007 land tax reform in DK was also fully capitalised into house prices42.
41 In Iceland, corporate tax revenue was very low in 2011 following the 2008 crisis but has increased significantly during the
economic boom of the last few years. Furthermore, the main property tax in Iceland is currently strongly affected by increases in house prices.
42 Høj, A. K., Jørgensen, M. R. and Schou, P. (2018), “Land Tax Changes and Full Capitalisation”, Fiscal Studies. The Journal of Applied Public Economics, Institute for Fiscal Studies, June, pp. 365-380.

Vulnerabilities in the residential real estate sectors of the EEA countries / September 2019 Cross-country risk analysis 56
Chart 23 Property taxes by country
(percentage of total taxation)
Source: European Commission.
Chart 24 Property taxes in EU
(percentage of total taxation)
Source: European Commission.
Several European countries target the supply side of the RRE market to either deal with increasing demand or incentivise housing construction. In order to tackle its booming RRE market and meet supply shortages, Ireland has implemented the “Rebuilding Ireland” plan with measures supporting infrastructure, opening up additional sites and speeding up planning processes. It also introduced “Rent Pressure Zones” in December 2016 to limit the growth of rental values. Among other examples, Hungary has applied a preferential VAT rate of 5% for new dwellings (compared with regular VAT of 27%) from 2016 until the end of 2019. The policy has boosted construction activity, with most developers rushing to finalise their projects by 2020.
0
2
4
6
8
10
12
14
UK FR GR ES BE IT PL PT DK LU IS IE NL LV MT FI RO CY BU NO DE SE HU AT SI CZ LT SK HR EE
Recurrent taxes on immovable propertyOther taxes on property2011
0.0
0.5
1.0
1.5
2.0
2.5
3.0
3.5
4.0
4.5
2004 2005 2006 2007 2008 2009 2010 2011 2012 2013 2014 2015 2016
Recurrent taxes EU28 Other taxes EU28

Vulnerabilities in the residential real estate sectors of the EEA countries / September 2019 Country analysis of risks and policies for a subset of ESRB Member States 57
While the cross-country analysis gives an overview of vulnerabilities by stretches, the country analysis is a country-by-country evaluation that also accounts for interactions between the identified vulnerabilities and their implications for financial stability. The cross-country risk analysis investigates vulnerabilities for each stretch, drawing on all the available information and the particularities of each risk dimension. The country analysis is motivated by the need to better understand country specificities and the interaction of risks for countries with certain vulnerabilities.
A country was selected for the country analysis if it had a high risk level in at least one of the three stretches or a medium risk level in at least two of the stretches in the cross-country analysis. The list of selected countries for the country analysis is the following: AT*, BE*, CZ, DE, DK*, EE, FI*, FR, IE, IS, LU*, MT, NL*, NO, PT, SE*, SI, SK and UK*43. The countries which received an ESRB warning in 2016 also benefited from a comparative analysis of risks and policies44.
The policy analysis is performed as part of the country analysis only for countries where the identified risks are more pronounced. The policy assessment departs from the presence of certain risks, which can vary in nature and intensity. In particular, the appropriateness and sufficiency of the macroprudential policy mix is measured through the impact it has on mitigating the identified financial stability risks. Focusing on countries with a certain level of risk allows a more resource-efficient analysis.
4.1 Interaction between vulnerabilities
The risk assessment was extended to account for the interaction of vulnerabilities in order to better capture the potential implications of RRE risks for financial stability. Different combinations of vulnerabilities may indicate different types of risk to financial stability depending on the transmission channels. The interaction between vulnerabilities in the stretches analysed in the cross-country analysis may indicate two main types of risk:
• “direct risks” related to potential losses of lenders from mortgage portfolios in the event of negative economic developments;
• “indirect risks” related to potential adjustments in household consumption in the event of negative economic developments, with further consequences for financial stability and the real
43 Countries marked with * received a warning from the ESRB in 2016. Austria (Warning ESRB/2016/05); Belgium (Warning
ESRB/2016/06); Denmark (Warning ESRB/2016/07); Finland (Warning ESRB/2016/08); Luxembourg (Warning ESRB/2016/09); the Netherlands (Warning ESRB/2016/10); Sweden (Warning ESRB/2016/11); and the United Kingdom (Warning ESRB/2016/12).
44 ESRB (2019, forthcoming), Follow-up report on countries which received ESRB warnings in 2016 for medium-term vulnerabilities in the residential real estate sector.
4 Country analysis of risks and policies for a subset of ESRB Member States

Vulnerabilities in the residential real estate sectors of the EEA countries / September 2019 Country analysis of risks and policies for a subset of ESRB Member States 58
economy. These vulnerabilities do not necessarily materialise upon the default of housing loans.
Moreover, vulnerabilities are categorised as either accumulated (stock vulnerabilities) or building up in recent times (flow vulnerabilities) (Table 16).
Both stock and flow vulnerabilities may be driven by cyclical and structural factors, depending on the time profile and intensity of the factors. Cyclical factors with the potential to generate flow vulnerabilities may include a period of economic expansion, which can lead to house price overvaluation and increasing household indebtedness. Examples of structural factors with the same effect include constraints on new RRE construction due to temporary or recent legal obstacles to the issuance of building permits. The same factors – if long-lasting – may then represent sources of stock vulnerabilities. Other structural sources of stock vulnerabilities may include rental market regulation, which can create shortages on the owner-occupier market and result in an overvaluation of house prices.
Many of the countries selected for the individual country analysis have been experiencing increasing (flow) vulnerabilities with a direct risk to financial stability, while in others these (stock) vulnerabilities may have already accumulated. In many countries, the overvaluation of house prices or their unsustainable dynamics, coupled with growth in mortgage lending or eased lending standards, may lead to an accumulation of vulnerabilities that can result in credit losses for mortgage portfolios. In some of the countries that exhibit house price overvaluation, relatively high household indebtedness and signs of eased lending standards for existing loans, the vulnerabilities may have already accumulated to relatively high levels.
Countries selected for the individual analysis also face increasing (flow) vulnerabilities with an indirect risk to financial stability, while for some these (stock) vulnerabilities may have already accumulated. In many countries, high household indebtedness coupled with eased lending standards for outstanding loans (especially those related to household creditworthiness) may imply reduced household consumption vulnerabilities in the event of negative economic or financial shocks and housing-related developments. There are also many countries in which household indebtedness is relatively low but increasing, accompanied by an easing of lending standards. In these countries, the dynamics of these vulnerabilities should be monitored.
As part of the country analysis, the overall risk assessment was assigned reflecting mostly the accumulated (stock) vulnerabilities. Countries that are in further expansionary phases of the housing cycle tend to exhibit accumulated RRE vulnerabilities (stock vulnerabilities), which may be further increasing (flow vulnerabilities). For this reason, these countries were mostly considered as high- or medium-risk countries with regard to RRE-related vulnerabilities. Some of the countries that are in earlier phases of the housing cycle exhibit rapidly growing vulnerabilities (flow vulnerabilities), even though the level of their vulnerabilities (stock vulnerabilities) typically does not represent an immediate threat to financial stability. For this reason, they are considered as medium-risk countries in the analysis. However, unlike for the overall risk assessment, for the assessment of macroprudential policies, the stock and flow vulnerabilities were of the same importance.

Vulnerabilities in the residential real estate sectors of the EEA countries / September 2019 Country analysis of risks and policies for a subset of ESRB Member States 59
Most countries are identified as having a medium level of RRE-related risks, several countries are identified as high risk countries and one country is deemed as low risk. 5 countries were identified with high stock vulnerabilities, coupled with high or medium flow vulnerabilities (DK, LU, NL, NO, SE). These countries were assigned the “high” overall risk assessment. SI was identified with low stock vulnerabilities and medium flow vulnerabilities, which implied that it was assigned an overall low risk. The rest of the countries were identified as having medium- or low-level stock vulnerabilities, but coupled with high or medium flow vulnerabilities. These countries were assigned the “medium” overall risk assessment (AT, BE, CZ, DE, EE, FI, FR, IE, IS, MT, PT, SK, UK) (Table 16).

Vulnerabilities in the residential real estate sectors of the EEA countries / September 2019 Country analysis of risks and policies for a subset of ESRB Member States 60
Table 16 Assessment of interactions between vulnerabilities
Country Cyclical position
Evaluation of risks Description of identified stock and flow
vulnerabilities (with potential direct and indirect effects, relative to financial stability)
Overall risk assessment
Stock vulnerabilities
Flow vulnerabilities
AT Firm expansion
Medium High Significant share of new loans with high LTV values, coupled with house price overvaluation and elevated mortgage credit growth may generate risky loans with a potential direct impact on banks' balance sheets. Stock vulnerabilities stem from a high share of existing loans with variable interest rates but these are limited by a contained level of household indebtedness and the importance of RRE exposures for the real economy.
Medium
BE Mature expansion
Medium High Significant share of existing and new loans with high LTV values, coupled with signs of house price overvaluation and elevated mortgage credit growth may lead to an accumulation of risky loans, with potential direct impact on banks balance sheets. High and increasing household indebtedness may amplify these direct risks and be a source of potential indirect risks.
Medium
CZ Firm expansion
Medium High Significant share of new loans with high LTV, DTI and DSTI values, coupled with house price overvaluation, strong house price increases and high mortgage credit growth may generate risky loans with a potential direct impact on banks' balance sheets. Household indebtedness is also growing, leading to increasing indirect risks.
Medium
DE Firm expansion
Medium High Provision of new loans in an environment of overvalued house prices as well as uncertainties regarding lending standards due to significant data gaps are sources of flow vulnerabilities. To facilitate better analysis, data gaps related to the lending standards of new loans should be closed. Moreover, vulnerabilites may have already accumulated during the build-up of the house price overvaluation.
Medium
DK Mature expansion
High Medium Stock vulnerabilities stem from high household indebtedness, combined with a large share of loans with deferred amortisation and a moderate share of loans with variable interest rate, with potential indirect effects on financial stability. Despite muted credit growth, flow vulnerabilities relate to the significant share of non-amortisaing loans.
High
EE Firm expansion
Medium Medium Potentially reinforcing dynamics of housing price growth and elevated mortgage lending growth which may generate risky loans if lending standards deteriorate, with a potential direct impact on banks' balance sheets. Household indebtedness is high in peer group comparison and the share of variable interest rate loans is high, with potential indirect effects on financial stability.
Medium
FI Mature expansion
Medium Medium Elevated household indebtedness, high growth of indirect real estate lending to households (through housing company loans), easing of lending standards of new loans and interconnectedness with the Nordic banking system may be a source of both direct and indirect risks with a potential impact on banks' balance sheets and the real economy.
Medium
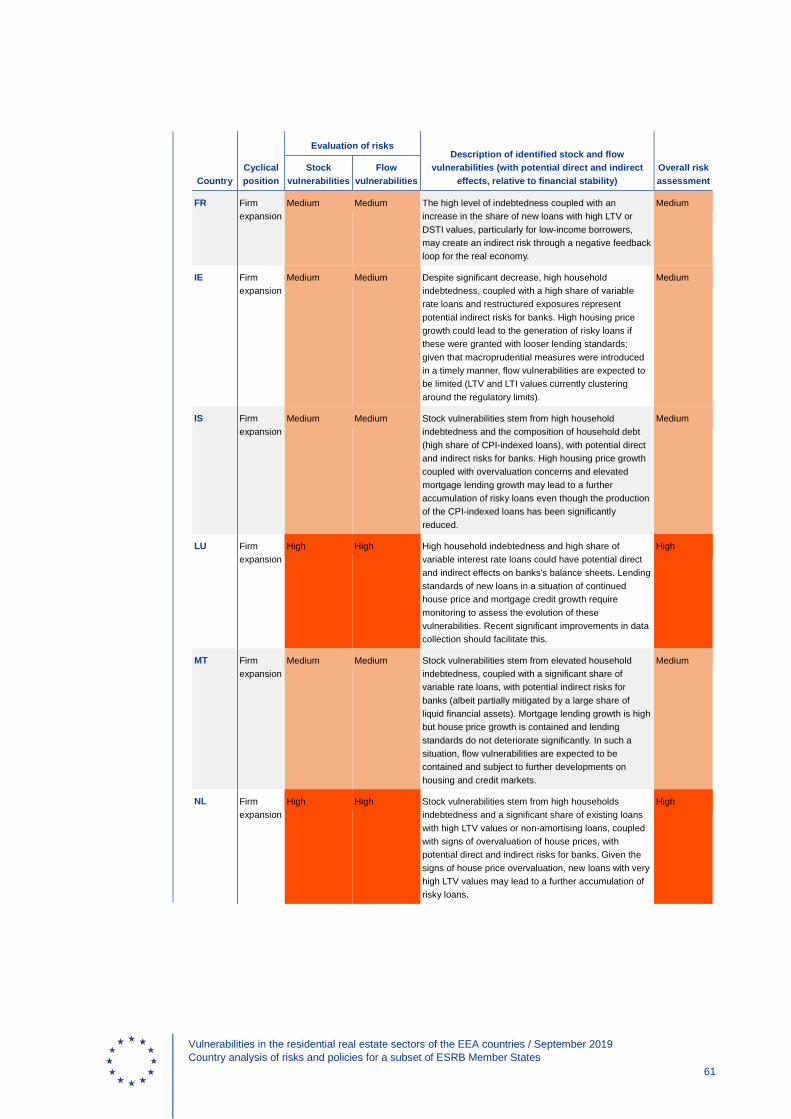
Vulnerabilities in the residential real estate sectors of the EEA countries / September 2019 Country analysis of risks and policies for a subset of ESRB Member States 61
Country Cyclical position
Evaluation of risks Description of identified stock and flow
vulnerabilities (with potential direct and indirect effects, relative to financial stability)
Overall risk assessment
Stock vulnerabilities
Flow vulnerabilities
FR Firm expansion
Medium Medium The high level of indebtedness coupled with an increase in the share of new loans with high LTV or DSTI values, particularly for low-income borrowers, may create an indirect risk through a negative feedback loop for the real economy.
Medium
IE Firm expansion
Medium Medium Despite significant decrease, high household indebtedness, coupled with a high share of variable rate loans and restructured exposures represent potential indirect risks for banks. High housing price growth could lead to the generation of risky loans if these were granted with looser lending standards; given that macroprudential measures were introduced in a timely manner, flow vulnerabilities are expected to be limited (LTV and LTI values currently clustering around the regulatory limits).
Medium
IS Firm expansion
Medium Medium Stock vulnerabilities stem from high household indebtedness and the composition of household debt (high share of CPI-indexed loans), with potential direct and indirect risks for banks. High housing price growth coupled with overvaluation concerns and elevated mortgage lending growth may lead to a further accumulation of risky loans even though the production of the CPI-indexed loans has been significantly reduced.
Medium
LU Firm expansion
High High High household indebtedness and high share of variable interest rate loans could have potential direct and indirect effects on banks's balance sheets. Lending standards of new loans in a situation of continued house price and mortgage credit growth require monitoring to assess the evolution of these vulnerabilities. Recent significant improvements in data collection should facilitate this.
High
MT Firm expansion
Medium Medium Stock vulnerabilities stem from elevated household indebtedness, coupled with a significant share of variable rate loans, with potential indirect risks for banks (albeit partially mitigated by a large share of liquid financial assets). Mortgage lending growth is high but house price growth is contained and lending standards do not deteriorate significantly. In such a situation, flow vulnerabilities are expected to be contained and subject to further developments on housing and credit markets.
Medium
NL Firm expansion
High High Stock vulnerabilities stem from high households indebtedness and a significant share of existing loans with high LTV values or non-amortising loans, coupled with signs of overvaluation of house prices, with potential direct and indirect risks for banks. Given the signs of house price overvaluation, new loans with very high LTV values may lead to a further accumulation of risky loans.
High
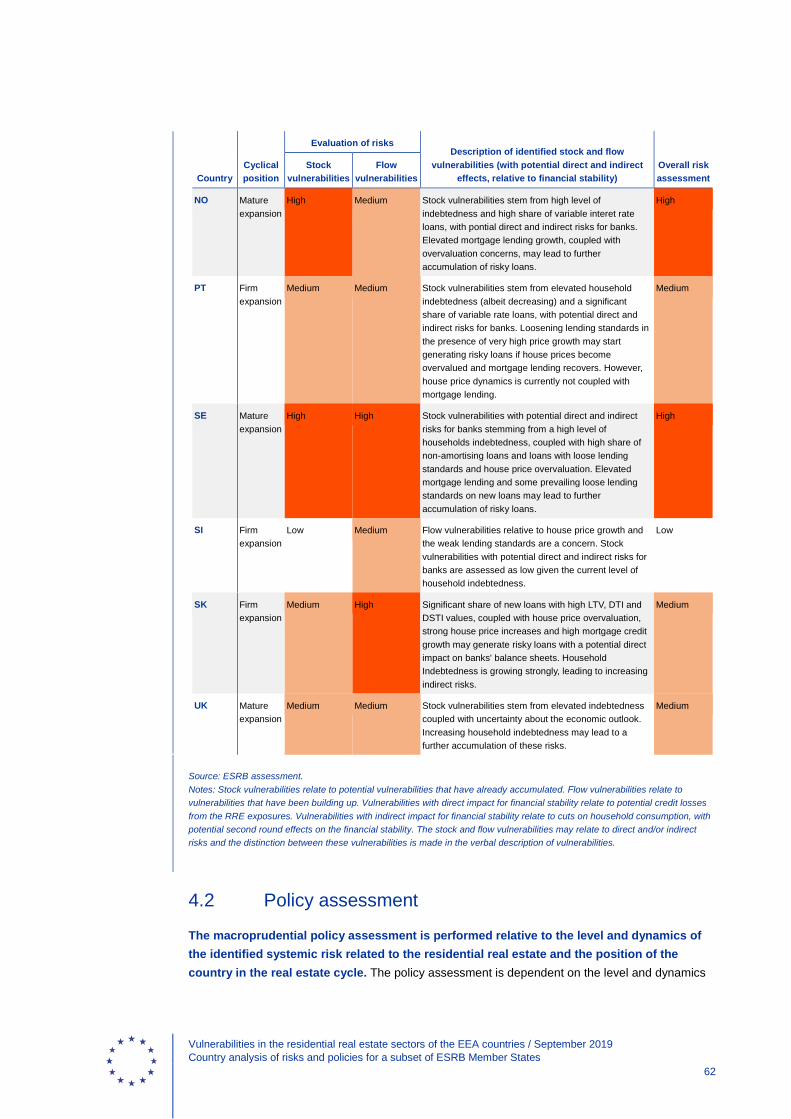
Vulnerabilities in the residential real estate sectors of the EEA countries / September 2019 Country analysis of risks and policies for a subset of ESRB Member States 62
Country Cyclical position
Evaluation of risks Description of identified stock and flow
vulnerabilities (with potential direct and indirect effects, relative to financial stability)
Overall risk assessment
Stock vulnerabilities
Flow vulnerabilities
NO Mature expansion
High Medium Stock vulnerabilities stem from high level of indebtedness and high share of variable interet rate loans, with pontial direct and indirect risks for banks. Elevated mortgage lending growth, coupled with overvaluation concerns, may lead to further accumulation of risky loans.
High
PT Firm expansion
Medium Medium Stock vulnerabilities stem from elevated household indebtedness (albeit decreasing) and a significant share of variable rate loans, with potential direct and indirect risks for banks. Loosening lending standards in the presence of very high price growth may start generating risky loans if house prices become overvalued and mortgage lending recovers. However, house price dynamics is currently not coupled with mortgage lending.
Medium
SE Mature expansion
High High Stock vulnerabilities with potential direct and indirect risks for banks stemming from a high level of households indebtedness, coupled with high share of non-amortising loans and loans with loose lending standards and house price overvaluation. Elevated mortgage lending and some prevailing loose lending standards on new loans may lead to further accumulation of risky loans.
High
SI Firm expansion
Low Medium Flow vulnerabilities relative to house price growth and the weak lending standards are a concern. Stock vulnerabilities with potential direct and indirect risks for banks are assessed as low given the current level of household indebtedness.
Low
SK Firm expansion
Medium High Significant share of new loans with high LTV, DTI and DSTI values, coupled with house price overvaluation, strong house price increases and high mortgage credit growth may generate risky loans with a potential direct impact on banks' balance sheets. Household Indebtedness is growing strongly, leading to increasing indirect risks.
Medium
UK Mature expansion
Medium Medium Stock vulnerabilities stem from elevated indebtedness coupled with uncertainty about the economic outlook. Increasing household indebtedness may lead to a further accumulation of these risks.
Medium
Source: ESRB assessment. Notes: Stock vulnerabilities relate to potential vulnerabilities that have already accumulated. Flow vulnerabilities relate to vulnerabilities that have been building up. Vulnerabilities with direct impact for financial stability relate to potential credit losses from the RRE exposures. Vulnerabilities with indirect impact for financial stability relate to cuts on household consumption, with potential second round effects on the financial stability. The stock and flow vulnerabilities may relate to direct and/or indirect risks and the distinction between these vulnerabilities is made in the verbal description of vulnerabilities.
4.2 Policy assessment
The macroprudential policy assessment is performed relative to the level and dynamics of the identified systemic risk related to the residential real estate and the position of the country in the real estate cycle. The policy assessment is dependent on the level and dynamics

Vulnerabilities in the residential real estate sectors of the EEA countries / September 2019 Country analysis of risks and policies for a subset of ESRB Member States 63
of systemic risk stemming from the RRE sector as well as the position of the country in the real estate cycle. It includes an assessment of policy appropriateness and policy sufficiency. Policy appropriateness, i.e. activated macroprudential policy instruments, is assessed in relation to the identified systemic risks and their past and expected dynamics going forward. Policy sufficiency is conditioned on policy appropriateness and is based on the intensity of identified systemic risk, also taking into account the expected costs and benefits related to the implementation of macroprudential measures. Thus, macroprudential policy may not be entirely sufficient also because the net benefit of further action in this area may no longer render it a first best option in achieving the full mitigation of systemic risk and other policy areas may need to intervene. It is important to note that although the scope of macroprudential policy is systemic risk, it has its limits in containing risks that come from areas beyond the financial sector, e.g. through households’ incentives or limited housing supply. In such cases, other policies are needed to complement macroprudential policies in order to mitigate the sources of systemic risk efficiently.
The policy assessment is performed over the medium-term, similarly to the risk assessment. The risks are identified over a medium-term, so macroprudential policy should be able to mitigate them over this horizon in order to be assessed as fully appropriate and fully sufficient. Situations may arise when national authorities may not have at their disposal instruments that could contain identified systemic risks. In such situations the policy may be considered not entirely appropriate.
A country is assessed as having a macroprudential policy that is fully appropriate and fully sufficient if it has implemented a set of macroprudential measures that are expected to suitably address and mitigate the identified systemic risk related to residential real estate to a large extent without generating more costs than benefits for the economy.
4.2.1 Policy appropriateness
Macroprudential policy appropriateness is evaluated depending on the nature and level of the identified vulnerabilities as well as the position of the country in the real estate cycle. The presence of accumulated vulnerabilities or a positioning in the mature phase of real estate cycle expansion may indicate the need for capital-based instruments. On the other hand, if vulnerabilities have only started building up for recent exposures, borrower-based measures (BBMs) are typically considered more appropriate. However, there is a fine line between the two policy options for countries, which exhibit a combination of several vulnerabilities, and thus the appropriate policy mix should not be designed mechanically. Furthermore, a comprehensive macroprudential response is generally more effective in addressing systemic risks and limiting leakages. For instance, in the case of accumulated stock vulnerabilities due to high household indebtedness, income-based measures continue to be considered as relevant to ensure the long-term sustainability of household debt and to prevent the further build-up of stock vulnerabilities.

Vulnerabilities in the residential real estate sectors of the EEA countries / September 2019 Country analysis of risks and policies for a subset of ESRB Member States 64
Figure 2 Determining policy appropriateness
Source: ESRB assessment.
Most analysed countries have implemented both capital- and borrower-based macroprudential instruments in line with their macroprudential policy objectives and their positions in the real estate cycle. By applying macroprudential instruments, national authorities aim at ensuring borrowers’ and/or lenders’ resilience. Some authorities also cite the goal of preventing reinforcing dynamics between house prices and mortgage lending, which can lead to deterioration in the quality of loans, as motivation for their policy measures. Countries that are in a mature real estate cycle phase have aimed to ensure that they have enough resilience, while countries where the real estate cycle is still trending up have been more active in also adopting borrower-based instruments. In order to ensure that banks are resilient to shocks stemming from real estate vulnerabilities, countries have typically implemented measures related to risk weights (BE, FI, LU, MT, NO, SE), or broader buffers such as the countercyclical capital buffer (CCyB) (CZ, DK, FR, IE, IS, LU, SK, SE, NO, UK) or systemic risk buffer (SyRB) (EE, FI, IS). Vulnerabilities associated with the current dynamics in house prices and credit are addressed by borrower based measures, most commonly in the form of LTV caps (AT, CZ, DK, EE, FI, IE, IS, MT, NL, PT, NO, SE, SI and SK) and DSTI caps (AT, CZ, EE, MT, NL, PT, SI, SK).
Capital measures are deemed particularly relevant for countries with accumulated vulnerabilities. Identified stock vulnerabilities warrant a strengthening of banks’ resilience. In the event of a downturn in the housing market or a macroeconomic shock that would affect households’ ability to repay debt, banks could incur substantial losses from their real estate-related exposures, as well as through second-round effects (real estate or other). In countries where the use of internal ratings-based (IRB) approaches is significant among banks, and which have a history of low level of defaults on real estate exposures, the risk weight floor is a fully appropriate measure that works as sectoral buffer (FI, LU, NO, SE). Belgium is the only country that has implemented a dynamic
Vulnerabilities identified
All vulnerabilities(stock, flow or both)
addressed
Instruments sufficiently enforceable,
leakages and circumvention
minimised
Macroprudential fully policy appropriate
Instruments not sufficiently enforceable,
or leakages and circumvention
not minimised
Macroprudential policy partially appropriate
NAs have not implemented sufficienly enforceable measures
NAs do not have powers to implement sufficienly enforceable measures
Some vulnerabilities (either stock or flow)
addressed
Macroprudential policy partially appropriate
No vulnerabilities(neither stock nor flow)
addressedMacroprudential policy
not appropriate

Vulnerabilities in the residential real estate sectors of the EEA countries / September 2019 Country analysis of risks and policies for a subset of ESRB Member States 65
risk weight measure intended to also have countercyclical effects. Norway is the only country that uses an LGD floor combined with PD requirements instead of a risk weight (RW) floor. Given that sometimes it is difficult to disentangle broader vulnerabilities related to cyclical developments from those stemming directly from the RRE sector, authorities have also chosen to activate or recalibrate buffers such as the CCyB and SyRB in order to enhance their banks’ resilience against the entire set of potential vulnerabilities (CZ, FI, FR, LU, SE, NO, SK). These were therefore considered appropriate in addressing stock vulnerabilities, alongside sectoral capital requirements. The use of the CCyB to address real estate vulnerabilities can nevertheless have unwanted consequences. Being a broad measure, the CCyB may introduce selectivity in lending due to different risk weights on distinct asset classes, so more targeted capital instruments should typically be considered when discussing RRE vulnerabilities.
Various combinations of borrower-based measures are considered appropriate to tackle potential financial stability risks related to new loans. The LTV cap is used as a backstop to excessive lending for house purchases and is particularly relevant in countries where house price overvaluation is emerging or is already present. It has been used both as a cyclical (CZ, IE) and a structural instrument (SE, PT, SI). Countries with high levels of household indebtedness (IE, UK) and a large share of non-amortising loans (DK, NO, SE) have typically opted for various measures related to debt-to-income (DTI)/loan-to-income (LTI) limits, while countries where there is a concern about the debt servicing capacity, given a full amortisation of loans, have implemented DSTI caps combined with either stress testing of borrowers’ ability to service the debt or maturity limits (AT, EE, MT, NL, PT). Other countries have preferred to use a mix of DTI and DSTI limits (SK) to ensure an effective policy mix.
The form of borrower-based measures varies across countries, depending on the level of vulnerabilities as assessed by national authorities as well as the availability of legally binding instruments. While in most of the countries BBMs have been implemented through legally binding acts, in others they have been introduced as recommendations or through communication tools (AT, CZ, PT, SI). In Austria, Slovenia and Portugal, the measures have been introduced through a recommendation, even though the national authorities have powers to implement these measures through legally binding acts. In all these cases, the decision to introduce the measures through non-legally binding acts was made with regard to the level of the risks which were assessed to be growing but not high (in Austria, this in fact represents a condition for the legally binding measures to be used).
In some countries, national authorities lack the powers to set legally binding borrower-based measures that would be appropriate with respect to the current identified vulnerabilities or their development over the medium term (Figure 2). In some countries, the assessment of vulnerabilities would warrant the use of highly enforceable BBMs as of now (LU) or potentially in future if the vulnerabilities keep increasing (CZ, DE, FI). National authorities in these countries either lack the powers over legally binding BBMs completely (CZ, LU) or they have powers over some of the measures only (DE, FI). In these countries, national authorities have opted or may still opt for non-legally binding measures. However, while these soft measures may be suitable initially when the vulnerabilities start to emerge, they may not be sufficient in further phases of the housing cycle, when the measures may suddenly stop being complied with, e.g. due to competition among credit providers.

Vulnerabilities in the residential real estate sectors of the EEA countries / September 2019 Country analysis of risks and policies for a subset of ESRB Member States 66
In some countries, the powers of national authorities to implement legally binding borrower-based measures should be extended or consolidated to ensure that appropriate policies can be implemented to mitigate potential risks, including beyond the horizon of this analysis. The powers of national authorities to set legally binding BBMs may also be limited to certain instruments in some of the countries in which the policy is deemed appropriate in the analysis. In all countries, however, the national authorities should have a comprehensive toolkit of legally binding BBMs so that they are able to react efficiently if the intensity of vulnerabilities increases at any moment, or if the nature of the vulnerabilities changes. As a minimum, the toolkit should include an LTV instrument, at least one income-related instrument (DTI or DSTI) and requirements that would minimise the potential for circumvention of the other measures (maturity limits and amortisation requirement). To avoid the circumvention of measures, national authorities in all countries should be able to target the total indebtedness of borrowers (including top-up loans) and credit by any type of credit provider. In some other countries, the macroprudential authority has the power to decide on the BBMs and recommend another institution to implement these measures, but the latter may decide not to do so (NL). From a forward-looking perspective, it would be advisable for the macroprudential authorities in these countries to have more direct powers over legally binding BBMs so that they are able to react in a flexible way to new sources of systemic risk.
When assessing the use of borrower-based measures, the enforceability of the measures in relation to the intensity of vulnerabilities over the medium-term is also taken into account (Figure 2). In countries, in which the flow vulnerabilities are deemed as pronounced, a high degree of enforceability of the borrower-based measures would be required in order for the policy to be assessed as fully appropriate. On the other hand, for countries with less pronounced flow vulnerabilities, “softer” measures, such as recommendations by national authorities, might still be considered fully appropriate. In case of non-legally binding borrower-based measures, institutional frameworks behind these measures were analysed in order to assess the enforceability of these measures. Moreover, permanent monitoring of compliance with these measures by the national authorities and feedback to the supervised institutions, were considered as examples of an enforceability mechanism of these measures. If there is indication that a recommendation is not complied with, then the implementation of legally-binding instruments should be considered more appropriate. Finally, in countries in which the flow vulnerabilities are expected to persist at a high intensity or further accelerate on the horizon of this analysis, it would be required for a fully appropriate policy that the national authorities hold powers to set highly enforceable borrower based measures which they can activate at their discretion.
Overall, the implementation of legally binding borrower-based measures is heterogeneous and highly impacted by the institutional framework in each country. In the EU, 20 countries have at least some BBMs available in their toolkit, four Member States currently do not have any such measures in their macroprudential toolkit (GR, LU, CZ, HR) and in the case of another four countries, BBMs can be implemented, but the institutional setting can make it difficult to decide upon their implementation (BE, DK, NL, PL). Some countries implement these measures through laws or binding regulations (FI, EE, IS, IE, NL, NO, SE, UK), while others issue recommendations (AT, CZ, PT) or use consumer protection law (DK, SK).
There are three groups of countries, in which the macroprudential policy mix is not considered as fully appropriate:

Vulnerabilities in the residential real estate sectors of the EEA countries / September 2019 Country analysis of risks and policies for a subset of ESRB Member States 67
• countries, in which some sources of systemic risk remain to a certain extent unaddressed (DE, FI, FR, LU), because certain instruments are not implemented or cannot be implemented due to the existing legal setting;
• countries, in which some of the macroprudential instruments may need to be complemented by additional macroprudential measures in order to avoid leakages of the current measures (FI, IS) or by more targeted measures (BE);
• countries, in which the degree of enforceability of the instruments may not be sufficient given the intensity of the vulnerabilities (CZ).
4.2.2 Policy sufficiency
The assessment of policy sufficiency is conditional on the level of policy appropriateness. Indications that countries have not chosen the appropriate mix of macroprudential instruments, or have not been able to implement policy measures to address certain vulnerabilities, automatically resulted in an assessment of (partial) policy insufficiency. In this situation, vulnerabilities are expected to continue building up unless there is a change in the macro-financial environment or in other policy areas.
If the macroprudential policy was deemed appropriate, policy sufficiency was assessed based on the ability of macroprudential measures to deliver a substantial contribution to mitigating the identified vulnerabilities, with reasonably higher benefits than costs in pursuing the stated policy objectives. The assessment of policy sufficiency is particularly challenging given the heterogeneity of methods used by national authorities to calibrate and evaluate the measures. The analysis reflects the current best practices, either observed empirically across countries or reflected in the economic literature, countries’ own assessments of policy effectiveness (ex ante or ex post analysis, if made available), and practical evaluations of risk indicators based on the implementation of policies (Figure 3). This approach was adopted because most national authorities do not yet have in place advanced tools to assess policy sufficiency, and a comprehensive set of results of sufficiency of their current or future policy measures is currently not available in many of the countries. Sometimes, the assessment was also impaired by data gaps, in which case the policy assessment outcome could be no better than “partially appropriate” and “partially sufficient”, respectively. For both stock and flow vulnerabilities, the evolution of various risk indicators (i.e. lending standards, RWs, price growth, credit growth) was analysed before and after policy implementation. In the case of recently implemented measures, national authorities provided their assessment of the expected efficiency of the policy. A policy was considered partially or not sufficient if vulnerabilities are still increasing to a certain degree. With regard to stock vulnerabilities, in countries with high levels of household indebtedness or house price overvaluation, the analysis carefully pointed out that capital buffers should be at a commensurate level.
Macroprudential policy may not be fully sufficient also because the net benefit of further action may not recommend it as a first best option in achieving the mitigation of systemic risk and other policy areas may need to intervene (Figure 2). The policy analysis departs from the level of RRE vulnerabilities identified. The need for macroprudential action is analysed against

Vulnerabilities in the residential real estate sectors of the EEA countries / September 2019 Country analysis of risks and policies for a subset of ESRB Member States 68
the presence of unaddressed systemic risk, but the decision to take this action depends on a number of factors. In the case where the expected benefits of macroprudential policy relative to the costs seem to have been reached, other policy areas might be needed to mitigate these risks efficiently and effectively. It is important to note that although the scope of macroprudential policy is systemic risk, it has its limits in containing risks that come from areas beyond the financial sector, e.g. through households’ incentives or limited housing supply. In such cases, other policies are needed to complement macroprudential policies in order to mitigate the sources of systemic risk efficiently.
Figure 3 Determining policy sufficiency
Source: ESRB assessment.
For countries which were assessed as appropriate, the sufficiency of macroprudential policy was analysed based on the extent to which macroprudential policy has the ability to mitigate systemic risks without generating substantial costs for the real economy. For all countries, the benefits were assessed in terms of the capacity of instruments to mitigate direct and indirect financial stability vulnerabilities, without major consequences for the real economy. In countries where vulnerabilities have already accumulated and are currently at high levels, the analysis acknowledged the potential limitations of macroprudential measures in further mitigating the vulnerabilities in the short to medium term. SE and NO are two relevant cases of countries which have implemented a comprehensive set of both capital- and borrower-based measures. A further tightening of these instruments might generate more costs than intended benefits in mitigating the systemic risks, while intervention in other policy areas (such as housing policy impacting the functioning and supply of housing as well as tax policy impacting households’ incentives) is needed to complement the macroprudential measures in order to mitigate the systemic risks related to RRE.
Vulnerabilities identified
Macroprudential policy appropriate
Measures properly calibrated
Systemic risk contained Macroprudential policy fully sufficient
Systemic risk not contained
Macroprudential policy partially/not sufficient
Measures not properly calibrated
Macroprudential policy partially/not sufficient
Macroprudential policy partially appropriate
Macroprudential policy partially/not sufficient,
depending on calibration
Macroprudential policy not appropriate
Macroprudential policy not sufficient
(no country)

Vulnerabilities in the residential real estate sectors of the EEA countries / September 2019 Country analysis of risks and policies for a subset of ESRB Member States 69
There are three cases, in which the macroprudential policy mix is assessed to be partially sufficient:
• countries, in which the macroprudential policy was considered partially appropriate (BE, CZ, DE, FI, FR, IS, LU);
• countries, in which the macroprudential instruments may not be calibrated tight enough given the intensity of risks (DK, NL);
• countries, in which the systemic risk related to residential real estate markets cannot be efficiently mitigated by macroprudential policy, and where other policy action may be needed to complement macroprudential policy in order to mitigate systemic risks (NO, SE).
Overall, the policy assessment concluded that out the 19 countries for which a country analysis was conducted, in eight countries, the implemented macroprudential policies in relation to the identified financial stability vulnerabilities are assessed as fully appropriate and fully sufficient (AT, EE, IE, MT, PT, SK, SI, UK).
Moreover, in three countries the policy measures are assessed to be fully appropriate and partially sufficient (DK, SE, NO). The analysis takes note of the fact that in NO and SE the identified systemic risk levels remain high and intervention in other policy areas may be required to complement macroprudential policy to lower them efficiently.
Finally, in eight countries the policy measures are assessed to be partially appropriate and partially sufficient (BE, CZ, DE, FI, FR, IS, NL, LU) (Table 17).

Vulnerabilities in the residential real estate sectors of the EEA countries / September 2019 Country analysis of risks and policies for a subset of ESRB Member States 70
Table 17 Assessment of policies
Country
Cycli1.05cal
position
Assessment of policy
appropriateness Description of policy appropriateness assessment
Assessment of policy
sufficiency Description of policy sufficiency
assessment
Remaining sources of systemic risk, which could be addressed more efficiently by other policy areas
AT Firm expansion
Fully appropriate The recommendation on BBMs is deemed appropriate for the predominantly emerging vulnerabilities.
Fully sufficient
The communication and guidelines on BBMs appear to be sufficient relative to the intensity of vulnerabilities.
NA
BE Mature expansion
Partially appropriate
BBMs would be the best appropriate instruments to address the loosening of lending standards for new loans as they would impact new lending directly.
Partially sufficient
The current RW add-on may not be enough to address the loosening of lending standards since they affect new lending indirectly through banks' preferences for risk taking and cost of capital. BBMs might be considered sufficient instead.
NA
CZ Firm expansion
Partially appropriate
Legally binding BBMs may become more appropriate instead of the current recommendation in the medium term, given the intensity of the flow vulnerabilities and their potential further dynamics. To this end, NAs should be given powers over legally binding BBMs which they might need to implement depending on the medium-term dynamics of the vulnerabilities.
Partially sufficient
The current recommendation on BBMs may become insufficient if the vulnerabilities continue growing.
NA
DE Firm expansion
Partially appropriate
A comprehensive analysis of lending standards is currently hindered by the lack of detailed data. Given the absence of these data, the overvaluation of house prices and further house price and mortgage credit growth, national authorities should contribute to ensuring prudent lending standards of new loans. Authorities might also consider the use of capital-based measures for banks to create additional capital buffers against the vulnerabilities that might have already accumulated.
Partially sufficient
There are currently no macroprudential measures in place to mitigate vulnerabilities which may be present.
NA
DK Mature expansion
Fully appropriate The set of BBMs and capital measures seems appropriate given the nature of the vulnerabilities identified.
Partially sufficient
Further tighthening of exisiting amortisation measures may be envisaged to sufficiently mitigate the risk associated with household debt sustainability.
NA
EE Firm expansion
Fully appropriate The BBMs seem appropriate to address the predominantly emerging vulnerabilities.
Fully sufficient
The BBMs appear sufficient relative to the intensity of the vulnerabilities.
NA
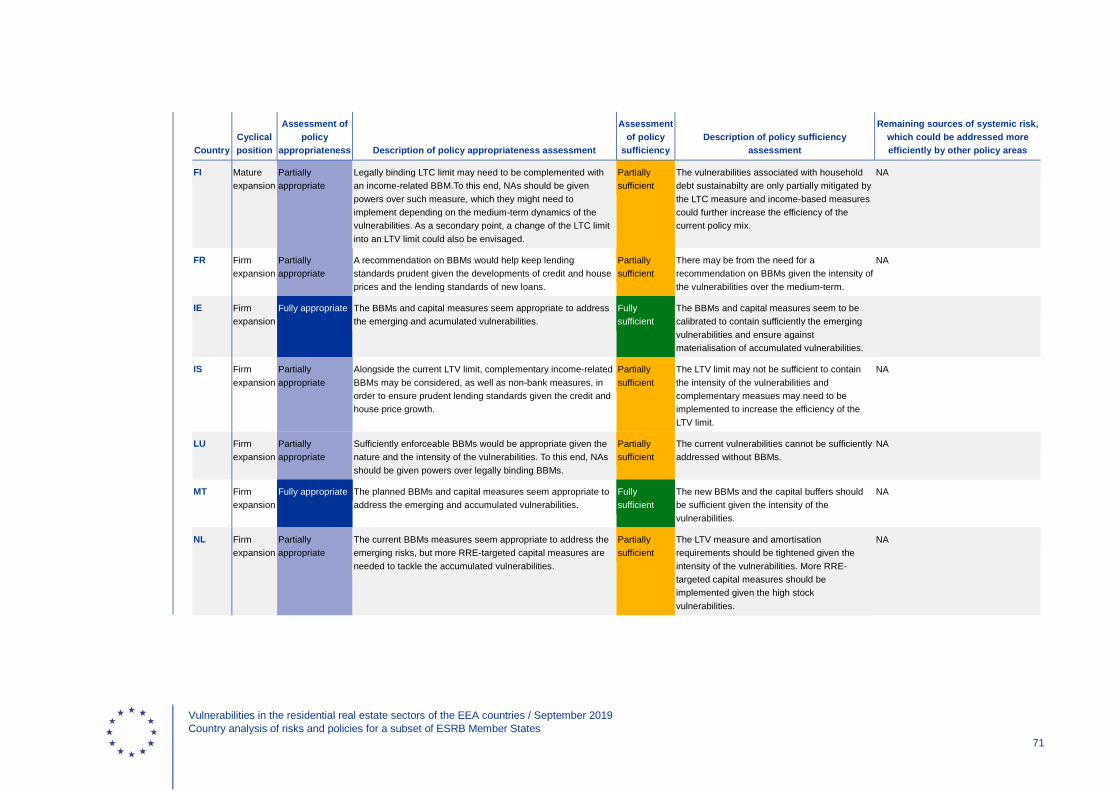
Vulnerabilities in the residential real estate sectors of the EEA countries / September 2019 Country analysis of risks and policies for a subset of ESRB Member States 71
Country Cyclical position
Assessment of policy
appropriateness Description of policy appropriateness assessment
Assessment of policy
sufficiency Description of policy sufficiency
assessment
Remaining sources of systemic risk, which could be addressed more efficiently by other policy areas
FI Mature expansion
Partially appropriate
Legally binding LTC limit may need to be complemented with an income-related BBM.To this end, NAs should be given powers over such measure, which they might need to implement depending on the medium-term dynamics of the vulnerabilities. As a secondary point, a change of the LTC limit into an LTV limit could also be envisaged.
Partially sufficient
The vulnerabilities associated with household debt sustainabilty are only partially mitigated by the LTC measure and income-based measures could further increase the efficiency of the current policy mix.
NA
FR Firm expansion
Partially appropriate
A recommendation on BBMs would help keep lending standards prudent given the developments of credit and house prices and the lending standards of new loans.
Partially sufficient
There may be from the need for a recommendation on BBMs given the intensity of the vulnerabilities over the medium-term.
NA
IE Firm expansion
Fully appropriate The BBMs and capital measures seem appropriate to address the emerging and acumulated vulnerabilities.
Fully sufficient
The BBMs and capital measures seem to be calibrated to contain sufficiently the emerging vulnerabilities and ensure against materialisation of accumulated vulnerabilities.
IS Firm expansion
Partially appropriate
Alongside the current LTV limit, complementary income-related BBMs may be considered, as well as non-bank measures, in order to ensure prudent lending standards given the credit and house price growth.
Partially sufficient
The LTV limit may not be sufficient to contain the intensity of the vulnerabilities and complementary measues may need to be implemented to increase the efficiency of the LTV limit.
NA
LU Firm expansion
Partially appropriate
Sufficiently enforceable BBMs would be appropriate given the nature and the intensity of the vulnerabilities. To this end, NAs should be given powers over legally binding BBMs.
Partially sufficient
The current vulnerabilities cannot be sufficiently addressed without BBMs.
NA
MT Firm expansion
Fully appropriate The planned BBMs and capital measures seem appropriate to address the emerging and accumulated vulnerabilities.
Fully sufficient
The new BBMs and the capital buffers should be sufficient given the intensity of the vulnerabilities.
NA
NL Firm expansion
Partially appropriate
The current BBMs measures seem appropriate to address the emerging risks, but more RRE-targeted capital measures are needed to tackle the accumulated vulnerabilities.
Partially sufficient
The LTV measure and amortisation requirements should be tightened given the intensity of the vulnerabilities. More RRE-targeted capital measures should be implemented given the high stock vulnerabilities.
NA

Vulnerabilities in the residential real estate sectors of the EEA countries / September 2019 Country analysis of risks and policies for a subset of ESRB Member States 72
Country Cyclical position
Assessment of policy
appropriateness Description of policy appropriateness assessment
Assessment of policy
sufficiency Description of policy sufficiency assessment
Remaining sources of systemic risk, which could be addressed more efficiently by other policy areas
NO Mature expansion
Fully appropriate The current BBMs and capital measures seem appropriate to address the emerging and accumulated vulnerabilities.
Partially sufficient
The BBMs and capital measures seem to be calibrated in such a way that vulnerabilities are mitigated without excessive costs for the real economy. However, macroprudential policies are unable to fully mitigate the amount of risk for financial stability.
Demand factors that have supported growth in housing prices and housing lending such as favourable tax regime related to real estate acquisition and financing, as well as urbanisation and demographic changes.
PT Firm expansion
Fully appropriate The recommendation on BBMs is deemed appropriate for the predominantly emerging vulnerabilities.
Fully sufficient
The BBMs appear sufficient relative to the intensity of the vulnerabilities.
NA
SE Mature expansion
Fully appropriate The current BBMs and capital measures seem appropriate to address the emerging and accumulated vulnerabilities.
Partially sufficient
The BBMs and capital measures seem to be calibrated in such a way that vulnerabilities are mitigated without excessive costs for the real economy. However, macroprudential policies are unable to fully mitigate the amount of risk for financial stability.
Demand factors that have supported growth in housing prices and housing lending: favourable tax regime related to real estate acquisition and financing, strongly regulated market, as well as urbanisation and demographic changes.
SI Firm expansion
Fully appropriate The current BBMs seem appropriate to address the emerging vulnerabilities, given the level of low overall risk.
Fully sufficient
The BBMs appear to be calibrated in such a way that vulnerabilities are contained for the moment, given the low stock risk.
NA
SK Firm expansion
Fully appropriate The BBMs and capital measures seem appropriate to address the vulnerabilities.
Fully sufficient
The BBMs appear sufficient relative to the intensity of the vulnerabilities.
NA
UK Mature expansion
Fully appropriate The BBMs and capital measures seem appropriate to address the emerging and accumulated vulnerabilities.
Fully sufficient
The current results of the stress testing of the banking sector indicate that the capital buffers in place should be sufficiently calibrated to ensure resilience against an adverse real estate and macroeconomic scenario, also taking into account the potential second-round effects from the household sector.
NA
Source: ESRB assessment.
Vulnerabilities in the residential real estate sectors of the EEA countries / September 2019 Austria 73
Cyclical position: firm expansion
Key vulnerabilities
• House price overvaluation
• Signs of loose lending standards for new loans
• Moderate house price growth
• Moderate mortgage lending growth
Risk assessment – medium risk
Stock vulnerabilities
Collateral
Existing estimates from the Oesterreichische Nationalbank point to high overvaluation of house prices in Vienna (by around 22%) and elevated overvaluation in the rest of the country (by around 11%), supporting evidence of high overvaluation from the scoreboard indicators.
Household
Household indebtedness (at around 85% of disposable income) can be considered moderate in EU comparison. However, vulnerabilities related to household indebtedness are amplified by the relevant shares of outstanding loans with variable interest rates (50%), denominated in foreign currency (10%) or non-amortising (13% as of Q3 2018). On the other hand, in the event of vulnerabilities materialising, the effect of potential negative developments on the residential real estate (RRE) markets on the consumption of households may, to some extent, be mitigated by relatively low home ownership rate, regulated rental market, and the concentration of debt with higher-income households.
Flow vulnerabilities
Collateral
Following a period of gradual growth since 2000, the average annual real house price growth has slowed down recently (to 4.0% in Q3 2018, with faster dynamics outside the capital city), slightly outpacing the growth in household income. Investment in construction has contributed to the house price growth over the recent cycle, and can be seen as an amplifying factor contributing to a potential house price decrease in the event of vulnerabilities materialising.
Funding
Despite a recent pick-up in new lending, the real annual growth in housing credit has been moderate over the past three years (3.4% real growth in Q2 2018). Growth of pure new loans has
Austria

Vulnerabilities in the residential real estate sectors of the EEA countries / September 2019 Austria 74
been rather strong, standing at 18% relative to the stock of loans of the previous year. However, available evidence from a survey points to a significant share of new loans with high loan-to-value (LTV) amounts (20% of new with LTVs of over 100%).
Household
Household indebtedness has remained stable over the past three years, at 84% of disposable income. However, 41% of new loans for house purchases are provided to households with variable interest rates (as at Q3 2018).
Interactions and transmission channels
Given the elevated to high overvaluation of house prices, the major risk is the direct risk of credit losses connected to new loans that are provided with high LTV ratios, mostly if this practice persists and if it is coupled with ongoing house price and credit growth dynamics.
Given the high share of variable rate loans of both existing and new loans, there may also be indirect risks connected to decreasing household consumption in a situation of economic downturn. The moderate indebtedness of households, relatively low home ownership ratio and regulated rental market, however, mitigate these vulnerabilities to some extent.
Policy assessment – fully appropriate and fully sufficient
Policy mix
• Implementation of the legal basis to adopt binding borrower-based instruments (LTV, debt service-to-income (DSTI), debt-to-income (DTI), amortisation criteria) in December 2017
• Communication on prudent lending standards from the Oesterreichische Nationalbank, Financial Market Authority and lately also the Financial Market Stability Board, including:
(a) maximum LTV values (20% downpayment);
(b) amortisation and affordability requirements (in fact DSTI limit at 30-40%);
(c) maximum maturities.
Policy appropriateness
The loose values of LTVs on new loans, especially relative to the overvaluation of house prices, are being addressed by communication on the minimum required downpayment. The risk of borrowers becoming distressed in the event of economic downturn is addressed by the communication on affordability requirements, including a requirement for amortisation. However, NAs might also define minimum standards for stress-testing the DSTI values as an integral part of their communication on prudent lending standards (currently, the NAs check the effect of increased interest rates at the aggregate economy level).
Vulnerabilities in the residential real estate sectors of the EEA countries / September 2019 Austria 75
Policy sufficiency
House prices are currently assessed as overvalued in Austria (particularly in Vienna) and lending standards have remained loose in terms of LTV. House prices and housing lending continue to grow, albeit moderately, and the potential house price and credit spiral did not start evolving. Given the recent experience made by the NAs with intense macroprudential supervision, borrower-based measures in the form of communication are currently deemed fully appropriate and fully sufficient. The NAs have the powers to set legally binding borrower-based measures if threats to financial stability become stronger, which may ensure policy sufficiency in the future.
Vulnerabilities in the residential real estate sectors of the EEA countries / September 2019 Belgium 76
Cyclical position: mature expansion
Key vulnerabilities
• Signs of house price overvaluation
• Elevated and rising household indebtedness
• Loose credit standards for both outstanding and new flows of loans
• Moderate mortgage credit growth
Risk assessment – medium risk
Stock vulnerabilities
Collateral
There are signs of overvaluation on the Belgian housing market. Housing price growth has slightly outpaced wage and income growth, and house prices are now at their highest in 18 years. The deviation of price-to-income from the long-term trend points to an estimated overvaluation of approximately 15%, while the IMF estimates overvaluation in Belgium at around 8%, and the Nationale Bank van België/Banque Nationale de Belgique (NBB/BNB) puts it at 5.9% in Q2 2018. This development has been fuelled by strong investor demand and the low interest rate environment. There is also evidence of an increase in the number of loans taken out for acquiring a second property for buy-to-let purposes, which may be seen as speculative investment.
Funding
Loosening the lending standards operating for some time may have created pockets of vulnerabilities for the outstanding portfolio of RRE loans. The Belgian banking sector is well capitalised and more profitable than the European average, which could possibly cushion against adverse developments in the RRE market. However, the average RWs of the IRB banks for RRE portfolios, without taking into account the macroprudential measure in place, are relatively low (12%45 on a consolidated basis and 10% on a domestic basis in Q2 2018) in cross-country comparison.
Household
Household indebtedness is relatively high and increasing. Household indebtedness stands at around 106% of disposable income (Q3 2018) and around 61% of GDP (Q1 2018). A large share of households own their houses through mortgages (43%), which could make them particularly
45 The number reflects the average value of RWs as estimated by banks’ internal models, without the effect of the
macroprudential measure.
Belgium

Vulnerabilities in the residential real estate sectors of the EEA countries / September 2019 Belgium 77
vulnerable to changes in house prices. An important mitigating factor of this vulnerability is the prevalence of fixed rate mortgages with a regular amortisation schedule.
Flow vulnerabilities
Funding
The growth in housing loans has been relatively strong (5.9% real annual growth rate, over the past three years, in Q4 2018). The growth of housing loans adjusted for sales and securitisations was 3.4% in the past year (Q3 2018). This development is coupled with a further loosening of lending standards. The share of new loans with the LTV>90% is 36% of new loans (H1 2018, also 6% with an LTV>100%), and there has been an increasing share (23% in H1 2018) of new loans with DSTI>50%. Moreover, the exposures of Belgian banks to RRE are elevated (approximately 40% of total lending, 40% of GDP). The increased competition between banks can fuel the deterioration in lending standards.
Interactions and transmission channels
The elevated level of household indebtedness and the fact that lending standards appear to be somewhat loose could increase household vulnerability in the event of a financial shock. These could materialise as defaults or adjustments in consumption to meet loan repayments. The house price overvaluation combined with a share of households with higher LTVs could also make the households and the banking sector vulnerable to potential economic and financial shocks. The systemic nature of the RRE sector for lenders could further amplify potential shocks. However, Belgian authorities regard indirect vulnerabilities (feedback between property prices and the real economy, via consumption and investment) as weak.
Policy assessment – partially appropriate and partially sufficient
Policy mix
• Risk weight add-on with two components: 1) risk weight add-on of 5 percentage points for IRB banks retail exposures secured by real estate; 2) risk-sensitive risk weight add-on, calculated as a share (33%) of the average microprudential risk weight on the (residential) mortgage portfolio.
• Monitoring framework for credit standards, consisting of an informal communication channel to ensure that banks maintain sound lending standards.
Policy appropriateness
Capital measures such as changes in capital requirements, risk weights and the LGD parameters are appropriate to address the stock RRE vulnerabilities in Belgium. However, borrower-based measures (BBM) could address concerns about loose lending standards and might also curb credit growth and ensure that households’ debt levels remain sustainable. Moreover, BBMs are more effective when combined with measures targeting the stock vulnerabilities.

Vulnerabilities in the residential real estate sectors of the EEA countries / September 2019 Belgium 78
Policy sufficiency
The recently adopted risk weight add-on is expected to be fully sufficient in terms of enhancing banks’ resilience (the measure effectively increased the average IRB risk weight for housing loans from 10% to 18%), but its effectiveness remains to be tested in terms of impact on riskiness of new loans. This new measure is stricter than the previous one adopted by the Belgian authorities, which consisted of a linear risk-weight add-on. The current instrument further increases risk weights according to the risk profile of banks’ mortgage portfolios, which is welcome. However, the NBB/BNB still believes that the share of loans in riskier buckets remains too high. There is also uncertainty about the monitoring framework (not legally binding or strongly enforceable) in place and whether it will be enough to ensure that banks’ lending practises remain sound. In this sense, evidence that lending standards have been deteriorating in recent times is very compelling. The policy mix could be complemented with a more explicit guidance in terms of lending standards or legally binding borrower-based measures.

Vulnerabilities in the residential real estate sectors of the EEA countries / September 2019 Czech Republic 79
Cyclical position: firm expansion
Key vulnerabilities
• House price overvaluation
• Elevated house price growth
• High housing credit growth
• Loose lending standards
• Increasing household indebtedness
Risk assessment – medium risk
Stock vulnerabilities
Collateral
The growth in house prices has outpaced the growth in household income over the medium term, and it cannot be fully attributed to the developments in the debt servicing capacity of households. Česká národní banka (CNB) estimates that as at the second half of 2018, house prices in the Czech Republic were overvalued by 10% to 15%. In addition to the contribution from cyclical factors, there are important structural factors that may have contributed to this overvaluation. In particular, the failure to approve a building plan in Prague and delays in issuing building permits may have contributed to the shortage of housing supply, especially in the capital.
Household
Although household indebtedness in the Czech Republic can be regarded as moderate compared with the other EEA countries, it has been increasing in line with the growth in housing loans. Despite the fact that recently there have been longer periods during which interest rates were fixed, the fact remains that when interest rates were at their lowest, a significant share of new mortgage loans were provided with fixation periods of less than five years. Consequently, a significant percentage of households taking out new mortgage loans may find it difficult to service their debt in the event of an interest rates increase.
Flow vulnerabilities
Collateral
Even though the growth in housing prices has been slowing down, it remains elevated and conditions for further increases in house prices continue.
Czech Republic

Vulnerabilities in the residential real estate sectors of the EEA countries / September 2019 Czech Republic 80
Funding
The annual growth in housing loans has been high over the medium term. Prior to the introduction of recommended limits to the LTV ratio, DTI ratio and DSTI ratio, the growth in housing credit was coupled with the loosening of lending standards as evidenced by the increasing percentage of loans with a high LTV ratio (of over 80% and 90%) and the increasing percentage of loans with high DTI and DSTI ratios (of over 8 and 40%, respectively). These loans were provided to households that may be vulnerable to adverse economic and financial conditions. Moreover, there was an increasing percentage of loans provided that combined high LTV ratios with a high DTI ratio or DSTI ratio, thus further increasing the potential for credit losses related to these new mortgage loans. While the average risk weights for the mortgage portfolios held by internal ratings-based credit institutions in the Czech Republic can be regarded as relatively high in comparison with other EU Member States, these risk weights have been declining.
Household
In line with the growth in housing credit, household indebtedness has also exhibited upward dynamics. Even though the interest rate fixation periods have been extended in the new loans, there is still a significant share of loans with a fixation period lower than 5 years, making households with low financial reserves vulnerable to increasing interest rates. In the event of deterioration in the macroeconomic situation, household consumption may be negatively affected through the significant share of households that are homeowners with a mortgage.
Interactions and transmission channels
The high overvaluation of house prices, which continues to increase, coupled with the high growth in housing loans and the loosening of lending standards increase the possibility of credit losses from mortgage loans in the event of adverse economic and financial conditions or adverse developments in the residential real estate market, with direct effects on financial stability. Similarly, the increasing indebtedness of households, coupled with the growing share of households that are potentially vulnerable to adverse economic and financial conditions or adverse developments in residential real estate market may lead to households reducing their consumption in the event of an economic or financial shock. That could lead to second-round effects, potentially affecting financial stability indirectly.
Policy assessment – partially appropriate and partially sufficient
Policy mix
• LTV (90%, currently with 15% of new loans with LTV 80-90%)
• DTI (9, with 5% of new loans with higher DTI)
• DSTI (45%, with 5% of new loans with higher DSTI)
• Maturity limits (30 years)
• CCyB of 2.0% (applicable from July 2020, currently at 1.25%)
Vulnerabilities in the residential real estate sectors of the EEA countries / September 2019 Czech Republic 81
Policy appropriateness
There is a wide range of borrower-based measures in place, which are targeted at the flow vulnerabilities. The limits to the LTV ratio aim to address the build-up of vulnerabilities related to the provision of new mortgage loans in a market in which house prices are overvalued, with potential direct effects on financial stability. Furthermore, limits on the DTI ratio and the DSTI ratio aim to increase the effectiveness of the limits on the LTV ratio by restricting the provision of new loans to households that are potentially vulnerable to adverse economic and financial conditions and adverse developments in the residential real estate market in the Czech Republic. Financial institutions are also recommended to stress-test the ability of debtors to withstand shocks related to increased interest rates or decreased incomes. To increase the resilience of banks vis-à-vis cyclical vulnerabilities, in 2019 CNB further increased the counter-cyclical capital buffer rate to 2% (from 1.75%), from July 2020.
Policy sufficiency
The LTV limits were pre-emptively introduced when the housing prices just started to recover from the previous downturn. As the overvaluation of house prices started to accumulate, gradual tightening of the LTV limits followed in 2016. The DTI and DSTI limits are currently set at levels that aim to prevent further deterioration in the identified vulnerabilities. To increase resilience in light of the increasing indebtedness of the private sector as a whole, the CCyB rate has been raised several times since 2015. In support of the macroprudential policy, the monetary policy rates have been raised eight times since 2017. Currently, CNB is continuing its efforts to obtain statutory powers to set upper LTV, DTI and DSTI limits.
Vulnerabilities in the residential real estate sectors of the EEA countries / September 2019 Denmark 82
Cyclical position: Mature expansion
Key vulnerabilities
• High but declining household indebtedness
• Signs of house price overvaluation
• Large (although declining) share of loans with deferred amortisation for outstanding loans
• Interconnectedness with the Nordic banking system
Risk assessment – high risk
Stock vulnerabilities
Household
Household indebtedness is still very high in international comparison, despite the decrease over the medium term. Household indebtedness stands at 230% of disposable income (Q3 2018) and 118% of GDP (Q2 2018). Additional vulnerabilities are generated mainly by the large share of loans with deferred amortisation and, to a lesser extent, by the share of loans with a variable interest rate (40% of new loan volumes). These are mitigated by the large welfare state and other structural factors which, other things being equal, lower expenditures that the households would otherwise need to incur, e.g. unemployment insurance and retirement savings. Furthermore, high creditor protection combined with the Danish municipalities’ rehousing obligation means that the loss rates on Danish mortgages have been low. Nevertheless, studies point to the high vulnerabilities of consumption reduction that might occur if the highly indebted households incur financial shocks. Ownership rate through mortgages is rather high (48%), which could enhance the collateral channel for households.
Collateral
There are signs of housing price overvaluation, given that the prices have been growing much faster than household income, and the price-to-income ratio is above its long-term average. National authorities have pointed to some overvaluation in 2017, but only for Copenhagen. The IMF also indicates that there are signs of overvaluation in Denmark’s urban areas. This development reflects the increase in population, including migration flows, tax deductibility of mortgages, which may act as an incentive for households to over-borrow, complex rental market regulations with caps on rent in a significant share of apartment buildings in the major cities, and some supply constraints of owner-occupied housing, particularly for small apartments in Copenhagen.
Denmark

Vulnerabilities in the residential real estate sectors of the EEA countries / September 2019 Denmark 83
Flow vulnerabilities
Funding
The growth in housing loans has been low (0.7% annual growth rate in Q3 2018, over the past three years), but lending standards of outstanding and new loans have raised concerns. The large share of loans with deferred amortisation has been particularly concerning, although their share has been steadily declining since 2013. The lending standards of traditional banks are harder to assess, given that most lending is granted by mortgage banks (and corresponding statistical data are made available only for these), which finance themselves through covered bonds that comply with tight LTV and maturity conditions by law. Moreover, the highest increase in housing loans is observed for medium-sized banks that are present in high price growth areas. The RRE sector is of systemic importance for the banking sector, as housing loans make up 55% of banks’ total assets. The banking sector is also highly interconnected with those of the surrounding Nordic countries. Moreover, Denmark is financing mortgages almost exclusively through covered bonds which are significant in size (136% of GDP in 2017). This implies that more prudent lending standards are in place and that in Denmark the covered bond financing market is designed in such a way that it could have additional mitigating effects for borrowers. In Denmark every mortgage has a corresponding bond issued. For 30-year fixed rate mortgages, which account for 44% of the total stock, the borrower can recall the bond at par in the event of interest rate increases and hence reduce the value of the outstanding mortgage debt. This mechanism ensures a lower probability of negative equity if house prices decline following interest rate increases.46
Interactions and transmission channels
The high, though declining, share of loans with deferred amortisation and high LTIs or LTVs, increase the household indebtedness vulnerability. In the event of financial shocks, highly indebted households could severely reduce consumption in order to continue servicing a long-term debt.
Policy assessment – fully appropriate and partially sufficient
Policy mix
• Minimum downpayment requirement of 5%.
• Wealth requirement at loan origination linked to DTI in larger cities: new borrowers in "growth areas" with a DTI above 4 (5) should have sufficient wealth so that net wealth remains positive if house prices drop by 10% (25%).
• Mortgage product restriction linked to DTI and LTV: new borrowers with a DTI above 4 and LTV above 60% should have an interest rate fixation period of at least 5 years and can only obtain deferred amortisation if the interest rate fixation period is 30 years.
• CCyB at 1% (applicable from September 2019, current level at 0.5%).
46 Lea, M. (2010), “Alternative forms of mortgage finance: What can we learn from other countries?”, Moving Forward in
Addressing Credit Market Challenges: A National Symposium, February.

Vulnerabilities in the residential real estate sectors of the EEA countries / September 2019 Denmark 84
• “Supervisory diamond” for mortgage banks – microprudential measures with some macroprudential effects.
Policy appropriateness
The combination of both capital-based and borrower-based measures that is in place is considered appropriate to tackle the identified stock and flow vulnerabilities. Although the CCyB is a relatively broad measure, it is an appropriate capital instrument meant to build bank resilience in the face of stock vulnerabilities, such as high indebtedness, and cyclical RRE evolutions. The amortisation requirements related to LTV and DTI, together with the LTV cap aim to ensure a more stable evolution of indebtedness and ultimately of household and bank resilience.
Policy sufficiency
Amortisation requirements and other initiatives have had the effect of reducing the share of risky loans. However, borrower-based measures could be tightened further, given the large extent of deferred amortisation. Moreover, the signs of overvaluation in urban areas, Copenhagen in particular, and the elevated housing price increase may warrant a reconsideration of the 5% minimum downpayment requirement, which is rather low in international comparison. Also, given that the stock vulnerability associated with household indebtedness is very high, an increase in capital requirements including the CCyB could be also considered, as well as a capital measure more specifically targeted at the RRE sector. Furthermore, a new housing taxation system that links the payable housing tax to current house market values will be effective from 2021. Though not a macroprudential measure as such, the new housing taxation system should contribute to a more stable housing market. Reforms in other policy areas could also target mortgage tax deductibility and rental market regulations and support the efforts of the macroprudential policy to address the RRE vulnerabilities which are present in Denmark.

Vulnerabilities in the residential real estate sectors of the EEA countries / September 2019 Estonia 85
Cyclical position: firm expansion
Key vulnerabilities
• Moderate housing price growth
• Elevated household indebtedness (compared with the peer country group)
• Moderate housing lending growth
• Interconnectedness with the Nordic banking system
Risk assessment – medium risk
Stock vulnerabilities
Household
Household indebtedness is moderate compared with the entire set of European countries, but elevated relative to the Central and Eastern European peer group. Household debt stood at 72% of disposable income (Q4 2017) and at 39% of GDP (Q2 2018). Moreover, economic growth has been particularly strong in Estonia and a potential tapering or even reversal of dynamics could have notable consequences for overly indebted households. Vulnerabilities may be aggravated by the large share of mortgages with a variable interest rate, which represented 90% of the flow of new loans in Q4 2017. However, evidence from national authorities points to the fact that mortgage debt is concentrated in households with higher income and larger financial assets, which might cushion the impact of potential adverse shocks.
Flow vulnerabilities
Collateral
Housing prices have exhibited a steady moderate growth over the past three years (real average annual growth of 3.6% in Q4 2018), and over the past year (3.4% real annual growth in Q3 2018). There are no substantial restrictions on housing supply and the price elasticity of supply is relatively high. This may mitigate pressures on RRE prices, but it may also lead to overshooting in the construction sector in the short run.
Funding
Housing lending has been moderate with an average real annual growth of 3.2% over the past three years (Q3 2018). In Q3 2018, the real annual growth of household loans for house purchases adjusted for sales and securitisations was 3.3%. The average LTV has remained close to 70% for new housing loans as a whole and the weighted average schedule DSTI value has risen slightly from 27% to 28% over the past two years. The distributions of the stressed DSTI ratio and the actual ratio from the repayment schedule have shifted towards slightly higher values than in the recent past. Housing loans are of systemic importance for the banking sector as they represent a
Estonia

Vulnerabilities in the residential real estate sectors of the EEA countries / September 2019 Estonia 86
relatively large share of total loans (40% of total bank loans). Moreover, the Estonian banking sector is interconnected with that of other Nordic countries, making it vulnerable to potential spillovers in the event of a downturn in financial sectors of the neighbouring countries. Some IRB banks report rather low and decreasing risk weights for RRE exposures, which could make them vulnerable in the event of a macro financial downturn.
Interactions and transmission channels
As housing prices and mortgage lending have increased in parallel for some time, there is a concern about housing-credit cycles potentially reinforcing each other between the two markets. Moreover, credit growth can further fuel the accumulation of household indebtedness, which is already high compared with the peer group.
Policy assessment – fully appropriate and fully sufficient
Policy mix
• LTV limit of 85% (up to 90%, if the loan is guaranteed by the state foundation KredEx)
• DSTI limit of 50% with an incorporated interest rate shock (an annual interest rate of 6% or the actual rate with a 2 percentage point add-on, whichever is higher)
• Maximum maturity of 30 years
• Permitted exceptions on each requirement: up to 15% of the amount of housing loans issued by a credit institution in a quarter
• Risk weight floor of 15% – to be updated pending ongoing Art. 458 consultation
• SyRB
Policy appropriateness
The flow vulnerabilities are more pronounced, albeit still at a medium level. Stock vulnerability associated with the household indebtedness is also considered to be at a medium level, albeit in relative terms compared with the peer group. Estonian authorities have implemented a fully appropriate policy mix to address primarily the growth of credit and housing prices. The LTV limit should ensure both bank and household resilience against potential downturns in prices, while income-related measures should contain excessive and unsustainable lending to households. The SyRB and the steps taken by national authorities to implement an RW floor for RRE exposures in IRB banks should help ensure bank resilience against potential shocks to the financial system.
Policy sufficiency
The combination of macroprudential policy measures should ensure the resilience of borrowers and lenders given that vulnerabilities are still at a medium level. The policy mix is keeping lending standards from deteriorating, while the RRE price growth has diminished considerably and is currently below the income growth. Banks appear to be resilient given the current level of risks and the existing and upcoming capital measures.
Vulnerabilities in the residential real estate sectors of the EEA countries / September 2019 Finland 87
Cyclical position: mature expansion
Key vulnerabilities
• Elevated and rising household indebtedness
• High growth in indirect real estate lending to households (through housing company loans)
• Easing of lending standards for new loans
• Interconnectedness with the Nordic banking system
Risk assessment – medium risk
Stock vulnerabilities
Household
Household indebtedness is elevated and relatively high in international comparison (household debt stood at approximately 115.6% of disposable income in Q3 2018), and has increased over the medium term, with some deceleration recorded in 2018. The largest share of mortgages (more than 95%) is made up of variable interest rate loans, which makes borrowers vulnerable to shocks to the market interest rates. A large share of housing loans is held by highly indebted borrowers; hence, the distribution of debt among households is very uneven. As a mitigating factor, mortgages in Finland are relatively short in maturity and also fully amortising.
Collateral
Currently, there is no evidence of house price overvaluation, but house prices have diverged regionally over the past decade, particularly between the Helsinki metropolitan area and the rest of the country. Tax deductibility of mortgages was an incentive for house purchases, but it has recently been reduced (from the 100% in 2011 to 25% by 2019). Housing prices have not been growing recently, so forward-looking concerns about overvaluation are fairly contained at the moment.
Flow vulnerabilities
Funding
The stock of mortgage loans is growing by around 2% year-on-year, while loans to housing companies (i.e. loans taken out by housing companies, but in practice paid back by households and investors holding the shares in these companies) are growing rapidly (annual growth rate of approximately 10%). Overall, the total housing-related lending is growing at a pace of around 4% year-on-year. According to the results of the new mortgage survey by the Finnish Financial Supervisory Authority (FIN-FSA), the percentage of new borrowers with the DSTI (including housing and other loans) over 50% stood at 8.7% (the share weighted by new lending volumes at 12.6%) in 2018. In addition to this, the share of new borrowers with an LTI above 5 stood at 9%
Finland

Vulnerabilities in the residential real estate sectors of the EEA countries / September 2019 Finland 88
(the share weighted by new lending volumes at 21%) in the same period. These figures suggest that there is already a relatively large portion of highly indebted households that could be vulnerable to negative financial and real economy shocks. In the absence of macroprudential tools targeted at mitigating the accumulation of household debt, there is a concern that in the medium term, this share of vulnerable households could increase further. Even though the growth of direct mortgage lending by banks is currently moderate, there is a concern that the accumulation of household debt could be channelled indirectly through the housing company loans.
In international comparison, the average margins appear narrow. The initial loan maturities of housing loans have slightly lengthened but they are still relatively short in international comparison. The RRE exposures are 42% of banks’ loans and 49% of GDP. Bank lending to NFCs is highly concentrated in construction and real estate sectors (including housing company loans), constituting the highest concentration among European countries and making the Finnish banking sector vulnerable to a downturn in real estate markets. Moreover, Finnish banks are highly dependent on market financing, mainly covered bonds collateralised by residential housing loans granted by the banks, which makes them vulnerable to shocks to investor sentiment. Housing lending is also highly concentrated in institutions that estimate risk weights using the internal ratings based approach (IRB), and given that there have been no recent real estate crises in Finland, the average risk weights obtained are low. The Nordic financial system’s large size, concentration and interconnectedness across the region all add to the vulnerabilities faced by the financial sector.
Interactions and transmission channels
Elevated and growing household indebtedness and negative saving rates give households little room for the absorption of potential financial or real shocks. The concentration of debt in a subset of highly indebted borrowers, correlated with the prevalence of variable interest rate loans could generate risk of repayment inability in the event of a RRE downturn. The effects could direct, namely defaults on banks’ balance sheets, or indirect, related to adjustments in consumption with second-round impact on the real economy.
Policy assessment – partially appropriate and partially sufficient
Policy mix
• LTC (loan-to-collateral) limit of 85% (95% for first-time home buyers)
• RRE risk weight floor of 15%
• Systemic risk buffer requirements (from 1%-3%) with implications for the RRE market
• Several FIN-FSA Board recommendations concerning lending standards of new loans, including housing company loans
Policy appropriateness
Capital measures are appropriate instruments to build up the resilience of banks, given the high level of household indebtedness and the low RW estimations of the IRB banks. The legally binding LTC limit aims to address the vulnerabilities which may be related to the flow of new loans. The recent recommendations by the FIN-FSA aim to address the emerging vulnerabilities that are

Vulnerabilities in the residential real estate sectors of the EEA countries / September 2019 Finland 89
related to the lengthening of maturities and to the shift towards the provision of housing loans to households through loans to housing companies.
To ensure a fully appropriate macroprudential policy over the medium term with regard to the indebtedness of households, which has been increasing from already elevated levels, legally binding income-related borrower-based measures, namely the DTI/ DSTI measure, in combination with maturity limits should be first made available, and then activated in Finland. The macroprudential authorities should be given the possibility to calibrate the measures based on the developments in the household indebtedness and other financial stability considerations. Such tools might become particularly helpful should the growth in household indebtedness accelerate in the medium term. It is crucial that these measures take into account the provision of housing loans to households through loans to housing companies as well as loans granted by any type of lender (i.e. the scope of the measures should be activity-based rather than entity-based). Furthermore, these income-related measures should take into account the borrower’s total debt, in order to avoid circumvention of the measures through top-up loans. The power over these measures should also be coupled with the power to set maximum maturity of the loans, in order to ensure appropriate amortisation of mortgages and avoid increases in household indebtedness through lengthening of maturities. Finally, it would increase the effectiveness of macroprudential policies if the power of the macroprudential authority to set legally binding LTC-related measures changed to a power over LTV-related measures to ensure prudent assessment of collateral value of the loans from credit providers.
Policy sufficiency
As regards the key stock vulnerabilities, the policy measures to ensure the resilience of the banking sector (e.g. through the RRE risk weight floor and systemic risk buffer) are seen as sufficient. However, with respect to possible future increases in household indebtedness, the current borrower-based macroprudential measures may not be fully sufficient. The effectiveness of the existing macroprudential measures that are already in place would increase with the activation of limits to either the DTI ratio or the DSTI ratio, in combination with maturity limits. In the absence of income-based measures, the LTC cap can be circumvented by using loans uncollateralised with real estate. Moreover, in contrast with the LTV limit, the definition of the LTC allows for the inclusion of other assets in the collateral definition, which diminishes substantially its efficiency in insulating banks and borrowers from real estate shocks. To reduce total household indebtedness, all types of household loans granted by any type of lender should be taken into account when designing the new tools to be applied in the policy mix. The recommendations for prudent lending via housing companies should help contain the risk coming from this sector, but more explicit quantitative guidance should perhaps also be considered.

Vulnerabilities in the residential real estate sectors of the EEA countries / September 2019 France 90
Cyclical position: firm expansion
Key vulnerabilities
• Elevated household debt
• Elevated housing lending growth
• Loosening of lending standards
• Signs of house price overvaluation in some large cities
Risk assessment – medium risk
Stock vulnerabilities
Collateral
House prices at the national level in France have been growing steadily since 2015 (the three-year real annual growth stood at 1.1% in Q3 2018). In 2017, house prices grew by 4% in France and by 8.6% in the Paris area. While there are no strong signs of overvaluation, residential real estate prices have increased significantly in some large cities47 and this may have eroded housing affordability in some places. The deviation of price-to-income from a long-term trend points to an estimated overvaluation of approximately 14 percentage points for the French housing market. The ECB econometric model points to 6 percentage points. Some IMF research work48 indicates an overvaluation of house prices in France of around 15 percentage points and the European Commission’s indicators pointed to an overvaluation of around 10% in 201749. National authorities report that some country-specific estimates show prices potentially more in line with fundamentals. Some models take into consideration the interest rate levels, so there may be a risk of underestimation of overvaluation in the context of a low interest rate environment. In the Paris area, prices have reached their ten-year high.
There are some important mitigating factors related to collateral stretch vulnerabilities. First, the residential guarantee schemes50, which cover nearly 60% of the volume of French residential real estate loans, act as a mitigating factor for direct credit risks for banks. Second, the loans are full recourse. Third, the potential wealth effects for households are estimated to be weaker than in other advanced economies given that there is no possibility to withdraw cash or equity from the house revaluations.
47 INSEE (latest data for Q4 2018), with data for Paris, Lyon and Marseilles in particular. 48 Geng, N. (2018): “Fundamental Drivers of House Prices in Advanced Economies”, IMF Working Paper Series, No 18/164,
International Monetary Fund. 49 European Commission (2019), European Semester: Country Report – France. 50 The guarantors are financial institutions or insurance companies owned by one or more banks; in all cases, they are
regulated bodies supervised by the Autorité de Contrôle Prudentiel et de Résolution (ACPR).
France

Vulnerabilities in the residential real estate sectors of the EEA countries / September 2019 France 91
Household
Household debt in France is elevated and stood at 94% as a share of disposable income in Q1 2018 (marking an increase of 40 percentage points since Q4 1999), and at 59% as a share of GDP for Q2 2018 (up by 20 percentage points since Q4 1999). While household indebtedness in France is close to the EU average (which stood at around 90% of disposable income in Q3 2018), it has continued to increase steadily over the past few years.
Similarly to other countries, the main real estate-related risk associated with the level of indebtedness is household consumption contraction. It materialises if households need to adjust their consumption, e.g. due to a macroeconomic shock leading to a rise in unemployment and weakening of household income, in order to continue servicing their real estate loans. The associated negative shock to household income and contraction of consumption may reinforce the initial shock leading to second-round effects. Even though the collateral channel is estimated to be weak (as home equity withdrawal is not possible in France), some wealth effect51 with an impact on consumption adjustment may still materialise if the house prices contract substantially.
Nevertheless, some mitigating factors exist. First, the savings rate of French households is high in international comparison. Second, there are important social safety nets which mitigate the decrease in borrowers’ income in case of unemployment. Third, a large share of borrowers are not exposed to interest rate shocks due to the very large share of fixed rate loans (>90%). Fourth, the guarantee schemes include a double-monitoring of borrower quality: first by the bank and then by the guarantor, with both having the option to reject a loan request.
Flow vulnerabilities
Funding
The growth in housing loans has been relatively strong both over the short term (3.8% real annual growth rate of loans adjusted for sales and securitisations in Q3 2018) and the medium term (the three-year average of real housing lending growth in Q3 2018 was 4.5%), but still below pre-2008 dynamics. However, the growth in new housing loans (excluding renegotiations) is elevated with flows over one year amounting to around 18% relative to the stock of credit of the previous year (Q2 2018). Moreover, there are signs that credit standards are looser than in the past (but not as loose as before 2008) from the European perspective, and deteriorating. The share of new loans with the LTV values over 95% was on average close to 40% (over 2018, 38.4% of new loans), which is high from the cross-country perspective. Moreover, the average LTI of new loans increased for the fourth consecutive year and reached a historical peak of 5 in 2017, while the median maturity of housing loans among reporting French banks also increased (20.1 years in December 2018 compared with 18.5 in January 2011). The absolute DSTI average values may appear prudent in international comparison, but there was a recent slight deterioration in the share of new loans with DSTI>35%, which approached 30% in December 2018 (after remaining at approximately 25% between 2013 and 2017). Moreover, there is some indication that young and lower-income households tend to have high DSTI ratios. The recent trend in lending standards derives in part from the low interest rate environment, leading to raised loan volumes (and thus LTV 51 Guerrieri, C. and Mendicino, C. (2018), “Wealth effects in the euro area”, Working Paper Series, No 2157, ECB, June.

Vulnerabilities in the residential real estate sectors of the EEA countries / September 2019 France 92
and LTI levels) with increased maturities, without DSTI deterioration (especially in the French context of fixed rate loans). Preliminary micro data used by the French authorities to monitor these developments suggest that a large part of high LTV or high DSTI borrowers are wealthy households with collateral and guarantees.
Housing loans are typically collateralised by a guarantee issued by specialised funds, and not by the property value. This practice, combined with the full-recourse framework, might protect banks from household defaults52. However, in the event of systemic risk materialising, the guarantee scheme may only partially insulate the financial system against negative consequences, given the tight links between guarantors and banks. Nevertheless, a dedicated stress test of the guarantors (“guarantor stress test”) was performed by the ACPR, consistent with the EBA stress test in terms of scenarios and assumptions. The guarantor stress test, supervised by the ACPR and performed for three French guarantors, confirms that these guarantors would be able to withstand the adverse scenario and meet minimum capital requirements.
Interactions and transmission channels
Household indebtedness in France is elevated and has continued to increase over the past few years. The growth in housing loans has been relatively strong both over the short and medium term, and there is evidence that lending standards are somewhat deteriorating, which could lead to the accumulation of riskier loans going forward. Moreover, there are signs of elevated house price levels in certain large cities, which, coupled with high LTV values, could make the overall financial system vulnerable to potential significant price corrections, with indirect effects on net household wealth and guarantors’ resilience.
The interaction of the above-mentioned vulnerabilities in the event of economic or financial shocks could generate systemic risk with both direct and indirect effects, as soon as the mitigating factors are no longer considered sufficient to prevent the risks from materialising. More specifically, as regards direct credit risks, the guarantee scheme may only partially insulate the financial system against negative consequences, given the tight links between guarantors and banks. In particular, the guarantees are issued by private entities, which are credit institutions owned by the biggest banks or insurance companies that are also tied to banks. However, these institutions appear to be resilient in the stress testing performed by the ACPR.
With regard to indirect credit risks, an economic shock, for instance, could lead to some of the above-mentioned vulnerabilities related to household indebtedness crystallising. This could happen if, for example, unemployment increases and leads to a drop in income, causing some households difficulties in servicing their debts. The associated negative household income and contraction of consumption may reinforce the initial shock leading to second-round effects.
52 The debtor does not choose the type of collateral to pledge: the debtors with good credit profiles are selected to be issued
a guarantee. The selected debtors pay an initial fee for the guarantee. In the event of default, the bank receives the guarantee from the fund and the fund should work out the recovery of the loan. In theory, if no amicable solution can be found with the debtor, the guarantor can register a mortgage by court order and the property may be sold to repay the loan.

Vulnerabilities in the residential real estate sectors of the EEA countries / September 2019 France 93
Policy assessment – partially appropriate and partially sufficient
Policy mix
• CCyB at 0.5% (applicable from July 2020, and 0.25% applicable since July 2019)
Policy appropriateness
Given the identified systemic risks, macroprudential policy is deemed partially appropriate. In general, capital measures such as risk weight add-ons or buffers are appropriate to address stock vulnerabilities. In fact, the CCyB in France was calibrated at 0.5% to preventively build up the resilience of banks, taking into account the dynamism of indebtedness of the non-financial sector in France more broadly and household lending supported by the recovery of residential property prices. Therefore, the capital measures are regarded as appropriately addressing the identified stock vulnerabilities related to residential real estate.
However, regarding flow vulnerabilities, the increase in household indebtedness coupled with deterioration in lending standards calls for explicit guidance on lending standards. The efforts made by the French authorities to monitor systemic risks in the residential real estate sector as well as their aim to further improve the monitoring framework in accordance with Recommendation ESRB/2016/14 of the ESRB53 are fully acknowledged. Nevertheless, further actions may be needed to mitigate the systemic risk. In particular, given the rising household indebtedness and signs of deteriorating lending standards, the national authorities in France could consider pre-emptive action such as proposing explicit guidelines for lending standards, either in the form of a recommendation or formal borrower-based measures.
Policy sufficiency
Macroprudential policy addressing residential real estate vulnerabilities is assessed as partially sufficient, given that it is considered partially appropriate. The CCyB is calibrated to take into account credit developments, including housing lending, and to ensure overall banking resilience to cyclical vulnerabilities. Nevertheless, vulnerabilities related to increasing household indebtedness and potential second-round effects may not be sufficiently addressed by the current macroprudential measures. In particular, given the emerging household vulnerabilities, national authorities could consider pre-emptive action such as proposing explicit guidelines for lending standards, either in the form of a recommendation or formal borrower-based measures.
53 ESRB Recommendation ESRB/2016/14 on closing real estate data gaps (OJ C 31, 31.1.2017, p. 1–42).

Vulnerabilities in the residential real estate sectors of the EEA countries / September 2019 Germany 94
Cyclical position: firm expansion
Key vulnerabilities
• House price overvaluation
• Elevated house price growth (recently but also over the medium term)
• Some signs of loosening of lending standards; however, there is uncertainty regarding lending standards due to significant data gaps
Risk assessment – medium risk
Stock vulnerabilities
Collateral
Similar to the results in 2016 and 2017, existing estimates for 2018 point to a high overvaluation of house prices in the urban areas (by between 15% and 30% according to Deutsche Bundesbank estimations, and 20% according to the IMF).
Household
Household indebtedness (at 53% of GDP in Q2 2018 and 84.8% of household income in Q3 2018) can be considered moderate in EU comparison. However, even though the home ownership rate in Germany is the lowest in the EU, the share of homeowners with a mortgage is 25% of the total population, which is roughly the EU average. For this reason, potential negative developments in the RRE markets, e.g. as a result of an economic or financial shock may have negative direct and indirect effects on financial stability. For instance, if unemployment increases and/or household income growth falls, some households may find it more difficult to service their debts. The associated negative household income and wealth effects may reinforce the initial shock e.g. if households need to reduce consumption in order to service their housing loans. This can lead to second-round effects and increase risks to the banks and the financial system. However, one should note that the long periods of mortgage interest rate fixation mitigate the risk of increasing interest rates for borrowers. Given the positive income prospects for private households, the persistent favourable labour market conditions and the ESRB scoreboard risk assessment results, potential risks from the household stretch appear to be rather low.
Flow vulnerabilities
Collateral
Following a period of gradual growth, real house price growth has increased in recent years (5.5% in Q3 2018), slightly outpacing the growth in household income. Also, the house price dynamic has become more broad-based across urban and rural areas. While the house price increases in the large cities and urban areas reflect a shortage of supply relative to demand, the German Federal
Germany
Vulnerabilities in the residential real estate sectors of the EEA countries / September 2019 Germany 95
Government has introduced a number of measures aimed at alleviating the shortages of available housing. Therefore, going forward, the further house price dynamics may depend on the effects of these measures.
Funding
Despite a recent pick-up in new lending, the annual growth in housing credit has been moderate over the past three years (reaching a 2.7% real growth, after adjusting for sales and securitisation, in Q4 2018). Results of the quarterly Eurosystem Bank Lending Survey (BLS) for Q1 2019 show that the 34 responding banks in Germany have slightly tightened their credit standards for housing loans recently, having left them unchanged in Q4 2018 and having shown easing tendencies in five consecutive quarters before that. Additionally, the level of credit standards was relatively tight in the first quarter of 2019 in longer-term comparison, according to the BLS. The results of the BLS do not suggest that banks have eased the lending standards in terms of LTV ratios. The BLS further suggests that the surveyed banks have tightened their margins on loans for house purchases in recent years.
Non-representative information provided by a loan brokerage platform indicates that the importance of loan applications with high sustainable LTV ratios has tended to increase. Since the sustainable LTV is calculated based on the mortgage lending value rather than the market value of the property, it is a conservative measure of LTV (see Section 16(2) of the Pfandbrief Act, or Pfandbriefgesetz). A comprehensive analysis is currently hindered by the lack of detailed data on LTVs as well as other credit ratios for newly provided loans. We welcome the comprehensive survey conducted by BaFin and the Deutsche Bundesbank in 2019 among German banks in order to broaden the information basis on lending standards for loans for house purchases both for newly granted loans as well as loans which have been granted in recent years.
Interactions and transmission channels
Potential direct flow vulnerabilities relate to the provision of new loans in an environment of overvalued house prices as well as uncertainties regarding lending standards due to significant data gaps. Also, beyond overvalued house prices, potential direct stock vulnerabilities may relate to existing loans provided in the last years when the house prices overvaluation was accumulating.
Policy assessment – partially appropriate and partially sufficient
Policy mix
• CCyB at 0.25% (applicable from July 2020)
Policy appropriateness
There are currently no macroprudential measures in place in Germany to mitigate the identified vulnerabilities related to residential real estate. Given the medium level of risk assessed, based on the evidence of stock vulnerabilities and potential flow vulnerabilities, the policy stance is considered partially appropriate.
Germany could use capital-based measures requiring banks to create additional capital buffers against cyclical risks and vulnerabilities that might have accumulated, given the rapidly evolving

Vulnerabilities in the residential real estate sectors of the EEA countries / September 2019 Germany 96
housing price dynamics and the overvaluation of house prices that has already existed for several years. With respect to this, the recommendation made by the Financial Stability Committee (Ausschuss für Finanzstabilität) to BaFin to increase the countercyclical capital buffer rate from 0% to 0.25% in order to preventively build up the resilience of banks, is a welcome step. The recommended calibration has taken into account the credit dynamics in Germany, accompanied by the strong residential property price dynamics. However, it is not expected to curb the housing credit growth or halt the potential deterioration in lending standards. The national authorities have been monitoring credit conditions, but there has been no formal guidance from them on what should be included in prudent standards.
Given some signs of loosening individual lending standards derived from the available information and the high house price overvaluation in the large cities and urban areas of Germany, the authorities should contribute to ensuring sound lending standards for new loans in an appropriate manner (e.g. through a recommendation or activation of legally binding LTV limits, if the legal conditions for the activation are met), so that credit providers can act pre-emptively against a build-up of vulnerabilities, thus fostering financial stability. In addition, to ensure a truly comprehensive analysis and an efficient macroprudential policy framework, it is important that the national authorities close the data gaps on lending standards for new loans.
Against this background, and as already proposed by the German Financial Stability Committee in 2015, it is also important that national authorities have all necessary macroprudential instruments at their disposal to have the power to address potential financial stability vulnerabilities, in particular the powers to set legally binding limits on DTI and DSTI ratios for new housing loans when necessary.
Moreover, to ensure truly comprehensive analysis and efficient macroprudential policy when needed, it is important that the national authorities close the data gaps on lending standards for new loans.
Policy sufficiency
There are currently no macroprudential measures in place to mitigate the existing vulnerabilities. However, the German authorities are closely monitoring the situation in the German residential real estate markets and using public communication tools to increase awareness of the risks. Given the identified medium level of risk and the policy assessment of partial appropriateness, the policy stance is regarded as partially sufficient.
National authorities in Germany have the power to set legally binding LTV limits if deemed necessary to guarantee financial stability, when at least risks to financial stability from strongly increasing house prices and strongly increasing mortgage lending accompanied by a substantial loosening of lending standards are identified. Moreover, authorities have the possibility to emphasise the importance of sound lending standards for new housing loans in the appropriate form. In addition, national authorities have the possibility to use capital-based measures for banks to create additional capital buffers against cyclical risks and vulnerabilities that might have been accumulated, inter alia, with the rapid housing price dynamics and the overvaluation of house prices.

Vulnerabilities in the residential real estate sectors of the EEA countries / September 2019 Iceland 97
Cyclical position: firm expansion
Key vulnerabilities
• High but decreasing household indebtedness
• High housing price growth in the medium term
• Signs of house price overvaluation
• Some concerns about lending standards
Risk assessment – medium risk
Stock vulnerabilities
Collateral
There are signs of housing price overvaluation, as prices have been growing steadily for the past eight years. House price appreciation has decelerated in recent quarters but remains positive. National authorities concur that there is some overvaluation on the Icelandic housing market. At the moment, forward-looking concerns about the possible effects of a sudden price correction in the financial system are fairly contained.
Household
Household indebtedness is high in international comparison. In spite of strong deceleration in recent years, it stood at 145% of disposable income at the end of 2018. Furthermore, around 77% of household debt is made up of mortgages and Iceland has the highest share of homeowners with housing loans in Europe, which makes them sensitive to changes in house prices. As a mitigating factor, a large portion of indebted households are insulated from interest rate movements because of fixed interest rates. Households are highly exposed to consumer price movements, since CPI-indexed loans are historically very common in Iceland.54 Nearly 80% of housing loans are CPI-indexed (Q4 2018). It is quite common for the loans to be combined with negative amortisation schedules for the first half of the repayment period. This can heighten the magnitude of potential macroeconomic shocks through negative home equity. Furthermore, in the event of economic distress coupled with increasing inflation, about 80% of households would not see their debt eroded by inflation. However, CPI-indexed loans smooth out debt service in times of increased inflation when non-indexed interest rates usually increase debt service. As a result, the negative effects on household (HH) consumption are mitigated to some extent, which can dampen potential macroeconomic shocks. Greater probability of HH being able to service their housing loans in high inflation leads to fewer HH bankruptcies in stress situations, which reduces the effect of negative 54 The CPI-indexed loan is a contract where the loan amount is linked to the consumer price index and the interest rate is kept
fixed (for more details see Elíasson, L. (2014), Indexation 101, Economic Affairs Paper No 6, Central Bank of Iceland, January).
Iceland
Vulnerabilities in the residential real estate sectors of the EEA countries / September 2019 Iceland 98
home equity on bank losses and financial stability. The transmission channel of negative equity is also mitigated by the fact that the LTV is very low (53% for households that hold any mortgages). Moreover, the Icelandic government has publicly stated that it will look to reduce the prevalence of CPI-indexed loans55 and there are currently proposals to limit the maturity of certain loans of this type to 25 years, which would greatly limit the risk of negative amortisation schedules and negative equity. Another mitigating factor is the fact that most households are allowed to withdraw a portion of their private pension funds and use it to either service RRE debt or directly reduce the principal without having to pay income taxes on the amount withdrawn.
Flow vulnerabilities
Collateral
Housing price growth has been strong in the past three years (8.7% average growth rate in annual terms in Q3 2018), but has recently decelerated (average y-o-y quarterly growth rates over one year of 2.6% in Q3 2018). House prices rose steeply during a period of fast growth in the tourism industry in the years 2014 to 2017 (10% average real growth rate in annual terms), but has recently decelerated (average y-o-y quarterly real growth rates over one year of 1.9% in Q1 2019). Building costs, income growth, increased net migration flows and short-term rental contracts (demand generated by tourism) have all contributed to this cyclical development. Recent supply increases have coincided with two of Iceland's main export industries experiencing negative supply shocks56, which has heightened uncertainty about future economic developments.
Funding
Households have been transforming expensive consumer loans into less expensive mortgages. RRE credit growth rate has been picking up over the last two years (3.5% average y-o-y real growth rate in Q3 2018). Credit growth has been increasing at a moderate pace, by 3% on average annually in real terms over the past 3 years and by 4.9% in the past year (Q3 2018, average over 4 quarters). The average LTV for outstanding loans (53%) appear to be prudent. A share of 1% of debtors had an LTV of over 100% in Q1 2019. However, there is concern about households’ DTI (computed using net total income and total debt) and DSTI. Between the beginning of 2016 and the start of 2019, 17% of new RRE loans to households were to households with DTI of over 6 and 18% with DSTI of over 40%. However, the number of highly indebted households is quite low, with only around 5% of households having a DTI of over 5. Furthermore, the average DTI has been steadily decreasing since 2010, which may imply that the high share of households with DTI of over 6 in terms of household debt may be caused by a lingering impact from the 2008 financial crisis and the following recession. The latest supervisory stress test, which included a severe drop in the price of residential real estate57 in conjunction with a severe scenario for the real economy, show that the three main banks have considerable resilience towards such an event.58 Moreover, the RRE portfolios are diversified between the three largest banks (56%), pension funds (26%) and the
55 Government of Iceland’s proposals. 56 Capelin catch failure and a drop in airline passenger numbers. 57 The price decrease was about 15% in nominal terms and significantly over 25% in real terms. 58 Central Bank of Iceland (2019), Financial Stability Report 2019/1, Vol. 24, April.

Vulnerabilities in the residential real estate sectors of the EEA countries / September 2019 Iceland 99
government housing fund (18%). Around a third of bank loans and 12% of pension funds’ assets are RRE loans.
Interactions and transmission channels
The housing lending dynamics, supported by both the banking and non-banking sectors add additional pressure to the already high level of household indebtedness. Moreover, as household indebtedness is particularly high, an economic downturn may generate defaults and direct losses for the financial system, while reducing overall consumption.
Policy assessment – partially appropriate and partially sufficient
Policy mix
• LTV at 85% (90% for first-time buyers)
• Borrower’s affordability tests for household mortgage lending (equivalent to a soft DSTI)
• CCyB at 2% (applicable from February 2020, currently 1.75%)
• SyRB at 3%
• Stress testing
Policy appropriateness
The policy addresses both flow and stock vulnerabilities, and the LTV measure is applied to all lenders, thus avoiding potential leakages across sectors. The LTV limit was implemented in the build-up phase of the financial cycle to strengthen the resilience of borrowers, prevent deterioration in lending standards and mitigate excessive credit and house price growth. Currently, the national authorities see it as a structural measure, but they might decide to use it cyclically if needed. There is also a harmonised legal requirement for creditworthiness assessments before new mortgages are issued. The assessments have been restrictive for many potential borrowers, especially those with lower incomes.
Nevertheless, income-based measures such as a DTI limit might help to maintain prudent lending standards. For example, if the economy were to continue to expand rapidly despite the current outlook and, as a result, house prices were to start growing at a fast pace, the current LTV limit would have a restricted effect. In this scenario, income-based measures would be more appropriate. Credit growth has been positive since the end of 2016, but it is still moderate. The capital-based measures (the CCyB rate and the SyRB rate) were implemented to strengthen the resilience of banks against the materialisation of vulnerabilities stemming from private sector indebtedness, coupled with a housing price overvaluation. Nevertheless, the current capital buffers are broad and do not specifically target RRE vulnerabilities. Moreover, they do not apply to non-bank lenders (such as pension funds) which are more prominent in the Icelandic mortgage market than in many other countries. For this reason, income-based measures would be a logical next step in case RRE-related vulnerabilities continued to build up in the financial system.

Vulnerabilities in the residential real estate sectors of the EEA countries / September 2019 Iceland 100
Policy sufficiency
The macroprudential measures seem to be adequately calibrated, the CCyB and the SyRB are expected to increase bank resilience, and the LTV limit is set prudently in international comparison, while being also legally binding for the banking sector and other lenders (moreover, pension funds also comply with their own regulations which set an LTV cap at 75%59). The flow vulnerabilities have been present for some time and may warrant a need to consider some income-based measures, which would complement the LTV in order to ensure prudent lending standards going forward. A potential implementation of income-based measures needs to take into account the macroeconomic outlook and the position in the financial cycle, so that it does not create more costs than benefits for the economy.
59 “Technically pension funds could provide a loan with a higher loan to value, but that loan would be classified as an
investment with a higher risk than mortgage loans in general” (EIOPA (2018), Financial Stability Report, June).

Vulnerabilities in the residential real estate sectors of the EEA countries / September 2019 Ireland 101
Cyclical position: firm expansion
Key vulnerabilities
• Elevated but declining household indebtedness
• High house price growth
Risk assessment – medium risk
Stock vulnerabilities
Household
Household indebtedness has declined significantly since the last financial crisis (from almost 220% to about 128% of disposable income between 2011 and 2018). Nevertheless, a high share of outstanding loans (80%) carry variable or tracker interest rates and the debt may be unevenly distributed across the households. In addition, a significant share of households remain in late-stage arrears and/or are under restructuring conditions. The still high share of new housing loans with variable interest rates or short (< 3y) interest rate fixation periods (51%) warrant monitoring.
Flow vulnerabilities
Collateral
Housing prices have grown by 11.3% (real annual growth) in Q3 2018 and by 9.9% (real annual growth) over the past three years. This dynamic has been coupled with high levels of investment in construction, albeit coming from a low base, which may contribute to the house price decrease if the economic cycle turns around. On the other hand, this effect is to some extent mitigated by legal and structural limits to supply (high building costs, impaired balance sheets of construction firms, skill shortages and land hoarding). Furthermore, a significant (although declining) part of the RRE transactions are non-mortgage financed, which may to some extent limit the vulnerabilities connected to the collateral values. While recent increases in house prices have outpaced income growth, available estimates do not point to an overvaluation (Central Bank of Ireland’s own valuation metrics indicate that house prices are now in line with or just above values justified by economic fundamentals).
Funding
Despite the recent increases in new lending, housing credit has declined by 0.8% annually over the past three years. Overall lending standards appear to be stable. Average LTIs and LTVs have remained relatively unchanged over the past year across borrower types, while there have been some increases in the shares of loans with LTI of between 3.25 and 3.5 and LTV of between 89% and 90%, respectively. Currently, about 50% of FTBs have maturities of over 30 years. As factors mitigating these vulnerabilities, both average RWs on IRB RRE portfolios (35%) and total capital ratio (22%) can be considered significant in the comparison of EU countries, even though the
Ireland

Vulnerabilities in the residential real estate sectors of the EEA countries / September 2019 Ireland 102
significance of these factors is to some extent limited by the fact that the share of NPLs from the past remains high.
Interactions and transmission channels
A high growth in house price represents a source of direct flow vulnerabilities for financial stability, as lending is expected to pick up. Household indebtedness remains relatively high, in spite of the strong deceleration. Therefore, some debtors remain vulnerable to potential changes in macroeconomic and real estate conditions. This can have potential direct and indirect consequences for the banking sector, which still carries some legacy NPL issues.
Policy assessment – fully appropriate and fully sufficient
Policy mix
• CCyB at 1% (applicable from July 2019)
• LTV limit (FTBs: 90% with 5% of new mortgages above the limit, SSBs: 80% with 20% of new mortgages above the limit, BTL: 70% with 10% of new mortgages above the limit)
• LTI limit (3.5 with the following share of new mortgages above this limit: FTBs: 20%, SSBs: 10%)
Policy appropriateness
Flow vulnerabilities are the most pronounced, while stock vulnerabilities are mainly related to legacy issues. Authorities have therefore implemented borrower-based measures to address primarily the growth in housing prices (by LTV limits), also in relation to incomes (by LTI limits). Also, authorities have done so in a timely manner. Positive CCyB rate may further support banks’ resilience.
Policy sufficiency
The LTV limit was calibrated based on the past experience with losses of loan defaults, and it should currently provide sufficient security against a potential accumulation in house price overvaluation. While the house prices have continued to grow significantly after these limits were introduced, this may be related to the high share of non-mortgage-financed purchases (and to housing supply shortages). The LTI limit was calibrated based on the past experience of DSTI levels with payment difficulties, making prudent assumptions about possible increases in interest rates and maximum maturity of the loans. The calibration of the LTV and LTI limits is re-assessed every year. Besides this, the Central Bank of Ireland has committed itself to reassess the need to introduce limits on DTI once the information on the debt structure becomes available for new loans.
Vulnerabilities in the residential real estate sectors of the EEA countries / September 2019 Luxembourg 103
Cyclical position: firm expansion
Key vulnerabilities
• High household indebtedness
• High housing lending growth and concerns regarding lending standards
• House price overvaluation
Risk assessment – high risk
Stock vulnerabilities
Household
The high and increasing level of household indebtedness is a main source of vulnerability in Luxembourg. It stood at 171% of disposable income in Q4 2017 and 72% of GDP in Q3 2018. The vulnerabilities are also amplified by the share of loans with a variable interest rate, which represent around 75% of outstanding loans (September 2017) and around 43% of flows of new lending (October 2018). Moreover, the distribution of debt by net wealth shows that households with less net wealth hold more mortgage debt, in relative terms. The real estate market in Luxembourg is also dominated by owner-occupied housing (73% in 2017), which implies a transmission channel for collateral risk.
Collateral
Various statistical indicators show a positive gap of housing prices from a long-term average. The Banque centrale du Luxembourg’s valuation models also point to some tentative signs of overvaluation. Moreover, the housing price growth has significantly surpassed the growth of household income over the past ten years. Housing demand is fuelled by demographic factors, such as positive net migration, as well as the low interest rate environment. The limited supply of dwellings is constrained by land availability60 and a limited number of construction permits combined with a cumbersome process for obtaining building permits. On the other hand, net migration may act as a mitigating factor in case the flow of immigrants is of a permanent rather than temporary nature; in this case, they would continue to support demand for housing if prices drop. If, however, the migration flows are affected by business cycle movements, they would only aggravate tensions in the housing market in the event of an economic downturn.
60 The issues have more to do with using the available land for construction rather than the lack of available land per se. The
majority of land is owned by private individuals (92%) who are reluctant to sell their property because: i) land tax is very small, ii) growing RRE prices are an incentive for long-term wealth accumulation, and/or iii) cultural reasons.
Luxembourg
Vulnerabilities in the residential real estate sectors of the EEA countries / September 2019 Luxembourg 104
Flow vulnerabilities
Funding
Lending for house purchases has been growing strongly, by 6.1% over the past year (adjusted for sales and securitisations, Q3 2018) and by 6.3% per year on average over the past three years (Q4 2018). There is uncertainty regarding the lending standards due to only a recent data collection; the most recent (preliminary) data point to some concerns that there may be pockets of vulnerabilities related to lending standards. Given the recent implementation of the monitoring framework of lending standards, the data are expected to improve and reveal more information about the potential sources of risk. The bank exposures to RRE are significant in relation to GDP (63%), and moderate relative to banks assets (35% of total loans). Housing lending is concentrated in a small number of domestic credit institutions, which would imply that they are particularly vulnerable to potential housing market deterioration.
Interactions and transmission channels
Steady and strong credit dynamics may exacerbate the vulnerability associated with household indebtedness. Given the long-term growth in housing prices and overvaluation, as well as the concerns about lending standards, a potential downturn of the real estate market may affect the net wealth of households and their capacity to repay their loans, also generating losses for banks. The high household indebtedness level might amplify adverse shocks, e.g. in the event of a house price reversal. This could lead to a decline in consumption, investment and GDP, and affect demand, including that for real estate.
Policy assessment – partially appropriate and partially sufficient
Policy mix
• Risk weight floors of 15% for exposures to Luxembourg residential real estate of IRB banks
• CCyB at 0.25% (applicable from January 2020)
Policy appropriateness
The high level of stock vulnerability implies the need for capital-based measures to ensure banks resilience. In this sense, the risk weight floor and the CCyB are appropriate measures. However, the price and credit dynamics, alongside concerns about potentially loose credit standards, indicate the need for an activation of borrower-based measures, which are not in place. Recently, authorities have implemented a monitoring framework for lending standards and this is expected to improve their assessment of the sources of risk and help with any future implementation of borrower-based measures. The national authorities have taken steps to adopt a legal framework in order to implement such instruments, but the process is still ongoing.
Policy sufficiency
The current capital measures in place may seem sufficient to address the existing stock vulnerabilities. The activation of the CCyB is much welcomed and provides a signalling effect until it comes into force in 2020. Overall, the banks that provide much of the mortgage lending appear to

Vulnerabilities in the residential real estate sectors of the EEA countries / September 2019 Luxembourg 105
be very well capitalised. However, the identified flow vulnerabilities are currently not addressed by any measure. The credit and price dynamics, and the potentially loose credit standards, imply the need for an implementation of borrower-based measures.

Vulnerabilities in the residential real estate sectors of the EEA countries / September 2019 Malta 106
Cyclical position: firm expansion
Key vulnerabilities
• Moderate but prolonged house price growth
• Elevated housing lending growth
• Elevated household debt
Risk assessment – medium risk
Stock vulnerabilities
Household
Household debt has decreased when expressed as a share of disposable income, but remains fairly high in international comparison61, at around 89% of disposable income and 49% of GDP in Q3 2018. On the other hand, the share of homeowners with a mortgage (22%) is below the average of the EU, meaning that the mortgage debt is relatively concentrated within the household sector. Overall, such a level of indebtedness would make households susceptible to consumption adjustments in the event of a macroeconomic shock. This risk is to some extent mitigated by a very high share of liquid assets on household balance sheets. However, there is no micro evidence on the distribution of assets among households, so we cannot know if asset holdings would necessarily help those overly indebted.
Flow vulnerabilities
Collateral
House price increases have moderated in the past years, but house price developments remain a risk given a prolonged period of growth and possible future demand pressures. The fast-growing main economic sectors, net migration, buoyant tourism and tax benefits have supported high demand for real estate and any change in these underlying factors could lead to significant adjustments. Depending on the data used, some valuations point to strong undervaluation while others indicate fair values or slight overvaluation. The IMF highlights an interesting decoupling between advertised prices and transaction-based prices, with the former registering an overvaluation of between 5% and 10%62. Meanwhile, the ECB demand model indicates that property prices may still be undervalued by more than 20%.
61 The risks associated to household debt are also highlighted in IMF (2019), Malta: Financial System Stability
Assessment, February. 62 ibid.
Malta
Vulnerabilities in the residential real estate sectors of the EEA countries / September 2019 Malta 107
Funding
Housing credit has grown substantially, by 7.3% (average real annual growth) in Q4 2018 over the past three years. Housing loans adjusted for sales and securitisations grew by 6.1% over the past year (Q3 2018). The growth of actual new loans (including renegotiations) is less strong, standing at around 12% relative to the stock of loans from the previous year, in Q2 2018. Moreover, during the first three quarters of 2018 credit standards remained relatively tight as evidenced by the weighted average loan-to-value and debt service-to-income ratios for residential real estate loans, which stood at 72.9% and 23.7%, respectively. Authorities have stress-tested the households’ DSTI with an interest rate shock of 150bps and results show that only about 4% of all mortgages would exceed a DSTI of 40. Banks appear to be well capitalised and profitable, but the core credit institutions are substantially involved in real estate lending (around 65% of bank exposures are real estate-related), which implies a heightened sensitivity to a potential correction in property prices. NFC lending for commercial real estate is also very strong, which implies more risk due to the interconnection between RRE and CRE developments. Banks have nevertheless tried to move away from exposures to construction and real estate, where the concentration of lending was on few borrowers, towards housing credit spread over a larger borrower base.
Interactions and transmission channels
The growth rate of mortgage lending could create some challenges to keeping household indebtedness stable over the medium term. The real estate exposures are of systemic importance for banks and, in the event of an RRE downturn, direct risks could be considerable. The fact that lending standards remain prudent may help mitigate direct risks to some extent. Indirect risks may also arise if indebted households experience a financial shock, but the strong household financial wealth could act as a mitigating factor.
Policy assessment – fully appropriate and fully sufficient
Policy mix
• LTV limit between 75% and 90%, by category of debtor
• DSTI limit of 40% with interest rate stress test (+1.5 pp)
• Maturity limit of between 25 and 40 years, by category of debtor;
• 35% RW for loans having LTV at or below 70%, with the rest assigned a 100% RW
Policy appropriateness
The new policy package is deemed appropriate to prevent accumulation of risky loans, given the strong housing lending dynamics. The stock risk stemming from the household debt level is addressed by the RW measure.
Policy sufficiency
Vulnerabilities are considered to be at a medium level both in terms of flow and stock vulnerabilities, so the RW measure and the new borrower-based measures are expected to be fully

Vulnerabilities in the residential real estate sectors of the EEA countries / September 2019 Malta 108
sufficient to address the vulnerabilities related to household indebtedness and prevent the emergence of risky loans by ensuring prudent lending standards.
Vulnerabilities in the residential real estate sectors of the EEA countries / September 2019 Netherlands 109
Cyclical position: firm expansion
Key vulnerabilities
• High household indebtedness
• Signs of housing price overvaluation
• Elevated house price growth
• Loose lending standards for new and outstanding loans
Risk assessment – high risk
Stock vulnerabilities
Collateral
After a correction phase of the earlier market exuberance which lasted from 2008 to 2013, the Dutch housing market has regained its momentum. The persistent house price growth has led to pockets of overvaluation, particularly in the capital and other large cities. Authorities have observed a spillover effect from the major cities, as prices in the surrounding regions have also been rising sharply. Prices are close to their historic highs, and cumulated housing price growth over the past five years has substantially surpassed the growth in household income. This development has been fuelled by incentives such as mortgage tax deductibility and the low interest rate environment. Furthermore, residential properties have attracted investors, which in combination with existing supply constraints fuelled house price growth further. Zoning regulations are strict and space (mainly in and around cities) is scarce, resulting in a low elasticity of housing supply. Moreover, as a result of the financial crisis, the capacity of the construction sector is currently limited, which is expected to continue to suppress the supply of new houses in the medium term.
Funding
Outstanding loans have high LTV values in international comparison and high LTIs. In addition to this, a large part of loans are not fully amortising (50% of the loans are interest-only), which contributes to debt accumulation and further household vulnerability. Moreover, the average RW of housing loans of banks using the IRB approach is rather low in international comparison (12.2% in Q2 2018). Furthermore, the high household debt is reflected in large mortgage exposures of the Dutch banking sector (47% of bank assets and 68% of GDP).
Household
Household indebtedness is among the highest in Europe: 210% of disposable income (Q3 2018) and 104% of GDP (Q1 2018). Households’ vulnerability may be amplified by the presence of variable interest rate loans (15% of new loans in 2017), and by a large share of interest-only loans. The share of homeowners with negative home equity is currently 6%.
Netherlands

Vulnerabilities in the residential real estate sectors of the EEA countries / September 2019 Netherlands 110
Flow vulnerabilities
Collateral
Housing prices have been growing strongly by 6.9% on average over the past year and by 7% per year on average over the past three years. The dynamics is driven by the same factors that have generated overvaluation in the pre-crisis period. National authorities also point to the increased transaction activity, as new sales of existing properties have reached record numbers.
Funding
Housing credit growth has been fairly low recently. Nevertheless, the growth rate of pure new loans stands at 11% relative to the stock of the previous year. The average LTV of new loans has been decreasing, but it is still very high at 90%; 40% of loans are then provided with an LTV of over 90% (67% of loans to first-time buyers). The average LTI ratio of new loans has been gradually increasing, currently reaching the value of 4. Moreover, new loans have been accumulating close to the maximum values which are implied by the DSTI limit under the assumption of a 30-year maturity of the loans. There is no indication either of deceleration of non-amortising loans in the production of new credit. The DSTI limit for mortgage loans has important risk-mitigating characteristics, such as the application of ‘stressed’ DSTI caps with a 5% interest rate for mortgage loans that have interest rates fixed for a period shorter than ten years. However, the method used to calculate the DSTI cap may be pro-cyclical, as changes in disposable income influence the cap.
Interactions and transmission channels
In the light of the price correction that occurred from 2008 to 2013, the risk channels for Netherlands seem to concentrate on "underwater" mortgages and negative consumption effects. Given the indication of overvaluation and the high price increases as well as the high LTV ratios, corrections in housing prices may generate substantial adjustments of expenses for households with high levels of debt.
Policy assessment – partially appropriate and partially sufficient
Policy mix
• LTV limit of 100%
• DSTI limits (from 10.5% to 35%) in a matrix by income and interest rate levels63
• Maturity limit of 30 years for eligibility for tax deductibility of mortgage interest payments
Policy appropriateness
Both stock and flow vulnerabilities are present in Netherlands. The LTV and DSTI measures, coupled with the maturity restriction for tax deductibility, seem fully appropriate to counteract loose lending standards and potentially insulate banks and other lenders as well as households from housing price developments. However, the authorities should also implement capital measures 63 Table from the Dutch Government’s financing load percentages.

Vulnerabilities in the residential real estate sectors of the EEA countries / September 2019 Netherlands 111
which would be calibrated to mitigate vulnerabilities associated with residential real estate risks, as the stock vulnerabilities associated with household indebtedness and signs of overvaluation are high in Netherlands. The average risk weight of RRE exposures of IRB banks is low in international comparison (12.2% in Q3 2018, compared with almost 16% for the EEA average). Bigger banks, which are the ones usually applying the IRB approach, have to hold the systemic risk buffer, but this is calibrated for various risks and might actually incentivise banks to grant real estate loans, since they typically have lower risk weights compared with other retail and corporate loans. Setting the same LTV and DSTI limits for all mortgage lending, independent of the type of lender (e.g. bank, insurer, pension fund) prevents leakages to a large extent. However, from the forward-looking perspective, the macroprudential authority should be given more direct powers with regard to the implementation of the borrower-based measures through legally binding acts, to be able to react in a flexible way to any sources of systemic risk that may emerge.
Policy sufficiency
In contrast to the evaluation of policy appropriateness, the policy mix is not entirely sufficient to mitigate the existing vulnerabilities. The LTV cap is set at a level which is very high in absolute terms, relative to the degree of overvaluation, and in international comparison. Therefore, the LTV limit should be tightened. Moreover, the large share of non-amortising loans is currently not sufficiently addressed by the current mix of borrower-based measures. The DSTI limit has important risk-mitigating characteristics, but the method used to calculate it appears to be pro-cyclical, as changes in disposable income influence the cap. This has reduced the effectiveness of the DSTI limit in ensuring sustainable borrowing to households. Although some adjustments have been made to address these issues, such as taking four-year averages of the calculated ratios rather than annual data as input for the calibration, certain pro-cyclical elements remain. Regarding capital measures, for the level of stock vulnerabilities associated with the household indebtedness and housing price overvaluation, authorities should consider additional capital requirements to increase bank resilience. As the average RW of mortgage portfolios of IRB banks is rather low in the European comparison, more targeted capital measures like risk weight add-on should be considered. Apart from this, changes in other policy areas like treatment of the mortgage tax deductibility and rental market regulation would support the efforts of the macroprudential policy to address the RRE vulnerabilities present in the Netherlands by removing some important sources of these vulnerabilities.

Vulnerabilities in the residential real estate sectors of the EEA countries / September 2019 Norway 112
Cyclical position: mature expansion
Key vulnerabilities
• High and rising household indebtedness
• Signs of housing price overvaluation
• Moderate housing credit growth
• Interconnectedness with the Nordic banking system
Risk assessment – high risk
Stock vulnerabilities
Collateral
Following a long period of elevated and persistent housing price growth, there are signs of housing price overvaluation. The IMF has pointed out that the housing prices in Oslo and nationwide are significantly above their 2010 levels (by 85% and 55%, respectively) and that the price-to-income ratio is high in historical and international comparison. The IMF’s estimation of overvaluation is around 5-20% for Oslo and below 10% for the rest of the country. In the past year real housing prices have decreased (-2.3% average annual variation over the past year, Q3/2018), which indicates a maturing housing cycle. Factors contributing to this are: the normalisation of monetary policy, a decrease in population growth pressure, the growth in construction as well as the macroprudential measures for housing credit. However, given some signs of housing price overvaluation, there might be room for further stronger corrections, which may have a negative impact on the market.
Household
Household indebtedness is very high in international and historical comparison (224% of disposable income in Q4 2017). It has been growing and is now considered to be the main source of vulnerability. The concern regards particularly the indirect effects the high debt could have on the Norwegian financial system and real economy, as in the event of a shock households may need to increase saving and tighten consumption. The risk is particularly high for households that have a high exposure to the housing market64. Moreover, there is a large share of variable interest loans, which makes households vulnerable to interest rate spikes. However, stress testing on survey data shows that an interest rate increase of 5 percentage points would lead only 1% of mortgage applicants to be unable to meet normal living expenses (2017). The share of interest-only loans stands at 17% of all mortgages, including household lines of credit. The home ownership rate
64 Lindquist, K., Solheim, H. and Vatne, B.H. (2017), Decomposition of the increase in household debt, Norges Bank,
No 6/2017.
Norway

Vulnerabilities in the residential real estate sectors of the EEA countries / September 2019 Norway 113
through mortgages is high (62%), making households particularly vulnerable to collateral adjustments.
Flow vulnerabilities
Funding
Mortgage lending has been growing steadily, being the main contributor to growth in household lending (around 3.1% real annual increase, in Q4 2018). Lending standards seem to be contained; however, young borrowers are riskier in relative terms. The average DTI was around 3 and the average LTV for loans for house purchases was 67%, according to FSA’s "Survey of banks' residential mortgage lending practices" for 2018. In 2018, the share of loans with an LTV ratio in excess of 85% accounted for 13% of loans to younger borrowers and 6% of young borrowers took out a repayment mortgage with a DTI of over 5. In addition, the banking sector may be vulnerable due to the high share of covered bond funding. Although typically this ensures prudent lending standards for the encumbered assets, in a crisis they may actually lower the average credit quality of the unencumbered assets on bank balance sheets and increase the probability of a run on unsecured bank debt. In addition, a considerable share of covered bonds in Norway are funded by foreign investors, increasing banks’ vulnerability to potential shifts in international financial market conditions. Last but not least, mortgage lending has a systemic importance for the banking sector, as it represents a high share of its total assets. Moreover, the banks are interconnected with the financial systems of the other Nordic countries and macroeconomic or real estate shocks in these surrounding economies could have large spillover effects.
Interactions and transmission channels
The high level of household indebtedness is amplified by the credit dynamics. Potential macroeconomic shocks may limit households’ capacity to service debt, leading to defaults or falls in other expenditure. Thus, the indirect risks are expected to be more significant than the direct risks, as a decrease in consumption of households with high debt would generate losses for the economy as a whole through second-round effects.
Policy assessment – fully appropriate and partially sufficient
Policy mix
• LTV limit of 85% and an additional LTV limit of 60% for loans for secondary dwellings in Oslo
• DTI limit ratio of 5
• Affordability testing in the event of a 5 percentage point rise in interest rates
• Principal repayment requirements for loans with an LTV ratio above 60%
• All of the above are subject to an exemption of up to 10% of the value of gross loan volume granted per quarter (in Oslo this is 8%)
• Tighter requirements for the residential mortgage internal ratings-based approach: LGD floor of 20% and requirements for calculating probability of default (PD) for mortgage loans;
Vulnerabilities in the residential real estate sectors of the EEA countries / September 2019 Norway 114
• CCyB at 2.5% (applicable from December 2019, currently at 2%)
Policy appropriateness
National authorities have implemented a wide range of macroprudential measures which are considered fully appropriate to tackle both flow and stock vulnerabilities related to the RRE sector. The LGD floor alongside PD requirements and the CCyB are all important capital-based measures that are expected to ensure bank resilience against stock vulnerabilities. Moreover, the CCyB affects banks using both IRB and SA approaches. The set of borrower-based measures is comprehensive, avoiding possible leakages as it contains explicit limits for the LTV and DTI, complemented by affordability tests and amortisation requirements.
Policy sufficiency
The national authorities have designed a comprehensive macroprudential policy mix which is expected to be effective in mitigating the identified risks. The various types of capital requirements, many of them targeted specifically at RRE loans, are expected to ensure bank resilience in the event of a RRE market downturn. National authorities report that the LGD floor and PD requirements have led to an increase in the average risk weight on residential mortgages for Norwegian IRB banks from 16% to 22%, between 2014 and 2017. Moreover, the authorities have activated a wide range of borrower-based measures: a combination of the LTV cap, DTI cap and affordability tests. Furthermore, Norway is among the very few countries to have macroprudential measures differentiated by region, namely the stricter LTV for secondary dwellings in Oslo and the stricter exemption quota for loan volumes in Oslo. For the entire set of borrower-based measures, the authorities have an exemption for a share of up to 10% of the value of gross loan volumes per quarter outside of Oslo and 8% inside Oslo. The effects of the measures have been documented, and it can be observed that between 2016 and 2017 there was a decrease in the share of mortgages with LTV over 85%, DTI over 5 and interest-only repayments.
However, despite being particularly active, macroprudential policy is only partially sufficient to mitigate the identified systemic residential real estate risk in Norway. In order to address the remaining systemic risk, macroprudential policies could be complemented by broader policy action leading to the elimination of factors which facilitate or promote increasing household indebtedness. These should support the current macroprudential measures to address the remaining vulnerabilities identified in the residential real estate market in Norway efficiently and effectively, without producing excessive costs for the Norwegian real economy and financial system. For instance, in order to remove biases of higher household indebtedness, authorities could further relax housing supply regulations and reform the tax framework for housing (such as increased taxation of home ownership and/or removal of mortgage interest rate deductibility). If no other policy action is taken and if the vulnerabilities do not recede, or if they increase due to economic and financial developments, existing macroprudential measures could be tightened or new macroprudential measures activated.

Vulnerabilities in the residential real estate sectors of the EEA countries / September 2019 Portugal 115
Cyclical position: firm expansion
Key vulnerabilities
• High housing price growth
• Elevated but declining household indebtedness
• Signs of loose lending standards for new housing loans in terms of interest rate spreads
Risk assessment – medium risk
Stock vulnerabilities
Household
A legacy issue, household indebtedness is now on a downward path. Nevertheless, it remains elevated in international comparison: household indebtedness stood at 100% of disposable income in Q3 2018 and at 67% of GDP in Q3 2018. Fixed rate mortgages have gained ground in new operations. However, the prevalence of variable rate mortgages could make debt service payments sensitive to shifts in interest rates (in Q2 2017, the share of variable interest rate loans was 58% of new loans). Moreover, the savings rate of households has been declining, which could limit households’ shock absorption capacity.
Funding
Portuguese banks have continued to reduce their non-performing exposures but the NPL levels remain high when compared with other EU countries (for RRE exposures, the NPL rate was around 5% in Q2 2018). Overall, banks’ RRE exposures are elevated (45% of total lending, 52% of GDP) and higher than the European average. However, it should be noted that, in Portugal, average RWs for both SA and IRB are above the European average, which enhances banks' resilience.
Flow vulnerabilities
Collateral
Housing prices have been growing strongly, by 8% on average in annual real terms in Q3 2018 over the past three years and by 9.7% over the past year (average over four quarters in Q3 2018). Nonetheless, the most recent data point to a somewhat slower pace of increase in housing prices (real terms): a quarter-on-quarter rate of change of 1.0% in the third quarter of 2018 (lowest figure since the fourth quarter of 2015) and a year-on-year rate of change of 8.5%. Housing demand has been favoured by the low interest rate environment, buoyant tourism (demand for short-term local accommodation), and demand by non-residents, partly associated with residence permits. The characteristics of the rental market also create a preference for home ownership on the part of households. Prices have been growing the strongest in specific locations, like Lisbon, Porto and the Algarve region. The recovery in investment in construction has been supported by a pick-up in
Portugal

Vulnerabilities in the residential real estate sectors of the EEA countries / September 2019 Portugal 116
tourism-related construction. There has also been a strong increase in transactions for dwellings and in Q4 2017 the share of transactions funded by credit was 41%. However, the share of transactions funded by credit is much lower than before the financial crisis (when it approached 65%), and the fact that currently a much larger part of the RRE transactions is non-mortgage-financed should to some extent limit the vulnerabilities linked to collateral values. Even though housing prices have grown more than income over the past years, and the prices have reached previous peaks, there is no conclusive evidence of overvaluation of house prices vis-à-vis fundamentals.
Funding
Before the introduction of the macroprudential policy mix regarding new loans to households (“the Recommendation”) in July 2018, there were some concerns regarding a possible deterioration in lending standards, including certain share of loans with maturities of over 40 years. Following the introduction of the Recommendation, new housing loans with a maturity of over 40 years became immaterial65 (as of March 2019). Furthermore, a lower percentage of mortgage loans are being granted to borrowers with DSTI above 60% and LTV above 90%, even though the share of loans with DSTI of 50%-60% and the LTV of 80%-90% has increased.
In October 2018, in the ECB’s BLS, the banks indicated that the terms and conditions applying to new loans for house purchases and, to a lesser extent, to consumer loans, became tighter in the third quarter of 2018. Most institutions in the October 2018 survey said that the factor contributing the most to the tightening of standards was compliance with the Recommendation. According to the results of the latest BLS (April 2019), some institutions thought that as a result of regulatory changes (macroprudential measure) there was some decrease in the demand for housing loans.
Following the introduction of the Recommendation, new housing loans continued to grow year-on-year, but have been growing at a slower rate than in 2017. In the first quarter of 2019, the year-on-year growth rate of new loans was 7.5%, against 28% in June 2018. As for consumer loans, the year-on-year growth rate started to decline in March 2018 and the production of new loans has been broadly stable since September 2018. However, spreads for household loans (both for housing and consumption purposes) have been gradually declining since 2012.
Interactions and transmission channels
The macroprudential policy mix introduced in July 2018 has been leaning against the potential build-up of a spiral between house prices and new mortgage credit by restricting lending standards of new loans. However, households remain vulnerable to shocks because of the amount of outstanding debt and the prevalence of variable rate loans, which could impair their debt repayment capacity in the event of a shock and lead to a decrease in consumption and to second-round effects.
65 According to the information collected from institutions that account for a very high coverage of these credit agreements,
prior to the implementation of the Recommendation, a part of new credit relating to residential immovable property had a 40-year maturity. Moreover, some institutions offered even longer maturities and granted credit to borrowers whose age would significantly exceed the expected retirement age at the expiry of the credit agreements (Banco de Portugal (2018), Macroprudential measure within the legal framework of credit for consumers, February).

Vulnerabilities in the residential real estate sectors of the EEA countries / September 2019 Portugal 117
Policy assessment – fully appropriate and fully sufficient
Policy mix
• LTV limit of 90% for credit for own and permanent residence, of 80% for credit for purposes other than own and permanent residence, and 100% for credit for purchasing immovable property held by the credit institutions themselves and for property financial leasing agreements
• DSTI limit of 50% with the following exceptions: i) up to 20% of the total amount of credit granted by each institution in each year may be granted with a DSTI of up to 60%, ii) up to 5% of the total amount of credit granted by each institution in each year may exceed the limits to the DSTI. DSTI limits consider interest rate (by maturity, up to 3 percentage points for loans over ten years’ initial maturity) and income (at least, -20%) shocks
• Maximum maturity of 40 years to the original maturity and gradual convergence towards an average maturity of 30 years by the end of 2022 (a maturity limit of ten years was also established for consumer credit agreements)
Policy appropriateness
Given the strong house price dynamics flow vulnerabilities are more prevalent than stock vulnerabilities, which are mainly a legacy issue (high household indebtedness and NPL volumes). Authorities have therefore implemented a fully appropriate policy mix to promote the adoption of prudent credit standards on household loans primarily. However, potential indirect effects of this measure on other variables, such as the dynamics of RRE prices, should not be excluded. In fact, a policy measure targeted at new credit may also have a dampening effect on preventing exuberant RRE price dynamics and contain a self-reinforcing credit and RRE prices spiral by ensuring that credit standards remain appropriate. The combination of DSTI and LTV limits should ensure both bank and household resilience against potential downturns in prices or an economic downturn. The additional requirements for maturities, amortisation and stressed DSTIs, including references to consumer loans, ensure that there is no leakage of the macroprudential measures.
Policy sufficiency
The combination of macroprudential policy measures should ensure the resilience of borrowers and lenders against any potential effects of excessive housing price growth and keep lending standards for new loans prudent. After the Recommendation entered into force, the resilience of households taking out new mortgage loans to a possible deterioration in the economic conditions increased, while the potential losses of credit institutions in a scenario of decreasing real estate prices and the risk of borrowers being left with negative equity decreased.

Vulnerabilities in the residential real estate sectors of the EEA countries / September 2019 Slovenia 118
Cyclical position: firm expansion
Key vulnerabilities
• High house price growth
• Concerns about lending standards given low compliance with the recommended limits
Risk assessment – low risk
Flow vulnerabilities
Collateral
House prices have been increasing significantly since mid-2016. Their average growth rate amounted to 9.4% in annual terms in Q2 2018 and is even higher in the largest cities and tourist centres. Demand for RRE is fuelled by favourable economic conditions and transactions that were postponed during the crisis, but also by a rising number of real estate purchases for investment purposes. Low volumes of new construction have contributed to the existing imbalance between supply and demand. Yet, increasing investment in construction suggests that the gap might narrow in the future. Despite the high house price growth, there are no clear signs of house price overvaluation yet. Various statistical indicators show that house prices are relatively close to equilibrium levels. However, these indicators are showing an upwards trend so that the first signs of overvaluation may rapidly arise if current price dynamics continue.
Funding
The growth in lending for house purchases has been moderate in recent years, at around 3-4% on an annual basis since mid-2016 (2.9% in real terms in Q3 2018). The fact that mortgage lending growth has not increased as much as house prices can be partly explained by the declining share of RRE transactions financed with loans. Nevertheless, the share of new flows of loans over one year relative to the stock of loans a year before is substantial at around 18% in Q2 2018. The average LTV ratio of new loans secured by RRE has remained fairly stable in recent years (at around 60%). However, the share of loans with an LTV of over 100% stood at 11% and around a third of loans stood above the limit of 80% recommended by national authorities in 2018. The share of new loan volumes with DSTI values over the recommended limit of 50% was around 11% and the share of loans with DSTI values of over 40% (critical value according to literature on household fragility) represented around a third of new loans in 2018. Moreover, the share of loans with LTI values over 5 amounts to approximately 20% of new loans. If the expectations regarding the slowdown in house prices and economic activity do not materialise, there is room for lending standards to deteriorate relative to the recommended limits. In addition, the recommended DSTI limit does not take into account potential shocks to income or interest rate of mortgage loans.
Slovenia

Vulnerabilities in the residential real estate sectors of the EEA countries / September 2019 Slovenia 119
Interactions and transmission channels
House prices have been growing strongly, mortgage lending has been robust and lending standards are weak. Depending on future demand pressures, the interaction between these developments could lead to riskier loans. If the current projections regarding a deceleration in house prices and stabilisation of credit growth do not materialise, risks to financial stability might rapidly increase. Signs of overvaluation are emerging, together with increasing exposures of households and banks to RRE developments (also via loans to the construction sector, which is currently gaining traction). The low importance of RRE exposures relative to bank assets (around 27% of total lending and 15% of total assets) and the relatively high capital adequacy of banks could mitigate the direct risks to financial stability associated with the identified vulnerabilities in the collateral stretch. Moreover, indirect risks (i.e. impact on financial stability through reduced consumption of indebted households) are limited because of the low level of household indebtedness and the low share of homeowners with a mortgage (12%).
Policy assessment – fully appropriate and fully sufficient
Policy mix
• Recommendation to have LTV values below 80%
• Recommendation to have a maximum DSTI of 50% for income below €1,700, a maximum 50% of DSTI for the proportion of income of up to €1,700, and 67% of the proportion of income above €1,700
• Maximum recommended maturity for consumer loans of 10 years
Policy appropriateness
The recommendation for borrower-based measures is comprehensive and considered appropriate to address the identified risks stemming from the very strong dynamics in house prices, coupled with robust mortgage lending. The maturity limit should prevent leakages from consumer lending. Overall, banks in Slovenia appear to be well capitalised and stock vulnerabilities, particularly related to household indebtedness, are low so there is no immediate need for the activation of capital measures.
Policy sufficiency
The current measures are deemed sufficient given the current level of household indebtedness and mortgage lending dynamics. The recommendation regarding borrower-based measures issued by national authorities has had a very small effect on the DSTI and LTV distributions, as house prices have grown strongly. The fact that authorities tolerate a certain degree of violations of the recommended limits may create incentives for banks to further loosen their lending standards, if house prices continue to grow at the same pace or lead to a similar dynamic in mortgage lending. The national authorities should monitor the evolution of lending standards and the violations of the recommended limits and, in the event of their deterioration, the introduction of binding measures could be considered. Moreover, given the relatively high share of loans with variable interest rates coupled with a relatively high share of new loans with DSTI exceeding 40%, an amendment to the

Vulnerabilities in the residential real estate sectors of the EEA countries / September 2019 Slovenia 120
Recommendation to include mandatory interest rate stress tests at loan origination could also be considered.
Vulnerabilities in the residential real estate sectors of the EEA countries / September 2019 Slovakia 121
Cyclical position: Firm expansion
Key vulnerabilities
• High mortgage credit growth (the highest in the EU)
• Easing of lending standards
• Growing household indebtedness
• Signs of house price overvaluation
• Moderate house price growth
Risk assessment – medium risk
Stock vulnerabilities
Collateral
Despite moderate growth in house prices over the medium term, national authorities estimate that there are signs of overvaluation of house prices, especially in the capital and other urban areas.
Household
Household indebtedness may be still considered moderate in comparison with other EU countries (69% of income in Q4 2017), but it has been increasing considerably in relation to household income over the past years (by 14 percentage points over the past three years). However, a significant share of outstanding loans with interest rate fixation periods below five years amplify the potential for vulnerability linked to household indebtedness, similar to the concentration of existing debt with the young households.
Flow vulnerabilities
Funding
The real average annual growth rate of housing loans (adjusted for sales and securitisations) has been the highest in the EU (and also high in comparison with peer countries), both recently (9.5% in Q3 2018) and over the past three years (annual growth of 12.5% in Q3 2018). Before the macroprudential limits were introduced, there had been signs of loosening lending standards: an increasing share of loans with LTVs of over 80%, increasing share of loans with high DTI and DSTI values to households with lower income levels, and ultimately also narrowing loan margins. As a factor mitigating these vulnerabilities, the average RWs on IRB RRE portfolios (16%) and total capital ratio (17.6%) can be considered significant in comparison with other EU countries.
Slovakia

Vulnerabilities in the residential real estate sectors of the EEA countries / September 2019 Slovakia 122
Household
In line with the growth in housing credit, household indebtedness and debt burden have recently also exhibited growth. Even though the interest rate fixation periods have tended towards extensions, there is still a significant share of loans with interest rate fixation periods lower than five years, making households vulnerable to increases in interest rates. In addition, new credit continues to be unevenly concentrated in some groups of households, mainly the young cohorts. Moreover, household income may be particularly vulnerable to changes in the macroeconomic conditions as it may currently be boosted by cyclical investment in construction and by favourable business development in general. In the event of macroeconomic reversal, household consumption may be affected through a significant share of households that are homeowners with a mortgage.
Collateral
The real house prices have grown by 4% annually on average over the past three years, but have slowed down recently (to 1.9% in Q3 2018). Slow issuance of building permits may be contributing to the house price increases. As such, it may be viewed as an amplifying factor for the growth in house prices, as possible improvements in the issuance may lead to correction in house prices. In the medium term, enough space for new construction in Bratislava may be seen as a potentially mitigating factor for further growth in house prices.
Interactions and transmission channels
Direct flow vulnerabilities have been identified in Slovakia. High credit growth, fostered by the low interest environment and economical catching-up effects, in combination with an overvaluation in the RRE market, might cause financial distress to households in the event of interest rate increases and an economic downturn/price correction, especially to more vulnerable cohorts of younger people with the highest level of indebtedness.
Policy assessment – fully appropriate and fully sufficient
Policy mix
• LTV (90%, with 25% of new loans with LTV 80-90% in 1H 2019 and 20% of these loans as of July 2019)
• DTI (8, with 10% of new loans with higher DTI in 1H 2019 and 5% of these loans as of July 2019, with another 5% for young borrowers)
• DSTI at 80% (income defined as a net income surplus after deducting various household expenses)
• Maturity and amortisation limits
• CCyB of 1.5% (applicable from August 2019, currently at 1.25%)

Vulnerabilities in the residential real estate sectors of the EEA countries / September 2019 Slovakia 123
Policy appropriateness
Slovak authorities have implemented a wide range of borrower-based measures, which are targeted at the flow vulnerabilities, including the limits on LTV, DSTI and DTI as well as maturity and amortisation rules. The risk of a jump in interest rates is addressed by an affordability test, which applies not only to new loans, but also to all existing loans with remaining maturity exceeding eight years. Such a policy mix minimises the potential for circumvention of these measures and increases their efficiency. To increase the resilience of banks to cyclical vulnerabilities, Národná banka Slovenska has further set a CCyB rate of 1.5%.
Policy sufficiency
The borrower-based measures, which should tackle the most important of the identified vulnerabilities in Slovakia, are legally binding and have been gradually tightened in line with the changes in the intensity of the identified vulnerabilities. Their concurrent use of both collateral-based and income-based instruments minimises the potential for circumvention of these measures and increases their efficiency. To further limit the risk of circumvention through the provision of consumer loans or credit via non-banks, the scope of these measures has been extended to all types of loans and lenders. In addition, the CCyB rate has been gradually increased to enhance banks’ resilience to cyclical vulnerabilities. The calibration of the policy tools has been complemented with a thorough impact analysis.

Vulnerabilities in the residential real estate sectors of the EEA countries / September 2019 Sweden 124
Cyclical position: mature expansion
Key vulnerabilities
• High and rising household indebtedness
• Significant house price overvaluation
• High mortgage lending growth and high level of non-amortising mortgages in the stock of existing mortgages
• Interconnectedness with the Nordic banking system
Risk assessment – high risk
Stock vulnerabilities
Collateral
The sustained housing price growth has led to a high house price overvaluation in Sweden, with various estimates ranging from 20% to 60%. This development has been fuelled by strong population growth increasing the demand for housing, favourable economic developments, the low interest rate environment, the favourable tax treatment of real estate transactions, the low tax burden on profits arising from real estate sales and the tax deductibility of interest paid on mortgage loans. There have also been constraints. Moreover, a strictly regulated rental housing market in Sweden has led to few incentives for investors to supply enough rental properties, which pushes people into ownership, creating an additional pressure on house prices. Recently, housing prices have started to stabilise and even decrease in some quarters, as new construction has grown extensively over the past three years.
Funding
Housing loans represent a large share of bank loans (47% of total loans), which makes the real estate sector one of systemic importance. The construction sector has also been growing quite strongly, including the construction of dwellings, and the major banks have significant exposures to real estate companies. While there is evidence that the lending standards have improved for the new housing loans, there are still outstanding loans with high DTI ratios, as nearly 13% of households have a DTI (computed using net income) exceeding 666. Moreover, the long-term practice of granting non-amortising loans has led to the accumulation of loans, which exacerbate household indebtedness and make them more vulnerable to financial shocks. Following the measures taken by the Swedish authorities, the share of new non-amortising loans has been
66 Blom, K. and van Santen, P. (2017), The indebtedness of Swedish households – update for 2017, Sveriges Riskbank,
Economic commentaries, No 6, November.
Sweden

Vulnerabilities in the residential real estate sectors of the EEA countries / September 2019 Sweden 125
reduced. Currently, however, the share of non-amortising loans stands at around 21% of outstanding loans and full amortisation for all loans is yet to be reached.
Household
Household indebtedness is one of the highest in Europe: 174% of disposable income (Q3 2018) and 88% of GDP (Q1 2018). Households with mortgages had an average debt‐to‐income ratio of 338% in September 2017, which increased by 36 percentage points since 2011 and by 12 percentage points compared with 2016. Indebtedness increased for all age and income groups of borrowers in 2017. In addition to their bank loans, many households also have indirect debts in the form of loans taken out by their housing cooperatives, whose interest expenses and amortisations are partly reflected in the cooperative’s monthly fees. Household vulnerability is further amplified by the large shares of variable interest rate loans (around 70% of new loans in 2017) and non-amortising loans (around 20% of outstanding loans in 2017).
Flow vulnerabilities
Funding
Funding vulnerabilities in Sweden are associated with an elevated growth rate of mortgage loans. While the annual real growth rate of housing loans over the past three years has been only 1.1% (Q4 2018), mortgage loans adjusted for sales and securitisations have grown by nearly 6% over the past three years and by 4.7% over the past year, in real terms (Q3 2018). Tax deductibility of mortgage interest rates encourages households to take out large loans for house purchases. The annual rate of growth in lending to housing cooperatives was approximately 8.7% in March 2018. The DSTI values have increased as a result of amortisation requirements. The share of new borrowers with an LTI over 4.5 (on a gross income basis) was 15% in 2017, and it dropped to around 9% in 2018 following the stricter amortisation requirement, which seems to be effective in reducing flow vulnerabilities. There may be some risk associated with the loans for equity withdrawals, which implies additional risk in the presence of house price overvaluation. After 2010, there was a decrease in such practices, but a pick-up was recorded after 2015. However, these types of loans are losing popularity again now. The mortgages where borrowers have taken additional credit against an increase in collateral value ranges from 15% to 40% of new loans, according to different estimations from national authorities.
Interactions and transmission channels
The high level of household indebtedness is the main vulnerability in itself but it can be further amplified by the dynamics of mortgage credit and house prices. The stock of loans with high DTI values combined with a high level of house price overvaluation might generate direct losses for banks in the event of a severe housing market downturn. Indirect vulnerabilities could be significant and may arise from a decrease in consumption of overly indebted households, with second-round effects for the real economy. Cyclical factors play an important role in fuelling the vulnerabilities that have been identified in Sweden, but there are also important structural factors that have driven these vulnerabilities. These include a lack of sufficient housing supply, restrictive rental market regulations and tax incentives for owner-occupied housing and mortgage debt, which may lead to

Vulnerabilities in the residential real estate sectors of the EEA countries / September 2019 Sweden 126
negative externalities by facilitating house price increases, and the taking out of additional debt by households.
Policy assessment – fully appropriate and partially sufficient
Policy mix
• LTV limit of 85%
• Amortisation requirement linked to LTV: households are required to amortise 2% of the mortgage, if LTV>70%, and 1% if LTV>50%
• Amortisation requirement linked to LTI: households are required to amortise an additional 1% of the mortgage, if LTI>450%
• Risk weight floor of 25% for mortgage loans
• CCyB at 2.5% (applicable from September 2019, currently at 2%)
• Affordability tests – microprudential measure with certain macroprudential effects
Policy appropriateness
Authorities have implemented a comprehensive set of macroprudential measures which are deemed fully appropriate to address the identified stock and flow vulnerabilities. The RW floor and the CCyB are important capital-based measures that aim to ensure bank resilience in case the accumulated RRE and cyclical vulnerabilities materialise. The LTV limit was also implemented as a structural measure in Sweden, given that the house price overvaluation has built up due to structural factors such as the regulation of rental market and interest rate deductibility. Moreover, amortisation requirements are expected to improve household resilience over time. The most recent LTI-based amortisation measure should work like an LTI cap with a certain allowance for exemptions, as it is less restrictive for high income earners. Affordability tests67 may also play a role in ensuring household resilience, and amortisation requirements automatically became part of the affordability tests.
Policy sufficiency
The macroprudential policy mix ensures a robust level of bank capital buffers. Apart from the RW floor, the instruments (CCyB, SRB and Pillar 2) have been set to address a broad set of vulnerabilities also beyond the RRE vulnerabilities. Moreover, amortisation requirements and the LTV limit are expected to help improve the quality of new loans and borrower resilience as well as to act as a backstop for limiting excessive household indebtedness. Recent data on lending standards on new housing loans point to an improving effect of the amortisation requirement linked to LTI on both LTI and DTI distributions. Nevertheless, national authorities should monitor the
67 They were introduced through the Consumer Credit Law and are formally of microprudential nature. They do not fall under
the supervision of Finansinspektionen or the central bank, but NAs collect information from banks about how they perform the affordability tests and they informally recommend certain approaches.

Vulnerabilities in the residential real estate sectors of the EEA countries / September 2019 Sweden 127
medium-term effect of the LTI measure, and be ready to also consider an explicit DTI cap in case household indebtedness levels of new borrowers weaken.
In spite of being particularly active, macroprudential policy is not fully sufficient to mitigate the existing systemic risk related to the Swedish housing market. Therefore, there is a need to consider a broader set of policies that could more efficiently address the underlying factors, which have generated the identified vulnerabilities such as misaligned incentives. Examples of such policies could include reforms of rental market regulations or reforms of the tax framework for housing and mortgage lending.

Vulnerabilities in the residential real estate sectors of the EEA countries / September 2019 United Kingdom 128
Cyclical position: mature expansion
Key vulnerabilities
• Elevated and rising household indebtedness
• Some signs of house price overvaluation
Risk assessment – medium risk
Stock vulnerabilities
Collateral
In 2018, activity in the UK housing market was subdued, as the uncertainty surrounding Brexit dampened economic and cyclical financial developments. Mortgage approvals have been broadly unchanged since mid‑2016. Moreover, property transactions and growth in secured lending have also been steady in recent quarters, at levels well below pre‑crisis averages. The annual real growth rate of house prices over the past three years has reached 2.8% in Q3 2018. Furthermore, in November 2018, the annual nominal UK house price growth was 2.8%, which is the lowest rate of house price inflation in over five years. The slowdown in UK house price growth has been sharpest in London, which is the only region to have experienced an outright decline in prices over the past year.
Despite the subdued activity, the UK house prices are currently close to their historical peaks, and have been growing more strongly than the households’ wage income in cumulated terms over the past years. Given these developments, there are some potential signs of housing price overvaluation. However, the national authorities have not presented strong evidence either in favour or against overvaluation, while the ECB indicators of overvaluation send mixed signals.
Household
Household debt stood at 129% of disposable income in Q3 2018 and at 86% of GDP in Q1 2018, and has declined significantly from the peak values registered in 2008. Nevertheless, household indebtedness remains high in historical and cross-country comparison. Recent cyclical developments of household credit have been contained. While mortgage lending is currently showing a low growth rate, consumer credit grew rather strongly and has moderated recently. Research conducted by the national authorities emphasise that in the UK households with higher levels of debt tend to reduce consumption more significantly during times of financial distress. Moreover, households with higher mortgage debt-to-income ratios are even more likely to cut spending. However, the share of households with high mortgage debt-servicing ratios is close to historical lows. The share of owners with mortgages (29% of tenants) is relatively high, which can make households vulnerable to collateral corrections, though it has declined by over 10% during the past three decades. 38% of the stock of loans are characterised by variable interest rate and non-amortisation, which may further increase vulnerabilities. However, the share of fixed rate
United Kingdom
Vulnerabilities in the residential real estate sectors of the EEA countries / September 2019 United Kingdom 129
mortgages has risen markedly in recent years. Two-thirds of the outstanding stock of mortgages now feature a fixed rate.
Interactions and transmission channels
The recent deceleration of housing price growth, the muted dynamics of household lending for house purchases and the broad compliance of households with the borrower-based measures all reduce the risk of imprudent lending and credit defaults. Nevertheless, against the backdrop of a significant economic uncertainty, the high household indebtedness in historical and cross-country comparison, and the close-to-peak house prices, both direct and indirect financial stability vulnerabilities are present. A potential significant downturn in RRE prices coupled with income shocks could lead highly indebted and vulnerable households to adjust their spending in order to meet mortgage payments. Adjustments in consumption can further amplify economic deterioration and reduce general lending activity. A potential hard Brexit could lead to the materialisation of the above-mentioned vulnerabilities and their amplification according to the transmission mechanisms described.
Policy assessment – fully appropriate and fully sufficient
Policy mix
• LTI limit of 4.5 (the 4.5 multiple was calibrated to ensure that, at a stressed mortgage rate of 7% and a typical mortgage term of around 25 years, mortgagors’ stressed DSRs would not exceed 35%–40%) with a speed limit of 15%
• Affordability tests
• CCyB at 1%
• Annual stress testing
Policy appropriateness
The macroprudential policy is deemed appropriate since it aims to address the level of household indebtedness and keep housing lending prudent through the borrower-based measures (the LTI and affordability tests). Furthermore, the CCyB should ensure banking resilience in the event of cyclical shocks. Stress testing is used both micro- and macroprudential analysis to assess the resilience of the banking sector to an extreme stress scenario on an annual basis and to calibrate the appropriate level of capital across the banking system. According to a recent Bank of England stress test, the UK banks seem resilient to both first- and second-round effects of a severe scenario for the housing market and the real economy.
Policy sufficiency
The LTI limit and affordability test are expected to keep new mortgage lending prudent. However, the high levels of household indebtedness in historical and cross-country comparison, as well as the growth in consumer credit and the non-amortising loans, warrant continuous monitoring by national authorities.

Vulnerabilities in the residential real estate sectors of the EEA countries / September 2019 United Kingdom 130
The CCyB rate of 1% may be considered sufficient given the moderate growth in credit (consumer credit growth has also been slowing down recently), as it has been calibrated for a standard risk environment. Moreover, under the recent Bank of England adverse stress testing scenario, the current bank capital levels appear to be sufficient. The stress test included a severe stress scenario for the UK housing market (33% fall in UK residential property prices in the course of one year). The Bank of England's Financial Policy Committee judged that the stress test scenario was sufficiently severe to encompass the outcomes based on ‘worst case’ assumptions about the challenges the UK economy could face in the event of a cliff-edge Brexit. The stress test also incorporates feedback loops between the banking sector and real sector in order to account for second-round effects stemming also from high household indebtedness.

The work was led by Tuomas Peltonen (ESRB Secretariat) and the report was written by Elena Banu, Hana Hejlová, Michela Guarnero and Paulina Zlatkute (formerly at the ESRB Secretariat).
The risk analysis framework is based on work by the ESRB Working Group on Real Estate Methodologies (WG-REM) led by Francesco Zollino (Bank of Italy).
The risk and the policy analyses were prepared with the help of the project team members Alexandra Jespers (National Bank of Belgium), Michael Richter (Deutsche Bundesbank), Laura Schupp (Deutsche Bundesbank), Hanna Putkuri (Bank of Finland), Zita Fellner (National Bank of Hungary), Vania Tinoco-Pereira, Rui Silva (Bank of Portugal), Dina Batista (Bank of Portugal), and Matías Lamas (Bank of Spain).
Valuable analytical and technical contributions from Marco Lo Duca (ECB), Marek Rusnák (ECB), Eugen Tereanu (ECB), Mara Pirovano (ECB), José Fique (ESRB), Piotr Kusmierczyk (ESRB), and Cosimo Izzo (formerly at the ECB) are gratefully acknowledged.
The report has also benefitted from the initial contributions of Sverre Mæhlum and Simon Dagrain (formerly at the ESRB Secretariat) as well as from comments from Magdalena Grothe (ESRB Secretariat).
The authors gratefully acknowledge data and input from the ECB, EBA, and the national authorities of the EU Member States, as well as from Iceland, Liechtenstein and Norway.
Imprint and acknowledgements
© European Systemic Risk Board, 2019
Postal address 60640 Frankfurt am Main, Germany Telephone +49 69 1344 0 Website www.esrb.europa.eu
All rights reserved. Reproduction for educational and non-commercial purposes is permitted provided that the source is acknowledged.
The cut-off date for the data included in this report was March 2019.
ISBN 978-92-9472-125-9 (pdf) DOI 10.2849/97676 (pdf) EU catalogue No DT-02-19-733-EN-N (pdf)