vulnerability of major wastewater facilities to flooding from sea-level rise august 21, 2008 shaun...
TRANSCRIPT
Vulnerability of Major Wastewater Facilities Vulnerability of Major Wastewater Facilities to Flooding from Sea-Level Riseto Flooding from Sea-Level Rise
August 21, 2008Shaun O’Neil
King County WTD

King County Wastewater System
• Serve 1.4 M people – 2.4 M by 2030
• 420 sq.mi.• 42 pump stations• 19 regulator
stations• 353 miles of pipe• 2” – 14’ in diameter• 200 mgd average
treatment• 34 Local agencies
contribute flow
a
PIERCE
SNOHOMISH
SKAGIT
WHATCOMOKANOGAN
CHELAN
KITTITAS
YAKIMA
KLICKITAT
BENTON
GRANT
DOUGLAS
FERRY
STEVENS
PENDORVILLE
SPOKANELINCOLN
ADAMS
WHITMAN
ASOTINWALLAWALLA
SKAMANIA
CLARK
FRANKLIN
COWLITZPACIFIC
LEWIS
THURSTON
GRAY'SHARBOR
MASON
JEFFERSONKITSAP
ISLAND
SAN JUAN
KING
GARFIELD
CLALLAM
COLUMBIA
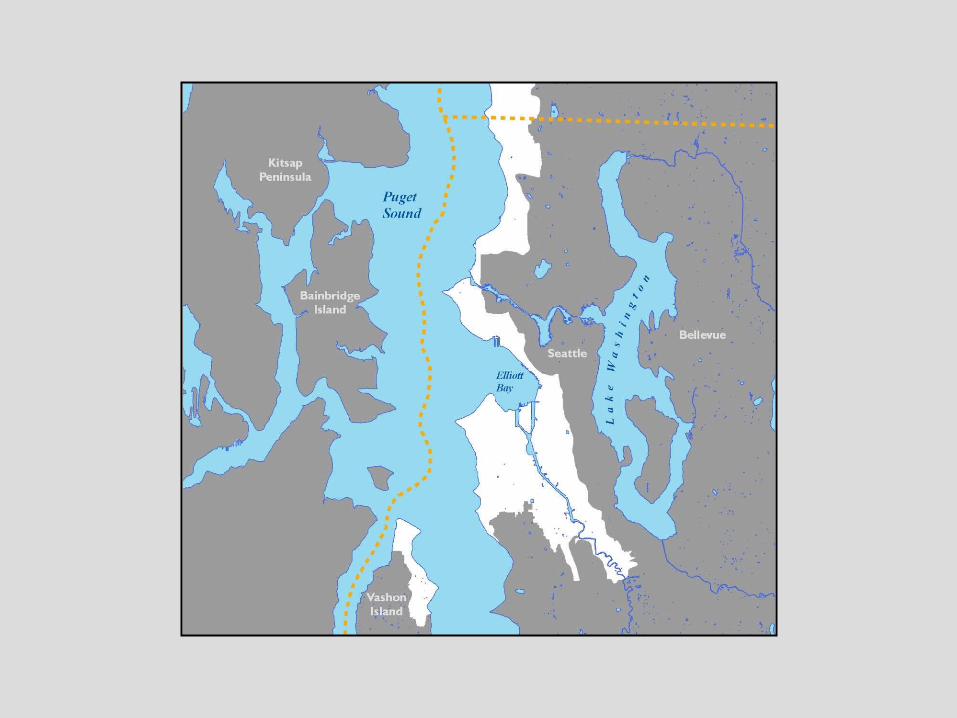
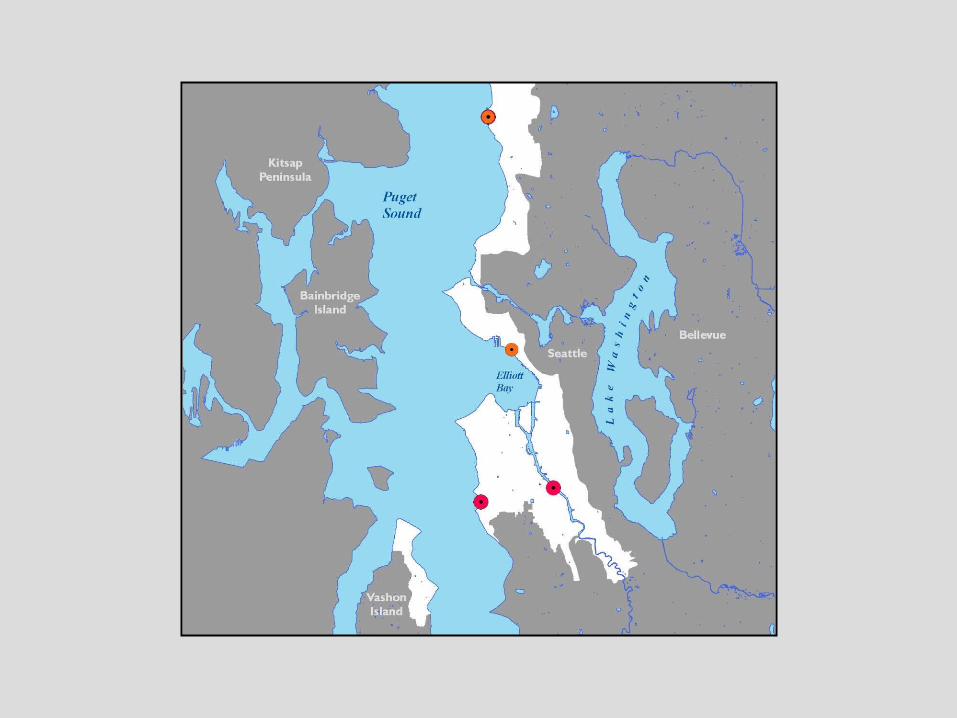
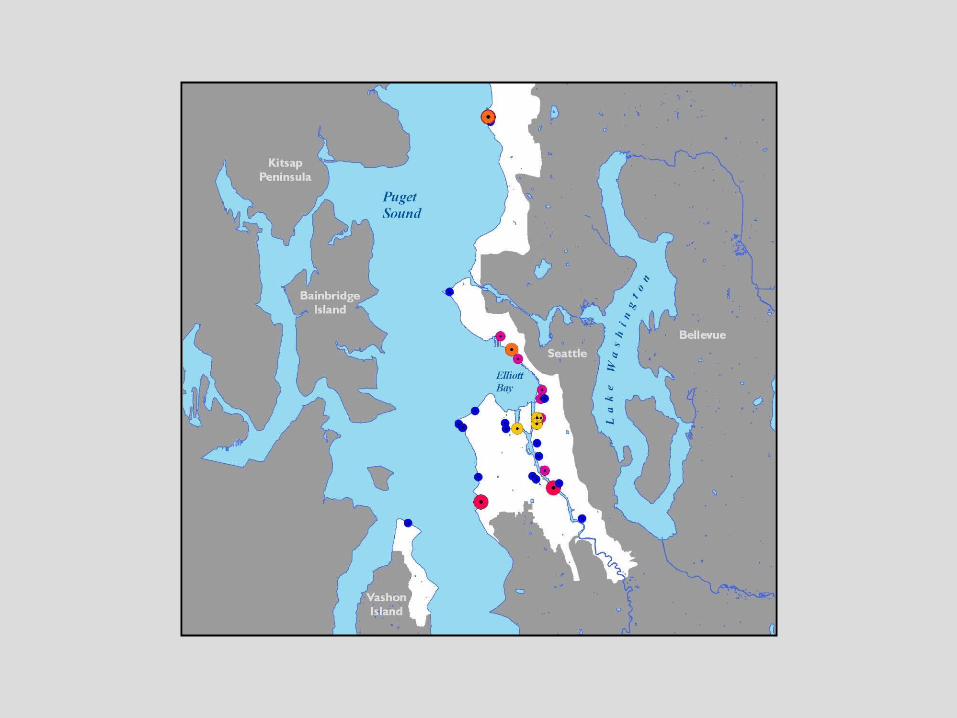
Puget Sound
South Secondary plant
CSO PlantTreatment plant
CSOTreatment plant
West Secondary plant
King County wastewater treatment service area
King County boundary
NewSecondary plant (2010)
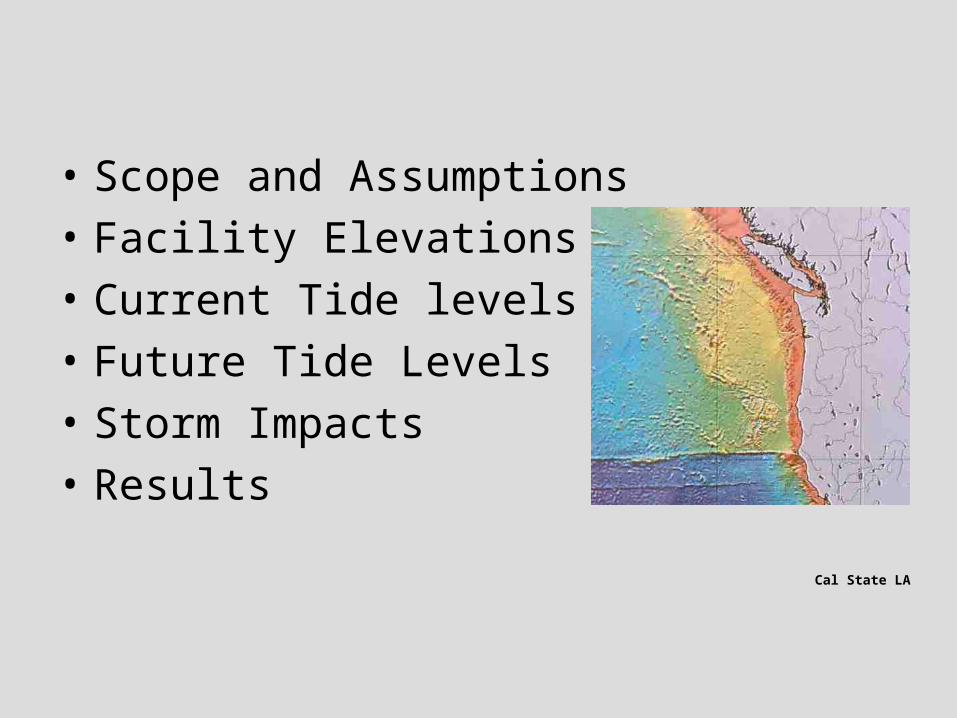
• Scope and Assumptions
• Facility Elevations
• Current Tide levels
• Future Tide Levels
• Storm Impacts
• Results
Cal State LA


USGS
University of Washington

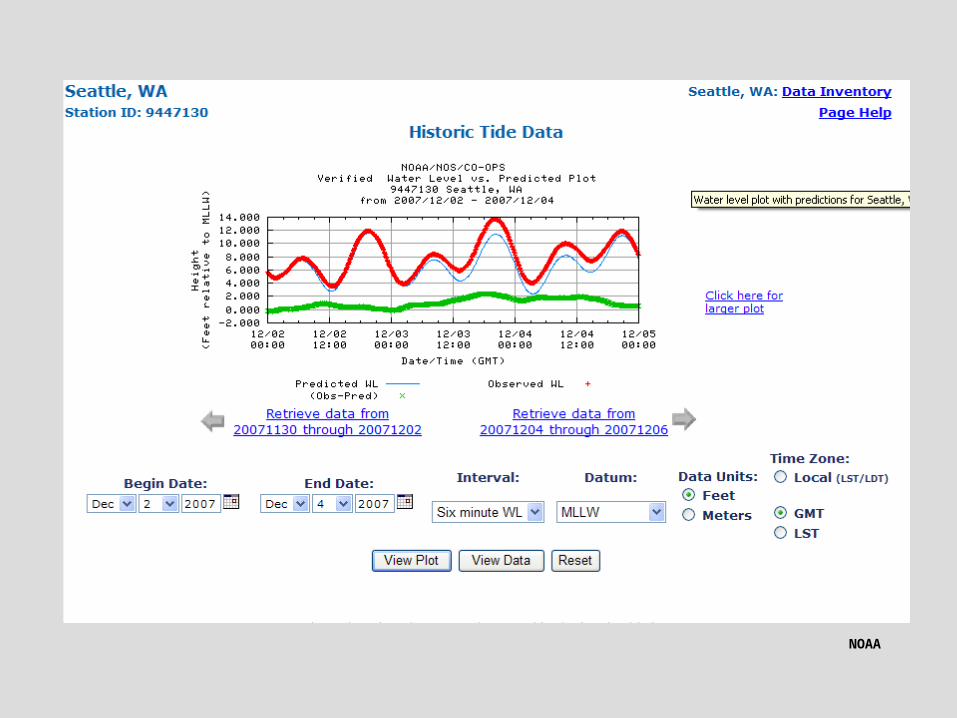
Seattle Tide Gauge Data (January 1983–December 2001)
Elevation (above NAVD88 zero feet)
Highest observed water level (January 27,1983) 12.14
Mean higher high water (MHHW) 9.01
Mean high water (MHW) 8.15
Mean sea level (MSL) 4.29
NAVD 0.00
Mean lower low water (MLLW) -2.35
Lowest observed water level (January 4, 1916) -7.38
NOAA
NOAA

Mean Sea Level Difference:for Seattle, WA
1983-2001 1960-1978 Difference:14.58 ft. 14.40 ft. 0.18 ft.
NOAA
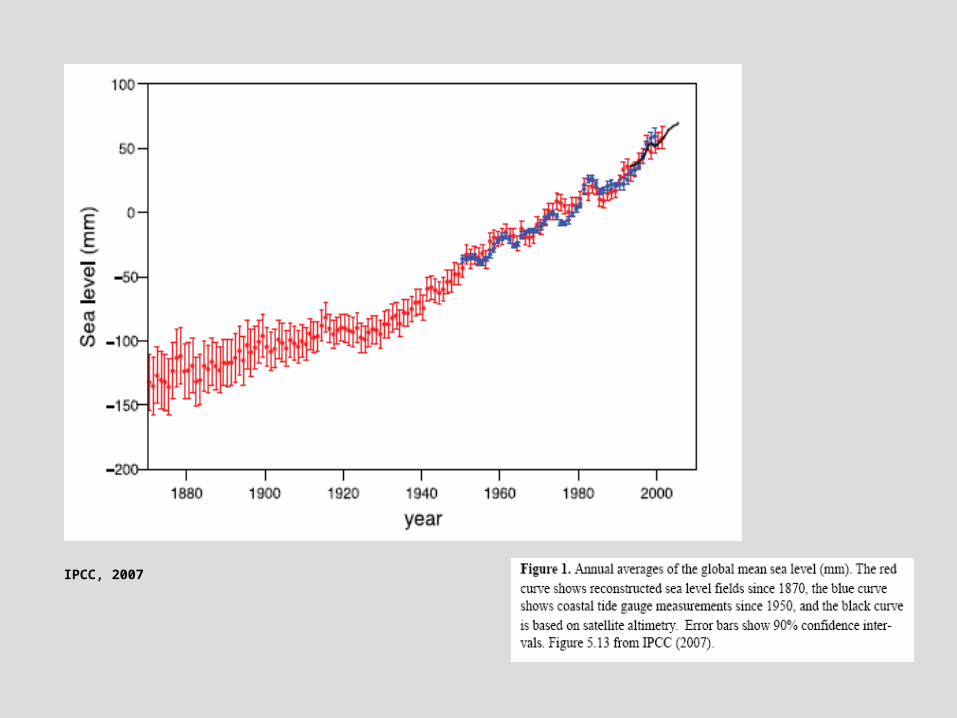
IPCC, 2007

IPCC, 2007

Puget Sound Sea-Level Rise Scenarios (Mote et al., 2008)
Scenario Predicted Sea-Level Rise
2050 2100
Very low sea-level rise—low-probability low-impact
3 inches (0.25 feet)
6 inches (0.50 feet)
Medium sea-level rise (most likely) 6 inches (0.50 feet)
13 inches (1.08 feet)
Very high sea-level rise—low-probability high-impact
22 inches (1.83 feet)
50 inches (4.17 feet)

NASANASA
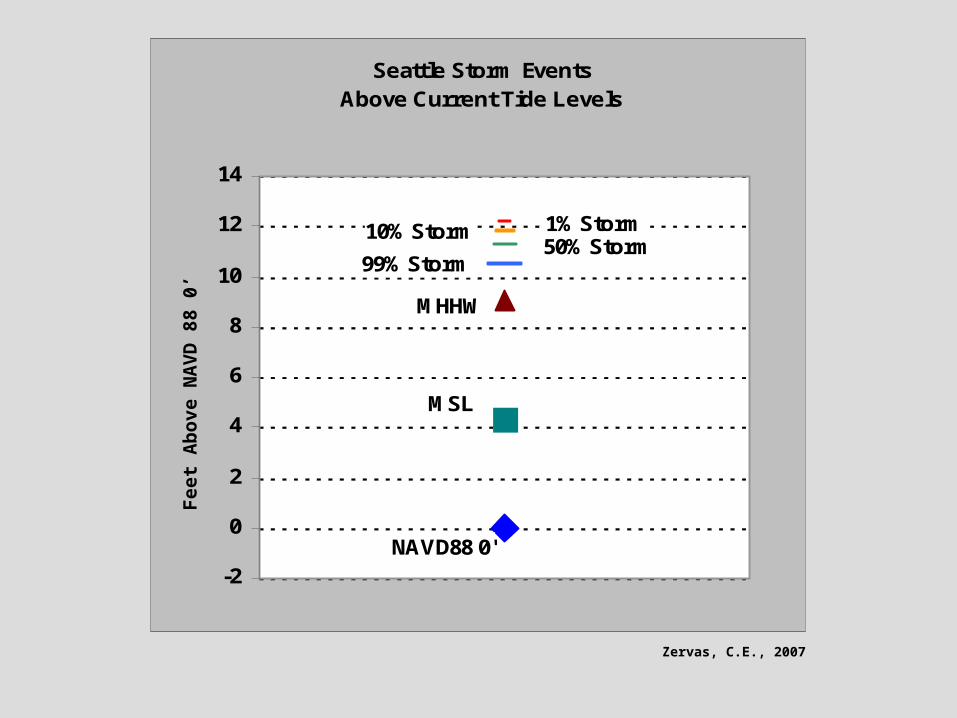
Zervas, C.E., 2007
Feet
ab
ove N
AV
D 8
8 0
’
Seattle Storm Events Above Current Tide Levels
1% Storm10% Storm50% Storm
99% Storm
MHHW
MSL
NAVD88 0'-2
0
2
4
6
8
10
12
14Feet
Ab
ove N
AV
D 8
8 0
’
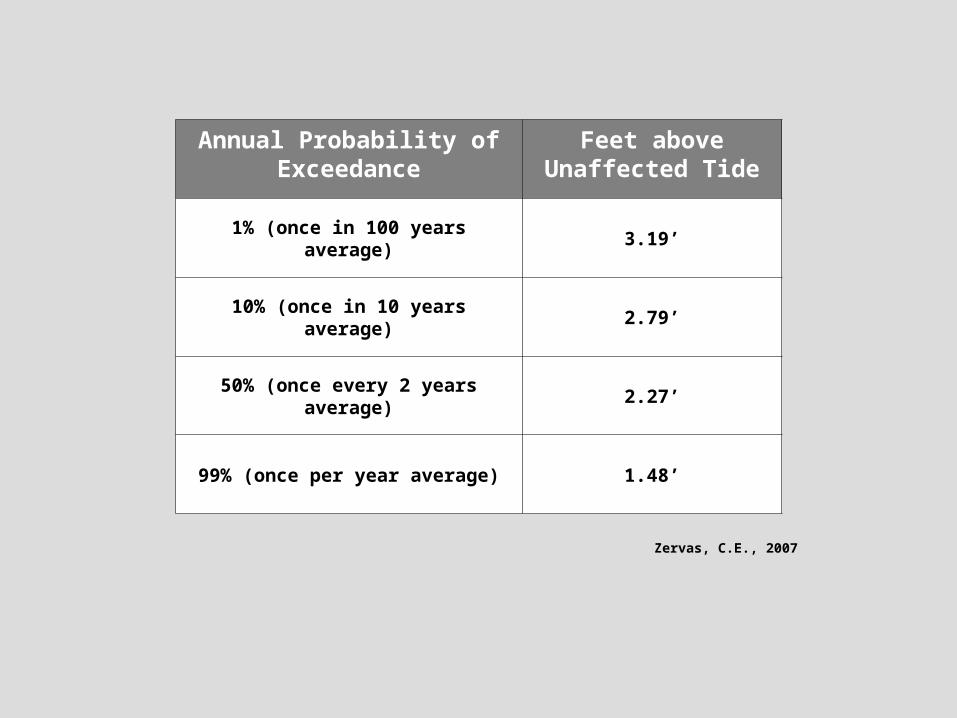
Annual Probability of Exceedance
Feet above Unaffected Tide
1% (once in 100 years average) 3.19’
10% (once in 10 years average) 2.79’
50% (once every 2 years average) 2.27’
99% (once per year average) 1.48’
Zervas, C.E., 2007


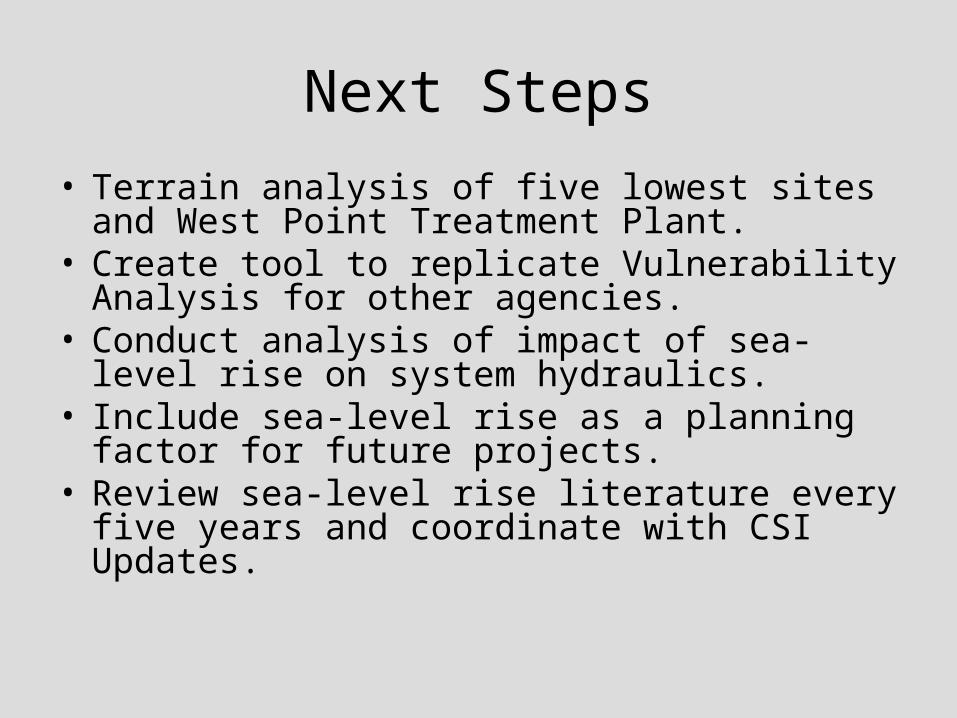
Next Steps
• Terrain analysis of five lowest sites and West Point Treatment Plant.
• Create tool to replicate Vulnerability Analysis for other agencies.
• Conduct analysis of impact of sea-level rise on system hydraulics.
• Include sea-level rise as a planning factor for future projects.
• Review sea-level rise literature every five years and coordinate with CSI Updates.
References
• Intergovernmental Panel on Climate Change (IPCC). 2007. Climate Change 2007: The Physical Science Basis. Contribution of Working Group I to the Fourth Assessment Report of the Intergovernmental Panel on Climate Change. Solomon, S., Qin, D., Manning, M., Chen, Z.,. Marquis, M., Averyt, K.B., Tignor, M. and Miller, H.L. (Eds.). Cambridge, UK, and New York, NY: Cambridge University Press.
• Mote, P., Petersen A., Reeder, S., Shipman, H., and Whitely Binder, L. 2008. Sea Level Rise in the Coastal Waters of Washington State. Report prepared by the Climate Impacts Group, University of Washington, Seattle, Washington, and the Washington Department of Ecology, Lacey, Washington.
• Zervas, C.E. 2005. Response of Extreme Storm Tide Levels to Long-Term Sea Level Change. Oceans, 2005, Proceedings of MTS/IEEE, 3, 2501-2506.

Questions?

Websites
• King County Climate Change with Vulnerable Facilities Analysis Paper - http://dnr.metrokc.gov/dnrp/climate-change/conference-2005.htm
• UW Climate Impacts Group - http://cses.washington.edu/cig/
• Mote Paper - http://cses.washington.edu/db/pdf/moteetalslr579.pdf
• Puget Sound LIDAR Consortium - http://pugetsoundlidar.ess.washington.edu/About_PSLC.htm
• NOAA Tides and Currents - http://tidesandcurrents.noaa.gov/index.shtml
• Seattle Tide Gauge - http://tidesandcurrents.noaa.gov/station_info.shtml?stn=9447130+SEATTLE,+PUGET+SOUND,+WA
• IPCC - http://www.ipcc.ch/ Shaun O’Neil206.684.1671
Shaun.O’[email protected]