vulnerable groups and communities in the context of adaptation and development planning &...
TRANSCRIPT

Vulnerable Groups and
Communities in The Context of
Adaptation and Development
Planning & Implementation:
Leo C. Zulu, Michigan State University
Identification and Targeting at
Different Scales, Best Available
Methods and Data, Best Practices

Outline
• Introduction • Concepts: what is vulnerability?• Geographic targeting vulnerability and
geospatial tools • Who is vulnerable? Methods• Data for vulnerability mapping• Emerging lessons • Vulnerability analysis & geographic
targeting and the NAPs: entry points• Conclusion
2

Development resources, including for adaptation are limited Among many competing priorities, climate change (CC) may not
rank highly Must make a case for:
Enhancing adaptation as part of development needs/process Targeting limited adaptation resources for cost effectiveness - most
bang for the buck This requires identifying most vulnerable people, systems –
hence, geographic targeting There are many methods and approaches to doing this, hence: Objective: Present and discuss common methods, data, and
best practices to guide identification of vulnerable groups and communities in the context of adaptation and development planning and implementation The NAP process offers a mechanisms for meeting this objective
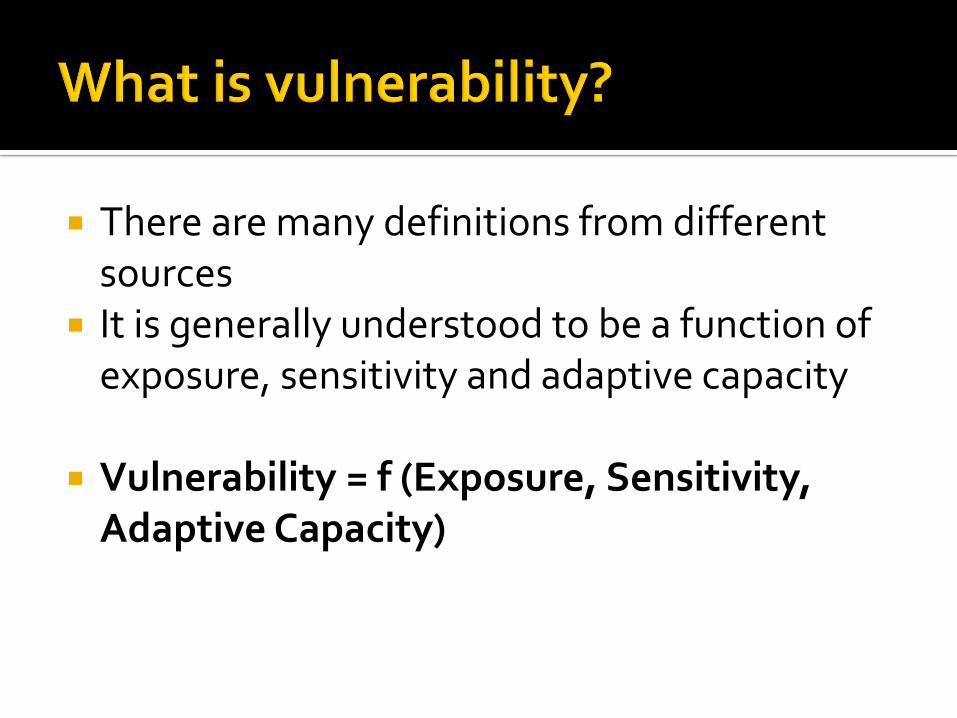
There are many definitions from different sources
It is generally understood to be a function of exposure, sensitivity and adaptive capacity
Vulnerability = f (Exposure, Sensitivity, Adaptive Capacity)
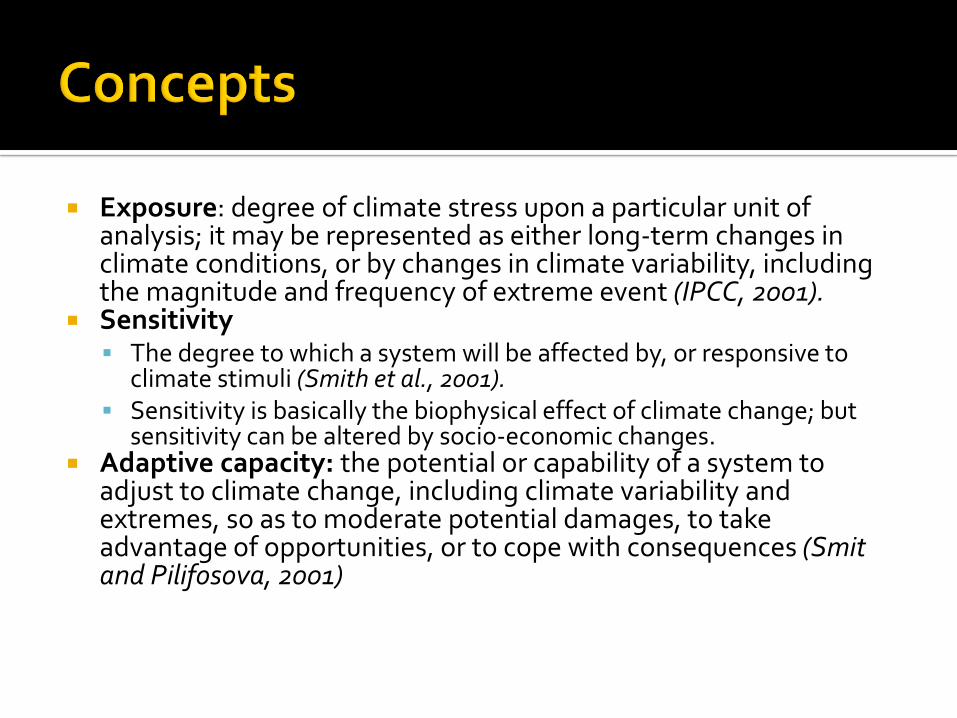
Exposure: degree of climate stress upon a particular unit of analysis; it may be represented as either long-term changes in climate conditions, or by changes in climate variability, including the magnitude and frequency of extreme event (IPCC, 2001).
Sensitivity The degree to which a system will be affected by, or responsive to
climate stimuli (Smith et al., 2001). Sensitivity is basically the biophysical effect of climate change; but
sensitivity can be altered by socio-economic changes. Adaptive capacity: the potential or capability of a system to
adjust to climate change, including climate variability and extremes, so as to moderate potential damages, to take advantage of opportunities, or to cope with consequences (Smit and Pilifosova, 2001)

The poor The food insecure Those living in fragile environments
Do vulnerable people create vulnerable spaces, which compound vulnerability?
The marginalized – women, girls, youth, ill, handicapped, ethnic minorities, indigenous groups, urban poor, etc.
Broader dimensions of vulnerability Adding social to biophysical inequity Qualitative analysis of vulnerability Inequality
What are the best methods to get to the poor, vulnerable? Do vulnerable people create vulnerable spaces, which further compound
vulnerability? How well can we predict the next vulnerable places and people
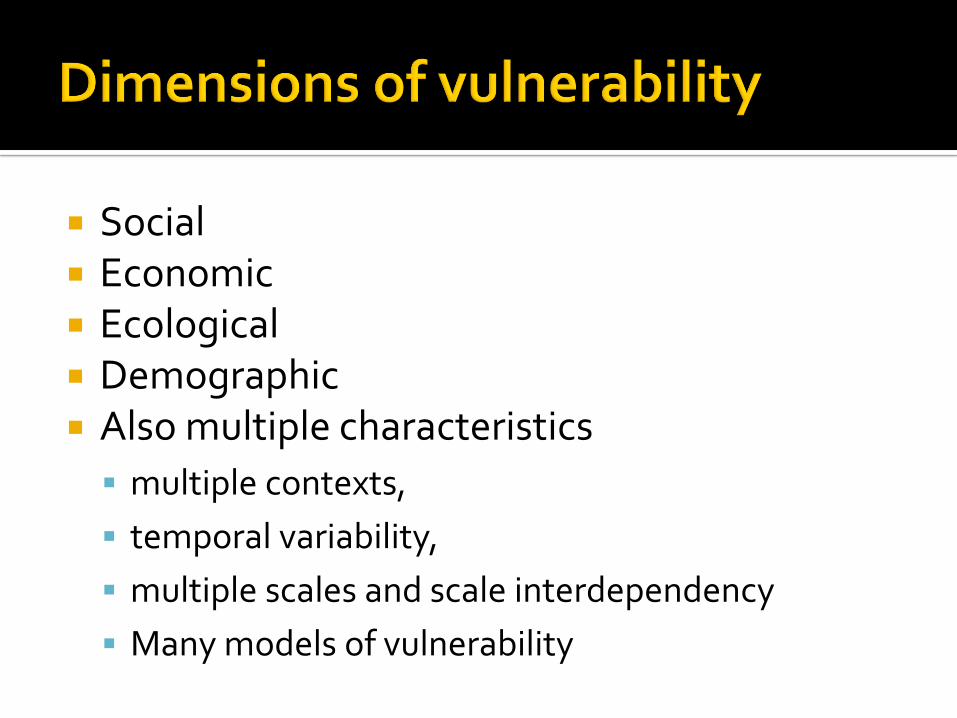
Social Economic Ecological Demographic Also multiple characteristics
multiple contexts,
temporal variability,
multiple scales and scale interdependency
Many models of vulnerability

Bharwani et al., 2011, SEI

Global scale The issue is identifying vulnerable global regions and countries to
particular hazards
Uses national or regional datasets/tools:▪ Climate Change Vulnerability Index
▪ Famine Early Warning System (FEWS), USAID
▪ Food Insecurity and Vulnerability Information
▪ Mapping System (FIVIMS ), FAO
National & sub-national scales Analysis disaggregated to local administrative units or small
geography areas to capture fine spatial heterogeneity in vulnerability
At least census data and survey data are often neded

• Also• V20 group of countries
vulnerable to climate change
• GermanWatch Global Climate Risk Index, top 10 1993-2013
• UNEP rankings, etc
Word Bank 12 most at risk courtiers to CCRisk areas1. Droughts2. Floods3. Storms4. Rising sea levels, and5. Agriculture.

Climate Change Vulnerability Index 2011
https://maplecroft.com/about/news/ccvi.html
Ethiopia (11), Cambodia (12), Thailand (14), Malawi (15) and Pakistan (16)

• CCVI evaluates the vulnerability of people in 170 countries to extreme climate related events & change in major climate measurements over the next 30 years.
• Used to assess national vulnerability• Regions are indicated on the map:42 social, economic and environmental factors
• 16 countries and 15 fast growing cities all in Africa and Asia
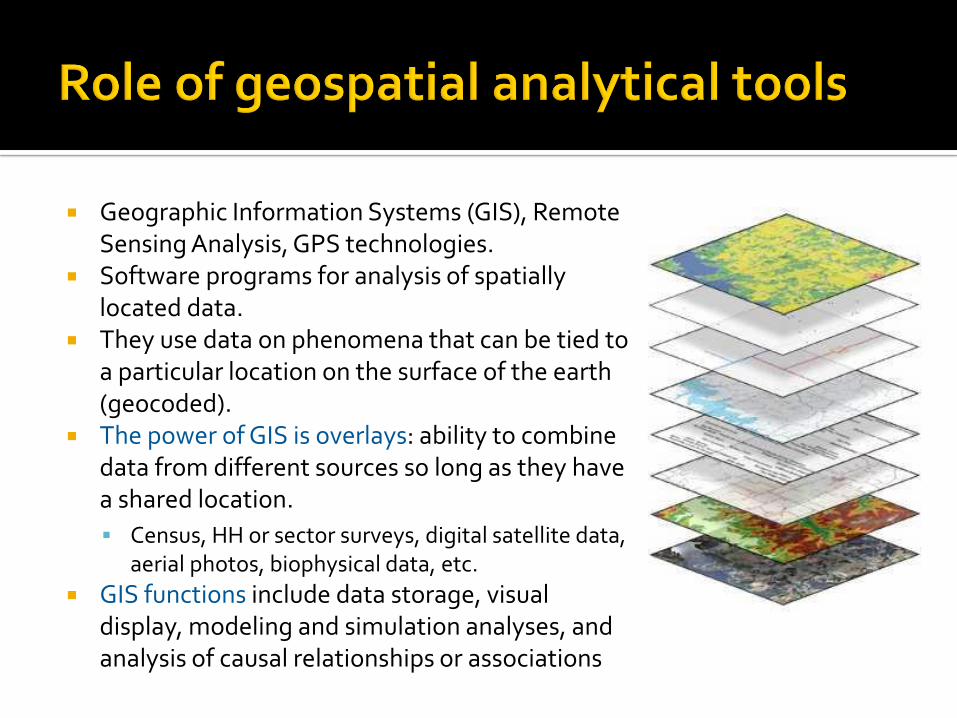
Geographic Information Systems (GIS), Remote Sensing Analysis, GPS technologies.
Software programs for analysis of spatially located data.
They use data on phenomena that can be tied to a particular location on the surface of the earth (geocoded).
The power of GIS is overlays: ability to combine data from different sources so long as they have a shared location.
Census, HH or sector surveys, digital satellite data, aerial photos, biophysical data, etc.
GIS functions include data storage, visual display, modeling and simulation analyses, and analysis of causal relationships or associations
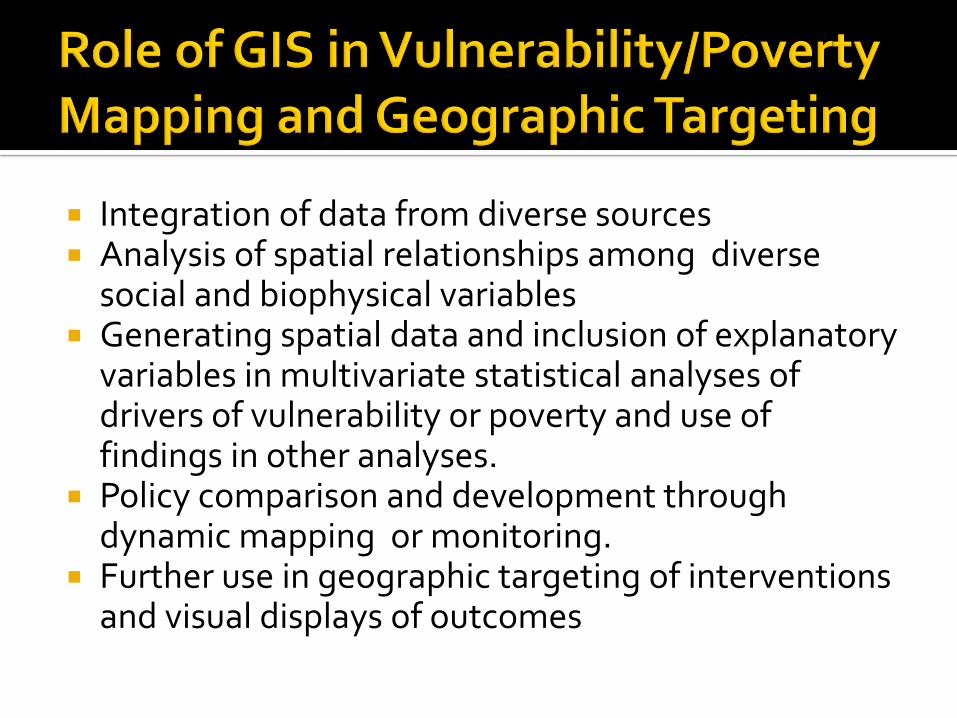
Integration of data from diverse sources Analysis of spatial relationships among diverse
social and biophysical variables Generating spatial data and inclusion of explanatory
variables in multivariate statistical analyses of drivers of vulnerability or poverty and use of findings in other analyses.
Policy comparison and development through dynamic mapping or monitoring.
Further use in geographic targeting of interventions and visual displays of outcomes

Cost for optimal targeting at the third admin level were 42% - 7% lower than for non targeted cash transfers in three countries.
In Albania, poverty map data were successfully used to target public spending through the Albanian Development Fund (ADF).
Poverty maps have also been used to monitor MDGs an national and local levels
Cost comparison: Uniform Transfer (Untargeted) Versus Optimal Targeting
World Bank, 2007

Small area estimation
household (HH) or community data
Multivariate weights basic-needs index Hybrid qualitative/secondary data methods Extrapolation Participatory approaches Direct measurement from HH data Direct measurement from census data(Baylis 2002; World Bank 2007)

Needs both national census data and coincident socioeconomic survey data to get sub-national poverty estimates.
Estimates are indirect and have a level of inherent statistical error, but are generally sound.
1st stage: multiple regression analysis is conducted using consumption-based welfare variables from the survey shared by both census and survey datasets
2nd stage: The regression model is applied to the census data with addition of a random disturbance term to better estimate consumption per capita (with SEs, confidence intervals); impute probability of being poor/food insecure using benchmarks
Findings are presented in a GIS, aggregated to a chosen spatial resolution - province, state, district, sub-district, and municipality
(Elbers, Lanjouw, and Lanjouw 2003)
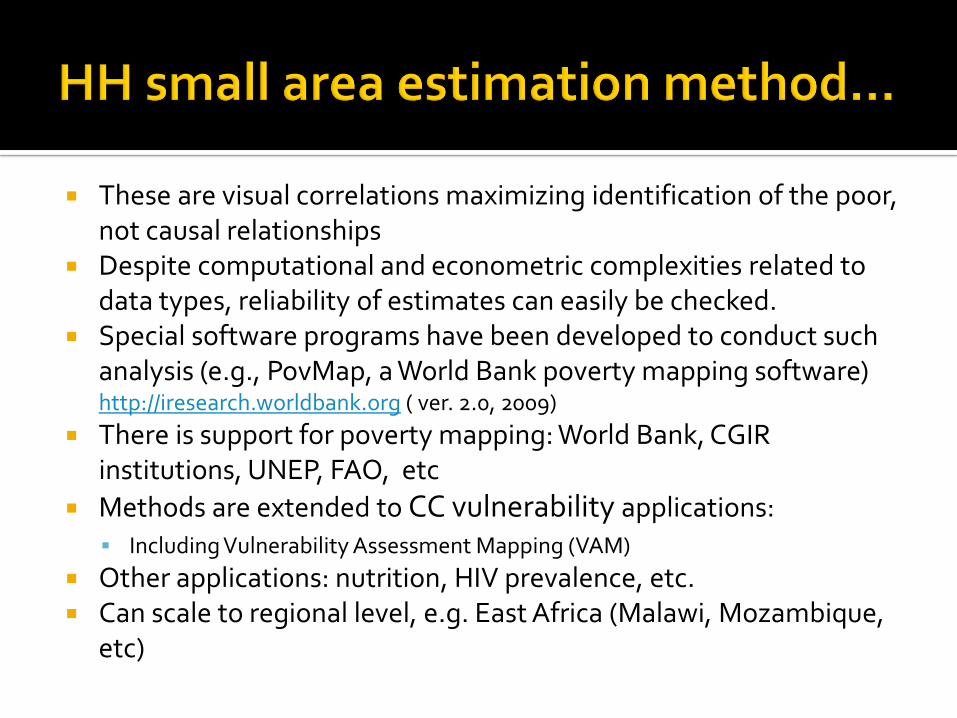
These are visual correlations maximizing identification of the poor, not causal relationships
Despite computational and econometric complexities related to data types, reliability of estimates can easily be checked.
Special software programs have been developed to conduct such analysis (e.g., PovMap, a World Bank poverty mapping software) http://iresearch.worldbank.org ( ver. 2.0, 2009)
There is support for poverty mapping: World Bank, CGIR institutions, UNEP, FAO, etc
Methods are extended to CC vulnerability applications:
Including Vulnerability Assessment Mapping (VAM)
Other applications: nutrition, HIV prevalence, etc. Can scale to regional level, e.g. East Africa (Malawi, Mozambique,
etc)

Uses aggregated community data averages instead of HH level data, e.g. small towns, community, district level
Data are more easily available but level aggregation can undermine reliability of estimates.
Scale of the predictive model is different but the method is the same as with HH data, with minor modifications E.g., special headcount measure for groups (Taylor expansions); special
assumptions on constant variation around mean and model behavior of poverty within and outside, and need to deal with higher incidence of missing data (limited data available at community level)
Many countries have used this method Vietnam, Burkina Faso, China and Kenya, others
But, loss in precision of estimates increases with size of admin. Area – HH method is preferable if data are available
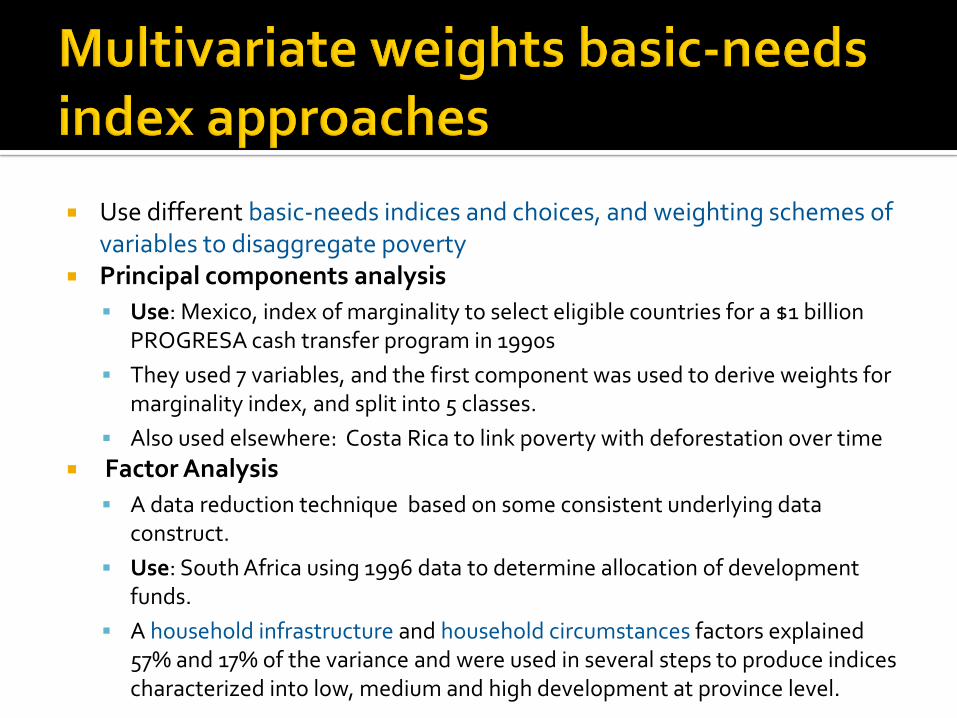
Use different basic-needs indices and choices, and weighting schemes of variables to disaggregate poverty
Principal components analysis
Use: Mexico, index of marginality to select eligible countries for a $1 billion PROGRESA cash transfer program in 1990s
They used 7 variables, and the first component was used to derive weights for marginality index, and split into 5 classes.
Also used elsewhere: Costa Rica to link poverty with deforestation over time
Factor Analysis
A data reduction technique based on some consistent underlying data construct.
Use: South Africa using 1996 data to determine allocation of development funds.
A household infrastructure and household circumstances factors explained 57% and 17% of the variance and were used in several steps to produce indices characterized into low, medium and high development at province level.
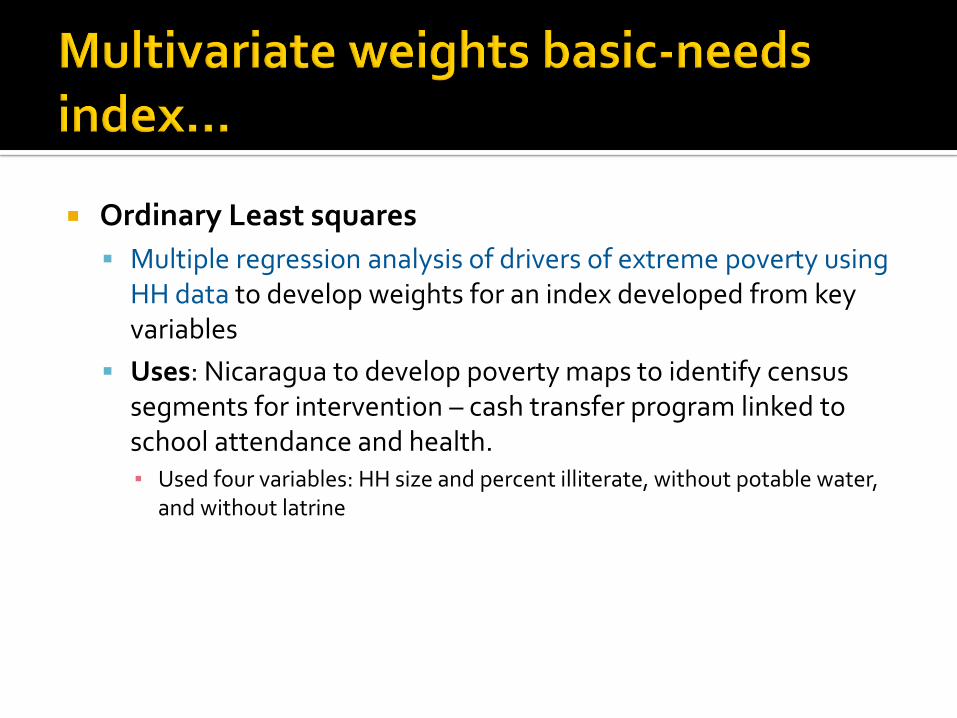
Ordinary Least squares
Multiple regression analysis of drivers of extreme poverty using HH data to develop weights for an index developed from key variables
Uses: Nicaragua to develop poverty maps to identify census segments for intervention – cash transfer program linked to school attendance and health.▪ Used four variables: HH size and percent illiterate, without potable water,
and without latrine

Focus is often on food security determinants and livelihood strategies, and combine use of qualitative and secondary quantitative data
Primarily qualitative data approaches Qualitative data collection: Through RRA/PRA, focus groups, semi-structured
interviews, key informants, supplemented by secondary data
Household Economy Approach (HEA) – by Save the Children Fund, FAO Global Information and Early Warning Systems (GIEWS) and used in WFP Vulnerability & Assessment Mapping
FIVIMS: FAO Food Insecurity and Vulnerability Information and Mapping Systems
▪ Involves development of vulnerable-group profiles and mutually exclusive strategy groups based on key livelihoods strategies
Primarily secondary data FEWS (Famine Early Waring Systems approach) - indicator based
Approach assesses vulnerability with focus on identifying households mainly from secondary data with minor supplemental fieldwork
Multiple vulnerability indicators are often weighted using best judged and ranked into a single index to rank areas/groups, and mapped
Statistical analysis of qualitative data combined with secondary data E.g. FEWS, Malawi
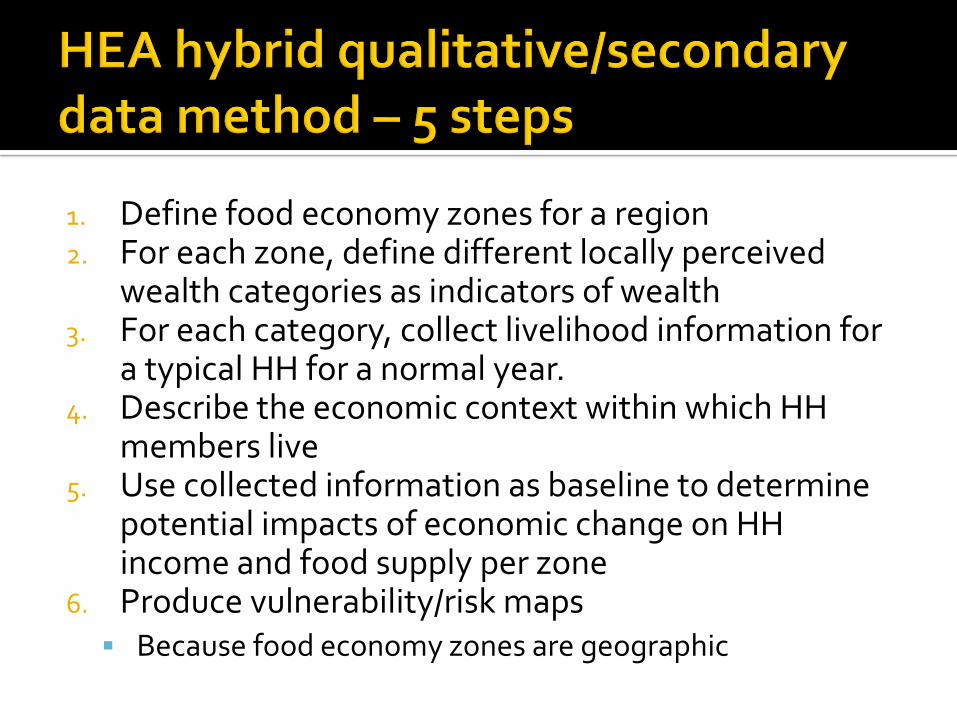
1. Define food economy zones for a region2. For each zone, define different locally perceived
wealth categories as indicators of wealth3. For each category, collect livelihood information for
a typical HH for a normal year. 4. Describe the economic context within which HH
members live5. Use collected information as baseline to determine
potential impacts of economic change on HH income and food supply per zone
6. Produce vulnerability/risk maps Because food economy zones are geographic
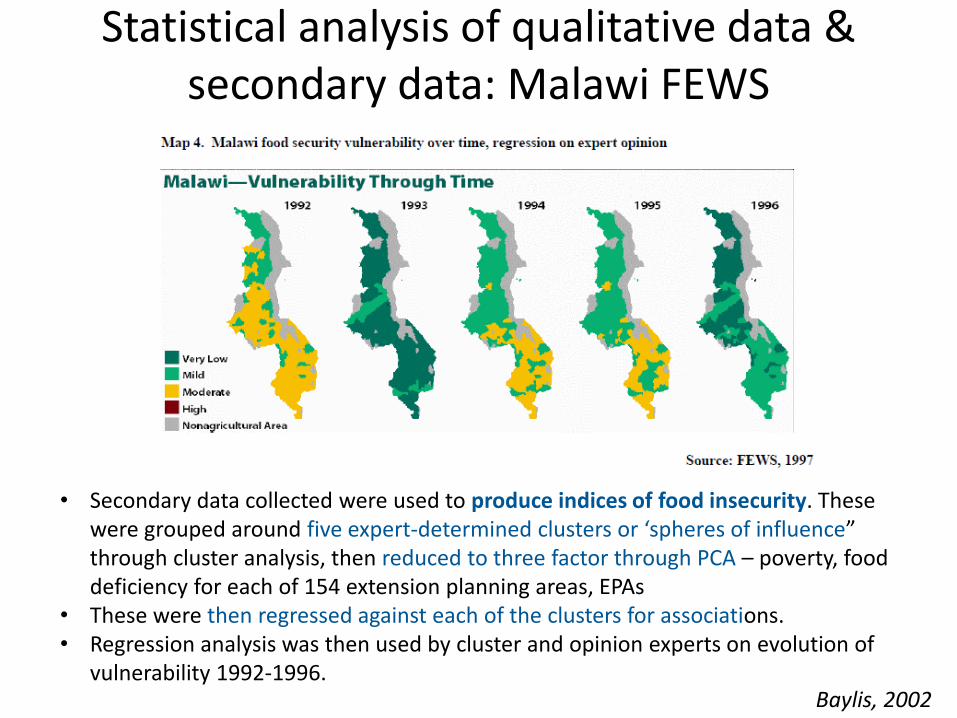
Statistical analysis of qualitative data & secondary data: Malawi FEWS
• Secondary data collected were used to produce indices of food insecurity. These were grouped around five expert-determined clusters or ‘spheres of influence” through cluster analysis, then reduced to three factor through PCA – poverty, food deficiency for each of 154 extension planning areas, EPAs
• These were then regressed against each of the clusters for associations.• Regression analysis was then used by cluster and opinion experts on evolution of
vulnerability 1992-1996. Baylis, 2002
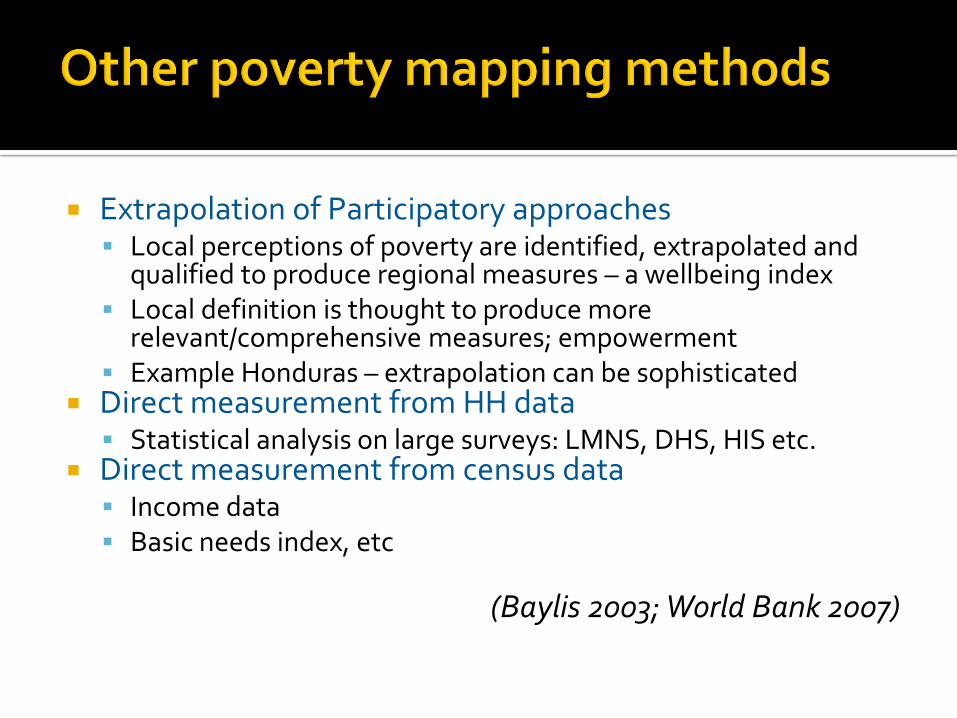
Extrapolation of Participatory approaches Local perceptions of poverty are identified, extrapolated and
qualified to produce regional measures – a wellbeing index Local definition is thought to produce more
relevant/comprehensive measures; empowerment Example Honduras – extrapolation can be sophisticated
Direct measurement from HH data Statistical analysis on large surveys: LMNS, DHS, HIS etc.
Direct measurement from census data Income data Basic needs index, etc
(Baylis 2003; World Bank 2007)
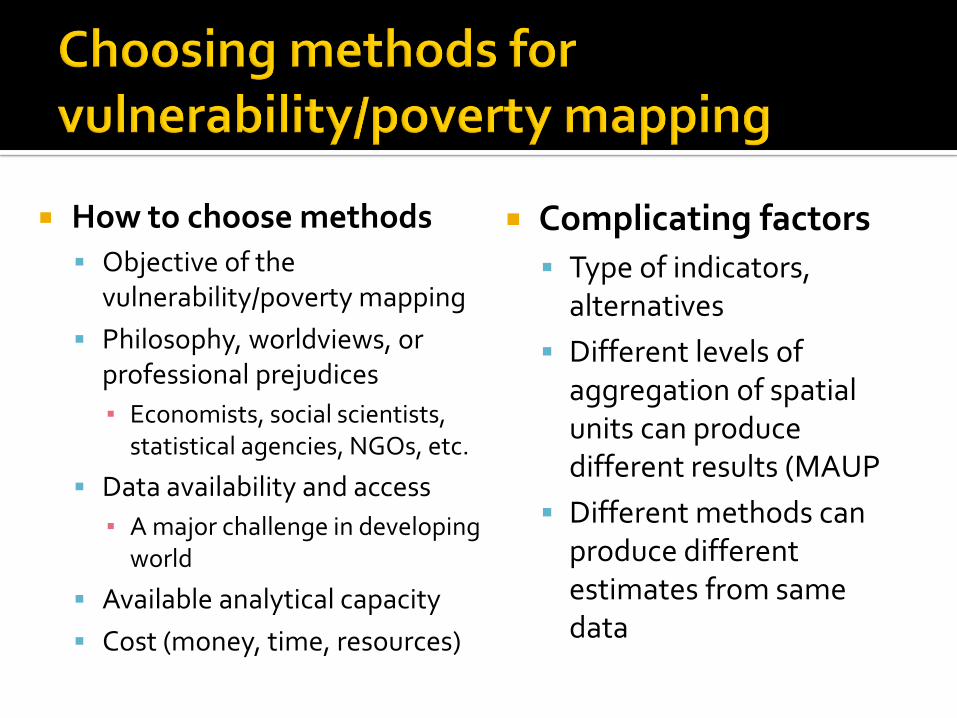
How to choose methods
Objective of the vulnerability/poverty mapping
Philosophy, worldviews, or professional prejudices
▪ Economists, social scientists, statistical agencies, NGOs, etc.
Data availability and access
▪ A major challenge in developing world
Available analytical capacity
Cost (money, time, resources)
Complicating factors
Type of indicators, alternatives
Different levels of aggregation of spatial units can produce different results (MAUP
Different methods can produce different estimates from same data

Census data Survey data
Demographic Health Surveys (DHS)
Multiple Indicator Cluster Surveys (MICS)
Integrated HH surveys
Living Standards Measurement Study (LSMS)
National Human Development Reports
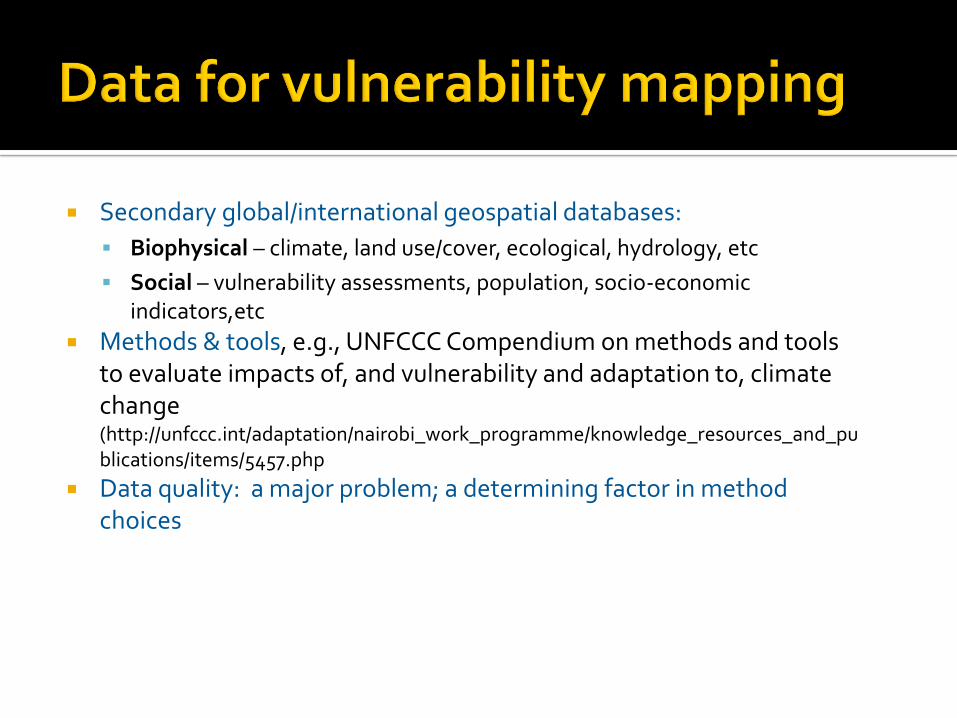
Secondary global/international geospatial databases:
Biophysical – climate, land use/cover, ecological, hydrology, etc
Social – vulnerability assessments, population, socio-economic indicators,etc
Methods & tools, e.g., UNFCCC Compendium on methods and tools to evaluate impacts of, and vulnerability and adaptation to, climate change (http://unfccc.int/adaptation/nairobi_work_programme/knowledge_resources_and_publications/items/5457.php
Data quality: a major problem; a determining factor in method choices

Awareness and uses of Monetary Poverty Maps among Institutions, Bolivia
Awareness and use were much higher among international users than public institutions
(World Bank 2007)

The 10 Steps of the Poverty Mapping Process1. Define the scope of the mapping exercise2. Build support3. Create demand4. Overcome challenges, conflicts, and tensions5. Establish institutional arrangements6. Address data and software issues7. Produce the poverty maps and test their validity8. Distribute poverty mapping products9. Support users and provide follow-up10. Engage development partners(Case study Albania, CARLETTO et al, in World Bank 2007)
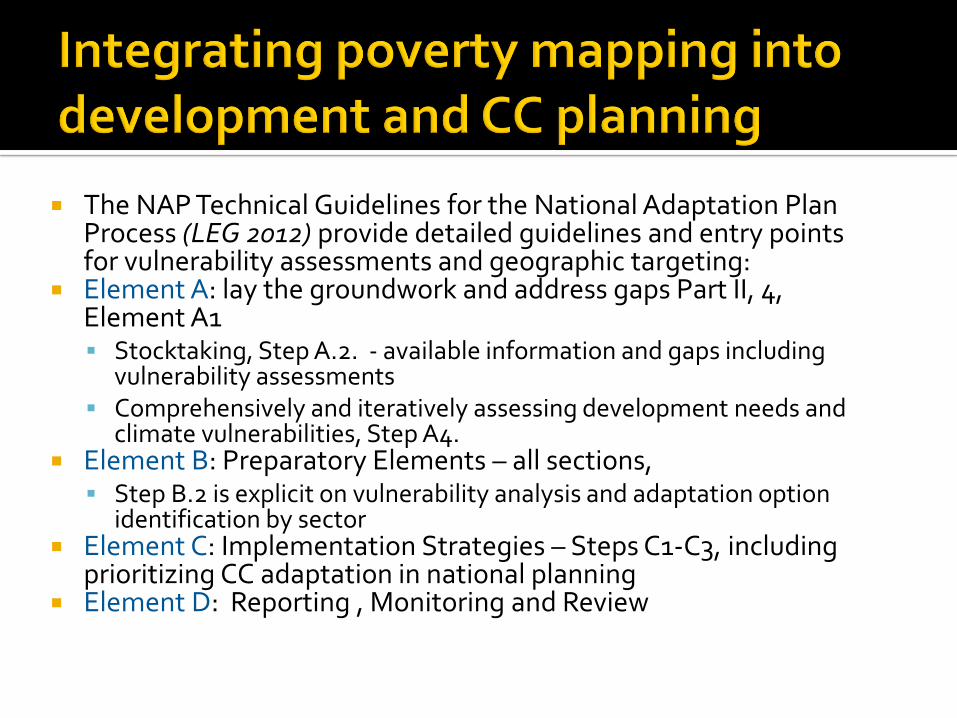
The NAP Technical Guidelines for the National Adaptation Plan Process (LEG 2012) provide detailed guidelines and entry points for vulnerability assessments and geographic targeting:
Element A: lay the groundwork and address gaps Part II, 4, Element A1 Stocktaking, Step A.2. - available information and gaps including
vulnerability assessments Comprehensively and iteratively assessing development needs and
climate vulnerabilities, Step A4. Element B: Preparatory Elements – all sections,
Step B.2 is explicit on vulnerability analysis and adaptation option identification by sector
Element C: Implementation Strategies – Steps C1-C3, includingprioritizing CC adaptation in national planning
Element D: Reporting , Monitoring and Review

Vulnerability/poverty mapping tools are important, but choose critically, customize, and have a longer term view (a process, not one-off event or just a map)
Integrate levels of local participation and decision making in vulnerability/poverty assessments for enhance local relevance
Take proportionate affirmative action to creatively include marginalized groups: women & girls, ethnic minorities/indigenous communities, low caste groups, urban
poor, youth, etc. Small grants program at national level offer flexibility for creative,
vulnerability-/country-specific adaptation interventions that miss international funding streams.
Anticipate and integrate data collection needs vulnerability/poverty mapping into national surveys and synchronize with census data collection
Build in-house capacity for vulnerability/poverty mapping with national statistical services

Inherent spatial heterogeneity in natural and social systems causes variation in vulnerability/poverty indicators
makes spatial tools essential for the geographic targeting of the vulnerable/poor for adaptation & development planning.
Vulnerability/poverty mapping methods are diverse, from participatory poverty profiles to sophisticated econometric models & standalone
programs; hence critical selection and use is key. All methods involve some error, hence require a balancing act:
Biophysical versus social indicators of vulnerability and goals
Quantitative versus qualitative methods or combines
Data scarcity versus reliability of vulnerability estimates
Objective versus political criteria e.g., the poorest or marginalized groups versus groups with best value for money/resources
Broadening notion of vulnerability favor methods that integrate local power and decision-making in selecting the vulnerable and in targeting adaptation/development interventions.

THANK YOU FOR YOUR ATTENTION?
QUESTIONS?COMMENTS?
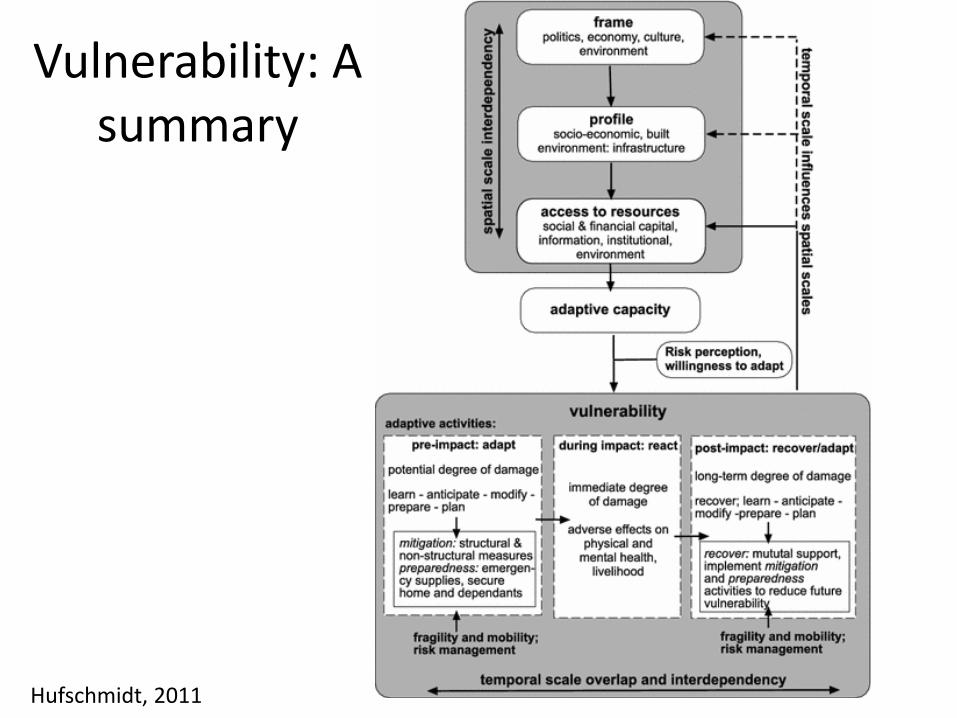
Hufschmidt, 2011
Vulnerability: A summary

Poverty mapping revealed the link between cholera spread and poverty in South Africa
An overlay of a poverty map and information on a cholera outbreak in the KwaZulu Natal province of South Africa in early 2001 shows that the outbreak originated in very high and high poverty areas and spread through and towards other poor areas.
Mapping poverty and the spread of cholera in KwaZulu Natal, South Africa, January 2001
Henninger and Snel 2002)