w a y n e c o u n t y a i r p o r t a u t h o r i t …...i michael berry administration building...
TRANSCRIPT

2018
W A Y N E C O U N T Y A I R P O R T A U T H O R I T Y
COMPREHENSIVE ANNUAL FINANCIAL REPORT
F O R T H E Y E A R E N D E D S E P T E M B E R 3 0 , 2 0 1 8 – D E T R O I T , M I C H I G A N

Prepared by: Controller’s Office
WAYNE COUNTY AIRPORT AUTHORITY
Detroit, Michigan
Comprehensive Annual Financial Report
Year Ended September 30, 2018

WAYNE COUNTY AIRPORT AUTHORITY
Table of Contents
Page(s)
Introductory Section
Transmittal Letter I – VIII
Government Finance Officers Association (GFOA) Certificate of Achievement IX
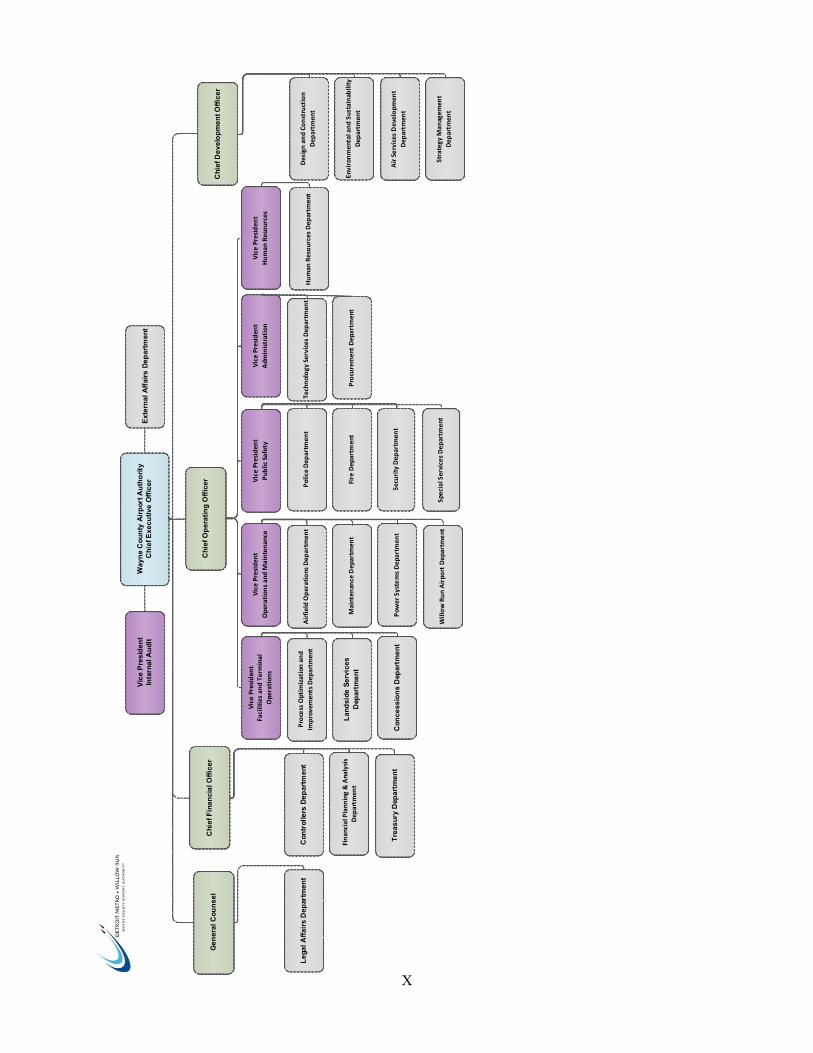
Organizational Chart X
List of Principal Officials XI
Financial Section
Independent Auditor’s Report 1 – 3
Management Discussion and Analysis 4 – 11
Basic Financial Statements:
Primary Government:
Statement of Net Position 12 – 13
Statement of Revenues, Expenses, and Changes in Net Position 14
Statement of Cash Flows 15 – 16
Notes to Basic Financial Statements 17 – 56
Required Supplementary Information:
Wayne County Airport Authority Defined Benefit Plan:
Schedule of Changes in the Net Pension Liability and Related Ratios, Schedule of Contributions and Notes to Required Supplementary Information
57 – 58
Wayne County Airport Authority Retiree Health Care Plan:
Schedule of Changes in the Net Other Postemployment Benefit Liability and Related Ratios, Schedule of Contributions and Notes to Required Supplementary Information
59 – 60

WAYNE COUNTY AIRPORT AUTHORITY
Table of Contents
Page(s)
Statistical Section (Unaudited)
Statistical Contents 61
Exhibit S-1 – Annual Revenues, Expenses, and Changes in Net Position 62
Exhibit S-2 – Principal Revenue Sources and Revenues per Enplaned Passenger 63
Exhibit S-3 – Airlines Rates and Charges 64
Exhibit S-4 – Airline Landed Weights 65 – 66
Exhibit S-5 – Enplaned Passengers 67 – 68
Exhibit S-6 – Debt Service Detail 69 – 70
Exhibit S-7 – Revenue Coverage 71
Exhibit S-8 – Ratios of Outstanding Debt 72
Exhibit S-9 – Authority Employees 73
Exhibit S-10 – Demographic and Economic Information 74
Exhibit S-10A – Selected Demographic and Economic Information for the Primary Air Trade Area
75
Exhibit S-10B – Principal Employers in Primary Air Trade Area 76
Exhibit S-11 – Airport Information – Detroit Metropolitan Airport 77
Exhibit S-12 – Airport Information – Willow Run Airport 78
Continuing Disclosure Section (Unaudited)
Documents Incorporated by Reference 79
Table 1 – Debt Service Requirements and Coverage 80
Table 2 – Operation and Maintenance Expenses 81
Table 3 – Operating Revenues 82
Table 4 – Application of Revenues 83
Table 5 – Net Revenues and Debt Service Coverage 84
Table 6 – Historical Airline Passenger Enplanements 85

WAYNE COUNTY AIRPORT AUTHORITY
Table of Contents
Pages(s)
Table 7 – Historical Comparative Total Enplanements 86
Table 8 – Historical Airline Departures 87
Table 9 – Historical Domestic Originations and Connections 88
Table 10 – Historical Airline Market Shares 89 – 90
Table 11 – Historical Airline Cargo 91
Table 12 – Historical Aircraft Landed Weight 92 – 93
Table 13 – Historical Aircraft Operations 94
Table 14 – Historical Aviation Demand Statistics 95
Table 15 – Nonstop International Destinations Added and Dropped 96
Table 16 – Historical Operating Results 97
Table 17 – Top 20 Domestic O&D Markets 98
Table 18 – Top 20 International O&D Markets 99
Compliance Section
Independent Auditor’s Report on Internal Control Over Financial Reporting and on Compliance and Other Matters Based on an Audit of Financial Statements Performed in Accordance with Government Auditing Standards
100 – 102
Report on Compliance for the Passenger Facility Charge Program; Report on Internal Control Over Compliance
103 – 104
Schedule of Passenger Facility Charge Revenues and Expenditures 105
Notes to Schedule of Passenger Facility Charge Revenues and Expenditures 106

I
Michael Berry Administration Building
11050 Rogell Drive, Bldg. #602
Detroit, MI 48242
Ph 734 247‐7678
www.metroairport.com
January 25, 2019 To the Wayne County Airport Authority Board: The Comprehensive Annual Financial Report (CAFR) of the Wayne County Airport Authority (the Authority) as of and for the year ended September 30, 2018 is submitted herewith. Responsibility for both the accuracy of the presented data and completeness and fairness of the presentation, including all disclosures, rests with the Authority. To the best of our knowledge and belief, this report fairly presents and fully discloses the Authority’s financial position, results of operations and cash flows in accordance with accounting principles generally accepted in the United States of America (GAAP). It includes disclosures necessary to enable the reader to gain an understanding of the Authority’s financial activities included within the CAFR. The report of the independent auditors on the financial statements is included on pages 1 – 3 of the CAFR. The CAFR was prepared following the guidelines recommended by the Government Finance Officers Association of the United States and Canada (GFOA). The GFOA awards Certificates of Achievement to those governments whose annual financial reports are judged to conform substantially to the high standards of public financial reporting, including GAAP promulgated by the Governmental Accounting Standards Board (GASB). The management of the Authority is responsible for establishing and maintaining an internal control structure that is designed to ensure that the assets of the Authority are safeguarded. In addition, as a recipient of federal financial assistance, the Authority is responsible to make certain that an adequate internal control structure is in place to ensure compliance with general and specific laws and regulations related to the Airport Improvement Program and the Aviation Safety and Capacity Expansion Act. The objectives of an internal control structure are to provide management with reasonable assurance that the resources are safeguarded against waste, loss and misuse and reliable data are recorded, maintained and fairly disclosed in reports. The current internal controls provide the Authority with a solid base of reliable financial records from which the financial statements are prepared. These accounting controls ensure that accounting data are reliable and available to facilitate the preparation of financial statements on a timely basis. Inherent limitations should be recognized in considering the potential effectiveness of any system of internal control. The concept of reasonable assurance is based on the recognition that the cost of a system of internal control should not exceed the benefits derived and that the evaluation of those factors requires estimates and judgment by management.

II
State laws require an annual audit of the financial records and transactions of the Authority by a firm of independent licensed certified public accountants. The Board appoints an Audit Committee of three Board members to ensure compliance with this requirement. The Audit Committee is to meet at least four times each year with the Chief Executive Officer, the Chief Financial Officer (who is appointed by the Chief Executive Officer) and the Authority’s independent public auditors to review the financial condition, operations, performance and management of the Authority. In addition, the Chief Executive Officer appoints an Internal Auditor to evaluate the Authority’s internal accounting and administrative control system and conduct audits relating to the Authority’s financial activities. The Authority’s financial statements for the year ended September 30, 2018 have received an “unmodified opinion” from Plante & Moran, PLLC, the Authority’s independent certified public accountants. An unmodified opinion is the best opinion that an organization can receive on its financial statements. It indicates that the auditor’s examination has disclosed no conditions that cause them to believe that the financial statements are not fairly stated in all material respects. An independent audit was also performed by Plante & Moran, PLLC, as required under Federal Aviation Regulation, Part 158 (Passenger Facility Charges). The auditor’s reports related to the Schedule of Passenger Facility Charges are immediately following the CAFR in the Compliance Section. Unlike most fiscal years, for the year ended September 30, 2018 an independent audit was not performed in accordance with the requirements of the Uniform Grant Guidance (2 CFR Part 200), i.e., Single Audit. Federal expenditures of the Authority did not meet the $750,000 threshold which requires the performance of a Single Audit. This CAFR was prepared to meet the needs of a broad spectrum of financial statement readers and is divided into the following major sections: Introductory Section – In addition to serving as a transmittal letter, this section provides the reader an introduction to the CAFR and the Authority. The introductory section includes background information on the reporting entity, its operations and services, accounting systems and budgetary controls, overview of the local economic conditions, its long-term financial planning and certain other pertinent information. It is complementary to financial and analytical data offered in the Management Discussion and Analysis (MD&A) and the Statistical Section of the CAFR discussed below. Financial Section – The independent auditor’s report, MD&A, financial statements, notes to the financial statements and required supplementary information are included here. These are the Authority’s basic financial statements and provide an overview of the Authority’s financial position. MD&A immediately follows the independent auditor’s report and complements this letter of transmittal and should be read in conjunction with it. Statistical Section – The supplementary information presented in this section is designed to provide additional historical perspective, context and detail to assist a reader to understand and assess the Authority’s economic condition beyond what is provided in the financial statements and notes to the financial statements. The information contained in this section is prepared by the Authority and is not part of the independent auditor’s report. Continuing Disclosure Section – The continuing disclosure schedules reflect information in accordance with the requirements of Rule 15c2-12 promulgated by the Securities and Exchange Commission and as set

III
forth in the Continuing Disclosure Undertaking for issued debt. The information contained in this section is prepared by the Authority and is not part of the independent auditor’s report. Compliance Section – This section presents schedules and footnotes prepared to meet the Federal Aviation Administration requirements applicable to the Passenger Facility Charge Program in accordance with 14 CFR Part 158. REPORTING ENTITY BACKGROUND The Authority is an independent public benefit agency and considered an agency of the Charter County of Wayne, Michigan (the County), which owns the Detroit Metropolitan Wayne County Airport (DTW) and Willow Run Airport (YIP), (collectively, the “Airports”). Until August 9, 2002, the County operated the Airports. Pursuant to an amendment to the Aeronautics Code of the State of Michigan, known as the Public Airport Authority Act (the Authority Act), Public Act 90, Michigan Public Acts of 2002, effective March 26, 2002, the Authority has operational jurisdiction of the Airports, with the exclusive right, responsibility and authority to occupy, operate, control and use the Airports and the Airport Hotel. Pursuant to the Authority Act, the Authority is liable for all of the obligations with respect to the Airports and the Airport Hotel. The Authority is directed and governed by a Board consisting of seven members. The governor of the State appoints two members of the Board; one member is appointed by the legislative body of the County and four members of the Board are appointed by the Chief Executive Officer of the County. The Board appoints the Chief Executive Officer of the Authority. AUTHORITY OPERATIONS AND SERVICES The Authority is self-supporting, using aircraft landing fees, fees from terminal and other rentals and revenue from parking, concessions and various additional sources to fund operating expenses. The Authority is not taxpayer-funded. The Capital Improvement Program is funded by bonds issued by the Authority, federal and state grants, passenger facility charges (PFCs) and other discretionary funds. Airline Use and Lease Agreement Leases. Revenues received by the Authority in accordance with the Master Airport Revenue Bond Ordinance (Master Bond Ordinance) are derived from rentals, fees and charges imposed upon airlines operating at the Airport under Airline Use and Lease Agreements relating to their use of the Airport. The following airlines are parties to such agreements: Air France, American Airlines, Delta Air Lines, Federal Express, JetBlue Airways, KLM Royal Dutch Airlines, Lufthansa German Airlines, Southwest Airlines, Spirit Airlines, United Airlines and United Parcel Service (collectively, the “Signatory Airlines”). KLM is not currently operating at the Airport. Activity Fees. Under the Airline Use and Lease Agreements, the Signatory Airlines also are obligated to pay activity fees, which are calculated on an Airport residual basis (Activity Fees). Essentially, the Activity Fee calculation for each Operating Year is based on all airport revenue bond Debt Service (net of Debt Service paid by PFCs and federal grant funds) and all Operation and Maintenance (O&M) Expenses for such Operating Year minus all non-airline revenue for such Operating Year, all airline rental payments for such Operating Year, all international facility use fees for such Operating Year and all payments for use of the Authority-controlled airline space, if any, in each terminal for such Operating Year.

IV
Amendment to End of Year True-Up of Fees and Charges. In order to enable the Authority to issue airport revenue bonds for airfield-related capital projects without the bonds being subject to the federal alternative minimum tax, all of the Signatory Airlines agreed in 2012 to an amendment of the Airline Use and Lease Agreements that revised the end of year true-up provision so that the amount to be refunded would include the Signatory and Non-Signatory Airlines. Prior to 2012, Non-Signatory Airlines did not participate in year-end refunds. Weighted Majority Approval. The Airline Use and Lease Agreements provide that a Weighted Majority of the Signatory Airlines can approve additional capital projects for which airport revenue bonds may be issued to pay the costs. A Weighted Majority is defined as either Signatory Airlines which, in the aggregate, landed eighty-five percent (85%) or more of the landed weight of all Signatory Airlines for the preceding 12-month period for which records are available or all but one of the Signatory Airlines regardless of landed weight.
Passenger Facility Charges. The Authority is obligated under the Airline Use and Lease Agreements to use PFCs to pay Debt Service on airport revenue bonds issued to pay the costs of certain PFC-eligible projects at the Airport. These projects include the construction of both the South Terminal and the North Terminal. The Airline Use and Lease Agreements also set forth a required priority for the application of PFCs to pay Debt Service in the event there is insufficient PFC revenue available in any Operating Year to pay all PFC-eligible debt service. The Airline Industry Over the past decade, since the most recent recession, the airline industry has undergone a significant transformation. By reducing capacity, particularly in short-haul markets served with small, short-range aircraft, the industry has become consistently profitable. In addition, current trends such as historically low fuel costs, the unbundling of services and the use of ancillary fees such as charges for checked baggage have further contributed to profitability, with net profits for the global airline industry totaling $34.2 billion in 2016 and $38.0 billion in 2017 (per the International Air Transport Association, IATA). Profitability was further supported by year over year growth in global passenger traffic of 7.4 percent in 2016 and 8.1 percent in 2017. IATA forecasts that net profits will remain high for the global airline industry in 2018 at $33.8 billion, with year over year growth of global passenger traffic of 7.0 percent. This period of profitability has also been a period of consolidation within the United States airline industry. Noteworthy consolidation activities included the merger of Delta and Northwest Airlines (now operating as Delta), the merger of United Airlines and Continental Airlines (now operating as United Airlines) and the purchase of AirTran Airways by Southwest Airlines. While capacity reductions and merger activity contributed to increased profitability, as demand for air travel has increased, airlines have selectively added back seat capacity over the past three years. Capacity growth has resulted from additional seats on fewer flights, which is accomplished by up-gauging equipment via replacement of smaller aircraft with larger aircraft. Based on aviation data provider Diio, the year over year growth in the nationwide capacity for the twelve months ended September 30, 2018 was 1.8 percent for flights and 3.9 percent for seats. Seats capacity at DTW grew by 1.6 percent and flights declined by 0.2 percent during this time. These changes demonstrate the effect of the airlines equipment up-gauging, as seat growth outpaces operations.

V
Airport Activity DTW ended fiscal year 2018 with a 1.6 percent increase in enplaned passengers, a 0.3 percent increase in operations, a 6.5 percent increase in cargo and a 1.7 percent increase in landed weight compared to the prior fiscal year. DTW’s activities for the years ended September 30, 2018 and 2017 were as follows:
A modest increase in demand for air travel is expected for the next fiscal year. ACCOUNTING SYSTEM AND BUDGETARY CONTROLS The Authority’s Budget Prior to the commencement of each fiscal year (currently October 1 to September 30), the Authority is required by the Master Bond Ordinance and Public Act 90 to prepare and adopt a budget. The budget contains an itemized statement of the estimated current operational expenses and the expenses for capital, including funds for the operation and development of the Airports under the jurisdiction of the Authority and the amount necessary to pay the principal and interest of any outstanding bonds or other obligations of the Authority maturing during the ensuing fiscal year. The budget also contains an estimate of the revenues of the Authority from all sources for the next fiscal year. Budgeting serves as an important management tool to plan, control and evaluate the operations of the Authority. DTW, including the Westin Hotel, and YIP Operation & Maintenance funds budgets are the Authority’s annual financial plan for operating and maintaining the airports and hotel. These budgets must be sufficient to cover the operation and maintenance expenses of the Airports, the debt service payable on bonds and other known financial requirements for the ensuing fiscal year. The Capital Improvement Program budget is the Authority’s plan for the design and construction of major improvements and new facilities at the Airports with a five-year horizon. The Authority’s basis of budgeting is in accordance to the terms of the Airline Use & Lease Agreements with the Airlines, which differs from Accounting Principles Generally Accepted in the United States of America – the Authority’s accounting basis. Budgetary control is required to ensure that expenditures do not exceed appropriations. The Authority maintains this control through the use of an encumbrance system. As purchase orders are issued, corresponding amounts of appropriations are reserved by the use of encumbrances to prevent overspending. Amendments to the budget are subject to approval by the Board in accordance with the terms contained in the Board resolution adopted with the budget. The independent monitoring of the budget continues throughout the fiscal year for management control purposes. Each month, Financial Planning & Analysis (FP&A) reviews and analyzes all revenue and expense accounts to compare actual to prior year actual and to budget. The findings are reported to the Board in the monthly management report.
2018 2017 Prct. Change
Enplanements 17,558,618 17,281,219 1.6%Operations 394,807 393,713 0.3%Cargo (in metric tons) 227,963 213,980 6.5%Landed Weight (in thousand, lbs.) 21,959,469 21,601,812 1.7%

VI
AUTHORITY’S ECONOMIC CONDITION Population and Air Trade Area DTW resides in a region which the United States Office of Management and Budget (OMB) defines as the Detroit-Warren-Ann Arbor Combined Statistical Area (CSA) and is composed of the ten Michigan counties of Genesee, Lapeer, St. Clair, Livingston, Oakland, Macomb, Washtenaw, Wayne, Lenawee and Monroe. These counties represent the primary geographical area served by DTW and are commonly called the “Air Trade Area.” The estimated population of the Air Trade Area as of 2017 was 5.3 million according to the U.S. Census Bureau. DTW serves as the primary commercial service airport for the CSA, and is by far the largest airport in the region. Within a 100-mile driving radius from DTW there are four commercial service airports that offer limited scheduled airline service. These airports are Windsor International Airport (YQG), Toledo Express Airport (TOL), Bishop International Airport (FNT) in Flint, Michigan and Capital Regional Airport (LAN) in Lansing, Michigan. Total combined enplanement activity at these airports was less than 6 percent of total enplanements at DTW in calendar year 2017. Chicago Midway International Airport (MDW) and Chicago O’Hare International Airport (ORD) are the nearest large hub airports at approximately 270 and 290 driving miles from DTW. Toronto Pearson International Airport (YYZ) in Ontario, Canada is the nearest large airport somewhat comparable in size to DTW, however, it is across the U.S. boarder and is approximately 240 driving miles from DTW. The nearest medium hub airport is Cleveland-Hopkins International Airport, which is approximately 145 driving miles from DTW. In calendar year 2017, DTW ranked 17th nationwide in total aircraft operations with 395,357 aircraft movements and 18th nationwide in total passengers, enplaning and deplaning, with approximately 34.7 million passengers. Economy The demand for air transportation is, to a large extent, dependent upon the demographic and economic characteristics of the geographical area served by an airport (i.e., the Air Trade Area). Home to a number of Fortune 500 companies, the Air Trade Area has seen steady improvement in employment rates and a high percentage of households in the uppermost income categories when compared to Michigan and the nation. The Air Trade area is home to 10 Fortune 500 Company Headquarters. Six of the Air Trade Area’s Fortune 500 companies are part of the automotive industry. The three largest employers in the Air Trade Area as of July 2018 are automobile manufacturers: Ford Motor (48,000 employees), General Motors (37,400 employees) and FCA US (35,399 employees). The University of Michigan (34,067 employees) and Beaumont Health (28,012 employees) complete the top five employers. Consistently appearing near the top of the Fortune 500 Rankings, in 2017 General Motors and Ford Motor were ranked 8th and 10th, respectively. Consistent with nationwide employment trends, the Air Trade Area has experienced significant reductions in unemployment rates from levels seen during the most recent recession (2007–2009). As of September 2018, the unemployment rate in the Air Trade Area was 3.7 percent (non-seasonally adjusted). This rate is comparable to the unemployment rate in the State of Michigan (3.5 percent) and in the United States of America (3.6 percent).

VII
Personal income is a composite measurement of market potential and indicates the general level of affluence of local residents, which corresponds to an area’s ability to afford air travel, as well as the area’s attractiveness to business and leisure travelers. For the ten-year period from 2007-2017, per capita personal income for the Air Trade Area increased at a compounded annual growth rate (CAGR) of 2.8 percent, rising from $38,624 to $50,863. In the same time period, the CAGR for Michigan was 2.9 percent and the CAGR for the United States was 2.6 percent. LONG-TERM FINANCIAL PLANNING The Authority’s long-term financial planning includes the completion of certain approved capital projects and the accumulation of sufficient resources required to service the debt issued to finance these projects, as well as to operate and maintain the Airports. Under the terms of the Airline Use and Lease Agreement, fees and charges paid by the Airlines are used along with other income from DTW to service the debt issued to finance the construction program. The Authority covenants in the Master Bond Ordinance state that DTW’s net revenues plus other available monies as defined by the Master Bond Ordinance are sufficient to provide debt service coverage of 125 percent of the average annual debt service requirement on senior lien bonds. This coverage ratio for the year ended September 30, 2018 was in excess of the requirements at 142 percent of senior lien debt service and 133 percent of total debt service. Capital Improvement Program The Authority maintains an ongoing Capital Improvement Program (CIP) to expand, modernize and maintain the Airports. In addition to renovations and modernization of certain existing facilities, the CIP includes construction of the principal elements of the Master Plan for each Airport. The Master Plans establish the framework for the CIP that is necessary for the development of the Airports. The Authority’s CIP represents current expectations of future capital needs. The current five-year plan for 2019-2023 includes planned funding of approximately $787.9 million and $107.9 million for Detroit Metropolitan and Willow Run Airports, respectively. The Authority’s funding sources for the CIP are airport revenue bonds, PFCs, grants and Authority discretionary funds. Given the multiple funding sources that comprise this plan, Board approval of the CIP does not imply that the source of funding has been determined. A detailed review of the CIP is published in the Authority’s budget book. Airport Improvement Program Since 1986, the Authority has participated in the Airport Improvement Program (AIP), the Federal government’s airport grant program. The AIP provides funding for airport development, airport planning and noise compatibility programs from the Airport and Airway Trust Fund. The AIP also provides both entitlement and discretionary grants for eligible projects. The Authority also receives grants from the State of Michigan. Passenger Facility Charges In 1990, Congress approved the Aviation Safety and Capacity Expansion Act, which authorized domestic airports to impose a PFC on enplaning passengers. In May 1991, the FAA issued the regulations for the

VIII
use and reporting of PFCs. PFCs may be used for projects which meet at least one of the following criteria: preserve or enhance safety, security, or capacity of the national air transportation system; reduce noise or mitigate noise impacts resulting from an airport; or furnish opportunities for enhanced competition between or among carriers. Since 1992, the FAA has approved six PFC applications and amendments submitted by the Authority. The Authority is currently authorized to impose and use a PFC of $4.50 per enplaned passenger up to $3.2 billion, which includes amounts for the payment of principal, interest and other financing costs on bonds for which the proceeds are used to pay PFC-eligible costs on approved projects. As of September 30, 2018, the Authority received approximately $1.44 billion of PFC revenue and interest earnings of approximately $73.6 million. The Authority expended approximately $1.51 billion on approved projects. The current PFC expiration date is estimated at February 1, 2034. OTHER INFORMATION Awards and Achievement The GFOA awarded the Authority a “Certificate of Achievement” for Excellence in Financial Reporting for its CAFR for the year ended September 30, 2017. This was the fifteenth consecutive year that the Authority has achieved this prestigious award. In order to be awarded a Certificate of Achievement, a government must publish an easily readable and efficiently organized CAFR. Such a CAFR must satisfy both accounting principles generally accepted in the United States of America and applicable legal requirements. A Certificate of Achievement is valid for a period of one year only. We believe our current report continues to conform to the Certificate of Achievement program requirements and are submitting this 2018 CAFR to the GFOA for consideration. Acknowledgments The preparation of this report could not have been accomplished without the efficient and dedicated services of the entire staff of the Finance Division. We would like to express our appreciation to all members of this Division. This report also could not have been possible without the leadership and support of the governing body of the Authority’s Board. Respectfully submitted,
Chad Newton Amber Hunt Chief Executive Officer Chief Financial Officer
IX
X
V
ice
Pre
sid
en
tIn
tern
al
Au
dit
C
hief
Fin
an
cia
l O
ffic
er
C
ontr
olle
rs D
ep
art
me
nt
Finan
cial P
lann
ing & Ana
lysis
Dep
artmen
t
Tre
as
ury
Dep
art
me
nt
Process Optim
ization and
Improve
ments Dep
artmen
t
L
and
sid
e S
erv
ice
s
Dep
art
me
nt
C
on
ce
ssio
ns
Dep
art
me
nt
Vice Presiden
t Facilities an
d Term
inal
Ope
rations
Vice President
Ope
ration
s an
d M
aintenance
Airfield Operations Dep
artm
ent
Mainten
ance Dep
artm
ent
Pow
er Systems Dep
artm
ent
Willow Run Airpo
rt Dep
artm
ent
Vice Presiden
t
Pub
lic Safety
Police Dep
artm
ent
Fire Dep
artm
ent
Se
curity Dep
artm
ent
Vice Presiden
t
Adm
inistration
Te
chnology Services Dep
artm
ent
Procuremen
t Dep
artmen
t
C
hie
f De
ve
lop
me
nt
Off
ice
r
Vice Presiden
t
Human Resources
Design and Co
nstruction
Dep
artm
ent
Human
Resources Dep
artm
ent
Env
ironmen
tal and Sustainab
ility
Dep
artm
ent
Air Services Developm
ent
Departm
ent
Strategy M
anagem
ent
Departm
ent
C
hie
f O
pe
rati
ng
Off
ice
r
Wa
yne
Co
un
ty A
irp
ort
Au
tho
rity
Ch
ief
Ex
ecu
tive
Off
icer
G
en
era
l C
oun
se
l
E
xte
rna
l A
ffa
irs
De
par
tme
nt
L
eg
al
Aff
air
s D
ep
artm
en
t
Spe
cial Services Departm
ent

XI
LIST OF PRINCIPAL OFFICIALS
Authority Board Position Term Expires Nabih H. Ayad Chairperson October 2020 Dr. Curtis L. Ivery Vice-Chairperson October 2024 Marvin W. Beatty Secretary October 2023 Michael Garavaglia Board Member October 2020 Ronald Hall, Jr. Board Member October 2020 Mark Ouimet Board Member October 2022 Al Haidous Board Member October 2024
Airport Management Position Chad Newton Chief Executive Officer Amber Hunt Chief Financial Officer June Lee Chief Operating Officer Bryant Holt Chief Development Officer Shannon Ozga Interim General Counsel Angela Frakes Vice President – Facilities and Terminal Operations Darryl Brown Vice President – Public Safety Istakur Rahman Vice President – Internal Audit James Montgomery Vice President – Operations and Maintenance Lynda Racey Vice President – Human Resources

Independent Auditor's Report
To the Board of DirectorsWayne County Airport Authority
Report on the Financial Statements
We have audited the accompanying financial statements of each major fund of the Wayne County AirportAuthority (the "Authority") as of and for the year ended September 30, 2018 and the related notes to the financialstatements, which collectively comprise the Wayne County Airport Authority's basic financial statements, as listedin the table of contents.
Management’s Responsibility for the Financial Statements
Management is responsible for the preparation and fair presentation of these financial statements in accordancewith accounting principles generally accepted in the United States of America; this includes the design,implementation, and maintenance of internal control relevant to the preparation and fair presentation of financialstatements that are free from material misstatement, whether due to fraud or error.
Auditor’s Responsibility
Our responsibility is to express an opinion on these financial statements based on our audit. We conducted ouraudit in accordance with auditing standards generally accepted in the United States of America and the standardsapplicable to financial audits contained in Government Auditing Standards, issued by the Comptroller General ofthe United States. Those standards require that we plan and perform the audit to obtain reasonable assuranceabout whether the financial statements are free from material misstatement.
An audit involves performing procedures to obtain audit evidence about the amounts and disclosures in thefinancial statements. The procedures selected depend on the auditor’s judgment, including the assessment of therisks of material misstatement of the financial statements, whether due to fraud or error. In making those riskassessments, the auditor considers internal control relevant to the entity’s preparation and fair presentation of thefinancial statements in order to design audit procedures that are appropriate in the circumstances, but not for thepurpose of expressing an opinion on the effectiveness of the entity’s internal control. Accordingly, we express nosuch opinion. An audit also includes evaluating the appropriateness of accounting policies used and thereasonableness of significant accounting estimates made by management, as well as evaluating the overallpresentation of the financial statements.
We believe that the audit evidence we have obtained is sufficient and appropriate to provide a basis for our auditopinions.
Opinions
In our opinion, the financial statements referred to above present fairly, in all material respects, the respectivefinancial position of each major fund of the Wayne County Airport Authority as of September 30, 2018 and therespective changes in its financial position and, where applicable, cash flows for the year then ended inaccordance with accounting principles generally accepted in the United States of America.
Emphasis of Matter
As explained in Note 2(v) to the notes to the financial statements, the Authority adopted Governmental AccountingStandards Board (GASB) Statement No. 75, Accounting and Financial Reporting for Postemployment BenefitsOther than Pensions, which resulted in the Authority restating net position for the recognition of the Authority’sother postemployment benefit related activity incurred prior to October 1, 2017. Our opinion is not modified withrespect to this matter.
1

To the Board of DirectorsWayne County Airport Authority
Required Supplemental Information
Accounting principles generally accepted in the United States of America require that the management'sdiscussion and analysis and the required supplemental information, as identified in the table of contents, bepresented to supplement the basic financial statements. Such information, although not a part of the basicfinancial statements, is required by the Governmental Accounting Standards Board, which considers it to be anessential part of financial reporting for placing the basic financial statements in an appropriate operational,economic, or historical context. We have applied certain limited procedures to the required supplementalinformation in accordance with auditing standards generally accepted in the United States of America, whichconsisted of inquiries of management about the methods of preparing the information and comparing theinformation for consistency with management's responses to our inquiries, the basic financial statements, andother knowledge we obtained during our audit of the basic financial statements. We do not express an opinion orprovide any assurance on the information because the limited procedures do not provide us with sufficientevidence to express an opinion or provide any assurance.
Other Information
Our audit was conducted for the purpose of forming an opinion on the financial statements that collectivelycomprise the Wayne County Airport Authority's basic financial statements. The schedule of passenger facilitycharge revenues and expenditures, as required by the Passenger Facility Charge Audit Guide for Public Agencies,and the introductory section, statistical section, and continuing disclosure section are presented for the purpose ofadditional analysis and are not a required part of the basic financial statements.
The schedule of passenger facility charge revenues and expenditures is the responsibility of management andwas derived from and relates directly to the underlying accounting and other records used to prepare the basicfinancial statements. Such information has been subjected to the auditing procedures applied in the audit of thebasic financial statements and certain additional procedures, including comparing and reconciling such informationdirectly to the underlying accounting and other records used to prepare the basic financial statements or to thebasic financial statements themselves, and other additional procedures in accordance with auditing standardsgenerally accepted in the United States of America. In our opinion, the schedule of passenger facility chargerevenues and expenditures is fairly stated in all material respects in relation to the basic financial statements as awhole.
The introductory section, statistical section, and continuing disclosure section have not been subjected to theauditing procedures applied in the audit of the basic financial statements and, accordingly, we do not express anopinion nor provide any assurance on them.
Other Reporting Required by Government Auditing Standards
In accordance with Government Auditing Standards, we have also issued our report dated January 25, 2019 onour consideration of the Wayne County Airport Authority's internal control over financial reporting and on our testsof its compliance with certain provisions of laws, regulations, contracts, grant agreements, and other matters. Thepurpose of that report is to describe the scope of our testing of internal control over financial reporting andcompliance and the results of that testing, and not to provide an opinion on the internal control over financialreporting or on compliance. That report is an integral part of an audit performed in accordance with GovernmentAuditing Standards in considering the Wayne County Airport Authority's internal control over financial reporting andcompliance.
January 25, 2019
2

This page intentionally left blank.
3

WAYNE COUNTY AIRPORT AUTHORITY
MANAGEMENT DISCUSSION AND ANALYSIS
September 30, 2018
4
The following discussion and analysis provides an overview of the financial performance and activities of the Wayne County Airport Authority (the Authority) as of and for the year ended September 30, 2018, with selected comparative information for the year ended September 30, 2017. This discussion and analysis has been prepared by the Authority’s management and should be read in conjunction with the basic financial statements and notes thereto, which follow this section. The Authority is a business-type entity and, as such, the basic financial statements consist of three statements and notes to the basic financial statements. The three basic statements are: (a) Statement of Net Position, which presents the assets, liabilities, deferred inflows and outflows of resources and net position of the Authority as of the end of the fiscal year (b) Statement of Revenues, Expenses, and Changes in Net Position, which reflects revenues and expenses recognized during the fiscal year and (c) Statement of Cash Flows, which provides information on all the cash inflows and outflows for the Authority by major category during the fiscal year. The financial statements are prepared in accordance with accounting principles generally accepted in the United States of America (U.S.) as promulgated by Governmental Accounting Standards Board (GASB) principles. The financial statements include the operations of Detroit Metropolitan Wayne County Airport, including the Airport Hotel (the Airport) and Willow Run Airport. The Airport Funding Methodology Funding for the Airport’s operations is predicated upon the stipulations in the Airport Use and Lease Agreements (the agreements) between the Authority and the Airlines. The agreements set the terms of the business relationship between the Authority and the Airlines. Key terms in the agreements include rental rates, activity fee methodology, utilities, etc. Once an airline signs an agreement, they are designated a “Signatory Airline.” The agreements also determine the budget and financing (activity fee) methodology that the Authority and Airlines agree to follow. Airport budget methodologies throughout the United States are usually characterized as either compensatory or residual, although some airports have a hybrid methodology that combines both features. The Airport operates under a residual methodology. The methodology places additional risk on the Airlines as these Airlines guarantee the net cost of operating the entire Airport. This obligation includes operating expenses and all debt service requirements of the Airport. If the Airport incurs a deficit in a particular year, it has the ability to increase rates to all Airlines up to the amount of the deficit. Conversely, if the Airport realizes a surplus, the Airport must refund the surplus to all the Airlines. The total amount to be charged or refunded is based on a pro rata allocation between the Signatory Airlines and the Non-Signatory Airlines, which reflects the same ratio as the ratio of total activity fees paid by each group.
The residual methodology agreed upon by the Signatory Airlines and the Authority creates a funding mechanism that is not congruent with financial statement reporting standards. Although the Airlines are required to fund any deficit of the Airport, this deficit is not equivalent to “Operating Loss” or any other designation on the financial statements. Since the Airport utilizes the residual methodology, all annual operating costs and debt service requirements of the Airport have been funded.

WAYNE COUNTY AIRPORT AUTHORITY
MANAGEMENT DISCUSSION AND ANALYSIS
September 30, 2018
5
Financial Highlights Fiscal Year 2018 operating revenues increased $14.5 million (3.9 percent) compared to 2017. Authority airline revenues increased by $0.6 million (0.4 percent) compared to 2017, primarily due to a decrease in landing fee revenue ($2.6 million) partially offset by increases in terminal building rental and facility use fee revenues of $2.7 million and $0.5 million, respectively. Authority non-airline revenues increased by $13.9 million (7.0 percent) compared to 2017 and outperformed budgeted non-airline revenues by $14.0 million (7.2 percent). Operating expenses are $11.8 million (2.9 percent) lower than fiscal year 2017. The primary categories that decreased were salaries, wages and fringe benefits ($14.4 million) and depreciation ($10.0 million). These decreases were offset by increases in professional and other contractual services ($6.8 million) and hotel management ($1.7 million). Nonoperating revenues in 2018 increased by $5.7 million (6.9 percent) compared to 2017. The primary categories that increased were interest income, which increased by $4.0 million and passenger facility charges, which increased by $1.6 million. Nonoperating expenses increased by $3.8 million (4.7 percent). The increase is primarily due to an increase in interest expense ($9.7 million) offset by a decrease in the loss on disposal of assets ($5.8 million). In addition, capital contributions decreased $6.9 million from the prior year. Statement of Net Position The Statement of Net Position includes all assets, liabilities, deferred inflows and outflows of resources and the resulting net position. Assets and liabilities are generally measured using current values. One exception is capital assets, which are stated at historical cost less an allowance for depreciation. The condensed summary of the Authority’s net position as of September 30, 2018 and 2017 is as follows:

WAYNE COUNTY AIRPORT AUTHORITY
MANAGEMENT DISCUSSION AND ANALYSIS
September 30, 2018
6
Current unrestricted assets consist mainly of cash and investments, accounts receivable and amounts due from other governmental units. Current unrestricted assets increased $9.2 million over 2017, primarily due to an increase in unrestricted cash ($12.2 million) and accounts receivable ($2.0 million) offset by a reduction in grants receivable ($5.8 million). Restricted assets consist of cash and investments and accounts receivable which are restricted for debt service and bonded construction. Restricted assets increased approximately $19.8 million over the prior year due to the issuance of new airport revenue bonds. All cash and investments of the Authority are invested according to legal requirements established by the legislature of the State of Michigan. In accordance with State law, investments are restricted to various U.S. government securities, certificates of deposit, commercial paper and repurchase agreements. Other assets consist primarily of prepaid bond insurance premiums, net of related amortization. Deferred outflows of
2018 2017(000's) (000's)
ASSETS:
Current unrestricted assets 224,019$ 214,794$
Restricted assets 391,709 371,935
Capital assets (net) 1,947,922 1,991,353
Other assets 2,004 9,082
Total assets 2,565,654 2,587,164
DEFERRED OUTFLOWS 46,116 48,455
LIABILITIES:
Current liabilities 76,960 90,066
Liabilities payable from restricted assets 127,534 127,324
Long-term liabilities 2,255,744 2,200,923
Total liabilities 2,460,238 2,418,313
DEFERRED INFLOWS 5,139 -
NET POSITION:
Net investment in capital assets (118,242) (90,041)
Restricted 296,207 295,809
Unrestricted (31,572) 11,538
TOTAL NET POSITION 146,393$ 217,306$

WAYNE COUNTY AIRPORT AUTHORITY
MANAGEMENT DISCUSSION AND ANALYSIS
September 30, 2018
7
resources represent the consumption of net position in one period that is applicable to future periods. They are reported separately from assets and consist of the deferred amount on debt refunding and deferred outflows related to pensions and other post-employment benefits (OPEB). In accordance with the terms of applicable ordinances, the Authority is required to restrict assets for various purposes. The components of net position have been reserved related to certain restrictions on the use of those assets. Net position has been restricted for operations and maintenance, replacement and improvements, construction, bond and interest redemption, passenger facility charges, customer facility charges and drug enforcement. Current liabilities consist mainly of accounts payable, payroll-related liabilities, self-insurance liabilities, accrued vacation and sick time, amounts due to other governmental units and security/performance deposits. Long-term liabilities consist primarily of long-term debt, net pension liability, net OPEB liability, other accrued liabilities and amounts due to other governmental units. Long-term liabilities increased approximately $54.8 million in fiscal year 2018, primarily as a result of the implementation of GASB 75, which resulted in an increase in long-term liabilities of $56.7 million. Deferred inflows of resources represent an acquisition of net position that is applicable to future periods, and increased $5.1 million due to differences between projected and actual earnings on pension plan investments and the implementation of GASB 75. Total net position at September 30, 2018 was approximately $146.4 million, which is a decrease in net position of $70.9 million from 2017. The decrease is the net result of a $68 million decrease in net position resulting from the restatement of beginning net position for GASB 75, and a decrease of $2.9 million as a result of changes in net position from current year operations. A total of $296.2 million of the Airport’s 2018 net position is restricted for future debt service, capital construction and replacement, bond and interest redemption and passenger facility charges, subject to federal regulations. Net investment in capital assets was a negative $118.2 million and represents land, intangible assets, buildings, improvements and equipment, net of accumulated depreciation and outstanding principal balances of debt attributable to the acquisition of, construction or improvement of those assets. Unrestricted net position was a negative $31.6 million. The Authority reported a positive unrestricted net position in each of the past two fiscal years ($11.5 million in 2017 and $19.2 million in 2016). The net OPEB liability of $56.7 million which was recorded upon implementation of GASB 75 caused the shift from positive to negative unrestricted net position at September 30, 2018. Capital Assets and Long Term Debt Activity The Authority is authorized to issue airport revenue bonds to finance the cost of capital projects and include the debt service on such bonds in the fees and charges of the Signatory Airlines only after receiving approval of a Weighted Majority for such capital projects. As of September 30, 2018, the Authority had approximately $2.2 billion in outstanding bonds and other debt, both senior and subordinate, paying fixed and variable rates. The total annual debt service (principal and interest) was approximately $182.7 million in 2018 and long-term debt amounting to $92.7 million was paid off during the year. More detailed information on capital assets and long-term debt activity can be found in Notes 7 and 8 included in the Notes to Basic Financial Statements section of this report.

WAYNE COUNTY AIRPORT AUTHORITY
MANAGEMENT DISCUSSION AND ANALYSIS
September 30, 2018
8
Statement of Revenues, Expenses and Changes in Net Position The Statement of Revenues, Expenses, and Changes in Net Position presents the operating results of the Authority, as well as the nonoperating revenues and expenses. Operating revenues include both airline and non-airline revenues and consist primarily of landing and related fees, terminal building rental and fees, parking fees, concession fees, car rental and hotel revenues. Nonoperating revenues consist primarily of passenger facility charges, federal and state sources and interest income. Interest expense is the most significant nonoperating expense. A summarized comparison of the Authority’s revenues, expenses, and changes in net position for the years ended September 30, 2018 and 2017 follows:
2018 2017
(000's) (000's)
Operating revenues:
Airline revenues:
Airport landing and related fees 77,551$ 80,160$
Terminal building rentals and fees 84,929 82,231
Facility use fees 9,378 8,829
Non-airline revenues:
Parking fees 80,248 76,707
Concession fees 42,787 39,753
Car rental 26,165 24,950
Hotel 31,368 29,928
Other 30,220 25,574
Total operating revenues 382,646 368,132
Operating expenses:
Salaries, wages, and fringe benefits 96,282 110,656
Parking management 8,405 7,987
Hotel management 19,775 18,049
Depreciation 124,774 134,754
Professional and contractual services 32,760 25,925
Utilities 23,877 23,259
Building, ground, equipment maintenance 38,180 36,863
Other 45,561 43,898
Total operating expenses 389,614 401,391
Operating loss (6,968) (33,259)
Nonoperating revenues (expense):
Passenger facility charges 69,774 68,128
Other nonoperating revenues 18,815 14,779
Interest expense (82,468) (72,739)
Other nonoperating expenses (2,500) (8,385)
Net nonoperating expenses 3,621 1,783
Net loss before capital contribution (3,347) (31,476)
Capital Contribution 390 7,278
Changes in net position (2,957) (24,198)
Net position, beginning of the year, restated 149,350 241,504
Net position, end of the year 146,393$ 217,306$

WAYNE COUNTY AIRPORT AUTHORITY
MANAGEMENT DISCUSSION AND ANALYSIS
September 30, 2018
9
Operating Revenues The chart below illustrates the sources of total operating revenue for the year ended September 30, 2018:
Operating revenues for the Authority increased $14.5 million in 2018 as compared to 2017. Airline revenues, a major category of operating revenues, includes terminal rentals, landing, facility use and related fees. Total Airline revenues increased 0.4 percent to $171.9 million in 2018 from $171.2 million in 2017. Landing fee revenues decreased 3.3 percent in 2018 to $77.6 million from $80.2 million in 2017. The decrease in landing fee revenue was primarily a result of a decrease in landing fee rates, which was adjusted in accordance with the airline agreement. The landing fee rate decreased by 4.7 percent from the prior year, with a final Signatory rate of $3.48 per 1,000 pounds landed weight. The decrease in the landing fee rate was offset by a 1.6 percent increase in total landed weights over the prior year. Another aspect of Airline revenues is terminal building rentals and fees, which are driven by the terminal rental rates. Terminal building rentals and fees increased $2.7 million (3.3 percent) over the prior year. The final Signatory rate was $60.32 for the South Terminal and $98.89 for the North Terminal. Non-Airline revenues, the other major category of operating revenues, includes revenue collected for activities that are not specifically aviation related. In fiscal year 2018, total non-Airline operating revenues increased by 7.0 percent to $210.8 million compared to $196.9 million in 2017. The growth was largely due to increases in parking fee revenue, ground transportation and concession fee revenue and hotel revenue. Parking fee revenue increased $3.5 million (4.6 percent) over 2017 due to growth in originating passenger enplanements while concession fees increased $3.0 million (7.6 percent). Ground transportation revenue increased $2.4 million over 2017 primarily due to revenue from transportation network companies (TNC’s), Uber and Lyft, which began operating at the Airport in March 2017. Hotel revenue increased by $1.4 million (4.8 percent) driven by an increase in room revenue caused by weather related delays in the winter months and the conclusion of construction activity.

WAYNE COUNTY AIRPORT AUTHORITY
MANAGEMENT DISCUSSION AND ANALYSIS
September 30, 2018
10
Operating Expenses The chart below illustrates the components of total operating expenses for the year ended September 30, 2018:
Operating expenses for the Authority decreased by 2.9 percent to $389.6 million in 2018 from $401.4 million in 2017. The primary categories that had significant decreases were salary, wages and benefits ($14.4 million) and depreciation ($10.0 million). These decreases were offset by increases in professional and contractual services ($6.8 million) and hotel management ($1.7 million).
Salaries, wages and fringe benefits decreased 13.0 percent from 2017 to $96.3 million. This decrease was the result of a one-time charge which was recognized in 2017. The charge was a result of the Authority recognizing its share of pre-2002 retiree liabilities, which were valued at $22 million, and documented via a memorandum of understanding entered into in 2017 between the Authority, Wayne County and Wayne County Employees’ Retirement System (WCERS). See Note 10 for additional information. Depreciation expense decreased 7.4 percent to $124.8 million. This is the result of a large number of assets, which were placed in service in 2002 at the opening of the McNamara Terminal, reaching the end of their 15-year useful lives in 2017. Professional and contractual services increased by $6.8 million (26.4 percent) in fiscal year 2018. The increase was largely due to increased snowfall during the 2017/2018 winter as compared to the 2016/2017 winter, which resulted in an increase in snow removal costs of approximately $3.6 million. In addition, professional fees related to bond issues increased by $1.3 million in 2018 as compared to 2017 due to the issuance of new airport revenue bonds and airport revenue refunding bonds. Hotel operating expenses increased by $1.7 million (9.6 percent) in fiscal year 2018. During fiscal year 2017, the hotel went through a renovation, resulting in a decrease in the amount of rooms available for occupancy and a corresponding decrease in operating expense. As renovation activities have concluded and the full complement of rooms have become available for occupancy operating expenses have increased accordingly.

WAYNE COUNTY AIRPORT AUTHORITY
MANAGEMENT DISCUSSION AND ANALYSIS
September 30, 2018
11
Nonoperating Revenues, Expenses and Contributed Capital Nonoperating revenue increased $5.7 million in 2018. The increase in nonoperating revenue was primarily due to an increase in interest income of $4.0 million and passenger facility charges (PFC) of $1.6 million. The Authority collects $4.50 of PFCs per enplaned passenger and enplanements increased 1.6 percent in 2018. Nonoperating expense increased $3.8 million in 2018. The primary reason for the increase in nonoperating expense was additional interest expense of $9.7 million offset by a decrease in the loss on disposal of assets of $5.9 million. Capital contributions decreased $6.9 million from 2017. The Authority anticipates significant increases in capital contributions in 2019 as it begins reconstruction of runway 3L/21R.

12
(continued)
WAYNE COUNTY AIRPORT AUTHORITY
Statement of Net Position
September 30, 2018
DetroitMetropolitan Willow RunAirport Fund Airport Fund Total
Assets:Current assets:
Cash and investments (note 4) $ 186,888,626 $ 650,089 $ 187,538,715 Accounts receivable, less allowance
(note 2) 29,985,700 272,083 30,257,783 Due from other governmental units 4,490,815 — 4,490,815 Due from other funds — 807,865 807,865 Prepaids and deposits 909,666 14,298 923,964
Total current assets 222,274,807 1,744,335 224,019,142
Restricted assets (notes 4 and 6):Cash and investments 390,340,813 — 390,340,813 Accounts receivable 1,368,002 — 1,368,002
Capital assets (note 7):Capital assets not being depreciated:
Land and nondepreciable assets 225,745,388 17,476,885 243,222,273 Construction in progress 111,762,853 1,377,845 113,140,698
Capital assets being depreciated:Buildings and improvements 2,151,425,294 13,934,137 2,165,359,431 Equipment 106,406,834 6,439,305 112,846,139 Infrastructure 1,398,631,979 145,858,177 1,544,490,156
Total capital assets 3,993,972,348 185,086,349 4,179,058,697
Less accumulated depreciation 2,121,152,931 109,983,986 2,231,136,917
Net capital assets 1,872,819,417 75,102,363 1,947,921,780
Other assets:Prepaids and deposits 450,000 — 450,000 Prepaid bond insurance premiums
(note 2) 1,554,170 — 1,554,170
Total noncurrent assets 2,266,532,402 75,102,363 2,341,634,765
Total assets $ 2,488,807,209 $ 76,846,698 $ 2,565,653,907
Deferred outflows of resources:Deferred amount on refunding (note 2) $ 21,813,007 $ — $ 21,813,007 Deferred outflows from pensions (note 10) 23,380,784 320,199 23,700,983 Deferred outflows from other postemployment
benefits (note 11) 590,978 10,832 601,810
Total deferred outflows of resources $ 45,784,769 $ 331,031 $ 46,115,800
See accompanying notes to basic financial statements.

13
WAYNE COUNTY AIRPORT AUTHORITY
Statement of Net Position
September 30, 2018
DetroitMetropolitan Willow RunAirport Fund Airport Fund Total
Liabilities:Current liabilities:
Accounts payable $ 41,285,402 $ 1,244,200 $ 42,529,602 Accrued wages and benefits 3,156,966 59,222 3,216,188 Due to other governmental units 1,856,670 — 1,856,670 Due to other funds 807,865 — 807,865 Advance billings and payments received
in advance 3,720,447 9,993 3,730,440 Bonds payable and other debt (note 8) — 39,476 39,476 Other accrued liabilities 24,399,960 379,819 24,779,779
Total current liabilities 75,227,310 1,732,710 76,960,020
Payable from restricted assets:Accrued interest and other payables 33,577,498 — 33,577,498 Bonds payable and other debt (note 8) 93,956,439 — 93,956,439
Other accrued liabilities (note 8) 862,869 940,200 1,803,069 Advance billings and payments received
in advance 26,987 — 26,987 Due to other governmental units (note 12) 4,715,000 — 4,715,000 Net pension liability (note 10) 58,227,049 865,368 59,092,417 Net other postemployment benefit liability (note 11) 55,720,423 1,021,352 56,741,775 Bonds payable and other debt, net
(note 8) 2,132,899,141 464,866 2,133,364,007
Total noncurrent liabilities 2,379,985,406 3,291,786 2,383,277,192
Total liabilities $ 2,455,212,716 $ 5,024,496 $ 2,460,237,212
Deferred inflows of resources:Deferred inflows from pension (note 10) $ 3,188,845 $ 58,452 $ 3,247,297 Deferred inflows from other postemployment
benefits (note 11) 1,858,062 34,058 1,892,120
Total deferred inflows of resources $ 5,046,907 $ 92,510 $ 5,139,417
Net position:Net investment in capital assets $ (193,320,150) $ 75,078,021 $ (118,242,129) Restricted for:
Capital assets 18,470,404 — 18,470,404 Debt service 235,729,366 — 235,729,366 Operations 40,666,901 — 40,666,901 Drug enforcement 1,340,714 — 1,340,714
Unrestricted (deficit) (28,554,880) (3,017,298) (31,572,178)
Total net position $ 74,332,355 $ 72,060,723 $ 146,393,078
See accompanying notes to basic financial statements.

14
WAYNE COUNTY AIRPORT AUTHORITY
Statement of Revenues, Expenses, and Changes in Net Position
Year ended September 30, 2018
DetroitMetropolitan Willow RunAirport Fund Airport Fund Total
Operating revenues:Airline revenues:
Airport landing and related fees $ 76,738,881 $ 811,745 $ 77,550,626 Terminal building rentals and related fees 84,732,195 197,159 84,929,354 Facility use fees 8,876,488 501,744 9,378,232
Nonairline revenues:Parking fees 80,248,186 — 80,248,186 Concession fees 42,786,536 — 42,786,536 Car rental 26,164,448 — 26,164,448 Hotel 31,368,028 — 31,368,028 Employee shuttle bus 2,891,239 — 2,891,239 Ground transportation 10,199,443 — 10,199,443 Utility service fees 4,969,809 126,588 5,096,397 Rental facilities 3,673,131 1,028,511 4,701,642 Other 6,429,744 902,317 7,332,061
Total operating revenues 379,078,128 3,568,064 382,646,192
Operating expenses:Salaries, wages, and fringe benefits 94,557,519 1,724,809 96,282,328 Parking management 8,404,763 — 8,404,763 Hotel management 19,775,235 — 19,775,235 Shuttle bus services 6,849,343 — 6,849,343 Janitorial services 14,405,534 22,384 14,427,918 Security 6,031,481 — 6,031,481 Professional and other contractual services 31,455,194 1,304,630 32,759,824 Utilities 23,253,212 623,249 23,876,461 Buildings and grounds maintenance 18,234,066 462,960 18,697,026 Equipment repair and maintenance 19,315,017 167,457 19,482,474 Materials and supplies 10,300,584 112,150 10,412,734 Insurance 1,901,742 32,838 1,934,580 Other 5,481,474 423,950 5,905,424 Depreciation 120,445,640 4,328,775 124,774,415
Total operating expenses 380,410,804 9,203,202 389,614,006
Operating gain (loss) (1,332,676) (5,635,138) (6,967,814)
Nonoperating revenues (expenses):Passenger facility charges 69,774,131 — 69,774,131 Customer facility charges 4,548,815 — 4,548,815 Federal and state sources 6,650,317 — 6,650,317 Interest income 7,612,101 5,572 7,617,673 Interest expense (82,468,769) — (82,468,769) (Loss) gain on disposal of assets (2,399,305) — (2,399,305) Amortization of bond insurance premiums (101,414) — (101,414)
Net nonoperating revenues 3,615,876 5,572 3,621,448
Net gain (loss) before capital contributionsand transfers 2,283,200 (5,629,566) (3,346,366)
Capital contributions 389,653 — 389,653 Transfers (out) in (2,467,217) 2,467,217 —
Changes in net position 205,636 (3,162,349) (2,956,713)
Net position – Beginning of year, restated (note 2) 74,126,719 75,223,072 149,349,791
Net position – End of year $ 74,332,355 $ 72,060,723 $ 146,393,078
See accompanying notes to basic financial statements.

15
WAYNE COUNTY AIRPORT AUTHORITY
Statement of Cash Flows
Year ended September 30, 2018
DetroitMetropolitan Willow RunAirport Fund Airport Fund Total
Cash flows from operating activities: Receipts from customers and users $ 382,791,056 $ 3,645,641 $ 386,436,697 Payments to suppliers (163,700,323) (3,085,232) (166,785,555) Payments to employees (102,700,066) (1,771,462) (104,471,528) Payments (to) from other funds for services provided (1,219,051) 1,219,051 — Advances (to) from other funds for services provided 54,015 (54,015) — Return of customer deposits (485,242) (4,224) (489,466) Collection of customer deposits 394,335 2,791 397,126
Net cash provided by (used in) operating activities 115,134,724 (47,450) 115,087,274
Cash flows from noncapital financing activities: Passenger facility charges received 478,411 — 478,411 Customer facility charges received 25,463 — 25,463 Transfers (to) from other funds (73,077) 73,077 — Insurance proceeds received from settlement — 92,000 92,000 Grants from federal/state government 5,358,200 8,615 5,366,815
Net cash provided by noncapital financing activities 5,788,997 173,692 5,962,689
Cash flows from capital and related financing activities: Capital contributions received 6,848,192 — 6,848,192 Passenger facility charges received 69,382,995 — 69,382,995 Customer facility charges received 4,517,759 — 4,517,759 Transfers (to) from other funds (367,223) 367,223 — Proceeds from capital debt 106,084,452 — 106,084,452 Principal paid on capital debt (92,632,782) (19,476) (92,652,258) Acquisition and construction of capital assets (99,035,262) (897,788) (99,933,050) Proceeds from disposal of capital assets 407,998 — 407,998 Interest paid on capital debt (91,189,903) — (91,189,903)
Net cash used in capital and related financing activities (95,983,774) (550,041) (96,533,815)
Cash flows from investing activities: Interest and dividends received 6,838,107 5,572 6,843,679 Purchases of investments (335,702,414) — (335,702,414) Maturities of investments 339,985,218 — 339,985,218
Net cash provided by investing activities 11,120,911 5,572 11,126,483
Net increase (decrease) in cash and cash equivalents 36,060,858 (418,227) 35,642,631
Cash and cash equivalents – Beginning of year 332,762,285 1,068,316 333,830,601
Cash and cash equivalents – End of year $ 368,823,143 $ 650,089 $ 369,473,232

16
WAYNE COUNTY AIRPORT AUTHORITY
Statement of Cash Flows
Year ended September 30, 2018
DetroitMetropolitan Willow RunAirport Fund Airport Fund Total
Reconciliation of operating loss to net cashprovided by (used in) operating activities:
Operating loss $ (1,332,676) $ (5,635,138) $ (6,967,814) Adjustments to reconcile operating loss to
net cash provided by (used in) operating activities:Depreciation expense 120,445,640 4,328,775 124,774,415 (Decrease) increase in accounts receivable (2,396,459) 74,741 (2,321,718) (Decrease) increase in due from/to other funds (1,165,036) 1,165,036 — Decrease (increase) in prepaids/deposits 19,269 (917) 18,352 Increase in accounts payable 2,985,579 87,803 3,073,382 (Increase) decrease in accrued wages and benefits (267,766) 3,990 (263,776) Increase in unearned revenue 2,028,739 2,836 2,031,575 Increase in due to other governmental units 3,741,452 — 3,741,452 Increase (decrease) in other accrued liabilities 2,130,164 (21,735) 2,108,429 Increase in net OPEB liability (4,082,735) (74,836) (4,157,571) (Increase) decrease in net pension liability (6,701,447) 21,994 (6,679,453)
Total adjustments 116,737,400 5,587,687 122,325,087
Net cash provided by (used in)operating activities $ 115,404,724 $ (47,451) $ 115,357,273
Cash and investments at September 30, 2018 consist of: Cash and cash equivalents $ 368,823,143 $ 650,089 $ 369,473,232 Investments 208,406,296 — 208,406,296
Total cash and investments $ 577,229,439 $ 650,089 $ 577,879,528
Noncash operating activities:- Loans due from Willow Run Airport Fund to Detroit Metropolitan Airport Fund of $1,182,347 were forgiven during fiscal year 2018. Noncash capital and related financing activities:- The issuance of refunding bonds resulted in several noncash activities. The major components are as follows: $593.1 million
of principal and $39.5 million of bond premium additions offset by $632.3 million of principal reductions. In addition, deferred refunding charges totaling $9.5 million were recorded, along with write-offs of $9.4 million of deferred refunding charges, $1.3million of prepaid bond insurance, and $2.4 million of bond premiums.
- Interest expense of appoximately $6.6 million was capitalized into Detroit Metropolitan Aiport capital assets during 2018.Noncash investing activities:-
See accompanying notes to basic financial statements.
Detroit Metropolitan Airport Fund had a noncash change in the fair value of investments of approximately $121,000 in 2018.

WAYNE COUNTY AIRPORT AUTHORITY
Notes to Basic Financial Statements
September 30, 2018
17
(1) The Reporting Entity The Wayne County Airport Authority (the Authority) is an independent public benefit agency and considered an agency of the Charter County of Wayne, Michigan (the County) for the purposes of federal and state laws, but is not subject to any County charter requirements or the direction or control of either the Wayne County Executive or Commission. Pursuant to Public Act 90 (the Authority Act), Michigan Public Acts of 2002 (effective March 26, 2002), the Authority has operational jurisdiction of the Detroit Metropolitan Wayne County Airport (Metro Airport), the Willow Run Airport, and the Airport Hotel, with the exclusive right, responsibility, and authority to occupy, operate, control, and use them. The financial statements of the Authority include the operations of Metro Airport (which includes the Airport Hotel) and Willow Run Airport. The Authority is not deemed a component unit of the County. The Authority is directed and governed by a board consisting of seven members. The governor of the State appoints two members of the board, one member is appointed by the legislative body of the County that owns Metro Airport, and four members of the board are appointed by the chief executive officer of the County. Metro Airport has airport use contracts with 11 airlines. These airlines, along with their affiliates, constitute approximately 97 percent of total landed weight in 2018. Metro Airport has agreements with various concessionaires (parking, food service, rental car agencies, etc.) for which Metro Airport pays a management fee or receives revenue.
(2) Summary of Significant Accounting Policies (a) Basis of Presentation
The Authority reports the following major funds: Detroit Metropolitan Airport Fund – This fund is used to account for the operations and maintenance of the Detroit Metropolitan Wayne County Airport, which includes the Airport Hotel. Willow Run Airport Fund – This fund is used to account for the operations and maintenance of the Willow Run Airport.
(b) Basis of Accounting and Measurement Focus The financial statements of the Authority are presented on the accrual basis of accounting and are accounted for on the flow-of-economic-resources measurement focus as applicable to governmental units; revenues are recorded when earned, and expenses are recorded as incurred. (c) Cash and Investments Cash resources of the individual funds of the Authority, except as specifically stated by ordinance, are pooled and invested. Interest on pooled investments is allocated monthly among the respective funds based on average investment balances. Interest earned but not received at year end is accrued. Investments are stated at fair value.

WAYNE COUNTY AIRPORT AUTHORITY
Notes to Basic Financial Statements
September 30, 2018
18
(d) Cash Flows For the purpose of the statement of cash flows, the Authority considers all highly liquid investments, including restricted assets, with a maturity of three months or less when purchased to be cash equivalents. All pooled investments qualify as cash equivalents. (e) Passenger Facility Charges The Authority assesses passenger facility charges of $4.50 per passenger enplanement. The passenger facility charges are recorded as nonoperating revenues and may only be expended on capital and noncapital projects approved by the federal government. Passenger facility charges from airlines are recorded on an accrual basis. Unspent PFC cash and accounts receivable are classified as restricted net position for eligible debt service. (f) Customer Facility Charges The Authority collects customer facility charges (CFC) from all rental car concessionaires that operate at Detroit Metropolitan Airport. During the fiscal year ending September 30, 2018, $1.00 was charged to each airport rental car concessionaire customer on a per transaction day basis. This charge was increased to $5.50 effective November 1, 2018. CFC revenues are classified as nonoperating on the statement of revenues, expenses, and changes in net position. Such amounts are restricted for capital improvements related to the rental car operations at Detroit Metropolitan Airport. (g) Revenue Recognition Operating revenues are recorded as revenues at the time services are rendered. Nonexchange transactions, in which the Authority receives value without directly giving equal value in return, include grants and capital contributions. Federal and state grants and capital contributions are recognized as revenues when the eligibility requirements, if any, are met. (h) Net Position Equity is displayed in three components, as follows: Net Investment in Capital Assets – This consists of capital assets, net of accumulated depreciation, less the outstanding balances of any bonds, notes, or other borrowings that are attributable to the acquisition, construction, or improvement of those assets. Restricted – This consists of net position that is legally restricted by outside parties or by law through constitutional provisions or enabling legislation. When both restricted and unrestricted resources are available for use, generally it is the Authority’s policy to use restricted resources first and then unrestricted resources when they are needed. Unrestricted – This consists of net position that does not meet the definition of “restricted” or “net investment in capital assets.”

WAYNE COUNTY AIRPORT AUTHORITY
Notes to Basic Financial Statements
September 30, 2018
19
(i) Classification of Revenues and Expenses
The Authority has classified its revenues and expenses as either operating or nonoperating according to the following criteria:
Operating – Operating revenues and expenses include activities that have the characteristics of exchange transactions, such as revenues from landing and related fees and concession fees, and expenses paid to employees and vendors.
Nonoperating – Nonoperating revenues and expenses include activities that have the characteristics of nonexchange transactions that are defined as nonoperating by GASB No. 9, Reporting Cash Flows of Proprietary and Nonexpendable Trust Funds and Governmental Entities That Use Proprietary Fund Accounting, such as revenue from federal and state grants and contributions and investment income, and expenses for capital debt. (j) Use of Estimates
The preparation of financial statements in conformity with U.S. generally accepted accounting principles requires management to make estimates and assumptions that affect the reported amounts of assets and liabilities and disclosure of contingent assets and liabilities at the date of the financial statements and the reported amounts of revenues and expenses during the reporting period. Actual results could differ from those estimates. (k) Capital Assets
Capital assets are stated at the estimated historical cost. Depreciation is computed using the straight-line method over the estimated useful lives of the assets as follows:
Purchases with a cost of $5,000 or more for capital assets and for major renewals and betterments that extend the estimated useful life of the assets are capitalized; routine maintenance and repairs are charged to expense as incurred. All costs relating to the construction of property and equipment owned by the Authority are capitalized, including interest costs during construction. At the time capital assets are sold, retired, or disposed of, the costs of such assets and related accumulated depreciation are removed from the accounts, and any gain or loss is reflected in the results of operations.
(l) Compensated Absences
The Authority’s employees earn vacation and sick leave benefits based, in part, on length of service. Vacation pay is fully vested when earned, and sick pay vests upon completion of two years of service. Upon separation from service, employees are paid accumulated vacation and sick pay based upon the nature of separation (death, retirement, or termination). Certain limitations have been placed on the hours of vacation and sick leave that employees may accumulate and carry over for payment at
Buildings and improvements 10 - 50 yearsEquipment 3 - 12 yearsInfrastructure 10 - 40 years

WAYNE COUNTY AIRPORT AUTHORITY
Notes to Basic Financial Statements
September 30, 2018
20
termination, retirement, or death. Unused hours exceeding these limitations are forfeited. A liability for accumulated unpaid vacation and sick pay has been recorded in the financial statements as a current “other accrued liability” and will be paid with resources from both the Detroit Metropolitan Airport Fund and the Willow Run Airport Fund. Activity for the year ended September 30, 2018 was as follows:
(m) Retirement Contributions and Other Postemployment Benefit Costs
The Authority offers defined benefit and defined contribution retirement benefits though the Wayne County Employees’ Retirement System (WCERS), an agent multiemployer retirement system. Related to the defined benefit plans, the Authority records a net pension liability for the difference between the total pension liability calculated by the actuary and the pension plan’s fiduciary net position. For purposes of measuring the net pension liability, deferred outflows of resources and deferred inflows of resources related to pensions and pension expense, information about the fiduciary net position of the pension plan and additions to/deductions from the pension plan’s fiduciary net position have been determined on the same basis as they are reported by WCERS. For this purpose, benefit payments (including refunds of employee contributions) are recognized when due and payable in accordance with the benefit terms. Investments are reported at fair value. Related to the defined contribution plans, employer and employee contributions are recognized in the period in which the contributions are due. In addition, the Authority has entered into an arrangement with WCERS and Wayne County which the Authority has concluded represents a special funding situation under GASB 68. Under the arrangement, which was entered into in 2016, the Authority has committed to a five-year payment schedule of $1.1 million per quarter for its estimated share (10.25 percent) of the Combined Pre-2002 Retiree Liability of $20,948,822.
The Authority offers retiree healthcare benefits to retirees. For purposes of measuring the net retiree healthcare benefit liability, deferred outflows of resources and deferred inflows of resources, and retiree healthcare benefit plan expense, information about the fiduciary net position of the retiree healthcare benefit plan and additions to/deductions from the retiree healthcare benefit plans fiduciary net position have been determined on the same basis as they are reported by Authority. For this purpose, benefit payments are recognized when due and payable in accordance with the benefit terms. Investments are reported at fair value. In addition, the Authority has agreed to contribute 11.25 percent for its estimated share of stipend payments made to participants in the Wayne County Health and Welfare Plan that retired before September 1, 2002. Members of the Wayne County Health and Welfare Plan are required to file annual certifications related to the use of this stipend for healthcare benefits.
Beginning Endingbalance Increases Decreases balance
$ 5,791,963 $ 5,914,937 $ (6,599,269) $ 5,107,631

WAYNE COUNTY AIRPORT AUTHORITY
Notes to Basic Financial Statements
September 30, 2018
21
(n) Accounts Receivable
Net receivables at September 30, 2018 consist of trade receivables incurred by customers during the normal course of business. Total allowance for uncollectible accounts at September 30, 2018 was $241,000, of which $205,000 was for the Detroit Metropolitan Airport Fund and $36,000 was for the Willow Run Airport Fund.
(o) Accounts Payable
Total payables at September 30, 2018 consist of payables due to vendors used during the normal course of business. (p) Restricted Assets and Liabilities
Restricted assets consist of cash, investments, and accounts receivable that are legally required to be trusteed or maintained in separate depository accounts. Capital program funds are restricted to pay the costs of certain capital projects as defined in various bond agreements. Debt service funds are restricted to make payments for principal and interest as required by the specific bond agreements. Liabilities payable from restricted assets are the accrued interest and current portion of long-term debt associated with the purchase and construction of the capital projects funded by the restricted assets. (q) Interfund Balances, Advances, and Transfers
The interfund balances resulted from (1) the time lag between the dates interfund goods and services are provided or reimbursable expenses occur, (2) the time lag between the dates payment between funds is made, and (3) overdrafts by individual funds of its share of pooled cash. Noncurrent balances arising in connection with interfund loans are reported as advances. Due from other funds is an asset account used to record current portions of loans from one fund to another fund within the same reporting entity. Similarly, due to other funds is a liability account used to record current portions of debt owed by one fund to another fund within the same reporting entity.
Interfund transfers are used to transfer unrestricted resources from one reporting fund to another to fund operations and capital projects.
(r) Prepaid Bond Insurance Premiums
Prepaid bond insurance premium costs are amortized over the period the bond is outstanding using the straight-line method. Accumulated amortization at September 30, 2018 is $781,520. (s) Deferred Outflows/Inflows of Resources
In addition to assets, the statement of net position will sometimes report a separate section for deferred outflows of resources. This separate financial statement element represents a consumption of net position that applies to future periods and so will not be recognized as an outflow of resources (expense) until then. The Authority has three items that qualify for reporting in this category. One is the deferred charge on refunding reported on the statement of net position. A deferred charge on refunding results from the difference in the carrying value of refunded debt and its reacquisition price.

WAYNE COUNTY AIRPORT AUTHORITY
Notes to Basic Financial Statements
September 30, 2018
22
The amount is deferred and amortized over the shorter of the life of the refunded or refunding debt. The second and third are the deferred outflows for pension and OPEB. See the detailed categories of the deferred outflows for pension in Note 10 and OPEB in Note 11. In addition to liabilities, the statement of net position will sometimes report a separate section for deferred inflows of resources. This separate financial statement element represents an acquisition of net position that applies to future periods and so will not be recognized as an inflow of resources (revenue) until that time. The Authority has two items that qualify for reporting in this category, deferred inflows for pensions and deferred inflows for OPEB. See the detailed categories of the deferred inflows for pension in Note 10 and OPEB in Note 11. (t) Environmental Matters
Environmental accruals are calculated and recorded using an expected cash flow technique applied to probabilities, ranges, and assumptions developed in response to a potential remediation liability as based on current law and existing technologies. These accruals are evaluated periodically for changes due to additional assessment and remediation efforts, as well as more detailed legal or technical information. Environmental liabilities are included in the statement of net position as current and long-term “other accrued liabilities.”
In certain instances, environmental remediation costs cannot be reasonably estimated; however, the nature of the matters is disclosed in the notes to the basic financial statements as commitments and contingencies. As components of the remediation efforts are able to be projected, they are calculated using an expected cash flow technique and recorded accordingly.
(u) Self-Insurance
During the year ended September 30, 2004, the Authority became self-insured for disability, unemployment, and liability insurance. The Authority charges its departments a specified percentage of the department’s regular biweekly payroll for these liabilities. Claims related to unemployment, disability, claim administration, deductibles, self-insured retentions, and legal bills are paid out of these funds. The Authority purchases commercial insurance for general liability claims in excess of $10,000, auto liability insurance for claims in excess of $25,000, public officials/employment practices liability insurance for claims in excess of $500,000, and Law Enforcement liability insurance for claims in excess of $50,000. There were no claims in the current year that exceeded the deductible amounts.
During the year ended September 30, 2005, the Authority became self-insured for health insurance and workers’ compensation. The Authority charges its departments a specified percentage of the department’s regular biweekly payroll for these liabilities. The funds collected for workers’ compensation are used to pay claims (wages and medical), third-party administration services, and loss control services. The Authority purchases workers’ compensation insurance for claims that exceed $1 million. There have been two claims that have exceeded the $1 million deductible wherein the insurer has been responsible for settlement of all future wages, medical, and legal costs. The funds collected for health insurance are used to pay self-insured claims to Blue Cross Blue Shield, the primary healthcare provider, and premiums for Health Alliance Plan, dental, and life insurance. The Authority purchases stop/loss coverage from Blue Cross Blue Shield for healthcare claims that exceed $1 million. No claims have been incurred that have exceeded this threshold.

WAYNE COUNTY AIRPORT AUTHORITY
Notes to Basic Financial Statements
September 30, 2018
23
The liability for self-insurance claims has been recorded in the financial statements as a current “other accrued liability”. The Detroit Metropolitan Airport Fund resources are used to liquidate this liability. A reconciliation of the Authority’s self-insured claims liability at September 30, 2018 follows:
(v) New Accounting Pronouncement During the current year, the Authority adopted GASB Statement No. 75, Accounting and Financial Reporting for Postemployment Benefits Other Than Pensions. The objective of the statement is to improve accounting and financial reporting by state and local governments for postemployment benefits other than pensions (other postemployment benefits or OPEB). The statement replaces the requirements of GASB Statements No. 45, Accounting and Financial Reporting by Employers for Postemployment Benefits Other Than Pensions, and No. 57, OPEB Measurements by Agent Employers and Agent Multiple-Employer Plans. The statement establishes standards for recognizing and measuring liabilities, deferred outflows of resources, deferred inflows of resources, and expenses. For defined benefit OPEB, the statement identifies the methods and assumptions that are required to be used to project benefit payments, discount projected benefit payments to their actual present value, and attribute that present value to periods of employee service. As a result of this implementation, the Authority has restated its beginning net position as follows:
Health Insurance
Workers' Compensation Other Claims Total
Claims liability, September 30, 2016 3,774,718$ 755,446$ 427,120$ 4,957,284$
Claims incurred during fiscal year 2017 12,538,802 459,483 205,375 13,203,660 Payments on claims (11,922,836) (409,625) (317,223) (12,649,684) Increase (decrease) in the reserve (647,725) 54,099 (76,365) (669,991)
Claims liability, September 30, 2017 3,742,959$ 859,403$ 238,907$ 4,841,269$
Claims incurred during fiscal year 2018 10,670,432 555,714 521,929 11,748,075 Payments on claims (11,053,117) (503,768) (289,480) (11,846,365) Increase (decrease) in the reserve (1,449,700) 59,142 11,509 (1,379,049)
Claims liability, September 30, 2018 1,910,574$ 970,491$ 482,865$ 3,363,930$
DetroitMetropolitan Willow RunAirport Fund Airport Fund
Beginning net position - October 1, 2017 $ 140,963,609 $ 76,342,484 Implementation of GASB 75 (66,836,890) (1,119,412) Beginning net position - as restated 74,126,719 75,223,072

WAYNE COUNTY AIRPORT AUTHORITY
Notes to Basic Financial Statements
September 30, 2018
24
(3) Major Customer Delta Air Lines (Delta) and its affiliates account for approximately 32 percent of total Authority operating revenues for the year ended September 30, 2018, including 71 percent of landing and related fees, 69 percent of airline rental and related fees, and 78 percent of facility use fees. Approximately 72 percent of total 2018 enplanements are attributable to Delta’s (and affiliates) operations. In the event that Delta discontinues its operations, there are no assurances that another airline would replace its hub activities. Existing operating agreements with all Signatory Airlines servicing the Authority require that all remaining airlines would continue to pay the net operating costs and debt service requirements of the Authority. The Authority had approximately $5.9 million in receivables from Delta at September 30, 2018. It is reasonable to assume that any financial or operational difficulties incurred by Delta, the predominant airline servicing the Airport, or another Signatory Airline may, whether directly or indirectly, have a material adverse impact on Airport operations.
(4) Deposits and Investments
Michigan Compiled Laws Section 129.9 1 (Public Act 20 of 1943, as amended), authorizes the Authority to make deposits and invest in the accounts of federally insured banks, credit unions, and savings and loan associations that have offices in Michigan. The Authority is allowed to invest in bonds, securities, and other direct obligations of the United States or any agency or instrumentality of the United States; repurchase agreements; bankers' acceptances of United States banks; commercial paper rated within the two highest classifications that matures not more than 270 days after the date of purchase; obligations of the State of Michigan or its political subdivisions, which are rated as investment grade; and mutual funds composed of investment vehicles that are legal for direct investment by local units of government in Michigan. The investment policy adopted by the Authority in accordance with Public Act 20 of 1943, as amended, authorizes investments in U.S. Treasuries, U.S. agencies and instrumentalities (date- specific maturities only), non-negotiable certificates of deposits, commercial paper (rated A2/P2 or above), bankers' acceptances, repurchase agreements, overnight deposits, or mutual funds. For overnight deposits, the treasurer may invest overnight or short-term liquid assets to cover cash flow requirements in the following types of pools: investment pools organized under the Surplus Funds Investment Pool Act of 1982, PA 367, 1 MCL 129.111 to MCL 129.118, or investment pools organized under the Urban Cooperation Act of 1967, PA 7, MCL 124.501 to 124.512. For mutual funds, the treasurer may invest in no-load fixed-income mutual funds composed of investment vehicles that are legal for direct investment by local units of government in Michigan, either taxable or tax-exempt. This authorization is limited to mutual funds whose intent is to maintain a net asset value of $1.00 per share. The Authority’s cash and investments are subject to several types of risk, which are examined in more detail below.

WAYNE COUNTY AIRPORT AUTHORITY
Notes to Basic Financial Statements
September 30, 2018
25
Credit risk - In compliance with state law, the Authority’s investment policy limits investments of commercial paper to the two top ratings issued by nationally recognized statistical rating organizations. As of year-end, the credit quality ratings of investments (other than the U.S. government and municipal bonds) are as follows:
Custodial credit risk of bank deposits - Custodial credit risk is the risk that in the event of a bank failure, the government's deposits may not be returned to it. The Authority’s investment policy requires that deposits over the $250,000 insured limit in a commercial bank shall not equal more than 25 percent of the combined capital and surplus of that bank, and that bank must meet the minimum standards of at least one standard rating service. At year-end, the Authority had $107,583,984 of bank deposits (certificates of deposit, checking, and savings accounts) that were uninsured and uncollateralized. The Authority believes that due to the dollar amounts of cash deposits and the limits of FDIC insurance, it is impractical to insure all deposits. As a result, the Authority evaluates each financial institution with which it deposits funds and assesses the level of risk of each institution. Only those institutions with an acceptable estimated risk level are used as depositories. Custodial credit risk of investments - Custodial credit risk is the risk that in the event of the failure of the counterparty, the Authority will not be able to recover the value of its investments or collateral securities that are in the possession of an outside party. The Authority’s investment policy requires that all investments not purchased directly from an issuer must be held in the name of the Authority, be purchased using the delivery vs. payment procedure, and be held in third party safekeeping. At year-end, none of the Authority’s investments was subject to custodial credit risk due to one of the following: Investments were held by a third-party safe-keeper in the Authority’s name. Investments were held by the Authority’s trustee in the Authority’s name. Investments were part of a mutual fund.
Interest rate risk – Interest rate risk is the risk that the value of investments will decrease as a result of a rise in interest rates. The Authority’s investment policy addresses this risk by setting limits by investment fund type as follows:
Investment fund Maturity maximum
General Pool 1 yearBond Reserve 5 yearsBond Payment and Capital Interest Funds 1 business day prior to bond payment dateConstruction Funds Must match draw schedule or less
Note: All Commercial Paper is limited by state statute to 270 days maximum
Fair value Rating OrganizationMoney market funds $ 4,807,110 AAA S&PCommercial paper 50,413,948 A1+, P1 S&P, MoodyCommercial paper 115,908,053 A1, P1 S&P, MoodyCommercial paper 36,861,586 P1 Moody
Investment

WAYNE COUNTY AIRPORT AUTHORITY
Notes to Basic Financial Statements
September 30, 2018
26
At year end, the average maturities of investments subject to interest rate risk are as follows:
Fair Averagevalue maturity
Investments subject to risk:General pool funds:
U.S. Agencies $ 9,859,798 9.9 monthsCommercial paper 4,942,669 5.4 months
Bond reserves:U.S. Treasuries 9,798,050 1.6 yearsU.S. Agencies 102,272,584 1.9 yearsMunicipal Bonds 1,468,620 1.6 yearsLong-term repo 3,629,278 3.2 yearsCommercial paper 18,292,421 2.1 months
Bond payment funds:U.S. Treasuries 106,200,544 2 months
Construction funds:2007 Construction:
Commercial paper 7,790,478 20 days2012A Construction:
Commercial paper 8,497,290 6 days2012B Construction:
Commercial paper 8,291,884 17 days2014A Construction:
Commercial paper 1,399,432 7 days2014B Construction:
Commercial paper 15,078,754 23 days2014C Construction:
Commercial paper 15,776,778 24 days2015E Construction:
Commercial paper 1,799,540 5 days2017A Construction:
Commercial paper 45,433,941 24 days2017B Construction:
Commercial paper 34,541,336 28 daysOther construction and operating funds:
Commercial paper 41,339,064 2.4 monthsInvestments subject to risk 436,412,461
Deposits/investments not subject to risk:Deposits 136,659,957 Money market funds 4,807,110
Total deposits and investments $ 577,879,528

WAYNE COUNTY AIRPORT AUTHORITY
Notes to Basic Financial Statements
September 30, 2018
27
Concentration of credit risk – Through its investment policy, the Authority places limits on the amount the Authority may invest in any one issuer, along with the minimal capital strength of those issuers. There are also limits as to the use of specific types of instruments, along with limits upon use of a single institution. These limits are as follows: Limits using capital strength test: Maximum investment is 25 percent of combined capital and surplus position of that financial institution. Limits based upon use of specific instruments:
Authority limits based upon use of a single issuer:
Investment type LimitBankers' acceptances 25% of total portfolioRepurchase agreements 10% of total portfolioCertificates of Deposit (bank) 33% of total portfolioCertificates of Deposit (S&L) 5% of total portfolio
Actual year-end investments in a single issuer exceeding 5 percent of total portfolio are as follows:
(5) Fair Market Measurement The Authority categorizes its fair value measurements within the fair value hierarchy established by generally accepted accounting principles. The hierarchy is based on the valuation inputs used to measure the fair value of the asset. Level 1 inputs are quoted prices in active markets for identical assets; Level 2 inputs are significant other observable inputs; Level 3 inputs are significant unobservable inputs. Investments that are measured at fair value using the net asset value per share (or its equivalent) as a practical expedient are not classified in the fair value hierarchy below.
Actual atInvestment type Limit year-end
Bankers' acceptances 50% - %Repurchase agreements 25 0.6Certificates of deposit (bank) 50 5.7Money market funds 50 0.8Commercial paper 60 35.2U.S. Government 100 39.5
Percentage ofIssuer Investment type Fair value portfolio Rating
Toyota Motor Credit Commercial paper 38,723,162$ 6.70% A1+, P1General Electric Capital Corp Commercial paper 36,861,586 6.38 P1Santander UK PLC Commercial paper 35,267,994 6.10 A1, P1MUFG Bank LTD Commercial paper 30,391,708 5.26 A1, P1

WAYNE COUNTY AIRPORT AUTHORITY
Notes to Basic Financial Statements
September 30, 2018
28
In instances where inputs used to measure fair value fall into different levels in the above fair value hierarchy, fair value measurements in their entirety are categorized based on the lowest level input that is significant to the valuation. The Authority’s assessment of the significance of particular inputs to these fair value measurements requires judgment and considers factors specific to each asset or liability. The Authority has the following recurring fair value measurements as of September 30, 2018: U.S. Treasury securities of $115,998,594 - are valued using quoted market prices (Level 1
inputs).
Commercial paper of $203,183,587 - are valued using a matrix pricing model and par value (Level 2 inputs).
U.S. Government Agency securities of $112,132,382 - are valued using quoted market prices and various market and industry inputs (Level 2 inputs).
Municipal securities of $1,468,620 – are valued using observable inputs, either directly or indirectly (Level 2 inputs).
Repurchase agreements of $3,629,278 - are valued using par value (Level 2 inputs). Investments in Entities that Calculate Net Asset Value per Share – The Authority holds shares or interests in money market mutual funds at year end whereby the fair value of the investment held is estimated based on the net asset value per share (or its equivalent) of the money market mutual fund. Certain investments measured at net asset value per share (or equivalent) are classified within Level 1 of the fair value hierarchy as the investment can be redeemed at the measurement date. At year end, the fair value of these investments was $4,807,110. There were no unfunded commitments or redemption rules associated with these investments.
(6) Restricted Assets
In accordance with the terms of applicable ordinances and federal and state laws, the Authority is required to restrict assets for various purposes. Net position has been restricted related to certain of the restricted assets. A summary of the restricted assets at September 30, 2018 is as follows:
Construction:Cash and investments 146,560,451 Accounts receivable 271,145
Total 146,831,596
Bond and interest redemption:Cash and investments 243,780,362 Accounts receivable 1,096,857
Total 244,877,219
Total restricted assets 391,708,815$
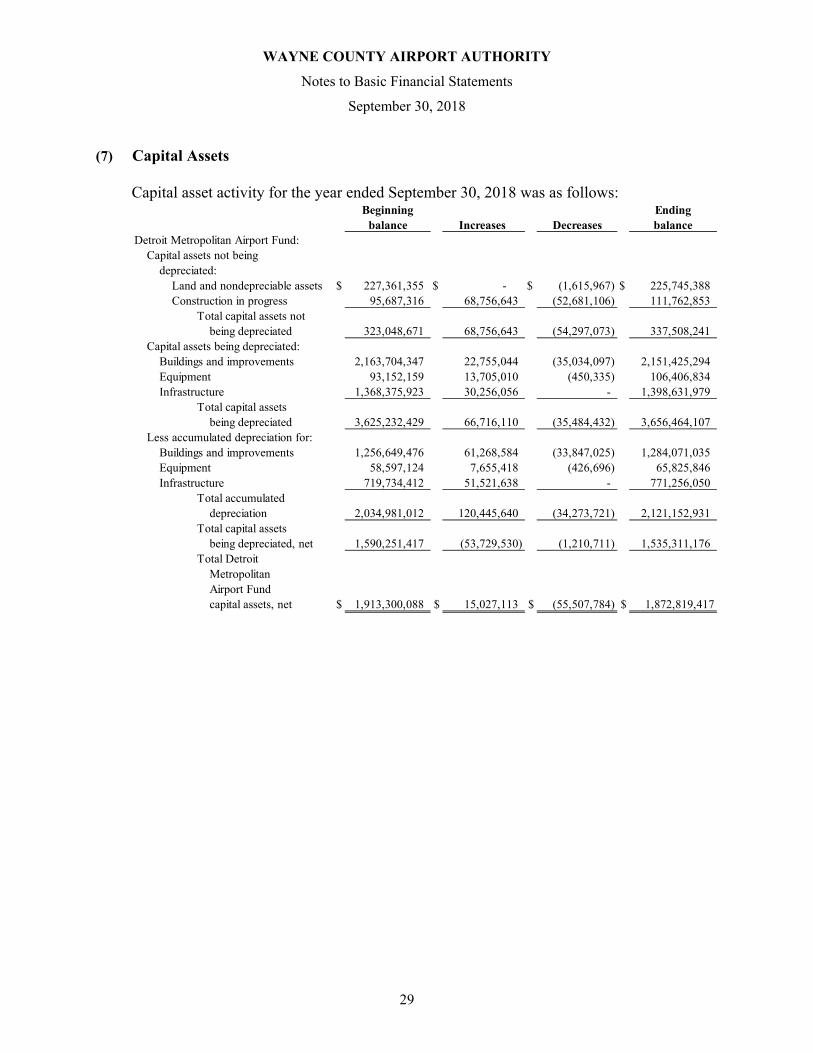
WAYNE COUNTY AIRPORT AUTHORITY
Notes to Basic Financial Statements
September 30, 2018
29
(7) Capital Assets Capital asset activity for the year ended September 30, 2018 was as follows:
Beginning Endingbalance Increases Decreases balance
Detroit Metropolitan Airport Fund:Capital assets not being
depreciated:Land and nondepreciable assets $ 227,361,355 $ - $ (1,615,967) $ 225,745,388 Construction in progress 95,687,316 68,756,643 (52,681,106) 111,762,853
Total capital assets notbeing depreciated 323,048,671 68,756,643 (54,297,073) 337,508,241
Capital assets being depreciated:Buildings and improvements 2,163,704,347 22,755,044 (35,034,097) 2,151,425,294 Equipment 93,152,159 13,705,010 (450,335) 106,406,834 Infrastructure 1,368,375,923 30,256,056 - 1,398,631,979
Total capital assetsbeing depreciated 3,625,232,429 66,716,110 (35,484,432) 3,656,464,107
Less accumulated depreciation for:Buildings and improvements 1,256,649,476 61,268,584 (33,847,025) 1,284,071,035 Equipment 58,597,124 7,655,418 (426,696) 65,825,846 Infrastructure 719,734,412 51,521,638 - 771,256,050
Total accumulateddepreciation 2,034,981,012 120,445,640 (34,273,721) 2,121,152,931
Total capital assetsbeing depreciated, net 1,590,251,417 (53,729,530) (1,210,711) 1,535,311,176
Total DetroitMetropolitanAirport Fundcapital assets, net $ 1,913,300,088 $ 15,027,113 $ (55,507,784) $ 1,872,819,417

WAYNE COUNTY AIRPORT AUTHORITY
Notes to Basic Financial Statements
September 30, 2018
30
Beginning Endingbalance Increases Decreases balance
Willow Run Airport Fund:Capital assets not being
depreciated:Land and nondepreciable assets $ 17,476,885 $ - $ - $ 17,476,885Construction in progress 832,382 561,303 (15,840) 1,377,845
Total capital assets notbeing depreciated 18,309,267 561,303 (15,840) 18,854,730
Capital assets being depreciated:Buildings and improvements 13,934,137 - - 13,934,137Equipment 5,622,798 816,507 - 6,439,305Infrastructure 145,842,337 15,840 - 145,858,177
Total capital assetsbeing depreciated 165,399,272 832,347 - 166,231,619
Less accumulated depreciation for:Buildings and improvements 5,816,105 543,383 - 6,359,488Equipment 4,881,487 238,313 - 5,119,800Infrastructure 94,957,620 3,547,078 - 98,504,698
Total accumulateddepreciation 105,655,212 4,328,774 - 109,983,986
Total capital assets being depreciated, net 59,744,060 (3,496,427) - 56,247,633
Total Willow Run Airport Fund capital assets, net 78,053,327 (2,935,124) (15,840) 75,102,363
Total Authority capitalassets, net $ 1,991,353,415 $ 12,091,989 $ (55,523,624) $ 1,947,921,780

WAYNE COUNTY AIRPORT AUTHORITY
Notes to Basic Financial Statements
September 30, 2018
31
(8) Long-term Debt The detail of long-term debt at September 30, 2018 is as follows:
Detroit Metropolitan Airport Fund:Airport Revenue Bonds:
Series 2008A, 4.00% to 5.75%, due 12/1/2032 $ 93,190,000 Series 2010A, 2.00% to 5.00%, due 12/1/2018 32,170,000 Series 2010C, 1.50% to 5.50%, due 12/1/2022 61,910,000 Series 2010D, 1.50% to 5.50%, due 12/1/2021 12,075,000 Series 2011A, 4.00% to 5.00%, due 12/1/2022 152,465,000 Series 2011B, 3.00% to 5.00%, due 12/1/2020 7,900,000 Series 2012A, 3.00% to 5.00%, due 12/1/2042 173,985,000 Series 2012B, 5.00%, due 12/1/2037 24,290,000 Series 2012C, 3.00% to 4.00%, due 12/1/2020 760,000 Series 2012D, 3.00% to 5.00%, due 12/1/2028 40,790,000 Series 2014A, Variable, Current Yield at 9/30/18, 2.029625%, due 12/1/2034 29,800,000 Series 2014B, 3.00% to 5.00%, due 12/1/2044 66,495,000 Series 2014C, 3.00% to 5.00%, due 12/1/2044 31,745,000 Series 2015A, 1.67%, due 12/1/2020 52,010,000 Series 2015B, 2.716%, due 12/1/2024 75,000,000 Series 2015C, 3.75%, due 12/1/2034 25,640,000 Series 2015D, 3.00% to 5.00%, due 12/1/2045 213,330,000 Series 2015E, 5.00%, due 12/1/2038 7,755,000 Series 2015F, 5.00%, due 12/1/2034 224,155,000 Series 2015G, 2.00% to 5.00%, due 12/1/2036 72,715,000 Series 2015H, Variable, Crnt. Yield at 9/30/18, 2.291%, due 12/1/2039 23,125,000 Series 2017A, 4.00% to 5.00%, due 12/1/2047 50,670,000 Series 2017B, 4.00% to 5.00%, due 12/1/2047 40,770,000 Series 2017C, 5.00%, due 12/1/2028 78,360,000 Series 2017A, Jr. Lien, 4.00% to 5.00%, due 12/1/2037 63,055,000 Series 2017B, Jr. Lien, 5.00%, due 12/1/2032 46,040,000 Series 2017C, Jr. Lien, 5.00%, due 12/1/2037 24,615,000 Series 2017D, Variable, Crnt.Yield at 9/30/18, 2.169625%, due 12/1/2033 198,955,000 Series 2017E, 4.00%, due 12/1/2028 67,765,000 Series 2017F, 2.6835%, due 12/1/2028 114,345,000
Installment purchase contract, 4.33%, due 5/21/2023 1,814,983
Total Detroit Metropolitan Airport Fund 2,107,694,983
Willow Run Airport Fund:Notes payable – Washtenaw County, 0%, due 12/31/2019 24,342 Notes payable – Downriver Community Conference, 0%, due 5/1/2027 480,000
Total Willow Run Airport Fund 504,342
Total Authority bonds payable and other debt 2,108,199,325

WAYNE COUNTY AIRPORT AUTHORITY
Notes to Basic Financial Statements
September 30, 2018
32
The annual requirements to pay principal and interest on the Authority’s debt outstanding at September 30, 2018 are summarized as follows:
Add (less):Certain bond discounts (460,034) Certain bond premiums 119,620,631
Total Authority bonds payable and other debt, net 2,227,359,922
Less current portion 93,995,915
Total Authority bonds payable and other debt, noncurrent $ 2,133,364,007
2019 $ 93,620,000 $ 336,439 $ 39,476 $ 93,995,915 2020 100,895,000 363,757 64,866 101,323,623 2021 99,820,000 392,636 60,000 100,272,636 2022 100,795,000 423,497 60,000 101,278,497 2023 96,740,000 298,653 280,000 97,318,653
2024 to 2028 535,665,000 — 535,665,000 2029 to 2033 462,635,000 — — 462,635,000 2034 to 2038 313,375,000 — — 313,375,000 2039 to 2043 201,280,000 — — 201,280,000 2044 to 2048 101,055,000 — — 101,055,000
Total $ 2,105,880,000 $ 1,814,983 $ 504,342 $ 2,108,199,325
PrincipalInstallmentPurchase Airport
Revenue Bonds Debt TotalContractsWillow Run

WAYNE COUNTY AIRPORT AUTHORITY
Notes to Basic Financial Statements
September 30, 2018
33
Pursuant to the Authority Act, the Authority is liable for all of the obligations with respect to the Authority and is obligated to perform all of the duties, and is bound by all of the covenants, with respect to the Authority under any ordinances (including Ordinance 319), agreements or other instruments and under law. Under the Authority Act, all airport revenue bonds issued by the Authority may be issued on a parity basis with the Outstanding Senior Lien Bonds and Additional Bonds issued by the Authority under the Master Bond Ordinance, and secured by net revenues. Net revenues (as defined in the various bond ordinances) of Metro Airport have been pledged toward the repayment of the Airport Revenue Bonds and the Installment Purchase Contract. Net revenues consist of operating revenues, interest income and other, federal and state sources, passenger facility charges, and customer facility charges reduced by operating expenses not including depreciation. For fiscal year 2018, the net revenue was $210,741,905 compared to the net debt service (principal and interest) of $182,688,215. The Airport Revenue Bond Ordinances require that Metro Airport reserve assets to provide for the operations, maintenance, and administrative expenses of the subsequent month, the redemption of bond principal and interest, and for other purposes as defined in those ordinances.
In June 1999, the County entered into agreements with Northwest to issue approximately $15.2 million in Airport Special Facility Revenue Bonds to finance the construction of an aircraft maintenance facility. All debt service costs will be paid by the airline through a trustee. The County and the Authority are not obligated in any manner to pay debt service in the event of default by Northwest. As these bonds are payable from special facility lease rentals payable in full by Northwest, the related debt has not been reflected in the financial statements of the Authority. An “Event of Default” occurred as a result of the Northwest Airlines bankruptcy filing on September 14, 2005. Northwest Airlines has since emerged from bankruptcy and affirmed its obligation for the Series 1999 Special Facility Bonds and is no longer in default. Effective December 31, 2009, the FAA issued a
2019 $ 89,697,372 $ 72,022 $ 89,769,394 2020 85,425,009 56,917 85,481,926 2021 81,040,886 40,602 81,081,488 2022 76,583,419 22,993 76,606,412 2023 72,098,396 4,870 72,103,266
2024 to 2028 302,222,609 — 302,222,609 2029 to 2033 195,879,880 — 195,879,880 2034 to 2038 105,746,063 — 105,746,063 2039 to 2043 49,749,625 — 49,749,625 2044 to 2048 9,025,125 — 9,025,125
Total $ 1,067,468,384 $ 197,405 $ 1,067,665,789
InterestInstallment
Airport Purchase Revenue Bonds Contracts Total

WAYNE COUNTY AIRPORT AUTHORITY
Notes to Basic Financial Statements
September 30, 2018
34
single operating certificate for the integrated airline, and on the same date Northwest legally merged into Delta, resulting in a single surviving corporation known as Delta Air Lines, Inc. As a result of the merger, by operation of law, Delta has succeeded to all of the rights and obligations of Northwest. In December 2001, the County entered into a $292,133 note payable with Washtenaw County to allow Washtenaw County to use their Michigan Community Development Block Grant to assist Willow Run Airport in renovating Hangar I. The agreement calls for the principal to be paid in quarterly installments commencing March 31, 2005. In September 2007, the Authority executed a Master Lease Purchase Agreement to finance up to $8 million in major equipment purchases over a three-year period. The Authority used $5,397,299 of this agreement and entered into five Installment Purchase Contracts to pay for equipment and additional energy conservation improvements at Metro Airport. As of September 30, 2018, four of the five Installment Purchase Contracts were paid in full. In April 2008, the Authority issued $142.3 million in Wayne County Airport Authority Airport Revenue Refunding Bonds, Series 2008A. The Series 2008A Fixed Rate Refunding Bonds were issued to refund the Series 2002A Variable Rate Bonds which were initially issued to finance the cost of various capital projects at Metro Airport. The Series 2008A Bonds are revenue obligations of the Authority payable solely from revenues derived by the Authority from the operations of Metro Airport. The Authority defeased the Series 2002A Bonds by placing the proceeds of the Series 2008A Bonds in an irrevocable trust to provide for all future debt service payments. The Series 2002A Bonds were subsequently called and paid in full in May 2008. In December 2010, the Authority issued $722.7 million in Wayne County Airport Authority Airport Revenue Refunding Bonds, Series 2010A, 2010B, 2010C, 2010D, 2010E-1, 2010E-2 and 2010F. The Series 2010A, 2010B, 2010C, 2010D, 2010E-1, 2010E-2 and 2010F Bonds were issued to refund certain outstanding indebtedness previously issued to finance or refinance the cost of various capital projects at Metro Airport. The Series 2010A Refunding Bonds were issued to refund a portion of the Series 1998A Bonds. The Series 2010B Refunding Bonds were issued to refund a portion of the Series 1998B Bonds. The Series 2010C Refunding Bonds were issued to refund a portion of the Series 2008B Bonds, a portion of the Series 2008C Bonds, the Series 2008E Bonds and the Series 2008F Bonds. The Series 2010D Refunding Bonds were issued to refund the Series 2008D Bonds. The Series 2010E-1 Refunding Bonds were issued to refund a portion of the Series 1998A Bonds. The Series 2010E-2 Refunding Bonds were issued to refund a portion of the Series 1998A Bonds. The Series 2010F Refunding Bonds were issued to refund a portion of the Series 2008B Bonds and a portion of the Series 2008C Bonds. The Series 2010A Bonds, Series 2010B Bonds, Series 2010C Bonds, Series 2010D Bonds, Series 2010E-1 Bonds, Series 2010E-2 Bonds and Series 2010F Bonds are revenue obligations of the Authority payable solely from the net revenues derived by the Authority from the operations of Metro Airport. The Authority defeased the refunded portions of the Series 1998A Bonds, Series 1998B Bonds, Series 2008B Bonds, Series 2008C Bonds, Series 2008D Bonds, Series 2008E Bonds and Series 2008F Bonds by placing the proceeds of the Series 2010A Bonds, Series 2010B Bonds, Series 2010C Bonds, Series 2010D Bonds, Series 2010E-1 Bonds, Series 2010E-2 Bonds and Series 2010F Bonds in an irrevocable trust to provide for all future debt service payments. The Series 1998A Bonds, Series

WAYNE COUNTY AIRPORT AUTHORITY
Notes to Basic Financial Statements
September 30, 2018
35
1998B Bonds, Series 2008B Bonds, Series 2008C Bonds, Series 2008D Bonds, Series 2008E Bonds and Series 2008F Bonds were subsequently called and paid in full in January 2011 and February 2011. The difference between the cash flows required to service the new debt and complete the refunding was approximately $52.2 million. The Authority estimates its minimum economic gain (difference between the present value of the debt service payments on the old and new debt) was approximately $25.5 million. In November 2011, the Authority issued $169.4 million in Wayne County Airport Authority Airport Revenue Refunding Bonds, Series 2011A and 2011B. The Series 2011A and 2011B Bonds were issued to refund certain outstanding indebtedness previously issued to finance or refinance the cost of various capital projects at Metro Airport. The Series 2011A Refunding Bonds were issued to refund a portion of the Series 1998A Bonds. The Series 2011B Refunding Bonds were issued to refund a portion of the Series 2002C Bonds. The Series 2011A Bonds and Series 2011B Bonds are revenue obligations of the Authority payable solely from the net revenues derived by the Authority from the operations of Metro Airport. The Authority defeased the refunded portions of the Series 1998A Bonds and the refunded portions of the Series 2002C Bonds by placing the proceeds of the Series 2011A Bonds and Series 2011B Bonds in an irrevocable trust to provide for all future debt service payments. The Series 1998A Bonds and Series 2002C Bonds were subsequently called and paid in full in December 2011 and December 2012. The difference between the cash flows required to service the new debt and complete the refunding was approximately $10.6 million. The Authority estimates its minimum economic gain (difference between the present value of the debt service payments on the old and new debt) was approximately $8.1 million. In September 2012, the Authority issued $202.7 million in Wayne County Airport Authority Airport Revenue Bonds to provide funds to pay a portion of the costs of certain capital improvements at Metro Airport. These projects include the reconstruction and rehabilitation of airfield pavement and parking decks/lots, the replacement and construction of support facilities, acquisition of fleet and heavy equipment, design of powerhouse control room, watermain replacements, security network upgrades and roof replacements. The Series 2012A Bonds and Series 2012B Bonds are revenue obligations of the Authority payable solely from the net revenues derived by the Authority from the operations of Metro Airport. In September 2012, the Authority issued $75.4 million in Wayne County Airport Authority Airport Revenue Refunding Bonds, Series 2012C and 2012D. The Series 2012C and 2012D Bonds were issued to refund certain outstanding indebtedness previously issued to finance or refinance the cost of various capital projects at Metro Airport. The Series 2012C Refunding Bonds were issued to refund a portion of the Series 2002C Bonds. The Series 2012D Refunding Bonds were issued to refund a portion of the Series 1998A Bonds and the Series 2002D Bonds. The Series 2012C Bonds and Series 2012D Bonds are revenue obligations of the Authority payable solely from the net revenues derived by the Authority from the operations of Metro Airport. The Authority defeased the refunded portions of the Series 1998A Bonds, the refunded portions of the Series 2002C Bonds and the refunded Series 2002D Bonds by placing the proceeds of the Series 2012C Bonds and Series 2012D Bonds in an irrevocable trust to provide for all future debt service payments. The Series 1998A Bonds, Series 2002C Bonds and Series 2002D Bonds were subsequently called and paid in full in October 2012 and December 2012. The difference between
WAYNE COUNTY AIRPORT AUTHORITY
Notes to Basic Financial Statements
September 30, 2018
36
the cash flows required to service the new debt and complete the refunding was approximately $10.0 million. The Authority estimates its minimum economic gain (difference between the present value of the debt service payments on the old and new debt) was approximately $7.8 million. In May 2014, the Authority issued a $30 million Direct Placement Bond with Banc of America Preferred Funding Corporation, Series 2014A Bonds. The Series 2014A Bonds were issued to provide funds to pay a portion of the costs of certain capital improvements at Metro Airport. These projects include airfield pavement rehabilitation and reconstruction, development of wide-body aircraft parking apron, various electrical upgrades throughout the airport grounds, North power plant chillers, support systems and HVAC/air handler replacements, roadway reconstructions, demolition costs for various buildings and site improvement costs related to those demolition sites. The Series 2014A Bonds are revenue obligations of the Authority payable solely from the revenues derived by the Authority from the operations of Metro Airport. The Series 2014A Bonds are variable-rate bonds. Banc of America Preferred Funding Corporation is responsible under an agreement with Metro Airport to establish the interest rate monthly. The interest rate is determined as the rate of interest which, in the judgment of Banc of America Preferred Funding Corporation, would cause the Series 2014A Bonds to have a market value as of the date of determination equal to the principal amount, taking into account prevailing market provisions. In August 2014, the Authority issued $98.4 million in Wayne County Airport Authority Airport Revenue Bonds to provide funds to pay a portion of the costs of certain capital improvements at Metro Airport. These projects include taxiway rehabilitation and reconstruction, road reconstruction, bridges and roadway rehabilitation, fleet and heavy equipment acquisitions, various electrical projects, power plant equipment replacements and demolition of various buildings. The Series 2014B Bonds and Series 2014C Bonds are revenue obligations of the Authority payable solely from the net revenues derived by the Authority from the operations of Metro Airport. In January and March 2015, the Authority received $600,000 from a note payable signed in May 2014 with the Downriver Community Conference to assist Willow Run Airport with the demolition of Hangar 2. In May 2015, $120,000 of the funds borrowed was converted into a grant, thereby reducing the amount of the note payable to $480,000. The agreement calls for principal to be paid in monthly installments commencing June 1, 2019. In September 2015, the Authority issued an $85 million Direct Placement Bond with PNC Bank, N.A., Series 2015A Bonds. The Series 2015A Refunding Bonds were issued to refund a portion of the Series 2005A Bonds which were initially issued to finance the cost of various capital projects at Metro Airport. The Series 2015A Bonds are revenue obligations of the Authority payable solely from the revenues derived by the Authority from the operations of Metro Airport. The Authority defeased the Series 2005A Bonds by placing the proceeds of the Series 2015A Bonds in an irrevocable trust to provide for all future debt service payments. The Series 2005A Bonds were subsequently called and paid in full in December 2015. The difference between the cash flows required to service the new debt and complete the refunding was approximately $10.5 million. The Authority estimates its minimum economic gain (difference between the present value of the debt service payments on the old and new debt) was approximately $8.3 million.

WAYNE COUNTY AIRPORT AUTHORITY
Notes to Basic Financial Statements
September 30, 2018
37
In September 2015, the Authority issued a $75 million Direct Placement Bond with Bank of America, N.A., Series 2015B Bonds. The Series 2015B Refunding Bonds were issued to refund a portion of the Series 2005A Bonds which were initially issued to finance the cost of various capital projects at Metro Airport. The Series 2015B Bonds are revenue obligations of the Authority payable solely from the revenues derived by the Authority from the operations of Metro Airport. The Authority defeased the Series 2005A Bonds by placing the proceeds of the Series 2015B Bonds in an irrevocable trust to provide for all future debt service payments. The Series 2005A Bonds were subsequently called and paid in full in December 2015. The difference between the cash flows required to service the new debt and complete the refunding was approximately $16 million. The Authority estimates its minimum economic gain (difference between the present value of the debt service payments on the old and new debt) was approximately $12.7 million. In September 2015, the Authority issued a $25.6 million Direct Placement Bond with Citibank, N.A., Series 2015C Bonds. The Series 2015C Refunding Bonds were issued to refund a portion of the Series 2005A Bonds which were initially issued to finance the cost of various capital projects at Metro Airport. The Series 2015C Bonds are revenue obligations of the Authority payable solely from the revenues derived by the Authority from the operations of Metro Airport. The Authority defeased the Series 2005A Bonds by placing the proceeds of the Series 2015C Bonds in an irrevocable trust to provide for all future debt service payments. The Series 2005A Bonds were subsequently called and paid in full in September 2015. The difference between the cash flows required to service the new debt and complete the refunding was approximately $4.4 million. The Authority estimates its minimum economic gain (difference between the present value of the debt service payments on the old and new debt) was approximately $3.5 million. In October 2015, the Authority issued $221.1 million in Wayne County Airport Authority Airport Revenue Bonds to provide funds to pay a portion of the costs of certain capital improvements at Metro Airport. These projects include reconstruction and rehabilitation of airfield pavement, acquisition of fleet and heavy equipment, roadway rehabilitation and lighting, GTC heating system reconfiguration, retaining wall reconstruction, construction of an administration building, power plant building rehabilitation and security system upgrades. The series 2015D Bonds and Series 2015E Bonds are revenue obligations of the Authority payable solely from the net revenues derived by the Authority from the operations of Metro Airport. In October 2015, the Authority issued $299 million in Wayne County Airport Authority Airport Revenue Refunding Bonds, Series 2015F and 2015G. The Series 2015F and 2015G Bonds were issued to refund certain outstanding indebtedness previously issued to finance or refinance the cost of various capital projects at Metro Airport. The Series 2015F Refunding Bonds were issued to refund a portion of the Series 2005A Bonds. The Series 2015G Refunding Bonds were issued to refund a portion of the Series 2001A Airport Hotel Revenue Bonds. The Series 2015F Bonds and the Series 2015G Bonds are revenue obligations of the Authority payable solely from the revenues derived by the Authority from the operations of Metro Airport. The Authority defeased the refunded portion of the Series 2005A Bonds and the refunded portion of the Series 2001A Bonds by placing the proceeds of the Series 2015F Bonds and Series 2015G Bonds in an irrevocable trust to provide for all future debt service payments. The Series 2005A Bonds and the Series 2001A Bonds were subsequently called and paid in full in December 2015. The difference

WAYNE COUNTY AIRPORT AUTHORITY
Notes to Basic Financial Statements
September 30, 2018
38
between the cash flows required to service the new debt and complete the refunding was approximately $27.1 million. The Authority estimates its minimum economic gain (difference between the present value of the debt service payments on the old and new debt) was approximately $29.6 million. In October 2015, the Authority issued a $23.1 million Direct Placement Bond with Bank of America, N.A., Series 2015H Bonds. The Series 2015H Refunding Bonds were issued to refund a portion of the Series 2001A Airport Hotel Revenue Bonds which were initially issued to finance the cost of the Westin Hotel located in the McNamara Terminal. The Series 2015H Bonds are revenue obligations of the Authority payable solely from the revenues derived by the Authority from the operations of Metro Airport. The Authority defeased the Series 2001A Bonds by placing the proceeds of the Series 2015H Bonds in an irrevocable trust to provide for all future debt service payments. The Series 2001A Bonds were subsequently called and paid in full in December 2015. The Series 2015H Bonds are variable-rate bonds. Bank of America, N.A. is responsible under an agreement with Metro Airport to establish the interest rate monthly. The interest rate is determined as the rate of interest which, in the judgment of Bank of America N.A., would cause the Series 2015H Bonds to have a market value as of the date of determination equal to the principal amount, taking into account prevailing market provisions. In October 2017, the Authority issued $91.4 million in Wayne County Airport Authority Airport Revenue Bonds to provide funds to pay a portion of the costs of certain capital improvements at Metro Airport. These projects include reconstruction and rehabilitation of airfield pavement, acquisition of fleet and heavy equipment, roadway rehabilitation, improvements to the baggage handling system at the McNamara Terminal and improvements to the passenger tram control system at the McNamara Terminal. The Series 2017A Bonds and Series 2017B Bonds are revenue obligations of the Authority payable solely from the net revenues derived by the Authority from the operations of Metro Airport. In October 2017, the Authority issued $78.4 million in Wayne County Airport Authority Airport Revenue Refunding Bonds, Series 2017C. The Series 2017C Bonds were issued to refund certain outstanding indebtedness previously issued to finance or refinance the cost of various capital projects at Metro Airport. The Series 2017C Refunding Bonds were issued to refund the Series 2007B Bonds. The Series 2017C Bonds are revenue obligations of the Authority payable solely from the revenues derived by the Authority from the operations of Metro Airport. The Authority defeased the refunded portion of the Series 2007B Bonds by placing the proceeds of the Series 2017C Bonds in an irrevocable trust to provide for all future debt service payments. The Series 2007B Bonds were subsequently called and paid in full in December 2017. The difference between the cash flows required to service the new debt and complete the refunding was approximately $15.2 million. The Authority estimates its minimum economic gain (difference between the present value of the debt service payments on the old and new debt) was approximately $12.8 million. In October 2017, the Authority issued $109.1 million in Wayne County Airport Authority Airport Revenue Refunding Bonds, Series 2017A Jr. Lien and 2017B Jr. Lien. The Series 2017A Jr. Lien

WAYNE COUNTY AIRPORT AUTHORITY
Notes to Basic Financial Statements
September 30, 2018
39
and 2017B Jr. Lien Bonds were issued to refund certain outstanding indebtedness previously issued to finance or refinance the cost of various capital projects at Metro Airport. The Series 2017A Jr. Lien and Series 2017B Jr. Lien Refunding Bonds were issued to refund a portion of the Series 2007A Jr. Lien Bonds. The Series 2017A Jr. Lien Bonds and the Series 2017B Jr. Lien Bonds are revenue obligations of the Authority payable solely from the revenues derived by the Authority from the operations of Metro Airport and available after net revenues have first been set aside as required to pay the principal and interest and redemption price, if any, of Senior Lien Bonds as provided in the Ordinance. The Series 2017A Jr. Lien Bonds and Series 2017B Jr. Lien Bonds are “Junior Lien Bonds” under the Ordinance, and a statutory lien subordinate to the prior lien in respect of Senior Lien Bonds has been established under the Ordinance upon and against the net revenues to secure the payment of the Series 2017A Jr. Lien Bonds and Series 2017B Jr. Lien Bonds. The Authority defeased the refunded portion of the Series 2007A Jr. Lien Bonds by placing the proceeds of the Series 2017A Jr. Lien Bonds and Series 2017B Jr. Lien Bonds in an irrevocable trust to provide for all future debt service payments. The Series 2007A Jr. Lien Bonds were subsequently called and paid in full in December 2017. The difference between the cash flows required to service the new debt and complete the refunding was approximately $26 million. The Authority estimates its minimum economic gain (difference between the present value of the debt service payments on the old and new debt) was approximately $18.8 million. In October 2017, the Authority issued a $24.6 million Direct Placement Bond with Citibank, N.A., Series 2017C Jr. Lien Bonds. The Series 2017C Jr. Lien Bonds were issued to refund certain outstanding indebtedness previously issued to finance or refinance the cost of various capital projects at Metro Airport. The Series 2017C Jr. Lien Refunding Bonds were issued to refund a portion of the Series 2007A Jr. Lien Bonds. The Series 2017C Jr. Lien Bonds are revenue obligations of the Authority payable solely from the revenues derived by the Authority from the operations of Metro Airport and available after net revenues have first been set aside as required to pay the principal and interest and redemption price, if any, of Senior Lien Bonds as provided in the Ordinance. The Series 2017C Jr. Lien Bonds are “Junior Lien Bonds” under the Ordinance, and a statutory lien subordinate to the prior lien in respect of Senior Lien Bonds has been established under the Ordinance upon and against the net revenues to secure the payment of the Series 2017C Jr. Lien Bonds. The Authority defeased the Series 2007A Jr. Lien Bonds by placing the proceeds of the Series 2017C Jr. Lien Bonds in an irrevocable trust to provide for all future debt service payments. The Series 2007A Jr. Lien Bonds were subsequently called and paid in full in December 2018. The difference between the cash flows required to service the new debt and complete the refunding was approximately $6.8 million. The Authority estimates its minimum economic gain (difference between the present value of the debt service payments on the old and new debt) was approximately $4.3 million. In December 2017, the Authority issued a $199 million Direct Placement Bond with Bank of America, N.A., Series 2017D Bonds. The Series 2017D Refunding Bonds were issued to refund the Series 2013A Direct Placement Bonds which were initially issued to refund certain outstanding indebtedness previously issued to finance or refinance the cost of various capital projects at Metro Airport. The Series 2017D Bonds are revenue obligations of the Authority payable solely from the revenues derived by the Authority from the operations of Metro Airport.

WAYNE COUNTY AIRPORT AUTHORITY
Notes to Basic Financial Statements
September 30, 2018
40
The Authority refunded the Series 2013A Direct Placement Bond by placing the proceeds of the Series 2017D Bonds in the 2013A Bond Fund to be immediately paid to the Direct Placement Bondholder. The Series 2013A Direct Placement Bond was paid in full on December 21, 2017. The Series 2017D Bonds are variable-rate bonds. Bank of America N.A. is responsible under an agreement with Metro Airport to establish the interest rate monthly. The interest rate is determined as the rate of interest which, in the judgment of Bank of America N.A., would cause the Series 2017D Bonds to have a market value as of the date of determination equal to the principal amount, taking into account prevailing market provisions. In December 2017, the Authority issued a $67.8 million Direct Placement Bond with Citibank, N.A., Series 2017E Bonds. The Series 2017E Refunding Bonds were issued to refund the Series 2013B Direct Placement Bond which were initially issued to refund certain outstanding indebtedness previously issued to finance or refinance the cost of various capital projects at Metro Airport. The Series 2017E Bonds are revenue obligations of the Authority payable solely from the revenues derived by the Authority from the operations of Metro Airport. The Authority refunded the Series 2013B Direct Placement Bond by placing the proceeds of the Series 2017E Bonds in the 2013B Bond Fund to be immediately paid to the Direct Placement Bondholder. The Series 2013B Direct Placement Bond was paid in full on December 21, 2017. In December 2017, the Authority issued a $114.3 million Direct Placement Bond with Bank of America, N.A., Series 2017F Bonds. The Series 2017F Refunding Bonds were issued to refund the Series 2013C Direct Placement Bond which were initially issued to refund certain outstanding indebtedness previously issued to finance or refinance the cost of various capital projects at Metro Airport. The Series 2017F Bonds are revenue obligations of the Authority payable solely from the revenues derived by the Authority from the operations of Metro Airport. The Authority refunded the Series 2013C Direct Placement Bond by placing the proceeds of the Series 2017F Bonds in the 2013C Bond Fund to be immediately paid to the Direct Placement Bondholder. The Series 2013C Direct Placement Bond was paid in full on December 21, 2017. Long-term debt activity for the year ended September 30, 2018 was as follows:
Detroit Metropolitan Airport Fund:Airport revenue bonds $ 2,145,910,000 $ 684,575,000 $ (724,605,000) $ 2,105,880,000 $ 93,620,000 Installment purchase contracts 2,152,765 — (337,782) 1,814,983 336,439 Add (less): Certain bond discounts (490,528) 30,494 — (460,034) — Certain bond premiums 74,855,937 52,795,267 (8,030,573) 119,620,631 —
Total Detroit MetropolitanAirport Fund 2,222,428,174 737,400,761 (732,973,355) 2,226,855,580 93,956,439
Willow Run Airport Fund:
Notes payable 523,820 — (19,478) 504,342 39,476
Total Willow Run Airport Fund 523,820 — (19,478) 504,342 39,476
Total Long-Term Debt $ 2,222,951,994 $ 737,400,761 $ (732,992,833) $ 2,227,359,922 $ 93,995,915
Due within
one year
Beginning
balance Additions Reductions
Ending
balance

WAYNE COUNTY AIRPORT AUTHORITY
Notes to Basic Financial Statements
September 30, 2018
41
Other long-term liability activity for the year ended September 30, 2018 was as follows:
(9) Commitments and Contingencies
(a) Litigation The Authority is a defendant in a number of lawsuits and claims that have resulted from the ordinary course of providing services. The ultimate effect on the Authority’s financial statements of the resolution of these matters is, in the opinion of the Authority’s counsel, not expected to be material.
(b) Construction The estimated costs to complete Metro Airport’s current capital improvement program totaled $668.5 million at September 30, 2018, which will be funded by previously issued and anticipated debt, federal grants, and passenger facility charges. Unexpended commitments on construction and professional services contracts in connection with Metro Airport’s program totaled $20.2 million at September 30, 2018. The estimated costs to complete Willow Run Airport’s current capital improvement program totaled $121.9 million at September 30, 2018, which will be funded with federal and state grants. Unexpended commitments on construction and professional services contracts in connection with Willow Run Airport’s program totaled $1.9 million at September 30, 2018.
(c) Environmental Matters Environmental accruals are calculated and recorded using an expected cash flow technique applied to probabilities, ranges, and assumptions developed in response to a potential remediation liability as based on current law and existing technologies. At September 30, 2018, the Authority had accrued obligations of $3.3 million for environmental remediation and restoration costs. This is management’s best estimate of the costs with respect to environmental matters; however, these estimates contain inherent uncertainties primarily due to unknown conditions, changing regulations, and developing technologies. In accordance with GASB Statement 49, Accounting and Financial Reporting for Pollution Remediation Obligations, the liability has been recorded at the current value
Detroit Metropolitan Airport Fund:Accrued interest and other payables $ 34,691,521 $ 6,601,520 $ (7,715,543) $ 33,577,498 $ — Other accrued liabilities 3,296,349 — (606,391) 2,689,958 1,827,089 Due to other governmental units — 4,715,000 — 4,715,000 Net pension liability 67,600,745 14,535,235 (23,908,931) 58,227,049 —
Net OPEB liability 1
61,070,242 9,562,383 (14,912,202) 55,720,423 — Willow Run Airport Fund:
Other accrued liabilities 962,700 — (22,500) 940,200 — Net pension liability 922,161 266,430 (323,223) 865,368 — Net OPEB liability
11,119,414 175,278 (273,340) 1,021,352 —
Total Other Long-Term Liabilities $ 169,663,132 $ 35,855,846 $ (47,762,130) $ 157,756,848 $ 1,827,089
1 - Beginning balance upon implementation of GASB 75 in the current year.
Due within
one yearbalance
Beginning
Additions Reductions balance
Ending

WAYNE COUNTY AIRPORT AUTHORITY
Notes to Basic Financial Statements
September 30, 2018
42
estimated using the expected cash flow technique, a probability-weighted approach. Twenty-three percent of the recorded environmental liabilities are related to a Consent Decree and judgment issued during 1994 that identifies the Airport as one of the fourteen responsible parties to the improvements to the Wayne County Downriver Sewage Disposal System (the System). The bulk of the remainder is for asbestos remediation estimates. See additional discussion on both below. Downriver Sewage Disposal System In 1994, the Environmental Protection Agency (EPA) and Michigan Department of Natural Resources (MDNR) through a federal court ruling, issued a mandate for environmental remediation of the System noting in their Financing Plan and Final Judgment RE: 1994 Court-Ordered Improvements, “Whereas, it is immediately necessary and imperative for the public health and welfare of the present and future residents of Wayne and the Downriver Communities that the improvements for the System required by the Consent Decree be planned, designed, acquired, constructed and financed to service the Downriver Communities.” The “Downriver Communities” listed as responsible parties to this decree included 13 communities as well as Metro Airport, which utilize the plant for water and sewage disposal. Total project costs were initially estimated at $230 million and financed by Wayne County (the County) through the issuance of bonds and additional State Revolving Fund (SRF) financing. Each responsible party is required to pay their allocated portion of principal and interest on the bonds and SRF bonds, as well as their portion of any subsequent debt issued to pay project costs. In August 2007, a series of completion bonds were issued to finance the estimated final costs of the project. Metro Airport has paid $8.02 million to the City of Romulus for prior year debt service as of September 30, 2018 and an additional $400 thousand to fund a bond reserve. The amounts recorded by the Authority for future debt service payments are believed to materially encompass the remaining obligation. On October 13, 2016, the “Downriver Communities” listed as the responsible parties in the Consent Decree entered into an agreement with the Downriver Utility Wastewater Authority (DUWA) authorizing DUWA to acquire and operate the sewage disposal system. This acquisition does not impact the obligation of each responsible party to pay their allocated portion of principal and interest on the bonds and SRF bond, as well as any subsequent debt issued to pay project costs. The Authority’s outstanding liability related to the sewage disposal system was $826,000 at September 30, 2018. Asbestos Remediation It is known that certain Metro Airport and Willow Run Airport buildings hold asbestos-containing materials (ACMs) that will need to be disposed of upon demolition of affected structures. While the pollutant is currently contained due to prior remediation efforts during the late 1980’s and early 1990’s, the environmental assessments have indicated that remediation will be necessary during the demolition of the affected buildings to ensure containment of the pollutants and proper disposal. WCAA personnel, with the assistance of WCAA contractors, have performed preliminary assessments of the nature and extent of the material. Based upon the information gathered and provided the Authority has recorded asbestos-related liabilities of $1.6 million and $940 thousand at Detroit Metro and Willow Run Airports, respectively, as of September 30, 2018.

WAYNE COUNTY AIRPORT AUTHORITY
Notes to Basic Financial Statements
September 30, 2018
43
Additional Remediation Matters In the mid-1990’s, it was discovered that areas at or near the Willow Run airport were contaminated with toxic materials. Various public and private entities (including the County of Wayne, the predecessor entity to WCAA) were tasked by the EPA to remediate the areas. Toxic materials were dredged from Tyler Pond, and then encapsulated in a controlled facility located on a plot of land owned by WCAA. Pursuant to the various documents and orders governing the remediation, title to the real property where the controlled facility is located was required to be transferred to General Motors or Ford Motor Company, as both entities were jointly and severally liable. In June of 2009, before taking title to the real property where the controlled facility is located, General Motors filed for bankruptcy protection. While Ford Motor Company has continued to operate the controlled facility, to date, and despite the WCAA’s attempts, Ford Motor Company has not taken title to the real property where the controlled facility is located. WCAA is in negotiation to facilitate the transfer of real property where the controlled facility is located to the Ford Motor Company.
(10) Employee Benefits
(a) Plan Description The Authority provides retirement benefits to its employees through the Wayne County Employees’ Retirement System (WCERS), an agent multi-employer public employee retirement system that is governed by the Wayne County Retirement Ordinance as amended. The Retirement System provides both defined benefit plan and defined contribution plan retirement options. The Defined Benefit Plan consists of Plan Option 1, Plan Option 2, Plan Option 3, Plan Option 5 and Plan Option 5A (collectively, the Plan). Three of the Plan options require employee contributions (Plan Option 1, Plan Option 3 and Plan Option 5A) and two do not require employee contributions (Plan Option 2 and Plan Option 5). Two of the Plan options are hybrid plans (Plan Option 5 and Plan Option 5A) which consist of both a defined benefit component and a defined contribution component. The Defined Contribution Plan consists of Plan Option 4, Plan Option 4A, Plan Option 5 and Plan Option 5A. The Retirement System provides retirement, survivor, and disability benefits to substantially all County and Authority employees. The Retirement Board issues separate financial statements for the Defined Benefit Plan and the Defined Contribution Plan annually. Copies of these financial statements can be obtained at 28 W. Adams, Suite 1900, Detroit, Michigan 48226. The statements are also available on WCERS website at www.wcers.org. Effective October 1, 2012, WCERS established Wayne County Defined Contribution Plan #4A and Wayne County Hybrid Retirement Plan #5A, which contains both a defined benefit component and a defined contribution component. Participants in the plan options previously in existence (Plan Option 4 and Plan Option 5) could elect to transfer their account balances to Plan Option 5A. Plan Options 1, 2, 3, and 4 were closed to new hires.

WAYNE COUNTY AIRPORT AUTHORITY
Notes to Basic Financial Statements
September 30, 2018
44
At the September 30, 2017 measurement date, the following employees were covered by the Plan:
Inactive Plan Members or Beneficiaries Currently Receiving Benefits 215Inactive Plan Members Entitled to But Not Yet Receiving Benefits 12Active Plan Members 334Total Plan Members
561
(b) Pension Benefits Benefits are paid monthly over the member’s or survivor’s lifetime, after meeting normal retirement or duty disability retirement requirements, which vary by option, based on the following percentages of average final compensation, for each year of credited service: Plan Option 1 – 2.65 percent for each year of service. Maximum Authority-financed portion is 75 percent of average final compensation (less workers’ compensation payments). Minimum monthly pension is $5 times years of service. Plan Option 2 – 1 percent for each year up to 20 years and 1.25 percent for each year over 20 years. Maximum Authority-financed portion is 75 percent of average final compensation (less worker’s compensation payments). Plan Option 3 – 1.5 percent for each year up to 20 years, 2 percent for each year between 20 and 25 years, and 2.5 percent for each year over 25 years. Maximum Authority-financed portion is 75 percent of average final compensation (less workers’ compensation payments). Plan Option 5 – 1.25 percent for each year up to 20 years and 1.5 percent for each year over 20 years. Maximum pension is 75 percent of average final compensation (less workers’ compensation payments). Plan Option 5A – 1.50 percent for each year up to 20 years and 1.75 percent for each year over 20 years. Maximum pension is 75 percent of average final compensation (less workers’ compensation payments). Death and disability benefits – The Plan also provides nonduty death and disability benefits to members after 10 years of credited service for Plan Options 1, 5 and 5A, along with nonduty disability for Plan Option 2 and nonduty death benefits for Plan Option 3. The 10-year service provision is waived for duty disability and death benefits for Plan Options 1, 5, and 5A and duty disability for Plan Option 2. (c) Contributions Participants in Plan Option 1 contribute 2.00 percent to 6.58 percent of annual compensation, depending on years of credited service. Participants in Plan Option 2 do not make plan contributions, but receive a lower final benefit. Plan Option 3 participants make contributions of 3.0 percent of covered compensation and receive a lower final benefit. Participants in Plan Option 5 with 1.25/1.5 percent multiplier contribute 0 percent of covered compensation depending on the collective bargaining agreement. Participants in Plan 5A contribute 2.00 percent of annual compensation,

WAYNE COUNTY AIRPORT AUTHORITY
Notes to Basic Financial Statements
September 30, 2018
45
unless the Annual Actuarial Valuation Report of the Wayne County Employees’ Retirement System show the Authority’s funding level less than 100 percent, then the participant’s contribution level will increase to 3 percent until the funding level is at 100 percent. The obligation to contribute and to maintain the Plan for these employees was established by negotiations with the County’s and subsequently the Authority’s collective bargaining units. For the year ended September 30, 2018, the average Authority’s contribution rate was 24.63 percent of annual payroll. (d) Pension Plan Investments – Policy and Rate of Return The Retirement Commission is vested with a fiduciary responsibility for administration, management, and proper operation of WCERS. The Plan’s assets are held and invested in accordance with the Michigan Public Pension Investment Act 314 of 1965, as amended (Act 55, P.A. 1982). Act 314 incorporates the prudent person rule and requires investment fiduciaries to act solely in the interest of the Plan’s participants and beneficiaries. Accordingly, the Retirement Commission has the authority to invest the Plan’s assets in common and preferred stock, obligations of the United States, its agencies or United States government-sponsored enterprises, obligations of any state or political subdivision of a state having the power to levy taxes, bankers’ acceptances, certificates of deposit, commercial paper, repurchase agreements, reverse repurchase agreements, real and personal property, mortgages, and certain other investments. Investment Allocation Policy. The Retirement Commission has established an investment policy statement (“IPS”) for the Plan. The IPS outlines the goals and investment objectives of WCERS and is intended to provide guidelines for the investment and management of the Plan’s assets. The IPS pursues an investment strategy that protects the financial health of the Plan and reduces risk through prudent diversification of the portfolio across a broad selection of distinct asset classes. Plan assets are invested in the broad investment categories and asset classes to achieve the allocation targets in the below table. Recognizing that returns may vary, causing fluctuations in the relative dollar value levels of assets within classes, the Plan may not maintain strict adherence to the targets in the short-term, but may allow the values to fluctuate within these ranges. Over the long term, the Plan will strive to adhere to the given targets as financially practicable and move toward target allocations in a prudent manner consistent with its fiduciary duty. The adopted asset allocation policy as of September 30, 2017, was as follows:
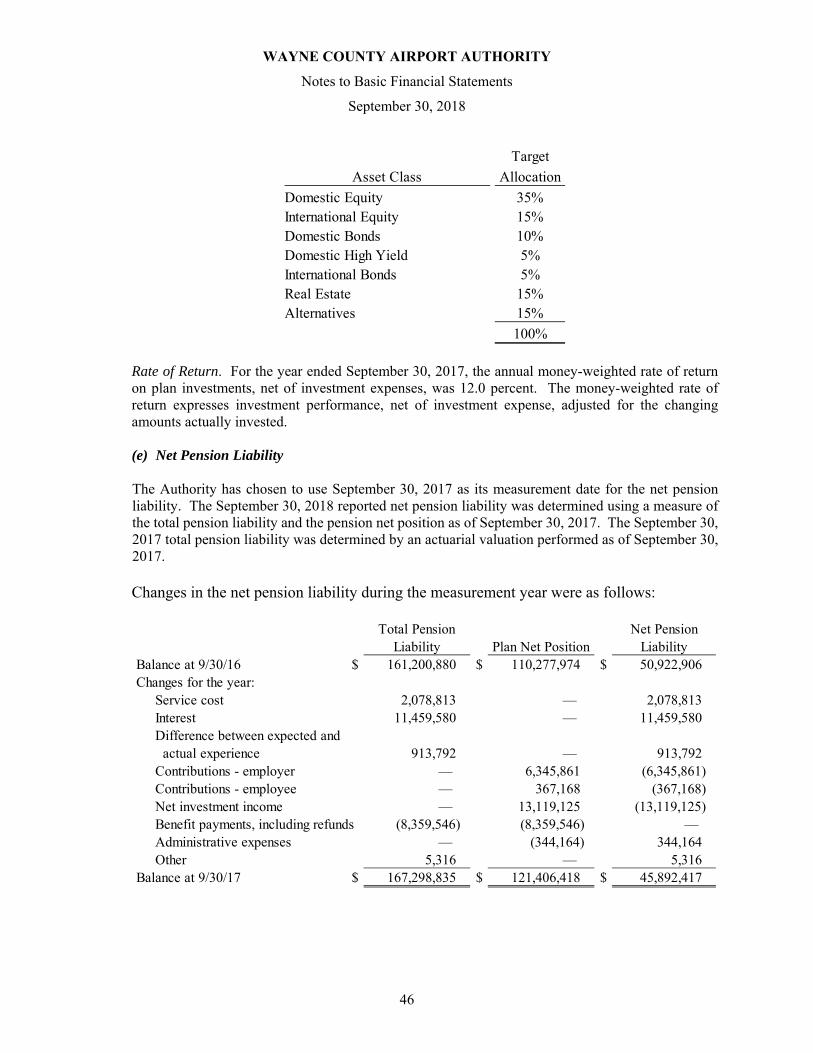
WAYNE COUNTY AIRPORT AUTHORITY
Notes to Basic Financial Statements
September 30, 2018
46
Rate of Return. For the year ended September 30, 2017, the annual money-weighted rate of return on plan investments, net of investment expenses, was 12.0 percent. The money-weighted rate of return expresses investment performance, net of investment expense, adjusted for the changing amounts actually invested.
(e) Net Pension Liability The Authority has chosen to use September 30, 2017 as its measurement date for the net pension liability. The September 30, 2018 reported net pension liability was determined using a measure of the total pension liability and the pension net position as of September 30, 2017. The September 30, 2017 total pension liability was determined by an actuarial valuation performed as of September 30, 2017. Changes in the net pension liability during the measurement year were as follows:
Asset Class
Target
Allocation
Domestic Equity 35%International Equity 15%Domestic Bonds 10%Domestic High Yield 5%International Bonds 5%Real Estate 15%Alternatives 15%
100%
Total Pension Liability Plan Net Position
Net Pension Liability
Balance at 9/30/16 $ 161,200,880 $ 110,277,974 $ 50,922,906 Changes for the year:
Service cost 2,078,813 — 2,078,813 Interest 11,459,580 — 11,459,580 Difference between expected and actual experience 913,792 — 913,792 Contributions - employer — 6,345,861 (6,345,861) Contributions - employee — 367,168 (367,168) Net investment income — 13,119,125 (13,119,125) Benefit payments, including refunds (8,359,546) (8,359,546) — Administrative expenses — (344,164) 344,164 Other 5,316 — 5,316
Balance at 9/30/17 $ 167,298,835 $ 121,406,418 $ 45,892,417

WAYNE COUNTY AIRPORT AUTHORITY
Notes to Basic Financial Statements
September 30, 2018
47
For the fiscal year ended September 30, 2018, the Authority recognized pension expense of $7,588,883. At fiscal year end, the Authority reported deferred outflows of resources and deferred inflows of resources related to pensions from the following sources:
Deferred outflows of pension resources related to contributions after the measurement date will be a reduction of the net pension liability at September 30, 2019. Amounts reported as deferred outflows of resources and deferred inflows of resources related to pensions will be recognized in pension expense as follows:
Actuarial Assumptions. The total pension liability in the September 30, 2017 actuarial valuation was determined using the following actuarial assumptions applied to all periods included in the measurement:
Inflation 3.0% Salary increases 3.0% to 13.15% including inflation Investment rate of return 7.25%
Mortality rates were based on the RP-2014 Healthy Annuitant Mortality Table for males and females, adjusted for mortality improvement back to the base year of 2006. The actuarial assumptions used to calculate contribution rates in the September 30, 2017 valuation were determined using an experience-based table of rates specific to the type of eligibility condition. The experience-based table of rates was last updated for the 2016 valuation pursuant to an experience study of the period beginning October 1, 2010 and ending September 30, 2015. Discount Rate. The discount rate used to measure the total pension liability was 7.25 percent. The projection of cash flows used to determine this rate assumed that plan member contributions will be
Deferred Outflows of Resources
Deferred Inflows of Resources
Net difference between projected and actualearnings on pension plan investments $ — $ 3,247,297
Changes in actuarial assumptions 5,896,353 — Difference between projected and actual
experience 3,939,345 — Employer contributions to the plan
subsequent to the measurement date 7,265,285 — Total $ 17,100,983 $ 3,247,297
Fiscal Year Ouflow
2019 $ 1,991,168 2020 2,450,144 2021 1,173,342 2022 906,356 2023 67,391 Thereafter — Total $ 6,588,401

WAYNE COUNTY AIRPORT AUTHORITY
Notes to Basic Financial Statements
September 30, 2018
48
made at the current contribution rate and that employer contributions will be made at rates equal to the difference between actuarially determined contribution rates and the member rate. Based on these assumptions, the pension plan’s fiduciary net position was projected to be available to make all projected future benefit payments of current plan members. Therefore, the long-term expected rate of return on pension plan investments was applied to all periods of projected benefit payments to determine the total pension liability. The assumed rate of investment return was adopted by the plan’s trustees after considering input from the plan’s investment consultant(s) and actuary. Additional information about the assumed rate of investment return is included in the September 30, 2017 actuarial valuation report. The long-term expected rate of return on pension plan investments was determined using a building-block method in which expected future real rate of returns (expected returns, net of pension plan investment expense and inflation) are developed for each major asset class, and in conjunction with a formal study of experience during the period October 1, 2010 through September 30, 2015. These real rates of return are combined to produce the long-term expected rate of return by weighting the expected future real rates of return by the target asset allocation percentage and by adding expected inflation. For each major asset class that is included in the pension plan’s target asset allocation as of September 30, 2017, these best estimates of the arithmetic real rates of return are as follows:
Sensitivity of the Net Pension Liability to Changes in the Discount Rate. The following presents the net pension liability of the Authority, calculated using the discounted rate of 7.25 percent, as well as what the Authority’s net pension liability would be if it were calculated using a discount rate that is one percentage point lower (6.25 percent) or one percentage point higher (8.25 percent) than the current rate.
Pension Plan Fiduciary Net Position. Detailed information about the Plan’s fiduciary net position is available in the separately issued financial report. For purposes of measuring the net pension liability, deferred outflows of resources or deferred inflow of resources related to pension and pension expense, information about the Plan’s fiduciary net position and addition to/deduction from fiduciary net
Asset Class
Long Term
Real Return
Domestic Equity 5.54%International Equity 6.86%Domestic Bonds 1.40%Domestic High Yield 3.49%International Bonds 0.05%Real Estate 5.61%Alternatives 5.53%
1% Decrease Current Rate 1% Increase6.25% 7.25% 8.25%
Net Pension Liability $ 65,226,741 $ 45,892,418 $ 29,592,954

WAYNE COUNTY AIRPORT AUTHORITY
Notes to Basic Financial Statements
September 30, 2018
49
position have been determined on the same basis as they are reported by the Plan. The Plan uses the economic resources measurement focus and the full accrual basis of accounting, and investments are stated at fair value. Member contributions are recognized in the period in which contributions are due. Employer contributions are recognized when due and the employer has made a formal commitment to provide the contributions. Benefits and refunds are recognized when due and payable in accordance with benefit terms. (f) Pre-2002 Retirees The Authority participates in the Wayne County Employees’ Retirement System with the County, an agent multiple employer defined benefit plan. Pursuant to Public Act 90 and Michigan Public Act of 2002, the Authority was granted operational jurisdiction of the Detroit Metropolitan Wayne County Airport, the Willow Run Airport, and the Airport Hotel, with the exclusive right, responsibility, and authority to occupy, operate, control, and use them. Prior to the Act, the Authority and its employees were employees of the County. In connection with the Authority’s assumption of control and operation of the Airports pursuant to Act 90, the Authority was responsible for funding any retirement obligations for those employees that were previously County employees. During fiscal year 2016, the Authority committed to a five-year payment schedule of $1.1 million per quarter for its estimated share (10.25 percent) of the Combined Pre-2002 Retiree Liability of $20,948,822 as of September 30, 2015. Prior to the end of the fifth payment year, an actuarial valuation will be prepared to determine the Authority’s remaining estimated share of the liability (if any). The funding requirement and payment amortization of any remaining liability will be determined at that time. The terms of this commitment were memorialized in a memorandum of understanding between the Authority, Wayne County and WCERS in fiscal year 2017. The Authority has concluded that this arrangement represents a special funding situation under GASB Statement No. 68. The Authority’s liability under this arrangement is reflected as of the Authority’s measurement date of September 30, 2017, and is presented on the Authority’s balance sheet as of September 30, 2018 in accordance with GASB 68. The $6.6 million of payments made during fiscal year 2018 are presented on the balance sheet as deferred outflows of resources for contributions to the plan subsequent to the measurement date. The net pension liability and deferred outflows from pensions for pre-2002 and post-2002 retirees at the September 30, 2017 measurement date were as follows:
(g) Retirement System Wayne County Employees’ Defined Contribution Plan The Wayne County Employees’ Retirement System instituted a Defined Contribution Plan (Plan Option 4, Plan Option 4A, Plan Option 5, and Plan Option 5A) under the County’s Enrolled Ordinance No. 86-486 (November 20, 1986), as amended. The Plan was established to provide retirement, survivor, and disability benefits to County and Authority employees. The administration,
Net Pension Liability
Deferred Outflows from Pensions
Deferred Inflows from Pensions
Pre-2002 Retirees $ 13,200,000 $ 6,600,000 $ — Post-2002 Retirees 45,892,417 17,100,983 3,247,297 Total $ 59,092,417 $ 23,700,983 $ 3,247,297

WAYNE COUNTY AIRPORT AUTHORITY
Notes to Basic Financial Statements
September 30, 2018
50
management, and responsibility for the proper operation of the Plan are vested in the trustees of the Wayne County Retirement Commission. Under Plan Option 4, the Authority contributes $4.00 for every $1.00 contributed by each member or, for eligible executives, $5.00 for every $1.00 contributed by each member, with the member contributions ranging from 1.0 percent to 2.5 percent (3 percent for employees with 20 or more years of service and 3 percent for eligible executives with 10 or more years of service) of base compensation. Employees hired prior to July 1, 1984 were eligible to transfer from the WCERS Defined Benefit Plan to the Plan through September 30, 2002. Effective September 30, 2012, the Authority closed the Plan Option 4 to new hires. Classified employees are vested as to employer contributions after three years of service, and executive members are vested after two years of service. In Plan Option 4, members are able to receive loans from the Defined Contribution Plan. Only active employees with a vested account balance of $2,000 or more are eligible. Interest on the loans is at the rate of five-year Treasury notes plus 300 basis points (3 percent), rounded to the nearest quarter of a percent. Participants in Plan Option 4A must contribute 4 percent and can elect to contribute an additional 7.5 percent of their compensation. The Authority makes matching contribution of eight percent of an employee’s compensation. Employees are vested after three years. Participants in Plan Option 5 and Plan Option 5A contribute 3 percent of gross pay. The Authority makes matching contributions at a rate equal to the amount contributed by each employee. Employees are vested at 50 percent after one year of service, 75 percent after two years of service, and 100 percent after three years of service. The obligation to contribute and to maintain the Plan for these employees was established by negotiations with the Authority’s collective bargaining units. Total Authority employer and employee contributions to the Plan during 2018 were $3,779,326 and $1,994,290, respectively.
(11) Other Postemployment Benefits
Wayne County Airport Authority Retiree Health Care Plan (a) Plan Description As provided for in the Authority Act, the Authority provides hospitalization and other health insurance benefits for retirees, pursuant to agreements with various collective bargaining units or other actions of the Authority Board. Benefits are provided through the Wayne County Airport Authority Retiree Health Care Plan, a single employer defined benefit plan administered by the Municipal Employees’ Retirement System (MERS). The plan does not issue a separate stand-alone financial statement.

WAYNE COUNTY AIRPORT AUTHORITY
Notes to Basic Financial Statements
September 30, 2018
51
At the September 30, 2017 valuation date, the following members were covered by the plan:
Retirees and Beneficiaries Currently Receiving Benefits 236Inactive Plan Members Entitled to But Not Yet Receiving Benefits 0Active Plan Members 442Total Plan Members
678
(b) Benefits Provided Benefits are provided after normal retirement or non-duty disability subject to age and service requirements established in respective collective bargaining agreements. Benefits are provided after duty disability with no age or service requirement. Medical and prescription drug coverage is provided to retirees under the age of 65 and their eligible dependents, and the cost of federal Medicare premiums and supplemental hospitalization is paid for retirees over 65 and their eligible dependents, as these costs are incurred by the retirees.
(c) Contributions
In September 2008, the Authority created and began funding an Act 149 Health Care Trust (Trust). The Trust provides a funding mechanism for the Wayne County Airport Authority Retiree Healthcare Plan. In September 2012, the Authority transferred the assets of the Trust into a MERS of Michigan Retiree Health Funding Vehicle, which is held in a separate reserve, but invested on a pooled basis by MERS with other governmental units. The balance as of September 30, 2018 in this restricted plan is $64,502,368. Retiree healthcare costs are generally paid by the Authority on a “pay-as-you-go” basis, and funds are accumulated in the Trust for the payment of future benefits. The Authority is under no obligation to make contributions to the Trust in advance of when costs are incurred; however, the Authority’s financial plan is to fund these obligations annually based upon the actuarial recommended contribution. Non-Medicare retirees are required to contribute either 10 percent of the Blue Cross Blue Shield illustrative rate or 10 percent of the lesser of HAP active and HAP retiree premium. For the fiscal year ended September 30, 2018 the Authority has paid postemployment healthcare benefits of $1,875,930, plus it contributed $7,697,891 into the Trust. (d) Net OPEB Liability
The Authority has chosen to use September 30, 2018 as its measurement date for the net OPEB liability. The September 30, 2018 fiscal year end reported net OPEB liability was determined using a measure of the total OPEB liability and the OPEB net position as of the September 30, 2018 measurement date. The September 30, 2018 total OPEB liability was determined by an actuarial valuation performed as of September 30, 2017. Update procedures were performed to roll forward the estimated liability to September 30, 2018.

WAYNE COUNTY AIRPORT AUTHORITY
Notes to Basic Financial Statements
September 30, 2018
52
Changes in the net OPEB liability during the measurement year were as follows:
The Plan’s fiduciary net position represents 53.2 percent of the total OPEB liability. For the fiscal year ended September 30, 2018, the Authority recognized OPEB expense of $5,416,250. At fiscal year end, the Authority reported deferred outflows of resources and deferred inflows of resources related to OPEB from the following sources:
Amounts reported as deferred outflows of resources and deferred inflows of resources related to OPEB will be recognized in OPEB expense as follows:
Changes in Net OPEB Liability
Total OPEB Liability Plan Net Position
Net OPEB Liability
Balance at 9/30/2017 $ 115,729,202 $ 53,539,546 $ 62,189,656 Changes for the year:
Service cost 1,644,712 - 1,644,712 Interest 8,092,952 - 8,092,952 Differences between expected and (2,346,793) - (2,346,793)
actual experience - - - Contributions - Employer - 9,573,821 (9,573,821) Net investment income - 3,264,931 (3,264,931) Benefit payments, including refunds (1,875,930) (1,875,930) -
Net changes 5,514,941 10,962,822 (5,447,881)
Balance at 9/30/2018 $ 121,244,143 $ 64,502,368 $ 56,741,775
Deferred Outflows of Resources
Deferred Inflows of Resources
Difference between expected and actual experience $ - $ (1,892,120) Net difference between projected and actual earnings
on OPEB plan investments 601,810 -
Total $ 601,810 $ (1,892,120)
Fiscal Year Amount
2019 $ 304,220 2020 304,220 2021 304,220 2022 304,220 2023 73,430
Thereafter -
Total $ 1,290,310

WAYNE COUNTY AIRPORT AUTHORITY
Notes to Basic Financial Statements
September 30, 2018
53
Actuarial Assumptions. The total OPEB liability in the September 30, 2018 actuarial valuation was determined using a wage inflation assumption of 3.0 percent; assumed salary increases (including inflation) ranging from 3.0 percent to 13.15 percent; an investment rate of return (net of investment expenses) of 7.0 percent; an initial healthcare cost trend rate of 8.5 percent for 2018, gradually decreasing to an ultimate rate of 3.5 percent for 2027 and later years; and using the RP-2014 Healthy Annuitant Mortality table with the MP-2016 mortality improvement scale. These assumptions were applied to all periods included in the measurement. The actuarial assumptions used to calculate contribution rates in the September 30, 2017 valuation were determined using an experience-based table of rates specific to the type of eligibility condition. The experience-based table of rates was last updated pursuant to an experience study of the period beginning October 1, 2010 and ending September 30, 2015. Discount Rate. The discount rate used to measure the total OPEB liability was 7.0 percent. The projection of cash flows used to determine the discount rate assumed that employer contributions will be made at rates equal to the actuarially determined contribution rate. The discount rate reflects 1) the long-term expected rate of return on OPEB plan investments of 7.0 percent and 2) a municipal bond rate of 3.83 percent (based on fixed-income municipal bonds with 20 years to maturity that include only federally tax-exempt municipal bonds as reported in Fidelity Index’s “20-Year GO AA Index” as of September 28, 2018). Based on these assumptions, the OPEB plan’s fiduciary net position was projected to be available to make all projected future benefit payments of current plan members. Therefore, the long-term expected rate of return on OPEB plan investments was applied to all periods of projected benefit payments to determine the total OPEB liability. Investment Rate of Return. The long-term expected rate of return on OPEB plan investments was determined using a forward-looking estimate of capital market returns model for each investment major asset class. These ranges are combined to produce the long-term expected rate of return by weighing the expected future real rates of return by the target asset allocation percentage and by adding expected inflation and investment percentages. The target allocation and best estimate of arithmetic real rates of return for each asset class are summarized in the following table:
Sensitivity of Net OPEB Liability to Changes in the Discount Rate. The following presents the net OPEB liability of the Authority, calculated using the discount rate of 7.0 percent, as well as what the Authority’s net OPEB liability would be if it were calculated using a discount rate that is one percentage point lower or one percentage point higher than the current rate:
Fund Name
Long Term
Real Return
MERS Established Market Portfolio 4.20%MERS Total Market Portfolio 5.25%

WAYNE COUNTY AIRPORT AUTHORITY
Notes to Basic Financial Statements
September 30, 2018
54
Sensitivity of the Net OPEB Liability to Changes in the Healthcare Cost Trend Rate. The following presents the net OPEB liability of the Authority, calculated using the healthcare cost trend rate of 8.5 percent, as well as what the Authority’s net OPEB liability would be if it were calculated using a healthcare cost trend rate that is one percentage point lower or one percentage point higher than the current rate:
(12) Due to Other Governmental Units - Wayne County Health and Welfare Plan (Pre-2002) As provided for in the Authority Act, the Authority, through the County, provides hospitalization and other health insurance for retirees pursuant to agreements with various collective bargaining units or other actions of the Wayne County Board of Commissioners, the Wayne County Retirement Board, or the Authority Board. Benefits are provided to retirees under the age of 65 and their eligible dependents, and the cost of federal Medicare premiums and supplemental hospitalization is paid for retirees over 65 and their eligible dependents as these costs are incurred by the retirees. Currently, the plan’s members include retirees for the County and the Authority that retired before September 1, 2002. The plan is closed to new members. During the year ended September 30, 2016, the County Commission adopted an ordinance amending the 1990 Wayne County Health and Welfare Plan. The ordinance provided for stipend payments in lieu of healthcare benefits for Plan members that meet certain eligibility requirements. Plan members that receive the stipend benefit are required to file annual certifications related to the use of this stipend for health care benefits. Plan members may become ineligible for this stipend benefit upon eligibility for another health care plan. The Authority’s liability under this arrangement as of September 30, 2018 is $4,715,000. To date, the Authority has made $1,727,205 in payments related to these stipend benefits.
(13) Subsequent Events
On November 14, 2018, the Authority issued $153.4 million in Wayne County Airport Authority Revenue Bonds at the following amounts: Series 2018A - $147.4 million and Series 2018B - $6 million. These bonds were issued to provide funds to pay a portion of the costs of certain capital acquisitions and improvements at Metro Airport and make deposits to Bond Reserve Accounts.
1% DecreaseCurrent Rate Assumption 1% Increase
6.0% 7.0% 8.0%
Net OPEB Liability $ 72,791,795 $ 56,741,775 $ 43,481,361
1% Decrease
Current Healthcare Cost Trend Rate
Assumption 1% Increase
7.5% 8.5% 9.5%
Net OPEB Liability $ 41,813,352 $ 56,741,775 $ 74,976,588

WAYNE COUNTY AIRPORT AUTHORITY
Notes to Basic Financial Statements
September 30, 2018
55
On November 14, 2018, the Authority also issued $78.5 million in Wayne County Airport Authority Revenue Refunding Bonds at the following amounts: Series 2018C - $35.5 million and Series 2018D - $43 million. The Series 2018C and Series 2018D Revenue Refunding Bonds were issued to provide funds to refund the Series 2008A Revenue Refunding Bonds and make deposits to Bond Reserve Accounts.
(14) Upcoming Reporting Changes In November 2016, the GASB issued Statement No. 83, Certain Asset Retirement Obligations, which addresses accounting and financial reporting for legally enforceable liabilities associated with the retirement of a tangible capital asset. This standard will require entities that have legal obligations to perform future asset retirement activities related to its tangible assets to recognize an estimated liability based on the current value of outlays expected to be incurred. The Authority is currently evaluating the impact this standard will have on the financial statements when adopted. The provisions of this statement are effective for the Authority’s financial statements for the year ending September 30, 2019. In January 2017, the Governmental Accounting Standards Board issued Statement No. 84, Fiduciary Activities. This statement establishes criteria for identifying fiduciary activities of all state and local governments. An activity meeting the criteria should be reported in a fiduciary fund in the basic financial statements. The Authority is currently evaluating the impact this standard will have on the financial statements when adopted. The provisions of this statement are effective for the Authority's financial statements for the year ending September 30, 2020. In June 2017, the GASB issued Statement No. 87, Leases, which improves accounting and financial reporting for leases by governments. This statement requires recognition of certain lease assets and liabilities for leases that previously were classified as operating leases and recognized as inflows of resources or outflows of resources based on the payment provisions of the contract. It establishes a single model for lease accounting based on the foundational principle that leases are financings of the right to use an underlying asset. Under this statement, a lessee is required to recognize a lease liability and an intangible right-to-use lease asset, and a lessor is required to recognize a lease receivable and a deferred inflow of resources. The Authority is currently evaluating the impact this standard will have on the financial statements when adopted. The provisions of this statement are effective for the Authority's financial statements for the year ending September 30, 2021. In March 2018, the GASB issued Statement No. 88, Certain Disclosures Related to Debt, Including Direct Borrowings and Direct Placements. This statement establishes criteria to improve the information that is disclosed in the notes to the government financial statements related to debt, including direct borrowings and direct placements. It also clarifies which liabilities governments should include when disclosing information related to debt. The Authority is currently evaluating the impact this standard will have on the financial statements when adopted. The provisions of this statement are effective for the Authority's financial statements for the year ending September 30, 2019. In June 2018, the GASB issued Statement No. 89, Accounting for Interest Cost Incurred Before the End of a Construction Period, which simplifies accounting for interest cost incurred before the end of construction and requires those costs to be expensed in the period incurred. As a result, interest

WAYNE COUNTY AIRPORT AUTHORITY
Notes to Basic Financial Statements
September 30, 2018
56
cost incurred before the end of a construction period will not be capitalized and included in the historical cost of a capital asset reported in a business-type activity or enterprise fund. This statement also reiterates that in financial statements prepared using the current financial resources measurement focus, interest cost incurred before the end of a construction period should be recognized as an expenditure on a basis consistent with governmental fund accounting principles. The requirements of the standard will be applied prospectively and result in increased interest expense during periods of construction. The provisions of this statement are effective for the Authority's financial statements for the September 30, 2021 fiscal year.

REQUIRED SUPPLEMENTARY INFORMATION

WAYNE COUNTY AIRPORT AUTHORITY
Required Supplementary Information
September 30, 2018
57
Schedule of Changes in the Authority’s Net Pension Liability and Related Ratios
Schedule of Contributions
For the measurement date September 30, 2017, the investment rate of return used was 7.25 percent which was the same as the previous year.
GASB Statement No. 68 was implemented on September 30, 2015 and does not require retroactive implementation. Data will be added as information is available until 10 years of such information is available.
Fiscal Year End:
Total Pension LiabilityService cost $ 2,078,813 $ 2,035,141 $ 1,910,254 $ 1,784,942Interest 11,459,580 10,943,315 10,408,880 10,007,566Changes in benefits - - - 1,083,361 Difference between expected and actual experience 913,793 3,004,584 2,360,317 - Changes in actuarial assumptions - 8,982,156 - - Benefit payments, including refunds (8,359,546) (7,901,621) (7,790,299) (7,621,347) Other 5,315 - - -
Net Change in Total Pension Liability 6,097,955 17,063,575 6,889,152 5,254,522
Total Pension Liability - Beginning of Year 161,200,880 144,137,305 137,248,153 131,993,631
Total Pension Liability - End of Year $ 167,298,835 $ 161,200,880 $ 144,137,305 $ 137,248,153
Plan Fiduciary Net PositionContributions - Employer $ 6,345,861 $ 11,021,191 $ 13,105,600 $ 8,475,718Contributions - Member 367,168 334,437 2,168,732 1,359,927Net investment income 13,119,125 10,247,311 786,957 8,502,195Administrative expenses (344,164) (318,694) (919,758) (319,237)Benefit payments, including refunds (8,359,546) (7,901,621) (7,790,299) (7,621,347)
Net Change in Plan Fiduciary Net Position 11,128,444 13,382,624 7,351,232 10,397,256
Plan Fiduciary Net Position - Beginning of Year 110,277,974 96,895,350 89,544,118 79,146,862
Plan Fiduciary Net Position - End of Year $ 121,406,418 $ 110,277,974 $ 96,895,350 $ 89,544,118
Authority's Net Pension Liability - Ending $ 45,892,417 $ 50,922,906 $ 47,241,955 $ 47,704,035
Plan Fiduciary Net Position as a % of Total Pension Liability 72.57% 68.41% 67.22% 65.24%
Covered Payroll $ 29,022,520 $ 30,105,635 $ 28,300,056 $ 27,197,880
Authority's Net Pension Liability as a % of Covered Payroll 158.13% 169.15% 166.93% 175.40%
2018 2017 2016 2015
Fiscal Year End:
Actuarially determined contribution $ 5,958,323 $ 6,924,296 $ 7,001,434 $ 5,782,269Contributions in relation to the actuarially determined contribution 6,345,861 11,021,191 13,105,600 8,475,718
Contribution Deficiency (Excess) $ (387,538) $ (4,096,895) $ (6,104,166) $ (2,693,449)
Covered Payroll $ 29,022,520 $ 30,105,635 $ 28,300,056 $ 27,197,880
Contributions as a Percentage of Covered Employee Payroll 21.87% 36.61% 46.31% 31.16%
2017 2016 20152018

WAYNE COUNTY AIRPORT AUTHORITY
Required Supplementary Information
September 30, 2018
58
Notes to Schedule of Authority Contributions
Valuation date
Methods and assumptions used to determine contribution rates
Actuarial cost method Entry Age Normal
Amortization method Level Dollar, Closed
Remaining amortization period 22 years decreased by two years annually
Asset valuation method 4-year smoothed market; 20% corridor
Wage inflation 3.00% as of September 30, 2016. Before that, 3.50%.
Salary increases
Investment rate of return 7.25% as of September 30, 2016. Before that, 7.75%.
Retirement age
Mortality
Cost of living adjustment None
Other Information
The investment rate of return was assumed to be 7.25% as of September 30, 2016. Before that, it was assumed to be 7.75%.
A new mortality table was used as of September 30, 2016. See "Mortality" section above for detail of mortality assumptions used as of September 30, 2016 and before.
Actuarially determined contribution rates are calculated as of September 30 each year,which is one period prior to the beginning of the fiscal year in which contributions arereported.
Experience-based table of rates that are specific to the type of eligibility condition.Last updated for the 2016 valuation pursuant to an experience study of the periodOctober 1, 2010 - September 30, 2015.
As of September 30, 2016: RP-2014 Healthy Annuitant Mortality table for males andfemales, adjusted for mortality improvement back to the base year of 2006. Mortalityrates for a particular calendar year are determined by applying the MP-2016 MortalityImprovement scale to the above described tables. The corresponding Disabled andEmployee tables were used for disability and pre-retirement mortality, respectively.Before September 30, 2016: RP-2000 Combined Healthy Mortality Table projected20 years. Set forward 5 years for disabled retirees.
3.00% to 13.15% including inflation as of September 30, 2016. Before that, 3.50% to 8.80% including inflation.

WAYNE COUNTY AIRPORT AUTHORITY
Required Supplementary Information
September 30, 2018
59
Schedule of Changes in the Authority’s Net OPEB Liability and Related Ratios
Schedule of OPEB Contributions
GASB Statement No. 75 was implemented September 30, 2018 and does not require retroactive implementation. Data will be added as information is available until 10 years of such information is available.
Fiscal Year End: 2018
Total OPEB LiabilityService cost $ 1,644,712Interest 8,092,952Changes in benefits - Difference between expected and actual experience (2,346,793)Changes in actuarial assumptions - Benefit payments, including refunds (1,875,930) Other -
Net Change in Total OPEB Liability 5,514,941
Total OPEB Liability - Beginning of Year 115,729,202
Total OPEB Liability - End of Year $ 121,244,143
Plan Fiduciary Net PositionContributions - Employer $ 9,573,821Net investment income 3,264,931Administrative expenses 0Benefit payments, including refunds (1,875,930)
Net Change in Plan Fiduciary Net Position 10,962,822
Plan Fiduciary Net Position - Beginning of Year 53,539,546
Plan Fiduciary Net Position - End of Year $ 64,502,368
Authority's Net OPEB Liability - Ending $ 56,741,775
Plan Fiduciary Net Position as a % of Total OPEB Liability 53.20%
Covered Employee Payroll $ 41,144,209
Net OPEB Liability 137.91%
Fiscal Year End: 2018
Actuarially determined contribution $ 6,885,604Contributions in relation to the actuarially determined contribution 9,573,821
Contribution Deficiency (Excess) $ (2,688,217)
Covered Employee Payroll $ 41,144,209
Contributions as a Percentage of Covered Payroll 23.27%

WAYNE COUNTY AIRPORT AUTHORITY
Required Supplementary Information
September 30, 2018
60
Notes to Schedule of Authority Contributions
Valuation date
Methods and assumptions used to determine contribution rates
Actuarial cost method Entry Age Normal
Amortization method Level Dollar
Remaining amortization period 24 years, Closed
Asset valuation method Market Value of Assets
Price inflation 2.50%
Wage inflation 3.00%
Salary increases 3.00% to 13.15%
Investment rate of return 7.00%, net of OPEB plan investment expense
Retirement age Experience-based table of rates that are specific to the type of eligibility condition.
Mortality
Healthcare trend rates Initial trend of 8.50% gradually decreasing to an ultimate trend rate of 3.50% in year 10.
Other Information
None
Actuarially determined contribution amounts for the year ended September 30, 2018 werebased on the September 30, 2017 actuarial valuation.
RP-2014 Healthy Annuitant Mortality table, adjusted back to the base year of 2006. Mortality rates are determined by applying the MP-2016 Mortality Improvement scale.

61
STATISTICAL SECTION
This section of the Wayne County Airport Authority’s comprehensive annual financial report presents detailed information as a context for understanding what the information in the financial statements, note disclosures, and required supplementary information says about the Authority’s overall financial health.
CONTENTS
Financial Trends – Exhibits S-1, S-2
These exhibits contain trend information to help the reader understand how the Authority’s financial performance and well-being have changed over time.
Revenue Capacity – Exhibits S-3, S-5
These exhibits contain information to help the reader assess the factors affecting the Authority’s ability to generate revenue.
Debt Capacity – Exhibits S-6 to S-8
These exhibits present information to help the reader assess the affordability of the Authority’s current levels of outstanding debt and the Authority's ability to issue additional debt in the future.
Demographic & Economic Information – Exhibits S-10 series
These exhibits offer demographic and economic indicators to help the reader understand the environment within which the Authority’s financial activities take place and to help make comparisons over time with other entities. In certain instances, due to the nature of the Authority’s operations, 10 years of data may not be necessary for readers to understand the Authority’s environment or to make comparisons with other entities. In these instances, less than 10 years of data may be presented.
Operating Information – Exhibits S-4, S-5, S-9, S-11, S-12
These exhibits contain information about the Authority’s operations and resources to help the reader understand how the Authority’s financial information relates to the services the Authority provides and the activities it performs. In the case of S-11 and S-12, due to the nature of the Authority’s operations, 10 years of data may not be necessary for readers to understand the Authority’s environment or to make comparisons with other entities. In these instances, less than 10 years of data may be presented.
Sources: Unless otherwise noted, the information in these exhibits is derived from the comprehensive annual financial reports of the relevant year.

62
2018 2017 2016 2015 2014 2013 2012 2011 2010 2009
Operating revenues:Airport landing and related fees $ 77,550,626 $ 80,160,100 $ 78,661,781 $ 73,888,139 $ 76,406,397 $ 65,493,268 $ 67,299,967 $ 69,099,578 $ 70,172,024 $ 60,059,740 Concession fees 68,950,984 64,702,113 61,820,000 57,615,102 54,161,908 51,696,676 51,689,387 50,575,848 47,974,977 48,424,882 Parking fees 80,248,186 76,706,962 74,497,683 68,017,761 61,187,198 57,828,811 56,091,494 54,145,257 48,309,486 49,911,261 Hotel 31,368,028 29,928,448 33,889,957 33,345,294 32,922,844 29,301,463 27,611,922 29,372,498 26,828,936 23,246,792 Rental facilities 112,099,910 106,121,745 104,913,627 107,356,129 105,234,040 103,155,137 107,353,758 96,449,901 91,822,952 90,110,146 Expense recoveries 5,096,397 5,026,053 4,812,705 4,722,477 5,027,074 5,282,902 4,927,372 5,010,457 4,445,747 4,535,773 Other 7,332,061 5,486,987 4,473,948 4,790,511 4,784,310 6,007,508 3,664,924 6,406,295 7,542,765 4,470,468
Total operating revenues 382,646,192 368,132,408 363,069,701 349,735,413 339,723,771 318,765,765 318,638,824 311,059,834 297,096,887 280,759,062
Nonoperating revenues:Passenger facility charges 69,774,131 68,128,397 66,764,363 63,840,589 62,016,364 61,705,013 62,134,255 62,197,495 60,305,754 59,711,453 Customer facility charges 4,548,815 4,442,148 4,260,370 304,510 — — — — — — Federal and state sources 6,650,317 6,655,554 5,568,130 1,339,342 1,029,619 1,353,122 1,378,911 1,326,034 1,264,891 1,089,499 Interest income and other 7,617,673 3,681,738 3,956,859 2,209,999 2,808,958 2,048,283 1,834,241 3,390,214 5,021,589 7,310,241
Total nonoperating revenues 88,590,936 82,907,837 80,549,722 67,694,440 65,854,941 65,106,418 65,347,407 66,913,743 66,592,234 68,111,193
Total revenues 471,237,128 451,040,245 443,619,423 417,429,853 405,578,712 383,872,183 383,986,231 377,973,577 363,689,121 348,870,255
Operating expenses:Salaries, wages, and fringe benefits 96,282,328 110,655,997 85,906,812 77,278,115 80,339,925 72,891,273 70,105,901 71,489,016 70,060,439 75,098,962 Parking management 8,404,763 7,986,688 7,908,549 7,882,292 6,630,160 6,280,332 6,048,290 6,794,062 6,504,949 7,082,235 Hotel management 19,775,235 18,049,328 22,357,224 18,793,497 23,063,942 21,064,105 20,888,610 22,644,120 20,032,541 18,693,537 Janitorial services 14,427,918 13,537,224 12,014,456 11,967,572 11,809,916 11,400,627 11,498,166 11,164,616 10,988,244 10,599,304 Security 6,031,481 5,149,362 3,745,339 2,557,818 2,511,402 2,260,167 2,288,013 2,401,473 2,293,067 2,657,120 Utilities 23,876,461 23,258,507 22,220,804 24,499,913 28,939,467 27,035,597 26,676,454 24,886,104 26,691,836 27,700,377 Repairs, professional services, and other 96,041,405 88,001,189 98,458,024 94,162,429 82,616,234 75,658,752 71,689,848 79,689,990 74,617,012 69,556,874 Depreciation 124,774,415 134,753,534 173,101,695 167,105,516 141,539,710 140,526,973 142,828,398 142,754,436 146,151,075 146,151,805
Total operating expenses 389,614,006 401,391,829 425,712,903 404,247,152 377,450,756 357,117,826 352,023,680 361,823,817 357,339,163 357,540,214
Nonoperating expenses:Interest expense 82,468,769 72,739,426 71,351,499 80,334,978 82,352,146 82,825,198 85,514,177 91,549,044 105,913,828 116,392,802 Loss on disposal of assets 2,399,305 8,209,718 9,513,323 1,564,607 1,016,927 5,488,973 2,555,076 — — 1,104,513 Amortization of bond insurance premiums 101,414 175,438 175,438 371,068 371,068 — — — — — Amortization of bond issuance costs — — — — — 1,968,924 2,035,607 1,902,952 2,161,678 1,942,959
Total nonoperating expenses 84,969,488 81,124,582 81,040,260 82,270,653 83,740,141 90,283,095 90,104,860 93,451,996 108,075,506 119,440,274
Total expenses 474,583,494 482,516,411 506,753,163 486,517,805 461,190,897 447,400,921 442,128,540 455,275,813 465,414,669 476,980,488
Capital contributions 389,653 7,278,160 32,953,269 8,560,699 32,679,821 41,637,536 27,121,478 17,750,671 29,137,352 36,318,566
Change in net position $ (2,956,713) $ (24,198,006) $ (30,180,471) $ (60,527,253) $ (22,932,364) $ (21,891,202) $ (31,020,831) $ (59,551,565) $ (72,588,196) $ (91,791,667)
Net position at year end composed of:Net investment in capital assets (118,242,129) (90,041,234) (97,448,351) (6,890,342) 39,760,424 27,234,267 36,778,052 86,906,586 120,302,294 151,759,863 Restricted 296,207,385 295,809,085 319,728,265 287,087,714 314,707,433 323,698,561 338,786,218 322,488,477 358,386,114 405,007,255 Unrestricted (31,572,178) (56,418,060) 19,224,185 (8,512,802) (22,256,034) 48,582,410 58,895,731 56,085,769 46,343,989 40,853,475
Total net position $ 146,393,078 4
149,349,791 $ 241,504,099 $ 271,684,570 3
332,211,823 2
399,515,238 $ 434,460,001 $ 465,480,832 $ 525,032,397 1
597,620,593
1 In 2010, the Authority restated beginning net position by $50,958,860. This amount less the increase/decrease in net position is used to arrive at ending net position.
2 In 2014, the Authority restated beginning net position by $13,053,561. This amount less the increase/decrease in net position is used to arrive at ending net position.
3 In 2015, the Authority restated beginning net position by $44,371,051. This amount less the increase/decrease in net position is used to arrive at ending net position.
4 In 2018, the Authority restated beginning net position by $67,956,302. This amount less the increase/decrease in net position is used to arrive at ending net position.
Source: Audited Financial Statements of the Wayne County Airport Authority.
See accompanying independent auditor's report.
WAYNE COUNTY AIRPORT AUTHORITY
Exhibit S-1
Annual Revenues, Expenses, and Changes in Net Position
(Unaudited)

63
2018 2017 2016 2015 2014 2013 2012 2011 2010 2009
Airline revenues:Airport landing and related fees $ 77,550,626 $ 80,160,100 $ 78,661,781 $ 73,888,139 $ 76,406,397 $ 65,493,268 $ 67,299,967 $ 69,099,578 $ 70,172,024 $ 60,059,740 Terminal building rentals and fees 84,929,354 82,231,045 84,580,455 86,816,124 85,169,050 84,354,836 86,463,382 74,347,911 71,852,635 67,703,125 Facility use fees 9,378,232 8,829,376 8,288,005 8,367,454 8,608,737 7,552,051 7,489,497 7,143,733 6,302,145 6,468,964
Total airline revenues 171,858,212 171,220,521 171,530,241 169,071,717 170,184,184 157,400,155 161,252,846 150,591,222 148,326,804 134,231,829
Percentage of total revenues 36.5% 38.0% 38.7% 40.5% 42.0% 41.0% 42.0% 39.8% 40.8% 38.5%
Non-Airline revenues:Parking fees 80,248,186 76,706,962 74,497,683 68,017,761 61,187,198 57,828,811 56,091,494 54,145,257 48,309,486 49,911,261 Concession fees 42,786,536 39,752,574 37,947,768 35,185,895 32,253,029 31,536,249 32,063,017 31,592,316 30,702,401 30,885,107 Car rental 26,164,448 24,949,539 23,872,232 22,429,207 21,908,879 20,160,427 19,626,370 18,983,532 17,272,576 17,539,775 Hotel 31,368,028 29,928,448 33,889,957 33,345,294 32,922,844 29,301,463 27,611,922 29,372,498 26,828,936 23,246,792 Employee shuttle bus 2,891,239 2,833,329 2,316,970 2,100,820 2,032,346 2,502,311 5,210,640 5,869,315 5,467,240 5,655,355 Ground transportation 10,199,443 7,813,795 5,125,120 5,428,501 5,452,612 5,094,540 4,882,553 4,944,291 4,738,700 6,510,045 Utility service fees 5,096,397 5,026,053 4,812,705 4,722,477 5,027,074 5,282,902 4,927,372 5,010,457 4,445,747 4,535,773 Rental facilities 4,701,642 4,414,200 4,603,077 4,643,230 3,971,295 3,651,399 3,307,686 4,144,651 3,462,232 3,772,657 Other 7,332,061 5,486,987 4,473,948 4,790,511 4,784,310 6,007,508 3,664,924 6,406,295 7,542,765 4,470,468
Total non-airline revenues 210,787,980 196,911,887 191,539,460 180,663,696 169,539,587 161,365,610 157,385,978 160,468,612 148,770,083 146,527,233
Percentage of total revenues 44.7% 43.7% 43.2% 43.3% 41.8% 42.0% 41.0% 42.5% 40.9% 42.0%
Nonoperating revenues:Passenger facility charges 69,774,131 68,128,397 66,764,363 63,840,589 62,016,364 61,705,013 62,134,255 62,197,495 60,305,754 59,711,453 Customer facility charges 4,548,815 4,442,148 4,260,370 304,510 — — — — — — Federal and state grants 6,650,317 6,655,554 5,568,130 1,339,342 1,029,619 1,353,122 1,378,911 1,326,034 1,264,891 1,089,499 Interest 7,617,673 3,567,954 3,856,859 1,454,197 1,388,246 1,616,192 1,810,277 3,241,109 4,941,344 7,310,241 Other — 113,784 100,000 755,802 1,420,712 432,091 23,964 149,105 80,245 —
Total nonoperating revenues 88,590,936 82,907,837 80,549,722 67,694,440 65,854,941 65,106,418 65,347,407 66,913,743 66,592,234 68,111,193
Percentage of total revenues 18.7% 18.3% 18.1% 16.2% 16.2% 17.0% 17.0% 17.7% 18.3% 19.5%
Total revenues $ 471,237,128 $ 451,040,245 $ 443,619,423 $ 417,429,853 $ 405,578,712 $ 383,872,183 $ 383,986,231 $ 377,973,577 $ 363,689,121 $ 348,870,255
Enplaned passengers 17,558,618 17,281,219 17,130,687 16,443,778 16,216,673 16,077,652 16,169,584 16,226,201 15,876,381 15,941,132
Total revenue per enplaned passenger $ 26.84 26.10 25.90 25.39 25.01 23.88 23.75 23.29 22.91 21.88
Airline revenue per enplaned passenger $ 9.79 9.91 10.01 10.28 10.49 9.79 9.97 9.28 9.34 8.42
Source: Audited Financial Statements of the Wayne County Airport Authority.
See accompanying independent auditor's report.
WAYNE COUNTY AIRPORT AUTHORITY
Exhibit S-2
Principal Revenue Sources and Revenues per Enplaned Passenger
(Unaudited)

64
2018 2017 2016 2015 2014 2013 2012 2011 2010 2009
Landing Fees:Signatory Airlines ¹ $ 3.48 3.65 3.62 3.54 3.71 3.14 3.23 3.26 3.44 2.83 Non-Signatory Airlines ² 4.35 4.56 4.52 4.43 4.64 3.93 4.04 4.08 4.30 3.39 General Aviation ³ 2.32 2.32 2.25 2.00 2.00 1.75 1.50 1.50 1.50 1.50
Facility Use Fees:South Terminal $ 5.50 5.50 5.50 5.50 5.50 5.00 5.00 5.00 5.00 5.00 North Terminal 5.50 5.50 5.50 5.50 5.50 5.00 5.00 5.00 5.00 5.00
Terminal Rental Rates (per SF per year):South Terminal - Signatory Airlines ¹ $ 60.32 56.81 56.90 58.74 60.00 57.71 60.00 57.70 54.51 52.00 South Terminal - Non-Signatory Airlines 69.37 65.33 65.44 67.55 69.00 66.36 69.00 69.00 68.00 60.00 North Terminal - Signatory Airlines ¹ 98.89 109.26 119.35 124.12 117.00 118.95 118.00 51.20 65.17 61.00 North Terminal - Non-Signatory Airlines 113.73 125.65 137.25 142.74 134.00 136.79 136.00 78.00 88.00 71.00 Cargo Building/Warehouse 8.00 8.00 8.00 8.00 8.00 8.00 8.00 8.00 8.00 8.00 Aircraft Ramp 0.96 0.96 0.96 0.96 0.96 0.96 0.96 0.96 0.96 0.96 Unimproved Land 0.31 0.31 0.31 0.31 0.31 0.31 0.31 0.31 0.31 0.31 Electric 4.67 4.67 4.67 4.67 4.67 4.67 4.67 4.67 4.67 1.24
** The revenue bases to which these rates are applied and their principal payers can be found in Schedules S-2 and S-4.
¹ Calculated pursuant to the formulas set forth in the Airport Use and Lease Agreement. The agreement provides the calculation of the annual landing fee and terminal rental rates, with rate adjustments at mid-year, if required.
² Average billed rate per 1,000 lbs. MGLW.
³ General aviation rates are charged at Willow Run Airport only and represent an average of the tiered rates applied per 1,000 lbs. MGLW.
Source: WCAA Finance Department Records
See accompanying independent auditor's report.
(Unaudited)
Airlines Rates and Charges **
Exhibit S-3
WAYNE COUNTY AIRPORT AUTHORITY

65
Landed Landed Landed Landed Landed Airline ¹ weights Share weights Share weights Share weights Share weights Share
Delta 10,584,280 48.2% 10,505,297 48.6% 10,616,006 49.5% 10,615,528 51.5% 10,273,955 50.4%
Delta (Sky West) 2,069,010 9.4 1,643,645 7.6 864,151 4.0 465,842 2.3 294,404 1.4Spirit Airlines 1,601,875 7.3 1,405,062 6.5 1,293,177 6.0 1,129,323 5.5 886,234 4.3
Delta (Endeavor) 5 1,315,655 6.0 1,439,231 6.7 1,960,734 9.1 1,824,960 8.8 2,523,978 12.4
Delta (GoJet) 1,253,053 5.7 888,262 4.1 271,737 1.3 128,707 0.6 190,615 0.9
Southwest/AirTran Airways 3 903,968 4.1 931,658 4.3 898,636 4.2 854,196 4.1 904,127 4.4
American/US Airways 7 785,679 3.6 855,276 4.0 861,963 4.0 843,916 4.1 842,150 4.1
Federal Express 496,174 2.3 470,760 2.2 483,114 2.3 479,295 2.3 493,528 2.4
United/Continental 4 244,621 1.1 275,721 1.3 209,604 1.0 136,885 0.7 100,958 0.5
Delta (Republic) 5 226,916 1.0 130,371 0.6 — — — — — —
United Parcel Service 221,034 1.0 189,156 0.9 179,533 0.8 175,421 0.9 170,445 0.8
United/Continental (Republic) 4 217,724 1.0 169,454 0.8 114,619 0.5 — — — —
Lufthansa 194,131 0.9 170,089 0.8 165,418 0.8 162,237 0.8 180,296 0.9
Delta (ExpressJet) 2 168,179 0.8 680,318 3.2 1,423,967 6.6 1,544,732 7.5 1,351,443 6.6
JetBlue Airways 167,276 0.8 162,534 0.8 168,108 0.8 129,654 0.6 — —
United/Continental (Mesa) 4 165,922 0.8 183,080 0.8 157,475 0.7 91,642 0.4 — —
Frontier 150,280 0.7 189,950 0.9 140,122 0.7 100,624 0.5 105,448 0.5
Air France 137,656 0.6 134,507 0.6 134,644 0.6 138,530 0.7 136,291 0.7
American/US Airways (Republic) 7 131,669 0.6 149,076 0.7 194,949 0.9 225,467 1.1 107,669 0.5
American/US Airways (PSA) 7 128,353 0.6 102,934 0.5 68,183 0.3 40,838 0.2 — —
American/US Airways (SkyWest) 7 123,201 0.5 76,389 0.4 — — — — — —
Alaska Airlines 117,327 0.5 76,993 0.4 65,210 0.3 55,208 0.3 — —
United/Continental (SkyWest) 4 77,164 0.4 53,126 0.2 73,679 0.4 69,752 0.3 33,738 0.2
DHL (Kalitta) 71,360 0.3 — — — — — — — —
DHL (Atlas) 61,808 0.3 118,096 0.5 119,608 0.6 — — — —
Air Canada (Air Georgian) 61,180 0.3 61,194 0.3 43,749 0.2 18,548 0.1 16,600 0.1
American/US Airways (Envoy) 6, 7 47,843 0.2 52,670 0.2 77,245 0.4 176,287 0.9 209,816 1.0
Aeromexico 41,408 0.2 30,883 0.1 — — — — — —
Royal Jordanian 39,520 0.2 38,380 0.2 39,520 0.2 38,257 0.2 40,645 0.2
Aeromexico Connect 27,353 0.1 — — — — — — — —
American/US Airways (Piedmont) 7 26,015 0.1 — — — — — — — —
United/Continental (GoJet) 4 24,522 0.1 7,705 — 36,917 0.2 46,297 0.2 45,091 0.2
Delta (Compass) — — 149,528 0.7 154,667 0.7 165,734 0.8 252,328 1.2
Virgin Atlantic Airways — — 61,014 0.3 135,699 0.6 49,683 0.2 — —
Delta (Shuttle America) — — 58,320 0.3 276,165 1.3 480,607 2.3 97,562 0.5
American/US Airways (Air Wisconsin) 7 — — 53,580 0.2 72,615 0.4 48,927 0.2 69,466 0.3
Delta (Chatauqua) — — — — — — 141,015 0.7 564,145 2.8
United/Continental (ExpressJet) 2, 4 — — — — — — 78,571 0.4 147,800 0.7
Lufthansa Cargo — — — — — — — — 17,657 0.1
Delta (Comair) — — — — — — — — — —
Mesaba — — — — — — — — — —
KLM — — — — — — — — — —
Other 8 77,313 0.3 87,553 0.3 165,380 0.6 168,969 0.8 326,312 1.9
Total 21,959,469 100.0% 21,601,812 100.0% 21,466,594 100.0% 20,625,652 100.0% 20,382,701 100.0%
¹ Signatory Affiliate Airlines are associated based on 2018 affiliations and shown in parentheses to major carrier name.All historical landed weights for these affiliates are shown on one line regardless of prior affiliations.
2 Atlantic Southwest Airlines acquired ExpressJet on November 22, 2011 and began operating as ExpressJet. For comparative purposes, entities are shown as one on this report. 3 Southwest Airlines acquired AirTran Airways on May 2, 2011 and for comparative purposes, are shown as one on this report.
4 Continental Airlines merged with and into United Airlines on October 1, 2010, and for comparative purposes, are shown as one on this report.
5 Effective August 1, 2013, Pinnacle Airlines changed its legal name to Endeavor Air. 6 Effective April 15, 2014, American Eagle changed its legal name to Envoy Air.7 US Airways merged with American Airlines on April 8, 2015 and, for comparative purposes, are shown as one on this report.8 Includes airlines no longer serving Detroit Metro or carriers with insignificant activity. Several airlines reported in the "Other" category in prior years have been reported
individually in the current year.
Source: WCAA Finance Department Records
See accompanying independent auditor's report. (Continued)
WAYNE COUNTY AIRPORT AUTHORITY
Exhibit S-4
Airline Landed Weights
(in thousands of pounds)
(Unaudited)
2018Detroit Metropolitan Airport
2017 201420152016

66
2009Landed Landed Landed Landed Landed weights Share weights Share weights Share weights Share weights Share
10,051,320 48.7% 9,655,644 46.9% 10,153,498 48.5% 10,369,432 51.4% 11,333,666 54.0%
— — — — — — — — — —765,188 3.7 749,026 3.6 752,623 3.6 637,083 3.2 690,048 3.3
3,661,163 17.7 3,237,417 15.7 2,743,336 13.1 2,817,713 14.0 2,616,584 12.5
— — — — — — — — — —
969,194 4.7 942,596 4.6 973,682 4.6 894,080 4.4 946,536 4.5
785,631 3.8 755,222 3.7 741,329 3.5 692,460 3.4 776,576 3.7
446,450 2.2 461,450 2.2 409,567 2.0 361,807 1.8 374,202 1.8
95,890 0.5 166,107 0.8 242,335 1.2 238,808 1.2 394,117 1.9
— — — — — — — — — —
167,762 0.8 168,483 0.8 171,832 0.8 171,234 0.8 171,687 0.8
— — — — — — — — — —
153,106 0.7 146,790 0.7 147,477 0.7 142,243 0.7 174,062 0.8
1,260,107 6.1 1,110,252 5.4 795,381 3.8 104,058 0.5 1,474 —
— — — — — — — — — —
— — — — — — — — — —
84,124 0.4 124,080 0.6 143,844 0.7 126,776 0.6 140,742 0.7
142,397 0.7 146,639 0.7 146,476 0.7 138,582 0.7 122,641 0.6
— — — — — — — — — —
— — — — — — — — — —
— — — — — — — — — —
— — — — — — — — — —
65,129 0.3 50,850 0.3 29,405 0.1 75,208 0.4 34,341 0.2
— — — — — — — — — —
— — — — — — — — — —
— — — — — — — — — —
207,170 1.0 195,133 0.9 180,815 0.9 193,235 1.0 155,625 0.7
— — — — — — — — — —
42,452 0.2 40,244 0.2 40,698 0.2 41,097 0.2 42,294 0.2
— — — — — — — — — —
— — — — — — — — — —
51,389 0.2 39,329 0.2 66,531 0.3 79,931 0.4 69,077 0.3
225,942 1.1 288,096 1.4 371,436 1.8 438,616 2.2 596,054 2.8
— — — — — — — — — —
139,035 0.7 221,668 1.1 — — — — — —
77,597 0.4 85,634 0.4 97,431 0.5 87,467 0.4 113,082 0.5
467,713 2.3 217,005 1.1 — — — — — —
— — — — — — — — — —
52,480 0.3 31,390 0.2 — — — — — —
— — 942,080 4.6 1,115,580 5.3 669,929 3.3 187,696 0.9
— — 144,408 0.7 872,731 4.2 1,202,839 6.0 1,484,510 7.1
— — — — — — — — 74,970 0.4
717,622 3.5 688,808 3.2 727,706 3.5 684,667 3.4 504,662 2.3
20,628,861 100.0% 20,608,351 100.0% 20,923,713 100.0% 20,167,265 100.0% 21,004,646 100.0%
Detroit Metropolitan Airport20112013 2012 2010

67
Passenger Passenger Passenger Passenger Passenger Airline ¹ enplanements Share enplanements Share enplanements Share enplanements Share enplanements Share
Domestic:
Alaska Airlines 103,328 0.59 72,380 0.42 66,040 0.39 57,636 0.35 — —
American/US Airways (Air Wisconsin) 7 2,541 0.01 45,400 0.26 63,898 0.37 34,465 0.21 57,178 0.35
American/US Airways (Envoy) 6, 7 44,557 0.25 44,914 0.26 67,414 0.39 136,328 0.83 169,854 1.05
American/US Airways (Mesa) 7 — — — — — — 13,713 0.08 29,246 0.18
American/US Airways (Piedmont) 7 25,553 0.14 8,985 0.05 3,621 0.02 — — — —
American/US Airways (PSA) 7 101,289 0.58 81,867 0.47 58,585 0.34 39,344 0.24 5,492 0.03
American/US Airways (Republic) 7 99,408 0.57 118,354 0.68 156,144 0.91 178,734 1.09 92,224 0.57
American/US Airways (SkyWest) 7 101,370 0.58 63,056 0.36 — — — — — —
American/US Airways 7 672,190 3.83 725,334 4.20 761,214 4.44 732,616 4.46 725,183 4.47
Delta (Chautauqua) — — — — — — 140,318 0.85 560,376 3.46
Delta (Comair) — — — — — — — — — —
Delta (Compass) — — 117,490 0.68 111,614 0.65 120,847 0.73 207,036 1.28
Delta (Endeavor) 4 1,117,394 6.36 1,223,918 7.08 1,677,874 9.79 1,556,601 9.46 2,159,842 13.32
Delta (ExpressJet) 3 137,411 0.78 547,541 3.17 1,150,700 6.72 1,276,020 7.76 1,098,157 6.77
Delta (GoJet) 1,056,632 6.02 745,286 4.31 230,733 1.35 107,108 0.65 160,650 0.99
Delta (Mesaba Aviation) — — — — — — — — — —
Delta (Republic) 193,050 1.10 111,888 0.65 — — — — — —
Delta (Shuttle America) — — 48,860 0.28 264,188 1.54 475,505 2.89 86,319 0.53
Delta (Sky West) 1,351,867 7.70 1,114,479 6.45 570,927 3.33 353,817 2.15 251,177 1.55
Delta Air Lines 7,534,271 42.91 7,456,453 43.15 7,486,766 43.70 7,249,879 44.09 6,856,076 42.28
Frontier 162,764 0.93 208,426 1.21 149,124 0.87 92,038 0.56 98,958 0.61
JetBlue Airways 141,241 0.80 142,117 0.82 146,799 0.86 105,591 0.64 — —
Southwest/Airtran Airlines 5 836,627 4.76 848,036 4.91 845,604 4.94 784,365 4.77 828,595 5.11
Spirit Airlines 1,607,113 9.15 1,424,905 8.25 1,289,024 7.52 1,096,225 6.67 875,463 5.40
United/Continental (ExpressJet) 2, 3 1,637 0.01 5,268 0.03 9,002 0.05 76,704 0.47 143,587 0.89
United/Continental (GoJet) 2 22,350 0.13 7,011 0.04 31,741 0.19 42,751 0.26 40,249 0.25
United/Continental (Mesa) 2 148,448 0.85 153,771 0.89 140,502 0.82 80,084 0.49 18,478 0.11
United/Continental (Republic) 2 183,134 1.04 124,655 0.72 92,302 0.54 — — — —
United/Continental (Skywest) 2 67,976 0.39 46,470 0.27 69,388 0.41 65,860 0.40 31,384 0.19
United/Continental Airlines 2 203,974 1.16 218,781 1.27 171,058 1.00 105,188 0.64 78,956 0.49
USA 3000 — — — — — — — — — —
Other 8 1,412 0.01 19,868 0.11 65,294 0.38 86,562 0.53 177,393 1.09
Total Domestic 15,917,537 90.65 15,725,513 90.99 15,679,556 91.52 15,008,299 91.27 14,751,873 90.97
International:
Aeromexico 29,317 0.17 19,954 0.12 — — — — — —
Aeromexico Connect 16,771 0.10 — — — — — — — —
Air Canada 45,462 0.26 40,781 0.24 32,392 0.19 23,980 0.15 21,253 0.13
Air France 75,679 0.43 71,462 0.41 71,642 0.42 75,576 0.46 73,512 0.45
American/US Airways 7 — — — — 566 — 520 — 1,256 0.01
Delta (Comair) — — — — — — — — — —
Delta (Compass) — — 5,841 0.03 18,703 0.11 17,102 0.10 8,691 0.05
Delta (Endeavor) 4 — — — — — — — — — —
Delta (Mesaba Aviation) — — — — — — — — — —
Delta Air Lines 1,315,807 7.49 1,275,473 7.38 1,161,607 6.78 1,178,621 7.17 1,226,121 7.56
KLM-Royal Dutch Airlines — — — — — — — — — —
Lufthansa 89,688 0.51 77,521 0.45 71,472 0.42 76,694 0.47 77,650 0.48
Royal Jordanian Airlines 16,163 0.09 14,937 0.09 13,403 0.08 12,225 0.07 14,755 0.09
Southwest/Airtran Airlines 5 — — — — — — — — 12,255 0.08
Spirit Airlines 36,024 0.21 28,806 0.17 22,575 0.13 22,457 0.14 22,986 0.14
Virgin Atlantic Airways — — 19,417 0.11 47,380 0.28 20,442 0.12 — —
WOW air 16,170 0.09 — — — — — — — —
Other 8 — — 1,514 0.01 11,391 0.07 7,862 0.05 6,321 0.04
Total International 1,641,081 9.35 1,555,706 9.01 1,451,131 8.48 1,435,479 8.73 1,464,800 9.03
Grand Total 17,558,618 100.00% 17,281,219 100.00% 17,130,687 100.00% 16,443,778 100.00% 16,216,673 100.00%
¹ Signatory Affiliate Airlines are associated based on 2018 affiliations and shown in parentheses to major carrier name.
All historical enplanements for these affiliates are shown on one line regardless of prior affiliations.2 Continental Airlines merged with and into United Airlines on October 1, 2010 and for comparative purposes, are shown as one in this report.
4 Effective August 1, 2013, Pinnacle Airlines changed its legal name to Endeavor Air. 5 Southwest Airlines acquired AirTran Airways on May 2, 2011 and for comparative purposes, are shown as one in this report.6 Effective April 15, 2014, American Eagle changed its legal name to Envoy Air.7 US Airways merged with American Airlines on April 8, 2015 and for comparative purposes, are shown as one in this report.8 Includes airlines no longer serving Detroit Metro or carriers with insignificant activity.
Source: WCAA Finance Department Records
See accompanying independent auditor's report. (Continued)
2018
3 Atlantic Southeast Airlines acquired ExpressJet on November 22, 2011 and began operating as ExpressJet. For comparative purposes, entities are shown as one in this report
WAYNE COUNTY AIRPORT AUTHORITY
Exhibit S-5
Enplaned Passengers
Detroit Metropolitan Airport
(Unaudited)
2017 20142016 2015

68
2009Passenger Passenger Passenger Passenger Passenger
enplanements Share enplanements Share enplanements Share enplanements Share enplanements Share
— — — — — — — — — —
63,752 0.40 71,394 0.44 81,860 0.50 76,414 0.48 95,658 0.60
169,407 1.05 162,633 1.01 154,136 0.95 161,692 1.02 125,766 0.79
26,173 0.16 37,154 0.23 19,074 0.12 22,387 0.14 22,640 0.14
— — — — — — — — — —
6,519 0.04 10,716 0.07 5,990 0.04 5,860 0.04 15,747 0.10
96,509 0.60 80,347 0.50 111,361 0.69 112,838 0.71 74,785 0.47
— — — — — — — — — —
662,355 4.12 635,870 3.95 616,654 3.80 588,264 3.70 660,549 4.15
448,754 2.79 217,573 1.35 168,194 1.04 95,086 0.60 4,798 0.03
— — 811,218 5.02 945,095 5.82 540,781 3.41 145,990 0.92
175,829 1.09 241,508 1.49 312,578 1.93 340,262 2.14 439,785 2.76
3,080,866 19.16 2,698,992 16.69 2,254,208 13.89 2,186,627 13.77 2,066,229 12.96
978,390 6.09 885,230 5.47 650,836 4.01 83,690 0.53 1,289 0.01
— — — — — — — — — —
— — 123,066 0.76 721,808 4.45 949,610 5.98 1,042,785 6.54
— — — — — — — — — —
121,712 0.76 190,663 1.18 85,863 0.53 4,462 0.03 10,599 0.07
— — — — — — — — — —
6,568,924 40.86 6,349,263 39.27 6,651,576 40.99 7,328,799 46.16 7,894,790 49.52
80,496 0.50 125,186 0.77 140,291 0.86 117,044 0.74 117,396 0.74
— — — — — — — — — —
832,772 5.18 842,732 5.21 813,744 5.02 755,276 4.76 742,389 4.65
755,169 4.70 711,134 4.40 703,335 4.33 558,596 3.52 591,150 3.71
130,342 0.81 123,199 0.76 112,402 0.69 118,001 0.74 63,765 0.40
44,311 0.28 34,532 0.21 57,089 0.35 66,206 0.42 56,837 0.36
42,346 0.26 43,702 0.27 19,733 0.12 29,999 0.19 47,908 0.30
— — — — — — — — — —
58,464 0.36 43,592 0.27 29,789 0.18 68,400 0.43 31,407 0.20
70,789 0.44 128,634 0.80 195,711 1.21 186,520 1.17 287,568 1.80
— — — — 153 — 2,226 0.01 19,823 0.12
251,438 1.56 233,942 1.45 61,052 0.37 215,005 1.36 62,738 0.40
14,665,317 91.21 14,802,280 91.57 14,912,532 91.89 14,614,045 92.05 14,622,391 91.74
— — — — — — — — 2,053 0.01
— — — — — — — — — —
17,156 0.11 14,887 0.09 12,340 0.08 6,875 0.04 5,956 0.04
77,751 0.48 82,675 0.51 76,568 0.47 70,685 0.45 55,233 0.35
1,302 0.01 1,459 0.01 1,493 0.01 1,997 0.01 1,853 0.01
— — — — — — 20,851 0.13 — —
— — — — — — 13,301 0.08 26,608 0.17
2,175 0.01 18,094 0.11 44,711 0.28 97,518 0.61 — —
— — — — 67 — 19,583 0.12 45,248 0.28
1,180,193 7.34 1,119,589 6.92 1,065,984 6.57 921,973 5.81 1,009,773 6.33
— — — — — — — — 40,196 0.25
66,977 0.42 64,854 0.40 67,952 0.42 65,568 0.41 72,884 0.46
14,334 0.09 15,143 0.09 14,051 0.09 15,258 0.10 14,822 0.09
11,120 0.07 10,295 0.06 11,436 0.07 5,849 0.04 271 —
22,669 0.14 23,339 0.14 15,579 0.10 12,274 0.08 16,928 0.11
— — — — — — — — — —
— — — — — — — — — —
18,658 0.12 16,969 0.10 3,488 0.02 10,604 0.07 26,916 0.16
1,412,335 8.79 1,367,304 8.43 1,313,669 8.11 1,262,336 7.95 1,318,741 8.26
16,077,652 100.00% 16,169,584 100.00% 16,226,201 100.00% 15,876,381 100.00% 15,941,132 100.00%
Detoit Metropolitan Airport20102012 20112013

69
Principal Interest ¹ Principal Interest ¹ Principal Interest ¹ Principal Interest ¹ Principal Interest ¹
Airport Revenue Bonds:Series 1994A $ — — — — — — — — — — Series 1996A — — — — — — — — — — Series 1996B — — — — — — — — — — Series 1998A — — — — — — — — — — Series 1998B — — — — — — — — — — Series 2001 Jr. Lien — — — — — — — — — — Series 2002C — — — — — — — — — — Series 2002D — — — — — — — — — — Series 2005 — — — — 257,075,000 539,025 196,950,000 22,271,263 11,720,000 23,153,925 Series 2007A Jr. Lien 157,970,000 — 4,230,000 7,870,983 3,985,000 8,080,440 3,795,000 8,278,108 3,615,000 8,466,358 Series 2007B 97,830,000 — 5,870,000 4,695,100 5,580,000 5,004,850 5,305,000 5,281,558 — 5,502,600 Series 2008A 5,470,000 5,215,250 5,390,000 5,501,725 5,305,000 5,783,957 5,225,000 6,061,768 5,155,000 6,335,469 Series 2008B — — — — — — — — — — Series 2008C — — — — — — — — — — Series 2008D — — — — — — — — — — Series 2008E — — — — — — — — — — Series 2008F — — — — — — — — — — Series 2009A — — — — — — — — — — Series 2010A 30,615,000 1,863,625 29,115,000 3,381,875 27,680,000 4,825,667 26,310,000 6,198,250 27,560,000 7,478,233 Series 2010B — — — — — — — — 4,800,000 40,000 Series 2010C 11,290,000 3,256,608 22,700,000 3,916,192 21,275,000 5,039,317 20,305,000 6,094,983 18,675,000 7,096,650 Series 2010D 2,630,000 655,841 2,490,000 786,175 2,380,000 909,759 2,310,000 1,028,175 2,165,000 1,135,250 Series 2010E-1 — — — — — — — — 75,275,000 17,663 Series 2010E-2 — — — — — — — — 74,895,000 21,997 Series 2010F — — — — — — — — 124,640,000 28,980 Series 2010G — — — — — — — — 115,760,000 106,848 Series 2011A — 7,296,000 — 7,296,000 — 7,296,000 — 7,296,000 — 7,296,000 Series 2011B 2,420,000 364,366 2,310,000 484,450 2,200,000 599,034 2,135,000 701,375 — 754,750 Series 2012A 3,480,000 8,728,250 100,000 8,873,750 — 8,876,250 — 8,876,250 — 8,876,250 Series 2012B 700,000 1,220,333 100,000 1,250,333 — 1,254,500 — 1,254,500 — 1,254,500 Series 2012C 235,000 31,966 225,000 40,925 220,000 47,650 215,000 54,225 2,230,000 70,750 Series 2012D 5,240,000 2,083,166 4,960,000 2,342,834 7,065,000 2,608,375 7,000,000 2,961,083 6,470,000 3,285,100 Series 2013A 199,070,000 693,963 330,000 2,619,794 330,000 1,953,055 280,000 1,654,399 — 1,494,922 Series 2013B 74,375,000 260,566 185,000 976,469 180,000 716,561 120,000 600,329 — 541,947 Series 2013C 114,610,000 411,754 370,000 1,551,374 365,000 1,151,923 270,000 973,334 — 880,323 Series 2014A 100,000 538,723 100,000 404,728 — 300,414 — 253,070 — 104,169 Series 2014B 100,000 3,312,125 — 3,314,625 — 3,314,625 — 3,072,166 — 619,958 Series 2014C 100,000 1,576,750 — 1,579,250 — 1,579,250 — 1,463,732 — 295,378 Series 2015A 16,770,000 915,244 16,220,000 1,193,771 — 1,458,931 — — — — Series 2015B — 2,037,000 — 2,037,000 — 2,093,583 — — — — Series 2015C — 961,500 — 961,500 — 988,208 — — — — Series 2015D — 10,653,500 — 12,996,670 — 7,896,028 — — — — Series 2015E — 387,750 — 452,375 — 308,046 — — — — Series 2015F — 11,207,750 — 11,207,750 — 10,771,893 — — — — Series 2015G 1,600,000 3,649,084 500,000 3,717,416 — 3,580,860 — — — — Series 2015H — 483,042 — 312,880 — 223,981 — — — — Series 2017A Sr — 2,452,210 — — — — — — — — Series 2017B Sr — 1,971,365 — — — — — — — — Series 2017C Sr — 3,798,283 — — — — — — — — Series 2017A Jr — 2,890,932 — — — — — — — — Series 2017B Jr — 2,231,661 — — — — — — — — Series 2017C Jr — 1,193,144 — — — — — — — — Series 2017D — 3,113,046 — — — — — — — — Series 2017E — 2,108,244 — — — — — — — — Series 2017F — 2,386,571 — — — — — — — —
Airport Hotel Bonds:Series 2001A — — — — 99,630,000 212,057 — — — —
Installment Purchase Contracts 337,782 86,345 779,704 108,657 747,395 129,884 774,760 150,941 818,958 173,405
Willow Run Notes Payable:Washtenaw County 19,476 — 19,474 — 19,476 — 19,476 — 19,476 — University of Michigan — — — — — — — — — —
Less: Bond Refundings ² (632,310,000) — — — (343,700,000) — (184,605,000) — (390,570,000) —
Totals $ 92,652,258 90,035,957 95,994,178 89,874,600 90,336,871 87,544,123 86,409,236 84,525,509 83,228,434 85,031,425
Airport Hotel (a)
Principal Interest ¹ Principal Interest ¹ Principal Interest ¹ Principal Interest ¹ Principal Interest ¹
Airport Hotel Bonds:Series 2001A $ — — — — — — — 5,089,375 — 5,089,375 Series 2001B — — — — — — 4,185,000 194,535 1,645,000 294,305
Less: Bond Refundings ² — — — — — — — — — —
Other Hotel Debt:Capital/FF&E Reserve Loan — — — — — — — — — — Working Capital Loan — — — — — — — — 1,500,000 80,000
Totals $ — — — — — — 4,185,000 5,283,910 3,145,000 5,463,680
¹ Interest does not include adjustments for capitalized interest, amortization of issuance costs, discount, premium,
or refunding costs, and arbitrage.
² Amount of debt service paid through issuance of refunding bonds.
(a) In October 2015, the Authority entered into a new hotel management agreement and the 2001A Hotel Bonds, which were special facility revenue bonds, were
refunded by the 2016G-H Airport Revenue Refunding Bonds. As a result, the operations of the Airport Hotel have been included with the operations of Detroit
Metro Airport (see Note 2 of 2016 financial statements for additional discussion).
Source: WCAA Finance Department Records
See accompanying independent auditor's report. (Continued)
WAYNE COUNTY AIRPORT AUTHORITY
Exhibit S-6
Debt Service Detail
(Unaudited)
Detroit Metropolitan and Willow Run Airports (a)2018
2018
2017
2017
2016 2015 2014
2016 2015 2014

70
Principal Interest ¹ Principal Interest ¹ Principal Interest ¹ Principal Interest ¹ Principal Interest ¹
— — — — — — — — 2,975,000 29,131 — — — — — — — — 39,710,000 — — — — — — — — — 39,710,000 — — — 188,455,000 2,369,208 523,050,000 13,903,092 21,400,000 36,492,050 20,280,000 37,614,200 — — — — 13,885,000 119,395 4,085,000 752,119 3,890,000 960,013 — — — — — — — — — 8,956,732
2,105,000 17,542 23,425,000 422,686 130,000 1,357,673 125,000 1,362,839 120,000 1,367,806 6,920,000 59,508 49,935,000 2,046,127 4,005,000 3,089,613 3,800,000 3,289,738 3,630,000 3,487,750
11,130,000 23,759,217 10,590,000 24,310,175 10,080,000 24,835,425 9,590,000 25,332,592 — 25,718,425 3,480,000 8,645,983 3,315,000 8,818,607 — 8,956,733 — 8,956,733 — 8,956,733 4,805,000 5,542,642 — 5,742,850 — 5,742,850 — 5,742,850 — 5,742,850 5,100,000 6,603,500 5,020,000 6,857,833 4,955,000 7,108,292 4,895,000 7,355,542 2,580,000 7,796,648
— — — — 196,450,000 105,706 4,800,000 658,931 — 2,884,226 — — — — 81,250,000 453,996 4,715,000 2,336,011 3,470,000 3,629,604 — — — — 33,375,000 222,333 3,800,000 1,154,563 2,500,000 1,708,255 — — — — 33,340,000 267,251 3,725,000 1,736,496 300,000 2,317,172 — — — — 33,375,000 266,992 3,730,000 1,705,727 300,000 2,280,328 — — — — — — 9,000,000 36,125 — 1,559
26,185,000 8,527,825 22,855,000 9,258,634 — 7,631,310 — — — — — 240,000 3,995,000 266,633 — 316,509 — — — —
16,990,000 8,016,358 15,270,000 8,762,450 — 7,088,049 — — — — 2,055,000 1,196,225 1,940,000 1,235,325 — 997,163 — — — —
85,000 104,432 — 123,572 — 128,462 — — — — 105,000 97,698 — 115,477 — 121,786 — — — —
— 171,296 — 190,434 — 192,729 — — — — 240,000 1,279,419 — 1,326,022 — 1,031,784 — — — —
— 7,296,000 — 6,100,267 — — — — — — — 754,750 — 631,055 — — — — — — — 8,900,906 — 591,750 — — — — — — — 1,257,985 — 83,633 — — — — — — — 126,852 — 8,433 — — — — — — — 3,456,425 — 229,790 — — — — — — — — — — — — — — — — — — — — — — — — — — — — — — — — — — — — — — — — — — — — — — — — — — — — — — — — — — — — — — — — — — — — — — — — — — — — — — — — — — — — — — — — — — — — — — — — — — — — — — — — — — — — — — — — — — — — — — — — — — — — — — — — — — — — — — — — — — — — — — — — — — — — — — — — — — — — — — — — — — — — — — — — — — — — — — — — — — — — — — — — — — — — — — — — — — — — — — — — — — — — — — — — — — — — — — — — — — — — — — — — — — — — — — — — — — — —
— — — — — — — — — —
846,437 198,465 400,464 179,411 2,253,902 257,251 2,245,693 378,987 2,018,534 490,406
19,476 — 19,476 — 19,476 — 19,475 — 19,475 — 401,148 24,251 7,543 32,682 3,038 37,186 8,144 32,081 5,492 34,733
— — (255,600,000) — (866,085,000) — — — (74,770,000) —
80,467,061 86,277,279 69,627,483 79,703,054 70,086,416 84,231,580 75,938,312 97,323,384 46,738,501 113,976,571
Principal Interest ¹ Principal Interest ¹ Principal Interest ¹ Principal Interest ¹ Principal Interest ¹
— 5,089,375 — 5,089,375 — 5,089,375 — 5,089,375 — 5,089,375 1,480,000 401,060 1,200,000 494,860 980,000 566,905 765,000 624,908 590,000 669,745
— — — — — — — — — —
2,922,147 93,522 439,308 253,040 405,640 286,708 374,553 317,796 345,848 346,501 — 120,000 — 120,000 — 120,000 — 120,000 — 120,000
4,402,147 5,703,957 1,639,308 5,957,275 1,385,640 6,062,988 1,139,553 6,152,079 935,848 6,225,621
Detroit Metropolitan and Willow Run Airports (a)200920102011
2011
20122013
2010 2009Airport Hotel (a)
2013 2012

71
WAYNE COUNTY AIRPORT AUTHORITY
Exhibit S-7
Revenue Coverage
(Unaudited)
2018 2017 2016 2015 2014 2013 2012 2011 2010 2009
Detroit Metro and Willow Run Airports (a)Net revenues:
Operating revenues $ 382,646,192 $ 368,132,408 $ 363,069,701 $ 316,390,119 $ 306,800,927 $ 289,464,302 $ 291,026,902 $ 281,687,336 $ 270,267,951 $ 257,512,270 Interest income and other 7,617,673 3,681,738 3,956,859 2,157,671 2,789,211 2,026,745 1,798,471 3,354,863 4,992,574 7,143,858 Federal and state sources 6,650,317 6,655,554 5,568,130 1,339,342 1,029,619 1,353,122 1,378,911 1,326,034 1,264,891 1,089,499 Passenger facility charges 69,774,131 68,128,397 66,764,363 63,840,589 62,016,364 61,705,013 62,134,255 62,197,495 60,305,754 59,711,453 Customer facility charges 4,548,815 4,442,148 4,260,370 304,510 — — — — — —
Total revenues 471,237,128 451,040,245 443,619,423 384,032,231 372,636,121 354,549,182 356,338,539 348,565,728 336,831,170 325,457,080
Less operating expenses, not including depreciation (264,839,591) (266,638,295) (252,611,208) (218,348,139) (212,847,104) (195,526,748) (188,306,672) (196,428,761) (191,159,047) (192,698,372)
Net revenues 206,397,537 184,401,950 191,008,215 165,684,092 159,789,017 159,022,434 168,031,867 152,136,967 145,672,123 132,758,708
Net debt service:Principal ³ 92,652,258 95,994,178 90,336,871 86,409,236 83,228,434 80,467,061 69,627,483 70,086,416 75,938,312 46,738,501 Interest ¹ 90,035,957 89,874,600 87,544,123 84,525,509 85,031,425 86,277,279 79,703,054 84,231,580 97,323,384 105,019,840
Net debt service 182,688,215 185,868,778 177,880,994 170,934,745 168,259,859 166,744,340 149,330,537 154,317,996 173,261,696 151,758,341
Debt Service Coverage ² 1.13 0.99 1.07 0.97 0.95 0.95 1.13 0.99 0.84 0.87
Pledged Revenue Coverage – Airport Hotel (a)Net revenues:
Operating revenues — — — 33,345,294 32,922,844 29,301,463 27,611,922 29,372,498 26,828,936 23,246,792 Interest income and other — — — 52,328 19,747 21,538 43,320 35,351 29,015 166,383
Total revenues — — — 33,397,622 32,942,591 29,323,001 27,655,242 29,407,849 26,857,951 23,413,175
Less operating expenses, not including depreciation — — — (18,793,497) (23,063,942) (21,064,105) (20,888,610) (22,640,620) (20,029,041) (18,690,037)
Net revenues — — — 14,604,125 9,878,649 8,258,896 6,766,632 6,767,229 6,828,910 4,723,138
Net debt service:Principal — — — 4,185,000 3,145,000 4,402,147 1,639,308 1,385,640 1,139,553 935,848 Interest ¹ — — — 5,283,910 5,463,680 5,703,957 5,957,275 6,062,988 6,152,079 6,225,621
Net debt service — — — 9,468,910 8,608,680 10,106,104 7,596,583 7,448,628 7,291,632 7,161,469
Debt Service Coverage ² — — — 1.54 1.15 0.82 0.89 0.91 0.94 0.66
Combined net debt service:Principal 92,652,258 95,994,178 90,336,871 90,594,236 86,373,434 84,869,208 71,266,791 71,472,056 77,077,865 47,674,349 Interest ¹ 90,035,957 89,874,600 87,544,123 89,809,419 90,495,105 91,981,236 85,660,329 90,294,568 103,475,463 111,245,461
Total combined net debt service $ 182,688,215 $ 185,868,778 $ 177,880,994 $ 180,403,655 $ 176,868,539 $ 176,850,444 $ 156,927,120 $ 161,766,624 $ 180,553,328 $ 158,919,810
Notes: The Authority has pledged all net Airport revenues solely for the payment of the Airport Revenue Bonds and the Parity Obligations, and a statutory first lien has been granted upon all net revenues for such purpose.
¹ Interest does not include adjustments for capitalized interest, amortization of issuance costs/ bond insurance premiums, discount, premium, refunding costs, or arbitrage.
² Coverage calculations presented in this schedule differ from those required by the Master Bond Ordinance and all series ordinances as shown in the Continuing Disclosures.
³ Principal payments do not include bond refunding payoffs.
(a) In October 2015, the Authority entered into a new hotel agreement and the 2001A Hotel Bonds, which were special facility bonds, were refunded by the 2016G-H Aiport RevenueRefunding Bonds. As a result, the operations of the Airport Hotel have been included with the operations of Detroit Metro Airport (see Note 2 of 2016 financial statements foradditional discussion).
Source: WCAA Finance Department Records
See accompanying independent auditor's report.
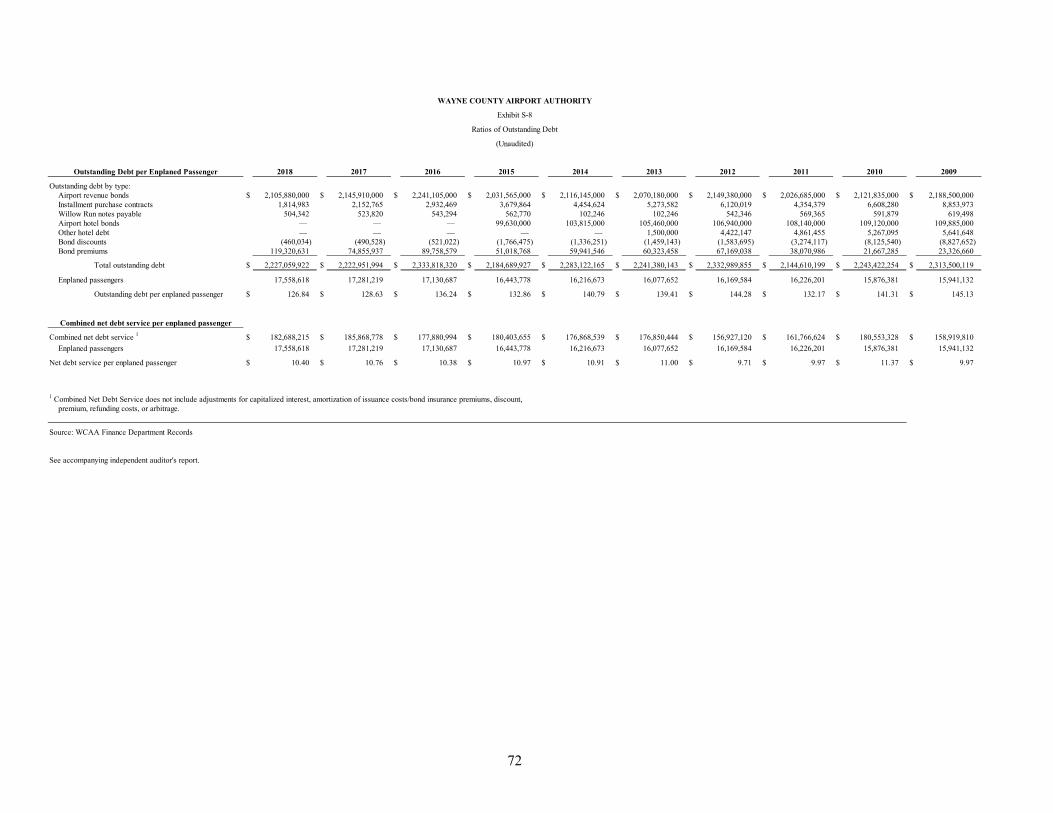
72
WAYNE COUNTY AIRPORT AUTHORITY
Exhibit S-8
Ratios of Outstanding Debt
(Unaudited)
Outstanding Debt per Enplaned Passenger 2018 2017 2016 2015 2014 2013 2012 2011 2010 2009
Outstanding debt by type: Airport revenue bonds $ 2,105,880,000 $ 2,145,910,000 $ 2,241,105,000 $ 2,031,565,000 $ 2,116,145,000 $ 2,070,180,000 $ 2,149,380,000 $ 2,026,685,000 $ 2,121,835,000 $ 2,188,500,000 Installment purchase contracts 1,814,983 2,152,765 2,932,469 3,679,864 4,454,624 5,273,582 6,120,019 4,354,379 6,608,280 8,853,973 Willow Run notes payable 504,342 523,820 543,294 562,770 102,246 102,246 542,346 569,365 591,879 619,498 Airport hotel bonds — — — 99,630,000 103,815,000 105,460,000 106,940,000 108,140,000 109,120,000 109,885,000 Other hotel debt — — — — — 1,500,000 4,422,147 4,861,455 5,267,095 5,641,648 Bond discounts (460,034) (490,528) (521,022) (1,766,475) (1,336,251) (1,459,143) (1,583,695) (3,274,117) (8,125,540) (8,827,652) Bond premiums 119,320,631 74,855,937 89,758,579 51,018,768 59,941,546 60,323,458 67,169,038 38,070,986 21,667,285 23,326,660
Total outstanding debt $ 2,227,059,922 $ 2,222,951,994 $ 2,333,818,320 $ 2,184,689,927 $ 2,283,122,165 $ 2,241,380,143 $ 2,332,989,855 $ 2,144,610,199 $ 2,243,422,254 $ 2,313,500,119
Enplaned passengers 17,558,618 17,281,219 17,130,687 16,443,778 16,216,673 16,077,652 16,169,584 16,226,201 15,876,381 15,941,132
Outstanding debt per enplaned passenger $ 126.84 $ 128.63 $ 136.24 $ 132.86 $ 140.79 $ 139.41 $ 144.28 $ 132.17 $ 141.31 $ 145.13
Combined net debt service per enplaned passenger
Combined net debt service 1 $ 182,688,215 $ 185,868,778 $ 177,880,994 $ 180,403,655 $ 176,868,539 $ 176,850,444 $ 156,927,120 $ 161,766,624 $ 180,553,328 $ 158,919,810
Enplaned passengers 17,558,618 17,281,219 17,130,687 16,443,778 16,216,673 16,077,652 16,169,584 16,226,201 15,876,381 15,941,132
Net debt service per enplaned passenger $ 10.40 $ 10.76 $ 10.38 $ 10.97 $ 10.91 $ 11.00 $ 9.71 $ 9.97 $ 11.37 $ 9.97
1 Combined Net Debt Service does not include adjustments for capitalized interest, amortization of issuance costs/bond insurance premiums, discount, premium, refunding costs, or arbitrage.
Source: WCAA Finance Department Records
See accompanying independent auditor's report.

73
2018 2017 2016 2015 2014 2013 2012 2011 2010 2009
Administration 15 12 10 11 9 8 8 16 11 15 Internal Audit 3 3 3 3 3 3 3 3 2 2 Legal 5 5 5 5 5 5 5 5 5 5 Finance 28 33 33 32 33 32 31 34 35 31 Information Technology/Telecommunications 20 20 17 18 15 14 12 13 14 14 Procurement/Business Diversity 16 16 19 16 15 14 14 18 24 20 Human Resources 12 12 13 13 11 11 11 14 12 14 Maintenance/Facilities 245 235 216 196 199 194 192 206 204 203 Airfield Operations 47 47 47 42 40 39 40 44 44 44 Public Safety 231 224 223 205 204 203 204 209 207 207 Planning & Development 30 29 32 31 25 28 24 19 17 16 Business Development 45 46 41 37 37 32 33 34 35 37 Willow Run 14 13 13 11 11 11 11 11 11 11
Totals 711 695 672 620 607 594 588 626 621 619
* Represents both filled and budget-approved full-time positions as of each fiscal year end. Headcount actuals are lower due to employee turnover and amount of available positions at different times during the year.
Source: WCAA Finance Department Records
See accompanying independent auditor's report.
WAYNE COUNTY AIRPORT AUTHORITY
Exhibit S-9
Authority Employees
(Unaudited)
Authority Full-Time Positions *

74
Exhibit S-10: Demographic and Economic Information Wayne County Airport Authority (the Authority) is a regional entity that spans multiple jurisdictions. The Authority has operational jurisdiction of Detroit Metropolitan Wayne County Airport (DTW) and Willow Run Airport (YIP), as well as an Airport Hotel. Detroit Metropolitan Wayne County Airport is a major commercial airport located in Romulus, Michigan classified a large hub by the FAA with 1 percent or more of total U.S. passengers enplaned. As of 2017, Detroit Metro Airport is the seventeenth busiest airport in the United States and the thirty-third busiest airport in the world. Nearby to DTW is the smaller non-commercial airport Willow Run that serves freight, corporate, and general aviation clients. Together, these airports serve a Primary Air Trade Area commonly referred to as Metropolitan Detroit (Metro Detroit). The United States Office of Management and Budget (OMB) defines the six counties of Lapeer, Livingston, Macomb, Oakland, St. Clair and Wayne the Detroit-Warren-Dearborn Metropolitan Statistical Area (MSA). Further, the larger OMB designated Detroit-Warren-Ann Arbor Combined Statistical Area (CSA) incorporates both the above MSA and the counties of Genesee, Lapeer, Lenawee and Monroe. This area is defined based on commuting patterns and results in the ten-county labor market region of Metro Detroit with a population of 5.3 million as of the 2010 census. Detroit Metro Airport also serves the Toledo, Ohio, area, which is located approximately 47 miles south of the airport, and the city of Windsor, Ontario in nearby Canada. The Total Air Trade Area incorporates these regions along with the Primary Air Trade Area of Metro Detroit.
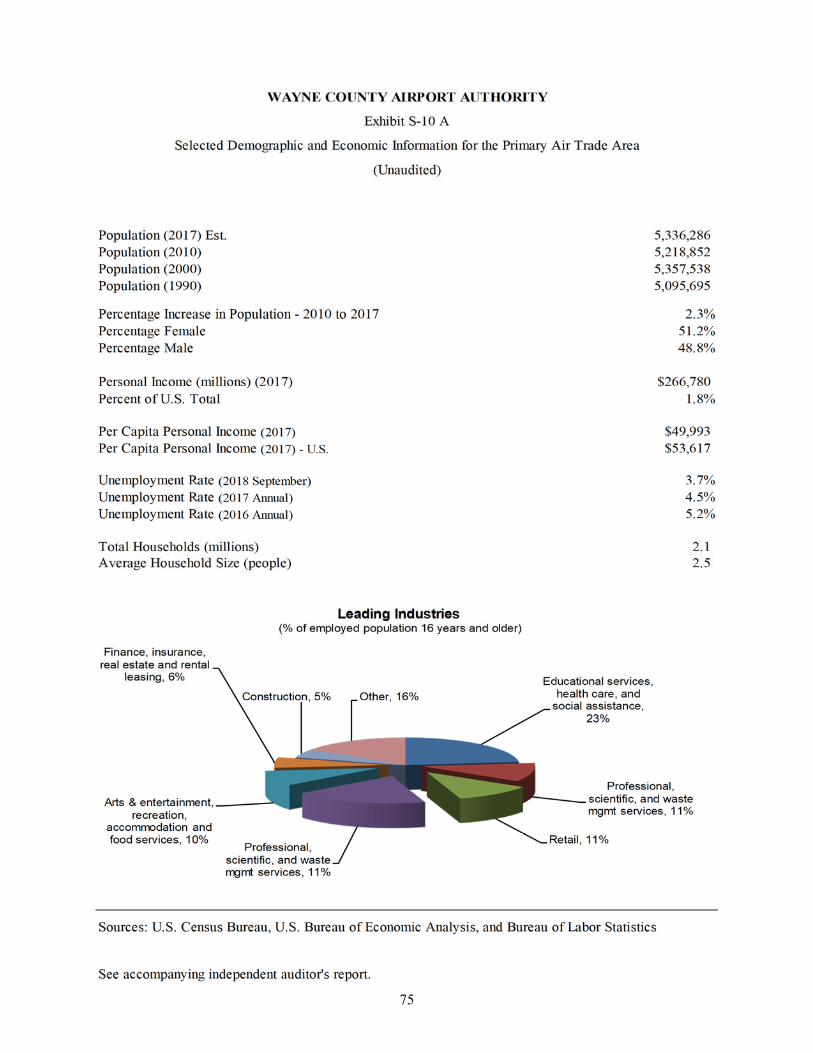
75

76
WAYNE COUNTY AIRPORT AUTHORITY
Exhibit S-10 B
Principal Employers in Primary Air Trade Area
(Unaudited)
Metro Employees
Metro Employees Percentage (%) Type of
Employer City 2018 * 2017 ** Change Business
Ford Motor Co. Dearborn 48,000 48,000 0.0% Automobile ManufacturerGeneral Motors Corp. Detroit 37,400 37,713 -0.8% Automobile ManufacturerFCA US LLC Auburn Hills 35,399 32,514 8.9% Automobile ManufacturerUniversity of Michigan Ann Arbor 34,067 32,749 4.0% Public University & Health Care SystemBeaumont Health Southfield 28,012 28,038 -0.1% Health Care SystemHenry Ford Health System Detroit 23,724 17,608 34.7% Health Care SystemU.S. Government Detroit 18,817 18,920 -0.5% Federal GovernmentRock Ventures Detroit 17,819 16,617 7.2% Financial Services/Real EstateTrinity Health Michigan Livonia 15,899 14,676 8.3% Health Care SystemAscension Michigan Warren 11,893 11,893 0.0% Health Care System
* Data as of July 2018
** Data as of July 2017
Source: Crain’s Detroit Business, December 24, 2018
See accompanying independent auditor's report.

77
WAYNE COUNTY AIRPORT AUTHORITY
Exhibit S-11
Airport Information
(Unaudited)
Detroit Metropolitan Airport
Location: 20 miles southwest of Detroit in the city of Romulus
Area: 7,348 acres
Airport Code: DTW
Runways: 3R/21L3L/21R9R/27L9L/27R4R/22L4L/22R
Terminal: McNamara Terminal Airlines 911,853 sq ftNorth Terminal Airlines 218,454 sq ft (b)Tenants/Concessionaires 223,027 sq ft (b)TSA/FIS 245,924 sq ftPublic/Common 1,607,233 sq ft (b)
Number of In-Service Passenger Gates 130 Number of Concessionaires 30 (b)Number of Rental Car Agencies On-Airport 6
Airfield: Runways 15,320,346 sq ftTaxiways 28,825,764 sq ft (a)Aprons 21,568,712 sq ft (a)
Parking: Spaces Available:McNamara Parking Structure 10,117 Big Blue Deck and Short-Term 6,530 Green Lot 1 1,517 Green Lot 2 900
19,064 spaces
Cargo: Cargo/Hangar Buildings 1,113,912 sq ft
International: Customs/Immigration F.I.S. Facility
Tower(s): AIR TRAFFIC CONTROL TOWER 24/7/365Delta Air Lines Ramp Control Tower 24/7/365North Terminal Ramp Control Tower 24/7/365
FBO(s): Signature Flight Support
(a) These totals have changed from the prior year due to physical inventory reconciliation and construction activity.(b) These numbers changed from the prior year due to changes in agreements.
Source: WCAA Finance Department Records
See accompanying independent auditor's report.

78
WAYNE COUNTY AIRPORT AUTHORITY
Exhibit S-12
Airport Information
(Unaudited)
Willow Run Airport
Location:
Area: 2,360 acres
Airport Code: YIP
Runways: 5L/23R5R/23L9/27
Airfield: Runways 3,147,605 sq ftTaxiways 4,282,931 sq ftRamps/Aprons 5,099,776 sq ft (a)
Corporate/Private Space: Hangar 396,000 sq ft (b)Tenants Other 68,600 sq ft (b)T-Hangars (qty. 110) 44,800 sq ft
Number of Rental Car Agencies On-Airport 1
Additional Space: WCAA Admin, Maintenance, Ops, Public Safety 56,200 sq ftYankee Air Museum 53,400 sq ftFAA 35,000 sq ft
International: U.S. Customs (user fee airport)
Tower: FAA 24/7
FBOs: AvflightOdyssey Aviation
(a) These totals have changed from the prior year due to physical inventory reconciliation and construction activity.
(b) These numbers changed from the prior year due to changes in agreements.
Source: WCAA Finance Department Records
See accompanying independent auditor's report.
7 miles west of Detroit Metropolitan Airport bordering on Wayne and Washtenaw Counties
79
DETROIT METROPOLITAN WAYNE COUNTY AIRPORT
Documents Incorporated By Reference
Operating Years Ended September 30, 2018
Document Part of CAFR into which incorporated
Portions of the following documents are incorporated herein by reference into sections of the Comprehensive Annual Financial Report (CAFR) as indicated:
Official Statement, $169,800,000 Wayne County Airport Authority Airport Revenue Bonds, Series 2017A-C; and Wayne County Authority Airport Revenue Refunding Bonds, Junior Lien, Series 2017A-B Continuing Disclosures

80
DETROIT METROPOLITAN WAYNE COUNTY AIRPORT
Continuing Disclosure Table #1
Debt Service Requirements and Coverage
Operating Year 2018
(Unaudited)
Netrevenues,revenue
fund balance,and other Total debtavailable service Debt Airline costmonies requirements service per enplaned
(thousands) (thousands) coverage passenger
Senior Lien 247,038$ 174,462$ 1.42 9.70$
Total Senior Lien and Junior Lien 247,038$ 185,652$ 1.33 9.70$
Source: Wayne County Airport Authority
See accompanying independent auditor's report.

81
DETROIT METROPOLITAN WAYNE COUNTY AIRPORT
Continuing Disclosure Table #2
Operation and Maintenance Expenses
Operating years ending September 30
(In thousands of dollars, except as noted)
(Unaudited)
Description 2018 2017 2016 2015 2014
Salaries and wages $ 58,693 $ 57,511 $ 52,684 $ 49,221 $ 46,661 Employee benefits 35,840 28,720 35,497 34,357 27,027
94,533 86,231 88,181 83,578 73,688
Contractual services:Parking management 8,405 7,987 7,909 7,882 6,630 Hotel management (a) 19,702 18,612 22,678 — — Security expenses 6,031 5,149 3,745 2,558 2,511 Janitorial services 14,406 13,515 11,992 11,948 11,792 Shuttle bus 6,849 8,169 7,194 6,540 6,123 Other services 27,920 23,893 24,870 19,811 24,352
Total contractual services 83,313 77,325 78,388 48,739 51,408
Wayne County administrative services 123 86 103 159 138 Repairs and maintenance 33,039 32,251 33,123 32,567 31,144 Supplies and other operating expenses 14,740 13,921 13,791 13,252 12,511 Insurance 1,902 2,049 2,075 2,145 2,200 Utilities 23,388 22,947 21,939 24,105 28,441 Rentals 182 123 113 720 718 Interest expense and paying agent fees 109 121 92 107 182 Capital expenses 8,816 13,216 10,874 6,311 3,371
82,299 84,714 82,110 79,366 78,705
Total O&M expenses $ 260,145 $ 248,270 $ 248,679 $ 211,683 $ 203,801
(a) On October 15, 2015, the Authority entered into a new hotel management agreement and the 2001A Hotel Bonds, whichwere special facility revenue bonds, were refunded by the 2016G-H Airport Revenue Refunding Bonds. As a result, asof October 15, 2015, the net revenues of the Hotel are included in the Net Revenues pledged toward the repayment ofall the Authority's general airport revenue bonds and hotel management expenses are included in the Authority's operationand management expenses. At this time, all outstanding bonds, including the 2016G-H Airport Revenue Refunding Bonds,are all general airport revenue bonds.
Source: Wayne County Airport Authority
See accompanying independent auditor's report.
Historical

82
DETROIT METROPOLITAN WAYNE COUNTY AIRPORT
Continuing Disclosure Table #3
Operating Revenues
Operating years ending September 30
(In thousands of dollars, except as noted)
(Unaudited)
Description 2018 2017 2016 2015 2014
Airline revenues:Rental and use fees:
Terminal building rentals and fees $ 63,641 $ 60,688 $ 61,227 $ 62,776 $ 63,523 Common-use/shared-use area rentals 23,770 22,632 24,161 26,779 25,988 Debt service recapture 988 1,109 1,718 1,718 1,718 Facilities use fees 8,877 8,475 8,036 8,065 8,361 Less rental fee adjustment (3,666) (2,447) (2,820) (4,859) (6,313)
Total rental and use fees 93,610 90,457 92,322 94,479 93,277
Activity fees:Signatory airlines 77,092 76,305 75,525 72,369 75,360 Nonsignatory airlines 3,151 3,832 3,452 1,967 1,393 Less rental fee adjustment (3,505) (643) (931) (1,069) (973)
Total activity fees 76,738 79,494 78,046 73,267 75,780
Total airline revenues 170,348 169,951 170,368 167,746 169,057
Nonairline revenues:Concessions:
Automobile parking 80,248 76,707 74,498 68,018 61,187 Hotel (b) 31,368 29,928 33,890 — — Rental car 26,164 24,949 23,872 22,429 21,909 Food and beverage 20,703 19,427 18,016 14,149 12,948 Retail 14,734 13,296 12,745 13,347 12,526 Marketing and communications 1,721 1,566 1,635 2,235 2,388 Other concessions 5,141 5,001 5,110 5,057 4,012
Total concessions 180,079 170,874 169,766 125,235 114,970
Rentals 3,673 3,422 3,666 3,654 2,975 Utility fees 4,970 4,903 4,691 4,601 4,904 Interest income 792 337 162 110 76 Ground transportation 10,199 7,814 5,125 5,428 5,453 Other (a) 9,437 9,506 8,951 7,780 7,186
Total nonairline revenues 209,150 196,856 192,361 146,808 135,564
Total operating revenues $ 379,498 $ 366,807 $ 362,729 $ 314,554 $ 304,621
(a) Includes shuttle bus revenue, badging fees, miscellaneous fees, chargebacks, insurance recoveries, and state and federal grants
(b) On October 15, 2015, the Authority entered into a new hotel management agreement and the 2001A Hotel Bonds, whichwere special facility revenue bonds, were refunded by the 2016G-H Airport Revenue Refunding Bonds. As a result, asof October 15, 2015, the net revenues of the Hotel are included in the Net Revenues pledged toward the repayment ofall the Authority's general airport revenue bonds and hotel management expenses are included in the Authority's operationand management expenses. At this time, all outstanding bonds, including the 2016G-H Airport Revenue Refunding Bonds,are all general airport revenue bonds.
Source: Wayne County Airport Authority
See accompanying independent auditor's report.
Historical

83
DETROIT METROPOLITAN WAYNE COUNTY AIRPORT
Continuing Disclosure Table #4
Application of Revenues
Operating years ending September 30
(In thousands of dollars, except as noted)
(Unaudited)
2018 2017 2016 2015 2014
Revenues:Airline revenues $ 170,348 $ 169,951 $ 170,368 $ 167,746 $ 169,057 Nonairline revenues 209,150 196,856 192,361 146,808 135,564 Interest income generated in bond funds and reserves 5,415 5,649 8,091 12,705 7,056
Other available monies:PFC contributions 73,174 66,473 66,178 63,596 62,443 Capitalized interest contribution 3,078 2,104 13,219 8,731 12,131 Other 4,550 6,751 4,604 1,847 1,933
Total revenues $ 465,715 $ 447,784 $ 454,821 $ 401,433 $ 388,184
Application of revenues:1 Operation and Maintenance Fund (a) $ 271,452 $ 258,266 $ 259,980 $ 218,398 $ 210,219 2 Bond Fund 174,462 167,681 172,095 161,733 157,187 3 Junior Lien Bond Fund 11,190 12,276 12,270 12,231 12,231 4 Operation and Maintenance Reserve Fund 100 1,050 1,965 560 412 5 Renewal and Replacement Fund 500 500 500 500 500 6 County Discretionary Fund 350 350 350 350 350 7 Airport Development Fund 7,661 7,661 7,661 7,661 7,285
Total application of revenues $ 465,715 $ 447,784 $ 454,821 $ 401,433 $ 388,184
(a) Includes amounts applied to the Hotel Furniture, Fixtures and Equipment Account established under the Authority'shotel management agreement effective October 15, 2015.
See accompanying independent auditor's report.
Priority

84
DETROIT METROPOLITAN WAYNE COUNTY AIRPORT
Continuing Disclosure Table #5
Net Revenues and Debt Service Coverage
Operating year ending September 30, 2018
(In thousands of dollars, except as noted)
(Unaudited)
Revenues:Revenues $ 379,498 Revenue fund balance at beginning of year 55,853 Other available monies:
PFC contributions 73,174 Other 4,550
Interest income generated in bond funds and reserves 5,415
Total revenues [A] 518,490
Operation and maintenance expenses [B] 271,452
Net revenues available for Sr. Lien debt service [A] - [B] = [C] 247,038
Bond debt service - Senior Lien [D] 174,462
Net revenues available for Jr. Lien debt service [C] - [D] = [E] 72,576
Bond debt service - Junior Lien [F] 11,190
Net revenues remaining in revenue fund 61,386
Debt service coverage:Senior Lien bonds [C] / [D] 1.42 Senior Lien and Junior Lien bonds [C] / ([D] + [F]) 1.33
Rate covenant elements:Operation and maintenance expenses $ 271,452 125% debt service – Bonds (1.25 x [D]) + [F] 229,268 Other fund requirements 8,611
Total rate covenant elements $ 509,331
Source: Wayne County Airport Authority
See accompanying independent auditor's report.

85
DETROIT METROPOLITAN WAYNE COUNTY AIRPORT
Continuing Disclosure Table #6
Historical Airline Passenger Enplanements
Operating years ending September 30
(Unaudited)
Operating Percentyear Domestic International Total increase2018 15,917,537 1,641,081 17,558,618 1.6%2017 15,725,513 1,555,706 17,281,219 0.92016 15,679,556 1,451,131 17,130,687 4.22015 15,008,299 1,435,479 16,443,778 1.42014 14,751,873 1,464,800 16,216,673 0.9
Source: Wayne County Airport Authority records
See accompanying independent auditor's report.

86
DETROIT METROPOLITAN WAYNE COUNTY AIRPORT
Continuing Disclosure Table #7
Historical Comparative Total Enplanements
Calendar years ending December 31
(Unaudited)
Detroit Metro United StatesPercent Detroit as a
Calendar Number of increase Number of Percent percentage of year passengers (decrease) passengers increase U.S. total2018 16,601,210 (1.2)% 816,659,548 2.3% 2.0%2017 16,794,750 1.1 798,509,085 3.1 2.12016 16,613,139 3.6 774,740,631 3.3 2.12015 16,038,743 2.9 750,164,431 4.8 2.12014 15,587,638 0.5 715,681,042 2.7 2.2
Note: 2018 estimate based on six months of data; 2017 updated with final data
Source: U.S. Department of Transportation, Bureau of Transportation Statistics, Airport Activity Statisticsof Certificated Route Air Carriers, Form 41, Schedule T3
See accompanying independent auditor's report.

87
DETROIT METROPOLITAN WAYNE COUNTY AIRPORT
Continuing Disclosure Table #8
Historical Airline Departures
Calendar years ending December 31
(Unaudited)
Total departuresPercent
Calendar Departures by carrier type increaseyear Majors Nationals Regionals Total (a) (decrease)2018 134,836 49,152 1,006 184,994 (2.0)%2017 136,630 51,590 498 188,718 0.22016 134,536 52,760 1,043 188,339 3.62015 126,785 54,522 459 181,766 (3.4)2014 119,462 68,043 609 188,114 (8.0)
(a) Total does not include departures by commuters or charters.
Note: 2018 estimate based on six months of data; 2017 updated with final data
Source: U.S. Department of Transportation, Bureau of Transportation Statistics, Airport ActivityStatistics of Certificated Route Air Carriers, Form 41, Schedule T3
See accompanying independent auditor's report.

88
DETROIT METROPOLITAN WAYNE COUNTY AIRPORT
Continuing Disclosure Table #9
Historical Domestic Originations and Connections
Calendar years ending December 31
(Unaudited)
Domestic originations Domestic connectionsCalendar Percent Percent
year Number of total Number of total2018 8,560,577 55.6% 6,826,289 44.4%2017 8,372,980 52.9 7,445,619 47.12016 7,912,712 50.2 7,837,790 49.82015 7,303,964 47.8 7,975,161 52.22014 6,952,520 47.0 7,831,959 53.0
Note: 2018 estimate based on six months of data; 2017 updated with final data
Source: U.S. Department of Transportation Origin and Destination Passenger Ticket Survey, 298cCommuter Data, Airport Activity Statistics of Certificated Route Air Carriers, and Wayne CountyAirport Authority records.
See accompanying independent auditor's report.
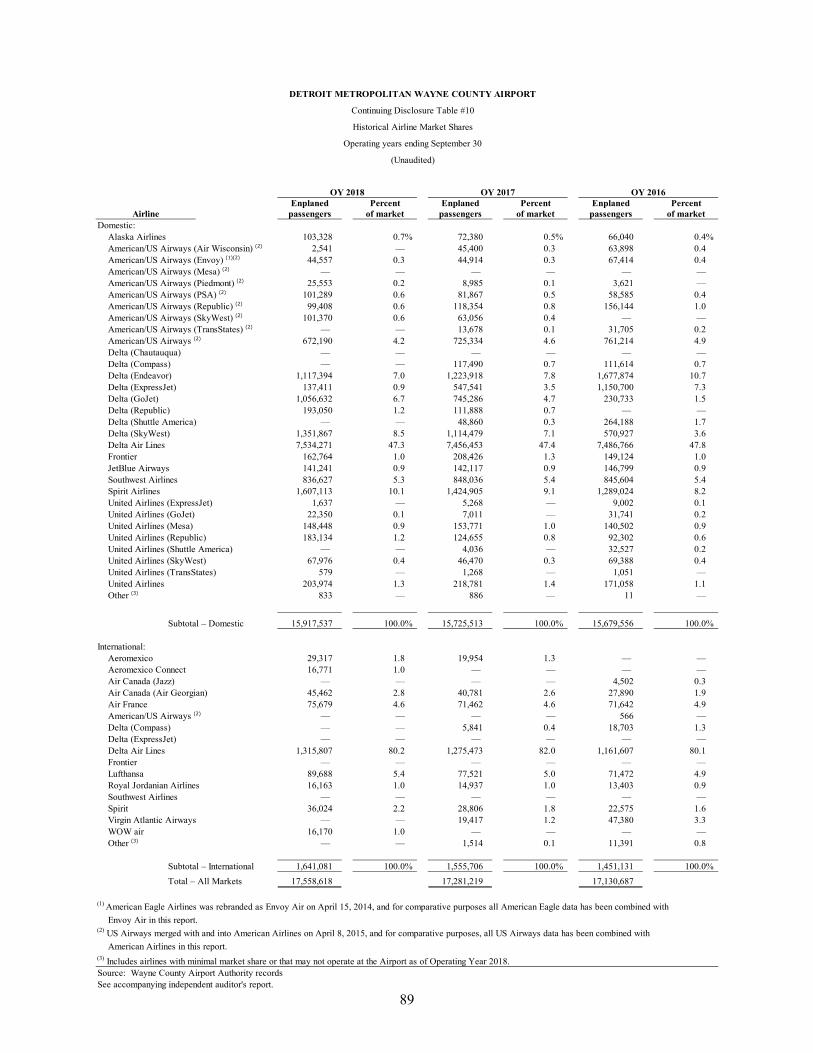
89
DETROIT METROPOLITAN WAYNE COUNTY AIRPORT
Continuing Disclosure Table #10
Historical Airline Market Shares
Operating years ending September 30
(Unaudited)
OY 2018 OY 2017 OY 2016Enplaned Percent Enplaned Percent Enplaned Percent
Airline passengers of market passengers of market passengers of marketDomestic:
Alaska Airlines 103,328 0.7% 72,380 0.5% 66,040 0.4%American/US Airways (Air Wisconsin) (2) 2,541 — 45,400 0.3 63,898 0.4American/US Airways (Envoy) (1)(2) 44,557 0.3 44,914 0.3 67,414 0.4American/US Airways (Mesa) (2) — — — — — —American/US Airways (Piedmont) (2) 25,553 0.2 8,985 0.1 3,621 —American/US Airways (PSA) (2) 101,289 0.6 81,867 0.5 58,585 0.4American/US Airways (Republic) (2) 99,408 0.6 118,354 0.8 156,144 1.0American/US Airways (SkyWest) (2) 101,370 0.6 63,056 0.4 — —American/US Airways (TransStates) (2) — — 13,678 0.1 31,705 0.2American/US Airways (2) 672,190 4.2 725,334 4.6 761,214 4.9Delta (Chautauqua) — — — — — —Delta (Compass) — — 117,490 0.7 111,614 0.7Delta (Endeavor) 1,117,394 7.0 1,223,918 7.8 1,677,874 10.7Delta (ExpressJet) 137,411 0.9 547,541 3.5 1,150,700 7.3Delta (GoJet) 1,056,632 6.7 745,286 4.7 230,733 1.5Delta (Republic) 193,050 1.2 111,888 0.7 — —Delta (Shuttle America) — — 48,860 0.3 264,188 1.7Delta (SkyWest) 1,351,867 8.5 1,114,479 7.1 570,927 3.6Delta Air Lines 7,534,271 47.3 7,456,453 47.4 7,486,766 47.8Frontier 162,764 1.0 208,426 1.3 149,124 1.0JetBlue Airways 141,241 0.9 142,117 0.9 146,799 0.9Southwest Airlines 836,627 5.3 848,036 5.4 845,604 5.4Spirit Airlines 1,607,113 10.1 1,424,905 9.1 1,289,024 8.2United Airlines (ExpressJet) 1,637 — 5,268 — 9,002 0.1United Airlines (GoJet) 22,350 0.1 7,011 — 31,741 0.2United Airlines (Mesa) 148,448 0.9 153,771 1.0 140,502 0.9United Airlines (Republic) 183,134 1.2 124,655 0.8 92,302 0.6United Airlines (Shuttle America) — — 4,036 — 32,527 0.2United Airlines (SkyWest) 67,976 0.4 46,470 0.3 69,388 0.4United Airlines (TransStates) 579 — 1,268 — 1,051 —United Airlines 203,974 1.3 218,781 1.4 171,058 1.1Other (3) 833 — 886 — 11 —
Subtotal – Domestic 15,917,537 100.0% 15,725,513 100.0% 15,679,556 100.0%
International:Aeromexico 29,317 1.8 19,954 1.3 — —Aeromexico Connect 16,771 1.0 — — — —Air Canada (Jazz) — — — — 4,502 0.3Air Canada (Air Georgian) 45,462 2.8 40,781 2.6 27,890 1.9Air France 75,679 4.6 71,462 4.6 71,642 4.9American/US Airways (2) — — — — 566 —Delta (Compass) — — 5,841 0.4 18,703 1.3Delta (ExpressJet) — — — — — —Delta Air Lines 1,315,807 80.2 1,275,473 82.0 1,161,607 80.1Frontier — — — — — —Lufthansa 89,688 5.4 77,521 5.0 71,472 4.9Royal Jordanian Airlines 16,163 1.0 14,937 1.0 13,403 0.9Southwest Airlines — — — — — —Spirit 36,024 2.2 28,806 1.8 22,575 1.6Virgin Atlantic Airways — — 19,417 1.2 47,380 3.3WOW air 16,170 1.0 — — — —Other (3) — — 1,514 0.1 11,391 0.8
Subtotal – International 1,641,081 100.0% 1,555,706 100.0% 1,451,131 100.0%
Total – All Markets 17,558,618 17,281,219 17,130,687
(1) American Eagle Airlines was rebranded as Envoy Air on April 15, 2014, and for comparative purposes all American Eagle data has been combined with
Envoy Air in this report.(2) US Airways merged with and into American Airlines on April 8, 2015, and for comparative purposes, all US Airways data has been combined with
American Airlines in this report.(3) Includes airlines with minimal market share or that may not operate at the Airport as of Operating Year 2018.Source: Wayne County Airport Authority recordsSee accompanying independent auditor's report.

90
DETROIT METROPOLITAN WAYNE COUNTY AIRPORT
Continuing Disclosure Table #10
Historical Airline Market Shares
Operating years ending September 30
(Unaudited)
OY 2015 OY 2014Enplaned Percent Enplaned Percent
Airline passengers of market passengers of marketDomestic:
Alaska Airlines 57,636 0.4% 3,927 —%American/US Airways (Air Wisconsin) (2) 34,465 0.2 57,178 0.4American/US Airways (Envoy) (1)(2) 136,328 0.9 169,854 1.2American/US Airways (Mesa) (2) 13,713 0.1 29,246 0.2American/US Airways (Piedmont) (2) — — — —American/US Airways (PSA) (2) 39,344 0.3 5,492 —American/US Airways (Republic) (2) 178,734 1.2 130,553 0.9American/US Airways (SkyWest) (2) — — — —American/US Airways (TransStates) (2) — — — —American/US Airways (2) 732,616 4.9 725,183 4.9Delta (Chautauqua) 140,318 0.9 560,376 3.8Delta (Compass) 120,847 0.8 207,036 1.4Delta (Endeavor) 1,556,601 10.4 2,159,842 14.6Delta (ExpressJet) 1,276,020 8.5 1,098,157 7.5Delta (GoJet) 107,108 0.7 160,650 1.1Delta (Republic) — — — —Delta (Shuttle America) 475,505 3.2 86,319 0.6Delta (SkyWest) 353,817 2.4 251,177 1.7Delta Air Lines 7,249,879 48.3 6,856,076 46.5Frontier 92,038 0.6 98,958 0.7JetBlue Airways 105,591 0.7 46,011 0.3Southwest Airlines 784,365 5.2 828,595 5.6Spirit Airlines 1,096,225 7.3 875,463 5.9United Airlines (ExpressJet) 76,704 0.5 143,587 1.0United Airlines (GoJet) 42,751 0.3 40,249 0.3United Airlines (Mesa) 80,084 0.5 18,478 0.1United Airlines (Republic) 11,580 0.1 — —United Airlines (Shuttle America) 52,359 0.4 70,345 0.5United Airlines (SkyWest) 65,860 0.4 31,384 0.2United Airlines (TransStates) 20,680 0.1 15,316 0.1United Airlines 105,188 0.7 78,956 0.5Other (3) 1,943 — 3,465 —
Subtotal – Domestic 15,008,299 100.0% 14,751,873 100.0%
International:Aeromexico — — — —Aeromexico Connect — — — —Air Canada (Jazz) 11,011 0.8 7,976 0.6Air Canada (Air Georgian) 12,969 0.9 13,277 0.9Air France 75,576 5.3 73,512 5.0American/US Airways (2) 520 — 1,256 0.1Delta (Compass) 17,102 1.2 8,691 0.6Delta (ExpressJet) — — 5,947 0.4Delta Air Lines 1,178,621 82.1 1,226,121 83.7Frontier 7,831 0.5 — —Lufthansa 76,694 5.3 77,650 5.3Royal Jordanian Airlines 12,225 0.9 14,755 1.0Southwest Airlines — — 12,255 0.8Spirit 22,457 1.6 22,986 1.6Virgin Atlantic Airways 20,442 1.4 — —WOW air — — — —Other (3) 31 — 374 —
Subtotal – International 1,435,479 100.0% 1,464,800 100.0%Total – All Markets 16,443,778 16,216,673
(1) American Eagle Airlines was rebranded as Envoy Air on April 15, 2014, and for comparative purposes all American Eagle data has been combined with
Envoy Air in this report.(2) US Airways merged with and into American Airlines on April 8, 2015, and for comparative purposes, all US Airways data has been combined with
American Airlines in this report.(3) Includes airlines with minimal market share or that may not operate at the Airport as of Operating Year 2018.Source: Wayne County Airport Authority recordsSee accompanying independent auditor's report.

91
DETROIT METROPOLITAN WAYNE COUNTY AIRPORT
Continuing Disclosure Table #11
Historical Airline Cargo
Operating years ending September 30
(Unaudited)
Total CargoPercent
Operating Total increase
year Enplaned Deplaned Enplaned Deplaned Cargo (decrease)2018 84,459 121,248 11,815 10,441 227,963 6.5%2017 78,041 115,305 11,381 9,253 213,980 4.52016 81,744 106,500 8,975 7,639 204,858 7.42015 77,043 97,381 8,225 8,009 190,658 (8.7)2014 85,475 107,634 8,543 7,187 208,839 (3.0)
(a) Includes small packages
Source: Wayne County Airport Authority records
See accompanying independent auditor's report.
Freight and Express (a) Mail
Cargo by type (metric tons)
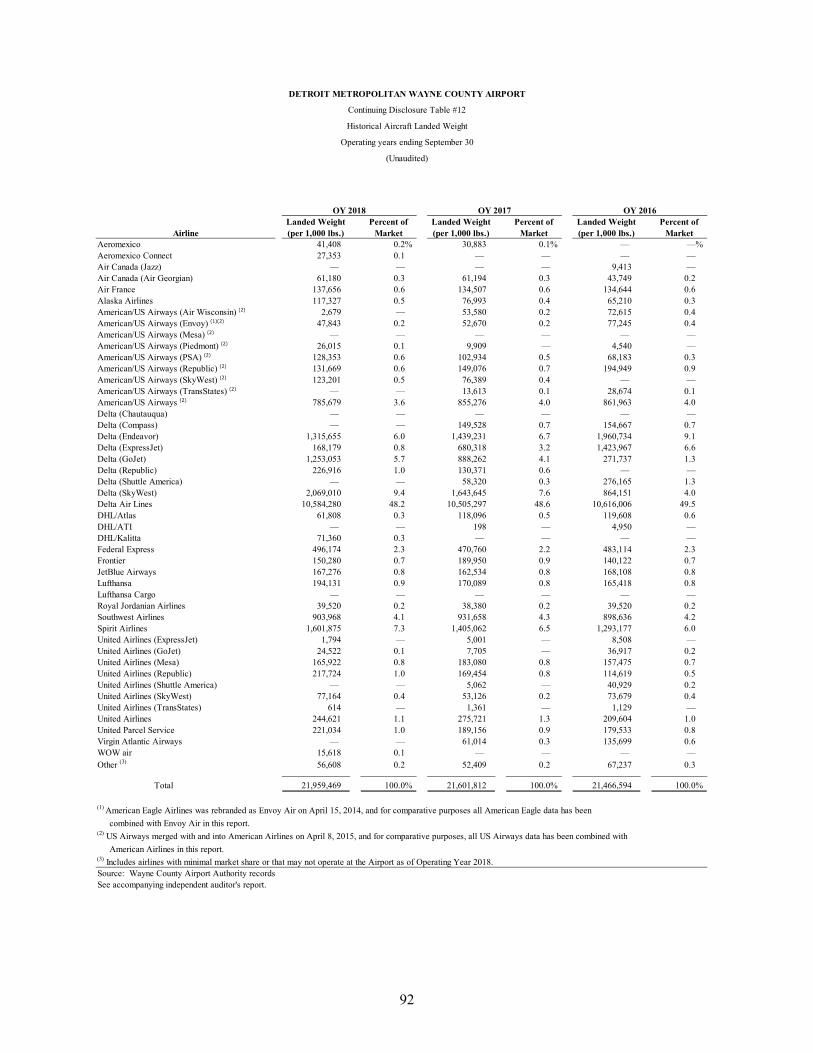
92
DETROIT METROPOLITAN WAYNE COUNTY AIRPORT
Continuing Disclosure Table #12
Historical Aircraft Landed Weight
Operating years ending September 30
(Unaudited)
OY 2018 OY 2017 OY 2016Landed Weight (per 1,000 lbs.)
Percent of Market
Landed Weight (per 1,000 lbs.)
Percent of Market
Landed Weight (per 1,000 lbs.)
Percent of Market
Aeromexico 41,408 0.2% 30,883 0.1% — —%Aeromexico Connect 27,353 0.1 — — — —Air Canada (Jazz) — — — — 9,413 —Air Canada (Air Georgian) 61,180 0.3 61,194 0.3 43,749 0.2Air France 137,656 0.6 134,507 0.6 134,644 0.6Alaska Airlines 117,327 0.5 76,993 0.4 65,210 0.3American/US Airways (Air Wisconsin) (2) 2,679 — 53,580 0.2 72,615 0.4American/US Airways (Envoy) (1)(2) 47,843 0.2 52,670 0.2 77,245 0.4American/US Airways (Mesa) (2) — — — — — —American/US Airways (Piedmont) (2) 26,015 0.1 9,909 — 4,540 —American/US Airways (PSA) (2) 128,353 0.6 102,934 0.5 68,183 0.3American/US Airways (Republic) (2) 131,669 0.6 149,076 0.7 194,949 0.9American/US Airways (SkyWest) (2) 123,201 0.5 76,389 0.4 — —American/US Airways (TransStates) (2) — — 13,613 0.1 28,674 0.1American/US Airways (2) 785,679 3.6 855,276 4.0 861,963 4.0Delta (Chautauqua) — — — — — —Delta (Compass) — — 149,528 0.7 154,667 0.7Delta (Endeavor) 1,315,655 6.0 1,439,231 6.7 1,960,734 9.1Delta (ExpressJet) 168,179 0.8 680,318 3.2 1,423,967 6.6Delta (GoJet) 1,253,053 5.7 888,262 4.1 271,737 1.3Delta (Republic) 226,916 1.0 130,371 0.6 — —Delta (Shuttle America) — — 58,320 0.3 276,165 1.3Delta (SkyWest) 2,069,010 9.4 1,643,645 7.6 864,151 4.0Delta Air Lines 10,584,280 48.2 10,505,297 48.6 10,616,006 49.5DHL/Atlas 61,808 0.3 118,096 0.5 119,608 0.6DHL/ATI — — 198 — 4,950 —DHL/Kalitta 71,360 0.3 — — — —Federal Express 496,174 2.3 470,760 2.2 483,114 2.3Frontier 150,280 0.7 189,950 0.9 140,122 0.7JetBlue Airways 167,276 0.8 162,534 0.8 168,108 0.8Lufthansa 194,131 0.9 170,089 0.8 165,418 0.8Lufthansa Cargo — — — — — —Royal Jordanian Airlines 39,520 0.2 38,380 0.2 39,520 0.2Southwest Airlines 903,968 4.1 931,658 4.3 898,636 4.2Spirit Airlines 1,601,875 7.3 1,405,062 6.5 1,293,177 6.0United Airlines (ExpressJet) 1,794 — 5,001 — 8,508 —United Airlines (GoJet) 24,522 0.1 7,705 — 36,917 0.2United Airlines (Mesa) 165,922 0.8 183,080 0.8 157,475 0.7United Airlines (Republic) 217,724 1.0 169,454 0.8 114,619 0.5United Airlines (Shuttle America) — — 5,062 — 40,929 0.2United Airlines (SkyWest) 77,164 0.4 53,126 0.2 73,679 0.4United Airlines (TransStates) 614 — 1,361 — 1,129 —United Airlines 244,621 1.1 275,721 1.3 209,604 1.0United Parcel Service 221,034 1.0 189,156 0.9 179,533 0.8Virgin Atlantic Airways — — 61,014 0.3 135,699 0.6WOW air 15,618 0.1 — — — —Other (3) 56,608 0.2 52,409 0.2 67,237 0.3
Total 21,959,469 100.0% 21,601,812 100.0% 21,466,594 100.0%
(1) American Eagle Airlines was rebranded as Envoy Air on April 15, 2014, and for comparative purposes all American Eagle data has been
combined with Envoy Air in this report.(2) US Airways merged with and into American Airlines on April 8, 2015, and for comparative purposes, all US Airways data has been combined with
American Airlines in this report.(3) Includes airlines with minimal market share or that may not operate at the Airport as of Operating Year 2018.Source: Wayne County Airport Authority recordsSee accompanying independent auditor's report.
Airline

93
OY 2015
Landed Weight (per 1,000 lbs.)
Percent of Market
Landed Weight (per 1,000 lbs.)
Percent of Market
Aeromexico — —% — —%Aeromexico Connect — — — —Air Canada (Jazz) 20,584 0.1 13,916 0.1Air Canada (Air Georgian) 18,548 0.1 16,600 0.1Air France 138,530 0.7 136,291 0.7Alaska Airlines 55,208 0.3 4,199 —American/US Airways (Air Wisconsin) (2) 48,927 0.2 69,466 0.3American/US Airways (Envoy) (1)(2) 176,287 0.9 209,816 1.0American/US Airways (Mesa) (2) 14,333 0.1 29,594 0.2American/US Airways (Piedmont) (2) — — — —American/US Airways (PSA) (2) 40,838 0.2 6,025 —American/US Airways (Republic) (2) 225,467 1.1 153,468 0.8American/US Airways (SkyWest) (2) — — — —American/US Airways (TransStates) (2) — — — —American/US Airways (2) 843,916 4.1 842,150 4.1Delta (Chautauqua) 141,015 0.7 564,145 2.8Delta (Compass) 165,734 0.8 252,328 1.3Delta (Endeavor) 1,824,960 8.8 2,523,978 12.4Delta (ExpressJet) 1,544,732 7.5 1,351,443 6.6Delta (GoJet) 128,707 0.6 190,615 0.9Delta (Republic) — — — —Delta (Shuttle America) 480,607 2.3 97,562 0.5Delta (SkyWest) 465,842 2.3 294,404 1.5Delta Air Lines 10,615,528 51.5 10,273,955 50.4DHL/Atlas — — — —DHL/ATI — — — —DHL/Kalitta — — — —Federal Express 479,295 2.3 493,528 2.4Frontier 100,624 0.5 105,448 0.5JetBlue Airways 129,654 0.6 58,298 0.3Lufthansa 162,237 0.8 180,296 0.9Lufthansa Cargo — — 17,657 0.1Royal Jordanian Airlines 38,257 0.2 40,645 0.2Southwest Airlines 854,196 4.1 904,127 4.4Spirit Airlines 1,129,323 5.5 886,234 4.3United Airlines (ExpressJet) 78,571 0.4 147,800 0.7United Airlines (GoJet) 46,297 0.2 45,091 0.2United Airlines (Mesa) 91,642 0.4 23,919 0.1United Airlines (Republic) 15,275 0.1 — —United Airlines (Shuttle America) 64,068 0.3 86,919 0.4United Airlines (SkyWest) 69,752 0.3 33,738 0.2United Airlines (TransStates) 21,159 0.1 15,871 0.1United Airlines 136,885 0.7 100,958 0.5United Parcel Service 175,421 0.8 170,445 0.8Virgin Atlantic Airways 49,683 0.2 — —WOW air — — — —Other (3) 33,550 0.2 41,772 0.2
Total 20,625,652 100.0% 20,382,701 100.0%
(1) American Eagle Airlines was rebranded as Envoy Air on April 15, 2014, and for comparative purposes all
American Eagle data has been combined with Envoy Air in this report.(2) US Airways merged with and into American Airlines on April 8, 2015, and for comparative purposes, all
US Airways data has been combined with American Airlines in this report.(3) Includes airlines with minimal market share or that may not operate at the Airport as of Operating Year 2018.Source: Wayne County Airport Authority recordsSee accompanying independent auditor's report.
Airline
OY 2014
DETROIT METROPOLITAN WAYNE COUNTY AIRPORT
Continuing Disclosure Table #12
Historical Aircraft Landed Weight
Operating years ending September 30
(Unaudited)

94
DETROIT METROPOLITAN WAYNE COUNTY AIRPORT
Continuing Disclosure Table #13
Historical Aircraft Operations
Operating years ending September 30
(Unaudited)
Total operationsOperations by class of carrier Percent
Operating Air taxi and General increaseyear Air carrier commuter aviation Military Total (decrease)2018 312,540 75,991 6,194 82 394,807 0.3%2017 298,125 89,369 6,111 108 393,713 0.32016 286,336 99,811 6,104 132 392,383 3.22015 268,876 105,649 5,540 95 380,160 (4.9)2014 237,863 155,405 6,511 117 399,896 (6.0)
Source: Wayne County Airport Authority records
See accompanying independent auditor's report.

95
DETROIT METROPOLITAN WAYNE COUNTY AIRPORT
Continuing Disclosure Table #14
Historical Aviation Demand Statistics
Operating years ending September 30
(Unaudited)
2018 2017 2016 2015 2014
Enplaned passengers:Domestic:
Scheduled:Originating (a) 8,855,356 8,323,239 7,877,070 7,173,571 6,935,557 Connecting (a) 7,061,348 7,401,388 7,802,486 7,832,785 7,812,851
Subtotal – scheduled 15,916,704 15,724,627 15,679,556 15,006,356 14,748,408
Percentage connecting 44.4% 47.1% 49.8% 52.2% 53.0%
Charter 833 886 — 1,943 3,465
Subtotal – domestic 15,917,537 15,725,513 15,679,556 15,008,299 14,751,873
International:Scheduled:
U.S. airlines 1,351,831 1,310,120 1,203,451 1,226,531 1,277,256 Foreign flag 289,250 244,072 236,289 208,917 187,170
Subtotal – scheduled 1,641,081 1,554,192 1,439,740 1,435,448 1,464,426
Charter — 1,514 11,391 31 374
Subtotal – international 1,641,081 1,555,706 1,451,131 1,435,479 1,464,800
Total enplaned passengers 17,558,618 17,281,219 17,130,687 16,443,778 16,216,673
Enplaned cargo (tons):Freight 84,459 78,041 81,744 77,043 85,475 Mail 11,815 11,381 8,975 8,225 8,543
Total cargo 96,274 89,422 90,719 85,268 94,018
Aircraft departures (b):Domestic 176,626 178,209 178,050 172,440 180,546 International 13,163 12,448 11,988 12,197 13,157
Total aircraft departures 189,789 190,657 190,038 184,637 193,703
Aircraft operations:Air carrier 312,540 298,125 286,336 268,876 237,863 Air taxi and commuter 75,991 89,369 99,811 105,649 155,405 General aviation 6,194 6,111 6,104 5,540 6,511 Military 82 108 132 95 117
Total aircraft operations 394,807 393,713 392,383 380,160 399,896
Landed weight (1,000-pound units):Passenger:
U.S. carriers:Major/national 14,555,307 14,402,492 14,252,825 13,865,334 13,175,369 Commuter/regional 5,980,312 5,872,633 5,830,936 5,648,967 6,102,680
Subtotal – U.S. carriers 20,535,619 20,275,125 20,083,761 19,514,301 19,278,049
Foreign flag 516,865 496,067 546,473 427,839 387,749
Subtotal – passenger 21,052,484 20,771,192 20,630,234 19,942,140 19,665,798
All cargo 906,985 830,620 836,360 683,512 716,903
Total landed weight 21,959,469 21,601,812 21,466,594 20,625,652 20,382,701
(a) 2018 originating and connecting activity statistics are estimated based on calendar-year percentages.
(b) 2018 departures are estimated based on both actual and scheduled data.
Sources: Wayne County Airport Authority records, U.S. Department of Transportation data,
and the Diio MI Database.
See accompanying independent auditor's report.
Historical

96
DETROIT METROPOLITAN WAYNE COUNTY AIRPORT
Continuing Disclosure Table #15
Nonstop International Destinations Added and Dropped
Calendar years ending December 31
(Unaudited)
Year Cities added Cities dropped Net change
2018 León, Mexico 3 Querétaro, MexicoReykjavik, Iceland
2017 —
2016 Munich, Germany 1
2015 Halifax, Canada (1)
2014 Quebec City, Canada (1)
Notes: Data reflects new and discontinued nonstop international destinations served from DTW during the calendar year.
Source: Diio MI Database
See accompanying independent auditor's report.
No Nonstop International Destinations Added or Dropped
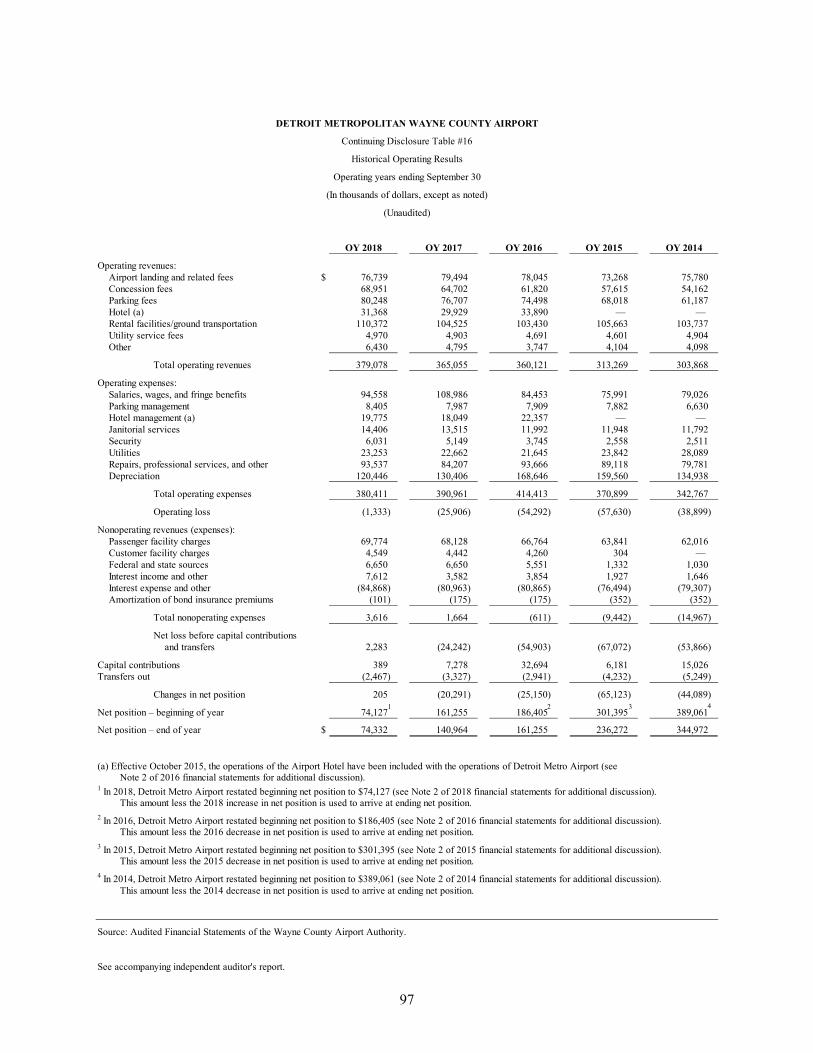
97
DETROIT METROPOLITAN WAYNE COUNTY AIRPORT
Continuing Disclosure Table #16
Historical Operating Results
Operating years ending September 30
(In thousands of dollars, except as noted)
(Unaudited)
OY 2018 OY 2017 OY 2016 OY 2015 OY 2014
Operating revenues:Airport landing and related fees $ 76,739 79,494 78,045 73,268 75,780 Concession fees 68,951 64,702 61,820 57,615 54,162 Parking fees 80,248 76,707 74,498 68,018 61,187 Hotel (a) 31,368 29,929 33,890 — — Rental facilities/ground transportation 110,372 104,525 103,430 105,663 103,737 Utility service fees 4,970 4,903 4,691 4,601 4,904 Other 6,430 4,795 3,747 4,104 4,098
Total operating revenues 379,078 365,055 360,121 313,269 303,868
Operating expenses:Salaries, wages, and fringe benefits 94,558 108,986 84,453 75,991 79,026 Parking management 8,405 7,987 7,909 7,882 6,630 Hotel management (a) 19,775 18,049 22,357 — — Janitorial services 14,406 13,515 11,992 11,948 11,792 Security 6,031 5,149 3,745 2,558 2,511 Utilities 23,253 22,662 21,645 23,842 28,089 Repairs, professional services, and other 93,537 84,207 93,666 89,118 79,781 Depreciation 120,446 130,406 168,646 159,560 134,938
Total operating expenses 380,411 390,961 414,413 370,899 342,767
Operating loss (1,333) (25,906) (54,292) (57,630) (38,899)
Nonoperating revenues (expenses):Passenger facility charges 69,774 68,128 66,764 63,841 62,016 Customer facility charges 4,549 4,442 4,260 304 — Federal and state sources 6,650 6,650 5,551 1,332 1,030 Interest income and other 7,612 3,582 3,854 1,927 1,646 Interest expense and other (84,868) (80,963) (80,865) (76,494) (79,307) Amortization of bond insurance premiums (101) (175) (175) (352) (352)
Total nonoperating expenses 3,616 1,664 (611) (9,442) (14,967)
Net loss before capital contributionsand transfers 2,283 (24,242) (54,903) (67,072) (53,866)
Capital contributions 389 7,278 32,694 6,181 15,026 Transfers out (2,467) (3,327) (2,941) (4,232) (5,249)
Changes in net position 205 (20,291) (25,150) (65,123) (44,089)
Net position – beginning of year 74,127 161,255 186,405 301,395 389,061
Net position – end of year $ 74,332 140,964 161,255 236,272 344,972
(a) Effective October 2015, the operations of the Airport Hotel have been included with the operations of Detroit Metro Airport (seeNote 2 of 2016 financial statements for additional discussion).
1 In 2018, Detroit Metro Airport restated beginning net position to $74,127 (see Note 2 of 2018 financial statements for additional discussion). This amount less the 2018 increase in net position is used to arrive at ending net position.
2 In 2016, Detroit Metro Airport restated beginning net position to $186,405 (see Note 2 of 2016 financial statements for additional discussion). This amount less the 2016 decrease in net position is used to arrive at ending net position.
3 In 2015, Detroit Metro Airport restated beginning net position to $301,395 (see Note 2 of 2015 financial statements for additional discussion). This amount less the 2015 decrease in net position is used to arrive at ending net position.
4 In 2014, Detroit Metro Airport restated beginning net position to $389,061 (see Note 2 of 2014 financial statements for additional discussion). This amount less the 2014 decrease in net position is used to arrive at ending net position.
Source: Audited Financial Statements of the Wayne County Airport Authority.
See accompanying independent auditor's report.
31 2 4
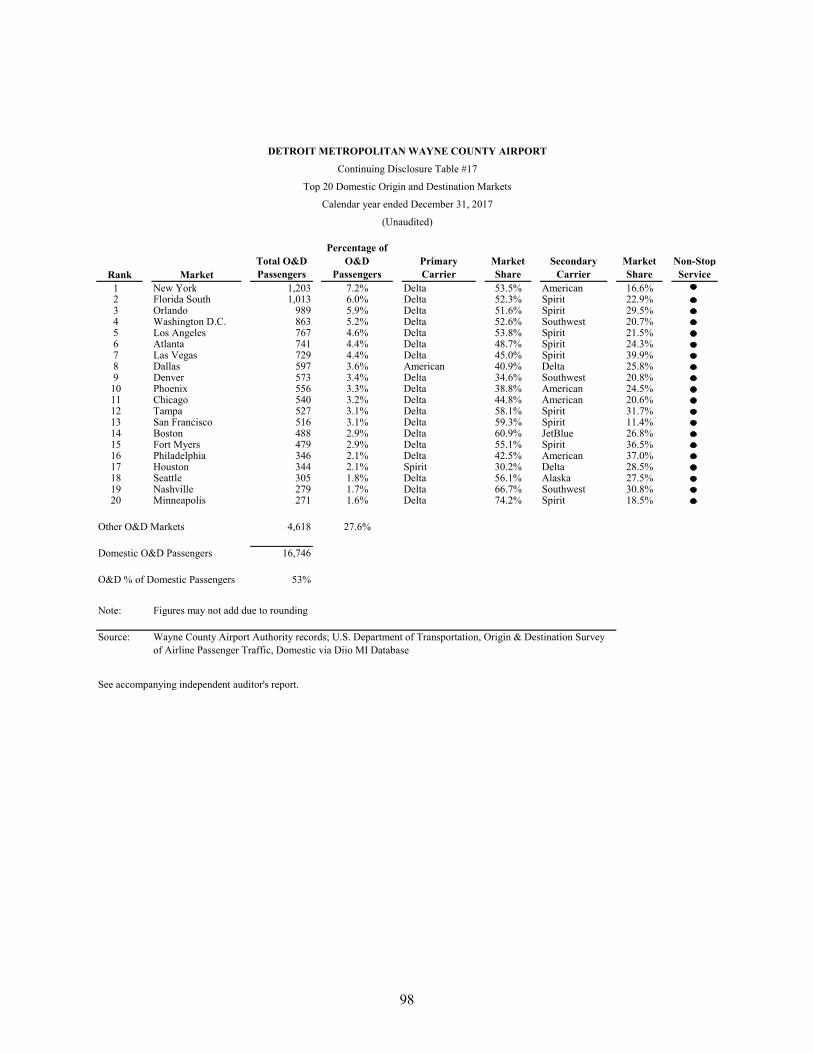
98
DETROIT METROPOLITAN WAYNE COUNTY AIRPORT
Continuing Disclosure Table #17
Top 20 Domestic Origin and Destination Markets
Calendar year ended December 31, 2017
(Unaudited)
Rank MarketTotal O&D Passengers
Percentage of O&D
PassengersPrimary Carrier
Market Share
Secondary Carrier
Market Share
Non-Stop Service
1 New York 1,203 7.2% Delta 53.5% American 16.6%2 Florida South 1,013 6.0% Delta 52.3% Spirit 22.9%3 Orlando 989 5.9% Delta 51.6% Spirit 29.5%4 Washington D.C. 863 5.2% Delta 52.6% Southwest 20.7%5 Los Angeles 767 4.6% Delta 53.8% Spirit 21.5%6 Atlanta 741 4.4% Delta 48.7% Spirit 24.3%7 Las Vegas 729 4.4% Delta 45.0% Spirit 39.9%8 Dallas 597 3.6% American 40.9% Delta 25.8%9 Denver 573 3.4% Delta 34.6% Southwest 20.8%10 Phoenix 556 3.3% Delta 38.8% American 24.5%11 Chicago 540 3.2% Delta 44.8% American 20.6%12 Tampa 527 3.1% Delta 58.1% Spirit 31.7%13 San Francisco 516 3.1% Delta 59.3% Spirit 11.4%14 Boston 488 2.9% Delta 60.9% JetBlue 26.8%15 Fort Myers 479 2.9% Delta 55.1% Spirit 36.5%16 Philadelphia 346 2.1% Delta 42.5% American 37.0%17 Houston 344 2.1% Spirit 30.2% Delta 28.5%18 Seattle 305 1.8% Delta 56.1% Alaska 27.5%19 Nashville 279 1.7% Delta 66.7% Southwest 30.8%20 Minneapolis 271 1.6% Delta 74.2% Spirit 18.5%
Other O&D Markets 4,618 27.6%
Domestic O&D Passengers 16,746
O&D % of Domestic Passengers 53%
Note: Figures may not add due to rounding
Source: Wayne County Airport Authority records; U.S. Department of Transportation, Origin & Destination Survey of Airline Passenger Traffic, Domestic via Diio MI Database
See accompanying independent auditor's report.

99
DETROIT METROPOLITAN WAYNE COUNTY AIRPORT
Continuing Disclosure Table #18
Top 20 International Origin and Destination Markets
Calendar year ended December 31, 2017
(Unaudited)
Rank MarketTotal O&D Passengers
Non-Stop
Service1 Cancún 95,4712 London (Heathrow) 42,3863 Frankfurt 41,4284 Punta Cana 35,9495 Mexico City 35,1346 Shanghai 32,9827 Tokyo 30,1848 Montego Bay 28,9119 Beirut 28,764
10 Monterrey 27,46711 Paris 22,32412 Seoul 18,90913 Vancouver 18,84714 Beijing 16,97215 Rome 16,53216 Toronto 16,43917 Los Cabos 16,33618 Amsterdam 16,17919 León 15,33520 Montréal 15,254
Source: US DOT Origin & Destination Survey of Airline Passenger Traffic
See accompanying independent auditor's report.

Report on Internal Control Over Financial Reporting and on Compliance and Other Matters Based on an Audit ofFinancial Statements Performed in Accordance with Government Auditing Standards
Independent Auditor's Report
To Management and the Wayne CountyAirport Authority Board
Wayne County Airport Authority
We have audited, in accordance with auditing standards generally accepted in the United States of America andthe standards applicable to financial audits contained in Government Auditing Standards issued by the ComptrollerGeneral of the United States, the financial statements of the business-type activities and each major fund of theWayne County Airport Authority (the "Authority") as of and for the year ended September 30, 2018 and the relatednotes to the financial statements, which collectively comprise the Authority's financial statements, and have issuedour report thereon dated January 25, 2019.
Internal Control Over Financial Reporting
In planning and performing our audit of the financial statements, we considered the Wayne County AirportAuthority's internal control over financial reporting (internal control) to determine the audit procedures that areappropriate in the circumstances for the purpose of expressing our opinions on the financial statements, but notfor the purpose of expressing an opinion on the effectiveness of the Authority's internal control. Accordingly, we donot express an opinion on the effectiveness of the Authority's internal control.
A deficiency in internal control exists when the design or operation of a control does not allow management oremployees, in the normal course of performing their assigned functions, to prevent, or detect and correct,misstatements on a timely basis. A material weakness is a deficiency, or a combination of deficiencies, in internalcontrol such that there is a reasonable possibility that a material misstatement of the Authority's financialstatements will not be prevented, or detected and corrected, on a timely basis. A significant deficiency is adeficiency, or a combination of deficiencies, in internal control that is less severe than a material weakness, yetimportant enough to merit attention by those charged with governance.
Our consideration of internal control was for the limited purpose described in the first paragraph of this section andwas not designed to identify all deficiencies in internal control that might be material weaknesses or significantdeficiencies. Given these limitations, during our audit we did not identify any deficiencies in internal control that weconsider to be material weaknesses. However, material weaknesses may exist that have not been identified.
Compliance and Other Matters
As part of obtaining reasonable assurance about whether the Wayne County Airport Authority's financialstatements are free from material misstatement, we performed tests of its compliance with certain provisions oflaws, regulations, contracts, and grant agreements, noncompliance with which could have a direct and materialeffect on the determination of financial statement amounts. However, providing an opinion on compliance withthose provisions was not an objective of our audit and, accordingly, we do not express such an opinion. Theresults of our tests disclosed no instances of noncompliance or other matters that are required to be reportedunder Government Auditing Standards.
100

To Management and the Wayne CountyAirport Authority Board
Wayne County Airport Authority
Purpose of this Report
The purpose of this report is solely to describe the scope of our testing of internal control and compliance and theresults of that testing, and not to provide an opinion on the effectiveness of the Authority's internal control or oncompliance. This report is an integral part of an audit performed in accordance with Government AuditingStandards in considering the Authority's internal control and compliance. Accordingly, this communication is notsuitable for any other purpose.
January 25, 2019
101

This page intentionally left blank.
102

Report on Compliance for the Passenger Facility Charge Program and Report on Internal Control OverCompliance
Independent Auditor's Report
To the Wayne County Airport Authority BoardWayne County Airport Authority
Report on Compliance for the Passenger Facility Charge Program
We have audited Wayne County Airport Authority's (the "Authority") compliance with the applicable requirementsdescribed in the Passenger Facility Charge Audit Guide for Public Agencies issued by the Federal AviationAdministration that could have a direct and material effect on the Authority's passenger facility charge program forthe year ended September 30, 2018. The Authority's passenger facility charge program is identified in thepassenger facility charge revenues and expenditures schedule.
Management's Responsibility
Management is responsible for compliance with federal statutes, regulations, and the terms and conditions of itsfederal awards applicable to its passenger facility charge program.
Auditor's Responsibility
Our responsibility is to express an opinion on compliance for the Authority's passenger facility charge programbased on our audit of the types of compliance requirements referred to above.
We conducted our audit of compliance in accordance with auditing standards generally accepted in the UnitedStates of America; the standards applicable to financial audits contained in Government Auditing Standards,issued by the Comptroller General of the United States; and the audit requirements of the Passenger FacilityCharge Audit Guide for Public Agencies, issued by the Federal Aviation Administration (the “Guide”). Thosestandards and the Guide require that we plan and perform the audit to obtain reasonable assurance about whethernoncompliance with the types of compliance requirements referred to above that could have a direct and materialeffect on the passenger facility charge program occurred. An audit includes examining, on a test basis, evidenceabout the Authority's compliance with those requirements and performing such other procedures as we considerednecessary in the circumstances.
We believe that our audit provides a reasonable basis for our opinion on compliance for the passenger facilitycharge program. However, our audit does not provide a legal determination of the Authority's compliance.
Opinion on the Passenger Facility Charge Program
In our opinion, the Authority complied, in all material respects, with applicable requirements referred to above thatcould have a direct and material effect on the passenger facility charge program for the year ended September 30,2018.
Report on Internal Control Over Compliance
Management of the Authority is responsible for establishing and maintaining effective internal control overcompliance with applicable requirements referred to above. In planning and performing our audit of compliance,we considered the Authority's internal control over compliance with the types of requirements that could have adirect and material effect on the passenger facility charge program to determine the auditing procedures that areappropriate in the circumstances for the purpose of expressing an opinion on compliance for the passenger facilitycharge program and to test and report on internal control over compliance in accordance with the Guide, but notfor the purpose of expressing an opinion on the effectiveness of internal control over compliance. Accordingly, wedo not express an opinion on the effectiveness of the Authority's internal control over compliance.
103
To the Wayne County Airport Authority BoardWayne County Airport Authority
A deficiency in internal control over compliance exists when the design or operation of a control over compliancedoes not allow management or employees, in the normal course of performing their assigned functions, toprevent, or detect and correct, noncompliance with a type of compliance requirement of the passenger facilitycharge program on a timely basis. A material weakness in internal control over compliance is a deficiency, or acombination of deficiencies, in internal control over compliance such that there is a reasonable possibility thatmaterial noncompliance with a type of compliance requirement of the passenger facility charge program will not beprevented, or detected and corrected, on a timely basis. A significant deficiency in internal control over complianceis a deficiency, or a combination of deficiencies, in internal control over compliance with a type of compliancerequirement of the passenger facility charge program that is less severe than a material weakness in internalcontrol over compliance, yet important enough to merit attention by those charged with governance.
Our consideration of internal control over compliance was for the limited purpose described in the first paragraphof this section and was not designed to identify all deficiencies in internal control over compliance that might bematerial weaknesses or significant deficiencies. We did not identify any deficiencies in internal control overcompliance that we consider to be material weaknesses. However, material weaknesses may exist that have notbeen identified.
The purpose of this report on internal control over compliance is solely to describe the scope of our testing ofinternal control over compliance and the results of that testing based on the requirements of the Guide.Accordingly, this report is not suitable for any other purpose.
January 25, 2019
104

105
Amended Cumulative Total Cumulative TotalAmount September 30, December 31, March 31, June 30, September 30, Total September 30,
Approved 2017 2018 2018 2018 2018 FY 2018 2018
Passenger Facility Charges Collected 3,164,332,836$ 1,371,894,206 17,663,637 15,830,213 18,347,049 18,020,507 69,861,406 1,441,755,612
Interest Earned N/A 73,569,160 13,627 12,454 10,286 13,420 49,787 73,618,947
Total Revenues 3,164,332,836$ 1,445,463,366 17,677,264 15,842,667 18,357,335 18,033,927 69,911,193 1,515,374,559
Passenger Facility Charges Expended for Approved Projects:APPLICATION NO. 1
South Airport Access Road Construction 38,620,000$ 28,664,340 - - - - - 28,664,340 Storm Water Retention & Drainage Facilities Construction 4,980,000 4,169,572 - - - - - 4,169,572 Noise Berm Construction 225,000 224,927 - - - - - 224,927 Noise Mitigation Program 104,084,000 19,864,593 116,770 122,268 117,101 122,272 478,411 20,343,004 Willow Run Airport Layout Plan Update 5,000 5,000 - - - - - 5,000
APPLICATION NO. 2Land Acquisition and Preliminary Design for Fourth Parallel Runway 6,391,000 2,439,199 - - - - - 2,439,199 Perimeter Property Fencing and Removal of Airport Hazard - Willow Run 52,000 16,665 - - - - - 16,665
APPLICATION NO. 3Midfield Domestic and International Terminal Facilities Construction 1,370,450,360 829,247,440 8,557,793 9,065,123 8,582,102 8,961,034 35,166,052 864,413,492 Reconstruction of Existing Terminals and Concourses 673,408,000 257,150,681 6,783,202 6,521,312 6,233,784 6,352,809 25,891,107 283,041,788 Concourse C Expansion & Domestic Terminals Facilities Construction (Interim Improvement) 22,967,000 21,693,389 - - - - - 21,693,389 International Passenger Processing Facilities Expansion (Interim Improvement) 32,000,000 31,800,730 - - - - - 31,800,730
APPLICATION NO. 4Runway 21C/3C Keel Section Replacement 16,991,000 8,727,721 112,647 117,950 112,966 117,954 461,517 9,189,238 Runway 4R/22L Design and Construction 169,274,000 64,310,536 545,151 570,822 546,698 570,841 2,233,512 66,544,048 Rebuild Outfall Structures at Ponds 3 and 4 2,413,000 1,241,304 16,001 16,754 16,046 16,754 65,555 1,306,859 21C Remote Primary Deicing 23,958,000 13,187,164 146,796 153,709 147,214 153,713 601,432 13,788,596 Grade/Pave Taxiway "K" Islands 704,000 362,160 4,671 4,891 4,684 4,890 19,136 381,296
APPLICATION NO. 5North Terminal Apron 59,574,000 9,941,028 - - - - - 9,941,028 McNamara Terminal Phase II Program 277,941,000 105,410,908 2,220,545 2,120,925 1,937,661 1,977,719 8,256,850 113,667,758 Third Aircraft Rescue and Firefighting Facility 1,315,000 129,764 - - - - - 129,764 West Airfield Improvements 31,906,000 9,112,409 - - - - - 9,112,409 Interconnect Re-route 1,441,000 369,055 - - - - - 369,055 Taxiway Q Construction 4,153,000 1,552,756 - - - - - 1,552,756 Runway 4R/22L Shoulders/Overburden (fka 3L/21R) 2,090,000 735,822 - - - - - 735,822 Deicing Pad at Runway 22L 18,123,000 6,601,048 - - - - - 6,601,048 Deicing Pads at Runway 4R and 3L 39,941,000 9,628,871 - - - - - 9,628,871 Perimeter Fencing and Other Security Enhancements 710,000 - - - - - - - Surface Movement Guidance Control System 1,310,000 - - - - - - - Runway 3L/21R Planning 700,000 - - - - - - - Runway 3R/21L Design and Pavement Evaluation 1,200,000 - - - - - - - Part 150 Study Update 386,156 326,095 - - - - - 326,095
APPLICATION NO. 7Airfield Snow Removal Vehicles & Equipment 16,873,119 1,833,188 - - - - - 1,833,188 McNamara Terminal In-Line Explosive Detection 110,328,130 4,277,033 - - - - - 4,277,033 Infill Island at Taxiway Y-10 811,236 85,294 - - - - - 85,294 Master Plan Update 946,500 87,823 - - - - - 87,823 Runway Surface Monitor System for RW 4L/22R 1,000,000 - - - - - - - Runway and Taxiway Improvements 97,694,583 3,053,440 - - - - - 3,053,440 Reconstruct Runway 4R/22L (Impose Only) 29,366,752 - - - - - - -
Total Amount Approved 3,164,332,836$
Total Expenditures 1,436,249,955$ 18,503,576$ 18,693,754$ 17,698,256$ 18,277,986$ 73,173,572$ 1,509,423,527$
Unexpended Passenger Facility Charges 9,213,411$ 5,951,032$
See accompanying independent auditors' report and the notes to schedule of passenger facility charge revenues and expenditures.
Quarter Ended
WAYNE COUNTY AIRPORT AUTHORITYSchedule of Passenger Facility Charges Revenues and Expenditures
Year Ended September 30, 2018

WAYNE COUNTY AIRPORT AUTHORITY
Notes to Schedule of Passenger Facility Charge Revenues and Expenditures
September 30, 2018
106
(1) General The Aviation Safety and Capacity Expansion Act of 1990 (Public Law 101-508, Title II, Subtitle B) authorized domestic airports to impose a Passenger Facility Charge (PFC) on enplaning passengers. PFCs may be used for airport projects which meet at least one of the following criteria: (1) preserve or enhance safety, security, or capacity of the national air transportation system; (2) reduce noise or mitigate noise impacts resulting from an airport; or (3) furnish opportunities for enhanced competition between or among carriers. Since 1992, the Federal Aviation Administration (FAA) has approved six PFC applications and amendments submitted by Wayne County Airport Authority (the “Authority”). The most recent application was approved during fiscal year 2008 and resulted in an additional $.3 billion of collection authority from the FAA. The Authority is currently authorized to collect PFCs in the amount of $4.50 per enplaned passenger up to a total for approved collections of $3.2 billion. Project expenditures may include amounts for the payment of principal, interest, and other financing costs on bonds for which the proceeds are used to pay PFC-eligible costs on approved projects. As of September 30, 2018, the Authority had received approximately $1.44 billion of PFC revenue and interest earnings of approximately $73.6 million. The Authority had expended approximately $1.51 billion on approved projects.
(2) Basis of Accounting The accompanying Schedule of Passenger Facility Charge Revenues and Expenditures (the Schedule) has been prepared on the cash basis of accounting, which is a comprehensive basis of accounting other than U.S. generally accepted accounting principles (GAAP). PFC charges collected, expended, and interest earned represent amounts reported to the FAA on the Passenger Facility Charge Quarterly Status Reports and total $69.9 million, $73.2 million, and $49 thousand, respectively, for the year ending September 30, 2018. The Authority also maintained a receivable of approximately $10.8 for PFCs collected by the airlines but not remitted to the Authority as of September 30, 2018.
(3) Interest Earned Interest income is allocated to the PFC program (the Program) based on a ratio of the Program’s cash and investments to the total Authority cash and investments included in the pooled cash funds, with the exception of funds for the Revenue Account, which are held in a separate interest-bearing account and credited directly to the Program.
