w avefront c haracterization c ampaign at p aranal d ecember 2007 using dimm-mass-gsm-mosp-lusci...
TRANSCRIPT

FO
RO
T-Sard
enia
15
-18
Septe
mber 2
00
8
1
WAVEFRONT CHARACTERIZATION CAMPAIGN AT PARANALDECEMBER 2007
Using
DIMM-MASS-GSM-MOSP-LuSci & SCIDAR
ESO/LUAN/IAC/CTIOJoint effort

2
FO
RO
T-Sard
enia
15
-18
Septe
mber 2
00
8
THE GOALS OF THE CAMPAIGN
ELT-DS (EU-FP6) funds Understand the properties of the optical
turbulence at ELT scales (which model for L0?)
Understand the transition from free air to telescope enclosure
Cross-correlate various instruments used in site surveys, establish confidence levels

FO
RO
T-Sard
enia
15
-18
Septe
mber 2
00
8
3
Instruments’ baselines or diameters
2m
GSMMOSPSCIDARLUSCIMASSDIMM
8m
AO WFS: NACO Interferometry: AMBER
Kolmogorov / von Kàrmàn von Kàrmàn??
Nice & ESO ESO & ONERA ESO
Spatial scales at which turbulence is probed by different instruments

FO
RO
T-Sard
enia
15
-18
Septe
mber 2
00
8
4
Instruments and expected parameters
MASS-DIMM (CN2(h), e0, t0)
LUSCI (CN2(h))
SCIDAR (CN2(h),v(h), e0, q0, t0)
MOSP (L0(h), CN2(h), e0)
DIMM (e0, t0)GSM (e0, L0, q0, t0)NACO (e0, L0, t0)AMBER (OPD, e0, L0)
CN2 : structure constantL0 : outer scaleV : wind speedε0 : seeing
θ0 : isoplanatic angleτ0 : coherence time
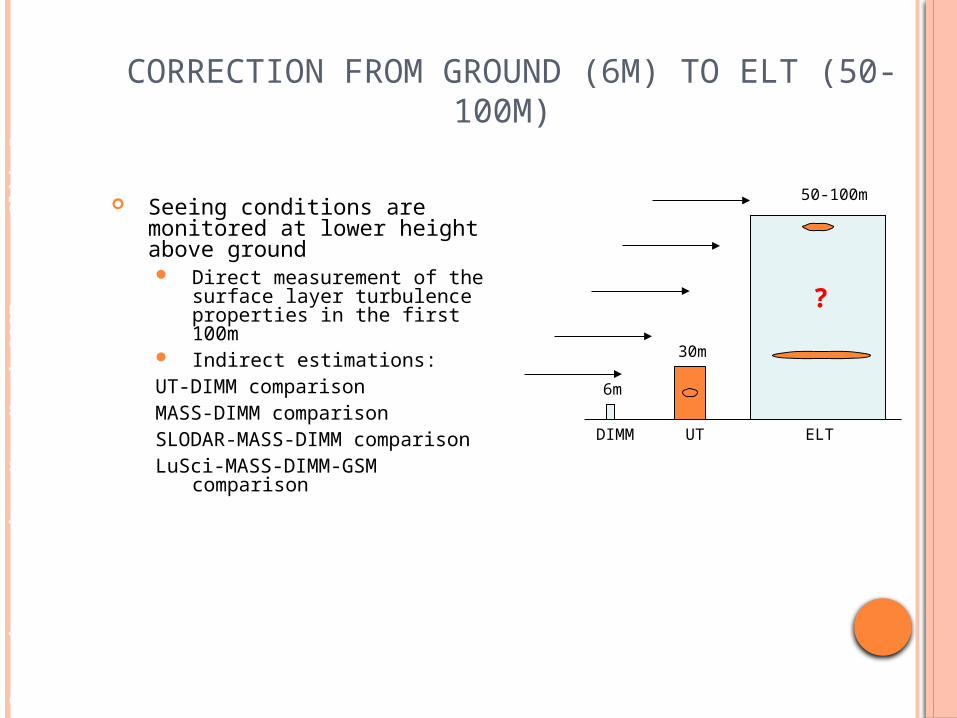
CORRECTION FROM GROUND (6M) TO ELT (50-100M)
Seeing conditions are monitored at lower height above ground Direct measurement of the
surface layer turbulence properties in the first 100m
Indirect estimations:UT-DIMM comparisonMASS-DIMM comparisonSLODAR-MASS-DIMM comparisonLuSci-MASS-DIMM-GSM
comparison
50-100m
DIMM UT ELT
6m
30m
?
Sym
posiu
m o
n s
eein
g,
Kon
a M
arc
h 2
007
-
- S
lid
e 5

FO
RO
T-Sard
enia
15
-18
Septe
mber 2
00
8
6
N
E
Cute-SCIDAR location at Paranal
The Paranal Astronomical Site Monitor is located on the platform, in a zone diametrically opposite to the Control Building, just behind the VST.
The CUTE-SCIDAR@AT4 is located on the platform, in VLTI J2 Station.
WHERE?

FO
RO
T-Sard
enia
15
-18
Septe
mber 2
00
8
7
Cute-SCIDAR at Paranal (AT4 focus) for E-ELT Site Characterisation (Vázquez Ramió et al; The Messenger 132 – June 2008)
INSTRUMENT COMMISSIONED IN NOVEMBER 2007
Data collected during 20 nights between November and December 2007
December acquisitions included in the Navidad Campaign

FO
RO
T-Sard
enia
15
-18
Septe
mber 2
00
8
8
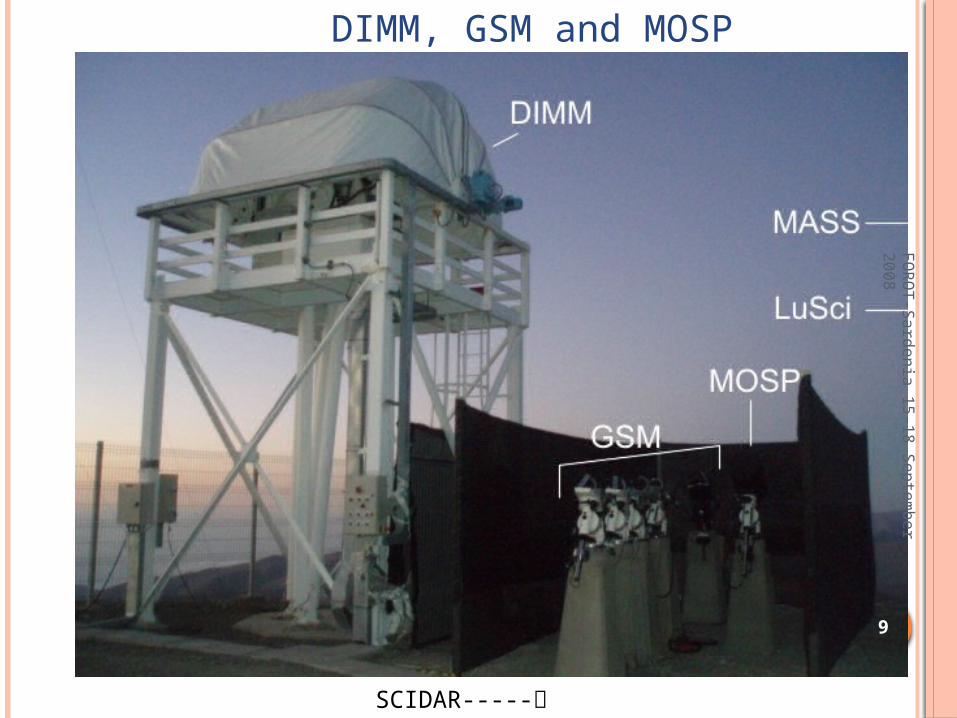
Meteo, DIMM, GSM and MOSP, MASS and LuSci
FO
RO
T-Sard
enia
15
-18
Septe
mber 2
00
8
9
DIMM, GSM and MOSP
SCIDAR-----

FO
RO
T-Sard
enia
15
-18
Septe
mber 2
00
8
10
Synchronous acquisitions
FO
RO
T-Sard
enia
15
-18
Septe
mber 2
00
8
11
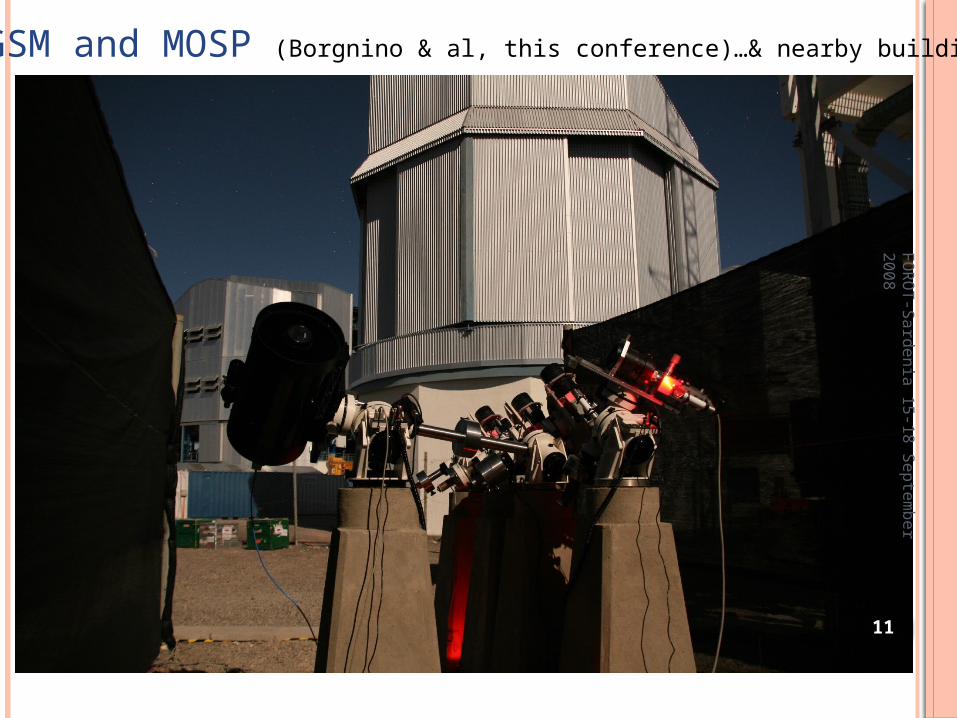
GSM and MOSP (Borgnino & al, this conference)…& nearby buildings

FO
RO
T-Sard
enia
15
-18
Septe
mber 2
00
8
12
LUSCI - J. Beckers, 1993 & this conference- P. Hickson, 2004 & this conference- A. Tokovinin SPIE 7013, 2008

FO
RO
T-Sard
enia
15
-18
Septe
mber 2
00
8
13
MASS-DIMM on C11 tube and ASTELCO mount

14
FO
RO
T-Sard
enia
15
-18
Septe
mber 2
00
8TURBULENCE PROFILES FROM MASS
The altitude weighting functions of MASS and SCIDAR are of different physical nature
FO
RO
T-Sard
enia
15
-18
Septe
mber 2
00
8
15
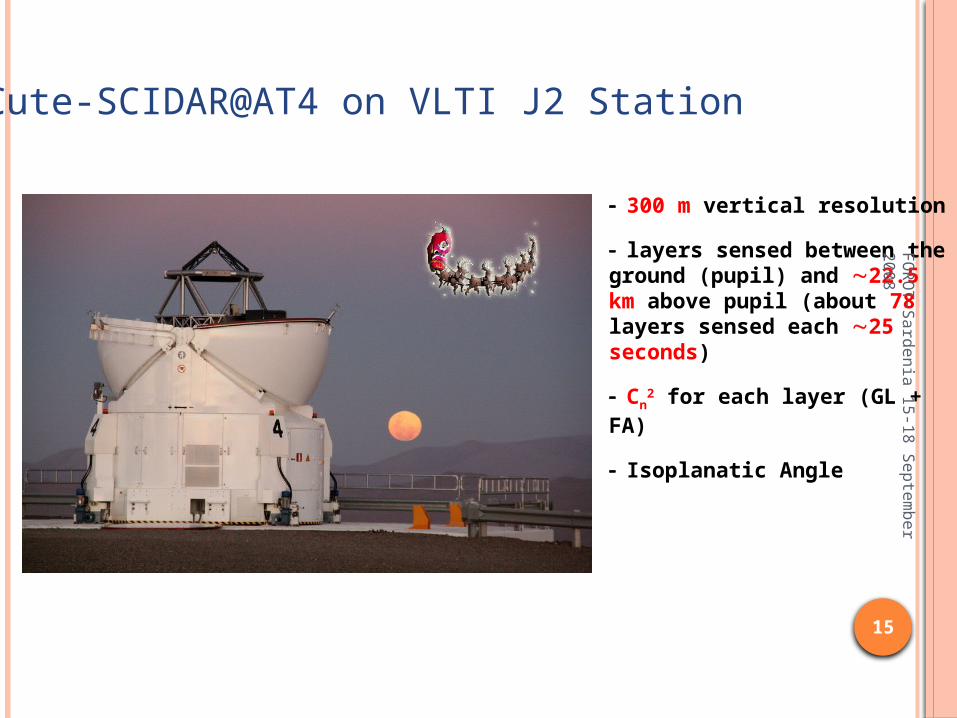
Cute-SCIDAR@AT4 on VLTI J2 Station
- 300 m vertical resolution
- layers sensed between the ground (pupil) and 22.5 km above pupil (about 78 layers sensed each 25 seconds)
- Cn2 for each layer (GL +
FA)
- Isoplanatic Angle

FO
RO
T-Sard
enia
15
-18
Septe
mber 2
00
8
16
SCIDAR real time analysis and first post-processing
Real time turbulence evolution including and excluding dome turbulence (see Fuensalida et al. 2008, MNRAS, 389, 731)Direct correlation with Seeing from other Profilers or Monitors, wind speed and wind direction
Recombination of the turbulence profile in a “MASS-like” structure for immediate comparison
17
FO
RO
T-Sard
enia
15
-18
Septe
mber 2
00
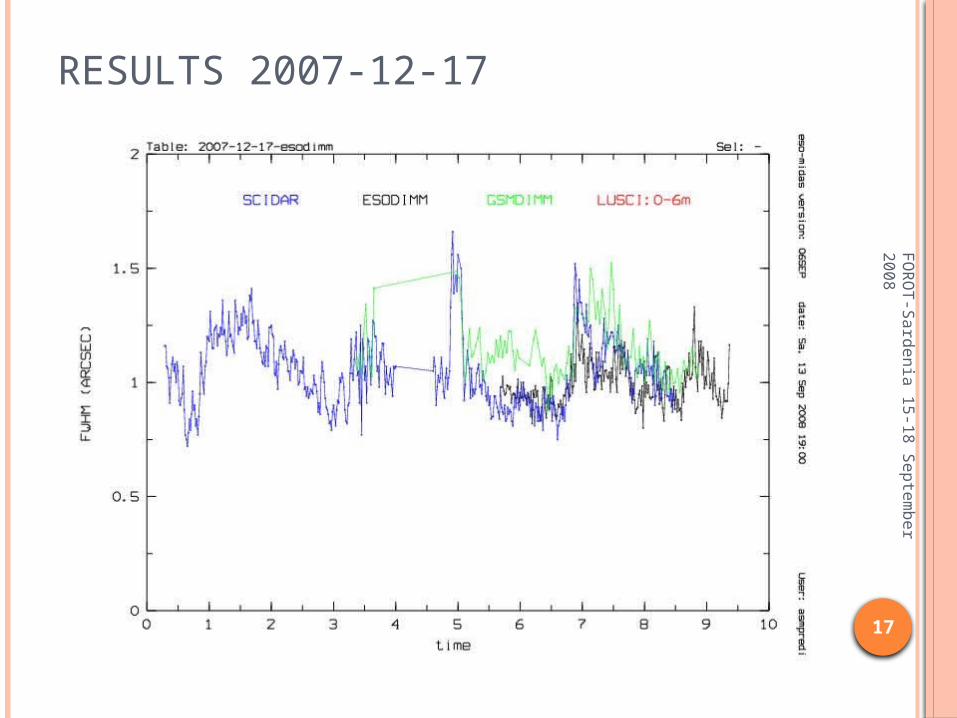
8RESULTS 2007-12-17
18
FO
RO
T-Sard
enia
15
-18
Septe
mber 2
00
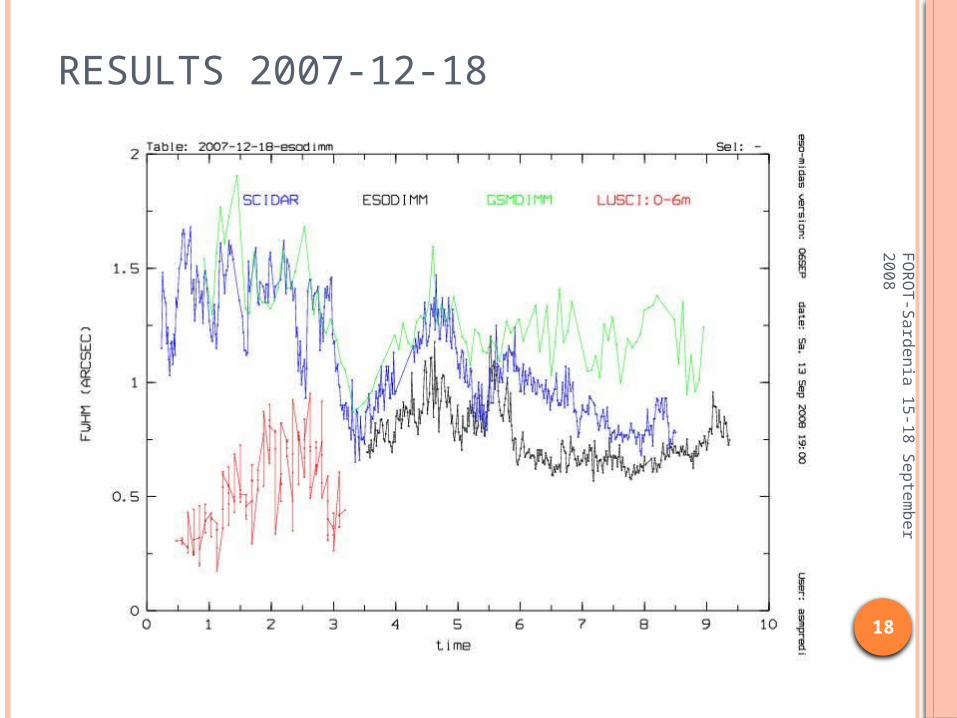
8RESULTS 2007-12-18

19
FO
RO
T-Sard
enia
15
-18
Septe
mber 2
00
8RESULTS 2007-12-19

20
FO
RO
T-Sard
enia
15
-18
Septe
mber 2
00
8RESULTS 2007-12-20

21
FO
RO
T-Sard
enia
15
-18
Septe
mber 2
00
8RESULTS 2007-12-21

22
FO
RO
T-Sard
enia
15
-18
Septe
mber 2
00
8RESULTS 2007-12-22
23
FO
RO
T-Sard
enia
15
-18
Septe
mber 2
00
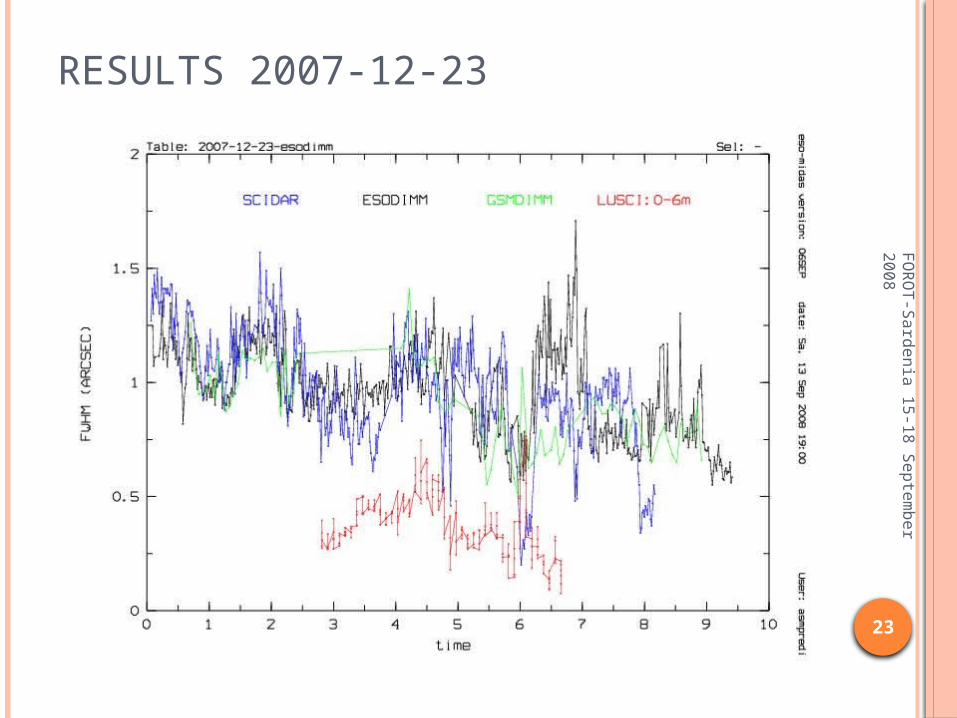
8RESULTS 2007-12-23

24
FO
RO
T-Sard
enia
15
-18
Septe
mber 2
00
8RESULTS 2007-12-24
FO
RO
T-Sard
enia
15
-18
Septe
mber 2
00
8
25
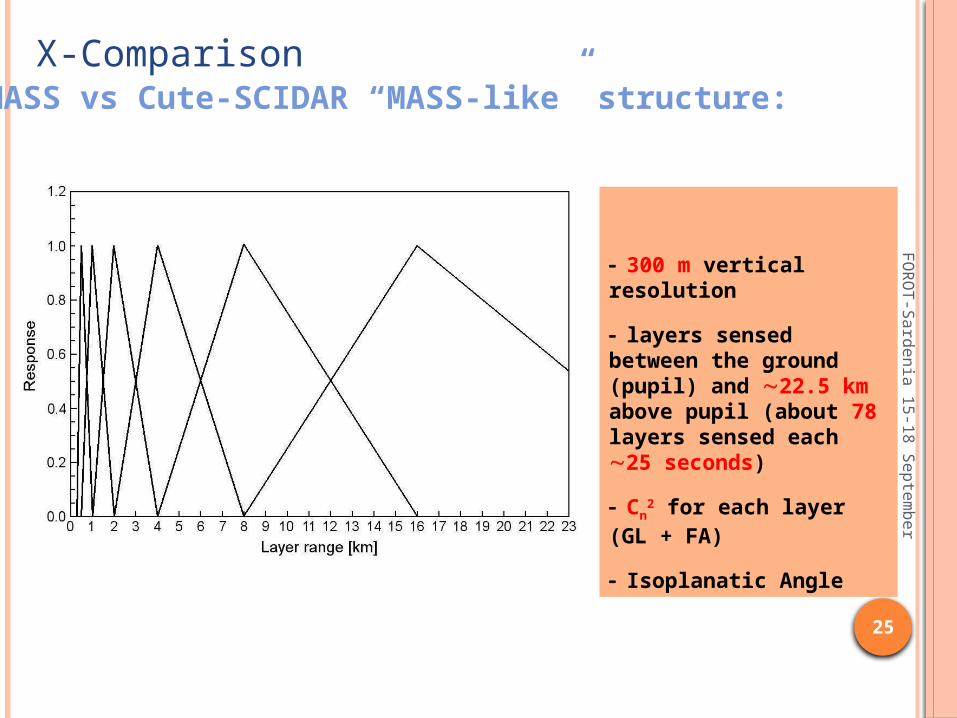
MASS vs Cute-SCIDAR “MASS-like” structure: X-Comparison
- 300 m vertical resolution
- layers sensed between the ground (pupil) and 22.5 km above pupil (about 78 layers sensed each 25 seconds)
- Cn2 for each layer (GL
+ FA)
- Isoplanatic Angle

FO
RO
T-Sard
enia
15
-18
Septe
mber 2
00
8
26
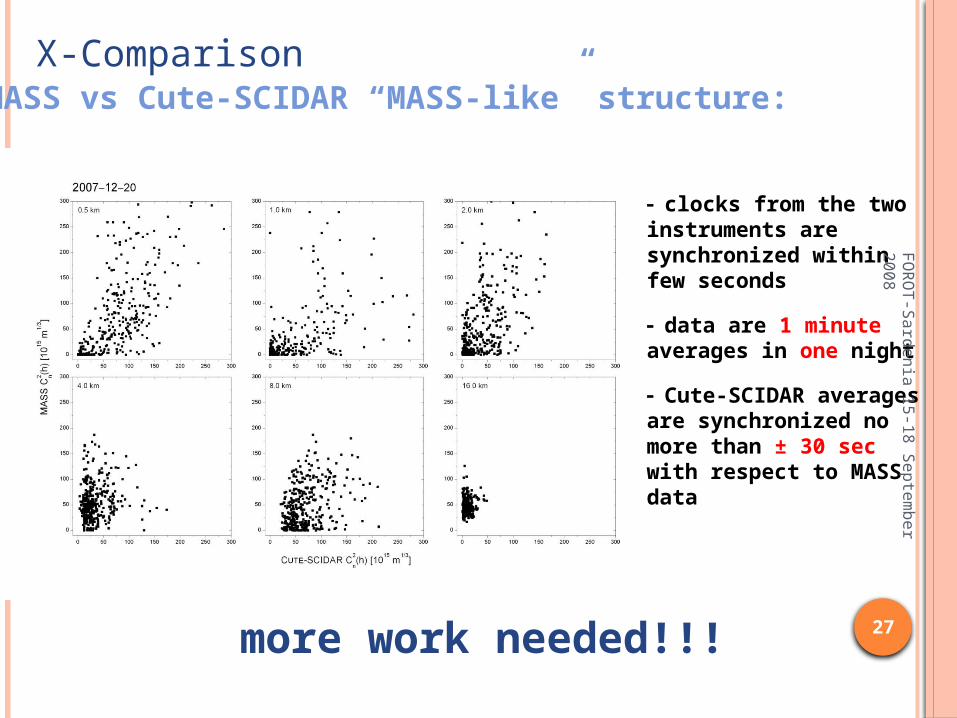
MASS vs Cute-SCIDAR “MASS-like” structure: X-Comparison
FO
RO
T-Sard
enia
15
-18
Septe
mber 2
00
8
27
MASS vs Cute-SCIDAR “MASS-like” structure: X-Comparison
- clocks from the two instruments are synchronized within few seconds
- data are 1 minute averages in one night
- Cute-SCIDAR averages are synchronized no more than ± 30 sec with respect to MASS data
more work needed!!!