w ot* iimuiiniiim mi i.j iii.hiiiiiu.ii.mii nm' » i ot* iimuiiniiim mi i.j iii.hiiiiiu.ii.mii...
TRANSCRIPT
w ■OT* iimuiiniiim mi i.j III.HIIIIIU.II.MII nm'■""■»"■■»"■ i ■ '' T'T
AD-759 499
TWO-STAGE HIGH PRESSURE - R A TIO CENTRI- FUGAL COMPRESSOR
Colin Rodgers
Solar
Prepared for:
Army Air Mobility Research and Development Laboratory
March 1973
DISTRIBUTED BY:
urn National Technical Information Service U. S. DEPARTMENT OF COMMERCE 5285 Port Royal Road. Springfield Va. 22151
iMalMUBMl ■MMMMMMMaMi

^r ■ .■""i" ■"■■l immmmmm^mmmfi i .,"»»■» >•- '"<«'iimjii.iiiimmi.\mtw""i <•"- ■ PWfWWHWFB»» »i||ip»IIBII ,J ll,|lip,ipi.llI"lHW"W»"»i» "T1
»j»i»«^A!*9eiWM,vwvrw»«/r?^,;*^/v*--HB^ "" .' ■'■ ' " "'•
I . m ■'■■
i ' Oi 1 ^
• 0) 1 ^ 1 ^ 1
■■
USMMRDL TECHNICAL REPORT 73-4
TWO-STAGE HIGH PRESSURE-RATIO CENTRIFUGAL COMPRESSOR
CoiiMiers
Hard 1973
EUSTIS DIRECTORATE U. S. ARMY AIR MOBILITY RESEARCH AND DEVELOPMENT LABORATORY
FORT EUSTIS, VIRGINIA CONTRACT DAAJ02-72-C-0014
SOLAR DIVISION OF INTERNATIONAL HARVESTER COMPANY SAN DIEGO, CALIFORNIA
Approved for public release; distribution unlimited.
Reproducrd by
NATIONAL TECHNICAL INFORMATION SERVICE
U S D.pürtn,,,,! „( Comm.rc« Spnng(„.|ri VA 2213) ^r
^m*m*mimamm*m*tt»mNmmmmt*M**~i***Mim.*~**mt*mttia^MM ■ - ■ - ■ M
wwup wnwm^ ■ ' 1 ■-' — 'l- !«.■ i ... ..i.» ..U... i M. ■■ — "TT"
DISCLAIMERS
The findings in this report are not to be construed as an official Department of the Army position unless so designated by other authorized documents.
When Government drawings, specifications, or other data are used for any purpose other than in connection with a definitely related Government procurement operation, the United States Government thereby incurs no responsibility nor any obligation whatsoever; and the fact that the Government may have formulated, furnished, or in any way supplied the said drawings, specifications, or other data is not to be regarded by implication or otherwise as in any manner licensing the holder or any other person or corporation, or conveying any rights or permission, to manufacture, use, or sell any patented invention that may in any way be related thereto.
Trade names cited in this report do not constitute an official endorsement or approval of the use of such commercial hardware or software.
DISPOSITION »NSTRUCTIONS
Destroy this report when no longer needed. Do not return it to the originator.
[ Acccsin hr
'v\ NTK DOC bli UtlM D nuKOorxH □ JIBTIflMIlO»
IT DISTIlim ioii/««iLAmr* r.
"«iCljii/jrV:-. l.-,l~ | Ditt.
h . \ %
m ii i i M nmmämaimmaltmältia»muiUmtmitmtittmtammi^M^mm «UIMHIIIMIMIMMMMMMBI
W^pi|m|p|^^piV«niMPW«OT^^^W<R^<Jn>WinilJlluiniWP)pi||i||HpTCn^a'?^^>^n<iai •inifc"« l.»jMliipjl||piB»w»w^ll.wn«iiii»n»iIii 11 lunm i|ill|.l| I.PI.I ■nwpi.ii |>WIJ||III.I|.II!UIIIII«|III<II.IJIU|IJI. i^rp-
DEPARTMENT OF THE ARMY U. S. ARMY AIR MOBILITY RESEARCH 4 DEVELOPMENT LABORATORY
EUSTIS DIRECTORATE FORT EUSTIS, VIRGINIA 23S04
The objective of this contractual effort was to demonstrate that two existing centrifugal compressor stages could be scaled, matched, and run on the same shart to provide
aerodynamic performance comparable to that achievable using state-of-the-art axial centrifugal compressor technology. The target performance was to be demonstrated witluut benefit of compressor variable geometry, using existing impeller tooling and hot turbine drive design.
This report was prepared by the Solar Division of International Harvester Company under the terms of Contract DAAJ02-72-C-0014. It presents the aeromechanlcal design of the compressor, test results, and an analysis of these results. An analysis of mechanical problems encountered and recommendations for additional research are also presented.
This report has been reviewed by the technical personnel of this Directorate. The conclusions contained herein are concurred in by thi" Directorate and will be considered in any future centrifugal compressor programs. The U.S. Army project engineer for this effort was Mr. Robert A. Langworthy, Technology Applications Division.
1

"'" ""ll"1 "",w'^^^^^^*^' ' III>-II~"" i»"">- ' — 'i II.IH. ii«. ii »»Piiiiu|ili»wiiL-».illl|l |pi, lijii i.n»iii.|»iw.nmiMM^tiiHu,nm,iu in w^mgfl
Task 1G162207AA7102 Contract DAAJ02-72-C-0014
USAAMRDL Technical Report 73-4 March 1973
TWO-STAGE HIGH-PRESSURE-RATIO CENTRIFUGAL COMPRESSOR
Final Technical, Test, and Demonstration Report
Solar ER 2415
By
Colin Rodgers
Prepared by
Solar Division of International Harvester Company San Diego, California
for
EUSTB DIRECTORATE U.S. ARMY AIR MOBILITY RESEARCH AND DEVELOPMENT LABORATORY
FORT EUSTB, VIRGINIA
Approved for public release; distribution unlimited.
JJ
____
H I "" ""'""■ "WPIil «mnp«
uMdaaaiflad tecurit» CUttiflotion
DOCUMENT CONTROL DATA R&D (Stutllr tlmflllcmllan of H(l«, body al mbtnacl mni Indttlnj «nwototlon mnl W «ntwrf ■*«■ g« o»»f«H npotl I« clmttlUtij
I. omaiNATiNO ACTIVITY fBwpüjü «uikarj
Solar, Division of International Harvester Company 2200 Pacific Highway San Diego, California
, RCPOKT «ICUIIITV CLAHiriCikTION
Unclassified ««our
N/A > ■■PONT T1TLK
TWO-STAGE HIGH-PRESSURE-RATIO CENTRIFUGAL COMPRESSOR
4. OctCRIPTIVK HOTtt (Trp* ol ixyolt M>4 Inctutlv <Ul*t)
Final Techanlcal. Test, and Demonstration Report ■. AUTHOR»! (Flwmi mm», «MM SHHSC Immt nmmm) —— ~
Colin (NMI) Rodgers
• RCPORT DAT!
March 1973 M. CONTMACT OR CHANT NO.
DAAJ02-72-C-0014 ». RRO." .r NO.
Task 1G162207 AA7102
Ta. TOTAL NO. OF PAOZI
6£
USAAMRDL Technical Report 73-4 •k. OTHCR RKrORT NOIW (A*T
Ihlm fpmilj
ER 2415
Approved for public release; distribution unlimited.
It. ACtTRACT
11. IPONtORINa MILITARY ACTIVITY Eustis Directorate U.S. Army Air Mobility Research and Development Laboratory Fort Eustts. Virginia
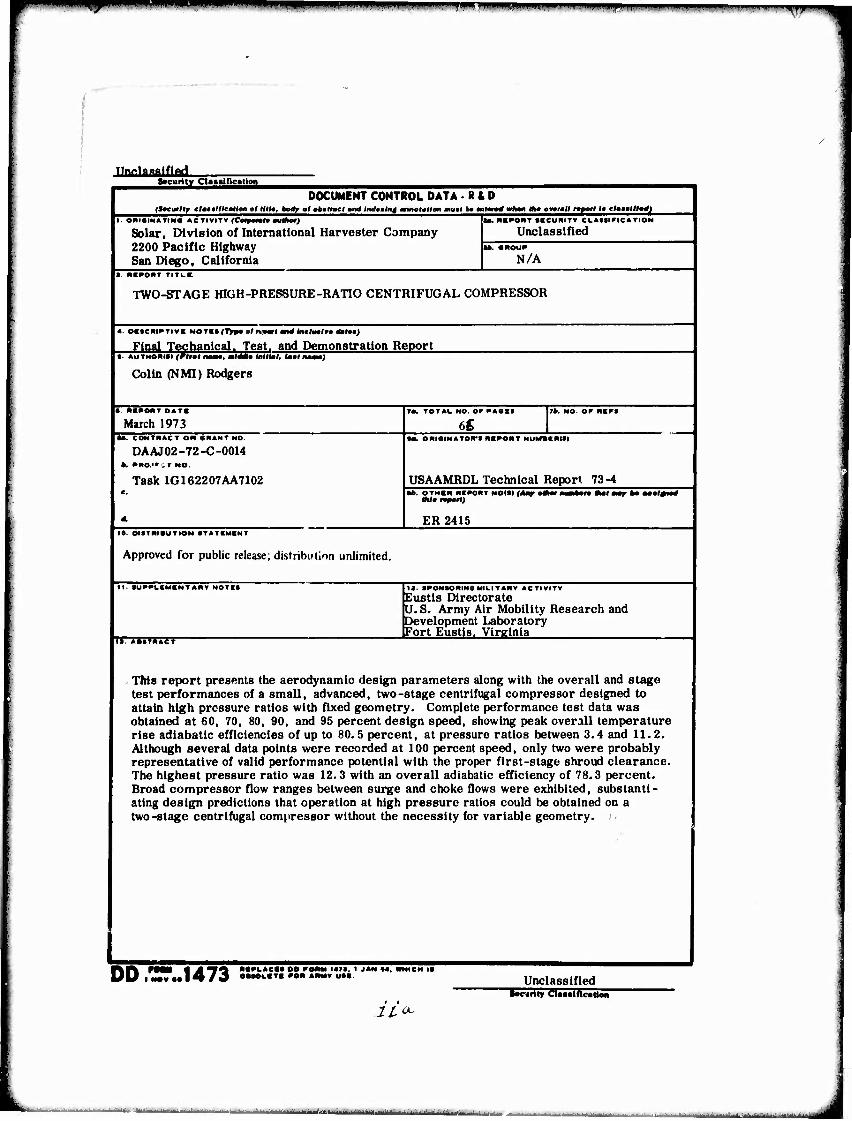
This report presents the aerodynamic design parameters along with the overall and stage test performances of a small, advanced, two-stage centrifugal compressor designed to attain high pressure ratios with fixed geometry. Complete performance test data was obtained at 60, 70, 80, 90, and 95 percent design speed, showing peak overall temperature rise adiabatic efficiencies of up to 80.5 percent, at pressure ratios between 3.4 and 11.2. Although several data points were recorded at 100 percent speed, only two were probably representative of valid performance potential with the proper first-stage shroud clearance. The highest pressure ratio was 12.3 with an overall adiabatic efficiency of 78.3 percent. Broad compressor flow ranges between surge and choke flows were exhibited, substanti- ating design predictions that operation at high pressure ratios could be obtained on a two-stage centrifugal compressor without the necessity for variable geometry.
T^fi FMM 4 M "f ^i ««»LAC«» oo roRM i«». i j Uli I M« •• I 470 OMOL.T. rOR ARMY UM.
AN »«. «MICH It
Unclassified lociirily CUaaineatte
Jio-
■ ■■i T n^MdV " - M
" i m *?F ' «l nuiiiwii^»! i i i i»^ mmi i ii i.iiiiiiii» iinj m in i iiiiiiin »i i in» mm I'm»! ■ n I I'li'iip" ,■!■ u . .■ ■yy WJ
Unclassified Security CUsdftcallon
KCV mono» ■OLt WT
Compressors Compressors, Centrifugal, Engine Efficiency, Engines, Gas Turbine
XLI Unclassifibi
S«CWUT ClassincaUeB J^44-71
L_ i ■ II 11 (iniii-^i- II ■ -—-■-■■■■■" .■■.■■■■* -- - -.-.-
T mim ■— ' ^. ■IIII»IIJIHIUIIII»I'»-"J'TW>IJ ■ LI.I UIWII imiiwii IU. .i.idnwwunii. i^; f '
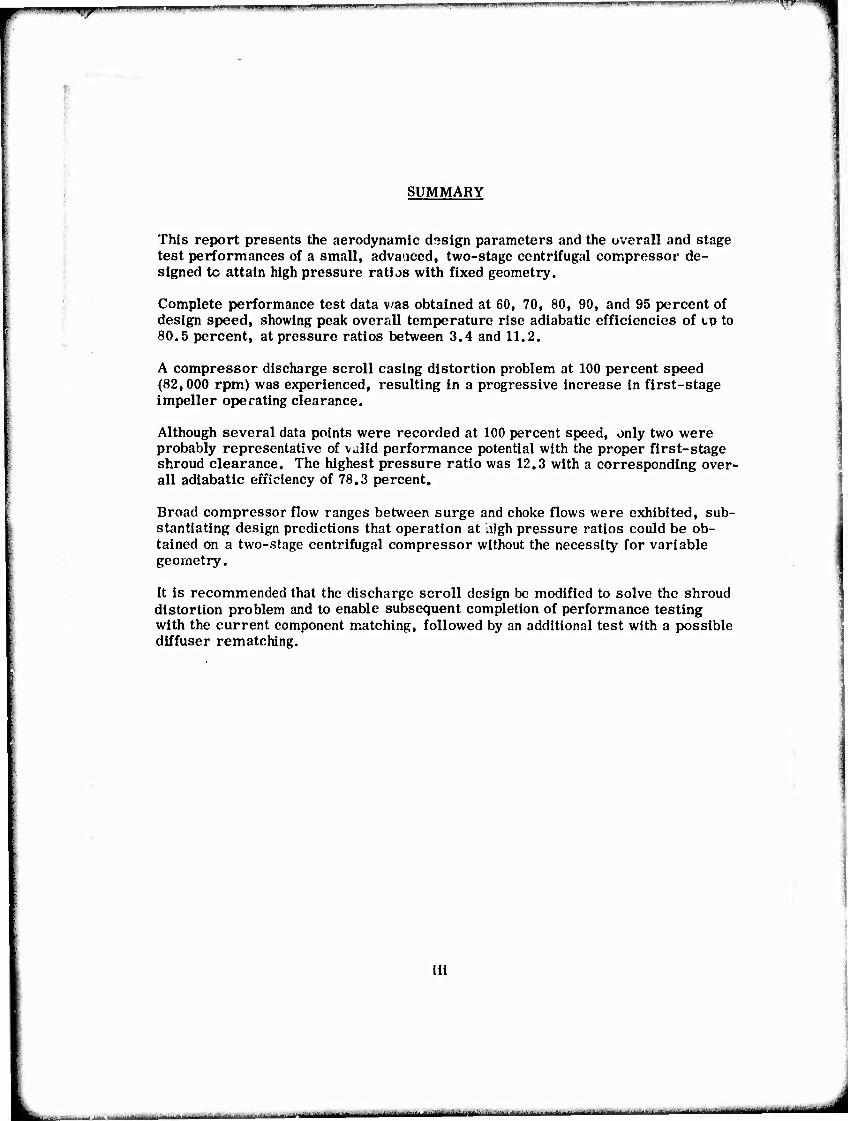
SUMMARY
This report presents the aerodynamic design parameters and the overall and stage test performances of a small, advanced, two-stage centrifugal compressor de- signed to attain high pressure ratios with fixed geometry.
Complete performance test data vas obtained at 60, 70, 80, 90, and 95 percent of design speed, showing peak overall temperature rise adiabatic efficiencies of up to 80.5 percent, at pressure ratios between 3.4 and 11.2.
A compressor discharge scroll casing distortion problem at 100 percent speed (82,000 rpm) was experienced, resulting in a progressive increase in first-stage impeller operating clearance.
Although several data points were recorded at 100 percent speed, only two were probably representative of valid performance potential with the proper first-stage shroud clearance. The highest pressure ratio was 12.3 with a corresponding over- all adiabatic efficiency of 78.3 percent.
Broad compressor flow ranges between surge and choke flows were exhibited, sub- stantiating design predictions that operation at high pressure ratios could be ob- tained on a two-stage centrifugal compressor without the necessity for variable geometry.
It is recommended that the discharge scroll design be modified to solve the shroud distortion problem and to enable subsequent completion of performance testing with the current component matching, followed by an additional test with a possible diffuser rematching.
iii

H M ■"
FOREWORD
This technical report covers all design and experimental work necessary to fulfill the requirements of Contract DAAJ02-72-C- 0014, DA Task 1G162207AA7102,with the Eustis Directorate, U.S. Army Air Mobility Research and Development Labo- ratory, Fort Eustis, Virginia.
The technical representative of the U. S. Army was Mr. R. A. Langworthy of the Eustis Directorate.
The principal investigator responsible for the technical content, execution, and liaison of the program was C. Rodgers. Other Solar personnel engaged in the pro- gram included J. Thayer, Experimental Engineer; M. Lafferty, Design Engineer; and P. Carlson, Program Manager.
- I MlilMlMT Ml ■ ■ ll_aa^a-UM____a

m* ^mi^^m <•<•< mm "^W
TABLE OF CONTENTS
Page
SUMMARY iii
FOREWORD v
LIST OF ILLUSTRATIONS vlii
LIST OF TABLES x
LIST OF SYMBOLS xi
INTRODUCTION 1
DISCUSSION OF WORK PERFORMED 2
Aerodynamic Design 2 Mechanical Design 3 Compressor Fabrication and Assembly 10 Apparatus and Procedures 15 Test Results 20 Performance Summary 34
CONCLUSIONS 38
RECOMMENDATIONS 39
APPENDIXES
I. Drive Turbine Spin Test Results 40
II. Discharge Scroll Distortion Analysis 41
in. Error Computation for Two-Stage Compressor 43
IV. Calibration of Pressure Transducer 46
V. Computer Performance Listing, Data Point 44 48
DISTRIBUTION 52
vii
_^ ... m. *.**
T^r1 ü "'H Hi > m 'i'""""" '■ .—.—™— ■ -- IIIM. ...n -" ii ini.!^ i IIIF"" ■■■■'-■■ ' i.ni. ■■■iipif.ii.i ii ^yy'p^
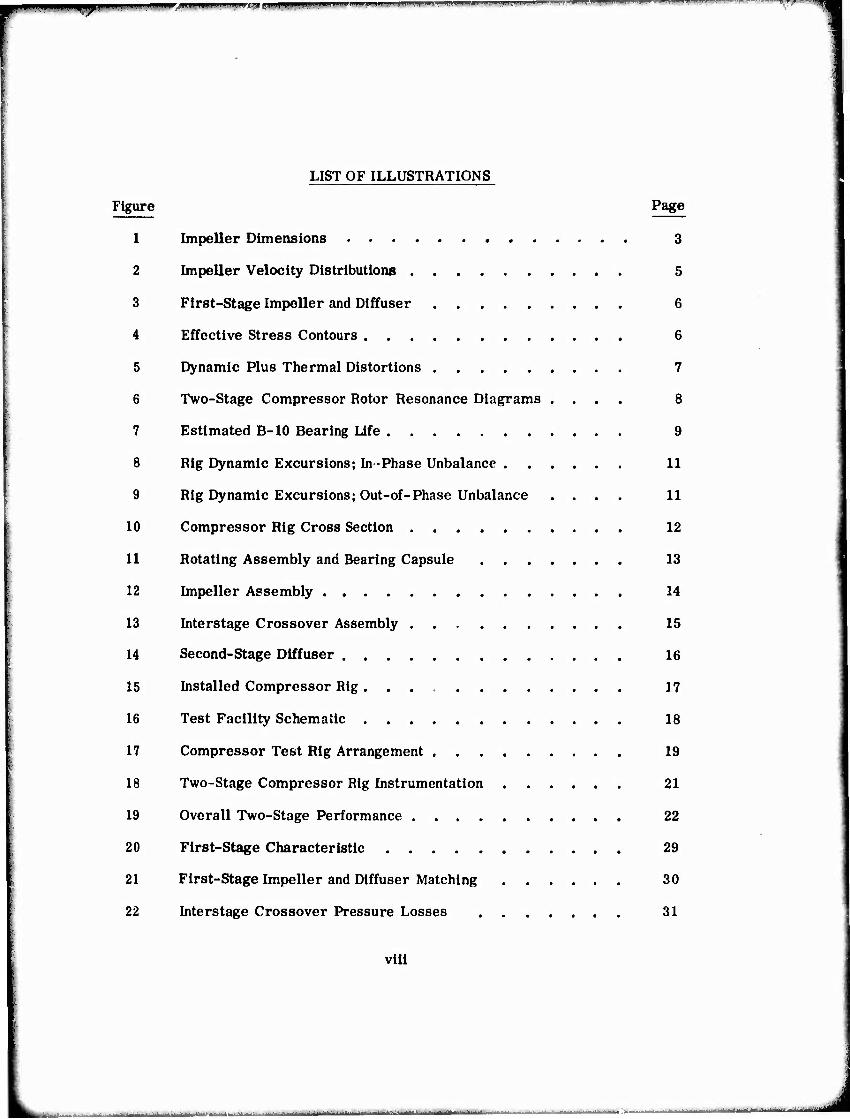
LIST OF ILLUSTRATIONS
Figure Page
1 Impeller Dimensions 3
2 Impeller Velocity Distributions 5
3 First-Stage Impeller and Diffuser 6
4 Effective Stress Contours 6
5 Dynamic Plus Thermal Distortions 7
6 Two-Stage Compressor Rotor Resonance Diagrams .... 8
7 Estimated B-10 Bearing Life 9
8 Rig Dynamic Excursions; In -Phase Unbalance 11
9 Rig Dynamic Excursions; Out-of-Phase Unbalance .... 11
10 Compressor Rig Cross Section 12
11 Rotating Assembly and Bearing Capsule 13
12 Impeller Assembly 14
13 Interstage Crossover Assembly . . , 15
14 Second-Stage Diffuser 16
15 Installed Compressor Rig... 17
16 Test Facility Schematic 18
17 Compressor Test Rig Arrangement 19
18 Two-Stage Compressor Rig Instrumentation 21
19 Overall Two-Stage Performance 22
20 First-Stage Characteristic 29
21 First-Stage Impeller and Diffuser Matching 30
22 Interstage Crossover Pressure Losses 31
viii
.- HUM _—j».
1 ■■""■'■ rnimm -,.iiiii,i.nii 11.111. i uim i .i. »iii .muiiii-i^.yii»nii^i,ii^i.iij ii«w,in»miijiiii^ini. ium« i.i"'.'w«"'■ ■-' '■"'.' i,i'Jj'l|)n.w«""i'™yn<
|
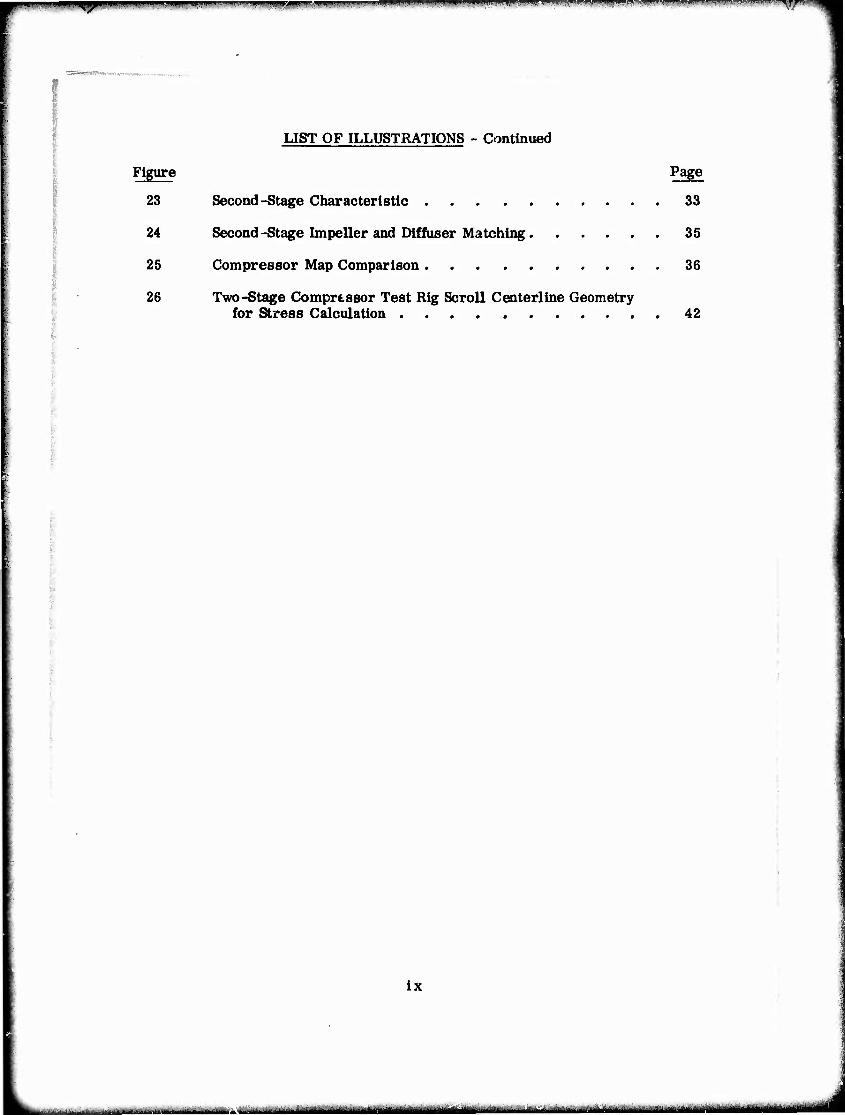
OST OF ILLUSTRATIONS - Continued
Figure Page
23 Second-Stage Characteristic 33
24 Second-Stage Impeller and Diffuser Matching 35
25 Compressor Map Comparison 36
26 Two-Stage Compressor Test Rig Scroll Centerline Geometry for Stress Calculation 42
ix
*■'■■■- -■-■ - - ■ ■ tn1- jMaa^Miii^iitMir .~^~*u~~M~*****mä***m***a niiiimriiiiiiaiiiiimiiiiiiilifii mtm

■PWl^'"""'"'""" mmummimm mw ——™-^" -"-^ - ■■■ V'""^
WWWftWWW^''?-' tgTVWWeWMWw «wt'irp r»*«)^i. ■.,
LIST OF TABLES
Table Page
I Two-Stage Compressor Aerodynamic Design Parameters . , 4
II Instrumentation for Monitoring and Control of Two-Stage Compressor Rig 23
HI Instrumentation for Determination of Two-Stage Compressor Big Performance 24
IV Compressor Test Performance Parameters 26
V Compressor Performance Comparisons 37
VI Computer Evaluation of Two-Stage Compressor Performance. 49
VII Computer Evaluation of First-Stage Performance .... 50
VIII Computer Evaluation of Second-Stage Performance ... 51
|f|1t->J,^^., .a.^...J^,.J„^..:;.....:....-..,...^,
•"W^WW^I^WW" i ■ || I , IUIL |...l>ia I !• " l !■.. ........i ■ |.M ,..,„,...-. ,.* ,, ..„.l r— ^y^
A
b
C
CF
cfs
Cp
CP
D
DF
DP
E
F
g
Had
J.
K
KSI
L
M
N
NS
P
q
RMS
RHO
RWD
s T
LIST OF SYMBOLS
Area, in.
Blade height, in.
Absolute velocity, ft/sec
Skin friction coefficient
Inlet volume flow based on stagnation pressure, ft /sec
Specific heat at constant pressure, 0.243 Btu/lbTl for air
_..,, .. Static pressure rise Diffuser static pressure recovery = m ^^ head
Diameter, in.
Diffusion factor
Design point
Exit
Axial thrust, lb
Gravitational constant, 32.2 ft/sec2
Adiabatic head, JCp ATa(j ft
Joules equivalent, of heat, 778 ft-lb/Btu
Constant for axial thrust calculation
Thousands, lb/in.
Impeller blade flow path length, in.
Mach number
Rotational speed, rpm
Specific speed, rpm» cfs *
Pressure, lb/in,2
Work factor, gJCpAT/U22
.Had-0.75
Root mean square
Density, lb/ft3
Diffuser relative flow parameter, W/T
~Äjrn i A p '3 3
3/_WT3 (M, 1.0)
Static flow conditions (also STA)
Temperature 0F, "R, or stagnation flow conditions (also TOT)
xi
„.^ . -. u~^_

■ i. II 1.11.III II III — ■ r ' ■ "'■ ,— --- - i ■ ii n mi i i ■ ■■».■■ii»—
1
LIST OF SYMBOLS - Continued
U Blade tip speed, ft/sec
uts Ultimate tensile strength, lb/in.2
W Airflow, lb/sec; also
Relative velocity, ft/sec
Z Impeller blade number
a
ß Y
A
5
1
6
üi
Air angle (relative to axial direction), deg
Blade angle (relative to axial direction), deg
Specific heat ratio, 1.395
Difference
Inlet relative pressure, psia/14.7
Efficiency (ETA), based on temperature rise Inlet prewhirl (THETA); also Met temPerature °R
DX9 „, ■ . .. Effective area Blockage fraction, teometrical area (LAM)
Impeller pressure loss coefficient
SUBSCRIPTS
1 Impeller inlet
2 Impeller tip
3 Vaned diffuser throat
4 Vaned diffuser exit
C Compressor
E Exit
H Inducer hub
S Inducer shroud
ad Adiabatic
xii
- -^ ■ iI'MMHIW -- ■ i III...I..II
^^^•mmim^mf 11 iinmmmmm r——"- |
INTRODUCTION
■
Extensive studies of various methods of obtaining pressure ratios between 10 and 20:1, with airflows ranging from 2.0 to 5.0 pounds per second (pps), for advanced, small, low-cost gas turbines were conducted at Solar during the period 1969-1971. Three basic compressor configurations were examined:
• Single-stage axial transonic plus single-stage centrifugal
• Two-stage axial transonic plus single-stage centrifugal
• Two-stage centrifugal
The results of these studies indicated that up to overall pressure ratios of 14.0:1, the two-stage centrifugal compressor configuration could probably provide equal performance to the two-stage axial transonic plus centrifugal stage, and probably would not require variable geometry to obtain adequate surge margin for advanced gas turbine application.
Preliminary matching studies were conducted for a two-stage centrifugal-compres- sor configuration, using as a baseline individual stage characteristics for existing high- and low-specific-speed compressor designs developed at Solar in 1970. Matching analysis showed that it should be possible to obtain an overall compres- sor f fficiency of 79 percent, at 14.0:1 pressure ratio, with an airflow of 2.0 pps and a rotational speed of 82,000 rpm, with components scaled from existing 1970 designs.
As the result of an unsolicited approach to the Eustis Directorate, USAAMRDL, a compressor research program was procured to design, fabricate, and test such a two-stage centrifugal compressor. The compressor design approach, test pro- cedures and performance, and the results of various analytical studies performed are presented in this report.

I W'/ ■ ' ' '" ■■' "ll» .— -■-'■'■," ■—""—' ' ^r-
DISCUSSION OF WORK PERFORMED
AERODYNAMIC DESIGN
The two-stage centrifugal compressor was designed for the following overnll performance:
Pressure ratio
Inlet corrected airflow, lb/sec
Rotational speed, rpm
Overall adiabatic efficiency, percent
14.0 (total - total)
2.05
82,000
79 (total - total)
This level of performance was to be obtained by using first- and second-stage com- pressor designs scaled from existing baseline high- and low-specific-speed com- pressor types previously developed at Solar. The only new aerodynamic compon- ent required, the interstage crossover, was designed with turning vanes to reduce the entry swirl to the second-stage impeller to 7.0 degrees with a minimum of total pressure loss. The design of the interstage crossover duct was based upon similarity with existing Solar multi-stage centrifugal compressor crossovers.
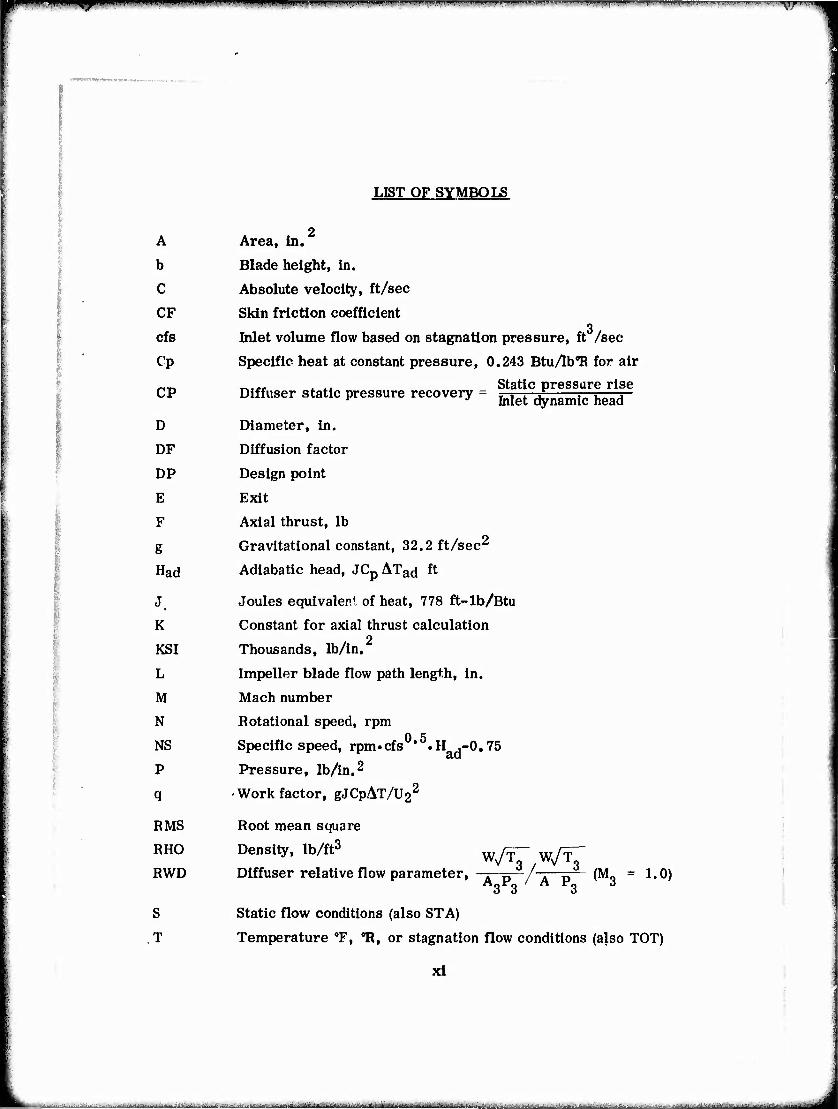
The respective scale factors required for each stage to give design point perfor- mance were 0.8 and 1.266, with impeller tip diameters of 5. 06 and 4.75 inches. The meridional dimensions of the scaled compressors are given in Figure 1. Both impellers from which the two-stage compressor was scaled are typical of the latest generation of small centrifugal compressors which employ 40 degrees of blade backsweep (relative to radial direction) at the tip. Using advanced design techniques coupled with extensive testing, this type of design has consistently ex- hibited high efficiencies with extended flow range at stage pressure ratios up to 6.0.
The design point aerodynamic dntails for both stages are listed in Table I. First- stage pressure ratio and specific speed were 4.9 and 116. Second-stage pressure ratio and specific speed were 2.86 and 69.0. Estimated impeller blading velocity distribution plots for each stage are shown in Figure 2.
Nineteen vanes of relatively high solidity were selected for the crossover turning vanes to accomplish an air turning from 63 degrees at the inlet to a residual exit swirl of 7.0 degrees (with rotation). Turning vane diffusion factor was 0.65 with an average absolute Mach number of 0.210.
■ ■■-■-■- - - ■ - -----— . ... M^^I—JM^iMMiaM^M
«nwMMi ■^ "" - "■ ••" ' " ' '■—"
1.44 D 1.60 D
Figure 1. Impeller Dimensions (inches).
The first-stage diffuser vanes were designed with 1.5 percent bleed-al- takeoff along the critical suction surface prior to the throat. The slot position and geom- etry were scaled from a similar-design channel diffuser on an advanced experi- mental Solar centrifugal compressor. The slot configuration is shown In Figure 3. Slot entry height is 0.009 to 0.011 inch.
MECHANICAL DESIGN
Impeller Stress Analysis
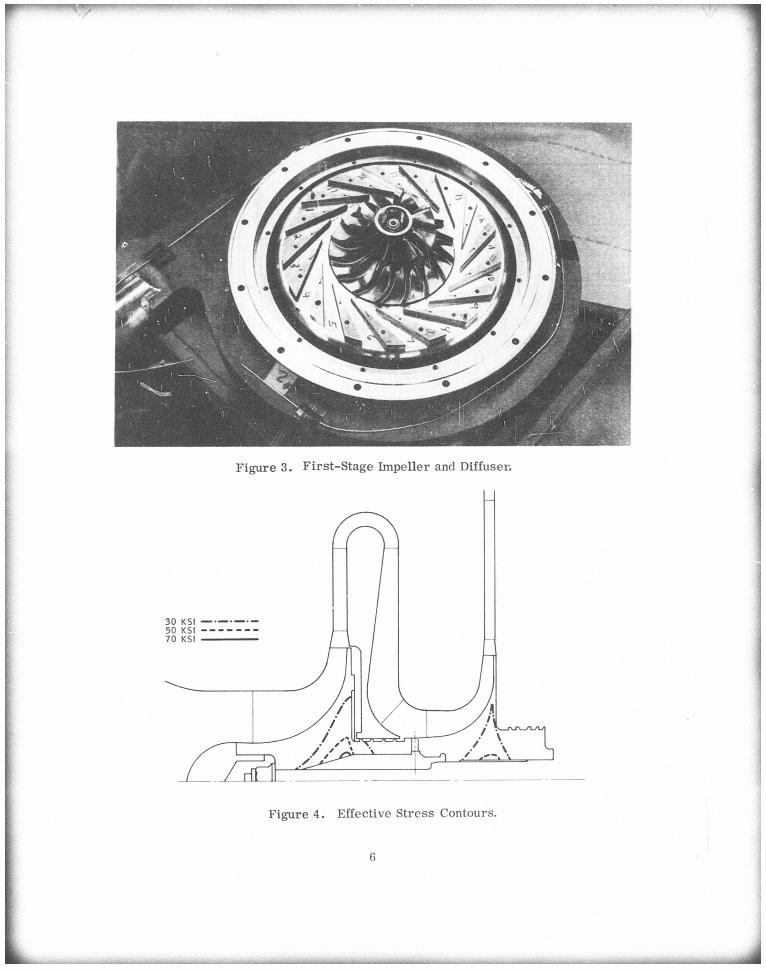
First- and second-stage impeller disc stresses and blade distortions were computed employing a finite-element stress program, and are shown on Figures 4 and 5 respectively. Maximum effective stresses at design speed and material uts limitations are listed below:
STAGE EffifiJ S££QKD Maximum effective stress (hub), KSI 76.4 52.4 Material TI6A4V T16242
Ultimate tensile strength, KSI 140 140
MHMMMH „.„__

■V —— —— ——■■■"■"■"■'■'■ ■ '
TABLE I. TWO-STAGE COMPRESSOR AERODYNAMIC DESIGN PARAMETERS
1ST STAGE 2ND STAGE
Inlet pressure, lb/In, 14.7 72.0
Inlet temperature, 0F 60 425
Inducer tip diameter, in. 3.376 2.615
Inducer hub diameter, in. 1.44 1.59
Inducer tip Mach number 1.248 0.69
Inducer RMS Mach number 1.027 0.59
Inducer RMS air angle, deg 56.0 59.5
Inducer RMS incidence, deg +7.0 +9.5
Impeller tip Mach number 0.95 0.78
Impeller tip speed, ft/sec 1810 1700
Impeller tip diameter, in. 5.06 4.75
Impeller tip width. In. 0.296 0.180
Impeller tip air angle, deg 71.2 74.7
Impeller tip blade angle, deg 40.0 40.0
Impeller efficiency, % 86.0 91.0
Diffuser leading edge diameter, in. 5.70 5.32
Diffuser inlet Mach number 0.738 0.605
Diffuser throat/exit area ratio 1.83 2.26
Diffuser throat/length ratio 5.3 9.1
Diffuser exit diameter, in. 8.3 10.6
Diffuser exit Mach number 0.31 0.215
Overall diffuser static recovery 0.79 0.73
Corrected airflow, lb/sec 2.05 0.545
Stage pressure ratio 4.9 2.86
Stage efficiency, % 81.0 83.6
Stage specific speed, rpm v/cfs ft3/4
116 69.0
Work factor, q 0.68 0.760
- - .,,.-..

_
o o 00 Q
UJ
o
Q < UJ
o -I vO S
o
U. X 1- <
o 0. ai ^r 5 o
d .2
_l ■u li- 3
s o CO
* *
s
o « CO >
s^ o. o ■ 6 -o
< »'-H
O • a: <N x (- a> ? ^
o o be ^r
X
5
fc
o o (VJ _i
SdJ -S3lll30n3A3AliV13a
I
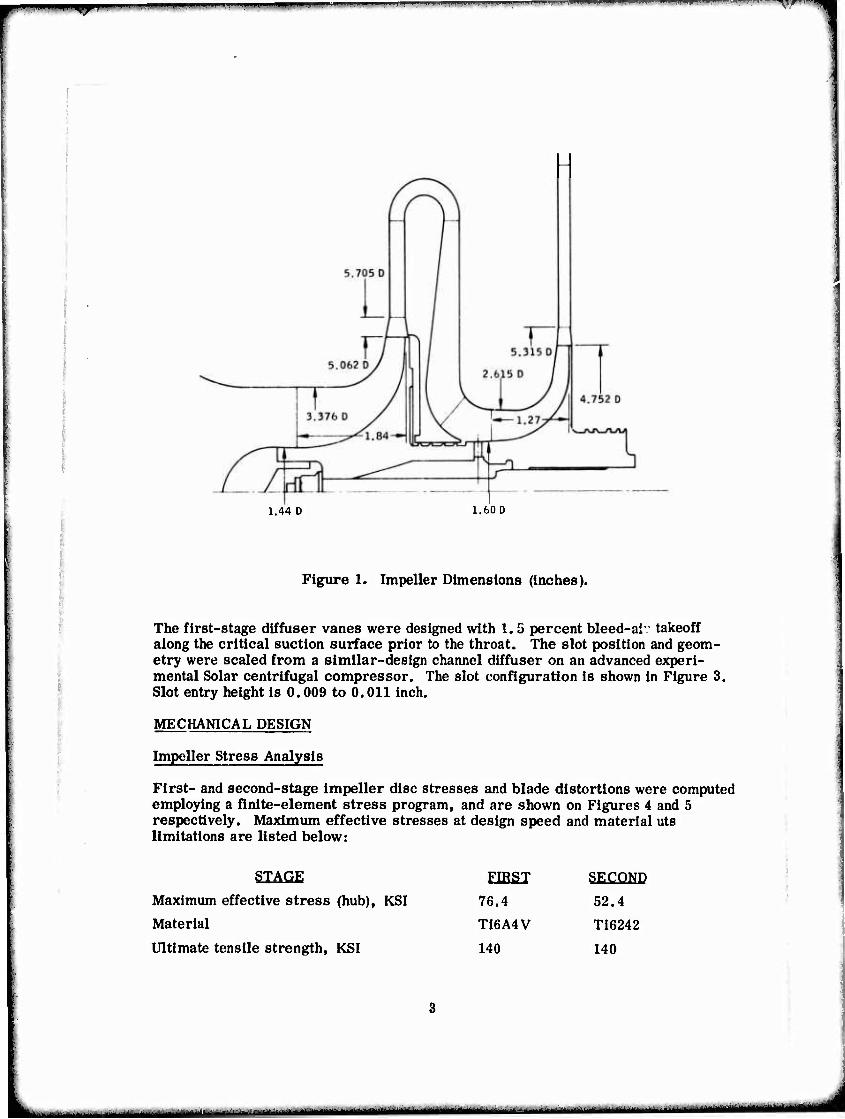
Figure 3. First-Stage Impeller and Diffuser.
30 KSI 50 KSI 70 KSI
Figure 4. Effective Stress Contours.

»——-"-"—"■—'—' "—r~ ww- "* • •
0.0005 0.0015
Figure 5. Dynamic Plus Thermal Distortions (inches).
X 75 = 87 KSI
Experimentally determined maximum blade stresses for the baseline first-stage design were 75 KSI in the same material at an equivalent tip speed of 1675 fps. Design tip speed for the scaled first stage was 1810 fps, increasing blade stresses to
/moV 11675/
Blade stresses were not experimentally determined for the baseline second-stage impeller with the same sweepback, but will be lower than the first stage since the blade heights are relatively smaller with a lower specific speed design.
Impeller Resonance Diagrams
Impeller resonance diagrams for the first and second stages were constructed, based upon vibration shaker table data of the baseline compressors at the first flap mode of the inducer. Figure 6 shows that the first stage is clear of any excitation that may arise from 17-vane diffusers downstream.
The second-stage impeller couJd possibly be excited by either the 19 vanes of the interstage duct or the 15 vanes of the diffuser downstream between 50 and 65 per- cent design speed.
- — -~ - - ■

""■-1 ■• ' —r.~~^——T-»——^——»————r«™——^.^——.
?0,000
15,000
10,000
x > u z UJ
a UJ a: u.
5000 -
FIRST FLAP MODE INDUCER ©HZ RISE DUE TO
CENTRIFUGAL LOADING
SHORT BLADE
LONG BLADE
3000
2000
1000
15E
10E
40 60 SHAFT SPEED-THOUSANDS RPM
40 60 80 90 100 DESIGN SPEED-%
Figure 6. Two-Stage Compressor Rotor Resonance Diagrams.
100
- UMBBMMMMI ■aaaaaiai -
■^ «wv* ■ i ——— '—■ n Bearing and Seal Design
A straddle-mounted compressor and turbine system with the two compressor stages cantllevered from the front bearing was selected after preliminary dynamic calcu- lations had Indicated that the amount of overhang was acceptable. This arrange- ment permits a clean Inlet to the first-stage compressor, and simplifies compon- ent assembly.
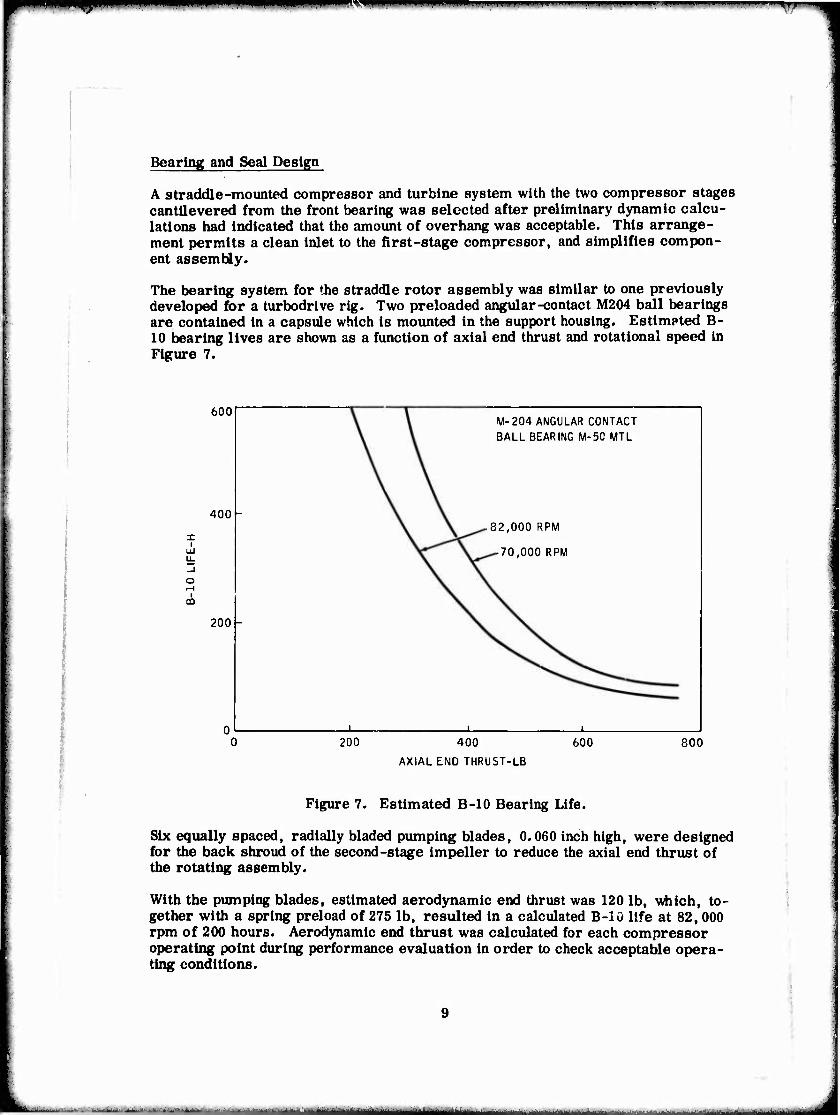
The bearing system for the straddle rotor assembly was similar to one previously developed for a turbodrlve rig. Two preloaded angular-contact M204 ball bearings are contained In a capsule which Is mounted In the support housing. Estimated B- 10 bearing lives are shown as a function of axial end thrust and rotational speed In Figure 7.
600
400
i UJ
CO
200
M-204 ANGULAR CONTACT BALLBEARING M-50 MTL
.82,000 RPM
• 70,000 RPM
200 400
AXIAL END THRUST-LB
600 800
Figure 7. Estimated B-10 Bearing Life.
Six equally spaced, radially bladed pumping blades, 0.060 inch high, were designed for the back shroud of the second-stage Impeller to reduce the axial end thrust of the rotating assembly.
With the pumping blades, estimated aerodynamic end thrust was 120 lb, which, to- gether with a spring preload of 275 lb, resulted In a calculated B-10 life at 82,000 rpm of 200 hours. Aerodynamic end thrust was calculated for each compressor operating point during performance evaluation in order to check acceptable opera- ting conditions.
9
■ - -■ ■■— ■■ - - ..- . ■■.
■^ '"■>' ■ %'TT '
Thermocouples v.cre installed on the bearing outer races and connected to an auto- matic shutdown dewoe in the event of excessive operating temperatures.
All three aerodynamic seals are of the rub-in labyrinth type, SAE 64 (80/10/10). Bronze was selected for the seal material. The turbine-end oil labyrinth is buffered by shop air. The compressor-end lube oil seal has bleed-down capability, and Is further assisted by six blades Incorporated In the reverse face of the second- stage Impeller. The pressure gradient generated by these blades, besides minimi- zing aerodynamic thrust loads, serves to reduce the seal pressure differential. The Interstage seal la unbuffered.
Rotor Dynamic Response
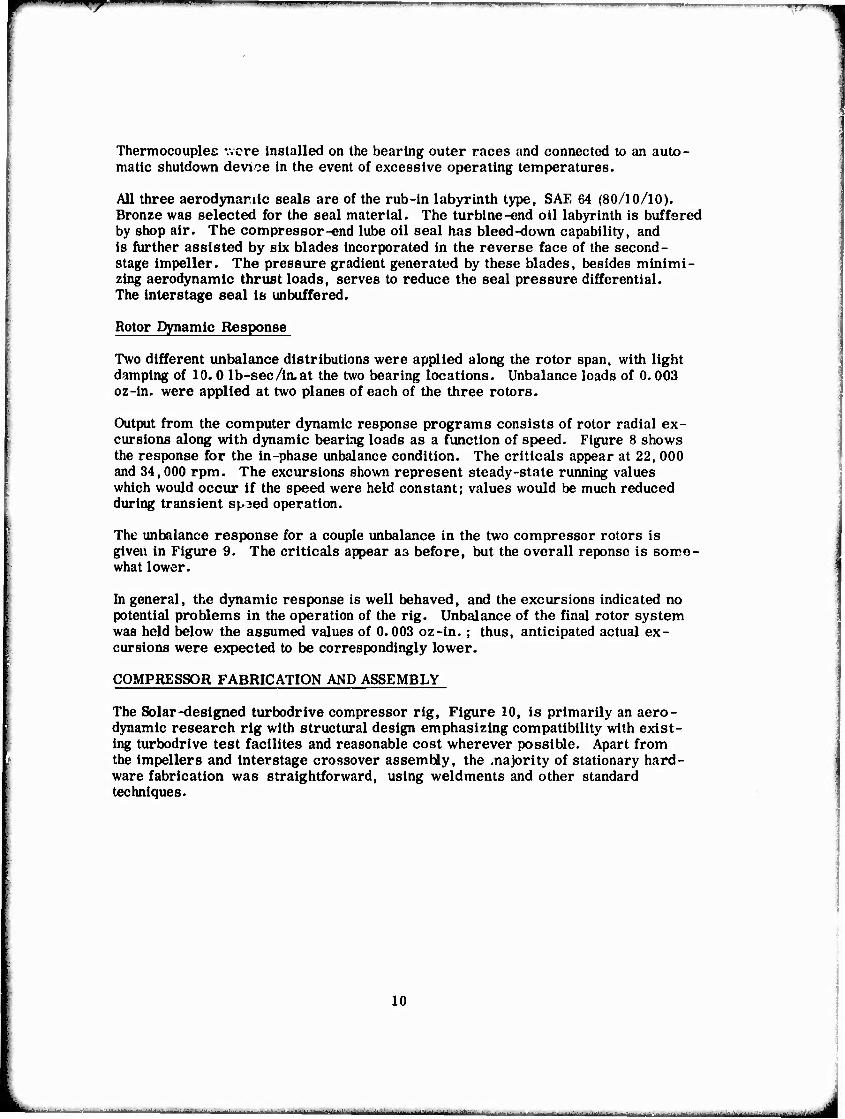
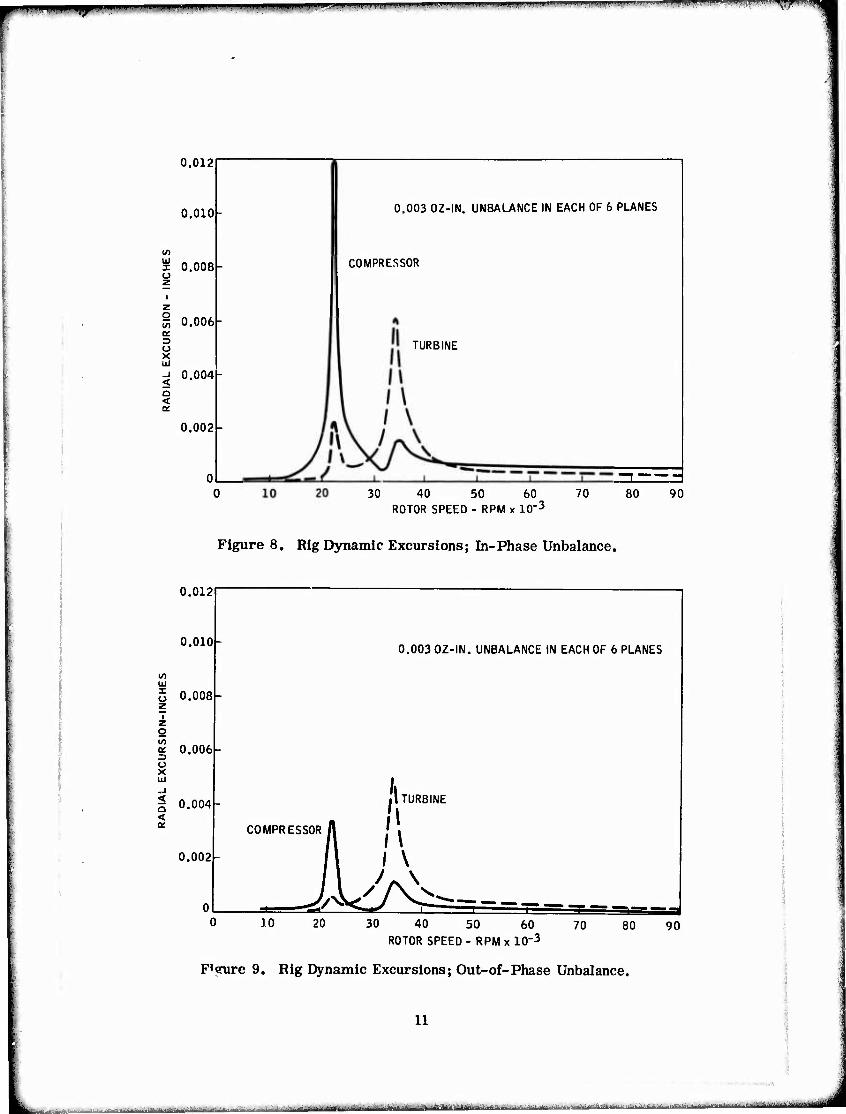
Two different unbalance distributions were applied along the rotor span, with light damping of 10. 0 lb-sec/in. at the two bearing locations. Unbalance loads of 0.003 oz-ln. were applied at two planes of each of the three rotors.
Output from the computer dynamic response programs consists of rotor radial ex- cursions along with dynamic bearing loads as a function of speed. Figure 8 shows the response for the In-phase unbalance condition. The critlcals appear at 22, 000 and 34,000 rpm. The excursions shown represent steady-state running values which would occur If the speed were held constant; values would be much reduced during transient s).oed operation.
The unbalance response for a couple unbalance In the two compressor rotors Is given In Figure 9. The critlcals appear a3 before, but the overall reponse Is some- what lower.
In general, the dynamic response is well behaved, and the excursions Indicated no potential problems In the operation of the rig. Unbalance of the final rotor system was held below the assumed values of 0.003 oz-ln. ; thus, anticipated actual ex- cursions were expected to be correspondingly lower.
COMPRESSOR FABRICATION AND ASSEMBLY
The Solar-designed turbodrive compressor rig, Figure 10, Is primarily an aero- dynamic research rig with structural design emphasizing compatibility with exist- ing turbodrive test facllites and reasonable cost wherever possible. Apart from the Impellers and interstage crossover assembly, the majority of stationary hard- ware fabrication was straightforward, using weldments and other standard techniques.
10
i mil. w<,mnm,^m«mmmKi*mm.mmmm.*mm«M"" <<•****• Wm,|iiiwiiiiWMi i 11 ,i iimniiM'i nn .^IIWWBWII»... nijyyii- ■
0.012
o.oioh
x 0.008 u
B, 0.006
o X UJ
J 0.004 a < a:
0.002
0.003 OZ-IN. UNBALANCE IN EACH OF 6 PLANES
COMPRESSOR
TURBINE
30 40 50 60 ROTOR SPEED - RPM x 10-3
80 90
Figure 8. Rig Dynamic Excursions; In-Phase Unbalance.
10 UJ T o
o (A a. Z3 Ü X UJ
-J
< Q <
0.012
0.010 - 0.003 OZ-IN. UNBALANCE IN EACH OF 6 PLANES
0.008 -
0.006 -
0.004 _ .i TURBINE
COMPRESSOR A
0.002 /
0 1 10 20 30 40 50 60
ROTOR SPEED - RPM x 10-3 70 80 90
F'trure 9. Rig Dynamic Excursions; Out-of-Phase Unbalance.
11
^..._.._._^_ — - — - - ^—^. ^. „^„.ju^uU.lU.
fflp w ■ iii.^i,fPIWPBPIBpipip^^»!IIPimippi «spw I pi I ..,¥.«<..».<.R.«;.,^^.,.,..,.,, MF
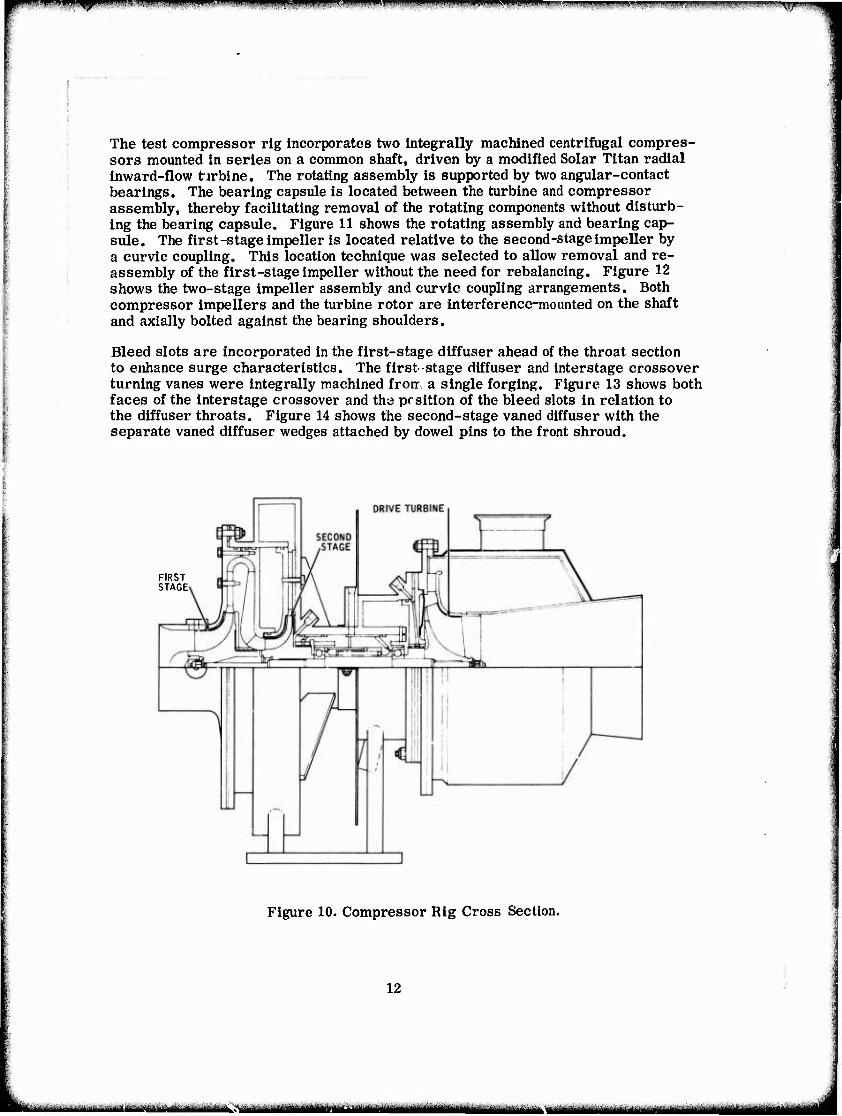
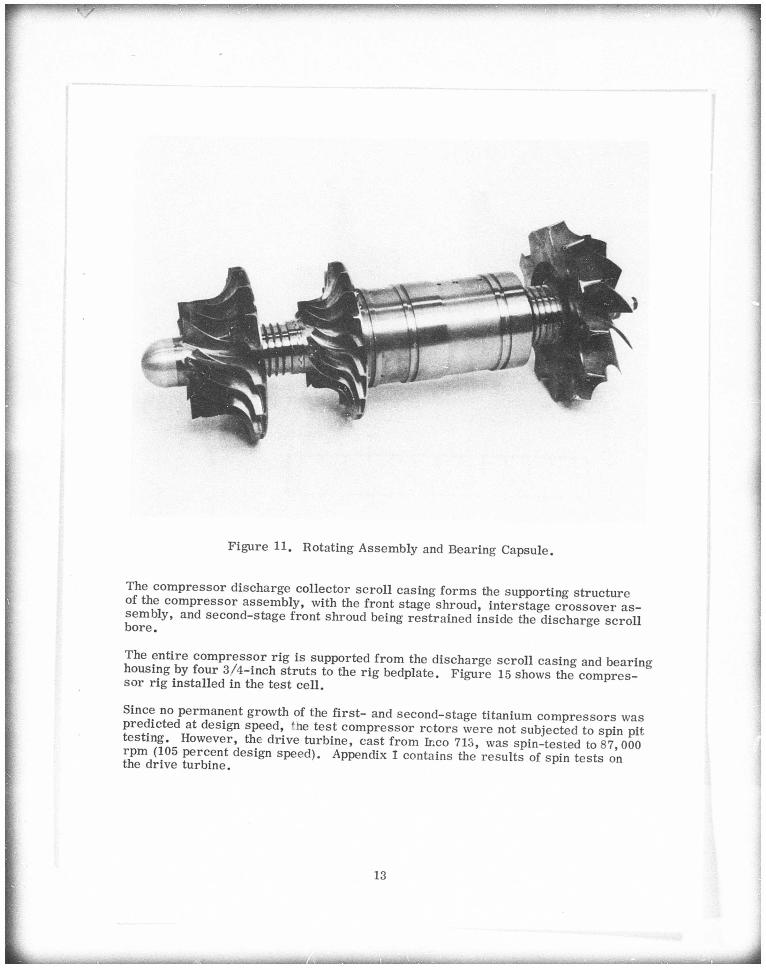
The test compressor rig Incorporates two Integrally machined centrifugal compres- sors mounted in series on a common shaft, driven by a modified Solar Titan radial inward-flow tirbine. The rotating assembly is supported by two angular-contact bearings. The bearing capsule is located between the turbine and compressor assembly, thereby facilitating removal of the rotating components without disturb- ing the bearing capsule. Figure 11 shows the rotating assembly and bearing cap- sule. The fir st-stage impeller is located relative to the second-stage impeller by a curvic coupling. This location technique was selected to allow removal and re- assembly of the first-stage impeller without the need for rebalancing. Figure 12 shows the two-stage impeller assembly and curvic coupling arrangements. Both compressor impellers and the turbine rotor are interference-mounted on the shaft and axially bolted against the bearing shoulders.
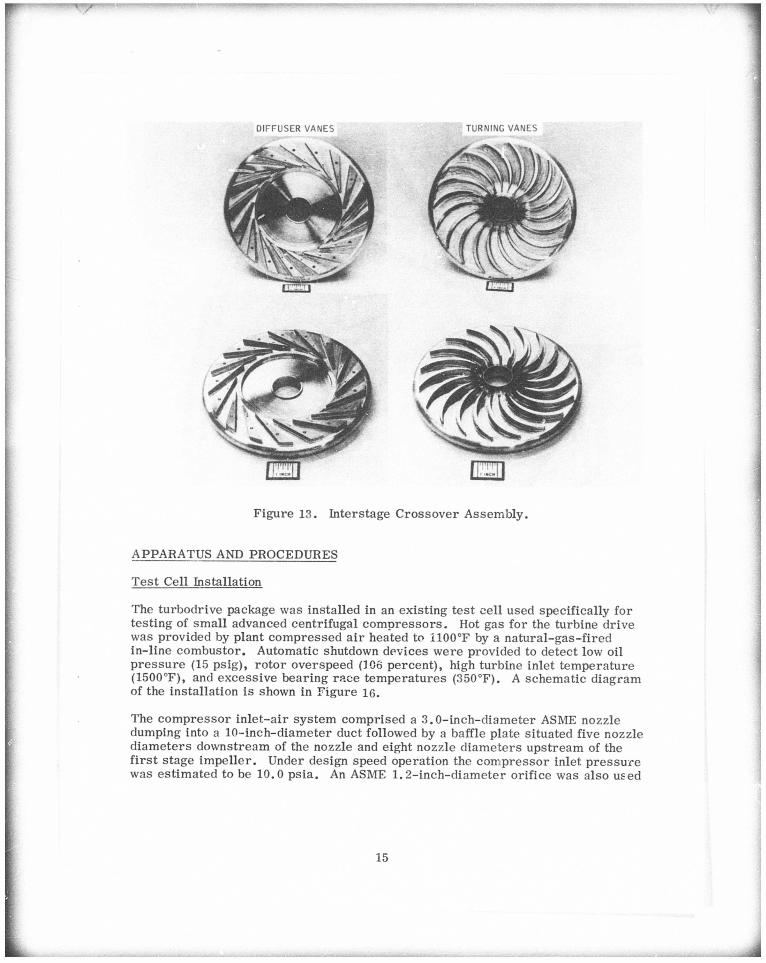
Bleed slots are incorporated in the first-stage diffuser ahead of the throat section to enhance surge characteristics. The first-stage diffuser and interstage crossover turning vanes were integrally machined fron, a single forging. Figure 13 shows both faces of the interstage crossover and tha prsition of the bleed slots in relation to the diffuser throats. Figure 14 shows the second-stage vaned diffuser with the separate vaned diffuser wedges attached by dowel pins to the front shroud.
FIRST STAGE
Figure 10. Compressor Rig Cross Section.
12
--^—^—^-^ - ii ii iiiiiii iiuiiiiiütMlii ^ mm*mmmmg
r •W-W-K 1
Figure 11. Rotating Assembly and Bearing Capsule.
The compressor discharge collector scroll casing forms the supporting structure of the compressor assembly, with the front stage shroud, interstage crossover as -sembly, and second-stage front shroud being restrained inside the discharp-e scroll bore.
The entire compressor rig is supported from the discharge scroll casing and bearing housing by four 3/4-inch struts to the rig bedplate. Figure 15 shows the compres-sor rig installed in the test cell.
Since no permanent growth of the f i r s t - and second-stage titanium compressors was predicted at design speed, tne test compressor rotors were not subjected to spin pit esting. However, the drive turbine, east from Inco 713, was spin-tested to 87, 000
r r , ( 1 ° 5 Pe r1
c .en t d e s i £ n speed). Appendix I contains the results of spin tests on the drive turbine.
13

n i~n 1 i 1 i 6 INCHES n
Figure 12. Impeller Assembly.
^ ™ t a t i n g a s s embly were all individually dynamically bal-group assembly. " S U b S e q U 6 n t P a s s i v e balancing of the complete rotating
JhrJJahhl nTd S G C O n d ~ S t a g e i m P e l l e r front shrouds were plasma-sprayed with an critical sneer/"1"11"1 ^ P ° X y ™® t e r i a l t o minimize potential rubbing damage during
i f i r S t . - S , t a / e 3 n d s e cond-stage-impeller c o M r t r S S * tively on t h e ^ r s t assembly. V a r ' ° d "°m ° - 0 I 3 - ° - ° ' 9 0-010-0.0M respec-
14
f i r i- I fr A
W~ ' — v - r r
Figure 13. Interstage Crossover Assembly.
APPARATUS AND PROCEDURES
Test Cell Installation
The turbodrive package was installed in an existing test cell used specifically for testing of small advanced centrifugal compressors . Hot gas for the turbine drive was provided by plant compressed air heated to 1100°F by a natural-gas-fired in-line combustor. Automatic shutdown devices were provided to detect low oil pressure (15 psig), rotor overspeed (106 percent), high turbine inlet temperature (1500°F), and excessive bearing race temperatures (350°F). A schematic diagram of the installation is shown in Figure 16.
TURNING VANES DIFFUSER VANES
The compressor inlet-air system comprised a 3.0-inch-diameter ASME nozzle dumping into a 10-inch-diameter duct followed by a baffle plate situated five nozzle diameters downstream of the nozzle and eight nozzle diameters upstream of the f i rs t stage impeller. Under design speed operation the compressor inlet pressure was estimated to be 10.0 psia. An ASME 1.2-inch-diameter orifice was also used
15

STATIC TAPS
Figure 14. Second-Stage Diffuser

Figure 15. Installed Compressor Rig.
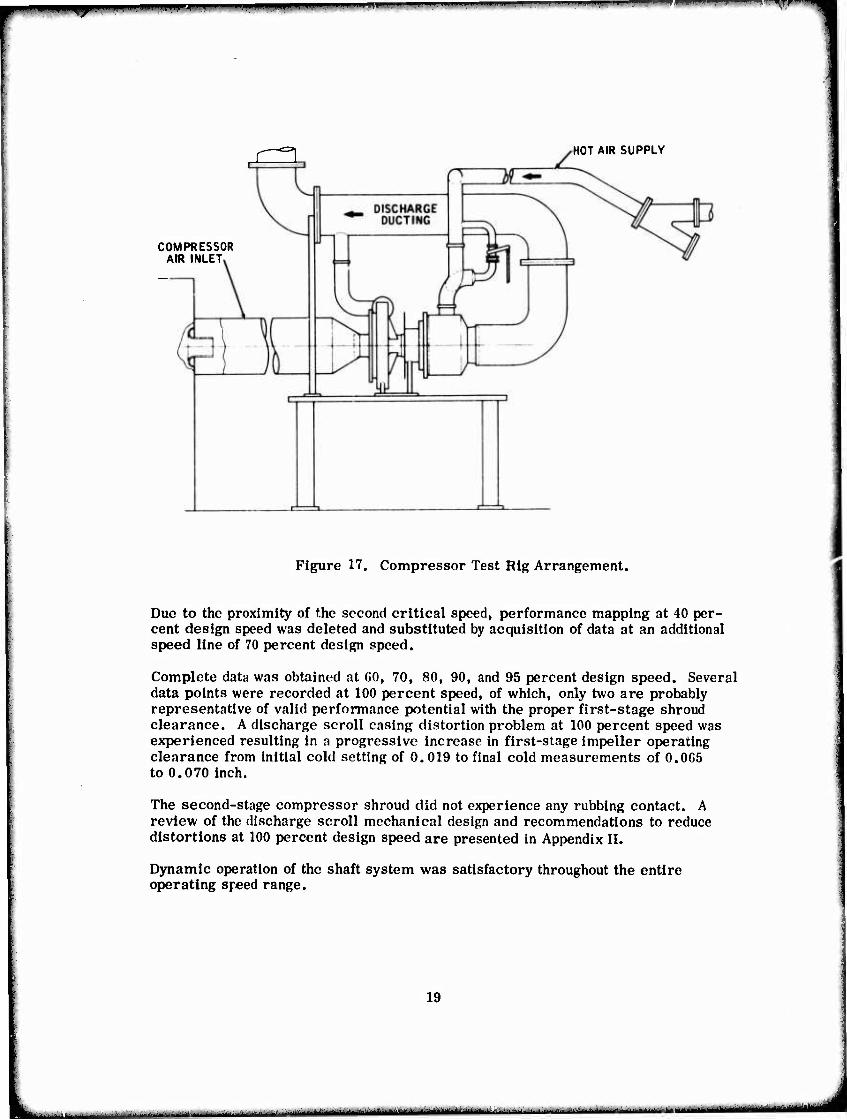
to measure compressor discharge flow, being placed in the discharge line down-stream of the compressor discharge collector. The arrangement of the turbodrive rig and its ducting is shown in Figure 17.
Test Procedure and Operation
The turbodrive package was initially subjected to a mechanical shakedown run up to 70 percent design speed past the predicted f irs t and second critical speeds at 27 and 42 percent design speed. The abradable first-stage shroud was inspected after the shakedown run and showed some slight evidence of abrasion along the in-ducer section.
The compressor performance was mapped by setting a predetermined corrected speed and gradually increasing the back pressure to determine the stable operating range. Approximately six data points evenly spaced between surge and choke were obtained for each speed line. Surge was determined audibly. Approximate time between each data point was 4 minutes.

mmmmmm^m
TEST CELL EXHAUST STACK
I1
DRIVE AIRFLOW ORIFICE
PRESSURE REGULATOR.
IN-LINE COMBUSTOR WITH IGNITION SYSTEM
SHUTS OFF AIR I ^ AND GAS SUPPLY
OVERSPEED DETECTION
4 SIGNAL
CONDITIONER ^ SPEED
READOUT
♦ WOODWARD GOVERNOR CONTROL
- SPEED
SELECTOR
FILTER GOVERNOR HYDRAULIC ACTUATOR
GEAR PUMP
WATER
Figure 16. Test Facility Schematic.
18
— --• « -^ , -■,., — ■.■>.■
Ulli ' I -rrr-
J^l HOT AIR SUPPLY
COMPRESSOR AIR INLET
Figure 17. Compressor Test Rig Arrangement. I 4
Due to the proximity of the second critical speed, performance mapping at 40 per- cent design speed was deleted and substituted by acquisition of data at an additional speed line of 70 percent design speed.
Complete data was obtained at 60, 70, 80, 90, and 95 percent design speed. Several data points were recorded at 100 percent speed, of which, only two are probably representative of valid performance potential with the proper first-stage shroud clearance. A discharge scroll casing distortion problem at 100 percent speed was experienced resulting in a progressive increase In first-stage impeller operating clearance from initial cold setting of 0. 019 to final cold measurements of 0.065 to 0.070 inch.
The second-stage compressor shroud did not experience any rubbing contact. A review of the discharge scroll mechanical design and recommendations to reduce distortions at 100 percent design speed are presented in Appendix II.
Dynamic operation of the shaft system was satisfactory throughout the entire operating speed range.
19
mm
wmmmmmmm im >■' ■■ ■■" ' ' ""- " ' ' " ' -'
Instrumentation
The instrumentation employed was divided into two categories:
1. Monitoring. Instrumentation required to monitor mechanical operation is list- ed in Table II.
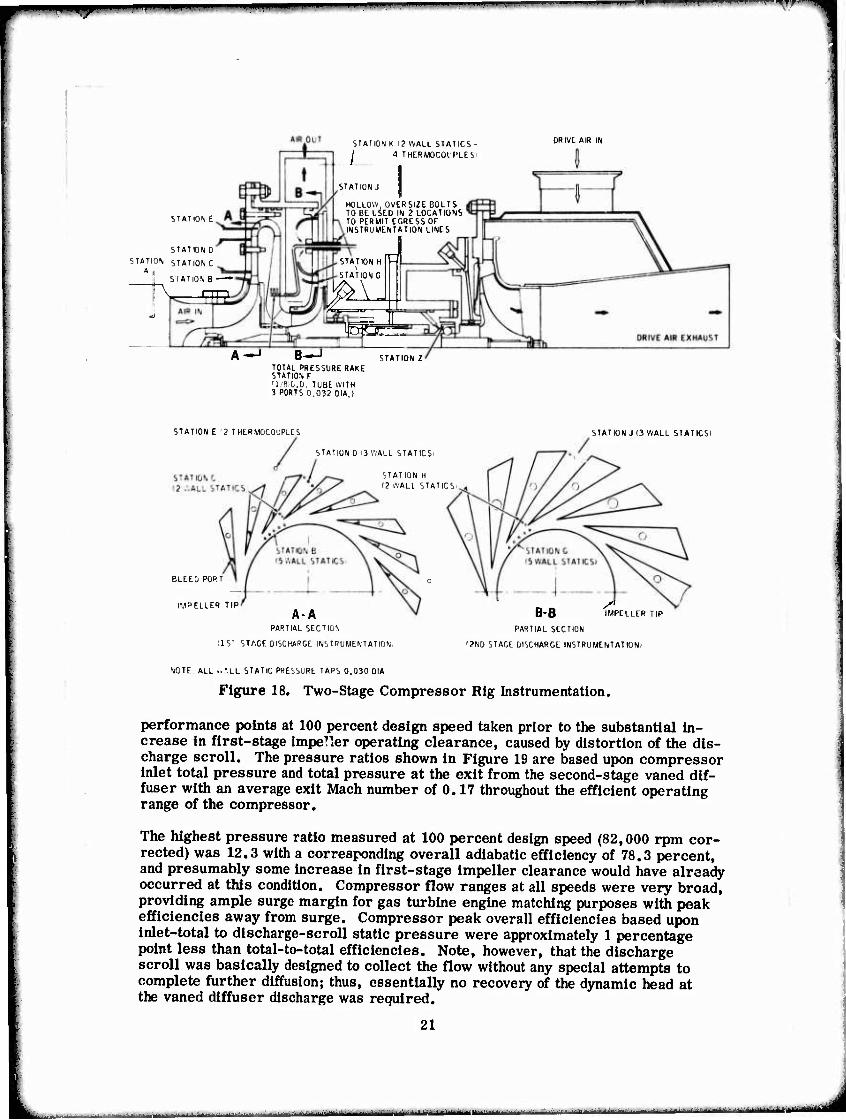
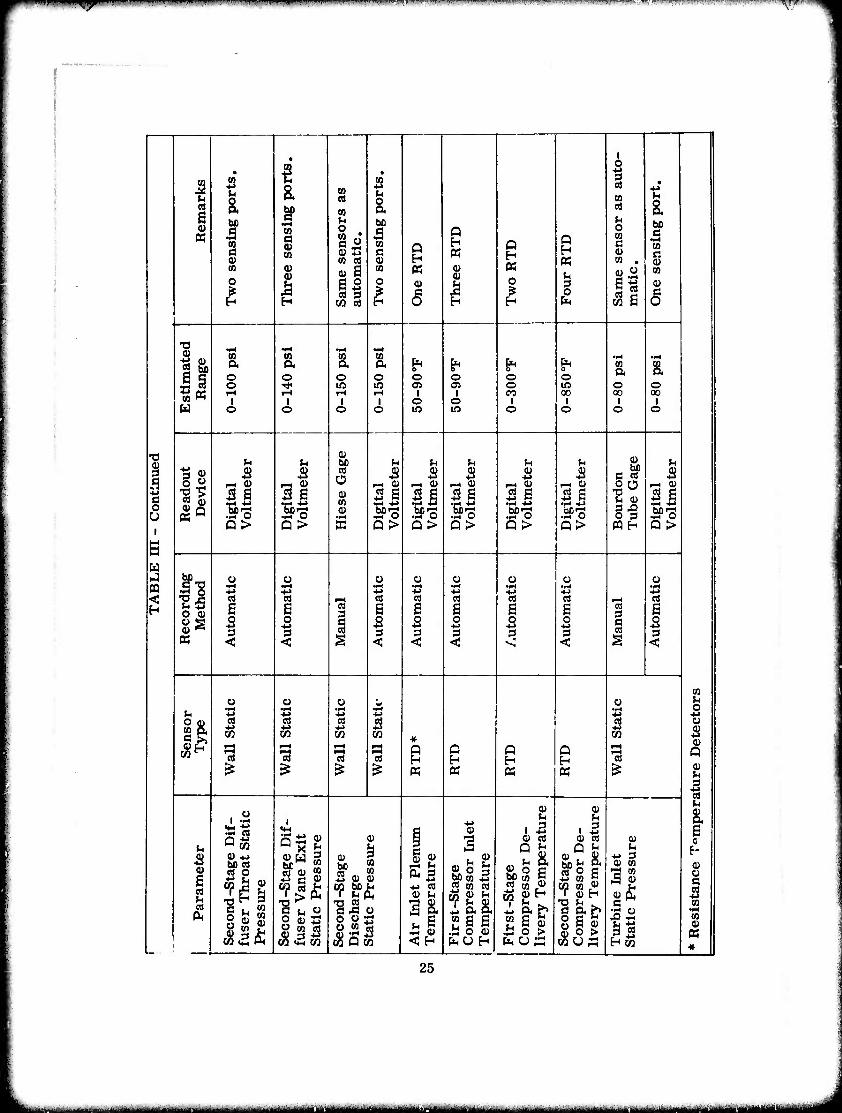
2. Definition of compressor performance. The instrumentation listed in Table III and shown in Figure 18 was used in determining compressor performance.
Due to the small sizes of the aerodynamic passages, the number of internal probes in the compressor flow pass was limited to three, comprising two resistance ther- mocouples at the first-stage crossover bend and a total-pressure rake at the cross- over turning vane exit. Basic reliance was upon static pressures to determine com- pressor performance characteristics. An error computation was conducted to de- termine the approximate limits of the instrumentation used to evaluate overall com- pressor efficiency. The results of the error computation are contained in Appendix III. Prior to installation in the test facility, the pressure transducer of the DAS sys- tem was calibrated in the instrument laboratory. Appendix IV lists the calibration results.
Calculation Procedure
The total pressure ratio, temperature rise ratio, and adiabatic efficiency were com- puted from the measured pressures and temperatures. Typical computer output and compressor performance parameters are listed in Appendix V. The stage and over- all efficiencies presented herein were calculated using a constant specific heat ratio of 1.395. The impeller and diffuser performances were calculated from the meas- ured static pressures at the impeller tip, diffuser throat, and diffuser exit. Flow continuity, flow area, impeller tip geometry, and temperature rise (allowing for disc friction and recirculation effects) were used to calculate average vector conditions at the impeller tip. Constant values of flow blockage were used f r effective flow area de - termination. The impeller and diffuser performances thus calculated were used basic - ally to assess relative component matching, without implicit acceptance of the cal- culated absolute efficiency and recovery levels.
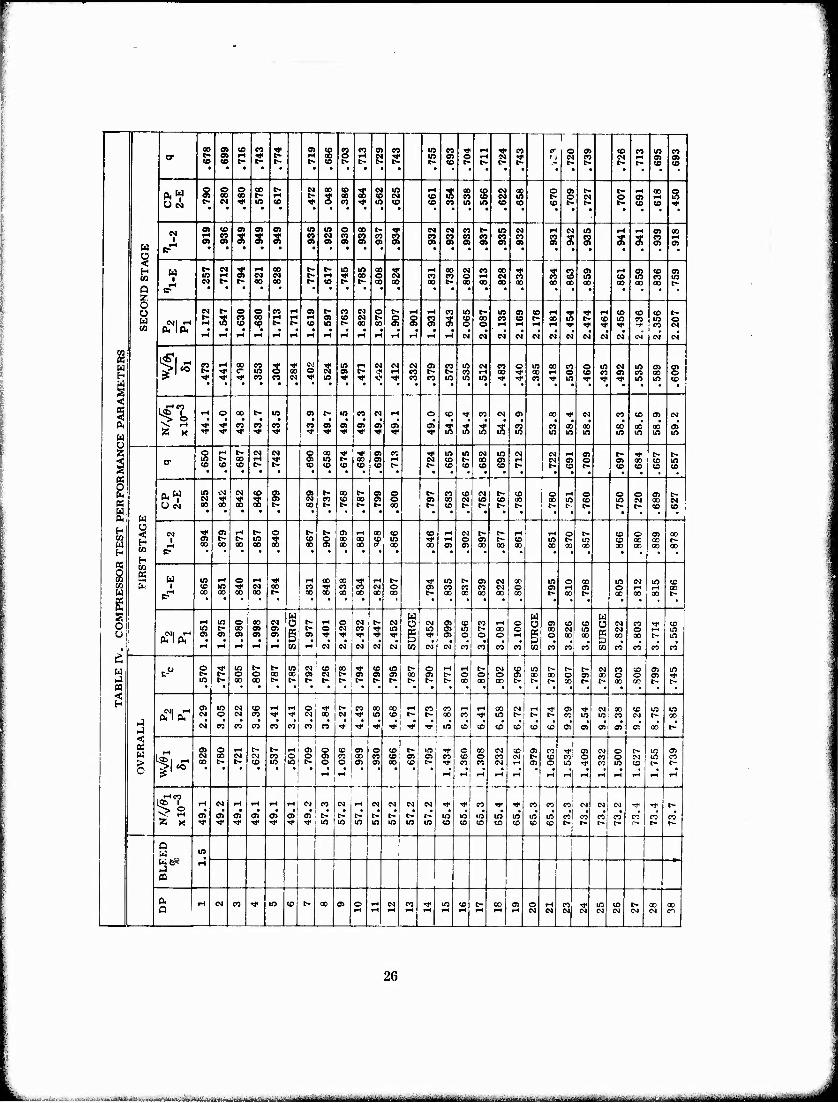
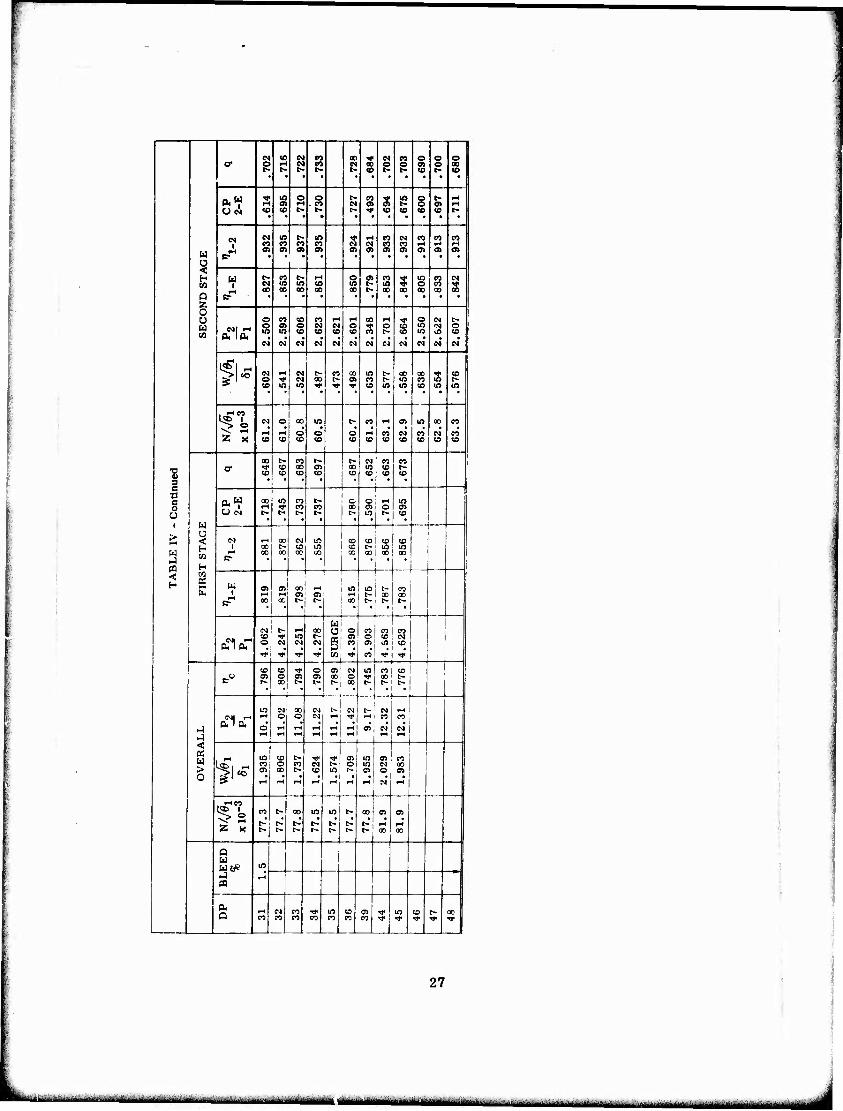
Basic compressor test performance parameters compiled from the computer output are listed in Table IV for 60, 70, 80, 90, 95, and 100 percent design speed.
TEST RESULTS
Sufficient instrumentation was installed on the turbodrive two-stage centrifugal com- pressor rig to determine both overall-compressor and individual-stage performances.
Overall Compressor Performance
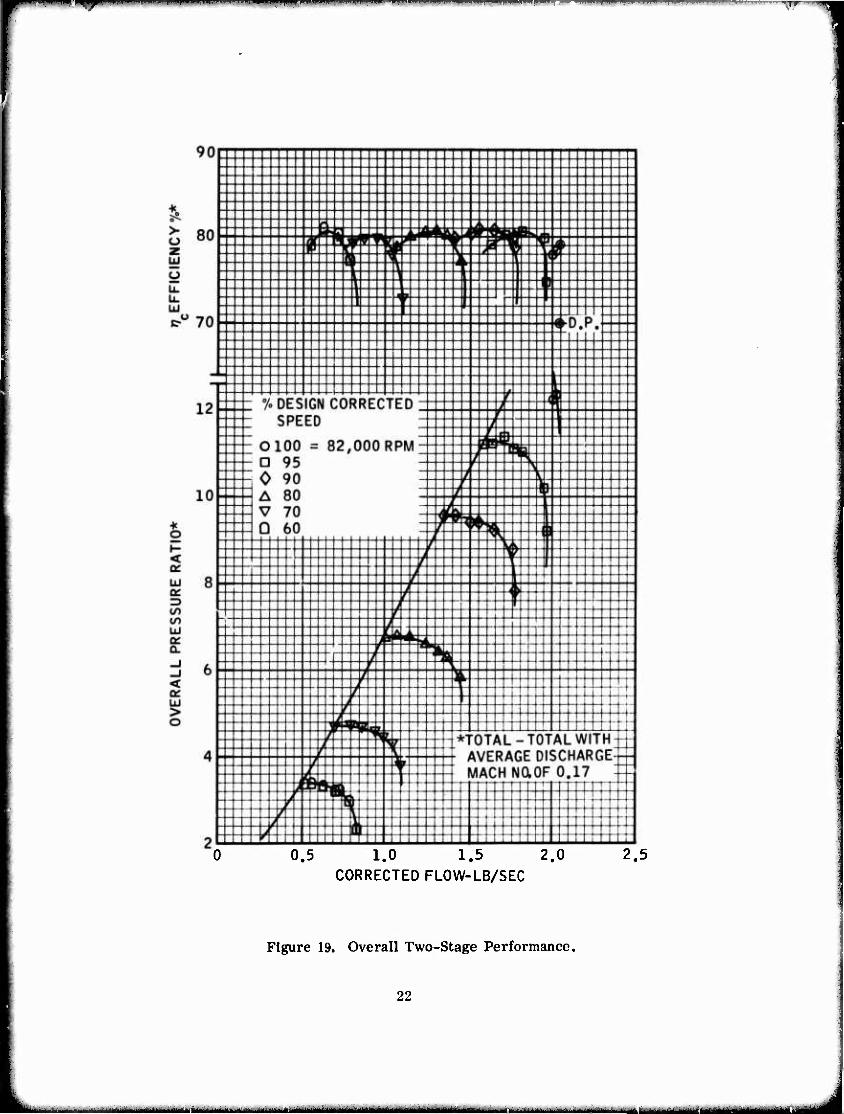
The corrected overall-compressor performance, measured with bleed take- off* prior to the first-stage vaned diffuser throat, is shown in Figure 19 for 60, 70, 80, 90, and 95 percent design speed. Also included are two
* Estimated bleed flow, based upon slot area and choking at the slot entry, with an entry pressure equal to diffuser exit total pressure was within the range of 1.5 to 2.0% first-stage inlet flow.
20
t^^^mmm 'wr-r
STATIO\E
STATION K (? WALL STATICS-
/ 4 THtRMOCOt'PLES
DRIVE AIR IN
STATION J
HOLLOW, OVERSIZE BOLTS TO BE USED IN 2 LOCATIONS TO PERMIT EGRESS OF INSTRUMENTATION LINES
STATION D
STATION STATION C A I I STATIONS ►
TATION H
STATION C
J ms
ipagg!
B-3" STATION Z
TOTAL PRESSURE RAKE STATION F 'IBiC.D. TUBE WITH 3 PORTS 0.032 DIA I
STATION E 2 THERMOCOUPLES
STATION D 13 WALL STATICS/
STATION H
(2 WALL STATICS
STATION J (3 WALL STATICSl
BLEECJ PORT
IMPELLER TIP A-A
PARTIAL SECTION
'IS' STAGE DISCHARGE INSTRUMENTATION.
IMPELLER TIP B-B PARTIAL SECTION
'2ND STAGE DISCHARGE INSTRUMENTATION
NOTE ALL ...".LL STATIC PRESSURE TAPS 0.030 DIA
Figure 18. Two-Stage Compressor Rig Instrumentation.
performance points at 100 percent design speed taken prior to the substantial in- crease in first-stage impeller operating clearance, caused by distortion of the dis- charge scroll. The pressure ratios shown in Figure 19 are based upon compressor inlet total pressure and total pressure at the exit from the second-stage vaned dif- fuser with an average exit Mach number of 0.17 throughout the efficient operating range of the compressor.
The highest pressure ratio measured at 100 percent design speed (82,000 rpm cor- rected) was 12.3 with a corresponding overall adiabatic efficiency of 78.3 percent, and presumably some Increase In first-stage Impeller clearance would have already occurred at this condition. Compressor flow ranges at all speeds were very broad, providing ample surge margin for gas turbine engine matching purposes with peak efficiencies away from surge. Compressor peak overall efficiencies based upon inlet-total to discharge-scroll static pressure were approximately 1 percentage point less than total-to-total efficiencies. Note, however, that the discharge scroll was basically designed to collect the flow without any special attempts to complete further diffusion; thus, essentially no recovery of the dynamic head at the vaned diffuser discharge was required.
21
-■
^_^^^^^j^^
Hmpi •■ ..- .—.—- ■—"■■■" -™—^Hl
0.5 1.0 1.5 2.0 CORRECTED FLOW-LB/SEC
Figure 19. Overall Two-Stage Performance.
22
—" J- - - .»A—*-*—M i^-...— .—~*—^— MBa^BM^a^M^ i ■Mum—MuMMMr———Mi

■i
TABLE II. INSTRUMENTATION FOR MONITORING AND CONTROL OF TWO-STAGE COMPRESSOR RIG
Parameter Sensor Type Readout Device
Estimated Range Remarks
Rotor Speed See r Pn Kl r» TTT . Automatic overspeed protection and read- out.
Rig Vibration Accelero- meter
Charge Amplifier
0-30g Installed adjacent to bearings. One ac- celerometer vertical and one horizontal.
Bearing Oil Supply Pressure
Wall Static Bourdon Tube Gage
20-40 pslg
Oil pressure less than 15 pslg to cause automatic shutdown.
Drive Air Orifice, Upstream Pres- sure
Wall Static Bourdon Tube Gage
0-100 pslg
Drive Air Orifice, Pressure Drop
Wall Static Water Mano- meter
Bearing Oil Supply Temperature
IC Full Shield Thermocouple
Self-Balancing Potentiometer
60-150 0F
Bearing Discharge Oil femperature
IC Full Shield Thermocouple
Self-Balancing Potentiometer
60-250 T
Turbine Inlet Temperature
CA Half Shield Thermocouple
Self-Balancing Potentiometer
0-1500
Turbine Exhaust Temperature
CA Half Shield Thermocouple
Self-Balancing Potentiometer
0-1100 0F
Bearing Outer Race Temperature
IC Bare Bead Thermocouple
Self-Balancing Potentiometer
0-300 T
One thermocouple at each bearing.
Drive Air Orifice Temperature
IC Half Shield Thermocouple
Self-Balancing Potentiometer
50-100 0F
23
- - - — .,- -- - ■ ■ -— ■-- --

^ «Pi wmmw '"-"- — ■"• •,▼
J2 u a 6 9) K
§
H «H O
oo 33 (0
•S3 II «
" o o 00 rH rH
Ü n B m
0)
a
< 5
09 a> a <D a) H CO
5 a» ^ o §73
la tit
u
co cs
if cd 9
CQ CIS
a.
e a I co
§ co 0) >
be
co c v CO
a be s CO c
co
a»
I u
i co CO Qi
3 o H
a I CO c 0) co
T3 11 II w
N
oS.
«3 I S »< m O O Q M o _ co
o K a
c o 09
o Q
Q a O m A"" "I o a
CO a
I o
co a o CM
CO a o T o
o I
o
o OS
3 o es ? I» 050
(4
SB
Q>
a» s o
u
.2 |
Q> l| a >
u 3
3 | bCS •Sr o S >
B r-, a>
5 6 Mrs t-i o Q> Q>
u
bo I'S O Q)
05
•a 3
•3 3
CO
6 o
<
£ 3
C5
e 5 3 <
Ü
e 5 3 <
Ü
| e o
es s 3 <
a S o
+-> 3
33 co tn
«
o
0)
2
Ö CO
l-H
o 53
73
u 33 co +J cn
3 cn co (1)
« S O « H05
o 33
cn i—i
73 5S
cd
2
T3 I
I 05
cd fa
3 o I? > M
•a « «Si
24
<v Si
be M QJ Bub op « ft
boh
S 8.0 •- s " fn t=l CO
05 .
CO 3 .S
.fa S^ fo P M
W 0) A. h e. 3 5 «1 ™ co -> a»
- 2 o Sl|
I'
0) s CO CO m
«fi bo1^ cd ^t *r cd
o *»
0)
"O 1—( it| co 5 cn
•— •! ■ HI «■■■ i ..•.■.-.... i mi w PH nmnannDanmFw«"*""1"!«""1'' ■IMIHIIIW.II.UPMIIIHIIHII, I in u .m'wm^mri'rmmTtmif!i»s«w««w»upwj"w»pif,»iiiv'v,.!"imjipi!<«
i2 s 0)
8. a
c
ad
m
• CO •p
a i (Q cd
•
a 1 0)
u
h CO A
bo
1 c Q P5
Q H
OH
h O m 3 V co .
bo C
•rH (0 C3 0)
0}
1 0) 0) S
il U) cd
CQ
o K
8
K o s
s ^ a
CQ
0)
6
T) •w •»4 • FH •rt 1? a a CQ a I* o ^ ?• ^ a a o o O o O o o O
o ■«* lO w OJ 05 o in o o 1-t
1 1 rH
1 1
o 1
O eo 00 00
1 00
I W o o O O w in o o o o
h h 0) be u ^ h u (H 0)
be B cd
u § s s Ä B 03
Ü $ Ä 5 B B B H o .2 ^H 0)
S"3
rH 0) r-, a> r-i O ~* v l-H 0) O Ü rt 0) s S a> *B a> 01
3 s äi SB §"3
is u v 3 5 o
mö .ä"3 S-s •SfS g'S S"S 3 -D O 3 5-3
i Q> Q> B Q> Q> Q> Q> Q> PQH Q>
R w •-I 1^ u u o Ü o o ü u pq •P4 •H •w •fH •w •iH .r-l • rH
■(-» B ■4J ■M ■M *J ■M +J ■< 2i
O (D
Rt rt i—t cd cd C« cd ed ■—1 cd H 6 a C8
3 a a a a a cd 3 a
S^ 5 2 s B B B 2 s. s B 3 s C<3 3 3 3 3 3 cd 3
W < < < < < <; < <
ü u o W ü co
HH o u ■*-> •M ■M -4-> ö ■«-»
O oi M CO C3 rt 5 co 8, 33
l-H
73
* Q Q
H Q g i—i
IS
B Q
^ ^ S5 £ « PS K w i^ 0)
1 8, u 2 0
h x fa 0) u 3
i o Q
1 u Q
3 Id 2
a 0
0) Q
5 6
CO ö u, S O m W « * OJ III
«J (U S
<u 3
2 (o 4 «si a
a Is ■*-> CQ
a a
*-> 3 0) (0 7) co
CO «C CO
T3 CO
W Q M
+J CQ i5 w rt
i & a «a a .3 0 0) PHUH
«5 co
»a .fa o fa u
> o e
ID
H
•PH 1—1
'S Ü M
•w 09 0) K *
25
- - - , ■ ■
S10 fP to n r1" 01 to m CO 05 M in eo f rH ^ CO
1 C 1 o <7S to in I-1
;* oo p rH es •«• in 05 o rH ig Tt to • to • • ■ • • to t- • • • t- to c- t- • t- • C- t- t^ CD to
A" s § § g IH eg 00 s 3 s in
eg rH to s S s a s o s eg o
rH m
00 s oc!. • • ^ • to • • o n in • to • to CO in in • to • to to t- t- t- to «D ^f
CM OJ <o 2 o> o> in in o 00 t- ■♦ eg eg eo t~ in eg rH eg lO rH m • • 3 • 3 • 3 • s eg
o> s • » co
-. s • 8 • 3 • 3 • s —
8 •
3
3 8 • 3 • 3 CO rH
H 3 eg 00 eg rH
in
s § eg CO S eg o s S s 2 OS
in rH CO S CD S
Cl 00 00 to i- l- « 00 00 t- ao 00 00 00 00 00 00 00 00 00 t* Q
CO
tT ' * * • • • " • • • • • • • • • ' • • 1
CM t- 1 0 0 CO rH 01 t- eo eg o t- rH pH eo in t~ m OS to rH 3 tn
cflöT iH s S <? !s rH to s s s oo § g 8 3 s s eo
rH to
H 00 rH
to i1
m CO 1« o in K
iH fH H fH rH rH rH rH rH rH rH rH rH rH rH eg eg eg eg eg eg eg eg eg eg OJ eg N
l* M
^ ^
<
H s? s ■* Si "? r-t eg eg eg 05 s? in eg eo o in on eo o in eg lO m a 00 0> * eo t- t- eo rH 00 t oo rH o to eo 05 CO o > ■* ■* f eo • • eg • ^C in • • ■9 • <■ • eo eo m in • in • •»< eo • in ■0« • • H».
■ m in CD 1
^l rH O 00 t- in 0> t- in CO cq iH o to t eo eg OS 00 t eg eo CD OS CM
(k z * I" 'J' CO n n n a o> o> Ol 05 05 s s f 3 CO eo on on 00 00 00 o> a x •* T). V •0" ■O" T». •* ■o« t in in in in in in in in w
O ?H t- eg eg o 00 t •* 01 eo ■* in in eg m eg eg rH OS i- a S" e» in ^- 00 O) rH ev) to t- on OS rH eg (TS
i to • to to • t- eo to • to to to t> • • to • CO to • eo t- t- to t> to • « to CD
0.« in iM eg to 01 0» t- 00 t~ 05 O t- eo to eg r- (0 o rH o o o OS t-
K
s ■* •«. O) eg n to 00 0> O ! 05 on eg in to no 00 lO tn in Ssi <T1 M ü« t- 00 t- t- t- t- 00 . t- to t- i~ t- t- t~ t- t> t- l> to CD
O * ' 1 * 1 ' * ' ■ ■ • *
Cv) Tf a i-i t- o . t- 0) rH on to to rH IN r~ i^ rt f-l o h^ to o OS 00 1 T». to o oo oo to in ■* iH O OS r~ to in t~ U »H 0Ü 00 00 oo 3) 00 ao a 00 oo 05 0> on on on on on on 00 00 00 00
H c- • • • • • • • • • • • • « H
^ £ u m r^ o rH •* rH 00 00 Tf rH t- ■<r in r- OS eg on in rs nn in CN] in CD fc 1 Tf P0 m •«C i M m eg o OS eo co CO eg o 05 rH as eo U sT1 t- 1 00 00 00 00 00 00 b- 00 00 00 00 on t~ on t» 00 00 00 t^
E s o
' ' * * * * 1 • • * • ■ • • " •
|H m o 00 eg W
rH o eg t> eg $ cg 05 to eo rH o $ OS to to s eg CO TJ* CD s o> B-.
O eo ■* in g
in 05 in (- on r> u ft. Ift. o> o> <J> OJ • f TC • ■* Tt* ■* 05 o o • o rH • § o • on 00 s 00 X t> in
a rH w rn i eg eg* eg CM eg ra eg eg CO CO CO CO tn CO CO eo w eo CO co CO
u .Ü o :* in t- t- m M to 00 t to in t- o rH rH t- eg to in t- r- t- as m t- o o 00 00 ai M t- 05 0) 05 00 C* O o o OS on on o as ci <-. rr>
h9 pa
in t- 00 00 t- t- t- t- c- t- » t- t- • l> 00 00 on c- t- C- on t> b- 00 CO t- t-
$ ft. la.
05 m eg to rH rH o ■* i- : co on QO rH CO CO rH rH on <N rH ■* ns ▼f CJ 00 cc in LO
j < H
t •* 00 eg ■* in to t~ 00 CO ■* in t- t- l> CO in in CO <M r- 00
N n n n n eo n n •* ■* •* *r Tf ■^ in to CO to tc to to 05 OS Cl OS Ol on t-
SS o fH t- t- Ml 0) o to 05 o to C- in t O on eg to o> CO t 05 (N o r^ lO o eg eg m o o a> CO 00 05 to 05 05 CO to O CO rg t^ tp CO O CO eS (N IO CO > o ^1^ • • • in • in
■ o o 0>
IH
05 00 • CO l>
rH
CO eo
rH
IN
rH
rH
rH
05 • o rH
in ■*
rH rH
CO
rH
in
rH
CD
rH
IrT"? ' i ^ t rl eg IH ^* f-H rHi eg | n eg | rH eg (N eg eg ■^ ■* CO ■* ■* CO CO coi eg eg eg Tf -r c- <? s o> m o> o> O) a> o» 1 t- U- t- c- t- t^ r- lO in in in in m in eo CO CO CO SS X ■* ■* ■* ■<»< ^C * <. 1 m i in m in m in in to] to
1 to to to to to t- t~ t~- t- t~ h-
a u
H to
in i-i
ft. Q
iH eg n -J. in to t- 00 01 o rH eg CO ■* in to c- oo 05 o rH C1 ^t* in to r- 00 00 rH rH rH rH r-t rH rH rH rH rH eg eg eg eg eg eg (M eg CO
26
— —*~ ^- - — -- ..- ...—...■.....--
N co M S3 00 3 CM CO o o o o1 <= H W n CM o o (7> o C 1
• t- co p t- CO t- co
0." s in ° ■ w g s S5 o t- •-1
üei «e CD t- 1 *
t- * co co CD to e-
et in t~ m Tjl H co CM CO CO eo 1 w « "i co CM CM co CO rH rH 1 rH
M 0> OJ \ O o> a> <n <J> a> a> •
^ r [ H " ^ m t" •-,
o at eo ? in co 1 c^i CO CM IB m co in t- m 0 co ■"'
00 00 00 00 00 t- 00 00 00 00 < > ! Q B- • ■ • • • • ■ • • • ,
ü o n co co '-i rH 00 rH ^t* o CM M-
to o ai o co CM o *Q O «4 o
P. IP< in in 1 co • co CO CD t- . in te CD 1
M M CM CM CM CM CM cg CM CM CM CM'J:
^1- IN iH M t- CO 00 in 1- 00 00 u co 0 Tf (N 00 t- 0> co t- in co i~ 1
«O in m ■>t 1 •O' •* co in in CD in • in
N o 00 in t> co rH e> in 00 co •H F-t o o o rH CO CM co CM CO CO co co co co CD CO CD co to co
on t~ CO 1»- l> CM co CO
1 'S O1 ri- co IX> o> on in u> c- ce CD co co CO co to co
1 g * ■ * • • • • 1 * oo! in co l~ i c o rH in
o f-f ■* co co 1 00 0> O 05
o U U •<
O cg o t- t- c- 1 ^ in
" CD
1 & M »-» 00 (M in C0 coi to CO
oo c- coi in i co t-' in in w 1-1
c- 00 oo • 00 00 : oo] oo , oo ao l
n < co
M
1 1 1 u 05 01 «,! « i ml in! t- co 1
l-H rH O»' o> t-tl t- 00 00
PT 00 X "r- ! » C- i t- t- j
H' ! 1 ■M t- r-* 00 a\ o eol n 1 co co: f in _, 0J! O CD CM 1
PTICT O N (M CM 5i ". 05| in co |
" " •* l' eo| ■w CO' •* Tj-
CD CD Tl- o a>' CM ml co co I ! -^ü O) O <J> <J> 00i O n« oo t-
^ 00 t- t- t-l 00 t- t- 1 t- 1 • 1 •i • i 1 J
1 ini CM 00 CM -ICM t- CM rH !
«^l ^ rH O o CM i-t ^ rH I tO CO .
hj &< 1 CX O >H l-H i-t |H 01, CM CM 1
< K W
L-IT-J _ I
rH ml co t- ■* f o> in 171 co 1 1^1 IH m\ o co CM r- o in CM 00 >
0 o> 00 l CD
rH
in1 o |H . rH
0> j
rH
1
O
it*?0? i !
J> o m t-l OO in in| t- oo a a> i
S5 X t-'i •> M t-l t-l «^ t-' 1 rH rH 1 t- t~ t» t~ C- (- t- 00 i 00 1
Q i 1
W 1 Wt* . «
fr, 0 Cj| co ■* U3 co ss ■f 0 x> > D 1
co w co co CO co co ■* ■* <* rc 1
27
•■ - i -i illlMttlMMiMli'Ihll I—I ' ■ — j
Estimated design-point overall compressor performance was a peak efficiency of 79 percent at a pressure ratio of 14.0 with a corrected airflow of 2.05 pps, compared to the highrtjt pressure ratio measured at 100 percent design speed on test of 12.3, with a corresponding efficiency and airflow of 78.3 percent and 2.03 pps respectively.
The basic reasons for lower performance than design were:
1. The progressive increase in first-stage axial clearance caused by distortion of the discharge scroll at 100 percent design speed, de- creasing the efficiency of the first-stage compressor.
2. Lower-than-design pressure-ratio capability of the second stage.
The separate performances of the two stages are discussed below.
First-Stage Performance
Overall performance of the first-stage compressor, with approximately 1.5 per- cent bleed flow at the vaned diffuser slots, is shown in Figure 20 for 60, 70, 80, 90, and 95 percent design speed. Also included are two performance points at 100 percent design speed acquired prior to the substantial increase in first-stage impeller operating clearance caused by distortion of the discharge scroll. The pressure ratios shown in Figure 20 refer to total pressure at the stage inlet and total pressure at the exit of the interstage crossover turning vanes, with an average exit Mach number of 0.17 throughout the efficient operating range of the compressor.
Estimated design-point first-stage compressor performance was a peak efficiency of 31 percent at a pressure ratio of 4.9 with a corrected airflow of 2.05 pps, com- pared to test performance of 100 percent speed (data point 44, presumably with some increased shroud clearance) of 78.7 percent with a pressure ratio of 4.56 and corrected airflow of 2.03 pps. After completion of running at 100 percent speed with the shroud clearance increased to 0.065 to 0.070 Inch, the efficieny of the first-stage compressor had decreased to the 70 percent level. Peak first- stage efficiency at 90 and 95 percent design speed was 81.5 percent. Increasing to 86 percent at 60 percent design speed.
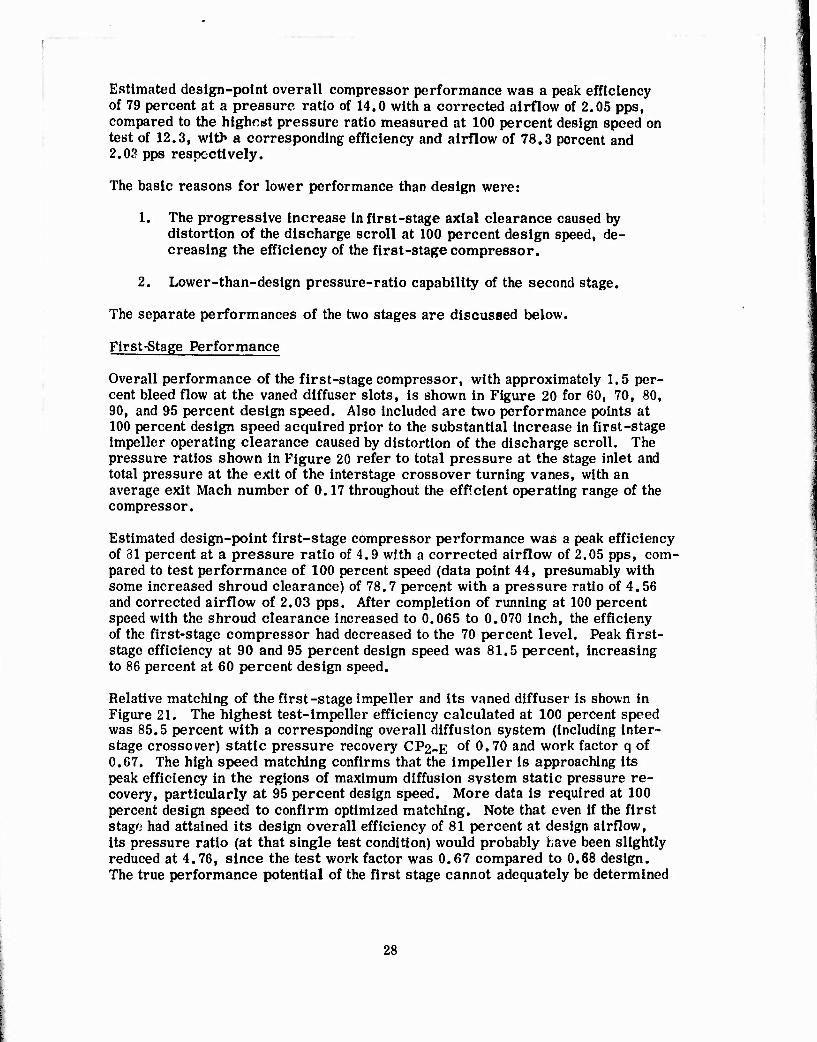
Relative matching of the first-stage impeller and its vaned diffuser is shown in Figure 21. The highest test-Impeller efficiency calculated at 100 percent speed was 85.5 percent with a corresponding overall diffusion system (Including inter- stage crossover) static pressure recovery CP2-E 0f 0.70 and work factor q of 0.67. The high speed matching confirms that the impeller is approaching its peak efficiency in the regions of maximum diffusion system static pressure re- covery, particularly at 95 percent design speed. More data Is required at 100 percent design speed to confirm optimized matching. Note that even if the first stago had attained Its design overall efficiency of 81 percent at design airflow. Its pressure ratio (at that single test condition) would probably have been slightly reduced at 4.76, since the test work factor was 0.67 compared to 0.68 design. The true performance potential of the first stage cannot adequately be determined
28
-- ■•■-■ ■■■-■■- ■■ -■■
-■- L——
.,,.-. ^

*6 90
0.5 1.0 1.5 2.0
CORRECTED FLOW-LB/SEC
Figure 20. First-Stage Characteristic.
29
■ -■- ■ ■ ■ ■■-- - --■- - - ■ " -■
DIFFUSER THROAT AREA 1.7 SQ IN
100
0.5 1.0 1.5
CORRECTED FLOW-LB/SEC
2.5
Figure 21, First-Stage Impeller and Diffuser Matching.
30
^- ■ ■ - - - —. !■ ,^ttmtl^mimlmiaimmUa^lit;^Um^^ä
.— ■■ . -- ■■ - - ■ ■ - ■ ■ ■" - -
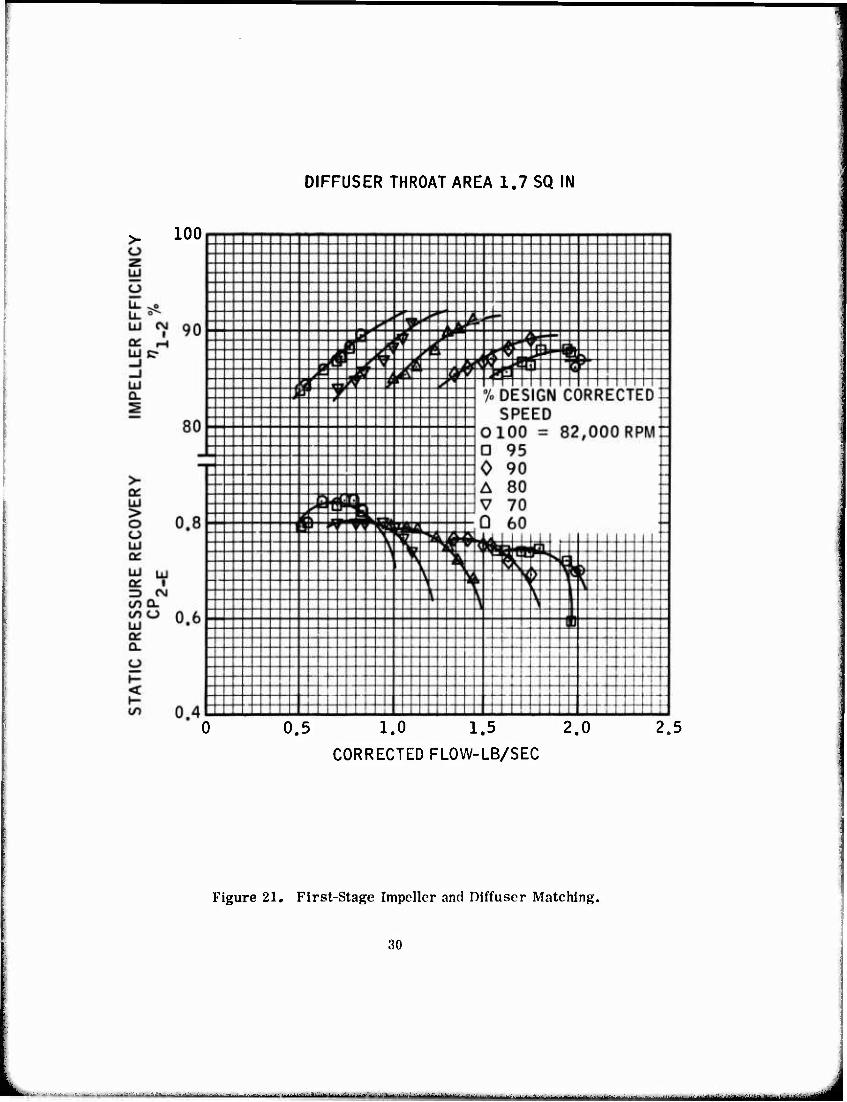
at this point due to insufficient data. However, it does appear from the adjacent speed data that with the correct clearance it should be possible to approach design efficiency and airflow. Figure 22 shows the pressure loss of the Interstage cross- over between exit of the first-stage vaned diffuser and exit of the Interstage turning vanes. Equivalent loss In stage efficiency is of the order of 2 percentage points In the peak efficiency operating range. It Is doubtful If this loss can be significantly reduced by redesign, and It must be accepted as an inherent penalty associated with staging two compressors In series.
APA c PRESSURE LOSS EXIT VANED DIFFUSER 4"t TO EXIT INTERSTAGE TURNING VANES
UJ
ü
U. LU ^f o a Ü ^v
UJ </) I CO ^j- O 0. -J "^ UJ a: CO CO UJ on CL
.uo 1111 1111111111 M H 1 "" ,"1 "T /« DESIGN UUKRtCTED i
SPEED
<^ 1 no QO OOO DDM OiUU — ot/UUU Krlvl n oc; na ._ u Vi, :
.U4 x A oo " " V 'v 'f A Rf) A au -- ^^ 52 :
V 70 ^ *,2 ^^3541, Li1 Arn JO/fflrh P
j~ 00 ■ ^ T^^a^^j^^apT^5 t~^t -T" r3 * 'k 7 ft — ^L:J2^\T]B>^" :
no _:_JI_:]3E _1 ,u^ it' — ^r n "' A F
: i D ,_~ :_ : z :_ ~ ~ i •i
I
0.5 1.0 1.5 2.0 CORRECTED FLOW-LB/SEC
2.5
Figure 22. Interstage Crossover Pressure Losses.
31
MB ■——I
Second-Stage Performance
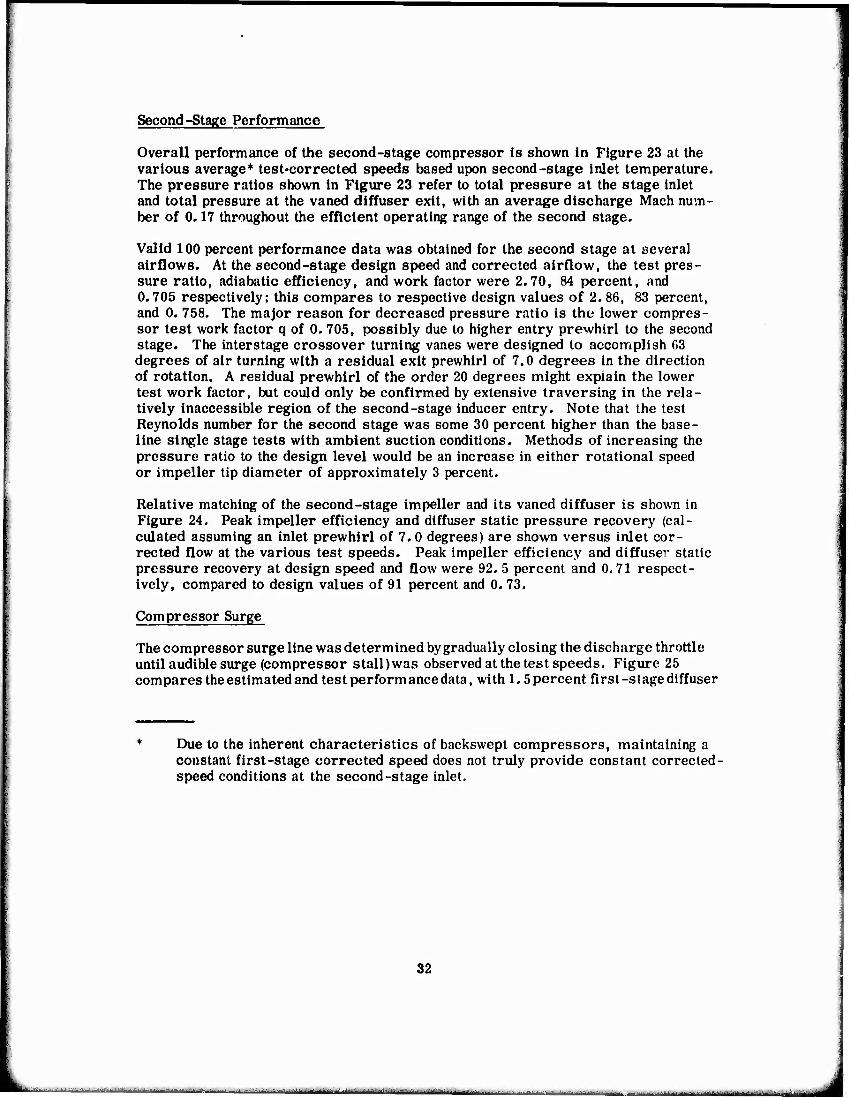
Overall performance of the second-stage compressor is shown In Figure 23 at the various average* test-corrected speeds based upon second-stage inlet temperature. The pressure ratios shown in Figure 23 refer to total pressure at the stage inlet and total pressure at the vaned diffuser exit, with an average discharge Mach num- ber of 0.17 throughout the efficient operating range of the second stage.
Valid 100 percent performance data was obtained for the second stage at several airflows. At the second-stage design speed and corrected airflow, the test pres- sure ratio, adiabatic efficiency, and work factor were 2.70, 84 percent, and 0.705 respectively; this compares to respective design values of 2. 86, 83 percent, and 0. 758. The major reason for decreased pressure ratio is the lower compres- sor test work factor q of 0. 705, possibly due to higher entry prewhirl to the second stage. The interstage crossover turning vanes were designed to accomplish 63 degrees of air turning with a residual exit prewhirl of 7.0 degrees in the direction of rotation. A residual prewhirl of the order 20 degrees might explain the lower test work factor, but could only be confirmed by extensive traversing in the rela- tively inaccessible region of the second-stage inducer entry. Note that the lest Reynolds number for the second stage was some 30 percent higher than the base- line single stage tests with ambient suction conditions. Methods of increasing the pressure ratio to the design level would be an increase in either rotational speed or impeller tip diameter of approximately 3 percent.
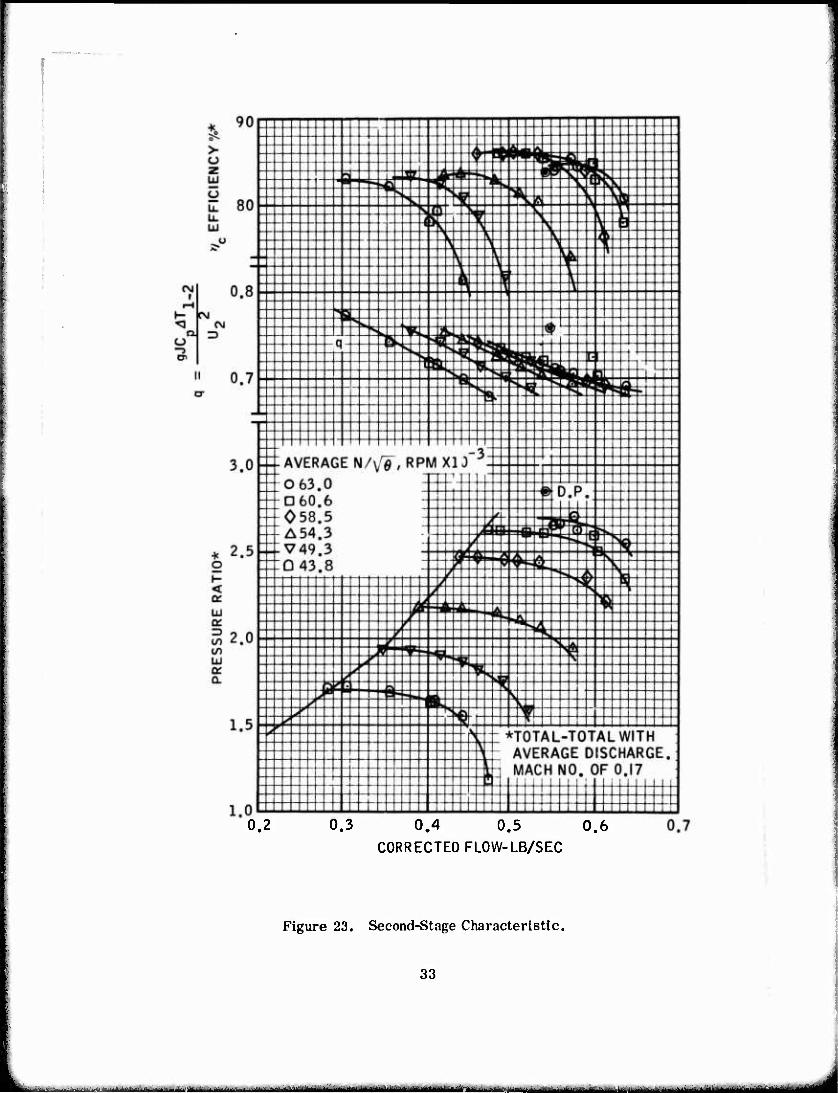
Relative matching of the second-stage Impeller and its vaned diffuser is shown in Figure 24. Peak impeller efficiency and diffuser static pressure recovery (cal- culated assuming an inlet prewhirl of 7.0 degrees) are shown versus inlet cor- rected flow at the various test speeds. Peak impeller efficiency and diffuser static pressure recovery at design speed and flow were 92. 5 percent and 0. 71 respect- ively, compared to design values of 91 percent and 0. 73.
Compressor Surge
The compressor surge line was determined by gradually closing the discharge throttle until audible surge (compressor stall)was observed at the test speeds. Figure 25 compares the estimated and test performance data, with 1.5 percent first-stage diffuser
Due to the Inherent characteristics of backswept compressors, maintaining a constant first-stage corrected speed does not truly provide constant corrected- speed conditions at the second-stage inlet.
32
■
0.3 0.4 0.5 0.6 CORRECTED FLOW-LB/SEC
Figure 23. Second-Stage Characteristic.
33
■ ■ ■■ - ■ - ' ^ -^~-*

bleed, to the surge lines predicted for the first and second stages from individual stage tests on the two baseline compressors from which the two-stage unit was scaled. It had been conservatively anticipated that the overall compressor surge line would follow that of the baseline first stage, whereas overall surge was In fact practically coincident with the baseline second-stage surge line. Comparisons of the baseline first-stage surge line (zero bleed) with the surge flows exhibited during test Indicated that the first stage was operating well beyond Its baseline surge limit. Without completing tests with and without diffuser slot bleed. It cannot be conclusively stated that the slot bleed is the major reason for the large flow range exhibited on test. It Is even possible that the second stage could have been stabilizing the first stage to operate beyond stall. Nevertheless, the effect of slot bleed on similar Solar single-stage compressors has shown significant Improve- ments In surge line characteristics. It Is recommended that, during continuation tests, the effect of diffuser slot bleed on both surge line and overall compressor performance be thoroughly Investigated.
Examination of the overall compressor performance (Figure 19), with respect to possible application in a small turboshaft gas turbine with fixed turbine geometry, substantiates design predictions that operation at high pressure ratios can bo achieved on a two-stage centrifugal compressor without the necessity for variable stator regulation. The flow ranges are very broad; this, together with a linear surge line and a large Island of 79 percent efficiency, represents a considerable technology Improvement In small high-pressure-ratio compressors.
PERFORMANCE SUMMARY
Analysis of the overall and stage test performances of the subject two-stage centrifugal compressor leads to revised predictions of performance level. These are listed In Table V.
With the current component matching, and the discharge scroll modified to ensure the proper first-stage operating clearances. It is estimated that it should be possible to attain a pressure ratio of 12.7 with an efficiency of 78.7 percent at design speed and airflow. In order to attain design pressure ratio with the current matching and modified scroll, it will be necessary to increase the rotational speed by 3 percent; under these conditions, the estimated overall efficiency would be 78.2 percent. An alternate, more costly option to Increasing the speed would be to Increase the Impeller tip diameters by 3 percent. It should be emphasized that these predictions are based upon the measured test performance at 100 per- cent speed when some slight first-stage performance deterioration could have al- ready occurred. Additionally, in many gas turbine applications, some high speed (100 percent) degradation of compressor performance is permissible if higher efficiencies are exhibited at operating conditions equivalent to 60 percent and 30 percent maximum rated engine output. In this instance, peak test efficiencies at all speeds up to 95 percent design speed were 2 percentage points higher than design-point efficiency.
34
DIFFUSER THROAT AREA 0.92 SQ IN
o _ " _ _ ' _± I." z _ ___ ___ _______ Lü _ _ _ _
y '•---ii-lli%-iiiKiiimiczciti-'± t^, :: " "W?^3^ia?|^^:i::::: ^ _L on --AVERAKF N/x/ö RPM X10 i Q^ x> — ~ UJ -_o63.o ■ :: it -
i m / A / _i DoO.o , ^ A«;« R --T- o. V->o.3 S \ ^4 "^ ^ i^yf.J
on - V/1Q 3
- Ü43 8 -li - - L-1 '*■?**•> .....
-*-- 1 1 t 1 1 1 1 1 [ 1 1 1 I 1 1 1 If 1 | [ 1 |A~3eL olRDm,1^W% -u X -Ä^ ^i?*^mg*-«*
> " ^' ^-se, ^^ flw!k ^s " ' a : _ =i:: :'!i: ^^ vsr- _J:s::s: _ u :3^ 5 ^ vs-5 N § 0.6 ::::::+-::-:^s:::::-V-""^"""s^^""T o " i:*s * 5 \-^^ \ m '--+ A i Re -^A Jt S 5 _ ^ _ _1 S 5 _ ^s, j\ ^^ L ^ UJ S ^ S i \ v
UJ i . - YCh 4K--.-__L 5 jt ± ^ eg .._i ,-4-^-4^ i*f k- > ^ jt özit rDQ. +- --- i \ _ L H-JL ,oO J -A - 3 - t ^ n zi --t Z- Jt -^ t _ _H _ Kl U#4 .- ^ 1^----V-—-j-w-^- w . x _ :. _ _r :: :: o: t t ^l a. : :::_::::::::i \ r
----it---- JL . V _ 0 - i::_ :_:a:ii::::_: i P - It::::: ::::::::: i ^ - : J _ ^. ^ n 2 ._„-.-„-:_—: ::i:: :: :_:
0.2 0.3 0.4 0.5 0.6 0.7
CORRECTED FLOW-LB/SEC
Figure 24. Second-Stage Impeller and Diffuser Matching.
35

<
LU a: CO to LÜ ai Q.
< us > o
CORRECTED FLOW- LB/SEC
Figure 25. Compressor Map Comparison.
30
-----

TABLE V. COMPRESSOR PERFORMANCE COMPARISONS
Item Case^
1 2 3 4
Rotational Speed, rpm x 10~3 82 82 82 84.5 Inlet Pressure, psia 14.7 14.7 14.7 14.7 Inlet Temperature, "F 60 60 60 60 Inlet Airflow, pps 2.05 2.03 2.05 2.1 First-Stage Pressure Ratio 4.9 4.56 4.7 4.95 **Fir8t-Stage Efficiency, % 81.0 78.7 80.0 79.5 Second-Stage Pressure Ratio 2.86 2.7* 2.70 2.83 ♦♦Second-Stage Efficiency, % 83.6 85.3 84.0 84.0 Overall Pressure Ratio 14.0 12.3 12.7 14.0 ♦♦Overall Efficiency, % 79.0 78.3 78.7 78.2
♦Case:
1. Original design. 2. Test data point 44. (See Appendix V.) 3. Estimated, with current matching and modified discharge scroll. 4. Same as case 3 except speed increased by 3%.
*♦ All efficiencies based on discharge total condition with an average Mach number of 0.17.
37
-■•
__»_ .««,
CONCLUSIONS
Complete performance test data was obtained for the subject two-sta^e centrifugal compressor at 60, 70, 80, 90, and 95 percent speed showing peak overall tempera- ture rise adiabatic efficiencies up to 80.5 percent at pressure ratios between 3.4 and 11.2.
A compressor discharge scroll casing distortion problem at 100 percent design speed (82,000 rpm) prevented accurate assessment of design speed performance capability. Although several data points were recorded at 100 percent design speed, only two were probably representative of valid performance potential. The highest pressure ratio was 12.3 with a corresponding overall adiabatic efficiency of 78.3 percent.
The compressor exhibited broad compressor flow ranges between the surge and choke flows, substantiating design predictions that operation at high pressure ratio could be obtained on a two-stage centrifugal compressor without the necessity for variable stator regulation.
The mechanical design of the rotating assembly, with the two stages overhung from a central bearing capsule, proved successful.
It is predicted that, with modifications to prevent distortion of the discharge scroll casing, it should be possible to obtain design performance at 3 percent overspeed condition with the current component matching.
38
^^mgugj MWMBWMUMMMHMMia - —-
RECOMMENDATIONS
First run testing of the subject two-stage centrifugal compressor has revealed performance characteristics which represent a considerable technology Improve- ment In small hlgh-pressure-ratlo compressors for advanced gas turbines. As a consequence of these encouraging first test results, the following additional tasks are recommended to Increase and more closely define the compressor performance potential:
1. Modify the compressor discharge scroll to prevent first stage shroud distortion problems.
2. Conduct performance calibrations and 100 percent design speed with 1,5 percent first-stage diffuser bleed.
3. Repeat performance testing with diffuser bleed closed.
4. Conduct overspeed testing to 103 percent design speed equal to a corrected speed of 84,500 rpm.
5. Pursuant with analysis of the previous testing, conduct an additional test with a diffuser rematch to optimize performance.
39
—-■■■i n-ii ' — ■- -—..-..■ .^i.............. ■■■- -■- - i ■ -----'""-— ■-" ——- ..^...-i^ -"^
•u "WP —^ '^i■"'■"l■|■l"" iin^mnw.p ■■I/.'W.PHIIWIDIIHHIIIHII
APPENDIX I DRIVE TURBINE SPIN TEST RESULTS
Due to the very high rotational speeds to be encountered while operating the USA AMRDL two-stage compressor test rig, it was required to ensure the mechanical integrity of the rig turbine wheel and stress relieve the bore by proof spinning. A bore radial growth of 0.004 inch was predicted at 100% design speed.
The turbine wheel was a Solar Titan 713LC production casting that had a modified hub and shortened blade tips. Prior to proof spinning, the wheel was balanced to within 0.003 ounce-inches of residual unbalance. The piloting bore diameters and the blade tip diameter were measured and recorded.
On April 5, 1972, the turbine wheel was successfully proof spun in the Solar spin pit for 1 minute at an approximate speed of 87,000 rpm (105 percent of rig design speed of 82,000 rpm). A special spin arbor was used to spin the wheel. After proof spin, the bore and blade tip diameters were remeasured and recorded. Up to 0.0072 inch of bore diameter growth and up to 0.0073 inch of blade tip diameter growth resulted from the proof spin. Both visual and Zyglo inspection of the wheel revealed no defects.
The turbine wheel was deemed to be mechanically sound for use In the compressor test rig. The wheel was then reworked to design dimensions and installed in the rig.
40
I-"JI* ■--"■ ■■'--- mm : • - - ^^^^^»^■^^-^^^i^—K.-— -- ^^^.■^- Bj—^a^jfc^—g^d ■ ■ ..: ...- ■ -...■.■...■-
■- ■■
njimiiiiniiiiHWumip»" i .i i mmi—iinHiin "—" ,]] in J niii,;.^»—»' •'•■'•* npOTMPnmMVPH
APPENDIX II COMPRESSOR SCROLL STRESS ANALYSIS FOR
TWO-STAGE COMPRESSOR TEST RIG
Stresses and deflections were computed for the subject scroll to establish a com- putation model giving results consistent with the observed permanent distortions that occurred in the tesi rig; specifically, in the -25, -26, and -27 parts. Figure 26 shows the assumed model shell element centerline geometry with the linear temperature gradient and pressure load.
Stress and deflection calculations were made using two different analytical tech- niques: a two-dimensional finite element program and a shell analysis program. Both methods gave deflections consistent with the measured pattern of distortion observed in the test rig, and Indicated stresses greater than the material yield strength (24 ksi at 500oF and 22 ksi at 800oF), confirming the permanent distortion.
The effect of the degree of restraint imposed at edge A (Figure 26) was evaluated by running two cases:
(1) Full radial restraint.
(2) No radial restraint.
The true case would lie between these limits. Case (1) gave higher stresses, but both cases indicated material yielding.
It would appear that scroll design changes can be properly evaluated to give con- trolled deflection and stress characteristics under load.
41
--■——-—^—iM* "■' "-*

'« ' w ^Wmppwii ■'"" ..■. iinin, .WMimni .111)" uiiiiiMiiiii -in IMimiW» Vf
SOOT
T" 9.50 R
SOOT SOOT
400T
-25
3.00 R
120 psig
SOOT
t t t t . . *
-24
400 T
-26-
600T
5.67 R
400 T
'-27
Figure 26. Two-Stage Compressor Test Rig Scroll Centerline Geometry for Stress Calculation.
42
„..- - - : - -■ - , -,-..— ^. ..■...., — .

■P^ ■HK ■wTr~~*
APPENDIX HI ERROR COMPUTATION FOR TWO-STAGE COMPRESSOR
Design Conditions:
V (« -i
AT l-E
At design point:
P, = 10.0 psia
140.0 psia
= 1.395
= 51911
= 1250^
PE =
y =
T, =
Instrumentation and Associated Error:
1. Princo Fortin type barometer:
2. Doric DS-100 with Scannivalve & Statham 200 psig pressure transducer:
3. Doric DS-100 millivolt indicator:
4. Rosemount 414L bridge:
5. Rosemount resistance thermometer:
; 0.005 psi
±0.10 psi
±0.01% reading ±0.01% psi
±0.1% reading ±0.03T
±0.1%spanor 0.25oC
43
—"-"■*■■ ^-■- ■ - ■

".^—- i. I.II iiMim^^vw . . ■<...<wla,v.w„, - - - '■ i'-i | iiijijiiiipi.! iiiiiwiniipiiiw.il i n i) Bmmmv\immm'im*i"ii*-'"rwi
Error Extremes in Measured Parameter:
P1 = 10.0 ± O.lOSpsla
PE = 140.0 ± 0.105 psla
T1 = 519^ ± LOOK
TE = 1250"« ± 1.8011
Calculation of Error Extremes in Efficiency: 0.395
^40.0t 1.395-1 Design Point »? = ML
Upper Limit With Error Maximized
1250 - 519 519
max = ,140.105; 0.283
( 9.895 h
= 0.79
-1 = 0.799 1248.20- 520.00
520.00
Lower Limit With Error Maximized
min / 139.895v 0.283 10.105 -1 = 0.78
1251.80- 518.00 518.00
Results
An approximation of error, assuming maximum error in instrumentation system, using the Doric Logging System with a Statham 200 psi pressure transducer and Rosemount platinum thermometer would indicate an uncertainity in computation of efficiency of ±1.0 from a design of 79.0.
The calculations do not take into account any errors caused by actual installation of sensors in the system. The system was calibrated prior to test, and all cali- bration corrections were applied. The system was operated at a stable ambient
44
— inrl > waMMIaHMMiMiiiMllaillliia*«

■V "■ll-" - ' " " ' '■" "■ ■"■ '■■■■■■!■■ »I'"' -PIIPil I ,_, mmm-nn— yp IIJU^I
temperature very near the conditions when calibrated. At 100 percent design speed, variation In Inlet and exit discharge temperatures was of the order of 1.5 and 3.0T respectively.
The computation of error should be used only as an approximation of limits antici- pated using the described Instrumentation system.
45
i"u"--i - ...... , , — ■ -
! TF ■I'""" ^ ,,..,.i „» „.i.ii... ......I-.I.,... ) II i,.,,,... ....^.M n HI« n^^ I I».
MODEL:
SERIAL:
OPERATING CONDITIONS:
DAS SETUP CONDITIONS:
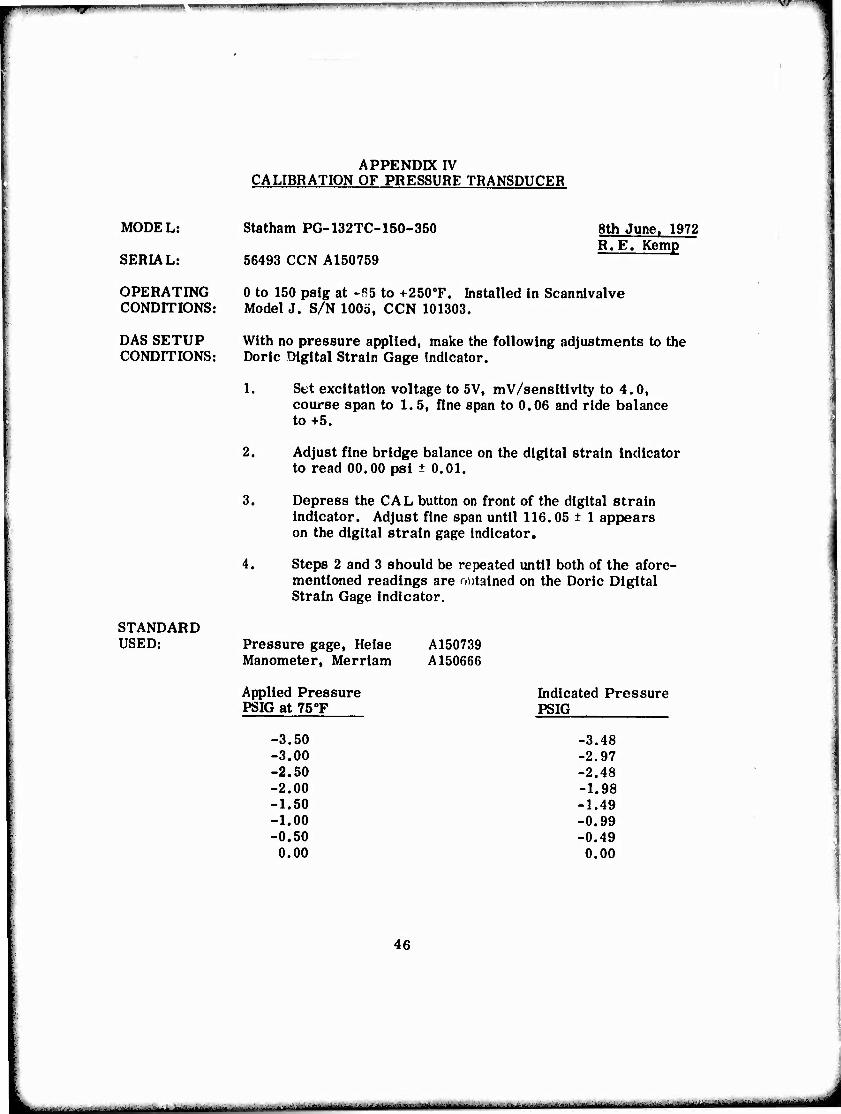
APPENDDC IV CALIBRATION OF PRESSURE TRANSDUCER
Statham PC-132TC-150-350
56493 CCN A150759
8th June. 1972 R. E. Kemp
0 to 150 pslg at -fi5 to +250oF. Installed In Scannlvalve Model J. S/N 100b, CCN 101303.
With no pressure applied, make the following adjustments to the Doric Digital Strain Gage Indicator.
1. Stt excitation voltage to 5V, mV/sensitivity to 4.0, course span to 1.5, fine span to 0.06 and ride balance to +5.
2. Adjust fine bridge balance on the digital strain indicator to read 00.00 psi ± 0.01.
3. Depress the CAL button on front of the digital strain indicator. Adjust fine span until 116.05 ± 1 appears on the digital strain gage Indicator.
4. Steps 2 and 3 should be repeated until both of the afore- mentioned readings are obtained on the Doric Digital Strain Gage indicator.
STANDARD USED: Pressure gage, Heise
Manometer, Merrlam A150739 A150666
Applied Pressure PSIG at 75 0F
Indicated Pressure PSIG
-3.50 -3.00 -2.50 -2.00 -1.50 -1.00 -0.50 0.00
-3.48 -2.97 -2.48 -1.98 -1.49 -0.99 -0.49 0.00
46
^-- - - >UMllMMMMaa*MMaatMMaMaMi

n I I ll.« I » ■— "' " '^^^'■ Vrr'
Applied Pressure Indicated Pressure PSIG at 75 T PSIG
15.00 15.02 30.00 30.00 45.00 45.03 60.00 60.07 75.00 75.12 90.00 90.15
105.00 105.19 120.00 120.14 135.00 135.02 150.00 150.00
STATEMENT OF ACCURACY:
Within the operating and setup conditions stated above, pressure measurements at 75T are estimated to be accurate with ± 0.10 psig. This accuracy applies only to the transducer-indicator system and does not include inherent errors of any pres- sure probes used.
47
^ ■ ■ ■ ■ - ■ ...■-. ^m
w pppipiMapiangMiBmnni11 ■'•l ' " ' ■ ■
APPENDIX V COMPUTER PERFORMANCE LISTING, DATA POINT 44
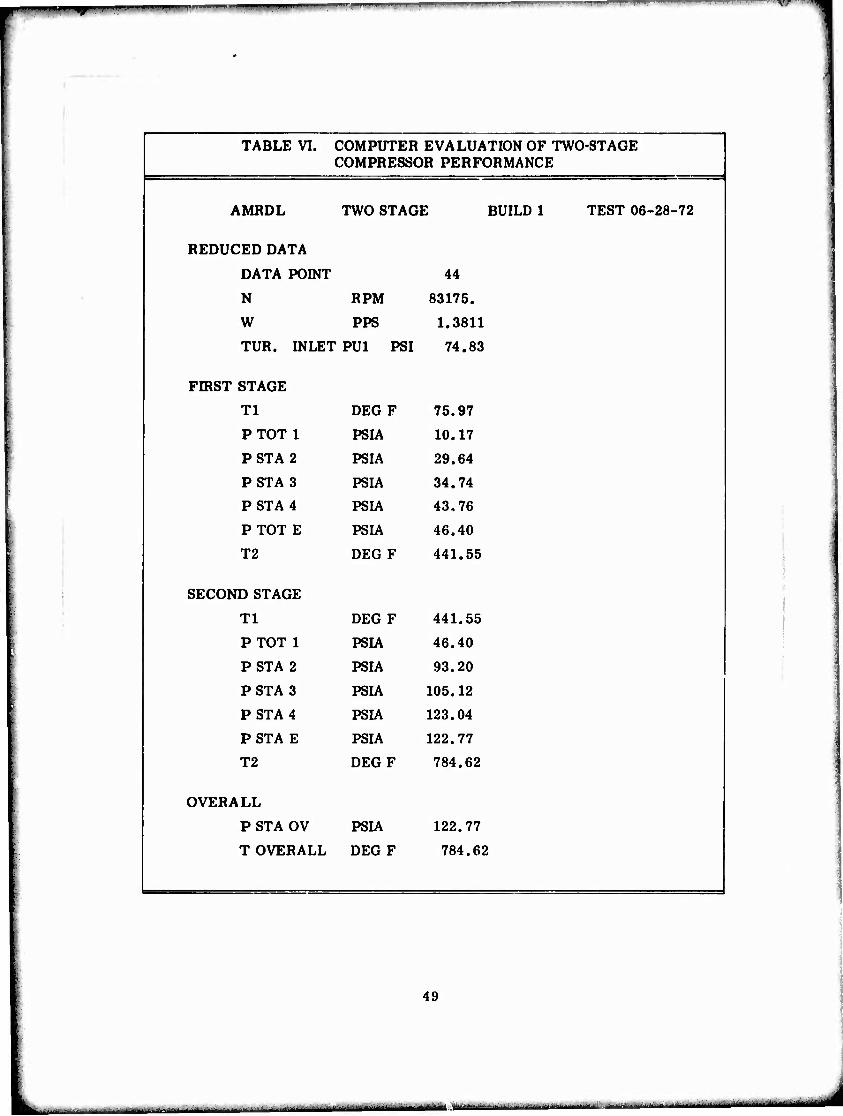
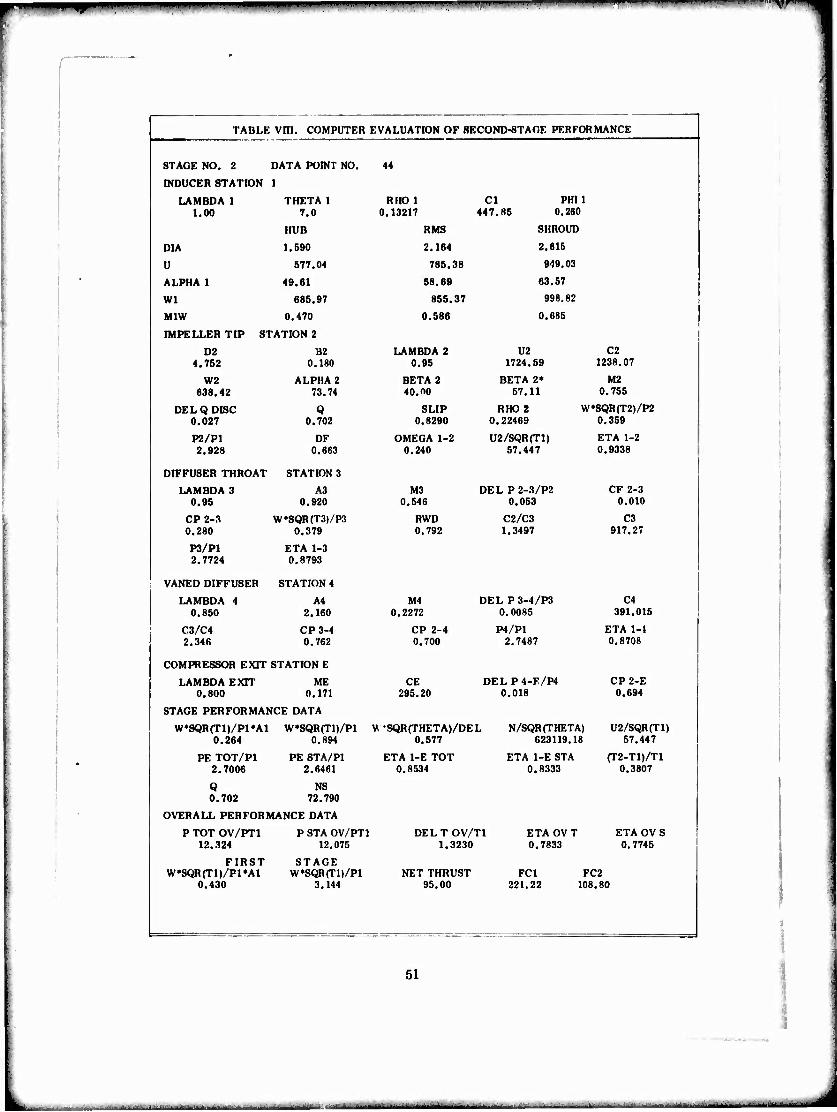
The raw compressor performance data from 'ie DAS printed paper listing pro- vided the input data to program 440 "Two-Stage Compressor Performance." Typical transcribed computer output is listed in Tables VI, VII, and VIII for test data point 44 at 100% design speed.
The symbols used for the various compressor performance parameters are identi- fied in the List of Symbols. Note that the computer printer output is limited to upper case symbols.
48
■ - -
^ ,"--— —,— m— .,,.....« la«!
TABLE VI. COMPUTER EVALUATION OF TWO-STAGE COMPRESSOR PERFORMANCE
AMRDL TWO STAGE BUILD 1 TEST 06-28-72
REDUCED DATA
DATA POINT 44
N RPM 83175.
W PPS 1.3811
TUR. INLET PU1 PSI 74.83
FIRST STAGE
Tl DEGF 75.97
PTOT 1 PSIA 10.17
PSTA2 PSIA 29.64
PSTA3 PSIA 34.74
PSTA4 PSIA 43,76
PTOT E PSIA 46.40
T2 DEGF 441.55
SECOND STAGE
Tl DEG F 441.55
PTOT 1 PSIA 46.40
PSTA 2 PSIA 93.20
PSTA3 PSIA 105.12
PSTA 4 PSIA 123.04
PSTA E PSIA 122.77
T2 DEGF 784.62
OVERALL
P STA OV PSIA 122.77
T OVERALL DEG F 784.62
49
~ ■. - ■■ ■ - ■

•"—' —— wmm
TABLE VII COMPUTER EVALUATION OF FIRST-STAGE PERFORMANCE
STAGE NO. 1 DATA POINT NO 44
INDUCER STATION 1
LAMBDA 1 1.00
THETA 1 0.0
RHO 1 0,04376
Cl PHI 621.15 0.339
1
HUB RMS SHROUD
DIA 1.440 2.595 3.375
U 522.60 941.64 1224.85
ALPHA 1 40.08 56.59 63.11
Wl 811.75 1128.06 1373.34
M1W 0.737 1.025 1.248
IMPELLER TIP STATION 2
D2 5.050
B2 0.29
LAMBDA 2 0.95
U2 1832.74
C2 1263.24
W2 ALPHA 2 774.99 70.11
BETA 2 40.00
BETA 2* 55.32
M2 0.928
DE LO DISC 0.014
Q 0.663
SLIP 0.8069
RHO 2 0.10371
W*SQR(T2)/P2 0.803
P2/P1 5.079
DF 0.624
OMEGA 1-2 0.856
U2/S0R(T1) 79.189
ETA 1-2 0.8561
DIFFUSER THROAT STATION 3
LAMBDA 3 0.95
A3 1.700
M3 DELP2-3/P2 0.753 0.021
CF2-3 0.005
CP 2-3 W 0.232
*SOR(T3)/P3 0.820
RWD 0.943
C2/C3 1,2011
C3 1051.71
P3/P1 4.9735
ETA 1-3 0.8424
VANED DIFFUSER STATION 4
LAMBDA 4 0.840
A4 3.280
M4 0.3650
DEL P3-4/P3 0.0514
C4 530.346
C3/C4 1.983
CP3-4 0.570
CP2-4 0.642
P4/P1 4.7178
ETA 1-4 0.8081
COMPRESSOR EXIT STATION E
LAMBDA EXIT 0.800
ME 0.205
CE 300.93
DEL P4-E/P4 0.033
CP2-E 0.701
STAGE PERFORMANCE DATA
W*SQR(T1)/P1*A1 0.430
W*SQR(T1)/P1 3.144
W*SQR(THETA)/DEL N/SQR (THETA) 2.029 81873.19
U2/SQR{T1) 79.189
PE TOT/PI 4.5634
PE STA/P1 4.4318
ETA 1-E TOT 0.7868
ETA 1-E STA 0.7682
(T2-T1)/T1 0.6825
Q 0.663
NS 121.473
50
in I ■ i i.i
mm- •—■—-——"
TABLE Vm. COMPUTER EVALUATION OF SECOND-STAOE PERFORMANCE
STAGE NO. 2 DATA POINT NO.
INDUCER STATION 1
LAMBDA 1 1.00
DIA
U
ALPHA 1
Wl
M1W
IMPELLER TIP
D2 4.752
W2 638.42
DEL Q DISC 0.027
P2/P1 2.928
THETA 1 7.0
HUB
1.690
577.04
49.61
685.97
0.470
STATION 2
B2 0.180
ALPHA 2 73.74
Q 0.702
DF 0.663
DIFFUSER THROAT STATION 3
LAMBDA 3 0.95
CP 2-3 0.280
P3/P1 2.7724
A3 0.920
W*SQR(T3)/P3 0.379
ETA 1-3 0.8793
VANED DIFFUSER STATION 4
LAMBDA 4 0.850
A4 2.160
C3/C4 2.346
CP3-4 0.762
COMPRESSOR EXIT STATION E
LAMBDA EXIT 0.800
ME 0.171
STAGE PERFORMANCE DATA
W*SQR(T1)/P1*A1 0.264
W*SQR(T1)/P1 0.894
PE TOT/PI 2.7006
PE STA/P1 2.6461
Q 0.702
NS 72.790
OVERALL PERFORMANCE DATA
P TOT OV/PT1 12.324
P STA OV/PT 12.075
FIRST W*SQR(T1)/P1*A1
0.430
STAGE W»SQR(T1)/P1
3.144
44
RHOl 0.13217
Cl PHI 1 447.85 0.260
RMS SHROUD
2.164 2.616
786.38 949.03
68.69 63.67
865.37 998.82
0.586 0.685
LAMBDA 2 0.95
U2 1724.59
C2 1238.07
BETA 2 40.00
BETA 2» 67.11
M2 0.766
SLIP 0.8290
RHO 2 W»SQR(T2)/P2 0.22469 0.369
OMEGA 1-2 0.240
U2/SQR(T1) 67.447
ETA 1-2 0.9338
M3 0.546
DEL P2-3/P2 0.053
CF 2-3 0.010
RWD 0.792
C2/C3 1.3497
C3 917.27
M4 0.2272
CP 2-4 0.700
CE 295.20
DEL P 3-4/P3 0.0085
P4/P1 2.7487
DELP4-F/P4 0.018
W 'SQRfTHETA^DEL 0.577
ETA 1-E TOT 0.8534
DELTOV/T1 1.3230
NET THRUST 95.00
N/SQR (THETA) 623119.18
ETA 1-E STA 0.8333
C4 391.015
ETA 1-1 0.8708
CP2-E 0.694
U2/SQR(T1) 57.447
(T2-T1)/T1 0.3807
'Tl ETA OV T ETA OV S ) 0.7833 0.7745
FC1 FC2 221.22 108.80
51