w. r. berkley annual reports 2003
TRANSCRIPT

W . R . B E R K L E Y C O R P O R A T I O N | A N A L Y S I S | 2 0 0 3 A N N U A L R E P O R T

Chairman’s Letter
Investments
Segment Overview
Specialty Segment
Regional Segment
Alternative Markets Segment
Reinsurance Segment
International Segment
Financial Data
Table of Contents 2
10
12
14
16
18
20
22
25
A N A L Y S I S
ANALYS IS
Look at W. R. Berkley Corporation
carefully. Analyze our numbers.
You will find a high-quality balance
sheet, leading market positions
and outstanding operating results.
Cover: “Analysis” by Michael Theise

CORPORATE PROFILE. W. R. Berkley Corporation, founded in 1967, is one of the nation’s premiercommercial lines property casualty insurance providers. Our strengths include skilled people, disciplinedunderwriting and a strong balance sheet. Each of the Company’s operating units participates in a productarea or geographic territory where it applies its professional skills to meet customer needs. Operationsare decentralized to place decision-making and accountability in the hands of people who are close to thecustomer. The management of the Company is focused on the long-term. We manage to optimize the risk-adjusted returns across the entire enterprise. The effective execution of our strategy has produced one ofthe best performance records in the insurance industry.
HOW W. R. BERKLEY CORPORATION IS DIFFERENT. The Company distinguishes itself in several ways:ACCOUNTABILITY. The business is operated with an ownership perspective and a clear sense of fiduciaryresponsibility to shareholders.PEOPLE-ORIENTED STRATEGY. New businesses are started when opportunities are identified and, most impor-tantly, when the right talent is found to lead a business. Of the Company’s 27 units, 19 were developedinternally and eight were acquired.RESPONSIBLE FINANCIAL PRACTICES. Risk exposures are managed proactively. A strong balance sheet, includinga high-quality investment portfolio, ensures ample resources to grow the business profitably whenever thereare opportunities to do so.RISK-ADJUSTED RETURNS. Management company-wide is focused on obtaining the best potential returns witha real understanding of the amount of risk being assumed. Superior risk-adjusted returns are generatedover the insurance cycle.TRANSPARENCY. Consistent and objective standards are used to measure performance – and, the samestandards are used regardless of the environment.
FINANCIAL HIGHLIGHTS. W. R. Berkley Corporation delivered record results in 2003:• Return on stockholders’ equity rose to 25.3%, the highest in nearly three decades.• Net income reached a new high of $3.87 per share, advancing 75% over 2002.• Net premiums written increased 35% to $3.7 billion.• Cash flow from operations advanced 47% to $1.4 billion.The Company achieved these results by capitalizing on increasing insurance prices and improving termsand conditions.
W. R . B E R K L E Y C O R P O R AT I O N AT A G L A N C E
0.0
0.5
1.0
1.5
2.0
Stockholders’ Equitydollars in billions
0.60.7
0.9
1.3
1.7
‘99 ‘00 ‘01 ‘02 ‘03
0.0
0.5
1.0
1.5
2.0
2.5
3.0
3.5
4.0
Net Premiums Writtendollars in billions
1.4 1.5
1.9
2.7
3.7
‘99 ‘00 ‘01 ‘02 ‘03
0
1
2
3
4
5
6
7
8
Investmentsmarket value – dollars in billions
3.0 3.13.6
4.7
6.5
‘99 ‘00 ‘01 ‘02 ‘03

F I N A N C I A L H I G H L I G H T S(Dollars in thousands, except per share data)
Years ended December 31, 2003 2002 2001 2000 1999
Total revenues $ 3,630,108 $ 2,566,084 $ 1,941,797 $ 1,781,287 $ 1,673,668
Net premiums written 3,670,515 2,710,490 1,858,096 1,506,244 1,427,719
Net investment income 210,056 187,875 195,021 210,448 190,316
Service fees 101,715 86,095 75,771 68,049 72,344
Net income (loss) 337,220 175,045 (91,546) 36,238 (37,060)
Net income (loss) per common share:
Basic 4.06 2.29 (1.39) .63 (.64)
Diluted 3.87 2.21 (1.39) .62 (.64)
Return on common
stockholders’ equity 25.3% 18.4% (11.2%) 6.1% (4.9%)
At year end
Total assets $ 9,334,685 $ 7,031,323 $ 5,633,509 $ 5,022,070 $ 4,784,791
Total investments 6,480,713 4,663,100 3,607,586 3,112,540 2,995,980
Stockholders’ equity 1,682,562 1,335,199 931,595 680,896 591,778
Common shares outstanding
(in thousands) 83,538 82,835 74,792 57,726 57,639
Common stockholders’
equity per share 20.14 16.12 12.45 11.79 10.27
R E L A T I V E S T O C K P R I C E P E R F O R M A N C EW. R. Berkley vs. S&P 500 over the past 20 years
2/84 2/86 2/88 2/90 2/92 2/94 2/96 2/98 2/00 2/02 2/04
2000%
1500%
1000%
500%
0%
2336%
629%
W. R . B E R K L E Y C O R P O R AT I O N
S & P 5 0 0
percentage change

F I V E B U S I N E S S S E G M E N T S
W. R. Berkley Corporation’s business segments had an excellent year, each producingstrong earnings growth.
SPECIALTY. The specialty units underwrite complex and sophisticated risks, includinggeneral, professional and product liability coverages as well as commercial transporta-tion business, primarily on an excess and surplus lines basis.2003 RESULTS: Total revenues increased 44% to $1.2 billion. Pre-tax income rose 48%to $202 million.
REGIONAL. The regional units, which are leaders in their local markets, write commer-cial lines coverages for small and mid-sized business firms and governmental entities.This segment also writes surety coverages.2003 RESULTS: Total revenues advanced 23% to $924 million. Pre-tax income increased47% to $153 million.
ALTERNATIVE MARKETS. The alternative markets units develop and administer self-insurance programs and other alternative risk transfer mechanisms, and also writespecialized workers’ compensation insurance. Workers’ compensation business is themain focus of the segment.2003 RESULTS: Total revenues advanced 53% to $551 million. Pre-tax income was $85million, up 36%.
REINSURANCE. The reinsurance units write reinsurance on both a facultative andtreaty basis. In addition, the Company writes business under quota share reinsuranceagreements with several Lloyd’s syndicates and participates in several specialty niches.2003 RESULTS: Total revenues rose 84% to $813 million. Pre-tax income increased 300%to $60 million.
INTERNATIONAL. The Company’s international joint venture operates in Argentinaand Asia.2003 RESULTS: Total revenues declined 25% to $71 million, due mainly to the impact ofcurrency devaluation in Argentina. Segment pre-tax income was $3 million versus apre-tax loss of $2 million in 2002.
T O O U R S H A R E H O L D E R S :
W. R. Berkley Corporation had a record year in 2003. Return on
stockholders’ equity, earnings, net premiums written and cash flow
from operations all increased strongly. While the Company’s 2003
performance was excellent, we expect 2004 to be significantly better.
2
We achieved these results by effectively executingour strategy and capitalizing on the strongestproperty casualty insurance market conditions inmore than a decade. The Company performedwell by every measure in 2003:• Return on equity increased to 25.3% from
18.4% in 2002.• Earnings per share advanced 75% to $3.87.• Net premiums written rose 35% to $3.7 billion.
Approximately three-quarters of the increase came from higher prices and one-quarter fromincreased policy counts.
• The Company’s GAAP combined ratio declinedto 91.4%, well below the industry average andthe Company’s lowest combined ratio in over 20 years, reflecting a higher underwriting profit.
• Cash flow from operations increased 47% to $1.4 billion. Record cash flow helps drive the growth of the Company’s investable assets, which ultimately will result in more future investment income.

3
William R. Berkley
Chairman of the Board and
Chief Executive Officer
Each of the Company’s five business segments –specialty, regional, alternative markets, reinsuranceand international – contributed to sharply higherearnings in 2003.
Equally important was the growth of theCompany’s investment portfolio to $6.5 billionat the end of 2003, up from $4.7 billion a yearearlier. Invested assets at the end of 2003 included$1.4 billion of cash and cash equivalents, reflect-ing our belief that interest rates will rise within thenext year due to expanding federal budget deficitsand a modestly improving economy. We expectthe portfolio to generate more income in the nextfew years as interest rates rise and as we believeit appropriate to invest the Company’s funds atmore attractive longer-term rates.
Looking back, the past three years havebeen an exceptional period for W. R. BerkleyCorporation. As net premiums written haveadvanced from $1.5 billion in 2000 to $3.7 billionin 2003, the Company has moved up the industryladder to become one of the 15 largest commer-cial lines property casualty insurance writers inthe United States.
Looking ahead, we continue to focus on gen-erating the highest risk-adjusted returns. We willgrow the Company opportunistically and seekout new business whenever market conditionsallow us to do so. We work constantly to managethe entire enterprise, evaluating risk and remainingaware of uncertainty, always seeking the maxi-mum potential returns from every opportunity.
W. R. BERKLEY CORPORATION’S STRATEGY. TheCompany performed well in 2003 because man-agement made the right decisions to position thebusiness for profitable growth, and made thesedecisions early. These decisions have allowed theCompany to write more business at a time ofoutstanding industry profitability and, in doingso, grow rapidly and generate returns better thanthose of our insurance industry peers. During2003, to support its growth, the Company raisedadditional capital and expanded several operatingunits while starting three new units.
Good management is not just a matter of pro-ducing higher earnings and better returns. Goodmanagement also requires a clear understanding

4
of the factors behind those earnings. It requires awell-thought-out strategy and effective planningto deal with the opportunities and challenges onthe horizon in order to continue to improve acompany’s performance. In addition, it requires aconstant understanding of, and focus on, the risksinherent in a company’s day-to-day business, whileat the same time being conscious of the uncertainenvironment that is part of contemporary society.
The Company’s strategy, which has consis-tently produced some of the industry’s best results,is based on a philosophy of decentralized opera-tions that places decision-making as close to thecustomer as possible. Through this approach,the Company is able to respond quickly to theconstant changes in its markets and take advan-tage of the opportunities afforded by thosechanges. We empower our managers and holdthem accountable.
Over the past 20 years, we have grown theCompany’s book value by more than 1,400%.The Company’s excellent business performance,not only in 2003 but over longer periods as well,is also reflected in the price of its common stock.W. R. Berkley Corporation’s stock price hasappreciated 2,336%, not including dividends,during the past 20 years, well ahead of the629% price appreciation of the Standard &Poor’s 500 Index.
WRITING PROFITABLE BUSINESS. Insurance industrymarket conditions were robust in 2003 for thesecond consecutive year. In many lines, the
Company obtained price increases of 20% ormore during 2003, accompanied by significantimprovements in terms and conditions. The busi-ness written by the Company during the yearnot only contributed to profits in 2003, butshould contribute in 2004 as well.
The last previous “hard” insurance marketmay offer some perspective on the industry’s out-look today. The last hard market began in 1985,and prices continued to increase until 1988. Eventhough prices then plateaued, returns remained atattractive levels through 1994.
As of the end of 2003, in the wake of twoyears of sizable price increases, the market hadrecovered to approximately its 1990 price levels.With current pricing, we see the prospect of con-tinued excellent returns at least into 2006. Giventoday’s market conditions, this is the time to accessand write as much good business as possible.
W. R. Berkley Corporation’s strategic approachand its high-quality balance sheet have enabled usto do just that. The Company has written morebusiness and grown profitably even as a numberof competitors have been constrained by unre-solved past problems, including the inadequatereserving of prior-year losses. According to arecent report by Standard & Poor’s, the propertycasualty industry is under-reserved by approxi-mately $60 billion, impinging upon the abilityof some insurers to write new business.
Adequate reserves are key to maintaining astrong balance sheet, which in turn enables acompany to write more business. We addressreserving issues proactively and therefore believethe Company is well positioned relative to theindustry. During 2003, as the Company wrotemore business, we increased our reserves to coverthe potential losses associated with that business.

5
W. R. Berkley Corporation’s strategy, which has consis-
tently produced some of the industry’s best results, is based
on a philosophy of decentralized operations that places
decision-making as close to the customer as possible.
By year-end, reserves were $4.2 billion, up 32%from $3.2 billion at the end of 2002. Duringthat same period, the Company’s policy countsincreased by only 7%. The Company’s paid-to-incurred-loss ratio decreased from 53% in 2002to 37% in 2003, remaining well below theindustry average. A lower ratio indicates a posi-tive loss development trend.
The Company has positioned itself favorablyin other ways as well. By exercising care in theselection of reinsurers and insisting on adequatesecurity, we have largely avoided the problemof uncollectible reinsurance, a major challengefor some of our competitors in 2003. In addition,the Company has no material asbestos-relatedliabilities, nor does it use derivatives or haveany “off-balance-sheet” financing. We striveto maintain maximum transparency in ourfinancial statements.
During 2003, the Company issued $350million of debt to support its increasing growth.This additional capital, in combination with theCompany’s high-quality balance sheet, enabledus to write all the business we felt appropriateat attractive rates during 2003. We believeW. R. Berkley Corporation has the financialresources and experienced personnel to continueto write all the good business that will be avail-able to us in 2004 in our market segments.
CHOOSING THE BEST SECTORS. The insurance indus-try is long-term in nature. Companies receivepremiums in return for a contractual promise topay future claims that are uncertain in theirtiming and amount.
Industry challenges, such as natural disastersand periods of inadequate pricing, are endemicand are faced by all insurers. In addition, the
responsibilities of insurers and their insureds areunder constant revision by the courts. Inflation ingeneral, and medical costs in particular, continueto push claims costs higher.
These issues have a different impact on eachinsurance company. Successful companies knowhow to anticipate and deal with the inevitableindustry challenges and continually refine theirstrategies to keep pace with evolving and notalways predictable markets. They know howto choose the right business lines in which toparticipate. They are able to minimize the impactof negative trends and events that are beyondtheir control and optimize the opportunitiesavailable to them when the market environmentis positive. Successful insurance companies are,most importantly, always looking ahead, assessingrisk and conscious of uncertainty.
Since the Company’s founding, we havefocused on identifying and participating in whatwe believe will be the most profitable areas of thebusiness on a risk-adjusted basis, recognizing thatdoing so is critical to the Company’s success. TheCompany’s operating units take part in marketsectors that demand a high level of underwritingskill and offer excellent opportunities for profit.We generally avoid commodity-type business inwhich competition is more intense and marginsare generally lower.
In all its markets, W. R. Berkley Corporationis known as a high-quality insurer that has thecommitment, infrastructure and depth of financialresources to understand the needs of customers

6
In recent years, we have taken a series of actions to
capitalize on opportunities while dealing with challenges
and deliberately refining where and how the Company
does business. Those actions are paying off today.
and meet its obligations to them. Our risk-bearingcompanies have regularly maintained “A” orbetter A.M. Best Co. ratings for more than 25years. Long-term relationships with brokers andagents allow the Company to compete effectivelywith its largest peers. Even in today’s transaction-obsessed world, successful agents and brokersrecognize the importance of commitment.
In managing the Company, we allocate capitalto those insurance lines and those business unitswhere we see the best potential risk-adjustedreturns. We seek to apply the Company’s flexi-bility, responsiveness, expertise and strong rela-tionships to competitive advantage in each of itsmarket sectors. Our goal is to build value forshareholders by outperforming the Company’speers throughout the insurance market cycle.
STRATEGIC ACTIONS. In recent years, we have takena series of actions to capitalize on opportunitieswhile dealing with challenges and deliberatelyrefining where and how the Company does busi-ness. Those actions are paying off today.
Since 2000, the Company has invested signifi-cantly in its specialty group, enabling the groupto grow rapidly in a period which has presentedgreat opportunity. The specialty group wasW. R. Berkley Corporation’s third largest segmentjust three years ago and is now the largest as wellas the most profitable segment. The operatingunits in this segment write complex and sophis-ticated coverages that are often tailored to thecustomer’s particular needs. In 2003, theCompany formed a new unit, Admiral ExcessUnderwriters, to specialize in underwritingexcess casualty coverages, one of the few areasof the specialty market in which we did not pre-viously participate.
The Company’s regional group writes com-mercial lines for small and mid-sized businessesand governmental entities. This exclusive focuson commercial lines has led to significant profitimprovement, reflecting the impact of a favorablemarket environment in combination with thegroup’s enhanced ability to service customers. In2003, the regional segment generated $153 mil-lion of pre-tax income and had an 87.5% GAAPcombined ratio, a remarkable performance.
We recently restructured the Company’s pri-mary surety business by combining four separateoperations into one unit and placing that unitwithin the regional segment as of 2004. Thenew unit principally writes bonds for mid-sizedcontractors. Although surety pricing has beeninsufficient for the past several years, there hasrecently been some improvement. We seek tocapitalize on that improvement by maintaining astrong, highly-focused surety operation with supe-rior underwriting and distribution capabilities.
The alternative markets segment continued itsexcellent growth with good profitability in 2003.This segment is, in part, countercyclical to theother segments. Customers often turn to self-insurance and other alternative markets whenthe primary markets charge higher premiumsfor the same or reduced levels of coverage. TheCompany’s alternative markets units provide bothfee-based services and risk-bearing insurance tomeet the full range of needs of our alternativemarket customers. In addition, the Company hasdeveloped one of the nation’s leading capabilities
7
in managing state workers’ compensation residualmarket mechanisms. In recent years, the Companyhas also leveraged its expertise to start newunits, such as Preferred Employers InsuranceCompany, which specializes in providing workers’compensation coverage for small, owner-managedbusinesses in California. Preferred has grownrapidly during the past two years in response tothe current favorable pricing environment, writing$163 million of net premiums in 2003. Theunit’s tight geographical and product focusenables it to respond quickly to changes in theCalifornia legislative and claims environment.
In the reinsurance segment, during the pasttwo years we have expanded the Company’sfacultative business and have withdrawn fromwhat we perceive to be commodity-type lines inthe treaty operations. Results have been dramatic.The facultative business, led by an extremelyexperienced and disciplined management team,wrote $286 million of net premiums in 2003 ver-sus $62 million in 2001. The reinsurance group didwell in 2003 even though results were dampenedby the need to add to reserves for prior businesswritten in the treaty operation. Segment earningsare expected to continue to improve as this adversedevelopment from prior years is eliminated.
The Company’s international joint ventureis the smallest of the five segments. It returnedto profitability in 2003, overcoming challengingeconomic conditions in Argentina. The venturealso has operations in the Philippines and recentlybegan distributing savings, life insurance and
other financial products in Hong Kong. It isexploring additional opportunities for profitableexpansion in Asia and Latin America.
NEW VENTURES. We continue to develop newbusinesses as platforms to support the Company’slong-term growth. While not yet significant con-tributors to results, these businesses offer excellentprospects for the future. Our financial results fullyreflect the startup expenses of these ventures.
In 2003, in addition to launching AdmiralExcess Underwriters, the Company formedW. R. Berkley Insurance (Europe), Limited inLondon. The new unit is owned 80% byW. R. Berkley Corporation. The unit is focusedinitially on writing professional indemnityinsurance. Late in the year, we formed BerkleyRisk Solutions, Inc., which provides insurance-based as well as reinsurance-focused financialsolutions for insurance companies and self-insuredentities in the U.S. and other markets.
The Company’s other newer venturescontinue to make good progress. B F ReUnderwriters, LLC, which provides casualtyfacultative reinsurance on a direct basis, wrote$56 million of net premiums in 2003, its firstfull year. Berkley Medical Excess Underwriters,LLC, which provides rational capacity to themedical malpractice insurance market, wasestablished at the end of 2001 and wrote $49million of gross premiums in 2003.
MANAGEMENT TEAM. We have an unusual breadthand depth of talented people at the corporatelevel and throughout the Company’s operatingunits. During the past two years, to support theCompany’s growth, we have been selectivelyadding to staff in order to strengthen the

8
Favorable conditions in the Company’smajor lines are expected to continue. While theoverall level of rate increases is abating, the trendremains positive as prices continue to rise morethan “loss cost” inflation. As in the previous hardcycle, we anticipate at least another two years ofstrong pricing, even if prices go up only modestlyon an inflation-adjusted basis from where theyare today. The Company will continue to writeall the good business it can in this environment.
W. R. Berkley Corporation’s excellent results –not only in 2003, but also over longer periods –speak to the dedication and skills of its people. Iwant to personally thank the Company’s employ-ees, brokers, agents, customers and shareholdersfor their support. W. R. Berkley Corporation’sdedicated people worldwide remain committed tomeeting the needs of customers and, by doing so,generating superior returns for shareholders. It isthe responsibility of management to evaluate thesereturns not just in absolute dollars, but also ona risk-adjusted basis. We believe the Company’s2003 results are even better when examined fromthat perspective.
We are extremely pleased with the Company’sperformance in 2003. We have never been moreconfident or excited about W. R. BerkleyCorporation’s prospects for the future.
Sincerely,
William R. BerkleyChairman of the Board andChief Executive OfficerMarch 30, 2004
Company’s risk management capabilities andbring further depth to our overall managementteam in strategic areas.
Robert W. Gosselink joined the Company in2003 as Senior Vice President – Insurance RiskManagement. Jeffrey E. Vosburgh joined theCompany as President of the newly-formedBerkley Risk Solutions unit, and Stuart Wrightcame on board as Chief Executive Officer of thenewly-formed London operation, W. R. BerkleyInsurance (Europe). All three of these individualsare talented, experienced insurance industry exec-utives. We are pleased to welcome them and theskilled teams they have assembled.
Robert C. Hewitt, formerly Senior VicePresident – Risk Management, was namedSenior Vice President – Alternative Markets,succeeding H. Raymond Lankford, who retiredand continues as a consultant to the Company.
Kevin W. Nattrass, formerly Senior VicePresident of Acadia Insurance Company, becamePresident and Chief Operating Officer of BerkleyMid-Atlantic Group.
OUTLOOK. We are confident of another outstandingyear in 2004. The Company’s operations are con-centrated in product lines that have experiencedsome of the insurance industry’s largest priceincreases. Furthermore, W. R. Berkley Corporationprimarily writes casualty insurance, an area whereprices continue to increase.

I N S P E C T I O N
I NSPECT ION
We keep the insurance market
under the microscope. In each
of our businesses, we constantly
search for opportunities that
offer superior rewards with risks
that can be properly evaluated.
9

The effective management of our investment assets is
an integral part of our overall enterprise management.
The investment portfolio, which has more than doubled
in size during the past four years, is an important driver
of future earnings.
10
he portfolio increased significantly in 2003, totaling$6.5 billion at year-end, up from $4.7 billion at theend of 2002. This increase primarily reflected the
investment of cash flow from operations as well as theproceeds from two financings totaling $350 million,in addition to market appreciation.
In 2003, the portfolio generated $210 million ofnet investment income, up 12% from 2002 despitethe impact of low interest rates and the shortenedportfolio duration.
The portfolio is managed conservatively to supportthe Company’s ability to write insurance. We have threemain investment goals: achieve favorable risk-adjustedreturns; avoid investment exposures that might impairthe Company’s ability to expand its insurance business;and maintain the duration of the fixed income portfoliowithin one year of the duration of the Company’s lia-bilities, including policy claims and debt obligations.
FIXED INCOME INVESTMENTS. At year-end, theportfolio was invested 88% in fixed income securities,including cash and cash equivalents. Low interest rateshave created a challenging fixed income investmentenvironment. Our current view is that interest rateswill move higher within the next year due to varioustrends, including expanding federal budget deficitsand a weak dollar. As a result, we have recently beeninvesting new monies primarily in short-term securities
I N V E S T M E N T S
Eugene G. Ballard
Senior Vice President
Chief Financial Officer and Treasuer
James G. Shiel
Senior Vice President
Investments
T

11
to lessen the portfolio’s exposure to the impact ofanticipated rate increases.
The Company had $1.4 billion of cash and cashequivalents at year-end. Although this cash positionaffected the level of investment income in 2003, webelieve the Company will be well rewarded in the longrun when interest rates increase and we are able toinvest at more attractive yields. In the fall of 2003, theCompany invested several hundred million dollars inintermediate-term municipal bonds when bond pricesdeclined temporarily and yields suddenly became espe-cially attractive. We remain alert to other opportunitiesto capture higher rates.
At year-end, the fixed income portfolio was invested36% in U.S. Government securities (including cash and
Paul J. Hancock
Senior Vice President
Chief Corporate Actuary
Ira S. Lederman
Senior Vice President
General Counsel and Secretary
Robert W. Gosselink
Senior Vice President
Insurance Risk Management
0
20
40
60
80
100
120
Fixed Income Portfolio Distribution
4%11%
25%
34%
17%
9%
U.S. Government and Government Agency
Foreign Bonds
Corporate Bonds
Cash and Cash Equivalents
State and MunicipalMortgage-backed Securities
cash equivalents), 34% in municipal securities, 17% inmortgage-backed securities, 9% in corporate bonds(including a modest position in high-yield bonds) and 4%in foreign bonds.
The weighted average credit rating of the fixed incomeportfolio was “AA” at year-end, and the duration was 4.1years, approximately one year shorter than the durationof the Company’s liabilities.
ALTERNATIVE INVESTMENTS. The portfolio includes vari-ous alternative investments which offer opportunities formore favorable returns while diversifying risk. Theseinvestments, which are managed by outside professionals,represented 12% of the overall portfolio at year-end.
Merger arbitrage has been a mainstay of the alternativeportfolio for more than 15 years. Although we have scaledback the portfolio’s allocation to this area for the past twoyears because of modest merger and acquisition activity,we are optimistic that the recent sharp increase in mergeractivity will create renewed opportunities.
During the past two years, we have increased theportfolio’s investments in other income-producing areaswhere we see attractive returns, including high dividendcommon stocks, convertible securities arbitrage and realestate investment trusts (REITs). In 2003, the portfoliomade its first direct investment of $50 million in commer-cial real estate. The total allocation to the real estate sector,including REITs, was $254 million at year-end.

0
5
10
15
20
25
30
35
40
12
Each of our five business segments is comprised of individual operating units that serve amarket that is defined by geography, products or services, or types of customers. Our growthis based on meeting the needs of customers, maintaining a high-quality balance sheet andallocating capital to our best opportunities.
S E G M E N T O V E RV I E W
33
23
26
40
17
12
30
12
16
Specialty
Regional
Alternative
Reinsurance
International
Specialty
Regional
Alternative
Reinsurance
International
0.000
103.125
206.250
309.375
412.500
515.625
618.750
721.875
825.000
2003 Revenues versus Profits dollars in millions
1,188
551 85
60
924 153
71 3
813
202
2003 Revenues
Specialty
Regional
Alternative
Reinsurance
International
Specialty
Regional
Alternative
Reinsurance
International
2003 Revenues versus Profits percent
0.000
103.125
206.250
309.375
412.500
515.625
618.750
721.875
825.000
2003 Profits
0.000
103.125
206.250
309.375
412.500
515.625
618.750
721.875
825.000
2003 Revenues
0.000
103.125
206.250
309.375
412.500
515.625
618.750
721.875
825.000
2003 Profits

S T R A T E G Y
13
STRATEGY
W. R. Berkley Corporation’s long-
term strategy of decentralized
operations helps drive results.
Each of our operating units is
empowered to identify and
respond quickly to customers’
needs.
S P E C I A LT Y S E G M E N T
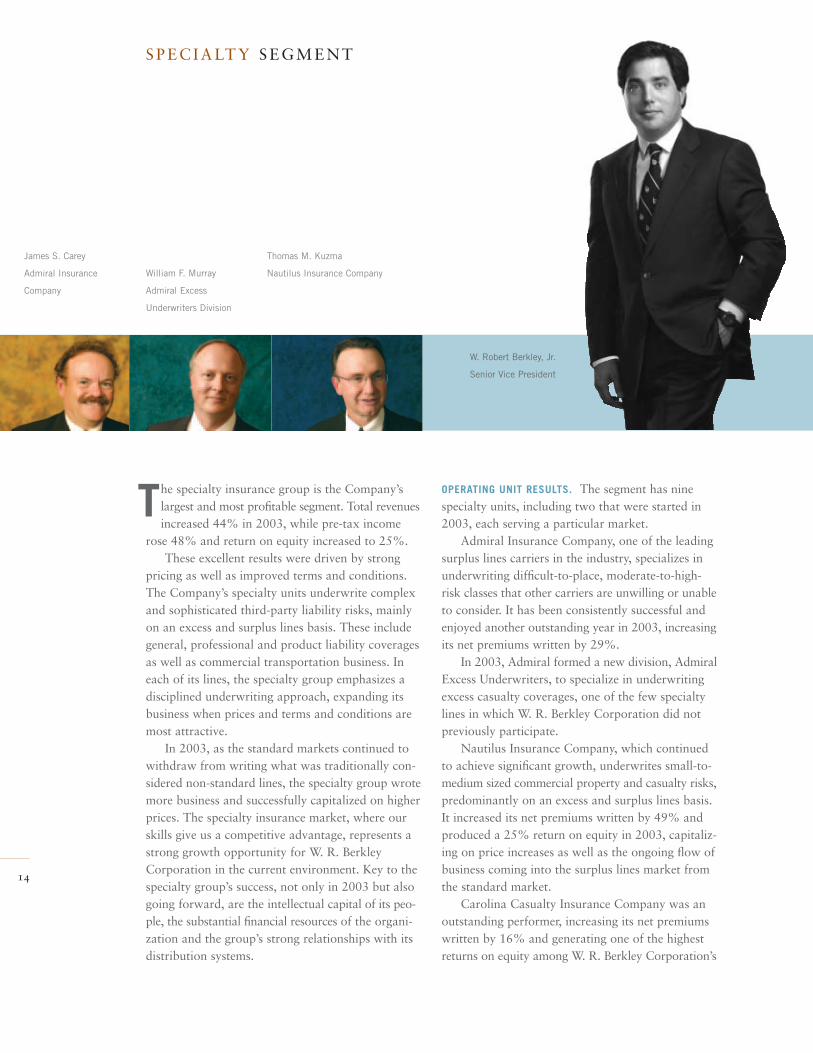
he specialty insurance group is the Company’slargest and most profitable segment. Total revenuesincreased 44% in 2003, while pre-tax income
rose 48% and return on equity increased to 25%.These excellent results were driven by strong
pricing as well as improved terms and conditions.The Company’s specialty units underwrite complexand sophisticated third-party liability risks, mainlyon an excess and surplus lines basis. These includegeneral, professional and product liability coveragesas well as commercial transportation business. Ineach of its lines, the specialty group emphasizes adisciplined underwriting approach, expanding itsbusiness when prices and terms and conditions aremost attractive.
In 2003, as the standard markets continued towithdraw from writing what was traditionally con-sidered non-standard lines, the specialty group wrotemore business and successfully capitalized on higherprices. The specialty insurance market, where ourskills give us a competitive advantage, represents astrong growth opportunity for W. R. BerkleyCorporation in the current environment. Key to thespecialty group’s success, not only in 2003 but alsogoing forward, are the intellectual capital of its peo-ple, the substantial financial resources of the organi-zation and the group’s strong relationships with itsdistribution systems.
William F. Murray
Admiral Excess
Underwriters Division
Thomas M. Kuzma
Nautilus Insurance Company
James S. Carey
Admiral Insurance
Company
OPERATING UNIT RESULTS. The segment has ninespecialty units, including two that were started in2003, each serving a particular market.
Admiral Insurance Company, one of the leadingsurplus lines carriers in the industry, specializes inunderwriting difficult-to-place, moderate-to-high-risk classes that other carriers are unwilling or unableto consider. It has been consistently successful andenjoyed another outstanding year in 2003, increasingits net premiums written by 29%.
In 2003, Admiral formed a new division, AdmiralExcess Underwriters, to specialize in underwritingexcess casualty coverages, one of the few specialtylines in which W. R. Berkley Corporation did notpreviously participate.
Nautilus Insurance Company, which continuedto achieve significant growth, underwrites small-to-medium sized commercial property and casualty risks,predominantly on an excess and surplus lines basis.It increased its net premiums written by 49% andproduced a 25% return on equity in 2003, capitaliz-ing on price increases as well as the ongoing flow ofbusiness coming into the surplus lines market fromthe standard market.
Carolina Casualty Insurance Company was anoutstanding performer, increasing its net premiumswritten by 16% and generating one of the highestreturns on equity among W. R. Berkley Corporation’s
14
T
W. Robert Berkley, Jr.
Senior Vice President

15
Douglas J. Powers
Monitor Liability
Managers, Inc.
Alfred Schonberger
Clermont Specialty
Managers, Ltd.
J. Michael Foley
Berkley Medical Excess
Underwriters, LLC
Stuart Wright
W. R. Berkley Insurance
(Europe), Limited
Richard P. Shemitis
Vela Insurance
Services, Inc.
Armin W. Blumberg
Carolina Casualty
Insurance Company
Segment Data Dollars in Millions
Total assets
Total revenues
Pre-tax income
GAAP combined ratio
Return on equity
Excludes realized investment gains and loses.
$3,128
1,188
202
88%
25%
$2,271
827
136
89%
21%
2003 2002
19%
52%
Other
General Liability6%Directors &Officers
CommercialTransportation
12%
Professional Liability
11%
27 operating units. Carolina specializes in commercialtransportation insurance, primarily involving long-haul trucking and public automobile risks. Thecompany continues to work with its agents andbrokers to position itself as a preferred commercialtransportation market.
Vela Insurance Services, Inc. writes excess andsurplus lines with a primary focus on contractor andproduct liability coverages. Vela increased its netpremiums written by 44% in 2003 and generateda 40% return on equity.
Monitor Liability Managers, Inc. writes directorsand officers, lawyers professional and employmentpractices lines. It continued to perform well in 2003,delivering a 35% return on equity despite the con-stantly evolving complexities of its line of business.
While most of the units in the specialty groupserve customers nationwide, Clermont SpecialtyManagers, Ltd. has a specific geographic focus.Clermont writes package insurance programs forresidential condominium and co-op associations aswell as for upscale restaurants in the metropolitanNew York City area, where it has well-establishedrelationships with its distributors. Clermont increasedits net premiums written by 28% in 2003 and contin-ued to increase its profits.
Berkley Medical Excess Underwriters, LLC writesmedical malpractice excess insurance and reinsurancefor hospitals. The unit had a strong year, increasing itsgross premiums written to $49 million in 2003, itsfirst full year of operation, and continues to establishits position as a market leader.
In July 2003, W. R. Berkley Corporationexpanded its specialty operations to the UnitedKingdom by forming W. R. Berkley Insurance(Europe), Limited, which is owned 80% byW. R. Berkley Corporation and 20% by Kiln plc.The new company is initially writing professionalindemnity insurance, with additional lines to beadded. Net premiums written were $43 million inthe unit’s partial first year.
SPECIALTY SEGMENT OUTLOOK. Specialty insurancemarkets have remained strong in the opening monthsof 2004, and we believe these favorable marketconditions will continue. As a leader in specialtyinsurance, we have the people, the capital and thedistribution relationships to establish an even moresignificant presence in the market segments in whichwe participate.
Gross Written Premiums by Line

Kevin W. Nattrass
Berkley Mid-Atlantic GroupBill Thornton
Acadia Insurance Company
16
R E G I O N A L S E G M E N T
Robert P. Cole
Senior Vice President
he regional segment had an outstanding year,achieving a record 28% return on equity. Thesegment has grown rapidly and has delivered
excellent profitability since we took a series of actions,beginning in 1999, to restructure the business andfocus on the best opportunities.
These actions, coupled with the segment’s ongoingefforts to deliver superior service to customers andexcellent financial results to shareholders, enabledW. R. Berkley Corporation to become one of the bestperformers in the entire regional property casualtyindustry in 2003. The segment’s revenue increased23% in 2003, reflecting higher prices in a strongmarket as well as a modest increase in policy count.Pre-tax operating income advanced 47%.
The segment consists of four commercial linesunits as well as the Company’s primary surety unit.Operations are decentralized, placing decision-mak-ing in the hands of people who are close to the cus-tomer. We believe the growing success of theregional group reflects not only the skills of our peo-ple, but also the group’s focus on smaller and mid-sized commercial lines customers, its strong localpresence in each of its markets, and the ability ofthe operating units to identify and respond rapidlyto customers’ needs.
Since 1999, we have realigned the segment bycombining 10 regional units into the current four
commercial lines units, withdrawing from personallines insurance, re-underwriting all our business toimprove pricing and tighten terms, and combiningthe Company’s various primary surety operationsinto a single unit. Because we restructured proactively,the regional segment has been well positioned tocapitalize on market opportunities. We have, at thesame time, been able to provide agents with thesteady source of capacity they need even in a periodof mergers and withdrawals by many other regionalcommercial lines carriers.
OPERATING UNIT RESULTS. The four commercial linesunits – Acadia Insurance Company, Berkley Mid-Atlantic Group, Continental Western Group andUnion Standard Insurance Group – serve small andmid-sized business and governmental entities primarilyin 32 states. Each is a multi-line company, offeringan array of commercial lines insurance products andloss control services through a select group of agents.
Acadia writes commercial business in Maine,New Hampshire, Vermont, Massachusetts,Connecticut, and central and northern New York. Inaddition to writing a full line of standard commercialproperty casualty products, it writes specialty prod-ucts for companies in the region, including lumbermills, timber haulers, and marine business. Acadia hadanother standout year, achieving strong profitability,
T

Gross Written Premiums by Unit
17
Bradley S. Kuster
Continental Western Group
Craig W. Sparks
Union Standard
Insurance Group
Segment Data Dollars in Millions
Total assets
Total revenues
Pre-tax income
GAAP combined ratio
Return on equity
Excludes personal lines business and realized investment gains and loses.
$1,993
924
153
88%
28%
$1,591
750
104
92%
20%
2003 2002
Paul J. Fleming
Monitor Surety Managers, Inc.
17%
29%
Union Standard
Acadia
ContinentalWestern
14%
BerkleyMid-Atlantic
40%
36% growth in net premiums written and an 87%GAAP combined ratio. Continuing its expansion,Acadia recently opened new branch offices inConnecticut and upstate New York, firmly establishingitself as one of the premier commercial lines carriersin the Northeast.
Berkley Mid-Atlantic Group’s marketing territoryspans the Atlantic coast from Pennsylvania to SouthCarolina, including the District of Columbia. Theunit reported solid results in 2003, increasing its netpremiums written by 13%. With the recent strength-ening of its management team, we believe the unit ispoised for excellent results in 2004.
Continental Western, the largest of the regionalcompanies, serves the insurance needs of business andfarm owners and governmental entities throughoutthe Midwest and Pacific Northwest. It enjoyed anotheroutstanding year, achieving an 84% combined ratiotogether with strong profit and revenue growth.Continental Western offers a number of specialtyproducts, including property casualty insurance pack-ages for fire departments throughout the Midwestand products covering farm equipment dealers, grain elevators, municipalities and collector cars. Itattained good growth in each of these areas in 2003.
In the South, Union Standard writes business ineight states from Alabama to New Mexico. The yearwas one of significant improvement for the unit, as it
joined the ranks of superior performers in the regionalgroup. Union Standard registered strong revenue andearnings improvement, and its combined ratio of 87%was the best in the unit’s 28-year history. UnionStandard is streamlining the way it does businessthrough investments in imaging technology andimproved workflow processes. These technologiesand processes will over time be adopted by the otherregional units as appropriate.
Contract bonds and court and commercial bondsare written through Monitor Surety Managers, Inc.,which has offices in the East, Midwest and Southand maintains a primary focus on providing suretybonds to mid-sized contractors. The unit wrote $13million of net premiums in 2003, a sizable increaseover 2002, and had a profitable year.
REGIONAL SEGMENT OUTLOOK. The regional group hasdelivered excellent results each of the past two yearsand, in the process, has become one of the nation’spremier regional commercial lines carriers. Duringthis period, the group has focused on improving itsmarket position while remaining disciplined in itsunderwriting standards. We anticipate another yearof profitable growth in 2004 and remain dedicatedto building an organization that can succeed in allmarket conditions.

18
A LT E R N AT I V E M A R K E T S S E G M E N T
Kenneth R. Hopkins
Berkley Risk Administrators
Company, LLC
Melodee J. Saunders
Midwest Employers
Casualty Company
Linda R. Smith
Preferred Employers
Insurance Company
Mark C. Tansey
Berkley Risk Administrators
Company, LLC
operations, the segment participated in the favorablepricing environment for traditional insurance products.
OPERATING UNIT RESULTS. Each alternative marketsunit has a particular business focus, and each achievedsuperior returns in 2003.
Berkley Risk Administrators Company, LLC(BRAC) – a third-party administrator and programmanager that designs, implements and manages alter-native risk financing programs and self-insurancepools – had an outstanding year, increasing its servicefee revenues by 12% in 2003 and further improvingits net income.
BRAC continued to expand its business of admin-istering state workers’ compensation assigned riskplans, a growth area, by successfully being awardedcontracts in three additional states in 2003. Equallyimportant, BRAC provides businesses, governments,educational institutions, tribal nations and non-profitentities with various alternative market services. Overthe last few years, BRAC has steadily expanded thegeographic reach of its services and now has clientson the East and West coasts and in the Southwestas well as in the Midwest, its traditional base. In2002, the Company formed a risk-bearing company,Nonprofits Insurance Company, which gives BRACfurther flexibility to provide insurance products andrelated fee-based services.
Midwest Employers Casualty Company (MECC)increased its net premiums written by 42%, with
he alternative markets segment continued to buildon its unique expertise in workers’ compensationinsurance, delivering its third consecutive year of
excellent results. Total revenues increased by 53%over 2002 while pre-tax income advanced 36%.Return on equity reached 25%.
We have built the alternative markets segmentopportunistically over the past two decades, addingnew units when we have identified promising marketsin which we can hire talented people and apply ourskills to competitive advantage. The segment currentlyprovides workers’ compensation insurance productsand fee-based insurance services through four majorareas of business:• Providing workers’ compensation insurance on an
excess basis for group and individual self-insuredsand on a primary basis in selected states;
• Managing state workers’ compensation residual market mechanisms;
• Providing bundled and unbundled fee-basedservices to help corporate, government, non-profitand other entities develop and administer self-insurance programs and utilize other alternative means of financing or transferring risk; and
• Writing workers’ compensation insurance for small,owner-managed businesses in California.
In 2003, the segment continued to capitalizeon opportunities to grow its fee-based business byproviding alternative mechanisms to help clientscontrol costs. In addition, through its risk-bearing
T

Joe W. Sykes
Key Risk Insurance Company
strong earnings. A national provider of excess workers’compensation coverage to individual employers andgroups above their self-insured or retained coverages,MECC has a unique ability to identify desirableworkers’ compensation risks. Through its under-writing and pricing process, the company gains anunderstanding of each risk’s historical and prospectivefrequency and severity performance against its peers,and then applies that knowledge to identify preferredrisks with the least propensity to cause loss. Thissophisticated information provides MECC with acompetitive advantage in that few if any competitorshave similar capabilities. In 2004, MECC plans toenter the large deductible area to complement itsother businesses.
Preferred Employers Insurance Company has beenvery successful in providing workers’ compensationcoverage for small business owners in the state ofCalifornia, writing $163 million of net premiums in2003. Preferred commenced operations in 1998 ona modest scale and has grown significantly duringthe past two years, generating superior returns in afavorable pricing environment. The unit continues towork with a select group of brokers who understandthe firm’s philosophy and business objectives.
In the Southeast, Key Risk Insurance Company(KRIC) and its affiliate, Key Risk ManagementServices, Inc. (KRMS), provide workers’ compensa-tion insurance products and services for employersin North Carolina, South Carolina, Virginia and
19
Robert C. Hewitt
Senior Vice
President
Segment Data Dollars in Millions
Total assets
Total revenues
Pre-tax income
GAAP combined ratio
Return on equity
Excludes realized investment gains and loses.
$1,505
551
85
93%
25%
$1,198
359
63
96%
21%
2003 2002
23%
23%
Preferred Employers
Berkley Risk39%
Midwest Employers
Georgia. Both units did well in 2003, increasing theirnet income and generating excellent returns on equity.KRIC underwrites workers’ compensation productsand recently created a healthcare division to capitalizeon the favorable market conditions in this industrysector. KRMS is a fee-based service organization,developing and administering workers’ compensationprograms for self-insureds and insurance carriers.
ALTERNATIVE MARKETS SEGMENT OUTLOOK. Based oncurrent trends and market conditions, the alternativemarkets segment is well positioned for another year ofprofitable growth in 2004. Our alternative marketsunits have not only grown their fee-for-service rev-enues in the current hard market, but have also lever-aged the current pricing environment to achieve solidreturns in their risk-bearing operations. We anticipatecontinued growth in both areas in 2004, drivinganother year of outstanding overall performance.
15%Key Risk
Revenues by Unit

Tom N. Kellogg
Signet Star Re, LLC Craig N. Johnson
Signet Star Re, LLC
20
R E I N S U R A N C E S E G M E N T
Daniel L. Avery
B F Re Underwriters, LLC
Roger J. Bassi
Fidelity & Surety Reinsurance
Managers, LLC
and conditions improved. Facultative ReSources,which writes business through intermediaries, tookadvantage of better pricing and improved terms andconditions in workers’ compensation reinsurance tosubstantially increase its book of business in that area.B F Re Underwriters, which we formed in late 2002to write business primarily on a direct basis, generated$56 million of net premiums written in 2003, its firstfull year.
Overall, the segment’s facultative reinsurance netpremiums written increased to $286 million in 2003from $140 million in 2002. In more than doublingtheir premiums, the facultative units capitalized on avery strong market, as some competitors were forcedto withdraw due to company-specific problems. Whilegrowing dramatically during the past two years, theCompany’s facultative units are prepared to cut backas necessary when the market softens and feweropportunities are available.
The segment’s treaty reinsurance business ismanaged by Signet Star Re, LLC, which also enjoyedstrong growth, increasing its net premiums writtento $324 million in 2003 from $227 million in 2002.During the past three years, we have re-engineeredSignet Star Re by re-staffing the unit and developinga strong underwriting culture. These efforts are nowpaying off with significant improvement in results.
Most treaty reinsurers remained disciplined intheir underwriting during 2003 even though therewas ample industry capacity for well-priced business.
he reinsurance segment quadrupled its pre-taxincome in 2003 with strong revenue growth inboth its facultative and treaty businesses.
Facultative net premiums written more than doubledover 2002.
In reinsurance, as in the other segments, we suc-cessfully implemented our strategy of writing as muchgood business as possible in the current positive mar-ket environment. The reinsurance segment’s operatingunits not only capitalized on price increases andimproved terms and conditions in 2003, but also grewtheir certificate counts during the year.
The segment’s facultative operations performedespecially well, generating gross premiums that, forthe first time, equaled those in the treaty business.We believe the Company’s Facultative ReSources, Inc.unit was the largest broker facultative reinsurancemarket in the U.S. in 2003.
OPERATING UNIT RESULTS. The segment utilizesthe risk-bearing capabilities of Berkley InsuranceCompany (BIC), which carries an A.M. Best Co.rating of “A (Excellent)” and a Standard & Poor’srating of “A+ (Superior).” Business is written onbehalf of BIC by various affiliated underwritingmanagement units, which have a depth of under-writing expertise and excellent distribution.
In the facultative area, Facultative ReSources, Inc.and B F Re Underwriters, LLC both had very goodyears, writing more business as prices and terms
T

Segment Data Dollars in Millions
Total assets
Total revenues
Pre-tax income
GAAP combined ratio
Return on equity
Excludes alternative markets reinsurance and realized investment gains and loses.
$3,415
813
60
99%
10%
$2,431
442
15
107%
4%
2003 2002
34%
8%
28%6%
24%
Lloyd’s
BerkleyUnderwriting
Partners
FacultativeReSources
B F Re
Jeffrey E. Vosburgh
Berkley Risk Solutions, Inc.John S. Diem
Berkley Underwriting
Partners, LLC
James W. McCleary
Senior Vice President and
President and
CEO of Facultative ReSources, Inc.
21
As a result of this market discipline, Signet Star Re wasable to identify and capitalize on many opportuni-ties. The unit’s business is focused primarily onexcess of loss casualty coverages, where we see thebest profit potential.
As its name implies, Fidelity & Surety ReinsuranceManagers, LLC writes fidelity and surety coverage,although it is currently writing only limited amountsof business until weakness in the surety reinsurancemarket is resolved.
Another of the reinsurance units, BerkleyUnderwriting Partners, LLC (BUP), utilizes programadministrators to write specialty insurance products.It emphasizes small-to-medium sized opportunitieswhere the administrator has unique product expertiseand BUP provides the centralized operating platform.This structure allows programs to thrive at levelswhich could not otherwise sustain the costs associatedwith being a standalone business entity. BUP’s busi-ness model is exemplified by its equine underwritingdivision, started in late 2003, which specializes inlivestock mortality. BUP provides the operating plat-form for the new division and specialists provide theprogram and product knowledge.
Berkley Risk Solutions, Inc., the newest unit inthe reinsurance group, was formed in late 2003. Itprovides insurance-based and reinsurance-basedfinancial solutions to insurance companies and self-insured entities not only in the United States but alsoin other markets.
Gross Written Premiums by Unit
REINSURANCE SEGMENT OUTLOOK. We anticipateanother year of profitable growth in the reinsurancesegment even though the Company plans to writeless business through its quota share reinsuranceagreements with Lloyd’s syndicates. Not only does thereinsurance business written in 2003 have significantfuture profit embedded in it, but we also believe thatreinsurance prices will remain attractive. We foreseemany opportunities ahead and remain focused onwriting as much profitable business as possible inthe current strong market.
Signet Star Re

22
ASIA. Our business in the Philippines specializes inendowment policies to pre-fund educational expensesand retirement income, as well as in traditional lifeinsurance products. The business increased its assetsunder management by 20% in 2003, outperformingcompetitors, and reduced its expenses, although earn-ings were lower than in 2002. Through consistentgrowth since 1997, when the operation was started,we now hold approximately a 14% share of newbusiness in the Philippines’ endowment pre-fundingmarket.
Late in the year, we formed an insurance agencyin Hong Kong to distribute life insurance products ina manner similar to that used in the Philippines.
INTERNATIONAL SEGMENT OUTLOOK. We anticipateprofitable growth in both Argentina and thePhilippines in 2004. Over time, we will seek newopportunities in the property casualty insurance mar-kets of selected countries in Latin America and Asiathat fit Berkley International’s approach and strategy.
he international segment returned to profitabilityin 2003, following a difficult year in 2002, andincreased its pre-tax income by $5 million. We
anticipate further profit improvement in 2004.We conduct our international business through
Berkley International, LLC, a joint venture with asubsidiary of The Northwestern Mutual LifeInsurance Company. W. R. Berkley Corporationowns 65% of the venture and holds managementresponsibility. Berkley International has operationsin Argentina and Asia.
ARGENTINA. In Argentina, we positioned the businessto perform well in 2003 by identifying and respondingto critical issues early. The Argentine operationreturned to sound levels of profitability in 2003 eventhough revenues declined due primarily to the impactof currency devaluation and the discontinuance ofthe life insurance operations.
Berkley International’s property casualty opera-tions in Argentina encompass both personal andcommercial lines and benefited in 2003 from improve-ment in the automobile insurance market. We shiftedthe market focus of our workers’ compensationbusiness from larger to mid-sized companies, whereprofit opportunities are greater at this time.
Through these and other actions, we again havea healthy business in Argentina with good prospectsfor profitable growth for 2004.
I N T E R N AT I O N A L S E G M E N T
Eduardo I. Llobet
Berkley International
Seguros S.A.
Fernando Correa Urquiza
President of
Berkley International, LLC
Alan M. Rafe
BI China, Limited
Segment Data Dollars in Millions
Total assets
Total revenues
Pre-tax income (loss)
GAAP combined ratio
Return on equity
Excludes realized investment and foreign currency gains and loses.
$153
71
3
97%
11%
$127
95
(2)
106%
N/A
2003 2002
T

23
C O N T E N T S
CONTENTS
Is the beaker half full or half
empty? Will insurance markets
continue to strengthen or are
they nearing their peak? While
market trends are important, it
is vital to analyze the contents
of the beaker. W. R. Berkley
Corporation’s contents – our
well-managed operating units,
supported by substantial financial
resources – have consistently
delivered returns that are among
the highest in the property casu-
alty insurance industry.

24
TODAY & TOMORROW
We at W. R. Berkley Corporation
apply long-term, enterprise-wide
management to optimize risk-adjusted
returns. We have the expertise and
resources to maximize our strengths
in the present environment – and the
flexibility to anticipate, innovate and
respond to whatever opportunities
and challenges the future may hold.

W . R . B E R K L E Y C O R P O R A T I O N | 2 0 0 3 F I N A N C I A L D A T A
25

26
F I N A N C I A L D ATA(Amounts in thousands, except per share data)
Years ended December 31, 2003 2002 2001 2000 1999
Net premiums written $ 3,670,515 $ 2,710,490 $ 1,858,096 $ 1,506,244 $ 1,427,719Net premiums earned 3,234,610 2,252,527 1,680,469 1,491,014 1,414,384Net investment income 210,056 187,875 195,021 210,448 190,316Service fees 101,715 86,095 75,771 68,049 72,344Realized investment gains (losses) 82,531 15,214 (12,252) 7,535 (5,683)Foreign currency gains (losses) (839) 21,856 758 829 (381)Total revenues 3,630,108 2,566,084 1,941,797 1,781,287 1,673,668Interest expense 54,733 45,475 45,719 47,596 50,801Income (loss) before income taxes 489,304 259,433 (151,394) 40,851 (79,248)Income tax (expense) benefit (150,626) (84,139) 56,661 (2,451) 45,766Minority interest (1,458) (249) 3,187 (2,162) (566)Preferred dividends — — — — (497)Net income (loss) before changein accounting and extraordinary gain 337,220 175,045 (91,546) 36,238 (34,545)
Cumulative effect of change in accounting — — — — (3,250)Extraordinary gain — — — — 735Net income (loss) attributableto common stockholders 337,220 175,045 (91,546) 36,238 (37,060)
Data per common share:Net income (loss) per basic share 4.06 2.29 (1.39) .63 (.64)Net income (loss) per diluted share 3.87 2.21 (1.39) .62 (.64)Stockholders’ equity 20.14 16.12 12.45 11.79 10.27Cash dividends declared .28 .24 .24 .24 .24
Weighted average shares outstanding:Basic 83,124 76,328 65,562 57,672 58,103Diluted 87,063 79,385 68,750 58,481 58,337
Investments (1) $ 6,480,713 $ 4,663,100 $ 3,607,586 $ 3,112,540 $ 2,995,980Total assets 9,334,685 7,031,323 5,633,509 5,022,070 4,784,791Reserves for losses and loss expenses 4,192,091 3,167,925 2,763,850 2,475,805 2,340,890Debt 659,208 362,985 370,554 370,158 394,792Trust preferred securities 193,336 198,251 198,210 198,169 198,126Stockholders’ equity 1,682,562 1,335,199 931,595 680,896 591,778
(1) Including trading account receivable from brokers and clearing organizations and trading account securities sold but not yet purchased.
Past Prices of Common StockThe common stock of the Company is traded on the New York Stock Exchange under the symbol “BER”. Allamounts have been adjusted to reflect the 3-for-2 common stock splits effected on August 27, 2003 and July 2, 2002.
Price Range: High Low Common Dividends Paid Per Share2003Fourth Quarter $ 36.93 $ 31.55 $ .07Third Quarter 36.01 31.27 .07Second Quarter 35.73 27.83 .07First Quarter 28.80 24.39 .07
2002Fourth Quarter $ 26.85 $ 20.76 $ .06Third Quarter 24.93 19.93 .06Second Quarter 27.20 23.98 .06First Quarter 25.80 21.36 .06
27
M A N A G E M E N T ’ S D I S C U S S I O N A N D A N A LY S I Sof Financial Condition and Results of Operations
Overview
W. R. Berkley Corporation is an insurance holdingcompany that provides, through its subsidiaries,commercial property casualty insurance products andservices. The Company’s primary sources of revenuesand earnings are insurance and investments.
The profitability of the Company’s insurance busi-ness is affected primarily by the adequacy of premiumrates. The ultimate adequacy of premium rates is notknown at the time a property casualty insurance policyis issued because premiums are usually determined longbefore claims are reported. The ultimate adequacy ofpremium rates is affected mainly by the severity andfrequency of claims, which are influenced by manyfactors, including natural and other disasters, regulatorymeasures and court decisions that define and expandthe extent of coverage and the effects of economicinflation on the amount of compensation due forinjuries or losses. General insurance prices are alsoinfluenced by the available insurance capacity, i.e., thelevel of policyholders’ surplus employed in the industryand the industry’s willingness to deploy that capital.
The Company’s invested assets, which are derivedfrom its own capital and cash flow from insurance busi-ness, are invested principally in fixed income securities.The return on invested assets is affected primarily bygeneral interest rates and the credit quality and durationof the investment portfolio.
Critical Accounting Policies
Management considers policies relating to reserves forlosses and loss expenses to be critical to the portrayalof the Company’s financial condition and results sincethey require management to establish estimates basedon complex and subjective judgments, often includingthe interplay of specific uncertainties with relatedaccounting measurements.
In the property casualty insurance industry, signifi-cant periods of time may elapse between the occurrenceof an insured loss, the report of the loss to the insurerand the insurer’s payment of that loss. To recognizeliabilities for unpaid losses, either known or unknown,insurers establish reserves, which is a balance sheetaccount representing estimates of future amountsneeded to pay claims and related expenses with respectto insured events which have occurred. Our lossreserves reflect our best estimates of the cost of settlingall such claims.
In general, when a claim is reported, claims person-nel establish a “case reserve” for the estimated amountof the ultimate payment. The estimate represents aninformed judgment based on general reserving practicesand reflects the experience and knowledge of the claimspersonnel regarding the nature and value of the specifictype of claim. Reserves are also established on anaggregate basis which provide for losses incurred butnot yet reported to the insurer, potential inadequacy ofcase reserves, the estimated expenses of settling claims,including legal and other fees and general expenses of administering the claims adjustment process, and aprovision for potentially uncollectible reinsurance.Reserves are established based upon the then currentlegal interpretation of coverage provided.
In examining reserve adequacy, several factors areconsidered in addition to the economic value of losses.These factors include historical data, legal developments,changes in social attitudes and economic conditions,including the effects of inflation. The actuarial processrelies on the basic assumption that past experience,adjusted judgmentally for the effects of current devel-opments and anticipated trends, is an appropriate basisfor predicting future outcomes. Reserve amounts arenecessarily based on management’s informed estimatesand judgments using data currently available. As addi-tional experience and other data become available andare reviewed, these estimates and judgments are revised.This may result in increases or decreases to reserves forinsured events of prior years. The reserving processimplicitly recognizes the impact of inflation and otherfactors affecting loss costs by taking into accounthistorical claim patterns and perceived trends.

Reserves do not represent an exact calculation ofliability. Rather, reserves represent an estimate of whatmanagement expects the ultimate settlement and claimadministration will cost. While the methods for estab-lishing the reserves are well tested over time, some ofthe major assumptions about anticipated loss emergencepatterns are subject to unanticipated fluctuation. Theseestimates, which generally involve actuarial projections,are based on management’s assessment of facts and circumstances then known, as well as estimates offuture trends in claims severity and frequency, judicialtheories of liability and other factors, including theactions of third parties which are beyond the Company’scontrol. The variables described above are affected by both internal and external events, such as inflation,judicial and litigation trends, reinsurance coverage andlegislative changes.
The inherent uncertainties of estimating reserves aregreater for certain types of liabilities, where long periodsof time elapse before a definitive determination ofliability is made. In periods with increased economicvolatility, it becomes more difficult to accurately predictclaim costs. Reserve estimates are continually refined inan ongoing process as experience develops and furtherclaims are reported and settled. Adjustments to reservesare reflected in the results of the periods in which suchestimates are changed. Because setting reserves is inher-ently uncertain, the Company cannot assure that itscurrent reserves will prove adequate in light of subse-quent events. Should the Company need to increase itsreserves, its pre-tax income for the period woulddecrease by a corresponding amount.
Each of the Company’s major operating units has anactuarial staff that has primary responsibility for assess-ing loss reserves. The Company’s corporate actuariesreview the analyses prepared by its subsidiaries’ actuariesand also perform their own loss reserve reviews formost units. In addition, for certain operating units, theCompany engages independent actuaries to perform
an annual review and evaluation of loss reserves.Theactuaries use a variety of actuarial techniques andmethods in estimating its ultimate liability for lossesand loss expenses. These methods include paid lossdevelopment, incurred loss development, paid andincurred Bornhuetter-Ferguson methods and frequencyand severity methods. This actuarial data is analyzed byline of business, coverage, and accident or policy year,as appropriate, for each operating unit. Industry lossexperience is also used to supplement the Company’sown data in selecting “tail factors” and in areas wherethe Company’s own data is limited.
For those operating units where the actuarial analysishas been substantially completed at the time the finan-cial statements are prepared, the loss reserves includedin the financial statements are based upon that analysis.For those operating units where the actuarial analysisrequires additional time to complete, the Companyaccrues loss reserves based upon the most recent actu-arially indicated loss ratios, adjusted as necessary toreflect known events or unusual claim activity sincethose indications were made.
Management determines the loss reserves includedin the Company’s financial statements based on theactuarial estimates contained in the actuarial analyses.However, to the extent not already reflected in theactuarial analyses, management also considers qualita-tive factors that may affect the ultimate loss reserves, todetermine its best estimate of the loss reserves. Thesequalitative considerations include, among others, theimpact of re-underwriting initiatives, changes in the mixof business, changes in distribution sources and changesin terms and conditions. Examples of changes in termsand conditions that can have a significant impact onreserve levels are the use of aggregate policy limits,the expansion of coverage exclusions, whether or notdefense costs are within policy limits and changes indeductibles and attachment points.
28

2003 2002 2001
Gross reserves for losses and loss expenses at beginning of year $ 3,168,000 $ 2,764,000 $ 2,476,000Increase in estimates for claims occurringin prior years, net of ceded reinsurance:
Reinsurance:Casualty lines $ 74,000 $ 47,000 $ 53,000Property lines — — 15,000Fidelity and surety 15,000 14,000 —
Specialty:Excess and surplus lines 62,000 30,000 24,000Professional liability 35,000 31,000 12,000Other 4,000 4,000 5,000
Alternative markets workers’ compensation 41,000 34,000 (2,000)Regional 40,000 10,000 (4,000)International 2,000 4,000 5,000Discontinued — — 103,000Total $ 273,000 $ 174,000 $ 211,000
29
ReinsuranceIn 2003 and 2002, the Company increased its estimatesof the ultimate loss costs for casualty reinsurance riskswritten between 1998 and 2001 primarily as a resultof higher than expected claims reported by ceding com-panies. A significant portion of the increase in estimatesfor claims occurring in prior years that was recognizedin 2003 related to certain large accounts. The Companysets its initial loss estimates based principally uponinformation obtained during the underwriting processand adjusts these estimates as additional informationbecomes available. As certain large contracts havematured, the Company has adjusted its loss estimatesupward to reflect the known loss experience and hasrevised its expectations regarding the level of ultimatelosses to reflect a higher level of known losses as wellas a pattern of delayed loss reporting by some cedingcompanies. The Company analyzes its treaty reinsurancebusiness and sets reinsurance reserves each quarter ona treaty-by-treaty basis, rather than in the aggregate forthe entire reinsurance business. The Company believesthis method provides a better estimate of requiredreserves, as the Company is able to promptly identifychanges in underlying trends experienced by individualceding companies and adjust its reserves as necessary.
The increase in estimated ultimate loss costs forfidelity and surety reinsurance reflects the settlement of several large surety claims during 2003 and 2002,including arbitration resolutions. In addition, theCompany has reserved for certain claims relating tofinancial guarantee exposures that were not intended tobe covered under the Company’s reinsurance policies.
SpecialtyThe Company increased its estimates of ultimate costsfor excess and surplus lines casualty business writtenin prior years to recognize certain recently identifiedtrends in the development of losses and loss expenses.These trends include a substantial increase in legalexpenses incurred in the defense of claims, in particularfor claims with multiple claimants in multiple states.For some policies, the obligation to defend has causedthe Company to incur aggregate legal expenses inexcess of policy limits, which was unanticipated in bothpricing and reserving these exposures. In addition, theCompany identified certain recent changes in the claimsreporting pattern that suggest that claim costs areemerging over a longer period of time and at a higherlevel than in the past. Prior year ultimate loss ratios wereadjusted upwards to recognize the estimated impact ofsuch trends. The increase in prior year reserves for theexcess and surplus lines also reflects the cost of the dis-position of a reinsurance arbitration.
Net losses and loss expenses for the years ended December 31, 2003, 2002 and 2001 included increases inestimates for claims occurring in prior years of $273,000,000, $174,000,000 and $211,000,00, respectively. TheCompany, along with the property casualty insurance industry in general, has experienced higher than expectedloss costs for certain business written from 1998 to 2001. Following is a summary of increases in estimates forclaims occurring in prior years for the indicated periods (dollars in thousands):

30
The increase in estimated ultimate loss costs for professional liability business written in prior yearsrelates primarily to lawyers professional liability, liabilitycoverage for senior living centers and employment prac-tices liability. These lines have experienced a higherlevel of claim frequency and severity and a longerreporting pattern than anticipated when initial lossreserves were established. These lines also have a highincidence of litigated claims, and the reporting patternshave lengthened due to a more protracted and complexlitigation environment.
Alternative MarketsUltimate loss costs for workers’ compensation businesswritten in prior years were impacted by a substantialincrease in medical cost inflation. This resulted princi-pally from increased utilization of the health care systemby injured workers and more expensive and higherusage of prescription drugs. The impact of the increasedmedical cost trends is especially significant to the excessworkers’ compensation business because of the higherseverity of claims and longer time period over whichclaims are paid.
RegionalThe increase in prior year reserves for the regional seg-ment was primarily related to workers’ compensationbusiness, which experienced similar trends to thosedescribed under alternative markets.
Environmental and asbestosTo date, known environmental and asbestos claimshave not had a material impact on the Company’soperations. These claims have not materially impactedthe Company because its subsidiaries generally did notinsure large industrial companies that are subject tosignificant environmental and asbestos exposures.
The Company’s net reserves for losses and lossadjustment expenses relating to asbestos and environ-mental claims were $31,866,000 and $28,509,000 atDecember 31, 2003 and 2002, respectively. TheCompany’s gross reserves for losses and loss adjustmentexpenses relating to asbestos and environmental claimswere $49,283,000 and $47,637,000 at December 31,
2003 and 2002, respectively. Net incurred losses andloss expenses (recoveries) for reported asbestos andenvironmental claims were approximately $4,749,000,$6,652,000 and $(4,503,000) in 2003, 2002 and 2001,respectively. Net paid losses and loss expenses wereapproximately $1,391,000, $2,938,000, and $125,000in 2003, 2002 and 2001, respectively. The estimationof these liabilities is subject to significantly greater thannormal variation and uncertainty because it is difficultto make an actuarial estimate of these liabilities due tothe absence of a generally accepted actuarial method-ology for these exposures and the potential effect ofsignificant unresolved legal matters, including coverageissues as well as the cost of litigating the legal issues.Additionally, the determination of ultimate damagesand the final allocation of such damages to financiallyresponsible parties are highly uncertain.
DiscountingThe Company discounts its liabilities for excess andassumed workers’ compensation business because ofthe long period of time over which losses are paid.Discounting is intended to appropriately match lossesand loss expenses to income earned on investmentsecurities supporting the liabilities. The expected lossesand loss expense payout pattern subject to discountingwas derived from the Company’s loss payout experienceand is supplemented with data compiled from insurancecompanies writing similar business. The liabilities forlosses and loss expenses have been discounted usingrisk-free discount rates determined by reference to theU.S. Treasury yield curve for non-proportional business,and at the statutory rate for proportional business.The discount rates range from 3.9% to 6.5% with aweighted average discount rate of 5.0%. For statutorypurposes, the Company uses a discount rate of 4.2% aspermitted by the Department of Insurance of the Stateof Delaware. The aggregate net discount, after reflect-ing the effects of ceded reinsurance, is $393,000,000,$293,000,000 and $243,000,000 at December 31,2003, 2002 and 2001, respectively. The increase inthe aggregate discount from 2002 to 2003 and from2001 to 2002 resulted from the increase in workers’compensation reserves.
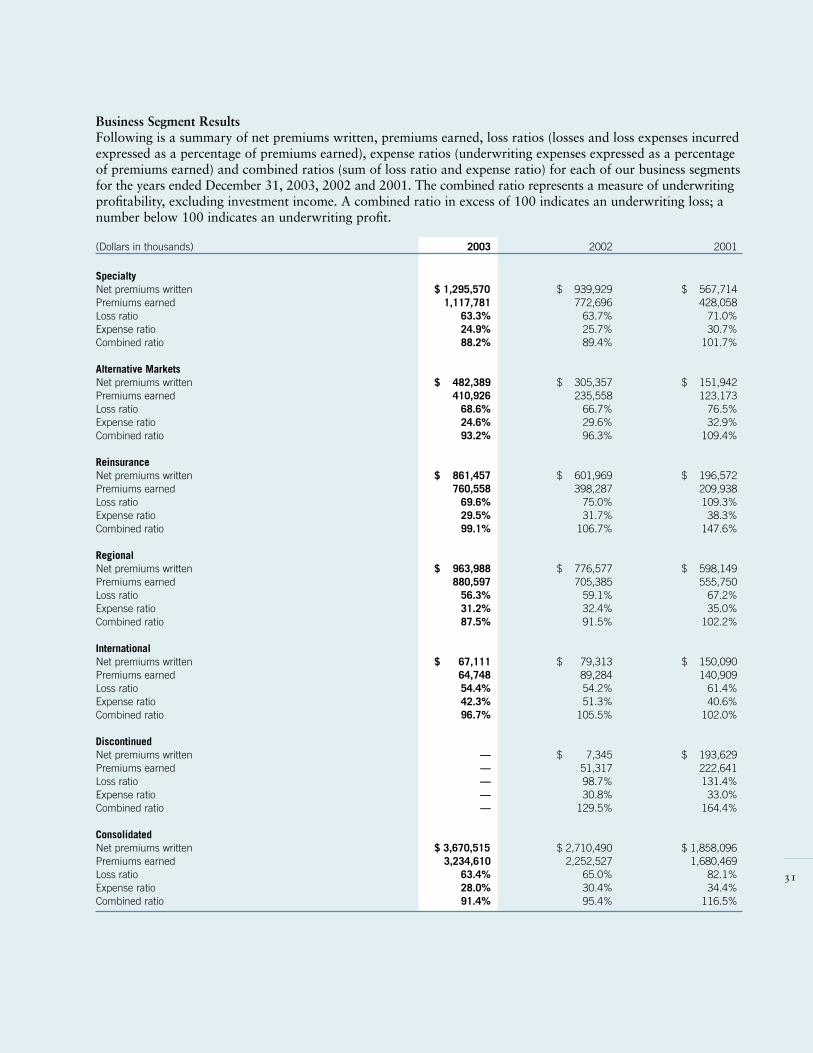
(Dollars in thousands) 2003 2002 2001
SpecialtyNet premiums written $ 1,295,570 $ 939,929 $ 567,714Premiums earned 1,117,781 772,696 428,058Loss ratio 63.3% 63.7% 71.0%Expense ratio 24.9% 25.7% 30.7%Combined ratio 88.2% 89.4% 101.7%
Alternative MarketsNet premiums written $ 482,389 $ 305,357 $ 151,942Premiums earned 410,926 235,558 123,173Loss ratio 68.6% 66.7% 76.5%Expense ratio 24.6% 29.6% 32.9%Combined ratio 93.2% 96.3% 109.4%
ReinsuranceNet premiums written $ 861,457 $ 601,969 $ 196,572Premiums earned 760,558 398,287 209,938Loss ratio 69.6% 75.0% 109.3%Expense ratio 29.5% 31.7% 38.3%Combined ratio 99.1% 106.7% 147.6%
Regional Net premiums written $ 963,988 $ 776,577 $ 598,149Premiums earned 880,597 705,385 555,750Loss ratio 56.3% 59.1% 67.2%Expense ratio 31.2% 32.4% 35.0%Combined ratio 87.5% 91.5% 102.2%
InternationalNet premiums written $ 67,111 $ 79,313 $ 150,090Premiums earned 64,748 89,284 140,909Loss ratio 54.4% 54.2% 61.4%Expense ratio 42.3% 51.3% 40.6%Combined ratio 96.7% 105.5% 102.0%
DiscontinuedNet premiums written — $ 7,345 $ 193,629Premiums earned — 51,317 222,641Loss ratio — 98.7% 131.4%Expense ratio — 30.8% 33.0%Combined ratio — 129.5% 164.4%
ConsolidatedNet premiums written $ 3,670,515 $ 2,710,490 $ 1,858,096Premiums earned 3,234,610 2,252,527 1,680,469Loss ratio 63.4% 65.0% 82.1%Expense ratio 28.0% 30.4% 34.4%Combined ratio 91.4% 95.4% 116.5%
Business Segment ResultsFollowing is a summary of net premiums written, premiums earned, loss ratios (losses and loss expenses incurredexpressed as a percentage of premiums earned), expense ratios (underwriting expenses expressed as a percentageof premiums earned) and combined ratios (sum of loss ratio and expense ratio) for each of our business segmentsfor the years ended December 31, 2003, 2002 and 2001. The combined ratio represents a measure of underwritingprofitability, excluding investment income. A combined ratio in excess of 100 indicates an underwriting loss; anumber below 100 indicates an underwriting profit.
31

Results of Operations For the Years Ended December 31, 2003, 2002 and 2001
The following table presents the Company’s netincome (loss) and net income (loss) per share for theyears ended December 31, 2003, 2002 and 2001(amounts in thousands, except per share data).
2003 2002 2001
Net income (loss) $ 337,220 $ 175,045 $ (91,546)Weighted average diluted shares 87,063 79,385 68,750
Net income (loss) per diluted share $ 3.87 $ 2.21 $ (1.39)
The increase in net income in 2003 compared with2002 reflects higher profits from underwriting activityas well as higher investment income and realizedinvestment gains. The improvement in underwritingresults reflects higher insurance prices, improved termsand conditions and growth in more profitable lines ofbusiness. The underwriting improvements were partiallyoffset by additions to prior year loss reserves of $273million in 2003 compared with additions to prior yearloss reserves of $174 million in 2002 (see CriticalAccounting Policies). The results for 2001 wereimpacted by additions to prior year loss reserves of$211 million, including $103 million for discontinuedbusinesses, losses related to the World Trade Centerattack of $35 million and surety losses related to theEnron bankruptcy of $18 million.
Net Premiums WrittenNet premiums written were $3.7 billion in 2003, up35% from 2002. In 2002, net premiums written were$2.7 billion, an increase of 46 % over 2001. Theincreases in net premiums written in 2003 and 2002were a result of higher prices as well as new business.A summary of net premiums written in 2003 comparedwith 2002 by business segment follows:
• Specialty premiums increased 38% to $1.3 billionin 2003 compared with $940 million in 2002 due tohigher prices and new business. The increase in pre-miums included a 37% increase for the Company’sthree excess and surplus lines companies, a 16%increase for commercial transportation business anda 26% increase for Monitor Liability Managers, Inc.,which specializes in directors and officers and lawyers
professional liability business. Net premiums writtenin 2003 also include $23 million from the Company’smedical excess underwriting unit, Berkley MedicalExcess Underwriters, LLC, and $43 million from theCompany’s new London-based unit, W. R. BerkleyInsurance (Europe), Limited.
• Alternative markets premiums increased by 58% to$482 million in 2003 compared with $305 millionin 2002. The increase included a 42% increase inexcess workers’ compensation business, a 95%increase in primary workers’ compensation inCalifornia and a 34% increase in primary workers’compensation in other states. The increases generallyreflect higher prices as well as new business.
• Reinsurance premiums increased by 43% to $861million in 2003 compared with $602 million in 2002.Net premiums written increased 104% to $286 mil-lion for facultative reinsurance, 27% to $218 millionfor reinsurance of certain Lloyd’s syndicates, and 23%to $357 million for other treaty business. The increasein facultative net premiums written in 2003 includes$56 million from the Company’s direct facultativeunderwriting unit, B F Re Underwriters, LLC.
• Regional premiums increased by 24% to $964 millionin 2003 compared with $777 million in 2002. Theincrease generally reflects higher prices across allfour regional units.
• International premiums decreased by 15% to $67million in 2003 compared with $79 million in 2002.The decrease was a result of a lower exchange ratefor the Argentine peso and of lower life insurancepremiums.
Net Premiums EarnedInsurance premiums are earned ratably over the termof the policy. Net premiums earned increased 44% in2003 compared with 2002 as a result of substantialgrowth in premiums written in 2003 and 2002.
Net Investment IncomeNet investment income increased 12% in 2003 com-pared with 2002. Average invested assets increased37% compared with 2002 as a result of cash flowfrom operations and proceeds from a secondary stockoffering in November 2002 and two debt offerings in2003. The average yield on investments was 4.6% in2003 compared with 5.4% in 2002. The lower yield in2003 reflects the decrease in general interest rate levelsas well as an increase in the portion of the portfolioinvested in cash equivalents and tax-exempt securities.
32

Realized Investment Gains and LossesRealized investment gains and losses result from salesof securities and from provisions for other than tem-porary impairment in securities. Realized investmentgains of $83 million in 2003 and $15 million in 2002resulted primarily from the sale of fixed income secu-rities in order to decrease the duration of the portfolioand to increase the portion of the portfolio investedin municipal securities. Charges for the permanentimpairment of investments were $0.4 million, $18.8million and $26.6 million in 2003, 2002 and 2001,respectively. The charges in 2002 and 2001 includedcharges of $10.0 million and $18.0 million, respectively,related to the impairment of investments in Argentinesovereign bonds.
Foreign currency gains and lossesThe Company reported a foreign currency loss of $0.8 million in 2003 and foreign currency gains of$21.9 million in 2002 and $0.8 million in 2001. The2002 foreign currency gain related to the Company’soperations in Argentina. This gain represented the netincrease in the local currency value of assets and liabilities denominated in U.S. dollars following thedevaluation of the Argentine peso. It also includes thegain from the negotiated settlement of certain U.S.dollar life insurance contracts for less than their localcurrency value following the devaluation of theArgentine peso.
Service FeesThe alternative markets segment offers fee-based servicesto help clients develop and administer self-insurance programs, primarily for workers compensation cover-ages. Service fees increased 18% in 2003 compared with2002 primarily as a result of an increase in service feesfor managing assigned risk plans in ten states.
Losses and Loss ExpensesLosses and loss expenses increased 40% in 2003 compared with 2002 as a result of the increased pre-mium volume. The consolidated loss ratio decreasedto 91.4% in 2003 from 95.4% in 2002 primarily as a result of higher prices and improved terms and conditions. A summary of loss ratios in 2003 compared with 2002 by business segment follows:
• Specialty’s loss ratio was 63.3% in 2003 comparedwith 63.7% in 2002 as higher prices, more favor-able terms and conditions and lower reinsurancecosts were offset by an increase in prior yearreserves, including the cost of the disposition of areinsurance arbitration.
33
• Alternative market’s loss ratio was 68.6% in 2003compared with 66.7% in 2002. The Company dis-counts its liabilities for excess workers’ compensationbusiness because of the long period of time overwhich losses are paid. The increase in the loss ratioin 2003 reflects a lower discount rate for currentyear business and an increase in prior year reserves.
• The reinsurance loss ratio was 69.6% in 2003 com-pared with 75.0% in 2002. The decrease reflects theimproved results for the current accident year as aresult of higher prices for both treaty and facultativerisks, which was partially offset by the impact ofadverse reserve development on prior years. The2003 and 2002 underwriting results also reflect lossrecoveries under the Company’s aggregate reinsur-ance agreement, which the Company terminated asof December 31, 2003. (See Note 10 of “Notes toConsolidated Financial Statements”.)
• The regional loss ratio decreased to 56.3% in 2003from 59.1% in 2002 primarily as a result of higherprices in 2002 and 2003. Weather-related losses forthe regional segment were $37.9 million in 2003compared with $29.2 million in 2002.
• The international loss ratio was 54.4% in 2003,nearly unchanged from 54.2% in 2002.
• The discontinued segment consists of regional per-sonal lines and alternative markets assumed reinsur-ance, both of which were discontinued in the fourthquarter of 2001. The discontinued segment reporteda loss ratio of 131.4% in 2001, primarily as a resultof reserve strengthening of $103 million. In 2002, theloss ratio was 98.7%, which represented the run-offof the remaining unearned premiums. There were nolosses reported in 2003.
Other Operating Costs and ExpensesFollowing is a summary of other operating costs andexpenses for the years ended December 31, 2003,2002 and 2001 (dollars in thousands):
2003 2002 2001
Underwriting expenses $ 905,349 $ 684,583 $ 577,658
Service company expenses 82,821 69,715 64,949
Other costs and expenses 47,724 42,907 21,169
Total $ 1,035,894 $ 797,205 $ 663,776
Underwriting expenses increased 32% in 2003compared with 2002 as a result of higher premiumvolume. The consolidated expense ratio decreased to28.0% in 2003 from 30.4% in 2002. The decrease is

due to a 43.6% increase in earned premiums with nosignificant increase in underwriting expenses other thancommissions and premium taxes.
Service company expenses represent the costs asso-ciated with the alternative market’s fee-based business.The increase in service expenses of 19% compared with2002 was commensurate with the increase in servicefee revenues of 18%.
Other costs and expenses represent primarily generaland administrative expenses for the corporate office.Other costs and expenses increased 11% to $48 milliondue to higher compensation costs and to start-up costsfor new business ventures.
Interest ExpenseInterest expense increased 20% to $55 million as aresult of the issuance of $200 million of 5.875% senior notes in February 2003 and $150 million of5.125% senior notes in September 2003.
Restructuring ChargeIn 2001, the Company reported a restructuring chargeof $3,196,000 in connection with its withdrawal fromregional personal lines business and the reorganizationof certain other operations. The Company reduced itspermanent workforce by approximately 304 employ-ees in connection with the plan. The charge consistedmainly of severance payments of $2,462,000 andcontractual lease payments related to abandoned facil-ities. The activities under the plan were substantiallycompleted in 2001.
Income taxesThe effective income tax rate was 31% in 2003, 32%in 2002 and 37% in 2001. The effective tax rate differsfrom the federal income tax rate of 35% primarilybecause of tax-exempt investment income. The decreasein the effective rate in 2003 compared with 2002 reflectsa higher level of tax-exempt securities.
Liquidity and Capital Resources
Cash FlowCash flow provided from operating activities was$1,398 million in 2003, $953 million in 2002 and$153 million in 2001. The increase in cash flow in2003 was primarily due to a higher level of premiumcollections and a lower paid loss ratio (paid lossesexpressed as a percentage of premium earned).
As a holding company, the Company derives cashfrom its subsidiaries in the form of dividends, tax pay-ments and management fees. The Company uses cashto pay debt service, Federal income taxes, operatingexpenses and dividends. The Company also providescapital to its subsidiaries. Tax payments and manage-ment fees from the insurance subsidiaries are madeunder agreements that generally are subject to approvalby state insurance departments. Maximum amountsof dividends that can be paid without regulatoryapproval are prescribed by statute. (See Note 14 of“Notes to Consolidated Financial Statements.”)
The Company’s subsidiaries are highly liquid,receiving substantial cash from premiums, investmentincome, service fees and proceeds from sales andmaturities of portfolio investments. The principal outflows of cash are payments of claims, taxes, oper-ating expenses and dividends.
Financing ActivityIn February 2003, the Company issued $200 millionaggregate principal amount of 5.875% senior notes dueFebruary 2013. In September 2003, the Company issued$150 million aggregate principal amount of 5.125%senior notes due September 2010. In July 2003, a sub-sidiary of the Company issued $12 million aggregateprincipal amount of 7.65% notes due June 2023.
During the first quarter of 2003, the Companyrepaid $35.8 million of 6.5% senior subordinatednotes and $25 million of 6.71% senior notes upontheir respective maturities. During the second quarterof 2003, the Company purchased $5.0 million (carryingvalue) of its trust preferred securities.
At December 31, 2003, the Company’s outstandingdebt was $667 million (face amount). The maturitiesof the debt are $40 million in 2005, $100 million in2006, $89 million in 2008, $150 million in 2010,$200 million in 2013, $76 million in 2022 and $12million in 2023. The Company also has $195 million(face amount) of trust preferred securities that maturein 2045.
At December 31, 2003, stockholders’ equity was$1,683 million and total capitalization (stockholders’equity, debt and trust preferred securities) was $2,535million. The percentage of the Company’s capitalattributable to debt and trust preferred securities was34% at December 31, 2003, compared with 30% atDecember 31, 2002.34

35
InvestmentsAs part of its investment strategy, the Company estab-lishes a level of cash and highly liquid short-term andintermediate-term securities that, combined withexpected cash flow, is believed adequate to meet foreseeable payment obligations. The Company alsoattempts to maintain an appropriate relationshipbetween the average duration of the investment portfolio and the approximate duration of its liabili-ties, i.e., policy claims and debt obligations.
The carrying value of the Company’s investmentportfolio as of December 31, 2003 and 2002 is as follows (dollars in thousands):
2003 2002
Cash and cash equivalents $ 1,431,466 $ 594,183Fixed maturity securities 4,293,302 3,511,522Equity securities available for sale 316,629 204,372Equity securities trading account (a) 315,124 306,836Investments in affiliates 126,772 46,187Unsettled trades (2,580) —Total $ 6,480,713 $ 4,663,100
(a) Represents trading account equity securities plus trading account receivablesfrom brokers and clearing organizations less trading account securities soldbut not yet purchased.
Fixed MaturitiesThe Company’s investment policy with respect to fixedmaturity securities is generally to purchase instrumentswith the expectation of holding them to their maturity.However, active management of a portion of the port-folio is considered necessary to maintain an approximatematching of assets and liabilities as well as to adjustthe portfolio as a result of changes in financial marketconditions and tax considerations. At December 31,2003, the fixed maturities portfolio mix was as fol-lows: U.S. Government securities were 14% (20% in2002); state and municipal securities were 46% (29%in 2002); corporate securities were 14% (19% in2002); mortgage-backed securities were 21% (27% in2002); and foreign bonds were 5% in 2003 and 2002.
Equity Securities Available for SaleEquity securities available for sale represent primarilyinvestments in common and preferred stocks of publicly traded real estate investment trusts (REITs).
Equity Securities Trading AccountThe trading account is comprised of direct investmentsin arbitrage securities and investments in arbitrage-related limited partnerships that specialize in mergerarbitrage and convertible arbitrage strategies. Mergerarbitrage is the business of investing in the securities ofpublicly held companies which are the targets inannounced tender offers and mergers. Convertible arbi-trage, is the business of investing in convertible securitieswith the goal of capitalizing on price differentialsbetween these securities and their underlying equities.
Investments in AffiliatesInvestments in affiliates represent principally theCompany’s 20.1% interest in Kiln plc ($40.5 million in 2003 and $31.5 million in 2002) and the Company’sinterest in real estate partnerships ($57.6 million in2003 and $10.8 million in 2002).
Securities in an Unrealized Loss PositionThe following table summarizes, for all securities inan unrealized loss position at December 31, 2003, the aggregate fair value and gross unrealized loss bylength of time those securities have been continuouslyin an unrealized loss position (dollars in thousands):
Grossunrealized
Fair Value loss
Fixed maturities:0 – 6 months $ 578,934 $ 4,5417 – 12 months 21,124 437Over 12 months 14,137 603
Total $ 614,195 $ 5,581
Equity securities available for sale:0 – 6 months $ 3,215 $ 887 – 12 months 9,345 401Over 12 months 13,971 664
Total $ 26,531 $ 1,153
Market RiskThe Company’s market risk generally represents therisk of gain or loss that may result from the potentialchange in the fair value of the Company’s investmentportfolio as a result of fluctuations in prices and interestrates. In addition, the Company’s international busi-nesses and securities are subject to currency exchangerate risk. As discussed above, the Company attempts tomanage its interest rate risk by maintaining an appro-priate relationship between the average duration of theinvestment portfolio and the approximate duration ofits liabilities, i.e., policy claims and debt obligations.

Duration is a common gauge of the price sensitivityof a fixed income portfolio to a change in interest rates.Based upon a pricing model, the Company determinesthe estimated change in fair value of the fixed maturitysecurities, assuming immediate parallel shifts in thetreasury yield curve while keeping spreads betweenindividual securities and treasury securities static. Thefair value at specified levels at December 31, 2003would be as follows:
Estimated Fair EstimatedValue of Financial Change in
Instruments Fair Value(000s) (000s)
300 basis point rise $ 5,109,479 $ (634,090)200 basis point rise 5,318,545 (425,024)100 basis point rise 5,540,247 (203,322)Base scenario 5,743,569 —100 basis point decline 5,969,866 226,297200 basis point decline 6,230,624 487,055300 basis point decline 6,515,505 771,936
The estimated changes in fair value, based uponthe above table, would be partially offset by theCompany’s liabilities if they were marked to market.
Arbitrage investing differs from other types ofinvestments in its focus on transactions and eventsbelieved likely to bring about a change in value overa relatively short time period (usually four months orless). The Company believes that this makes arbitrageinvestments less vulnerable to changes in general stockmarket conditions. Potential changes in market condi-tions are also mitigated by the implementation ofhedging strategies, including short sales. Additionally,the arbitrage positions are generally hedged againstmarket declines by purchasing put options, selling calloptions or entering into swap contracts. The Company’smerger arbitrage securities are primarily exposed to thecompletion of announced deals, which are subject toregulatory as well as political and other risks.
The principal market risk for the Company’s fixed maturity securities is interest rate risk. The Company uses various models and stress test scenarios to monitor and manage interest rate risk. The following table outlinesthe groups of fixed maturity securities and the components of the interest rate risk at December 31, 2003:
Federal and Foreign Income Taxes
The Company files a consolidated income tax returnin the U. S. and foreign tax returns in the countries ofits overseas operations. At December 31, 2003, theCompany had a deferred tax asset, net of valuationallowance, of $273 million (which primarily relates toloss and loss expense reserves and unearned premiumreserves) and a deferred tax liability of $237 million(which primarily relates to deferred policy acquisitioncosts, unrealized investment gains and intangibleassets). The realization of the deferred tax asset isdependent upon the Company’s ability to generatesufficient taxable income in future periods. Based onhistorical results and the prospects for future opera-tions, management anticipates that it is more likelythan not that future taxable income will be sufficientfor the realization of this asset.
Reinsurance
The Company follows the customary industry practiceof reinsuring a portion of its exposures, paying toreinsurers a part of the premiums received on the policies it writes. Reinsurance is purchased by theCompany principally to reduce its net liability on individual risks and to protect it against catastrophiclosses. Although reinsurance does not legally dischargean insurer from its primary liability for the full amountof the policies, it does make the assuming reinsurerliable to the insurer to the extent of the reinsurancecoverage. The Company monitors the financial condi-tion of its reinsurers and attempts to place its coveragesonly with substantial, financially sound carriers.
Market Effective Fair ValueYield Duration (000s)
Cash and cash equivalents 1.13% .02 $ 1,431,466U. S. Government securities 2.95 4.53 605,126State and municipal 3.64 7.49 1,966,596Corporate 4.10 4.33 592,262Foreign 4.91 3.97 222,545Mortgage-backed securities 4.54 2.81 925,574Total 3.18% 4.10 $ 5,743,569
36

Contractual Obligations
Following is a summary of the Company’s contractual obligations as of December 31, 2003 (amounts in thousands):
The largest net amounts retained by the Companyfor any one risk are: $5 million for Monitor Liabilityand Berkley Medical; $6 million for surety business;statutory limits for workers’ compensation business;and up to $2 million for other lines of business. TheCompany also purchases facultative coverage, whereappropriate, for exposures or limits falling outside itstreaty protection. In addition, the Company’s U.S.property catastrophe reinsurance provides protectionfor losses above $7.5 million up to $60 million. TheCompany’s principal reinsurers for its 2004 reinsuranceprogram are: Chubb Group, XL Capital, PartnerRe,Converium Group, Hannover Re and Allied WorldAssurance Company.
From January 1, 2001 through December 31,2003, the Company was reinsured under an aggregatereinsurance agreement that provided individual lossprotection for certain lines of business and aggregateaccident year protection for its reinsurance segment.The agreement contained annual and aggregate limitsover loss recoveries as well as profit sharing provisionsthat enabled the Company to recover a portion of thereinsurance costs if certain profit conditions were met.The aggregate reinsurance agreement was commutedand settled on December 31, 2003. (See Note 10 of“Notes to Consolidated Financial Statements”.)
As of December 31, 2003, the Company has non-cancelable operating lease obligations of approximately$63.7 million and contractual purchase commitmentsof approximately $75.3 million. The Company utilizesletters of credit to back certain payments and obliga-tions. Outstanding letters of credit were $22.0 millionas of December 31, 2003. The Company has madeguarantees to state regulators that the statutory capitalof certain subsidiaries will be maintained above certainminimum levels. In addition, the Company has com-mitments to invest up to $136.0 million in certaininvestment funds. The contractual obligations set forthin the above table do not include policyholder accountbalances of $53 million and liabilities for bankdeposits of $31 million.
Payments Due By Period 2004 2005 2006 2007 2008 ThereafterLong-term debt and trust preferred securities $ — $ 40,000 $ 100,000 $ — $ 88,800 $ 633,250Operating lease obligations 14,583 12,503 10,103 7,331 5,537 13,657Purchase obligations 15,346 18,597 2,475 19,980 18,122 800Other long-term liabilities reflected on
our consolidated balance sheet 1,850 2,975 4,325 2,075 3,250 1,425Total $ 31,779 $ 74,075 $ 116,903 $ 29,386 $ 115,709 $ 649,132
Off-Balance Sheet Arrangements
An off-balance sheet arrangement is any transaction,agreement or other contractual arrangement involvingan unconsolidated entity under which a company has(1) made guarantees, (2) a retained or contingentinterest in transferred assets, (3) an obligation underderivative instruments classified as equity or (4) anyobligation arising out of a material variable interest in an unconsolidated entity that provides financing,liquidity, market risk or credit risk support to theCompany, or that engages in leasing, hedging orresearch and development arrangements with theCompany. We have no arrangements of these typesthat we believe may have a material current or futureeffect on our financial condition, liquidity or results of operations.
37

38
CONSOLIDATED STATEMENTS OF OPERATIONS(Dollars in thousands, except per share data)
Years ended December 31, 2003 2002 2001
Revenues:Net premiums written $ 3,670,515 $ 2,710,490 $ 1,858,096Change in net unearned premiums (435,905) (457,963) (177,627)Premiums earned 3,234,610 2,252,527 1,680,469Net investment income 210,056 187,875 195,021Service fees 101,715 86,095 75,771Realized investment gains (losses) 82,531 15,214 (12,252)Foreign currency gains (losses) (839) 21,856 758Other income 2,035 2,517 2,030
Total revenues 3,630,108 2,566,084 1,941,797Operating costs and expenses:Losses and loss expenses 2,050,177 1,463,971 1,380,500Other operating costs and expenses 1,035,894 797,205 663,776Interest expense 54,733 45,475 45,719Restructuring charge — — 3,196
Total expenses 3,140,804 2,306,651 2,093,191
Income (loss) before income taxes 489,304 259,433 (151,394)Income tax (expense) benefit (150,626) (84,139) 56,661Minority interest (1,458) (249) 3,187
Net income (loss) $ 337,220 $ 175,045 $ (91,546)
Earnings (loss) per share:Basic $ 4.06 $ 2.29 $ (1.39)Diluted $ 3.87 $ 2.21 $ (1.39)
See accompanying notes to consolidated financial statements.

39
CONSOLIDATED BALANCE SHEETS(Dollars in thousands, except per share data)
December 31, 2003 2002
Assets
Investments:Cash and cash equivalents $ 1,431,466 $ 594,183Fixed maturity securities 4,293,302 3,511,522Equity securities available for sale 316,629 204,372Equity securities trading account 331,967 165,642Investments in affiliates 126,772 46,187
Total Investments 6,500,136 4,521,906
Premiums and fees receivable 950,551 822,060Due from reinsurers 804,962 734,687Accrued investment income 54,313 46,334Prepaid reinsurance premiums 193,693 164,284Deferred policy acquisition costs 405,324 308,200Real estate, furniture and equipment 143,792 135,488Deferred Federal and foreign income taxes 35,813 20,585Goodwill 59,021 59,021Trading account receivable from brokers and clearing organizations 102,257 177,309Other assets 84,823 41,449Total Assets $ 9,334,685 $ 7,031,323
Liabilities and Stockholders’ Equity
Liabilities:Reserves for losses and loss expenses $ 4,192,091 $ 3,167,925Unearned premiums 1,857,895 1,390,246Due to reinsurers 123,226 184,912Trading account securities sold but not yet purchased 119,100 36,115Policyholders’ account balances 53,405 42,707Other liabilities 415,714 294,334Debt 659,208 362,985Trust preferred securities 193,336 198,251
Total Liabilities 7,613,975 5,677,475
Minority interest 38,148 18,649
Stockholders’ equity:Preferred stock, par value $.10 per share:
Authorized 5,000,000 shares, issued and outstanding – none — —Common stock, par value $.20 per share:
Authorized 150,000,000 shares, issued and outstanding, net of treasury shares, 83,537,740 and 82,835,172 shares 20,901 20,901
Additional paid-in capital 820,388 816,223Retained earnings 939,911 623,651Accumulated other comprehensive income 119,977 104,603Treasury stock, at cost, 20,964,520 and 21,669,153 shares (218,615) (230,179)
Total Stockholders’ Equity 1,682,562 1,335,199
Total Liabilities and Stockholders’ Equity $ 9,334,685 $ 7,031,323
See accompanying notes to consolidated financial statements.
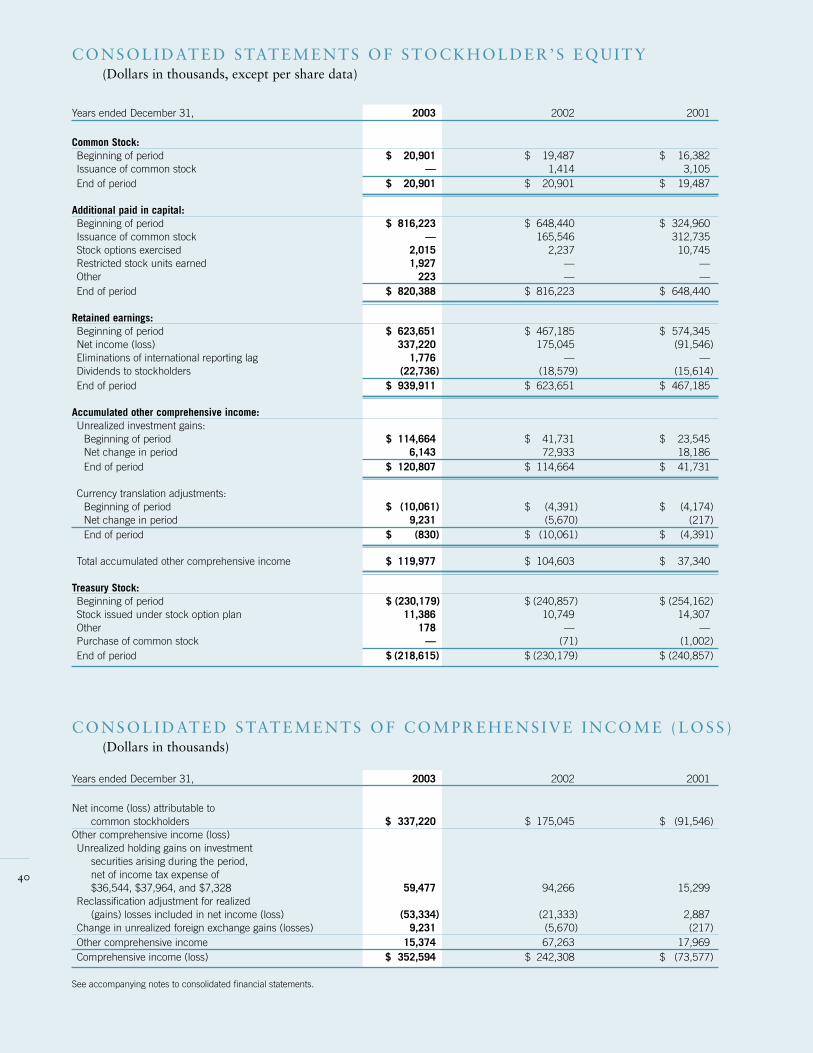
40
CONSOLIDATED STATEMENTS OF STOCKHOLDER’S EQUITY(Dollars in thousands, except per share data)
CONSOLIDATED STATEMENTS OF COMPREHENSIVE INCOME (LOSS )(Dollars in thousands)
Years ended December 31, 2003 2002 2001
Common Stock:Beginning of period $ 20,901 $ 19,487 $ 16,382Issuance of common stock — 1,414 3,105End of period $ 20,901 $ 20,901 $ 19,487
Additional paid in capital:Beginning of period $ 816,223 $ 648,440 $ 324,960Issuance of common stock — 165,546 312,735Stock options exercised 2,015 2,237 10,745Restricted stock units earned 1,927 — —Other 223 — —End of period $ 820,388 $ 816,223 $ 648,440
Retained earnings:Beginning of period $ 623,651 $ 467,185 $ 574,345Net income (loss) 337,220 175,045 (91,546)Eliminations of international reporting lag 1,776 — —Dividends to stockholders (22,736) (18,579) (15,614)End of period $ 939,911 $ 623,651 $ 467,185
Accumulated other comprehensive income:Unrealized investment gains:
Beginning of period $ 114,664 $ 41,731 $ 23,545Net change in period 6,143 72,933 18,186End of period $ 120,807 $ 114,664 $ 41,731
Currency translation adjustments:Beginning of period $ (10,061) $ (4,391) $ (4,174)Net change in period 9,231 (5,670) (217)End of period $ (830) $ (10,061) $ (4,391)
Total accumulated other comprehensive income $ 119,977 $ 104,603 $ 37,340
Treasury Stock:Beginning of period $ (230,179) $ (240,857) $ (254,162)Stock issued under stock option plan 11,386 10,749 14,307Other 178 — —Purchase of common stock — (71) (1,002)End of period $ (218,615) $ (230,179) $ (240,857)
Years ended December 31, 2003 2002 2001
Net income (loss) attributable to common stockholders $ 337,220 $ 175,045 $ (91,546)
Other comprehensive income (loss)Unrealized holding gains on investment
securities arising during the period,net of income tax expense of$36,544, $37,964, and $7,328 59,477 94,266 15,299
Reclassification adjustment for realized(gains) losses included in net income (loss) (53,334) (21,333) 2,887
Change in unrealized foreign exchange gains (losses) 9,231 (5,670) (217)Other comprehensive income 15,374 67,263 17,969Comprehensive income (loss) $ 352,594 $ 242,308 $ (73,577)
See accompanying notes to consolidated financial statements.

41
CONSOLIDATED STATEMENTS OF CASH FLOW(Dollars in thousands)
Years ended December 31, 2003 2002 2001
Cash flows provided by operating activities:Net income (loss) $ 337,220 $ 175,045 $ (91,546)Adjustments to reconcile net income (loss)
to net cash flows provided by operating activities:Realized investment and foreign currency (gains) losses (81,692) (37,070) 11,494Depreciation and amortization 20,324 17,944 17,493Minority interest 1,458 249 (3,187)Equity in undistributed earnings of affiliates (6,508) (690) 16Employee stock benefit plan 2,328 — —Change in:
Equity securities trading account (166,326) 45,649 135,980Premiums and fees receivable (128,491) (278,372) (153,175)Due from reinsurers (70,275) (19,273) (1,656)Accrued investment income (7,979) (10,233) 53Prepaid reinsurance premiums (29,409) (60,530) (4,223)Deferred policy acquisition cost (97,124) (84,090) (40,882)Deferred federal and foreign income taxes (38,769) 41,298 (61,360)Trading account receivable from brokers
and clearing organizations 75,052 174,398 (82,263)Other assets (41,804) 5,884 (17,470)Reserves for losses and loss expenses 1,024,166 395,420 335,276Unearned premiums 467,649 508,751 182,728Due to reinsurers (61,686) 45,590 6,801Trading account securities sold but not yet purchased 82,985 (20,875) (112,030) Other liabilities 117,064 54,019 31,220Net cash flows provided by operating activities 1,398,183 953,114 153,269
Cash flows used in investing activities:Proceeds from sales, excluding trading account:
Fixed maturity securities 1,084,957 662,144 532,861Equity securities 117,006 69,438 64,038Investment in affiliates — 2,250 —
Proceeds from maturities and prepaymentsof fixed maturity securities 696,176 291,031 189,961
Cost of purchases, excluding trading account:Fixed maturity securities (2,495,088) (1,837,114) (933,084)Equity securities (195,857) (205,780) (81,331)Other invested securities (69,138) (458) (1,178)
Proceeds (cost) of sold/acquired companies,net of acquired cash and invested cash 5,257 (2,053) 3,215
Net additions to real estate, furniture and equipment (28,315) (36,570) (22,076)Other, net (5,353) 26,722 11,303
Net cash used in investing activities (890,355) (1,030,390) (236,291)Cash flows provided by financing activities:Net proceeds from issuance of debt 356,181 — —Policyholders’ account balances 10,698 (11,125) (4,280)Bank deposits 12,051 15,871 2,955Advances from federal home loan bank 14,650 1,250 —Net proceeds from stock offerings — 166,960 315,840Net proceeds from stock options exercised 13,401 12,986 25,052Repayment of debt (65,750) (8,000) —Net change in short-term debt — — (10,000)Cash dividends to common stockholders (27,681) (17,872) (14,707)Purchase of common treasury shares — (71) (1,002)Proceeds from minority shareholders 15,337 — —Other, net 568 (22,627) (5,880)
Net cash provided by financing activities 329,455 137,372 307,978Net increase in cash and cash equivalents 837,283 60,096 224,956Cash and cash equivalents at beginning of year 594,183 534,087 309,131Cash and cash equivalents at end of year $ 1,431,466 $ 594,183 $ 534,087Supplemental disclosure of cash flow information:Interest paid on debt $ 47,714 $ 45,447 $ 45,241Federal income taxes paid $ 170,418 $ 19,381 $ 10,644
See accompanying notes to consolidated financial statements.

N O T E S T O C O N S O L I D AT E D F I N A N C I A L S TAT E M E N T SFor the years ended December 31, 2003, 2002, and 2001
Summary of Significant Accounting Policies
(A) Principles of consolidation and basis of presentationThe consolidated financial statements, which includethe accounts of W. R. Berkley Corporation and itssubsidiaries (the “Company”), have been prepared onthe basis of accounting principles generally accepted inthe United States of America (“GAAP”). All significantintercompany transactions and balances have beeneliminated. Reclassifications have been made in the2002 and 2001 financial statements to conform themto the presentation of the 2003 financial statements.The preparation of financial statements in conformitywith GAAP requires management to make estimatesand assumptions that affect the reported amounts ofassets and liabilities and disclosures of contingentassets and liabilities at the date of the financial state-ments and the revenues and expenses reflected duringthe reporting period. Actual results could differ fromthose estimates.
(B) Revenue recognitionProperty Casualty - Premiums written are recordedat the inception of the policy. Reinsurance premiumswritten are estimated based upon information receivedfrom ceding companies and subsequent differencesarising on such estimates are recorded in the periodthey are determined. Insurance premiums are earnedratably over the term of the policy. Fees for service areearned over the contract period.
Life – For investment contracts, premiums collectedfrom policyholders are not reported as revenues butare included in the liability for policyholders’ accountbalances. Policy charges for policy administration,cost of insurance and surrender charges are assessedagainst policyholders’ account balances and are recog-nized as premium income in the period in which servicesare provided.
(C) Cash and cash equivalentsCash equivalents consist of funds invested in moneymarket accounts and investments with an effectivematurity of three months or less when purchased.
(D) InvestmentsThe Company classifies its investments into four cate-gories. Securities that the Company has the positiveintent and ability to hold to maturity are classified as“held to maturity” and reported at amortized cost.Securities that the Company purchased with the intentto sell in the near-term are classified as “trading” andare reported at estimated fair value, with unrealizedgains and losses reflected in the statement of operations.Investments in affiliates are carried under the “equitymethod of accounting”, whereby the Company reportsits share of the income or loss from such investmentsas net investment income. The remaining securitiesare classified as “available for sale” and carried atestimated fair value, with unrealized gains and losses,net of applicable income taxes, excluded from earningsand reported as a component of comprehensive income(loss) and a separate component of stockholders’ equity.Fair value is generally determined using publishedmarket values.
Realized gains or losses represent the differencebetween the cost of securities sold and the proceedsrealized upon sale. The cost of securities is adjustedwhere appropriate to include a provision for signifi-cant decline in value which is considered to be otherthan temporary. An other than temporary decline isconsidered to occur in investments where there hasbeen a sustained reduction in market value and thereare no mitigating circumstances. The Company usesthe specific identification method where possible, andthe first-in, first-out method in other instances, todetermine the cost of securities sold. Realized gainsor losses, including any provision for decline in value,are included in the statement of operations.
(E) Trading account Assets and liabilities related to direct investmentsin arbitrage securities and investments in arbitrage-related limited partnerships are classified as tradingaccount securities. Long portfolio positions and part-nership interests are presented in the balance sheet asequity securities trading account. Short sales and shortcall options are presented as trading securities sold butnot yet purchased. Unsettled trades and the net marginbalances held by the clearing broker are presented astrading account receivable from brokers and clearingorganizations. The Company’s trading account portfo-lio is recorded at fair value. Realized and unrealizedgains and losses from trading activity are reported asnet investment income.
1
42

(F) Per share dataAll share data have been retroactively adjusted to reflectthe three-for-two common stock splits that were effectedon August 27, 2003 and on July 2, 2002. Basic pershare data is based upon the weighted average numberof shares outstanding during the year. Diluted pershare data reflects the potential dilution that wouldoccur if employee stock-based compensation planswere exercised.
(G) Deferred policy acquisition costsAcquisition costs (primarily commissions and premiumtaxes) incurred in writing insurance and reinsurancebusiness are deferred and amortized ratably over theterms of the related contracts. Deferred policy acquisitioncosts are limited to the amounts estimated to berecoverable from the applicable unearned premiumsand the related anticipated investment income by giving effect to anticipated losses, loss adjustmentexpenses and expenses necessary to maintain the contracts in force.
(H) Reserves for losses and loss expensesReserves for losses and loss expenses are an accumulationof amounts determined on the basis of (1) evaluation ofclaims for business written directly by the Company; (2)estimates received from other companies for reinsuranceassumed; and (3) estimates for losses incurred but notreported (based on Company and industry experience).These estimates are periodically reviewed and, as
experience develops and new information becomesknown, the reserves are adjusted as necessary. Suchadjustments are reflected in results of operations in theperiod in which they are determined. The Companydiscounts its reserves for excess and assumed workers’compensation claims using a risk-free or statutoryrate. (See Note 9 of Notes to Consolidated FinancialStatements.)
(I) Reinsurance cededCeded unearned premiums are reported as prepaidreinsurance premiums and estimated amounts of rein-surance recoverable on unpaid losses are reported asdue from reinsurers. To the extent any reinsurer doesnot meet its obligations under reinsurance agreements,the Company must discharge the liability. Amounts duefrom reinsurers are reflected net of funds held where theright of offset is present. The Company has providedreserves for estimated uncollectible reinsurance.
(J) Federal and foreign income taxesThe Company files a consolidated income tax returnin the U.S. and foreign tax returns in each of thecountries in which it has its overseas operations. TheCompany’s method of accounting for income taxesis the asset and liability method. Under the asset and liability method, deferred tax assets and liabilities aremeasured using tax rates currently in effect or expectedto apply in the years in which those temporary differ-ences are expected to reverse.
2003 2002 2001
Net income (loss), as reported $ 337,230 $ 175,045 $ (91,546)Add: Stock-based employee compensation expense Included in reported net income, net of tax 48 — —
Deduct: Total stock-based employee compensation expense under fair value based method for all awards, net of tax (4,803) (4,534) (3,008)
Pro forma net income (loss) $ 332,475 $ 170,511 $ (94,554)
Earnings per share:Basic-as reported $ 4.06 $ 2.29 $ (1.39)Basic-pro forma 4.00 2.23 (1.44)
Diluted-as reported 3.87 2.21 (1.39)Diluted-pro forma 3.82 2.15 (1.44)
43
(K) Stock optionsEffective January 1, 2003, the Company adopted the fair value recognition provisions of FAS 123 “Accountingfor Stock-Based Compensation”. The fair value provisions of FAS 123 were applied prospectively to all employeeawards granted, modified, or settled on or after January 1, 2003. The following table illustrates the effect on netincome and earnings per share as if the fair value based method had been applied to all outstanding and unvestedawards in each period (dollars in thousands, except per share data).

The fair value of the options granted is estimated on the date of grant using the Black-Scholes optionpricing model with the following weighted averageassumptions for 2003 and 2002, respectively:(a) dividend yield of 1%, (b) expected volatility of26%, (c) risk-free interest rates of 3.9% and 4.9%and (d) expected life of 7 years.
(L) Foreign currency Gains and losses resulting from foreign currency trans-actions (transactions denominated in a currency otherthan the entity’s functional currency) are included inthe statement of operations. Unrealized gains or result-ing from translating the results of non-U.S. dollardenominated operations and investment securities arereported as accumulated other comprehensive income.Revenues and expenses denominated in currenciesother than U.S. dollars are translated at the weightedaverage exchange rate during the year. Assets and lia-bilities are translated at the rate of exchange in effectat the balance sheet date.
(M) Real estate, furniture and equipmentReal estate, furniture and equipment are carried atcost less accumulated depreciation. Depreciation is calculated using the estimated useful lives of therespective assets. Depreciation expense was$20,160,000, $19,426,000 and $16,349,000 for 2003, 2002 and 2001, respectively.
(N) Comprehensive income (loss)Comprehensive income (loss) encompasses all changesin stockholders’ equity (except those arising fromtransactions with stockholders) and includes netincome, net unrealized capital gains or losses on available-for-sale securities and unrealized foreign currency translation adjustments.
(O) Goodwill and other intangible assets The Company adopted FAS 142, “Goodwill and OtherIntangible Assets,” effective January 1, 2002. UnderFAS 142, goodwill is no longer amortized and is evalu-ated periodically for other than temporary declines invalue. A reconciliation of the reported net loss toadjusted net loss for the year ended December 31, 2001had FAS 142 been applied as of January 1, 2001 follows(amounts in thousands, except per share data):
Net LossYear ended December 31, 2001 Net Loss per Share
Net loss, as reported $ (91,546) $ (1.39)Add back goodwill amortization
(net of tax) 3,686 .05Adjusted net loss $ (87,860) $ (1.34)
(P) Recent accounting pronouncementsIn May 2003, the FASB issued FAS 150, “Accountingfor Certain Financial Instruments with Characteristicsof both Liability and Equity.” FAS 150 establishesstandards for how an issuer classifies and measurescertain financial instruments with characteristics ofboth liabilities and equity. One requirement under FAS150 is that certain trust preferred securities are to be presented as liabilities. The Company elected to adopt FAS 150 in the second quarter of 2003, andaccordingly, its trust preferred securities have beenreclassified to liabilities in the accompanying consoli-dated balance sheet. The adoption of FAS 150 did nothave an effect on the Company’s results of operations.
In January 2003, the FASB issued InterpretationNo. 46, “Consolidation of Variable Interest Entities”(“FIN 46”), which was replaced in December 2003 by FIN 46R. FIN 46R addresses consolidation issuessurrounding special purpose entities and certain otherentities, collectively termed variable interest entities(“VIE”). A VIE is an entity in which equity investorsdo not have the characteristics of a controlling finan-cial interest or do not have sufficient equity at risk forthe entity to finance its activities without additionalsubordinated financial support from other parties. FIN46R requires VIEs to be consolidated by their primarybeneficiaries. FIN 46R was effective immediately fornew VIEs formed subsequent to January 31, 2003. ForVIEs that are not special purpose entities formed priorto February 1, 2003, the effective date is the end of thefirst interim or annual period ending after March 15,2004. The Company adopted FIN 46R in 2003, exceptfor the consolidation provisions which are required to beadopted during the first quarter of 2004. The adoptionof FIN 46R did not have an effect on the Company’sfinancial statement. The Company does not expect theadoption of the consolidation provisions of FIN 46Rto have a material effect on the Company’s financialcondition or results of operations.
Acquisitions and Asset Sales
During 2002 and 2001, business acquisitions werecompleted for an aggregate consideration of approxi-mately $3,730,000 and $3,780,000, respectively. Theacquisitions were accounted for as purchases and,accordingly, the results of operations of the companieshave been included from the respective dates of acqui-sition. Pro forma results of operations have been omit-ted as such effects are not significant.
44
2

45
Investments in Fixed Maturity Securities
At December 31, 2003 and 2002, investments in fixed maturity securities were as follows:
(Dollars in thousands)Gross Gross
Amortized unrealized unrealized Fair CarryingType of investment cost gains losses value value
December 31, 2003Held to maturity:State and municipal $ 81,966 $ 9,133 $ (80) $ 91,019 $ 81,966Corporate 6,371 700 — 7,071 6,371Mortgage-backed securities 115,554 9,048 — 124,602 115,554
Total held to maturity 203,891 18,881 (80) 222,692 203,891
Available for sale:United States Government and government agency 572,142 33,635 (651) 605,126 605,126State and municipal 1,810,133 66,844 (1,400) 1,875,577 1,875,577Corporate 558,247 27,844 (900) 585,191 585,191Mortgage-backed securities 779,365 22,484 (877) 800,972 800,972Foreign 203,269 20,949 (1,673) 222,545 222,545
Total available for sale 3,923,156 171,756 (5,501) 4,089,411 4,089,411
Total investment in fixed maturity securities $ 4,127,047 $ 190,637 $ (5,581) $ 4,312,103 $ 4,293,302
December 31, 2002Held to maturity:State and municipal $ 54,600 $ 9,018 $ (101) $ 63,517 $ 54,600Corporate 6,384 875 — 7,259 6,384Mortgage-backed securities 144,872 11,968 (6) 156,834 144,872
Total held to maturity 205,856 21,861 (107) 227,610 205,856
Available for sale:United States Government and government agency 679,323 46,330 — 725,653 725,653State and municipal 918,534 44,498 (731) 962,301 962,301Corporate 629,639 43,804 (5,798) 667,645 667,645Mortgage-backed securities 752,148 40,240 (2,167) 790,221 790,221Foreign 150,349 9,879 (382) 159,846 159,846
Total available for sale 3,129,993 184,751 (9,078) 3,305,666 3,305,666
Total investment in fixed maturity securities $ 3,335,849 $ 206,612 $ (9,185) $ 3,533,276 $ 3,511,522
3
The amortized cost and fair value of fixed maturitysecurities at December 31, 2003, by contractual matu-rity, are shown below. Actual maturities may differfrom contractual maturities because certain issuersmay have the right to call or prepay obligations:
2003(Dollars in thousands) Amortized cost Fair value
Due in one year or less $ 67,449 $ 69,333Due after one year through five years 878,918 910,618
Due after five years through ten years 768,743 820,051
Due after ten years 1,517,018 1,586,527Mortgage-backed securities 894,919 925,574Total $ 4,127,047 $ 4,312,103
At December 31, 2003 and 2002, there were noinvestments, other than investments in United Statesgovernment and government agency securities, whichexceeded 10% of stockholders’ equity. At December31, 2003, investments with a carrying value of $382million were on deposit with state insurance depart-ments as required by state laws; investments with acarrying value of $30 million were held in trust forpolicyholders; and investments with a carrying valueof $36 million were deposited at Lloyd’s in support ofunderwriting activities. The Company had contingentliabilities regarding irrevocable undrawn letters ofcredit supporting reinsurance business of $22 millionat December 31, 2003. The Company has pledgedinvestments with a carrying value of $54 million ascollateral to support this commitment.

46
The primary focus of the trading account is mergerand convertible arbitrage. Merger arbitrage is thebusiness of investing in the securities of publicly heldcompanies which are the targets in announced tenderoffers and mergers. Convertible arbitrage is the busi-ness of investing in convertible securities with the goalof capitalizing on price differences between their secu-rities and their underlying equities. Arbitrage investingdiffers from other types of investments in its focus ontransactions and events believed likely to bring abouta change in value over a relatively short time period(usually four months or less). The Company believesthat this makes arbitrage investments less vulnerableto changes in general financial market conditions.
Potential changes in market conditions are also miti-gated by the implementation of hedging strategies,including short sales.
The arbitrage positions are generally hedgedagainst market declines by purchasing put options,selling call options or entering into swap contracts.Therefore, just as long portfolio positions may incurlosses during market declines, hedge positions mayalso incur losses during market advances. As ofDecember 31, 2003, the notional amount of longoption contracts outstanding was $31,292,000 andthe notional amount of short option contracts out-standing was $46,346,000.
Trading Account
At December 31, 2003 and 2002, the arbitrage trading account was as follows:
(Dollars in thousands)Gross Gross
Amortized unrealized unrealized Fair CarryingType of investment cost gains losses value value
December 31, 2003Direct equity securities $ 220,791 $ 11,378 $ (1,098) $ 231,071 $ 231,071Arbitrage-related partnerships 100,896 — — 100,896 100,896
Total equity securities trading account 321,687 11,378 (1,098) 331,967 331,967Receivables from brokers 102,257 — — 102,257 102,257Securities sold but not yet purchased (110,782) 280 (8,598) (119,100) (119,100)
Total trading account $ 313,162 $ 11,658 $ (9,696) $ 315,124 $ 315,124
December 31, 2002Direct equity securities $ 72,217 $ 890 $ (3,373) $ 69,734 $ 69,734Arbitrage-related partnerships 95,908 — — 95,908 95,908
Total equity securities trading account 168,125 890 (3,373) 165,642 165,642Receivables from brokers 177,309 — — 177,309 177,309Securities sold but not yet purchased (38,347) 2,870 (638) (36,115) (36,115)
Total trading account $ 307,087 $ 3,760 $ (4,011) $ 306,836 $ 306,836
5
Investments in Equity Services for Sale
At December 31, 2003 and 2002, investments in equity securities were as follows:
(Dollars in thousands)Gross Gross
Amortized unrealized unrealized Fair CarryingType of investment cost gains losses value value
December 31, 2003Common stocks $ 145,893 $ 25,980 $ (698) $ 171,175 $ 171,175Preferred stocks 134,768 11,141 (455) 145,454 145,454
Total $ 280,661 $ 37,121 $ (1,153) $ 316,629 $ 316,629
December 31, 2002Common stocks $ 102,576 $ 3,606 $ (5,570) $ 100,612 $ 100,612Preferred stocks 99,812 4,626 (678) 103,760 103,760
Total $ 202,388 $ 8,232 $ (6,248) $ 204,372 $ 204,372
4

Investments in Affiliates
Investments in affiliates include the following:
Equity (loss)Carrying Value Earnings (loss)
(Dollars in thousands) 2003 2002 2001 2003 2002 2001
Kiln plc $ 40,488 $31,498 $ — $ 4,565 $ 687 $ —Real estate partnerships 57,560 10,808 2,878 6,112 190 —Structured finance partnership 17,846 — — (112) — —Other 10,878 3,881 2,587 (3,540) (187) (16)Total $ 126,772 $46,187 $ 5,465 $ 7,025 $ 690 $ (16)
6
The Company’s investments in affiliates are reportedunder the equity method of accounting. The Company’sshare of the earnings of affiliates is generally reportedon a one-quarter lag in order to facilitate the timelycompletion of the consolidated financial statements.
The Company’s acquired a 20.1% interest in Kilnplc in 2002 for approximately $29 million. Kiln plc is
based in the U.K. and conducts international insur-ance and reinsurance underwriting through Lloyd’ssyndicates. The Company also entered into qualifyingquota share reinsurance agreements with two Lloyd’ssyndicates managed by Kiln plc. Net premiums written under these quota share agreements were$122 million in 2003 and $121 million in 2002.
Investment Income
Investment income consists of the following:
(Dollars in thousands) 2003 2002 2001
Investment income earned on:Fixed maturity securities $ 197,963 $ 182,762 $ 162,751Equity securities available for sale 18,906 12,552 6,754Equity securities trading account (a) 8,110 7,144 19,572Investment in affiliates 7,025 690 (16)Cash and cash equivalents 11,516 5,899 14,715Other 827 1,853 2,880
Gross investment income 244,347 210,900 206,656Interest on funds held under reinsurance treaties and
investment expense (34,291) (23,025) (11,635)Net investment income $ 210,056 $ 187,875 $ 195,021
(a) Investment income earned from net trading account activity includes unrealized trading gains of $2,174,000 in 2003 and unrealized trading losses of $1,155,000 in 2002.
7
47

Realized Gains and Losses
Realized gains (losses) and the change in difference between fair value and cost of investments, before applicableincome taxes, are as follows:
(Dollars in thousands) 2003 2002 2001
Realized gains (losses):Fixed maturity securities (a) $ 73,000 $ 27,446 $ 6,706Equity securities available for sale 10,506 6,603 7,755Provision for other than temporary impairment (b):
Fixed maturity securities (430) (16,155) (26,511)Equity securities available for sale — (2,680) (109)
Other (545) — (93)82,531 15,214 (12,252)
Change in difference between fair value and costof investments, not including trading securities:
Fixed maturity securities (12,371) 128,327 32,452Equity securities available for sale 33,984 (4,139) (1,175)
21,613 124,188 31,277Total $ 104,144 $ 139,402 $ 19,025
(a) During 2003, 2002 and 2001, gross gains of $76,019,000, $39,494,000 and, $13,033,000, respectively, and gross losses of $3,019,000, $12,048,000 and$6,327,000, respectively, were realized.
(b) The 2003 provision for other than temporary impairment reflected the write-down of 2 bond holdings. The 2002 provision for other than temporary impairmentreflected a second quarter charge of $10 million for Argentine sovereign bonds (see Note 22 of Notes to Consolidated Financial Statements) and a fourth quartercharge of $9 million for other investments, including $6 million of securities issued by Dynegy Inc. The 2001 provision for other then temporary impairmentreflected the write-down of Argentine sovereign bonds and other securities.
For fixed maturity securities and equity securities available for sale, gross unrealized gains were $227,758,000 and gross unrealized losses were $6,734,000 as of December 31, 2003. The gross unrealized losses of $6,734,000include unrealized losses of $1,267,000 for securities that have been continuously in an unrealized loss positionfor more than twelve months.
Reserves for Losses and Loss Expenses
The table below provides a reconciliation of the beginning and ending reserve balances on a gross ofreinsurance basis:
(Dollars in thousands) 2003 2002 2001
Net reserves at beginning of year $ 2,323,241 $ 2,033,293 $ 1,818,049Net provision for losses and loss expenses:Claims occurring during the current year 1,780,905 1,288,071 1,140,622Increase (decrease) in estimates for claims occurring
in prior years 272,850 173,732 211,344Net (increase) decrease in discount for prior years (4,099) (4,549) 8,717
2,049,656 1,457,254 1,360,683Net payments for claimsCurrent year 268,170 373,541 443,802Prior years 599,432 793,765 701,637
867,602 1,167,306 1,145,439Net reserves at end of year 3,505,295 2,323,241 2,033,293Ceded reserves at end of year 686,796 844,684 730,557Gross reserves at end of year $ 4,192,091 $ 3,167,925 $ 2,763,850
8
9
48

The statement of operations includes $521,000, $6,717,000 and $19,817,000 for the years ended December31, 2003, 2002 and 2001, respectively, relating to the policyholder benefits incurred on life insurance which arenot included in the above table. Net payments in 2003 are net of $331 million of cash received upon the commu-tation of the aggregate reinsurance agreement (see Note 10 of Notes to Consolidated Financial Statements).
Net losses and loss expenses for the years ended December 31, 2003, 2002 and 2001 included increases inestimates for claims occurring in prior years. The Company, along with the property casualty insurance industryin general, has experienced higher than expected loss costs for certain business written from 1998 to 2001.Following is a summary of the increases in estimates for claims occurring in prior years for the indicated periods(dollars in thousands):
2003 2002 2001
Gross reserves for losses and loss expenses at beginning of year $ 3,168,000 $ 2,764,000 $ 2,476,000
Increase in estimates for claims occurringin prior years, net of reinsurance:
Reinsurance:Casualty lines $ 74,000 $ 47,000 $ 53,000Property lines — — 15,000Fidelity and surety 15,000 14,000 —
Specialty:Excess and surplus lines 62,000 30,000 24,000Professional liability 35,000 31,000 12,000Other 4,000 4,000 5,000
Alternative markets workers’ compensation 41,000 34,000 (2,000)Regional 40,000 10,000 (4,000)International 2,000 4,000 5,000Discontinued — — 103,000
Total $ 273,000 $ 174,000 $ 211,000
ReinsuranceIn 2002 and 2003, the Company increased its esti-mates of the ultimate loss costs for casualty reinsur-ance risks written between 1998 and 2001 primarilyas a result of higher than expected claims reported byceding companies. A significant portion of the increasein estimates for claims occurring in prior years thatwas recognized in 2003 related to certain largeaccounts. The Company sets its initial loss estimatesbased principally upon information obtained duringthe underwriting process and adjusts these estimatesas additional information becomes available. As certain large contracts have matured, the Companyhas adjusted its loss estimates upward to reflect theknown loss experience and has revised its expectationsregarding the level of ultimate losses to reflect a higher level of known losses as well as a pattern ofdelayed loss reporting by some ceding companies. The Company analyzes its treaty reinsurance businessand sets reinsurance reserves each quarter on a treaty-by-treaty basis, rather than in the aggregate for theentire reinsurance business. The Company believesthis method provides a better estimate of required
reserves, as the Company is able to promptly identifychanges in underlying trends experienced by individualceding companies and adjust its reserves as necessary.
The increase in estimated ultimate loss costs forfidelity and surety reinsurance reflects the settlementof several large surety claims during 2002 and 2003,including arbitration resolutions. In addition, theCompany has reserved for certain claims relating tofinancial guarantee exposures that were not intended tobe covered under the Company’s reinsurance policies.
SpecialtyThe Company increased its estimates of ultimate costsfor excess and surplus lines casualty business written inprior years to recognize certain recently identifiedtrends in the development of losses and loss expenses.These trends include a substantial increase in legalexpenses incurred in the defense of claims, in particularfor claims with multiple claimants in multiple states.For some policies, the obligation to defend has causedthe Company to incur aggregate legal expenses inexcess of policy limits, which was unanticipated in bothpricing and reserving these exposures. In addition, the
49

Company identified certain recent changes in theclaims reporting pattern that suggest that claim costsare emerging over a longer period of time and at ahigher level than in the past. Prior year ultimate lossratios were adjusted upwards to recognize the estimatedimpact of such trends. The increase in prior yearreserves for the excess and surplus lines also reflectsthe cost of the disposition of reinsurance arbitration.
The increase in estimated ultimate loss costs forprofessional liability business written in prior yearsrelates primarily to lawyers professional liability, liability coverage for senior living centers and employ-ment practices liability. These lines have experienced ahigher level of claim frequency and severity and alonger reporting pattern than anticipated when initialloss reserves were established. These lines also have ahigh incidence of litigated claims, and the reportingpatterns have lengthened due to a more protractedand complex litigation environment.
Alternative MarketsUltimate loss costs for workers’ compensation business written in prior years were impacted by asubstantial increase in medical cost inflation. Thisresulted principally from increased utilization of thehealth care system by injured workers and moreexpensive and higher usage of prescription drugs. The impact of the increased medical cost trends isespecially significant to the excess workers’ compensa-tion business because of the higher severity of claimsand longer time period over which claims are paid.
RegionalThe increase in prior year reserves for the regionalsegment was primarily related to workers’ compen-sation business, which experienced similar trends tothose described under alternative markets.
Environmental and asbestosTo date, known environmental and asbestos claimshave not had a material impact on the Company’soperations. These claims have not materially impactedthe Company because its subsidiaries generally did not insure large industrial companies that are subjectto significant environmental and asbestos exposures.
The Company’s net reserves for losses and lossadjustment expenses relating to asbestos and environ-mental claims were $31,866,000 and $28,509,000 at December 31, 2003 and 2002, respectively. The
Company’s gross reserves for losses and loss adjust-ment expenses relating to asbestos and environmentalclaims were $49,283,000 and $47,637,000 atDecember 31, 2003 and 2002, respectively. Netincurred losses and loss expenses (recoveries) forreported asbestos and environmental claims wereapproximately $4,749,000, $6,652,000 and$(4,503,000) in 2003, 2002 and 2001, respectively.Net paid losses and loss expenses were approximately$1,391,000, $2,938,000, and $125,000 in 2003,2002 and 2001, respectively. The estimation of theseliabilities is subject to significantly greater than normalvariation and uncertainty because it is difficult to makean actuarial estimate of these liabilities due to theabsence of a generally accepted actuarial methodologyfor these exposures and the potential effect of significantunresolved legal matters, including coverage issues aswell as the cost of litigating the legal issues. Additionally,the determination of ultimate damages and the finalallocation of such damages to financially responsibleparties are highly uncertain.
DiscountingThe Company discounts its liabilities for excess andassumed workers’ compensation business because ofthe long period of time over which losses are paid.Discounting is intended to appropriately match lossesand loss expenses to income earned on investmentsecurities supporting the liabilities. The expectedlosses and loss expense payout pattern subject to dis-counting was derived from the Company’s loss payoutexperience and is supplemented with data compiledfrom insurance companies writing similar business.The liabilities for losses and loss expenses have beendiscounted using risk-free discount rates determinedby reference to the U.S. Treasury yield curve for non-proportional business, and at the statutory rate forproportional business. The discount rates range from3.9% to 6.5% with a weighted average discount rateof 5.0%. For statutory purposes, the Company uses adiscount rate of 4.2% as permitted by the Departmentof Insurance of the State of Delaware. The aggregatenet discount, after reflecting the effects of ceded reinsurance, is $393,000,000, $293,000,000 and$243,000,000 at December 31, 2003, 2002 and 2001,respectively. The increase in the aggregate discountfrom 2002 to 2003 and from 2001 to 2002 resultedfrom the increase in workers’ compensation reserves.50

The Company had a multi-year aggregate reinsur-ance agreement that provided two types of reinsurancecoverage. The first type of coverage provided protectionfor individual losses on an excess of loss or quotashare basis, as specified for each class of business cov-ered by the agreement. The second type of coverageprovided aggregate accident year protection for ourreinsurance segment for loss and loss adjustmentexpenses incurred above a certain level. Loss recoverieswere subject to annual limits and an aggregate limitover the contract period. The agreement contained aprofit sharing provision under which the Companycould recover a portion of premiums paid to the reinsurer if certain profit conditions were met. TheCompany accrued return premiums of $51 million in 2003 and $20 million in 2002 (none in 2001). Asof December 31, 2003, the Company commuted the
aggregate reinsurance agreement. Upon commutation,the reinsurer released funds held in an amount equalto the commuted loss reserves and unearned premiumreserves and, accordingly there was no gain or loss asa result of the commutation.
Certain of the Company’s reinsurance agreementsare structured on a funds held basis whereby theCompany retains some or all of the ceded premiumsin a separate account that is used to fund ceded lossesas they become due from the reinsurance company.Interest is credited to reinsurers for funds held ontheir behalf at rates ranging from 7.0% to 8.9% ofthe account balances, as defined under the agreements.Interest credited to reinsurers, which is reported as areduction of net investment income, was $32 millionin 2003, $21 million in 2002 and $12 million in 2001.
Reinsurance Ceded
The Company reinsures a portion of its exposures principally to reduce net liability on individual risks and toprotect against catastrophic losses. The following amounts arising under reinsurance ceded contracts have beendeducted in arriving at the amounts reflected in the statement of operations:
(Dollars in thousands) 2003 2002 2001
Ceded premiums earned:Aggregate reinsurance agreement $ 152,632 $ 109,238 $ 46,585Other reinsurance contracts 403,992 346,023 299,574
Total $ 556,624 $ 455,261 $ 346,159
Ceded losses incurred:Aggregate reinsurance agreement $ 156,519 $ 94,164 $ 59,441Other reinsurance contracts 291,014 241,162 274,470
Total $ 447,533 $ 335,326 $ 333,911
10
Debt
Debt consists of the following:
(Dollars in thousands) 2003 2002Description Rate Maturity Face Value Carrying Value Carrying Value
Senior Subsidiary Notes 6.50% January 1, 2003 $ — $ — $ 35,793Senior Notes 6.71% March 4, 2003 — — 24,997Current installment due — — 60,790Senior Notes 6.375% April 15, 2005 40,000 39,954 39,919Senior Notes 6.25% January 15, 2006 100,000 99,699 99,566Senior Notes 9.875% May 15, 2008 88,800 87,272 87,010Senior Notes 5.125% September 30, 2010 150,000 147,845 —Senior Notes 5.875% February 15, 2013 200,000 196,973 —Senior Debentures 8.70% January 1, 2022 76,503 75,718 75,700Subsidiary Debt 7.65% June 30, 2023 11,747 11,747 —
$ 667,050 $ 659,208 $ 362,985
The difference between the face value of long-term debt and the carrying value is unamortized discount. All outstanding debt is not redeemable until maturity.
11
51

Trust Preferred Securities
The Company-obligated mandatorily redeemable pre-ferred securities of a subsidiary trust holding solelyjunior subordinated debentures (“Trust PreferredSecurities”) were issued by the W. R. Berkley CapitalTrust (“the Trust”) in 1996. All of the common secu-rities of the Trust are owned by the Company. Thesole assets of the Trust are $210,000,000 aggregateprincipal amount of 8.197% Junior SubordinatedDebentures due December 15, 2045, issued by theCompany (the “Junior Subordinated Debentures”).The Company’s guarantee of payments of cash distri-butions and payments on liquidation of the Trust andredemption of the Trust Preferred Securities, whentaken together with the Company’s obligations underthe Trust Agreement under which the Trust PreferredSecurities were issued, the Junior SubordinatedDebentures and the Indenture under which the JuniorSubordinated Debentures were issued, including itsobligations to pay costs, expenses, debts and liabilitiesof the Trust (other than with respect to the Trust
12
52
Preferred Securities), provide a full and unconditionalguarantee of the Trust’s obligations under the TrustPreferred Securities. The Company records the prefer-ential cumulative cash dividends arising from the payments of interest on the Junior SubordinatedDebentures as interest expense in its consolidatedstatement of operations.
The Trust Preferred Securities are subject tomandatory redemption in a like amount (i) in wholebut not in part, on the stated maturity date, uponrepayment of the Junior Subordinated Debentures, (ii) in whole but not in part, at any time contempora-neously with the optional prepayment of the JuniorSubordinated Debentures by the Company upon theoccurrence and continuation of a certain event and(iii) in whole or in part, on or after December 15,2006, contemporaneously with the optional prepaymentby the Company of Junior Subordinated Debentures.The liability for Trust Preferred Securities is reportednet of $15 million (face amount) of Trust PreferredSecurities repurchased by the Company.
Federal and Foreign Income Taxes
Federal and foreign income tax expense (benefit) consists of:
(Dollars in thousands) 2003 2002 2001Current expense $ 173,613 $ 44,694 $ 2,068Deferred expense (benefit) (22,987) 39,445 (58,729)Total expense (benefit) $ 150,626 $ 84,139 $ (56,661)
A reconciliation of Federal and foreign income tax (expense) benefit and the amounts computed by applyingthe Federal and foreign income tax rate of 35% to pre-tax income are as follows:
(Dollars in thousands) 2003 2002 2001
Computed “expected” tax expense (benefit) $ 171,975 $ 90,802 $ (52,988)Tax-exempt investment income (21,838) (9,051) (8,045)Change in valuation allowance (980) (3,275) 3,100Other, net 1,469 5,663 1,272
Total expense (benefit) $ 150,626 $ 84,139 $ (56,661)
13

Combined net income (loss) and policyholders’surplus of the Company’s consolidated insurance subsidiaries, as determined in accordance with statu-tory accounting practices, are as follows:
(Dollars in thousands) 2003 2002 2001Net income (loss) $ 293,455 $ 192,845 $ (130,630)
Policyholders’ surplus $ 1,886,013 $ 1,275,302 $ 928,367
The significant variances between statutoryaccounting practices and GAAP are that for statutorypurposes bonds are carried at amortized cost, acquisi-tion costs are charged to operations as incurred,deferred Federal income taxes are subject to limita-tions, excess and assumed workers’ compensationreserves are discounted at different discount rates andcertain assets designated as “non-admitted assets” arecharged against surplus.
The NAIC has risk-based capital (“RBC”) require-ments that require insurance companies to calculateand report information under a risk-based formulawhich measures statutory capital and surplus needsbased on a regulatory definition of risk in a company’smix of products and its balance sheet. All of theCompany’s insurance subsidiaries have an RBCamount above the authorized control level RBC, asdefined by the NAIC. The Company has guaranteedthat RBC levels of certain subsidiaries will remainabove their authorized control levels.
Stockholders’ Equity
Common Equity The weighted average number ofshares used in the computation of basic earnings pershare was 83,124,000, 76,328,000, and 65,562,000for 2003, 2002 and 2001, respectively. The weightedaverage number of shares used in the computations ofdiluted earnings per share was 87,063,000, 79,385,000and 68,750,000, for 2003, 2002 and 2001, respectively.Treasury shares have been excluded from averageoutstanding shares from the date of acquisition. Thedifference in calculating basic and diluted earningsper share is attributable entirely to the dilutive effectof stock-based compensation plans.
Changes in shares of common stock outstanding,net of treasury shares, are as follows:
(In thousands) 2003 2002 2001Balance, beginning of year 82,835 74,792 57,726Shares issued 705 8,048 17,106Shares repurchased (2) (5) (40)Balance, end of year 83,538 82,835 74,792
At December 31, 2003 and 2002, the tax effects ofdifferences that give rise to significant portions of thedeferred tax asset and deferred tax liability are as follows:
(Dollars in thousands) 2003 2002Deferred Tax AssetLoss reserve discounting $ 137,165 $ 94,159Life reserve 7,538 9,900Unearned premiums 113,705 85,541Net operating loss carry forward 2,355 1,143Alternative minimum tax credit
carryforward – 12,113Other 16,741 20,656
Gross deferred tax asset 277,504 223,512Less valuation allowance (4,223) (6,825)
Deferred tax asset 273,281 216,687
Deferred Tax LiabilityAmortization of intangibles 7,323 7,844Deferred policy acquisition costs 137,153 109,582Deferred taxes on unrealized
investment gains 72,609 64,043Other 20,383 14,633
Deferred tax liability 237,468 196,102Net deferred tax asset $ 35,813 $ 20,585
Federal income tax expense (benefit) applicable torealized investment gains (losses) was $28,090,000,$13,817,000 and $(2,478,000) in 2003, 2002 and2001, respectively. The Company had a currentincome tax payable of $8,654,000 and $8,314,000at December 31, 2003 and 2002, respectively. AtDecember 31, 2003, the Company had foreign netoperating loss carryforwards of $2,935,000, whichexpire from 2004 and 2008. The net change in thevaluation allowance is primarily related to the foreignnet operating loss carryforwards. The Company’s taxreturns through December 31, 2000 have beenreviewed by the Internal Revenue Service.
The realization of the deferred tax asset is depend-ent upon the Company’s ability to generate sufficienttaxable income in future periods. Based on historicalresults and the prospects for future current operations,management anticipates that it is more likely than notthat future taxable income will be sufficient for therealization of this gross asset.
Dividends from Subsidiaries and Statutory Financial Information
The Company’s insurance subsidiaries are restricted bylaw as to the amount of dividends they may pay with-out the approval of regulatory authorities. During 2004,the maximum amount of dividends which can be paidwithout such approval is approximately $197 million.
14
15
53
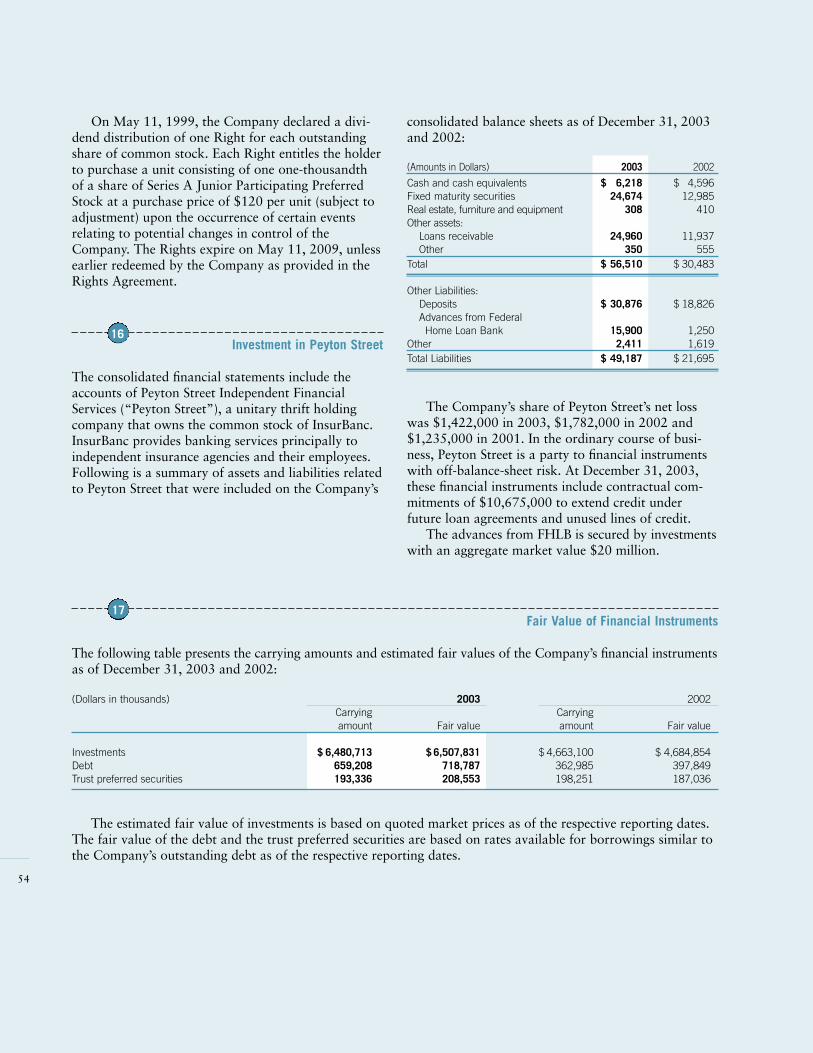
On May 11, 1999, the Company declared a divi-dend distribution of one Right for each outstandingshare of common stock. Each Right entitles the holderto purchase a unit consisting of one one-thousandthof a share of Series A Junior Participating PreferredStock at a purchase price of $120 per unit (subject toadjustment) upon the occurrence of certain eventsrelating to potential changes in control of theCompany. The Rights expire on May 11, 2009, unlessearlier redeemed by the Company as provided in theRights Agreement.
Investment in Peyton Street
The consolidated financial statements include theaccounts of Peyton Street Independent FinancialServices (“Peyton Street”), a unitary thrift holdingcompany that owns the common stock of InsurBanc.InsurBanc provides banking services principally toindependent insurance agencies and their employees.Following is a summary of assets and liabilities relatedto Peyton Street that were included on the Company’s
16
consolidated balance sheets as of December 31, 2003and 2002:
(Amounts in Dollars) 2003 2002
Cash and cash equivalents $ 6,218 $ 4,596Fixed maturity securities 24,674 12,985Real estate, furniture and equipment 308 410Other assets:
Loans receivable 24,960 11,937Other 350 555
Total $ 56,510 $ 30,483
Other Liabilities:Deposits $ 30,876 $ 18,826Advances from Federal
Home Loan Bank 15,900 1,250Other 2,411 1,619Total Liabilities $ 49,187 $ 21,695
The Company’s share of Peyton Street’s net losswas $1,422,000 in 2003, $1,782,000 in 2002 and$1,235,000 in 2001. In the ordinary course of busi-ness, Peyton Street is a party to financial instrumentswith off-balance-sheet risk. At December 31, 2003,these financial instruments include contractual com-mitments of $10,675,000 to extend credit underfuture loan agreements and unused lines of credit.
The advances from FHLB is secured by investmentswith an aggregate market value $20 million.
Fair Value of Financial Instruments
The following table presents the carrying amounts and estimated fair values of the Company’s financial instrumentsas of December 31, 2003 and 2002:
(Dollars in thousands) 2003 2002Carrying Carryingamount Fair value amount Fair value
Investments $ 6,480,713 $ 6,507,831 $ 4,663,100 $ 4,684,854Debt 659,208 718,787 362,985 397,849Trust preferred securities 193,336 208,553 198,251 187,036
The estimated fair value of investments is based on quoted market prices as of the respective reporting dates.The fair value of the debt and the trust preferred securities are based on rates available for borrowings similar tothe Company’s outstanding debt as of the respective reporting dates.
17
54

Lease Obligations
The Company and its subsidiaries use office space andequipment under leases expiring at various dates. Theseleases are considered operating leases for financialreporting purposes. Some of these leases have optionsto extend the length of the leases and contain clausesfor cost of living, operating expense and real estatetax adjustments. Rental expense was approximately:$18,773,000, $17,586,000 and $18,021,000 for 2003,2002 and 2001, respectively. Future minimum leasepayments (without provision for sublease income)are $14,583,000 in 2004; $12,503,000 in 2005;$10,103,000 in 2006; and $26,525,000 thereafter.
Commitments, Litigation andContingent Liabilities
The Company’s subsidiaries are subject to disputes,including litigation and arbitration, arising in theordinary course of their insurance and reinsurancebusinesses. The Company’s estimates of the costs ofsettling such matters are reflected in its aggregatereserves for losses and loss expenses, and the Companydoes not believe that the ultimate outcome of suchmatters, individually or in the aggregate, will have amaterial adverse effect on its financial condition orresults of operations.
During 2003, two arbitration hearings in whichsubsidiaries of the Company were involved were com-pleted. The Company recorded an increase in reservesfor loss and loss expenses during the third quarter of2003 of $15 million, which represents the excess ofthe Company’s estimate of the ultimate cost of thedisposition of these matters over amounts that werepreviously accrued.
18 19
55
Stock Incentive Plan
The Company has a stock incentive plan (the “Stock Incentive Plan”) under which 16,031,250 shares of CommonStock were reserved for issuance. Pursuant to the Stock Incentive Plan, stock incentives may be granted at pricesdetermined by the Board of Directors but not less than fair market value on the date of grant.The following table summarizes option information:
2003 2002 2001Shares Price (a) Shares Price (a) Shares Price (a)
Outstanding at beginning of year 9,206,468 $ 17.15 8,187,929 $ 15.21 8,968,679 $ 14.03Granted 73,000 30.96 1,897,013 24.41 1,217,138 20.92Exercised 694,989 14.33 581,550 13.41 1,559,025 13.23Canceled 112,658 15.66 296,924 17.17 438,863 14.55Outstanding at end of year 8,471,821 $ 17.52 9,206,468 $ 17.15 8,187,929 $ 15.21Options exercisable at year end 3,727,375 $ 15.55 3,609,791 $ 15.61 3,719,069 $ 14.73Stock available for future grant 3,611,946 3,578,751 5,179,931
(a) Weighted average exercise price.
The following table summarizes information about stock options outstanding at December 31, 2003 and 2002:
Options Outstanding Options ExercisableWeighted Weighted
Remaining Weighted AverageNumber Contractual Average Number Exercise
Range of Exercise Prices Outstanding Life Price Exercisable PriceDecember 31, 2003$6 to $10 1,444,013 6.3 $ 8.25 262,817 $ 8.2410 to 20 2,826,005 3.3 14.56 2,652,918 14.5920 to 35 4,201,803 7.0 22.69 811,640 21.05
Total 8,471,821 5.6 $ 17.52 3,727,375 $ 15.55
December 31, 2002$6 to $10 1,634,098 7.0 $ 8.30 — $ —10 to 20 3,186,783 4.2 14.37 2,958,048 14.4120 to 35 4,385,587 7.7 22.47 651,743 21.05
Total 9,206,468 6.3 $ 17.15 3,609,791 $ 15.61
20

International Operations
From its inception in 1995 and through the fourthquarter of 2002, the international segment’s results werereported on a one-quarter lag to facilitate the timelycompletion of the consolidated financial statements.Improvements in reporting procedures now allowthis segment to be reported without a one-quarter lag.Beginning in the first quarter of 2003, the internationalsegment’s results were reported in the consolidatedstatement of operations without a one-quarter lag. Inorder to eliminate the one-quarter lag, net income ofthe international segment for the fourth quarter of2002 was reported as a direct credit to consolidatedretained earnings during the first quarter of 2003.
During 2001 and 2002, Argentina experiencedsubstantial economic disruption, including default onits sovereign bonds, severe currency devaluation, highunemployment and inflation, increasing fiscal deficitsand declining central bank reserves. As a result of theseevents, the Company ceased writing life insurance busi-ness in Argentina in 2002 and has since liquidatedsubstantially all of its life insurance policies. TheCompany also wrote down the carrying value of itsArgentine sovereign bonds by $18 million in 2001and $10 million in 2002. In addition, the Company’sArgentine subsidiary reported net gains of $21.7 millionin 2002 as a result of foreign currency transactionsand the related settlement of life insurance contracts.The foreign currency transaction gain represents thenet increase in the local currency value of assets andliabilities denominated in US dollars following thedevaluation of the Argentine peso. The gain on surrenderof life insurance contracts represents the gain from thenegotiated settlement of certain US dollar life insurancecontracts for less than their local currency value follow-ing the devaluation of the Argentine peso.
Compensation Plan
The Company and its subsidiaries have profit sharingretirement plans in which substantially all employeesparticipate. The plans provide for minimum annualcontributions of 5% of eligible compensation; contribu-tions above the minimum are discretionary and varywith each participating subsidiary’s profitability.Employees become eligible to participate in theRetirement Plans on the first day of the monthfollowing the first full three months in which theyare employed. Profit sharing expense amounted to$17,135,000 $12,821,000, and $9,287,000 for 2003,2002 and 2001, respectively.
The Company has a Long-Term IncentiveCompensation Plan (“LTIP”) that provides for incen-tive compensation to key executives based on theCompany’s earnings, as defined under the LTIP. Keyemployees are awarded participation units (“Units”),which vest and become exercisable over a maximumterm of five years from the date of their award. In2001, the Company granted 178,875 Units, with anaggregate maximum value of $19,875,000, to keyexecutives. Based on the Company’s earnings, theseUnits achieved their maximum value in 2003. Theparticipants received the maximum value for their Unitsin cash in February 2004. Thereafter, no remainingunits were outstanding. Compensation expense relatedto the LTIP was $11,475,000 in 2003 and $8,400,000in 2002.
During 2003, 456,000 Restricted Stock Units(RSU) were awarded to officers of the Company and itssubsidiaries. Each RSU represents the right to receive oneshare of common stock, conditioned on the employee’ssatisfying certain requirements outlined in the awardagreement. The RSUs vest after five years of continuousemployment. The Company determines the cost of theRSUs awarded based on the market value of the stock atthe time of the award. The cost is recognized as com-pensation expense as the units are earned over thevesting period. Compensation expense related to RSUswas $1,927,000 for 2003. The remaining unearnedcompensation for outstanding RSUs was $11,060,000as of December 31, 2003.
56
21 22

alternative markets segment also provides a wide varietyof fee-based services, including consulting and admin-istrative services.
Our reinsurance operations specialize in under-writing property casualty reinsurance on both a treatyand a facultative basis. The principal reinsurance unitsare facultative reinsurance, which writes individualcertificates and program facultative business, treatyreinsurance, which functions as a traditional reinsurerin specialty and standard reinsurance lines, andLloyd’s reinsurance, which writes quota share reinsur-ance with certain Lloyd’s syndicates.
Our regional subsidiaries provide commercialinsurance products to customers primarily in 32states. Key clients of this segment are small-to-mid-sized businesses and governmental entities. Theregional subsidiaries are organized geographically,which provides them with the flexibility to adapt tolocal market conditions, while enjoying the superioradministrative capabilities and financial strength ofthe Company. The regional operations are conductedthrough four geographic regions based on marketsserved: Midwest, New England, Southern (excludingFlorida) and Mid Atlantic.
International operations are conducted inArgentina and Asia. In Argentina, we currently offercommercial and personal property casualty insurance.In Asia, we provide savings and life products to cus-tomers, including endowment policies to pre-fundeducation costs and retirement income.
During 2001, the Company discontinued itsregional personal lines business and the alternativemarkets division of its reinsurance segment. Thesediscontinued businesses are now being managed andreported collectively as a separate DiscontinuedBusiness Segment. Prior period segment informationhas been restated to reflect these changes.
The accounting policies of the segments are thesame as those described in the summary of significantaccounting policies. Income tax expense and benefits
Restructuring Plan
In 2001, the Company reported a restructuring chargeof $3,196,000 in connection with its withdrawal fromregional personal lines business and the reorganizationof certain other operations. The Company reduced itspermanent workforce by approximately 304 employeesin connection with the plan. The charge consistedmainly of severance payments of $2,462,000 and con-tractual lease payments related to abandoned facilities.The activities under the plan were substantiallycompleted in 2001.
Industry Segments
The Company’s operations are presently conductedthrough five segments of the insurance business:specialty lines of insurance; alternative markets;reinsurance; regional property casualty insurance;and international.
Our specialty segment underwrites complex andsophisticated third-party liability risks, principallywithin the excess and surplus lines, professional liability,commercial transportation and surety markets. Thespecialty business is conducted through seven operatingunits. The companies within the segment are dividedalong the different customer bases and product lineswhich they serve. The specialty units deliver their prod-ucts through a variety of distribution channels dependingon the customer base and particular risks insured. Thecustomers in this segment are highly diverse.
Our alternative markets operations specialize indeveloping, insuring, reinsuring and administeringself-insurance programs and other alternative risktransfer mechanisms. Our clients include employers,employer groups, insurers, and alternative market fundsseeking less costly, more efficient ways to manageexposure to risks. In addition to providing primaryand excess workers’ compensation insurance, the
Supplemental Financial Statement Data
Other operating costs and expenses consist of the following:
(Dollars in thousands) 2003 2002 2001Amortization of deferred policy acquisition costs $ 787,167 $ 589,993 $ 492,065Other underwriting expenses 118,182 94,590 85,593Service company expenses 82,821 69,715 64,949Other costs and expenses 47,724 42,907 21,169Total $ 1,035,894 $ 797,205 $ 663,776
23
24
25
57

are calculated based upon the Company’s overalleffective tax rate. Summary financial informationabout the Company’s operating segments is presentedin the following table. Income (loss) before incometaxes by segment consists of revenues less expensesrelated to the respective segment’s operations, including
Revenues Pre-tax NetEarned Investment Income Income
(Dollars in thousands) Premiums Income Other Total (loss) (loss)
December 31, 2003:Specialty $ 1,117,781 $ 70,232 $ — $ 1,188,013 $ 201,885 $ 136,725Alternative Markets 410,926 38,450 101,715 551,091 85,397 59,066Reinsurance 760,558 52,622 — 813,180 59,984 43,610Regional 880,597 43,368 — 923,965 153,292 105,468International 64,748 6,173 10 70,931 3,347 3,716Discontinued Business — — — — — —Corporate, other and eliminations — (789) 2,025 1,236 (96,293) (64,699)Realized investment and foreign
currency gains (losses) — — 81,692 81,692 81,692 53,334Consolidated $ 3,234,610 $ 210,056 $ 185,442 $ 3,630,108 $ 489,304 $ 337,220
December 31, 2002:Specialty $ 772,696 $ 53,862 $ — $ 826,558 $ 136,112 $ 90,498Alternative Markets 235,558 37,641 86,031 359,230 62,703 42,376Reinsurance 398,287 43,912 — 442,199 14,981 11,626Regional 705,385 44,365 — 749,750 104,085 69,429International 89,284 5,325 — 94,609 (1,757) (2,631)Discontinued Business 51,317 4,457 — 55,774 (10,682) (6,943)Corporate, other and eliminations — (1,687) 2,581 894 (83,079) (50,643)Realized investment and foreign
currency gains (losses) — — 37,070 37,070 37,070 21,333Consolidated $ 2,252,527 $ 187,875 $ 125,682 $ 2,566,084 $ 259,433 $ 175,045
December 31, 2001:Specialty $ 428,058 $ 41,021 $ 1,028 $ 470,107 $ 34,554 $ 24,617Alternative Markets 123,173 37,765 73,492 234,430 34,255 23,723Reinsurance 209,938 40,905 7 250,850 (61,403) (43,715)Regional 555,750 51,640 1,292 608,682 37,203 26,763International 140,909 13,993 1,011 155,913 12,149 9,293Discontinued Business 222,641 9,762 232,403 (133,480) (88,839)Corporate, other and eliminations — (65) 971 906 (63,178) (40,501)Realized investment and foreign
currency gains (losses) — — (11,494) (11,494) (11,494) (2,887)Consolidated $ 1,680,469 $ 195,021 $ 66,307 $ 1,941,797 $ (151,394) $ (91,546)
allocated investment income. Identifiable assets bysegment are those assets used in or allocated to theoperation of each segment. Reclassifications have beenmade in the 2002 and 2001 segment information inorder to conform with the presentation of the 2003segment information.
58

59
Interest expense for the alternative markets and reinsurance segments was $2,327,000 and $2,806,000 for theyears ended December 31, 2002 and 2001, respectively. Additionally, corporate interest expense (net of intercom-pany amounts) was $54,733,000, $43,148,000 and $42,913,000 for the corresponding periods. Identifiableassets by segment are as follows (dollars in thousands):
December 31, 2003 2002 2001Specialty $ 3,127,810 $ 2,271,105 $ 1,580,155Alternative Markets 1,504,535 1,197,977 859,502Reinsurance 3,415,191 2,431,429 1,751,428Regional 1,992,660 1,590,913 1,462,861International 152,571 126,528 209,473Discontinued Business 94,109 162,754 289,313Corporate, other and eliminations (952,191) (749,383) (519,223)Consolidated $ 9,334,685 $ 7,031,323 $ 5,633,509
Quarterly Financial Information (unaudited)
The following is a summary of quarterly financial data (in thousands except per share data):
Three months ended March 31, June 30, September 30, December 31,2003 2002 2003 2002 2003 2002 2003 2002
Revenues $ 791,413 $ 547,886 $ 926,957 $ 569,935 $ 916,382 $ 640,071 $ 995,356 $ 808,192Net income 71,703 34,396 95,840 27,374 76,469 40,544 93,208 72,731Net income per share:Basic (a) .87 .46 1.15 .36 .92 .54 1.12 .91Diluted (a) .83 .44 1.10 .34 .87 .52 1.07 .88
(a) Earnings per share (EPS) in each quarter is computed using the weighted-average number of shares outstanding during that quarter while EPS for the full yearis computed using the weighted-average number of shares outstanding during the year. Thus, the sum of the four quarters EPS does not necessarily equal the full-year EPS.
26

60
Board of Directors and StockholdersW. R. Berkley Corporation
We have audited the consolidated balance sheets of W. R. Berkley Corporation and subsidiaries as of December31, 2003 and 2002, and the related consolidated statements of operations, stockholders’ equity, comprehensiveincome and cash flows for each of the years in the three-year period ended December 31, 2003. These consoli-dated financial statements are the responsibility of the Company’s management. Our responsibility is to expressan opinion on these consolidated financial statements based on our audits.
We conducted our audits in accordance with auditing standards generally accepted in the United States ofAmerica. Those standards require that we plan and perform the audit to obtain reasonable assurance aboutwhether the financial statements are free of material misstatement. An audit includes examining, on a test basis,evidence supporting the amounts and disclosures in the financial statements. An audit also includes assessing theaccounting principles used and significant estimates made by management, as well as evaluating the overall finan-cial statement presentation. We believe that our audits provide a reasonable basis for our opinion.
In our opinion, the consolidated financial statements referred to above present fairly, in all material respects,the financial position of W. R. Berkley Corporation and subsidiaries as of December 31, 2003 and 2002, and theresults of their operations and their cash flows for each of the years in the three-year period ended December 31,2003, in conformity with accounting principles generally accepted in the United States of America.
As discussed in Note 1 to the consolidated financial statements, the Company has changed its method ofaccounting for goodwill in 2002.
New York, New York KPMG LLPFebruary 11, 2004
I N D E P E N D E N T A U D I T O R S ’ R E P O RT

O P E R AT I N G U N I T S
Specialty
Admiral Insurance Company1255 Caldwell Road, Cherry Hill, NJ 08034(856) 429-9200 Fax: (856) 429-8611
James S. Carey, CPCU, President & Chief Executive OfficerWilliam F. Murray, President – Excess DivisionScott R. Barraclough, Senior Vice President & TreasurerDaniel A. MacDonald, Senior Vice President & SecretaryCurtis E. Fletcher, CPCU, Regional Vice PresidentWilliam E. Haines, Regional Vice PresidentRaymond H. McDowell, Regional Vice PresidentMartin M. Michell, Regional Vice PresidentAnthony A. Peraine, Vice President – Chief ActuaryJohn Regan, Vice President – Information TechnologyWalter G. Strauss, Vice President – UnderwritingPatricia A. Vreeland, Vice President – Human Resources
Austin, Texas Seattle, WashingtonTel. (512) 795-0766 Tel. (206) 467-6511
Duluth, Georgia Stamford, ConnecticutTel. (770) 476-1561 Tel. (203) 323-8286
Berkley Medical Excess Underwriters, LLC390 S. Woods Mill Road, Suite 125Chesterfield, MO 63017(314) 523-3650 Fax: (314) 523-3685
J. Michael Foley, PresidentTodd Brown, Vice President – UnderwritingKimberly H. Willis, Vice President – MarketingW. Matthew Fessler, Vice President – ClaimsDianne Perry, Vice President – Risk ManagementCollin J. Suttie, Vice President – Actuarial ServicesRoger J. Becker, Controller, TreasurerRobbin A. Willis, Vice President – Human
Resources/Administration, Secretary
Carolina Casualty Insurance Company8381 Dix Ellis Trail, Jackson Building, Suite 400Jacksonville, FL 32256(904) 363-0900 Fax: (904) 363-8098
Armin W. Blumberg, PresidentDonald J. Bromberek, Vice President – UnderwritingRobert F. Flannery, Vice President – ActuaryJ. Madison Macon, Vice President – MarketingWilliam P. Sands, Vice President – ClaimsCarroll D. Starmer, Vice President – Management
Information SystemsCatherine P. Steckner, Vice President – Human ResourcesBetty C. Sutherland, Vice President & SecretaryGary R. Wothe, Vice President,
Chief Financial Officer & Treasurer
Clermont Specialty Managers, Ltd.3 University Plaza, Hackensack, NJ 07601(201) 342-4211 Fax: (201) 342-6381
Alfred Schonberger, PresidentDavid A. Gianfrancesco, Senior Vice President – ClaimsDonald J. Togneri, CPCU, Senior Vice President – UnderwritingGeorge C. Culliney, Jr., CPCU, Vice President & Secretary –
Compliance & Industry RelationsClaire Herstein, Vice President – Operations & Administration
Monitor Liability Managers, Inc.2850 West Golf Road, Suite 800Rolling Meadows, IL 60008-4039(847) 806-6590 Fax: (847) 806-6282
Douglas J. Powers, CPCU, President & Chief Executive Officer
Sandra C. Nelson, Senior Vice President – UnderwritingDavid R. Aller, CPCU, Vice President – Producer
DevelopmentJoseph B. Haltman, Vice President – Directors &
Officers LiabilityJames E. Hill, Vice President – ClaimsPeter A. Lindquist, CPCU, Vice President, Chief Financial
Officer, Treasurer & SecretaryThomas J. Mathias, Vice President – Management LiabilityRandal P. Mrozowicz, Vice President – Lawyers’
Professional Liability & Employment Practices LiabilityCraig G. Musgrave, Vice President & Chief Technology
Officer – Information Technology
Nautilus Insurance CompanyGreat Divide Insurance Company7273 East Butherus Drive, Scottsdale, AZ 85260(480) 951-0905 Fax: (480) 951-9730
Thomas M. Kuzma, President & Chief Executive OfficerJohn M. DiBiasi, Executive Vice President –
Underwriting/Agency RelationsJohn M. Runberg, Senior Vice President, Chief Financial
Officer & TreasurerBevin M. Beatovic, Vice President – UnderwritingEllen M. Hageman, Vice President – OperationsTony Howard, Vice President – Human ResourcesMichael J. Kilgas, Vice President – ClaimsVickie L. Potts, CPCU, Vice President – MarketingCynthia A. Roa, Vice President – Corporate DevelopmentJeanne M. Rondeau, CPCU, Vice President – UnderwritingJanet L. Shemanske, Vice President & SecretaryVickie L. Sprague, Vice President – Underwriting 61

62
Vela Insurance Services, Inc.200 West Madison, Suite 2700, Chicago, IL 60606(312) 553-4413 Fax: (312) 553-4416
Richard P. Shemitis, CPCU, PresidentO. Erik Hallberg, Executive Vice President – Branch
Manager, Santa Ynez, CARitamari Martin, Vice President – Underwriting,
Santa Ynez, CAPatricia Maruszak, Vice President – Underwriting,
Chicago, ILWilliam L. Braden, Vice President – Underwriting,
Chicago, IL
Santa Ynez, CaliforniaTel. (805) 693-0839
W. R. Berkley Insurance (Europe), Limited40 Lime Street, 6th FloorLondon EC3 M7AW, England011 44 207 280 9000 Fax: 011 44 207 280 9099
Stuart Wright, Chief Executive Officer & Chief Underwriting Officer
Paul Hosking, Chief Financial OfficerMichael Earp, Technical and Administration OfficerPeter Glanfield, Professional Lines Underwriting ManagerColin Eaton, Regional Underwriting Manager
Regional
Acadia Insurance CompanyOne Acadia Commons, P.O. Box 9010 Westbrook, ME 04098-5010(207) 772-4300 Fax: (207) 772-6104
Bill Thornton, CPCU, PresidentCharles A. Hamblen, CPCU, Senior Vice President,
Chief Financial Officer & TreasurerBobbi Amero, CPCU, Regional Vice President, NHSusan Grady, Regional Vice President, MEPaul S. McAuliffe, Regional Vice President, MAAndrew M. Burbank, Vice President – Information SystemsChristopher B. Dowd, CPCU, Vice President – Loss ControlJane E. Gordon, Vice President – UnderwritingJudith E. Plummer, CPCU, Vice President – Industry &
Government RelationsE. Wesley Raye, Jr., Vice President – Inland & Ocean MarineStephen J. Rich, CPCU, Vice President – ClaimsKathryn P. Whitmore, Vice President – Human
Resources & Secretary
Bedford, New Hampshire South Burlington, VermontTel. (603) 627-8466 Tel. (802) 658-0722
Farmington, Connecticut Syracuse, New YorkTel. (860) 409-9301 Tel. (315) 457-3757
Marlborough, Massachusetts Westbrook, MaineTel. (508) 786-6600 Tel. (207) 772-4300
Berkley Mid-Atlantic Group4820 Lakebrook Drive, Suite 300Glen Allen, VA 23060(804) 285-2700 Fax: (804) 285-5717
George C. Wynne, Vice Chairman & ChiefExecutive Officer
Kevin W. Nattrass, President & Chief Operating OfficerWilliam E. Yount, CPCU, Vice President –
Insurance OperationsW. Kirk Bonner, Vice President – Information TechnologyJeffrey E. Bouton, Vice President – UnderwritingDavid C. Keller, Vice President – MarketingStephen M. Loderick, CPCU, Vice President, Chief Financial
Officer & TreasurerW. Ralph Sitterson, Vice President – Claims
Erie, Pennsylvania Richmond, VirginiaTel. (814) 838-0124 Tel. (804) 285-2700
Harrisburg, PennsylvaniaTel. (800) 578-0655
Continental Western Group11201 Douglas Avenue, Urbandale, IA 50322(515) 278-3000 Fax: (515) 278-3458
Bradley S. Kuster, CPCU, PresidentThomas E. Boots, Senior Vice President –
Agency & Information ServicesRobert F. Buehler, Senior Vice President &
Chief Financial OfficerWalter E. Stradley, Senior Vice President – UnderwritingMichael L. Anania, Regional Vice President – Union RegionCurtis W. Bloemendaal, Regional Vice President –
Tri-State RegionSteven J. Freeborn, Regional Vice President –
Central RegionKevin H. Ebers, Vice President – Information SystemsGregory J. Johnson, Vice President – ClaimsTony J. Kellner, Vice President – ActuaryLynsey L. Oster, Vice President – AdministrationJohn F. Thelen, Vice President – General Counsel &
Secretary
Boise, Idaho Luverne, MinnesotaTel. (208) 375-4494 Tel. (507) 283-9561
Lincoln, Nebraska Urbandale, IowaTel. (402) 423–7688 Tel. (515) 278–3000
O P E R AT I N G U N I T S

Union Standard Insurance Group122 West Carpenter Freeway, Suite 350Irving, TX 75039-2008(972) 719-2400 Fax: (972) 719-2403
Craig W. Sparks, PresidentJerry W. Crites, Senior Vice President – ClaimsJames W. Foos, CPCU, Senior Vice President – UnderwritingEdmund P. Hemmerick, CPCU, Senior Vice President –
Operations & TreasurerJohn E. Gray, Vice President – FinanceJacquelynne Hurst, Vice President – Marketing &
Underwriting ServicesMary Jane Neese, Regional Vice President Greg R. Perkins, Vice President – Information ServicesE. Leslie Prock, Vice President – Human Resources
Albuquerque, New Mexico Meridian, MississippiTel. (505) 830-0038 Tel. (601) 482-6816
Birmingham, Alabama Nashville, TennesseeTel. (205) 988-5950 Tel. (615) 373-1621
Dallas, Texas Oklahoma City, OklahomaTel. (972) 719-2400 Tel. (405) 483-1555
Little Rock, Arkansas San Antonio, TexasTel. (501) 954-7888 Tel. (210) 979-9136
Monitor Surety Managers, Inc.383 Main Street, Suite 202Chatham, NJ 07928(973) 635-2400 Fax: (973) 635-1362
Paul J. Fleming, PresidentJohn F. Beers, Vice PresidentSteven F. Coward, Vice President
Alpharetta, Georgia New York, New YorkTel. (678) 624-1818 Tel. (212) 867-2650
Des Moines, Iowa Rolling Meadows, IllinoisTel. (515) 251-6634 Tel. (847) 806-6590
Irving, Texas Saratoga Springs, New YorkTel. (972) 719-2346 Tel. (518) 583-1623
Lincoln, Nebraska Severna Park, MarylandTel. (402) 423-7688 Tel. (410) 647-6990
Marlborough, Massachusetts Tampa, FloridaTel. (508) 263-2584 Tel. (813) 870-2077
Meridian, Mississippi Westbrook, MaineTel. (601) 482-6816 Tel. (207) 772-4300
Regional business written in:Acadia Insurance Company; Berkley Regional InsuranceCompany; Continental Western Insurance Company;Firemen’s Insurance Company of Washington, D.C.; Tri-State Insurance Company of Minnesota; Union Insurance Company; Union Standard Lloyds.Monitor Surety Managers, Inc. also writes businessin Carolina Casualty Insurance Company.
Alternative Markets
Berkley Risk Administrators Company, LLC222 South Ninth Street, Suite 1300Minneapolis, MN 55402-3332(612) 766-3000 Fax: (612) 766-3299
Mark C. Tansey, Chairman & Chief Executive OfficerKenneth R. Hopkins, President & Chief Operating OfficerKim J. Brenckman, Senior Vice President – Sales/MarketingSteven J. Davis, Chief Financial OfficerThomas R. Drake, Chief Information OfficerMichael T. Elsenpeter, Vice President – Client
Financial ServicesPatricia J. Fish, Vice President – Human
Resources/AdministrationLeland P. Johnson, Senior Vice President – ClaimsBruce A. Medvec, Senior Vice President – Western RegionDouglass E. Pfeifer, Senior Vice President –
Reinsurance/Underwriting
Alpharetta, GeorgiaTel. (770) 663-8635
Council Bluffs, IowaTel. (800) 832-0137
Nashville, TennesseeTel. (615) 493-7777
Overland Park, KansasTel. (913) 385-4960
Pierre, South DakotaTel. (605) 945-2144
Rolling Meadows, IllinoisTel. (847) 264-3000
St. Paul, MinnesotaTel. (651) 281-1200
Scottsdale, ArizonaTel. (602) 992-8844
Tukwila, WashingtonTel. (206) 575-2303
Virginia Beach, VirginiaTel. (757) 490-7838
Wauwatosa, WisconsinTel. (414) 771-2038
Wichita, KansasTel. (316) 821-0200
All Claims of Nevada, Inc.Las Vegas, NevadaTel. (702) 257-2193
O P E R AT I N G U N I T S
63
Allied AdjustersMinneapolis, MinnesotaTel. (612) 766-3700
Arizona All ClaimsScottsdale, ArizonaTel. (602) 997-5877
Berkley Administrators ofConnecticut, Inc.Farmington, ConnecticutTel. (860) 409-9300
Berkley Risk & InsuranceServicesNovato, CaliforniaTel. (415) 898-9600
Berkley Risk ManagersMays Landing, New JerseyTel. (609) 625-5544
Berkley Risk Services ofColoradoDenver, ColoradoTel. (303) 357-2600
Independent PlanAdministrators, LLCLas Vegas, NevadaTel. (702) 257-2190
Southwest Risk ServicesScottsdale, ArizonaTel. (602) 996-8810

64
Preferred Employers Insurance Company1455 Frazee Road, Suite 1000San Diego, CA 92108(619) 688-3900 Fax: (888) 472-9490
Linda R. Smith, President & Chief Executive OfficerMarc J. Beaulieu, Vice President – MarketingJan A. Beaver, Vice President & SecretaryJohn C. Bennett, Vice President Rosemary Favier, Vice President – ClaimsBarbara L. Gallagher, Vice President – UnderwritingMiklos F. Kallo, Vice President, Treasurer & Chief
Financial OfficerRandy Sysol, Vice President – Information Technology
Key Risk Insurance Company7900 McCloud Road, Suite 300, P.O. Box 49129Greensboro, NC 27419(336) 668-9050 Fax: (336) 605-7544
Joe W. Sykes, CPCU, President & Chief Executive OfficerJoe C. Brooks, Senior Vice President – Human
Resources/AdministrationRebecca H. Karr, CPCU, Senior Vice President & Chief
Financial Officer/Information SystemsAnne H. Myers, CPCU, Senior Vice President – Alternative
Risk ServicesRobert S. Capobianco, CPCU, Vice President – MarketingJohn A. Godfrey, CPCU, Vice President – UnderwritingRobert W. Standen, Vice President – Claims
Alpharetta, Georgia Raleigh, North CarolinaTel. (770) 751-8901 Tel. (919) 876-8611
Columbia, South Carolina Richmond, VirginiaTel. (803) 252-1777 Tel. (804) 288-2660
Key Risk Management Services, Inc.Greensboro, North CarolinaTel. (336) 668-9050
Midwest Employers Casualty Company13801 Riverport Drive, Suite 200Maryland Heights, MO 63043-4810(314) 298-7332 Fax: (314) 298-0434
Melodee J. Saunders, President & Chief Operating OfficerSteven J. Link, Executive Vice President – MarketingPeter W. Shaw, Chief Financial Officer & TreasurerDonna L. Knowling, Senior Vice President & SecretaryRobert H. Burgoyne, Vice President – UnderwritingMatthew J. Jerabek, Vice President – Special ProjectsLeo J. Winstead, Vice President – Claims
Reinsurance
Berkley Insurance Company475 Steamboat Road, Greenwich, CT 06830(203) 542-3800 Fax: (203) 542-3839
William R. Berkley, Chairman & PresidentLarry A. Hansen, Executive Vice President &
Chief Financial OfficerCarol J. LaPunzina, Senior Vice President – General Counsel &
SecretaryRichard D. Thomas, Vice President & Corporate Actuary
Facultative ReSources, Inc.475 Steamboat Road, Greenwich, CT 06830(203) 542-3500 Fax: (203) 542-3579
James W. McCleary, President & Chief Executive OfficerJames H. Crutchley, Chief Casualty Underwriting
Officer & Senior Vice President –Branch Manager, Greenwich, CT
Thomas V. Lehmkuhl, Vice President – Underwriting, Greenwich, CT
Michael E. Horn, Vice President – Underwriting, Greenwich, CT
Michael J. Nicholas, Senior Vice President – Branch Manager, Atlanta, GA
Ronald S. Hayden, Vice President – Underwriting, Atlanta, GA
David M. McNichols, Vice President – Resident Manager, Schaumburg, IL
Walter R. Carlson, Vice President – Underwriting, Schaumburg, IL
Stephen A. Samoskevich, Senior Vice President – Manager of Information Technology
Edward N. Ryan, Vice President – Property ManagerPasquale Tomaino, Vice President – Chief Financial OfficerNorman H. Davis, Vice President – Claims ManagerCarol J. LaPunzina, Vice President – General Counsel &
Secretary
Atlanta, Georgia Schaumburg, IllinoisTel. (770) 396-2515 Tel. (847) 884-1960
Signet Star Re, LLC475 Steamboat Road, Greenwich, CT 06830(203) 542-3200 Fax: (203) 542-3290
Tom N. Kellogg, ChairmanCraig N. Johnson, President & Chief Executive OfficerRichard Agatstein, Senior Vice President – UnderwritingStephen P. Horvath, Senior Vice President – UnderwritingTimothy C. McCoy, Senior Vice President – Underwriting
O P E R AT I N G U N I T S

Gordon J. Olver, Senior Vice President – UnderwritingJoseph W. Walsh, Senior Vice President – UnderwritingKevin J. Shea, Senior Vice President – Director of ClaimsTodd W. Bolden, Vice President – UnderwritingBarbara A. Connell, Vice President – UnderwritingGraham C. Dickinson, Vice President – UnderwritingOlivia W. Giutini, Vice President – ActuaryJulie K. Halper, Vice President – Chief ActuaryJoan E. Kapfer, Vice PresidentPaul J. Kelly, Vice President – UnderwritingKrystyna H. Miller, Vice President – ClaimsJohn M. Murray, Vice President – ClaimsJohn J. Myers, Vice President – Underwriting
B F Re Underwriters, LLCOne Canterbury Green, Stamford, CT 06901(203) 975-7739 Fax: (203) 975-7749
Daniel L. Avery, PresidentRichard A. Corpus, Executive Vice President Maria W. Anderson, Vice President Scott Balfour, Vice President Frederic C. Cooper, Vice President J. Robert Fender, Vice President Thomas P. Gaughran, Vice President Thomas J. Greenfield, Vice President Gary S. Miller, Vice President L. Randy Miller, Vice President Jeff M. Neher, Vice President Raymond H. Niver, Vice President Catherine P. Schilling, Vice PresidentJoseph J. Vyskocio, Vice President
Chicago, Illinois Irving, TexasTel. (312) 553-4707 Tel. (972) 580-9950
Dublin, Ohio Philadelphia, PennsylvaniaTel. (614) 766-4316 Tel. (215) 568-3570
Duluth, Georgia San Fransisco, CaliforniaTel. (770) 814-7531 Tel. (415) 543-4466
Fidelity & Surety Reinsurance Managers, LLC1901 N. Roselle Road, Suite 575Schaumburg, IL 60195(847) 882-6644 Fax: (847) 882-8711
Roger J. Bassi, PresidentJames H. Taylor, Vice President – ClaimsDiane M. Igielski, Vice President – Underwriting
Berkley Risk Solutions, Inc.475 Steamboat Road, Greenwich, CT 06830(203) 769-4050 Fax: (203) 769-4059
Jeffrey E. Vosburgh, PresidentGregory A. Cuzzi, Senior Vice President & Chief
Actuarial Officer
Robert W. Mathis, Senior Vice President & Chief Marketing Officer
Sally B. Gilmore, Senior Vice President & Chief Administrative Officer
Kenneth M. Roberts, Vice President
Berkley Underwriting Partners, LLC215 Shuman Boulevard, Suite 200Naperville, IL 60563(630) 210-0360 Fax: (630) 210-0376
John S. Diem, PresidentScott R. Wallace, Executive Vice President –
Business DevelopmentJoseph L. Mathews, Executive Vice President –
Chief Financial OfficerKay L. Frerk, Senior Vice President – Chief ActuaryJoseph M. Pojman, Senior Vice President –
Director of ClaimsJoycelyn M. Ray, Vice President – Regulatory Compliance
Gemini Insurance CompanyStarNet Insurance Company475 Steamboat Road, Greenwich, CT 06830(203) 542-3800 Fax: (203) 542-3839
William R. Berkley, President & Chief Executive OfficerLarry A. Hansen, Executive Vice President &
Chief Financial OfficerJohn S. Diem, Executive Vice President Richard P. Shemitis, Executive Vice President –
Gemini Insurance CompanyCarol J. LaPunzina, Senior Vice President – General
Counsel & SecretaryDonald M. McGuire, Senior Vice President &
Treasurer
International
Berkley International, LLC475 Steamboat Road, Greenwich, CT 06830(203) 629-3000 Fax: (203) 769-4098
William R. Berkley, Chairman & Chief Executive OfficerW. Robert Berkley, Jr., Vice ChairmanFernando Correa Urquiza, PresidentEugene G. Ballard, Senior Vice President – Chief Financial
Officer & TreasurerIra S. Lederman, Senior Vice President – General Counsel
& SecretarySteven J. Malawer, Vice President – Associate General
Counsel & Assistant Secretary
O P E R AT I N G U N I T S
65

66
Berkley International Argentina S.A.Carlos Pellegrini 1023, 2nd FloorC1009ABU - Buenos Aires, Argentina54-11-4378 7900 Fax: 54-11-4378 7910
Eduardo I. Llobet, President & Chief Executive OfficerMarcelo R. Crespo, Chief Financial Officer
Berkley International Aseguradora de Riesgos delTrabajo S.A.Carlos Pellegrini 1023, 3rd FloorC1009ABU - Buenos Aires, Argentina54-11-4378 8000 Fax: 54-11-4378 8088
Alejandro Bruce, Chief Executive OfficerEduardo I. Llobet, President
Berkley International Seguros S.A.Mitre 699, S2000COM-Rosario, Argentino54-341-410 4200 Fax: 54-341-425 9802
Carlos Pellegrini 1023, 1st & 2nd FloorsC1009ABU - Buenos Aires, Argentina54-11-4378 8100 Fax: 54-11-4378 8111
Eduardo I. Llobet, President & Chief Executive OfficerOsvaldo P. Borghi, Chief Operating Officer
Berkley International Philippines, Inc.Berkley International Life Insurance Co., Inc.Berkley International Plans, Inc.Family First, Inc.9th Floor, The Enterprise Centre, Tower 26766 Ayala Avenue, corner Paseo de RoxasMakati City, Philippines(632) 755-1500 Fax: (632) 755-1501
Daniel L. Villanueva, Executive Vice President & Chief Financial Officer
Robb S. Paulsen, Executive Vice President & General Manager – Family First, Inc.
Adnelle M. Valeza, Vice President – Information Technology
BI China, LimitedFamily First LimitedFFI Limited41st Floor, RBS TowerTimes SquareCauseway Bay, Hong Kong(852) 3182-6888 Fax: 852-2110-9928
Alan M. Rafe, Managing Director
Global Direct, LLC475 Steamboat Road, Greenwich, CT 06830(203) 629-3000 Fax: (203) 769-4098
Service Operations
Berkley Dean & Company, Inc.475 Steamboat Road, Greenwich, CT 06830(203) 629-3000 Fax: (203) 769-4096
James G. Shiel, PresidentEdward F. Linekin, Senior Vice President Nicholas R. Lang, Vice President James T. McGrath, Vice President
Berkley Capital, LLC475 Steamboat Road, Greenwich, CT 06830(203) 629-3000 Fax: (203) 769-4095
Robert D. Stone, Managing Director
Berkley Technology Services LLC405 Silverside Road, Suite 205, Wilmington, DE 19809(302) 439-2000 Fax: (302) 439-2016
Harry J. Berkley, Vice PresidentKenneth R. McKinion, Vice PresidentRobert L. Boley, Vice President – Customer ServiceJoni L. Gacke, Vice President – Underwriting ServicesWayne L. Robinson, Vice President – Network InfrastructureFrank C. Vedder, Vice President – Core SystemsThomas M. Whelans, Vice President – Operations
Luverne, MinnesotaSioux Falls, South DakotaTel. (507) 283-9195
O P E R AT I N G U N I T S

“ S A F E H A R B O R ” S TAT E M E N T
67
This report may contain forward-looking statements within the meaning of the Private Securities Litigation ReformAct of 1995. Any forward-looking statements contained herein, including statements related to our outlook forthe industry and for our performance for the year 2004 and beyond, are based upon the Company’s historicalperformance and on current plans, estimates and expectations. The inclusion of this forward-looking informationshould not be regarded as a representation by us or any other person that the future plans, estimates or expectationscontemplated by us will be achieved. They are subject to various risks and uncertainties, including but not limitedto, the cyclical nature of the property casualty industry, the long-tail and potentially volatile nature of the reinsurancebusiness, product demand and pricing, claims development and the process of estimating reserves, the uncertainnature of damage theories and loss amounts, increases in the level of our retention, natural and man-made cata-strophic losses, including as a result of terrorist activities, the impact of competition, the availability of reinsurance,the ability of our reinsurers to pay reinsurance recoverables owed to us, investment risks, including those relatingto fixed income securities, merger arbitrage investments, and other equity securities, exchange rate and politicalrisks relating to our international operations, legislative and regulatory developments, changes in the ratings assignedto us by ratings agencies, the availability of dividends from our insurance company subsidiaries, our ability tosuccessfully acquire and integrate companies and invest in new insurance ventures, our ability to attract and retainqualified employees, and other risks detailed from time to time in the Company’s filings with the Securities andExchange Commission. These risks could cause actual results of the industry or our actual results for the year 2004and beyond to differ materially from those expressed in any forward-looking statement made by or on behalf ofthe Company. Any projections of growth in the Company’s net premiums written and management fees would notnecessarily result in commensurate levels of underwriting and operating profits. Forward-looking statements speakonly as of the date on which they are made, and the Company undertakes no obligation to update publicly orrevise any forward-looking statement, whether as a result of new information, future developments or otherwise.
68
WILLIAM R. BERKLEYChairman of the Board and Chief Executive Officer
PHILIP J. ABLOVERetired Executive Vice President and Chief Financial Officerof Pioneer Companies, Inc.
W. ROBERT BERKLEY, JR.Senior Vice President – Specialty Operations
RONALD E. BLAYLOCKFounder, Chairman and Chief Executive OfficerBlaylock & Partners LP (investment banking firm)
MARK E. BROCKBANKRetired Chief Executive of XL Brockbank Ltd.
GEORGE G. DALYFingerhut Professor and Dean EmeritusStern School of BusinessNew York University
RICHARD G. MERRILLRetired Executive Vice President of Prudential InsuranceCompany of America
JACK H. NUSBAUMChairman, Willkie Farr & Gallagher LLP(attorneys at law)
MARK L. SHAPIROPrivate Investor
B O A R D O F D I R E C T O R S A N D O F F I C E R S
WILLIAM R. BERKLEYChairman of the Board and Chief Executive Officer
EUGENE G. BALLARDSenior Vice President – Chief Financial Officer and Treasurer
W. ROBERT BERKLEY, JR.Senior Vice President – Specialty Operations
ROBERT P. COLESenior Vice President – Regional Operations
ROBERT W. GOSSELINKSenior Vice President – Insurance Risk Management
PAUL J. HANCOCKSenior Vice President – Chief Corporate Actuary
ROBERT C. HEWITTSenior Vice President – Alternative Markets Operations
IRA S. LEDERMANSenior Vice President – General Counsel and Secretary
JAMES W. McCLEARYSenior Vice President – Reinsurance Operations
JAMES G. SHIELSenior Vice President – Investments
HARRY J. BERKLEYVice President – Information Technology
EDWARD F. LINEKINVice President – Investments
KENNETH R. McKINIONVice President – Information Technology Operations
CLEMENT P. PATAFIOVice President – Corporate Controller
JOSEPH M. PENNACHIOVice President – Human Resources
JOSEPHINE A. RAIMONDIVice President – Senior Counsel and Assistant Secretary
WILLIAM P. SCOTTVice President – Financial Risk Management
SCOTT A. SIEGELVice President – Taxes
THOMAS P. BOYLEAssistant Vice President – Corporate Actuarial
JOHN CELIDONIOAssistant Vice President – Actuary
RAYMOND J. O’BRIENAssistant Vice President – Director of Internal Audit
BRUCE I. WEISERAssistant Vice President – Counsel
JEAN P. MILOTAssistant Corporate Controller
GEORGE K. RICHARDSONAssistant Treasurer
JANET L. SHEMANSKEAssistant Secretary
JOHN E. WARYCHAAssistant Corporate Controller – Financial Reporting
DAWN M. CALLAHANDirector of Investment Accounting
ROBERT E. SLATTERYDirector of Corporate Information Systems
Directors
Officers

C O R P O R AT E I N F O R M AT I O N
AuditorsKPMG LLPNew York, NY
Outside CounselWillkie Farr & Gallagher LLPNew York, NY
Annual MeetingThe Annual Meeting of Stockholders of W. R. BerkleyCorporation will be held at 1:30 p.m. on May 11, 2004at the offices of W. R. Berkley Corporation,475 Steamboat Road, Greenwich, Connecticut 06830.
Shares TradedCommon Stock of W. R. Berkley Corporation istraded on the New York Stock Exchange.Symbol: BER
Transfer Agent and RegistrarWells Fargo Bank, N.A.Shareowner Services161 N. Concord ExchangeP. O. Box 64854South St. Paul, MN 55075Tel. (800) 468-9716
Annual Report on Form 10-KThe Annual Report on Form 10-K filed with theSecurities and Exchange Commission contains addi-tional financial and other information with respect toW. R. Berkley Corporation. Copies of the Form 10-Kwill be furnished to stockholders upon request. Pleasedirect all inquiries to:
Ira S. LedermanGeneral Counsel and SecretaryW. R. Berkley Corporation475 Steamboat RoadGreenwich, Connecticut 06830.
Web SiteFor additional information, including press releases,visit our internet site at:
http://www.wrberkley.com

W. R. Berkley Corporation475 Steamboat Road
Greenwich, CT 06830
203 629 3000
www.wrberkley.com