w203 on the use of deming and quadratic calibrations in ... · on the use of deming and quadratic...
TRANSCRIPT

On the use of Deming and quadratic calibrations in analytical chemistry
Henry Foden
Rand Water
October 09-2013
PO Box 3526, Vereeniging, 1930, Republic of South Africa
e-mail: [email protected]
Phone: 016 430 8849 Fax: 016 455 2055

• Introduction• The objective of this presentation is to introduce the audience
to instrumental calibration techniques which are less familiarthan the traditional linear calibration techniques normally usedin analytical chemistry.
• These include
• 1) The Deming regression.
• 2) The quadratic regression.
• Purpose• The calibration (regression) techniques already mentioned
carry advantages associated with their use which are notavailable from those associated with linear regressionmethods.

• Challenges
• Modern high volume production laboratories face many challenges. These include technical, quality control (QC), and production (sample load) issues. Consequently, analysts are faced with ever increasing demands for faster analytical turnaround times, increasingly strict quality control measures, lower detection limits, greater numbers of samples for analysis and more analytes per sample than was previously the case.
•
•Given that any laboratory has only a given quantity of resources in terms of available finances, laboratory staff, analytical instrumentation and ancillary equipment; it becomes obvious that methodologies for reducing the overall workload which are acceptable from a technical and QC point of view, become targets for investigation.
•
•On the purely technical side of chemical analysis, stricter demands on QC practices by governmental and other statutory bodies occasionally require innovative solutions to satisfy their requirements.
•
•Objectives
•The purpose of this presentation is to give an overview of two of the potential solutions to the issues mentioned above, both of which use regression methods which differ from the classical linear calibration techniques commonly used in analytical chemistry.

1 - The Deming regression
• This takes the point of view that unlike a least linear curves approximation to a linear calibration, where all uncertainty is attributed to that which is contained in the ordinate (i.e. the Y axis of a graph normally containing the raw instrument response), that a portion of the uncertainty is also present in the abscissa (i.e. the X axis of the graph normally containing the concentration of standards used for instrument calibration). This relationship has found realistic application in these laboratories for the calibration of microsyringes used for sample and reagent dispensing in discrete analysers and graphite furnace atomic absorption spectrometers for the definitive calibration of microsyringes, such as those having capacities of 100 µl or less.

The calibration of micropipettes
• Many modern analytical instruments utilise microsyringes for dispensing known volumes of sample as well as for the autodilution of a high level standard to produce calibration standards. Examples include discrete analysers, graphite furnace atomic absorption spectrometers and chromatographic instruments.
• Using traditional gravimetric methods for the determination of the accuracy of microsyringes is sometimes impractical due to the small volumes of liquid involved as well as the possibility that they are built into the instrument and are not readily removable by an analyst. In addition, the syringes have to normally have to be removed from the instrument and may not have a convenient hypodermic syringe adaptor.

Practical determination - 1
• In order to determine the accuracy of the microsyringe of a graphite furnace atomic absorption spectrometer (GFAA) autosampler, the technique outlined below was performed utilising the element selenium as the test analyte. The instrument was a Thermofisher iCE 3000 series GFAA.
• The instrument was calibrated from 0-50 µg/l as normal using the autodiluter to produce the standards from the master standard, which had a concentration of 50 µg/l. A second set of standards of the same concentrations as the calibration standards was then analysed. These standards however were manually prepared and then ran as analytical unknowns. They were prepared from the same stock solution as the autodiluter calibration standard to minimise the number of experimental variables.

Practical determination - 2
• The absorbance data for the two sets of “calibration” datawere then analysed using the Deming model II linearregression. As both data sets were obtained via the samemethod, they were assumed to possess equal uncertainties.The commercially available statistical package GraphPadPrism4 was used to performthe Deming regression.
• In table 1 below, the output absorbance of the autopipetted and the manually prepared standards as a function of concentration are shown.
• The output data from Graphpad was then pasted into EXCEL, and t and F tests performed.

Se concentration
µµµµg/lMicrosyringe standard
absorption values
Manual standard
absorption values
0 0.008 0.009
10 0.143 0.144
20 0.296 0.313
30 0.437 0.453
40 0.59 0.635
50 0.748 0.735
Table 1. Absorption values for manual and autosampler prepared standards

Microsyringe Manual
Mean 0.381500001 0.370333337
t Stat 0.363699994
P(T<=t) one-tail 0.358233107
t Critical one-tail 1.652508101
Table 2 - t-Test: Two-Sample Assuming Equal Variances

Microsyringe Manual
Mean 0.381500001 0.370333337
F 1.0236831
P(F<=f) one-tail 0.453532459
F Critical one-tail 1.391719552
Table 3 - F-Test:

Statistical summary of results for microsyringe calibration
• As no statistically significant differences are shownbetween the results of the t and of the F tests for the twodifferent calibration methods, it is therefore proven that themicrosyringe is accurate.
• It should be noted that the Deming regression allows for theinput of the standard deviation of replicate samples, thusalso making it a powerful tool for the comparison ofdifferent methods for the analysis of the same analyte. Inthis case, this was unnecessary as the analytical method(and specific instrument) was the same for both sets of dataobtained. Both sets of data were obtained fromthe sameanalytical run.

2 - The Quadratic calibration
• It has long been the practice in analytical chemistry and chemometrics courses for instrumental methods of analysis, to present topics related to the determination of the linear range of an analytical method together with the required statistical background. Such topics would naturally include correlation methods e.g. the method of least linear squares, and, in more advanced courses, the methods attached to the determination of the uncertainty of regression, and suitable analytical spacing of the calibration standards. Although seldom explicitly stated as such, these didactic methods leave an implicit assumption unstated, namely that other methods of calibration are unacceptable.

The Quadratic calibration
• Whilst objections have been raised to the practice of quadratic calibration, it has been conclusively shown in these laboratories that when used in conjunction with well-defined ISO practices and statistical procedures, and despite algebraic difficulties which may arise during the course of the determination of more difficult analytical parameters e.g. the uncertainty of calibration regression of the method, that these may be easily overcome on a routine basis.

• Main references used in this section of the presentation
• South African National Standard SANS 8466-2:2002, Water quality-Calibration and evaluation of analytical methods and estimation of performance characteristics, Part 1: Statistical evaluation of the linear function. pp 5.
• South African National Standard SANS 8466-2:2002, Water quality-Calibration and evaluation of analytical methods and estimation of performance characteristics, Part 2: Calibration strategy for non linear second-order calibration functions. pp 7.

• Quadratic regressions - 1
• The calibration of an instrument may be viewed as the analysis of a series of standards of known concentration to obtain an instrument output for each of the standards. The derivation of a defined mathematical formula relating the magnitude of the instrument output to the standard concentration, normally utilising a mathematical regression technique, results in an equation by which the instrument output for unknown samples can then be utilised to calculate the analyte concentration.
•• Given that a linear calibration methodology has been the
traditional and mathematically simpler approach, it is reasonable to examine the underlying reasons for the selection of a quadratic approach.

Quadratic regressions - 2
• Accredited laboratories which are primarily involved in high sample throughput routine analytical work, with tight deadlines on turnaround time require analytical procedures which are as simple and fast as possible, whilst bearing in mind the technical and quality control requirements of the specific analysis. As a natural corollary of this requirement, analytical procedures with simple sample preparation procedures would naturally be preferred over those with more complex preparation procedures.

Quadratic regressions - 3
• In some cases where the linear dynamic range of a method is high, covering many orders of magnitude, e.g. ICP-OES or ICP-MS, quadratic calibrations may be unnecessary, however other methods e.g. those which are colorimetrically or atomic absorption based which have relatively low linear dynamic ranges can benefit greatly from the use of quadratic calibrations.
• Fundamentals of linear a quadratic equations
• These are shown below in equations one and two
• � � � � �� Equation 1 Linear equation
•• � � � � �� � ��� Equation 2 Quadratic equation
•• By way of example, figuires 1 and 2 show the linear and
quadratic calibrations for the analysis of potassium in sewage samples by flame atomic absorption utilising a high range calibration methodology. Table 5 contains the raw data upon which the two calibrations are based.

Calibration 1 Nominal concentration mg/l Absorbance
K Blank 0 0.0027
Standard 1 20 0.3116
Standard 2 40 0.5847
Standard 3 60 0.8073
Standard 4 80 0.9694
Standard 5 100 1.0826
Table 4 – Raw data for Potassium calibrations

• Linear calibration for high range K analysis

• Quadratic calibration for high range K analysis

Table 5 – Raw data for Potassium calibrations
Calibration
points
Top calibration
standard mg/l R
SquaredR
1N/A
N/A N/A
2N/A
N/A N/A
340
0.9987 0.9994
460
0.9948 0.9973
580
0.9858 0.9929
6100
0.9715 0.9856
•If we sequentially remove the calibration points from the high concentration end of the calibration curve, we obtain the information in table 6.•••

• As can be readily seen in the two previous graphs of the linear and quadratic approaches to the regression analysis presented in the data, the quadratic approach leads to substantially higher correlation coefficients than the linear approach.

• Accuracy of quadratic calibrations
• Possibly the most critical question that can be asked of anycalibration technique is howaccurate is it? In order to answerthis question, test samples spreading across the analyticalrange consisting of a certified reference standard (CRM), aspiked sewerage sample, together with mid and high rangeQC verification standards were analysed.

• Accuracy of quadratic calibrations
PARAMETER K
Mean analysed value of CRMs mg/l 8.316Accuracy of CRMs. % 102.80Bias of CRMs. % +2.80
Manufacturers certified value mg/l 8.09
Manufacturers specified standard deviation mg/l 0.572Calculated Z Score 0.395Manufacturers acceptance limits mg/l 6.37 – 9.80
Table 6 – Analysis of CRM RTC QCI-046 Lot 015740/015741

• Accuracy of quadratic calibrations
To establish the accuracy at higher analytical levels (± 30 mg/l), samples of sewerage were analysed with and without spike addition. The spiking was performed as follows; A 100 ml volumetric flask was rinsed out with sample and then approximately half filled with the sample. 2 ml of 1000 mg/l K standard was added with a piston pipette. The flasks were then made up to the mark with the sample, mixed and used for spike recovery tests. The data obtained is in table eight below.

• Accuracy of quadratic calibrationsTable seven
CONCENTRATION OF UNSPIKED SAMPLE mg/l 10.591
MEAN VALUE OF SPIKED SAMPLE mg/l 31.210
SIGMA 0.607
R.S.D. % 1.944
MAXIMUM
mg/l 32.032
MINIMUM
mg/l 30.211
SPIKE RECOVERY % 102.73

• Table eight – accuracy of a 50 mg/l K standard
Accuracy of Q.C. verifications % 102.231
R.S.D. OF Q.C. verifications % 1.552
Bias of Q.C. verifications %+ 2.231
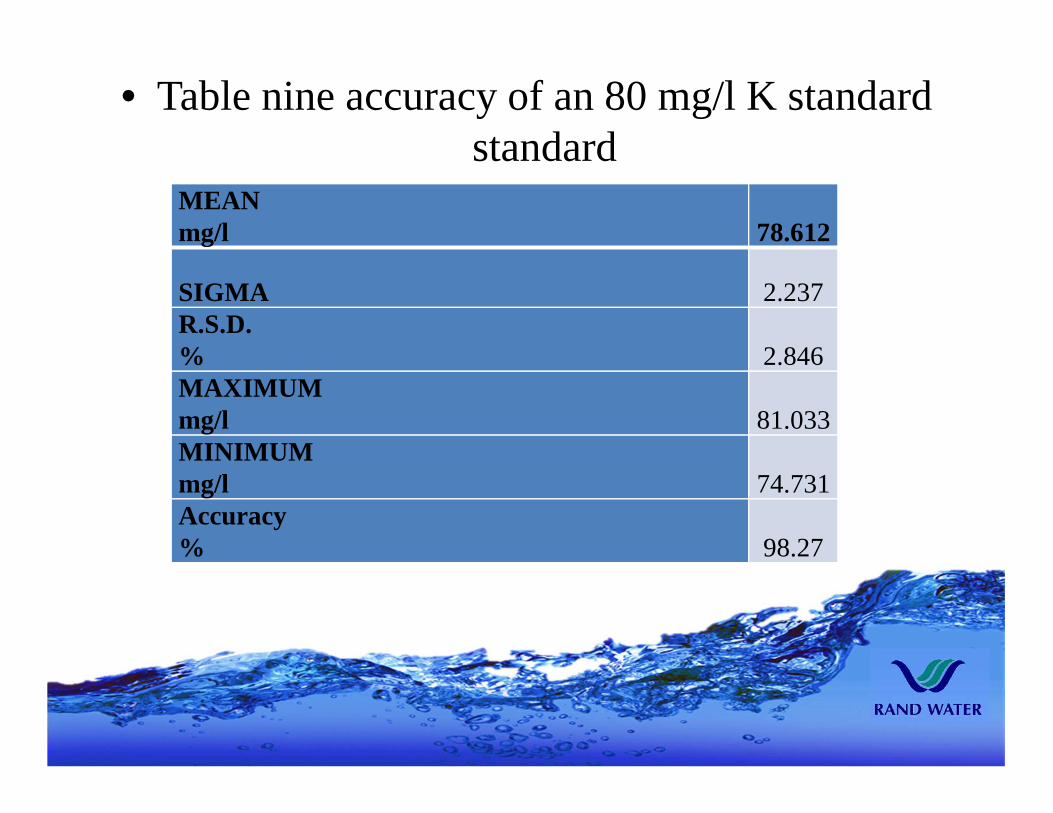
• Table nine accuracy of an 80 mg/l K standard standard
MEAN mg/l 78.612
SIGMA 2.237R.S.D. % 2.846MAXIMUM mg/l 81.033MINIMUM mg/l 74.731Accuracy % 98.27
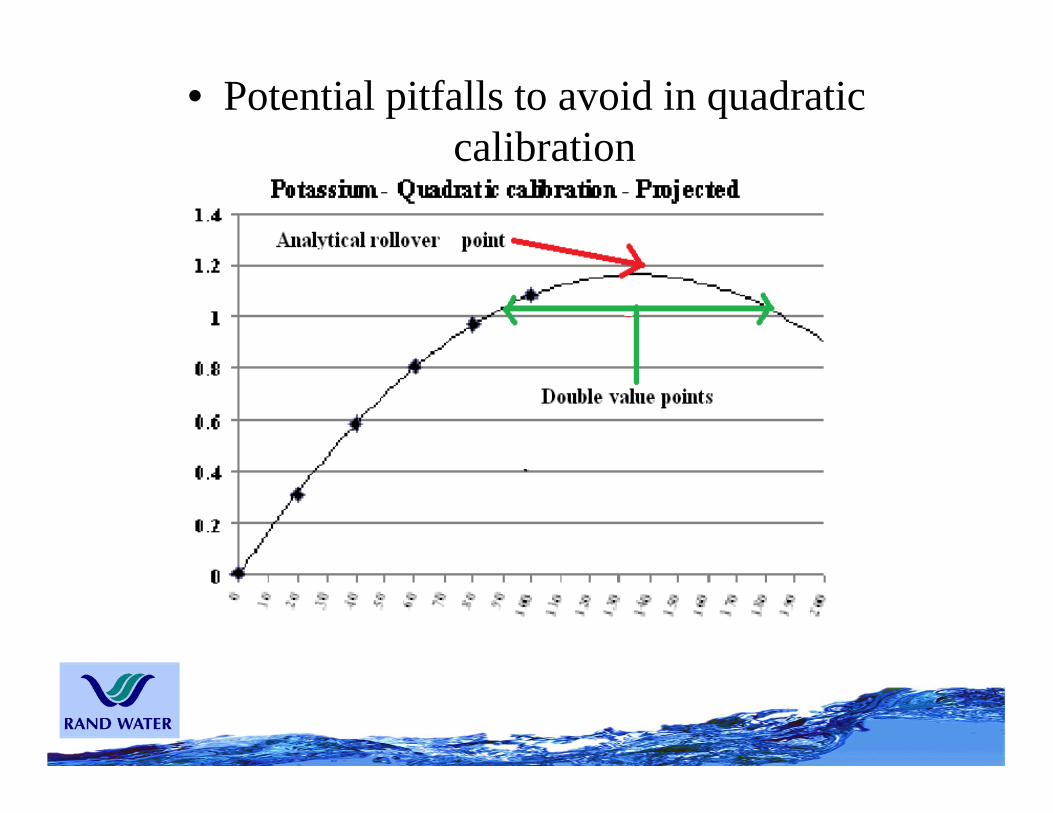
• Potential pitfalls to avoid in quadratic calibration

• Potential pitfalls to avoid in quadratic calibration
•Samples with concentrations higher than the analytical rolloverpoint will be incorrectly interpreted by the instrument softwareas have a lower value than is actually the case, therefore cautionhas to be observed using the quadratic method, and the samplesanalysed should preferably have been historically wellcharacterised to ensure that they fall within the methodcalibration range. In cases of doubt, it is preferable to dilute thesample prior to analysis.

• CONCLUSIONS – DEMING REGRESSIONS
• The Deming technique is both a mathematically and analytically elegant method for the determination of the accuracy of microsyringes for instrumental analysis as it is used without removal of the syringe from its position in the instrument. As all test samples are analysed with the syringe in position, leading to analytically realistic results as the output obtained from the instrument are directly used as the input for statistical analysis.
•• Quadratic calibration, although somewhat more complex for
the determination of uncertainty budgets, where the uncertainty of calibration regression is required, are still relatively easy to perform, and result in the extension of analytical range. This leads to material savings in terms of resource requirements due to the smaller amount of dilutions required when samples which exceed the calibration range of a

• CONCLUSIONS – QUADRATIC REGRESSIONS
• Quadratic calibration, although somewhat more complex for the determination of uncertainty budgets, where the uncertainty of calibration regression is required, are still relatively easy to perform, and result in the extension of analytical range. This leads to material savings in terms of resource requirements due to the smaller amount of dilutions required when samples which exceed the calibration range of a linearly calibrated method are used.

THANK YOU
Are their any questions?