wafs word 2. menu - international civil aviation organization material... · wafs_word 2. menu 2.1...
TRANSCRIPT

Published by Articulate® Storyline www.articulate.com
WAFS_Word
2. Menu
2.1 Untitled Slide

Published by Articulate® Storyline www.articulate.com
1. Introduction
1.1 Introduction
Notes:
As you will probably be aware, the traditional significant weather forecasts,
usually seen in chart form, provide only limited information about CB cloud,
Icing and Turbulence. They are also only produced for a single timestep every
6 hours, which means that for short-haul flights the latest information is not
being used and for very long-haul flights the charts do not go far enough
ahead to be useful.
The new grid point forecasts for CB cloud, Icing and Turbulence go some way
to addressing these problems.
They were first proposed at the ICAO/WMO divisional meeting in 2002 in
response to a requirement from the International Air Transportation

Published by Articulate® Storyline www.articulate.com
Association.
They are primarily designed for use in computerised flight planning systems.
The development of the forecasts has been overseen by the World Area
Forecasts Systems Operations Group of ICAO (which is usually pronounced I K
O).
So what is new about the grid point forecasts for CB cloud, Icing and Turbulence and how can they help you in your role?
1.2 Introduction
Notes:
The traditional sig weather forecasts are only produced for a single timestamp
whereas the new gridded forecasts mean that information is available at 3
hour timesteps from 6 to 36 hours ahead, and is updated every 6 hours.

Published by Articulate® Storyline www.articulate.com
In addition, the gridded forecasts are now available globally at all timesteps
whereas on the sig weather forecasts, icing forecasts were only provided for
limited geographical areas.
The new gridded forecasts of CB cloud, Icing and Turbulence consist of grid
point data at multiple vertical levels that cover the entire globe.
They are produced for the same grid points as the WAFS wind, temperature
and humidity forecasts.
This means that users will always have the latest information, relevant to the
flight, wherever it is flying.
This is a significant improvement on the traditional forecasts.
1.3 Introduction
Notes:
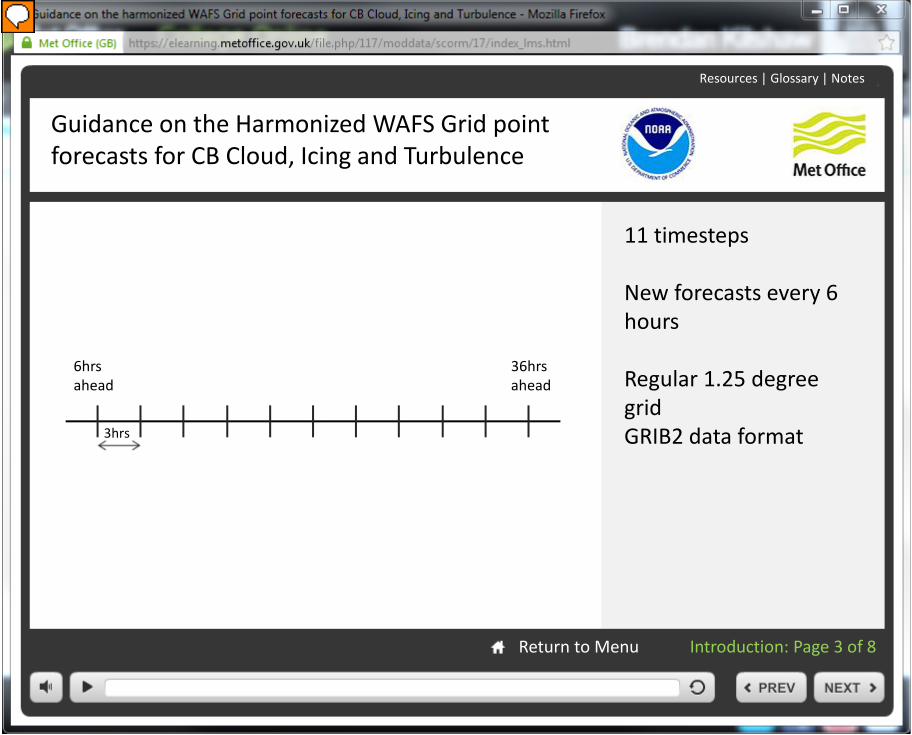
The grid point forecasts are produced for 11 time steps at 3 hourly intervals from 6

Published by Articulate® Storyline www.articulate.com
hours ahead to 36 hours ahead. A new forecast is issued every 6 hours. The forecasts use a regular one and a quarter degree grid and are issued in the GRIB2 data format
1.4 Introduction
Notes:
So how do you get access to this data?
The two WAFCs make this data available over the internet via the Secure
SADIS FTP service and WIFS.
The data will also be added to the SADIS 2G Satellite broadcast from
November 2013.
Some users may receive their data via a third party provider.
If you already have a SADIS, WIFS or user developed workstation to access WAFS GRIB data, then your service provider should be able to provide you

Published by Articulate® Storyline www.articulate.com
with a software upgrade to be able to use the new products.
1.5 Introduction
Notes:
In order to harmonise the data from the two WAFCs, the CB, ICING and
Turbulence data has some extra processing carried out on it.
It is therefore important to note that, due to this extra processing, the CB, Icing and Turbulence grid point forecasts are made available about 120 minutes after the wind, temperature and humidity data.

Published by Articulate® Storyline www.articulate.com
1.6 Introduction
Notes:
So how should the new grid point forecasts be used?
The WAFCs produced WAFS upper-air grid point forecasts are primarily
intended for use in flight planning.
So, for example, wind and temperature forecasts can be used to calculate the
most efficient fuel burn for an aircraft, while relative humidity forecasts are
traditionally used to indicate areas at risk of icing in extended time diversion
operations.
The new Icing forecasts can be ingested directly into automatic flight planning
systems and diversion calculations carried out using this data rather than the
relative humidity forecast.
The new data will allow forecasters to show customers where Icing,
Turbulence or areas of CB cloud are most likely.

Published by Articulate® Storyline www.articulate.com
These forecasts are provided in digital format, in GRIB2 code form and are designed to be integrated directly into automatic flight planning systems.
1.7 Introduction
Notes:
The Operators - usually the airlines - need to define their requirements for
making use of the grid point forecasts with their own service providers
according to their own business models and safety risk management plan.
For example, if an airline wants to avoid an area of Frequent CB around a
tropical storm, then the flight plan provider will know to route the aircraft
around the area of frequent CB, so avoiding the hazardous weather.
In this example, the customer has agreed a threshold of 0.7 with the service
provider, so that any area with CB coverage of greater than 0.7 could be
avoided in the flight plan.

Published by Articulate® Storyline www.articulate.com
So, Dispatchers, pilots and flight briefing providers need to be aware of what thresholds their suppliers have utilised when using these forecasts.
1.8 Introduction
Notes:
Although the WAFCs support the flight documentation requirements of Annex 3 by providing WAFS Significant Weather forecasts as well as upper-air wind, temperature and humidity grid point forecasts, the WAFCs do not provide visualizations of upper-air gridded CB clouds, icing and turbulence forecasts in support of flight documentation.
This is referred to in chapter 9 of Annex 3.

Published by Articulate® Storyline www.articulate.com
3. About the data
3.1 Data values: CB Cloud
Notes:
So, let's take a look at the data in more depth.
The forecasts of CB cloud use an algorithm that is based on cloud amount
and precipitation intensity
The horizontal extent of CB cloud in each grid box is given a value between
zero and 1.
A figure of 0.5 implies 50% coverage of CB cloud in that grid box.
A grid box is 1.25 degrees latitude by 1.25 degrees longitude in size.
Examples of how this data appears when visualised can be seen in section 3.

Published by Articulate® Storyline www.articulate.com
3.2 Data values: CB Cloud
Notes:
The base and top of the CB cloud are calculated in Flight levels and then
converted to metres above mean sea level.
Note that all heights given in WAFS Forecasts are relative to the ICAO Standard Atmosphere.

Published by Articulate® Storyline www.articulate.com
3.3 Data values: Icing
Notes:
This a new method of deriving Forecasts of Icing conditions.
The icing algorithms are based on a combination of cloud condensate (both
ice and water), temperature, relative humidity and vertical motion parameters
that predict the presence of super-cooled liquid water.
The values range from 0 to 1 and are a potential for the presence of icing.

Published by Articulate® Storyline www.articulate.com
3.4 Data values: Icing
Notes:
Because there are no routine measurements of Icing by aircraft it is not currently possible to accurately provide a probability of Icing or indicate the severity of Icing within the forecasts.
The WAFCs therefore use the term potential to indicate the likelihood of encountering Icing conditions at a particular location and time.
So,
the higher the value of icing potential, the greater the risk of encountering icing.

Published by Articulate® Storyline www.articulate.com
3.5 Data values: Icing - vertical levels
Notes:
Icing Forecasts are produced for 6 vertical layers.
These layers are 100 hectopascals deep and 100 hectopascals apart.
Approximate equivalent flight levels for each of the layers are given in the table.

Published by Articulate® Storyline www.articulate.com
3.6 Data values: Clear Air Turbulence
Notes:
Clear Air Turbulence is derived via an algorithm that is based on the Ellrod
Index. The Ellrod Index results from an objective technique for forecasting
clear-air-turbulence.
The index is calculated based on the product of horizontal deformation and
vertical wind shear derived from numerical model forecast-winds aloft.
Terrain-induced turbulence is also included within the index.
The theoretical limit to the data range is from zero to 99, but most of the values are less than 40.

Published by Articulate® Storyline www.articulate.com
3.7 Data values: Clear Air Turbulence
Notes:
The numerical value of CAT Potential is not a probability because there are
insufficient observations in order to calibrate the forecasts.
However, the higher the value, the greater the risk of encountering turbulence.
Due to lack of detailed observations it is not currently possible to indicate severity of turbulence.

Published by Articulate® Storyline www.articulate.com
3.8 Data values: Clear Air Turbulence - vertical levels
Notes:
CAT Forecasts are produced for 6 vertical layers.
These layers are 50 hectopascals deep and 50 hectopascals apart.
Approximate equivalent flight levels for each of the layers are shown in the right column of the table.

Published by Articulate® Storyline www.articulate.com
3.9 Data values: In-cloud turbulence
Notes:
There is also forecast data for turbulence in clouds.
The algorithms are based on the model indicating the presence of a cloud,
and the change in potential energy with height, which is a measure of
instability.
The range of values in the data is from zero to 1 and are a potential for encountering in-cloud turbulence.

Published by Articulate® Storyline www.articulate.com
3.10 Data values: In-cloud Turbulence - vertical levels
Notes:
The in-cloud turbulence Forecasts are produced for 5 vertical layers, each having a depth of 100 hectopascals

Published by Articulate® Storyline www.articulate.com
3.11 More details
Notes:
More details on all the GRIB2 forecast parameters, including the number of files and header information can be found on the ICAO website.

Published by Articulate® Storyline www.articulate.com
3.12 Data values: Maximum and Mean values
Notes:
The native resolution of the forecast models run by the WAFCs is much finer
than the 1.25 degree resolution of the WAFS grid point forecasts.
To provide some information on the variability of the data within each grid box, a maximum and mean value is calculated for each grid square for the Icing, Clear Air Turbulence and in cloud turbulence forecasts.

Published by Articulate® Storyline www.articulate.com
3.13 Data values: Maximum and Mean values
Notes:
This slide is designed to illustrate the variability of data values that may occur
within a single WAFS grid box.
In this example, we show a single grid box, 1.25 by 1.25 degrees in size.
Within this one grid box the finer detail from the native model shows that
values of CAT potential range between zero and 10.
The maximum value in the grid box is 10 and the mean value in the grid box
is 3.
These two figures are disseminated as the forecasts of Maximum CAT and
Mean CAT.
This interpolation is done by the WAFCs during production of the forecasts and aims to provide information about the variability of the data within each grid box.

Published by Articulate® Storyline www.articulate.com
3.14 Data values: Number of files
Notes:
This table shows the number of different files that are produced for each of
the forecast parameters.
Note that there are two icing parameters - mean icing and maximum icing
Two “in-cloud” turbulence parameters - a mean and a maximum
Two clear air turbulence parameters - mean and maximum
And three CB cloud parameters - horizontal extent, CB cloud base height, and
CB cloud top height.
With 11 timesteps, there are 407 data files in total.

Published by Articulate® Storyline www.articulate.com
3.15 Data values: Harmonization
Notes:
A harmonization process is carried out to provide consistency between the
WAFC London and WAFC Washington datasets.
It is effectively a two-member ensemble of WAFS forecasts.
Before issuance, the WAFC London and WAFC Washington forecasts are
harmonized using an identical process.
For each parameter, timestep and pressure level the ‘mean’ forecast values are
calculated from the ‘mean of the two means’ and the ‘maximum’ forecasts are
calculated from the ‘higher of the two maxes’.
This is done for the CAT, Icing and In cloud turbulence forecasts.
For CB horizontal extent the maximum value from the two forecasts is taken.
For CB top - the higher of the two values is used.

Published by Articulate® Storyline www.articulate.com
And for CB base - the lower of the two values is used.
3.16 Data values: Harmonization
Notes:
On rare occasions the harmonization process may not occur.
If the harmonization process fails, each WAFC then makes available its
independent forecasts.
A WAFS administrative message will be issued to notify users that,
independent, that is, unharmonized, forecasts have been issued.
You should always ensure you can access the latest Admin Messages on your
workstation.

Published by Articulate® Storyline www.articulate.com
To see examples of an administrative message please click on the resources
link in the top right of the screen.
4. Using the data
4.1 Introduction (i)
Notes:
The gridded forecasts of CB Cloud, Icing and Turbulence are quite different
from the traditional significant weather forecast issued by the WAFCs. The
differences are descibed in the next few slides, in particular, the user has
much more choice as to how the information can be used and visualised.

Published by Articulate® Storyline www.articulate.com
4.2 Introduction (i)
Notes:
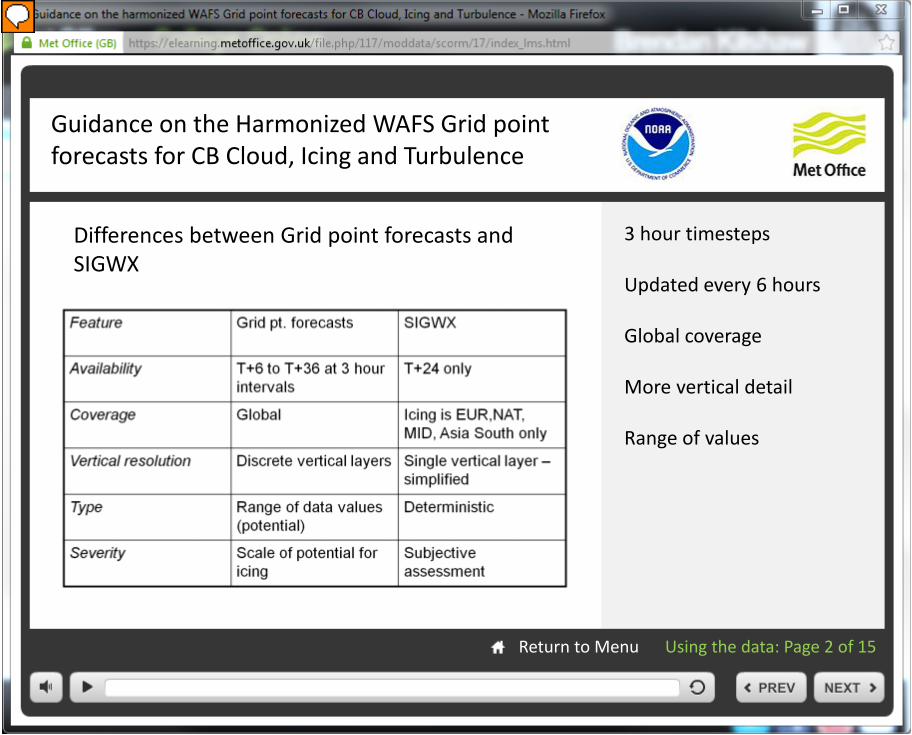
In this table, we show some of the main differences between the new grid
point forecasts and the traditional significant weather forecasts.
First, the new forecasts are available at 3 hour timesteps whereas the sig
weather are only available for one timestep at T+24.
The new forecasts are also updated every 6 hours.
The new forecasts have global coverage whereas Icing was only previously
available over limited areas.
The new forecasts give more detail on the vertical distribution of the
phenomena.
And a range of values is given for Icing and Turbulence which provides more detail on the risk of encountering these phenomena.

Published by Articulate® Storyline www.articulate.com
4.3 Introduction (i)
Notes:
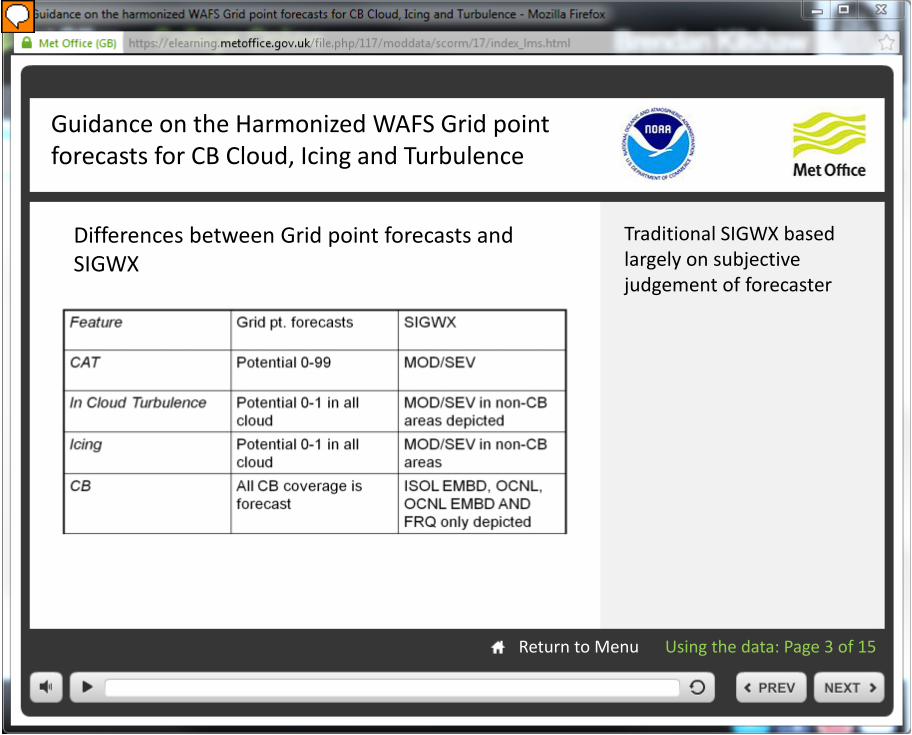
It should be borne in mind that while the traditional significant weather forecasts try to indicate moderate or severe categories of Icing and Turbulence this is based largely on a subjective judgement of the forecaster. The icing and turbulence potential values are based on an objective assessment of the risk of encountering these phenomena. At the present time it is not possible for these gridded forecasts to indicate the severity or probability of encountering icing or turbulence.

Published by Articulate® Storyline www.articulate.com
4.4 Introduction (i)
Notes:
Areas depicted by the gridded data will be different from and more
fragmented than the smooth shapes shown on Significant weather charts.
Users may choose what to visualise depending on their operational
requirements.
Software providers should choose appropriate thresholds using the guidance on the next few slides.

Published by Articulate® Storyline www.articulate.com
4.5 Introduction (i)
Notes:
The Maximum CAT forecasts are more discerning in identifying areas of higher
CAT potential than the Mean forecasts. Verification of the forecasts has shown
that the Maximum CAT forecasts have greater skill than the Mean CAT field.
A threshold of around 4 to 6 is recommended for the depiction of moderate
or greater CAT. So, for example, a visualisation of areas of CAT with a value of
5 or more can be used to show areas where moderate or greater turbulence
is expected.
The CAT algorithm performs best near Jet streams and areas of strong wind shear but not so well in areas of lighter winds, for example, near the tropics.

Published by Articulate® Storyline www.articulate.com
4.6 Introduction (i)
Notes:
Verification statistics, based on limited data have been produced that show
the hit rate and false alarm rate for encountering moderate or greater
turbulence above certain thresholds.
For example, for a CAT value of 6 or more, the hit rate can be expected to be
0.43 and the false alarm rate 0.11. In other words for a CAT value of 6 or
more, you can expect 43 per cent of observed occurrences of CAT to be
forecast and for turbulence to be forecast on 11 per cent of occasions when
turbulence is not observed.
Users may wish to use their own thresholds to meet their own operating requirements.

Published by Articulate® Storyline www.articulate.com
4.7 Introduction (i)
Notes:
For Icing, threshold data is based on use of the more conservative ‘maximum’
Icing field.
A threshold of 0.1 is recommended for avoidance of any icing in Extended
Diversion Time (EDTO) planning.
While a threshold of 0.7 gives similar areas of coverage to the areas of icing shown on significant weather charts.

Published by Articulate® Storyline www.articulate.com
4.8 Introduction (i)
Notes:
Here are some verification statistics that show the Hit rate and false alarm rate
for encountering icing above different thresholds at Flight Level 100.
For an Icing threshold value of 0.1 or more, the hit rate can be expected to be 0.9, equating to 90% and the false alarm rate is 0.155 equating to 15.5%.

Published by Articulate® Storyline www.articulate.com
4.9 Introduction (i)
Notes:
For CB clouds, the Threshold data is based on the harmonized ‘maximum’
horizontal extent.
A Threshold of 0.5 approximates the area of coverage of OCNL CB shown on Significant weather charts.

Published by Articulate® Storyline www.articulate.com
4.10 Introduction (i)
Notes:
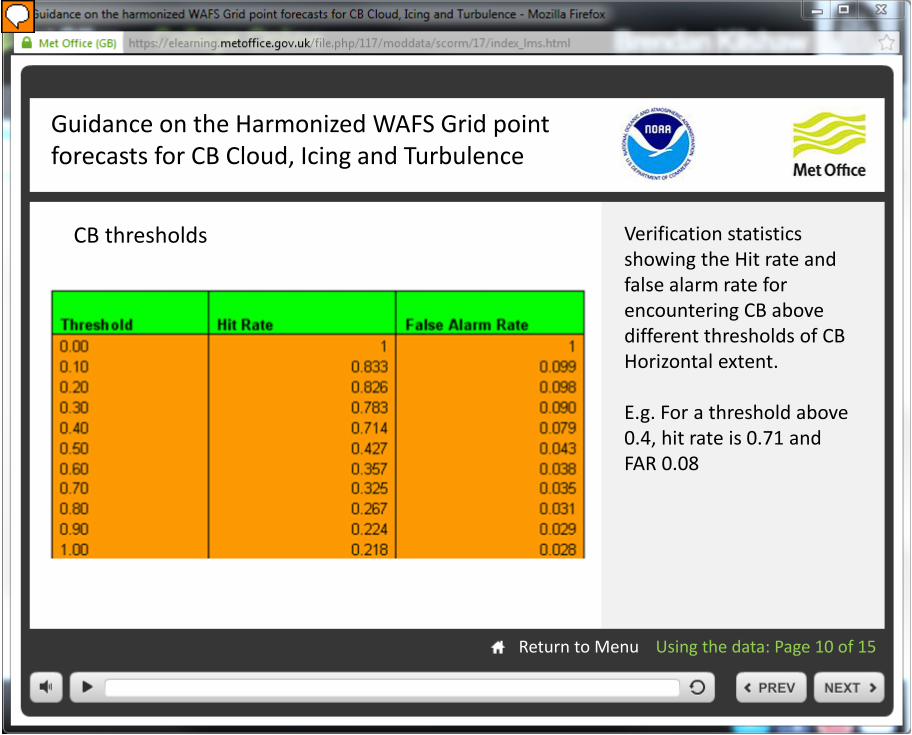
Here are some verification statistics that show the Hit rate and false alarm rate
for encountering CB clouds above different thresholds ‘CB Horizontal Extent’.
For a threshold value of 0.4 or more, the hit rate can be expected to be 0.71, equating to 71% and the false alarm rate 0.08, equating to 8%.

Published by Articulate® Storyline www.articulate.com
4.11 Introduction (i)
Notes:
The WAFCs do not provide visualisations of the WAFS Grid point forecasts.
Users will need to contact your SADIS or WIFS workstation provider if you
require software to display the WAFS Grid point forecasts.
Some examples of visualised WAFS grid point forecasts follow, these have been provided by the US National Weather Service.

Published by Articulate® Storyline www.articulate.com
4.12 Introduction (i)
Notes:
This visualisation shows areas of Clear Air turbulence in colours from yellow to
red overlaying a depiction of jet streams in blue to purple where wind speeds
are greater than 60 knots
The dark red area identified over the North Atlantic has a much higher potential (value more than 20) for moderate or severe CAT than other areas on the chart. An airline that wanted to avoid areas of CAT because of a fragile cargo could be routed to avoid these areas of higher potential CAT.

Published by Articulate® Storyline www.articulate.com
4.13 Introduction (i)
Notes:
This visualisation is of areas of Icing at Flight Level 100 using a threshold of
0.7 or greater.
The WAFCs recommend using a threshold of 0.1 to avoid all areas of potential Icing. This would be useful for Extended Time Diversion Operations.

Published by Articulate® Storyline www.articulate.com
4.14 Introduction (i)
Notes:
This is a visualisation of the location of CB clouds where coverage is more
than 0.5 with cloud tops in Flight levels depicted by greyscale.
The light area identified in white has forecast CB tops above FL450.
The dark area identified has Cb tops forecast to be no higher than FL300.

Published by Articulate® Storyline www.articulate.com
4.15 Introduction (i)
Notes:
The WAFCs are committed to a programme of continuous improvement to
the WAFS forecasts.
In particular, the availability of more observations of turbulence and icing will
allow the calculation of probability and severity and allow the verification to
be extended globally.
Further development of the algorithms are planned over the next few years
which will improve the information to satisfy user requirements.
Comments and feedback on this user guide are welcomed.
A webpage has been set up for the receipt of and responses to feedback - to
subscribe please go to the address listed.
Thank you for making use of this training tool. We hope it has been useful to you.

Published by Articulate® Storyline www.articulate.com

Guidance on the Harmonized WAFS Grid point forecasts for CB Cloud, Icing and Turbulence
Introduction About the Data Using the Data
WAFC London and WAFC Washington May 2013

Guidance on the Harmonized WAFS Grid point forecasts for CB Cloud, Icing and Turbulence
Resources | Glossary | Notes
Return to Menu Introduction: Page 1 of 8
Traditional Sig Weather Forecasts: • Limited CB, Icing and Turbulence data • Single Timestep
2002 requirements for more detailed forecasts ICAO WMO
2002

Guidance on the Harmonized WAFS Grid point forecasts for CB Cloud, Icing and Turbulence
Resources | Glossary | Notes
Return to Menu Introduction: Page 2 of 8
New gridded forecasts: Available at 3 hour timesteps from 6 to 36 hours ahead Available globally
All timestamps Global
Guidance on the Harmonized WAFS Grid point forecasts for CB Cloud, Icing and Turbulence
Resources | Glossary | Notes
Return to Menu Introduction: Page 3 of 8
11 timesteps New forecasts every 6 hours Regular 1.25 degree grid GRIB2 data format
3hrs
6hrs ahead
36hrs ahead

Guidance on the Harmonized WAFS Grid point forecasts for CB Cloud, Icing and Turbulence
Resources | Glossary | Notes
Return to Menu Introduction: Page 4 of 8
So how will I access this data?
WAFCs Nov 2013
Secure SADIS FTP
WIFS
You You You
SADIS 2G Satellite broadcast
Third party provider
You?

Guidance on the Harmonized WAFS Grid point forecasts for CB Cloud, Icing and Turbulence
Resources | Glossary | Notes
Return to Menu Introduction: Page 5 of 8
Extra processing means the grid point forecasts are made available approximately 120 minutes after the wind, temperature and humidity data.
120mins

Guidance on the Harmonized WAFS Grid point forecasts for CB Cloud, Icing and Turbulence
Resources | Glossary | Notes
Return to Menu Introduction: Page 6 of 8
Automatic flight planning systems can integrate the new forecast data directly

Guidance on the Harmonized WAFS Grid point forecasts for CB Cloud, Icing and Turbulence
Resources | Glossary | Notes
Return to Menu Introduction: Page 7 of 8
Airline operators need to define their requirements for making use of the grid point forecasts with their service providers according to their own business models and safety risk management plan Dispatchers, pilots and flight briefing providers should be aware of what thresholds their suppliers have utilised when using these forecasts
Example use of operator threshold for CB avoidance
Threshold 0.7

Guidance on the Harmonized WAFS Grid point forecasts for CB Cloud, Icing and Turbulence
Resources | Glossary | Notes
Return to Menu Introduction: Page 8 of 8
The WAFCs support the flight documentation requirements of ICAO Annex 3 by providing WAFS SIGWX forecasts as well as upper-air wind, temperature and humidity grid point forecasts. The WAFCs do not provide visualizations of upper-air gridded CB clouds, icing and turbulence forecasts in support of flight documentation (Annex 3, Chapter 9 refers).

Forecasts of CB cloud use an algorithm based on cloud amount and precipitation intensity The horizontal extent of CB cloud in each grid box is given a value between 0 and 1. A figure of 0.5 implies 50% coverage of CB cloud in that grid box (a grid box is 1.25 x 1.25 degrees in size)
Resources | Glossary | Notes
Return to Menu About the data: Page 1 of 16
Guidance on the Harmonized WAFS Grid point forecasts for CB Cloud, Icing and Turbulence
Data values: CB cloud

The base and top of the CB cloud are calculated in Flight Levels. These heights are then converted to and disseminated in metres above mean sea level. (all heights given in WAFS Forecasts are relative to the ICAO Standard Atmosphere)
Resources | Glossary | Notes
Return to Menu
Guidance on the Harmonized WAFS Grid point forecasts for CB Cloud, Icing and Turbulence
About the data: Page 2 of 16
Data values: CB cloud
Flig
ht le
vels
Met
res a
bove
mea
n se
a le
vel

The icing algorithms are based on a combination of cloud condensate (ice and water), temperature, relative humidity and vertical motion parameters that predict the presence of super-cooled liquid water. The values range from 0 to 1 and are a potential for the presence of icing.
Resources | Glossary | Notes
Return to Menu
Guidance on the Harmonized WAFS Grid point forecasts for CB Cloud, Icing and Turbulence
About the data: Page 3 of 16
Data values: Icing

Due to lack of observations of Icing it is not currently possible to indicate the severity of icing or calibrate the forecasts to an accurate probability The numerical value of Icing Potential is not a probability but the higher the value of icing potential, the greater the risk of encountering icing
Resources | Glossary | Notes
Return to Menu
Guidance on the Harmonized WAFS Grid point forecasts for CB Cloud, Icing and Turbulence
About the data: Page 4 of 16
Data values: Icing
Risk
of e
ncou
nter
ing
ice

Icing Forecasts are produced for 6 vertical layers, each having a depth of 100hPa.
Resources | Glossary | Notes
Return to Menu
Guidance on the Harmonized WAFS Grid point forecasts for CB Cloud, Icing and Turbulence
About the data: Page 5 of 16
Data values: Icing – vertical levels

(CAT) - is derived via an algorithm that is based on the Ellrod Index The index is calculated based on the product of horizontal deformation and vertical wind shear Terrain-induced turbulence is also included within the index The theoretical limit to the data range is 0 to 99, but most values are <40
Resources | Glossary | Notes
Return to Menu
Guidance on the Harmonized WAFS Grid point forecasts for CB Cloud, Icing and Turbulence
About the data: Page 6 of 16
Data values: Clear Air Turbulence

(CAT) - not a probability However, the higher the value the greater the risk of encountering turbulence Does not currently indicate severity
Resources | Glossary | Notes
Return to Menu
Guidance on the Harmonized WAFS Grid point forecasts for CB Cloud, Icing and Turbulence
About the data: Page 7 of 16
Data values: Clear Air Turbulence
Turb
ulen
ce ri
sk

CAT Forecasts are produced for 6 vertical layers, each having a depth of 50hPa.
Resources | Glossary | Notes
Return to Menu
Guidance on the Harmonized WAFS Grid point forecasts for CB Cloud, Icing and Turbulence
About the data: Page 8 of 16
Data values: Clear Air Turbulence – vertical levels

The in-cloud turbulence algorithms are based on (i) the model indicating the presence of a cloud, and (ii) the change in potential energy with height, which is a measure of instability The range of values in the data is from 0 to 1 and are a potential for encountering in-cloud turbulence
Resources | Glossary | Notes
Return to Menu
Guidance on the Harmonized WAFS Grid point forecasts for CB Cloud, Icing and Turbulence
About the data: Page 9 of 16
Data values: In-cloud turbulence

The in-cloud turbulence Forecasts are produced for 5 vertical layers, each having a depth of 100 hectopascals
Resources | Glossary | Notes
Return to Menu
Guidance on the Harmonized WAFS Grid point forecasts for CB Cloud, Icing and Turbulence
About the data: Page 10 of 16
Data values: In-cloud turbulence – vertical levels

More details on all the GRIB2 forecast parameters, including the number of files and header information can be found on the ICAO website.
Resources | Glossary | Notes
Return to Menu
Guidance on the Harmonized WAFS Grid point forecasts for CB Cloud, Icing and Turbulence
About the data: Page 11 of 16
More details can be found on the ICAO website:

The native resolution of the forecast models run by the WAFCs is much finer than the 1.25 degree resolution of the WAFS grid point forecasts A maximum and mean value is calculated for each grid square for the Icing, Clear Air Turbulence and in cloud turbulence forecasts
Resources | Glossary | Notes
Return to Menu
Guidance on the Harmonized WAFS Grid point forecasts for CB Cloud, Icing and Turbulence
About the data: Page 12 of 16
Data values: Maximum and Mean values
Maximum value Mean value

Here, values of CAT range between 0 and 10 within the grid box The maximum value of 10 and the mean value of 3 are the figures disseminated Grid interpolation is done by the WAFCs during production of the forecasts
Resources | Glossary | Notes
Return to Menu
Guidance on the Harmonized WAFS Grid point forecasts for CB Cloud, Icing and Turbulence
About the data: Page 13 of 16
Data values: Maximum and Mean values

2 Icing parameters (Mean and Max) 2 In-cloud turbulence parameters (Mean and Max) 2 CAT parameters (Mean and Max) 3 CB cloud parameters (Horizontal extent, Base height and Top height) 11 timesteps = 407 data files
Resources | Glossary | Notes
Return to Menu
Guidance on the Harmonized WAFS Grid point forecasts for CB Cloud, Icing and Turbulence
About the data: Page 14 of 16
Data values: Number of files

A harmonization process is carried out to provide consistency between the WAFC London and WAFC Washington datasets
Resources | Glossary | Notes
Return to Menu
Guidance on the Harmonized WAFS Grid point forecasts for CB Cloud, Icing and Turbulence
About the data: Page 15 of 16
Data values: Harmonization
WAFC London WAFC Washington

On rare occasions the harmonization process may not occur If this should occur, each WAFC then makes available its independent forecasts A WAFS administrative message will be issued to notify users that independent, that is, unharmonized forecasts have been issued.
Resources | Glossary | Notes
Return to Menu
Guidance on the Harmonized WAFS Grid point forecasts for CB Cloud, Icing and Turbulence
About the data: Page 16 of 16
Data values: Harmonization
WAFC London WAFC Washington

Return to Menu
Guidance on the Harmonized WAFS Grid point forecasts for CB Cloud, Icing and Turbulence
Using the data: Page 1 of 15
Differences between Grid point forecasts and SIGWX
3 hour timesteps Updated every 6 hours Global coverage More vertical detail Range of values
Return to Menu
Guidance on the Harmonized WAFS Grid point forecasts for CB Cloud, Icing and Turbulence
Using the data: Page 2 of 15
Differences between Grid point forecasts and SIGWX
Traditional SIGWX based largely on subjective judgement of forecaster
Return to Menu
Guidance on the Harmonized WAFS Grid point forecasts for CB Cloud, Icing and Turbulence
Using the data: Page 3 of 15
Differences between Grid point forecasts and SIGWX

Areas depicted by the gridded data will be different from and more fragmented than the smooth shapes shown on Significant weather charts. Users may choose what to visualise depending on their operational requirements. Software providers should choose appropriate thresholds using the guidance on the next few slides.
Return to Menu
Guidance on the Harmonized WAFS Grid point forecasts for CB Cloud, Icing and Turbulence
Using the data: Page 4 of 15
Supplementary information for all users

The Maximum CAT field has greater skill than the Mean CAT field Areas with a maximum CAT potential of > ~4-6 is recommended to show the location of moderate or greater CAT CAT algorithm performs best near Jet streams / areas of strong wind shear It performs less well in areas of lighter winds, e.g. near the tropics
Return to Menu
Guidance on the Harmonized WAFS Grid point forecasts for CB Cloud, Icing and Turbulence
Using the data: Page 5 of 15
Use of CAT data
An example of turbulence made visible by clouds

Verification statistics* have been produced that show the hit rate and false alarm rate for encountering moderate or greater turbulence above certain thresholds. E.g. For a CAT value of 6 or more, the hit rate can be expected to be 0.43 and FAR 0.11. *Based on limited data
Return to Menu
Guidance on the Harmonized WAFS Grid point forecasts for CB Cloud, Icing and Turbulence
Using the data: Page 6 of 15
CAT thresholds

Threshold data is based on use of the more conservative ‘maximum’ Icing field A threshold of 0.1 is recommended for avoidance of any icing in Extended Diversion Time (EDTO) planning. A threshold of 0.7 gives similar areas of coverage to the areas shown on SIGWX charts.
Return to Menu
Guidance on the Harmonized WAFS Grid point forecasts for CB Cloud, Icing and Turbulence
Using the data: Page 7 of 15
Use of Icing data

Verification statistics showing the Hit rate and false alarm rate for encountering icing above different thresholds at FL100. For an Icing threshold value of 0.1 or more, the hit rate can be expected to be 0.9 and the FAR 0.155
Return to Menu
Guidance on the Harmonized WAFS Grid point forecasts for CB Cloud, Icing and Turbulence
Using the data: Page 8 of 15
Icing thresholds

Threshold data is based on the harmonized ‘maximum’ horizontal extent Threshold of 0.5 approximates the area of coverage of OCNL CB shown on SIGWX charts.
Return to Menu
Guidance on the Harmonized WAFS Grid point forecasts for CB Cloud, Icing and Turbulence
Using the data: Page 9 of 15
Use of CB data
Verification statistics showing the Hit rate and false alarm rate for encountering CB above different thresholds of CB Horizontal extent. E.g. For a threshold above 0.4, hit rate is 0.71 and FAR 0.08
Return to Menu
Guidance on the Harmonized WAFS Grid point forecasts for CB Cloud, Icing and Turbulence
Using the data: Page 10 of 15
CB thresholds
The WAFCs do not provide visualisations of the WAFS Grid point forecasts Contact your SADIS or WIFS workstation provider if you require software to display the WAFS Grid point forecasts Some examples of visualised WAFS grid point forecasts follow, these have been provided by the US National Weather Service.
Return to Menu
Guidance on the Harmonized WAFS Grid point forecasts for CB Cloud, Icing and Turbulence
Using the data: Page 11 of 15
Visualisation of WAFS Grid point forecasts

Return to Menu
Guidance on the Harmonized WAFS Grid point forecasts for CB Cloud, Icing and Turbulence
Using the data: Page 12 of 15
Example visualisation of CAT and Jet Stream Location

Return to Menu
Guidance on the Harmonized WAFS Grid point forecasts for CB Cloud, Icing and Turbulence
Using the data: Page 13 of 15
Example visualisation of Icing

Return to Menu
Guidance on the Harmonized WAFS Grid point forecasts for CB Cloud, Icing and Turbulence
Using the data: Page 14 of 15
Example visualisation of CB

Return to Menu
Guidance on the Harmonized WAFS Grid point forecasts for CB Cloud, Icing and Turbulence
Using the data: Page 15 of 15
Quality control and further improvement
More observations will allow calculation of probability and severity and allow verification to be extended globally Further development of algorithms are planned over the next few years which will improve the information to satisfy user requirements Comments and feedback on the user guide are welcomed A webpage has been set up for feedback - to subscribe please go to:-