wairarapa water use project: prefeasibility summary · pdf filewairarapa water use project:...
TRANSCRIPT

Wairarapa Water Use Project: Prefeasibility Summary Report June 2015
Report prepared by: WWUP Working Group, Greater Wellington Regional Council
Author: Michael Bassett-Foss, Project Director

Contents
1. Introduction ................................................................................................................................. 1
2. The purpose of the WWUP .......................................................................................................... 1
2.1 Building economic prosperity ...................................................................................................... 2
2.2 Allocating and using water efficiently .......................................................................................... 2
2.2.1 National Policy Statement for Freshwater Management (NPS) .................................................. 3
2.2.2 Integrated catchment management ............................................................................................ 3
3. Project vision and objectives ....................................................................................................... 5
4. Stakeholder engagement ............................................................................................................. 5
5. Previous investigations ................................................................................................................ 7
5.1 Options Identification and Analysis (October 2011 - April 2013) ................................................ 7
5.2 Options Refinement (April 2013 - September 2013) ................................................................... 8
6. The Prefeasibility phase (March 2014 – May 2015) .................................................................... 9
6.1 Scheme option descriptions....................................................................................................... 11
6.2 Scope of Prefeasibility ................................................................................................................ 13
6.3 Assumptions and limitations ...................................................................................................... 16
6.4 Factors not yet investigated....................................................................................................... 16
7. Scheme comparison using Multi-Criteria Analysis (MCA) ......................................................... 17
7.1 The MCA process ....................................................................................................................... 17
7.2 Financial theme .......................................................................................................................... 20
7.2.1 Scheme capital and operating costs .......................................................................................... 20
7.2.2 Peer review - scheme capital and operating costs .................................................................... 26
7.2.3 Regional economic return .......................................................................................................... 26
7.2.4 On-farm economics .................................................................................................................... 27
7.2.5 Scheme economics..................................................................................................................... 29
7.2.6 Overall financial theme – summary ........................................................................................... 30
7.3 Social theme ............................................................................................................................... 31
7.3.1 Community dislocation in inundated areas ............................................................................... 32
7.3.2 Loss of employment in inundated areas .................................................................................... 32
7.3.3 Temporary construction effects................................................................................................. 33
7.3.4 Recreation implications and opportunities ............................................................................... 34
7.3.5 Overall social theme - summary ................................................................................................ 35
7.4 Environmental theme ................................................................................................................ 36
7.4.1 Terrestrial Ecology ..................................................................................................................... 37
7.4.2 Aquatic Ecology .......................................................................................................................... 38
7.5 Māori cultural theme ................................................................................................................. 40
7.6 Risks & Opportunities (scheme-specific) ................................................................................... 41
7.6.1 Financial ..................................................................................................................................... 41
7.6.2 National Policy Statement for Freshwater Management (NPS) ................................................ 44

7.7 Other risks and opportunities (general)..................................................................................... 44
8. Summary of results – comparisons of schemes ......................................................................... 44
8.1 Summary table – MCA ............................................................................................................... 44
8.2 Sensitivity analysis – overall ....................................................................................................... 45
9. Other storage opportunities ...................................................................................................... 46
9.1 On-plains storage ....................................................................................................................... 46
9.2 Reserve scheme options ............................................................................................................ 47

Glossary
Abbreviations (T&T, June 2015)
GWRC Greater Wellington Regional Council
GG Governance Group for the Wairarapa Water Use Project
IAF Irrigation Acceleration Fund, managed by the Ministry for Primary
Industries, is a fund set aside to support investigation into regional rural
water harvesting, storage and distribution infrastructure
LG Leadership Group for the Wairarapa Water Use Project
MCA Multi-Criteria Analysis, a basis for ranking and comparing scheme
options
MCM Million Cubic Metres
NIWA National Institute of Water and Atmospheric Research
PwC PricewaterhouseCoopers
QEII Queen Elizabeth II National Trust open space covenants. A National Trust
open space covenant is a legally binding protection agreement, which is
registered on the title of the land. It is voluntary but once in place binds
the current and all subsequent landowners. Each covenant is unique. It
can apply to the whole property or just part of the property. There can
be different management areas within a covenant with varying
applicable conditions. Conditions can be stringent where rare or
vulnerable natural features or habitats are being protected.
RMA Resource Management Act
RPS Regional Policy Statement for the Wellington Region, April 2013 (GWRC)
SAG Stakeholder Advisory Group for the Wairarapa Water Use Project
T&T Tonkin & Taylor Limited
WG Working Group for the Wairarapa Water Use Project
WRIT Wairarapa Regional Irrigation Trust
WWUP Wairarapa Water Use Project

Terminology
(T&T, June 2015)
90th percentile The value, derived from a statistical analysis, below which 90% of
observations may be found e.g. the value that has a 1 in 10 chance of
being exceeded
Command area The gross area that could be supplied with water from a scheme.
Distribution system/network Conveyance structures located downstream of the reservoir, comprising
existing rivers, canals, races and pipework that transfer flow from the
reservoirs to the command areas
Flushing flows High river flows, usually associated with rainfall, which flush out the river
system
Harvesting Transferring water to storage from a nearby stream/river located in a
different catchment. This definition is different from the Regional Policy
Statement, which uses harvesting to refer to on-river storage also.
Headworks Storage reservoir, dam structures required to impound the reservoir,
and any intakes, conveyances and pump stations (if required) to
‘harvest’ water to fill the reservoir
Net supplied area The portion of the command area expected to actually be
irrigated/supplied, after accounting for buildings, tracks, hedges etc.
Reservoir A natural or artificial pond or lake used for the storage and regulation of
water.
Scheme Headworks and associated distribution network to transfer water from
reservoirs to a command area
Uptake The commitment of water users to use (buy) water from the scheme

Executive Summary
The Wairarapa Water Use Project (WWUP) is investigating a multi-purpose water scheme for Wairarapa
to collect and store water, then distribute it for a variety of economic and community uses. Any eventual
scheme would improve regional prosperity while promoting sustainable management of land and water.
More specifically, WWUP aims to:
• Provide an affordable, economically efficient and resilient water supply to support rural and/or urban
demand, and thereby enable broader economic benefits;
• Manage effects on the natural and social environment in a way that, as far as is practicable, minimises
potential adverse effects through sound scheme selection, project design/operation and mitigation;
• Enable the integration of cultural values and opportunities through consultation and collaboration
with iwi;
• Contribute to wider initiatives to improve the resilience, efficiency and reliability of the Ruamāhanga
catchment water resource.
Water could be used for irrigation, environmental uses, power generation, municipal water supply,
recreation and cultural uses.
Conversations with all parts of the community with an interest in water have been a priority for the
WWUP since it began. A wide range of community interests have been involved in the development of
the project and its investigations through the WWUP Governance, Leadership and Stakeholder Advisory
Groups who provide feedback and input into project design and decisions.
Separately from the WWUP, the Ruamāhanga Whaitua committee is currently working to determine
community values and needs and set the vision for the catchment as part of the Regional Plan review. It
will then create policies and rules for how land and water resources are managed. Any water scheme
developed would need to operate within the Regional Plan’s water quality and quantity limits.
The question of how to increase the reliable supply of water through storage has been considered in
Wairarapa for several decades. In September 2013, following preliminary investigations led by Greater
Wellington Regional Council with support from the Ministry for Primary Industries, five possible water
schemes were selected for further investigation - Tividale, White Rock Road, Te Mara, Black Creek and
Mangatarere. A sixth scheme, Wakamoekau, a smaller variant of the Black Creek option, was also
considered in its own right.
The aim of the Prefeasibility investigations conducted between March 2014 and May 2015 was to
determine which scheme options, if any, showed enough feasibility to proceed to the Feasibility phase.
Early assessment of any possible ‘fatal flaws’ that could be used to eliminate schemes was favoured.
The six schemes, comprising headworks (including water storage reservoirs) and water distribution
systems were investigated as stand-alone options.
White Rock Road and Tividale options would supply water to essentially independent areas, except for
some minor overlap of Tividale and Black Creek. Te Mara, Wakamoekau, Black Creek and Mangatarere
would supply water to areas that overlap substantially.
The six scheme options were compared against each other and ranked using multi-criteria analysis (MCA)
that evaluates and weighs multiple criteria to help compare options against each other for the purpose
of decision-making.

Prefeasibility investigations were categorised into four main themes – financial, environmental, social
and cultural which were divided into a series of sub-themes. For each theme and sub-theme, the scheme
options were ranked against each other on a 1-5 scale with 1 as the least favourable and 5 as the most
favourable. While this work was more detailed than the preliminary investigations, it was still at a
relatively broad level.
Sensitivity analysis was undertaken to determine at what point the altered weightings significantly
affected the outcomes.
Criteria, weightings and scores were largely decided by the nominated professional experts employed by
the project e.g. geologists, hydrologists, ecologists, engineers and economists. Expert consultants, other
specialists, peer reviewers, and representatives of the Irrigation Acceleration Fund (IAF) also provided
input at key points.
In addition, risks and opportunities associated with each scheme option were identified and considered.
The findings from the MCA are an important part of the decision as to which scheme/s, if any, should
advance to the WWUP’s Feasibility phase.
Overall MCA rankings
A summary of the MCA rankings and weightings for each of the four main themes; financial, social,
environmental and cultural, considered during the Prefeasibility phase are presented in Table A below.
When combined and weighted, the four main themes provide an overall score for each scheme option
which is then translated into a ranking.
Table A: Combined themes - MCA rankings1
(Barnett, 2015; Boffa Miskell 2015; Steer, 2014; Opus, 2014; T&T, 2015; WWUP, 2015)
From an overall perspective, Wakamoekau appears to be the most favourable scheme, followed by Black
Creek with a ranking of 4. Mangatarere is moderately favourable with an overall ranking of 3. Tividale
and Te Mara are next with an equal ranking of 2. White Rock Road is the least favourable scheme option
with a ranking of 1.
1 Rankings are comparative; 5 most favourable - 1 least favourable. Raw scores are the weighted sum of the themes.
Combined Themes MCA
Rankings
Weightings are based on Options Refinement
MCA pre-sensitivity testing weighting
Theme
weightings
10
- T
ivid
ale
13
5 -
Wh
ite
Ro
ck R
oa
d
19
7 -
Te
Ma
ra
20
6 -
Wak
amo
eka
u
21
0 -
Bla
ck C
reek
21
5 -
Ma
ng
ata
rere
Financial 70% 3.0 1.0 3.0 5.0 4.0 4.0
Social 10% 4.0 3.0 5.0 5.0 2.0 1.0
Environmental 10% 1.0 3.0 3.0 5.0 4.0 1.0
Cultural 10% 3.5 4.0 1.0 5.0 5.0 4.0
Raw Combined Score 3.0 1.7 3.0 5.0 3.9 3.4
MCA Ranking 2 1 2 5 4 3

Overall sensitivity testing
Sensitivity analysis was undertaken to determine at what point the altered weightings of the four main
themes significantly affected the outcomes.
As Table B below indicates, four of the scheme options are relatively insensitive to varying the financial
and combined social/environmental/cultural weightings.
No matter what weighting is applied, Wakamoekau is consistently the most favourable scheme from an
overall perspective, followed by Black Creek which is also insensitive to weightings. Te Mara and Tividale
are relatively insensitive. When more weight is given to combined social/environmental/cultural factors,
Mangatarere is highly sensitive and becomes the least favourable. When more weight is given to financial
factors, White Rock is highly sensitive and becomes the least favourable of the scheme options.
Table B: Sensitivity testing on combined themes - MCA rankings2 (WWUP, April 2015)
Sensitivity Testing on
Combined Themes MCA
Rankings 1
0 -
Tiv
ida
le
13
5 -
Wh
ite
Ro
ck R
oa
d
19
7 -
Te
Ma
ra
20
6 -
Wa
kam
oe
kau
21
0 -
Bla
ck C
ree
k
21
5 -
Ma
ng
ata
rere
0% Env/Cult/Soc, 100% Financial 3 1 3 5 4 4
10% Env/Cult/Soc, 90% Financial 3 1 3 5 4 4
20% Env/Cult/Soc, 80% Financial 3 1 3 5 4 3
30% Env/Cult/Soc, 70% Financial 2 1 2 5 4 3
40% Env/Cult/Soc, 60% Financial 2 1 2 5 4 3
50% Env/Cult/Soc, 50% Financial 2 1 2 5 3 2
70% Env/Cult/Soc, 30% Financial 2 1 2 5 3 1
80% Env/Cult/Soc, 20% Financial 3 3 3 5 4 1
90% Env/Cult/Soc, 10% Financial 3 3 3 5 4 1
100% Env/Cult/Soc, 0% Financial 2 3 3 5 4 1
Opportunities and risks
Tonkin & Taylor developed risk and opportunity scores for each scheme option relating primarily to
engineering components. Risk scores focused on potential cost increases or technical risks. The focus of
opportunity scores was on potential cost savings (T&T, June 2015).
With respect to engineering, in terms of opportunities for cost savings, Te Mara is clearly the most
favourable, followed by Black Creek, and then Mangatarere. Tividale and Wakamoekau are similarly
moderately favourable. White Rock Road is clearly the least favourable of the six schemes in terms of
opportunities (T&T, June 2015).
2 Rankings are comparative; 5 most favourable - 1 least favourable.

In terms of risks of cost increases and technical constraints from an engineering perspective, Te Mara is
clearly the most favourable, very closely followed by Wakamoekau and Mangatarere. Black Creek is less
favourable to moderately favourable in terms of risk. Tividale is the least favourable of the six schemes,
though White Rock Road only slightly more favourable than Tividale (T&T, June 2015).
Next steps
The information contained in this summary report and the numerous expert reports that fed into it will
be used by the WWUP Governance Group to make a decision on which scheme or schemes, if any, should
advance to the next, Feasibility’ phase of investigation.
All reports completed during Prefeasibility that are not commercially sensitive are referenced in this
report and available on the ‘Reports’ page of the WWUP website at www.wairarapawater.org.nz

1
1. Introduction The Wairarapa Water Use Project (WWUP) is investigating a multi-purpose water scheme for
Wairarapa to collect and store water then distribute it for a variety of economic and community
uses. Any eventual scheme would improve regional prosperity while promoting sustainable
management of land and water.
WWUP aims to maximise the productive capacity of the Wairarapa valley through water storage
and distribution infrastructure for irrigation and also to meet a range of other environmental
and community needs such as power generation, municipal water supply, recreational and
cultural purposes.
Work to date has focused at a high level on how water could be provided to irrigate an
additional 30,000 hectares of the Wairarapa valley through a range of scheme options.
Currently, about 12,000 hectares are irrigated using surface and ground water, most of which
is fully allocated.
WWUP is sponsored and funded by the Greater Wellington Regional Council (GWRC). It has co-
funding from the Ministry for Primary Industries’ Irrigation Acceleration Fund (IAF) which
primarily supports investigation into regional rural water harvesting, storage, and distribution
infrastructure.
The project involves wide sections of the community through its Governance Group, Leadership
Group and Stakeholder Advisory Group, Farmer Group and Rural Bankers Group. This is
described further in Section 4 below.
This report summarises the results of the project’s Prefeasibility investigations on five scheme
options carried out between March 2014 and May 2015. These investigations follow
preliminary work by the project which is described in Section 5 below.
The process of assessing options is a critical part of the consideration by decision makers. The
requirement for adequate consideration of alternatives for major infrastructure projects is well-
recognised under the Resource Management Act 1991 (RMA).
This summary report and the numerous expert reports that fed into it form the basis of a
decision on which scheme or schemes, if any, should advance to a Feasibility investigation. This
report outlines the project’s purpose and background, then summarises a multi-criteria analysis
(MCA) process that compares the scheme options on financial, social, environmental and
cultural criteria. Known risks and opportunities associated with each scheme option are also
presented.
All reports completed during Prefeasibility that are not commercially or personally sensitive are
referenced in this report and available on the ‘Reports’ page of the WWUP website at
www.wairarapawater.org.nz.
2. The purpose of the WWUP The question of how to increase the reliable supply of water through storage has been
considered in Wairarapa for several decades. The opportunity for regional economic
development and resilience has and continues to be a key driver for the project.
More recently, a second question; how the region’s existing scarce water resource could most
efficiently be used for a range of purposes, has driven the project investigations.

2
2.1 Building economic prosperity
Primary production is the biggest single contributor to Wairarapa’s GDP at 17 percent. Water
storage for irrigation would provide the reliability needed for new crops, horticulture, pastoral
farming and processing of primary produce, while insulating farm production against dry years.
This presents the opportunity to achieve significant economic growth for the entire Wellington
region.
A greater, more reliable water supply in Wairarapa would grow the primary production base,
creating long-term and inter-generational economic and social development. Benefits could
include:
• increased farming productivity and returns
• a more diverse and higher-value range of agricultural and horticultural outputs
• creation of new jobs and increased regional GDP
• retention of younger people in the region through greater job prospects
• local processing of primary produce made possible through more reliable production
• new and expanded service industries e.g. transport
• social spin-offs – community facilities, population-based services, strong school rolls.
2.2 Allocating and using water efficiently
The current resource consents to take surface water account for nearly all of the available ‘core
allocation’ from the rivers in the Wairarapa valley. Limited additional groundwater is available,
especially now that investigations have confirmed that there is strong interconnection between
surface water and groundwater in Wairarapa.
Therefore, to reliably meet increased water demand in a sustainable manner, water would have
to be supplied from storage. GWRC’s over-arching environmental policy directive, the Regional
Policy Statement (RPS), requires the Regional Plan to promote efficient use of water and ‘water
harvesting’; i.e. taking and storing water when the availability is high and using it when needed.
With this comes the environmental challenges of more intensive land use and managing
changing land use; both key considerations. This requires an integrated discussion about
efficient use of water in a way that maintains or enhances the overall environment and provides
for community values.

3
2.2.1 National Policy Statement for Freshwater Management (NPS)
The Government’s freshwater management reforms resulted in the introduction of the National
Policy Statement for Freshwater Management (NPS) in 2011, which was updated in 2014.
The NPS specifically sets out:
“… objectives and policies that direct local government to manage water in an
integrated and sustainable way, while providing for economic growth within set
water quantity and water quality limits” (NPS, 2014)”
and must be considered in terms of progressing water storage and reticulation options.
While water quantity and allocation regimes have been in place for some time, there is now a
new requirement for local government to set and meet water quality limits. In a catchment-
wide approach to land and water management, GWRC has divided the greater Wellington
region into five ‘Whaitua’ or management areas. In each area, including Wairarapa, a
community-led vision for land and water use is being developed as part of the Regional Plan
review.
2.2.2 Integrated catchment management
GWRC is moving from an individual water take approach to looking holistically at a catchment
scale at how to most efficiently aggregate, distribute and use water to achieve environmental
sustainability and economic growth. This requires cohesive planning for water allocation and
distribution for individual use and public good environmental, recreational, social, cultural and
economic purposes.
In Wairarapa, this holistic approach has three key parts supported by an extensive programme
of science modelling;
a. The Regional Plan review (to become the Natural Resources Plan)
b. The community-led Whaitua process, and
c. The Wairarapa Water Use Project.
The key task now is establishing limits for allocation and limits for quality through the new
Regional Plan. Each of these inter-related projects has a role to play in how water resources are
used and how the community makes decisions about the balance of environmental, cultural,
economic and social uses.
Briefly described below, the Regional Plan, Ruamāhanga Whaitua and WWUP are all
underpinned by a substantial scientific programme developed by GWRC and involving national
partners. This is building a repository of evidence on what to base decisions.
Regional Plan review
The current Regional Plan review process, is considering amongst other things, how to allocate
water and set minimum flows to recognise the importance of in-stream ecosystems, while
managing potential land-use impacts in an environmentally and economically sustainable way.
One of the drivers for the review was how water is allocated and for what purposes; for
example, irrigation, water races, flushing flows and municipal supply.
The new Regional Plan, to be known as the ‘Natural Resources Plan’, is likely to be proposed in
August 2015 with some provisions likely to have immediate effect. The plan will become fully
operative after going through a process of submissions, hearings and possible appeals.

4
Ruamāhanga Whaitua (catchment) committee
Throughout the greater Wellington region, the complex question of how to manage the limit-
setting process, particularly with regard to quality, is being considered through community-led
Whaitua (catchment) committees.
In Wairarapa the Ruamāhanga Whaitua is working to determine community values and needs
and set the vision for the catchment. It will then create policies and rules for how land and
water resources are managed that suit the needs of local people. These will be incorporated
into the new Regional Plan through the ‘Ruamāhanga Whaitua chapter’. This section will be
read alongside the regional policies and regulations and will control how resources are
managed in the wider GWRC area. Any water scheme developed in the region would need to
operate within the Regional Plan framework.
Wairarapa Water Use Project
The third part of considering the catchment in an integrated/holistic way is the question of
harvesting water and storing it in order to create long-term security of supply for a variety of
purposes.
Ultimately a large-scale water scheme is an infrastructure tool that could assist the efficient use
and allocation of water for current and new users and the management of land and water in
the catchment.
To this end, WWUP is investigating the feasibility of a water scheme that contributes to
economic growth and to wider initiatives to improve the resilience, efficiency and reliability of
the Ruamāhanga catchment water resource. Any effects on the natural and social environment
would need to be managed in a way that, as far as is practicable, minimises potential adverse
effects.
Increased irrigation is likely to bring environmental challenges, particularly those associated
with more intensive land use. Understanding potential land use change and its effects is a key
consideration for WWUP and the community and will be assisted by the GWRC science
modelling work. At the same time, water storage can present opportunities for the environment
by increasing minimum stream flows and providing flushing flows in summer, and assisting with
efficient use and allocation of water. Opportunities exist to improve farm practices, use new
technology and use irrigation water more efficiently.
The NPS/Regional Plan framework will have a significant impact on any water scheme that
might eventuate. It is difficult at this stage to quantify the extent of this until limits are set by
the Ruamāhanga Whaitua and the results of GWRC’s science modelling work are known.
Therefore, the potential impact on possible water schemes is presented as risks and
opportunities in Section 7.6.2 of this report.

5
3. Project vision and objectives The Wairarapa Water Use Project vision, developed in 2012 is:
“To provide one or more multi-purpose water scheme for Wairarapa to collect
and store water then distribute it for a variety of economic and community uses.
This will be done in a way that promotes sustainable management of land and
water and creates regional prosperity.”
Following on from the vision, the project objectives are to:
• Provide an affordable, economically efficient and resilient water supply to support rural
and/or urban demand, and thereby enable broader economic benefits;
• Managing effects on the natural and social environment in a way that, as far as is
practicable, minimises potential adverse effects through sound scheme selection,
project design/operation and mitigation;
• Enable the integration of cultural values and opportunities through consultation and
collaboration with iwi;
• Contribute to wider initiatives to improve the resilience, efficiency and reliability of the
Ruamāhanga catchment water resource.
These objectives are a revision of the original project objectives first formulated in November
2012 at the early stage of investigations. The changes take into account advancement in the
knowledge gained and decisions made during the intervening period.
Revision of the objectives has also taken into account decisions from recent applicable RMA
decisions including those relating to water irrigation projects.
4. Stakeholder engagement Conversations with all parts of the community with an interest in water have been a priority for
the project since it began. A wide range of community interests have been involved in the
development of the project and its investigations through several groups. Their membership
(see Appendix A) reflects the magnitude of the opportunities and challenges the project
presents to the region.
The WWUP Governance Group, established in 2014 comprises members of the community,
local iwi, local government, and the Wairarapa Regional Irrigation Trust. The Governance Group
is the key project decision-maker and an advisory group to the GWRC as the project funder.
Following initial community engagement by the project late in 2009, the WWUP Stakeholder
Advisory Group (SAG) was formally established in 2011. Made up of 19 community
organisations, it acts as an advisory body to the project. The SAG meets approximately six-
weekly, receives all project information, and provides feedback and input into project design
and decisions.
Established in 2009, the WWUP Leadership Group comprises regional leaders and acts in an
advisory capacity. The project is managed by the WWUP Working Group. Structural
relationships and committee functions are outlined in Figure 1 below.

6
Figure 1: WWUP stakeholder structural relationships and committee functions

7
5. Previous investigations Investigations of possible water storage schemes in Wairarapa have been carried out by several
organisations and date back to 2001. In 1997 a significant drought attracted a Central
Government-funded research project.
Between 2001 and 2003 local economic development agencies commissioned several studies
that showed that a water storage option(s) was both feasible and advantageous for Wairarapa.
In 2007 the Wairarapa Regional Irrigation Trust (WRIT) was established by members of
Wairarapa’s business community to promote irrigation within the region and provide farmers
and interested parties with information on how irrigation could work for them.
In its early years WRIT built on initial investigative work carried out since 2001. Working with
Meridian Energy, it commissioned preliminary studies that indicate strong potential for
irrigating land that currently does not have access to water for that purpose.
In 2011 an independent expert review of all previous investigations found that the water
scheme project is potentially feasible in hydrology, engineering and economic terms.
Against this backdrop, GWRC decided to conduct a thorough and open investigation of how
water in Wairarapa could be stored and distributed in a way that contributed to both economic
growth and overall environmental sustainability. This was part of an integrated catchment
management approach as described in Section 2.2 of this report.
To date, the GWRC-funded investigations have included an initial Scoping Study, an Options
Identification and Analysis Phase, an Options Refinement Phase, and the Prefeasibility Phase,
the subject of this report, which considered and built on the previous studies by other
organisations.
Key constraints and exclusions were agreed at the beginning of the Options Identification and
Analysis Phase, and have been retained for the Options Refinement Phase and current
Prefeasibility Phase. In particular, dam sites in the Tararua Forest Park and on the main stems
of the Ruamāhanga, Tauherenikau, Waiohine and Waingawa Rivers were excluded from
consideration for recreational and environmental reasons principally.
5.1 Options Identification and Analysis (October 2011 - April 2013)
The broad study of Options Identification and Analysis, identified 243 storage options based on
an initial sweep, accounting for all possible sites with topography suitable for storing more than
3 million cubic metres of water. The large number of storage options was progressively and
systematically refined to a short-list of nine, based on a preliminary understanding of cost-
effectiveness, geology and active faults, water availability, environmental impacts and risks,
impacts on infrastructure and towns, land tenure constraints, and a range of social, cultural,
environmental and financial opportunity/risk factors.
Nine scheme options were then developed to a concept level suitable for comparison, each
comprising one of the short-listed reservoirs and an associated indicative command area. The
nine single storage schemes were assessed on their merits as independent options. A command
area was selected for each scheme on the basis of the area that could be supplied most cost-
effectively from the relevant reservoir. As the locations of the reservoirs were not evenly
distributed around the Wairarapa valley, the associated indicative command areas tended to
overlap, and significant areas of the valley were not covered. (T&T Executive Summary, 2015)

8
5.2 Options Refinement (April 2013 - September 2013)
The decision to undertake an Options Refinement Phase emerged from recommendations set
out in the Scheme Options Identification and Analysis Report, feedback on that report from
GWRC’s peer reviewers, the WWUP Stakeholder Advisory Group (SAG), Leadership Group (LG)
and Working Group (WG), and the key findings presented at meetings with the SAG and LG
during March 2013.
The Options Refinement work developed a concept for an integrated valley scheme comprising
multiple reservoirs supplying an indicative command area. This provided coverage of the high
and medium priority demand areas in the Wairarapa valley study area i.e. a ‘multi-storage’
scheme rather than ‘single storage’ scheme.
In addition, two additional storage options in the Taueru Valley catchment and a smaller version
of the Black Creek reservoir was developed as three independent schemes to a concept level
suitable for comparison with the nine schemes developed during Options Identification and
Analysis. Two of the original nine scheme options were eliminated as unrealistically expensive
compared with the other schemes under consideration, resulting in a ‘top ten’ list of possible
schemes.
The ‘top ten’ schemes were compared through a multi-criteria analysis (MCA), accounting for
environmental, financial, social, cultural and opportunity/risk themes. Overall MCA scores
showed relatively little difference between the top ten schemes, especially if only the top nine
were considered.
In order to ensure coverage of the medium and high priority areas in the Wairarapa valley, the
study area was divided into zones, and a priority reservoir and back-up reservoir was identified
for each zone. The priority schemes selected for further investigation were:
1. Tividale (Scheme 10)
2. White Rock Road (Scheme 135)
3. Te Mara (Scheme 197)
4. Black Creek (Scheme 210) including a smaller variant option called ‘Wakamoekau’
(Scheme 206)
5. Mangatarere (Scheme 215)
In addition, substantial flexibility for considering alternative arrangements and cost savings for
the multi-storage scheme was identified. Understanding how multiple reservoirs could fit
together in a cost-effective arrangement to cover the medium and high priority areas was
considered important for ensuring a long-term cost-effective strategy to water management in
the study area.
Therefore, further development of the distribution aspects of the multi-storage scheme was
recommended for investigation along with further work on the specific storage sites. These
recommendations were endorsed by the project and its stakeholders and the Options
Refinement report was published in September 2013.
9
6. The Prefeasibility phase (March 2014 – May 2015) In September 2013, following preliminary investigations, five possible water schemes were
selected as priorities for further investigation. Three other schemes were identified as reserve
options, should any of the five prove unviable during the Prefeasibility phase.
The following five single storage schemes were advanced through the Prefeasibility phase of
work:
• Tividale (Scheme 10)
• White Rock Road (Scheme 135)
• Te Mara (Scheme 197)
• Black Creek (Scheme 210)
• Mangatarere (Scheme 215)
A sixth scheme, Wakamoekau (Scheme 206), a smaller variant of the Black Creek option, was
also considered in its own right. Figure 2 (T&T) shows the location of the five reservoir storage
sites and the indicative irrigable area associated with each.
Further details on key attributes of each scheme option are detailed in WWUP Prefeasibility
Phase Engineering Report (T&T, June 2015).

10
Figure 2: Location of short-listed reservoirs and command areas assumed for evaluation as independent, alternative scheme options (T&T, June 2015)

11
6.1 Scheme option descriptions
Tividale (Scheme no. 10)
The Tividale water storage option is located approximately 23km northeast of Masterton off Te
Ore Ore Bideford Road in the vicinity of Mangapurupuru Road. It is situated on the Taueru River
just downstream of the confluence with Mangapurupuru Stream. The water would be sourced
from its own catchments the Taueru River and Mangapurupuru Stream.
With a capacity of 29.2million cubic metres (MCM) of water, the reservoir could supply
30.2MCM of water to its irrigable area in a drought year.
The indicative command area associated with the Tividale scheme is a long, narrow area along
the Taueru and Ruamāhanga Rivers that extends from around Bideford at its northern end to
southwest of Greytown and to the northern end of Lake Wairarapa. The total net supplied area
would be approximately 9,800ha, of which approximately 3,200ha would be riparian users
along the Taueru and Ruamāhanga Rivers (existing and new users with direct takes from the
river). The remaining 6,600ha would be supplied from a centralised scheme intake, pump
station and pumped pipe network comprising approximately 24km of pipe (T&T, June 2015).
White Rock Road (Scheme no. 135)
The White Rock Road water storage option is located approximately 10km south of
Martinborough immediately west of White Rock Road. It is situated on the Makara River a few
hundred metres downstream of the confluence with the Mangapari Stream and approximately
3km upstream of the confluence with the Huangarua River. The reservoir would be filled by
own catchment infill i.e. runoff and river flows from the Makara River and Mangapari Stream
catchments, upstream of the dam.
With a capacity of 23.2MCM of water, the reservoir could supply 27.4MCM of water to its
irrigable area in a drought year.
The indicative command area associated with the White Rock Road scheme extends from the
Huangarua River valley (north of White Rock Road) to around Martinborough, and southwest
towards Lake Wairarapa. The total net supplied area would be approximately 7,600ha, of which
approximately 1,100ha would be riparian users along the Huangarua River (existing and new
users with direct takes from the river). The remaining 6,500ha would be supplied from a
centralised scheme intake, pump station and a pumped pipe network comprising approximately
26km of pipe (T&T, June 2015).
Te Mara (Scheme no. 197)
The Te Mara water storage option is located approximately 15km north of Masterton, 2km west
of State Highway 2 and north of Kiriwhakapapa Road. It would be situated on the Te Mara
Stream, a tributary of the Waipoua River. The reservoir would be filled by a combination of own
catchment infill (i.e. run-off and river flows from the Te Mara Stream catchment) and water
harvested from the Ruamāhanga River.
With a capacity of 23.3MCM of water, the reservoir could supply 34MCM of water to its irrigable
area in a drought year.
The indicative command area for the Te Mara scheme encompasses three sectors; the northern
sector covering the Waipoua and Ruamāhanga River valleys north of Masterton, the eastern
sector around Te Ore Ore (east of Masterton), and the southern sector between the Waingawa
River and Carterton. The three sectors are disconnected by areas where scheme water supply
is not proposed around State Highway 2 north of Masterton, and the Waingawa River (between
the northern and southern sectors).

12
The total net supplied area would be approximately 9,700ha. The scheme would be a fully-
piped, gravity-fed system from the dam, comprising approximately 49km of pipe (T&T 2015).
Wakamoekau (Scheme no. 206)
The Wakamoekau water storage option is located northwest of Masterton near Mikimiki,
effectively at the end of Falloon Settlement Road. The dam would be situated on Wakamoekau
Creek, a tributary of the Waipoua River. A second, saddle dam would be required at the
southern end of the site. The reservoir would be filled by a combination of own catchment infill
(i.e. run-off and river flows from the Wakamoekau Creek catchment) and water harvested from
the Waingawa River.
With a capacity of 18.8MCM of water, the reservoir could supply 28.9MCM of water to its
irrigable area in a drought year.
The indicative command area for the Wakamoekau Scheme encompasses three sectors, the
northern sector covering the Waipoua and Ruamāhanga River valleys to the north of Masterton,
the eastern sector around Te Ore Ore (east of Masterton), and the southern sector between
the Waingawa River and Carterton. The three sectors are disconnected by areas where scheme
water supply is not proposed around State Highway 2 north of Masterton, and the Waingawa
River (between the northern and southern sectors).
The total net supplied area would be approximately 8,100ha. The scheme would be fully-piped
and predominantly a gravity-fed system from the Wakamoekau Creek intake, comprising
approximately 45km of pipe (T&T, June 2015).
Black Creek (Scheme no. 210)
The Black Creek water storage option is located approximately 11 km northwest of Masterton,
on Falloon Settlement Road. The main dam would be situated on Black Creek, a tributary of the
Waingawa River. A second dam would be located on Wakamoekau Creek, a tributary of the
Waipoua River. The Black Creek reservoir would be filled by a combination of its own catchment
infill (i.e. run-off and river flows from the Wakamoekau and Black Creek catchments) and water
harvested from the Waingawa River.
With a capacity of 46.2MCM of water, the reservoir could supply 67MCM of water to its irrigable
area in a drought year.
The indicative command area for the Black Creek Scheme encompasses three sectors, the
northern sector covering the Waipoua and Ruamāhanga River valleys to the north of Masterton,
the eastern sector around Te Ore Ore (east of Masterton), and the southern sector between
the Waingawa River and Carterton. The total net supplied area is approximately 19,700ha.
The scheme would be fully-piped except for a short length of river conveyance from the
Wakamoekau dam to the intake, and use of the Ruamāhanga River for riparian users. A
predominantly gravity-fed system would stem from the dams, served by two independent
outlets from the dam sites on Wakamoekau Creek and Black Creek.
The net supplied areas attributed to each outlet are roughly equal, with the northern and
eastern sectors fed by the Wakamoekau Creek outlet and the area southwest of Masterton
served by the Black Creek outlet. Approximately 89km of pipe would be required for the full
distribution network (T&T, June 2015).
13
Mangatarere (Scheme no. 215)
The Mangatarere water storage option is located approximately 10km northwest of Carterton,
on Mangatarere Valley Road. The dam would be situated on the Mangatarere Stream, a
tributary of the Waiohine River. The reservoir would be filled by own catchment infill i.e. run-
off and river flows from the Mangatarere Stream catchment upstream of the dam. With a
capacity of 29.3MCM of water, the reservoir could supply 33.6MCM of water to its irrigable
area in a drought year.
The indicative command area for the Mangatarere Scheme encompasses the area around
Carterton, between the Waingawa River in the north and the Waiohine River in the south. The
total net supplied area would be approximately 9,700ha.
The scheme distribution arrangements would consist of outlet works at the dam, 2.5km of
conveyance via the Mangatarere Stream to a diversion weir and 3km of synthetic-lined
conveyance headrace canal feeding a gravity-fed, pumped and piped distribution network. The
pipe network would comprise approximately 35km of pipe (T&T, June 2015).
6.2 Scope of Prefeasibility The aim of the Prefeasibility investigations was to determine which scheme options, if any,
showed sufficient feasibility to proceed to a more detailed feasibility study beginning in 2015.
The objective was narrowed to focus on only doing enough to decide which scheme/s should
progress to feasibility. In addition, early assessment of any possible ‘fatal flaws’ that could be
used to discount schemes and avoid unnecessary work was favoured.
Investigations covered financial, engineering, environmental, social and cultural aspects. While
Prefeasibility work was more detailed than preliminary investigations, it was still at a relatively
broad level.
The scope and direction of the Prefeasibility phase was developed progressively in an adaptive
and collaborative manner. At the completion of each stage, the scope of the remainder of
Prefeasibility was reviewed with the WWUP Working Group and either endorsed or revised as
appropriate. Other specialists, peer reviewers, and representatives of the IAF also provided
input at key points (T&T, June 2015).
In addition, the WWUP Governance, Leadership and Stakeholder Advisory Groups provided
input into what should be investigated during Prefeasibility.
The concept of investigating a ‘multi-storage scheme’ was not pursued during this phase as
recommended in the Options Refinement phase. Instead each option was investigated as
stand-alone scheme.
The three reserve schemes were not brought into the Prefeasibility investigation because none
of the preferred schemes were discounted during this phase.
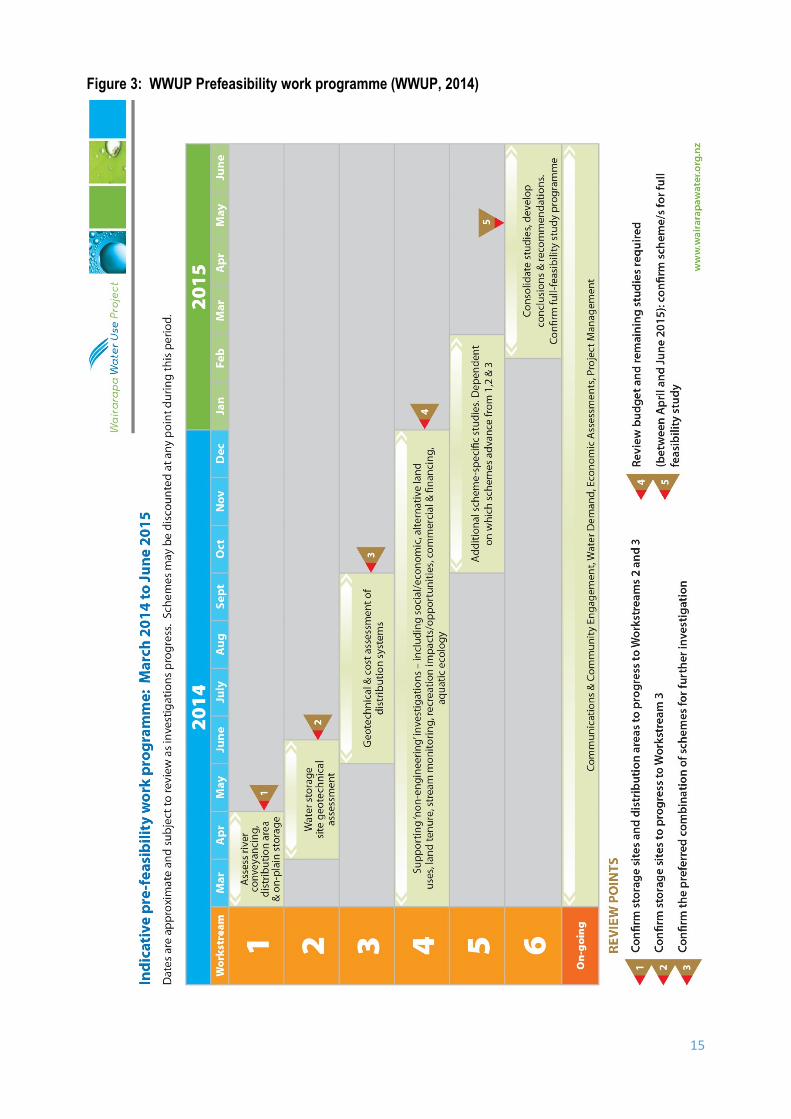
The Prefeasibility programme was divided into six workstreams, undertaken by the WWUP
Working Group, Tonkin & Taylor and various other experts.
• Workstream 1: Revise command area and assess use of rivers for conveyance
• Workstream 2: Geotechnical assessment of reservoirs focussing on 5 shortlisted storage
sites including site visits, digger pits, and a ‘fatal flaws’ assessment
• Workstream 3: Supply-demand matching, design, geotechnical assessment, and cost
estimates for the distribution aspects of a multi-storage scheme in order to confirm
selected storage sites are appropriate for a cost-effective, long-term strategy

14
• Workstream 4: Non-engineering studies, including arranging access for site visits,
stakeholder and community engagement activities, and coordination of hydrometric data
collection for possible schemes
• Workstream 5: Additional scheme-specific studies that were identified and fully-scoped
following review points part way through the programme; and
• Workstream 6: Overall management, coordination and reporting on Prefeasibility
investigations (T&T, June 2015).
Workstreams were interspersed with review points to enable due consideration of issues by the
WWUP Working Group, Governance Group and stakeholders and the discounting of schemes not
deemed feasible at these review points. These are shown in Figure 3 below.
15
Figure 3: WWUP Prefeasibility work programme (WWUP, 2014)
16
Throughout the Prefeasibility phase, the scope of work and project criteria changed and adapted
as information came to light.
One of the major refinements was a Value Engineering exercise carried out in September 2014
which followed investigation and high-level design of water storage infrastructure and
distribution networks.
Value Engineering was undertaken to provide a critical assessment of scheme costs and therefore
economic feasibility, and involved project team members, consultants and Ministry for Primary
Industries (IAF) and industry experts. It confirmed scheme costings appropriate for this stage of
the project and economic feasibility to continue Prefeasibility investigations. It also identified a
range of potentially large cost saving opportunities to allow better relative comparison of the
scheme options.
The results of the Value Engineering exercise are described in Section 5.4 of the WWUP
Prefeasibility Phase - Engineering Report (T&T, June 2015).
6.3 Assumptions and limitations The work undertaken in the Prefeasibility phase was based on several assumptions and
performance criteria regarding water demand estimates, water availability, scheme service
parameters (reliability, water pressure etc.), and engineering design criteria. The engineering
design assumptions are outlined in Section 4.4 of the Tonkin & Taylor WWUP Prefeasibility
Phase - Engineering Report.
These may potentially change during future phases of work and more detailed investigations.
In addition, GWRC is currently reviewing policies around water allocation and minimum flows
as part of its Regional Plan review process. The work undertaken on the WWUP to date has
made assumptions on water allocation scenarios that may change particularly as the Regional
Plan review process evolves.
The assessment of likely costs of potential schemes is preliminary due to the number of
uncertainties at this early stage of investigation. The scheme layouts have been developed to
a Prefeasibility level, and modifications to arrangements can be expected during future
investigation, consultation and design stages (T&T, June 2015).
6.4 Factors not yet investigated It is important to note that at this Prefeasibility phase of the WWUP, many factors have not yet
been investigated and are still therefore unknown. The following is a list of these factors which
is not exclusive but provides an indication of investigations that will need to be added in future
phases of the project.
• Water quality within reservoir/s
• Effects on ground and surface water
• Future land use and the effects of land use change
• The effects of climate change on the demand for water and the availability of water
• Detailed dam geotechnical information
• Analysis of the risk of dam break for dam design purposes
• Possible environmental improvements that could result from a scheme
• Landscape and visual effects
• National, regional and district planning implications for consenting
• The shape and form of the legal entity or development structure for ownership and
construction of any scheme
• The price of water to users/farmers

17
7. Scheme comparison using Multi-Criteria Analysis (MCA) During the Prefeasibility phase, the six scheme options were compared against each other and
ranked using multi-criteria analysis (MCA). This follows the same process used in the Options
Refinement phase.
MCA is a structured and well-established framework that explicitly evaluates and weighs
multiple criteria to help compare options relative to each other for the purpose of decision-
making.
MCA processes are now a standardised tool for assessing and comparing options and have been
recognised as being appropriate through a number of significant consenting processes
considered through the Courts or Boards of Inquiry.
The criteria provided a structured approach to determining the respective advantages and
disadvantages of each of the options, based on a range of environmental and other attributes
which reflected, amongst other considerations, the statutory tests under the RMA.
Where possible, quantifiable data is obtained to provide a measureable assessment of potential
impacts (e.g. cost). Otherwise, MCA relies on a qualitative or subjective evaluation of the
options based on the experience and knowledge of the relevant experts involved, consultation
and subsequent testing, usually at multi-disciplinary workshops or the like.
The criteria used for the MCA were divided into four main themes - financial, environmental,
social and cultural. Under each of these were a series of sub-themes. Schemes were ranked
against each other on a 1-5 scale, using the same process for each theme and sub-theme.
In addition, risks and opportunities associated with each scheme option were identified and
considered. The findings from the MCA are an important part of the decision as to which
scheme/s, if any, should advance to the WWUP’s Feasibility phase.
This section of the Prefeasibility report presents a summary of the MCA analysis for the four
main themes. More detail and full reports on each of these themes are referenced in this report
and available on the ‘Reports’ page of the WWUP website at: www.wairarapawater.org.nz
7.1 The MCA process
For consistency, the same themes (from the Options Refinement phase) were continued in the
Prefeasibility phase; in many cases more information that has been gathered has enabled
categories to be broken down to another level or sub-theme (T&T, June 2015).
The process undertaken to arrive at the relative scheme rankings for each criteria involved four
steps.
1. Under each criterion, scores were applied to each scheme option
2. Criteria were weighted (as a percentage) according to their importance within each theme
3. Scores were then translated into a ranking from 1-5
4. Sensitivity analysis was undertaken to determine at what point the altered weightings
significantly affect the outcomes.

18
A scale of 1-5 was used to provide a comparative rather than absolute ranking for each criterion
in order to differentiate between schemes i.e. a score of 1 was least favourable compared with
the other schemes under consideration but was not necessarily unacceptable in a wider context.
Likewise, a score of 5 does not necessarily mean a scheme is favourable in an absolute sense. The
comparative scale is described as follows:
1. Least favourable
2. Less favourable
3. Moderately favourable
4. Favourable
5. Most favourable
For each criterion at least one scheme must score a 5 and another scheme as score of 1 to provide
the range. No other ‘rules’ apply to scoring e.g. four ‘5’s and one ’1’ is possible.
Criteria, weightings and scores were finally decided by the nominated professional experts. The
MCA rankings have been made by professional experts employed by the project e.g. geologists,
hydrologists, ecologists, engineers and economists. Each expert independently scored their own
area of expertise, providing written justification for each score. The experts also needed to
ensure the sub-themes were correct within their area of expertise and approve weightings for
each.
For the Social theme, the WWUP Working Group used local knowledge to score the four sub-
themes with expert guidance from Tonkin & Taylor, Opus International Consultants and Taylor
Baines.
Throughout the MCA process, the WWUP Stakeholder Advisory Group, Governance Group and
Leadership Group provided comment on the draft MCA scores. Elements, themes and rankings
were debated and group members provided input into reports by experts. In some cases expert
information was challenged and returned to the experts for further consideration. While experts
considered feedback, they ultimately decided whether their scores should be adjusted or
retained. The process and the assumptions should be able to be replicated.
The final part of the MCA process, sensitivity testing, is a recognised means of checking the
strength of the initial analysis. This process is conducted once the sub-themes have been ranked
(1-5) the weightings applied and the totals added. The aim of sensitivity testing is to establish
how different theme weightings affect the overall ranking of the schemes. The starting point was
the same as in the Options Refinement phase of work.
Care has been taken to ensure that criteria have not been ‘double counted’. Where expenditure
of capital can be applied to avoid, remedy, or mitigate an ‘effect’, it has been included in the
‘Financial’ category. This also helps avoid double counting e.g. a fish passage that would help
mitigate environmental issues is counted as cost to the project.
In addition, opportunities and risks have been identified with each scheme option. Some of these
are quantifiable and others are not. Opportunities and risks (outlined in Section 7.6 below) are
considered alongside the MCA themes.
19
The following themes and sub-themes were considered. The MCA rankings of each of these are
summarised in this report. Full reports for each theme and sub-theme are referenced in this
report and available on the ‘Reports’ page of the WWUP website at www.wairarapawater.org.nz.
Financial theme
• Scheme capital and operating costs
• Regional economic return
• On-farm economics
− Land use capability
− Increase in productivity
• Scheme economics
− Demand
− Rate of uptake
Social theme
• Community dislocation
• Loss of employment in inundated areas
• Construction activity effects
• Recreation implications and opportunities
Environmental theme
• Terrestrial ecology
• Aquatic ecology
Māori cultural theme
• Recorded cultural archaeological/historic sites
Risks and opportunities (scheme-specific)
• Financial
• National Policy Statement for Freshwater Management 2014 (NPS)
Risks and opportunities (general)

20
7.2 Financial theme The financial assessment of the Prefeasibility study was made up of four parts:
1. Scheme construction and operating costs
2. Regional economic return
3. On-farm economics
4. Scheme economics
7.2.1 Scheme capital and operating costs
The most significant financial sub-theme is scheme capital and operating costs because this
underpins the ultimate cost of water and therefore the economic viability of a scheme.
For this reason, scheme costs have received a weighting of 70% of the overall financial theme.
Costs include the capital cost of constructing the scheme headworks and distribution network,
and the annual operating and maintenance components spanning a 50-year period.
Consulting engineers Tonkin & Taylor were tasked with providing MCA scores in relation to
engineering aspects. A financial score, a risk score and an opportunity score was prepared for
each scheme in relation to engineering aspects. The financial score is based on the most likely
scheme layouts given the current level of investigation, while the risk and opportunity scores
reflect areas of uncertainty. Risk and opportunity scores are presented in Section 7.6 of this
summary report and in Tonkin & Taylor’s Prefeasibility Phase Engineering Report (2015).
Scheme characteristics such as topography, geology and geotechnical conditions, water
demand and water availability (which contribute to reservoir size) have all contributed to the
storage, water harvesting and distribution arrangements described in Section 13 of Tonkin &
Taylor’s Prefeasibility Phase Engineering Report (2015). Cost estimates have been prepared for
these arrangements, and used to compare the schemes on a financial basis as part of the multi-
criteria analysis.
Development of cost estimates involved the following steps:
1. Estimate of initial construction cost and selected costs during the operational period that
may differentiate schemes based on current understanding of engineering aspects (T&T,
June 2015) and
2. PricewaterhouseCoopers (PWC) combined these costs into a Net Present Cost (NPC) for
each scheme that accounts for the time-value-of-money (PwC, April 2015).
Tonkin & Taylor developed prefeasibility level estimates of initial construction costs and some
of the operational costs, considered at this stage because of their potential to differentiate
between schemes:
• Average annual cost of electricity for pumping
• Average annual cost of maintenance and servicing of valves and pumps, and
• Refurbishment/replacement cost for electrical mechanical components of pump stations
applicable in year 25 of the nominal 50-year operational period.

21
Other operational costs, such as ongoing administration of schemes, are excluded on the basis
that they will be broadly similar for all schemes based on limited understanding of these costs at
the current Prefeasibility level of investigation. A list of costs not included in the estimates can
be found in Section 14 of Tonkin & Taylor’s Prefeasibility Phase Engineering Report (2015).
WWUP has worked to integrate known costs of the scheme options through a robust
process using independent expert consultants. These are presented in Table 1 below (PwC, April
2015).
At this stage of investigation, the estimated cost ranges for the scheme options does NOT relate
to the cost of water to users or the cost of a scheme to investors. This will be depend on factors
such as scheme funding structure and water uptake rates which have not yet been investigated.
A range of opportunities and risks also needs further investigation during subsequent phases of
the project. These will be pursued with the aim of optimising scheme costs, and reducing
contingency and the range of uncertainty.
Table 1 below presents the net present cost (NPC) for each of the six scheme options. The NPC
is presented for each of the low (-15%), mid (+0%) and high (+30%) construction cost estimates.
Table 1: Net present cost (NPC) by scheme option (PwC, April 2015)
$million Black Creek*
Mangatarere
Te Mara Tividale Wakamoekau
White Rock Rd
Low NPC (-15%)
$138m $69m $73m $71m $55m $64m
Mid (+0%) $161m $81m $85m $82m $64m $74m
High NPC (+30%)
$205m $105m $108m $105m $81m $94m
*Black Creek figures include Wakamoekau
The cost estimates are considered appropriate for comparison of schemes in the multi-criteria
analysis, but a wide cost range is considered realistic for the current level of design development.
In terms of accuracy, it is expected that a ‘typical’ range for initial construction cost estimates
could be in the order of -15%/+30%. If atypical changes are made to performance scope or there
are significant changes from findings and assumptions to date, costs would be expected to be
beyond the ‘typical’ range shown in figures.
Prefeasibility is an early stage of investigation, and this necessarily limits the degree of cost
certainty that can be achieved. Cost estimates are based on the information currently available,
level of assessment completed to date, and assumptions and design criteria that may change
with future phases of the WWUP.
The scheme cost estimates exclude the following, which represents a relatively typical list for a
Prefeasibility level of assessment:
• General upgrades to the wider electricity grid
• On-farm costs
• Land purchase beyond reservoir extents
• Landowner compensation for easements
• Replacement of private access and amenities such as air strips
• Relocation of public utilities, power lines and services

22
• Subsidies, compensation, or purchase of commercial operations such as quarries.
• Foundation grouting at dam sites
• Government taxes
• Design and investigation costs up to and including the Specimen Design of the chosen
option/s
• Legal costs
• Financing and developer administration associated with initial construction
• Consenting and approvals
• Insurance
• Construction cost volatility
• All operational and maintenance costs other than electricity for pumping, pump/valve
maintenance and pump/valve replacement. (T&T, June 2015)
Figures 4 and 5 on page 23 present the typical range of net present cost estimates for each
scheme in terms of net present cost per hectare supplied ($/ha) and net present cost per cubic
metre of water supplied in a drought year ($/m3) respectively.

23
Figure 4: Net Present Cost ranges in terms of $/h (net area supplied) (T&T, June 2015)
Figure 5: Net present cost ranges in terms of $/m³ supplied in a drought year (T&T, June 2015)
Note: The estimated cost ranges in Tables 4 and 5 above do NOT relate to the cost of water to
users or the cost of a scheme to investors. There is a great deal more work to be done before
the cost of water can be determined.

24
The results of Tonkin & Taylor’s MCA ranking for combined scheme construction and operating
costs are shown in Table 2 below. Financial scores are presented for both $/ha and $/m³ supplied
in a drought year. The details that contributed to the MCA scores are presented in Appendices
C and D of Tonkin & Taylor’s Wairarapa Water Use Project Prefeasibility Phase – Engineering
Report (T&T, June 2015).
Table 2 - Combined construction and some operating costs – MCA rankings3 (T&T, June 2015)
Scheme
Financial Score
$/ha $/m³ supplied in a drought year
Scheme 10 Tividale 4.1 1.0 (least favourable)
Scheme 135 White Rock Road
1.0 (least favourable) 1.1 (close to least favourable)
Scheme 197 Te Mara 3.3 2.7
Scheme 206 Wakamoekau 5.0 (most favourable) 5.0 (most favourable)
Scheme 210 Black Creek 4.5 3.5
Scheme 215 Mangatarere 4.1 3.4
Note: when scored on the basis of $/m³ supplied in a drought year, Tividale compares much less favourably
than when scored on a $/ha basis. This is because the annual water demand ($/ha) in a drought year is
expected to be notably lower for the Tividale scheme than the other five schemes.
3 Rankings are comparative; 5 most favourable - 1 least favourable.

25
Table 3 - Sensitivity testing of $/ha and $/m³ for capital and operating costs4 (WWUP, April 2015)
Opex and Capex score
Weightings
10 - T
ivid
ale
135
- W
hite
Roc
k R
oad
197
- Te
Mar
a
206
- W
akam
oeka
u
210
- Bla
ck C
reek
215
Man
gata
rere
0% weighting on $/ha & 100% on $/m3
1.0 1.1 2.7 5.0 3.5 3.4
15% weighting on $/ha & 85% on $/m3
1.5 1.1 2.8 5.0 3.7 3.5
35% weighting on $/ha & 65% on $/m3
2.1 1.1 2.9 5.0 3.9 3.6
50% weighting on $/ha & 50% on $/m3
2.6 1.1 3.0 5.0 4.0 3.8
65% weighting on $/ha & 35% on $/m3
3.0 1.0 3.1 5.0 4.2 3.9
85% weighting on $/ha & 55% on $/m3
3.6 1.0 3.2 5.0 4.4 4.0
100% weighting on $/ha & 0% on $/m3
4.1 1.0 3.3 5.0 4.5 4.1
MCA Ranking on 50/50 split 2 1 3 5 4 4
The key conclusions from the Prefeasibility cost estimates (T&T, June 2015) are:
• There is substantial overlap of the cost estimates for the six schemes when the expected range of -
15%/+30% is considered.
• When financial favourability is considered in terms of $/ha (net area supplied) or $/m³ supplied in a
dry year, Wakamoekau appears the most promising. Black Creek and Mangatarere are the next most
promising and are similarly favourable. Te Mara is moderately favourable. White Rock Road appears
to be the least promising of the six schemes. Tividale appears similarly favourable as Black Creek
and Mangatarere if considered on the basis of $/ha (net supplied), but appears the least favourable
if considered on the basis of $/m³ supplied to farm gate in a dry year.
• The lowest ranked scheme is 24% more expensive than the highest ranked scheme in terms of $/ha
and 22% more expensive in terms of $/m³ supplied in a dry year. This is a relatively small difference
when considered against the uncertainty range in the cost estimates. This indicates that all six
schemes are in a similar range in terms of overall affordability (T&T, June 2015).
4 Rankings are comparative; 5 most favourable - 1 least favourable.

26
It is important to note that this process does not determine a price for water; that includes
other factors such as the commercial model adopted, water uptake rates, funding sources etc.
As such, price will not be known until much later in the project.
7.2.2 Peer review - scheme capital and operating costs
The assessment of financial favourability has been based on comparing single-storage schemes
as independent alternative options that would not be developed in conjunction without
modifications to arrangements.
For the engineering and cost aspects of the Prefeasibility phase three independent peer
reviewers were commissioned to review Tonkin & Taylor’s work:
• Alan Pickens of Pickens Consulting Ltd (PCL), covering engineering components comprising
design of reservoirs, harvesting systems and distribution systems;
• Morgan Pheloung of Bond Construction Management Ltd, covering cost estimates; and
• Ian McIndoe of Aqualinc Research Ltd, covering water demand, water availability and
hydrology.
Details of their findings are outlined in Section 16 of Tonkin & Taylor’s report. This includes
further work suggested by the peer reviewers during future phases of the WWUP. With respect
to reservoirs, PCL provided the following comments in his peer review letter dated 11 May
2015:
‘In my experience, the approach has been extremely thorough, more so than is
usual in identifying and comparing potential solutions, but warranted, given that
the WWUP project involves a high level of complexity.
With the proviso that at the Prefeasibility level stage, cost constraints mean that it
is not possible to precisely evaluate all relevant aspects, particularly subsurface
conditions at dam sites and best material sources for construction, assessments to
date do not indicate any fatal flaws. I am satisfied that a thoroughgoing approach
has been adopted in quantifying engineering components and then costing them.’
(Pickens Consulting Ltd, 11 May 2015).’
7.2.3 Regional economic return
Regional economic return is the potential impact of the scheme options on the economy of
the greater Wellington region.
Benefits to the Wairarapa and greater Wellington regions potentially resulting from increased
irrigation were described by Butcher Partners in their report Regional Economic Impact Analysis
of the Proposed Wairarapa Water Use Project, 19 October 2014.
This report did not analyse economic impact by individual scheme option but provided an
analysis of economic impact by irrigated hectares (10,000ha and 30,000ha scenarios). This
impact was quantified based on a prescribed set of land use mix and land use profitability
assumptions. The land use profitability data came from the 2014 Baker & Associates report
Wairarapa Water Use: Land Use Affordability under Irrigation, April 2015.
Economic impact was measured in terms of GDP. Taking into account soil types in Wairarapa
and assumed land uses, this work estimated the GDP impact per cubic metre of water delivered
to primary producers. This parameter was applied to the number of hectares in the command

27
area of each scheme and the maximum cubic metres of water supplied by each scheme. The
resulting scheme rankings under the Regional Economic sub-theme were as follows:
Table 4: Regional economic return - MCA rankings5 (WWUP, May 2015)
The most favourable scheme in terms of GDP impact per cubic metre of water supplied was
Tividale, followed by Black Creek. Te Mara and Mangatarere were the next most favourable and
White Rock and Wakamoekau were equally the least favourable.
7.2.4 On-farm economics
On-farm economics scores the potential increased productivity of irrigated land over dry land.
The two factors measured were:
− Land use capability (LUC) and
− Increase in productivity per hectare under irrigation
Land use capability is the measurement of the land’s general versatility to sustain continuous
production. Increase in productivity per hectare measures the potential increase in disposable
surplus under irrigation over dry-land farming (WWUP, April 2015).
Land use capability (LUC)
Land Use Capability (LUC) is a standard that classifies New Zealand land into categories based on
its versatility. Land is rated on a scale of 1-8 with 1 being the most versatile and 8 being the least.
These classifications were applied to the command areas for each scheme option to gain a view
of which land had the most versatile land use.
Using mapping software, the percentage of each LUC class in the command area of each scheme
option was determined. LUC rankings were weighted as to favour the soils with greater
versatility. The scheme options were then ranked as follows, according to the versatility of land
in their command areas (WWUP, 2015).
5 Rankings are comparative; 5 most favourable - 1 least favourable.
Regional Economics
10
- T
ivid
ale
13
5 -
Wh
ite
Ro
ck R
oa
d
19
7 -
Te
Mar
a
20
6 -
Wa
ka
mo
ek
au
21
0 -
Bla
ck C
ree
k
21
5 -
Ma
nga
tare
re
MCA Ranking 5 1 2 1 3 2

28
Table 5: On-farm and scheme economics - MCA rankings6 (WWUP, April 2015)
Wei
ghtin
g %
10 - T
ivid
ale
135
- W
hite
Roc
k R
oad
197
- Te
Mar
a
206
- W
akam
oeka
u
210
- Bla
ck C
reek
215
Man
gata
rere
On-Farm Economics
Land Use Capability 50% 5 1 3 3 4 2
Increase in Productivity 50% 3 2 4 5 3 1
TOTAL 4 1.5 3.5 4 3.5 1.5
MCA score 5 1 3 5 3 1
Scheme Economics
Potential Demand 70% 4 1 3 3 2 5
Rate of Uptake 30% 4 1 3 3 2 5
TOTAL 4 1 3 3 2 5
MCA score 4 1 3 3 2 5
As shown in Table 5, the most favourable option for Land Use Capability is Tividale, followed by
Black Creek, then equally Te Mara and Wakamoekau. Mangatarere was the second least
favourable and White Rock the least favourable.
Increase in productivity
An indication of which schemes show the greatest potential to the farmer/land owner in the form
of increased disposable surplus after changing from dry land farming to irrigated farming.
Wairarapa farm consultants Baker and Associates Ltd measured potential increase in primary
production for each scheme option across a range of land uses, and three soil types. The increase
was the increase in production of irrigated land over dry land production.
The report compared financial returns under current land use with returns under irrigation for
different soil types and four different land uses - dairy, sheep & beef, mixed arable, viticulture.
An indication of the financial viability of irrigation, before the cost of water and existing debt
servicing were taken into account. Dairy, sheep & beef and mixed arable were then used for this
analysis.
Based on interviews with farmers and local rural professionals, and land use mixes of other actual
and proposed schemes elsewhere in New Zealand, the possible land use mix in the command
zone of each scheme option (not the whole Wairarapa valley) after irrigation is introduced was
predicted. Table 5 above ranks the scheme options according to their favourability to
increase disposable surplus income per irrigated hectare. Most favourable was Wakamoekau,
followed by Te Mara, then equally Black Creek and Tividale. White Rock was the second least
favourable and Mangatarere the least (WWUP, April 2015).
6 Rankings are comparative; 5 most favourable-1 least favourable. Raw scores are the weighted sum of sub-
themes.

29
7.2.5 Scheme economics Scheme economics measures the potential demand and rate of uptake of water by farmers and
growers. The measure used was cubic metres of water. In the MCA process, Scheme Economics
was given the least weight (5%) of the four financial sub-themes due to the preliminary nature
of the farmer surveys and the early estimations of demand and rate of uptake (WWUP, April
2015).
Demand for water
Throughout the Options Identification, Options Refinement and Prefeasibility phases of the
project the WWUP Working Group has engaged with farmers/landowners to broadly estimate
the potential demand for water. To date, farmers responsible for approximately 67 percent of
land area in the command areas have been interviewed (WWUP, April 2015).
During interviews with landowners, farmers and growers, they were asked about their interest
in accessing water to irrigate all or some of their land. Scheme options were then ranked
according to the level of interest expressed. It is important to note that the price of water, which
will be a key factor in uptake or water, was not available to be included in these discussions
(WWUP, April 2015).
As shown in Table 5 above, in the demand category the most favourable scheme was
Mangatarere, followed by Tividale, Te Mara and Wakamoekau, Black Creek with White Rock
Road being the least favourable.
In terms of command area locations, it is noted that:
• The White Rock Road and Tividale schemes would supply water to essentially independent
command areas, except for some minor overlap of Tividale and Black Creek.
• Te Mara, Wakamoekau, Black Creek and Mangatarere would supply water to command
areas that overlap substantially (T&T, June 2015).
Rate of uptake
During the demand interviews farmers were also asked when they thought they would buy
water after a scheme became operational. This factor is important because a minimum uptake
is likely to be required when a scheme becomes operational, providing revenue from the start.
During the interviews, farmers/landowners were asked “If irrigation scheme ‘user pays’ water
was made available to your farm, how many years later would you expect to make any
agricultural land use changes?” The responses to this fell into five categories:
1. <1 Demand indicated by existing land owners immediately
2. 1-2 years Demand indicated by existing land owners in the first 2 years
3. 3-5 years Demand indicated by existing land owners in the first 5 years
4. 6-10 years Demand indicated by existing land owners in the first 10 years
5. 10-20 years Unaccounted for demand
By calculating the potential volume of water demand in each category, compared with available
water, then dividing this by the average volume of water supplied each command area was
ranked (WWUP, April 2015).
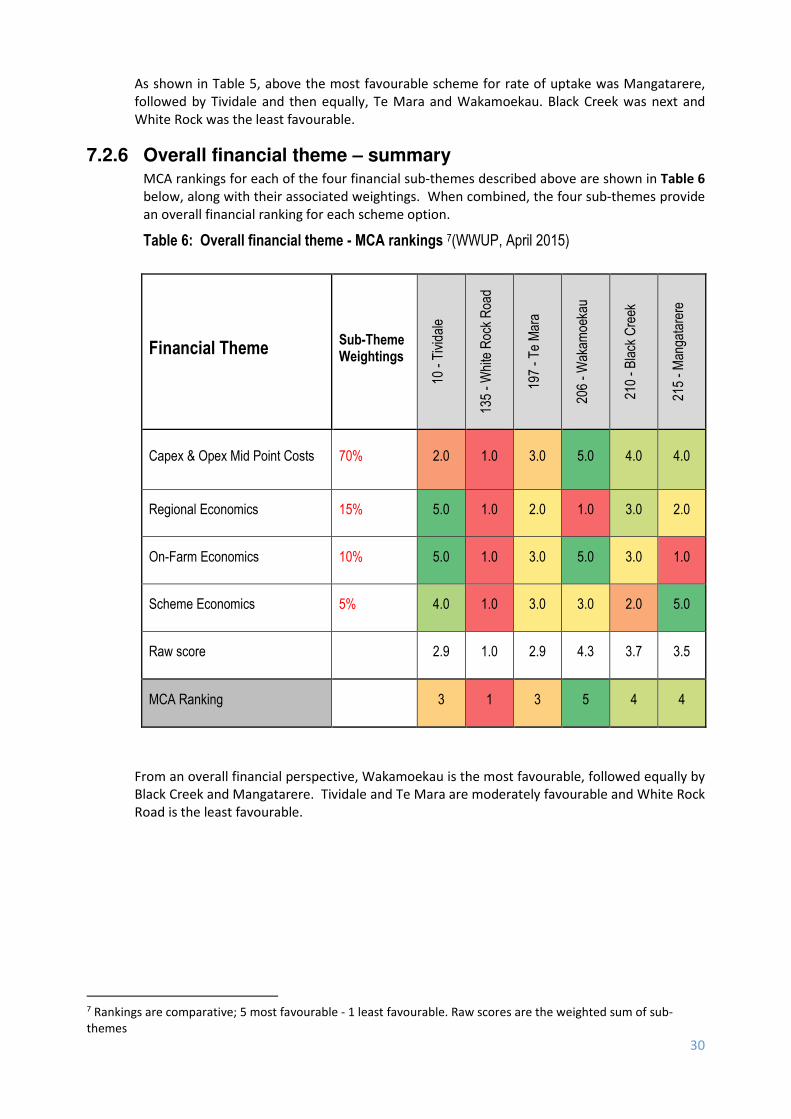
30
As shown in Table 5, above the most favourable scheme for rate of uptake was Mangatarere,
followed by Tividale and then equally, Te Mara and Wakamoekau. Black Creek was next and
White Rock was the least favourable.
7.2.6 Overall financial theme – summary MCA rankings for each of the four financial sub-themes described above are shown in Table 6
below, along with their associated weightings. When combined, the four sub-themes provide
an overall financial ranking for each scheme option.
Table 6: Overall financial theme - MCA rankings 7(WWUP, April 2015)
Financial Theme Sub-Theme Weightings
10 - T
ivid
ale
135
- W
hite
Roc
k R
oad
197
- Te
Mar
a
206
- W
akam
oeka
u
210
- Bla
ck C
reek
215
- M
anga
tare
re
Capex & Opex Mid Point Costs 70% 2.0 1.0 3.0 5.0 4.0 4.0
Regional Economics 15% 5.0 1.0 2.0 1.0 3.0 2.0
On-Farm Economics 10% 5.0 1.0 3.0 5.0 3.0 1.0
Scheme Economics 5% 4.0 1.0 3.0 3.0 2.0 5.0
Raw score
2.9 1.0 2.9 4.3 3.7 3.5
MCA Ranking
3 1 3 5 4 4
From an overall financial perspective, Wakamoekau is the most favourable, followed equally by
Black Creek and Mangatarere. Tividale and Te Mara are moderately favourable and White Rock
Road is the least favourable.
7 Rankings are comparative; 5 most favourable - 1 least favourable. Raw scores are the weighted sum of sub-
themes

31
Testing to analyse how sensitive the overall scheme rankings were to the relative weightings of
the four sub-themes is shown in Table 7 below. When the weightings were adjusted, scheme
rankings showed very little sensitivity and were largely unchanged. Tividale becomes more
favourable when Regional, On-farm and Scheme Economics are given more weight.
Table 7: Sensitivity testing on overall financial ranking8 (WWUP, April 2015
Financial Sensitivity Testing
C&O: Capex & Opex mid-point costs
Reg: Regional economics
OFS: Off-farm scheme economics
SE: Scheme economics
10
- T
ivid
ale
13
5 -
Wh
ite
Ro
ck R
oa
d
19
7 -
Te
Ma
ra
20
6 -
Wa
kam
oe
kau
21
0 -
Bla
ck C
ree
k
21
5 -
Ma
ng
ata
rere
50% C&O,
16.66%Reg,16.66%OFS,16.66%SE 4 1 3 5 4 4
60% C&O,
20%Reg,12.5%OFS,7.5%SE 3 1 2 5 4 4
60% C&O,
13.33%Reg,13.33%OFS,13.33%SE 3 1 2 5 4 4
70% C&O, 15%Reg,10%OFS,5%SE 3 1 3 5 4 4
70% C&O, 10%Reg,10%OFS,10%SE 3 1 3 5 4 4
80% C&O, 10%Reg,7.5%OFS,2.5%SE 2 1 3 5 4 4
80% C&O,
6.66%Reg,6.66%OFS,6.66%SE 2 1 3 5 4 4
7.3 Social theme The social theme of the MCA considered four sub-themes – community dislocation in inundated
areas, loss of employment, temporary construction effects and recreation impacts and
opportunities.
It did not include regional social benefits and impacts because information gathered on these
was not scheme-specific and therefore did not contribute to a comparison of schemes for
selection purposes.
This will be an area of further investigation in the Feasibility phase of work. These were
described in the Taylor Baines & Associates report Preliminary Social Impact Assessment,
October 2014.
8 Rankings are comparative; 5 most favourable - 1 least favourable.

32
7.3.1 Community dislocation in inundated areas The estimated number of permanent residents in the area within each water storage reservoir
option was considered and taken into account when comparing the five scheme options.
Community dislocation is a measure of the approximate number of people who would need to
leave their place of residence to allow for the construction of the reservoir.
A weighting of 50% was applied to this sub-theme as part of the overall social theme. This
relatively high weighting reflects the effect of the storage reservoirs displacing people from
their homes. Table 8 below ranks the scheme options with respect to the estimated numbers
of people involved.
Table 8 - Community dislocation in inundated areas - MCA rankings9 (WWUP, April 2015)
Note: Resident numbers are estimates. Compensation for loss of assets and/or land is accounted for in
the Financial Theme.
With respect to community dislocation, Te Mara is the most favourable option, with
Wakamoekau and Tividale equally next most favourable. White Rock is moderately favourable.
Due to the number of people living in the areas, Mangatarere and Black Creek are the least
favourable.
7.3.2 Loss of employment in inundated areas Loss of employment in inundated areas is a measure of the approximate number of full time
equivalent (FTE) jobs that would be lost within the reservoir areas. Some of these would be
temporary as people working in these areas could use their expertise in other areas in
Wairarapa or elsewhere as they chose. A weighting of 10% has been applied to this measure
as part of the overall social theme.
Table 9 below estimates the number of employees that could be expected to be displaced for
each of the scheme options. It excludes any new opportunities created.
Table 9 - Loss of employment in inundated areas - MCA rankings10 (WWUP, April 2015)
9 Rankings are comparative; 5 most favourable - 1 least favourable. 10 Rankings are comparative; 5 most favourable - 1 least favourable.
Community dislocation
10
- T
ivid
ale
13
5 -
Wh
ite
Ro
ck
19
7 -
Te
Ma
ra
20
6 -
Wa
kem
oe
ka
u
21
0 -
Bla
ck C
ree
k
21
5 -
Ma
nga
tare
re
Estimated permanent residents 2 8 1 4 39 18
MCA Ranking 4 3 5 4 1 2

33
With respect to loss of employment in inundated areas, Tividale and White Rock were the most
favourable scheme options. Te Mara and Wakamoekau were equally moderately favourable.
Mangatarere was the second least favourable and Black Creek the least favourable.
7.3.3 Temporary construction effects A preliminary assessment of the social effects of scheme construction that may be temporarily
experienced by groups such as residents, farmers, infrastructure companies and/or users and
recreationalists has been made for each scheme option for comparative purposes.
The temporary effects of scheme construction include digging, dam construction,
transportation of materials, extra traffic, more trucks on the road and the digging of pipe
networks. A weighting of 10% has been applied to this measure as part of the overall Social
theme (see Table 12 below).
MCA rankings for temporary social impacts associated with construction are shown in Table 10
below.
Table 10: Temporary construction effects - MCA rankings11 (WWUP, T&T, 2015)
Note: The rationale behind these scores is based on one possible approach to construction given
the current level of investigation. Details are likely to change with further investigation.
11 Rankings are comparative; 5 most favourable - 1 least favourable. Raw scores are the weighted sum of the
sub-themes.
Loss of employment
10
- T
ivid
ale
13
5 -
Wh
ite
Ro
ck
19
7 -
Te
Mar
a
20
6 -
Wak
amo
ekau
21
0 -
Bla
ck C
reek
21
5 -
Man
gata
rere
Estimated FTEs displaced 0 0 1 1 4 2
MCA Ranking 5 5 3 3 1 2
Temporary
construction effects
Sub-theme
weightings
10
- T
ivid
ale
13
5 -
Wh
ite
Ro
ck R
oa
d
19
7 -
Te
Ma
ra
20
6 -
Wa
ka
mo
ek
au
21
0 -
Bla
ck C
ree
k
21
5 -
Ma
ng
ata
rere
Borrow from off-site 20% 2 3 3 4 5 1
Spoil 10% 4 2 5 4 3 1
Impacts immediately at site 30% 2 1 4 5 4 1
Impacts of distribution
network construction40% 5 3 3 3 1 2
Raw score 3.4 2.3 3.5 3.9 2.9 1.4
MCA Ranking 4 2 4 5 3 1

34
With respect to temporary construction effects, Wakamoekau is the most favourable option,
followed equally by Tividale and Te Mara. Black Creek is moderately favourable. White Rock
Road and Mangatarere are the least favourable options.
7.3.4 Recreation implications and opportunities As part of the Prefeasibility phase, a high-level preliminary view of the implications and
opportunities for recreation presented by each of the scheme options was undertaken by Opus
International Consultants. This was included in the Prefeasibility study at the request of the
Stakeholder Advisory Group.
The purpose of the Opus Preliminary Recreation Implications and Opportunities Report, October
2014 was to provide a desk-top study of the current recreation activities undertaken at the five
water storage sites being considered, and understand the potential implications on these
activities as a result of the project. Consideration was also been given to the opportunities
associated with the potential water storage sites including potentially improved up/down
stream flows, through seasonal environmental and flushing flows.
Background research in the form of a brief site visit to each site, literature research and
consultation was undertaken to inform the Preliminary Report. Early in the assessment, a key
contacts comprising the WWUP Stakeholder Advisory Group (SAG) and key current and
potential stakeholders were sent a questionnaire and to inform the recreation assessment.
These included potential users of the water storage sites such as kayaking groups.
Table 11 below presents the MCA rankings for the recreation sub-theme which was comprised
of three sub-themes; location, implications for existing recreation activities and new
opportunities.
Table 11: Recreation theme MCA - rankings12 (Opus, 2014)
Note: At the time the Preliminary Report was done by Opus International Consultants,
Wakamoekau was part of the Black Creek site. It is now being considered as a standalone scheme.
The MCA ranking of 4 has been agreed by Opus as appropriate.
With respect to recreation, Black Creek is the most favourable scheme, followed by
Wakamoekau. Te Mara is moderately favourable. Tividale and White Rock Road are equally
ranked next. Mangatarere is the least favourable for recreation.
12 Rankings are comparative;5 most favourable-1 least favourable. Raw scores are the weighted sum of sub-
themes.
RecreationSub-theme
weightings
10
- T
ivid
ale
13
5 -
Wh
ite
Ro
ck R
oa
d
19
7 -
Te
Ma
ra
20
6 -
Wa
ka
mo
ek
au
21
0 -
Bla
ck C
ree
k
21
5 -
Ma
ng
ata
rere
Location 20% 1 3 3 5 2
Implications for existing
recreation activities 30% 5 3 1 4 1
New opportunities 50% 1 2 4 5 2
Raw Score 2.2 2.5 2.9 4.7 1.7
MCA Ranking 2 2 3 4 5 1

35
7.3.5 Overall social theme - summary When combined, the four social sub-themes described above provide an overall social ranking
for each scheme option.
The combined MCA rankings for the four social sub-themes are shown in Table 12 below, along
with their associated weightings:
Table 12: Social theme summary - MCA rankings13 (Opus, 2014; T&T, 2015; WWUP, 2015)
The weighting of the social factors, the most important sub-theme being identified as the effect of the
storage reservoirs displacing people from their homes/place of work; hence the relatively high weighting
applied. Principally for this reason, Black Creek and Mangatarere are ranked lowest overall.
Mangatarere consistently received low rankings for all social sub-themes, whereas Black Creek received
mid-range scores for two of four sub-themes, namely construction effects and recreation, but because
of Black Creek’s scale it is ranks lowest on two sub-themes.
The 30% weighting for recreation reflects the more permanent/ongoing outcomes and impacts to the
region compared with the more transitional effects of the loss of employment and temporary
construction effects sub-themes.
Even though Wakamoekau and Black Creek have overlapping storage areas, the difference between them
lies in the number of residents affected by each scheme.
Sensitivity testing of the four social sub-themes which make up the overall social theme rankings tested
the effect that different weightings had on the scheme rankings. This is shown in Table 13 below. The
most notable outcomes from the sensitivity testing were that irrespective of the weightings:
• Wakamoekau remained the most favourable scheme
• Mangatarere remained the least favourable scheme
• All sites were insensitive or almost insensitive to a change of weightings.
13 Rankings are comparative; 5 most favourable-1 least favourable.
Prefeasibility MCA
Social Theme
Sub-Theme
Weightings
10
- T
ivid
ale
13
5 -
Wh
ite
Ro
ck R
oad
19
7 -
Te
Ma
ra
20
6 -
Wak
amo
ekau
21
0 -
Bla
ck C
ree
k
21
5 -
Ma
nga
tare
re
Community Dislocation 50% 4 3 5 4 1 2
Loss of Employment 10% 5 5 3 3 1 2
Temp Construction Effects 10% 4 2 4 5 3 1
Recreation 30% 2 2 3 4 5 1
Raw score 3.5 2.8 4.1 4.0 2.4 1.6
MCA Ranking 4 3 5 5 2 1

36
Table 13: Social sub-themes - MCA sensitivity testing14 (WWUP, April 2015)
SOCIAL Sub-Themes Sensitivity Testing
Sub -Theme Abbreviations:
10 - T
ivid
ale
135
- W
hite
Roc
k R
oad
197
- Te
Mar
a
206
- W
akam
oeka
u
210
- Bla
ck C
reek
215
- M
anga
tare
re
CD - Community Dislocation
LE - Loss of Employment
CE - Temporary Construction effects
Rec - Recreation
CD 50%, LE 10%, CE 10%, Rec 30 % 4 3 5 5 2 1
CD 40%, LE 15%, CE 15%, Rec 30 % 4 3 5 5 2 1
CD 30%, LE 20%, CE 20%, Rec 30 % 4 3 5 5 2 1
CD 20%, LE 25%, CE 25%, Rec 30 % 4 3 4 5 2 1
CD 10%, LE 30%, CE 30%, Rec 30 % 4 3 4 5 2 1
CD 40%, LE 10%, CE 10%, Rec 40 % 3 2 5 5 2 1
CD 30%, LE 10%, CE 10%, Rec 50 % 3 2 4 5 3 1
CD 25%, LE 25%, CE 25%, Rec 25 % 4 3 4 5 3 1
CD 10%, LE 40%, CE 40%, Rec 10 % 4 3 4 5 3 1
7.4 Environmental theme The Prefeasibility environmental assessment was a desk-top study of the ecological values
within the reservoir footprints and the stream/river(s) affected. More detailed environmental
assessments, including of the effects of land use change will be carried out in the feasibility
phase. At this stage, issues relating to the National Policy Statement for Freshwater
Management (NPS) are presented as environmental risks and opportunities in Appendix B.
As outlined in Section 2.2, separately from the WWUP, the Ruamāhanga Whaitua committee is
working to determine community values and needs and set the vision for the catchment as part
of the Regional Plan review. It will then create policies and rules for how land and water
resources are managed. Any water scheme developed would need to operate within the
Regional Plan’s water quality and quantity limits.
14 Rankings are comparative; 5 most favourable - 1 least favourable.

37
Two components were considered as part of the Environmental theme of the MCA - terrestrial
ecology and aquatic ecology. GWRC’s Biodiversity department initially undertook the
assessment of both of these aspects as reported in MCA scores for Environmental Theme (Jamie
Steer, GWRC).
MCA scores were calculated for the terrestrial and aquatic sub-themes for each of the water
storage options. Combined (terrestrial and aquatic) MCA scores were also calculated for each.
A peer review was then conducted by Dr Vaughan Keesing of Boffa Miskell which resulted in
some changes to several elements of the assessments. The rationale for and nature of the
changes made are outlined in the peer review report Wairarapa Water Use Project Ecological
Review (Boffa Miskell, 2015). It was agreed by the original author and the peer reviewer that
the peer reviewer’s adjustments would be used as the final MCA scores.
The principal outcomes of the peer review were:
• Decrease in the Mangatarere reservoir footprint from the most favoured to the least
favoured with respect to The LENZ (Land Environments of NZ) Threatened Environments
Classification (combined with presence of indigenous systems).
• switch in scores for Black Creek and Wakamoekau with Tividale and White Rock with
respect to the NIWA freshwater database.
With respect to point a. above, the primary difference between the initial assessment and the
peer review was the use of the LENZ threatened environment layer. The authors of the initial
assessment used the LENZ vegetation cover data to establish where value for potential
vegetation lay (irrespective of current land cover vegetation). They also used the LENZ data to
assess where under-represented categories of the “environment” were and which might be
returned to an indigenous system sometime in the future. It was considered that a more
relevant approach was to only value LENZ categories where indigenous vegetation is currently
present, which effectively meant the LENZ category had no influence where no indigenous
system is present. This approach was used to rework the LENZ classification analysis in the
terrestrial sub-theme previously undertaken.
With respect to point b. above, the peer reviewer conducted a re-analysis of the NIWA
freshwater database, and as a result made some changes to two categories namely ‘habitat for
indigenous fish species of conservation interest’ and ‘habitat for six or more migratory
indigenous fish species’.
7.4.1 Terrestrial Ecology Factors considered in the terrestrial ecology Prefeasibility assessment were as follows:
• Total number of hectares covered by the water storage footprint, including a 20-metre
buffer
• Land Environments of NZ (LENZ) classifications
• Existing ecosystem types identified using LCDB2
• Department of Conservation-administered estate, reserves and covenants
• Land covenanted by the Queen Elizabeth II National Trust
• The NZ Geopreservation Inventory which highlights the best examples of the wide diversity
of natural physical features and processes that together characterise each part of NZ.

38
Table 14 below presents the agreed MCA rankings for the terrestrial ecology aspects of the scheme
options, incorporating the peer review adjustments.
Table 14: Terrestrial ecology - MCA rankings15 (Boffa Miskell, 2015; GWRC, 2015)
With respect to terrestrial ecology, the most favourable site is clearly Wakamoekau. Te Mara is
moderately favourable (3). White Rock Road and Black Creek are next with an equal ranking of 2. The
least favourable sites are Tividale and Mangatarere with an equal ranking of 1.
7.4.2 Aquatic Ecology Factors considered in the aquatic ecology Prefeasibility assessment were as follows:
• Main watercourses (e.g. rivers, streams) and total length of watercourse affected.
• Presence of wetlands
• Draft Natural Resources Plan (Wellington region) rivers and lakes with significant
indigenous ecosystems
− High micro invertebrate community health
− Habitat for indigenous fish species of conservation interest
− Habitat for six or more migratory indigenous fish species
• Regional Policy Statement (RPS) rivers and lakes with significant indigenous ecosystems
− High micro invertebrate community health
− Habitat for threatened indigenous fish species
− Habitat for six or more migratory indigenous fish species
• Cawthron Highest Value Reaches for Fish
• Cawthron Sports Fish Spawning & Recruitment
• Draft Natural Resources Plan (Wellington Region) Trout Habitat
15 Rankings are comparative; 5 most favourable-1 least favourable. Raw scores are the weighted sum of sub-
themes
Pre-feasibility MCA
Environmental
(Terrestrial theme)
Sub-theme
weightings
10
- T
ivid
ale
13
5 -
Wh
ite
Ro
ck R
oa
d
19
7 -
Te
Ma
ra
20
6 -
Wa
ka
mo
ek
au
21
0 -
Bla
ck C
ree
k
21
5 M
an
ga
tare
re
Hectares 30% 2.0 4.5 4.5 5.0 1.0 5.0
LENZ Threatened
Environments Classification25% 3.0 2.0 4.0 4.5 5.0 1.0
Ecosystem types 15% 3.0 4.0 4.0 5.0 4.0 1.0
DoC land 10% 5.0 5.0 5.0 5.0 5.0 1.0
QEII 10% 2.0 3.0 1.0 5.0 1.0 5.0
NZ Geo-preservation 10% 5.0 1.0 5.0 5.0 5.0 5.0
Raw Score 3.0 3.4 4.1 4.9 3.3 3.0
MCA Ranking 1.0 2.0 3.0 5.0 2.0 1.0

39
Table 15 below presents the agreed MCA rankings for the aquatic ecology aspects of the scheme options,
incorporating the peer review adjustments:
Table 15: Aquatic ecology - MCA rankings16 (Boffa Miskell, 2015; GWRC, 2015)
The most favourable site is White Rock Road. Black Creek, Te Mara and Mangatarere (all 1) are the least
favourable sites.
Table 16 below summaries the agreed MCA rankings for the combined environmental values (terrestrial
and aquatic), incorporating the peer review adjustments.
Table 16: Overall environmental theme - MCA rankings17 (Boffa Miskell, 2015; GWRC, 2015)
For the combined terrestrial and aquatic sub-themes, Wakamoekau is the most favourable site, followed
by Black Creek. White Rock Road and Te Mara are ranked relatively favourably. Mangatarere and Tividale
are the least favourable options.
16 Rankings are comparative; 5 most favourable-1 least favourable. Raw scores are the weighted sum of sub-
themes 17 Rankings are comparative; 5 most favourable-1 least favourable. Raw scores are the weighted sum of sub-
themes
Prefeasibility MCA
Environmental
(Aquatic theme)
Sub-theme
weightings
10
- T
ivid
ale
13
5 -
Wh
ite
Ro
ck R
oa
d
19
7 -
Te
Ma
ra
20
6 -
Wa
ka
mo
ek
au
21
0 -
Bla
ck C
ree
k
21
5 M
an
ga
tare
re
Watercourses 30% 1 3.5 5 5 2.5 2.5
Wetlands 10% 5 5 1 5 5 5
Draft NRP rivers & lakes with
significant indigenous
ecosystems
30% 2 1 4 5 5 3
Cawthron highest value
reaches for fish10% 5 5 1 5 5 1
Cawthron sports fish spawning
& recruitment10% 5 5 1 5 5 1
Draft NRP trout habitat 10% 1 5 1 1 1 1
Raw score 2.5 3.4 3.1 4.6 3.9 2.5
MCA Ranking 1 3 2 5 4 1
Prefeasibility MCA
Environmental ThemeSub-Theme
Weightings
10
- T
ivid
ale
13
5 -
Wh
ite
Ro
ck R
oa
d
19
7 -
Te
Ma
ra
20
6 -
Wa
ka
mo
ek
au
21
0 -
Bla
ck C
ree
k
21
5 M
an
ga
tare
re
Terrestrial sub-theme scores 50% 1 2 3 5 2 1
Aquatic sub-theme scores 50% 1 3 2 5 4 1
Raw Scores 1 2.5 2.5 5 3 1
MCA Rankings 1 3 3 5 4 1

40
7.5 Māori cultural theme Joint discussions held with Wairarapa iwi members from Rangitāne o Wairarapa and Ngāti
Kahungunu ki Wairarapa identified opportunities for further development of the project’s
relationship with iwi. In addition, feedback was sought on cultural value of the areas covered
by the five scheme options. This included benefits, concerns, risks and opportunities.
These discussions and a review of previous work completed in the Options Refinement phase
formed the basis of the MCA rankings for the Māori Cultural sub-theme.
Subsequently, advice was provided by archaeologist Christine Barnett on known Māori
archaeological and historic sites of significance in her report Archaeological and Historic Sites -
Sites of Significance, April 2015.
This report was a desk-top study using existing historic and archaeological information; no field
work was conducted. It focused on the storage site options and gave secondary consideration
to the scheme command areas. This was because there is flexibility around the impact of the
distribution infrastructure which can be considered during the Feasibility phase (Barnett, 2015).
Christine Barnett’s report broadly covered the following:
a. Archaeological site recording: recorded and unrecorded sites.
b. Historic sites
c. Traditional trails and artefacts
d. The significance of all the historic and archaeological sites
e. Archaeological site information within the five preferred scheme areas
f. Legislation in New Zealand with regard to archaeological sites. (Barnett, 2015)
A subsequent meeting with members of both iwi was held on 18 May 2015 to review the draft
cultural report and scheme rankings. The scheme rankings as shown in Table below were
agreed:
Table 17: Māori cultural theme - MCA rankings18 (Barnett, 2015)
Prefeasibility MCA Cultural Theme
10 - T
ivid
ale
135
- W
hite
Roc
k R
oad
197
- Te
Mar
a
206
- W
akam
oeka
u
210
- Bla
ck C
reek
215
Man
gata
rere
Archaeological & Historic Sites Ranking
3.5 4.0 1.0 5.0 5.0 4.0
18 Rankings are comparative; 5 most favourable - 1 least favourable.

41
With respect to Maori archaeological and historic sites, Wakamoekau and Black Creek are equally
the most favourable options. Mangatarere and White Rock Road are also equally favourable.
Tividale is moderately favourable and Te Mara is clearly the least favourable.
In addition to the rankings above, the peer review process by iwi identified a number of
opportunities and risks from a cultural perspective which will be further developed during the
Feasibility phase.
7.6 Risks & Opportunities (scheme-specific)
7.6.1 Financial The risk scores for each scheme option developed for the MCA by Tonkin & Taylor focus on
potential cost increases or technical risks relating primarily to engineering components. The
focus of opportunity scores has been on potential cost savings, though the potential to
incorporate a hydropower add-on at dams was also considered (T&T, June 2015).
In order to put factors into a quantitative context and ensure the weightings reflect the likely
impact on overall scheme costs, consideration has been given to the component of net present
cost represented by each factor. Indicative weightings based on judgement have been assigned
for the hydro-power add-on opportunity and geotechnical risks for aspects not represented in
cost schedules (T&T, June 2015).
Overall risk and opportunity scores for each scheme were then developed based on a weighted
average across these factors. Finally, an adjustment was applied so that scores ranged from 1
‘least favourable’ to 5 ‘most favourable’ (T&T, June 2015).
Detailed thinking behind scores for each factor is provided in Appendix D of the Tonkin & Taylor
WWUP Prefeasibility report, noting that much of this thinking is relatively speculative and
subjective which is considered appropriate at this Prefeasibility phase (T&T, June 2015).
Table 18 and Table 19 below rank the relative technical and financial risks and opportunities
respectively for each of the scheme options:

42
Table 18: Engineering opportunities for cost savings - MCA rankings19 (T&T, June 2015)
In terms of opportunities for cost savings, Te Mara is clearly the most favourable, followed by Black Creek,
and then Mangatarere. Tividale and Wakamoekau are similarly moderately favourable. White Rock Road
is clearly the least favourable of the six schemes in terms of opportunities (T&T, June 2015).
The opportunities listed above can relate to matters which are yet to be investigated and which may
result in benefits and/or potential cost savings.
19 Rankings are comparative; 5 most favourable - 1 least favourable. Raw scores are the weighted sum of the
sub-themes or opportunity factors.
Engineering OpportunitiesSub-theme
weightings
10
- T
ivid
ale
13
5 -
Wh
ite
Ro
ck R
oa
d
19
7 -
Te
Ma
ra
20
6 -
Wa
kam
oe
kau
21
0 -
Bla
ck C
ree
k
21
5 -
Ma
ng
atar
ere
Hydropotential 3% 3 4 1 1 2 5
Potential for cost savings / optimisation of
public road realignment6% 5 5 1 1 1 2
Potential for cost savings / optimisation of extra
infrastructure for flow management i.e. buffer
pond and connecting channel
3% 5 1 2 1 4 1
Potential for cost savings / optimisation of dam
construction diversion6% 4 3 2 1 1 5
Potential cost savings / optimisation of dam
earthworks15% 2 1 5 4 4 3
Potential cost savings / optimisation of dam
spillways 5% 5 4 1 1 1 3
Potential cost savings / optimisation of dam
operational outlet works4% 1 4 4 4 3 5
Potential cost savings / optimisation of water
harvesting infrastructure (including electricity
for pumping)11% 1 1 5 5 4 1
Potential cost savings / optimisation of
distribution (including electricity for pumping) 40% 2 1 5 3 4 3
Potential cost savings / optimisation of land
purchase, easements, offset mitigation and fish
passage
8% 5 1 1 1 1 4
Raw opportunity score 2.7 1.7 3.8 2.8 3.2 3.0
Adjusted opportunity score
(1=Least favourable, 5=Most favourable) 2.8 1.0 5.0 3.1 3.8 3.4

43
Table 19: Engineering risks for additional costs/technical issues - MCA rankings20 (T&T, June 2015)
In terms of risks of cost increases and technical constraints, Te Mara is clearly the most favourable, very
closely followed by Wakamoekau and Mangatarere. Black Creek is less favourable to moderately
favourable in terms of risk. Tividale is the least favourable of the six schemes, though White Rock Road
only slightly more favourable than Tividale (T&T, June 2015).
There is unavoidable uncertainty across many areas given the Prefeasibility stage of investigation. In
combination, the many factors tend to balance each other out. Nevertheless, there is still the potential
for a ‘fatal flaw’ to arise with respect to one of these factors (T&T, June 2015).
20 Rankings are comparative; 5 most favourable - 1 least favourable. Raw scores are the weighted sum of the
sub-themes or risk factors.
Engineering RisksSub-theme
weightings
10
- T
ivid
ale
13
5 -
Wh
ite
Ro
ck R
oa
d
19
7 -
Te
Ma
ra
20
6 -
Wa
ka
mo
ek
au
21
0 -
Bla
ck C
ree
k
21
5 -
Ma
ng
ata
rere
Potential for additional costs / technical
issues due to geotechnical complexity &
uncertainty at dam sites
10% 3 1 5 4 2 4
Potential for additional cost / technical
issues for public road realignment5% 2 1 5 5 5 3
Potential for additional cost / technical
issues for extra infrastructure for
operational flow management i.e.
buffer pond and connecting channel
3% 1 3 5 5 3 5
Potential for additional cost / technical
issues for dam construction diversion5% 2 1 5 3 3 2
Potential for additional cost / technical
issues for dam earthworks (including
dead storage allowances, such as
sedimentation)
14% 1 2 5 4 3 4
Potential for additional cost / technical
issues for dam spillways5% 2 1 4 5 4 3
Potential for additional cost / technical
issues for dam operational outlet works3% 5 5 5 5 5 1
Potential for additional cost / technical
issues of water harvesting infrastructure
(including electricity for pumping)
10% 5 5 2 3 1 5
Potential for additional cost / technical
issues for distribution (including
electricity for pumping)
37% 1 2 4 4 3 5
Potential for additional cost / technical
issues for land purchase, easements,
offset mitigation and fish passage
7% 2 3 4 5 1 2
Raw Scores 2.0 2.3 4.2 4.1 2.8 4.1
Adjusted Risk scores
(1=Least favourable, 5=Most favourable)1.0 1.5 5.0 4.8 2.4 4.7

44
7.6.2 National Policy Statement for Freshwater Management (NPS) Environmental risks and opportunities for each of the scheme options have been developed as
the result of a workshop that focused on issues relating to the National Policy Statement for
Freshwater Management (NPS) and regarding water and nutrient allocation and efficiency. The
focus was on the relativity between the scheme options so that the differences could be
considered as part of the WWUP Prefeasibility decision-making process.
The following two extracts from the NPS provide further context for the workshop.
“This national policy statement sets out objectives and policies that direct local
government to manage water in an integrated and sustainable way, while
providing for economic growth within set water quantity and quality limits.
The national policy statement is a first step to improve freshwater
management at a national level.”
“Overall freshwater quality within a region must be maintained or improved.
This national policy statement allows some variability in terms of freshwater
quality, including between freshwater management units, as long as the
overall freshwater quality is maintained within a region.”
(Ministry for the Environment, 2014 Preamble p3, p4)
The outcomes of this workshop are presented in Appendix B, “Notes of workshop on
opportunities and risks related to the National Policy Statement on Freshwater Management”.
The NPS will have an impact on the future feasibility of the WWUP scheme options. This impact
will be better understood as the Ruamāhanga Whaitua process, the proposed Natural Resources
Plan and science modelling work described in Section 2.0 of this report evolves.
7.7 Other risks and opportunities (general) Risks and opportunities are not an integral part of the MCA summary rankings and sensitivity
analysis but rather an indicator of ‘known unknowns’. They are, however, taken into account
during the overall decision making process.
A record of all risks and opportunities that have been noted as a result of discussions with the
Stakeholder Advisory Group and within the WWUP Working Group is provided in Appendix C.
Where a risk or opportunity has been accounted for in the MCA process or referred to in
another report it has been removed.
8. Summary of results – comparisons of schemes
8.1 Summary table – MCA The MCA rankings for each of the four main themes; financial, social, environmental and
cultural, considered during the WWUP Prefeasibility phase are presented in Table 20 below,
together with their associated weightings. The weightings are consistent with those applied to
the four themes in the previous phase of the WWUP, Options Refinement. When combined
and weighted, the four main themes provide an overall ranking for each scheme option.
From an overall perspective, Wakamoekau appears to be the most favourable scheme (5),
followed by Black Creek with a ranking of 4. Mangatarere is moderately favourable with an
overall ranking of 3. Tividale and Te Mara are next with an equal ranking of 2. White Rock Road
is the least favourable scheme option with a ranking of 1.

45
Table 20: Combined themes – MCA rankings21
(Barnett, 2015; Boffa Miskell 2015; GWRC, 2014; Opus, 2014; T&T, 2015; WWUP, 2015)
8.2 Sensitivity analysis – overall
As Table 21 below indicates, four of the scheme options are relatively insensitive to varying the
financial and combined social/environmental/cultural weightings.
No matter what weighting is applied, Wakamoekau is consistently the most favourable scheme
from an overall perspective, followed by Black Creek which is also insensitive to weightings. Te
Mara and Tividale are also relatively insensitive. When more weight is given to
social/environmental/cultural factors, Mangatarere is highly sensitive and becomes the least
favourable. When more weight is given to financial factors, White Rock is highly sensitive and
becomes the least favourable of the scheme options.
21 Rankings are comparative; 5 most favourable - 1 least favourable.
Combined Themes MCA
Rankings
Weightings are based on Options Refinement
MCA pre-sensitivity testing weighting
Theme
weightings
10
- T
ivid
ale
13
5 -
Wh
ite
Ro
ck R
oa
d
19
7 -
Te
Ma
ra
20
6 -
Wa
kam
oek
au
21
0 -
Bla
ck C
ree
k
21
5 -
Ma
ng
ata
rere
Financial 70% 3.0 1.0 3.0 5.0 4.0 4.0
Social 10% 4.0 3.0 5.0 5.0 2.0 1.0
Environmental 10% 1.0 3.0 3.0 5.0 4.0 1.0
Cultural 10% 3.5 4.0 1.0 5.0 5.0 4.0
Raw Combined Score 3.0 1.7 3.0 5.0 3.9 3.4
MCA Ranking 2 1 2 5 4 3
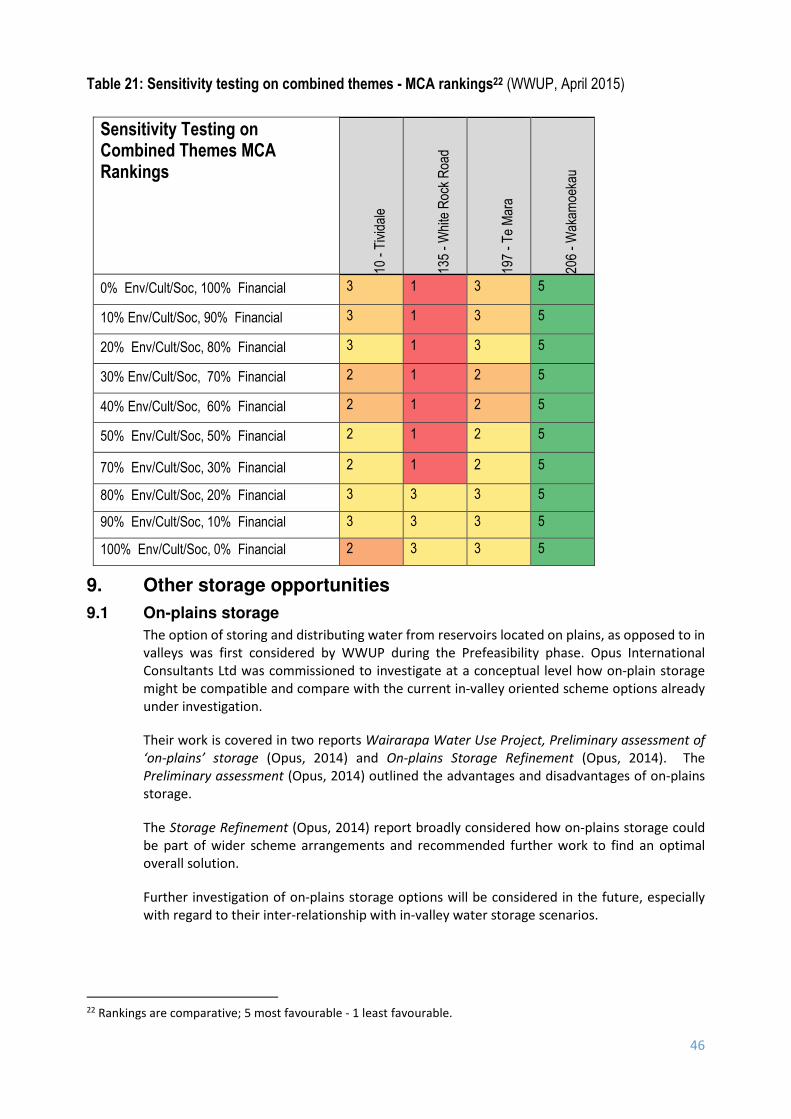
46
Table 21: Sensitivity testing on combined themes - MCA rankings22 (WWUP, April 2015)
Sensitivity Testing on Combined Themes MCA Rankings
10 - T
ivid
ale
135
- W
hite
Roc
k R
oad
197
- Te
Mar
a
206
- W
akam
oeka
u
0% Env/Cult/Soc, 100% Financial 3 1 3 5
10% Env/Cult/Soc, 90% Financial 3 1 3 5
20% Env/Cult/Soc, 80% Financial 3 1 3 5
30% Env/Cult/Soc, 70% Financial 2 1 2 5
40% Env/Cult/Soc, 60% Financial 2 1 2 5
50% Env/Cult/Soc, 50% Financial 2 1 2 5
70% Env/Cult/Soc, 30% Financial 2 1 2 5
80% Env/Cult/Soc, 20% Financial 3 3 3 5
90% Env/Cult/Soc, 10% Financial 3 3 3 5
100% Env/Cult/Soc, 0% Financial 2 3 3 5
9. Other storage opportunities
9.1 On-plains storage
The option of storing and distributing water from reservoirs located on plains, as opposed to in
valleys was first considered by WWUP during the Prefeasibility phase. Opus International
Consultants Ltd was commissioned to investigate at a conceptual level how on-plain storage
might be compatible and compare with the current in-valley oriented scheme options already
under investigation.
Their work is covered in two reports Wairarapa Water Use Project, Preliminary assessment of
‘on-plains’ storage (Opus, 2014) and On-plains Storage Refinement (Opus, 2014). The
Preliminary assessment (Opus, 2014) outlined the advantages and disadvantages of on-plains
storage.
The Storage Refinement (Opus, 2014) report broadly considered how on-plains storage could
be part of wider scheme arrangements and recommended further work to find an optimal
overall solution.
Further investigation of on-plains storage options will be considered in the future, especially
with regard to their inter-relationship with in-valley water storage scenarios.
22 Rankings are comparative; 5 most favourable - 1 least favourable.

47
9.2 Reserve scheme options
Three schemes were set aside as ‘reserve’ options at the beginning of the Prefeasibility phase
as alternatives to some of the six scheme options investigated during this phase. They were
Kiriwhakapapa (Scheme 200), Te Ore Ore (Scheme 63) and Martinborough South (Scheme 175).
These reserve scheme options were not investigated during Prefeasibility because none of the
six preferred scheme options were discounted during this phase.
48
Acknowledgements
The Wairarapa Water Use Project acknowledges the many organisations and individuals who contributed
to the Prefeasibility investigations outlined in this summary report.
We particularly acknowledge and thank the owners of property who gave permission for members of the
Working Group and consulting engineers to enter their property for site walk-overs and initial
geotechnical investigations. We also acknowledge the owners and occupiers of properties within the six
possible reservoir sites and the three reserve sites and recognise the uncertainty that the investigations
have caused them.
We acknowledge and thank the members of the WWUP Governance Group and Leadership Group, and
the member organisations of the Stakeholder Advisory Group (see Appendix A), and staff of the Ministry
for Primary Industries’ Irrigation Acceleration Fund.
We appreciate the work carried out by a range of consultants who have provided expert input into this
phase of work, particularly Tonkin & Taylor, Baker and Associates, Butcher Partners, Taylor Baines and
Associates, Opus International Consultants, staff of Ngāti Kahungunu ki Wairarapa and Rangitāne o
Wairarapa, Christine Barnett and staff of GWRC (Wellington and Wairarapa).

49
References
Tonkin & Taylor, Wairarapa Water Use Project Prefeasibility Phase - Engineering Report (June 2015)
PricewaterhouseCoopers, Memo, WWUP Cost Analysis (April 2015)
Butcher Partners, Regional Economic Impact Analysis (October 2014)
Baker & Associates, Land use affordability under irrigation (April 2014)
WWUP Working Group, Preliminary Regional, On-farm and Scheme Economics (May 2015)
Taylor Baines & Associates Preliminary Social Impact Assessment (October 2014)
Opus International Consultants Ltd, Opportunities and implications for Recreation (October 2014)
Jamie Steer, GWRC Biodiversity Department, MCA scores for Environmental Theme (March 2015)
Dr Vaughan Keesing, Boffa Miskell, Wairarapa Water Use Project Ecological Review (May 2015)
Christine Barnett, Māori Archaeological and Historic Sites - Sites of Significance (April 2015)
Opus International Consultants Ltd, Preliminary Assessment of On-Plain Storage (April 2014)
Opus International Consultants Ltd, On-Plains Storage Refinement (September 2014)
Ministry for the Environment, National Policy Statement for Freshwater Management (2014)

50
Appendices
Appendix A: WWUP Governance, Stakeholder Advisory and Leadership Group Membership
Appendix B: Notes of workshop on opportunities & risks related to the National Policy Statement for Freshwater
Appendix C: Risks & opportunities (general)

51
Appendix A: Wairarapa Water Use Project Governance, Stakeholder and Leadership group membership
WWUP Governance Group (GG) - membership
Bob Francis Chairman
Mandy Armstrong Environmental interest groups representative
John Booth Carterton Mayor (representing Wairarapa’s district councils)
Jason Kerehi Rangitāne o Wairarapa
Jim Lynch Independent Chair, WWUP Stakeholder Advisory Group
Nelson Rangi Ngati Kahungunu ki Wairarapa Chair
Bob Tosswill Wairarapa Regional Irrigation Trust Chair
Fran Wilde Greater Wellington Regional Council Chair
WWUP Stakeholder Advisory Group (SAG) - member organisations
Carterton District Council
Department of Conservation
Federated Farmers Wairarapa
Fish and Game
Forest and Bird
Greater Wellington Regional Council
Grow Wellington
Masterton District Council
Ngāti Kahungunu ki Wairarapa
Council of Outdoor Recreation Associations of New Zealand
Rangitāne o Wairarapa
Regional Public Health
South Wairarapa District Council
Sustainable Wairarapa
Wairarapa Chamber of Commerce
Wairarapa Development Group
Wairarapa Regional Irrigation Trust
Wairarapa Water Users Society
White Water NZ
Jim Lynch, Independent Chairman
WWUP Leadership Group (LG) - membership
Fran Wilde (Chair) Chair, Greater Wellington Regional Council
Lyn Patterson Masterton Mayor
John Booth Carterton Mayor
Adrienne Staples South Wairarapa District Mayor
Nelson Rangi Ngati Kahungunu ki Wairarapa Chair
Siobhan Garlick Rangitāne o Wairarapa
Mandy Armstrong Environment & Recreation interest groups representative
Gary McPhee Wairarapa Constituent Regional Councillor, GWRC
Gerard Quinn Chief Executive, Grow Wellington
Bob Tosswill Chair, Wairarapa Regional Irrigation Trust
Bob Francis Chair, Wairarapa Water Use Project Governance Group
Alastair Scott MP for Wairarapa
Jim Lynch Independent Chair, WWUP Stakeholder Advisory Group
Kevin Steel Ministry for Primary Industries Irrigation Acceleration Fund Manager

52
APPENDIX B: Notes of workshop on opportunities & risks related to the National Policy Statement on Freshwater Management
Note these are potential opportunities & risks – i.e. aspects or issues that could be considered in the future many of which have not been ‘tested’ or verified, or canvassed with interested &/or affected parties
OPPORTUNITIES 10 - Tividale 135 - White Rock Road 197 - Te Mara 206 - Wakamoekau 210 - Black Creek 215 - Mangatarere Other considerations
Efficiency Dividends
Release' of consent water from part
of the Moroa water race, existing &
future irrigation
Existing & future irrigation, Supply
of town water from cat A
groundwater, therefore not allocation
related
Release' of consented water from
MDC &/or CDC urban water
supplies, Taratahi water race,
existing & future irrigation
‘Release' of consented water from
MDC urban water supply, Taratahi
water race, existing & future
irrigation – but less than Black
Creek
‘Release' of consented water from
MDC urban water supply, Taratahi
water race, existing & future
irrigation
‘Release' of consented water from
MDC &/or CDC urban water
supplies, Carrington &/or part
Taratahi water race, existing &
future irrigation
White Rock - town water supply
from cat A groundwater, therefore
not allocation related efficiency
dividend
Increased security of supply
(quality & quantity – less than BC
Could feed MDC WTP
Driver for strategic renewal of
assets
Water races & town water supply ,
but limitedLimited to town supply
Water races & town water supply –
but less than BC
Water races & town water supply –
but less than BCWater races & town water supply Water races & town water supply
Quality of stock drinking water Water races & town water supply –
but less than BC
Improvement through piping c.f.
drainsImprovement through piping Improvement through piping
Reallocation of waterProvides more choice for multiple
uses
Provides more choice for multiple
uses – but less than BC
Provides more choice for multiple
uses
Provides more choice for multiple
uses
Henley Lake waterImproved water quality via
Ruamahanga River in summer
Flushing flows Includes flows in summer &
flushing, & supply existing users
Includes flows in summer &
flushing, & supply existing users
Includes flows in summer &
flushing, & supply existing users
Includes flows in summer &
flushing, & supply existing users
Applicable to Black creek &
Wakamoekau stream
Includes flows in summer &
flushing, & supply existing users
Efficiency potential ‘New’ take ‘New’ takeReallocation of existing users
leading to higher efficiency potential
Reallocation of existing users
leading to higher efficiency potential
Reallocation of existing users
leading to higher efficiency potential
Reallocation of existing users
leading to higher efficiency potential
RISKS Tividale White Rock Te Mara Wakamoekau Black Creek Mangatarere Other considerations
Environmental valuesLoss of water race values if
removed/changed
Loss of water race values if
removed/changed
Loss of water race values if
removed/changed
Loss of water race values if
removed/changed
Water Transfer mechanismRequires a policy or ‘deal’ & willing
parties
Requires a policy or ‘deal’ & willing
parties
Requires a policy or ‘deal’ & willing
parties
Requires a policy or ‘deal’ & willing
parties
Requires a policy or ‘deal’ & willing
parties
e.g. water races &/or urban water
supplies
Scale of water body affected by
the damSmall river Small river Small stream Very small stream 2 small streams Small river Note stream & river references
Scale of reservoir/water storedCan storage capacity supply
benefits
Can storage capacity supply
benefits
Can storage capacity supply
benefits
Can storage capacity supply
benefits-
Can storage capacity supply
benefits
Changed river flowsPartial reverse flow volumes – higher
summer, lower winter
. Partial reverse flow volumes –
higher summer, lower winter
Partial reverse flow volumes – higher
summer, lower winter
Partial reverse flow volumes – higher
summer, lower winter
Partial reverse flow volumes – higher
summer, lower winter on
Wakamoekau stream.
Partial reverse flow volumes – higher
summer, lower winter
Proximity of irrigation areas to
natural water bodies
Proximity to lake/river – N&P losses
through increased production
Balances with opportunity re
nutrient headroom gain
Water losses‘Loss’ of conveyed water through
river seepage
Loss’ of conveyed water through
river seepage
Loss’ of conveyed water through
river seepage
Sediment Transfer
Flows will transport sediment to
Ruamahanga faster than natural
progression.
Sediment is not natural to Tauweru
River – stones are
2,800/9,700ha = 0.29
The greatest ‘headroom’ gains may
exist where most irrigation/LUI
currently exists . Also note,
headroom can be shifted
geographically.
Nutrient head room (based on
existing net irrigated area cf
command net irrigable area)
4,700/9,800ha = 0.48 Largest ratio
of existing irrigation - largest opp for
headroom gains
2,700/7,600 ha = 0.36 2,500/9,700 ha = 0.26
1,900/8,100ha = 0.23 Lowest ratio
of existing irrigation - least opp. for
headroom gains
7,400/19,700ha = 0.38
Flow Augmentation
70km stretch of enhanced flows &
possibility of Tauweru R returning to
stones An addition 17 km of
Ruamahanga River enhanced
by scheme water before
extraction point.
13 km enhanced by scheme water
before extraction plus additional 5
km enhanced by residual flows
before confluence with Ruamahanga
River.
- 3km enhanced by residual
flows to the confluence with
Kiriwhakapapa stream/Waipoua
River
- Wakamoekau stream
enhanced by residual flows for
10km before confluence with
Waipoua River.
- Wakamoekau stream
enhanced by residual flows for
10km before confluence with
Waipoua River.
2km enhanced by scheme water
with further 18km enhanced by
residual flows before confluence with
Waiohine River .
Urban Water Supply No urban supply possibilitiesExisting irrigation (grapes) could be
transferred to town supply
Increased security of supply – but
less than BC
Increased security of supply – but
less than BCIncreased security of supply

53
Appendix C: Risks & opportunities (general)
The following are general risks and opportunities that do not relate to specific scheme options and were
not included in engineering and cultural risks/opportunities in Prefeasibility. This list was largely
generated by the WWUP Stakeholder Advisory Group (SAG) with input from the WWUP Working Group.
Opportunities
• Regional self-determination and sufficiency
• Increased GDP within region and NZ
• Increased population leads to regional growth
• New industry to add value by processing primary produce
• Could allow for development for all alternative land uses – vineyards, horticulture, agriculture,
orchards, silviculture (not just dairy)
• Opportunity to increase the quality of life of Wairarapa people by costing in a sophisticated benefit
system that includes benefits that don’t just relate to financial gain
• Some native fish, birds and plants could have a suitable environment created
• Increase the amount of natural capital and ecosystem services by including an extensive programme
of habitat enhancement in project costs
• River management costs could be reduced by moderating extreme flood events
• Use of buffer ponds to improve water reliability especially where river conveyancing is used
• River/stream flushing flow used for other activities
• Opportunity to teach tamariki traditional water sports
• Waterfowl hunting opportunity
• Native fish as long as predatory fish are managed
• Create good road access for recreation
• On-farm cost savings (pressure at gate)
• Energy/power supply - hydro potential
• Staged development
Risks
• Lack of uptake of scheme water by farmers
• Inability to fund project
• Time and cost of consenting process
• Legal challenges and consenting
• Difficulty in creating distribution networks across private land
• Water quality threatened by increased nutrients from intensified farming
• Life supporting capacity not maintained
• Increased periphyton/slime for extended periods
• Ability to provide fish passage
• More flow abstracted from rivers than anticipated (river takes)
• Water loss from evaporation
• Catastrophic climate events
• Degraded environment in Tararua Forest Park
• Earth flows due to more saturated land
• Potential for reduced gravel transport affecting river bed
• Ability of region’s roading and infrastructure network to cope during construction
• Water level fluctuations restrict recreation for some of the year
• Less chance of recharge in dry summers
• Management of river conveyance
• Time for water to flow down river where river is used for conveyance

54
• Loss of traditional stories
• Influx of migrant workers to service farms – schooling pressures
• Amalgamation of farms makes recreational access more difficult
• ‘Corporate farms’ change culture