waiting time policies contents in the health sector - qs health policy studies waiting time policies...
TRANSCRIPT

OECD Health Policy Studies
Waiting Time Policies in the Health Sector WHAT WORKS?Contents
Executive summary
Part I. OverviewChapter 1. Waiting times for heath care: A conceptual framework
Chapter 2. Measuring waiting times across OECD countries
Chapter 3. A review of waiting times policies in 13 OECD countries
Part II. Review of waiting times policies: Country case studiesChapter 4. Australia
Chapter 5. Canada
Chapter 6. Denmark
Chapter 7. Finland
Chapter 8. Ireland
Chapter 9. Italy
Chapter 10. Netherlands
Chapter 11. New Zealand
Chapter 12. Norway
Chapter 13. Portugal
Chapter 14. Spain
Chapter 15. Sweden
Chapter 16. United Kingdom
ISBN 978-92-64-17906-6 81 2012 09 1 P -:HSTCQE=V\^U[[:
Waitin
g T
ime P
olicies in th
e Health S
ector W
HA
T W
OR
KS
?O
EC
D H
ealth Po
licy Stu
dies
OECD Health Policy Studies
Waiting Time Policies in the Health Sector WHAT WORKS?
Consult this publication on line at http://dx.doi.org/9789264179080-en
This work is published on the OECD iLibrary, which gathers all OECD books, periodicals and statistical databases. Visit www.oecd-ilibrary.org for more information.


OECD Health Policy Studies
Waiting Time Policiesin the Health Sector
WHAT WORKS?
Luigi SicilianiMichael Borowitzand Valerie Moran

This work is published on the responsibility of the Secretary-General of the OECD. The
opinions expressed and arguments employed herein do not necessarily reflect the official
views of the Organisation or of the governments of its member countries.
This document and any map included herein are without prejudice to the status of or
sovereignty over any territory, to the delimitation of international frontiers and boundaries
and to the name of any territory, city or area.
ISBN 978-92-64-17906-6 (print)ISBN 978-92-64-17908-0 (PDF)
Series: OECD Health Policy StudiesISSN 2074-3181 (print)ISSN 2074-319X (online)
The statistical data for Israel are supplied by and under the responsibility of the relevant Israeli authorities. The useof such data by the OECD is without prejudice to the status of the Golan Heights, East Jerusalem and Israelisettlements in the West Bank under the terms of international law.
Photo credits: Cover © Alexandre Lukin/Shutterstock.com
Corrigenda to OECD publications may be found on line at: www.oecd.org/publishing/corrigenda.
© OECD 2013
You can copy, download or print OECD content for your own use, and you can include excerpts from OECD publications, databases and
multimedia products in your own documents, presentations, blogs, websites and teaching materials, provided that suitable
acknowledgement of OECD as source and copyright owner is given. All requests for public or commercial use and translation rights should
be submitted to [email protected]. Requests for permission to photocopy portions of this material for public or commercial use shall be
addressed directly to the Copyright Clearance Center (CCC) at [email protected] or the Centre français d’exploitation du droit de copie (CFC)
Please cite this publication as:Siciliani, L., M. Borowitz and V. Moran (eds.) (2013),Waiting Time Policies in the Health Sector: WhatWorks?, OECD Health Policy Studies, OECD Publishing.http://dx.doi.org/10.1787/9789264179080-en

FOREWORD
Foreword
Long waiting times for health services is a prominent health policy issue in many OECD countries.
This issue was the focus of an earlier OECD project carried out in 2001-04. Since then many new
policies have been introduced to decrease waiting times. This book critically evaluates these policies
and presents detailed information on the experience of countries and information on waiting times.
This book will help policy makers who are confronting the issue of increased waiting times for
elective treatments. It will help national experts to compare their policies with several other OECD
countries and to identify latest developments. The focus on elective treatments reflects the policy
focus of countries over the past decade, but waiting times are also prevalent in other parts of the
health system – in receiving primary care, emergency care, and cancer treatment – where their
effects may well be more deleterious to health outcomes.
The book first provides a framework to understand the role of waiting times in health systems
in Chapter 1. It then discusses variation and best practice in defining and measuring waiting times
across OECD countries in Chapter 2. The book summarises and discusses the effectiveness of
the most common policies to address long waiting times in 13 OECD countries in Chapter 3.
Chapters 4-16 provide detailed country case studies respectively in Australia, Canada, Denmark,
Finland, Ireland, Italy, Netherlands, New Zealand, Norway, Portugal, Spain, Sweden, and the United
Kingdom. They describe current policy developments and assess the effectiveness of policies in the
last ten years.
The book was edited by Luigi Siciliani (University of York), Michael Borowitz (OECD) and
Valerie Moran (OECD). We would like to thank the authors of the country case studies, without
whom this book would have not been possible: Meliyanni Johar, Glenn Jones and Elizabeth Savage
(University of Technology Sydney); Anurag Sharma and Anthony Harris (Monash University);
John McGurran (University of Toronto); Terkel Christiansen and Mickael Bech (University of
Southern Denmark); Pia Maria Jonsson, Pirjo Häkkinen, Jutta Järvelin, Jukka Kärkkäinen (National
Institute for Health and Welfare, Finland); Charles Normand (Trinity College Dublin); Alan Smith
(Department of Health, Ireland); Giovanni Fattore (Bocconi University); Giuliano Mariotti (Trento
Hospital); Vincenzo Rebba (University of Padua); Frederik T. Schut and Marco Varkevisser (Erasmus
University Rotterdam); Jacqueline Cumming, (Victoria University of Wellington); Tor Iversen
(University of Oslo); Jan Erik Askildsen and Oddvar Kaarboe (University of Bergen); Pedro Pita
Barros (Universidade Nova de Lisboa); Rita Cristovão and Pedro Andrade Gomes (Administração
Central do Sistema de Saúde); Manuel García-Goñi (Universidad Complutense de Madrid);
Joan Costa-Font (London School of Economics and Political Science); Ulrika Winblad (Uppsala
University); Marianne Hanning (National Board of Health and Welfare Sweden); Peter C. Smith
(Imperial College London); Matt Sutton (University of Manchester and University of Aberdeen).
We also thank officials from Health Ministries who provided valuable comments to the country
case studies and the fast track paper and who attended respectively the experts’ meeting held in
Paris on 24-25th March 2012 and the Health Committee meeting held in Paris on 25th-26th
June 2012. Finally, we thank John Martin (Director, Employment, Labour and Social Affairs
WAITING TIME POLICIES IN THE HEALTH SECTOR: WHAT WORKS? © OECD 2013 3

FOREWORD
Directorate, OECD) and colleagues from the OECD Health Division: Mark Pearson (Head of Division),
Gaetan Lafortune, Ankit Kumar, Yuki Murakami, Divya Srivastava, Pauliina Patana, Emily Hewlett
and Nelly Biondi. We would like to thank Judy Zinnemann for her assistance, and Marlène Mohier
and Patrick Hamm for their editing work.
WAITING TIME POLICIES IN THE HEALTH SECTOR: WHAT WORKS? © OECD 20134

TABLE OF CONTENTS
Table of contents
Executive summary . . . . . . . . . . . . . . . . . . . . . . . . . . . . . . . . . . . . . . . . . . . . . . . . . . . . . . . . . 11
Acronyms and abbreviations . . . . . . . . . . . . . . . . . . . . . . . . . . . . . . . . . . . . . . . . . . . . . . . . . 14
Part I
Overview
Chapter 1. Waiting times for health care: A conceptual framework . . . . . . . . . . . . . . 19
By Michael Borowitz, Valerie Moran and Luigi Siciliani
Chapter 2. Measuring waiting times across OECD countries . . . . . . . . . . . . . . . . . . . . 33
By Luigi Siciliani, Michael Borowitz, Valerie Moran and Huw Dixon
Chapter 3. A review of waiting times policies in 13 OECD countries. . . . . . . . . . . . . . 49
By Michael Borowitz, Valerie Moran and Luigi Siciliani
Part II
Review of waiting times policies: Country case studies
Chapter 4. Australia . . . . . . . . . . . . . . . . . . . . . . . . . . . . . . . . . . . . . . . . . . . . . . . . . . . . . . . . 71
By Meliyanni Johar, Glenn Jones, Elizabeth Savage, Anurag Sharma and Antony Harris
Chapter 5. Canada . . . . . . . . . . . . . . . . . . . . . . . . . . . . . . . . . . . . . . . . . . . . . . . . . . . . . . . . . 99
By John J. McGurran
Chapter 6. Denmark . . . . . . . . . . . . . . . . . . . . . . . . . . . . . . . . . . . . . . . . . . . . . . . . . . . . . . . 115
By Terkel Christiansen and Mickael Bech
Chapter 7. Finland . . . . . . . . . . . . . . . . . . . . . . . . . . . . . . . . . . . . . . . . . . . . . . . . . . . . . . . . . 133
By Pia Maria Jonsson, Pirjo Häkkinen, Jutta Järvelin and Jukka Kärkkäinen
Chapter 8. Ireland . . . . . . . . . . . . . . . . . . . . . . . . . . . . . . . . . . . . . . . . . . . . . . . . . . . . . . . . . 147
By Valerie Moran, Charles Normand and Alan Smith
Chapter 9. Italy . . . . . . . . . . . . . . . . . . . . . . . . . . . . . . . . . . . . . . . . . . . . . . . . . . . . . . . . . . . . 167
By Giovanni Fattore, Giuliano Mariotti and Vincenzo Rebba
Chapter 10. The Netherlands . . . . . . . . . . . . . . . . . . . . . . . . . . . . . . . . . . . . . . . . . . . . . . . . . 183
By Frederik T. Schut and Marco Varkevisser
Chapter 11. New Zealand . . . . . . . . . . . . . . . . . . . . . . . . . . . . . . . . . . . . . . . . . . . . . . . . . . . . 201
By Jacqueline Cumming
Chapter 12. Norway . . . . . . . . . . . . . . . . . . . . . . . . . . . . . . . . . . . . . . . . . . . . . . . . . . . . . . . . . 221
By Jan Erik Askildsen, Tor Iversen and Oddvar Kaarboe
WAITING TIME POLICIES IN THE HEALTH SECTOR: WHAT WORKS? © OECD 2013 5

TABLE OF CONTENTS
Chapter 13. Portugal . . . . . . . . . . . . . . . . . . . . . . . . . . . . . . . . . . . . . . . . . . . . . . . . . . . . . . . . 237
By Pedro Pita Barros, Rita Cristovão and Pedro Andrade Gomes
Chapter 14. Spain . . . . . . . . . . . . . . . . . . . . . . . . . . . . . . . . . . . . . . . . . . . . . . . . . . . . . . . . . . . 263
By Manuel García-Goñi and Joan Costa-Font
Chapter 15. Sweden . . . . . . . . . . . . . . . . . . . . . . . . . . . . . . . . . . . . . . . . . . . . . . . . . . . . . . . . . 275
ByUlrika Winblad and Marianne Hanning
Chapter 16. United Kingdom . . . . . . . . . . . . . . . . . . . . . . . . . . . . . . . . . . . . . . . . . . . . . . . . . 293
By Peter C. Smith and Matt Sutton
Tables
2.1. Mean and median in-patient waiting time of patients admitted
for treatment, England, 2008-09 . . . . . . . . . . . . . . . . . . . . . . . . . . . . . . . . . . . . . . 37
2.2. In-patient waiting times for patients admitted from the waiting list,
public hospitals, Australia, 2008-09. . . . . . . . . . . . . . . . . . . . . . . . . . . . . . . . . . . . 37
2.3. Waiting times for patients admitted from the waiting list,
in-patient waiting time, Australia, 2008-09 . . . . . . . . . . . . . . . . . . . . . . . . . . . . . 38
2.4. Waiting times for diagnostic tests by type of provider in Italy, 2009 . . . . . . . . 38
2.5. Referral to treatment waiting time, England . . . . . . . . . . . . . . . . . . . . . . . . . . . . 40
2.A1.1. Different distributions of waiting and their mean . . . . . . . . . . . . . . . . . . . . . . . 46
2.A1.2. Example 3 . . . . . . . . . . . . . . . . . . . . . . . . . . . . . . . . . . . . . . . . . . . . . . . . . . . . . . . . . 47
3.1. Frequency of use and potential effect of policies to address waiting times. . . . 51
3.2. Maximum waiting times in selected OECD countries . . . . . . . . . . . . . . . . . . . . 52
3.3. Mean waiting time for elective surgical procedures in Dutch hospitals,
2000 to 2011 . . . . . . . . . . . . . . . . . . . . . . . . . . . . . . . . . . . . . . . . . . . . . . . . . . . . . . . 63
4.1. Surgical procedures per 100 000 population, 2000 and 2009 . . . . . . . . . . . . . . . 75
4.2. Median wait, 90th percentile wait and percentage waiting more than
365 days by indicator procedure, states and territories,
Australia, 2001-02 to 2009-10 . . . . . . . . . . . . . . . . . . . . . . . . . . . . . . . . . . . . . . . . . 80
5.1. Procedures per 100 000 population (in-patient and day cases),
Canada, 2000 and 2009 . . . . . . . . . . . . . . . . . . . . . . . . . . . . . . . . . . . . . . . . . . . . . . 102
5.2. Percentage of patients receiving care in priority areas within
the benchmark, Canada, 2010 . . . . . . . . . . . . . . . . . . . . . . . . . . . . . . . . . . . . . . . . 107
6.1. Procedures per 100 000 population (in-patient and day cases),
Denmark, 2000 and 2010. . . . . . . . . . . . . . . . . . . . . . . . . . . . . . . . . . . . . . . . . . . . . 118
6.2. Health problem areas for which waiting times are provided, Denmark . . . . . 120
7.1. Surgical procedures per 100 000 population, Finland, 2000 and 2010 . . . . . . . 137
8.1. Surgical procedures per 100 000 population, Ireland, 2000 and 2010. . . . . . . . 151
8.2. Expenditure on the National Treatment Purchase Fund (NTPF),
Ireland, 2002 to 2010 . . . . . . . . . . . . . . . . . . . . . . . . . . . . . . . . . . . . . . . . . . . . . . . . 158
8.3. Elective treatments, Ireland, 2005 to 2010 . . . . . . . . . . . . . . . . . . . . . . . . . . . . . . 160
8.4. Comparison of prices under the National Treatment Purchase
Fund (NTPF) for the eight most common procedures, Ireland, 2004 . . . . . . . . 160
8.5. Total number and percentage of patients actively waiting for surgical
procedures, Ireland, 2006 to 2010 . . . . . . . . . . . . . . . . . . . . . . . . . . . . . . . . . . . . . 162
8.6. Median wait time, Ireland, 2007 to 2010. . . . . . . . . . . . . . . . . . . . . . . . . . . . . . . . 162
9.1. Surgical procedures per 100 000 population, Italy, 2000 and 2009 . . . . . . . . . . 170
WAITING TIME POLICIES IN THE HEALTH SECTOR: WHAT WORKS? © OECD 20136

TABLE OF CONTENTS
9.2. Waiting times for diagnostic tests by geographical area, Italy, 2009 . . . . . . . . 172
9.3. Waiting times for diagnostic tests by type of test and by type of provider,
Italy, 2009 . . . . . . . . . . . . . . . . . . . . . . . . . . . . . . . . . . . . . . . . . . . . . . . . . . . . . . . . . 173
10.1. Surgical procedures per 100 000 population, Netherlands, 2000 and 2009 . . . 186
10.2. Mean waiting time for in-patient treatment in Dutch hospitals,
2000 and 2001 . . . . . . . . . . . . . . . . . . . . . . . . . . . . . . . . . . . . . . . . . . . . . . . . . . . . . . 190
10.3. Mean waiting time in Dutch hospitals, 2000 to 2003 . . . . . . . . . . . . . . . . . . . . . 190
10.4. Mean waiting time of patients admitted by surgical procedure
in Dutch hospitals, 2000 to 2011 . . . . . . . . . . . . . . . . . . . . . . . . . . . . . . . . . . . . . . 191
10.5. Waiting times in Dutch hospitals, 2011 . . . . . . . . . . . . . . . . . . . . . . . . . . . . . . . . 195
11.1. Surgical procedures per 100 000 population, New Zealand, 2000 and 2010 . . 204
11.2. Reported waiting list numbers and times for surgery, New Zealand. . . . . . . . 206
12.1. Surgical procedures per 100 000 population, Norway, 2000 and 2009 . . . . . . . 224
12.2. Waiting times according to priorities, Norway, 2003-06. . . . . . . . . . . . . . . . . . . 228
12.3. Average waiting times in days and proportion of patients
with excessive waiting times per health region, Norway . . . . . . . . . . . . . . . . . 233
12.4. Average waiting times in days, and the proportion of patients
with excessive waiting times in the prioritisation groups, Norway. . . . . . . . . 234
13.1. Surgical procedures per 100 000 population, Portugal, 2000 and 2009. . . . . . . 241
13.2. Current targets for waiting times in Portugal, as defined by
the Ordinance No. 1529/2008 of 26 December 2008 . . . . . . . . . . . . . . . . . . . . . . 249
13.3. Maximum waiting times guarantees over time, Portugal . . . . . . . . . . . . . . . . . 250
13.4. Waiting times in days, Portugal . . . . . . . . . . . . . . . . . . . . . . . . . . . . . . . . . . . . . . . 256
13.5. The effect of the Intervention Programme in Ophthalmology (PIO)
in Portugal. . . . . . . . . . . . . . . . . . . . . . . . . . . . . . . . . . . . . . . . . . . . . . . . . . . . . . . . . 259
14.1. Surgical procedures per 100 000 population in Spain, 2000 and 2010 . . . . . . . 267
14.2. Evolution of surgical waiting lists in Spain, 2004 to 2010 . . . . . . . . . . . . . . . . . 268
14.3. Evolution of waiting lists for visits to specialist, Spain, 2003 to 2009 . . . . . . . 268
14.4. Evolution of waiting time for surgical procedures, Spain, 2003 to 2009 . . . . . 269
14.5. Regional practices related to an increase in the supply
of health services, Spain. . . . . . . . . . . . . . . . . . . . . . . . . . . . . . . . . . . . . . . . . . . . . 272
15.1. Surgical procedures per 100 000 population, Sweden, 2000 and 2010 . . . . . . . 278
15.2. The national waiting time database, content and measures, Sweden, 2012 . . . . . 282
15.3. The waiting time guarantee of 2005, Sweden . . . . . . . . . . . . . . . . . . . . . . . . . . . 283
16.1. Surgical procedures per 100 000 population,
United Kingdom, 2007 and 2010 . . . . . . . . . . . . . . . . . . . . . . . . . . . . . . . . . . . . . . 297
16.2. NHS pledges on waiting times, England, November 2011 . . . . . . . . . . . . . . . . . 300
16.3. National waiting time objectives, England, 1999 to 2010. . . . . . . . . . . . . . . . . . 303
16.4. Waiting time targets set in 2002, England . . . . . . . . . . . . . . . . . . . . . . . . . . . . . . 304
16.5. Performance in 2011 on the referral to treatment target, Scotland . . . . . . . . . 316
Figures
1.1. Conceptual framework of waiting lists and waiting times
for elective treatment . . . . . . . . . . . . . . . . . . . . . . . . . . . . . . . . . . . . . . . . . . . . . . . 21
1.2. Hip and knee replacement per 100 000 population, 2010 (or nearest year). . . 23
1.3. Benefits and costs from mis-prioritisation caused by maximum waiting
time guarantees . . . . . . . . . . . . . . . . . . . . . . . . . . . . . . . . . . . . . . . . . . . . . . . . . . . . 24
WAITING TIME POLICIES IN THE HEALTH SECTOR: WHAT WORKS? © OECD 2013 7

TABLE OF CONTENTS
1.4. Public health expenditure and waiting times . . . . . . . . . . . . . . . . . . . . . . . . . . . 26
1.5. Relationship between long waiting times and health expenditure,
hospital beds and doctors . . . . . . . . . . . . . . . . . . . . . . . . . . . . . . . . . . . . . . . . . . . 28
2.1. Examples of starting points for measuring waiting times (completed waits)
for contact, primary care appointments, specialist care appointments
and treatment . . . . . . . . . . . . . . . . . . . . . . . . . . . . . . . . . . . . . . . . . . . . . . . . . . . . . 35
2.2. Waiting time of patients treated and on the list . . . . . . . . . . . . . . . . . . . . . . . . . 39
2.3. Waiting time of four months or more for elective surgery . . . . . . . . . . . . . . . . 42
3.1. Patients willing to travel to another EU country because
of long waiting times. . . . . . . . . . . . . . . . . . . . . . . . . . . . . . . . . . . . . . . . . . . . . . . . 58
4.1. Elective surgery admission and waiting times in Australia, 2000 to 2010 . . . . 78
4.2. Elective surgery admission and waiting times in New South Wales,
2000 to 2010 . . . . . . . . . . . . . . . . . . . . . . . . . . . . . . . . . . . . . . . . . . . . . . . . . . . . . . . 83
4.3. Distribution of urgency assignment in New South Wales, 2004 to 2009 . . . . . 83
4.4. Elective surgery admissions and waiting lists in Victoria, 1999 to 2010 . . . . . 86
4.5. Median waiting times by urgency category in Victoria, 1999 to 2010. . . . . . . . 87
4.6. Proportion on the waiting list by urgency category in Victoria, 1999 to 2010. . . . . 87
6.1. Expected and experienced waiting time for various treatments,
Denmark, 1998 to 2011 . . . . . . . . . . . . . . . . . . . . . . . . . . . . . . . . . . . . . . . . . . . . . . 121
7.1. Number of patients waiting longer than 180 days for specialist care
per 10 000 inhabitants, Finland, October 2002 to April 2011 . . . . . . . . . . . . . . . 140
7.2. Proportion of patients waiting from referral to assessment longer than three
weeks by speciality, Finland, December 2008 to December 2011 . . . . . . . . . . . . . . . 142
7.3. Number of patients waiting longer than six months for dental care,
Finland, October 2006 to March 2012 . . . . . . . . . . . . . . . . . . . . . . . . . . . . . . . . . . 142
7.4. Cataract surgery in public health care, Finland, 2001 to 2010 . . . . . . . . . . . . . . 143
7.5. Cataract surgery in public health care, Finland, 2010. . . . . . . . . . . . . . . . . . . . . 143
7.6. Cataract surgery in public health care hospital districts, Finland, 2010 . . . . . 144
11.1. Numbers of people waiting more than six months for treatment and first
specialist assessment, New Zealand, 2000 to 2011. . . . . . . . . . . . . . . . . . . . . . . 212
11.2. Publicly funded elective surgical discharges, New Zealand,
2007-08/2010-11 . . . . . . . . . . . . . . . . . . . . . . . . . . . . . . . . . . . . . . . . . . . . . . . . . . . . 213
12.1. Average waiting times in Norway for somatic,
in-patient and out-patient care . . . . . . . . . . . . . . . . . . . . . . . . . . . . . . . . . . . . . . . 229
12.2. Share of patients with a right to necessary treatment, Norway. . . . . . . . . . . . 230
13.1. Evolution of national waiting list for surgery in Portugal between 2005
to 2011 (at 31 December). . . . . . . . . . . . . . . . . . . . . . . . . . . . . . . . . . . . . . . . . . . . . 252
13.2. Evolution of the national waiting time for surgery in Portugal, 2005 to 2011 . . . . 252
13.3. Evolution of scheduled surgical production in Portugal, 2006 to 2011. . . . . . . 253
13.4. Evolution of new entries to the national waiting list for surgery
in Portugal, 2006 to 2011 . . . . . . . . . . . . . . . . . . . . . . . . . . . . . . . . . . . . . . . . . . . . . 254
13.5. Evolution of the percentage of the national waiting list for surgery
with times above those set by the SIGIC, Portugal, 2005 to 2011 . . . . . . . . . . . 254
13.6. Trends in waiting times over time, Portugal, 2006 to 2010. . . . . . . . . . . . . . . . . 255
13.7. Evolution of the standard deviation of waiting times across providers,
Portugal, 2006 to 2010 . . . . . . . . . . . . . . . . . . . . . . . . . . . . . . . . . . . . . . . . . . . . . . . 256
WAITING TIME POLICIES IN THE HEALTH SECTOR: WHAT WORKS? © OECD 20138

TABLE OF CONTENTS
13.8. Time evolution of selected procedures (eye and vein),
Portugal, 2006 to 2010 . . . . . . . . . . . . . . . . . . . . . . . . . . . . . . . . . . . . . . . . . . . . . . . 257
13.9. Cancellations and people on waiting lists over total entries in
a given month, Portugal, 2006 to 2010 . . . . . . . . . . . . . . . . . . . . . . . . . . . . . . . . . 257
14.1. Average waiting times for visits to specialists and surgical procedures,
Spain, 2003 to 2009 . . . . . . . . . . . . . . . . . . . . . . . . . . . . . . . . . . . . . . . . . . . . . . . . . 270
15.1. Number of cataract operations and percentage of patients waiting less than
three months, Sweden, 1980 to 2002 . . . . . . . . . . . . . . . . . . . . . . . . . . . . . . . . . . 281
15.2. Number of patients on waiting lists for treatment (specialist care), and how
long they waited between decision to treat and treatment, Sweden, 2009
to 2011 . . . . . . . . . . . . . . . . . . . . . . . . . . . . . . . . . . . . . . . . . . . . . . . . . . . . . . . . . . . . 286
15.3. Patients on waiting lists for treatment (42 different procedures),
Sweden, 31 December 2011 . . . . . . . . . . . . . . . . . . . . . . . . . . . . . . . . . . . . . . . . . . 286
16.1. The National Health Service waiting list, England, 1949 to 2010 . . . . . . . . . . . 298
16.2. Trends in “referral to treatment” waiting times for patients admitted
to hospital (adjusted), England, 2008 to 2011. . . . . . . . . . . . . . . . . . . . . . . . . . . . 301
16.3. Trends in quarterly waiting list by time waited, England . . . . . . . . . . . . . . . . . 308
16.4. Median waiting time, elective admissions, England, 1993 to 2009. . . . . . . . . . 309
16.5. Cumulative distributions of completed in-patient waiting times, Scotland . . . . . 317
16.6. Trends in unavailability of patients on the in-patient/day-case waiting list,
Scotland, 2008 to 2011 . . . . . . . . . . . . . . . . . . . . . . . . . . . . . . . . . . . . . . . . . . . . . . . . . . . . 318
16.7. Long-term trends in completed in-patient/day-case waits, Scotland,
March 1998 onwards . . . . . . . . . . . . . . . . . . . . . . . . . . . . . . . . . . . . . . . . . . . . . . . . 320
WAITING TIME POLICIES IN THE HEALTH SECTOR: WHAT WORKS? © OECD 2013 9

Waiting Time Policies in the Health Sector
What Works?
© OECD 2013
Executive summary
In many OECD countries, long waiting times for health care services is an important health
policy issue. A recent OECD survey revealed problems with waiting times in almost all OECD
countries including primary care, out-patient specialist care, emergency care, cancer care
and elective (non-emergency) care. More than half of OECD countries have long waiting
times for elective treatments, and these waiting times are often a contentious political issue.
In 2001-04, the OECD carried out a project reviewing policies to tackle excessive waiting times
for elective treatments in 13 countries (Australia, Canada, Denmark, Finland, Ireland, Italy,
the Netherlands, New Zealand, Norway, Portugal, Spain, Sweden and the United Kingdom).
At that time, waiting times in many countries were long and a series of policies were just
being introduced. However assessing the effectiveness of these policies was difficult, given
the short time-frame since implementation. A decade later, many of these countries have
made considerable progress in reducing waiting times. This book reviews options for on-
going monitoring of waiting times, and highlights the most effective policies to decrease
waiting times for elective care. Given the economic crisis in some countries, less money will
be available for elective care. Governments need to be ready to address potential increases in
waiting times.
Long waiting times for elective treatments generally tend to be found in countries that
combine public health insurance with zero or low patient cost-sharing and constraints on
capacity. Long waiting times are found less often in countries with social insurance that
allow choice of provider, but there are some social insurance systems with below average
spending that do have waiting times for elective care. Countries with no waiting times tend
to spend more on health and have higher hospital capacity.
Over the past decade, waiting time guarantees have become the most common and effective
policy tool to tackle long waiting times, but are only effective if enforced. There are two
approaches to enforcement: setting waiting time targets and holding health providers to
account for achieving the targets, or allowing patients to choose alternate health providers,
including the private sector, if patients have to wait beyond a maximum time. In the United
Kingdom and Finland, health providers were penalized if they exceeded a target. As a result
waiting times decreased. This method is often known as “targets and terror” and though
effective, it is unpopular with health professionals and difficult to sustain over a long time.
Portugal, the Netherlands and Denmark have introduced choice and competition
successfully, and this is the direction recently taken by the United Kingdom. The Portuguese
model has been particularly effective in decreasing waiting times. The model entails a
unified information system containing data on waiting times for all public and private
providers, and vouchers allowing free choice of any provider which are issued to patients
when 75% of the waiting time guarantee is reached.
11

EXECUTIVE SUMMARY
Supply-side waiting time policies, by themselves, are usually not successful. In the earlier
OECD study on waiting time policies, the most common policy was to provide increased
funding to health providers to decrease waiting times, and this type of policy continues to be
a common approach. It has almost invariably been unsuccessful in bringing down waiting
times over the long term. Generally, there is a short-term burst of funding that initially
reduces waiting times, but then waiting times increase, and occasionally return to even
higher levels when the temporary funding runs out. The other main supply-side policy is
increasing hospital productivity, by introducing new payment methods such as activity-
based financing (ABF) using diagnosis-related groups. This increases hospital productivity,
but does not necessarily decrease waiting times.
The introduction of ABF, however, is often one of the key components in introducing choice
and competition which can lower waiting times. The Netherlands successfully eliminated
waiting times by a combination of ABF, lifting a cap on hospital spending, allowing choice
and competition, and introducing waiting time norms. In general, it appears that a
combination of sufficient supply, payment systems that reward activity for both specialists
and hospitals, and limited constraints on hospital spending are associated with low waiting
times. However, these policies tend to be expensive and given the current economic
environment may not be feasible in all countries.
A complementary approach to reduce waiting times is to implement demand-side policies in
order to reduce or shift the demand for elective treatments. One approach is to shift demand
to the private sector using private insurance. In general, this has failed to reduce demand for
elective treatments in public hospitals and decrease waiting times. The other approach is to
introduce tools to improve clinical prioritisation for elective treatments. Clinical
prioritisation tools have been used most widely in New Zealand with some success.They can
be difficult to implement since they depend on setting a clear clinical threshold in a valid and
reliable manner. In some countries, such as Norway and Australia, clinical prioritisation is
linked to waiting time guarantees, with different guarantees depending on the level of need.
This appears to be a promising approach, but requires better tools for clinical prioritisation
that measure reliably clinical need and the benefit of the elective procedures.
To enforce waiting time guarantees, waiting times need to be measured systematically.
Currently, there is no common definition for measuring waiting times across OECD
countries. There is an emerging best practice that includes measuring the waiting time of
patients rather than the length of the waiting list, and moving beyond measuring only
hospital waiting to measuring the total patient journey beginning in primary care. The
referral to treatment time used in the United Kingdom, which measures the waiting time
from referral of the general practitioner to hospital treatment, is a good approach to
measuring the patient journey for elective care. Many countries, such as Sweden, are
attempting to measure the entire patient journey for cancer care.
Cross-country data on waiting times are useful for evaluating health system performance
and the effectiveness of policies. Survey data are available for selected OECD countries from
the Commonwealth Fund International Health Policy Survey. This is a household survey
which collects information on health system performance that encompasses waiting time
data across different parts of the health system including elective surgery. However, survey
data are less useful in monitoring changes in waiting times associated with policies, as
elective care is a relatively rare event and requires a large sample.
WAITING TIME POLICIES IN THE HEALTH SECTOR: WHAT WORKS? © OECD 201312

EXECUTIVE SUMMARY
The best method for accurately measuring waiting times is through administrative data.
Currently, the OECD is piloting a data collection on waiting times for selected elective
procedures for a group of countries. Given the economic crisis and the likelihood that waiting
times will increase, and the new European Union regulations allowing patients to seek
treatment in other countries if there is “undue delay” from waiting times, there is a growing
interest in developing a common approach for defining and measuring waiting times.
WAITING TIME POLICIES IN THE HEALTH SECTOR: WHAT WORKS? © OECD 2013 13

ACRONYMS AND ABBREVIATIONS
Acronyms and abbreviations
A&E Accident and emergency
ABR Activity-based reimbursement
ABF Activity-based funding
AC Autonomous community
ACC Accident compensation insurance scheme
ACES Health center groups
ACSS Administrative Central Agency of Portugal’s National Health Service
ADSE Social health insurance system for public sector employees and their
dependents
AHCA Australian Health Care Agreement
AHS Area health service
AIHW Australian Institute of Health and Welfare
ASC Availability Status Code
aTT Actual treatment threshold
AUD Australian dollar
BC British Columbia
C&AG Comptroller and Auditor General
CABG Coronary bypass
CCN Cardiac Care Network (Ontario)
CIHI Canadian Institute for Health Information
COAG Council of Australian Government
COPD Chronic obstructive pulmonary disease
CPAC Clinical priority assessment criteria
CT Commitment to treatment
CT scan Computed tomography
DAGS Danish rate for ambulatory patients
DBC Diagnosis treatment combinations (Diagnose Behandeling Combinaties,
Netherlands)
DHB District Health Boards
DoH Department of Health
DoHC Department of Health and Children
DRG Diagnosis-related group
DTC Diagnosis treatment combination
DTP Diagnostic and therapeutic pathway
ED Emergency department
ENT Ear, nose and throat
ERHA Eastern Regional Health Authority
ESPI Elective Services Patient Flow Indicators
WAITING TIME POLICIES IN THE HEALTH SECTOR: WHAT WORKS? © OECD 201314

ACRONYMS AND ABBREVIATIONS
ESWLRP Elective Surgery Waiting List Reduction Plan
FCC Federation of County Councils
FSA First specialist assessment
GDP General dental practitioner
GP General practitioner
HEAT Health improvement, efficiency, access and treatment
HIA Health Insurance Act
HIQA Health Information and Quality Authority
HOPE European Hospital and Healthcare Federation
HSE Health Service Executive
HWG Homogeneous Waiting Group
ICD International Classification of Diseases
ICD-9-CM International Classification of Diseases, Ninth Revision, Clinical Modification
ICRP Italian Court for the Rights of the Patient
ISD Information Services Division
LDP Local Delivery Plan
LEA Italian basic package of health care (Livelli essenziali di assistenza)
LHU Local health units
MoH Ministry of Health
MRI Magnetic resonance imaging
MSAH Ministry of Social Affairs and Health (Finland)
MWT Maximum waiting time
NBWH National Board of Health and Welfare
NESF National Economic and Social Forum
NEST National Elective Surgery Target
NGO Not-for-profit organisation
NHEA Norwegian Health Economics Administration
NHI National health insurance
NHS National health system
NOG Not-for-profit organisation
NOK Norwegian krone
NordDRG Nordic Diagnosis-related Group
NPR Norwegian Patient Register
NSW New South Wales
NTPF National Treatment Purchase Fund
NZa Dutch Healthcare Authority
NZD New Zealand dollar
PbR Payment by results
PCT Primary Care Trusts
PECLEC Special Programme to Fight Surgical Waiting Lists
PERLE Specific Programme for Waiting List Recovery
PET Positron emission tomography
PHI Private health insurance
PIO Intervention Programme in Ophthalmology
PPA Programme to Promote Access
PPP Purchasing power parity
PTCA Percutaneous transluminal coronary angioplasty
WAITING TIME POLICIES IN THE HEALTH SECTOR: WHAT WORKS? © OECD 2013 15
ACRONYMS AND ABBREVIATIONS
PTR Patient Treatment Register
QALY Quality adjusted life year
QoF Quality and Outcomes Framework
RFA Recommendation for admission form
RHA Regional health authorities
RTT Referral to treatment
SALAR Swedish Association of Local Authorities and Regions
SDU Special Delivery Unit
SEK Swedish krone
SSCN Surgical care network
SIGIC Integrated Management System of the Waiting List for Surgery
SIGLIC Supporting information system for SIGIC
STEMI ST elevation myocardial infarction
THL Institute for Health and Welfare (Finland)
UCGIC Waiting List for Surgery Management
UHI Universal health insurance
UKCWTG UK Comparative Waiting Times Group
USD American dollar
VHI Voluntary private health insurance
WLI Waiting List Initiative
WAITING TIME POLICIES IN THE HEALTH SECTOR: WHAT WORKS? © OECD 201316

PART I
Overview
WAITING TIME POLICIES IN THE HEALTH SECTOR: WHAT WORKS? © OECD 2013


Waiting Time Policies in the Health Sector
What Works?
© OECD 2013
PART I
Chapter 1
Waiting times for health care:A conceptual framework
by
Michael Borowitz and Valerie Moran,
Health Division, OECD
and
Luigi Siciliani,
Department of Economics and Related Studies, University of York, United Kingdom
This chapter provides a conceptual framework for understanding the role of waitinglists and waiting times in the health sector, with a special focus on hospital services.It emphasises demand-side and supply-side factors that influence excessive waitingtimes, and in particular the critical role of doctors in determining the demand forcare. It then briefly describes the health policy significance of waiting times acrossthe OECD countries, and the extent to which this is associated with health spendingand the supply of hospital beds and doctors. There is a negative association betweenwaiting times and the availability of curative care beds, and to a lesser extent withpublic health expenditure per capita. It then briefly reviews the empirical evidenceon the effect of waiting times on health outcomes. This suggests that long waitingtimes can have a detrimental impact on health outcomes for more urgentprocedures, like coronary bypass, but less so for less urgent ones, like elective hipreplacement, where the evidence is mixed. It also highlights the recent empiricalliterature, which suggests that waiting times for publicly funded patients may belonger for individuals with lower socioeconomic status, making waiting times a lessequitable allocation mechanism than currently perceived.
19

I.1. WAITING TIMES FOR HEALTH CARE: A CONCEPTUAL FRAMEWORK
IntroductionThis chapter provides a conceptual framework for understanding the role of waiting
lists and waiting times in the health sector, with a special focus on hospital services. A
different framework would be required for waiting times for other parts of the health
system, such as waiting times for primary care or long-term care.
We emphasise demand-side and supply-side factors that influence excessive waiting
times. Waiting times arise as the result of the imbalance between the demand for and the
supply of health care services. High levels of need for health care, an ageing population and
technological developments are contributing factors to the demand for health care
services. We also emphasise the critical role of doctors in determining the demand for care.
The doctor generally sets the clinical threshold for treatment, and this threshold is one of
the key parameters determining waiting times. When demand for health care exceeds the
supply of health care services, which is limited by the capacity allocated to public services,
patients are added to the list and have to wait before being treated. Feedback mechanisms
from waiting times also influence the demand and supply of services. Longer waiting times
may induce some patients to opt for private sector treatment and push providers to
increase production or productivity.
The chapter then briefly describes the health policy significance of waiting times
across the OECD countries, and the extent to which this is associated with health spending
and the supply of hospital beds and doctors. There is a small group of OECD countries that
do not report waiting times for elective surgery as an important health policy issue. The
evidence provided below suggests a negative association between waiting times and the
availability of curative care beds, and, to a lesser extent, between waiting times and public
health expenditure per capita. However, waiting times are not exclusively an issue of
supply, since there are some countries with high spending, beds or doctors that also have
waiting times.
We then review the empirical evidence on the effect of waiting times on health
outcomes. It suggests that long waiting times can have a detrimental effect on health
outcomes for more urgent procedures, like coronary bypass (CABG), but less so for less
urgent ones, like elective hip replacement, where the evidence is mixed. We also highlight
the recent empirical literature, which suggests that waiting times for publicly funded
patients may be longer for individuals with lower socioeconomic status, making waiting
times a less equitable allocation mechanism than currently perceived.
Why are there waiting times in health systems?Figure 1.1 provides a model of waiting lists and waiting times, where patients flow
through a typical health care system with limited capacity, leading to a waiting list (Hurst
and Siciliani, 2003; Siciliani and Hurst, 2004). Patients suffering from conditions that might
benefit from medical or surgical interventions enter the publicly funded secondary health
care system for assessment by a doctor, either as emergencies, a referral from a general
WAITING TIME POLICIES IN THE HEALTH SECTOR: WHAT WORKS? © OECD 201320

I.1. WAITING TIMES FOR HEALTH CARE: A CONCEPTUAL FRAMEWORK
practitioner (GP) or a self-referral. There is a hierarchy of need for health care, ranging from
emergency procedures (such as repairing a ruptured abdominal aortic aneurysm) through
urgent interventions (such as operating on colon cancer with obstruction) through non-
urgent, elective procedures that can be scheduled (such as hip replacement) to
discretionary procedures that may be routinely excluded from public programmes (such as
much of cosmetic surgery).
After assessment, some patients who do not require specialised treatment are
referred back to their GP. Others may be asked to wait for “elective” treatment and be given
a future date for treatment (booked) or put on a public waiting list. If demand for elective
procedures is greater than supply, a queue will form and patients will have to wait. In
traditional markets, price is used to ration goods, but in health care, where people face
either zero or low cost-sharing (due to coverage by governments or insurance companies),
there is very limited price rationing. Instead, rationing occurs through waiting times
(Martin and Smith, 1999, 2003). Often, when faced with longer waiting times, some
patients choose not to wait and may opt for private surgery to “jump the queue”, provided
they can pay for it or are privately insured.
From the standpoint of hospital efficiency, there is a role for some patient waiting
time. Waiting ensures that expensive hospital services, like surgical suites, can be used at
full capacity. Hospitals have to carry out a complex balancing act between emergency and
elective services, and lulls in emergency surgery can be used to provide elective care. The
existence of a waiting list decreases the probability that supply exceeds demand, leaving
capacity under-utilised (Cooper, 1981; Goddard et al., 1995). However, longer waiting lists
push hospital costs up, because of the costs of administering the list, including the use of
Figure 1.1. Conceptual framework of waiting lists and waiting timesfor elective treatment
Source: Siciliani, L. and J. Hurst (2005), “Tackling Excessive Waiting Times for Elective Surgery: A Comparison ofPolicies in 12 OECD Countries”, Health Policy, Vol. 72, No. 2, pp. 201-215.
++– –
Health status
Technology
Severity thresholds
Patients preferences
Cost sharing
PHI coverage
Price of privatesurgery
Waiting list(stock)
Waitingtime
Public capacity(beds, doctors)
Capacity in theprivate sector
Productivity (publicand private)
Hospitals’ anddoctors’ paymentsystem
Privatetreatmentperformed
Publictreatmentperformed
Private elective treatment
Emergency treatment
Additions
inflow
Treatment
outflow
Emergencyarrivals
GPassessment
Specialistassessment
Referrals
Returnto GP
WAITING TIME POLICIES IN THE HEALTH SECTOR: WHAT WORKS? © OECD 2013 21

I.1. WAITING TIMES FOR HEALTH CARE: A CONCEPTUAL FRAMEWORK
clinical resources for regular re-assessment of patients (Iversen, 1993, 1997). There is
evidence from England that when waiting times are long (above three months), there are
no additional cost savings from a further increase (Siciliani et al., 2009a). On the contrary,
there is evidence from Belgium, where waiting times are generally lower, that hospitals
with higher waiting times have lower costs (Smet, 2004).
A waiting list forms when the flow of additions to the waiting list (the inflow) exceeds
the rate at which patients are removed from the list by receiving treatment (the outflow).
Imbalances between additions and removals from the list may be due to short-term
fluctuations in demand, especially from emergency patients, who take priority for beds
and staff in general hospitals, and to systematic imbalances between demand and supply.
Many OECD countries have a national strategy to address waiting times, which are
reported as a significant issue in several parts of the health system (Annex 1.A1).
The inflow of elective surgery is determined by the health status of the population,
and, given the ageing of the population, the demand for many elective procedures is
increasing. Demand is also determined by the state of medical technology, including the
increasing ease of many procedures, like cataract and carpal tunnel surgery, which can
now be performed with little risk as day surgery. Much of the demand for surgery depends
on patient preferences, especially the complex balance between potential benefits and
potential costs – what is often known as “preference-sensitive conditions” (OECD, 2012a).
Various financial incentives, such as the extent of cost-sharing by public patients (e.g. co-
payments, coinsurance rates), the proportion of the population with private health
insurance and the price of private care, will also influence demand.
Doctors play a critical role in determining demand for health careWhereas the patient demands better health (e.g. reduction of symptoms), it is the
doctor who converts this demand into a demand for medical care. Hence, the demand for
surgery will always be surgeon-managed. The critical role of physicians in determining
supply has been well-documented in the literature on small-area variations in health care
(Wennberg and Gittelsohn, 1975; Wennberg, 2010).
Data on surgical volumes across OECD countries reveals wide cross-country variations
(OECD, 2011a). Figure 1.2 presents the example of hip and knee replacements. It is worth
noting that countries with low waiting times, such as the United States, Germany and
Switzerland, generally exhibit high rates of elective surgery (e.g. hip and knee
replacements), while conversely some countries that report high waiting times (e.g. Ireland
and Portugal) have relatively low rates of elective surgery. However, many of the Nordic
countries have high waiting times and also have relatively high rates of elective surgery. A
recent review of the published literature on medical practice variations within countries
also reveals a lot of variation in procedure rates across different regions or hospitals within
the same country, suggesting a possible over-use or under-use of certain procedures
(OECD, 2011b).
In the small-area variations literature, Wennberg and Gittelsohn (1975) and others
have suggested that the variations in practice are due to clinical uncertainty; there seem to
be large differences in opinion across surgeons about the thresholds for need and the
indications for surgery. One of the tools for decreasing variation and getting the right rate
is to increase clinical certainty through practice guidelines and other prioritisation tools for
demand management. This is re-visited when we discuss policy tools to address waiting
WAITING TIME POLICIES IN THE HEALTH SECTOR: WHAT WORKS? © OECD 201322

I.1. WAITING TIMES FOR HEALTH CARE: A CONCEPTUAL FRAMEWORK
753856
250
.9.1226
tion
lists, as prioritisation tools have been one of the methods used to try to decrease waiting
times. Though rational and therefore attractive, guidelines have been very difficult to
implement. If one could develop good tools that measured the benefits of elective surgery
depending on clinical need, this could decrease variations in medical practice, and could
consequently decrease demand for elective surgery and thus waiting times.
In addition to doctors, specific policies such as a maximum waiting time guarantee
also affect the demand for health care and the consequent waiting time. Figure 1.3
explains what could happen with clinical prioritisation with the introduction of a waiting
time guarantee, given a fixed volume of procedures. Assuming doctors are good at
prioritisation, as clinical need decreases the waiting time increases. The waiting time
guarantee is represented by the vertical line at W, meaning that patients who were waiting
beyond W are now treated. However, the waiting times of those with higher clinical need
increase, as those with less need are now being treated earlier in order to comply with the
guarantee, shifting the waiting line to the right (without the tail beyond the guarantee). The
result is mis-priorisation based on clinical need. Patients with greater clinical need
experience an increase in waiting time as a result of the guarantee. Some of the
patients beyond the guarantee may be patients who would not qualify for treatment if
there were formal rationing based on a cost/benefit ratio (e.g. cost per quality adjusted life
year – QALY).
Long waiting times are politically unpopular, and it is critical to address the tail of
those waiting for a long time. However, one could argue that patients who are below a
certain level of need should not be offered the service rather than put on a waiting list.
Many of these patients may have an unfavourable cost/benefit ratio (cost per QALY is high)
such that the cost of their treatment is not justified, since the public funding could be used
Figure 1.2. Hip and knee replacement per 100 000 population, 2010 (or nearest year)
Source: OECD (2012), OECD Health Data 2012, OECD Publishing, Paris, http://dx.doi.org/10.1787/health-data-en.1 2 http://dx.doi.org/10.1787/888932
0 030025020015010050 20015010050
3.36.2
44.245.248.4
61.784.185.5
94.797.7
104.4107.9111.5
121.6124125.3127.6131.6
141.5144.1
155.4168.6
174.7177.6
187200.6
211213265.5
295
7.517.922.1
51.963.2
74.484.587.8
9799.4
121.5123.5
143.4146.9
153.5159.3161.1162.7
172.6181.2
199.1203.7207.6210.4213.3
224.7225.4
242.4245249.1
Hip replacement surgery Knee replacement surgery
Per 100 000 populaPer 100 000 population
MexicoChile
IrelandHungary
IsraelPortugalNorway
SloveniaNew Zealand
ItalySpainKorea
Czech RepublicOECD
FranceSweden
NetherlandsIceland
United KingdomCanada
LuxembourgAustraliaDenmarkBelgiumFinlandAustria
SwitzerlandGermany
United States
MexicoKoreaChile
IsraelPoland
Slovak RepublicEstonia
PortugalSpain
HungaryIrelandCanada
New ZealandItaly
OECDSloveniaAustralia
Czech RepublicIceland
United KingdomFinland
United StatesLuxembourg
SwedenNetherlands
FranceDenmark
NorwayBelgiumAustria
SwitzerlandGermany
WAITING TIME POLICIES IN THE HEALTH SECTOR: WHAT WORKS? © OECD 2013 23

I.1. WAITING TIMES FOR HEALTH CARE: A CONCEPTUAL FRAMEWORK
more effectively. This is the approach that New Zealand has attempted to implement,
where many of the patients with long waits are taken off the waiting list (see Chapters 3
and 11).
An alternative to the scenario presented above is that the increased focus on waiting
times arising from the guarantee may increase the efficiency of service provision or divert
resources from elsewhere in the system (including increasing the working hours of
consultants or focusing their efforts on public lists (and not their private lists). As a
consequence, the tail of the distribution (i.e. the very long waits) could be reduced without
increasing the waiting time for the patients below the maximum set by the guarantee. In
some of the country case studies, most notably the Netherlands, there was a reduction in
long waits as well as in the mean waiting time.
The outflow (supply) of elective care depends on both public and private capacity and
the productivity with which the capacity is used. Dramatic changes in the technology of
surgery and anaesthesiology in recent decades have been associated with a large increase
in the amount of day surgery, especially for services with long waiting times such as
cataract surgery. As in other areas, there is wide variation in the rate of cataract surgery
and the share of it carried out as day surgery (OECD, 2011b). Productivity is also influenced
by the way hospitals and specialists are paid. Many OECD countries are increasingly using
activity-based hospital payments, often known as diagnosis-related groups (DRGs), to
increase hospital productivity (Busse et al., 2012). Providers treating larger volumes of
patients are rewarded with higher revenues. Incentives to increase production are stronger
compared to payment rules based on fixed budgets. Doctors’ payment also plays a role,
with fee-for-service systems providing stronger financial incentives than salary.
Figure 1.3. Benefits and costs from mis-prioritisation causedby maximum waiting time guarantees
Source: Michael Borowitz, Valerie Moran and Luigi Siciliani for the OECD.
Clinical needMax waiting-time
guarantee
WWaiting time
WAITING TIME POLICIES IN THE HEALTH SECTOR: WHAT WORKS? © OECD 201324

I.1. WAITING TIMES FOR HEALTH CARE: A CONCEPTUAL FRAMEWORK
Demand for and supply of health care respond to waiting timesThe demand for (inflow) and supply of (outflow) elective surgery are also affected by
the level of waiting times. Longer waiting times may reduce demand for public care by
inducing some patients to pay for private treatment, or to give up the treatment. Similarly,
longer waiting times may increase the supply of public care by inducing providers to work
harder (because providers are altruistic and feel bad about the patients waiting or because
their performance is based on waiting times targets) or inducing governments to allocate
more resources to the hospital sector.
Several empirical studies from England suggest that demand for health care there is
inelastic to waiting times and equal to -0.2. This implies that an increase in waiting times
by 10% reduces waiting times by 2%. It also implies that exogenous expansions in supply
will translate into significant reductions in waiting times, since the offsetting increase in
demand is small (Martin and Smith, 1999, 2003; for a more detailed review of the empirical
literature see Iversen and Siciliani, 2011; Siciliani and Iversen, 2012). These empirical
results do not necessarily hold for other OECD countries, where more evidence is needed.
One study from Australia (New South Wales), for example, suggests that demand is elastic
and equal to -1.7: an increase in waiting times by 10% reduces waiting times by 17%
(Stavrunova and Yerokhin, 2011). An expansion in supply will now have a moderate impact
on waiting times. Therefore, how demand responds to waiting time depends on the
specific institutional setting. The different results between England and Australia may be
explained by the more prominent role played by the private sector in Australia.
Waiting times are a significant policy issue in many OECD countriesbut not in others
One interesting feature of waiting times is that there is a group of countries where
waiting times are not a significant policy issue (including Luxembourg, the United States,
Switzerland, Germany, France, Belgium, Japan and Korea) (Siciliani and Hurst, 2004). Not
surprisingly, all of these countries (except Korea) spend above the OECD average, where
spending is measured by public health expenditure per capita (see Figure 1.4, Panel A;
countries are listed based on expenditure levels in descending order). However, several
countries where waiting times are a significant policy issue also spend above the OECD
average (e.g. Norway, Denmark, Canada, the United Kingdom), while others spend below
average (for example Italy, Spain, Portugal). Therefore, high expenditure is not a guarantee
of low waiting times.
Panels A and B in Figure 1.4 focus on beds and doctors. A large number of countries
where waiting times are a significant policy issue have a proportion of curative care beds that
is below the OECD average, and several countries where waiting times are not a significant
issue have a proportion above the OECD average. Therefore, capacity constraints as proxied
by bed availability seem to play a role. There are, however, exceptions: Switzerland and the
United States have a below-average proportion, but waiting times are not a significant issue.
Seven countries are higher than average, but waiting times are a significant issue.
Panel C in Figure 1.4 provides a surprising picture. Most countries (the exceptions
being Switzerland and Germany) where waiting times are not a significant policy issue
have proportions of doctors below the OECD average. Countries where waiting times are a
policy issue exhibit both higher-than-average proportions of doctors and lower-than-
average proportions, although to some extent this may be due to how doctors are defined.
WAITING TIME POLICIES IN THE HEALTH SECTOR: WHAT WORKS? © OECD 2013 25

I.1. WAITING TIMES FOR HEALTH CARE: A CONCEPTUAL FRAMEWORK
Figure 1.4. Public health expenditure and waiting times
1. Doctors are classified as “professionally active” meaning that data include not only doctors providing direct careto patients, but also those working in the health sector as managers, educators, researchers, etc. (adding another5-10% of doctors).
2. Data refer to all doctors who are licensed to practice.Source: OECD (2012), OECD Health Data 2012, OECD Publishing, Paris, http://dx.doi.org/10.1787/health-data-en, for publichealth expenditure in 2009; OECD Waiting Times Policy Survey 2011-12 for reported information on waiting times asan issue.
Curative care beds per 1 000 population (2010)higher than OECD average
Public health expenditure per capita (USD PPP)higher than OECD average
Curative care beds per 1 000 population (2010)lower than OECD average
Public health expenditure per capita (USD PPP)lower than OECD average
A. Public health expenditure per capita USD PPP, 2010 (or nearest available year) and waiting times
B. Curative care beds per 1 000 population (2010) and waiting times
JapanGermanyKoreaLuxembourgBelgiumFrance
LuxembourgUnited StatesSwitzerlandGermanyFranceBelgiumJapan
Korea ItalySpainPortugalSloveniaGreeceCzech RepublicSlovak RepublicIsraelPoland Turkey
Waiting times are NOTa significant policy issue
Waiting times are a significantpolicy issue
Italy
Waiting times are a significantpolicy issue
NorwayNetherlandsDenmarkAustriaCanadaSwedenUnited KingdomIcelandIrelandNew ZealandAustraliaFinland
Physicians per 1 000 population (2010)higher than OECD average
Physicians per 1 000 population (2010)lower than OECD average
C. Physicians per 1 000 population (2010) and waiting times
SwitzerlandGermany
Waiting times are NOTa significant policy issue
Waiting times are a significantpolicy issue
SwitzerlandUnited States
Waiting times are NOTa significant policy issue
AustraliaNetherlands1
FinlandUnited KingdomNew ZealandSloveniaCanada1
PolandTurkey1
FranceBelgiumLuxembourgUnited StatesJapanKorea
Greece1
AustriaNorwayPortugal2
SwedenSpainItalyIcelandCzech RepublicIsraelDenmarkSlovak RepublicIreland
AustriaCzech RepublicSlovak RepublicPolandGreece SloveniaAustralia
NetherlandsDenmark
ItalyPortugalSpainTurkeyNorwayUnited KingdomIrelandSwedenNew ZealandIsraelFinlandCanada
WAITING TIME POLICIES IN THE HEALTH SECTOR: WHAT WORKS? © OECD 201326

I.1. WAITING TIMES FOR HEALTH CARE: A CONCEPTUAL FRAMEWORK
Figure 1.5 (Panels A-C) shows the relationship between long waiting times for a
smaller set of 11 OECD countries (as measured in the 2010 Commonwealth Fund Survey,
Schoen et al., 2010) and health expenditure, hospital beds and doctors (from the OECD
Health Data 2012). Long waiting times are proxied through the proportion of patients who
waited longer than four months for elective surgery. Data on waiting times were collected
from a phone survey from a representative sample of individuals in each country
(Schoen et al., 2010).
In terms of public spending, countries with high waiting times (with more than 15% of
patients waiting more than four months) are also characterised by lower spending.
However, there are exceptions: New Zealand and France have comparable levels of
spending but the proportion of patients with a long wait is lower (below 10%). Moreover,
Norway has high expenditure but the proportion of patients with a long wait is above 20%.
The correlation between spending and long waiting is weak and equal to -0.12, but when
Norway is excluded is -0.45.
In line with Panel B in Figure 1.4, Panel B in Figure 1.5 suggests that there is a more
pronounced negative correlation (-0.67) between long waits and the availability of curative
care beds, which is reduced when Germany is excluded (-0.55). Again, in line with Panel C
in Figure 1.4, Panel C in Figure 1.5 does not suggest a clear association between waiting
times and physician availability.
In summary, there are two key insights from the above description. First, waiting times
have a clear negative association with acute care beds, and only to a lesser extent public
health expenditure. Second, there is a lot of variation across countries, and waiting times
are not exclusively an issue of supply. The implications of this analysis should be taken
with a note of caution. It is difficult to make causal inferences from the above diagrams.
These are only associations. Many other (omitted) factors also play a role (differences in
age structure, needs, health profile and specific health system characteristics, payment
systems that reward activity for both specialists and hospitals, etc.). Nevertheless, they are
instructive to give a general picture across OECD countries.
Waiting times may affect health outcomesThere is some evidence on whether waiting times lead to poorer health outcomes. Some
studies suggest that longer waiting times for emergency procedures (e.g. Guttmann et al., 2011)
and urgent procedures, such as CABG, lead to worse outcomes in terms of physical and social
functioning. Sobolev and Fradet (2008) review the literature for patients in need of CABG. They
suggest that long waits may worsen symptoms, deteriorate patient’s condition and lead to
worse clinical outcomes. Waits may also increase the probability of preoperative death and
unplanned emergency admission (see also Rexius et al., 2004; Sobolev et al., 2006, 2012; Sobolev
and Kuramoto, 2010).
The evidence is less conclusive for less urgent procedures. Hirvonen (2007) reviews the
literature for patients in need of hip or knee replacement across a range of OECD countries.
The review, which covers both observational and randomised studies, finds that the evidence
is mixed, with some studies finding that longer waiting times did reduce health outcomes,
though most of them do not find any effect (see, for example, Hirvonen et al., 2007). The
systematic review by Hoogeboom et al. (2009) included 15 studies and concluded that there
was strong evidence that pain did not worsen during a six-month wait for patients awaiting
WAITING TIME POLICIES IN THE HEALTH SECTOR: WHAT WORKS? © OECD 2013 27

I.1. WAITING TIMES FOR HEALTH CARE: A CONCEPTUAL FRAMEWORK
Figure 1.5. Relationship between long waiting times and health expenditure,hospital beds and doctors
Source: OECD (2012), OECD Health Data 2012, OECD Publishing, Paris, http://dx.doi.org/10.1787/health-data-en; andC. Schoen, R. Osborne et al. (2010), “How Health Insurance Design Affects Access to Care and Costs, by Income, inEleven Countries”, Health Affairs, Vol. 29, No. 12, pp. 2322-2337.
1 2 http://dx.doi.org/10.1787/888932753875
30
25
20
15
10
5
02 000 2 500 3 000 3 500 4 000 4 500 5 000
30
25
20
15
10
5
00 1 2 3 4 5 6
30
25
20
15
10
5
02.0 2.5 3.0 3.5 4.0 4.5
AUS
CAN
FRA
DEU
NLD
NZL
NORSWE
CHE
GBR
USA
DEU
AUS
CAN
FRANLD
NZL
NORSWE
CHE
GBR
USA
AUS
FRA
DEU
NLD
NZL
NORSWE
CHE
GBR
USA
CAN
Linear (with Norway) Linear (without Norway)
Percentage waited four months or more for elective surgery
A. Public health expenditure per capita (USD PPP) and percentage waitingfour months or more for elective surgery, 2010
Public health expenditure per capita USD PPP
Linear (with Germany) Linear (without Germany)
Percentage waited four months or more for elective surgery
B. Curative care beds per 1 000 population and percentage waitingfour months or more for elective surgery, 2010
C. Physicians per 1 000 population and percentage waiting four months or more for elective surgery, 2010
Curative care beds, per 1 000 population
Percentage waited four months or more for elective surgery
Physicians per 1 000 population
Corr = -0.12, p-value = 0.72
Corr = -0.67, p-value = 0.02Corr = -0.55, p-value = 0.10
Corr = -0.04, p-value = 0.90
Corr = -0.45, p-value = 0.19
WAITING TIME POLICIES IN THE HEALTH SECTOR: WHAT WORKS? © OECD 201328

I.1. WAITING TIMES FOR HEALTH CARE: A CONCEPTUAL FRAMEWORK
a hip and knee replacement. Self-reported functioning also did not deteriorate for patients
awaiting a hip replacement, but there was conflicting evidence for patients awaiting a knee
replacement.
Observational studies that find no effect on health outcomes may be consistent with
clinical prioritisation and may suggest that waiting lists tend to work fairly well in
rationing care based on clinical need. It is important to emphasise that there is always the
escape valve of shifting a patient from elective to emergency care if the patient deteriorates
significantly while waiting. Also, one major effect of waiting concerns the experience of the
patient and the anxiety associated with waiting, which are often not well captured in
clinical studies.
Waiting time may result in inequality in accessOne of the rationales behind using waiting lists to allocate health care is that it is a
means of granting access to services that does not depend on the ability to pay. This is in
contrast to rationing by price (co-payments or coinsurance rates), where access to care
depends on income. Recent empirical literature suggests that, even within a publicly
funded health system, non-price rationing does not guarantee equality of access with
respect to the patient’s socio-economic status. In several OECD countries, individuals with
higher socioeconomic status (as measured by income or educational attainment) tend to
wait less for publicly funded hospital care than those with lower socioeconomic status (see
Siciliani and Verzulli, 2009b; Cooper et al., 2009 and Laudicella et al., 2012 for England; Johar
et al., 2010 and Sharma et al., 2011 for Australia; Monstad et al., 2010 and Carlsen and
Kaarboe, 2010 for Norway).
There are several possible explanations for the residual gradient between waiting time
and socio-economic status. Individuals with higher socioeconomic status may engage
more actively with the system and exercise pressure when they experience long delays.
They may also have better social networks (“know someone”) and use them to gain priority
over other patients, and they may have a lower probability of missing scheduled
appointments (which would increase the waiting time). This negative gradient between
waiting time and socioeconomic status may be interpreted as evidence of inequity within
publicly funded systems and suggests that waiting lists may be less equitable than they
appear.
ConclusionsWaiting times are the result of a complex interaction between the demand for and the
supply of health care services, where doctors play a critical role on both sides. The health
policy significance of waiting times varies substantially across OECD countries. However,
waiting times are not exclusively an issue of supply, since there are countries with high
levels of spending, beds or doctors that have long waiting times. Waiting times generate
disutility to patients due to postponed benefits from treatments, pain while waiting,
anxieties due to uncertainty about the date of treatment and the risk of poorer health
outcomes. It is no surprise that many OECD countries continuously develop policies aimed
at tackling excessive waiting times. This is the subject of most of the remainder of this
book, which gives a detailed account of different approaches and experiences across
13 OECD countries.
WAITING TIME POLICIES IN THE HEALTH SECTOR: WHAT WORKS? © OECD 2013 29

I.1. WAITING TIMES FOR HEALTH CARE: A CONCEPTUAL FRAMEWORK
References
Busse, R., A. Geissler, W. Quentin and M. Wiley (2012), Diagnosis-Related Groups in Europe Moving TowardsTransparency, Efficiency and Quality in Hospitals, Open University Press, England.
Carlsen, F. and O. Kaarboe (2010), “Waiting Times and Socioeconomic Status. Evidence from Norway”,Working Papers in Health Economics, No. 2/10, Health Economics Bergen, University of Bergen,Norway.
Cooper, R.B. (1981), Basic Queuing Theory, North Holland, New York.
Cooper, Z.N., A. McGuire, S. Jones S. and J. Le Grand (2009), “Equity, Waiting Times, and NHS Reforms:Retrospective Study”, British Medical Journal, Vol. 339, p. b3264.
Goddard, J., M. Malek and M. Tavakoli (1995), “An Economic Model of the Market for Hospital Treatmentfor Non-urgent Conditions”, Health Economics, Vol. 4/1, pp. 41-55.
Guttmann, A., M.J. Schull, M.J. Vermeulen, M.J and T.A. Stukel (2011), “Association Between WaitingTimes and Short-term Mortality and Hospital Admission After Departure from EmergencyDepartment: Population-based Cohort Study from Ontario, Canada”, British Medical Journal,Vol. 342, p. d2983.
Hirvonen, J. (2007), “Effect of Waiting Time on Health Outcomes and Service Utilization. A ProspectiveRandomized Study on Patients Admitted to Hospital for Hip or Knee Replacement”, Research ReportNo. 170, STAKES, Helsinki.
Hirvonen, J., M. Blom, U. Tuominen, S. Seitsalo, M. Lehto, P. Paavolainen, K. Hietaniemi, P. Rissanen andH. Sintonen (2007), “Evaluating Waiting Time Effect on Health Outcomes at Admission: AProspective Randomized Study on Patients with Osteoarthritis of the Knee Joint”, Journal ofEvaluation in Clinical Practice, Vol. 13, pp. 728-733.
Hoogeboom, T.J., C.H.M. van den Ende, G. van der Sluis, J. Elings, J.J. Dronkers, A.B. Aiken, N.L.U. vanMeeteren (2009), “The Impact of Waiting for Total Joint Replacement on Pain and Functional Status:A Systematic Review”, Osteoarthritis and Cartilage, Vol. 17, pp. 1420-1427.
Hurst, J. and L. Siciliani (2003), “Tackling Excessive Waiting Times for Elective Surgery: A Comparisonof Policies in Twelve OECD Countries”, OECD Health Working Papers, No. 6, OECD Publishing, Paris,http://dx.doi.org/10.1787/108471127058.
Iversen, T. (1993), “A Theory of Hospital Waiting Lists”, Journal of Health Economics, Vol. 12, pp. 55 – 71.
Iversen, T. (1997), “The Effect of a Private Sector on the Waiting Time in a National Health Service”,Journal of Health Economics, Vol. 16, pp. 381-396.
Iversen, T. and L. Siciliani (2011), “Non-price Rationing and Waiting Times”, Oxford Handbook of HealthEconomics, Chapter 28, Oxford University Press, pp. 444-460.
Johar, M., G. Jones, M. Keane, E. Savage and O. Stavrunova (2010), “Differences in Waiting Times forElective Admissions in NSW Public Hospitals: A Decomposition Analysis by Non-clinical Factors”,Working Paper No. 2010/7, CHERE, University of Technology, Sidney.
Laudicella, M., L. Siciliani and R. Cookson (2012), “Waiting Times and Socioeconomic Status: Evidencefrom England”, Social Science and Medicine, Vol. 74, No. 9, pp. 1331-1341.
Martin, S. and P.C. Smith (1999), “Rationing by Waiting Lists: An Empirical Investigation”, Journal ofPublic Economics, Vol. 71, pp. 141-164.
Martin, S. and P.C. Smith (2003), “Using Panel Methods to Model Waiting Times for National HealthService Surgery”, Journal of the Royal Statistical Society, Vol. 166, Part 2, pp. 1-19.
Monstad, K., L.B. Engeaeter and B. Espehaug. (2010), “Waiting Time Socioeconomic Status: AnIndividual Level Analysis”, Working Papers in Economics, No. 11/10, Department of Economics,University of Bergen.
OECD (2011a), Health at a Glance 2011 – OECD Indicators, OECD Publishing, Paris, http://dx.doi.org/10.1787/health_glance-2001-en.
OECD (2011b), “Value for Money in Health Care: Analysing Variations in Medical Practices”, Paperpresented at the meeting of the OECD Health Committee, 20-21 June 2011, OECD, Paris.
OECD (2012a), “OECD Project on Medical Practice Variations: Objectives and Proposed Approach”, Paperpresented at the meeting of the OECD Health Committee Expert Group on Medical PracticeVariations, 2-3 April 2012, OECD, Paris.
OECD (2012b), OECD Health Data 2012, OECD Publishing, Paris, http://dx.doi.org/10.1787/health-data-en.
WAITING TIME POLICIES IN THE HEALTH SECTOR: WHAT WORKS? © OECD 201330

I.1. WAITING TIMES FOR HEALTH CARE: A CONCEPTUAL FRAMEWORK
Rexius, H., G. Brandrup-Wognsen, A. Oden and A. Jeppsson (2004), “Mortality on the Waiting List forCoronary Artery Bypass Grafting: Incidence and Risk Factors”, Annals of Thoracic Surgery, Vol. 77,pp. 769-774.
Schoen, C., R. Osborne et al. (2010), “How Health Insurance Design Affects Access to Care and Costs, byIncome, in Eleven Countries”, Health Affairs, Vol. 29, No. 12, pp. 2322-2337.
Sharma, A., L. Siciliani and A. Harris (2011), “Waiting Times and Socioeconomic Status: Does SampleSelection Matter?”, Working Paper No. 11/22, Health, Econometrics and Data Group (HEDG),Department of Economics, University of York.
Siciliani, L. and J. Hurst (2003), “Explaining Waiting Times Variations for Elective Surgery across OECDCountries”, OECD Health Working Papers, No. 7, OECD Publishing, Paris, http://dx.doi.org/10.1787/406746186162.
Siciliani, L. and J. Hurst (2004), “Explaining Waiting Times Variations for Elective Surgery across OECDCountries”, OECD Economic Studies, Vol. 38, No. 1, pp. 95-123, http://dx.doi.org/10.1787/eco_studies-v2004-art5-en.
Siciliani, L. and J. Hurst (2005), “Tackling Excessive Waiting Times for Elective Surgery: A Comparisonof Policies in 12 OECD Countries”, Health Policy, Vol. 72, No. 2, pp. 201-215.
Siciliani, L. and T. Iversen (2012), “Waiting Lists and Waiting Times”, in A. Jones (ed.), Elgar Companionin Health Economics, Second Edition, Chapter 24, pp. 59-70.
Siciliani, L. and R. Verzulli (2009b), “Waiting Times and Socioeconomic Status Among ElderlyEuropeans: Evidence from SHARE”, Health Economics, Vol. 18, No. 11, pp. 1295-1306.
Siciliani, L., A. Stanciole and R. Jacobs (2009a), “Do Waiting Times Reduce Costs?”, Journal of HealthEconomics, Vol. 28/4, pp. 771-780.
Smet, M. (2004), “Multi-product Costs and Standby Capacity Derived from Queuing Theory: The Caseof Belgian Hospitals”, Applied Economics, Vol. 36, No. 13, pp. 1475 – 1487.
Sobolev, B. and G. Fradet (2008), “Delays for Coronary Artery Bypass Surgery: How Long is Too Long?”,Expert Review of Pharmaeconomics and Outcome Research, Vol. 8, No. 1, pp. 27-32.
Sobolev, B. and L Kuramoto (2010), Analysis of Waiting-time Data in Health Services Research, Springer.
Sobolev, B.G., G. Fradet, L. Kuramoto and B. Rogula (2012), “An Observational Study to Evaluate 2 TargetTimes for Elective Coronary Bypass Surgery”, Medical Care, Vol. 50, No. 7, pp. 611-619.
Sobolev, B.G., A.R. Levy, L. Kuramoto, R. Hayden and J.M. FitzGerald (2006), “Do Longer Delays forCoronary Artery Bypass Surgery Contribute to Preoperative Mortality in Less Urgent Patients?”,Medical Care, Vol. 44, No. 7, pp. 680-686.
Stavrunova, O. and O. Yerokhin (2011), “Equilibrium Model of Waiting Times for Elective Surgery inNSW Public Hospitals”, Economic Record, Vol. 87, No. 278, pp. 384-398.
Wennberg, J.E. (2010), Tracking Medicine A Researcher’s Quest to Understand Health Care, Oxford UniversityPress, New York.
Wennberg, J.E. and A. Gittelsohn (1975), “Health Care Delivery in Maine, I: Patterns of Use of CommonSurgical Procedures”, Journal of the Maine Medical Association, Vol. 66, pp. 123-130, 149.
WAITING TIME POLICIES IN THE HEALTH SECTOR: WHAT WORKS? © OECD 2013 31
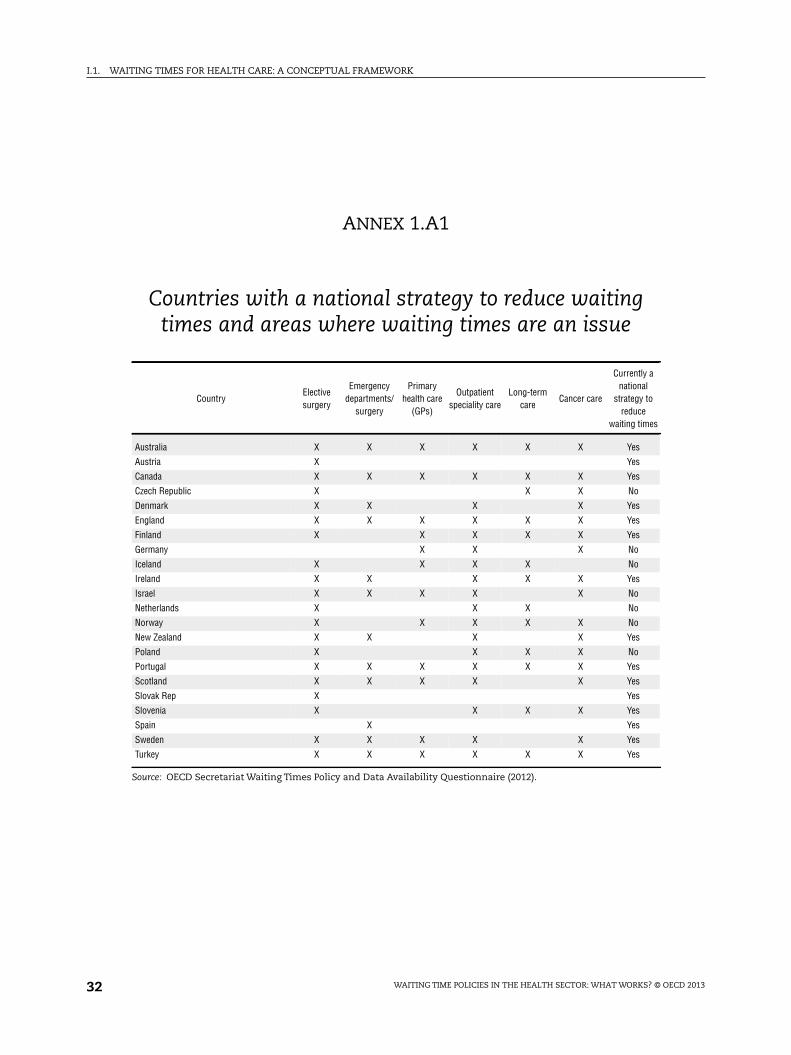
I.1. WAITING TIMES FOR HEALTH CARE: A CONCEPTUAL FRAMEWORK
ANNEX 1.A1
Countries with a national strategy to reduce waitingtimes and areas where waiting times are an issue
CountryElectivesurgery
Emergencydepartments/
surgery
Primaryhealth care
(GPs)
Outpatientspeciality care
Long-termcare
Cancer care
Currently anational
strategy toreduce
waiting times
Australia X X X X X X Yes
Austria X Yes
Canada X X X X X X Yes
Czech Republic X X X No
Denmark X X X X Yes
England X X X X X X Yes
Finland X X X X X Yes
Germany X X X No
Iceland X X X X No
Ireland X X X X X Yes
Israel X X X X X No
Netherlands X X X No
Norway X X X X X No
New Zealand X X X X Yes
Poland X X X X No
Portugal X X X X X X Yes
Scotland X X X X X Yes
Slovak Rep X Yes
Slovenia X X X X Yes
Spain X Yes
Sweden X X X X X Yes
Turkey X X X X X X Yes
Source: OECD Secretariat Waiting Times Policy and Data Availability Questionnaire (2012).
WAITING TIME POLICIES IN THE HEALTH SECTOR: WHAT WORKS? © OECD 201332

Waiting Time Policies in the Health Sector
What Works?
© OECD 2013
PART I
Chapter 2
Measuring waiting times acrossOECD countries
by
Luigi Siciliani,
Department of Economics and Related Studies, University of York, United Kingdom,
Michael Borowitz and Valerie Moran,
Health Division, OECD
and
Huw Dixon,
Cardiff Business School, Cardiff, United Kingdom
The measurement of waiting times varies widely across OECD countries. This chaptergives an overview of different measures of patients’ experience of waiting usingexamples from several countries. Common measures are the in-patient waiting time(from specialist addition to the list to treatment), the out-patient waiting time (fromgeneral practitioner referral to specialist visit) and the referral-to-treatment (from GPreferral to treatment). Reported figures include the mean waiting times, the waitingtime at different percentiles of the distribution (at the 50th percentile, i.e. the median,the 80th, 90th or 95th percentile), and the number of patients waiting more than athreshold waiting time, for example, three, six or nine months. Waiting times arereported in most countries by procedure (e.g. hip and knee replacement, cataractsurgery) or by specialty (e.g. ophthalmology, orthopedics). They refer mainly to twodistributions: i) the distribution of waiting times of patients treated in a given period(for example, a financial year); ii) the distribution of waiting times of the patients onthe list at a point in time (a census date). Most information on waiting times isavailable from administrative databases from countries where waiting times are asignificant policy issue, and less so from survey data.
33

I.2. MEASURING WAITING TIMES ACROSS OECD COUNTRIES
IntroductionThe measurement of waiting times varies widely across OECD countries, and the
definitions used are system specific. There are many different concepts to be considered.
This chapter gives an overview of different measures of patients’ experience of waiting,
using examples from several countries.
We start by making a distinction between waiting lists and waiting times, and then
focus on several measures of waiting times. OECD countries start measuring waiting times
at different points in the patient journey. The most common measures are the in-patient
waiting time (from specialist addition to the list to treatment), the out-patient waiting time
(from GP referral to specialist visit) and the referral-to-treatment (from GP referral to
treatment). Countries are moving towards measuring referral-to-treatment waiting time
since they are trying to capture waiting time across the full patient journey from when a
referral is made in primary care to the time treatment is provided.
Commonly reported measures are: i) the mean and median waiting times, ii) the
waiting time at different percentiles of the distribution in addition to the median (i.e. at the
50th percentile), for example the 80th, 90th or 95th percentile, iii) the number or proportion
of patients waiting more than a threshold waiting time, for example, three, six or nine
months. The distribution of waiting times tends to be positively skewed, with a tail of
patients waiting very long times. Hence, the mean is influenced by a small number of
patients with long waits and is systematically above the median. The mean and the
median are more representative of the average patient’s experience. The other measures,
which focus on the proportion or number of patients waiting above a threshold waiting
time or the waiting time at a high percentile, have the advantage of focusing on patients
who are most disadvantaged, i.e. those with the longest wait (although if prioritisation
works well, these are likely to be patients with the lowest severity).
Waiting times are reported in most countries: i) for specific procedures (e.g. hip and
knee replacement, cataract surgery, coronary bypass, etc.); ii) by specialty (e.g.
ophthalmology, orthopedics, etc.); iii) for all elective patients. Increasingly, waiting times
are collected for urgent types of care (e.g. cancer care).
Reported measures of waiting times refer to either of two distributions: i) the
distribution of waiting times of patients treated in a given period (for example, a financial
year); ii) the distribution of waiting times of the patients on the list at a point in time (a
census date). The first distribution measures the full duration of the patient’s waiting time
experience (from entering to exiting the list). The second measure of waiting times of
patients on the list is instead “incomplete”, since the patient’s wait has yet to come to an
end. The waiting time of patients treated has the advantage of capturing the full duration
of a patient’s journey, but obviously is retrospective in nature. The main advantage of the
waiting time of patients on the list is that it captures the experience of the patients who are
still waiting at a point in time.
WAITING TIME POLICIES IN THE HEALTH SECTOR: WHAT WORKS? © OECD 201334

I.2. MEASURING WAITING TIMES ACROSS OECD COUNTRIES
Most information on waiting times is available from administrative databases from
countries where waiting times are a significant policy issue. Survey data is, to a much lesser
extent, also available for a subset of OECD countries, some of which have a significant
waiting time problem. Survey data can prove useful to compare countries with and without
a waiting time problem, though the information is only available at aggregate level.
Waiting times, not waiting listsWhile the waiting list provides the stock of patients to be treated at a point in time (the
number of patients on the list), the waiting time is determined by the duration of time
necessary to treat all the patients on the current waiting list through the current and future
supply of treatments. Although waiting times and waiting lists are related concepts, they
can vary in different ways over time (Siciliani, 2008). For example, waiting lists in England
have been constantly rising over long time-periods since the 1950s. In contrast, waiting
times have been fairly stable over long periods of time (Hurst and Siciliani, 2003). From the
patients’ perspective, what matters is the “time” waited, not the length of the list: patients
will not be concerned by long waiting lists if the waiting time is short. For this reason,
governments have focused increasingly on the measurement of waiting times and less on
the number of patients on the list.
When does the patient’s waiting time start and finish?As is evident from Figure 2.1, OECD countries start measuring waiting times at
different points in the patient journey.
Figure 2.1. Examples of starting points for measuring waiting times(completed waits) for contact, primary care appointments,
specialist care appointments and treatment
* Sweden measures both waiting time for contact and for upcoming visits in primary care.Source: Adapted from SALAR (2011), “Swedish Waiting Times for Health Care in an International Perspective”, SALAR,Stockholm, updated by the OECD Secretariat.
Primary care Specialised care
Referral to treatment
Appointment
Contact
Appointment
iv) Inpatientii) Diagnostic
iii) Outpatientii) Diagnostic
i) General practice doctor
Finland
Sweden*
England
Scotland
Denmark
Portugal
Sweden
Spain (referralto a specialist)
Finland
NewZealand
Netherlands
Denmark
Norway
England (RTT)
England (HESoutpatient)
Finland
Scotland (RTT)
Scotland(outpatient)
England (HESinpatient)
The NetherlandsFinland
ScotlandPortugal
New ZealandSweden
Spain (electivesurgical
procedure) Finland
Portugal
Ireland
Canada
Australia
Finland
laboratory,measurements
Examinations, Examinations,
laboratory,measurements
Patient listed
Decision to treat
Referral written
Referral received
Referral evaluated
Treatmentstarted
WAITING TIME POLICIES IN THE HEALTH SECTOR: WHAT WORKS? © OECD 2013 35
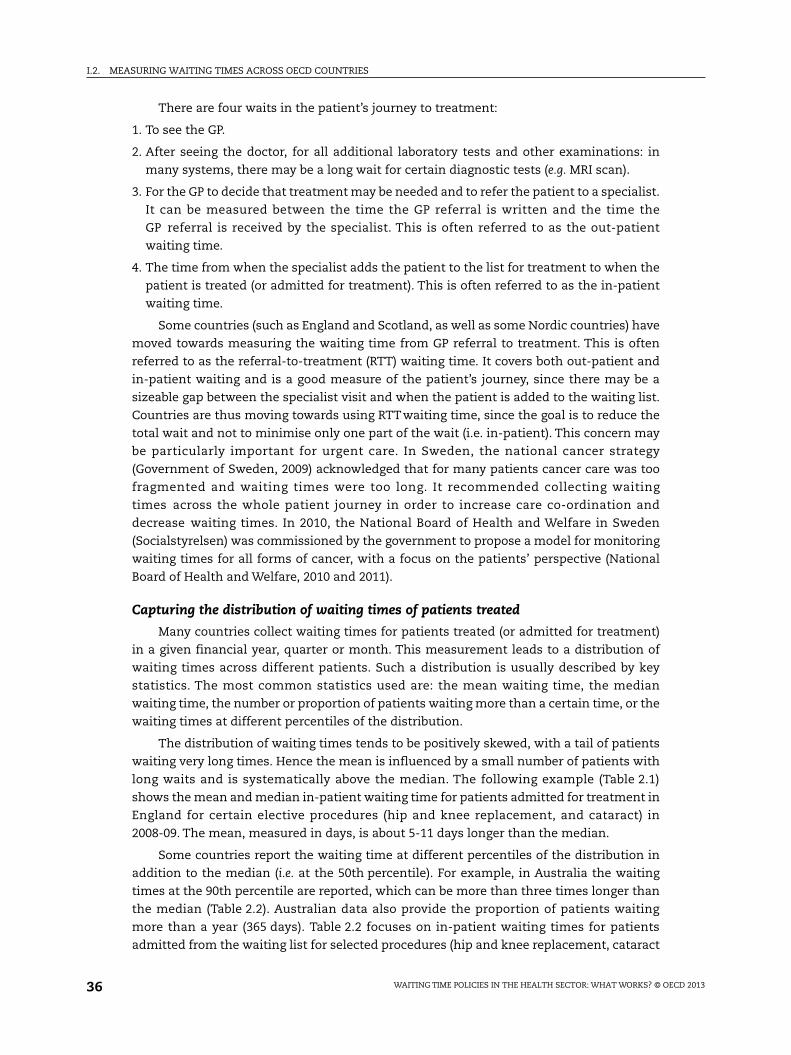
I.2. MEASURING WAITING TIMES ACROSS OECD COUNTRIES
There are four waits in the patient’s journey to treatment:
1. To see the GP.
2. After seeing the doctor, for all additional laboratory tests and other examinations: in
many systems, there may be a long wait for certain diagnostic tests (e.g. MRI scan).
3. For the GP to decide that treatment may be needed and to refer the patient to a specialist.
It can be measured between the time the GP referral is written and the time the
GP referral is received by the specialist. This is often referred to as the out-patient
waiting time.
4. The time from when the specialist adds the patient to the list for treatment to when the
patient is treated (or admitted for treatment). This is often referred to as the in-patient
waiting time.
Some countries (such as England and Scotland, as well as some Nordic countries) have
moved towards measuring the waiting time from GP referral to treatment. This is often
referred to as the referral-to-treatment (RTT) waiting time. It covers both out-patient and
in-patient waiting and is a good measure of the patient’s journey, since there may be a
sizeable gap between the specialist visit and when the patient is added to the waiting list.
Countries are thus moving towards using RTTwaiting time, since the goal is to reduce the
total wait and not to minimise only one part of the wait (i.e. in-patient). This concern may
be particularly important for urgent care. In Sweden, the national cancer strategy
(Government of Sweden, 2009) acknowledged that for many patients cancer care was too
fragmented and waiting times were too long. It recommended collecting waiting
times across the whole patient journey in order to increase care co-ordination and
decrease waiting times. In 2010, the National Board of Health and Welfare in Sweden
(Socialstyrelsen) was commissioned by the government to propose a model for monitoring
waiting times for all forms of cancer, with a focus on the patients’ perspective (National
Board of Health and Welfare, 2010 and 2011).
Capturing the distribution of waiting times of patients treated
Many countries collect waiting times for patients treated (or admitted for treatment)
in a given financial year, quarter or month. This measurement leads to a distribution of
waiting times across different patients. Such a distribution is usually described by key
statistics. The most common statistics used are: the mean waiting time, the median
waiting time, the number or proportion of patients waiting more than a certain time, or the
waiting times at different percentiles of the distribution.
The distribution of waiting times tends to be positively skewed, with a tail of patients
waiting very long times. Hence the mean is influenced by a small number of patients with
long waits and is systematically above the median. The following example (Table 2.1)
shows the mean and median in-patient waiting time for patients admitted for treatment in
England for certain elective procedures (hip and knee replacement, and cataract) in
2008-09. The mean, measured in days, is about 5-11 days longer than the median.
Some countries report the waiting time at different percentiles of the distribution in
addition to the median (i.e. at the 50th percentile). For example, in Australia the waiting
times at the 90th percentile are reported, which can be more than three times longer than
the median (Table 2.2). Australian data also provide the proportion of patients waiting
more than a year (365 days). Table 2.2 focuses on in-patient waiting times for patients
admitted from the waiting list for selected procedures (hip and knee replacement, cataract
WAITING TIME POLICIES IN THE HEALTH SECTOR: WHAT WORKS? © OECD 201336

I.2. MEASURING WAITING TIMES ACROSS OECD COUNTRIES
and hysterectomy). Taking hip replacement as an example, the waiting time at the
50th percentile (i.e. the median) in 2008-09 was 100 days, while the waiting time at the
90th percentile was 364 days, i.e. more than three times longer. This suggests a wide
dispersion in waiting times within a given procedure. The proportion of patients waiting
more than a year was 9.6%. Compared to hip and knee replacement, waiting times for
hysterectomy were substantially lower for the same time period.
All these different statistics are useful. The mean and the median are more
representative of the average patient’s experience. The other measures, which focus on the
proportion or number of patients waiting above a threshold waiting time, or the waiting
time at a high percentile (e.g. 80th, 90th or 95th), have the advantage of focusing on patients
who are most disadvantaged, i.e. those with the longest wait.
For what type of care are waiting times measured?
Common ways to report waiting times are by treatment (e.g. hip and knee
replacement, cataract, hip fracture), specialty (e.g. ophthalmology, orthopedics) or
diagnostic test (e.g. MRI scan). Some countries also report waiting times for all the patients
who were admitted from the waiting list (i.e. for any treatment and specialty).
A recent publication by the Swedish Association of Local Authorities and Regions
(SALAR, 2011) documented a wide range of different approaches to measuring waiting
times across OECD countries. One of the most common approaches is the use of waiting
times by specialty, but this is difficult to compare across countries.
We report some examples by specialty and diagnostic test from Australia and Italy. In
Australia (Table 2.3), median waiting times tend to be lower for cardio-thoracic surgery and
urology, where possibly more urgent procedures are performed, compared to other
specialties like ophthalmology and orthopedic surgery. Therefore, differences in waiting
Table 2.1. Mean and median in-patient waiting time of patients admittedfor treatment, England, 2008-09
Episodes Mean (days) Median (days)
Primary hip replacement cemented (HRG H80) 37 207 82 74
Primary hip replacement uncemented (HRG H81) 21 769 87 77
Primary knee replacement (HRG H04) 70 813 89 78
Phakoemulsification cataract extraction and insertion of lens (B13) 313 640 61 56
Source: Hospital Episode Statistics on line at www.hesonline.nhs.uk.1 2 http://dx.doi.org/10.1787/888932754654
Table 2.2. In-patient waiting times for patients admitted from the waiting list,public hospitals, Australia, 2008-09
AdmissionsDays waited
at 50th percentile(median)
Dayswaited at 90th
percentile
Percentagewaiting more than
365 days
Total hip replacement 7 939 100 364 9.6
Total knee replacement 11 493 147 393 14.9
Cataract extraction 51 436 84 320 3.6
Hysterectomy 9 879 48 171 1.2
Source: National Elective Surgery Waiting Times Data Collection, Table 10.7, AIHW (2010), Australian Hospital Statistics2008-09, Health Services Series No. 17, No. HSE 84, AIHW, Canberra.
1 2 http://dx.doi.org/10.1787/888932754673
WAITING TIME POLICIES IN THE HEALTH SECTOR: WHAT WORKS? © OECD 2013 37

I.2. MEASURING WAITING TIMES ACROSS OECD COUNTRIES
times across specialties show that prioritisation is at work, with more severe patients
waiting for a shorter time than less severe patients. Such differences across specialties are
common across countries.
In Italy, average waiting times for selected diagnostic tests are around 1.5-2 months in
public hospitals but tend to be lower for private hospitals treating publicly funded patients
(Table 2.4).
Waiting times of patients treated versus waiting times of patients on the list
The discussion above has focused on the distribution of waiting times of patients
“admitted for treatment from the waiting list”. A second common measure is the
distribution of waiting times of the patients “on the list” at a point in time (i.e. at a census
date). The first distribution measures the full duration of the patient’s waiting time
experience (from entering to exiting the list). In contrast, the second measure is
“incomplete”, since the patient’s wait has yet to come to an end. Intuitively, this should
lead to a lower mean or median waiting time of patients on the list when compared to
patients treated, but this is not necessarily the case. A higher mean or median waiting time
of patients on the list compared to patients treated can arise because patients with long
waits are oversampled compared to patients with short waits (who tend to enter and exit
the waiting list more quickly) (see Dixon and Siciliani, 2009). Similar arguments apply to
the proportion of patients waiting more than a given waiting time: the proportion of
patients on the list waiting more than six months can be higher or lower than the
proportion of patients treated who have been waiting longer than six months.
Figure 2.2 illustrates the difference between the mean waiting times of the two
distributions. Suppose that in each period there are two patients who enter the waiting list:
Table 2.3. Waiting times for patients admitted from the waiting list,in-patient waiting time, Australia, 2008-09
AdmissionsDays waited at 50thpercentile (median)
Days waitedat 90th percentile
Ear, nose and throat surgery 53 602 58 318
Cardio-thoracic surgery 11 835 12 76
Ophthalmology 68 779 65 306
Orthopedic surgery 86 990 53 323
Urology 68 040 27 137
Source: National Elective Surgery Waiting Times Data Collection, Table 10.7, AIHW (2010), Australian Hospital Statistics2008-09, Health Services Series No. 17, No. HSE 84, AIHW, Canberra.
1 2 http://dx.doi.org/10.1787/888932754692
Table 2.4. Waiting times for diagnostic tests by type of provider in Italy, 2009Average number of days
Public hospitalPublic
outpatients clinicNHS accreditedprivate facility
All
Traditional X-rays 61 36 7 41
Ecography 44 66 25 42
Endoscopy tests 46 73 78 54
CT scan 46 73 49 53
MRI 65 91 15 52
Source: Fattore, G., G. Mariotti and V. Rebba (2012), “Waiting Times in Italy”, in L. Siciliani, M. Borowitz and V. Moran(eds.), Waiting-time Policies in the Health Sector: What Works?, OECD Publishing, Paris (Chapter 9 in this volume).
1 2 http://dx.doi.org/10.1787/888932754711
WAITING TIME POLICIES IN THE HEALTH SECTOR: WHAT WORKS? © OECD 201338

I.2. MEASURING WAITING TIMES ACROSS OECD COUNTRIES
one patient waits for one period, and the other patient waits for five periods. At time t, only
two patients have their wait that is just completed. One patient has waited for one period and
one patient has waited for five periods. The average wait of patients treated in period t (and
any other period) is therefore three periods. At time t there are six patients still waiting on the
list: two patients have waited for one period, one for two periods, one for three periods, one for
four periods and one for five periods. The average wait is therefore 2.7 periods. The
two averages are similar and this is due to oversampling of long-wait patients (those waiting
for five periods). Note that if every patient were to wait for five periods (and only one patient
enters the list per period), then the average wait of patients treated would be five periods. At
time t there would be five patients on the list, each waiting respectively one, two, three, four
and five periods, giving an average waiting time of patients on the list of three periods. Since
there is no oversampling of long-waiting time patients (since every patient waits the same) the
average waiting time of patients on the list is substantially lower than the average of patients
treated (due to the incomplete waiting).
An example from England illustrates the median waiting times of the patients on the
list and of patients treated (Table 2.5). The first column in the table below measures the
median waiting time from the time the patient was referred from the family doctor to the
time the patient is admitted to hospital for treatment. It therefore measures the complete
duration of the wait for those patients admitted to hospital in a given month. The second
column measures the median waiting time from the time the patient was referred from the
family doctor to the time the patient was removed from the list as the patient was not
admitted to hospital for treatment (non-admitted pathway): this could include waiting
time to see a specialist who decided that the patient did not require treatment. Finally, the
third column measures the median waiting from the time the patient was referred from
the family doctor to the census date, i.e. the end of the month, when the patients were still
waiting on the list. Therefore, the third column measures an incomplete wait at a census
date (for example, end of February) and includes both types of patients, i.e. those who were
admitted for treatment and those who were not but were removed from the list. Taking
February 2012 as an example, the median waiting time of the patients on the list was
5.2 weeks. The waiting time of patients treated was 8.7 weeks and the waiting time of
patients without a hospital admission was 3.6 weeks.
Figure 2.2. Waiting time of patients treated and on the list
Source: Luigi Siciliani for the OECD.
1
2
3
4
5
t
Cohort t
Cohort (t-1)
Cohort (t-2)
Cohort (t-3)
Cohort (t-4)
Cohort (t-5)
Cohort (t-6)
Cohort (t+1)
Patient’s waitcompleted at time t
time
WAITING TIME POLICIES IN THE HEALTH SECTOR: WHAT WORKS? © OECD 2013 39
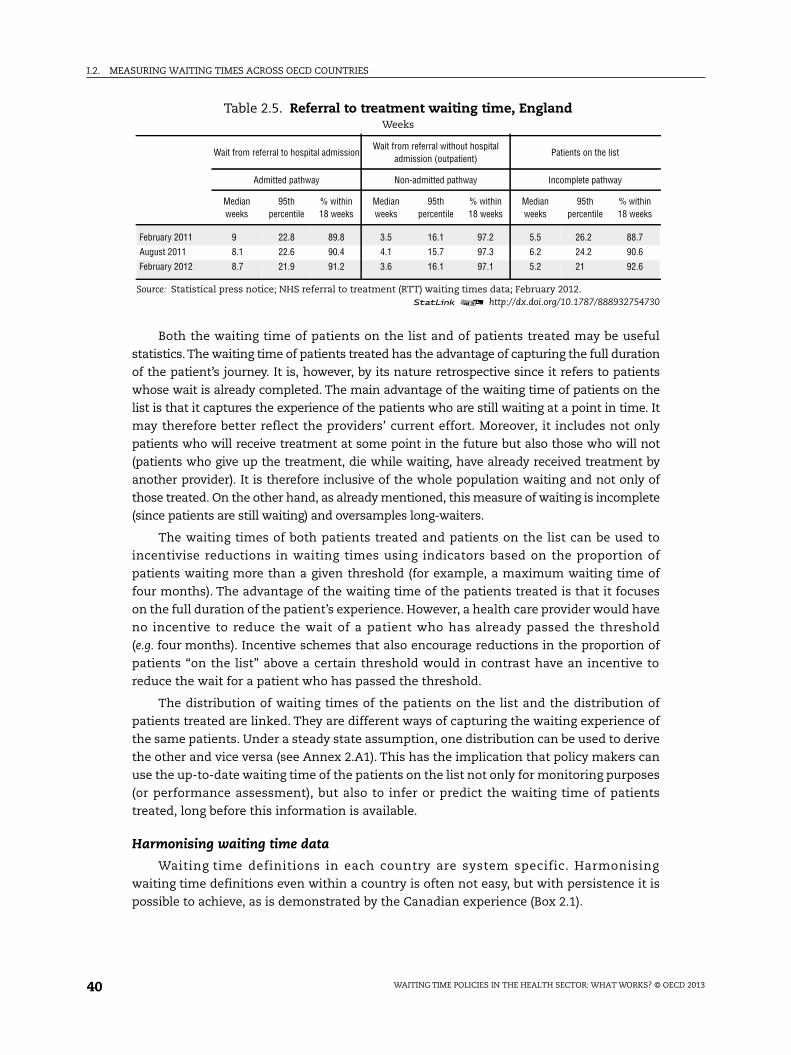
I.2. MEASURING WAITING TIMES ACROSS OECD COUNTRIES
Both the waiting time of patients on the list and of patients treated may be useful
statistics.The waiting time of patients treated has the advantage of capturing the full duration
of the patient’s journey. It is, however, by its nature retrospective since it refers to patients
whose wait is already completed. The main advantage of the waiting time of patients on the
list is that it captures the experience of the patients who are still waiting at a point in time. It
may therefore better reflect the providers’ current effort. Moreover, it includes not only
patients who will receive treatment at some point in the future but also those who will not
(patients who give up the treatment, die while waiting, have already received treatment by
another provider). It is therefore inclusive of the whole population waiting and not only of
those treated. On the other hand, as already mentioned, this measure of waiting is incomplete
(since patients are still waiting) and oversamples long-waiters.
The waiting times of both patients treated and patients on the list can be used to
incentivise reductions in waiting times using indicators based on the proportion of
patients waiting more than a given threshold (for example, a maximum waiting time of
four months). The advantage of the waiting time of the patients treated is that it focuses
on the full duration of the patient’s experience. However, a health care provider would have
no incentive to reduce the wait of a patient who has already passed the threshold
(e.g. four months). Incentive schemes that also encourage reductions in the proportion of
patients “on the list” above a certain threshold would in contrast have an incentive to
reduce the wait for a patient who has passed the threshold.
The distribution of waiting times of the patients on the list and the distribution of
patients treated are linked. They are different ways of capturing the waiting experience of
the same patients. Under a steady state assumption, one distribution can be used to derive
the other and vice versa (see Annex 2.A1). This has the implication that policy makers can
use the up-to-date waiting time of the patients on the list not only for monitoring purposes
(or performance assessment), but also to infer or predict the waiting time of patients
treated, long before this information is available.
Harmonising waiting time data
Waiting time definitions in each country are system specific. Harmonising
waiting time definitions even within a country is often not easy, but with persistence it is
possible to achieve, as is demonstrated by the Canadian experience (Box 2.1).
Table 2.5. Referral to treatment waiting time, EnglandWeeks
Wait from referral to hospital admissionWait from referral without hospital
admission (outpatient)Patients on the list
Admitted pathway Non-admitted pathway Incomplete pathway
Medianweeks
95thpercentile
% within18 weeks
Medianweeks
95thpercentile
% within18 weeks
Medianweeks
95thpercentile
% within18 weeks
February 2011 9 22.8 89.8 3.5 16.1 97.2 5.5 26.2 88.7
August 2011 8.1 22.6 90.4 4.1 15.7 97.3 6.2 24.2 90.6
February 2012 8.7 21.9 91.2 3.6 16.1 97.1 5.2 21 92.6
Source: Statistical press notice; NHS referral to treatment (RTT) waiting times data; February 2012.1 2 http://dx.doi.org/10.1787/888932754730
WAITING TIME POLICIES IN THE HEALTH SECTOR: WHAT WORKS? © OECD 201340

I.2. MEASURING WAITING TIMES ACROSS OECD COUNTRIES
Box 2.1. Measuring and reporting waiting times in Canada
Canada is a federal system and its experience in harmonising waiting time acrossprovinces can be compared to what the OECD would need to do to collect comparablewaiting time data. In 2004, Canadian First Ministers agreed to a 10-Year Plan to StrengthenHealth Care. Included in this Plan was a commitment to deliver a measurable reduction inwaiting times and evidence-based wait-time benchmarks in five priority areas: cancer,heart, diagnostic imaging, hip and knee joint replacement and cataract surgery. Thebenchmark waiting times were developed through collaboration among the provincial andterritorial ministries of health, the health research community and the CanadianInstitutes of Health Research. There was to be no financial penalty should a jurisdictionfail to meet the benchmarks. This Plan represents the first pan-Canadian policy initiativeaimed specifically at waiting time reduction. Prior to the Plan, individual provinces hadundertaken various initiatives to shorten waiting times for elective surgeries, but thesewere not harmonised at a federal level (see Chapter 5 on Canada in this volume).
The Plan required all jurisdictions to publicly report on their progress in meeting thebenchmarks, and all have developed websites dedicated to that purpose. Moreover, everythree years a parliamentary committee must review and report on progress inimplementing the 10-Year Plan. The report from the first of these reviews was published inJune 2008 and concluded that consistent and meaningful reductions in waiting times hadnot occurred. Moreover, the problem of a lack of comparable data to monitor progress andcompare jurisdictions was identified. The review also highlighted the concern that areduction of waiting times in the priority clinical areas may come at the cost of increasingwaiting times in the non-prioritised areas. Thus, it recommended that this phenomenonbe monitored.
The Canadian Institute for Health Information (CIHI) is mandated to publish regularcomprehensive reports on performance with respect to waiting times. In 2012, the CIHIreported that the data and infrastructure required for monitoring and reporting on waitingtimes did not exist in 2004 when the 10-Year Plan was announced. Consequently, theprovinces were required to collaborate on the development of common data definitions andcalculations for waiting times. While the waiting time benchmark for diagnostic imaginghas not yet been produced, comparable pan-Canadian waiting time data have beenpublished for the other areas. The table below shows national trend data for selectedprocedures.
Median waiting time of treated in-patients in Canada,2008-11
Days
2008 2009 2010 2011
Cataract surgery 50 48 52 49
Coronary bypass 10 9 7
Total and partial hip replacement 82 79 83 89
Knee replacement 99 94 99 107
Source: Canadian Institute for Health Information (CIHI).1 2 http://dx.doi.org/10.1787/888932754749
WAITING TIME POLICIES IN THE HEALTH SECTOR: WHAT WORKS? © OECD 2013 41

I.2. MEASURING WAITING TIMES ACROSS OECD COUNTRIES
Measuring waiting times from cross-country surveys
The waiting time measures described above refer mainly to administrative databases.
An alternative approach to capturing evidence on waiting times is through the use of
household surveys. The Commonwealth Fund has pioneered the use of a household survey
across a number of OECD countries that collects a wide range of information, including
waiting times for primary care, for specialists and for elective surgery. In their first
International Health Policy Survey, in 1998, they included five OECD countries – the United
States, Canada, Australia, New Zealand and the United Kingdom. A question was asked in
the survey to ascertain the percentage of respondents who waited for elective surgery for
four months or more, and this was repeated several times, most recently in 2010 and for a
larger number of countries (Schoen et al., 2010 and Figure 2.3).
The survey results are particularly useful to compare countries with and without a
waiting time problem, though the information is only available at an aggregate level and
obtained with a relatively small sample size and may suffer from recall bias. The survey
results are a useful benchmark for collecting comparative information on waiting times
across OECD countries. They also provide a full picture on access to care, because a wide
range of questions is asked about access to care, including access to primary and specialist
care, and about broader information on barriers to care.
ConclusionsCountries tend to differ in how they measure waiting times. Although definitions are
system specific, some general lessons can be drawn from countries’ experiences. First, it is
important to measure the actual waiting time (i.e. the duration) of patients on the waiting list,
not just the number of patients on the list.The duration of the wait is what matters to patients.
Second, it is important to measure both the mean and the median in reporting waiting
times, because the distribution is skewed (with the mean being systematically larger than
Figure 2.3. Waiting time of four months or more for elective surgery
Source: OECD (2011), Health at a Glance 2011 – OECD Indicators, OECD Publishing, Paris, based on the CommonwealthFund Survey (Schoen et al., 2010).
1 2 http://dx.doi.org/10.1787/888932753894
50
40
30
20
10
0
% 2001-02 2005 2007 2010
27
38
2326
5
33
41
19 20
86
2730
18
13
8 75
2522 21 21
18
8 7 7 75
0
Canad
a
Sweden
Norway
Unit
ed King
dom
Aus
tralia
New Ze
aland
Franc
e
Switz
erlan
d
Unit
ed Stat
es
Neth
erlan
ds
German
y
WAITING TIME POLICIES IN THE HEALTH SECTOR: WHAT WORKS? © OECD 201342

I.2. MEASURING WAITING TIMES ACROSS OECD COUNTRIES
the median), and also other measures of waiting times across the distribution (e.g. the
waiting time at the highest percentiles, like the 80th or 90th, or the proportion or number
of patients with long waits, for example, above a threshold of three, six or nine months).
The mean and median have the advantage of capturing the average experience of a
patient’s journey. The others have the advantage of focussing on those who wait longest.
Third, it is essential to measure the waiting times for the entire patient journey. For
elective care, this means both out-patient and in-patient waiting times, and includes the
time from the GP referral to the time of treatment.
Finally, some countries collect the distribution of patients treated in a given period
(month, year), some countries collect the distribution of the patients on the list (at a census
date), and some countries collect both. Both distributions can be useful. The distribution of
the waiting time of patients treated has the advantage of capturing the full duration of the
patient’s experience. The distribution of the waiting time of patients on the list gives a
more up-to-date picture of the patients who are still waiting, which may reflect the efforts
of current providers, as opposed to past providers.
In summary, a key set of measures can be identified across OECD countries. Each
measure has advantages and disadvantages. The appropriate choice ultimately depends
on the intended use of the measures.
References
Commonwealth Fund (2011), “Commonwealth Fund International Health Policy Survey”, CommonwealthFund, New York.
Dixon, H. and L. Siciliani (2009), “Waiting-time Targets in the Healthcare Sector. How Long Are WeWaiting?”, Journal of Health Economics, Vol. 28, pp. 1081-1098.
Don, B., A. Lee and M.J. Goldacre (1987), “Waiting List Statistics. III. Comparison of Two Measures ofWaiting Times”, British Medical Journal, Vol. 295, pp. 1247-1248.
Government of Sweden (2009) “A National Cancer Strategy for the Future, ”“Report of the Commission ofInquiry on A National Cancer Strategy”, Swedish Government Official Reports, Stockholm.
Hurst, J. and L. Siciliani (2003), “Tackling Excessive Waiting Times for Elective Surgery: A Comparisonof Policies in Twelve OECD Countries”, OECD Health Working Papers, No. 6, OECD Publishing, Paris,http://dx.doi.org/10.1787/108471127058.
National Board of Health and Welfare (2010), “Waiting for an Answer – Waiting Times in Cancer Care.Mapping and a Proposal for a Measuring Model”, National Board of Health and Welfare, Stockholm.
National Board of Health and Welfare (2011), “Waiting Times in Cancer Care – From Referral toTreatment”, National Board of Health and Welfare, Stockholm.
SALAR (2011), “Swedish Waiting Times for Health Care in an International Perspective”, SALAR,Stockholm.
Schoen, C., R. Osborne et al. (2010), “How Health Insurance Design Affects Access to Care and Costs, byIncome, in Eleven Countries”, Health Affairs, Vol. 29. No. 12, pp. 2322-2337.
Siciliani, L. (2008), “A Note on the Dynamic Interaction between Waiting Times and Waiting Lists”,Health Economics, Vol. 17, No. 5, pp. 639-647.
Socialstyrelsen (2008). “Uppföljning av den nationella vårdgarantin” (Follow-up of the national careguarantee), Artikelnr 2008-103-1, National Board of Health and Welfare in Sweden.
WAITING TIME POLICIES IN THE HEALTH SECTOR: WHAT WORKS? © OECD 2013 43

I.2. MEASURING WAITING TIMES ACROSS OECD COUNTRIES
ANNEX 2.A1
Linking the distribution of waiting timesof patients treated and of patients on the list
In this annex we describe some useful results which link the statistical relationship
between two commonly used distributions for measuring waiting times: i) the distribution
of waiting times of patients treated over a period of time, and ii) the distribution of waiting
times of patients on the list at a point in time. This sections draws on Dixon and
Siciliani (2009).
The first measure typically refers to the waiting time of patients treated in a given
year. This takes all of the patients treated throughout the year and measures the difference
between the time the patient was added to the waiting list and the time the patient
received the treatment (the completed waiting time). The second measure is the time the
patients on the list at a census date (usually the end of a month or quarter) have waited: it
is a cross-sectional measure that takes the list of patients at a point in time (census date)
and measures the difference between that time and when the patient was added to the list
(for most patients this is an incomplete waiting duration since they will still be waiting
after the census date).
These two measures are fundamentally different. Dixon and Siciliani (2009) studied
the theoretical link between the distribution of the waiting time of patients on the list and
the distribution of the waiting time of patients treated under the assumption of steady
state. This assumption implies: i) the number of patients added to the waiting list and
treated in each period t is constant; ii) the probability of remaining on the list after waiting
for i periods depends only on the periods spent on the list “i” but does not vary with the
period the patient entered the waiting list “t”.
The authors show that in steady state there is a one-to-one mapping of the two
distributions, so that, given one of the distributions, the other one can be derived.
Essentially, under the assumption of a steady state there is a mathematical identity linking
any possible distribution of waiting times on the list with a unique distribution of waiting
times of people treated, and vice versa.
This is a useful result. It means that if we have one set of data, we can use it to recover
the other. This can be used in international comparisons: different countries collect
different data, and we can compare statistics based on waiting list data meaningfully with
data based on waiting times of people treated. It also has the important implication that
policy makers can use the up-to-date waiting time of the patients on the list not only for
WAITING TIME POLICIES IN THE HEALTH SECTOR: WHAT WORKS? © OECD 201344

I.2. MEASURING WAITING TIMES ACROSS OECD COUNTRIES
monitoring purposes (or performance assessment), but also to infer or predict the waiting
time of patients treated, long before that information is available.
Mapping the two distributionsDefine fTr(i) as the density function of the patients treated in any given period who
have been waiting for i periods (where the superscript Tr stands for Treated), and fL(i) as
the density function of the waiting time of the patients on the list who have been waiting
for i periods (where the superscript L stands for “on the List”) with i=1,…, I (where I denotes
the longest time waited). Therefore, fTr(i) and fL(i) denote respectively the proportion of
patients who wait for i periods among the patients treated and among the patients on the
list. Similarly, define FTr(i) and FL(i) as the corresponding cumulative distribution function
(i.e. the proportion of patients who have a waiting time equal to i or less), and wTr and wLas
the mean wait for patients treated and for patients on the list.
There is a steady state identity between the two distributions, which means that if we
know either distribution (the density across the patients treated or the patients on the list)
we can recover the other (see Dixon and Siciliani, 2009). The following two propositions
describe such an identity. Proposition 1 determines the distribution of the patients treated
as a function of the distribution of the patients on the list.
Proposition 1
Suppose that we observe fL(i), i.e. the distribution of the waiting time of the patients on
the list. Then, the distribution of the waiting time of the patients treated is given by:
fTr(i)=[fL(i)-fL(i+1)]/fL(1)
Proposition 1 suggests that the proportion of the patients who are treated in any given
period after having waited for i periods is equal to the difference between the proportion of
the patients on the list who have waited for i periods and (i+1) periods divided by the
proportion of patients in their first period on the list, i.e. who have just joined the list.
Equivalently, and perhaps more intuitively, it is equal to the additional number of patients
that have been taken off the list, and therefore treated, between period i and period i+1.
Proposition 2
Suppose that we observe fTr(i), i.e. the distribution of the waiting time of the patients
treated. Then, the distribution of the waiting time of the patients on the list is given by:
fL(1) = 1/wTr and fL(i) = [ 1 – fTr(j) ]/wTr for i > 1.
The intuition is that there is a flow of new entrants onto the list equal to 1/wTr each
period. Hence at a given time t the people on the list waiting for one period are those
arriving at t. The people who are waiting for two periods at time t are those who arrived in
the previous period (t-1), less the proportion fTr(1) who were treated in (t-1). The people
who are waiting for three periods at t are those who arrived in period t-2, less the
proportion fTr(1) treated in period (t-2) and the proportion fTr (2) treated in (t-1).
The mean waiting times for the two distributions are in general different. We can write
the mean waiting time of the patients treated as a function of the mean waiting time of the
patients on the list:
wTr = [ wL - fL(i+1) ]/fL(1)
WAITING TIME POLICIES IN THE HEALTH SECTOR: WHAT WORKS? © OECD 2013 45

I.2. MEASURING WAITING TIMES ACROSS OECD COUNTRIES
This arises because on the one hand, the full length of waiting of any patient measured
under the “waiting time of the patients treated” always exceeds the partial length of any
patient measured under the “waiting time of the patients on the list” (also known as
interruption bias, see Don et al., 1987). On the other hand, it is patients with a longer than
mean full length of waiting who are more likely to be in progress when the “waiting time of
the patients on the list” is measured (also known as length bias, see Don et al., 1987).
The concept of “the proportion of patients waiting more than i periods” also differs
across the two measures. The proportion of patients on the list who waited more than
(or equal to) i periods as a function of the proportion of patients treated who waited more
than (or equal to) i periods is given by:
1 – FL(i) = 1 – [ (1 – FTr(j)) ]/wTr
Again, in general the two measures will be different, although it is difficult to predict
in which direction.
Examples
We provide two illustrative examples in Table 2.A1.1. Example 1 assumes that all
patients wait the same time. More precisely, suppose that each patient waits for
four periods (for example, four months), so that the proportion of patients waiting one,
two, three and four months on the list is 0.25. In this case we have wTr= 4 > wL= 2.5: the
mean waiting time for patients treated (i.e. four months) is higher than the mean waiting
time of the patients on the list (2.5 months).
Example 2 supposes instead that 80% of the patients treated wait one month, 10% wait
for two months and 10% for four months. In this case we have wTr= 1.4 < wL= 1.5: the mean
waiting time for patients treated is 1.4 months, which is now lower than the mean waiting
time of the patients on the list, who on average wait 1.5 months. It is heterogeneity in the
different duration of waits that makes this result possible.
Example 3 in Table 2.A1.2 uses data from the English NHS from the patients on the list
for the specialty ear, nose and throat. In quarter 1 of year 2004-05, there were 75% of
patients who waited more than a month, 56% more than two months, 40% more than
three months, 5% more than seven months, 1.6% more than eight months, and no patients
waiting more than nine months. Using proposition 1 (under the assumption of steady
state), we can estimate the distribution of waiting of patients treated and then compute
the proportion of patients treated waiting more than i months. Table 2.A1.2 suggests that
the proportion of patients treated waiting longer than seven months is 14%, which is
higher than the proportion of patients on the list waiting longer than seven months. Again,
this illustrates how the two distributions can look different.
Table 2.A1.1. Different distributions of waiting and their mean
Example 1 Example 2
fTr(1) = 0 fL(1) = 0.25 fTr(1) = 0.8 fL(1) = 0.71
fTr(2) = 0 fL(2) = 0.25 fTr(2) = 0.1 fL(2) = 0.14
fTr(3) = 0 fL(3) = 0.25 fTr(3) = 0 fL(3) = 0.07
fTr(4) = 1 fL(4) = 0.25 fTr(4) = 0.1 fL(4) = 0.07
wTr = 4 wL= 2.5 wTr= 1.4 wL= 1.5
WAITING TIME POLICIES IN THE HEALTH SECTOR: WHAT WORKS? © OECD 201346

I.2. MEASURING WAITING TIMES ACROSS OECD COUNTRIES
The results described above assume a steady state. This implies that the distributions
are not changing over time: one period is the same as any other. This is a simplifying
assumption. There are likely to be seasonal effects (for example, Christmas holidays, etc.),
which may affect the inflows of patients needing to be treated, or the ability of hospitals to
supply treatments. These seasonal effects should not matter so much if we are using long
periods of data that will “average out” the seasonality and wash out short-term effects. The
steady-state assumption will in general be a good approximation if the waiting lists are
roughly stable over the time period considered.
Table 2.A1.2. Example 3
Speciality: ear, nose and throat
Proportion waiting more than i months
Quarter 1, 2004-2005
Patients on the list[(1-FL(i)] (%)
Patients treated[(1-FT(i)] (%)
1 month 75.2 78.1
2 months 55.9 63.4
3 months 40.1 55.0
4 months 26.5 38.6
5 months 16.9 29.9
6 months 9.5 17.9
7 months 5.1 14.0
8 months 1.6 6.5
9 months 0.0 0.0
Average 2.809 3.534
Source: Dixon, H. and L. Siciliani (2009), “Waiting-time Targets in the HealthcareSector. How Long Are We Waiting?”, Journal of Health Economics, Vol. 28, pp. 1081-1098.
WAITING TIME POLICIES IN THE HEALTH SECTOR: WHAT WORKS? © OECD 2013 47


Waiting Time Policies in the Health Sector
What Works?
© OECD 2013
PART I
Chapter 3
A review of waiting times policiesin 13 OECD countries
by
Michael Borowitz and Valerie Moran,
Health Division, OECD
and
Luigi Siciliani,
Department of Economics and Related Studies, University of York, United Kingdom
This chapter reviews various policy tools that countries have used to tackleexcessive waiting times in 13 countries: Australia, Canada, Denmark, Finland,Ireland, Italy, Netherlands, New Zealand, Norway, Portugal, Spain, Sweden and theUnited Kingdom. The most common policy is some form of maximum waiting timeguarantee. Increasingly, such guarantees are backed with targets set for providersand sanctions if these targets are not met. The guarantees often go hand-in-handwith choice, competition and an increase in supply (in the public and/or the privatesector). These policies have generally been successful in bringing down waitingtimes. In contrast, most attempts to increase supply temporarily in order to decreasewaiting times have had only a limited effect. A better approach may be to conditionincreases in supply on simultaneous reductions in waiting times. Demand-sidepolicies attempt to define more rigorous clinical thresholds for treatment. However,it has proved difficult to implement such thresholds. The most promisingapproaches link waiting time guarantees to different categories of clinical need, alsoreferred to as waiting time prioritisation. An alternative demand-side approach is toencourage private health insurance to shift demand from the public to the privatesector, though this has generally not proven successful in reducing waiting times.
49

I.3. A REVIEW OF WAITING TIMES POLICIES IN 13 OECD COUNTRIES
IntroductionIn this chapter, we review the various policy tools that countries have used to tackle
excessive waiting times. Compared with the earlier OECD study (Siciliani and Hurst, 2005),
where supply-side policies predominated, currently the most common policy is some form
of maximum waiting time guarantee, which often combines supply-side measures and
demand-side measures. Increasingly, such guarantees are backed with targets set for
providers and sanctions if these targets are not met. The guarantees often go hand-in-
hand with choice, competition and an increase in supply (in the public and/or the private
sector). These policies have been successful in bringing down waiting times. In contrast,
most attempts to increase supply temporarily in order to decrease waiting times have had
only a limited effect. Generally, there is a short-term decrease in waiting times, soon
followed by an increase to earlier levels when the funding runs out. This suggests the need
to work simultaneously on supply and demand-side policies, for example, by conditioning
increases in supply on simultaneous reductions in waiting times (to limit subsequent
increases in demand). The demand-side policies attempt to define more rigorous clinical
thresholds for treatment. However, it has proved exceedingly difficult to implement
demand-side policies. The most promising of these link waiting time guarantees to
different categories of clinical need, which is also referred to as waiting time prioritisation.
An alternative demand approach is to encourage private health insurance to shift demand
from the public to the private sector, though this has generally not proven successful in
reducing waiting times.
The chapter draws on 13 detailed case studies presented in Chapters 4-16, which cover
respectively Australia, Canada, Denmark, Finland, Ireland, Italy, Netherlands, New
Zealand, Norway, Portugal, Spain, Sweden and the United Kingdom. We selectively focus
on the most common policies and on key aspects of such policies. The case studies contain
a wealth of information. We refer the interested reader to the case studies in Chapters 4-16,
for a full description and evaluation of the policies reviewed in this chapter and for less
common policies as well. Each case study also provides a brief description of the country’s
health system, which helps to put the policies into context.
Policies to address waiting times can target the supply side, the demand side,or both
As explained earlier in the conceptual framework, the policies used to tackle excessive
waiting times can be broadly grouped according to whether they primarily address supply
or demand. In addition, there are policies addressing both demand and supply, which are
generally formulated as waiting time guarantees. Table 3.1 gives the list of policy options
for waiting times and outlines how common they are across countries as well as their
potential effect on waiting times.
We concentrate on the most common policies used, in particular on waiting time
guarantees and some of the more common supply-side policies: extra funding for waiting
WAITING TIME POLICIES IN THE HEALTH SECTOR: WHAT WORKS? © OECD 201350

I.3. A REVIEW OF WAITING TIMES POLICIES IN 13 OECD COUNTRIES
times; activity-based financing; and choice. On the demand side, we also explore the
growing use of prioritisation tools and discuss the scope for subsidising private health
insurance.
Maximum waiting time guarantees increasingly used in OECD countriesThe most common policy used across OECD countries to reduce waiting times is to
establish a maximum waiting time guarantee, often in combination with targets for
hospitals or health providers. The simplest way to formulate such guarantees is to state
that no patient in need of care should wait more than a pre-determined maximum time.
The waiting time guarantees differ widely across OECD countries in both the length of the
guarantee and how it is formulated (see Table 3.2). The maximum waiting time reflects,
among other things, how much the country can afford.
The critical question is whether there is any enforcement of the guarantee. In many
cases, waiting time guarantees may not have the force of law, and even if they do, it may be
difficult for patients to exercise their rights. They are, in other words, less of a guarantee and
more of an aspiration. Differing definitions of waiting time guarantees make it difficult to
compare the length of waiting time under the guarantees across countries. The critical issue
is how the guarantee is enforced, i.e. either through active administrative processes or
through actively allowing patients to choose alternate providers, including the private sector.
In 1992, Sweden became one of the first OECD countries to introduce a waiting time
guarantee, but it was a relatively weak guarantee and patients had limited ability to
exercise their rights. The initial guarantee was targeted at 12 different interventions that
had particularly long waiting times. Patients were guaranteed to wait no longer than three
months from the physician’s decision to treat/operate. If the guarantee was not fulfilled,
the patient had the right to be treated at another hospital at the cost of the hospital that
initially failed to fulfill the guarantee. The government provided additional funding of
SEK 500 million (USD 72 million) for the initial year, but there was no additional funding in
later years. Waiting lists decreased substantially during the first year of the guarantee, but
by the next year waiting lists were stagnant and lists for some procedures began to
Table 3.1. Frequency of use and potential effect of policiesto address waiting times
Policies Commonly usedPotential effect
on waiting times
Supply-side policies 1. Increased production in the public sectorby funding extra activity 6/13 countries Weak
2. Contracting with private sector 6/13 countries Weak
3. Sending patients abroad 3/13 countries Weak
4. Increased productivity by introducing 3/13 countries Medium
activity-based financing (DRGs)
5. Increased choice of providers 5/13 countries Medium
6. Improved management of waiting lists Medium
Demand-side policies 1. Explicit guidelines to prioritise patients 7/13 countries Medium
2. Subsidise private insurance 5/13 countries Weak
Combined policies 1. Waiting-time guarantees 13/13 countries Weak
2. With sanctions 3/13 countries Strong
3. With choice and competition 6/13 countries Strong
Source: Based on OECD Secretariat assessment of 13 case studies and review of the literature.
WAITING TIME POLICIES IN THE HEALTH SECTOR: WHAT WORKS? © OECD 2013 51

I.3. A REVIEW OF WAITING TIMES POLICIES IN 13 OECD COUNTRIES
Table 3.2. Maximum waiting times in selected OECD countries
Country Maximum waiting time
Australia● 30 days. Patient’s health has the potential to deteriorate quickly.● 90 days. Patient’s health not likely to deteriorate quickly.● 365 days. Patient’s health unlikely to deteriorate quickly.
Canada● Hip and knee replacements within 26 weeks.● Cataracts within 16 weeks for high-risk patients.● Cardiac bypass surgery, from 2 to 26 weeks depending on urgency
Denmark
1993: Waiting times from GP or specialist referral to treatment: 3 months reduced to two months in 2002.2007: Four weeks independent of disease type or severity.Cancer (except cancer which require bone marrow transplantation, and skin cancer which is not melanoma):● To surgery: two weeks from information about diagnosis and treatment possibilities.● To medical treatment as primary treatment: two weeks from information about diagnosis and treatment possibilities
and no later than four weeks from referral.● To radiation treatment as primary treatment: 4 weeks from referral to radiation therapy has been received by the
relevant hospital ward.● To follow-up treatment: four weeks from referral to follow-up treatment has been received by the relevant hospital ward.Life-threatening cases:Cervical cancer: two weeks from referral to pre-examination.Ischemic diseases:● By main stem disease: two weeks from when a referral with the diagnosis has been received by the specialised hospital.● By documented unstable angina pectoris: three weeks to coronary arteriography and revascularisation from when the
hospital has received the referral from a cardiological intensive ward.● By angina pectoris immediately after a myocardial infarct: five weeks to coronary arteriography and revascularisation
from when the hospital has received a referral from a cradiological intensive ward.
Finland
● No delay during weekday office hours for a health centre or health care unit or three working days from first contactif an assessment of the need for treatment cannot be carried out immediately.
● Three weeeks for assessment of need for treatment for specialised medical care provided in connection with primaryhealth care extended to three months if highly specialised consultation or special imaging or laboratory tests arenecessary.
● Any treatment deemed necessary must then be provided within three months of the assessment extended by amaximum of a further three months in cases involving oral health care or specialised medical care provided inconnection with primary health care.
Ireland
1993: 12 months for adults and 6 months for children.2001: 3 months for public patients.2011: 12 months for elective surgery; 6 hours in Emergency Departments.2012: 9 months for elective treatment in hospitals; 9 hours on a trolley.
Italy
2002: Ambulatory care (60 days for five major diagnostic procedures and 30 days for eye and cardiology visits);oncology services (two weeks for first visit; 30 days for surgical interventions, chemotheraphy and radiotherapytreatment); and 80 days for cataract surgery and hip replacement and 120 days for percutaneous transluminalcoronary angioplasty.
2010-12:
Cardiovascular diseasesEmergency treatment within 72 hours; ten days for treatment that, if not promptly provided, may impact significantlyon short term prognosis, pain, dysfunction or disability; and 30 days for treatment that is required owing to patient’spain, dysfunction or disability.
Oncology diseasesThree days for urgent diagnostic priorities; ten days for diagnostic priorities within a therapeutic programme; follow-upof patients already treated for neoplastic disease.
Netherlands 2000: Four weeks for first visit to a hospital’s outpatient clinic, diagnosis and medical assessment; six weeks foroutpatient (day care) treatment; and seven weeks for inpatient treatment: seven weeks.
New Zealand
● Ten days to inform patient if they will be assessed by a specialist.● Six months from referral for first specialist assessment.● Six months for treatment (of patients accepted for treatment) or clinical review for patients not accepted for treatment
but placed under “active” review.
Norway● 30 days from receipt of referral to decision to treat.● Patients suitable for treatment given an individual maximum waiting time to start of treatment. If this waiting time is
exceeded, 14 days for provision of treatment.
WAITING TIME POLICIES IN THE HEALTH SECTOR: WHAT WORKS? © OECD 201352

I.3. A REVIEW OF WAITING TIMES POLICIES IN 13 OECD COUNTRIES
Norway
2002: Provide treatment within two years to all patients registered on the waiting list at the end of the first semester of 2002.
25th November 2004 to 14th January 2008:
Level of clinical priority Group of pathologies Maximum waiting time
P1 – Normal General 12 months
Cancer 12 months
P2 – Priority General 2 months
Cancer 2 months
P3 – High priority General 2 weeks
Cancer 2 weeks
P4 – Urgent General 3 days
Cancer 3 days
Portugal
14th May 2008 to present:
General 270
P1 – Normal Cancer 60
Obesity 270
P2 – Priority General 60
Cancer 45
Obesity 60
P3 – High priority General 15
Cancer 15
Obesity 15
P4 – Urgent General 3
Cancer 3
Obesity 3
Spain 180 days for specific surgical procedures (cataracts, cardiovascular, and hip and knee replacements)
Sweden
1992-95: Three months from the physician’s decision to treat/operate.2005: 24 hours for phone consultation with health centre; seven days for a GP appointment if necessary; and 90 days
for an appointment at a public or private hospital and from the decision to treat to treatment2009: 60 days for an appointment with a specialist.
United Kingdom
England:
1991: Inpatient treatment within two years (soon reduced to 18 months).
1998: “Ensure everyone with suspected cancer is able to see a specialist within two weeks of their GP deciding theyneed to be seen urgently and requesting an appointment for: all patients with suspected breast cancer from April1999, and for all other cases of suspected cancer by 2000.”
2000: Three months for outpatient appointment and six months for inpatient treatment.
2002: Three months for inpatient and day case treatment; four hours in A&E from arrival to admission, transfer ordischarge; within 24 hours for a primary care professional and within 48 hours for a primary care doctor.
2004: 18 weeks from GP referral to hospital treatment.
2010: Within two weeks from GP referral to a cancer specialist.● 31 days from diagnosis to surgery for cancer and start of an anti-cancer drug regimen.● 62 days from referral for suspected cancer to first treatment for all cancers.● Two weeks to see a specialist for all patients referred for investigation of breast symptoms.● Three months for patients who need a revascularisation.● Two weeks for Rapid Access Chest Pain Clinics.● Access to a genito-urinary medicine clinic within 48 hours of contacting a service.● All patients who have operations cancelled, on or after the day of admission (including the day of surgery), for non-
clinical reasons to be offered another binding date within 28 days, or the patient’s treatment to be funded at the timeand hospital of the patient’s choice.
● All ambulance trusts to respond to 75% of Category A calls within eight minutes; 95% of Category A calls within 19minutes; and 95% of Category B calls within 19 minutes.
Table 3.2. Maximum waiting times in selected OECD countries (cont.)
Country Maximum waiting time
WAITING TIME POLICIES IN THE HEALTH SECTOR: WHAT WORKS? © OECD 2013 53

I.3. A REVIEW OF WAITING TIMES POLICIES IN 13 OECD COUNTRIES
increase. The guarantee had limited sanctions on providers, and it was difficult to
operationalise to transfer funding between hospitals across counties. Furthermore, there
was a political debate about whether one should prioritise only a few specific conditions,
when waiting was commonplace for all services. A guarantee for specific procedures may
lead to over-prioritisation of those services (see Chapter 15 on Sweden in this volume).
A similar policy was introduced again in 2005, which gave patients the right to choose
another hospital or private specialist within or outside of the jurisdiction of the county
council if a visit or a treatment was not offered within the guarantee. However, the guarantee
was a comprehensive guarantee that covered all forms of planned specialist care. Again, the
costs of this treatment were supposed to be covered by the patient’s home-hospital or the
county council, and the latter received state grants amounting to SEK 700 million
(USD 100 million) in 2005, and an additional SEK 500 million (USD 72 million) in 2006 and
SEK 750 million (USD 107 million) in 2007 (Socialstyrelsen, 2008). A national evaluation
revealed that waiting times decreased in the first years of this guarantee. However, a
subsequent evaluation showed waiting times had not fallen as fast as expected and that
some waiting times had even increased, especially for the first visit to a doctor within
specialist care. Furthermore, there was wide variation in performance between the 21 county
councils (see Chapter 15).
In 2009, Sweden again introduced a similar policy to reduce waiting times. The
waiting time guarantee remained the same, and the government provided an SEK 1 billion
fund (the Queue Billion) to the country councils to reduce waiting times. In this case, the
counties were only eligible for the funds if they reduced waiting times. During the first
year, as before, waiting times declined. The guarantee was regulated by law in 2010. The
United Kingdom
Scotland:
1997-98: 12 months
2000: Nine months for inpatients; 12 weeks for angiography or 24 weeks for revascularisation; two months fromurgent referral to treatment for all cancers (one month for breast cancer).
2003-11: Maximum waiting time between specialist decision to treat and inpatient/daycase treatment: nine months byend December 2003; six months by end December 2005; 18 weeks by end December 2007; 15 weeks byend March 2009; 12 weeks by end March 2010; and nine weeks by end March 2011.
Maximum waiting time between referral and first specialist assessment as an outpatient: six months by end December2005; 18 weeks by end December 2007; 15 weeks by end March 2009; and 12 weeks by end March 2010.
Maximum waiting time from referral to treatment: 18 weeks by end December 2011.
2012:● (GP) referral to treatment of 18 weeks.● Nine weeks for hospital inpatient or day case treatment.● 12 weeks for new outpatient appointments.● Six weeks for (eight) key diagnostic tests.● Coronary heart disease: 16 weeks from referral to cardiac intervention; and for outpatient specialist appointment to
treatment.● Cancer: 62 days for patients screened positive or with an urgent referral with a suspicion of cancer to treatment and
31 days from decision to treat to first treatment for all patients diagnosed with cancer.● Cataract surgery: 18 weeks from referral by a GP or optometrist to cataract surgery.● Accident and emergency: four hours between arriving at a Unit and admission, discharge or transfer.● Addiction services: three weeks from referral received to appropriate drug or alcohol treatment.● Primary care: 48 hour access or advance booking.● Child and adolescent mental health services: 26 weeks referral to treatment, reducing to 18 weeks by December 2014.● Psychological therapies: from 31 December 2014, 18 weeks referral to treatment for patients of all ages for
psychological therapies.
Source: Based on OECD Secretariat assessment of 13 case studies.
Table 3.2. Maximum waiting times in selected OECD countries (cont.)
Country Maximum waiting time
WAITING TIME POLICIES IN THE HEALTH SECTOR: WHAT WORKS? © OECD 201354

I.3. A REVIEW OF WAITING TIMES POLICIES IN 13 OECD COUNTRIES
current (2010) guarantee appears to have had a more positive effect on waiting times. In
particular, more patients are receiving treatment and surgery within 90 days compared to
previous years. The Swedish experience implies that guarantees work best when they are
comprehensive, have strong sanctions and economic incentives attached, and enable
patients to exercise their right to use an alternative provider (see Chapter 15).
In Italy, waiting time for in-patient care appears to be less critical than waiting time for
out-patient services and out-patient diagnostic services. Thus, waiting time guarantees
have been developed with a particular emphasis on diagnostics, which makes the Italian
guarantees distinct from those developed in other OECD countries (see Chapter 9 on Italy).
In Canada, evidence-based benchmark waiting times have been developed through
the collaboration of the provincial and territorial Ministries of Health, the health research
community and the Canadian Institutes of Health Research, as part of the 10-Year Plan (see
Table 3.2). No financial penalties are, however, levied against a jurisdiction if a pan-
Canadian waiting time standard is not met. Based on its review of the first three years of
the Plan, the House of Commons Standing Committee on Health could not conclude that
consistent and meaningful reductions in waiting times had occurred across the country
(see Chapter 5 on Canada in this volume).
Maximum waiting time guarantees are most successful when linked to targetswith sanctions
England and Finland have combined waiting time guarantees with sanctions or
penalties for failure to fulfil the guarantee. In England and Scotland, maximum waiting
time guarantees were set respectively at 12 months in 2002-03 and nine months in 2003-04,
and then were progressively ratcheted down over time to 18 weeks by 2006, where they
have remained (in both England and Scotland). In 2010, in England, patient entitlements for
waiting times were codified into the NHS Constitution, a new quasi-legal instrument,
where patients are entitled to a maximum wait from GP referral to treatment (RTT) of
18 weeks. The Department of Health monitors the 18-week target monthly and expects
90% of patients to be treated within target; breach of these targets results in a reduction of
up to 5% of revenues for the relevant specialty in the month in which the breach occurs (see
Chapter 16 on the United Kingdom).
There is evidence from England that waiting time guarantees with sanctions bring
down waiting times. Long waits of over six months have virtually disappeared. This is the
first time since the inception of the National Health Service that waiting times have ceased
to be one of the most important health policy issues. In England, targets with penalties
were introduced in the period 2000-05, with strong political oversight from the Prime
Minister and the newly created Prime Ministerial Delivery Unit along with the Health Care
Commission (Bevan and Hood, 2006). Senior health administrators were at risk of losing
their jobs if hospital targets were not met (a policy sometimes referred to as “targets and
terror”). Using Scotland as a control group (where no such penalties were introduced),
Propper et al. (2008, 2010) found that waiting times were cut significantly: the proportion of
patients waiting more than six months reduced by 6-9 percentage points in England. In
recent years, Scotland has also accompanied targets with sanctions and these have been
associated with reductions in waiting times (see Chapter 16).
In Finland, there is also a strong waiting time guarantee combined with targets. In
2005, a waiting time guarantee was introduced as part the Health Care Guarantee 2005,
WAITING TIME POLICIES IN THE HEALTH SECTOR: WHAT WORKS? © OECD 2013 55
I.3. A REVIEW OF WAITING TIMES POLICIES IN 13 OECD COUNTRIES
which was subsequently incorporated into the Finnish Health Care Act of 2010. This
guarantees that primary care services should be provided to patients at a health centre
within three days; patients referred from primary care to an out-patient specialist should
be seen within 3 weeks. For elective surgery, any evaluation a patient needs should occur
within three weeks, and all of the needed diagnostic work should be completed within
three months. If surgery is needed, it should be carried out within 6 months of the
assessment of the need for care/treatment. The introduction of the legal guarantee led to a
significant decline in waiting times. The number of patients waiting over six months
decreased from 126 per 10 000 population in 2002 to 66 per 10 000 in 2005 (see Chapter 7).
In Finland, the National Supervisory Agency (Valvira) supervised the implementation
of the waiting times guarantee and had the authority to penalise municipalities that failed
to comply. Valvira provided targets to municipalities for the number of patients waiting
over six months, which were progressively lowered from 15 per 10 000 population in 2007
to 7.5 in 2009 and 5 in 2010. Almost all the hospital districts met the targets, but, by 2010,
Valvira had to issue 30 orders for improvement, including eight with a threat of fines. In
reviewing the Finnish experience of the guarantee and the targets, it was noted that any
time the supervisory regime was lessened, waiting times increased; they termed this the
“rubber band” effect (see Chapter 7).
The use of waiting time guarantees raises concerns over potential negative effects,
such as mis-prioritisation, gaming or changes in referral patterns. For England, Propper
et al. (2010) did not find evidence for such behavioural changes. However, Dimakou et al.
(2009) did find that the probability of patients being treated increases when the wait
approaches the target, and falls thereafter, which may be consistent with mis-
prioritisation, i.e. giving priority to lower severity patients who approach the target at the
cost of increasing waits for higher severity patients whose wait is well below the target.
Given the concern with mis-prioritisation caused by maximum waiting time
guarantees, some countries, notably Norway, have decided to try to condition the
guarantees on the basis of need using criteria such as severity, effectiveness of treatment,
and cost. This can be thought of as an “individualised” guarantee, where a maximum wait
is determined on the basis of the patient’s condition, need and severity (see Chapter 12). In
Norway, an individualised waiting time guarantee was implemented in 2002, with patients
classified into three groups:
● Group 1 includes emergency patients who should receive treatment with no further delay.
● Group 2 includes patients who are elective but are entitled to an individual maximum
waiting time.
● Group 3 includes patients who are less severe compared to Group 2; they are also elective
but are not entitled to an individual maximum waiting time.
If the patient time guarantee is not fulfilled, patients have the option to be treated in
another hospital or abroad. Unfortunately, evidence suggests that this policy does not appear
to have been very successful, as increased prioritisation did not take place (Askildsen
et al., 2011). It is unclear whether the policy helped to reduce overall waiting times.
In summary, countries which have introduced strong sanctions on providers in
conjunction with waiting time guarantees have had success in significantly reducing
waiting times. However, there is some evidence to suggest guarantees with sanctions
attached may provide an incentive to mis-prioritise patients based on clinical need. Some
countries have attempted to condition the guarantees based on clinical need, but this has
WAITING TIME POLICIES IN THE HEALTH SECTOR: WHAT WORKS? © OECD 201356

I.3. A REVIEW OF WAITING TIMES POLICIES IN 13 OECD COUNTRIES
not been particularly successful, perhaps because this was not associated with strong
sanctions (or because strong sanctions are more complex to operationalise when
maximum waiting times are individualised). Generally, targets with sanctions appear to
work, but they are very unpopular with health professionals and as a result may not be
sustainable over the long term.
In many countries, waiting times are increasingly linked to choiceIn some cases, patients are allowed to be treated by another provider if the waiting
time guarantee is not fulfilled (e.g. Norway) or when the patient reaches a threshold level
(e.g. in Portugal, 75% of maximum waiting times). A free choice of hospitals by patients is
one of the main characteristics of health systems with no waiting times. England, which
previously relied on targets and sanctions, is moving towards greater choice as a method
for enforcing waiting time guarantees.
In Denmark, the free choice of hospital was introduced in 1993 within or outside the
patient’s region. Patients were given an intended maximum waiting time of three months from
GP or specialist referral to treatment. In 2002, this was formulated explicitly as a maximum
waiting time guarantee (although not in a legal sense) and reduced to two months, and in 2007
it was reduced to four weeks regardless of disease or severity. This scheme implies that if the
hospital can foresee that the maximum waiting time cannot be fulfilled, then the patient can
choose another public or private hospital within or outside Denmark, provided that the
Association of Danish Regions has an agreement with the hospital in question. If treatment is
outside of the region’s own hospitals, the expenses are covered by the region. Patient travelling
expenses are generally not reimbursed (with few exceptions). The proportion of patients who
used a commercial private hospital under the free choice policy increased from 2% to 4.2%
between 2006 and 2008 (including patients who were treated at private hospitals according to
an outsourcing agreement) and to 4.8% in 2010 (up to 10% for orthopaedic surgery). The
expected maximum waiting time declined significantly after 2002, and it is believed that free
choice played an important role in contributing to the reductions (see Chapter 6 on Denmark).
With “free choice”, reimbursement policies also changed. Until 1999, each Danish
county treating patients from another county received a low per-diem from the other
county. From 2000, counties instead paid the DRG tariff, which reflects the average cost of
the receiving county. This reform changed counties’ incentives substantially, making it
profitable to keep patients within the county and even to try to attract patients from other
counties. One purpose was to equalise waiting times across counties (see Chapter 6).
“Extended free choice” was suspended in 2008-09 due to a hospital personnel strike in
Denmark. The regions introduced differentiated waiting times and prioritised more severe
patients. Some clinicians have argued that a flexible rule allowing for differences in
severity and disease progression would be preferable to the general four-week guarantee so
as to avoid excessive focus on less severe diseases. The new Centre-Left government that
came into office in November 2011 has declared that it will modify the rule into a flexible
one (see Chapter 6).
The free choice of hospital provides an incentive to providers to meet maximum
waiting time guarantees. Free choice will be most successfully implemented when it is
accompanied by activity-based payment whereby the “money follows the patient”.
WAITING TIME POLICIES IN THE HEALTH SECTOR: WHAT WORKS? © OECD 2013 57

I.3. A REVIEW OF WAITING TIMES POLICIES IN 13 OECD COUNTRIES
Waiting time guarantees and choice take on greater importance with therecent European Union directive on patients’ rights in cross-border health care
In March 2011, the European Union issued a new directive (2011/24/EU) that seeks to
eliminate obstacles hindering patients from seeking treatment in other countries. Patients
seeking health care in another member state are allowed to seek care similar to what they
would be entitled to in their own country. For planning and budgeting purposes, countries
are allowed to set up prior authorisation schemes, whereby patients make a request to be
treated abroad before they obtain treatment (for surgery and other costly or specialised
treatment). Prior authorisation cannot be refused if a patient is experiencing “undue
delay”. European Court rulings have upheld the rights of patients to be reimbursed for
treatment in other member states when their treatment has been subject to “undue delay”.
The increasing use of waiting time guarantees by countries in Europe appears to be
consistent with the new European Union approach to patient rights and cross-border
health. If patients do not receive their treatment based on national waiting time
guarantees, it could be argued that they have experienced undue delay and they would
have the right to seek treatment abroad.
A European Barometer survey showed that many people would be willing to travel to
other countries to seek faster treatment. Across the European Union, 64% of respondents
said they were willing to travel abroad to reduce waiting times (Figure 3.1) (European
Commission, 2007).
Figure 3.1. Patients willing to travel to another EU country becauseof long waiting times
1) Footnote by Turkey: The information in this document with reference to “Cyprus” relates to the southern part ofthe Island. There is no single authority representing both Turkish and Greek Cypriot people on the Island. Turkeyrecognises the Turkish Republic of Northern Cyprus (TRNC). Until a lasting and equitable solution is found within thecontext of United Nations, Turkey shall preserve its position concerning the “Cyprus issue”.2) Footnote by all the European Union Member States of the OECD and the European Commission: The Republic ofCyprus is recognised by all members of the United Nations with the exception of Turkey. The information in thisdocument relates to the area under the effective control of the Government of the Republic of Cyprus.Source: European Commission (2007), “Eurobarometer: Cross-border Health Services in the EU Analytical Report”,Reaxys Database Information.
1 2 http://dx.doi.org/10.1787/888932753913
DNK
IRL
GBR
PRT
SWE
NLD
POL
SVN
ESP
FIN E
U15 E
U27 E
ST
NMS12
FRA
ROM
GRC
LTU
MLT
LUX
CYP*
DEU B
EL A
UT IT
A B
GR S
VK C
ZE H
UNLV
A
90 88 86 85 81 79 79 76 70 66 65 64 64 61 61 57 54 54 54 53 51 50 50 50 47 46 4637 33 32
9 11 13 10 16 19 17 2227 32 33 33 29 35 37 41 42 40 42 39 45 48 48 48
47 50 4857 62 63
1 0 1 5 3 2 5 3 4 2 3 3 7 4 3 2 4 7 5 8 4 1 3 2 6 4 7 6 6 6
Yes No Don’t know/Not applicable
For which of the following reasons would you travel to another EU country to receive medical treatment?To receive treatment more quickly than a home
WAITING TIME POLICIES IN THE HEALTH SECTOR: WHAT WORKS? © OECD 201358

I.3. A REVIEW OF WAITING TIMES POLICIES IN 13 OECD COUNTRIES
The implication of the EU directive is that many people might travel abroad for
treatment to decrease waiting times. However, the experience to date on the use of cross-
border treatment is limited. In November 2000, the Norwegian Government decided to
spend NOK 1 billion to shorten waiting times by sending patients abroad (also known as
the Patient Bridge). The National Insurance Administration handled the initiative and
negotiated contracts with public and private hospitals abroad. More than 10 000 patients
were sent abroad (mainly for orthopaedic and general surgery). Botten, Grepperud and
Nerland (2004) suggest patients sent abroad did experience shorter waiting times and were
generally satisfied. However, the initiative was quite expensive due to high transaction
costs, which include travel and accommodation cost for relatives or nurses from Norway.
In the Netherlands, health insurers are increasingly active in helping their patients to
obtain faster treatment and have introduced waiting list mediation services that actively
search for hospitals with the shortest waits (see Chapter 10 on the Netherlands). In 2009,
these services claimed to have reduced waiting times by 1-2 months for about
47 000 patients (Baltesen, 2010). 10% of these patients were treated in other countries, mainly
Belgium, Germany and Spain. There is evidence to suggest that patients are more likely to
choose hospitals abroad if the waiting time abroad is below the average waiting time they
need to wait in the country (Varkevisser and Van der Geest, 2007; Varkevisser et al., 2010).
Given the European Union directive and the increasing concern with “undue delay” in
treatment, it is likely that there will be growing interest in patients seeking treatment in
other countries, if there are long waiting times. The EU directive requires countries to put
in place clear rules on when patients are able to seek treatment abroad, and failing to meet
waiting time guarantees would appear to be sufficient reason to seek treatment abroad. It
appears that for this type of programme to work effectively, there needs to be some
organisation involved in actively managing treatment abroad, if it is to have any significant
effect on waiting times.
Supply-side policies
Dedicated/additional funding linked to the reduction of waiting times has not provedsuccessful
One policy that has been commonly used by countries is some type of targeted-funded
programme to bring down waiting times. Although this has been the most common policy
approach across OECD countries in both the current and earlier OECD review of waiting
times, it has invariably failed. Given the earlier discussion on the determinants of waiting
times, it would seem possible that countries with low capacity could spend their way out
of the problem and reduce waiting times with a large increase in capacity. However, in
general, these programmes to reduce waiting times are short-term bursts of funding that
are generally small compared with overall hospital funding and insufficient to raise
capacity significantly. Furthermore, it is not only funding, but the wider institutional
setting that determines incentives to increase production.
In Ireland, the National Treatment Purchase Fund (NTPF) was introduced by the
government in 2002 to reduce the longest waits for hospital treatment by purchasing care
primarily in the private sector (at home and abroad), and to a lesser extent in the public
sector. For the public sector, however, the additional activity had to be above the activity
funded by the core hospital budget. Almost EUR 600 million was allocated to the NTPF
during the period 2001-10. The volume of activity provided by the NTPF in 2005-08 was just
WAITING TIME POLICIES IN THE HEALTH SECTOR: WHAT WORKS? © OECD 2013 59

I.3. A REVIEW OF WAITING TIMES POLICIES IN 13 OECD COUNTRIES
over 3% of total public hospital activity (about 15 000-21 000 treatments) and therefore
accounted for a small proportion of overall hospital activity (see Chapter 8 on Ireland). Due
to differentials in the prices agreed with public and private sector providers, it is unclear
whether the NTPF contracted activity in a cost-effective manner. Moreover, the existence
of the NTPF created a potential negative incentive for public hospitals to delay treating
long-waiters in the knowledge that eventually these patients would be treated under the
NTPF (see Chapter 8). While median waiting times of patients on the list for in-patient
medical and surgical procedures declined over the tenure of the NTPF, it did not cover
waiting times for out-patient services or emergency departments. Moreover, the NTPF
failed to address the long-term structural factors that lie at the root of long waiting times,
such as provider remuneration and the extent of private sector activity in public hospitals.
In Australia, the federal government introduced the Elective Surgery Waiting List
Reduction Plan (ESWLRP) in 2008. The government committed USD 650 million to support
this initiative over four years. The goals were to i) immediately reduce the backlog of patients
waiting longer than the clinically recommended time (so that 95% are within the target);
ii) improve elective surgery long-term output by investing in information systems, major
equipment and day surgery units; and iii) reward states that reduce the proportion of
patients above the recommended times. Each state was required to either create additional
capacity in the public system or purchase it from the private sector (see Chapter 4 on
Australia). The plan delivered more than 62 000 additional elective surgeries during 2008-10
and expanded elective surgery capacities in more than 120 hospitals. While the number of
admissions from the waiting list increased as desired, waiting times did not decline. In
essence, the ESWLRP is a supply expansion policy. However, an equilibrium model of the
NSW hospital sector shows that demand for elective surgeries is highly elastic, even more
elastic than the supply, suggesting that expansionary supply policies to reduce waiting time
in public hospitals are counteracted by relatively large increases in demand as patients come
to expect shorter waits for public treatment (Stavrunova and Yerokhin, 2011). This explains
to some extent why the ESWLRP was not successful in reducing waiting times.
In Spain, increasing the funds directed to a specific waiting list is a typical approach
for some surgical procedures (e.g. cardiovascular). While this gives managers flexibility to
choose among various alternatives to reduce waiting lists in these particular areas, it may
also give managers incentives to focus their efforts only on the targets procedures and not
on solving the problem of waiting lists across the entire system (see Chapter 14 on Spain).
During the 1990s and 2000s, Portugal implemented several programmes to reduce
waiting times, including the provision of additional funds and contracting additional activity
in public and private hospitals (see Chapter 13 on Portugal). The failure of these various
initiatives prompted a new and innovative approach known as the SIGIC, which is described
in Box 3.1.
In general, short-term funding targeted at waiting lists and times has proved
unsuccessful. This may be because it fails to address the structural issues that determine
waiting times (as was the case in Ireland); or it leads to a subsequent increase in demand
(e.g. Australia); or it is targeted to a specific waiting list, thus failing to provide appropriate
incentives across the entire system (e.g. Spain). These policies may have had some success
because funding was allocated when waiting times were growing, and without this
funding, waiting times could have increased even further. Although, in principle, it should
be possible to spend sufficiently and thus increase capacities so as to reduce and even
WAITING TIME POLICIES IN THE HEALTH SECTOR: WHAT WORKS? © OECD 201360

I.3. A REVIEW OF WAITING TIMES POLICIES IN 13 OECD COUNTRIES
nalforPAr alic
me
all
cts
list
.
me
, a
or.
re
naledeealsto
nd
932
Box 3.1. The Portuguese Integrated Management System of the Waiting Listfor Surgery (SIGIC)
For the past two decades, Portugal has tried to solve its waiting time problem with bursts of additiofunding (see Chapter 13 on Portugal). There were several programmes that provided additional fundingwaiting lists, some of which included contracting to the extensive private sector: PERLE (1995-98); P(1998-2000); PECLEC (2002-04); and PIO (2008-09). In all four cases, waiting times declined initially focouple of years and then returned to high levels, and in some cases the waiting list increased. Pubinformation on waiting times was haphazard, with each hospital administering its own waiting list.
Portugal has found an innovative solution to waiting times through a combination of waiting ti
guarantees coupled with a new integrated information system to collect waiting time information from
public and private hospitals. The new integrated information system now systematically colle
information on waiting times for all hospitals, and it has changed the discussion away from the waiting
towards the actual waiting times of patients, both on average and also for those waiting for a long time
One key feature of the SIGIC is the use of a treatment voucher to operationalise the waiting ti
guarantee. When the patient on the waiting list reaches 75% of the maximum guaranteed waiting time
voucher is issued that allows the patient to seek treatment at any provider, including in the private sect
This creates incentives for public hospitals to treat within the waiting time guarantee (but no penalties a
involved, i.e. no “terror”).
As a result of the introduction of the SIGIC, waiting lists and times decreased dramatically – the natiowaiting list for surgery declined by 39% from 2005 to 2010, even though the demand for surgery increas(see figure below). The mean and median waiting times for key procedures declined significantly (sbelow). Part of the improvement is due to better management of the waiting list, by shifting from hospitto a central IT system, but the IT system also implements the waiting time guarantee, allowing patientsfind other providers with the information available through the IT system, thus introducing choice acompetition (see Chapter 13).
Impact of SIGIC on waiting lists and waiting times in Portugal
1 2 http://dx.doi.org/10.1787/888932753
60
50
40
20
30
10
02005 2006 2007 2008 2009 2010
%
0.54
0.46
0.2750.228
0.1940.147
Evolution of the % of waiting list for surgerywith time above the established by SIGIC
-39%
WAITING TIME POLICIES IN THE HEALTH SECTOR: WHAT WORKS? © OECD 2013 61
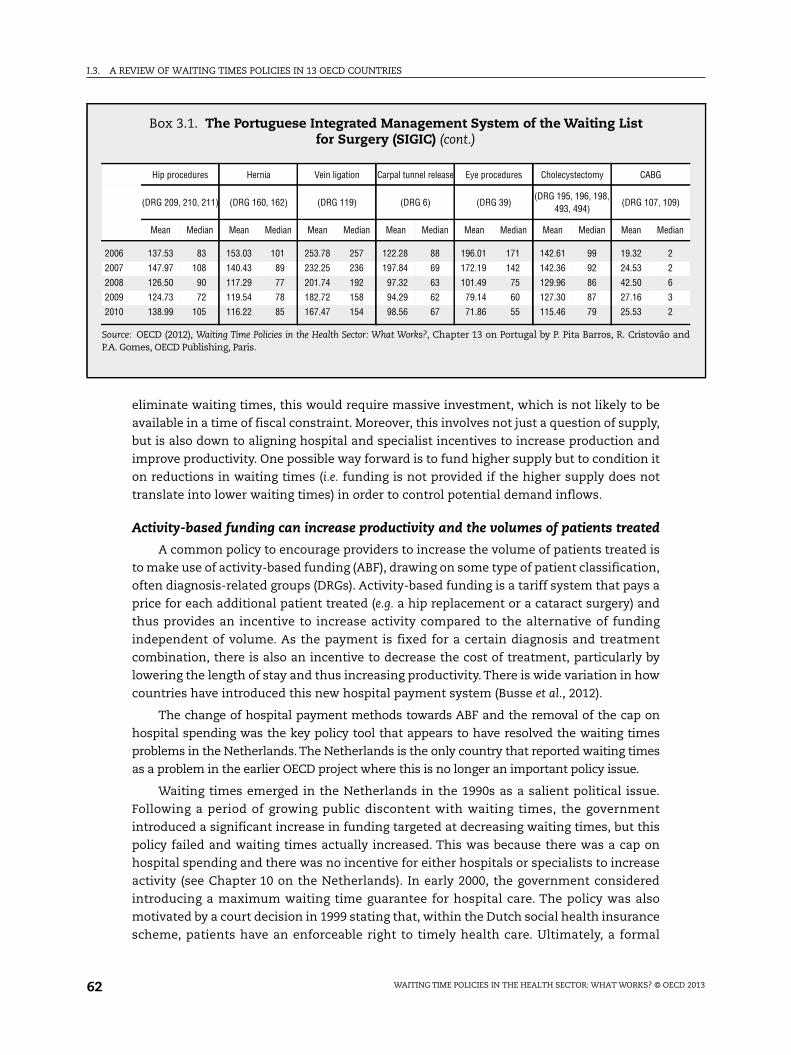
I.3. A REVIEW OF WAITING TIMES POLICIES IN 13 OECD COUNTRIES
9)
ian
and
eliminate waiting times, this would require massive investment, which is not likely to be
available in a time of fiscal constraint. Moreover, this involves not just a question of supply,
but is also down to aligning hospital and specialist incentives to increase production and
improve productivity. One possible way forward is to fund higher supply but to condition it
on reductions in waiting times (i.e. funding is not provided if the higher supply does not
translate into lower waiting times) in order to control potential demand inflows.
Activity-based funding can increase productivity and the volumes of patients treated
A common policy to encourage providers to increase the volume of patients treated is
to make use of activity-based funding (ABF), drawing on some type of patient classification,
often diagnosis-related groups (DRGs). Activity-based funding is a tariff system that pays a
price for each additional patient treated (e.g. a hip replacement or a cataract surgery) and
thus provides an incentive to increase activity compared to the alternative of funding
independent of volume. As the payment is fixed for a certain diagnosis and treatment
combination, there is also an incentive to decrease the cost of treatment, particularly by
lowering the length of stay and thus increasing productivity. There is wide variation in how
countries have introduced this new hospital payment system (Busse et al., 2012).
The change of hospital payment methods towards ABF and the removal of the cap on
hospital spending was the key policy tool that appears to have resolved the waiting times
problems in the Netherlands. The Netherlands is the only country that reported waiting times
as a problem in the earlier OECD project where this is no longer an important policy issue.
Waiting times emerged in the Netherlands in the 1990s as a salient political issue.
Following a period of growing public discontent with waiting times, the government
introduced a significant increase in funding targeted at decreasing waiting times, but this
policy failed and waiting times actually increased. This was because there was a cap on
hospital spending and there was no incentive for either hospitals or specialists to increase
activity (see Chapter 10 on the Netherlands). In early 2000, the government considered
introducing a maximum waiting time guarantee for hospital care. The policy was also
motivated by a court decision in 1999 stating that, within the Dutch social health insurance
scheme, patients have an enforceable right to timely health care. Ultimately, a formal
Box 3.1. The Portuguese Integrated Management System of the Waiting Listfor Surgery (SIGIC) (cont.)
Hip procedures Hernia Vein ligation Carpal tunnel release Eye procedures Cholecystectomy CABG
(DRG 209, 210, 211) (DRG 160, 162) (DRG 119) (DRG 6) (DRG 39)(DRG 195, 196, 198,
493, 494)(DRG 107, 10
Mean Median Mean Median Mean Median Mean Median Mean Median Mean Median Mean Med
2006 137.53 83 153.03 101 253.78 257 122.28 88 196.01 171 142.61 99 19.32 2
2007 147.97 108 140.43 89 232.25 236 197.84 69 172.19 142 142.36 92 24.53 2
2008 126.50 90 117.29 77 201.74 192 97.32 63 101.49 75 129.96 86 42.50 6
2009 124.73 72 119.54 78 182.72 158 94.29 62 79.14 60 127.30 87 27.16 3
2010 138.99 105 116.22 85 167.47 154 98.56 67 71.86 55 115.46 79 25.53 2
Source: OECD (2012), Waiting Time Policies in the Health Sector: What Works?, Chapter 13 on Portugal by P. Pita Barros, R. CristovãoP.A. Gomes, OECD Publishing, Paris.
WAITING TIME POLICIES IN THE HEALTH SECTOR: WHAT WORKS? © OECD 201362
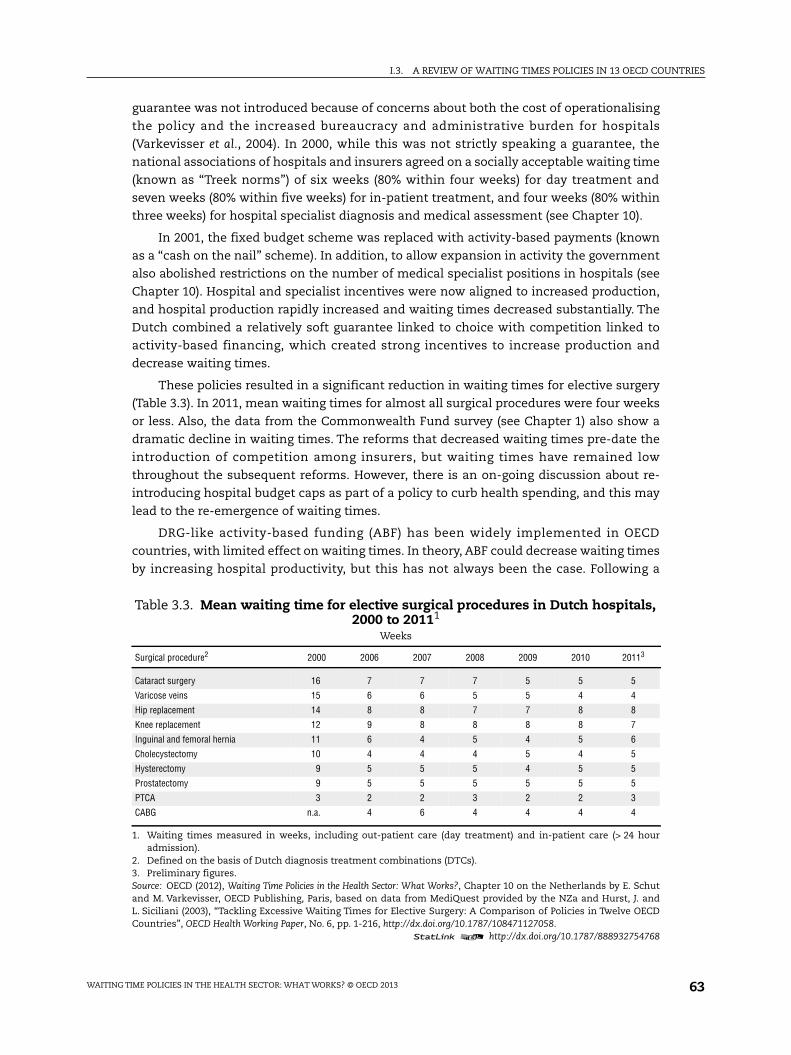
I.3. A REVIEW OF WAITING TIMES POLICIES IN 13 OECD COUNTRIES
guarantee was not introduced because of concerns about both the cost of operationalising
the policy and the increased bureaucracy and administrative burden for hospitals
(Varkevisser et al., 2004). In 2000, while this was not strictly speaking a guarantee, the
national associations of hospitals and insurers agreed on a socially acceptable waiting time
(known as “Treek norms”) of six weeks (80% within four weeks) for day treatment and
seven weeks (80% within five weeks) for in-patient treatment, and four weeks (80% within
three weeks) for hospital specialist diagnosis and medical assessment (see Chapter 10).
In 2001, the fixed budget scheme was replaced with activity-based payments (known
as a “cash on the nail” scheme). In addition, to allow expansion in activity the government
also abolished restrictions on the number of medical specialist positions in hospitals (see
Chapter 10). Hospital and specialist incentives were now aligned to increased production,
and hospital production rapidly increased and waiting times decreased substantially. The
Dutch combined a relatively soft guarantee linked to choice with competition linked to
activity-based financing, which created strong incentives to increase production and
decrease waiting times.
These policies resulted in a significant reduction in waiting times for elective surgery
(Table 3.3). In 2011, mean waiting times for almost all surgical procedures were four weeks
or less. Also, the data from the Commonwealth Fund survey (see Chapter 1) also show a
dramatic decline in waiting times. The reforms that decreased waiting times pre-date the
introduction of competition among insurers, but waiting times have remained low
throughout the subsequent reforms. However, there is an on-going discussion about re-
introducing hospital budget caps as part of a policy to curb health spending, and this may
lead to the re-emergence of waiting times.
DRG-like activity-based funding (ABF) has been widely implemented in OECD
countries, with limited effect on waiting times. In theory, ABF could decrease waiting times
by increasing hospital productivity, but this has not always been the case. Following a
Table 3.3. Mean waiting time for elective surgical procedures in Dutch hospitals,2000 to 20111
Weeks
Surgical procedure2 2000 2006 2007 2008 2009 2010 20113
Cataract surgery 16 7 7 7 5 5 5
Varicose veins 15 6 6 5 5 4 4
Hip replacement 14 8 8 7 7 8 8
Knee replacement 12 9 8 8 8 8 7
Inguinal and femoral hernia 11 6 4 5 4 5 6
Cholecystectomy 10 4 4 4 5 4 5
Hysterectomy 9 5 5 5 4 5 5
Prostatectomy 9 5 5 5 5 5 5
PTCA 3 2 2 3 2 2 3
CABG n.a. 4 6 4 4 4 4
1. Waiting times measured in weeks, including out-patient care (day treatment) and in-patient care (> 24 houradmission).
2. Defined on the basis of Dutch diagnosis treatment combinations (DTCs).3. Preliminary figures.Source: OECD (2012), Waiting Time Policies in the Health Sector: What Works?, Chapter 10 on the Netherlands by E. Schutand M. Varkevisser, OECD Publishing, Paris, based on data from MediQuest provided by the NZa and Hurst, J. andL. Siciliani (2003), “Tackling Excessive Waiting Times for Elective Surgery: A Comparison of Policies in Twelve OECDCountries”, OECD Health Working Paper, No. 6, pp. 1-216, http://dx.doi.org/10.1787/108471127058.
1 2 http://dx.doi.org/10.1787/888932754768
WAITING TIME POLICIES IN THE HEALTH SECTOR: WHAT WORKS? © OECD 2013 63

I.3. A REVIEW OF WAITING TIMES POLICIES IN 13 OECD COUNTRIES
system of global budgets, in 2002-07 the Danish government created a fund (equivalent to
about 3-4% of hospitals’ budgets) to increase activity in public hospitals. The funding was
allocated to counties whose activity was above a certain activity target. Counties were free
to decide how to reallocate the funding to the hospitals. “Elective” activity above the target
was reimbursed at 100% of the DRG tariff (though there was an upper ceiling). This policy
generated a form of upcoding from other care to elective care, and from 2003 the allocation
rule was based on “total” rather than “elective” activity. Since 2007, most regions reimburse
hospitals for extra activity in areas with waiting lists so as to motivate the hospitals to
meet the demand of the citizens in the region, but some of the region’s payment schemes
also reimburse extra activity without waiting lists, but usually with a lower percentage of
the DRG tariff (see Chapter 6 on Denmark).
In Norway, ABF of hospitals was introduced in 1997, but had little effect on waiting
times. Only a proportion of the funding, however, depends on the number of patients
treated. The proportion has varied between 35% and 60% (see Chapter 12 on Norway). Biørn
et al. (2003) suggest that the change in the hospital payment system increased the annual
growth rate of activity from 2% between 1992 and 1996 to 3.2% between 1997 and 1999.
Kjerstad (2003) finds that after 1997 activity increased by 4% in hospitals that were paid
based on activity-based funding, while the increase was only 2% in hospitals that were not.
The increased activity is likely to have contributed to some reduction in hospital waiting
times (see Chapter 12).
The introduction of ABF can be expected to increase activity, but it does not
necessarily decrease waiting times. It might be possible to target increased productivity in
areas with longer waits by raising the prices for those services significantly, but this policy
has not been used. As the experience from the Netherlands has shown, ABF is likely to
decrease waiting lists and times only if it is accompanied by additional measures such as
increased capacity, choice and competition.
Demand-side policies
Private health insurance has a limited effect in shifting demand to the private sector
It may be argued that one way to reduce waiting times is by shifting demand to private
hospitals by encouraging private health insurance, therefore addressing the “inflow”. In
Australia, a number of incentives to encourage private insurance coverage have been
introduced (see Chapter 4 on Australia). In 2009-10, the cost of the insurance subsidy for
the government was USD 4.3 billion, about 8.1% of federal government health expenditure.
In 1996-97, the federal government funded 44.9% of public hospital expenditure and 10.1%
of private hospital expenditure. By 2009-10, these proportions had changed sharply, to
38.3% and 32.7% respectively (AIHW, 2000 and 2011).
It was expected that, by encouraging the substitution of treatment in public hospitals
by treatment in private hospitals, the insurance reforms might reduce waiting times in
public hospitals. However, there has not been a reduction in waiting times associated with
the uptake of private insurance in Victoria or New South Wales (see Chapter 4). While
private insurance coverage increased from 30% in 1998 to about 45% in 2000, the impact on
public hospital care was small. New insurees who responded to financial incentives did not
significantly reduce the use of the public hospitals (Lu and Savage, 2006; Fiebig et al., 2006).
Three possible reasons have been given for why the increase in private health insurance
did not reduce waiting times: i) privately insured people continue to use public hospitals,
WAITING TIME POLICIES IN THE HEALTH SECTOR: WHAT WORKS? © OECD 201364
I.3. A REVIEW OF WAITING TIMES POLICIES IN 13 OECD COUNTRIES
either as public patients or as private patients, because of high co-payments and
deductibles in private hospitals; ii) public hospitals provide some highly complex services
that are not available in private hospitals; and iii) hospital specialists work in both public
and private hospitals and are in limited supply (see Chapter 4).
In Denmark, supplementary private health insurance was negligible before 2002 when
the government introduced a tax exemption for employees covering the value of their
private insurance. Private insurance in Denmark can be used only to cover treatment in a
private hospital, since public hospitals cannot treat private patients. The private sector
expanded as a result of this policy, with the number of private hospitals and clinics
increasing from 175 to 249 between 2006 and 2010. It is important to emphasise that a
considerable part of this increased activity is not due to the private health insurance tax
rebate. Under the “free choice” policy, publicly funded regions also purchased care for
publicly funded patients from the private sector. Of all operations provided by private
hospitals, the regions paid for 64% while just 25% was paid for by private insurance, and
the remaining 11% was paid by the patient out of pocket. There is, nonetheless, evidence
to suggest that patients holding supplementary private insurance used fewer publicly
funded hospital services: patients with private insurance spend 10% less on public services
(see Chapter 6 on Denmark). The take-up of private insurance – along with a waiting time
guarantee at public hospitals (see above) – supported an increase in private hospital
activity, but this did not necessarily reduce waiting times in public hospitals (see
Chapter 6). However, it is difficult to assess the effects of the increased number of people
with private supplementary insurance on public waiting lists, because too many other
factors influencing waiting lists changed in the same period, but it is important to note that
the increased volume resulted largely from public funding for the choice associated with
the waiting time guarantee.
A number of countries have incentivised private health insurance in the belief that it
would encourage patients to use the private sector and remove pressure from the public
sector. The evidence on increased use of the private sector is mixed: in Australia, increased
coverage of private health insurance had a negligible effect on the usage of public sector
services. In contrast, Denmark experienced a decrease in public sector usage following the
introduction of a tax exemption for private health insurance. However, as in Australia
incentivising private health insurance did not necessarily reduce waiting times in
Denmark.
Prioritisation through clinical thresholds to target the “inflow” of patients ontowaiting lists
A demand-side policy to reduce waiting times involves introducing clinical thresholds
below which patients are not entitled to publicly funded surgery, thus potentially
decreasing the “inflow” onto the waiting list. New Zealand has been at the forefront in
using demand-side policies, where a patient is entitled to elective surgery depending on
patients’ needs and their ability to benefit from the medical intervention as assessed by
the specialist. Patients are normally referred for elective surgery by their GP, and the
specialist assessment determines whether the patient should be put on the waiting list.
Patients are classified into three groups: 1) booked; 2) certainty of treatment; and 3) active
care and review. Patients in the first and second groups are treated within six months.
Patients in the third group have the lowest severity and are not added to the waiting list.
The patients are referred back to their GP, who treats them and monitors their health
WAITING TIME POLICIES IN THE HEALTH SECTOR: WHAT WORKS? © OECD 2013 65

I.3. A REVIEW OF WAITING TIMES POLICIES IN 13 OECD COUNTRIES
status. If the condition deteriorates, these patients in Group 3 can move to Group 2.
Patients in Group 3 are therefore refused surgical treatment. Clearly, this may have a
dramatic effect on waiting times and the waiting list by significantly reducing the number
of patients who are added to the list (see Chapter 11 on New Zealand).
This innovative scheme of demand management in New Zealand has a long history
dating back to the 1990s, when the country began to develop and use clinical prioritization
assessment criteria (CPAC) tools to manage waiting lists. The goal behind these tools was
not only to manage the waiting list more effectively, but also to increase transparency in
how patients were prioritised, and to ensure that patients with the greatest benefit would
receive priority. A distinction was made between the clinical threshold where the patients
would benefit from treatment and a higher “financial threshold” which the health system
could afford (see Chapter 11). Many CPAC tools were multi-dimensional, integrating both
objective and subjective clinical criteria which were combined to create a composite score.
Integrated tools were also developed in some specialty areas (such as orthopaedics,
ophthalmology and plastic surgery), where clinicians first ranked individual conditions
against each other, with each condition then being allocated a specified range of scores
available within an overall scale of 1-100 (Roake, 2003). At one point, CPAC tools for
29 specialities were listed on the Ministry of Health website (McLeod, Morgan et al., 2004).
One of the critical implementation issues was whether to use national or locally
developed tools. Many districts used different tools, and this meant there was wide
variation in the clinical thresholds for treatment. Even when national tools were used,
there were still variations in scoring and in clinical thresholds, so there was little
consistency in who was entitled to publicly funded surgery. There were also problems in
developing valid and reliable tools for measuring patient need/severity and the potential
benefit from surgery. There was limited evaluation of the CPAC tools, and several studies
suggested that they were not consistent with other condition-specific tools (see
Chapter 11). Although various governments have aimed to have a national system fully
operational, it has proven very difficult to implement such a wide-ranging system of
clinical prioritisation.
However, even with these caveats, the focus on clinical prioritisation has led to a
decrease in the numbers awaiting treatment. The number of patients in New Zealand with
a commitment to treatment (i.e. either booked or given certainty) waiting more than
six months declined from around 7 000 patients in 2002-06 to around 3 000 patients in
2007-10 (see Chapter 11). More recent policy has emphasised the need for a greater focus
on improving patient flow across the patient journey, particularly linking the waiting times
for first specialist assessment to the actual time to treatment (New Zealand Ministry of
Health, 2012).
ConclusionsOver the past decade, waiting time guarantees have become the most common policy
tool to tackle long waiting times, but they are effective only if they are enforced. There are
two broad approaches to enforcement. The first entails setting waiting time targets and
holding health providers to account for achieving the targets. The second allows patients
to choose alternate health providers, including the private sector, if patients have to wait
beyond a maximum time. In England and Finland, health providers were penalised if they
exceeded a target, a method often known as “targets and terror”. As a result, waiting times
WAITING TIME POLICIES IN THE HEALTH SECTOR: WHAT WORKS? © OECD 201366

I.3. A REVIEW OF WAITING TIMES POLICIES IN 13 OECD COUNTRIES
decreased. This method is, however, unpopular with health professionals and difficult to
sustain over a long time. Portugal, the Netherlands and Denmark have introduced choice
and competition successfully, and this is the direction recently taken by England. The
Portuguese model has been particularly effective in decreasing waiting times. The model
entails a unified information system containing data on waiting times for all public and
private providers, and vouchers that allow the free choice of any provider and are issued to
patients when 75% of the waiting time guarantee is reached.
Supply-side waiting time policies, by themselves, are usually not successful. In the
earlier OECD study on waiting time policies, the most common policy was to provide
increased funding to health providers to decrease waiting times, and this type of policy
continues to be a common approach. It has almost invariably been unsuccessful in
bringing down waiting times over the long term. Generally, there is a short-term burst of
funding that initially reduces waiting times, but then waiting times increase, and
occasionally return to even higher levels when the temporary funding runs out. The other
main supply-side policy involves increasing hospital productivity by introducing new
payment methods, such as activity-based financing using diagnostic-related groups. This
increases hospital productivity, but does not necessarily decrease waiting times.
The introduction of activity-based funding, however, is often one of the key
components in introducing choice and competition, which can lower waiting times. The
Netherlands successfully eliminated waiting times by a combination of activity-based
funding, lifting a cap on hospital spending, allowing choice and competition, and
introducing waiting time norms. In general, it appears that a combination of sufficient
supply, payment systems that reward activity for both specialists and hospitals, and
limited constraints on hospital spending are associated with low waiting times. However,
these policies tend to be expensive and, given the current economic environment, may not
be feasible in all countries.
A complementary approach to reducing waiting times is to implement demand-side
policies in order to curtail or shift the demand for elective treatments. One approach is to
shift demand to the private sector by using private insurance. This has, however, generally
failed to reduce demand for elective treatments in public hospitals and to decrease waiting
times. The other approach is to introduce tools to improve clinical prioritisation for elective
treatments. Clinical prioritisation tools have been used most widely in New Zealand, with
some success. They can be difficult to implement, since they depend on setting a clear
clinical threshold in a valid and reliable manner. In some countries, such as Norway and
Australia, clinical prioritisation is linked to waiting time guarantees, with different
guarantees depending on the level of need. This appears to be a promising approach, but
requires better tools for clinical prioritisation that reliably measure clinical need and the
benefit of the elective procedures.
References
Askildsen, J.E., T.H. Holmås and O.M. Kaarbøe (2011), “Monitoring Prioritization in the Public Health careSector by Use of Medical Guidelines: The Case of Norway”, Health Economics, Vol. 20, pp. 958-970.
AIHW – Australian Institute of Health and Welfare (2000), “Australia’s Health Services Expenditure to1998-99”, Health Expenditure Bulletin, No. 16. Cat. No. HWE 15, AIHW, Canberra.
AIHW – Australian Institute of Health and Welfare (2011), “Health Expenditure Australia 2009-10”,Health and Welfare Expenditure Series, No. 46. Cat. No. HWE 55, AIHW, Canberra.
WAITING TIME POLICIES IN THE HEALTH SECTOR: WHAT WORKS? © OECD 2013 67

I.3. A REVIEW OF WAITING TIMES POLICIES IN 13 OECD COUNTRIES
Baltesen, F. (2010), “Patiënt wenst operatie eerder, luxer en beter” (Patient demands earlier, better andmore luxurious operation), NRC Handelsblad, Vol. 3, February 9.
Bevan, G. and C. Hood (2006), “Have Targets Improved Performance in the English NHS?”, British MedicalJournal, Vol. 332, pp. 419-422.
Biørn, E., T.P. Hagen, T. Iversen and J. Magnussen (2003), “The Effect of Activity-based Financing onHospital Efficiency. A Panel Data Analysis of DEA Efficiency Scores 1992-2000”, Health CareManagement Science, Vol. 6, pp. 271-283.
Botten, G., S. Grepperud and S.M. Nerland (2004), “Trading Patients: Lessons from Scandinavia”, HealthPolicy, Vol. 69, pp. 317-327.
Busse, R., A. Geissler, W. Quentin and M. Wiley (2012), Diagnosis-Related Groups in Europe: Moving TowardsTransparency, Efficiency and Quality in Hospitals, Open University Press, England.
Dimakou, S., D. Parkin, N. Devlin and J. Appleby (2009), “Identifying the Impact of Government Targetson Waiting Times in the NHS”, Health Care Management Science, Vol. 12, pp. 1-10.
European Commission (2007), Cross-border Health Services in the EU Analytical Report, EuropeanCommission, Brussels.
Fiebig, D.G., E.J. Savage and R.C. Viney (2006), “Does the Reason for Buying Health Insurance InfluenceBehaviour?”, CHERE Working Paper No. 2006/1, CHERE, University of Technology Sydney, Australia.
Hurst, J. and L. Siciliani (2003), “Tackling Excessive Waiting Times for Elective Surgery: A Comparisonof Policies in Twelve OECD Countries”, OECD Health Working Paper, No. 6, pp. 1-216, http://dx.doi.org/10.1787/108471127058.
Kjerstad , E.M. (2003), “Prospective Funding of General Hospitals in Norway: Incentives for HigherReduction?”, International Journal of Health Care Finance and Economics, Vol. 4, pp. 231-251.
Lu, M. and E.J. Savage (2006), “Do Financial Incentives for Supplementary Private Health InsuranceReduce Pressure on the Public System? Evidence from Australia”, CHERE Working Paper No. 2006/11,CHERE, University of Technology Sydney, Australia.
McLeod, D., S. Morgan et al. (2004), “Use of, and Attitudes To, Clinical Priority Assessment Criteria inElective Surgery in New Zealand”, Journal of Health Services Research and Policy, Vol. 9, No. 2, pp. 91-99.
New Zealand Ministry of Health (2012), Improving the System: Meeting the Challenge – Improving PatientFlow for Electives. A Toolkit for District Health Boards, Ministry of Health, Wellington.
Propper, C., M. Sutton et al. (2008), “Did ‘Targets and Terror’ Reduce Waiting Times in England forHospital Care?”, B.E. Journal of Economic Analysis & Policy, Vol. 8, No. 2.
Propper, C., M. Sutton, C. Whitnall and F. Windmeijer (2010), “Incentives and Targets in Hospital Care:Evidence from a Natural Experiment”, Journal of Public Economics, Vol. 94, pp. 318-335.
Roake, J. (2003), Managing Waiting Lists. Health Care Management and Delivery in New Zealand, R. Gauld.Dunedin, Otago University Press, pp. 107-121.
Siciliani, L. and J. Hurst (2005), “Tackling Excessive Waiting Times for Elective Surgery: A Comparisonof Policies in Twelve OECD Countries”, Health Policy, Vol. 72, No. 2, pp. 201-215.
Socialstyrelsen (2008), “Uppföljning av den nationella vårdgarantin” (Follow-up of the national careguarantee), Artikelnr 2008-103-1, National Board of Health and Welfare, Stockholm.
Stavrunova, O. and O. Yerokhin (2011), “Equilibrium Model of Waiting Times for Elective Surgery inNSW Public Hospitals”, Economic Record, Vol. 87, No. 278, pp. 384-398.
Varkevisser, M., S.A. van der Geest and F.T. Schut (2004), “Concurrentie tussen Nederlandseziekenhuizen”, Studies in Economic Policy, No. 13, OCFEB/iBMG, Erasmus University Rotterdam,Holland.
Varkevisser, M. and S.A. van der Geest (2007), “Why Do Patients Bypass the Nearest Hospital? AnEmpirical Analysis for Orthopaedic Care and Neurosurgery in the Netherlands”, European Journal ofHealth Economics, Vol. 8, No. 3, pp. 287-295.
Varkevisser, M., S.A. van der Geest and F.T. Schut (2010), “Assessing Hospital Competition When PricesDon’t Matter to Patients: The Use of Time Elasticities”, International Journal of Health Care Finance andEconomics, Vol. 10, No. 1, pp. 43-60.
WAITING TIME POLICIES IN THE HEALTH SECTOR: WHAT WORKS? © OECD 201368

PART II
Review of waiting timespolicies: Country case studies
WAITING TIME POLICIES IN THE HEALTH SECTOR: WHAT WORKS? © OECD 2013


Waiting Time Policies in the Health Sector
What Works?
© OECD 2013
PART II
Chapter 4
Australia
by
Meliyanni Johar, Glenn Jones and Elizabeth Savage,
Business School, University of Technology Sydney (UTS),
and
Anurag Sharma, Antony Harris,
Centre for Health Economics, Monash University
In Australia, lowering waiting times for elective surgery has been a policy focus overthe last two decades. Initially, the focus at the national level was on subsidisingprivate health insurance with the aim of shifting demand from public to privatehospitals. More recently, policies have shifted to directly expanding public hospitalcapacity and providing financial incentives to states for achieving lower waitingtimes. Despite these expensive efforts, waiting times barely changed, with themedian even increasing slightly. Australia’s states manage the public hospitals, andthere are large variations in waiting time across the states. There is some evidencethat state-based programmes are more effective than national ones, but theirimpacts have been short-lived. Several features of the current system for managingwaiting lists may contribute to long waiting times, including the wide discretiongiven to specialists in assigning urgency to patients on the waiting list.
71

II.4. AUSTRALIA
Main characteristics of the Australian health system
Description of the Australian health system
The health care system in Australia is characterised by universal coverage and is
financed mainly through general taxation and a compulsory tax-based health insurance
levy, which pays for Medicare coverage. Medicare provides Australians with subsidised
primary and out-patient care and free public hospital care (Healy et al., 2006). 50% of
Australians buy further insurance coverage to access private facilities and extra benefits
(Commonwealth Fund, 2011). The Australian Government sets some national health policy,
whilst the states and territories also have their own health departments and set state- or
territory-wide health policy. The Medicare public insurance programme is administered
regionally. Hospitals are the responsibility of the state and territory governments. The
National Health Reform Agreement (COAG, 2011) sets out the future plan for system-wide
health reform in Australia, and gives the Australian Government responsibility for
financing and leading policy for GP and primary equivalent care, care for the elderly and
community care. This agreement, signed by the Prime Ministers of all states, supersedes
the National Health and Hospital Network Agreement (COAG, 2010), which also sought to
establish the Australian Government as the majority funder (60%) of all public hospitals.
Under the supervision of the Australian Government, “Medicare Locals” were
established by July 2012. Medicare Locals will become the primary health care
organisations across Australia, operating as the GP and primary health care partners of
Local Hospital Networks. Medicare Locals and Local Hospital Networks are to work
together to create more integrated and responsive services across primary and acute care
in their area. There are non-governmental health service providers across Australia, both
private for-profit and not-for-profit organisations (NGOs). These services exist either
independently of public health care provision, for example, in private clinics, or as
complements to public health care, with NGOs providing specific health services alongside
public service provision. NGOs sometimes operate independently, but are often and
increasingly being awarded government contracts to provide certain services. Private
health care in Australia is most typically used as an “add-on” to state health services
covered under Medicare, a situation that is encouraged by the federal government. The
Australian Government has also been encouraging individuals to take out private health
insurance through a range of initiatives, including incentives, subsidies and penalties.
Hospital remuneration
The federal government’s contribution for public hospitals is provided through
agreements with each of the eight states and territories. Hospitals are paid mostly through
a global budget, with some case-based payments (Commonwealth Fund, 2011). Public
hospital services are provided free of charge, in principal on the basis of clinical need,
within a clinically appropriate time period and regardless of geographic location. The
system for funding the public hospitals is the responsibility of the state and territory
WAITING TIME POLICIES IN THE HEALTH SECTOR: WHAT WORKS? © OECD 201372

II.4. AUSTRALIA
governments. The National Health Reform Agreement (COAG, 2011) supersedes the
National Health and Hospital Network Agreement (COAG, 2010), which also sought to
establish the Australian Government as the majority funder (60%) of all public hospitals,
and ensures block grants from the Australian Government to the states and territories,
making the Australian Government the major funder of hospitals. Remuneration systems
include funding based on agreed levels of case mix, funding based on past levels of
expenditure and funding based on demographic profiles. Some jurisdictions use a
combination of methods to determine budget levels. In general, the level of waiting time
for elective surgery is not a determinant of hospital funding. However, where extended
waiting times are a result of changes in demand and demographic patterns, this
information may be used by health authorities in setting future hospital budgets.
Patients admitted to public hospitals can elect to be treated within that facility either
as public or private patients. Public patients are treated free of charge. When a patient
elects to be treated as a private patient at a public hospital, the patient is responsible for
the charges incurred. Patients who choose to be treated as private patients in public
hospitals may pay for their care out-of-pocket or through private health insurance.
However, as already mentioned, access to services in public hospitals is on the basis of
clinical need. The election of public or private status does not play any part in the
determination of the required clinical interventions. Under the universal health care
arrangements, patients who elect to be treated as public patients can choose the hospital,
but not the doctor. Some states and territories also contract out to private hospitals some
activity, at the expense of the public system. Under the Australian Health Care
Agreements, states and territories are not permitted to refuse treatment to a person
resident in a different state or territory; however, most public elective surgery is performed
within the state or territory of residence.
Hospital beds
There were a total of 81 826 hospital beds in Australia in 2009 (3.73 per
1 000 population). 69.5% of these beds were in publicly owned hospitals, whilst 14.3% were
in not-for-profit private hospitals and the remaining 16.1% in for-profit private hospitals.
The number of acute care hospital beds was 3.4 per 1 000 population in 2008-09, which was
also the OECD average in 2009. As in most OECD countries, the number of hospital beds per
capita in Australia has fallen over time. This decline has coincided with a reduction in the
average length of stay in hospitals and an increase in the number of same-day surgical
procedures (OECD, 2012).
Specialist remuneration
Consultations with specialists outside of hospitals are covered by Medicare rebates.
Specialists treating private patients set their own fees, on a fee-for-service basis; the gap
between the fee charged and the Medicare subsidy is covered either by insurance or out-of-
pocket payments, or both. Individuals need a referral from a GP before they can see a
specialist. Many specialists work in both the private and public sectors. The states and
territories determine the remuneration arrangements for specialists in public hospitals.
The two most common categories of specialist are “Visiting medical officers” and “Salaried
specialists”. “Visiting medical officers” are private specialists who work within the public
system under contracts or other arrangements and may be entitled to see private patients
within the public hospital under agreed conditions. The remuneration of Visiting Medical
WAITING TIME POLICIES IN THE HEALTH SECTOR: WHAT WORKS? © OECD 2013 73

II.4. AUSTRALIA
Officers ranges from fee-for-service arrangements to “set service level” contracts. “Salaried
specialists” at public hospitals may also be entitled to have a private practice for a
proportion of their time, under agreed conditions. The arrangements usually establish
certain fees to be paid to the hospital (to be used for specific training or equipment
purchases, for example) as recognition of the cost of the facilities that the hospital
provides.
Co-payments
Medicare reimburses between 75% and 100% of services and offers additional
payments for concession card holders and children. Public hospital services must be
provided free of charge to patients who elect to be treated as public patients. The
Australian Government funds and administers the Pharmaceutical Benefits Schedule,
which subsidises listed pharmaceuticals (Healy et al., 2006); in 2011, prescriptions covered
under the PBS had a standard co-payment of AUD 33, with a reduced rate of AUD 6 for
concession card holders.
Primary care
Most general practitioners are self-employed and run their practices as small
businesses. Group practices are the norm. General practitioners may also perform minor
surgery in their clinics. In 2009, the average wage of a self-employed GP was 1.71 (estimate)
per average wage (OECD, 2012). Primary care payment is on a fee-for-service basis, and
patients do not need to register with a single GP. GPs do play a gatekeeping role
(Commonwealth Fund, 2011). Medicare covers 100% of the consultation fees for GPs, tests
and examinations. GPs can either charge the cost of the Medicare rebate, through directly
billing Medicare (bulk-billing), or they can charge more than the Medicare coverage. If the
GP charges more than the Medicare rebate, the patient must pay the difference between
the Medicare rebate and the GP fee out of pocket (Healy et al., 2006). There were 1.2 GPs
per 1 000 population in 2009 (OECD, 2012).
Surgical activity
A number of surgical procedures by ICD-9-CM (per 100 000 population) have
experienced a shift in provision from in-patient to day-case surgery between 2000 and 2009
(Table 4.1). The highest growth rates in surgical procedures conducted only on an in-
patient basis within this period are for knee replacements (75.8%) and percutaneous
coronary interventions (PTCA and stenting) (39.5%). On the other hand, coronary bypass
has experienced the largest decrease (-35.3%).
Expenditure
Total health spending accounted for 9.1% of GDP in Australia in 2009-10, slightly lower
than the average of 9.5% in OECD countries in 2010. Australia ranks above the OECD
average in terms of total health spending per capita, with spending of USD 3 670 in 2009-10
(adjusted for purchasing power parity), compared with an OECD average of USD 3 268
(OECD, 2012). Between 2000 and 2009, total health spending in Australia increased in real
terms by 4.6% per year on average, a growth rate similar to the OECD average of 4.7%. In
Australia, 68.5% of health spending was funded by public sources in financial year 2009-10,
below the OECD average of 72.2% (OECD, 2012).
WAITING TIME POLICIES IN THE HEALTH SECTOR: WHAT WORKS? © OECD 201374

II.4. AUSTRALIA
Practising physicians
Physicians in public hospitals either are salaried (but may also have private practices
and additional fee-for-service income) or are paid on a per-session basis for treating public
patients. In 2009, Australia had 3.1 practising physicians per 1 000 population, the same as
the OECD average (OECD, 2012).
Ageing and life expectancy
In 2010, life expectancy at birth in Australia stood at 81.8 years, two years higher than
the OECD average of 79.8, and an increase from 79.3 in 2000. Australia has the fifth-highest
life expectancy among OECD countries, after Japan, Switzerland, Spain and Italy. The
proportion of the population aged 65 and over has increased from 12.4% in 2000 to 13.2%
in 2011 (OECD, 2012).
Waiting times policies in the Australian health system
To access public hospital care for an elective hospital procedure in Australia, a patient
must first obtain a referral from a GP for a specialist consultation. It is the specialist who
books the patient for treatment at a specific hospital. If the patient is booked to a private
hospital, the waiting time is likely to be minimal, and there is no reporting of private
hospital waits. If the patient is booked to a public hospital, whether as a public or private
patient, the specialist assigns an urgency category, which influences waiting time.
Principle 7 of the Australian Health Care Agreements between the Australian Government
and each state/territory government requires that all public hospital services for private
Table 4.1. Surgical procedures per 100 000 population, 2000 and 2009
Surgical procedures by ICD-9-CM 20001 2009% change
in surgical proceduresbetween 2000 and 2009
Cataract surgery:
Inpatient 112.5 46.4 -58.70
Day-case 588.2 896.3 52.30
Tonsillectomy with or without adenoidectomy:
In-patient 149.5 196.1 31.10
Day-case 4.2 17.3 311.90
Percutaneous coronary interventions (PTCA and stenting) – in-patient 109.7 153.1 39.50
Coronary bypass – in-patient 87.1 56.3 -35.30
Appendectomy – in-patient 140.3 151.4 7.90
Cholecystectomy:
In-patient 238.6 222.3 -6.80
Day-case 2.6 4.9 88.40
Laparoscopic cholecystectomy:
In-patient 198.1 197.5 -0.30
Day-case 2.4 4.8 100.00
Inguinal and femoral hernia:
In-patient 179.4 162.8 -9.20
Day-case 46.9 49.9 6.30
Hip replacement – in-patient 125.2 161.1 28.60
Knee replacement – in-patient 95.9 168.6 75.80
1. Break in series, excluding cataract surgery.Source: OECD (2012), OECD Health Data 2012, OECD Publishing, Paris, http://dx.doi.org/10.1787/health-data-en.
1 2 http://dx.doi.org/10.1787/888932754787
WAITING TIME POLICIES IN THE HEALTH SECTOR: WHAT WORKS? © OECD 2013 75

II.4. AUSTRALIA
patients should be provided on the same basis as for public patients: access to public
hospital care should be on the basis of clinical need, not payment status.1
Waiting times are calculated as the time between the date on which a patient was
added to a public hospital waiting list for elective surgery and the date that they were
admitted (AIHW, 2011b). Reported waiting times are for patients who complete their wait
and are admitted to hospital for their surgery. Some patients are removed from waiting
lists for other reasons, including that they: i) were admitted as an emergency patient for
the awaited procedure; ii) were transferred to another hospital’s waiting list; iii) were
treated elsewhere (e.g. in a private hospital); iv) were not contactable; or v) had died or
declined surgery.
Australia uses a three-category system of urgency that specifies the maximum
recommended waiting time beyond which treatment can be considered overdue, with
possible health risks. A “30 day” urgency is assigned to patients with “a condition that has
the potential to deteriorate quickly to the point that it may become an emergency”; a
“90 day” urgency is used for “a condition causing some pain, dysfunction or disability, which
is not likely to deteriorate quickly or become an emergency”; and a “365 day” status is used
for “a condition causing minimal or no pain, dysfunction or disability, which is unlikely to
deteriorate quickly and which does not have the potential to become an emergency”. A
further category, “not ready for care”, is used for patients who either are clinically not ready
for admission or have deferred admission for personal reasons. Days on which the patient
was classified as “not ready for care” are excluded from the calculation of waiting times.
There is some variation in the method that the states and territories use to calculate waiting
times for patients who change clinical urgency category while on the waiting list or who
transfer from a waiting list managed by one hospital to one managed by another.2
Payments from private patients for hospital services provide revenue to public
hospitals in addition to their global budgets. There is some incentive on the part of
specialists who work in both sectors to maintain public hospital waiting times at a level
sufficient to induce demand for surgery in private hospitals. There is also an incentive for
public hospitals to manage throughput and waiting times for elective surgery in such a way
as to achieve additional funding.
Past federal policy
Hospital waiting times have been a policy concern for the past two decades at the state
level. More recently the federal government has also made waiting times a priority. At the
Council of Australian Governments’ meeting on 20 December 2007, the Prime Minister
identified the reduction of waiting times for elective surgery in public hospitals as a new
major policy initiative for the federal government.
The main elective surgery policy focus at the national level has been, at least until
recently, on private insurance, with the aim of encouraging the use of private hospitals.
Between 1997 and 2000, a number of private health insurance incentives were introduced.
The first incentive in 1997 had two components, an insurance premium rebate for low-
income earners and a tax surcharge for high-income individuals and families who did not
have private health insurance cover. In 1999, the premium rebate was converted to a
universal 30% premium subsidy. In 2006, the 30% rebate was increased to 35% from age 65
and to 40% from age 70. From July 2012, this subsidy is means-tested. In 2000, the Lifetime
Health Cover Policy was introduced: for individuals aged over 30 who were not insured by
WAITING TIME POLICIES IN THE HEALTH SECTOR: WHAT WORKS? © OECD 201376
II.4. AUSTRALIA
July 2000, the policy imposed a 2% premium surcharge on every private insurance policy for
each year of age above 30. In all other respects private insurance premiums are community
rated.
By 2009-10, the cost of the insurance premium subsidy was AUD 4.3 billion. This
constituted 8.1% of federal government health expenditure, up from 6.7% at its
introduction. This has caused a large shift in the emphasis of federal health funding. In
1996-97, the federal government funded 44.9% of public hospital expenditure and 10.1% of
private hospital expenditure. By 2009-10, these proportions had changed to 38.3% and
32.7%, respectively (AIHW, 2000 and 2011c). While private health insurance cover increased
from 30% in 1998 to about 45% in 2000, there was only a small impact on public hospital
use. New insurees who responded to the financial incentives did not significantly reduce
their use of the public hospital system (Lu and Savage, 2006; Fiebig et al., 2006).
Recent federal policy
The federal government elected in December 2007 changed the policy focus on waiting
times from support for private health insurance to the provision of funding to expand the
capacity of the public hospital system. The 2008 Elective Surgery Waiting List Reduction
Plan (ESWLRP) committed AUD 650 million over four years, including AUD 300 million in
upfront payments in 2010-11.3
The goals were to i) immediately reduce the backlog of patients waiting longer than
the clinically recommended time, ii) improve elective surgery throughput in the long term
by investing in information systems, major equipment and instrumentations, as well as in
the construction of additional day surgery units and iii) reward states that reduce their
proportion of patients not seen within clinically recommended times. There were three
stages to the plan: stage one focussed on the immediate reduction of patients on waiting
lists, stage two provided money for investment in infrastructure to improve elective
surgery in the future and stage three was aimed at reducing the number of “long waiting”
patients and improving the overall efficiency of public hospitals. Under the ESWLRP, the
states and territories were rewarded for achieving targets at each stage. When the
performance payments for stage three were announced, only three states qualified for the
full amount of reward funding (New South Wales, Queensland and Victoria). The remaining
states received partial payments.
The initial plan applied up to 2010; following an agreement between the federal
government and the states announced in August 2011, the focus changed to increasing the
number of patients seen within clinically recommended times and to progressively reducing
the numbers of long wait patients. As part of this agreeement, from July 2012, there is a plan
to pay hospitals on the basis of activity-based funding for in-patient services and to set up a
new National Performance Authority to report on hospital perfomance (COAG, 2011).
One part of the federal government initiative required each state to create additional
capacity within the public hospital system or to purchase additional capacity from the
private sector. The National Access Guarantee for Elective Surgery committed to treating
95% of patients waiting for elective surgery within the clinically recommended times by
2014. It also proposed immediate free treatment in public or private hospitals for patients
waiting longer than the clinically recommended times. This guarantee of immediate
treatment purchased from the private sector was opposed by state health departments and
has not been delivered.
WAITING TIME POLICIES IN THE HEALTH SECTOR: WHAT WORKS? © OECD 2013 77

II.4. AUSTRALIA
The ESWLRP had mixed results. The total volume of elective surgery under stage 1 of the
plan has been reported as exceeding expectations, i.e. delivering 41 584 elective surgical
procedures against a target of 25 278, and expanded elective surgery capacities in more than
120 hospitals (Commonwealth of Australia, 2010). Despite this, a deterioration in waiting
time performance was noted in a commissioned review of access targets by an expert panel
of six physicians and public health experts (Commonwealth of Australia, 2011).
In 2011, a national health reform agreement aimed at improving public hospital
services was agreed between the federal and state governments (COAG, 2011). It sets up the
National Elective Surgery Target (NEST), which will commence from 1 January 2012 with
the aim of moving towards having 100% of elective surgery patients admitted within the
clinically recommended time. Under the policy the federal government will provide up to
AUD 650 million to the states and territories by 1 July 2012 (including AUD 450 million in
facilitation funding) and up to AUD 200 million in reward funding over the life of this
agreement.
Trends in waiting times in Australia over the past decade
Most states did not collect waiting time data prior to 1997, and waiting times were not
reported nationally until 2000. This prevents a comparison of elective surgery waiting
times before and after the insurance incentives. Figure 4.1 presents trends in elective
surgery admissions (per 1 000 population) and waiting time indicators (median and 90th
percentile waiting time and percentage waiting more than 365 days) for Australia from
2000-01 to 2009-10 relative to the base year.
Over the decade, the elective surgery admission rate has been fairly stable at around
27 elective admissions per 1 000 population. In 2000-01, the median and 90th percentile
waiting times were 27 and 202 days, respectively, and 4% waited longer than one year. Both
the median and 90th percentile wait increased quite rapidly after 2004. The median waiting
time increased to 36 days in 2009/10, and the 90th percentile wait increased to 247 days.
Figure 4.1. Elective surgery admission and waiting times in Australia,2000 to 2010
Source: National Elective Surgery Waiting Times Data Collection, AIHW (2012), www.aihw.gov.au/national-elective-surgery-waiting-times-data/.
1 2 http://dx.doi.org/10.1787/888932753951
1.40
1.20
0.80
0.40
1.00
0.60
0.20
02000/01 2001/02 2002/03 2003/04 2004/05 2005/06 2006/07 2007/08 2008/09 2009/10
% waited > 365 days (base = 4%) Admission per 1 000 population (base = 26.4)Median (base = 27 days) P90 (base = 202 days)
WAITING TIME POLICIES IN THE HEALTH SECTOR: WHAT WORKS? © OECD 201378

II.4. AUSTRALIA
The proportion of patients waiting more than a year has fluctuated over time, declining
rapidly in 2007, then stabilising briefly before rising in 2009-10. The number of long waiting
patients actually increased following the introduction of the ESWLRP. This suggests that
policies at the state level may have been more influential in driving the trends.
Waiting times for elective surgery in public hospitals can be very long for some
procedures. Table 4.2 reports the median and 90th percentile waiting times and the
proportion of patients waiting more than 365 days at the national level, and separately for
New South Wales and Victoria, the two largest Australian states,4 for several common
procedures. Procedures that are assigned lower urgency tend to involve longer waits. Knee
and hip replacements have the longest waiting times, followed by cataract extraction. In
contrast, most patients for coronary artery bypass grafts (CABG) are admitted within two to
three weeks. For each procedure the waiting time distribution is extremely skewed to the
right. A coronary artery bypass graft, for example, had a median wait of around 14 days in
2004/05, but 10% of patients waited more than 89 days. Similarly, 50% of cholecystectomy
patients waited less than 46 days, but 10% of them waited more than 217 days.
For all procedures (except CABG), both the 90th percentile waiting times and the
percentage waiting more than 12 months have fallen. For example, the proportion of cataract
patients waiting more than 365 days dropped dramatically, from 12.1% to 3.6%, and the
proportion of knee replacement patients waiting more than 365 days dropped from 23.5% to
14.9%. Likewise, for cystoscopy the percentage of patients waiting more than 365 days fell
from 2.6% to 1.5%, and the 90th percentile wait fell from 158 days to 133 days. These trends
may be explained by the focus of waiting time reduction efforts on long waiting times.
However, the median waiting times have generally increased over the period, for example,
from 36 days to 48 days for hysterectomy, from 32 days to 41 days for prostatectomy and
from 62 days to 85 days for tonsillectomy. This illustrates the trade-offs that public hospitals
have made to meet the targets. Despite the great similarity of the patient populations in New
South Wales and Victoria, Table 4.2 shows large differences between the two states in
waiting times for procedures. For example, in 2008-09 the median wait for cataract extraction
in New South Wales was 168 days but only 56 days in Victoria.
Because both federal and state governments share responsibilities for public hospitals
in Australia. Recent policies on waiting times and their outcomes in New South Wales and
Victoria are described in the following two sections.
Waiting times policies in the New South Wales health system5
NSW public hospitals account for about one-third of total elective surgery admissions
in Australia each year. In 2009-10, the NSW state government funded 52% of public hospital
expenditure and the federal government funded 39%. The remaining 9% was funded by a
combination of private health insurance claims and out-of-pocket payments for private
patients and other insurance claims such as work-related injuries (AIHW, 2011c). Dual
funding of public hospitals by different levels of government has been criticised as
providing no clear line of accountability for the delivery by public hospitals of quality
outcomes, including waiting times. New South Wales began collecting waiting time data in
1997, but waiting times were not reported nationally until 2000.
Public hospitals in New South Wales are administered by regional health authorities.
These authorities receive combined federal and state government funding, which they
distribute as block payments to individual hospitals. New South Wales is distinct from
WAITING TIME POLICIES IN THE HEALTH SECTOR: WHAT WORKS? © OECD 2013 79

II.4.A
UST
RA
LIA
WA
ITIN
GT
IME
POLIC
IESIN
TH
EH
EALT
HSEC
TO
R:W
HA
TW
OR
KS?
©O
ECD
201380 ys by indicator procedure,
Western Australia Australia
1-02 2004-05 2009-10 2001-02 2004-05 2009-10
503 3 985 7 257 35 574 44 846 52 0695.2 6.1 0.5 15.4 12.1 4.3113 94 41 88 92 86322 317 183 430 388 336797 954 1 166 15 466 16 840 17 9301.3 2.2 1.6 4.1 4.2 2.229 28 31 4.1 46 51
143 165 171 205 217 186408 303 222 5 985 5 210 3 8990.0 0.0 0.0 0.4 0.2 0.717 20 20 16 14 1566 53 70 96 89 80
703 3 482 4 974 26 892 33 808 39 7482.1 3.5 2.5 2.4 2.6 1.318 23 28 28 27 2594 187 162 145 158 126
966 1 118 1 234 13 386 15 140 14 7462.2 2.6 0.8 4.2 4.0 3.125 25 37 36 43 57
153 151 198 207 216 250907 964 1 743 11 697 12 419 16 83010.7 14.0 1.3 10.1 9.8 8.4
85 127 76 63 62 91378 406 181 368 360 357387 515 778 5 927 7 213 8 5728.0 10.5 1.7 11.7 14.4 11.188 114 78 96 102 116
334 377 209 395 433 373372 540 1 091 7 164 9 526 12 5160.4 17.8 5.9 19.4 23.5 18.1174 165 100 131 152 180524 450 277 524 542 414832 49 295 61 298 508 371 549 746 606 3054.1 3.8 1.5 4.5 4.8 3.525 27 32 27 29 35
217 197 161 203 217 246
2 http://dx.doi.org/10.1787/888932754806
Table 4.2. Median wait, 90th percentile wait and percentage waiting more than 365 dastates and territories, Australia, 2001-02 to 2009-10
New South Wales Victoria Queensland
Indicator procedure Measure 2001-02 2004-05 2009-10 2001-02 2004-05 2009-10 2001-02 2004-05 2009-10 200
Cataract extraction Admissions 14 345 19 264 19 070 9 232 11 723 13 515 4 567 5 623 6 775 3% waited more than 365 days 24.1 21.2 8.4 5.1 1.9 1.4 16.8 2.6 2.2Days waited at 50th percentile 159 182 211 53 44 63 30 33 37Days waited at 90th percentile 471 475 363 256 187 228 544 209 224
Cholecystectomy Admissions 6 517 6 793 6 741 3 321 3 943 4 341 3 233 3 367 3 669% waited more than 365 days 4.6 6.1 2.5 4.6 4.4 1.2 2.9 1.2 0.8Days waited at 50th percentile 40 50 62 44 49 50 40 40 40Days waited at 90th percentile 210 274 233 234 236 156 149 104 138
Coronary artery bypass graft Admissions 1 691 1 466 890 1 465 1 023 980 1 497 1 636 1 060% waited more than 365 days 0.1 0.1 0.0 1.4 0.1 2.7 0.1 0.4 0.0Days waited at 50th percentile 21 17 19 10 7 23 17 11 5Days waited at 90th percentile 111 94 69 64 129 122 1.1 84 52.5
Cystoscopy Admissions 10 600 13 498 14 352 6 531 8 843 12 570 4 775 4 269 4 646 1% waited more than 365 days 1.9 2.2 1.3 2.5 3.6 0.7 2.1 1.4 1.5Days waited at 50th percentile 28 27 25 28 23 22 27 29 30Days waited at 90th percentile 119 146 130 165 174 108 134 160 117
Inguinal hemiorrhaphy Admissions 5 594 6 047 5 941 2 870 3 341 3 602 2 630 2 897 2 219% waited more than 365 days 3.3 4.7 4.3 5.4 5.3 1.9 3.8 1.5 1.6Days waited at 50th percentile 34 4.7 72 39 48 52 35 38 47Days waited at 90th percentile 201 246 319 229.5 255 170 153 111 155
Tonsillectomy Admissions 3 833 4 186 4 946 3 225 3 789 4 599 2 662 2 279 3 492% waited more than 365 days 12.8 19.1 15.7 6.9 3.1 6.0 10.0 2.0 4.0Days waited at 50th percentile 87 110 220 47 39 86 45 28 53Days waited at 90th percentile 401 516 387 288 205 318 365 128 213
Total hip replacement Admissions 2 222 2 747 3 023 1 468 1 705 2 244 1 099 1 295 1 412% waited more than 365 days 14.8 18.9 16.2 10.8 12.8 8.9 6.3 4.0 5.2Days waited at 50th percentile 111 106 167 109.5 141 119 56 50 69Days waited at 90th percentile 450 481 391 378 400 352 250 179 269
Total knee replacement Admissions 3 191 4 270 5 217 1 399 1 625 2 673 1 360 1 857 2 205% waited more than 365 days 26.9 33.1 24.6 14.8 17.6 14.5 9.3 7.2 10.3 2Days waited at 50th percentile 174 218 301 129 176 155 69 60 93Days waited at 90th percentile 598 604 415 448 463 417 350 267 368
Total Admissions 186 229 197 600 198 503 112 309 129 205 155 761 108 844 108 876 113 884 38% waited more than 365 days 5.0 6.9 4.9 4.4 4.0 2.8 3.6 1.8 2.5Days waited at 50th percentile 28 34 44 28 28 36 23 22 27Days waited at 90th percentile 220 294 330 210 200 197 132 105 150
Source: National Elective Surgery Waiting Times Data Collection, AIHW (2012), www.aihw.gov.au/national-lective-urgery-waiting-times-data/.1

II.4. AUSTRALIA
other Australian states in that it has not used the case-mix to allocate funding to hospitals.
A further distinction is that public hospitals in New South Wales have a relatively high
share of private patients. These features may not be unrelated. In 2009-10, of total
accommodation days in all NSW hospitals resulting in a private health insurance claim,
34% were for private patients admitted to public hospitals. This compares with 22% for
Australia overall. The corresponding percentages for benefits paid by private health
insurers are 11.7% for New South Wales and 6.9% for Australia (Private Health Insurance
Administration Council, 2011). These figures suggest that NSW public hospitals are more
likely than those in other Australian states to use revenue from private patients to
supplement their block budget allocations.
The Australian Health Care Agreements (AHCAs) between New South Wales and the
federal government require that all public hospital patients should be treated solely on the
basis of clinical need, irrespective of payment status. Clinically comparable public and
private patients, who are placed on hospital waiting lists for elective admission, should
have comparable waiting times. However, there are financial incentives for both public
hospitals and physicians to increase the throughput of private patients by reducing the
waiting times of private patients compared with clinically equivalent public patients.
The reporting of waiting times at the national level, and comparisons between the
states, do not differentiate public and private patient waiting times. Preferential treatment
of private patients on the waiting lists could delay the admission of more urgent public
patients and affect the distribution of waiting times. This is likely to be more pronounced
in New South Wales than in other Australian states.
Waiting times in New South Wales in 2004-05Analysis of 2004-05 data on elective public hospital admissions in New South Wales
provides robust evidence that access to elective surgery in New South Wales is influenced
by patients’ payment status. Comparing private and public patients who were in the same
urgency class or waiting for the same procedures in 2004-05, private patients in NSW public
hospitals were admitted ahead of their listing rank (Johar and Savage, 2010). For instance,
in the principal referral hospitals, the average wait for cataract extractions for public
patients was 254 days, compared with 66 days for private patients. Similarly, public
patients waiting for knee replacements waited on average 358 days, whilst the
corresponding waiting time for private patients was only half as long. Private patients were
also more likely to be assigned to a less urgent category and less likely to be admitted
beyond the recommended waiting time.
Johar, Jones and Savage (2012a) find further evidence that NSW private patients are
advantaged. They examined the impact of admissions from the emergency department on
waiting times for elective procedures. Using waiting time variation across hospitals, they
found that, holding constant the bed size, hospital type, patient health profile of the
hospital and location, an increase in Emergency Department admissions increases the
waiting times of public patients, but has no effect on the waiting times of private patients.
Even among public patients in public hospitals there is evidence of discrimination in
favour of richer public patients, who are found to have shorter waiting times than their
clinically comparable poorer counterparts, even in the most urgent category. While an
incentive for public hospitals to favour private admissions is provided by contributions of
private patient revenues to their fixed budgets, the incentives to favour richer public patients
are less clear. Perhaps the financial incentives are more indirect (Johar et al., 2012b).
WAITING TIME POLICIES IN THE HEALTH SECTOR: WHAT WORKS? © OECD 2013 81

II.4. AUSTRALIA
Waiting times within New South Wales also exhibit a large variation across geographic
areas, and even within the capital city of Sydney where access to the public hospitals is
relatively uniform. Consistent with the above-mentioned evidence of discrimination at the
individual patient level, the mean waiting time is found to be the shortest in the area
health service (AHS) with the highest socioeconomic status. The average waiting time
advantage for the richest AHS can be as large as 76 days. This geographical gap cannot be
explained by differences in patients’ health profiles across areas (Johar et al., 2012c).
New South Wales waiting times policies, 2003 to 2010
Before 2003, there were no specific policies in New South Wales directed at reducing
waiting times for elective surgery. In 2003, the NSW Department of Health proposed monthly
reporting at the hospital level of a set of performance indicators, together with the setting of
access targets for hospital treatment (NSW Department of Health, 2003). The indicators
selected were the percentages of urgency category 1 cases (most urgent) admitted to hospital
in less than 30 days and the percentage of patients admitted within 12 months. The policy
recommended benchmarking to indicators used in other jurisdictions. The benchmarks
adopted were the Australian National Health Performance Committee (median waiting time
overall and for coronary revascularisation and hip replacement); the English NHS (the
percentage waiting longer than 6 months for in-patient admission, the percentage seen in
less than 13 weeks of a GP referral for first specialist appointment, and the percentage seen
in less than two weeks of an urgent GP referral to a specialist for cancer); and the Canadian
health system (median waiting times for surgery, cardiac procedures, hip and knee
replacement, diagnostic services and specialist visits).
Figure 4.2 presents trends in elective surgery admissions (per 1 000 population) and
waiting time indicators (median and 90th percentile waiting time and percentage waiting
more than 365 days) for Australia from 2000-01 to 2009-10 relative to the base year. Over the
decade, the elective surgery admission rate has been fairly stable at around 27 elective
admissions per 1 000 population. In 2000-01, the median and 90th percentile waiting times
were 27 and 202 days, respectively, and 4% waited longer than one year. Both the median and
90th percentile wait increased quite rapidly after 2004. The median waiting time increased to
36 days in 2009/10, and the 90th percentile wait increased to 247 days. The proportion of
patients waiting more than 365 days is quite erratic, spiking in 2005 and returning to the 2000-
01 level by 2009-10. The data suggests very little impact from the benchmarking initiative.
The percentage of patients waiting more than 365 days had increased by about 50% (to
7% of patients) after 2003-04. In January 2005, the NSW Surgical Services Taskforce
Predictable Surgery Programme was introduced. This programme had the specific goal of
reducing the percentage of patients waiting more than 365 days.6 The programme involved
a number of elective surgery management initiatives, including a telephone service that
gave health practitioners and patients information on surgeons with shorter waiting times.
It also introduced payments to health services that met activity targets for surgery
performance and established policies to improve operating theatre efficiency. The
programme was funded by both the state and federal governments. Details of the incentive
payment structure were not publically available. Figure 4.2 shows that the proportion of
patients waiting more than 365 days fell dramatically (to 2% of patients) for the two years
following the introduction of the programme. However this change was not sustained, with
no further improvements after 2007, and by 2009-10 the percentage of patients waiting
more than 365 days had risen rapidly again to reach the 2000-01 level.
WAITING TIME POLICIES IN THE HEALTH SECTOR: WHAT WORKS? © OECD 201382

II.4. AUSTRALIA
The federal government Elective Surgery Waiting List Reduction Plan (ESWLRP)
commenced in 2008, so it is difficult to separate the impacts of the state and federal
programmes after 2008. Nevertheless, Figure 4.3 shows that the median wait, the
90th percentile wait and the proportion waiting more than 365 days all rose after 2008. This
suggests that neither programme was effective in reducing waiting times.
In 2008, the NSW Government received a detailed report on the quality of care in NSW
public hospitals (Garling, 2008). The Garling report was highly critical of public hospital
performance in New South Wales. In 2009, the NSW Department of Health released their
response to this report, which contained a number of recommendations (NSW Department of
Health, 2009a), including for an independent audit of the waiting lists for each hospital in New
Figure 4.2. Elective surgery admission and waiting times in New South Wales,2000 to 2010
Source: National Elective Surgery Waiting Times Data Collection, AIHW (2012), www.aihw.gov.au/national-elective-surgery-waiting-times-data/.
1 2 http://dx.doi.org/10.1787/888932753970
Figure 4.3. Distribution of urgency assignment in New South Wales,2004 to 2009
Source: National Elective Surgery Waiting Times Data Collection, AIHW (2012), www.aihw.gov.au/national-elective-surgery-waiting-times-data/.
1 2 http://dx.doi.org/10.1787/888932753989
1.80
1.40
1.60
1.20
0.80
0.40
1.00
0.60
0.20
02000/01 2001/02 2002/03 2003/04 2004/05 2005/06 2006/07 2007/08 2008/09 2009/10
% waited > 365 days (base = 5.2%) Admission per 1 000 population (base = 29.7)Median (base = 28 days) P90 (base = 229 days)
1.50
1.40
1.20
1.30
0.80
0.90
1.00
1.10
0.70
0.602004/05 2005/06 2006/07 2007/08 2008/09
Cat 3 (base = 30%)Cat 1 (base = 41%) Cat 2 (base = 29%)
WAITING TIME POLICIES IN THE HEALTH SECTOR: WHAT WORKS? © OECD 2013 83

II.4. AUSTRALIA
South Wales that would examine all documentation, including correspondence between the
hospital and the referring doctor.The response to this recommendation was to slightly expand
the existing independent audit to include an annual audit of waiting lists at four hospitals in
two Area Health Services per year, and an annual review of waiting list management and
practices in every Area Health Service (each with three to four hospitals). A further
recommendation was that the patient’s referring doctor should be informed in writing
within seven days of any clinical urgency reclassification by the hospital. This
recommendation was accepted.
Policy changes to make urgency assignment and admission scheduling more
systematic could achieve a more equitable allocation of health care resources. However
changes in the assignment of urgency could also be a way to assist in meeting targets.
When there is reporting of the percentage of patients overdue for treatment, there are
incentives to move patients to less urgent categories and to shift long-wait patients into
the “not ready for care” category, since the waiting times of “not ready for care” patients are
not used in the reporting of hospital waiting time.
It is unlikely that the health profile of elective surgery patients in New South Wales
changes dramatically year-to-year or that a larger share of patients present for less urgent
procedures and a smaller share for the most urgent procedures.Yet, Figure 4.3 shows dramatic
changes in the assignment of urgency in New South Wales from 2004-05 (the base year) to
2008-09. In 2004-05, New SouthWales had 41% assigned to urgency category 1 (30 day urgency),
about double the proportion in Victoria, the next largest state in Australia (AIHW, 2006). This
made it difficult to ensure that a high percentage of patients were seen within the
recommended time. By 2008-09, New South Wales had lowered its share of category 1 patients
to 27% and increased its share of category 3 (365 day urgency) patients to 42% (AIHW, 2010b).
These changes appear not to be driven by the NSW Predictable Surgery Programme, which
focused on reducing the percentage of patients waiting more than 365 days. However, this
could reflect a response to other targets, in particular the percentage of all patients waiting
more than the clinically recommended time, which is reported by the state (Commonwealth of
Australia, 2008 and reports in earlier years).
In 2009, the NSW Department of Health revised its waiting time management policy
(NSW Department of Health, 2009b). Admitting specialists were required to complete a
recommendation for admission form (RFA) and meet deadlines for the submission and
approval of the form. The policy required documented clinical evidence to validate any
change to a patient’s assigned clinical priority category. Hospitals were required to actively
manage “not ready for care” patients to ensure that they become “ready for care” or are
removed from the waiting list. Guidelines for equity in the admission process required
consideration of clinical priority, the length of time the patient had waited in comparison
with patients in a similar category, previous delays, pre-admission assessment (e.g. living
alone or having to travel long distances to hospital) and resource availability (e.g. theatre
time, staffing, equipment and hospital capacity). An associated document, “Advice for
Referring and Treating Doctors – Waiting Time & Elective Patient Management”, provided a
list of accepted clinical priority categories for common procedures (e.g. “within 30 days” for
cardiac catheterisation and “within 365 days” for cataract extraction). Prior to these
changes, the assignment of urgency was at the discretion of the referring doctor.
In 2009, the NSW Government also established the Bureau of Health Information, an
independent, board-governed organisation with the goal of “excelling in the delivery of
WAITING TIME POLICIES IN THE HEALTH SECTOR: WHAT WORKS? © OECD 201384

II.4. AUSTRALIA
timely, accurate and comparable information on the performance of the NSW public health
system”.7 The Bureau reports the number of elective surgery procedures by urgency
classification and the percentage of patients treated on time on a quarterly basis. It also
reports quarterly on elective surgery performance at the hospital level. The data is not
reported at higher levels of aggregation, so it is cumbersome to monitor changes over time.
The Bureau also releases annual comparisons of NSW outcomes with those for Australia
overall and for ten other countries. The chapter on access and timeliness focuses on surveys
of patient experiences, but does not benchmark waiting times for elective in-patient
treatment with other countries (Bureau of Health Information, 2011). The most recent policy
development in New South Wales, introduced in 2010, was the online reporting of waiting
time information for various hospitals (overall and for selected procedures).8
ConclusionsAn equilibrium model of the NSW hospital sector shows that the demand for elective
surgeries is highly elastic, and considerably more so than its supply (Stavrunova and
Yerokhin, 2011). This implies that expansionary supply policies that aim to reduce waiting
times for elective surgery in public hospitals tend to be counteracted by relatively large
increases in demand. As patients see shorter waiting times for public treatment, the
probability that they nominate public over private hospital treatment increases.
The NSW experience shows that providers respond to waiting time targets, but that
there is little impact on waiting times overall. Imposing a target to reduce the percentage
of patients waiting more than one year had an effect on this measure while it was in
operation. The effect, however, has been to alter the distribution of waiting times: patients
in the next lower urgency category (90 days) wait longer on average. A similar effect is seen
at the median. Because of the high demand elasticity, it is difficult to use targets or supply
expansion to lower waiting times across the distribution.
An additional level of complexity is introduced by funding incentives. The block
funding of hospitals in New South Wales creates financial incentives to increase the
throughput of private patients treated in public hospitals, both for hospitals and
physicians. This is evident in the higher share of private patients in New South Wales
compared with other states in Australia. Private patients tend to be younger and have
fewer co-morbidities than their public counterparts, yet there is evidence that they are
given priority over clinically comparable public patients (Johar and Savage, 2010). This also
makes it more difficult to develop effective waiting times targets.
The major mechanism used to ensure equity in the allocation of waiting times has
been the assignment of urgency categories. This has not delivered equitable outcomes in
New South Wales, and recent policy initiatives are more prescriptive, limiting provider
discretion.
Elective surgery waiting time policies in Victoria: 1999-2000 to 2010-119
Introduction
The state of Victoria has faced increasing demand in its public hospital systems in the
last ten years due to population growth, the availability of and enthusiasm for new
treatment options, and rising community expectations for health services. There has been
an increase in hospital capacity, and improvements in hospital management, but while the
number of elective surgery procedures has risen substantially, this has not kept pace with
WAITING TIME POLICIES IN THE HEALTH SECTOR: WHAT WORKS? © OECD 2013 85

II.4. AUSTRALIA
the demand from a state population that has grown at an average of almost 2% per annum,
and a capital city whose population has grown by 17% during the decade.The result has been
an increase in waiting times for elective surgery for all but the most urgent of patients.
Figure 4.4 illustrates the growth in elective surgery admissions for the last ten years by
category of patient. In order to allocate patients to the queue more efficiently, they are
Figure 4.4. Elective surgery admissions and waiting lists in Victoria,1999 to 2010
Source: State of Victoria, Department of Health, Victorian Health Services Performance Report.1 2 http://dx.doi.org/10.1787/888932754008
1999-00 2000-01 2001-02 2002-03 2003-04 2004-05 2005-06 2006-07 2007-08 2008-09 2009-10
1999-00 2000-01 2001-02 2002-03 2003-04 2004-05 2005-06 2006-07 2007-08 2008-09 2009-10
1999-00 2000-01 2001-02 2002-03 2003-04 2004-05 2005-06 2006-07 2007-08 2008-09 2009-10
15 15 14 15 17 18 16 17 17 18 17
5653 52 53
59 6063 63 62
7074
21 22 23 2426 27
3032
34
42 42
40
3537
4042 42 41
36 3739 39
26 26 2523 24 23
20 20 19 19 19
Elective surgery admissions in the 12 months to 30 June Number listed at the end of the period
Semi-urgent
Urgent
Non-urgent
WAITING TIME POLICIES IN THE HEALTH SECTOR: WHAT WORKS? © OECD 201386
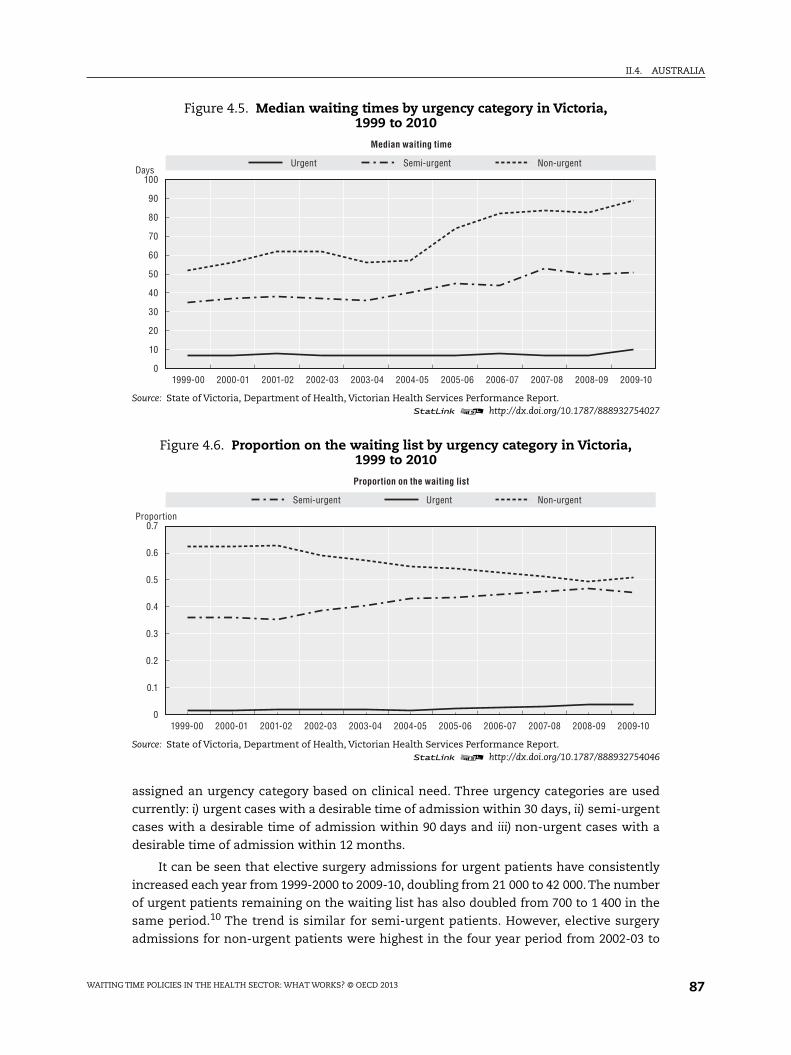
II.4. AUSTRALIA
assigned an urgency category based on clinical need. Three urgency categories are used
currently: i) urgent cases with a desirable time of admission within 30 days, ii) semi-urgent
cases with a desirable time of admission within 90 days and iii) non-urgent cases with a
desirable time of admission within 12 months.
It can be seen that elective surgery admissions for urgent patients have consistently
increased each year from 1999-2000 to 2009-10, doubling from 21 000 to 42 000. The number
of urgent patients remaining on the waiting list has also doubled from 700 to 1 400 in the
same period.10 The trend is similar for semi-urgent patients. However, elective surgery
admissions for non-urgent patients were highest in the four year period from 2002-03 to
Figure 4.5. Median waiting times by urgency category in Victoria,1999 to 2010
Source: State of Victoria, Department of Health, Victorian Health Services Performance Report.1 2 http://dx.doi.org/10.1787/888932754027
Figure 4.6. Proportion on the waiting list by urgency category in Victoria,1999 to 2010
Source: State of Victoria, Department of Health, Victorian Health Services Performance Report.1 2 http://dx.doi.org/10.1787/888932754046
100
90
80
70
60
50
40
30
20
10
01999-00 2000-01 2001-02 2002-03 2003-04 2004-05 2005-06 2006-07 2007-08 2008-09 2009-10
Urgent Semi-urgent Non-urgentDays
Median waiting time
0.7
0.6
0.5
0.4
0.3
0.2
0.1
01999-00 2000-01 2001-02 2002-03 2003-04 2004-05 2005-06 2006-07 2007-08 2008-09 2009-10
UrgentSemi-urgent Non-urgent
Proportion
Proportion on the waiting list
WAITING TIME POLICIES IN THE HEALTH SECTOR: WHAT WORKS? © OECD 2013 87

II.4. AUSTRALIA
2005-06. The number of non-urgent patients listed on the waiting list has decreased
consistently each year over the last decade, from 26 000 in 1999-00 to 19 000 in 2009-10.
There are a number of possible explanations, but the most likely is a so-called “category-
creep” (an increasing trend to categorise patients as semi-urgent (category 2) in preference
to non-urgent (category 3) in Victoria (Russell et al., 2003).
Figure 4.5 shows that the proportion of non-urgent patients has decreased from 62% to
50% over the last ten years, whereas that of semi-urgent patients has increased from 35%
to 45%. Given constraints on capacity, it is likely that semi-urgent patients will compete for
access with less urgent patients, resulting in increased waiting times for less urgent
patients. Indeed, the median time to treat a non-urgent patient on the waiting list
(Figure 4.6) shows a tendency to rise, with an increase from 52 days in 1999-00 to 89 days in
2009-10. Similarly, the median waiting time for semi-urgent patients also tends to rise
(from 35 to 51 days over the decade), most prominently after 2003-04. The median waiting
time for urgent patients has remained constant during the ten-year period (at around
seven days). Although the median waiting times for each urgency category lie within the
desired treatment time, many elective surgery patients wait significantly longer than the
recommended clinical times. For example, in 2007-08, 16% of public patients waited longer
for elective surgery than the recommended time for their urgency category.
The Victorian Government has implemented policies during the last decade to
improve waiting times for elective surgery, to stabilise waiting lists and to enhance the
experience of elective surgery patients. This has been done through a mix of strategies that
involve demand management, increasing hospital capacity to respond to the increased
demand for elective surgery, focussing on specialities with long waiting times
(ophthalmology, orthopaedic and plastic surgery patients), imposing targets on the
number of elective surgery patients treated and their waiting times and developing
prioritisation tools to improve the categorisation of elective surgery patients. In the next
section, we review the main initiatives undertaken by the Victorian Government to manage
elective surgery patients, with a focus on the period from 2000-01 to 2010-11. These
initiatives broadly consisted of supply-side policies, demand-side policies and policies
targeting waiting times (which affect both the demand and supply of elective care).
Review of the main policy initiatives
Supply-side policies
The supply-side policy initiatives undertaken by the Victorian Government can be
divided into three categories: i) increasing the short-term output and productivity of public
hospitals (funding additional elective medical and surgery admissions, efficient
management of waiting lists, and improving day of surgery admission (DOSA) and same
day surgery rates), ii) increasing longer term capacity and iii) improving access and co-
ordination at the state level (centralised co-ordination and increasing choice for patients).
Increase in productivity through funding additional admissions
Since 2001-02, the Victorian Government has periodically injected extra funding to
provide additional elective surgery admissions. Over the last ten years, this funding has
focussed on patients in a specific speciality, rural patients and long-waiting patients in
lower urgency categories. For example, in 2001-02, AUD 30 million was allocated to provide
11 800 additional elective medical and surgery admissions. Similarly in 2004-05,
WAITING TIME POLICIES IN THE HEALTH SECTOR: WHAT WORKS? © OECD 201388
II.4. AUSTRALIA
AUD 5 million was allocated to improve access to elective surgery services and selected
medical services for long-waiting patients in categories 2 and 3. Regional and rural health
services were provided funding to treat additional 1 000 elective surgery patients residing
in rural areas in 2005-06 as part of an extra AUD 30 million investment to shorten waiting
times. This was followed by a further injection of AUD 10 million in 2006-07 to treat an
additional 3 000 elective surgery patients in Victorian hospitals.
One of the major funding initiatives to tackle waiting times and waiting lists was taken
in January 2008 in collaboration with stage 1 of the Commonwealth Government’s Elective
Surgery Waiting List Reduction Plan. This provided a combined total of AUD 60 million one-
off funding to treat 150 758 elective surgery patients. The numbers of these patients
treated increased and their median waiting times decreased immediately after this
funding injection. Between January and June 2008, Victoria’s public hospitals treated
2 414 more long-waiting patients compared with the same period in 2007, and they treated
17 389 more elective surgery patients than in the previous year. From July to
December 2008, the median time to treat non-urgent patients decreased to 76 days from
83 days in the same period in 2007. However for the calendar year 2008-09 as a whole, the
median wait fell by just one day from the previous year. In 2008-09, 69 740 patients were
admitted for semi-urgent elective surgery, an increase of 8 044, or 13%, over the previous
year, while the median waiting time decreased by three days to 50 days. The Victorian
Government further allocated AUD 45 million in years 2009-10 and 2010-11 to treat an
additional 9 000 elective surgery patients each year, but as shown in Figures 4.4 and 4.6, in
spite of the episodic injections of funds for extra activity over the previous ten years, the
median waiting times have continued to increase for category 2 and 3 patients.
It is worth noting that throughout this period hospitals were required to maintain
access to emergency services and meet Key Performance Indicators (KPIs), and for much of
the period bonus funding was contingent on meeting these targets. For elective surgery,
these KPIs were: 100% of urgent patients should be treated within 30 days and 80% of semi-
urgent patients should be treated within 90 days. However, there was no such target for
non-urgent patients until January 2007, after which hospitals were required to treat 90% of
non-urgent patients within 12 months. The target of 80% was not met for semi-urgent
patients in nine of the last eleven years, although, after the introduction of the waiting list
reduction plan in 2008, the percentage of semi-urgent patients treated within the target
time increased to 73% from 70% in the previous year. On the other hand, the target of 90%
for non-urgent patients to be treated within one year was met in all years.11
Thus while the policy of funding extra activity might have reduced waiting lists and
waiting times temporarily, over the last decade there has been no significant improvement
in the numbers on the waiting list at the end of each year or in the average waiting time for
elective surgery in Victoria. It seems that these short-term injections of funds have often
been designed to clear a backlog of patients waiting on lists, but they do not address the
underlying issues of excess demand for elective surgery. Indeed, the very success of these
initiatives in reducing the number of patients on the lists may well have contributed to the
release of additional underlying demand pressures from population growth and
technological change facilitated by clinicians’ propensity to treat and admit patients.
Increase in productivity through the management of waiting lists
The government’s policy initiatives with regard to waiting list management in this
period have focussed on pain management, mobility and therapeutic interventions, as well
WAITING TIME POLICIES IN THE HEALTH SECTOR: WHAT WORKS? © OECD 2013 89

II.4. AUSTRALIA
as on developing prioritisation tools for surgery. One example is the Orthopaedic Waitlist
Project (OWL) (implemented in 2005-06), which developed a comprehensive model of joint
replacement care comprising a management and prioritisation tool that regularly monitors
health status of patients on waiting list. The model also ensures that conservative
treatment options are made available to manage the symptoms of disease while patients
wait for surgery. Patients participating in this management plan are referred to a
comprehensive range of health professionals who, in addition to providing therapeutic,
non-surgical treatment options, provide information regarding priority for surgery. The
median time for semi-urgent and non-urgent patients waiting for a joint replacement at
30 June 2006 was 121 days after the OWL project started – an 11% reduction from 136 at
30 June 2005.
Another policy initiated in Victoria for managing waiting lists involves pooling multiple
hospital waiting lists (for a particular speciality/DRG) into a central list, and then
streamlining the process of treatment. This was applied in 2005 to treat long-waiting
patients with carpal tunnel syndrome and involved co-ordinating numerous surgical units
and pooling elective surgery lists from the general surgery, neurosurgery, plastics,
orthopaedics and vascular lists into a central list. Over a period of six weeks, patients were
treated in dedicated theatre sessions using disposable instruments, which increased
turnaround time. As a result, 120 carpal tunnel syndrome patients received treatment. This
approach has now been incorporated into an ongoing management arrangement to improve
waiting times for this surgery, with one dedicated theatre session every eight weeks.
Long-waiting list patients on the waiting list are also managed by referral to
designated elective surgery centres. This model of care was applied to septoplasty patients
in 2005, after which the median time for semi-urgent and non-urgent patients waiting for
a septoplasty fell to 190 days – a 23% reduction from 248 days at 30 June 2004.
These efforts to manage waiting lists have targeted patients from specific specialties,
and waiting times have declined following implementation of these policies.
Increase in capacity
The Victorian Government initiated the Elective Surgery Access Service (ESAS) in 2002.
The service employs co-ordinators to offer semi-urgent and non-urgent patients, who have
not had their elective surgery within the clinically desirable time, the opportunity to
transfer to one of four new dedicated elective surgery centres hospitals where they can be
treated sooner (around 1 000 patients per annum). These centres have significantly
improved access to elective surgery for long-waiting patients. The government also
increased capacity for specific specialities like cataract surgery by funding a regional eye
service in 2002. The median waiting time for cataract patients fell following this increase
in capacity to 13 days in 2003-04 – a 78% reduction from 58 days in 1999-2000.
In 2009, the government allocated money for capital works to redevelop elective
surgical facilities as part of stage 2 of the Commonwealth ESWLRP. Over AUD 20 million
was allocated to redevelop elective surgery facilities at five major metropolitan hospitals.
In addition, AUD 10.6 million was allocated to purchase surgical equipment and
AUD 6 million to develop innovative solutions to manage elective surgery. The government
also funded new surgical facilities in 2010. Two new orthopaedic theatres were built at St
Vincent’s Hospital to provide treatment to more patients requiring joint replacement
surgery. Similarly, new theatres were built in Frankston Hospital, and the main theatres,
WAITING TIME POLICIES IN THE HEALTH SECTOR: WHAT WORKS? © OECD 201390
II.4. AUSTRALIA
day surgery unit and endoscopy services were integrated into a single operating theatre
complex. The impact of this increased capacity on waiting list and waiting times is not
yet known.
The Victorian Government took several initiatives concerning the recruitment and
retention of the medical workforce. As a result of these initiatives, at 30 June 2010 there
were 7 742 doctors employed on a full-time equivalent (FTE) basis in Victorian public
hospitals, an increase of 85% over the last 11 years. Similarly, the number of nurses
increased by 52% over the last 11 years to 32 628 FTE in June 2010. In 2008-09, the
government undertook a surgical workforce initiative that consists of a range of projects
intended to increase the availability of certain surgical procedures, improve the experience
of patients undergoing surgery and augment the surgical workforce. The projects funded
include nurse cystoscopy, nurse-led pre-admission, allied health-enhanced specialist
clinics, peri-operative division nursing roles and post-graduate nurse scholarships. Spare
capacity for elective surgery is also being generated by implementing programmes to
standardise practices across units so as to increase efficiency in the delivery of care and
enhance a team approach to discharge planning through fast-track initiatives. One such
programme, which focuses on falls by the elderly, has shown a 30% reduction in average
length of stay for patients with a fractured neck of femur. This equates to a potential
annual savings of 4 356 bed days. This programme also led to an increase in the time
nurses spend on bedside clinical care from 33% to 53%.
In addition to increasing capacity in the public sector, the government also started a
trial (in 2005-06) involving the limited purchasing of private sector elective surgery for
public patients. Since then a small proportion of long-waiting elective surgery patients are
being treated each year in private hospitals contracted by the government.
Increase in productivity through reforms in day surgery
One of the key features of the Elective Surgery Access Service (ESAS) adopted in
2002-03 was efficient management of patient episodes of care through improving day-of-
surgery admission and same-day surgery rates. This was done to encourage hospitals to
treat more multi-day patients as same-day patients, where opportunities exist to do so
without compromising the quality of care. Such a policy has the potential to improve bed
utilisation and access to in-patient treatment. Same-day surgery targets were set for an
overall “basket” of procedures that were characterised by wide variation in same-day rates
across the sector but had significant levels of same-day throughput at the majority of
hospitals. These targets were reviewed every six months to accommodate some variation
in the mix of patients. The same-day targets for 2002-03 were set at 85% or 95% of
procedures, depending on the speciality. The day surgery policies were revised over the
years, and one of the major initiatives to improve day surgery was the establishment of
elective surgery 23-hour units (at five major hospitals in 2007) to provide surgery in an
efficient, streamlined manner that requires patients spend minimal time in hospital. A 23-
hour service model is a model of care for elective surgery patients who require no more
than one overnight stay. The model is not an alternative or substitute for day surgery, but
an extension of services for patients unsuitable for day surgery. The aim of these units is to
provide safe and effective patient care by experienced clinicians skilled in managing short-
stay patients for more complex day surgery procedures. In these units, patients can be
monitored post-operatively and discharged within 23 hours. The model aims at the
following service improvements: improved operating theatre utilisation, reduced waiting
WAITING TIME POLICIES IN THE HEALTH SECTOR: WHAT WORKS? © OECD 2013 91

II.4. AUSTRALIA
lists, predictable access to operating theatre sessions and post-operative beds, reduced
length of stay, fewer hospital-initiated postponements and fewer unplanned overnight
stays. This model is applied on a “basket” of procedures, which includes the procedures
contained in the day surgery basket, but also other procedures suitable for 23-hour surgery.
The basket includes 78 procedures defined by diagnosis-related group (DRG) codes that
have been selected using the following criteria: the procedure was performed at least
200 times throughout Victoria in 2005-06, and more than half of the selected procedures
were performed with lengths of stay less than 48 hours.
These reforms, combined with new medical technologies, such as improved
anaesthetic procedures and laparoscopic surgery, have probably been important in leading
to an increase in the proportion of patients admitted for same-day treatment in public
hospitals from 48% in 1999-2000 to 55% in 2009-10. The average length of stay for non-same
day patients has also decreased from 6.3 days to 5.9 days during this period.
Increasing access and choice for patients
In Victoria, elective surgery patients make a choice of hospital in consultation with
their GPs and specialists. In 2005, the government started publishing a six-monthly report
on hospital performance (entitled “Your Hospital”12) to provide detailed information about
the functioning of hospitals. Initially these reports contained very broad measures of
elective surgery performance, such as the percentage of patients treated within the target
time for each hospital. Since March 2011, they contain more detailed measures, like the
median time to treatment and the number of elective surgery patients on the waiting list
for each hospital. However, there is limited information by speciality on each hospital, and
only one measure – elective surgery patients waiting longer than 365 days by specialty (per
cent) – is reported for all hospitals combined. In 2009-10, the government published a
supplementary report on elective surgery, where the median waiting time and the
percentage of patients who waited over 365 days were reported for each procedure and
speciality in each hospital, along with the corresponding figures for the whole
of Australia.13
Under the ESAS initiative, the coordinators contact long-waiting patients to offer them
quicker treatment in four designated public hospitals, but this policy provides limited
choice to patients, as it narrowly targets long-waiting patients in specific specialities.
Demand-side policies
Incentives for Private Health Insurance (PHI). In January 1999, the Australian Government
introduced a rebate for private health insurance premiums (at least 30%) to encourage the
take-up of private health insurance. Subsequently, a lifetime health cover loading on top of
the premium was introduced for individuals who do not take up insurance by the age of 31.
The government also imposes a surcharge on individuals who have not taken out private
insurance and who earn above a certain income threshold. These measures were adopted
to take pressure off the public system by encouraging patients to be treated in the private
sector. The proportion of Victorians with private health insurance hospital cover increased
from 29.8% in June 1999 to 44.9% in June 2001 as a result of these reforms, before falling
back in June 2004 to 42.2%, where it has remained. It was expected that, by encouraging the
substitution of treatment in public hospitals by treatment in private hospitals, the
insurance reforms might reduce waiting times in public hospitals. However, as we have
seen, there has not been a reduction in waiting times associated with the take-up of
WAITING TIME POLICIES IN THE HEALTH SECTOR: WHAT WORKS? © OECD 201392

II.4. AUSTRALIA
private insurance in Victoria. Three possible reasons have been given for this: i) privately
insured people continue to use public hospitals, either as public patients or as private
patients, because of high uncompensated out-of-pocket costs in private hospitals; ii) public
hospitals provide some highly complex services that are not available in private hospitals
and iii) hospital specialists work in both public and private hospitals and are in limited
supply. Due to this workforce constraint, if more people are treated in private hospitals, the
time some patients wait in public hospitals could even increase. However, there is no
evidence of any significant effect of PHI incentives on elective surgery waiting times in
Victoria or Australia as a whole.
Development of prioritisation tools. An efficient demand management of elective
surgery patients requires explicit guidelines to prioritise patients on the waiting list.
Currently, patients are assigned one of the three categories (urgent, semi-urgent or non-
urgent). However, it has been recommended that more sophisticated prioritisation tools be
applied, as there is a significant variation among patients within these urgency categories
and some evidence that patients are re-categorised. For example, in the period July-
September 2008, waiting times for category 2 (semi-urgent) hip replacements and
prostatectomy ranged from 15 to 315 days and 15 to 336 days, respectively (Curtis et al.,
2010). In 2008, the government established the OWL project for joint surgery, which
developed a Multi-Attribute Prioritisation Tool (MAPT) through a process involving concept
mapping, review and validation with orthopaedic surgeons and patients. It has been built
into the Victorian Osteoarthritis Hip and Knee Service, a service model for management of
patients requiring joint replacement that has been piloted at several Victorian hospitals,
but at this stage the suggestion that a standardised validated prioritisation tool be used
across different surgical procedures has not been implemented (Curtis et al., 2010).
Policies aimed directly on waiting times
Waiting time targets and financial incentives. In 1993, the Victoria Government introduced
diagnosis-related groups (DRGs) as part of the system for paying public hospitals and linked
this to specific requirements on treating patients on waiting lists. The government offered
direct sizable financial incentives (both performance bonuses and penalties) for individual
hospitals reporting any long-waiting, urgent-surgery patients. So, for example, metropolitan
hospitals were eligible in 2001/02 for bonus funds from a pool of AUD 30.8 million (out of a
AUD 1.1 billion operating budget) if they met (among other targets for health service quality)
annual negotiated targets for the number of patients on elective surgery waiting lists, for the
monthly proportion of category 1 elective surgical patients admitted within 30 days, and for
the quarterly proportion of category 2 elective surgical patients waiting more than 90 days.
In 2008, the Victorian Auditor-General conducted an audit for the first six months of
2007 and concluded that, “Hospitals inconsistently interpreted reporting rules, data capture
methods were susceptible to error, and the accuracy of some data was impossible to check,
meaning incorrect data may not be detected. In one hospital, data manipulation had
occurred.”14 Although it is not clear that hospitals gained from any manipulation to reduce
reported waiting times, it was suspected that some may have re-categorised or removed
patients from the list strategically, and so in response to this kind of evidence, the bonus
funding pool was abolished in March 2009 and funds were reallocated to health services.
Although direct financial incentives to meet targets were removed, the total funding was
WAITING TIME POLICIES IN THE HEALTH SECTOR: WHAT WORKS? © OECD 2013 93

II.4. AUSTRALIA
more than replaced by money from the Commonwealth Government Elective Surgery
Waiting List Reduction Plan.
It is possible that, although these financial incentives, while operative, led to better
management of waiting lists in hospitals and a reduction in waiting times for elective
surgery, the lack of either objective prioritisation tools for clinicians (beyond the example
of joint surgery discussed above) or benchmark waiting times for specific procedures has
limited their impacts. While there has been a subsequent tightening of the government’s
audit controls on hospital waiting lists, considerable variation across hospitals within
urgency categories remains, reflecting both differences in capacity and management. In
addition, if the purpose of these financial incentives was to reduce waiting times,
particularly for urgent and semi-urgent patients, there is little evidence in terms of median
waiting time that this was successful. That said, waiting list policies appear to have helped
to slightly reduce the numbers on the list at the end of each year over the whole period, in
spite of the substantial increase in elective surgery admissions.
ConclusionsPolicies targeting waiting times In Victoria have met with varied success. Supply-side
policies to increase productivity through funding additional admissions have not decreased
waiting times significantly in the long run. This might be because of the dynamic nature of
the waiting lists, which are also affected by the additional demand induced by additional
capacity. On the other hand, policies aimed at increasing productivity by managing the
waiting lists for patients in specific specialities (especially the OWL project) have reduced
waiting list numbers and waiting times and improved the patient experience. Similarly,
reforms in day surgery combined with technological change have improved day surgery
rates. On the other hand, demand-side policies such as incentives to substitute private care
for public care have not significantly affected waiting times in Victoria, and there is
insufficient evidence that waiting times have improved due to making information on
waiting times publicly available or greater centralised coordination.
Policy on waiting times in Victoria in the last ten years has focused on trying to contain
the average time patients wait for elective surgery, substantially increasing the number of
patients who move through the system, and periodically removing those who have been
waiting for an excessive time. It has done this by using a range of instruments, including
target-setting and financial incentives to meet performance indicators. This effort has
been more or less successful. Patient numbers admitted from the waiting lists have grown
at an average of 2% per annum over the ten years, while the waiting time for urgent cases
has remained constant for much of the period and for semi-urgent cases increased by
14 days (3.3% per annum). The increase in patient numbers is partly the consequence of
the maintenance of comparatively low waiting times for urgent and semi-urgent cases at a
time of increasing patient demand due to rapid population growth and technological
change that offers more accessible surgery to a wider population of patients.
Data on waiting times is always subject to some measurement error, but the processes
in place in Victoria to monitor and audit waiting times have been comparatively rigourous,
particularly in recent years, and we see no reason to doubt the trends shown in the
reported data. The clearest trend is the reduction in the proportion of patients who wait
more than a year for surgery. Continuous targets and funding incentives combined with
WAITING TIME POLICIES IN THE HEALTH SECTOR: WHAT WORKS? © OECD 201394

II.4. AUSTRALIA
periodic bursts of spending initiatives to clear long waiting times have reduced the
proportion waiting more than a year from 4% to 2%.
There has not been a strong emphasis on productivity improvement (prioritisation tools
or benchmark setting), and it may be that in spite of government financial incentives for
hospitals to reduce the waiting time among urgent and semi-urgent patients, there may well
have been a contrasting set of priorities from doctors to get their patients through the system
by classifying them into a more urgent category. However, given the increase in demand and
throughput in the period, compared to other states in Australia and international
benchmarks, the public hospital system and government policy in Victoria appears to have
performed well on elective surgery waiting times and better on all indicators than the
average for all Australian states. The contrast is particularly marked considering that the
increase in the auditing and monitoring of the waiting lists in later periods might have
inflated the data on waiting times, but also in light of the comparatively rapid growth in the
population and in hospital admissions in the last ten years.
Notes
1. The Australian Health Care Agreement for 2003-08 can be found at www.health.gov.au/internet/main/publishing.nsf/content/B02C99D554742175CA256F18004FC7A6/$File/New%20South%20%20Wales.pdf.
2. For patients who changed clinical urgency category, three methods were used: a) counting the timewaited in the most recent urgency category plus any time waited in more urgent categories,e.g. time waited in category 2, plus time spent previously in category 1 (this is the agreed nationalstandard for counting); b) counting the time waited in all urgency categories; c) counting the timewaited in the most recent urgency category only. For those transferring, the time waited on thefirst list is not generally included in the waiting time reported to the National Elective SurgeryWaiting Times Data Collection. Therefore, the number of days waited reflects the waiting time onthe list managed by the reporting hospital only. This would have the effect of shortening thereported waiting time compared with the time actually waited for these patients. For details bystate see Appendix 1 in AIHW (2011a).
3. www.health.gov.au/internet/main/publishing.nsf/content/elective-surgery.
4. New South Wales and Victoria account for 58% of total elective surgery admissions.
5. This section has been written by Meliyanni Johar, Glenn Jones and Elizabeth Savage, BusinessSchool, University of Technology Sydney (UTS).
6. www.yourhealth.gov.au/internet/yourhealth/publishing.nsf/Content/Expert-Panel-Supplementary-Annexure~section4~4-6.
7. www.bhi.nsw.gov.au/home.
8. www.health.nsw.gov.au/hospitals/search.asp.
9. This section has been written by Anurag Sharma and Anthony Harris, Centre for HealthEconomics, Monash University.
10. Waiting lists are managed by each health service by speciality. Waiting time is the days from whena patient is placed on the hospital’s elective surgery list to the day they are admitted for treatment.It does not include the time taken between a referral by a GP and the medical assessment by aspecialist or public hospital out-patient department. Elective surgery specialities includecardiothoracic surgery, ear nose and throat, ophthalmology, general surgery, gynaecology,neurosurgery, orthopaedics, plastic surgery, urology and vascular surgery.
11. State of Victoria, Department of Health, Victorian Health Services Performance Report http://docs.hea l th .v i c .gov.au/docs/doc/E8F38E2063AD858ECA25796E00065F0D/$FILE/Sep%202011%20Quarter%20Report_FINAL.pdf accessed 18th April 2012.
12. www.health.vic.gov.au/performance/downloads.htm, accessed January 2012.
13. www.health.vic.gov.au/performance/downloads/elective-surgery-supplementary-report-2009-10.pdf,accessed January 2012.
WAITING TIME POLICIES IN THE HEALTH SECTOR: WHAT WORKS? © OECD 2013 95

II.4. AUSTRALIA
14. Victorian Auditor-General’s Office. Access to public hospitals: measuring performance. Melbourne:VAGO, 2009. (PP No. 180, Session 2006–09, available at www.audit.vic.gov.au/reports__publications/reports_by_year/2009/20090401_hospital_indicators.aspx, accessed Jan 2012.
References
AIHW – Australian Institute of Health and Welfare (2000), “Australia’s Health Services Expenditure to1998-99”, Health Expenditure Bulletin, No. 16, Cat. No. HWE 15, AIHW, Canberra.
AIHW – Australian Institute of Health and Welfare (2006), The State of Our Public Hospitals,June 2006 report, AIHW, Canberra.
AIHW – Australian Institute of Health and Welfare (2007), Australian Hospital Statistics 2005-06, AIHW,Canberra.
AIHW – Australian Institute of Health and Welfare (2010a), Australia’s Health 2010, AIHW, Canberra.
AIHW – Australian Institute of Health and Welfare (2010b), The State of Our Public Hospitals, June 2010report, AIHW, Canberra.
AIHW – Australian Institute of Health and Welfare (2011a), Australian Hospital Statistics 2009-10, AIHW,Canberra.
AIHW – Australian Institute of Health and Welfare (2011b), “Australian Hospital Statistics 2010-11:Emergency Department Care and Elective Surgery Waiting Yimes”, Health Services Series, No. 41,Cat. No. HSE 115, AIHW, Canberra.
AIHW – Australian Institute of Health and Welfare (2011c), “Health Expenditure Australia 2009-10”,Health and Welfare Expenditure Series, No. 46, Cat. No. HWE 55, AIHW, Canberra.
Bureau of Health Information (2011), Healthcare in Focus 2011: How Well Does NSW Perform? Aninternational comparison November 2011. Bureau of Health Information, Sydney.
COAG – Council of Australian Governments (2010), “National Health and Hospital NetworkAgreement”, available at www.coag.gov.au/node/86#A National Health and Hospitals Network.
COAG – Council of Australian Government (2011), “The National Health Reform Agreement – NationalPartnership Agreement on Improving Public Hospital Services”, available at www.coag.gov.au/docs/nap_improving_public_hospital_services.pdf.
Commonweath Fund (2011), “International Profiles of Health Care Systems 2011”, The Australian HealthCare System 2011, The Commonwealth Fund , New York.
Commonwealth of Australia (2008), The State of Our Public Hospitals, June 2008 Report.
Commonwealth of Australia (2010), “Elective Surgery Waiting List Reduction Plan – June Quarter 2010”,Australian Department of Health and Ageing, available at www.health.gov.au/internet/main/pub l i sh ing.ns f /Content /0043B6C3D3389F4CCA257455001D661A/$Fi l e /JUNE%202010%20YTD%20ESWLRP%20Quarterly%20Report.pdf.
Commonwealth of Australia (2011), “Expert Panel: Review of Elective Surgery and Emergency AccessTargets under the National Partnership Agreement on Improving Public Hospital Services:Supplementary Annexure”, Report to the Council of Australian Governments.
Curtis, A.J., C.O.H. Russell, J.U. Stoelwinder and J.J. McNeil (2010), “Waiting Lists and Elective Surgery:Ordering the Queue”, Medical Journal of Australia, Vol. 192, No. 4, pp. 217-220.
Fiebig, D.G., E.J. Savage and R.C. Viney (2006), “Does the Reason for Buying Health Insurance InfluenceBehaviour?”, CHERE Working Paper No. 2006/1, UTS, Center for Health Economics Research andEvaluation (CHERE), University of Technology Sydney, Australia.
Garling, P. (2008), “Final Report of the Special Commission of Inquiry: Acute Care Services in NSWPublic Hospitals”, State of NSW through the Special Commission of Inquiry: Acute Care Services inNew South Wales Public Hospitals.
Healy, J., E. Sharman and B. Lokuge (2006), “Australia: Health System Review”, Health Systems inTransition, Vol. 8, No. 5, pp. 1-158.
Johar, M. and E. Savage (2010), “Do Private Patients Have Shorter Waiting Times for Elective Surgery?Evidence from New South Wales Public Hospitals”, Economic Papers, Vol. 29, No. 2, pp. 128-142.
WAITING TIME POLICIES IN THE HEALTH SECTOR: WHAT WORKS? © OECD 201396

II.4. AUSTRALIA
Johar, M., G. Jones, M. Keane, E. Savage and O. Stavrunova (2010), “The Demand for Private HealthInsurance: Do Waiting Lists or Waiting Times Matter?”, CHERE Working Paper No. 2010/8, Center forHealth Economics Research and Evaluation (CHERE), University of Technology Sydney, Australia.
Johar, M., G. Jones, M. Keane, E. Savage and O. Stavrunova (2011), “Waiting Times for Elective Surgeryand the Decision to Buy Private Health Insurance”, Health Economics, Vol. 20, No. S1, pp. 68-86.
Johar, M., G. Jones and E. Savage (2012a), “Emergency Admissions and Elective Surgery Waiting Times”,Health Economics, forthcoming.
Johar, M., G. Jones, M. Keane, E. Savage and O. Stavrunova (2012b), “Discrimination in a UniversalHealth Care System: Explaining Socioeconomic Waiting Time Gaps”, Journal of Health Economics,forthcoming.
Johar, M., G. Jones, M. Keane, E. Savage and O. Stavrunova (2012c), “Geographic Differences in HospitalWaiting Times”, Economic Record, Vol. 88, No. 281, pp. 165-181.
Lu, M. and E.J. Savage (2006), “Do Financial Incentives for Supplementary Private Health InsuranceReduce Pressure on the Public System? Evidence from Australia”, CHERE Working Paper No. 2006/11,UTS, Center for Health Economics Research and Evaluation (CHERE), University of TechnologySydney, Australia.
NSW Department of Health (2003), NSW Health System Performance Indicators, Sydney.
NSW Department of Health (2006), Advice for Referring & Treating Doctors – Managing Elective Patients/Waiting Lists, Sydney.
NSW Department of Health (2009a), Caring Together: The Health Action Plan for NSW, Sydney.
NSW Department of Health (2009b), Waiting Time and Elective Patient Management Policy, Sydney,available at www.health.nsw.gov.au/policies/pd/2009/pdf/PD2009_018.pdf.
OECD (2012), OECD Health Data 2012, OECD Publishing, Paris, http://dx.doi.org/10.1787/health-data-en.
Private Health Insurance Administration Council (2011), The Operations of Private Health Insurers AnnualReport 2010-11, PHIAC, Canberra.
Russell, C., M. Roberts, T.G. Williamson, J. McKercher, S.E. Jolly and J. McNeil (2003), “ClinicalCategorization for Elective Surgery in Victoria”, ANZ Journal of Surgery, Vol. 73, pp. 839-842.
State of Victoria, Department of Health, Victorian Health Services Performance Report http://docs.hea l th .v i c .gov.au/docs/doc/E8F38E2063AD858ECA25796E00065F0D/$FILE/Sep%202011%20Quarter%20Report_FINAL.pdf accessed 18th April 2012.
Stavrunova, O. and O. Yerokhin (2011), “Equilibrium Model of Waiting Times for Elective Surgery inNSW Public Hospitals”, Economic Record, Vol. 87, No. 278, pp. 384-398.
Victorian Public Health Services Performance and Accountability Framework Business Rules 2007-08,Victorian Department of Human Services.
WAITING TIME POLICIES IN THE HEALTH SECTOR: WHAT WORKS? © OECD 2013 97


Waiting Time Policies in the Health Sector
What Works?
© OECD 2013
PART II
Chapter 5
Canada
by
John J. McGurran,
Dalla Lana School of Public Health, University of Toronto
This chapter outlines the main characteristics of the Canadian health care deliverysystem, traces the development of unacceptably long patient waiting times for careand examines public concern about the viability of Canadian Medicare. Whileindividual jurisdictions addressed the problem of waiting times with limitedsuccess, federal provincial and territorial leaders collaborated in the development ofa pan-Canadian approach to reduce waiting times in the context of the 200410-Year Plan to Strengthen Health Care. Reductions in waiting times are presentedas are the results of statutory parliamentary reviews of progress.
99

II.5. CANADA
IntroductionA long wait for medically necessary health care can be stressful for the patient and
family and may result in a poor health outcome when the required service is provided
(Derrett, 1999; Mahon, 2002; Sanmartin, 2004). Unacceptably long wait times contribute to
public concern in Canada about the viability of the single-tier publicly funded health care
delivery system. In acknowledgement of the problem of unacceptably long waits for non-
urgent or scheduled health care, Canada and other OECD countries (OECD, 2011) have
introduced strategies to reduce and better manage patient waiting times.
In 2004, Canada’s federal, provincial and territorial governments1 made a
commitment to reduce patient waiting time in a number of priority clinical areas in accord
with their commitments in the 10-Year Plan to Strengthen Health Care.
This chapter will illustrate the circumstances leading up to the first pan-Canadian
health policy initiative to reduce waiting times and improve access to health care.
Examples will be provided to illustrate how this policy has been introduced at the
provincial level (British Columbia) and in the setting of a regional health authority
(Alberta), and with what results. The focus is on the priority areas (cancer, heart, diagnostic
imaging, joint replacement and sight restoration) described in the 10-Year Plan.
Main characteristics of the Canadian health systemStructurally, Canada is a federation with two levels of government that share power to
legislate and govern. The federal level governs with respect to the country as a whole, while
the 13 provincial and territorial governments do so in accord with their unique needs. Put
another way, federal power promotes unity of purpose while the provincial and territorial
power allows for the expression of diversity consistent with that purpose (Privy Council
of Canada, 2012). This sharing of responsibilities is a key feature of Canada’s national
health policy.
Passed into law in 1984, the Canada Health Act (the Act) forms the cornerstone of the
modern Canadian health care system (Canada Department of Justice, 2012). It lays out
five key principles that provincial and territorial governments must meet if they are to
receive their full share of federal funds through the Canada Health Transfer. Publicly
funded health care must be comprehensive, universally available, portable, accessible and
publicly administered.2 Unacceptably long waits for care (a scheduled surgery, a family
doctor appointment, an emergency department visit or mental health service
appointment) challenge the “accessibility” principle of the Act and put pressure on both
orders of government to make improvements.
The provinces3 administer, deliver and pay for health care services, a significant
component of which is hospital and medical care. The federal level addresses national
principles for the health care system, including those stated in the Act. Through the
Canada Health Transfer federal dollars flow to the provinces to pay for health care delivery,
subject to the terms of the Act. There is a certain tension between the federal level, which
WAITING TIME POLICIES IN THE HEALTH SECTOR: WHAT WORKS? © OECD 2013100

II.5. CANADA
wields significant fiscal power, and the provinces, which require federal funding to pay for
the insured hospital and medical care provided for their residents.
Hospitals
Out of 694 hospitals in 2009, 423 were publicly owned, 266 privately owned and
not-for-profit while only five hospitals were private for-profit (OECD, 2012). Ownership
usually resides with community-based not-for-profit corporations, religious organisations
or (rarely) with municipal governments or universities. However, the vast majority of
hospital revenues come from a single payer (the provincial department of health).
Spending on hospitals accounted for 30.2% of total current expenditures on health care in
2010 (OECD, 2012). Patients in most cases can select the physician or the clinic of their
choice (Health Canada, 2002). The for-profit hospital sector comprises mostly long-term
care facilities or specialised services such as addiction centres.
Hospital remuneration
Provincial governments use a variety of approaches to finance hospitals. Moreover,
the provinces do not use a single method to distribute funds to their hospitals. Most
rely on a primary funding approach to allocate the majority of funds and a number
of secondary methods to apportion lesser amounts (McKillop et al., 2001). Activity-
based funding for hospitals has been increasingly introduced in several provinces
(Commonwealth Fund, 2011).
In 2008/09, two jurisdictions (Alberta and Saskatchewan) used as their primary funding
approach a “population-based method” (which uses demographic or other characteristics of
the population such as age, gender, socio-economic status and mortality to determine the
relative propensity of different population groups to seek health services). Two jurisdictions
(Ontario and Quebec) used a global budget method (which adjusts the expenditure of the
previous year as a basis for the upcoming period). British Columbia and New Brunswick used
a “line-by-line” method (which derives a proposed funding level for each line item, such as
for in-patient nursing services, medical/surgical supplies, housekeeping, etc., or for each
programme or department, such as a family birthing unit; emergency care; cardiac care).
Four jurisdictions (Manitoba, Prince Edward Island, Nova Scotia and Newfoundland and
Labrador) used a “ministerial discretion method” (where the decision is made by the Minister
of Health, after the hospital-specific request to fund an event not recognised by the usual
funding approach, for example, to cover a significant deficit). Approximately half of the
jurisdictions also use secondary funding methods to determine some portion of operating
funds (Canadian Health Services Research Foundation, 2009).
Specialist remuneration
Most doctors are private practitioners who work in independent or group practices
and enjoy a high degree of autonomy. The estimated income of a self-employed specialist
was 4.62 times the average Canadian wage in 2009 (OECD, 2012). Some doctors work in
community health centres, in hospital-based group practices or in affiliation with hospital
out-patient departments. Private practitioners are generally paid on a fee-for-service basis
and submit their service claims directly to the provincial health insurance plan for
payment. Physicians in other practice settings may also be paid on a fee-for-service basis,
but are more likely to be salaried or remunerated through an alternative payment scheme.
Compensation for physician services is negotiated between the provinces and the
WAITING TIME POLICIES IN THE HEALTH SECTOR: WHAT WORKS? © OECD 2013 101

II.5. CANADA
provincial medical associations based on fee and utilisation increases, subject to various
forms of individual physician or global ceilings. Salaries for nurses are generally negotiated
through collective bargaining between the unions and governments. However, other forms
of payment (i.e. pay-for-performance, salary, capitation) have become more common in
recent years, accounting for 24% of “total clinical payments to physicians” in 2007/08
(Commonwealth Fund, 2011).
Co-payments
There are no deductibles or co-payments on coverage for publicly insured services.
Surgical activity
The growth rates for knee replacement, 96.8%, and for hip replacement, 56.1%, were
the highest of all the surgical procedures by ICD-9-CM (per 100 000 population) conducted
on an in-patient basis between 2000 and 2009. On the other hand, procedures for
tonsillectomy with or without adenoidectomy experienced the largest decrease, both on an
in-patient (-44%) and day-case basis (-20.9%). A number of procedures have experienced a
shift from in-patient to day-case surgery.
Private health insurance
Approximately two out of three Canadians have supplementary private insurance
coverage (Commonwealth Fund, 2011). Individuals and families may acquire private
insurance, or benefit from an employment-based group insurance plan, to offset some
Table 5.1. Procedures per 100 000 population (in-patient and day cases),Canada, 2000 and 2009
Surgical procedures by ICD-9-CM 2000 2009% change
in proceduresbetween 2000 and 2009
Cataract surgery:
In-patient 13.2 4 -69.60
Day-case 731.8 1 048.3 43.20
Tonsillectomy with or without adenoidectomy:
In-patient 44.4 24.5 -44.80
Day-case 106 75.7 -28.50
Percutaneous coronary interventions (PTCA and stenting): in-patient 108.7 130.2 19.70
Coronary bypass: in-patient 76.5 60.5 -20.90
Appendectomy: in-patient 104.1 101.1 -2.80
Cholecystectomy:
In-patient 152.7 82.8 -45.70
Day-case 96.5 125.4 29.90
Laparoscopic cholecystectomy:
In-patient 121.4 69.6 -42.60
Day-case 95.4 122.6 28.50
Inguinal and femoral hernia:
In-patient 75.1 51.7 -31.10
Day-case 139.4 145 4
Hip replacement: in-patient 79.1 123.5 56.10
Knee replacement: in-patient 73.2 144.1 96.80
Source: OECD (2012), OECD Health Data 2012, OECD Publishing, Paris, http://dx.doi.org/10.1787/health-data-en.1 2 http://dx.doi.org/10.1787/888932754825
WAITING TIME POLICIES IN THE HEALTH SECTOR: WHAT WORKS? © OECD 2013102

II.5. CANADA
portion of the expenses of supplementary health services. Although the provinces provide
some additional benefits to basic coverage, supplementary health services are mainly
privately financed, and Canadians must pay privately for these non-insured health
benefits. The individual’s out-of-pocket expenses may depend on the income or the ability
to pay. Under most provincial laws, private insurers are prohibited from offering coverage
which duplicates that of the governmental programmes, but they can compete in the
supplementary benefits market. Whilst approximately 80% of health and life insurance
companies selling private insurance are for-profit, the remaining 20% are not-for-profit
insurance organisations (Commonwealth Fund, 2011).
Health expenditure
In 2010, total health expenditure in Canada accounted for 11.4% of GDP, almost
2 percentage points higher than the OECD average of 9.5%. 71.1% of the expenditure was
public, while the remainder was composed of private supplementary insurance, employer-
sponsored benefits or out-of-pocket payments. Canada also ranks above the OECD average
in terms of health spending per capita, with spending of USD 4 445 in 2010 (adjusted for
purchasing power parity), compared with an OECD average of USD 3 268. This reflected a
rise from USD 2 519 in 2000. The share of public and private expenditure over the same
period has remained stable, public expenditure accounting for around 70.5% and private
29.5% respectively (OECD, 2012).
Primary care
Patients are not obliged to be registered with a primary care doctor in order to access
health services. Nevertheless, family physicians provide the majority of primary care
services (Commonwealth Fund, 2011; Marchildon, 2005), and there were 1.12 GPs per
1 000 population in Canada in 2012 (OECD, 2012). They are usually the initial contact with
the formal health care system and control access to most specialists, hospital admissions,
diagnostic testing and prescription drug therapy. In terms of remuneration of GPs, the
income of self-employed GPs was 3.01 (estimate) times the average wage (OECD, 2012).
Practising physicians
In the last ten years the number of professionally active physicians has slightly
increased from 2.1 (per 1 000 population) in 2000 to 2.37 in 2010, which is however well
below the OECD average of 3.1 (OECD, 2012). Thus, despite the relatively high level of health
expenditure in Canada, there are fewer physicians per capita than in most other OECD
countries.
Ageing and life expectancy
In 2008 (latest year available), life expectancy at birth in Canada stood at 80.8 years,
one year higher than the OECD average (79.8 years in 2010) and more than two years above
the United States (78.7 years in 2010). It has increased slightly within the past decade, from
79 years in 2000. The proportion of the population aged 65 and over has increased from
12.6% in 2000 to 14.4% in 2011 (OECD, 2012).
The need for reduced waiting time and better managementBy the 1990s, the provision of health care presented serious financial and policy
challenges to both orders of government. The Canadian population was aging and public
WAITING TIME POLICIES IN THE HEALTH SECTOR: WHAT WORKS? © OECD 2013 103

II.5. CANADA
expectations of the health care system were growing. There was, for example, increasing
demand for advanced technologies such as MRI and PET scanners (Health Council of
Canada, 2010) and a universal public prescription drug insurance programme (Gagnon and
Hebert, 2010). Reductions in fiscal transfers to the provinces from the federal government
resulted in decreased spending on health care in the provinces (Naylor et al., 1995) and in
growing concern over unacceptably long waits for hospital and medical care, especially
elective or scheduled surgical services (Marchildon, 2006).
Canadians’ concern about the viability of their highly valued public health care system
was reflected in public opinion of the overall quality of the health care system. A synthesis
of national opinion polls (Marchildon, 2005) indicated that the percentage responding that
heath care quality was “excellent, very good or good” declined from 86% in 1991 to 63% in
2000. The percentage reporting that quality was “fair, poor or very poor” increased from
12% in 1991 to 34% in 2000.
McDonald and colleagues (1998) described concerns expressed by health professionals
and the public, amplified by the media, about the apparent deterioration in quality and
unacceptably long waits for non-urgent care. They also identified a more problematic lack
of standardisation in the management of queues and the absence of valid and reliable
operational definitions of waiting time for particular procedures. Under these
circumstances, it was difficult for a hospital, a health authority or a government to know
the true number of people waiting, the urgency of their need and the length of time waited
compared to a clinically meaningful waiting time standard.
DeCoster and colleagues (2000), in their review of waiting times for surgical procedures
in the province of Manitoba from 1992 to 1999, reported that waits for some life-saving
procedures had been getting shorter, while waiting times for elective or scheduled
surgeries had lengthened.
Concerns about quality in general and access in particular were reiterated in the report
of the Commission on the Future of Health Care in Canada (2002). The Commissioner
observed that surgical waiting lists were not managed well, and there was little if any
coordination among physicians and hospitals. There was no common understanding of
when a patient’s wait began and little or no monitoring of the status of patients on waiting
lists. He concluded that a patient’s uncertainty about the ability to receive needed health
care in a timely manner should be addressed in a comprehensive plan and implemented
as a high priority across Canada.
In its report on the state of Canadian health care, the Standing Senate Committee on
Social Affairs, Science and Technology (2002) reiterated the perceived severity of the
problem of waiting time and access across the country. It identified the need for significant
new monies for health care and recommended that governments implement health care
guarantees for major hospital or diagnostic procedures.
The report of the Federal Advisor on Wait Times (2006) described a shortage of family
physicians and primary care providers, lengthy waiting times at many hospitals for
emergency department care and long waits for elective surgery.
Provincial initiatives in advance of the pan-Canadian planPrior to the national approach to improve access by reducing waiting times, many
Canadian provinces had begun, in their own way, to explore solutions to their waiting time
WAITING TIME POLICIES IN THE HEALTH SECTOR: WHAT WORKS? © OECD 2013104
II.5. CANADA
and access problems. This is illustrated by examples from the provinces of Ontario and
Saskatchewan.
Established in 1990, Ontario’s Cardiac Care Network (CCN) developed a province-wide
cardiac surgical patient registry, an urgency rating system and waiting time guidelines to
inform patient prioritisation. This was a network of 17 regional centres with dedicated care
coordinators to link patients with their family doctor, cardiac specialists and the hospital
(Monaghan et al., 2000). Over the first ten years of operation, the median waiting time for
urgent surgical patients remained constant despite increases in the number of patients
waiting for cardiac surgery. By 2007, the CCN was able to complete 96% of elective bypass
surgeries within the recommended waiting times, compared to 86% in 2004, and to reduce
regional variations in waiting times (Health Council of Canada, 2007).
In 2001, Saskatchewan established a province-wide surgical care network (SSCN) to
improve surgical waiting times, to standardise patient prioritisation and waiting list
management practices and to provide information that would be useful for surgical
patients and their primary care physicians (Glynn et al., 2003). The SSCN mission was to
change the way surgical care was delivered such that patients would receive the
appropriate procedure in accord with the urgency of their need, within explicit maximum
waiting times. The SSCN employs a standardised patient urgency assessment, a province-
wide surgical patient registry and a public website showing waiting times. As the first
network of its kind in Canada, it was an important early step along the way to improving
surgical care in Saskatchewan and served as an exemplar to other provinces.
Notwithstanding the work of individual provinces to shorten waiting times, there was
a growing understanding among health stakeholders that significant reform and
investment was needed across the country to preserve and strengthen Medicare and to
reassure Canadians that the publicly funded system of care was effective and sustainable.
National approachThe urgency of the need for meaningful health care reform had become an issue for
discussion at meetings of federal, provincial and territorial leaders. Their 2000 Communiqué
on Health laid out the terms of an action plan for health system renewal, the first element of
which was to “…improve both the timely access to, and quality of, health services of highest
priority to Canadians” (Canadian Intergovernmental Conference Secretariat, 2000). The first
ministers’ 2003 Accord on Health Care Renewal affirmed that all Canadians should have
timely access to insured health services on the basis of need, not ability to pay, regardless of
where they live in Canada. Specifically, national leaders made a commitment to ensure
timely access to diagnostic procedures and medical treatments (Health Canada, 2003).
In 2004, Canadian first ministers reaffirmed their commitment and agreed to a 10-Year
Plan to Strengthen Health Care (Health Canada, 2004). Among a broad array of health care
reforms, this plan included a promise by the provinces to deliver evidence-based waiting
time benchmarks and measurable waiting time reductions in five priority clinical areas:
cancer, heart, diagnostic imaging and hip and knee joint replacement. This 10-Year Plan
was national in scope and represents the first pan-Canadian policy initiative aimed
specifically at reducing waiting times.
To support the broad range of improvements required by the 10-Year Plan, the federal
government would allocate CAD 41.3 billion in new funding to the provinces and territories
on a per capita basis over the ten-year period ending in 2014 (Canada Department of
WAITING TIME POLICIES IN THE HEALTH SECTOR: WHAT WORKS? © OECD 2013 105

II.5. CANADA
Finance, 2011). Also, CAD 5.5 billion was allocated for specific initiatives to reduce waiting
times in the provinces and CAD 500 million was put into a Medical Equipment Fund.
Evidence-based benchmark waiting times were developed through collaboration of
the provincial and territorial ministries of health, the health research community and the
Canadian Institutes of Health Research (Watson et al., 2007). No financial penalty is levied
against a jurisdiction if a pan-Canadian waiting time standard is not met. A benchmark for
diagnostic imaging was not produced due to a lack of information;4 the remaining
benchmarks5 are:
● Hip fracture6 repair within 48 hours.
● Hip or knee joint replacements within 26 weeks.
● Surgery to remove cataracts within 16 weeks for patients who are at high risk.
● Cardiac bypass surgery, reflecting how urgently care is required, from 2 to 26 weeks.
● Cancer radiation therapy within 4 weeks of being ready to treat.
The 10-Year Plan required all jurisdictions to publicly report on their progress. To date,
all have developed public websites dedicated to that purpose and all provide potentially
useful information for patients and their families and health care providers. Some
provinces have established health quality councils to address issues related to the quality
of health care, broadly defined, including waiting times and access.
Has there been a reduction in waiting times?In accord with a statutory requirement, every three years a parliamentary committee
must review and report on progress in implementing the 10-Year Plan. The House of
Commons Standing Committee on Health conducted the first review (Parliament of
Canada, 2008). Based on its review of the first three years of the Plan, the Committee could
not conclude that consistent and meaningful reductions in waiting times had occurred
across the country. It commented on the absence of data needed to monitor progress and
compare jurisdictions. The Committee pointed to the possibility that the priority clinical
areas might receive disproportionately more resources and that a reduction of waiting
times in these areas may result in longer waits in the non-priority areas. It recommended
that this phenomenon be monitored. Subsequently, the province of British Columbia
reviewed surgical volume data and concluded that investment in priority areas was not
crowding out other surgeries (Health Council of Canada, 2011).
The Standing Senate Committee on Social Affairs, Science and Technology (2012)
completed the second statutory progress review of the 10-Year Plan. With regard to the
reduction of waiting time, the Committee heard that on average 80% of priority procedures
were delivered within the benchmark but significant variation across the country
remained problematic. The Senate Committee recommended the development of
benchmarks on waiting times for all specialty medical care, hospital emergency
departments and long-term care. It called on the Health Council of Canada to examine the
health care management practices that contributed to the reduction of waiting time with a
view to broad implementation in the provinces. The Committee asked federal, provincial
and territorial leaders to draft a vision for patient-centered care that provides a way to
incorporate their needs and perspectives into health system delivery.
Responsibility for annual monitoring and progress reporting was vested with two
national agencies. The Canadian Institute for Health Information (CIHI) publishes an
annual waiting time report that compares all provinces and territories. The Health Council
WAITING TIME POLICIES IN THE HEALTH SECTOR: WHAT WORKS? © OECD 2013106

II.5. CANADA
of Canada interprets this information and provides analysis and commentary in accord
with its mandate to monitor and report on health care renewal.
In its sixth annual report on waiting times, CIHI (2011b) notes that the data and
infrastructure required for monitoring and reporting waiting times required by the 10-
Year Plan did not exist in 2004. As a result, the provinces collaborated on the development
of common data definitions and calculations concerning waiting time. Comparable pan-
Canadian waiting time data for 2010 is now available as is trend reporting for the period
2008 to 2010.
Compared to the chaotic state of surgical waiting lists (Noseworthy et al., 2003) and the
uncertainty of patient waiting times that prevailed in the late 1990s, the situation in 2011
was much improved. Particularly in the priority clinical areas, there has been measured
improvement over time. All jurisdictions now report on their performance compared to
benchmarks for radiation treatment, hip and knee replacement, hip fracture repair,
cataract removal and cardiac bypass surgery.
Table 5.2 uses data from the CIHI (2011a) to show the benchmark waiting time, the
percentage of cases completed within the benchmark and the rank of each province.
Among the five priority areas compared in Table 5.2, the best nation-wide
performance was in cardiac surgery, where 99% of cases were reported as being completed
within the benchmark. In clinical practice cardiac surgery patients are assessed and
prioritised for surgery in accord with their level of urgency. Because urgency assessment is
not standard across the country, all cases are combined in Table 5.2. The range extends
from 100%, achieved in Saskatchewan, Ontario, New Brunswick, Nova Scotia and
Newfoundland and Labrador, to 95% in Alberta. The poorest nation-wide performance
against a benchmark is hip fracture repair, where 78% of cases were completed within the
benchmark. This ranged from a high of 82% in Manitoba to a low of 72% in Saskatchewan.
Table 5.2. Percentage of patients receiving care in priority areas withinthe benchmark, Canada, 2010
Priority clinical areaHip
replacementKnee
replacementHip fracture
repairCataractremoval
Cardiacsurgery
Radiationtherapy
Benchmark wait time 26 weeks 26 weeks 24 hours 16 weeks 2 to 26 weeks 4 weeks
Jurisdiction Score
All Canada 84 79 78 83 99 98
British Columbia 85 76 80 79 99 92
Alberta 78 69 81 48 95 94
Saskatchewan 69 60 72 62 100 97
Manitoba 63 57 82 70 99 100
Ontario 91 89 77 88 100 97
Quebec 88 83 1 87 3 98
New Brunswick 79 67 78 89 100 87
Nova Scotia 57 42 78 67 100 85
Prince Edward Island 90 73 74 80 4 97
Newfoundland & Labrador 75 67 2 80 100 94
1. Quebec hip fracture repair data is not comparable to other jurisdictions.2. Newfoundland & Labrador hip fracture repair data is not comparable to other jurisdictions.3. Quebec cardiac bypass data is not comparable to other jurisdictions.4. Prince Edward Island does not provide this cardiac surgery; patients receive care in other provinces.Source: CIHI (2011), “Wait Times in Canada – A Comparison by Province, 2011”, Canadian Institute for HealthInformation, Toronto.
1 2 http://dx.doi.org/10.1787/888932754844
WAITING TIME POLICIES IN THE HEALTH SECTOR: WHAT WORKS? © OECD 2013 107
II.5. CANADA
With regard to hip replacement surgery, nationally 84% of cases were completed within the
benchmark, and the range extended from a high in Ontario of 91% to a low in Nova Scotia
of 57%. Similarly with knee joint replacements, nationally, 79% of cases were reported as
completed within the benchmark with a range from 89% in Ontario to 42% in Nova Scotia.
The benchmark waiting time for cataract removal surgery was achieved in 83% of cases in
Canada as a whole, with a range from 89% in New Brunswick to 48% in Alberta. It should be
noted that the national benchmark for cataract surgery specifies a waiting time of
26 weeks for high-risk patients. In cataract surgery, as with cardiac surgery, there is
variability in how the urgency of patients is assessed across the country, and Table 5.2
includes all patients. Radiation therapy for cancer is the single non-surgical area for which
a national benchmark waiting time was established, and for the country as a whole 98% of
patients received their care within the benchmark.
In response to their 2004 commitment and given the funding to support it, Canadian
jurisdictions have delivered measurable improvement in patient waiting times in the
priority clinical areas. There has been improvement in the infrastructure required to
collect data and to compare and report on performance. This improvement, across the
country, would not have been possible without the federal, provincial and territorial
collaboration and commitment set out in the 10-Year Plan to Strengthen Health Care. Nor
could it have been documented without similar collaboration on data, definitions and
reporting methodologies.
The question of exactly how these improvements in performance have been achieved
and at what cost is not an easy one to answer. While there was agreement across all
jurisdictions on what the waiting time benchmarks ought to be, each province and territory
pursued its own path toward improved performance. In part, the progress can be attributed
to an increase in the rate and number of surgeries performed in the priority areas. From
2004/05 to 2007/08, there was an 8% increase, adjusted for population growth and aging, in
the rate of surgery performed across all priority areas (CIHI, 2009).
Sustainable improvement in waiting time reduction requires a strategic approach that
engages the key stakeholders in making necessary changes to the delivery system. The
10-Year Plan acknowledged that in 2004 work on waiting time reduction had already begun
across Canada and that the provinces had different priorities and starting points. The
Health Council of Canada (2011) reported that in addition to increased surgical volume in
the priority areas, governments, hospitals and health authorities adopted service delivery
changes that contributed to performance improvement. Many developed surgical patient
registries that incorporate standardised measures of patient urgency and prioritisation.
Payment-for-performance initiatives were implemented to clear surgical waiting lists and
to expedite patient flow. In all cases, the process of planning to reduce waiting times was a
collaborative effort of governments, clinicians and administrators.
It is beyond the scope of this chapter to document the waiting time improvement
activities of the nearly 100 regional health bodies in Canada. However, an overview of
British Columbia’s surgical waiting time strategy will serve as an illustration of the task at
a provincial level. Then, to demonstrate how surgical care can be redesigned to shorten
waits through improved efficiency, the work of the Alberta Bone & Joint Health Institute
will be briefly described.
WAITING TIME POLICIES IN THE HEALTH SECTOR: WHAT WORKS? © OECD 2013108

II.5. CANADA
British Columbia: developing a provincial strategyThe province of British Columbia’s (BC) strategic approach to improving upon timely
access to surgery consists of four pillars – governance, organisational structure, patient
management and accountability (BC Ministry of Health, 2011a). In 2007, the BC Ministry of
Health established operational waiting time targets requiring that on average 90% of
patients are treated within the national waiting time benchmarks.
Concerning governance, BC established a leadership team and concomitant policy
direction that fostered innovation through targeted investments in key surgical areas. It
established a Provincial Surgical Advisory Council to identify ways and means to
restructure the delivery of surgical services, consistent with the waiting time reduction
strategy.
In addressing organisation and structure, BC recognised the need to improve clinical,
administrative and managerial practices in its regional health authorities. Toward this end
two expert clinical panels brought together medical specialists, general practitioners,
nurses, allied health professionals, researchers and managers to review musculoskeletal
care and cataract surgery. The panels made recommendations to expedite the system
change needed to achieve waiting time targets. Working groups were set up to guide
implementation across its five regional health authorities. A province-wide surgical
services conference (BC Ministry of Health, 2009) brought together physicians, managers,
researchers and government officials to discuss priorities for the provincial strategy and
how to apply the strategy in clinical settings across the province.
Concerning patient management, BC enhanced its surgical patient registry by
including a requirement for urgency assessment and giving surgeons the opportunity to
use registry data to manage their queues. This assessment combines a diagnostic
description with a patient’s clinical condition and yields a priority level linked to a
recommended maximum waiting time. The registry can provide almost real-time data
about the number of patients waiting for surgery, the type of surgery, the relative urgency
of the case and the elapsed time between being added to the registry and having the
surgery performed.
The final element of BC’s strategy addresses accountability. Annual performance
agreements between the ministry and the health authorities outline roles, responsibilities
and multi-year performance expectations in relation to waiting time targets. BC’s waiting
time website fulfils part of the requirement for public reporting, consistent with the
10-Year Plan. Data describing surgical activity for the two months ending 31 January 2012
(BC Ministry of Health, 2011b) indicates that 1 706 knee replacements were completed, and
90% of these cases were completed within 36 weeks of being wait-listed; the provincial
target calls for 90% to be completed within 26 weeks. The website provides complementary
historical data. In 2001/02, 2 449 knee replacements were completed, and 90% were
completed within 62.9 weeks; in 2010/11, 6 867 cases were completed, 90% of them within
34.2 weeks.
BC’s operational waiting time targets drive performance improvement, and the
waiting time strategy provides a framework for doing so.
Alberta: Reducing the wait for hip and knee joint replacementThe Alberta Hip & Knee Replacement Project was a response to clinically unacceptable
waiting times and strong negative public reaction (Alberta Bone & Joint Institute, 2007).
WAITING TIME POLICIES IN THE HEALTH SECTOR: WHAT WORKS? © OECD 2013 109

II.5. CANADA
Recognising that the traditional approach to managing access was inefficient and variable
across the province, the Alberta Orthopedic Society developed a new model of care (Frank
et al., 2011). Their collaborative approach engaged the clinical, research and health care
management communities in the development of a new patient-centered model that
would, in time, replace the traditional model across the entire province.
This new model spans the continuum from referral to assessment in a multidisciplinary
clinic, to surgery if and when needed, to post-surgical support and an outcome assessment.
The model includes standardised clinical processes and data collection at each step in the
pathway. It is clinically coherent, and makes use of modern health care management
processes.
To evaluate the efficacy of the new model, a randomised controlled evaluation was
conducted (Gooch et al., 2009). Compared to conventional care, those in the new model
group showed improvement on five of six quality measurements identified by the Health
Quality Council of Alberta (2004). Patients receiving the new model also reported better
post-surgery quality of life and greater satisfaction with their health care experience than
did the conventional care group. They were more likely to be mobile on the day of their
surgery. They experienced a shorter hospital stay and shorter waits for assessment and
surgery. Waiting time for a surgical assessment fell from 145 days to 21 days with the new
model, and the wait for surgery fell from 290 days to 37 days.
Alberta is currently implementing this new model of care throughout the province.
ConclusionsThat roughly eight of ten Canadian patients receive care in priority surgical areas
within the national waiting time benchmarks is a worthy achievement; however,
continuing variability across the country remains a problem (Health Council of Canada,
2011). If waiting time benchmarks, monitoring and performance reporting can be
implemented in priority areas, does this not beg the question of why the same approach
has not been advanced, on a pan-Canadian basis, for other surgeries and health care
services (Wait Time Alliance, 2011)?
All jurisdictions post waiting time information on public websites, and some do so at
the hospital and surgeon levels. Recognising their great potential value for patients and
physicians, the Wait Time Alliance (2011) evaluates these websites according to five criteria
and assigns a letter grade to each in its annual report card on the subject. Their evaluation
assesses the timeliness of data updates; the range of procedures included; the ease of use
by patients looking for waiting time data; the extent to which waits are compared to
benchmarks; and the validity and reliability of the data on the website. While these
websites have the potential to influence patient choice of specialist or hospital, no
evidence was found to suggest that they are being used in this way.
From the patient’s perspective, the waiting time reported on provincial websites
represents only a part of their overall wait for surgery. The national benchmarks and most
provinces’ websites describe a wait that begins when a patient is placed on a surgical wait
list. In most instances, the surgical patient will also have waited for an appointment to see
a family physician. The patient will then wait for an assessment by a surgeon and possibly
other diagnostic or imaging procedures before being deemed ready for surgery and added
to a wait list. In a truly patient-centered system, the wait to be seen by a primary care
provider should be included in the calculus.
WAITING TIME POLICIES IN THE HEALTH SECTOR: WHAT WORKS? © OECD 2013110

II.5. CANADA
The Canadian approach to reducing waiting times described in the 10-Year Plan to
Strengthen Health Care has delivered improvement across the country in a number of the
surgical priority clinical areas. The Plan serves as an example of how the two orders of
Canadian Government address matters of shared responsibility in health care. The
accomplishments of the past eight years were necessary and have been beneficial but not
sufficient according to the most recent Parliamentary Review. It calls for investment in
dealing with the root causes of waiting and investment in better management practices
along the continuum of care.
Continued progress toward the provision of appropriate, timely and effective health
care is required to sustain public confidence in the quality and sustainability of Canadian
Medicare.
Notes
1. Consistent with the principle of Asymmetrical Federalism, the province of Quebec was not asignatory to the Accord. It would develop its own waiting time reduction plan and progress reports.
2. Public administration requires that provincial and territorial governments are ultimately responsiblefor the insurance plans in their jurisdiction. Comprehensiveness requires that these plans cover allmedically necessary health care, although it is not explicit in defining what this might or might notinclude. Universality requires that provincial and territorial insurance plans cover all their residents.Portability requires that residents must continue to be covered by their home insurance plan whilethey are either temporarily absent or moving within the country. Accessibility requires that residentshave reasonable access to insured health services without financial or other barriers.
3. Throughout the remainder of this chapter, the term “province” will be used to mean “provincesand territories” and “provincial” to mean “provincial and territorial”.
4. Five provinces publish diagnostic imaging waiting time information on their official websites, thusat least fulfilling the spirit of the 10-Year Plan.
5. Definitions for urgency categories implied for cataract surgery and cardiac surgery vary across thecountry at this point.
6. While the 10-Year Plan did not specifically identify hip fracture repair as a priority procedure, it hasbeen accepted as such and is reported along with joint replacement surgery.
References
Alberta Bone & Joint Institute (2007), “Alberta Hip & Knee Replacement Pilot Project ScientificEvaluation Report”, Alberta Bone & Joint Institute, Calgary.
BC Ministry of Health (2009), “Access to Surgical Services in BC – The Cutting Edge, Conference Report”,BC Ministry of Health, available at www.health.gov.bc.ca/cpa/mediasite/pdf/SAC_Final_Report.pdf.
BC Ministry of Health (2011a), “B.C. Access Strategy”, available at www.health.gov.bc.ca/swt/overview/waittime_targets.html.
BC Ministry of Health (2011b), “Current Wait Time Statistics”, available at www.health.gov.bc.ca/swt/faces/PriorityAreas.jsp.
Canada Department of Finance (2011), “Federal Investments in Support of the 10-Year Plan to StrengthenHealth Care”, Ottawa.
Canada Department of Justice (2012), “The Canada Health Act R.S.C., 1985, c. C-6”, Ottawa.
Canadian Health Services Research Foundation (2009), “Service-based Funding and Paying forPerformance – A Briefing”, Canadian Health Services Research Foundation, Ottawa, available atwww.chsrf.ca/migrated/pdf/news_events/CEO_Forum_Book_ENG_FINAL.pdf
Canadian Intergovernmental Conference Secretariat (2000), “News Release – First Ministers. MeetingCommuniqué on Health, September 11, 2000”, Canadian Intergovernmental ConferenceSecretariat, Ottawa.
WAITING TIME POLICIES IN THE HEALTH SECTOR: WHAT WORKS? © OECD 2013 111

II.5. CANADA
CIHI (2009), “Surgical Volume Trends, 2009 – Within and Beyond Wait Time Priority Areas”, CanadianInstitute for Health Information, Ottawa.
CIHI (2011a), “Wait Times in Canada – A Comparison by Province, 2011”, Canadian Institute for HealthInformation, Toronto.
CIHI (2011b), “National Health Expenditure Trends, 1975 to 2011”, Canadian Institute for HealthInformation, Ottawa.
Commission on the Future of Health Care in Canada (2002), “Building on Values: The Future of HealthCare in Canada – Final Report”, Commission on the Future of Health Care in Canada, Ottawa.
Commonwealth Fund (2011), “International Profiles of Health Care Systems 2011”, CommonwealthFund, New York.
DeCoster, C., L. MacWilliam and R. Walld (2000), “Waiting Times for Surgery: 1997/98 and 1998/99Update”, Manitoba Centre for Health Policy, Winnipeg.
Derrett, E., S.C. Paul and J.M. Morris (1999), “Waiting for Elective Surgery: Effects on Health-relatedQuality of Life”, International Journal for Quality in Health Care, Vol. 11, No. 1.
Federal Advisor on Wait Times (2006), Final Report of the Federal Advisor on Wait Times, Health Canada,Ottawa.
Frank, C., D. Marshall, P. Faris and C. Smith (2011), “Essay for the CIHR/CMAJ Award: Improving Accessto Hip and Knee Replacement and its Quality by Adopting a New Model of Care in Alberta”,Canadian Medical Association Journal, Vol. 183, No. 6.
Gagnon, M.-A. and G. Hebert (2010), “The Economic Case for Universal Pharmacare”, Canadian Centerfor Policy Alternative and Institut de Recherches et d’Informations Socio-économiques, Ottawa.
Glynn, P.A.R., L.M. Donnelly, D.A. Calder and J.C. Brown (2003), “The Saskatchewan Surgical CareNetwork – Toward Timely and Appropriate Access”, Health Quarterly, Vol. 7, No. 1.
Gooch, K.L., D. Smith, T. Wasylak, P.D. Faris, D.A. Marshall, H. Khong, J.E. Hibbert, R.D. Parker, R.F.Zernicke, L. Beaupré, T. Pearce, D.W.C. Johnston and C.B. Frank (2009),“The Alberta Hip and KneeReplacement Project: A Model for Health Technology Assessment Based on ComparativeEffectiveness of Clinical Pathways”, International Journal of Technology Assessment in Health Care,Vol. 25, No. 2.
Health Canada (2002), “Canada’s Health Care System”, Ottawa.
Health Canada (2003), “First Ministers’ Accord on Health Care Renewal”, Ottawa.
Health Canada (2004), “First Ministers’ Meeting on the Future of Health Care 2004: A 10-Year Plan toStrengthen Health Care”, Ottawa.
Health Council of Canada (2007), “Wading through Wait Times – What Do Meaningful Reductions andGuarantees Mean? An Update on Wait Times for Health Care”, Health Council of Canada. Toronto.
Health Council of Canada (2010), “Decisions, Decisions: Family Doctors as Gatekeepers to PrescriptionDrugs and Diagnostic Imaging in Canada”, Health Council of Canada, Toronto.
Health Council of Canada (2011), “Progress Report 2011: Health Care Renewal in Canada – Appendix:Provincial and Territorial Profiles”, Health Council of Canada, Toronto.
Health Quality Council of Alberta (2004), “Alberta Quality Matrix for Health Care: User Guide”, HealthQuality Council of Alberta, Calgary.
Mahon, J., R. Bourne, C. Rorabeck, D.H. Feeny, L. Stitt and S. Webster-Bogaert (2002), “Health-relatedQuality of Life and Mobility of Patients Awaiting Elective Total Hip Arthroplasty: A ProspectiveStudy”, Journal of the Canadian Medical Association, Vol. 167, No. 10.
McDonald, P., C. Sanmartin, S. Shortt, M. Barer, S. Lewis and S. Sheps (1998), “Waiting Lists and WaitingTimes for Health Care in Canada: More Management!! More Money??”, Health Canada, Ottawa.
McKillop, I., G.H. Pink and L.M. Johnson (2001), “The Financial Management of Acute Care in Canada:A Review of Funding, Performance Monitoring and Financial Reporting Practices”, CanadianInstitute for Health Information, Ottawa.
Marchildon, G.P. (2005), Health Systems in Transition: Canada, University of Toronto Press, Toronto.
Marchildon, G.P. (2006), “Health Care in Canada and the United States: Consumer Good, Social Servicesor Right of Citizenship?”, 2006 John F Roatch Global Lecture Series on Social Policy and Practice,University of Regina, Regina.
WAITING TIME POLICIES IN THE HEALTH SECTOR: WHAT WORKS? © OECD 2013112

II.5. CANADA
Monaghan, B., C. Morgan, B. Shragge, L. Higginson, M. Vimr and J. Trypuc (2000), “Through the LookingGlass: The Cardiac Care Network of Ontario 10 Years Later”, Healthcare Quarterly, Vol. 4, No. 3.
Naylor, C.D., C. Fooks and J.I. Williams (1995). “Canadian Medicare: prognosis guarded”, CanadianMedical Association Journal, Vol. 153, No. 3.
Noseworthy, T.W., J.J. McGurran, D.C. Hadorn and the Steering Committee of the Western CanadaWaiting List Project (2003), “Waiting for Scheduled Services in Canada: Development of Priority-setting Scoring Systems”, Journal of Evaluation in Clinical Practice, Vol. 9, No. 1.
OECD (2011), Health at a Glance: OECD Indicators, OECD Publishing, Paris, http://dx.doi.org/10.1787/health_glance-2011-en.
OECD (2012), OECD Health Data 2012, OECD Publishing, Paris, http://dx.doi.org/10.1787/health-data-en.
Parliament of Canada (2008), “Statutory Parliamentary Review of the 10-Year Plan to Strengthen HealthCare – Report of the Standing Committee on Health”, Parliament of Canada, Ottawa.
Privy Council of Canada (2012), “Canadian Federalism”, Privy Council of Canada, Ottawa.
Sanmartin, C., F. Gendron, J.-M. Berthelot and K. Murphy (2004), “Access to Health Care Services inCanada, 2003”, Statistics Canada, Ottawa.
Standing Senate Committee on Social Affairs, Science and Technology (2002), “The Health ofCanadians – The Federal Role”, Final Report, Vol. 6: “Recommendations for Reform”, Parliament ofCanada, Ottawa.
Standing Senate Committee on Social Affairs, Science and Technology (2012), “Time forTransformative Change: A Review of the 2004 Health Accord, Final Report”, Ottawa.
Wait Time Alliance (2011), “Time Out! Report Card on Wait Times in Canada, 2011”, Wait Time Alliance,Ottawa.
Watson, D.E., M.L. Barer, H.M. Matkovich and M.L. Gagnon (2007), “Wait Time Benchmarks, ResearchEvidence and the Knowledge Translation Process”, Healthcare Policy, Vol. 2 No. 3.
WAITING TIME POLICIES IN THE HEALTH SECTOR: WHAT WORKS? © OECD 2013 113


Waiting Time Policies in the Health Sector
What Works?
© OECD 2013
PART II
Chapter 6
Denmark
by
Terkel Christiansen and Mickael Bech,
COHERE, Centre of Health Economics Research,
Department of Business and Economics, University of Southern Denmark and *
Waiting times for hospital treatment have been on the political agenda in Denmarkfor a long time, and various measures have been taken since the 1990s to deal withthe problem directly, including systematic monitoring and reporting, theintroduction of maximum waiting times coupled with the free choice of hospital forsomatic and psychiatric patients, a short maximum waiting time guarantee for life-threatening diseases coupled with care packages for cancer and heart diseases andextra-activity targeted hospital grants. There are good reasons to believe that thesepolicies have reduced waiting times. In addition, a range of other measures mayindirectly have affected waiting times, such as a general increase in spending onhealth care, the strong commitment to general practitioners as gate-keepers, theincreased use of activity-based hospital reimbursement, the increasing use ofprivate health insurance and private hospitals, and a shift from in-patient to out-patient activity. A maximum waiting time for diagnosis is currently beingcontemplated. The waiting time experienced for surgery has been reduced fromabout 12 weeks in 2001 to 7.6 weeks in 2011.
* Aknowledgement: We are grateful to Mr. Jeppe Hedegaard Munk and Mr. Lars Oxlund Christoffersen,Danish Regions, for valuable comments, most of which have been included. Any remaining errorsare the authors’.
115

II.6. DENMARK
IntroductionWaiting time policies in any given country should be interpreted within the context of
the characteristics of the country’s health care system, and more broadly the values on
which it is built. Different values may be mirrored in different health care systems. Easy
and equal access for all is a dominant value underlying the Danish health care system,
and the health law states this as one of the aims, along with a short waiting time
(Sundhedsloven, 2011).
This chapter describes and analyses waiting time policies in Denmark. The first
section provides an overview of the main characteristics of the Danish health care system.
The second section describes current waiting time policies, with an emphasis on both
policies that are directly associated with waiting times (such as monitoring, regulation
through rules concerning maximum waiting times combined with free choice of hospital,
private insurance, care packages and economic incentives) and policies that might have an
indirect influence on waiting times (such as increasing health care spending, GPs playing
the role of gate-keepers, activity-based grants, the reimbursement policies of hospitals and
shifting from in-patient to out-patient treatment). Previous waiting time policies are briefly
described in the last section.
Main characteristics of the Danish health care systemThe basic structure of the Danish health care system is a decentralised public
integrated system based on tax financing and universal coverage. It is organised at three
levels: state, regional and municipal. While the state level has responsibility for overall
regulation and development through the Ministry of Health and a number of boards, such
as the National Board of Health, the planning and running of the system is – within the
framework set by the state – the responsibility of the regions (formerly counties) and
municipalities. Since 2007, Denmark has been divided into 5 regions and 98 municipalities.
Each region is run by a locally elected board of politicians whose main task is planning and
running the regional health care system, including the public hospitals as well as general
practice. The responsibilities of the municipalities include prevention, rehabilitation, care
for the elderly and citizens with chronic conditions, and the treatment of alcohol and drug
addiction.
Hospitals
The majority of the hospitals are owned and financed by the regions. In 2010, there
were a total of 19 405 hospital beds (3.5 per 1 000 population), 95% of which were located in
publicly owned hospitals (OECD, 2012). In addition to the public health care system and
specialists in private practice, there exists a minor private hospital sector consisting of for-
profit hospitals, and a few not-for-profit hospitals that are predominantly owned by
patient organisations and serve as specialised hospitals. In 2010, there were 468 beds in
not-for-profit hospitals and 401 beds in for-profit privately owned hospitals (OECD, 2012).
WAITING TIME POLICIES IN THE HEALTH SECTOR: WHAT WORKS? © OECD 2013116

II.6. DENMARK
The activity of the for-profit hospitals consists to a large extent of elective surgery and
radiological examinations. The turnover of the commercial hospitals has increased rapidly
(in relative terms) during the last decade, reaching a peak of 2% of total hospital production
in 2010 but with huge variation between specific activities (Sundhedsstyrelsen, 2011b). The
private hospital sector in Denmark includes, besides a few hospitals in the traditional
sense, a long list of clinics. The number of private hospitals and clinics in Denmark
increased from 175 to 249 during the period 2006-10, with an increase in larger hospitals in
particular. The production and the number of beds in commercial hospitals have, however,
decreased since 2009 due to reduced reimbursement and a number of regulatory changes.
Hospital remuneration
Publicly funded hospitals have traditionally been financed mainly through block
grants. The main criterion that drives the determination of the budget has been past
expenditure.
To stimulate hospital activity, an activity-based reimbursement (ABR) scheme for
public hospitals was implemented by what were the counties in 2002 and continued by the
regions, who took over in 2007. Rules on the payment of individual hospitals were changed
during the last decade, with an increased emphasis on ABR with the aim of increasing
activity. Thus, while until 2002 hospitals were financed through global budgets, a 90%/10%
split between the global budget and ABR respectively was introduced, i.e. 90% of the budget
is the global budget and 10% depends on activity. In reality, this was never implemented.
The shares were changed to an 80/20 split in 2004 and to a 50/50 split in 2007.
Hospital specialist remuneration
The hospital staff are hired on fixed salary contracts by the hospital. Specialists in
general practice and other specialists are considered private entrepreneurs who work on a
contractual basis for the regions. Specialists working in public hospitals are in principle
allowed to treat private out-patients outside the normal opening hours, according to an
agreed number of hours. Depending on the individual region, local agreements may allow
specialists to rent facilities in public hospitals in order to treat private patients. There is no
law prohibiting hospital specialists from offering surgical treatments to their own private
patients within the public hospital where they work. However regulations may differ
within regions. The majority of private out-patient activity is considered to be provided by
private clinics and commercial hospitals.
Co-payments
While access to GPs, public hospital service and specialist treatment after referral
from a GP is free of charge, co-payments exist for the use of, in particular, pharmaceuticals,
dental care, physiotherapy and medical aids.
Primary care
Primary health care is provided for most Danish citizens mainly by general
practitioners (GPs) who act as gatekeepers to hospitals and specialists in private practice
outside hospitals. GP contracts specify fees and the conditions for the supply of health
care, which are nationally negotiated every second year. All citizens have access to health
care through the tax-financed Public Health Security Scheme run by the regions. 99% of the
population has chosen membership in the Health Security Scheme, with free access to GPs.
WAITING TIME POLICIES IN THE HEALTH SECTOR: WHAT WORKS? © OECD 2013 117

II.6. DENMARK
The average income of salaried GPs was 2.71 per average wage in 2010, while the
corresponding figure for self-employed GPs was 2.89 in 2009* (OECD, 2012).
Surgical activity
Of all ICD-9-CM surgical procedures, the highest growth rate (per 100 000 population)
performed as in-patient over the last decade were for knee replacements (+250.1%). On the
other hand, surgical procedures for coronary bypass have decreased drastically by -38.7%. For
a number of procedures, there has been a shift from in-patient procedures to day-case surgery.
Private insurance
“Danmark”, a widespread private health insurance, complements the Public Health
Security Scheme. It covers 2.1 million people with the main objective being to reimburse
patients’ co-payments (Danmark, 2011). “Danmark” provides additional insurance for the
cost of surgery at private hospitals. Prior to 2002, supplementary private health insurance
was insignificant. A rapid increase has taken place since then, due to the introduction of a
tax rule that permitted tax exemption for employees for the value of a private health
insurance provided by an employer (Retsinformation, 2009). A substantial part of those
who are insured by an employer are also insured in Danmark (Kiil and Pedersen, 2009).
* No distinction is made between general practitioners and specialists, therefore the same figures arereported for both.
Table 6.1. Procedures per 100 000 population (in-patient and day cases),Denmark, 2000 and 2010
Surgical procedures by ICD-9-CM 2000 2010
Percentage changein surgical procedures
between 2000 and 2010(%)
Cataract surgery:
In-patient 90.2 16.3 -81.20
Day-case 443.9 890.1 100.50
Tonsillectomy with or without adenoidectomy:
In-patient 94 85.6 -8.90
Day-case 18.3 31 69.30
Percutaneous coronary interventions (PTCA and stenting): in-patient 107.2 158 47.30
Coronary bypass – in-patient 120.9 74 -38.70
Appendectomy: in-patient 136.6 105.3 -22.90
Cholecystectomy:
In-patient 113.9 78.2 -31.30
Day-case 6.3 60.5 860.30
Laparoscopic cholecystectomy:
In-patient 87 65.7 -24.40
Day-case 6.1 59.6 877
Inguinal and femoral hernia:
In-patient 99.4 55.8 -43.80
Day-case 131.5 145.4 10.50
Hip replacement: in-patient 161.7 225.4 39.30
Knee replacement: in-patient 49.9 174.7 250.10
Source: OECD (2012), OECD Health Data 2012, OECD Publishing, Paris, http://dx.doi.org/10.1787/health-data-en.1 2 http://dx.doi.org/10.1787/888932754863
WAITING TIME POLICIES IN THE HEALTH SECTOR: WHAT WORKS? © OECD 2013118

II.6. DENMARK
Health expenditure
Total health care expenditure as a percentage of GDP is currently slightly above the
level of the EU-15 and the OECD average of 9.5%, but still below the level of France and
Germany (Indenrigs-og Sundhedsministeriet, 2010; OECD, 2012). During the period 2003-10,
the share increased from 9.5% of GDP to 11.1%, while the public share of total spending
increased from 84.5% to 85.1% (OECD, 2012). Denmark also ranks above the OECD average
in health spending per capita, with spending of USD 4 464 in 2010 (adjusted for purchasing
power parity), compared with an OECD average of USD 3 268. Health spending in Denmark
increased in real terms by 3.6% per year on average between 2000 and 2009, but it decreased
by 1.6% in 2010. Several other OECD countries also experienced a marked slowdown or
reduction in health spending in 2010, following the recession and the need for fiscal
consolidation.
Practising physicians
Within the last decade, the number of practising physicians has increased from 2.91
per 1 000 population in 2000 to 3.48 in 2009 (OECD, 2012), which is higher than the OECD
average of 3.1.
Ageing and life expectancy
In 2010, life expectancy at birth in Denmark stood at 79.3 years, half-a-year less than
the OECD average of 79.8 years. Life expectancy in Denmark is lower than in most Western
European countries and other Nordic countries (OECD, 2012). The proportion of the
population aged 65 and over has increased from 14.8% in 2000 to 16.8% in 2011
(OECD, 2012).
Current waiting time policiesWaiting times have been on the political agenda for a long time, and various measures
have been taken since the 1990s to deal with the problem. While general increases in
health care budgets may have contributed to reduce waiting times and waiting lists, more
targeted policies, such as waiting time targets or guarantees, have also been applied. Most
of these are supply-side policies. A Liberal-Conservative government coalition took office
in 2001, and many of the subsequent policies were stated in the government platform
(Statsministeriet, 2001). The ensuing policies explicitly target waiting times or facilitate an
infrastructure that targets waiting times as one of its objectives. As different policies have
been at work at the same time as part of a policy package, it is difficult to disentangle the
effect of each separate policy on waiting times in general. However, it is most likely that the
policies that have directly targeted waiting times have had an effect through, among other
initiatives, giving waiting patients access to be treated in private hospitals.
Systematic monitoring and reporting
Two concepts are used in the monitoring and reporting of waiting times. The
experienced waiting time is defined by the National Board of Health as the time that an
average patient without complications has actually waited from referral by a GP or a
practicing specialist to the beginning of final hospital treatment, while the expected waiting
time is the estimated maximum waiting time from referral to being seen at a hospital for
examination or treatment.
WAITING TIME POLICIES IN THE HEALTH SECTOR: WHAT WORKS? © OECD 2013 119

II.6. DENMARK
Waiting times at public hospitals have been monitored since 1993. All public hospitals
mandatorily (with a few exceptions) report expected waiting times, currently for
23 selected treatment areas, to a central data base run by the National Board of Health (see
Table 6.2).
The National Board of Health provides analyses and reports of experienced waiting
times from data registers. Another type of waiting time is waiting time during a spell of
treatment, for example, from diagnosis to start of treatment, or between consecutive
episodes of treatment within a spell of treatment. This type of waiting time is currently not
monitored in Denmark.
Patients can seek information about expected waiting times for specific health
problems at an easily accessible government-sponsored health portal with search
functions (Sundhedsstyrelsen, 2012a). The information is given in days and indicates the
maximum expected waiting times for a patient with uncomplicated health problems.
Hospital wards routinely report their expected waiting times to a central database. The
information is made publicly available on a webpage and normally updated every month
(Sundhedsstyrelsen, 2012a). This monitoring is thought of as an important part of a policy
to support patients’ freedom of choice and to increase the accountability of hospitals.
Figure 6.1 shows expected as well as actual waiting times (Sundhedsstyrelsen, 2012b).
The expected maximum waiting times are shown in weeks for 18 selected surgery
treatments during the period 1998-2011. The expected waiting times declined sharply in
2002 and remained stable until 2008, but in 2010 again reached the former plateau of about
20 weeks. However, as can be seen from Figure 6.1, the general level of expected waiting
times was lower in the period 2002-08 than in previous years. The increase in 2008 can be
explained by a two-month general strike among hospital personnel. Expected waiting times
for cancer treatment declined from 2006. The figure also shows the actual experienced
waiting times for all surgery patients. Data from before 2005 are available only for 2001 and
2003 and are shown on a yearly basis. The average experienced waiting times declined from
nearly 13 weeks in 2001 to 11 weeks in 2003 and further to somewhere between five and
ten weeks after 2005 (with the exception of 2008/09 due to the aforementioned strike).
Apparently, the waiting time policies had an effect in the desired direction.
Some indications of the population’s satisfaction with access and waiting times are
available. According to a Eurobarometer survey (European Union, 2007), 70-75% of Danes
were satisfied with their ability to access hospital services, as compared to 75-84% in
Table 6.2. Health problem areas for which waitingtimes are provided, Denmark
AllergiesGeneral and unspecifiedMusculoskeletal (orthopaedic surgery)ChestChildrenDigestive organs (stomach/intestinal)Gynaecology, pregnancy and birthHeart, blood circulation and bloodSkinCancerRespiratory organsMale genitals
MedicalNerves and brainKidney and urinary tractPlastic surgeryMental – children and youngMental – adultsBackX-ray, ultrasound and scansTeeth, mouth and jawEyeEar/nose/throat
Source: Terkel Christiansen and Mickael Bech for the OECD.
WAITING TIME POLICIES IN THE HEALTH SECTOR: WHAT WORKS? © OECD 2013120
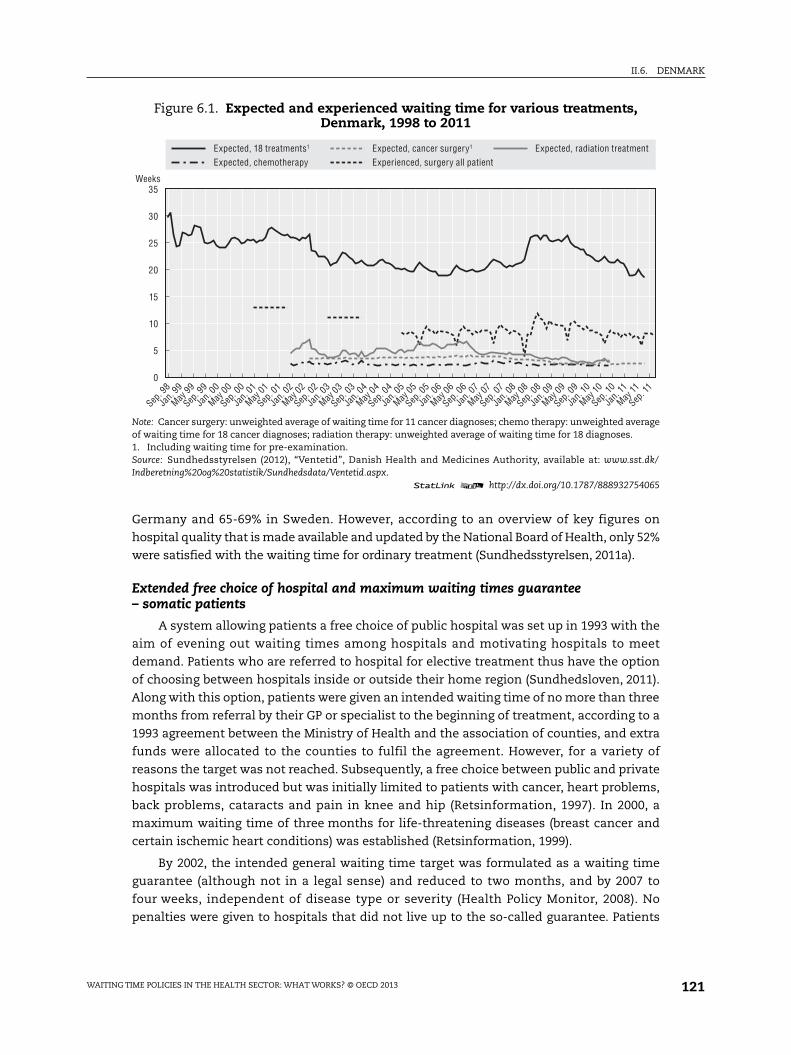
II.6. DENMARK
Germany and 65-69% in Sweden. However, according to an overview of key figures on
hospital quality that is made available and updated by the National Board of Health, only 52%
were satisfied with the waiting time for ordinary treatment (Sundhedsstyrelsen, 2011a).
Extended free choice of hospital and maximum waiting times guarantee– somatic patients
A system allowing patients a free choice of public hospital was set up in 1993 with the
aim of evening out waiting times among hospitals and motivating hospitals to meet
demand. Patients who are referred to hospital for elective treatment thus have the option
of choosing between hospitals inside or outside their home region (Sundhedsloven, 2011).
Along with this option, patients were given an intended waiting time of no more than three
months from referral by their GP or specialist to the beginning of treatment, according to a
1993 agreement between the Ministry of Health and the association of counties, and extra
funds were allocated to the counties to fulfil the agreement. However, for a variety of
reasons the target was not reached. Subsequently, a free choice between public and private
hospitals was introduced but was initially limited to patients with cancer, heart problems,
back problems, cataracts and pain in knee and hip (Retsinformation, 1997). In 2000, a
maximum waiting time of three months for life-threatening diseases (breast cancer and
certain ischemic heart conditions) was established (Retsinformation, 1999).
By 2002, the intended general waiting time target was formulated as a waiting time
guarantee (although not in a legal sense) and reduced to two months, and by 2007 to
four weeks, independent of disease type or severity (Health Policy Monitor, 2008). No
penalties were given to hospitals that did not live up to the so-called guarantee. Patients
Figure 6.1. Expected and experienced waiting time for various treatments,Denmark, 1998 to 2011
Note: Cancer surgery: unweighted average of waiting time for 11 cancer diagnoses; chemo therapy: unweighted averageof waiting time for 18 cancer diagnoses; radiation therapy: unweighted average of waiting time for 18 diagnoses.1. Including waiting time for pre-examination.Source: Sundhedsstyrelsen (2012), “Ventetid”, Danish Health and Medicines Authority, available at: www.sst.dk/Indberetning%20og%20statistik/Sundhedsdata/Ventetid.aspx.
1 2 http://dx.doi.org/10.1787/888932754065
35
30
25
20
15
10
5
0
Expected, chemotherapy Experienced, surgery all patientExpected, 18 treatments1 Expected, cancer surgery1 Expected, radiation treatment
Weeks
Sep. 9
8
Jan.
99
May 99
Sep. 9
9
Jan.
00
May 00
Sep. 0
0
Jan.
01
May 01
Sep. 0
1
Jan.
02
May 02
Sep. 0
2
Jan.
03
May 03
Sep. 0
3
Jan.
04
May 04
Sep. 0
4
Jan.
05
May 05
Sep. 0
5
Jan.
06
May 06
Sep. 0
6
Jan.
07
May 07
Sep. 0
7
Jan.
08
May 08
Sep. 0
8
Jan.
09
May 09
Sep. 0
9
Jan.
10
May 10
Sep. 1
0
Jan.
11
May 11
Sep. 1
1
WAITING TIME POLICIES IN THE HEALTH SECTOR: WHAT WORKS? © OECD 2013 121

II.6. DENMARK
either accepted a longer waiting time or used the option of choosing another hospital, as
will be described below.
An extended free choice of hospital was also introduced in 2002 along with the
maximum waiting time. “Extended choice” means that the choice was extended to include
private hospitals as well as public hospitals. This scheme implies that if the hospital to
which a patient is referred can foresee that the maximum waiting time cannot be fulfilled,
the patient should be given the option to choose another public hospital or a private
hospital or clinic at public cost. This could be either within or outside Denmark, provided
that the association of Danish regions has an agreement with the hospital or clinic in
question (Sundhedsloven, 2011, Chapter 20) and that the hospital is able to receive the
patient.
With regards to how the waiting time is measured, this is calculated as the time
between the date when a referral has been received by the hospital ward at a regional
hospital and the date treatment starts. A referral can be made by a GP or specialist, or
another hospital ward, including an emergency department, or other regional hospitals.
However, the waiting time does not include the time used for pre-examinations of less than
14 days for each pre-examination (Sundhedsloven, 2011), nor does it include waiting time
due to the patient’s health condition. For example, if a patient has, e.g. two pre-examinations
within 10 and 16 days respectively, then 10 + 14 days would not count as waiting time for
treatment, but only days 15 and 16 of the second pre-examination which exceed the 14-day
maximum. Also, if there is a medical need to observe a patient for some time, this does not
count as waiting time. If a patient chooses to benefit from these rules, then the regional
Box 6.1. Expected waiting time and experienced waiting time
Expected waiting time is a measure of how long a new patient with uncomplicatedproblems can at most expect to wait before being seen at a hospital, from the time ofreferral by a GP or a specialist. The expected waiting time is based on the waiting times for18 treatments: hernia, prolapsed disc, removal of uterus, removal of tonsils, gallstones,cataracts, artificial hip, artificial knee, meniscus surgery, prolapse of the uterus, crushingof kidney stones, surgery of kidney stones, prostate, reconstruction of ligaments,sterilisation of women, sterilisation of men, delivery of hearing aids, and varicose veins.
Expected waiting times for cancer treatments are based on the following information:
● For cancer surgery: un-weighted average waiting time for 11 cancer diagnoses,
● For radiation therapy: un-weighted average of waiting time for 18 diagnoses,
● For chemo therapy: un-weighted average of waiting time for 18 cancer diagnoses.
Experienced waiting times are calculated as the time that has elapsed from referral toactual start of treatment. They include waiting time to be seen or admitted to a hospitaland waiting time between examination and treatment. The data includes waiting times forall types of surgery.
The difference between expected and experienced waiting times is due to differences indata and methods. While the expected waiting time is an estimate of the maximumwaiting time for a patient with uncomplicated problems among 18 selected diagnoses, theexperienced waiting time is based on the actual waiting time for all patients who receiveda surgical treatment.
The seasonally adjusted curve for the experienced waiting time shows a trough in May2008, which is due to the aforementioned strike among hospital staff.
WAITING TIME POLICIES IN THE HEALTH SECTOR: WHAT WORKS? © OECD 2013122

II.6. DENMARK
hospital will refer the patient to the other hospital. However, if the waiting time at this
hospital is longer than at the regional hospital, the referral is not allowed. These rules do not
apply to psychiatric patients (see below).
A regional hospital that has received a referral has eight days to inform the patient by
letter about the following: the time and place for examination or treatment; whether the
treatment can be offered within one month; the patient’s right to choose another hospital;
the waiting times at the region’s own hospitals and other regions’ hospitals; and the fact
that the hospital can assist in referring the patient to another hospital. The information in
the letter also includes a telephone number to the regional Patient Office, where a patient
can obtain further information about the rules that apply for maximum waiting times.
The “extended freechoice” is legal in the sense that the patient has the right to choose,
but in principle there is no guarantee that the patient can actually make a choice, as this
depends on the availability of alternatives to the treatment that was offered as well as
waiting time at the private suppliers being shorter than the time given by the public
hospital. There is equal access for all, and patients are not prioritised (apart from patients
with cancer and heart failure; see below). The expense of a treatment outside the home
region’s own hospitals is covered by the regions. Patients are generally not reimbursed for
additional travelling costs if they use the extended free choice, but there are some
exceptions based on some rather complicated and debated rules.
The extended free choice was temporarily suspended in 2008/09 due to a long-lasting
strike among hospital personnel. During this period, some regions introduced
differentiated waiting times for their patients by giving priority to those with the most
severe problems, while other regions had no specific waiting time rules.
Now and then, clinicians have argued in favour of a differentiated rule that allows for
differences in severity and disease progression over the general four-week waiting time.
The argument has been that the general rule has distorted incentives and resulted in too
many increases in activity for non-severe diseases that had to be treated within the time
limit.
The number of patients who used commercial private hospitals increased from 2.0% of
all patients in 2006 to 4.2% in 2008, including patients who were treated at private hospitals
according to an outsourcing agreement. While this figure decreased temporarily in 2009
due to the suspension of the free choice, it increased again in 2010 to 4.8%
(Sundhedsstyrelsen, 2011b). In absolute terms, the numbers rose from 6 000 in 2002 to an
accumulated total of 328 000 during 2002-09 (Brancheforeningen for private hospitaler og
klinikker, 2010). About 35 000 of these can be ascribed to an extraordinary demand in 2008
due to the hospital strike. There are good reasons to believe that the extended free choice
had the intended effect on waiting times, as expected waiting times declined significantly
after 2002, as can be seen from Figure 6.1.
The new Centre-Left government that came into office in 2011 has proposed changing
the existing rule of maximum 30 days of waiting before start of treatment to a rule where
public hospitals are obliged to make a diagnosis within four weeks, followed by a
maximum waiting time for treatment of either one or two months depending on a medical
evaluation of urgency in each case. If a regional hospital is not able to make a diagnosis
within four weeks, the patient would have a right to be referred to a hospital in another
region or to a private hospital. Some exemptions to the general rule are envisaged for cases
that are difficult to diagnose. The new rules are to come into force for somatic patients in
WAITING TIME POLICIES IN THE HEALTH SECTOR: WHAT WORKS? © OECD 2013 123

II.6. DENMARK
2013 but the inclusion of the psychiatric patients awaits further discussion. This would not
change the existing rules for patients with life-threatening diseases (see below). To ease
the diagnostic process, it has been suggested that diagnostic centres with a range of
specialists should be established in the regions. This would permit patients to be
diagnosed by a team of specialists rather than being sent back and forth between various
specialists and GPs. Questions have been raised, however, about whether the proposed
rules are realistic, due to uncertainty about the capacity to diagnose patients faster than
today, and because some patients present health problems that take longer to diagnose
correctly (Heissel, 2012). It has also been agreed that a model for monitoring the area must
be established and ready before the end of 2012.
Psychiatric patients
Specific rules apply for psychiatric patients. Since 2009, an axtended free choice by a
waiting time of more than two months for examination was introduced for patients under
age 19, and in 2010 the rule was extended to treatment. Also, in 2010, an extended free
choice was introduced for adult psychiatric patients. The Danish regions have an
agreement with a number of private hospitals and clinics that may be used.
Maximum waiting time guarantee for life-threatening cases
In addition to the general rules on waiting times, some policies setting a maximum
waiting time guarantee for life-threatening cases have been implemented. The National
Board of Health has specified a shorter maximum waiting time for pre-examination,
treatment and follow-up for patients with life-threatening diseases (cancer and certain
ischemic diseases) (Retsinformation, 2010); see Box 6.2.
When a referral has been received by a regional hospital, it must send relevant
information to the patient within eight working days. If the home region of a patient is not
able to offer treatment within the specified maximum waiting time, the region must offer
treatment at another hospital, either public or private, in Denmark or abroad. The regions
have established a joint centre for the dissemination of information on each hospital’s
capacity. If the region is not able to find an alternative, it must contact the National Board
of Health, which must then attempt to find a treatment offer. If the patient on his/her own
finds a treatment offer, there is a possibility that the patient can be referred to it, provided
that the National Board of Health approves the referral. In these cases, the patient’s home
region must pay the costs of treatment and also the costs of transportation and stay. The
rules do not include alternative treatments, or treatments that are offered for the purpose
of research or experiment (Ministeriet for Sundhed og Forebyggelse, 2008).
As of 2012, the Ministry of Health has asked the regions for monthly reports on
whether the maximum waiting times for referred cancer patients and patients with heart
failure have been met for each patient (Sundhedsstyrelsen, 2012c).
Care packages for cancer and heart diseases
According to an agreement in 2007 between the government and the Danish regions,
a task force on cancer treatment was set up with the purpose of securing optimal
treatment packages for 34 defined types of cancer. The aim was to increase the quality
through developing integrated pathways as organisational and clinical standards for the
diagnosis and treatment of these areas. The task was later extended to include four
defined types of heart problems. The objective was to secure and monitor a fast and well-
WAITING TIME POLICIES IN THE HEALTH SECTOR: WHAT WORKS? © OECD 2013124

II.6. DENMARK
organised course of treatment and avoid unnecessary waiting times (Sundhedsstyrelsen,
2007 and 2009). The clinical content of each package was specified by multidisciplinary
clinical working groups using the latest available clinical guidelines.
This policy has been followed up by monitoring the hospital funding dedicated to the
area and, in some regions, pay-for-performance types of schemes. The purpose of this
policy is to ensure that excessive waiting times do not contribute to unnecessary deaths
and progressions in the disease stages of these life-threatening conditions. The waiting
times for radiation therapy and cancer surgery seem to have fallen since 2007 (see
Figure 6.1), which may be due to some important policy debates and the policies
subsequently adopted, including the allocation of additional resources, the strong political
attention dedicated to the area in this period, and monitoring of the initiatives taken.
Box 6.2. Life-threatening diseases for which maximumwaiting times are defined
Cancer
For all kinds of cancer (except cancers that require bone marrow transplants and non-melanoma skin cancer), the following maximum waiting times are applicable underDanish law:
● Until start of pre-examination: two weeks from when referral from a GP or specialist hasbeen received by the hospital.
● Until surgery: two weeks from information about diagnosis and treatment possibilities.
● Until medical treatment as primary treatment: two weeks from information aboutdiagnosis and treatment possibilities and no later than four weeks from referral.
● Until radiation treatment as primary treatment: four weeks from when referral toradiation therapy has been received by the relevant hospital ward.
● Until follow-up treatment: four weeks from when referral to follow-up treatment hasbeen received by the relevant hospital ward.
For cervical cancer, the maximum waiting time until pre-examination is two weeks fromreferral based on the diagnostic finding of a neoplasm.
There are no requirements as to the total time of treatment; however, it is assumed thatthe total spell of treatment is acceptable from a medical point of view.
Ischemic diseases
For ischemic heart diseases, the following waiting times are applicable to non-acuteconditions where there is a possibility for revascularisation:
● In case of main stem disease: two weeks from when a referral with the diagnosis hasbeen received by the specialised hospital.
● In case of documented unstable angina pectoris: three weeks from when the hospitalhas received the referral from a cardiological intensive ward until coronaryarteriography and revascularisation.
● In case of angina pectoris immediately after a myocardial infarct: five weeks from whenthe hospital has received a referral from a cardiological intensive ward until coronaryarteriography and revascularisation.
Source: Retsinformation (2010), “Bekendtgørelse om behandling af patienter med livstruende kræftsygdommem.v.”, available at: www.retsinformation.dk/Forms/R0710.aspx?id=11084.
WAITING TIME POLICIES IN THE HEALTH SECTOR: WHAT WORKS? © OECD 2013 125

II.6. DENMARK
Extra-activity targeted grants
To stimulate hospital activity, mainly in order to reduce waiting lists, the Danish state
created an activity-dependent grant in 2002. This corresponded to 3-4% of hospitals’ total
operating budgets, which was transferred to the counties/regions on the basis of activity
that exceeded a certain activity target measured in monetary value on the basis of DRG
tariffs. The activity target (called a baseline) was defined as last year’s production plus an
additional percentage to account for expected general productivity increases. Elective
activities above the defined baseline production (within a certain limit) were reimbursed by
100% in 2002. If the county produced below the baseline, it did not receive money from the
activity-dependent state grant, but nor was its block grant reduced. While originally
intended as a one-off appropriation, the policy has continued since then, with some
adjustments. Thus, as of 2003 the activity basis was changed from elective to total activity
to counter any coding bias (Christiansen, 2005). The activity-dependent grant had an upper
limit for each county, beyond which no further reimbursement was made. The state grant
was given to counties that could transfer the grant to hospitals, with whatever
reimbursement scheme they found appropriate. As the situation of the counties differed,
they implemented different hospital reimbursement schemes (Vrangbæk and Bech, 2004).
The activity-dependent grant was continued with only a few changes after the regions
replaced the counties in 2007. The regions thus calculate hospital budgets as basic budgets,
based on the previous year’s activity plus a requested productivity increase (between 2 and
3% per year). Activity above the stipulated budget is reimbursed by a percentage between 0
and 55% of the DRG tariffs (Danske Regioner, 2011).
Other policies that may affect waiting times
A number of health care policies that indirectly may have affected waiting times are
explained below. These policies have not only been targeted at waiting times but can be
expected to have had a significant influence, though we are not able to disentangle the
partial effect sizes.
Increased spending on health care
After a period of modest growth, health care expenditure increased substantially after
2001. During the period 2001 to 2010, total health care expenditure per capita increased by
29% in fixed 2000 GDP prices (OECD, 2012). It is very likely that the increase in total health
care budgets per se has facilitated a decrease in waiting times.
GPs as gatekeepers
Danish GPs have acted as gatekeepers for many years, which implies that diagnostics
and treatments are carried out in general practice as much as possible, which is intended
to minimise demand on hospital services. It is conceivable that ceteris paribus this allows
easier and faster access to hospital treatment when needed. This may be one of the most
important policies which has been a part of the overall health care system infrastructure
for many years. Even small absolute changes in the referral rates from all GPs will have a
major influence on hospital waiting times. Generally speaking, waiting times for seeing a
GP have not been an issue in Denmark, where there is easy access to GPs.
WAITING TIME POLICIES IN THE HEALTH SECTOR: WHAT WORKS? © OECD 2013126
II.6. DENMARK
Activity-based hospital reimbursement
As explained in the introduction, the activity-based remuneration (ABR) of hospitals has
gradually increased to reach 50% of the total budgets, with the rest being paid as block grants.
This policy balances the incentives for increasing activity in a way that is intended to control
overall expenditure while increasing productivity. Another purpose of the ABR schemes has
been to facilitate an infrastructure that takes account of patients’ free choice of hospital in
general. The waiting time increased slightly in 2007, concurrently with the increased use of
ABR, contrary to expectations, which should be attributed to factors other than ABR.
Since 2007, most regions reimburse hospitals for extra activity in areas with waiting
lists in order to motivate the hospitals to meet the demand of the region’s citizens.
However, one of the regions’ ABR schemes also reimburses extra activity in the absence of
waiting lists, but usually at a lower percentage of the DRG tariff (Danske Regioner, 2011).
Reimbursement policies for patients crossing county/regional borders
Along with the policies on free choice, reimbursement policies for patients being
treated outside their county or region of residence were also changed. Until 1999, the home
county of patients treated in another county paid the receiving county a low per diem
charge intended to reflect marginal costs, which gave the receiving county no incentives to
increase its capacity. From 2000, counties paid the receiving county the DRG tariff,
reflecting the average costs per admission. This reform of cross-county payments for
patients changed the counties’ incentives substantially, making it profitable to keep
patients within the county and even to try to attract patients from other counties. The
purpose of the 2000 reform was to encourage greater choice for patients and thereby
promote the equalisation of waiting times across counties. This policy was continued after
the establishment of the regions in 2007.
Private health insurance and private hospitals
While the existence of supplementary private health insurance was insignificant
before 2002, a rapid increase has taken place since then, due inter alia to the introduction of
preferential tax treatment for beneficiaries of this insurance. The preferential tax
treatment was conditioned on the employer offering the insurance to all their employees
(Retsinformation, 2009). However, the preferential tax treatment was abolished by the new
Centre-Left government in 2012. It has been estimated that the number of employer-paid
health insurance policyholders had increased to 1.1 million in 2011 from fewer than
100 000 in 2002 (out of a population of 5.5 million).
In 2010, private for-profit hospitals had about 2% of the number of beds in public
hospitals (OECD, 2012). In the period 2006-10, the number of discharges from private
hospitals increased by 94%, out-patient visits by 156% and operations by 128%, while for
public hospitals the corresponding figures were 10%, 15% and 15%. It should be noted,
however, that private hospitals have performed and still perform only a small part of total
production, and their main activity is elective surgery (Kjellberg et al., 2009). Only ten
private hospitals had more than 1 000 discharges in 2010 (Sundhedsstyrelsen, 2011b).
A considerable part of the increased activity in the private sector is caused by the
extended free choice. In 2009, 31% of all discharged patients had opted for the extended
free choice, i.e. they are publicly funded patients, while 12% of these patients were referred
to a private hospital on the basis of a tender agreement between a region and a private
WAITING TIME POLICIES IN THE HEALTH SECTOR: WHAT WORKS? © OECD 2013 127

II.6. DENMARK
hospital (Brancheforeningen for private sygehuse og klinikker, 2010). Of all operations
performed at private hospitals, the regions paid for 64%, while 25% was paid for by private
insurance and 11% were paid for by the patient directly (Sundhedsstyrelsen, 2011b).
Radiological examinations at private hospitals increased four-fold from 2006 to 2010, half
of these being MR scans (Sundhedsstyrelsen, 2011b).
The increase in privately insured patients – along with a maximum waiting time at
public hospitals (see above) – supported this increase in private hospital activity. One study
empirically tested the impact of the increased number of people with private
supplementary insurance on public waiting lists and found that persons who have taken
out supplementary private insurance use fewer publicly funded hospital services, which
was equivalent to an overall 10% decrease of average expenditure for publicly funded
hospital services for persons with supplementary private insurance (Søgaard et al., 2011).
A study by Vibholt in 2007 investigated whether private hospitals that had an
agreement with Danish regions had a tendency to select the most easily treatable patients
within specific patient categories, while the hospitals were paid a flat rate fee for each
specific category [either the DRG tariff for in-patients or the Danish for Ambulatory
patients Grouping System (DAGS) tariff] (Vibholt, 2007). The study did not support the
hypothesis that private hospitals cream-skimmed when accepting patients of a given DRG
or DAGS group. However, it did not address the question of whether private hospitals
selected between groups, although it did show a tendency of private hospitals to primarily
treat surgical patients within selected areas.
Shift from in-patient to out-patient activity
A number of policies have promoted a shift from in-patient to out-patient treatment
for several reasons, including to reduce waiting times, to reduce cost and to provide
services aligned with patient preferences. Investments in day surgery facilities in public
hospitals have been promoted. Some regions have encouraged ambulatory activity in their
ABR schemes, resulting in relatively higher payments for ambulatory care compared to in-
patient activity. The DRG tariff system has over the last ten years increased the number of
so-called grey zone tariffs for the reimbursement of activities that can be performed on
either an in-patient or ambulatory basis. The grey zone tariffs reflect an average cost of
treatment performed as an in-patient admission or as an ambulatory/day surgery
treatment. Independently of whether a hospital chooses to assign the patient ambulatory
or in-patient status, it is reimbursed according to the same tariff, which will incentivise
hospitals to perform the often less expensive treatment in an ambulatory setting. This
means that hospitals with an especially low share of ambulatory/day surgery treatment
compared to the national average have a strong incentive to change their production mix
to balance marginal revenues and costs. The latest DRG tariff scheme for 2012 contains
178 grey zone tariffs, 717 tariffs for in-patient treatment and 211 for ambulatory treatment
(Ministeriet for Sundhed og Forebyggelse, 2012).
Contracting with private suppliers
In connection with the extended free choice of hospital, the regions make contracts with
private hospitals and clinics. As of 2011, there exist models for three areas: non-psychiatric,
child and youth psychiatric, and adult psychiatric (Sundhedsloven, 2011, § 87). The contracts
are negotiated between the association of private hospitals (with about 50 members) and
Danish regions. The number of private hospitals and clinics with an agreement with Danish
WAITING TIME POLICIES IN THE HEALTH SECTOR: WHAT WORKS? © OECD 2013128

II.6. DENMARK
Regions concerning the extended free choice was 197 in 2006, 335 in 2010 and at the moment
(2012) there are 198.
Previous waiting times policiesThe current policies are further developments of past policies, with incremental steps
being taken to strengthen the hospitals’ and regions’ incentives to reduce waiting times
(Pedersen et al., 2005). No policies have been abandoned completely, but a few policies
have undergone radical change, with a major impact on the relevant incentives. Most of
these changes have been described above, but two of them will be discussed in greater
detail below.
Target grants in some counties
Before 2002, some counties implemented target grants that incentivised extra activity
in areas with waiting lists. This policy was effective as far as increasing the activity goes,
but the success in terms of reducing waiting lists and waiting times was debatable. Also,
these targeted grants were subject to debate, because they obviously give priority to certain
groups of patients.
In 2002, the target grants were replaced or integrated into the more general ABR
schemes of the hospitals. Some of the reimbursement models retained elements that
resembled the previous target grants, but in contrast to previous models the focus of the
ABR schemes was not only on treatment areas with waiting lists but more generally on
increasing overall hospital activity.
Reimbursement for patients crossing regional borders
Until 1999, counties paid for the treatment of patients in other counties on the basis of
fixed per diem tariffs that were supposed to reflect marginal costs. The tariffs were set at a
very low level so that counties would not have an incentive to build up hospital capacity
with money from other counties. The counties were supposed to be self-supporting with
respect to hospital services, with the exception of highly specialised hospital treatments.
However, this also meant that counties had very little incentive to receive patients from
other counties, and only in cases of especially sparse capacity would the low per diem
tariffs cover the actual marginal costs.
The incentives for the counties, and later the regions, changed significantly when
from 2000 cross-border patients began to be reimbursed according to the average cost as
measured by DRG tariffs. Depending on whether the counties/regions had a net inflow or
net outflow of patients, they had a strong incentive to align their own incentives down to
their own hospitals to keep their own patients within the region and to attract patients
from other regions to balance their overall budget. The extended free choice system
implemented in 2002 weakened the counties’/regions’ ability to control their budgets even
further, because of the open-ended obligations of the county/region to reimburse patients
who exercised their right to be treated in another region or at a private hospital if the
waiting time maximum had not been fulfilled (Vrangbæk and Bech, 2004).
ConclusionsPolicies in Denmark that are directly aimed at reducing waiting times include
regulations on maximum waiting times for elective treatment as well as for the treatment
WAITING TIME POLICIES IN THE HEALTH SECTOR: WHAT WORKS? © OECD 2013 129

II.6. DENMARK
of acute health problems, defined as life-threatening conditions. The regulations set out
rules for maximum waiting times before pre-examination and / or treatment. Another type
of policy that is primarily aimed at reducing waiting lists gives hospitals economic
incentives to increase activity. Various financial and structural changes, such as increased
health care budgets, increased private insurance, activity-based remuneration of hospitals,
can also be seen as policies that indirectly aim to reduce waiting times.
The current set of waiting time policies can be seen as the culmination of gradual
development through incremental change, which has been a characteristic of Danish
health care policy in general (Pedersen et al., 2005).
These gradual changes in policy have been made by successive governments with
different political orientations. While intended maximum waiting times were introduced
by a Centre-Left government in the 1990s, the policy was enhanced by the Liberal-
Conservative government that took office in 2001, which changed the intended maximum
waiting time to a maximum that was associated with a free choice of hospital, including
private hospitals.
There is good reason to conclude that these policies have had some effects in the
intended direction, as the expected waiting time for elective treatment has decreased, as
has the experienced waiting time for life-threatening conditions.
It is also obvious that the maximum waiting time rules are far from fully utilised by
patients, as in some cases the average expected waiting times for both ordinary and life-
threatening diseases are substantially higher than the times specified by the rules.
References
Brancheforeningen for privathospitaler og klinikker (2010), “Den private sygehussektor i tal 2010”.
Christiansen, T. (2005), “Waiting List Reductions: Activity-based Grants”, Health Policy Monitor, available at:http://hpm.org/en/Surveys/University_of_Southern_Denmark_-_Denmark/05/Waiting_list_reductions__Activity_based_grants.html.
Commonwealth Fund (2011), “International Profiles of Health Care Systems 2011”, Danish Health CareSystem 2011, Commonwealth Fund, New York.
“Danmark” (2011), Årsrapport 2010, available at: www.sygeforsikring.dk/default.aspx?ID=23.
Danske Regioner (2011), “Appendiks: Regionernes takststyringsmodeller”, available at: www.regioner.dk/%C3%98konomi/~/media/Filer/%C3%98konomi/Analyser/Styr%20p%C3%A5%20regionerne%202011/Styr%20p%C3%A5%20regionerne%20-%20Appendix.ashx
European Union (2007), “Health and Long-term Care in Europe”, Eurobarometer No. 283, available at:http://ec.europa.eu/public_opinion/archives/ebs/ebs_283_en.pdf.
Health Policy Monitor (2008), “Waiting Time Guarantee – An Update”, available at: http://hpm.org/en/Surveys/University_of_Southern_Denmark_-_Denmark/12/Waiting_time_guarantee_-_an_update.html.
Heissel, H. (2012), “Læger: Diagnosegarantien er ikke meget værd”, Dagens Medicin, 4 May 2012.
Indenrigs- og Sundhedsministeriet (2010), Det danske sundhedsvæsen i nationalt perspektiv, June,available at: www.sum.dk/Tal-og-analyser/~/media/Filer%20-%20Publikationer_i_pdf/2010/Tal%20og%20analyser/Det%20danske%20sundhedsvaesen%20i%20nationalt%20perspektiv/Sundhedsv%C3%A6senet%20i%20nationalt%20perspektiv%20juni2010.ashx.
Kiil, A. and K.M. Pedersen (2009), “The Danish Survey on Voluntary Health Insurance”, HealthEconomic Papers No. 2009(3), University of Southern Denmark, available at: http://static.sdu.dk/mediafiles//Files/Om_SDU/Centre/c_ist_sundoke/Forskningsdokumenter/publications/Working%20papers/20093.pdf.
Kjellberg, J., J. Søgaard and M.J. Andreasen (2009), “Privat/offentligt samspil i sundhedsvæsenet”,Dansk Sundhedsinstitut.
WAITING TIME POLICIES IN THE HEALTH SECTOR: WHAT WORKS? © OECD 2013130

II.6. DENMARK
Ministeriet for Sundhed og Forebyggelse (2008), “Maksimale ventetider på behandling for kræft ogvisse hjertesygdomme på sygehus”, available at: www.sum.dk/Aktuelt/Publikationer//~/media/Filerpercent20-%20Publikationer_i_pdf/2007/Maksimale_ventetider_kraeftbehandling.ashx.
Ministeriet for Sundhed og Forebyggelse (2012), “Takstsystem 2012 – Vejledning”, available at:www.im.dk/Sundhed/DRG-systemet/Takster/~/media/Filer%20-%20dokumenter/DRGtakster/2012/Takstsystem_2012.ashx.
Mooney, G. (2002), “The Danish Health Care System: It Ain’t Broke… So Don’t Fix It”, Health Policy,Vol. 50, No. 2, pp. 161-171.
OECD (2012), OECD Health Data 2012, OECD Publishing, Paris, http://dx.doi.org/10.1787/health-data-en.
Pedersen, K.M., T. Christiansen and M. Bech (2005), “The Danish Health Care System: Evolution NotRevolution in a Decentralized System”, Health Economics, Vol. 14, pp. S41-S57.
Retsinformation (1997), “Forslag til folketingsbeslutning om reelt frit valg for patienter med vissesygdomme mellem offentlige og privathospitaler”, available at: www.retsinformation.dk/forms/R0710.aspx?id=106588.
Retsinformation (1999), “Bekendtgørelse om behandling af visse livstruende sygdomme”, available at:www.retsinformation.dk/forms/R0710.aspx?id=21237.
Retsinformation (2009), “Ligningslovens bestemmelser vedr. bl.a. sundhedsforsikringer”, available at:www.retsinformation.dk.
Retsinformation (2010), “Bekendtgørelse om behandling af patienter med livstruende kræftsygdommem.v.”, available at: www.retsinformation.dk/Forms/R0710.aspx?id=11084.
Søgaard, R., M. Bech and J. Olsen (2011), “Effekten af sundhedsforsikringer på forbruget af offentligtfinansierede sygehusydelser”, CAST-rapport, Syddansk Universitet.
Statsministeriet (2001), “Regeringsgrundlag 2001”, available at: www.stm.dk/publikationer/regeringsgrundlag/reggrund01.htm#sundhed.
Sundhedsloven (2011), available at: www.retsinformation.dk/Forms/r0710.aspx?id=130455.
Sundhedsstyrelsen (2007), “Pakkeforløb på kræftområdet”, Danish Health and Medicines Authority,available at: www.sst.dk/Planlaegningper cent20og%20kvalitet/Kraeftbehandling/Pakkeforloeb.aspx.
Sundhedsstyrelsen (2009), “Beskrivelse af pakkeforløb 2009”, Danish Health and Medicines Authority,available at: www.sst.dk/Planlaegning%20og%20kvalitet/Kraeftbehandling/Pakkeforloeb/Pakkeforloebsbeskrivelser.aspx.
Sundhedsstyrelsen (2011a), “Sundhedskvalitet”, Danish Health and Medicines Authority, available at:www.sundhedskvalitet.dk/Noegletal.aspx.
Sundhedsstyrelsen (2011b), “Aktiviteten på private sygehuse 2006-2010”, Danish Health and MedicinesAuthority, available at : www.sst .dk/publ/Publ2011/DOKS/Akt iv i tetPr ivateSygehuse/AktvitetPrivateSygehuse2006-10.pdf.
Sundhedsstyrelsen (2012a), “Ventetider”, Danish Health and Medicines Authority, available at:www.venteinfo.dk.
Sundhedsstyrelsen (2012b), “Ventetid”, Danish Health and Medicines Authority, available at:www.sst.dk/Indberetning%20og%20statistik/Sundhedsdata/Ventetid.aspx.
Sundhedsstyrelsen (2012c), “Ventetid for kræft og hjertesygdom”, Danish Health and MedicinesAuthority, available at: www.sst.dk/Nyhedscenter/Nyheder/2012/VentetiderKraeftOgHjertesygdom.aspx.
Vibholt, H. (2007), “Fritvalgsordning og lighed: Konsekvenser af den udvidede fritvalgsordning forligheden i patienternes behandlingsadgang”, Dansk Sundhedsinstitut, København, available athttp://projekt.dsi.dk/uploads/upload_4c405956303eb.pdf.
Vrangbæk, K. and M. Bech (2004), “County Level Responses to the Introduction of DRG Rates for“Extended Choice’ Hospital Patients in Denmark”, Health Policy, Vol. 67, No. 1, pp. 25-37.
WAITING TIME POLICIES IN THE HEALTH SECTOR: WHAT WORKS? © OECD 2013 131


Waiting Time Policies in the Health Sector
What Works?
© OECD 2013
PART II
Chapter 7
Finland
by
Pia Maria Jonsson, Pirjo Häkkinen, Jutta Järvelin and Jukka Kärkkäinen,
National Institute for Health and Welfare, Helsinki
A National Health Care Guarantee was introduced into Finnish law in 2005. Theguarantee defines maximum waiting times for hospital and primary care services,including dental care. To support the guarantee, uniform grounds for access to non-emergency care were introduced.
After the establishment of the guarantee, waiting times for hospital care havebecome shorter, although the development has been bumpy and characterised by a“rubber band” phenomenon. The Supervisory Agency has given several hospitaldistricts that failed to comply with the guarantee orders to improve, oftenaccompanied by the threat of penalty fines. Consequently, waiting times haveshortened considerably, but the situation deteriorated again when the threat of fineswas removed. Regional variations in accessibility still exist.
Research is limited as to the broader range of consequences of the guarantee, e.g.whether resources have been allocated from chronic patient groups in need ofrepeated hospital care to patients to be admitted for the first time. The economicconsequences of the reform have not been calculated in detail.
The observed reductions in waiting times may partly be explained by other paralleltrends in the health sector, e.g. increased diversity in the production of services andincreasing freedom of choice.
133
II.7. FINLAND
IntroductionIn the 2003 OECD study (Hurst and Siciliani, 2003), Finland was one of the 12 countries
where waiting times were regarded as a serious health policy issue. In the comparative
analysis of the countries, there seemed to be a clear negative association between waiting
times and capacity, either measured in terms of number of beds or number of practising
physicians. Analogously, all other things being equal, a higher level of health spending was
also systematically associated with lower waiting times.
Since then, the health care sector in Finland has expanded and health care
expenditure as a percentage of GDP has increased. The numbers of health care personnel
have been relatively stable, although there are problems in recruiting physicians, especially
to primary health care. The number of hospital beds has decreased, although the number
of surgical procedures has increased, as many of the operations are now carried out as day
surgery or in ambulatory care. Over the past decade, the health sector has also gone
through a number of successive developments, implying greater diversity in the
production of services, increased freedom of choice of hospitals, increased use of
performance measurement data, and generally increased transparency and accountability.
Already in the 1990s, the four-year national plans for social and health care outlined
by the Finnish Government contained recommendations for maximum waiting times for
municipal health services. These maximum waiting times were loose advice that the
municipalities presumably did not follow very strictly, but waiting times and access to
services had become a major policy issue by the beginning of the millennium, leading to
the launch of the Health Care Guarantee in 2005. To support the legislation and guarantee
equal access to services across the country, the Ministry of Social Affairs and Health also
introduced national guidelines defining the criteria for access to non-urgent specialised
care procedures.
The main purpose of this chapter is to describe the contents and requirements of the
Finnish Health Care Guarantee, which was first introduced in 2005, and to review the data
and literature on the effects and consequences of the Guarantee, bearing in mind other
parallel developments in health care that might affect waiting times and access to care.
Main characteristics of the Finnish health care systemThe health care system in Finland is one of the most decentralised in the OECD. It is
characterised by universal coverage and financed mainly through general taxation. Both
the state and the municipalities have the right to levy taxes. In 2010, the share of health
expenditure financed by the public purse was 74.7%. Municipalities accounted for the
largest share of expenditure (35.1%), whilst the share of the central government was 24.9%
and that of the Social Insurance Institution 14.6%. Private households accounted for 19.3%,
employers 2.8%, and the remaining share (3.2%) came from relief funds, private insurance
companies and NGOs (National Institute for Health and Welfare in Finland, 2012).
WAITING TIME POLICIES IN THE HEALTH SECTOR: WHAT WORKS? © OECD 2013134

II.7. FINLAND
Health care funding is organised through parallel systems, combining taxation and
compulsory national health insurance (NHI), complemented by patients’ out-of-pocket
payments. Three parallel systems receive public funding: municipal health care, private
health care and occupational health care. The municipal services are financed by local
taxes, state subsidies and user fees. In 2011, there were 336 municipalities, with a median
number of inhabitants of 6 000.
About 15% of the total cost of health care in Finland is financed by the statutory
National Health Insurance (NHI) scheme. The main NHI funding comes from the state
budget, the insured and employers. NHI covers part of out-patient drug costs, part of
medical care costs in the private sector and part of the costs of occupational health care. Of
health services funded by public sources, about one-fourth of all out-patient visits to
physicians, nearly half of visits to dentists and some 4-5% of in-patient care periods are
provided by the private sector. As part of occupational health care, many large- or medium-
sized employers provide curative out-patient services, free of charge at the point of care.
About one-fifth of out-patient physician visits are provided by occupational health care.
Hospital remuneration
Each municipality must belong to one of the 20 hospital districts providing specialist
level care. The population base of hospital districts varies from 45 000 to 1.5 million. Each
hospital district has one or several hospitals: there are five university hospitals, 15 central
hospitals and a number of smaller “district” hospitals. Hospital districts are managed and
funded by the member municipalities, and since 1993 the hospital district budgets have
been determined by a council of member municipality representatives, in accordance with
the services provided (Vuorenkoski et al., 2008). There are no homogeneous arrangements
(or national guidelines) on how to determine the prices for hospital services. Recent
tendencies show a move from bed-per-day payments to activity-based prices, and in 2011,
14 out of 20 hospital districts used DRGs for billing municipalities for some proportion of
their services (Kapiainen et al., 2012). However, given that municipalities are responsible for
covering hospital financial losses, DRGs are primarily used as a resource allocation
mechanism rather than as a financial incentive (OECD, 2012). There are only a few private
hospitals, which provide 5% of the hospital episodes of care in the country (Vuorenkoski
et al., 2008).
Hospital beds
The total number of hospital beds in Finland per 1 000 population has decreased
from 7.54 in 2000 to 5.85 in 2010. The vast majority of beds (approximately 95%) were
located in publicly owned hospitals, which accounted for 7.28 beds (per 1 000 population)
in 2000 and 5.59 in 2010. The number of beds in for-profit privately owned hospitals has
remained relatively steady, decreasing only very slightly to 0.25 in 2009 from 0.27 in 2000
(OECD, 2012).
Specialist remuneration
Specialists are salaried in publicly funded hospitals. Hourly pay is different for
nightshifts and on-call services. Specialists working in publicly funded hospitals are
allowed to work also in privately funded hospitals or in private practice, conditional on the
permission of the hospital’s board. The work has to be performed outside the usual
working hours, which are between 8am and 4pm. Specialists working in publicly funded
WAITING TIME POLICIES IN THE HEALTH SECTOR: WHAT WORKS? © OECD 2013 135

II.7. FINLAND
hospitals are not allowed to see private out-patients (for a specialist visit) within the same
hospital. However, they are allowed to treat private in-patients (from two to eight patients
per specialist per day). Private patients pay on a fee-for-service basis. The income of
salaried specialists in Finland was 2.64 per average wage in 2010 (OECD, 2012).
Primary care
The municipalities are obliged to maintain health centres for the provision of primary
health care services, either on their own or jointly through a local federation of
municipalities. In 2011, there were 172 health centres in Finland (excluding the Åland
Islands). Most of the centres also have GP-run in-patient units. Health centres typically use
prospective budgets. In federation-owned health centres, the sharing of costs between
municipalities is usually determined by the volume of services utilised by their respective
inhabitants. The income of a salaried GP was 1.79 per average wage in 2010 (OECD, 2012).
Out-of-pocket payments
In 2012, the out-of-pocket payment for an out-patient visit to a public hospital was
EUR 27.50, whilst the out-of-pocket payment for day surgery was EUR 90.30. The out-of-
pocket payment for an in-patient stay was EUR 32.60 per day. Out-of-pocket payments are
also levied on psychiatric, primary and other kinds of care. There is an annual payment cap
for municipal services (EUR 636 in 2012).
Surgical activity
For a number of procedures, there has been a clear move from in-patient to day-case
surgery between 2000 and 2010. Of procedures performed on an in-patient basis,
percutaneous coronary interventions and knee replacement both experienced growth of
almost 100% over this same period. Coronary bypass, on the other hand, experienced the
largest decrease (-39.1 %).
Private health insurance
Coverage by voluntary private health insurance is rather low in Finland, and it is used
mainly to supplement the NHI reimbursement rate – 375 000 children and 237 000 adults
were covered by voluntary health insurance in 2005 (Vuorenkoski et al., 2008). The
government does not subsidise private health insurance. In 2010, private insurance’s share
of total health expenditure was 2.1%, decreasing from 2.5% in 2000 (OECD, 2012).
Health expenditure
Total health spending accounted for 8.9% of GDP in Finland in 2010, a lower share than
the OECD average of 9.5%. Health spending as a share of GDP is lower in Finland than in all
other Nordic countries. Health spending per capita in Finland is about equal to the OECD
average, with spending of USD 3 251 in 2010 (adjusted for purchasing power parity),
compared with the OECD average of USD 3 268. Between 2000 and 2009, health spending
per capita in Finland increased in real terms by 4.3% per year on average, but this growth
rate slowed to only 0.9% in 2010.
Physicians
The number of professionally active physicians has increased from 2.9 (per
1 000 population) in 2000 to 3.3 in 2010 (latest available year) (OECD, 2012).
WAITING TIME POLICIES IN THE HEALTH SECTOR: WHAT WORKS? © OECD 2013136

II.7. FINLAND
Ageing and life expectancy
In 2010, life expectancy at birth in Finland stood at 80.2 years, almost five months
higher than the OECD average of 79.8 years. The proportion of the population aged 65 year
or over has risen from 14.9% in 2000 to 17.8% in 2011 (OECD, 2012).
Governance and steering
The Ministry of Social Affairs and Health (MSAH) directs and guides social and health
services at the national level. The ministry defines general social and health policy,
prepares reforms and proposals for legislation, monitors their implementation and assists
the government in decision-making. Since the early 1990s, a major part of the national
steering of the health care system has been based on information guidance. Every four
years the government adopts a National Development Plan for Social and Health Care
Services and allocates funds to local and regional development projects (Ministry of Social
Affairs and Health, 2008).
Research and development on the national level is carried out and co-ordinated by the
National Institute for Health and Welfare (THL). The National Supervisory Authority for
Welfare and Health, Valvira, licenses health care professionals, handles complaints and
supervises compliance with legislation. The lower level of state administration comprises
six regions plus the autonomous Åland Islands. The Regional State Administrative
Agencies promote the national and regional objectives of the central administration and
guide and supervise both public and private health care providers.
Table 7.1. Surgical procedures per 100 000 population,Finland, 2000 and 2010
Surgical procedures by ICD-9-CM 2000 2010
% changein surgical procedures
between 2000 and 2010(%)
Cataract surgery:
In-patient 116.3 8.5 -92.70
Day-case 529.5 803.4 51.70
Tonsillectomy with or without adenoidectomy:
In-patient 160.8 50.2 -68.80
Day-case 24.7 101.3 310.10
Percutaneous coronary interventions (PTCA and stenting): in-patient 66.4 132.4 99.40
Coronary bypass: in-patient 93.1 56.7 -39.10
Appendectomy: in-patient 146.3 118.8 -18.80
Cholecystectomy:
In-patient 162.9 106.6 -34.60
Day-case 5.6 36.1 544.60
Laparoscopic cholecystectomy:
In-patient 116.3 86.8 -25.40
Day-case 5.4 35.6 559.30
Inguinal and femoral hernia:
In-patient 141.2 76.3 -46.00
Day-case 86.6 126.0 45.50
Hip replacement: in-patient 149.3 199.1 33.40
Knee replacement: in-patient 94.1 187.0 98.70
Source: OECD (2012), OECD Health Data 2012, OECD Publishing, Paris, http://dx.doi.org/10.1787/health-data-en.1 2 http://dx.doi.org/10.1787/888932754882
WAITING TIME POLICIES IN THE HEALTH SECTOR: WHAT WORKS? © OECD 2013 137

II.7. FINLAND
Policies addressing waiting timesThe four-year national plans for social and health care outlined by the government in
the 1990s (Ministry of Social Affairs and Health, 1995) contained recommendations for
maximum waiting times for municipal health services. The recommendations stated that
the patient should have access to a primary care physician within three working days,
while access to specialised health care should be possible within one or two weeks from
receipt of the referral. These maximum waiting times were loose advice that
municipalities presumably did not follow very strictly, but waiting times and access to
services became a major policy issue at the beginning of the millennium, leading to the
launch of the Health Care Guarantee in 2005.
Health Care Guarantee of 2005
In the previous OECD study, Finland was one of the 12 countries where waiting times
were regarded as a serious health policy issue. In 2002, a Decision in Principle by the
Council of State on Securing the Future of Health Care stated that the principle of access to
treatment within a reasonable period would be embodied in legislation by the year 2005
(Vuorenkoski and Keskimäki, 2004). According to the legislation, patients should be
assured of immediate contact with their health centre, and their need for care should be
assessed by a health care professional within a maximum of three weekdays. Dental care
was also included in the legislation. In non-acute specialised medical care, the hospital
district was responsible for ensuring that the patient’s need for care is assessed within a
maximum of three weeks after receiving a referral, and any necessary medical care must
be provided within three months, or at the very latest, six months.
To support the legislation and guarantee equal access to services in all parts of the
country, the compilation of uniform grounds for access to non-emergency care was
initiated in February 2004 by a management group that included representatives from the
Ministry of Social Affairs and Health, the National Authority for Medico-legal Affairs [the
predecessor of Supervisory Authority for Welfare and Health (Valvira)], the National
Research and Development Centre for Welfare and Health (the predecessor of the National
Institute for Health and Welfare), the Association of Finnish Local and Regional Authorities,
the hospital districts and health centres. The task of the group was to steer, guide and co-
ordinate the compilation of the uniform criteria. Trade unions, specialists’ associations,
municipalities, authorities and patients’ associations were also consulted during the work.
The MSAH published the national guidelines defining criteria for access to non-urgent
specialised care procedures in 2005 (Ministry of Social Affairs and Health, 2005 and 2010).
The guidelines covered 193 diseases or treatment groups, corresponding to about 80% of
non-emergency hospital care. Some of these were quite detailed and based on previous
work accomplished by the expert groups of the Finnish Medical Society. Some others gave
relatively blunt recommendations on indications for treatment. Scoring systems are used
in some of the guidelines.
The guidelines defined and still define which patients should receive treatment
according to the Health Care Guarantee, but they are not legally binding. To support the
implementation of the guidelines, the MSAH took various steps, including distributing
copies to all physicians working in Finland. In March 2007, nearly 90% of the health centres
reported in a survey that they used the guidelines in their daily practice. A new completed
edition of the guidelines was published in 2010.
WAITING TIME POLICIES IN THE HEALTH SECTOR: WHAT WORKS? © OECD 2013138

II.7. FINLAND
Health Care Guarantee in the Health Care Act
In 2011, the previous legislation on the Health Care Guarantee was refined and
transferred to the new Finnish Health Care Act (1326/2010). The Health Care Act
represented a merger of the Primary Health Care Act (66/1972) and the Act on Specialised
Medical Care (1062/1989), which previously regulated the provision of public sector health
services.
According to the Health Care Act, local authorities shall ensure that patients are able
to reach a health centre or other health care unit without delay during weekday office
hours. In situations where an assessment of the need for treatment cannot be carried out
immediately, a health care professional shall assess the need for treatment no later than
on the third working day from when the patient first contacted the health centre. As
regards specialised medical care provided in connection with primary health care, an
assessment of the need for treatment shall be commenced within three weeks of the unit
receiving notification that a patient has been referred.
Any treatment deemed necessary on medical or dental grounds shall then be provided
within a reasonable period of time, taking into consideration the health of the patient and
the projected development of the condition, and in any case within three months of the
assessment. This maximum period of three months may be extended by a maximum of a
further three months in cases involving oral health care or specialised medical care
provided in connection with primary health care, if treatment can be postponed on
medical, therapeutic or other comparable justified grounds without jeopardising the
patient’s health.
For non-emergency hospital admission, a referral is required by a physician or dentist.
An assessment of the need for treatment shall be commenced within three weeks of when
the hospital or other specialised medical care unit receives notification that a patient has
been referred. In situations where the assessment of the need for treatment requires
highly specialised consultation or special imaging or laboratory tests, the assessment and
any required tests shall be carried out within three months from the date of the arrival of
the referral. Any treatment or provision of advice deemed necessary on medical or dental
grounds or on the basis of health science in connection with the assessment of the need
for treatment shall be provided and begin within a reasonable period of time, taking into
consideration the urgency of the case, and in any case within six months of the need for
treatment having been ascertained.
Act on the Status and Rights of Patients
Other pieces of legislation also deal with access to health services. The Act on the
Status and Rights of Patients (785/1992) applies to every part of the health care system and
to health care services provided in social welfare institutions. The Act mainly concerns the
patients’ right to information, informed consent to treatment, the right to complain and
the right to autonomy. It also rules that those on a waiting list for treatment must be told
the reason for the delay and its estimated duration.
Freedom of choice
In the municipal health care system, patients have previously had limited freedom to
choose from among health care providers and physicians. The Health Care Act has
changed this situation, although the changes will be phased in gradually. In the first phase,
WAITING TIME POLICIES IN THE HEALTH SECTOR: WHAT WORKS? © OECD 2013 139
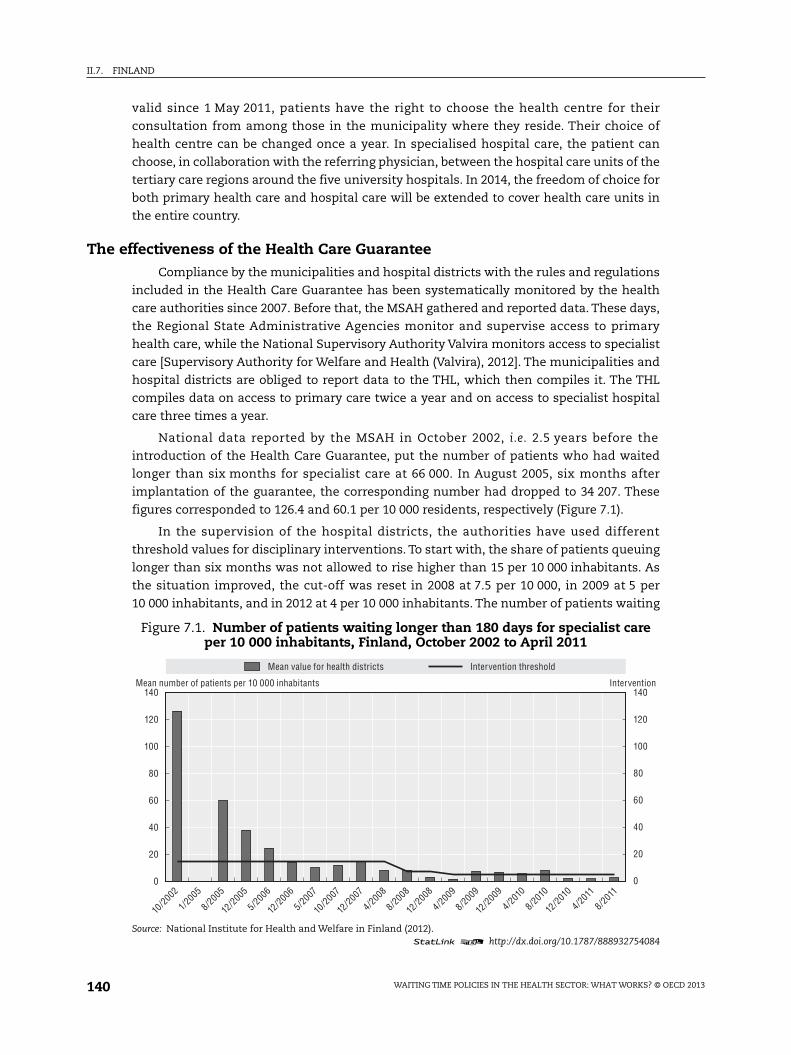
II.7. FINLAND
valid since 1 May 2011, patients have the right to choose the health centre for their
consultation from among those in the municipality where they reside. Their choice of
health centre can be changed once a year. In specialised hospital care, the patient can
choose, in collaboration with the referring physician, between the hospital care units of the
tertiary care regions around the five university hospitals. In 2014, the freedom of choice for
both primary health care and hospital care will be extended to cover health care units in
the entire country.
The effectiveness of the Health Care GuaranteeCompliance by the municipalities and hospital districts with the rules and regulations
included in the Health Care Guarantee has been systematically monitored by the health
care authorities since 2007. Before that, the MSAH gathered and reported data. These days,
the Regional State Administrative Agencies monitor and supervise access to primary
health care, while the National Supervisory Authority Valvira monitors access to specialist
care [Supervisory Authority for Welfare and Health (Valvira), 2012]. The municipalities and
hospital districts are obliged to report data to the THL, which then compiles it. The THL
compiles data on access to primary care twice a year and on access to specialist hospital
care three times a year.
National data reported by the MSAH in October 2002, i.e. 2.5 years before the
introduction of the Health Care Guarantee, put the number of patients who had waited
longer than six months for specialist care at 66 000. In August 2005, six months after
implantation of the guarantee, the corresponding number had dropped to 34 207. These
figures corresponded to 126.4 and 60.1 per 10 000 residents, respectively (Figure 7.1).
In the supervision of the hospital districts, the authorities have used different
threshold values for disciplinary interventions. To start with, the share of patients queuing
longer than six months was not allowed to rise higher than 15 per 10 000 inhabitants. As
the situation improved, the cut-off was reset in 2008 at 7.5 per 10 000, in 2009 at 5 per
10 000 inhabitants, and in 2012 at 4 per 10 000 inhabitants. The number of patients waiting
Figure 7.1. Number of patients waiting longer than 180 days for specialist careper 10 000 inhabitants, Finland, October 2002 to April 2011
Source: National Institute for Health and Welfare in Finland (2012).1 2 http://dx.doi.org/10.1787/888932754084
140 140
120
100
80
60
40
20
0
120
100
80
60
40
20
0
10/20
02
1/2005
8/2005
12/20
05
5/2006
12/20
06
5/2007
10/20
07
12/20
07
4/2008
8/2008
12/20
08
4/2009
8/2009
12/20
09
4/2010
8/2010
12/20
10
4/2011
8/2011
Mean value for health districts Intervention threshold
Mean number of patients per 10 000 inhabitants Intervention
WAITING TIME POLICIES IN THE HEALTH SECTOR: WHAT WORKS? © OECD 2013140

II.7. FINLAND
longer than six months has dropped over the years, and at its lowest was 745 patients
(April 2009) and at its highest 9 691 (January 2007).
Due to non-compliance with the legal requirements of the Health Care Guarantee,
during the period 2007-11 the Supervisory Authority Valvira has several times taken action
against hospital districts where the proportion of patients waiting longer than six months
has exceeded the threshold value applied. By 2012, a total of 30 orders for improvement
had been issued to the hospital districts. These had been accompanied by a threat of
penalty fines in nine cases (February 2012). The Regional Offices had also issued a few
orders, some of them with a threat of penalty fines.
In general, when hospital districts have become targets of disciplinary action, the
queues and waiting times for operations have shortened considerably. So far, no hospital
district has had to pay fines due to non-compliance with the Health Care Guarantee. In
many cases the situation has, however, deteriorated once again when the threat of penalty
fines was removed. Because of this “rubber band” phenomenon, Valvira changed its
regulations in 2010 and now requires the waiting time situation to be maintained at a
stable level over consecutive monitoring periods. In the last two years, “rubber banding” –
defined as an increase of more than 9% in the number of patients waiting more than
six months between consecutive observations – has still been a problem, e.g. in the large
hospital districts of Helsinki and Uusimaa and Pirkanmaa.
The Health Care Act also requires that referrals to specialist hospital care be handled
within three weeks. In this respect, large variations in practice can be observed between
the hospital districts. For example, the Helsinki and Uusimaa hospital district, with a
population base of approximately 1.5 million inhabitants, was threatened in May 2010 with
a penalty fine of EUR 2 million, due to problems with handling referrals to hospital
specialist evaluation in a number of medical fields. The threat was removed when the
hospital district could demonstrate improvements in some of the specialties, although the
three-week limit was still exceeded in some 2% of the cases.
In the country as a whole, the situation regarding referrals has generally improved
during the period 2008-11. “Rubber banding”, defined as an increase of more than 2.5%
between consecutive measurements, has been observed in anaesthesiology, neurosurgery,
phoniatrics, child psychiatry and child neurology. The sharpening of the waiting times
regulations regarding the assessment of need for treatment – included in the Health Care
Act of 2011 – seems to have improved the situation in several specialties.
Finland is one of few countries where a Health Care Guarantee addresses access to
primary health care, including dental care. Trends in waiting times for public dental care
are depicted in Figure 7.3, showing a decrease in the numbers of patients waiting more
than 6 months from 2006 to 2009, but a moderate increase after 2010.
An in-depth analysis of the economic and other consequences of the Health Care
Guarantee was published in 2008 (Pekurinen et al., 2008). This showed that, during the first
years of the guarantee, improved access to services was associated with an increase in
costs for the municipalities of approximately EUR 380 million. In addition, the government
and the municipalities “earmarked” and allocated an extra EUR 50 million in order to
reduce queues and waiting times. By the end of the study period (2007), however, the
municipalities had less need for extra resources to live up to the requirements of the
Health Care Guarantee.
WAITING TIME POLICIES IN THE HEALTH SECTOR: WHAT WORKS? © OECD 2013 141

II.7. FINLAND
Before the introduction of the Health Care Guarantee, there had been debate about
whether the guarantee would lead to shifting resources from primary care to specialist
services. No such trend could be verified, and the share of primary care was constant at
approximately 40% of the total costs of municipal care. The share of specialist care
represented by surgical specialties increased by a few percentage points, and the numbers
of orthopaedic procedures (knee and hip implantations) increased.
During the two-and-a-half year follow-up, regional variations in practice diminished
slightly, but there are still considerable differences between Finnish hospital districts,
e.g. in the numbers of cataract surgery and in accessibility measured as waiting time.
Figure 7.2. Proportion of patients waiting from referral to assessment longer thanthree weeks by speciality, Finland, December 2008 to December 2011
Percentage per speciality
Source: Finnish Supervisory Authority for Welfare and Health (2012).1 2 http://dx.doi.org/10.1787/888932754103
Figure 7.3. Number of patients waiting longer than six months for dental care,Finland, October 2006 to March 2012
Source: National Institute for Health and Welfare in Finland (2012).1 2 http://dx.doi.org/10.1787/888932754122
10
9
8
7
6
5
4
3
2
1
0
31 December 2008 31 December 2009 31 December 2010 31 December 2011
Interna
l
medici
ne
Anaes
thesio
logy
Gen
eral s
urgery
Neu
rosu
rgery
Gyn
aeco
logy a
nd ob
stetri
cs
Pae
diatri
cs
ENT (
ear, n
ose a
nd th
roat)
Oph
talmolo
gy
Pho
niatri
cs
Den
tistry
Skin
dise
ases
Onc
ology a
nd ra
diotio
n the
rapy
Psy
chiat
rics
Ado
leasc
. and
paed
. psy
chiat
ry
Neu
rolog
y
Pae
diatri
c neu
rolog
y
Lun
g dise
ases
Others
30 000
25 000
20 000
15 000
10 000
5 000
010/2006 3/2007 10/2007 3/2008 10/2008 3/2009 10/2009 3/2010 10/2010 3/2011 3/201210/2011
WAITING TIME POLICIES IN THE HEALTH SECTOR: WHAT WORKS? © OECD 2013142
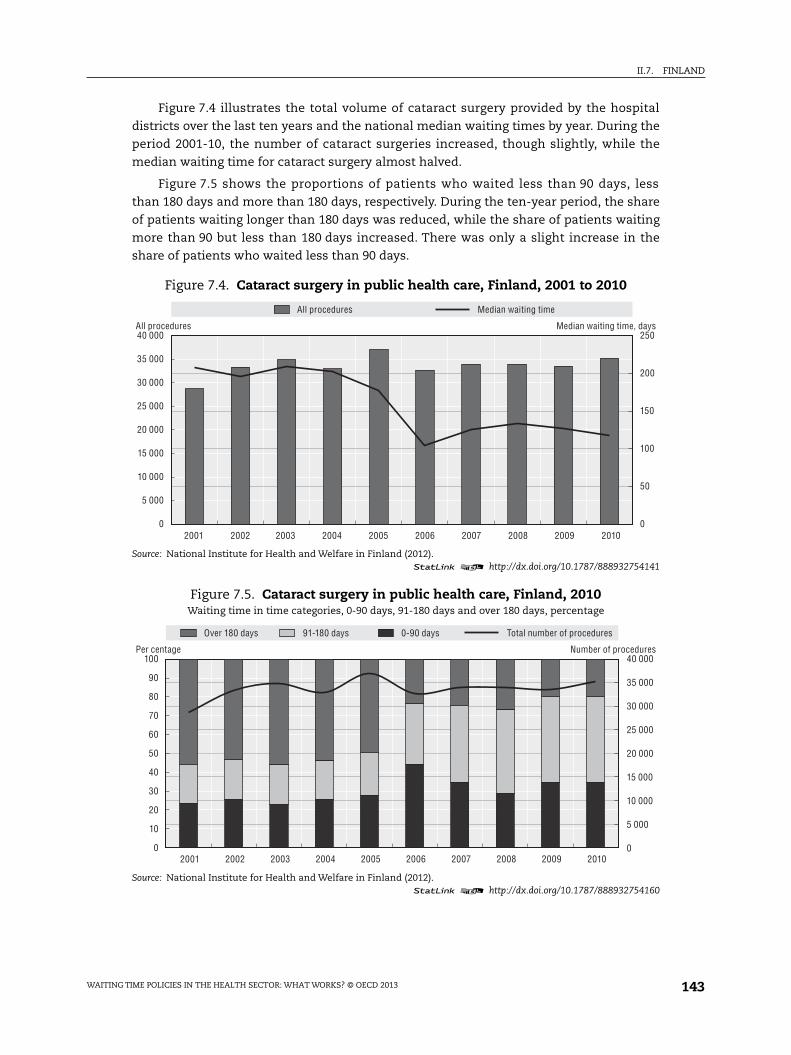
II.7. FINLAND
Figure 7.4 illustrates the total volume of cataract surgery provided by the hospital
districts over the last ten years and the national median waiting times by year. During the
period 2001-10, the number of cataract surgeries increased, though slightly, while the
median waiting time for cataract surgery almost halved.
Figure 7.5 shows the proportions of patients who waited less than 90 days, less
than 180 days and more than 180 days, respectively. During the ten-year period, the share
of patients waiting longer than 180 days was reduced, while the share of patients waiting
more than 90 but less than 180 days increased. There was only a slight increase in the
share of patients who waited less than 90 days.
Figure 7.4. Cataract surgery in public health care, Finland, 2001 to 2010
Source: National Institute for Health and Welfare in Finland (2012).1 2 http://dx.doi.org/10.1787/888932754141
Figure 7.5. Cataract surgery in public health care, Finland, 2010Waiting time in time categories, 0-90 days, 91-180 days and over 180 days, percentage
Source: National Institute for Health and Welfare in Finland (2012).1 2 http://dx.doi.org/10.1787/888932754160
40 000
35 000
30 000
25 000
20 000
15 000
10 000
5 000
0
250
200
150
100
50
02001 2002 2003 2004 2005 2006 2007 2008 2009 2010
All procedures Median waiting time
Median waiting time, daysAll procedures
100 40 000
35 000
30 000
25 000
20 000
15 000
10 000
5 000
0
90
80
70
60
50
40
30
20
10
02001 2002 2003 2004 2005 2006 2007 2008 2009 2010
Over 180 days 91-180 days 0-90 days Total number of procedures
Per centage Number of procedures
WAITING TIME POLICIES IN THE HEALTH SECTOR: WHAT WORKS? © OECD 2013 143

II.7. FINLAND
In Figure 7.6, the data for 2010 are disaggregated by hospital district. No clear-cut
correlation can be observed between the procedure rates reported by individual hospital
districts and the regional accessibility of surgery in terms of median waiting times.
To live up to the requirements of the Health Care Guarantee, many hospital districts
have taken measures to increase the volume of services available to the population. These
have included overtime work, which is compensated by extra payment schemes, the
outsourcing of services, the renewed organisation of hospital activities, as well as
increasing the resources for surgical activities. The latter can be made possible by
e.g. increasing the hospital districts’ prices for their services.
The number of publicly funded operations carried out by private providers increased
after the introduction of the guarantee. At the same time, the share of privately funded
patients operated on by private clinics decreased (Pekurinen et al., 2008; Mikkola, 2011).
More recently, the introduction of patient vouchers for cataract surgery, e.g. in Helsinki and
Uusimaa hospital district, under the Act on Service Vouchers (569/2009), has made it
possible to combine public and private funding of services.
Before the introduction of the Health Care Guarantee, it was hypothesised that the
guarantee might reduce the costs of National Health Insurance, as sick leaves due to
waiting times for orthopaedic operations, for example, would fall. The observed reduction
in costs turned out to be very small, approximately EUR 2 million, for the 14 major
procedures analysed in the follow-up study (Pekurinen et al., 2008). These savings were
marginal in comparison to the EUR 50 million ear-marked to support the reform.
DiscussionThe construction of the Finnish Health Care Guarantee can be regarded as relatively
conservative, as it allows waiting times that are longer than in many comparable countries.
Figure 7.6. Cataract surgery in public health care hospital districts, Finland, 2010
Note: Data on median waiting time missing from one hospital district.Source: National Institute for Health and Welfare in Finland (2012).
1 2 http://dx.doi.org/10.1787/888932754179
16
14
12
10
8
6
4
2
0
180
160
140
120
100
80
60
40
20
0
Procedures per 1 000 population Median waiting time
HUS
Pirk
anmaa
n shp
Poh
jois-P
ohjan
maan s
hp
Kes
ki-Suo
men sh
p
Kan
ta-Häm
een s
hp
Kes
ki-Poh
janmaa
n shp
Lap
in sh
p
Vaasa
n shp
Varsina
is-Suo
men sh
p
Itä-S
avon
shp
Län
si-Poh
jan sh
p
Etelä-
Karjala
n shp
Kainuu
n shp
Etel
ä-Poh
janmaa
n shp
Pohjoi
s-Sav
on sh
p
Sata
kunn
an sh
p
Pohjoi
s-Karj
alan s
hp
Kym
enlaa
kson
shp
Päijät-
Hämee
n shp
Etelä-
Savon
shp
All procedures per 1 000 inhabitants Median waiting time, days
WAITING TIME POLICIES IN THE HEALTH SECTOR: WHAT WORKS? © OECD 2013144

II.7. FINLAND
This poses another problem as well: complying with the maximum waiting times of
three weeks, three months or six months is in practice often interpreted as “success”,
although these limits really define only a minimum level of performance. At least in theory,
setting up conservative maximum waiting time rules might be counterproductive to
improving access to health care. Furthermore, such limits do not take into account the
optimal waiting time for individual surgical procedures or specific patient groups, as
motivated by medical or cost-effectiveness arguments.
Nevertheless, the reported queues and waiting times for hospital care have clearly
become shorter, although achieving this has involved a bumpy road characterised by
“rubber-banding” related to the use of threats of disciplinary action by the supervisory
bodies. The supervisory actions probably tend to lead to ad-hoc solutions so as to avoid
penalties, but do not guarantee the permanent improvements needed in the structure,
organisation and/or management of care. Little by little, however, they may have
contributed to necessary changes in the health care organisations. The exact character of
potentially effective measures has, nevertheless, not been studied.
The reduction in waiting times may also have been enforced by other major trends in
the health sector: increased attention to health care issues at the national level; a general
improvement in transparency and accountability; increased use of performance
measurement data within provider organisations; patient empowerment and the
increased freedom of choice of hospitals; and greater diversity in the production of
services.
The national monitoring of queues, waiting times and hospital productivity has been
intensified and the quality has improved during the past decade. This has given the
supervisory and other bodies information to act upon in order to live up to the Health Care
Guarantee. From a longer time perspective, intensified national monitoring has probably
been one of the positive consequences of the Health Care Guarantee. Nevertheless, there
are problems with the monitoring. One of these problems is, at least in theory, that under
the threat of penalties, the hospitals and hospital districts have an interest in manipulating
the measurements and waiting times that they report. One way of doing this is to postpone
placing new patients on waiting lists when the waiting time statistics are looking bad. This
could mask a situation where the patients´ actual waiting times from their first contact
with the health service to the receipt of treatment might be as long as before. It is thus
necessary to include the date of first contact in the routine patient statistics in order to
monitor the real waiting times for hospital care and any changes in them.
From an equity point of view, and considering the large regional variations in practice
associated with the extremely decentralised structure and organisation of the Finnish
health care system, the establishment of national criteria for access to non-emergency
care seemed well-motivated. In practice, however, the differences have not been evened
out, and it is questionable whether steering by information is sufficiently robust to
counteract variations based on local resources and decision-making. Also, the
concentration of private producers of e.g. cataract surgery in the larger cities may add to
inequities in the access to services.
One positive finding reported initially by primary care users of the national guidelines
was improved information to patients, i.e., the guidelines had been helpful when
discussing what one can expect from the publicly funded health care system. The
guidelines can also be seen as the first initiative to define the Finnish publicly funded
WAITING TIME POLICIES IN THE HEALTH SECTOR: WHAT WORKS? © OECD 2013 145

II.7. FINLAND
“service basket”, the definition of which will be needed when transposing the EU Patient
Directive into the country’s health care legislation. An MSAH decision has recently been
taken to update and extend the guidelines.
ConclusionsIn summary, the Health Care Guarantee, combined with the threat of penalty fines,
seems to have reduced waiting times in Finland, at least to some extent. Due to other
parallel developments in the health sector, as well as to problems related to the reliable
monitoring and reporting of waiting times, it has not been possible to estimate the actual
impact of the Guarantee. There is limited research on other possible consequences of the
reform, e.g. whether resources have been re-allocated from the treatment of chronic
patient groups in need of repeated hospital specialist care (e.g. patients with rheumatoid
diseases) to patients placed on waiting lists for first-time admission. Despite an initial
follow-up study, the economic consequences of the reform have not been calculated. Based
on the evidence today, we do not find it possible to draw any inferences about the overall
impact of the Health Care Guarantee on the equity and efficiency in health care. Better
systems are needed for monitoring waiting times from the patient’s first contact to the
receipt of the prescribed treatment.
References
Hurst, J. and L. Siciliani (2003), “Tackling Excessive Waiting Times for Elective Surgery: A Comparisonof Policies in Twelve OECD Countries”, OECD Health Working Papers, No. 6, OECD Publishing, Paris,http://dx.doi.org/10.1787/108471127058.
Kapiainen, S., M. Peltola, U. Häkkinen and H. Rättö (2012), “The Use and Usability of DRG in Europe” (inFinnish), Report No. 43/2012, National Institute for Health and Welfare (THL), Helsinki.
Mikkola, H. (2011), “The Social Insurance Institution’s Model for Financing Health Care” (in Finnish),Paper presented at the Finnish Health Economics Conference, Helsinki, February.
Ministry of Social Affairs and Health (1995), “Objectives and Principles of Municipal Social and HealthCare (1995). National Plan for the Organization of Social and Health Care for the Years 1996 to 1999”(in Finnish), Helsinki.
Ministry of Social Affairs and Health (2008), “National Development Plan for Social and Health CareServices”, Kaste Programme 2008-2011, Helsinki.
Ministry of Social Affairs and Health (2005 and 2010), “Uniform Criteria for Access to Non-EmergencyTreatment” (in Finnish), Reports of the Ministry of Social Affairs and Health No. 2010:33, Helsinki.
National Institute for Health and Welfare in Finland (2012), “Health Expenditure and Financing 2010”,Statistical Report No. 5/2012, National Institute for Health and Welfare in Finland (THL), Helsinki.
OECD (2012), OECD Health Data 2012, OECD Publishing, Paris, http://dx.doi.org/10.1787/health-data-en.
Pekurinen, M., H. Mikkola and U. Tuominen (eds.) (2008), “The Economics of the Health CareGuarantee. Impact on Healthcare Costs, Activities, and Reimbursement from the National HealthInsurance” (in Finnish), Stakes Report, No. 2008:5.
Siciliani, L. and J. Hurst (2005), “Explaining Waiting Times Variations for Elective Surgery across OECDCountries”, OECD Economic Studies, Vol. 38, No. 1, pp. 95-123, http://dx.doi.org/10.1787/eco_studies-v2004-art5-en.
Supervisory Authority for Welfare and Health (Valvira) (2012), “Access to Non-Emergency Care. Plan forNational Supervision 2012-2014” (in Finnish), Helsinki.
Vuorenkoski, L. and I. Keskimäki (2004), “Ensuring Access to Health Care”, Health Policy Monitor, April,available at www.hpm.org/survey/fi/a3/3.
Vuorenkoski, L., P. Mladovsky and E. Mossialos (2008), “Finland: Health System Review”, Health Systemsin Transition, Vol. 10, No. 4, pp. 1-168.
WAITING TIME POLICIES IN THE HEALTH SECTOR: WHAT WORKS? © OECD 2013146

Waiting Time Policies in the Health Sector
What Works?
© OECD 2013
PART II
Chapter 8
Ireland
by
Valerie Moran,
Health Division, OECD,
Charles Normand,
Centre of Health Policy and Management, Trinity College Dublin
and
Alan Smith,
Special Delivery Unit, Department of Health, Ireland
Long waiting times to access health services have characterised the Irish healthsector from the early 1990s. These waiting times may in part arise from the complexinteraction of public and private finance and delivery that is characteristic of theIrish health services. The major policy initiatives implemented to reduce waitingtimes have been in the form of additional dedicated funding. Maximum waitingtime targets were also introduced, but these were not accompanied by penalties fornon-fulfilment. While the first major policy initiative – the Waiting List Initiative –granted additional funding to public hospitals, its successor – the NationalTreatment Purchase Fund – instead channelled funding predominantly to privatehospitals. Recently, a new Special Delivery Unit has been established in order toreduce waiting times for scheduled and unscheduled care in Irish hospitals byadopting an approach based on performance management and capacity building.
147

II.8. IRELAND
IntroductionInitiatives to tackle the problem of long waiting times have been a feature of Irish
health policy since the early 1990s. In 1993, the Waiting List Initiative (WLI) was introduced
to reduce the numbers of patients waiting for excessively long periods of time for elective
surgery in the public sector. Although originally intended as a short-term initiative, the
WLI continued until 2003, when it was replaced by the National Treatment Purchase Fund
(NTPF). The NTPF differed from its predecessor by targeting patients waiting longer than
three months on an individual patient level rather than on a hospital (or provider) level and
by purchasing treatment for this group primarily in the private sector both in Ireland and
the United Kingdom. However, like its predecessor, the NTPF also failed to fully resolve the
waiting times issue, and it is currently being phased out to make way for a new Special
Delivery Unit (SDU). This chapter will outline the evolution of both the WLI and NTPF and
examine the relative strengths and weaknesses of both as formulae to solve the waiting
times issue in Ireland during the 1990s and 2000s.
Main characteristics of the Irish health system
Financing
The Irish health system is a mix of both public and private institutions and funders. It
is primarily tax-financed (80%), with the remainder of funding coming from out-of-pocket
payments (12%) and private insurance (8%) (Normand, 2011).
Eligibility
Eligibility for health services in Ireland is primarily based on residency and means.
Any person, regardless of nationality, who is ordinarily resident in Ireland is entitled to
either full eligibility (Category I, i.e. medical card holders) or limited eligibility (Category II)
for health services. To qualify for Category I eligibility, one must be considered to be unable
without undue hardship to arrange services for oneself and one’s dependents.
Persons in Category I (medical card holders) have full eligibility for the following
services:
● General practitioner services provided under the General Medical Service scheme.
● Approved prescribed drugs and medicines.
● All in-patient public hospital services in public wards, including consultants’ services.
● All out-patient public hospital services, including consultants’ services.
● Dental, ophthalmic and aural services and appliances.
● Maternity and infant care service.
About one-third of the population has Category I eligibility. Any person ordinarily
resident in Ireland who does not have Category I eligibility qualifies for Category II
eligibility. Persons in Category II are entitled, subject to certain charges, to all in-patient
WAITING TIME POLICIES IN THE HEALTH SECTOR: WHAT WORKS? © OECD 2013148

II.8. IRELAND
public hospital services in public wards, including consultants’ services, and out-patient
public hospital services, including consultants’ services. Subject to means-testing, some
persons in Category II can take avail of free GP services by obtaining a GP visit card.
Approximately 3% of the population has a GP visit card.
The Department of Health (DoH), under the direction of the Minister of Health
(together with Ministers of State), has strategic responsibility for health and personal social
services. In 2005, a new Health Service Executive (HSE) took responsibility for both the
budget and management of health services as a single national entity, accountable directly
to the Minister of Health. This replaced a system where the provision of services had been
the responsibility of seven regional health boards and the Eastern Regional Health
Authority (ERHA) (serving the Dublin area) (McDaid et al., 2009).
Acute hospitals
In 2010, there were 100 hospitals (comprised of general [acute] hospitals, approved
psychiatric centres and specialty hospitals), of which 26 were for-profit privately owned
hospitals. Under current arrangements, 80% of beds in publicly funded hospitals are
designated for public patients (Categories I and II), while 20% are designated for private
patients (both privately insured and out of pocket). About half of private acute beds are
located in public hospitals, with the remaining half located in private hospitals. The total
number of private acute beds in both private and public hospitals equates to approximately
one-third of all available acute hospital beds. The rationale for this public/private mix is to
ensure that the public and private sectors can share resources, clinical knowledge, skills
and technology (Department of Health and Children, 2001). However, evidence suggests
that these rules are not strictly applied, and some acute public hospitals have apparently
been able to overcome restrictions imposed on them in relation to the volume of private
practice (O’Reilly and Wiley, 2011).
Hospital remuneration
Public hospitals receive funding from the Health Service Executive on a global budget
basis (McDaid et al., 2009; Brick et al., 2010). Annual global budgets are determined on an
historic basis, with some adjustment for inflation, pay adjustments and one-off funding. A
subset of these public hospitals participate in the National Casemix Programme, under
which their global budgets are prospectively adjusted using diagnosis-related groups (DRGs)
(O’Reilly et al., 2011). Patients who opt to be treated privately by their consultant and occupy
private or semi-private accommodation in Irish public hospitals are liable for the per diem
accommodation charge and the charge equivalent to the statutory in-patient charge. In
addition to these, such patients are also liable for other charges such as MRI charges and
their medical consultant’s fees, the latter of which is paid directly to the consultant clinician.
Most, though not all, patients who occupy private or semi-private accommodation are
holders of private health insurance, and therefore in most cases it is insurance companies
that reimburse the hospital for the treatment provided (Department of Health and Children,
2010a). If patients do not hold private health insurance, they incur out-of-pocket payments
for these charges. The use of a per-diem system for private treatment in public hospitals may
incentivise insurers to have more complex patients treated in public hospitals, as they are
charged by the day and not in relation to the cost of the resources consumed, as would be the
case in private hospitals. A recent report published by the Department of Health and
Children (2010) concluded that the current per diem reimbursement system is not the
WAITING TIME POLICIES IN THE HEALTH SECTOR: WHAT WORKS? © OECD 2013 149

II.8. IRELAND
optimal arrangement for the reimbursement of public hospitals for treatment of private
patients treatment, and it recommended that this system be replaced by a per case system
using DRGs (Department of Health and Children, 2010a). A number of initiatives are currently
in place or underway to enable the introduction of a prospective case-based funding system
for public hospital care (Department of Health, 2012a).
Specialist remuneration
The common contract for medical consultants (specialists) in publicly funded
hospitals specifies that medical consultants are entitled to engage in private practice
within the public hospital or hospitals in which they are employed. Moreover, if their public
contract permits, it is possible for medical consultants to combine their public hospital
commitments with private practice in other public or private hospitals. Consultants
(specialists) in public and voluntary hospitals are employed under the “Common Contract
for Medical Consultants” and are paid on a salaried basis. Consultants operating purely in
the private sector are paid on a fee-for-service basis. The majority of hospital consultants
in public hospitals (over 90%) also have private practice privileges and are paid on a fee-for
service basis for the treatment of private patients. The fees for private patients paid out by
the three principal health insurers are set out in fee schedules. The current system (agreed
in 2008) features three types of contract. Under a Type A contract, consultants are paid a
public salary and have no possibility of earning private fee income, while Type B contracts
allow consultants to engage in privately remunerated professional medical practice in
public hospitals, but state that at least 80% of their clinical/patient output must be public
patients. Type C contracts apply only in exceptional situations and allow the appointee to
treat private patients outside public hospitals. There are also provisions for additional
payments for extra activity, such as working on a weekend or being on call (McDaid et al.,
2009). In 2010, salaried specialists in Ireland were paid 3.76 times the average national
wage (OECD, 2012).
Co-payments
Category I public in-patients receive services free of charge. Category II public
in-patients are subject to a daily overnight charge of EUR 75 per night, up to a maximum of
EUR 750 in any 12 consecutive months. Attendance at accident and emergency
departments is subject to a charge of EUR 100 whenever the patient does not have a referral
note from his/her doctor. This charge applies only to the first visit in any episode of care.
Under the Drugs Payment Scheme, an individual or family in Ireland has to pay up to
EUR 132 each month for approved prescribed drugs, medicines and certain appliances for
use by that person or his or her family in that month. Medical Card holders are subject to a
charge of 50 cents per prescription, up to a monthly ceiling of EUR 10 per person/family.
Private health insurance
A large proportion of the population (47%) who already have Category II eligibility also
subscribe to voluntary private health insurance (PHI). This is provided primarily by
three companies, which collectively account for 96% of the market. Private health
insurance plays both a complementary and supplementary role in Ireland. It provides
coverage against charges levied on non-Medical Card holders for in-patient bed use,
together with a more limited reimbursement of some out-of-pocket charges in the primary
care sector. However, PHI also allows subscribers to bypass waiting lists for in-patient
WAITING TIME POLICIES IN THE HEALTH SECTOR: WHAT WORKS? © OECD 2013150

II.8. IRELAND
services by obtaining a private bed and consultant treatment within a public hospital or by
undergoing full treatment in a private facility (McDaid et al., 2009). The latter seems to be
the primary rationale for purchasing PHI, as it provides an assurance that subscribers can
access hospital care when they need it, without undue waiting and with care from a
medical consultant of their choice (Nolan and Nolan, 2005). Private health insurance
contributions have traditionally attracted tax relief at source, which is currently provided
at 20% of the health insurance premiums (Department of Health, 2012a).
Primary care
In 2011, there were 75 GPs per 100 000 population, accounting for 18% of physicians
(OECD, 2012). Persons in Category I register with a physician of their choice from a list of
contracted physicians. Persons in Category II are free to choose any GP or specialist and pay
in full. GPs are paid by capitation for Category I patients and by fee-for-service for
Category II patients. In 2009, self-employed GPs in Ireland were paid 3.37 times the
national average wage (OECD, 2012).
Surgical procedures
For a number of procedures, Ireland has experienced a shift in provision from in-
patient to day-case surgery. In terms of procedures conducted only on an in-patient basis,
percutaneous coronary interventions (PTCA and stenting) as well as knee replacement
have seen a large increase over the time period 2000-09 while coronary bypass,
appendectomy and hip replacement have seen decreases, which have been relatively
minor in the case of the latter two.
Table 8.1. Surgical procedures per 100 000 population,Ireland, 2000 and 2010
Surgical procedures by ICD-9-CM 2000 2010% change
in surgical proceduresbetween 2000 and 2010
Cataract surgery:
In-patient 153.5 21.4 -86.1
Day-case 72.1 174.8 142.4
Tonsillectomy with or without adenoidectomy:
In-patient 160.5 83.9 -47.7
Day-Case 0.9 1.3 44.4
Percutaneous coronary interventions (PTCA and stenting) – in-patient 46.1 89.7 94.6
Coronary bypass: in-patient 34.1 21.6 -36.7
Appendectomy: in-patient 160.4 157.9 -1.6
Cholecystectomy:
In-patient 99.9 93.6 -6.3
Day-case 2.3 13.0 465.2
Laparoscopic cholecystectomy:
In-patient 79.2 81.9 3.4
Day-case 2.3 12.8 456.5
Inguinal and femoral hernia:
In-patient 95.8 48.1 -49.8
Day-case 25.4 35.2 38.6
Hip replacement: in-patient 132.2 121.5 -8.1
Knee replacement: in-patient 28.6 44.2 54.5
Source: OECD (2012), OECD Health Data 2012, OECD Publishing, Paris, http://dx.doi.org/10.1787/health-data-en.1 2 http://dx.doi.org/10.1787/888932754901
WAITING TIME POLICIES IN THE HEALTH SECTOR: WHAT WORKS? © OECD 2013 151

II.8. IRELAND
Health expenditureTotal health spending accounted for 9.2% of GDP in 2010, slightly less than the OECD
average of 9.5%. The recent recession initially led to a big rise in the health spending share
of GDP, from 7.8% in 2007 up to 9.9% in 2009, as GDP fell sharply in 2008 and in 2009 while
health spending continued to grow. But in 2010, a sharp reduction in health spending led
to a decrease in the health spending share of GDP. Despite these cuts, health spending per
capita in Ireland remains above the OECD average, with an average of USD 3 718 in 2010
(adjusted for purchasing power parity) compared with an OECD average of USD 3 268
(OECD, 2012).
PhysiciansIn 2010, Ireland had 3.1 physicians per 1 000 population, which is equal to the OECD
average.
Ageing and life expectancyThe percentage of the population aged 65 and over has increased slightly from 11.2 in
2000 to 11.5 in 2010. On the other hand, life expectancy has increased from 76.6 years in
2000 to 81 years in 2010.
Health reformIn 2011, a new government entered office with the intention of undertaking significant
health service reform by introducing a universal health insurance (UHI) system by 2016. The
proposed reform will make health insurance with a public or private insurer compulsory,
with insurance payments related to ability to pay. The state will pay insurance premia for
people on low incomes and subsidise premia for people on middle incomes. There will be a
choice between competing insurers, and a system of risk equalisation will be introduced
(Department of the Taoiseach, 2011). The aim of the legislation is to ensure “equal access to
care for all”, thereby avoiding “discrimination between patients on the grounds of income or
insurance status”. The proposed reform is largely a response to the incremental
development of a “two-tier” health system, whereby appropriate access to care is often
determined by financial means rather than clinical need, and to other key weaknesses in the
system, including inefficiency and limited capacity in infrastructure and human resources
(Thomas et al., 2010). The mission of the national reform programme is to improve the access
to and quality of health care services in Ireland, whilst living within the available resources.
Measurement of waiting lists and waiting timesPublic hospital waiting lists and waiting times are available on a national basis on a
database called the Patient Treatment Register (PTR). The information in the database is
based on waiting list information received directly from hospitals for public in-patients and
day-case care. The waiting time is that of patients “on the list”, thus it is a “census” type
measure that counts the number of people waiting on a particular date and the length of
time they have been waiting up to that date. The “median” wait time is reported for selected
specialities. The standardised collection and reporting of out-patient waiting times has
commenced in 2012.
Past policies to tackle waiting times in IrelandThe two major past policy initiatives to reduce waiting lists and times focused on
dedicated funding to public and private hospitals in an effort to increase activity.
WAITING TIME POLICIES IN THE HEALTH SECTOR: WHAT WORKS? © OECD 2013152

II.8. IRELAND
Maximum waiting time targets were also introduced, but these were not accompanied by
penalties in the case of non-fulfilment.
Waiting List Initiative
The Waiting List Initiative (WLI) introduced maximum waiting time targets and
additional funding for public hospitals in order to reduce waiting lists. The WLI was
established by the Department of Health and Children (DoHC) in 1993. The WLI was
originally intended as a short-term initiative that was intended to reduce the significant
numbers of public patients waiting excessively long periods for elective (i.e. non-
emergency) hospital procedures (Comptroller and Auditor General, 2005). Prior to the WLI,
there were no national targets on waiting times for elective treatment. However, the new
WLI set specific targets that stipulated that adults would not have to wait longer than
12 months for treatment in certain specialties and that children would not have to wait
longer than 6 months (Comptroller and Auditor General, 2003).
In order to achieve these targets, the DoHC allocated funding under the WLI to
individual health boards and voluntary hospitals. The purpose of this funding was to pay
for procedures for patients who had spent a long time on waiting lists for a number of
selected treatment specialties.1 A view existed that there was not a significant problem of
long waiting times for other specialties, and hence they were not included under the
initiative. Consequently, the target maximum waiting times specified for the WLI
specialties did not apply to patients waiting for treatment in other specialties (ibid.).
The money provided under the Initiative was additional to the normal funding for
acute hospital services, and therefore was intended to fund procedures additional to those
procedures performed using normal funds. In order to eliminate waiting beyond the target
times, it was intended that the WLI funding would be:
● Performance-related, i.e. it was designed to incentivise the performance of extra procedures.
● Targeted specifically at patients waiting longer than target times in the selected specialties.
● Ring-fenced, i.e. kept separate from other funding of elective procedures.
Annual expenditure on the WLI averaged around EUR 12.6 million during the period
1994 to 1998. Funding increased significantly from 1998 and plateaued at around
EUR 44 million in 2000 and thereafter (Comptroller and Auditor General, 2003).
As part of the WLI, the DOHC started to collect and compile national data supplied by
individual hospitals on the number of patients waiting three months or more for
treatment. This data revealed that, despite the introduction of the WLI, from the end of
1994, there was an upward trend in the reported number of patients waiting. This trend
continued until 1999, when the overall total number of patients waiting reached around
37 000. By the end of 2001, this number had fallen to 26 000, but it rose again to 29 000 by
the end of 2002 (ibid.). Furthermore, for most of this period, the numbers of patients with
long waiting times moved in parallel to the overall numbers waiting, suggesting little
prioritisation of the target group.
Evaluations of the WLI
Two major evaluations of the WLI were carried out in 1998 and 2003 in order to assess
its performance, in particular in terms of value for money.
WAITING TIME POLICIES IN THE HEALTH SECTOR: WHAT WORKS? © OECD 2013 153

II.8. IRELAND
1998 Review Group
As a result of the upward trends in both overall numbers waiting and the WLI target
group, in April 1998 the Minister for Health and Children established a Review Group whose
remit was to examine the operation of the WLI and to make recommendations on how best
to maximise its effectiveness. The group presented its report in July 1998 and made a set of
short-term, medium-term and long-term recommendations that they believed were
required if waiting lists and waiting times were to be reduced substantially. While some of
the recommendations related specifically to the WLI, others related to broader health system
factors that contributed to the waiting list problem. Recommendations of note included: the
increased use of day surgery; increasing the capacity of acute care, long-term care and
rehabilitation facilities; improving information systems and WLI data; improved co-
ordination of care; better bed management; and the development of national and/or local
level protocols for the validation and prioritisation of cases. The group proposed that all of its
recommendations should be implemented during the period 1998-2001.
The Review Group also investigated the financial incentives facing hospitals under the
WLI. Between 1993 and 1998, the DoHC distributed WLI funding to providers in one annual
allocation mid-year. However, the group suggested that this practice could act as a
disincentive to hospitals to improve their waiting list performance, as an improvement in
performance would lead to a reduction in WLI funding (Payne, 1998). Therefore a
proportion of total WLI funding could be retained by the department for distribution to the
hospitals that showed the greatest reduction in waiting times in target specialties. Thus,
the group recommended that the available annual funding under the Initiative be
distributed in two phases. The majority of funding would be allocated in the first phase, as
this would enable service providers to plan activities to better address the problem of long
waiting times. The remainder would then be awarded during the second phase to the
service providers with the best performance record, so as to increase the positive incentive
effect of the funding. Consequently, almost three-quarters of the WLI funding in
subsequent years was allocated at the start of each year, along with general acute hospital
funding allocations, with the remaining funding awarded mid-year.
Comptroller and Auditor General (2003)
In 2003, the Comptroller and Auditor General carried out a value-for-money
examination of the activity of the WLI between 1998 and 2002 (Comptroller and Auditor
General, 2003). This examination focused on four main areas:
1. How the WLI funding was used.
2. The impact of the WLI on the target group of long-waiting patients.
3. The monitoring and management of waiting times and waiting lists.
4. The absorption of WLI funding in “core” hospital funding.
Allocation and use of WLI funding. In order to avail of WLI funding, service providers
were required to outline proposals that typically specified the expected number of additional
elective procedures to be carried out; the types of activities proposed to achieve these extra
procedures; and in some cases the expected unit cost of the additional procedures. In
response to the proposals submitted, the Department/ERHA (Dublin health authority) then
notified the service providers of the amount of funding provided, and approved the elements
WAITING TIME POLICIES IN THE HEALTH SECTOR: WHAT WORKS? © OECD 2013154

II.8. IRELAND
of the proposals that were deemed acceptable. The related projected numbers of procedures
to be carried out were regarded as performance targets to be achieved.
In allocating WLI resources, the DoHC stated that it took into account several factors,
including: the population of the health board area; the reported total number of patients on
the waiting list in each hospital; the capacity of each hospital to increase the elective
procedures activity level – internally or through purchasing services from external sources;
past performance of the hospital in reducing its waiting list; and temporary consultant posts
in the hospital funded under the WLI. However, the Comptroller and Auditor General found
that the specific reasons for allocating amounts of funding to individual service providers
were not formally recorded. Consequently, it proved difficult to discern the precise factors
that were influential in the allocation decisions and the weighting given to each.
Interestingly, one factor not directly taken into account in allocating the available
WLI funding was the number of long-waiting patients in each hospital. Analysis of the
amounts allocated to regions and to individual hospitals revealed that, in practice, there
was no direct relationship between funding and the number of patients in the target group.
This practice most likely reflected a wish to avoid 1) providing funding to hospitals that
were unable, due to capacity or other constraints, to increase the level of elective activity
to provide treatment for long-waiting patients; and 2) providing a negative incentive to
hospitals to keep waiting lists long in order to attract additional funding.
However, a substantial proportion of WLI funding was directed at service providers who
consistently reduced their reported number of long-waiting patients and maintained this
reduction – even to the point of virtually eliminating the waiting list. This implied that those
service providers were rewarded for previous success, and any positive incentives inherent
in WLI funding to providers that still experienced a long-waiting problem were reduced.
WLI funding was primarily used to fund the following activities:
● Waiting list management.
● Hospital bed management.
● Increased output using existing capacity (e.g. overtime, keeping wards open).
● Expansion of in-house hospital capacity (e.g. funding temporary consultant posts).
● Purchasing external capacity and procedures.
Impact of WLI on the target group. Between the start of 1998 and the end of 2002, the
reported number of patients waiting longer than the target maximum waiting times for
elective treatment decreased by 39%. However, it was not until 2001 that the reduction of
waiting times began to be achieved at a faster rate for the target group than for the other
patients, suggesting that there was little prioritisation of target group patients prior to 2001.
The Comptroller and Auditor General criticised the DoHC for this lack of prioritisation
as reflected in a failure to stipulate that all patients waiting longer than target times should
be treated before patients waiting less than the target times. The DoHC responded to this
criticism by stating that it would have been impossible to direct that the target group
take absolute treatment precedence without reference to clinical decision-making
or prioritisation. This implies that clinical prioritisation took precedence over
WLI prioritisation.
WAITING TIME POLICIES IN THE HEALTH SECTOR: WHAT WORKS? © OECD 2013 155

II.8. IRELAND
Monitoring and managing waiting time. Several recommendat ions to improve
performance measurement and the management of waiting lists and waiting times were
made by the Comptroller and Auditor General:
● The collection and reporting of average and maximum waiting time rather than numbers
of patients waiting.
● Greater accuracy and consistency between hospitals in reporting waiting lists and
waiting time.
● The measurement and monitoring of waiting time for an out-patient appointment.
● The establishment and periodic review of milestones and deadlines in order to achieve
clear and achievable performance targets.
● The benchmarking of waiting time for public patients in public hospitals against waiting
time for private patients in the same hospitals.
● The improvement of public reporting of data on waiting for elective treatment in order
to assist GPs in making choices about referrals for consultations.
Absorption of WLI funding in “core” hospital funding. Perhaps the most str ik ing
disclosure of the Comptroller and Auditor General report was the implication that WLI
funding had become absorbed into “core” hospital budgets in many hospitals. In relation to
WLI output, it emerged that there were no effective systems either to distinguish the
procedures undertaken with WLI funding from core-funded procedures or to relate the
movement in the target group to the funding sources. Moreover, the overall level of elective
in-patient treatment actually fell between 1998 and 2001, which suggests that the WLI did
not result in an increase in elective in-patient activity over and above existing levels in
those hospitals. Instead, it may in effect have partly compensated for a reduction in core-
funded elective in-patient activity. In practice, this had the effect of further blurring the
distinction between WLI procedures and core-funded elective in-patient procedures.
Similarly, there was no routine comprehensive reporting of the cost of WLI activities.
While there were separate accounting mechanisms for some of the WLI activities, the cost
of activities was generally included in existing cost centres, and thus could not be
distinguished from core-funded activities. In addition, WLI funding was used in many
hospitals to fund temporary consultant posts on an ongoing basis. However, the
Comptroller and Auditor General revealed that when the Department of Health and
Children approved the employment of staff on a temporary basis, i.e. funded by the WLI, it
did not specify that the staff were required to provide services primarily or exclusively for
patients waiting longer than the target maximum waiting times. By 2002, up to half of WLI
funds were being allocated to staffing, which substantially reduced the level of flexibility
available to the Department to target the WLI funds to long-waiting patients in other
hospitals. Moreover, many of these posts subsequently became permanent. Consequently,
funding originally intended to be ring-fenced by the WLI instead became part of core
hospital funding, used to fund ongoing elective treatment capacity.
HOPE Report
In 1998, HOPE (the European Hospital and Healthcare Federation) published a report on
“Measures to Reduce Waiting Lists” that examined measures taken in recent years to
WAITING TIME POLICIES IN THE HEALTH SECTOR: WHAT WORKS? © OECD 2013156

II.8. IRELAND
reduce hospital surgical waiting lists in Ireland, Finland and Spain (HOPE, 1998). It made
several recommendations pertinent to the WLI, including:
● A move to prioritisation of patients according to clinical need, not length of wait.
● The routine monitoring of out-patient waiting times (in particular, the length of time
waited from GP referral until seen in an out-patient clinic and the length of time from
referral until definitive treatment). This would help to ensure that the focus on reducing
in-patient waiting times was not at the expense of longer out-patient waiting times.
● The central role of clinicians should be formalised in the management structure of
Waiting List Initiatives and, if possible, consultant contracts should take due cognisance
of their role in managing resources.
● Greater involvement of GPs in prioritisation and Waiting List Initiatives.
2001 Health Strategy: “Quality and Fairness: A Health System for You”
In 2001, the Department of Health and Children issued a new health strategy, “Quality
and Fairness: A Health System for You”. While the strategy recognised the relative success
of the WLI in substantially reducing waiting times in a number of specialities, it also
acknowledged that unacceptably long waiting times for public patients remained for some
elective hospital procedures, while excessive waiting times in accident and emergency and
out-patient departments were also a problem (Department of Health and Children, 2001).
The strategy posited that issues related to capacity, efficiency and equity were central
to the intractability of the waiting times issue and hence put forward a number of actions
to improve performance in these three areas (Department of Health and Children, 2001).
A key initiative proposed to increase efficiency was the establishment of a “new
Treatment Purchase Fund... to help reduce waiting times”, which became known as the
“National Treatment Purchase Fund” (NTPF). The strategy also set the following specific
targets with respect to waiting times:
● by the end of 2002, no adult will wait longer than 12 months and no child will wait longer
than six months to commence treatment following referral from an out-patient
department;
● by the end of 2003, no adult will wait longer than six months and no child will wait
longer than three months to commence treatment following referral from an out-patient
department; and
● by the end of 2004, no public patients will wait longer than three months for treatment
following referral from an out-patient department.
A new National Hospitals Agency would also be established which would develop a
national waiting time database. This database would help channel patients awaiting
treatment to an appropriate hospital with sufficient capacity and would underpin the
operation of the new treatment purchase fund (see below). In addition, guidelines would be
developed for the referral and prioritisation of patients within and between specialties,
especially those with long waiting times.
The strategy also stipulated that the admission of private patients for elective surgery
in a particular speciality could be suspended if the maximum target waiting time for public
patients had been exceeded until such time as the target waiting time was re-achieved.
However, there also existed a clause providing that such action could be set aside if
WAITING TIME POLICIES IN THE HEALTH SECTOR: WHAT WORKS? © OECD 2013 157
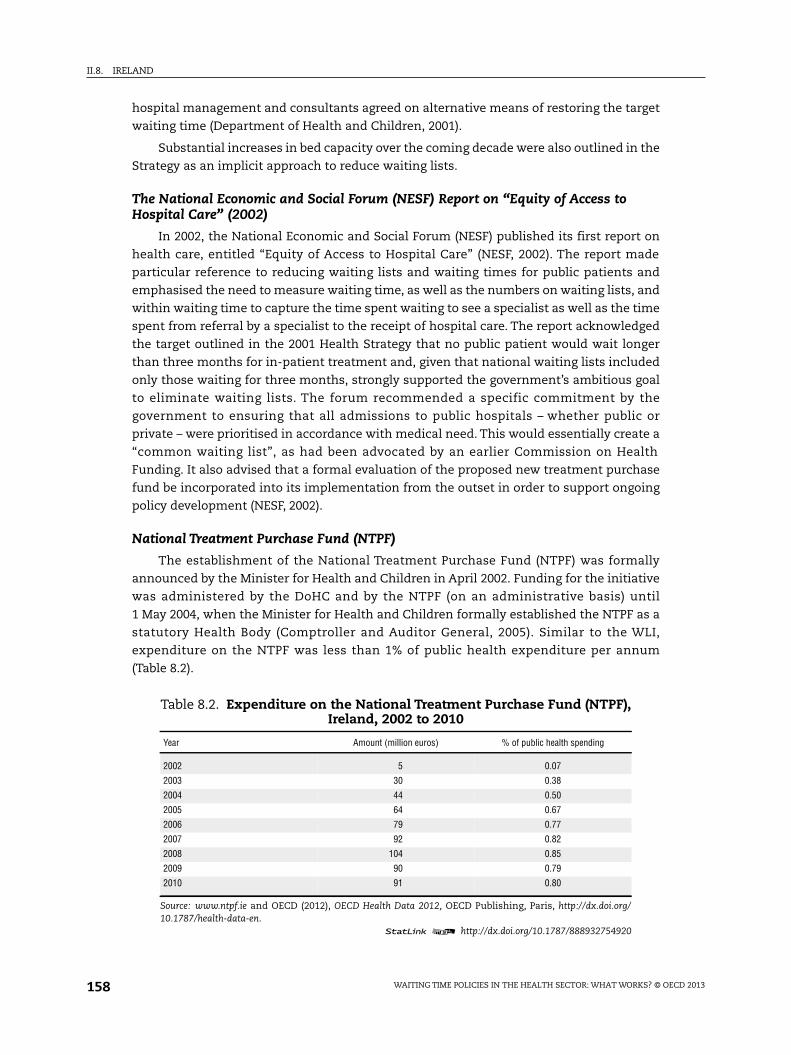
II.8. IRELAND
hospital management and consultants agreed on alternative means of restoring the target
waiting time (Department of Health and Children, 2001).
Substantial increases in bed capacity over the coming decade were also outlined in the
Strategy as an implicit approach to reduce waiting lists.
The National Economic and Social Forum (NESF) Report on “Equity of Access toHospital Care” (2002)
In 2002, the National Economic and Social Forum (NESF) published its first report on
health care, entitled “Equity of Access to Hospital Care” (NESF, 2002). The report made
particular reference to reducing waiting lists and waiting times for public patients and
emphasised the need to measure waiting time, as well as the numbers on waiting lists, and
within waiting time to capture the time spent waiting to see a specialist as well as the time
spent from referral by a specialist to the receipt of hospital care. The report acknowledged
the target outlined in the 2001 Health Strategy that no public patient would wait longer
than three months for in-patient treatment and, given that national waiting lists included
only those waiting for three months, strongly supported the government’s ambitious goal
to eliminate waiting lists. The forum recommended a specific commitment by the
government to ensuring that all admissions to public hospitals – whether public or
private – were prioritised in accordance with medical need. This would essentially create a
“common waiting list”, as had been advocated by an earlier Commission on Health
Funding. It also advised that a formal evaluation of the proposed new treatment purchase
fund be incorporated into its implementation from the outset in order to support ongoing
policy development (NESF, 2002).
National Treatment Purchase Fund (NTPF)
The establishment of the National Treatment Purchase Fund (NTPF) was formally
announced by the Minister for Health and Children in April 2002. Funding for the initiative
was administered by the DoHC and by the NTPF (on an administrative basis) until
1 May 2004, when the Minister for Health and Children formally established the NTPF as a
statutory Health Body (Comptroller and Auditor General, 2005). Similar to the WLI,
expenditure on the NTPF was less than 1% of public health expenditure per annum
(Table 8.2).
Table 8.2. Expenditure on the National Treatment Purchase Fund (NTPF),Ireland, 2002 to 2010
Year Amount (million euros) % of public health spending
2002 5 0.07
2003 30 0.38
2004 44 0.50
2005 64 0.67
2006 79 0.77
2007 92 0.82
2008 104 0.85
2009 90 0.79
2010 91 0.80
Source: www.ntpf.ie and OECD (2012), OECD Health Data 2012, OECD Publishing, Paris, http://dx.doi.org/10.1787/health-data-en.
1 2 http://dx.doi.org/10.1787/888932754920
WAITING TIME POLICIES IN THE HEALTH SECTOR: WHAT WORKS? © OECD 2013158

II.8. IRELAND
The remit given to the Fund was to focus on those patients waiting longest for hospital
procedures and to purchase treatment for them primarily in the private hospital system in
Ireland, Northern Ireland and Britain. It could also make use of any capacity within public
hospitals to arrange treatment for patients, but any NTPF work undertaken in public
hospitals was to be over and above core-funded activity and could not displace the normal
duties of these hospitals. Moreover, while consultants were discouraged from
predominantly treating patients from their own public hospital waiting lists, exceptions
were allowed in relation to the treatment of children and in certain cases for reasons of
procedural or patient complexity (Comptroller and Auditor General, 2005).
Patients could be referred to the NTPF by their GP, hospital or consultant, and they
could also contact the NTPF directly. In order to be eligible for referral it was necessary for
patients to have waited for at least three months on an in-patient or day-case waiting list.
Referrals by hospitals were the source of over 90% of the NTPF treatments provided each
year. In cases where treatment was provided in Britain or Northern Ireland, the NTPF also
organised and funded travel and accommodation for the patient and an accompanying
person (Comptroller and Auditor General, 2005). By funding long-waiting patients on an
individual basis, the NTPF was seen as removing the disadvantages to this group that were
inherent in the WLI, i.e. reducing funding allocated to service providers that did not meet
previous activity targets or did not have sufficient capacity to carry out extra procedures
(Comptroller and Auditor General, 2003).
The NTPF negotiated service level agreements for the provision of various
treatments with private hospitals on an annual basis and on a longer cycle with public
hospitals. The agreements provided for an all-inclusive rate of charge for each type of
procedure and other terms and conditions such as the details of participating
consultants. Prices for each procedure were negotiated individually with each hospital
based on standard surgery with a defined period of hospital accommodation where
required. In cases where the length of stay was exceeded, there was a provision for some
degree of risk-sharing (Comptroller and Auditor General, 2009). In negotiating prices of
treatment, the NTPF used Casemix2 as a benchmark when appropriate to the treatments
being procured. However, Casemix was not all-inclusive of all services provided to NTPF
patients, such as routine pre- and post-operative visits and tests for specific procedures;
nor in some instances did it take account of capital costs and depreciation costs in the
case of private hospitals (Comptroller and Auditor General, 2005). Patients approved for
treatment by the NTPF were then allocated to client hospitals, taking into account
considerations such as the location of the patient, hospital capacity, procedure price and
degree of medical complexity.
Table 8.3 shows the relative impact of the NTPF in terms of the total number of elective
in-patient treatments provided in public hospitals in the years 2005-08 and the additional
treatments arranged and funded by the NTPF. It becomes immediately apparent that the
number of elective treatments provided by the NTPF was only a minor proportion of the
total number provided.
WAITING TIME POLICIES IN THE HEALTH SECTOR: WHAT WORKS? © OECD 2013 159

II.8. IRELAND
Evaluation of the NTPF
The Comptroller and Auditor-General published several reports into the activity of the
NTPF. The findings of these reports can be summarised under three broad headings:
● Costs and prices.
● Hospital referral patterns.
● Waiting list management.
Costs and prices
The first investigation by the Comptroller and Auditor General revealed a large
variation in the negotiated prices of the eight most common procedures arranged by the
NTPF in 2004. For example, there was a difference of 217% between the lowest and highest
prices paid for skin lesions treated on a day-case basis (Table 8.4).
Hence, it is unclear whether the NTPF took advantage of spare capacity in a cost-
effective manner. A subsequent evaluation by the Comptroller and Auditor General
concluded that relative to the Casemix benchmark, procedures purchased from private
hospitals by the NTPF generally cost less than those carried out in the publicly funded
hospital system. However, the prices actually charged for some cases were subject to ex-
post increases. On the other hand, the prices agreed by public hospitals were 25% lower
than their private counterparts with almost no ex-post adjustments. However, strict
comparisons between the private and public sectors is difficult, as public hospital charges
to the NTPF did not explicitly include consultant remuneration, as consultants received a
public salary (Comptroller and Auditor General, 2009; Brick et al., 2010).
Table 8.3. Elective treatments, Ireland, 2005 to 2010
Public hospital treatments NTPF treatments Percentage of patients treated
2005 450 953 14 580 3.23
2006 511 924 16 931 3.31
2007 631 987 19 769 3.13
2008 657 806 20 829 3.17
Source: Comptroller and Auditor General (2009), Accounts of the Public Services 2008, Government of Ireland, Dublin.1 2 http://dx.doi.org/10.1787/888932754939
Table 8.4. Comparison of prices under the National Treatment PurchaseFund (NTPF) for the eight most common procedures, Ireland, 2004
ProcedurePercentage highest exceeded lowest
Inpatient Day case
Cataracts 87 76
Varicose Veins (one leg) 61 44
Total hip replacement (excluding revisions) 72 -
Skin lesions 126 217
Coronary angiogram 0 20
Total knee replacement (excluding revisions) 71 -
Grommets (< 17 years) 54 -
Laparascopic cholecysectomy 215 206
Source: Comptroller and Auditor General (2005), Annual Report 2004, Government of Ireland, Dublin.1 2 http://dx.doi.org/10.1787/888932754958
WAITING TIME POLICIES IN THE HEALTH SECTOR: WHAT WORKS? © OECD 2013160

II.8. IRELAND
Hospital referral patterns
In examining the referral patterns of hospitals operating under the NTPF, the
Comptroller and Auditor General focused on:
1. The extent to which NTPF procedures were carried out in private or public hospitals.
2. The extent to which patients were treated in the same hospital from which they were
referred, albeit via the NTPF.
3. The reasons behind the above.
In 2004, 44% of referrals for the eight most common procedures were to public hospitals.
36% of these procedures were carried out in the same public hospital from which the referral
had been made. The Comptroller and Auditor General also established that the NTPF did not
systematically record information relating to the referring consultant and the consultant
carrying out the surgical procedure, a measure that would have guarded against the risk of
excessive self-referral. However, the NTPF maintained that it knew both the referring and
treating consultants. Reasons given for “self-referrals” included limited private sector
capacity for certain specialities, e.g. paediatrics, and clinical or patient complexity, which
made it preferable for the patient to be treated by the same consultant in the hospital in
which they were on the waiting list. When the NTPF was first introduced, the use of public
capacity could account for 30% of total NTPF activity, once public core service planned
activity was not compromised. However, in subsequent years the use of public facilities by
the Fund was limited to 10% of total referrals for treatment (Comptroller and Auditor
General, 2005). The rationale for the 10% cap was to limit the private use of public beds, to
curtail consultants referring and treating their own patients and to allow for the treatment
of patients who were not suitable for referral elsewhere (Accounts of the Public Services,
2010).
From the data supplied for the 2010 Report of the Comptroller and Auditor General, it
was ascertained that for 8.5% of treatments provided under the NTPF, the consultant
referring and treating the patient was the same, with 3.7% provided in a public setting and
4.8% provided in a private setting.
Waiting List Management
In 2005, the NTPF developed and implemented a National Patient Treatment Register
(NPTR) in order to:
● Track the progress achieved in reducing waiting times.
● Provide the health care system with an accessible and accurate tool for waiting list data
that could also be used to reconcile changes in patient status.
● Inform patients and GPs about prospective waiting times and referral choices.
● Assist in reducing waiting times to achieve the Health Strategy commitment that all
patients on in-patient and day-case waiting lists would be treated within three months.
The data for this register was supplied to the NTPF by individual hospitals, which were
also responsible for validating and changing patient status on the system.
The 2008 Accounts of Public Services investigated the validation of this data
(Comptroller and Auditor General, 2009). The validation process revealed that fewer than
10% of those listed as waiting longest for elective treatment were actually available for
treatment under the NTPF scheme, primarily because hospitals did not follow up on
patients who failed to respond to previous contacts, and some patients should have been
WAITING TIME POLICIES IN THE HEALTH SECTOR: WHAT WORKS? © OECD 2013 161

II.8. IRELAND
temporarily or permanently removed from the list. Up to 37% of patients were reported by
their own hospital as unsuitable for treatment elsewhere due to clinical reasons, while a
significant number of patients who had been waiting over nine months were recorded by
their hospital as unwilling to accept an offer of private treatment under the NTPF scheme.
In 2009, the Report of the Comptroller and Auditor General revealed that 28% of long-
waiting patients were considered to be suitable only for treatment in their own hospital.
The report also highlighted the need to examine why public hospitals lacked the capacity
to treat this group, given that they appeared to have the capacity to treat the vast majority
of shorter-waiting patients within a more acceptable timeframe. This observation points to
the potential negative incentives created by the Fund for public hospitals to delay treating
long-waiters in the knowledge that eventually the Fund would pick up the tab.
While the number of patients waiting for over 12 months at the end of 2008 was quite
evenly spread across age groups and procedure categories, these patients were heavily
concentrated in a small number of hospitals, indicating an opportunity for the NTPF to
pursue a focused partnership approach that could benefit the long-term list. The Report of
the Comptroller and Auditor General for the following year (2009) noted once again that a
small number of hospitals accounted for a large percentage of the longest waiters but also
revealed that some of these hospitals did not take up all the slots available to them from
the NTPF for that year.
Data from the NPTR shows that, during the time the NTPF was in operation, the
number of patients actively waiting over 12 months declined dramatically (Table 8.5), while
the median wait time also decreased (Table 8.6). The decline of the former is most likely
due to some cleaning of the waiting list by removing patients no longer available for
treatment from the list.
Table 8.5. Total number and percentage of patients actively waiting for surgicalprocedures, Ireland, 2006 to 2010
Year3-6 months 6-12 months Over 12 months Total
Number % Number % Number %
2006 5 540 37.0 4 675 31.0 4 881 32.0 15 096
2007 6 511 42.9 4 587 30.2 4 096 26.9 15 194
2008 6 291 49.9 4 839 38.4 1 481 11.7 12 611
2009 6 444 59.4 4 070 37.5 330 3.04 10 844
2010 6 712 56.0 4 842 40.4 432 3.6 11 986
Source: National Patient Treatment Register www.ptr.ie/Pages/ptrHome.asp.1 2 http://dx.doi.org/10.1787/888932754977
Table 8.6. Median wait time, Ireland, 2007 to 2010
YearMedian wait time all procedures
(months)Median wait time surgical
proceduresMedian wait time medical
procedures
2007 3.5 3.5 3.5
2008 2.9 2.9 2.9
2009 2.4 2.5 2.2
2010 2.5 2.6 2.1
Source: National Patient Treatment Register www.ptr.ie/Pages/ptrHome.asp.1 2 http://dx.doi.org/10.1787/888932754996
WAITING TIME POLICIES IN THE HEALTH SECTOR: WHAT WORKS? © OECD 2013162

II.8. IRELAND
A recent report on Resource Allocation and Financing in the Health Sector
recommended that the mainstreaming of the purchaser/provider split pioneered by the
NTPF would remove the conflict between the Health Service Executive and its own
hospitals. The HSE would develop new contracts to fund health care providers
transparently on a prospective basis and thus reward quality of care and cost efficiency
throughout the system. This would remove the need for the NTPF to continue to purchase
services to reduce waiting lists and indeed eradicate the need for a specific programme for
waiting lists per se. However, the monitoring of waiting lists and times would continue to
ensure that targets were met (Minister for Health and Children, 2010b).
Emergency wait timesIn 2009, the Comptroller and Auditor General published a special report examining
HSE emergency departments (EDs) (Government of Ireland, 2009). One of the main findings
of this Special Report was that the waiting time for bed accommodation following
decisions to hospitalise emergency patients was unsatisfactorily long in most cases. The
report outlined the recent targets set by the HSE with respect to ED wait times:
● 2006: no patient should wait for a hospital bed for more than 24 hours after the decision
to admit. However, an analysis by the Health Information and Quality Authority (HIQA)
in 2008 suggested that a number of hospitals regularly failed to meet this target.
● 2007: a maximum 12-hour target for the time elapsed between decisions to admit and
the provision of a bed for the patient.
● 2009: a target of a total waiting time of 6 hours from the registration of the patient in the
emergency department to admission or discharge.
A comparison of the average waiting time for admission from emergency departments
during January to May 2008 with the same period in 2009 revealed that there had been an
increase in the number of patients waiting 12 hours or more. 46% of patients were waiting
12 hours or more in early 2009. Moreover, the majority of hospitals examined had more
than 25% of patients waiting more than the six-hour target.
The report recommended that some of the pressure on emergency departments could
be alleviated by better management of discharges and an increase in day-case activity.
Moreover, the report highlighted the lack of diagnostic facilities in the community and long
waiting times for out-patient appointments, which consequently led GPs to refer patients to
hospital emergency departments. In order to address this issue, a Community Diagnostic
Initiative was developed in late 2005 to improve access for GPs to particular diagnostic
services in response to concerns about waiting times for access to x-ray and ultrasound. The
initiative was developed within four regional areas between January and December 2007 and
was provided with an allocation of EUR 6 million towards running costs. However, the
implementation of the initiative was halted despite its success in reducing waiting times
(Government of Ireland, 2009).
A new approach – the Special Delivery Unit (SDU)A new division within the Department of Health, the Special Delivery Unit (SDU),
became operational in September 2011. The SDU is intended to play a central role in the
national health reform programme and unblock access to acute services by improving the
flow of patients through the health system. The SDU’s initial priorities encompass waiting
times for emergency departments; in-patient and day-case waiting times; out-patient
WAITING TIME POLICIES IN THE HEALTH SECTOR: WHAT WORKS? © OECD 2013 163

II.8. IRELAND
waiting times (the time from GP referral to an appointment with a consultant); and access
to diagnostics (Department of Health, 2011).
There are two fundamental ways in which the SDU approach is designed to be
different to previous efforts at tackling waiting lists. The first is to move to a model of
performance management based on outcomes, rather than on inputs or processes. This
means that the measures the SDU will take to determine whether an organisation is being
led appropriately will be measures that reflect outcomes for patients or clients, or evidence
of effective resource management. These measures will take priority over other measures
of inputs, such as activity, although these nonetheless remain important for contract
management purposes. Secondly, the SDU will initiate processes to monitor all of the key
priorities in a way that is both systematic and frequent. Each of the priorities is essential to
improve services for patients and the stability of the system as a whole. Because of this,
poor performance on any of the key priorities will not go unaddressed in any organisation
for any length of time.
The initial key priorities for the hospital system in Ireland can be expressed in three
points:
● To deliver improvements in the quality of care delivered.
● To improve access across the four key domains of emergency departments, in-patient
and day-case waiting, out-patient waiting and diagnostics.
● To reduce costs and improve the management of financial performance so as to ensure
organisational and system stability.
The SDU has implemented a number of new initiatives to tackle waiting times,
including the use of Statistical Process Control techniques to establish patterns and trends
in Emergency Departments and a resource reallocation of almost EUR 5 million to
16 hospitals for targeted measures to reduce the number of patients waiting during the
winter holiday period (Department of Health, 2012a). The SDU has also established the
following targets:
● By the end of 2011, no patients would wait longer than 12 months; 95% of all hospitals
met this target.
● 2012: no patient to wait longer than nine months for elective treatment in hospitals, no
patient to wait longer than nine hours on a trolley and 95% of patients to wait no longer
than six hours.
In March 2012, the Department of Health published a Statement of Strategy 2011-14.
This document affirmed waiting times for emergency departments, elective, out-patient
and diagnostic services; waiting times for access to safe stroke thrombolysis; and waiting
times for access to interventional cardiology for ST elevation myocardial infarction (STEMI)
and non-STEMI cases as key measures of performance for acute hospitals (Department of
Health, 2012b).
ConclusionsIn 1993, the Irish Government introduced the first strategic policy to reduce the
number of patients waiting for unacceptably long times for elective procedures in the
public sector. While originally intended as a short-term initiative, the Waiting List Initiative
(WLI) continued until 2003, by which time it had been funded on an annual basis to a total
cost of EUR 290 million. However, up to half of the funding from the WLI was generating
WAITING TIME POLICIES IN THE HEALTH SECTOR: WHAT WORKS? © OECD 2013164
II.8. IRELAND
activity that was indistinguishable from activity funded through the normal budgetary
processes applicable in the publicly funded health sector, implying that WLI funding had
been subsumed into “normal” hospital funding. Moreover, the WLI continued to fund
hospitals where the waiting list had been practically eliminated, while the numbers of
long-waiting patients remained stubbornly high in other hospitals. Essentially, the WLI
funded institutions and not additional activity per se.
The introduction of the National Treatment Purchase Fund (NTPF) in 2002 aimed to
remove any negative incentives inherent in the WLI by treating long-waiters on an
individual basis, primarily by utilising capacity in the private sector in order to avoid
double-funding the public sector. However, the NTPF also contained implicit negative
incentives for the public sector by offering alternative private sector treatment for the
longest waiters at no extra cost to patients or no penalty to public providers. Moreover, it
may not have been the most efficient way of improving delivery and performance if
patients were eventually treated in private hospitals at a much higher cost to the public
purse (McDaid et al., 2009). The proportion of overall elective treatments attributable to the
NTPF was approximately 3%, which raises the question of whether NTPF funding would
have been better invested in raising public sector capacity and/or efficiency to provide
these additional treatments. The use of public funds to buy treatment in the private sector
also raises equity issues, as the NTPF resource flow gave rise to cross-subsidisation that
was not necessarily in the direction of rich to poor (Smith and Normand, 2009).
Both the WLI and NTPF failed to prioritise the longest waiters and also neglected to
measure individual provider performance in order to hold providers accountable for any
improvement in waiting times. Moreover, they were both designed as short-term solutions
to a problem that is inherently structural and long-term. This may explain why both policy
initiatives remained in place much longer than originally intended. This also implies that
the resolution of the waiting times issue in Irish public hospitals will ultimately require a
sustainable system, where processes are implemented to ensure that providers are held
accountable and performance measured and fairly rewarded. The current health reform
and Special Delivery Unit (SDU) both intend to introduce structures and processes which
ensure that providers will no longer have an incentive to prolong waiting lists and times.
Notes
1. Cardiac surgery; ear, nose and throat (ENT); general surgery; gynaecology; orthopaedics;ophthalmology; plastic surgery; urology; vascular surgery.
2. Casemix is a programme to collect, categorise and interpret data related to the types of casestreated in the public hospital system. Casemix categorises each hospital caseload and allows thecomparison of activity and costs between different hospitals. Hence, it provides a commonlanguage for service planning, management and development that is meaningful to bothclinicians and managers (Comptroller and Auditor General, 2005).
References
Accounts of the Public Services (2010), Report of the Comptroller and Auditor General. Volume 2,Government of Ireland, Dublin.
Brick, A., A. Nolan, J. O’Reilly and S. Smith (2010), Resource Allocation, Financing and Sustainability inHealth Care: Evidence for the Expert Group on Resource Allocation and Financing in the Health Sector, ESRI,Dublin.
Comptroller and Auditor General (2003), The Waiting List Initiative, Government of Ireland, Dublin.
WAITING TIME POLICIES IN THE HEALTH SECTOR: WHAT WORKS? © OECD 2013 165

II.8. IRELAND
Comptroller and Auditor General (2005), Annual Report 2004, Government of Ireland, Dublin.
Comptroller and Auditor General (2009), Accounts of the Public Services 2008, Government of Ireland,Dublin.
Department of Health (2011), “Special Delivery Unit”, available at www.dohc.ie/about_us/divisions/special_delivery_unit.
Department of Health (2012a), Healthcare Reform in Ireland. A Summary of Programme for GovernmentCommitments and Reform Developments to Date, Department of Health, Dublin.
Department of Health (2012b), Department of Health Statement of Strategy 2011-2014, Department ofHealth, Dublin.
Department of Health and Children (2001), Quality and Fairness. A Health System for You, Government ofIreland, Dublin.
Department of Health and Children (2010a), Value for Money and Policy Review of the Economic Cost andCharges Associated with Private and Semi-Private Treatment Services in Public Hospitals, Government ofIreland, Dublin.
Department of Health and Children (2010b), Report of the Expert Group on Resource Allocation and Financingin the Health Sector, Government of Ireland, Dublin.
Department of the Taoiseach (2011), Programme for Government 2011, The Stationary Office, Dublin.
Government of Ireland (2009), Health Service Executive Emergency Departments Comptroller and AuditorGeneral Special Report, Government of Ireland, Dublin.
HOPE (1998), Measures to Reduce Surgical Waiting Lists, HOPE Co-Ordinating Sub-Committee, Brussels.
McDaid, D., M. Wiley, A. Maresso and E. Mossialos (2009), “Ireland: Health System Review”, HealthSystems in Transition, Vol. 11, No. 4, pp. 1-268.
National Economic and Social Forum (2002), “Equity of Access to Hospital Care”, Forum Report No. 25,National Economic and Social Forum, Dublin.
Nolan, A. and B. Nolan (2005), “Ireland's Health Care System: Some Issues and Challenges”, inT. Callan., A. Doris and D. McCoy (eds.), Budget Perspectives 2005, Economic and Social ResearchInstitute, Dublin.
Normand, C. (2011), “The Health Care System in Ireland: Controlling Growth in Expenditure andMaking the Best Use of Resources”, in Callan, T. (ed.), Budget Perspectives 2012, Economic and SocialResearch Institute, Dublin.
OECD (2012), OECD Health Data 2012, OECD Publishing, Paris, http://dx.doi.org/10.1787/health-data-en.
O’Reilly, J. and M. Wiley (2011), “Public and Private Utilisation of In Patient Beds in Irish Acute PublicHospitals”, Economic and Social Research Institute, Dublin.
O’Reilly, J., B. McCarthy and M. Wiley (2011), “Ireland: A Review of Casemix Applications within theAcute Public Hospital System”, in R. Busse, A. Geissler, W. Quentin and M. Wiley (eds.), Diagnosis-Related Groups in Europe Moving Towards Transparency, Efficiency and Quality in Hospitals, OpenUniversity Press, England.
Payne, D. (1998), “Ireland’s Waiting List Initiative is Failing”, British Medical Journal, Vol. 317, No. 1036.
Smith, S. and C. Normand (2009), “Analysing Equity in Health Care Financing: A Flow of FundsApproach”, Social Science and Medicine, Vol. 69, pp. 379-386.
Thomas, S., P. Ryan and C. Normand (2010), Effective Foundations for the Financing and Organisation ofSocial Health Insurance in Ireland, The Adelaide Hospital Society, Dublin.
WAITING TIME POLICIES IN THE HEALTH SECTOR: WHAT WORKS? © OECD 2013166

Waiting Time Policies in the Health Sector
What Works?
© OECD 2013
PART II
Chapter 9
Italy
by
Giovanni Fattore,
CERGAS and Department of Policy Analysis and Public Management, Bocconi University,
Giuliano Mariotti,
Rovereto Hospital, Local Health Unit APSS, Province of Trento
and
Vincenzo Rebba,
Department of Economics and Management, University of Padua
In Italy, waiting time is a critical issue for out-patient specialist care and diagnosticservices, and it is being tackled by national plans issued in the last decade. Mostregions improved patients’ access through better information on waiting times,process re-engineering and the creation of unified booking centres. In addition,important prioritisation criteria have been piloted to manage waiting time based onclinical criteria and professional judgment (for example, the Homogenous WaitingGroups pilots). However, actual policies, including the implementation of nationallegislation, vary across the regions, with some of them very active and others oftenlagging behind. Policies on co-payments, intramoenia dual practice and voluntaryinsurance also have substantial effects on waiting time. National and regional co-payments have likely reduced waiting time via the reduction of demand for nationalhealth services, but rather broad exemption criteria have limited their effect on themore affluent and healthier part of the population. The expansion of intramoenia dualpractice and the promotion of additional private health insurance could undermineaccess to the NHS basic health care package: the former may encourage doctors tobuild up long lists in their public practices so as to maintain demand for their privatepractice, whereas the latter may worsen equity of access to the NHS services.
167

II.9. ITALY
IntroductionThe Italian National Health Service (NHS), established in 1978 and reformed in the
1990s, is designed to provide national guarantees on the delivery of health care through a
decentralised system, with 19 regions and two autonomous provinces in charge of the
delivery system. Access to care is designed to be unrelated to social and economic
situations as well as to the place of residence; however, not all services are free at the point
of use, and large geographical disparities exist (Fattore and Torbica, 2010).
The reduction of waiting times for public health services was first mentioned in the
legislation founding the Italian NHS in 1978, and it is one of the objectives included in the
national health plans issued in the last decade. Several regions have adopted measures for
prioritising the delivery of care on the basis of clinical appropriateness and patient severity.
Nevertheless, access to public health care is still hampered by excessive waiting times, and
policies to reduce waiting time, both on the demand and supply sides, have generally had
only a limited impact.
Main characteristics of the Italian National Health SystemThe Italian NHS is institutionally decentralised. The national government sets the
basic package of health care (“LEA: livelli essenziali di assistenza”) to be guaranteed to
citizens, and the regions are mandated to offer that package with resources determined by
the state (Torbica and Fattore, 2005). The actual provision of the LEA is to be monitored and
guaranteed by each region on the basis of prioritisation criteria and maximum waiting
time targets for in-patient and out-patient care. Public health care expenditure is budgeted
each year by the national and regional governments and allocated to the regions on the
basis of the resident population and its age structure (Lo Scalzo et al., 2009). In theory, the
regions are fully accountable for any deficit incurred; in practice, however, regions running
deficits are bailed out by the national government and are subjected to a special regime
that requires cost containment measures and additional regional fiscal revenues.
Hospitals
Currently, hospital care is mainly delivered in independent public hospitals that
provide both out-patient and in-patient services. However, “local health units” (LHUs)
and the regions (the purchasers) also contract out services to private hospitals, which
may be for-profit or not-for-profit institutions (OECD, 2012). In 2010, Italy had
213 187 beds (3.52 per 1 000 population): 68% were located in publicly owned hospitals,
3.7% in not-for profits and the remainder (28%) in for-profit private hospitals (OECD,
2012). University hospitals and specialised hospitals have the status of “trusts” and are
formally separated from LHUs, and benefit from considerable financial independence.
Public hospitals without “trust” status are under the control of the LHUs but have some
financial and organisational autonomy within the LHU (Lo Scalzo et al., 2009).
WAITING TIME POLICIES IN THE HEALTH SECTOR: WHAT WORKS? © OECD 2013168

II.9. ITALY
Hospital remuneration
In 1992, the financing of hospital care was reformed through a switch from global
budgeting and per diem payment to a prospective, activity-based payment system for in-
patient and out-patient care. Since 1995, hospitals have been remunerated at regional rates
based on DRGs for in-patient care (both ordinary and day hospital) and on a fee-for-service
basis for out-patient care. Additional funding may also be provided by regions to support
“specific hospital activities” such as “emergency wards” and “teaching and research
activities”. The degree of competition potentially promoted by the prospective system is
strongly attenuated by “caps” set by the regions or LHUs on the maximum amount of
funding that each provider can receive. Funding rules for hospitals may differ significantly
among regions.
Specialist remuneration
NHS professionals working in public hospitals are government employees who are
paid on a salary basis augmented by various forms of performance-related payments.
Doctors are allowed to have “private” patients both inside (“intramoenia” = inside the walls)
and outside NHS facilities (De Pietro, 2006; Turchetti, 2009). Patients demanding
intramoenia services are generally charged full prices, with most of the revenue allocated
to the doctors as additional income. NHS organisations are often equipped with two
different booking systems, one for patients who demand free-of-charge services and the
other for those who are willing to pay for intramoenia services, typically in order to avoid
waiting and to have more freedom of choice. In 2010, the income of salaried specialists was
2.73 times the national average wage (OECD, 2012).
Co-payments
In-patient care and general practitioner (GP) services are free of charge, but
co-payments are generally required on pharmaceuticals, diagnostic procedures and
specialist visits. The landscape of co-payments and exemption criteria is rather complex
due to concurrent regional and national legislation.
Surgical activity
Between 2000 and 2009, cataract surgery has experienced the largest decrease in
procedures conducted on an in-patient basis out of all surgical procedures by ICD-9-CM
(Table 9.1); this reduction in hospital interventions has been balanced by the transition of
cataract surgery to an out-patient setting in many regions. A number of other procedures
have also experienced a move from in-patient to day-case surgery over this period. Of the
various surgical procedures performed as in-patient, knee replacement had the highest
growth rate (135.4%).
Primary care
Patients’ freedom to choose providers is an essential feature of the Italian NHS.
Patients are free to choose their GPs, who act as gatekeepers – and after a patient has been
referred, he or she can access the hospital or out-patient care centre of their choice. This
choice can be exercised across regions and includes private accredited providers. Since
2002, NHS and state-region agreements have invited regions and LHUs to use clinical
priority for access to secondary care (out-patient and in-patient).There were 0.76 GPs per
1 000 population in Italy in 2010 (OECD, 2012).
WAITING TIME POLICIES IN THE HEALTH SECTOR: WHAT WORKS? © OECD 2013 169
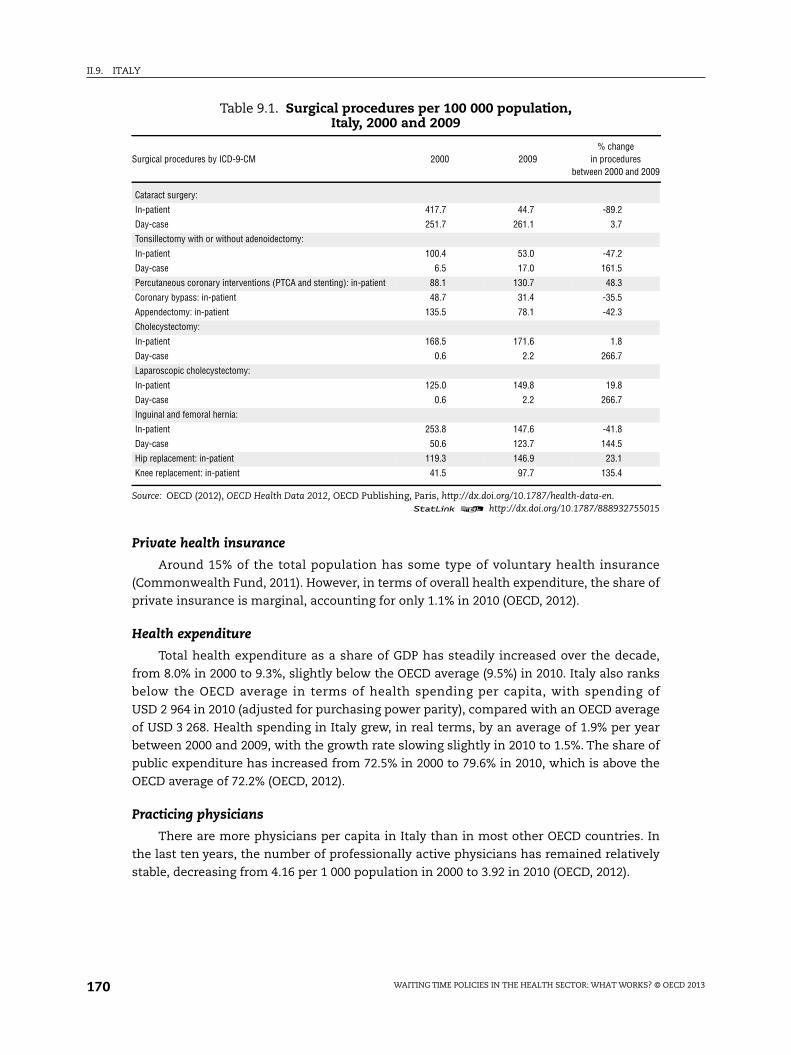
II.9. ITALY
Private health insurance
Around 15% of the total population has some type of voluntary health insurance
(Commonwealth Fund, 2011). However, in terms of overall health expenditure, the share of
private insurance is marginal, accounting for only 1.1% in 2010 (OECD, 2012).
Health expenditure
Total health expenditure as a share of GDP has steadily increased over the decade,
from 8.0% in 2000 to 9.3%, slightly below the OECD average (9.5%) in 2010. Italy also ranks
below the OECD average in terms of health spending per capita, with spending of
USD 2 964 in 2010 (adjusted for purchasing power parity), compared with an OECD average
of USD 3 268. Health spending in Italy grew, in real terms, by an average of 1.9% per year
between 2000 and 2009, with the growth rate slowing slightly in 2010 to 1.5%. The share of
public expenditure has increased from 72.5% in 2000 to 79.6% in 2010, which is above the
OECD average of 72.2% (OECD, 2012).
Practicing physicians
There are more physicians per capita in Italy than in most other OECD countries. In
the last ten years, the number of professionally active physicians has remained relatively
stable, decreasing from 4.16 per 1 000 population in 2000 to 3.92 in 2010 (OECD, 2012).
Table 9.1. Surgical procedures per 100 000 population,Italy, 2000 and 2009
Surgical procedures by ICD-9-CM 2000 2009% change
in proceduresbetween 2000 and 2009
Cataract surgery:
In-patient 417.7 44.7 -89.2
Day-case 251.7 261.1 3.7
Tonsillectomy with or without adenoidectomy:
In-patient 100.4 53.0 -47.2
Day-case 6.5 17.0 161.5
Percutaneous coronary interventions (PTCA and stenting): in-patient 88.1 130.7 48.3
Coronary bypass: in-patient 48.7 31.4 -35.5
Appendectomy: in-patient 135.5 78.1 -42.3
Cholecystectomy:
In-patient 168.5 171.6 1.8
Day-case 0.6 2.2 266.7
Laparoscopic cholecystectomy:
In-patient 125.0 149.8 19.8
Day-case 0.6 2.2 266.7
Inguinal and femoral hernia:
In-patient 253.8 147.6 -41.8
Day-case 50.6 123.7 144.5
Hip replacement: in-patient 119.3 146.9 23.1
Knee replacement: in-patient 41.5 97.7 135.4
Source: OECD (2012), OECD Health Data 2012, OECD Publishing, Paris, http://dx.doi.org/10.1787/health-data-en.1 2 http://dx.doi.org/10.1787/888932755015
WAITING TIME POLICIES IN THE HEALTH SECTOR: WHAT WORKS? © OECD 2013170

II.9. ITALY
Ageing and life expectancy
In 2009, life expectancy at birth in Italy was 82 years, more than two years above the
OECD average (79.8). The percentage of the population aged 65 and over has increased from
18.3% in 2000 to 20.8% in 2010 (OECD, 2012).
Waiting times for out-patient and in-patient careIn 2001, the Ministry of Health conducted the first national survey on waiting times for
out-patient and in-patient services (Ministero della Salute, 2002; Hurst and Siciliani, 2003,
p. 63). In 2006, a structured monitoring activity was launched by the National Agency for
Regional Health Services (Agenas). In the last three years, information has been
systematically collected from existing data sources on both in-patient care (using
information included in the hospital discharge form) and out-patient care. However, the
national database for monitoring waiting times is still in a trial stage, and no detailed
national reports are available. Some regions keep a registry of waiting times and report
data on their websites,1 whereas national surveys have been carried out either sporadically
or with restricted samples of patients.
To identify the causes and implications of waiting time in the Italian NHS, it is useful
to distinguish between three classes of service: in-patient care, out-patient medical care
and out-patient diagnostics. The waiting time for in-patient care appears less critical than
that for out-patient services. This may be due to a number of factors. First, the national and
regional tiers of the government agreed to prioritise some major interventions on the basis
of clinical criteria, and this contributed to significant reductions in waiting time in fields
such as oncology and cardio-surgery. Second, giving patients freedom of choice and basing
hospitals’ payment systems on diagnosis-related groups (DRGs) give incentives to
hospitals to increase the volume of care and to patients to shop around for a shorter
waiting time. Although the degree of competition has been reduced over time (Anessi and
Cantù, 2006), it still creates enough incentives to avoid excessive waiting times. Italian DRG
tariffs, although often not the only source of funding for public hospitals, greatly exceed
the variable costs and thus create clear incentives to fully use hospital capacity. Not all of
these reasons apply to out-patient care. Specialised medical care for out-patients
(e.g. cardiology visits) is not well reimbursed by the NHS; appropriateness criteria are less
clearly established for these types of services and patients’ demand is more elastic to the
prices of the NHS (co-payment) and to private options. For out-patient specialised medical
care, waiting time results from a) weak incentives to clear waiting lists for NHS-funded
organisations, b) strong incentives for doctors to maintain private care as an attractive
alternative, and c) weak institutional and organisational control systems. The situation of
out-patient diagnostic services lies somewhere in-between those of in-patient and out-
patient medical care. Tariffs tend to be more similar to costs, although economies of scale
are such that whether they are profitable strongly depends on the volume of services
delivered. Additionally, some specific diagnostic services have high unit costs and are thus
an easy target of specific policy and organisational interventions (e.g. caps on volumes and
guidelines). However, assuring appropriateness for the majority of diagnostic services
appears problematic, given the paucity of scientific evidence on the clinical impact and the
lack of information generated in out-patient settings.
WAITING TIME POLICIES IN THE HEALTH SECTOR: WHAT WORKS? © OECD 2013 171

II.9. ITALY
Here we provide recent data on waiting time, which is generally measured as “the
waiting time of the patients admitted for treatment from the waiting list” (Hurst and
Siciliani, 2003, p. 11).
The annual reports of the official national association of patients, the “Italian Court for
the Rights of the Patient” (ICRP), provide scant information at the national level. According
to the 2011 Report, approximately 16% of 23 524 patient complaints registered in 2010
concern excessive waits for access to public care (Tribunale per i Diritti del Malato, 2011,
p. 12). Generally, patients note a critical situation for out-patient specialist care (52.6% and
29.2% of the complaints for long waiting times are for diagnostics and specialist
consultations, respectively), with fewer complaints about waiting time for elective surgery
(19% of total complaints) (Tribunale dei diritti del Malato, 2011).2 Regarding increasing
waiting times for diagnostics, the most critical situations are reported for major imaging
tests such as Osseous Computerised Mineralography (OCM, 15 months), mammograms
(12 months), ultrasound (8.5 months), MRI, PET and CT scans (ten months on average).
Regarding specialist consultations, longer waiting times are reported for urology,
ophthalmology and cardiology (12, 8 and 7.5 months for a visit, respectively). However,
these waiting times reflect individual complaints, and are not the results of a survey on
waiting time; they therefore probably represent an overestimate of actual waiting times.
Further systematic evidence of waiting time comes from the CENSIS Foundation
survey on the levels of satisfaction of Italian citizens with their health care (Ministero della
Salute, 2010). The survey was conducted on a representative sample population of
1 184 adults who responded to a structured questionnaire over the phone. Table 9.2 reports
waiting times for diagnostic tests (number of days elapsing between the request and the
test day) and shows that 34.7% of the sample waited more than 1 month and 13.6% more
than three months.
Table 9.3 shows that reported waiting times are generally shorter for private
accredited facilities (27 days, on average, compared to 57 days for public facilities) and that,
apart from “other imaging tests” (only 3.9% of total tests), specific radiography tests
(mammograms, in particular) exhibit longer waits (approximately 83 days, on average,
with large differences according to the type of test).
Table 9.2. Waiting times for diagnostic tests by geographical area, Italy, 2009Percentage values and average number of days
How long did you wait on the public waiting list before getting a diagnostic test?
< 7 days 7-15 days 16-30 days 30-90 days > 90 days TotalAveragenumberof days
North-West 20.1 19.6 22.3 24.6 13.4 100 51
North-East 19.4 22.2 25 20.8 12.5 100 46
Centre 20 21.3 22.7 20 16 100 54
South-Isles 27.8 15.3 26.4 17.4 13.2 100 48
Italy 22.3 18.9 24 21.1 13.6 100 50
Source: Ministero della Salute (2010), “Cittadini e salute: La soddisfazione degli italiani per la sanità”, Quaderni delMinistero della Salute, No. 5, September-October.
1 2 http://dx.doi.org/10.1787/888932755034
WAITING TIME POLICIES IN THE HEALTH SECTOR: WHAT WORKS? © OECD 2013172

II.9. ITALY
The average waiting time for non-urgent in-patient care was approximately 2.2 months;
the longest waiting times were registered in the central regions (4 months and 2.9 months
for ordinary and day hospital admissions, respectively).
Most public health care organisations produce data for a number of publicly funded
specialist consultations and diagnostic tests that are considered more critical in terms of
waiting time. However, these data are usually produced separately for each organisation, and
therefore it is very difficult to aggregate them at the regional and national level. To our
knowledge, only the Emilia-Romagna region reports (on its web site) aggregate data on waiting
times for a number of out-patient treatments. In the last survey (October 2011), 53% of patients
overall were expected to wait less than 30 days, but 15% were expected to wait more than
three months.3 Longer waits (interventions for which more than 20% of the patients on the list
wait over three months) were reported for six diagnostic tests (head CT scan, spine MRI,
echodoppler, breast ultrasound, colonscopy and spirometry) and for five types of specialist
consultation (eye, gynecology, vascular surgery, gastroenterology and pneumology). According
to the same survey, for breast ultrasound and four types of specialist visit (eye, gynaecology,
gastroenterology and pneumology consultations), more than one-third of patients have to wait
more than 60 days. Short waits are registered for oncology consultations (45% of patients
waiting between zero and seven days, and 99% waiting 30 days or less); this is likely due to the
implementation of specific diagnostic and therapeutic pathways (DTPs) defined in the regional
plan for waiting list management, which contains target maximum waits for the diagnosis and
treatment of oncology-related diseases.
Past policiesPolicies to reduce waiting times in the Italian NHS can be grouped into two major
categories: 1) those explicitly created to address the issue, and 2) those that affect waiting
time indirectly.
Table 9.3. Waiting times for diagnostic tests by type of testand by type of provider, Italy, 2009
Average number of days
Public hospitalPublic outpatient
clinicNHS accreditedprivate facility
Total
Traditional X-rays 61 36 7 41
Other radiography tests (digital X-rays, fluoroscopy,mammography, angiography, coronography, etc.) 89 72 73 83
ECG (including Holter 24 h) 48 20 10 31
EEG (including Holter 24 h) 24 - 10 18
Echography(including echodoppler, echocardiography) 44 66 25 42
Endoscopy tests (gastroscopy, colonscopy, bronchoscopy, etc.) 46 73 78 54
CT scan 46 73 49 53
MRI 65 91 15 52
PET and other nuclear medicine tests 40 122 - 48
Other imaging tests 95 185 28 100
Total 57 57 27 50
Source: Ministero della Salute (2010), “Cittadini e salute: La soddisfazione degli italiani per la sanità”, Quaderni delMinistero della Salute, No. 5, September-October.
1 2 http://dx.doi.org/10.1787/888932755053
WAITING TIME POLICIES IN THE HEALTH SECTOR: WHAT WORKS? © OECD 2013 173
II.9. ITALY
Policies on managing and monitoring waiting timeIn 2002, an agreement between the State and the regions (accordo Stato-regioni,
11 luglio 2002) introduced two basic principles in the management of waiting lists: 1) the
appropriateness of out-patient and in-patient referrals according to evidence-based
medicine and 2) the prioritisation of out-patient and in-patient care based on clinical
criteria. According to these criteria, specific guidelines and maximum waiting time (MWT)
targets were determined for ten out-patient and in-patient interventions.4 However, failure
to meet the waiting time targets did not have any particular consequences for providers or
patients, even though a previous decree in 1998 (No. 124/98) introduced the principle that
whenever the waiting time for a particular treatment had exceeded the MWT target
established by the managers of local health units (LHUs), patients had the right to obtain
the provision of that treatment from private providers for free or to pay just the
co-payment. In reality, no region considered the MWT targets mandatory for LHU
managers.
From 2004 to 2006, AGENAS (the National Agency for Regional Services) co-ordinated a
national project that aimed to create a national framework to be adopted by all the regions
regarding the rules and information systems for waiting time.5 The recommendations in
the final document prepared by the working group include (AGENAS, 2006): 1) the
systematic monitoring of out-patient and in-patient waiting times; 2) the systematic
implementation of clinical priority setting; 3) the enforcement of regulations prohibiting
the practice of denying access to a waiting list (then enacted in an act by the Ministry of
Health); and 4) the monitoring of clinical pathways for several relevant conditions.
In 2006, the Ministry of Health also released a National Plan for the reduction of
waiting times (Piano Nazionale di Contenimento dei Tempi di Attesa), which set out guidelines
for legislative measures and further planning documents to be issued by the state and the
regions. In particular, this plan provides: 1) the maximum waiting times for 100 non-urgent
out-patient and in-patient treatments, including:6 49 treatments considered critical in
terms of need and access in oncology, cardiovascular disease, obstetrics and gynaecology
and geriatrics;7 six high-demand specialist consultations; and 45 other ambulatory and
in-patient procedures (37 out-patient treatments, five day-hospital procedures and
three surgical interventions); 2) the indications to set up a new monitoring system with
quarterly data collection by LHUs for the set of these 100 treatments; 3) a request that
Agenas revise MWTs yearly on the basis of evidence of the appropriateness of each
treatment; 4) a request that regions and LHUs introduce unified booking centres;8 and
5) the request that regions and LHUs collect and disseminate information on waiting times
(e.g. through web sites, patient charters, customer satisfaction surveys). On the basis of
these rules, regions issued plans that generally include three main policy tools for
managing wait lists: 1) the improvement of information transparency and communication
to citizens, 2) the implementation of demand-side policies (e.g. the adoption of priority
groups and of specific diagnostic and therapeutic pathways – DTPs – with the direct
involvement of GPs; charging a penalty to “no-show” patients;9 charging co-payments
before patient access), 3) the implementation of supply-side policies (e.g. planning the
volume of out-patient treatments by priority class; balancing appropriate demand flows
and supply capacity; increasing supply capacity through specific agreements with NHS
providers; specifying the facilities where MWTs are guaranteed; direct purchasing of extra
visits and tests from private providers by LHUs; the full activation of unified booking
centres) (Mannella, 2011).
WAITING TIME POLICIES IN THE HEALTH SECTOR: WHAT WORKS? © OECD 2013174

II.9. ITALY
Policies indirectly addressing waiting times
Three particular policy tools had important indirect effects on waiting times for access
to health care services included within the LEA (the basic package guaranteed by the NHS):
1) co-payments; 2) regulation of intramoenia private practice; and 3) incentives for
additional private health insurance coverage.
Co-payments
Out-patient care patients are required to make substantial co-payments, ranging from
EUR 36.15 to EUR 70; patients are also required to pay for emergency care if they are
evaluated in the lowest priority class (EUR 25). People below a family income threshold and
with major chronic diseases are generally exempt from these payments. Overall,
co-payments for out-patient care are substantial but are not applied to a large fraction
of patients.
Intramoenia private practice
Intramoenia practice was introduced in 2000 in order to regulate dual practice and to
exert stricter control over physicians with patients who pay privately.10 The law provides
that within the regulatory framework of each region and LHU, the proportions of
physicians practicing intramoenia and institutionally (NHS) should be balanced,
establishing the principle that intramoenia activities (measured in terms of either volume or
physician’s work time) cannot exceed institutional activities.11 Intramoenia activity is
mostly concentrated in ambulatory specialty care, which represents a significant
percentage of the total consultations and diagnostics provided by NHS facilities.12
Intramoenia reduces waiting time because it offers an easy to access, though costly,
alternative to NHS coverage. Through this monitored and controlled private provision of
care, LHUs shift part of their patients outside of NHS coverage and thus reduce waiting
time. In addition, LHUs and NHS hospitals can purchase intramoenia services with NHS
funds to reduce excessive waiting times; this approach is based on intramoenia representing
a flexible incentive mechanism to increase physicians’ productivity, in contrast to previous
attempts to reduce waiting times by raising NHS capacity, which have shown to be rather
costly and ineffective. Intramoenia practice is, however, very controversial. While it was
promoted to prevent doctors from practicing outside of the NHS with no control and to
avoid unfair competition due to conflicts of interest (e.g. using the NHS position to attract
patients to their private clinics), it has created a similar conflict of interest within the NHS:
having long waiting lists for NHS-funded treatments pushes patients willing to pay out-of-
pocket to opt for intramoenia private services (France et al., 2005; Domenighetti et al., 2010).
The regulation of intramoenia practice has undergone several changes. The most recent
legislation includes the creation of a National Observatory on intramoenia activities and the
explicit provision that NHS organisations may purchase intramoenia services whenever
patients’ waiting time exceeds the maximum waiting time target set by the region.13 The
last agreement between the state and the regions, issued in November 2010, also required
that each region introduce suitable procedures to reduce waiting time through the
management and monitoring of the volume of care provided under both NHS coverage and
intramoenia practice and that it appoint new committees to oversee waiting time with the
participation of citizens’ and patients’ representatives.
WAITING TIME POLICIES IN THE HEALTH SECTOR: WHAT WORKS? © OECD 2013 175

II.9. ITALY
Promoting voluntary health insurance coverage
In Italy, voluntary private health insurance (VHI) funds only 14.5% of private health care
expenditure, as out-of-pocket payments are widely used for out-patient specialist care,
dental care, drugs and medical prostheses (Rebba, 2010). VHI coverage is mainly used for
direct and faster access to specialists and diagnostic services, extended choice of hospitals
and clinics and access to dental care (Paccagnella et al., 2012). In 2008, it was estimated that
approximately 2.5 million Italians were covered by commercial health insurance, and
another 6.4 million had voluntary coverage provided by mutual organisations or other non-
profit entities; these insurances typically offer coverage complementary and supplementary
to that offered by the NHS (they are employer-based, professional and mutual aid funds
labeled “fondi sanitari integrativi”). In total, approximately 15% of Italians have voluntary
health insurance.
Since 1999, the government has tried to incentivise these funds through specific
regulation (that has not yet been completely enacted) and tax incentives (Rebba, 2003). The
main argument for tax incentives is that increasing the demand for additional private
insurance should mitigate the demand for statutory health services (thereby reducing
upward pressure on public expenditure) while enhancing access to essential health care
through a reduction of waiting times in the public system (Piperno, 1997; Turchetti, 2009).
However, the experience of different countries and the particular characteristics of private
health insurance coverage in Italy provide cautionary tales. VHI might favor inequalities in
access to health care, as it is mostly used by affluent and more highly educated people and
does not generally reduce the need for the insured to rely on out-of pocket payments to
cover the costs of health care excluded from public coverage (Paccagnella et al., 2012).
These inequalities may be further amplified by tax incentives, which act as a government
subsidy to wealthier people.14
Current policiesIn this section, we focus on the new strategies pursued by national and regional
governments after the adoption of the National Plan on waiting times issued in
November 2010. We also provide information on pilot experiences of waiting list
prioritisation based on the Homogeneous Waiting Groups (HWGs) approach, which is
currently developed by several LHUs.
The new National Plan for reducing waiting times
The new plan on waiting times (2010-12) updates and strengthens action to manage
waiting times in the NHS by forcing regions to act and follow national rules. First, it
updates the list of diagnostic, therapeutic and rehabilitation services for out-patient and
in-patient health care for which regional plans must set maximum waiting time targets (in
total 58 treatments: 14 specialist visits, 29 imaging and other diagnostic instrumental
tests, five hospital procedures, and ten ordinary elective surgical interventions).15 Second,
it defines four levels of priority and respective waiting times for 43 non-urgent out-patient
treatments (MWT of 3, 10, 30 and 180 days).16 Third, it identifies cardiovascular and
oncology diseases as priority areas for the development of diagnostic and therapeutic
pathways (DTPs) in order to facilitate a timely and appropriate provision of diagnoses and
treatments. Fourth, it requires regions to systematically monitor waiting lists and waiting
times and make data available on the web sites of regions as well as of public and private
accredited health care providers. Fifth, it plans to monitor waiting times for a set of
WAITING TIME POLICIES IN THE HEALTH SECTOR: WHAT WORKS? © OECD 2013176

II.9. ITALY
targeted out-patient services through a weekly survey carried out twice per year (to
measure “ex ante” waiting time, i.e., the time span between the patient’s request, based on
the referral by the GP, and the expected date of specialist consultation or diagnostic testing
assigned by the booking centre) and a new system to monitor the time span between the
patient’s request and the actual date of patient’s treatment (“ex post” waiting time) using a
standardised monthly information flow. Sixth, it requires the regions to monitor DTPs for
oncologic and cardiovascular diseases (breast, lung, colon cancer and CABG) and to
guarantee that for these conditions MWTs do not exceed 30 days for the diagnostic stage
and 30 days for the start of treatment from the diagnosis for at least 90% of the patients.17
Regional plans issued in response to the new National Plan show high heterogeneity in
the definition of priority classes for the 58 targeted out-patient and in-patient procedures.
Many regions invoke specific penalties against providers whenever the patient’s waiting time
for a particular intervention exceeds the target, including direct purchasing by the LHU of
intramoenia services from specialists on behalf of the patient (according to the principle
introduced by decree No. 124/98 and previously unimplemented)18 and financial penalties
for LHUs’ general managers (e.g. in Lombardy and Liguria regions).19 Moreover, some regions
have introduced penalties for “no show” patients, in most cases charging them the
co-payment for the treatment whenever they do not cancel the scheduled appointment.
Lastly, several regions (such as Emilia-Romagna and Tuscany) have significantly invested in
the development and improvement of DTPs, extending this approach to other diseases in
addition to those identified by the National Plan (Mannella, 2011, pp. 168-172).
The homogeneous waiting groups for prioritising out-patient procedures
In 2004, the NHS “Waiting Times” working group launched a pilot study to use clinical
information to prioritise interventions and thus manage waiting lists for out-patient health
services. In the pilot study, waiting list prioritisation was based on the implementation of
“Homogeneous Waiting Groups” (HWGs) (Raggruppamenti di Attesa Omogenei) in a sample of
LHUs (Mariotti, 1999 and 2006; Mariotti et al., 2008). Several LHUs are now extending the
approach to diagnostic procedures not included in the pilot study.
Typically, the HWG approach for diagnostic procedures works as follows: the LHU
medical director sets up a steering committee made up of representatives of GPs,
specialists and the person in charge of the booking system. The steering committee
identifies a set of diagnostic procedures and defines basic criteria for prioritising patient
access, and then the committee usually identifies priority categories according to clinical
evaluations. The allocation of procedures to each category (priority group) is agreed upon
by the members of the steering committee and is based on the general criterion that the
MWT for that diagnostic procedure (taking into account a subsequent appropriate time for
treatment) does not negatively affect the patient’s prognosis. GPs are asked to specify the
HWG of the diagnostic procedure upon their referrals. On the basis of this priority code, the
booking centre arranges the patient’s appointment. Specialists are also asked to use the
HWG coding to check and assess the consistency of their indications with GP decisions.
ConclusionsIn Italy, waiting time is a major issue and seems to be more critical for out-patient
specialist care and diagnostic services than for elective in-patient surgery or other non-
urgent hospital admissions. This chapter has primarily reviewed initiatives for out-patients,
which are also the core of national and regional initiatives. Overall, the review of the policies
WAITING TIME POLICIES IN THE HEALTH SECTOR: WHAT WORKS? © OECD 2013 177

II.9. ITALY
of the last decade provides a rich, if somewhat unclear, picture. The national tier of the NHS
and most regions have been actively designing and implementing specific measures to
better manage waiting time (e.g. waiting time plans and national rules on monitoring).
National initiatives, often promoted and agreed upon by the regions, have resulted in a
mature system for governing waiting times, with detailed rules about maximum waiting
times and how they are measured and monitored. Given the institutional structure of the
Italian NHS, the implementation of these initiatives depends on the regions, with great
regional variation. Most regions have improved patients’ access through better information
on waiting times, process re-engineering and the creation of unified booking centres.
Diagnostic and therapeutic pathways are also well established in several Italian regions, and
most providers regularly provide data about waiting times on their web sites. In addition,
important prioritisation criteria have been piloted to manage waiting times based on clinical
criteria and professional judgment (e.g. the Homogenous Waiting Groups pilots). These pilots
appear successful and are increasingly benchmarked by other NHS organisations. However,
all of these initiatives present a major limitation: despite the national character of the Italian
NHS, policy action and results are strongly dependent on local conditions. Actual policies,
including the implementation of national legislation, vary across regions, with some of them
being very active while others often lag behind.
While specific and direct policies may reduce waiting times and improve the
appropriateness of care, it should be made clear that waiting time results from a variety of
supply and demand health policies. We have highlighted three major policy domains that
appear salient: co-payment, intramoenia practice and voluntary insurance. Co-payments
deter the use of services and in some cases make it more convenient for patients to pay the
full price of the service in the private sector. The presence of national and regional
co-payments has likely reduced waiting time via the reduction of demand for services
covered by the NHS; however, rather broad exemption criteria have limited the use of co-
payments in the more affluent and healthier part of the population. The other two health
policies, namely voluntary insurance and intraomoenia, also have important indirect effects
on waiting time. The expansion of intramoenia dual practice and the promotion of
additional private health insurance could undermine access to the NHS basic health care
package (the LEA): the former may encourage doctors to run long lists in their public
practice so as to maintain demand for their private practice, whereas the latter may
worsen equity of access to NHS services. We argue that these two policies should be
carefully reconsidered, because they could jeopardise patients’ access to the NHS basic
health care package.
Notes
1. According to a survey by the Ministry of Health in November 2010, 11 regions (out of 21) and95 Local Health Units (out of 166) report data on waiting times on their web sites (AGENAS, 2011).The focus is mostly on diagnostics and specialist visits.
2. Long (and increasing) average waiting times were reported in 2010 for particular surgicalprocedures related to chronic conditions: e.g. nine months for hip replacements and 8.5 monthsfor prostate interventions (Tribunale dei diritti del Malato, 2011, pp. 48-49).
3. See the Emilia-Romagna Region web site: www.tdaer.it/MAPS/dati (accessed on 1 February 2012).
4. The agreement defined MWTs for: ambulatory care (60 days for five major diagnostic proceduresand 30 days for eye and cardiology visits); oncology services (the first visit should be providedwithin two weeks; surgical interventions, chemotherapy and radiotherapy treatment should beprovided within 30 days for malign neoplasm), and for three elective hospital procedures (180 days
WAITING TIME POLICIES IN THE HEALTH SECTOR: WHAT WORKS? © OECD 2013178

II.9. ITALY
for cataract surgery and hip replacement and 120 days for percutaneous transluminal coronaryangioplasty). For more details, see Hurst and Siciliani (2003, p. 64).
5. The “Waiting Times” Project was developed within the wider national project named “BuildingBlocks of the New Health Information System” (Progetto Mattoni del Nuovo Sistema InformativoSanitario). See the web site of the Ministry of Health (www.mattoni.ministerosalute.it). The final reportof the “Waiting Times” Project is available on the web site: www.agenas.it/mattone_tempi_conc.html.
6. The maximum waiting time for each referral and for each treatment should not exceed those setout in the Agreement between the State and regions in 2002 and must be guaranteed for 90% ofpatients on waiting lists.
7. The first set of 49 interventions included 24 oncologic treatments (19 out-patient and five in-patient), 14 cardiovascular treatments (10 out-patient and four in-patient), two obstetric andgynaecology out-patient services and nine geriatric treatments (seven out-patient and two in-patient, i.e. cataract surgery and hip replacement).
8. In 2009, the Ministry of Health published the guidelines for the implementation of unified bookingcentres (Ministero del Lavoro, della Salute e delle Politiche sociali, 2009).
9. According to several studies in Italy, “no show” patients (patients who do not arrive for scheduledappointments) represent on average about 11% of the total number of patients on the waiting listfor specialist consultations (Cusini et al., 2008; Castaldi, 2009).
10. Since 2000, doctors must make a choice between two options: they can work for the NHS but withtheir private practice confined to NHS facilities (intramoenia), or they can freely work outside ofthe NHS; in the latter case, they can work only part-time in publicly funded hospitals, with areduced wage, and without top-level management responsibility. According to a survey of theSenate Committee on health and health care, 95% of physicians opted for working exclusively forthe NHS (in southern regions the percentage was 4.5% lower than in Central-Northern regions); ofthese, only 59.2% carried out intramoenia activities (65% in the Centre-North, 45% in the South).(Commissione Igiene e Sanità, 2008).
11. Unfortunately, there are no official data on the percentage of the overall activity that can beattributed to intramoenia. Controls on the balance between intramoenia and institutional practicehave not always been effective, because national legislation has allowed intramoenia services toalso be provided “outside the wall of public facilities”. This dispensation (defined as “expandedintramoenia”) was initially provided to take into account those situations where public facilitiesrequired structural interventions to start intramoenia activities, but it has been continuouslypostponed until now (the latest deadline is 31 December 2012). This has hampered the process ofreducing waiting times for public treatments, which intramoenia practice was thought to promote.
12. It is estimated that around 8% of visits related to cardiology, eye, orthopedic and ear, nose andthroat are provided under intramoenia arrangements (Osservatorio nazionale per l’attività liberoprofessionale, 2011). However, these estimates should be considered with caution and likelyunderestimate the extent of intramoenia.
13. At present, few cases of public purchasing of intramoenia services on behalf of patients aredocumented (Mannella, 2011, pp. 173-176).
14. The experience of other countries (e.g. Australia, France, United Kingdom) provides similarevidence (Mossialos and Thomson, 2004; OECD, 2004).
15. Specialist visits: cardiology; vascular surgery; endocrinology; neurology; eye; orthopaedic;gynaecology; ear nose and throat; urology; dermatology; psychiatric; gastroenterology; oncology;pneumology. Diagnostic tests: mammography; thoracic CT; upper abdomen CT; lower abdomen CT;complete abdominal CT; CT head; spine CT; pelvic CT; brain and head MRI; pelvis MRI; muscle-skeleton MRI; spine MRI; ultrasound of head and neck; echo-doppler heart; echo-doppler supra-aortic vessels; echo-doppler peripheral vessels; abdominal ultrasound; breast ultrasound; obstetricand gynaecology ultrasound; colonoscopy; flexible sigmoidoscopy; esophagogastroduodenoscopy;ECG; ECG Holter; effort ECG; audiometric test; spirometry; fundoscopy; EMG. Day hospital procedures:chemotherapy; coronography; percutaneous liver biopsy; hemorrhoidectomy; inguinal herniasurgery. Surgical interventions: breast cancer; prostate cancer; colorectal cancer; uterine cancers;lung cancer; CABG; PTCA; carotid endarterectomy; hip replacement; tonsillectomy.
16. For a list of diagnostic services, maximum waiting time is set at 60 days.
17. The new plan for waiting times (2010-12) reports specific guidelines for DTPs in both areas. Forcardiovascular diseases, four priority classes are pointed out: a) emergency treatment (eitheremergency room or hospital admission within 72 hours due to a possible serious clinical
WAITING TIME POLICIES IN THE HEALTH SECTOR: WHAT WORKS? © OECD 2013 179

II.9. ITALY
progression of the medical condition; b) treatment that, if not promptly provided, maysignificantly impact the patient’s short-term prognosis, pain, dysfunction or disability (to beprovided within ten days); c) treatment that, if not promptly provided, does not affect the short-term prognosis but impacts the patient’s pain, dysfunction or disability (to be provided within30 days); and d) treatment that can be planned within a longer period of time since it would notimpact the patient’s prognosis, pain, dysfunction or disability. For oncology diseases, the followingfour priority classes are defined: a) urgent diagnostic priorities (within three days) for patientswith an oncology disease in rapid/symptomatic progression or with serious complications relatedto the treatments provided; b) diagnostic priorities within a therapeutic programme (withinten days) for patients with a confirmed or suspected diagnosis of cancer or cancer relapse, patientsat an initial stage or with a relapse of a neoplastic disease, and patients to be reassessed during orat the end of a cancer treatment; c) follow-up of patients already treated for neoplastic disease(within the limits defined by specific guidelines); d) organised screening (according to specificguidelines); only conditions of groups a) and b) are to be treated as priorities; in the case of surgeryand chemotherapy, different types of priority classes must be applied in relation to the clinicalcondition and the progression/aggressiveness of the disease (Ministero della Salute, 2011).
18. Specific rules are established by each region and LHU to prevent giving specialists an incentive todelay treating patients so that they can expand the volume of intramoenia services directlypurchased by the NHS; for example: i) introducing a system to monitor the waiting lists of patientsdemanding public health care; ii) adopting mechanisms to reduce the average length of waitinglists in order to guarantee limited differences in waiting time between the regular public waitinglist and the intramoenia regime; and iii) precisely and transparently defining the planning of the twomodes of health care delivery, establishing a threshold for the intramoenia activities by publicconsultants (maximum number of hours per week for private consultations that they cannotexceed, maximum volumes of intramoenia activities, etc.) in order to guarantee a suitable provisionof public treatment free of charge.
19. A number of regions have begun to consider the fulfilment of MWT targets among the criteria forperformance measurement used to evaluate LHUs and to determine financial rewards for their topmanagers.
References
AGENAS (2006), “Progetto Mattoni, Liste di attesa”, Agenzia nazionale per i servizi sanitari regionali,Rome, June, available at www.agenas.it/mattone_tempi_conc.html.
AGENAS (2011), “I tempi di attesa nei siti web di Regioni e Aziende sanitarie: la propettiva delcittadino”, Agenzia nazionale per i servizi sanitari regionali, Rome, July.
Anessi-Pessina, E. and E. Cantù (2006), “Whither Managerialism in the Italian National HealthService?”, International Journal of Health Planning Management, Vol. 21, No. 4, pp. 327-355.
Castaldi, S. (2009), “Liste d’attesa: strumenti di controllo della domanda sanitaria o artefici didisuguaglianza nell’accesso alle cure?”, Politiche Sanitarie, Vol. 10, No. 4, pp. 243-247.
Commissione Igiene e Sanità (2008), “Esercizio della libera professione medica intramuraria”, in Attidel convegno di presentazione dell’indagine conoscitiva sull’esercizio della libera professionemedica intramuraria, Senato della Repubblica, Rome, 12 March.
Commonwealth Fund (2011), “The Italian Health Care System 2011”, International Profiles of Health CareSystems 2011, The Commonwealth Fund, New York.
Cusini, M., F. Auxilia, V. Trevisan, U. Visconti and S. Castaldi (2008), “A Telephone Survey on theReasons of Non-attendance in a Dermatological Clinic”, G Ital Dermatol Venerol, Vol. 143, pp. 353-357.
De Pietro, C. (2006), “Private Medical Services in the Italian Public Hospitals: The Case for ImprovingHRM”, Health Policy, Vol.78, pp. 56-69.
Domenighetti, G., P. Vineis, C. De Pietro and A. Tomada (2010), “Ability to Pay and Equity in Access toItalian and British National Health Services”, European Journal of Public Health, Vol. 20, No. 5,pp. 500-503.
Fattore, G. and A. Torbica (2010), “Equità territoriale: definizioni, evidenze e politiche appropriate”, inE. Cantù (ed.), L’aziendalizzazione in sanità in Italia, Rapporto OASI 2010, Egea, Milano.
France, G., F. Taroni and A. Donatini (2005), “The Italian Health-care System”, Health Economics, Vol. 14,pp. S187-S202.
WAITING TIME POLICIES IN THE HEALTH SECTOR: WHAT WORKS? © OECD 2013180

II.9. ITALY
Hurst, J. and L. Siciliani (2003), “Tackling Excessive Waiting Times for Elective Surgery: A Comparisonof Policies in Twelve OECD Countries”, Annexes 1, 2, 3, OECD Health Working Papers, No. 6, OECDPublishing, Paris, http://dx.doi.org/10.1787/108471127058.
Lo Scalzo, A., A. Donatini, L. Orzella, A. Cicchetti, S. Profili and A. Maresso (2009), “Italy: Health SystemReview”, Health Systems in Transition, Vol. 11, No. 6, pp. 1-216.
Mannella, G. (2011), “Le liste di attesa”, in A. Tanese and S. Nardi (eds.), Osservatorio civico sul federalismoin sanità. Rapporto 2011, Tribunale dei Diritti del Malato-Cittadinanza Attiva.
Mariotti, G. (1999), Tempi d’attesa e priorità in sanità, Franco Angeli Editore, Milano.
Mariotti, G. (2006), Priorità cliniche in sanità, Franco Angeli Editore, Milano.
Mariotti, G., A. Meggio, M. Gentilini and G. dePretis (2008), “Improving the Appropriateness of Referralsand Waiting Times for Endoscopic Procedures”, Journal of Health Services Research & Policy, Vol. 13,pp. 146-151.
Ministero del Lavoro, della Salute e delle Politiche Sociali (2009), “Sistema CUP: Linee guida nazionali”,Nuovo Sistema Informativo Sanitario, Rome, 27 October.
Ministero della Salute (2002), “Rilevazione nazionale degli interventi attuali in tema di liste e tempi diattesa dalle Aziende Usl ed ospedaliere”, available at. www.salute.gov.it/imgs/C_17_pubblicazioni_595_allegato.pdf.
Ministero della Salute (2010), “Cittadini e salute: La soddisfazione degli italiani per la sanità”, Quadernidel Ministero della Salute, No. 5, September-October.
Ministero della Salute (2011), “Relazione sullo Stato Sanitario del Paese 2009-2010”, Report on HealthStatus in Italy – Summary Report, Rome.
Mossialos, E. and S. Thomson (2004), “Voluntary Health Insurance in the European Union”, WorldHealth Organization, European Observatory on Health Systems and Policies, Brussels.
OECD (2004), Private Health Insurance in OECD Countries, OECD Publishing, Paris, http://dx.doi.org/10.1787/9789264007451-en.
OECD (2012), OECD Health Data 2012, OECD Publishing, Paris, http://dx.doi.org/10.1787/health-data-en.
Osservatorio nazionale per l’attività libero professionale (2011), “Relazione sullo stato di attuazionedell’esercizio della libera professione intramuraria secondo quanto disposto dalla L.120/2007”,Vol. I, II, III, December.
Paccagnella, O., V. Rebba and G. Weber (2012), “Voluntary Private Health Insurance Among the Over 50sin Europe”, Health Economics, published online February 2012.
Piperno, A. (1997), “Mercati assicurativi e istituzioni: la previdenza sanitaria integrativa”, Il Mulino,Bologna.
Rebba, V. (2003), “La normativa italiana sui fondi sanitari integrativi”, in Nomisma-CRIEP (eds.), I fondisanitari integrativi. Quale futuro per la sanità italiana?, Franco Angeli, Rome, pp. 181-199.
Rebba, V. (2010), “Health Care Financing in Italy: The Role of Co-payments and Additional PrivateHealth Insurance”, Paper presented at the workshop “Sustainable funding of Italian NationalHealth Service: the role of demand and supply control. Lessons from other countries”, Universityof Padua, 4 June 2010.
Torbica, A. and G. Fattore (2005), “The “Essential Levels of Care’ in Italy: When Being Explicit Serves theDevolution of Powers”, European Journal of Health Economics (HEPAC), Vol. 6, pp. 46-52.
Tribunale per i diritti del malato-Cittadinanzattiva (2011), “Diritti al taglio. 14 Rapporto PITSalute 2011”, available at www.cittadinanzattiva.it/relazioni-annuali/cat_view/1-relazioni-annuali/170-salute/2-rapporti-pit-salute.html, accessed 1 February 2011.
Turchetti, G. (2009), “The Interaction of Public and Private Systems in Health Care Provision: The ItalianTwo-faced Janus”, European Papers on the New Welfare, No. 11, January, pp. 110-122.
WAITING TIME POLICIES IN THE HEALTH SECTOR: WHAT WORKS? © OECD 2013 181


Waiting Time Policies in the Health Sector
What Works?
© OECD 2013
PART II
Chapter 10
The Netherlands
by
Frederik T. Schut and Marco Varkevisser,
Institute of Health Policy and Management (iBMG), Erasmus University Rotterdam
In the Netherlands, hospital waiting times increased during the 1990s as a result ofthe introduction of fixed budgets and capacity constraints for specialists,complementing the fixed global hospital budgets already introduced in the 1980s.Though the resulting waiting lists were still small compared to other OECDcountries, public discontent initiated government action. Over the years 2000-11policies included a change from fixed budgets to activity-based funding, for bothhospitals and specialists, and increased competition among hospitals. All togetherthese measures resulted in a strong reduction of waiting times. In 2011, meanexpected waiting times for almost all surgical procedures were below five weeks,which is well under the generally agreed norm of 6-7 weeks. Waiting lists are thusno longer an important policy concern. Dutch policy makers are now primarilyconcerned about the rapid growth in health care expenditure as a result of acombination of hospitals’ and specialists’ incentives for extra production andinsurers’ limited countervailing power. Hence, new powerful supply-sideconstraints are being introduced in 2012. These constraints may cause waitingtimes to increase in the coming years, especially for more complex surgicalprocedures that are subject to price regulations.
183

II.10. THE NETHERLANDS
IntroductionMore than a decade ago, waiting times for hospital care in the Netherlands were the
shortest among all the countries included in the previous comparative OECD study on
waiting times (Siciliani and Hurst, 2003). Nevertheless, this study reported that in the
Netherlands waiting times were perceived as a policy concern, whereas this was not the
case in Germany and Switzerland even though they had longer average waiting times for
surgery. Indeed, in 2000 waiting times were high on the Dutch policy agenda and caused
a major change in hospital financing. This change effectuated a substantial reduction in
waiting times, which were further reduced after the major health care reform in 2006. In
this case study, after presenting the main characteristics of the Dutch health care system
(next section), we first explain how in 2000 hospital waiting times had become a policy
concern and then discuss the impact of successive past policies to reduce waiting times
for elective hospital care in the Netherlands. Except for the late 1990s, these policy
measures were not specifically targeted at reducing waiting lists but rather, in the pursuit
of broader objectives, involved general changes in the payment systems for both
hospitals and specialists. Since Dutch policy makers are now primarily concerned about
the rapid growth of health care expenditure caused by the combination of hospitals’ and
specialists’ incentives for extra production and insurers’ limited countervailing power,
from 2012 to 2015 the payment systems for both hospital and specialists will be
substantially reformed again. We conclude with an explanation of why these current
policies may cause waiting times to increase in the coming years.
Main characteristics of the Dutch health care system
Key features
Since the 1990s, the Dutch health care system has been in transition from supply-
side government regulation towards managed competition (Schut and Van de Ven, 2011).
A major step in this transition process was the introduction of the Health Insurance Act
(HIA) in 2006. With the introduction of the HIA, it became mandatory for all Dutch
citizens to buy standardised basic health insurance coverage from a private health
insurer. People are free to switch annually between health insurers, which are obliged to
accept all applicants, irrespective of their individual risk profile, at a community-rated
premium. Insurers are free to set this premium themselves. Expected differences in
individual health care expenditure are equalised by means of a risk equalisation scheme.
The basic idea behind the managed competition model is that consumers put pressure
on health insurers to provide good service and efficient care at a reasonable price. Indeed,
the HIA has led to strong price competition among health insurers. Many try to attract
enrolees by offering low-priced policies. To provide health insurers with sufficient room
to negotiate about the price and quality of care, a gradual deregulation of provider
markets started in 2005.
WAITING TIME POLICIES IN THE HEALTH SECTOR: WHAT WORKS? © OECD 2013184

II.10. THE NETHERLANDS
HospitalsHospitals in the Netherlands are independent and are contracted by health insurers.
The health insurers are allowed to contract with hospitals selectively, but to date (almost) all
hospitals have been contracted in practice. In 2011, there were 94 hospitals in the
Netherlands (NZa, 2012). All the hospitals, except the eight university medical centers, are
private not-for-profit entities (typically foundations) facing a legal non-distribution
constraint which means that they are prohibited from distributing any profits to investors,
owners or shareholders. In 2009, there were 4.66 beds (per 1 000 population) in hospitals
(OECD, 2012a). For routine care (e.g. cataract, knee and hip operations) an increasing number
of free-standing specialised clinics were established during the last decade. In 2012, there
were about 150 clinics, which had a joint market share of 2.3% of medical specialist care.
Hospital remunerationA new system for the payment of hospitals was introduced in February 2005, which
relies on a self-developed system of diagnosis-treatment combinations (Diagnose
Behandeling Combinaties, DBCs). The main purpose of the introduction of the DBC system
was to reform hospital payment to facilitate negotiations (in particular on quality) between
purchasers and providers by defining hospital products (that is, DBCs). When the new
system was introduced, only a small selection of DBCs (list B DBCs) were freely negotiable.
For the majority of DBCs (list A DBCs), the hospitals received a fixed amount per treated
case, within the framework of a collective contract. However, since 2005 free pricing has
gradually been extended, from about 10% of hospital expenditure to about 20% in 2008,
about 34% in 2009 and about 70% in 2012.
Specialist remunerationNearly half of medical specialists are working within hospitals as self-employed
entrepreneurs (mostly as members of a partnership – a “maatschap”). In 2008, their
remuneration was changed from lump-sum payments per hospital into payments per DBC,
which essentially is an output-based payment system. This gives them much stronger
incentives to provide more (or more expensive) services (OECD, 2012b).The income of self-
employed specialists was 6.49 per average wage in 2009, while salaried specialists1 earned
much less, 2.96 per average wage (OECD, 2012a).
Co-payments for hospital careThe mandatory deductible for basic health coverage was set at EUR 220 per year in
2012. Consumers can voluntarily choose an additional deductible of up to EUR 500 per year.
Insurers are free to selectively contract with hospitals and to use financial incentives to
motivate enrollees to use preferred providers.
Universal mandatory private health insuranceIn the mid-2000s, the Dutch Government embarked on a series of health care reforms
designed to move the sector from central control to a more market-based system. The
reforms centred on the introduction of mandatory private health insurance with a risk
equalisation scheme to avoid adverse selection, while giving health insurers the role of
health service purchasers. The reforms successfully introduced competition on premiums
among health insurers. Increased competition also forced a consolidation among health
insurers, leading to a high degree of concentration, i.e. the largest four insurers have a
market share of more than 90% (OECD, 2012b).
WAITING TIME POLICIES IN THE HEALTH SECTOR: WHAT WORKS? © OECD 2013 185

II.10. THE NETHERLANDS
Primary care
There were 0.72 GPs per 1 000 population in the Netherlands in 2009. The
remuneration system for GPs was reformed in 2006. Previously, it used a capitation basis
for two-thirds of the population and a fee-for-service basis for the other third. The new
system is a hybrid system for all patients, with part capitation – an annual “registration
fee” per patient – and part fee-for-service. In 2010, approximately 80% of GPs were
participating in primary care groups that offer integrated care to patients with chronic
diseases. In the period 2010-13, these primary care groups are allowed, on an experimental
basis, to negotiate integrated (or bundled) payments with health insurers for providing co-
ordinated care to people with specific chronic diseases (diabetes, vascular risk
management, chronic obstructive pulmonary disease – COPD) (OECD, 2012b). The income
of self-employed GPs was 3.14 per average wage in 2009, much higher than that of salaried
GPs2 (1.75 per average wage) (OECD, 2012a).
Surgical activity
For a number of procedures, the Netherlands has experienced a shift from in-patient
to day-case surgery between 2000 and 2009. Of surgical procedures performed as in-
patient, knee replacement and percutaneous coronary interventions had the highest
growth rates (149.2% and 69%) (OECD, 2012a and Table 10.1).
Table 10.1. Surgical procedures per 100 000 population,Netherlands, 2000 and 2009
Surgical procedures by ICD-9-CM 2000 2009% change
in surgical proceduresbetween 2000 and 2009
Cataract surgery:
In-patient 95.4 11.9 -87.50
Day-case 457.9 867.7 89.50
Tonsillectomy with or without adenoidectomy:
In-patient 92.7 77.0 -17.00
Day-case 152.9 163.7 7.10
Percutaneous coronary interventions (PTCA and stenting): in-patient 100.7 (2001) 170.1 69.00
Coronary bypass: in-patient 59.5 57.6 -3.20
Appendectomy: in-patient 94.3 99.0 4.90
Cholecystectomy:
In-patient 110.4 143.1 29.60
Day-case 1.4 7.0 400.00
Laparoscopic cholecystectomy:
In-patient 82.0 125.8 53.40
Day-case 1.4 7.0 400.00
Inguinal and femoral hernia:
In-patient 123.3 59.0 -52.10
Day-case 60.0 125.8 109.70
Hip replacement: in-patient 167.1 213.3 27.60
Knee replacement: in-patient 51.2 127.6 149.20
Source: OECD (2012), OECD Health Data 2012, OECD Publishing, Paris, http://dx.doi.org/10.1787/health-data-en.1 2 http://dx.doi.org/10.1787/888932755072
WAITING TIME POLICIES IN THE HEALTH SECTOR: WHAT WORKS? © OECD 2013186

II.10. THE NETHERLANDS
Health expenditure
Total health spending accounted for 12.0% of GDP in the Netherlands in 2010, the
second-highest among OECD countries and well above the OECD average of 9.5%. The
higher than average health expenditure is primarily due to relatively high expenditures on
long-term care (OECD, 2012b). The Netherlands also ranks well above the OECD average in
terms of health spending per capita, with spending of USD 5 056 in 2010 (adjusted for
purchasing power parity), compared with an OECD average of USD 3 268. This was the
fourth-highest figure among OECD countries. Health spending in the country increased in
real terms by 6.0% per year on average between 2000 and 2009, but this growth rate slowed
to 2.5% in 2010. 85.7% of current health spending was funded by public sources in 2010, well
above the OECD average of 72.2% (OECD, 2012a).
Practising physicians
The number of physicians per capita in the Netherlands was 2.9 per 1 000 population
in 2009, slightly less than the OECD average of 3.1 (OECD, 2012a).
Life expectancy and population
In 2010, life expectancy at birth in the Netherlands stood at 80.8 years, one year more
than the OECD average of 79.8 years (OECD, 2012a). The proportion of the population aged
65 and older has increased from 13.6% in 2000 to 15.6% in 2011 (OECD, 2012a).
Past policies (1995-2011)
Global budgeting system for hospitals
Since the early 1980s, the operating expenses of Dutch hospitals were reimbursed
under a global budgeting system in order to contain costs.3 At first, the budget for each
hospital was fixed and based on the operating expenses of the hospital in the preceding
year, but in 1985 part of the budget was made variable to reflect variations in hospital
utilisation. To determine the variable part of the budget, hospitals and health insurers had
to reach an agreement about the number of expected in-patient days, admissions, day-
treatment days and visits to the out-patient clinic per hospital per year. The precise
hospital budget was then determined by using the “agreed upon level of expected output”
as an input into a legally established budget formula that was applied nationwide, with
fixed weights for each of the four types of output. Hence, the budget was prospectively
determined and depended on the “agreed upon expected output” rather than on actual
output (Schut and Van de Ven, 2005). If a hospital produced more than the agreed level, its
per diem rates were subsequently reduced proportionally to redress the excess revenues.
Because more production than originally agreed upon did not result in more revenue for
the hospital, this budget system discouraged the hospital management from
accommodating any demand that exceeded the negotiated output level.
Lump sum payments for specialists
Until 1995, however, the disincentives for the hospital management to raise output
were counteracted by opposite incentives for self-employed medical specialists. While all
specialists in university medical centres are salaried employees, most medical specialists
in Dutch general hospitals were – and still are – self-employed entrepreneurs organised by
specialty in partnerships. Overall, the share of self-employed specialists in the Netherlands
WAITING TIME POLICIES IN THE HEALTH SECTOR: WHAT WORKS? © OECD 2013 187

II.10. THE NETHERLANDS
decreased from 56% in 1999 to 44% in 2007, but varies widely across medical specialities.
The percentage of self-employed specialists ranges from more than 67% among
cardiologists, radiologists, urologists, orthopaedic surgeons and cosmetic surgeons to less
than 10% among paediatricians and clinical geriatricians (Capaciteitsorgaan, 2010).
Specialists working as self-employed entrepreneurs were paid on a fee-for-service basis.
Hence, hospital management and self-employed medical specialists had diverging
interests, which resulted in many conflicts and in hospitals frequently exceeding the
agreed production limits.
In the beginning of the 1990s, the government tried to align incentives by imposing an
annual macro budget for the total revenues of all self-employed medical specialists. If this
annual budget was exceeded because of an increase in production by medical specialists,
then the fees of all medical specialists were reduced proportionally to redress the excess
total revenues. Individual medical specialists therefore faced a prisoner’s dilemma, which
induced them to raise rather than to mitigate production. This is because each individual
specialist had an incentive to produce more to compensate a potential drop of income due
to a general fee reduction as a result of increasing production by other specialists. So, the
conflict of interest between hospital management and medical specialists intensified
rather than diminished.
Moreover, medical specialists became caught in a spiral of increasing production and
decreasing fees, resulting in increasing conflicts with the government. In 1995, the
government undertook a next attempt to align interests and to reduce incentives for extra
production by giving self-employed medical specialists in each hospital the option to
opt for a fixed budget (lump sum) in return for an exemption from fee reductions (Scholten
et al., 1998). Medical specialists in all the hospitals except two opted for the lump sum. In
each hospital, the self-employed medical specialists had to divide this lump-sum payment
among themselves, and in most cases the allocation was based on past production levels
and fees. Since the lump-sum payment was fixed, the production incentives for medical
specialists were largely removed. Hence, the incentives of hospital management and
medical specialists were effectively aligned, implying that now neither had a stake in
increasing production and accommodating (or inducing) extra demand. In an empirical
study about the effects of introducing lump-sum payments in the first six hospitals that
adopted this payment scheme, it was found that the mean waiting time between diagnosis
and clinical intervention across these hospitals substantially increased, from 24 to 30 days
(Mot, 2002).4
In 1995, in contrast to the preceding years, the growth in productivity and in the total
production of hospitals was very low, which was at least partly attributed to the new
payment system for medical specialists (Commissie Van der Zwan, 1996). In addition to the
introduction of the lump sum, in 1996 the government also decided to freeze the number
of specialist positions in hospitals that were eligible for reimbursement from social health
insurance. The imposition of this capacity constraint also contributed to increasing
waiting lists and waiting times for hospital treatment. In a survey in 1999 of all general and
university hospitals (response rate 67%), about 75% of the responding hospitals reported
that waiting lists were, at least partly, caused by a shortage of specialists (Laeven
et al., 2000). Because both micro-evidence on specialist behaviour in hospitals and
macroeconomic time series on various hospital output variables over the years 1995-1999
indicate that the introduction of lump-sum payments had negative volume effects, Folmer
and Westerhout (2002) concluded that this policy measure was welfare-reducing.
WAITING TIME POLICIES IN THE HEALTH SECTOR: WHAT WORKS? © OECD 2013188

II.10. THE NETHERLANDS
Targeted waiting list funds
After 1995, public discontent about the growing waiting lists rapidly increased.5 Under
growing public pressure, in 1997 the government introduced a specific subsidy to reduce
waiting lists, labelled the “waiting list fund” (wachtlijstfonds). This temporary subsidy was
extended in both 1998 and 1999. In an evaluative study, Laeven et al. (2000) conclude that
the three consecutive years of targeted subsidies had no noticeable impact on waiting lists.
Although hospital production increased, demand increased too. Moreover, a major
drawback of the targeted subsidies was that they provided hospitals with perverse
incentives to increase waiting lists in order to obtain more subsidies. Since both a uniform
method of registration and an effective control on the accuracy of reported waiting list
information were lacking, adjusting the length of waiting lists was straightforward.
Increasing waiting lists motivated several large employers, health insurers and
hospitals to set up “employee-clinics” to provide priority care to employees (Brouwer and
Schut, 1999). The care provided by these clinics was produced by using formerly unused
hospital capacity (weekends, evenings) and was paid for directly by the employers. These
initiatives provoked a passionate public debate about prioritisation in health care, and
after a short time the employees-clinics were prohibited by the government, based on the
argument that prioritisation should be based solely on medical need.
Acceptable waiting times
An important recurring issue in the public debate about rationing care was the
question of what waiting times patients would consider to be acceptable. In 2000, the
national associations of hospitals, specialists and health insurers agreed upon acceptable
waiting time limits for different types of hospital care, known as the “Treek norms”
(Treekoverleg, 2000). The maximum acceptable waiting time for the first visit to a hospital’s
out-patient clinic was set at four weeks (80% within three weeks); for (supplementary)
diagnostics and medical assessment, four weeks (80% within three weeks); for out-patient
(day-case) treatment, six weeks (80% within four weeks); and for in-patient treatment,
seven weeks (80% within five weeks).6, 7 Although the norms for maximum waiting times
had no clear underpinning and did not differ across specialties, they were broadly accepted
by Dutch society, including the government and patient advocacy groups. To date, these
norms are still used as a benchmark by the Dutch Healthcare Authority (NZa) in its annual
evaluation of waiting times in the health care sector. They also function as informal
guidelines for doctors. In 2001, the Dutch Government considered the introduction of a
maximum waiting time guarantee for hospital care. Ultimately, this guarantee was not
introduced, for at least three reasons (Varkevisser et al., 2004): it would i) increase
bureaucracy in the health care system, ii) increase administrative burdens for hospitals
and iii) be expensive to operationalise.
Activity-based hospital funding
At the turn of the century, waiting times for various hospital treatments substantially
exceeded the acceptable waiting time limits formulated by hospitals, medical specialists
and health insurers (see Table 10.2).8
Spurred by growing public discontent and the apparent lack of success of the targeted
waiting list funds, in 2001 the government decided to make drastic changes to the method
of hospital financing: the fixed budget system was replaced by a new system with activity-
WAITING TIME POLICIES IN THE HEALTH SECTOR: WHAT WORKS? © OECD 2013 189

II.10. THE NETHERLANDS
based payments (labelled as the “cash on the nail” scheme). This change allowed health
insurers to reimburse extra hospital production if the initially agreed annual maximum
production level was exceeded during the course of the year. An additional reason for the
change towards activity-based funding was a court decision in 1999 stating that, within the
Dutch social health insurance scheme, patients have an enforceable right to timely health
care. Hence, the government was no longer allowed to ration care covered by social health
insurance if this would lead to infringing this right. In fact, this court decision implied a
legally enforceable maximum waiting guarantee, in which the maximum had to be
established by case law.
In addition to the change to activity-based hospital funding, the government also
abolished the restriction on the number of medical specialist positions in hospitals. As a
result of the radical change in the hospital payment system, hospital production rapidly
increased, and waiting times decreased substantially (see Table 10.3).
As shown in Table 10.4, for almost all surgical procedures compared for the year 2000
in the study by Siciliani and Hurst (2003), waiting times had fallen by about 50% in 2006,
and most kept on declining gradually since then.
As in most other OECD countries, in-patient admission rates in the Netherlands
decreased until 2001, but since then this trend has reversed. From 2001 to 2007, the number
of admissions per 1 000 population, corrected for changes in the age distribution, increased
on average by 3% per year for in-patient hospital care and by 9% for day care (Van de Vijsel
et al., 2011). From 2007 to 2010, the average annual growth in admissions further increased
to almost 4%, whereas the growth in day-case treatment slightly abated, to about 7.5% per
Table 10.2. Mean waiting time for in-patient treatment in Dutch hospitals,2000 and 2001
Specialty
2000 2001 2001
Mean (weeks) Mean (weeks)Percentage of patients exceedingmaximum acceptable waiting time
(seven weeks)
Cosmetic surgery 24 31 74
Ophthalmology 15 14 66
Orthopaedics 12 14 71
Surgery 9 8 34
Ear, nose and throat 8 8 57
Source: Schut, F.T. (2003), “Gezondheidszorg”, in C.A. de Kam and A.P. Ros (eds.), Jaarboek Overheidsfinanciën 2003, SduUitgevers, The Hague, pp. 105-131.
1 2 http://dx.doi.org/10.1787/888932755091
Table 10.3. Mean waiting time in Dutch hospitals, 2000 to 2003Weeks
Type of treatment 20001 20011 20021 20031 Change 2000-03
With overnight hospital stay (inpatient) 8.8 6.7 5.8 5.5 -38
Without overnight hospital stay (outpatient) 6.4 5.7 5.2 5.1 -20
1. 2000-02: December; 2003: July.Source: NVZ Databank [Ministry of Health (2004), Rijksbegroting 2004: XVI, Tweede Kamer, vergaderjaar 2003-2004, TheHague, p. 21].
1 2 http://dx.doi.org/10.1787/888932755110
WAITING TIME POLICIES IN THE HEALTH SECTOR: WHAT WORKS? © OECD 2013190

II.10. THE NETHERLANDS
year (NZa, 2012). The average length of stay for in-patient admissions fell from about 7 days
in 2003 to 5.5 days in 2009 (Blank et al., 2011). As a result, the number of in-patient days
slightly decreased, in spite of the growth in the number of in-patient admissions. Over the
period 2003-09, hospital productivity – measured as the number of treated case-mix
adjusted patients per unit of input – grew by an estimated 15%, which is quite substantial
(Blank et al., 2011).
Van de Vijsel et al. (2011) conclude, however, that the abolition of budget caps was not
an efficient way to reduce waiting lists, given that from the top-10 diagnostic categories
with the strongest growth in production only two categories were associated with long
waiting times. Moreover, they observe a strong growth in unspecified diagnostic categories.
They therefore argue that at least part of the extra demand was induced by supply and
might not have been necessary. Notwithstanding this, the strong increase in hospital
production as a result of the introduction of activity-based funding seems to have had
a major impact on life expectancy, particularly among the elderly. During the 1980s
and 1990s, life expectancy at birth rose slowly, but it suddenly accelerated after 2002
(Mackenbach et al., 2011).9 Two-thirds of the increase in life expectancy was due to
declining mortality among the elderly. The sudden boost in life expectancy was
accompanied by a sharp increase in health care utilisation among the elderly (specialist
visits, drug prescriptions, hospital admissions and surgical procedures). Though they
recognise that it is not possible to establish whether the relaxation of budgetary
constraints directly caused the expansion of health care, Mackenbach et al. (2011) argue
that it is highly plausible that this was at least a facilitating factor in the observed reversal
of old-age mortality trends in the Netherlands.
Managed competition and deregulation of hospital prices
The introduction of activity-based funding was considered by the Dutch Government
as only a temporary solution to reduce waiting lists. The limited incentives for efficiency
and the lack of countervailing power of the health insurers increased the urgency of more
Table 10.4. Mean waiting time of patients admitted by surgical procedurein Dutch hospitals, 2000 to 20111
Weeks
Surgical procedure2 2000 2006 2007 2008 2009 2010 2011
Cataract surgery 16 7 7 6 5 5 5
Varicose veins 15 7 6 5 5 5 4
Hip replacement 14 8 8 8 8 7 6
Knee replacement 12 10 8 8 8 8 6
Inguinal and femoral hernia 11 5 4 4 5 5 5
Cholecystectomy 10 4 4 4 5 5 5
Hysterectomy 9 5 5 5 5 5 5
Prostatectomy 9 5 5 5 5 5 5
PTCA 3 2 2 3 3 3 2
CABG n.a. 4 5 5 4 3 4
1. Including out-patient care (day-case treatment) and in-patient care (> 24 hour admission). Due to a change inwaiting time definitions in 2009, waiting time data before and after 2009 may not be fully comparable (see Box 10.1).
2. Defined on the basis of Dutch diagnosis treatment combinations (DTCs).Source: Siciliani, L. and J. Hurst (2003), “Explaining Waiting Times Variations for Elective Surgery across OECDCountries”, OECD Health Working Papers, No. 7, OECD Publishing, Paris, http://dx.doi.org/10.1787/406746186162; NZa(2012), Marktscan medisch specialistische zorg: weergave van de markt 2006-2011, Dutch Healthcare Authority, Utrecht.
1 2 http://dx.doi.org/10.1787/888932755129
WAITING TIME POLICIES IN THE HEALTH SECTOR: WHAT WORKS? © OECD 2013 191

II.10. THE NETHERLANDS
comprehensive and fundamental reforms (Schut and Van de Ven, 2005). As part of the
introduction of managed competition in the Netherlands, in February 2005 hospitals and
insurers were allowed to negotiate prices, volumes and quality for a number of routine
hospital services, such as cataract surgery and hip replacement.10
To facilitate the newly introduced negotiations between hospitals and insurers, a
classification system was developed in co-operation with hospitals and medical specialists
that was based on the diagnoses and subsequent treatment of patients. Since 2005, every
patient admitted to a Dutch hospital or visiting a hospital’s out-patient clinic has been
categorised into a diagnosis-treatment combination (DTC). Each DTC includes all hospital
activities and services (both in-patient and out-patient) associated with the patient’s
demand for care, from the initial consultation or examination to the final check-up.
From 2005 to 2011, the proportion of freely negotiable hospital services (B-segment)
was stepwise expanded from about 10% of total hospital revenue to about 34%. For the
remainder of hospital production (A-segment), typically the more complex treatments,
prices per DTC were still determined by the Dutch Healthcare Authority (NZa) and served
to fill the negotiated budget for these services. The results of this reform so far indicate
that health insurers have increasingly put pressure on hospitals to charge lower prices:
hospital prices in the freely negotiable B-segment have increased at a lower rate than in the
regulated and budgeted A-segment (and even decreased in real terms, using the consumer
price index as deflator). By contrast, the production of services in the B-segment increased
at a higher rate than in the A-segment, up to 8.6% in 2010 (NZa, 2012). Although the
introduction and expansion of the freely negotiable hospital segment may have
contributed alongside activity-based funding to a further reduction in waiting times, the
two effects are difficult to disentangle because they coincide with changes in the payment
system for medical specialists.
Activity-based payments for medical specialists
The introduction of hospital-insurer negotiations and DTCs in 2005 also involved a
change in the payment of self-employed specialists. From 2005 onwards, medical
specialists received a fixed payment per DTC for services included in the B-segment, of
which DTC-prices are freely negotiable between hospitals and health insurers. However,
from 2005 to 2007 the lump-sum payments per hospital for medical specialist services were
also maintained so that extra revenues in the B-segment had to be compensated by lower
payments for services in the A-segment. In 2008, however, the lump-sum was abolished
and medical specialists received a fixed payment for DTCs included in the A-segment as
well. Hence, since then the annual income of self-employed specialists has been
completely activity-based, generating strong incentives to increase production. As a result,
both the production and income of medical specialists substantially increased.
Increased transparency
After the introduction of the new health care system in 2006, waiting times have been
monitored by the NZa as part of its annual hospital market review. In order to provide the
NZa with more reliable information, in 2009 it became mandatory for Dutch hospitals to
register and publish their mean expected waiting times for out-patient clinic diagnosis and
treatment using uniform definitions and standard methods of measurement (see Box 10.1).
Comparative information about waiting times also became available to health insurers
and patients, in addition to the NZa – for example, through the government-sponsored
WAITING TIME POLICIES IN THE HEALTH SECTOR: WHAT WORKS? © OECD 2013192

II.10. THE NETHERLANDS
patient-oriented health care portal www.KiesBeter.nl (literally: “make better choices”).
Increased transparency should allow them to make well-considered choices among
alternative hospitals. Health insurers are increasingly active in assisting their enrolees to
obtain faster treatment. Most have introduced waiting list mediation services that actively
search for the hospitals with the shortest waits. In 2009, in a newspaper article Dutch
health insurers claimed that these mediation services had reduced waiting times for about
47 000 people by an average of one to two months (Baltesen, 2010). According to this
article, about 10% of these patients were treated in hospitals in other countries, mainly
Belgium, Germany and Spain. An investigation by the Dutch Consumers Association
(Consumentenbond, 2011) also found that in 2010 mediation by health insurers resulted in
substantial waiting time reductions for several treatments (see Box 10.2 for more detailed
information).
The impact of the mediation by health insurers and the release of waiting time
information on patient hospital choice has not (yet) been assessed directly, but there is
empirical evidence that patients are more likely to choose hospitals with below-average
waiting times (Varkevisser and Van der Geest, 2007; Varkevisser et al., 2010).11 As
mentioned above, mean waiting times in the Netherlands have fallen substantially since
the introduction of the reforms in 2006 (Table 10.4). The mean waiting times for almost all
surgical procedures in Dutch hospitals in 2011 did not exceed five weeks, which is
substantially below the maximum of six weeks (for day-case treatment) or seven weeks
(for in-patient treatment) that was agreed upon between hospitals and health insurers as
socially acceptable (the “Treek norms”). As Table 10.5 shows, the mean waiting times
Box 10.1. Waiting time definitions in the Netherlands
Since 2009, the Dutch Healthcare Authority (NZa 2008) requires hospitals andfreestanding clinics to publish monthly consumer information about waiting timesaccording to the following definitions:
Waiting time out-patient clinic
The number of weeks between the moment the patient makes an appointment with anout-patient clinic and the third opportunity he/she can visit the out-patient clinicaccording to the clinic’s appointment registry.
Waiting time hospital treatment (day-case and in-patient admission)
The number of weeks between the moment the patient is indicated for treatment by aphysician (in the out-patient clinic) and the third opportunity he/she can be admitted to,or treated in, the hospital according to the hospital’s appointment registry. In case ofmultiple treatments, the waiting time for the most common treatment has to be provided.
Waiting times must be provided in weeks (rounded off upwards, implying a minimumwaiting time of one week) for a specified list of medical specialties and treatments. Theaim of the regulation is to provide consumers with information that is as realistic aspossible about the actual expected waiting times. Since July 2009, hospitals are no longerallowed to publish retrospective waiting time information (the average realised waitingtimes during the last three months), as some hospitals used to do before. Due to thechange in definitions from retrospective to expected waiting times, waiting time datapublished before and since 2009 may not be fully comparable.
WAITING TIME POLICIES IN THE HEALTH SECTOR: WHAT WORKS? © OECD 2013 193

II.10. THE NETHERLANDS
are slightly above this norm only for abdominoplasty and breast reduction. For both
procedures, the percentage of hospital locations with mean waiting times exceeding the
socially acceptable norm is almost 50%, while for other procedures – with the exception
of breast enlargement – this percentage is substantially lower. It is also clear from
Box 10.2. Waiting list mediation services by health insurers
Basically, health insurers’ mediation services work as follows. People can contact theirinsurer by either phone or email to apply for waiting time mediation. Within one tothree working days, the health insurer will contact the applicant to investigate his/herwillingness to travel and to assess whether an alternative hospital (or freestanding clinic)is capable of providing appropriate treatment. If so, the mediation service contacts all theavailable alternatives to investigate whether the applicant can be treated earlier. Someinsurers then make an appointment for their insured, but most only inform them aboutthe possible options. People are free whether or not to choose one of the alternativesselected by the mediation service. Four health insurers (including three large ones)guarantee that people can be treated within 5 working days for a number of treatments.One health insurer guarantees a maximum waiting time of several weeks for hip andlaparoscopic operations.
In 2010, the Dutch Consumers Association did a survey of all ten health insurers about thefeatures and effects of their waiting list mediation services. The results were published inNovember 2011 on their website and in their monthly magazine (Consumentenbond, 2011).In 2010, mediation services were contacted by about 84 000 people, of whom 38 000 actuallyused the service offered. Seven health insurers report substantial waiting time reductionsrelative to the period people had to wait according to their original appointment (two smallhealth insurers did not record this information, and one small health insurer did notrespond to the survey). Reported waiting time reductions for several treatments are shownin the table below.
Reported average waiting time reductions in weeksby insurers’ mediation services relative to the scheduled waiting time
of the original appointment for several treatments,Netherlands, 2010
Health insurer (ranked by market share)Radiology
(MRI)Neurology
(herniated disc)Surgery
(knee/hip operation)Ophthalmology
(cataract surgery)
Achmea 4.4 4.3 7.1 9.1
UVIT 4.8 5.8 10.0 10.6
CZ 4.4 3.9 11.0 12.1
Menzis 5.3 5.6 5.7 7.3
De Friesland1 1.7 1.8 3.7 3.8
ONVZ 4.6 6.2 5.0 7.8
Zorg & Zekerheid n.a. 4.0 4.7 6.7
1. Regional insurer, located in a region in which waiting times are relatively low.Source: Consumentenbond (2011) and http://www.consumentenbond.nl/test/geld-verzekering/verzekeringen/zorgverzekeringen/extra/wachtlijstbemiddeling/.
1 2 http://dx.doi.org/10.1787/888932755148
WAITING TIME POLICIES IN THE HEALTH SECTOR: WHAT WORKS? © OECD 2013194

II.10. THE NETHERLANDS
Table 10.5 that, despite the availability of public information about waiting times and
health insurers’ mediation services, waiting times vary substantially across hospitals for
several procedures.
Current policies (2012-15)From 2012 to 2015, the payment systems for both hospital and specialists will be
substantially reformed. Dutch policy makers are now primarily concerned about the rapid
growth of health care expenditure caused by the combination of hospitals’ and specialists’
incentives for extra production and insurers’ limited countervailing power. From 2007 to
2010, hospital expenditure grew on average by 3 to 4% per year in real terms and 6 to 7% in
nominal terms (NZa, 2012). The aim of the current reforms is to increase incentives for
efficiency within a total budget constraint for hospital care. In addition, the government
and the national associations of general hospitals, academic hospitals, freestanding clinics
and health insurers concluded a voluntary agreement to reduce real total growth in
hospital expenditure to 2.5% per year over the period 2012-15. Since a reduction of waiting
times is no longer an important policy concern, the reforms are not aimed at reducing
waiting times. Nevertheless, the reforms are likely to affect production incentives and may
therefore also have an effect on waiting times.
The reform of the hospital payment system involves the introduction of free pricing
for about 70% of hospital services by 2012 (a doubling as compared to 2011) and regulated
Table 10.5. Waiting times in Dutch hospitals, 2011Weeks
Surgical procedure1 Observations2 MeanStandarddeviation
Min. Max.Percentage ofobservationsabove norm
Breast reduction 128 8 5.7 1 35 48
Abdominoplasty 109 7 5.2 1 37 49
Hip replacement 134 6 4.0 1 32 31
Breast enlargement 101 6 4.6 1 37 41
Knee replacement 139 6 3.6 1 30 28
Inguinal and femoral hernia 157 5 8.5 1 80 11
Cholecystectomy 137 5 4.8 1 31 12
Hysterectomy 132 5 2.1 2 15 16
Herniated disc (orthopaedics) 49 5 5.8 1 26 12
Herniated disc (neurosurgery) 85 5 2.7 1 17 16
Cataract surgery 147 5 3.2 1 21 20
Prostatectomy 130 5 2.0 1 14 11
Tonsillectomy 140 4 2.4 1 15 14
Varicose veins 156 4 3.7 1 31 12
CABG 25 4 2.5 1 9 16
Knee laparoscopy 153 4 2.2 1 15 5
Tympanostomy tube 135 3 1.7 1 12 3
PTCA 47 2 1.2 1 6 0
1. Defined on the basis of Dutch diagnosis treatment combinations (DTCs), including both out-patient (day-casetreatment) and in-patient procedures (> 24 hour admission).
2. Number of hospital locations, including independent treatment centres. Note that not all procedures are providedby all hospitals. For example, the number of hospitals providing CABG and PTCA is legally restricted in theNetherlands.
Source: Authors’ calculations based on data from MediQuest provided by the NZa.1 2 http://dx.doi.org/10.1787/888932755167
WAITING TIME POLICIES IN THE HEALTH SECTOR: WHAT WORKS? © OECD 2013 195
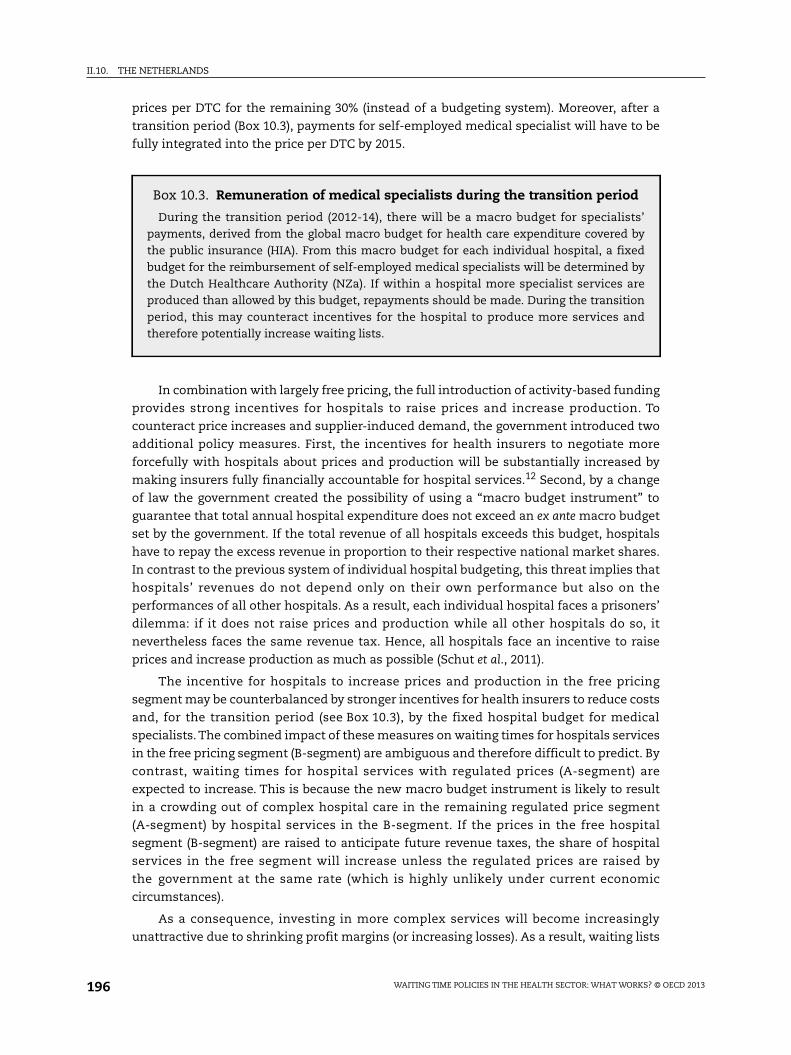
II.10. THE NETHERLANDS
prices per DTC for the remaining 30% (instead of a budgeting system). Moreover, after a
transition period (Box 10.3), payments for self-employed medical specialist will have to be
fully integrated into the price per DTC by 2015.
In combination with largely free pricing, the full introduction of activity-based funding
provides strong incentives for hospitals to raise prices and increase production. To
counteract price increases and supplier-induced demand, the government introduced two
additional policy measures. First, the incentives for health insurers to negotiate more
forcefully with hospitals about prices and production will be substantially increased by
making insurers fully financially accountable for hospital services.12 Second, by a change
of law the government created the possibility of using a “macro budget instrument” to
guarantee that total annual hospital expenditure does not exceed an ex ante macro budget
set by the government. If the total revenue of all hospitals exceeds this budget, hospitals
have to repay the excess revenue in proportion to their respective national market shares.
In contrast to the previous system of individual hospital budgeting, this threat implies that
hospitals’ revenues do not depend only on their own performance but also on the
performances of all other hospitals. As a result, each individual hospital faces a prisoners’
dilemma: if it does not raise prices and production while all other hospitals do so, it
nevertheless faces the same revenue tax. Hence, all hospitals face an incentive to raise
prices and increase production as much as possible (Schut et al., 2011).
The incentive for hospitals to increase prices and production in the free pricing
segment may be counterbalanced by stronger incentives for health insurers to reduce costs
and, for the transition period (see Box 10.3), by the fixed hospital budget for medical
specialists. The combined impact of these measures on waiting times for hospitals services
in the free pricing segment (B-segment) are ambiguous and therefore difficult to predict. By
contrast, waiting times for hospital services with regulated prices (A-segment) are
expected to increase. This is because the new macro budget instrument is likely to result
in a crowding out of complex hospital care in the remaining regulated price segment
(A-segment) by hospital services in the B-segment. If the prices in the free hospital
segment (B-segment) are raised to anticipate future revenue taxes, the share of hospital
services in the free segment will increase unless the regulated prices are raised by
the government at the same rate (which is highly unlikely under current economic
circumstances).
As a consequence, investing in more complex services will become increasingly
unattractive due to shrinking profit margins (or increasing losses). As a result, waiting lists
Box 10.3. Remuneration of medical specialists during the transition period
During the transition period (2012-14), there will be a macro budget for specialists’payments, derived from the global macro budget for health care expenditure covered bythe public insurance (HIA). From this macro budget for each individual hospital, a fixedbudget for the reimbursement of self-employed medical specialists will be determined bythe Dutch Healthcare Authority (NZa). If within a hospital more specialist services areproduced than allowed by this budget, repayments should be made. During the transitionperiod, this may counteract incentives for the hospital to produce more services andtherefore potentially increase waiting lists.
WAITING TIME POLICIES IN THE HEALTH SECTOR: WHAT WORKS? © OECD 2013196

II.10. THE NETHERLANDS
for complex hospital procedures are likely to grow. This may increase the outflow of
Dutch patients to other EU member states, because access to safe and high-quality cross-
border health care is being facilitated by the adoption of a new European directive
(European Union, 2011). Past experiments, however, have demonstrated that the
willingness of Dutch patients to travel is quite modest. Most of them seem to prefer waiting
longer in the Netherlands over waiting less by going abroad, even those living in border
regions (Brouwer et al., 2003).
ConclusionsDuring the 1990s, waiting lists in Dutch hospitals increased as a result of the
introduction of fixed budgets and capacity constraints for medical specialists alongside the
prevailing fixed global budgets for hospitals. Even though the waiting lists were still small
in comparison with other OECD countries, public discontent about increasing waiting
times pushed the government to take action. Since temporary subsidies targeted at waiting
lists proved not to be effective, in 2000 the hospital financing system underwent a radical
change, from fixed budgets to activity-based funding. As a result, from 2000 to 2006 average
waiting times for elective surgery were reduced by about 50%.
The introduction and gradual expansion of price competition among hospitals
since 2005 – as part of a major health care reform to introduce managed competition – plus
a radical change from fixed lump-sum payments to activity-based payments for medical
specialists in 2008 resulted in a further reduction in waiting times. As a consequence,
in 2011 mean waiting times for almost all surgical procedures in Dutch hospitals were
five weeks or less, which is substantially below the maximums of six or seven weeks
that have been adopted in Dutch society as the acceptable norms for elective out-patient
(day-case) or in-patient hospital treatment, respectively. The profound changes in the
financing of hospital treatment and medical specialist care not only reduced waiting times,
but also seems to have substantially contributed to a sharp upturn in life expectancy
since 2002. The downside of this, however, is that total health care expenditure has rapidly
increased, and that there is ample evidence that these extra resources were not spent
efficiently.
Waiting lists are no longer an important policy concern today. Dutch policy makers are
instead now primarily concerned with the rapid growth in health care expenditure caused
by strong incentives for both hospitals and specialists to increase production and by the
limited countervailing power of health insurers to counteract these incentives. By
reinforcing (price) competition among hospitals and incentives for health insurers to
enforce more efficient hospital production, the government aims at increasing the
pressure from the demand side to contain costs. At the same time, however, powerful
supply-side constraints are being introduced, which can be used in case the demand-side
pressure fails to yield the intended effects. Given the political need to contain public health
care expenditure in the short run, it is highly likely that these supply constraints will be
readily used. This may result not only in disabling effective competition, but also in
increasing waiting lists, particularly for complex hospital procedures.
Notes
1. Data refer to all persons in the BIG register with specialties in the groups general paediatrics,obstetrics and gynaecology, psychiatry and surgery, who work and live in the Netherlands and are
WAITING TIME POLICIES IN THE HEALTH SECTOR: WHAT WORKS? © OECD 2013 197

II.10. THE NETHERLANDS
classified as working within the health sector (SIC 3/NACE 1: 85; SIC 4/NACE v2: 86, 87 and 88), andwho had a taxable wage-income and were not self-employed in the same year. As medicalspecialists have the obligation to be currently practicing in order to maintain their registration, thiseconomic indicator signals at least being professionally active.
2. Data refer to all persons in the BIG register with the specialty “general practitioner” who work andlive in the Netherlands, are classified as working within the health sector (SIC 3/NACE 1: 85; SIC 4/NACE v2: 86, 87 and 88), had a taxable wage-income and were not self-employed in the same year.
3. Note that, except for the eight university medical centres, all hospitals in the Netherlands areprivate not-for profit entities facing a legal non-distribution constraint which means that they areprohibited from distributing any profits to investors, owners or shareholders.
4. The types of care included in the analysis were acute and subacute forms of ischemic heart disease(cardiology), malignant neoplasms of the digestive tract and peritoneum (surgery), arterial diseaseand disease of the capillaries (surgery), female genital disorders (gynaecology), disorders of thedigestive system (internal medicine), chronic tonsil and adenoid disease (otolaryngology),intervertebral disc disorders (neurology) and internal derangement of the knee (orthopaedics).
5. Prior to 1995, waiting lists did not seem to be an important societal issue. However, reliablestatistics about waiting times and waiting lists are scarcely available over that period.
6. In-patient care refers to any type of medical or surgical care performed at a hospital that doesinclude an overnight hospital stay, while out-patient care refers to any type of medical or surgicalcare performed at a hospital that does not include an overnight hospital stay.
7. For both out-patient and in-patient treatment, the maximum acceptable waiting time is measuredas the number of weeks between diagnosis and actual treatment.
8. Though in 1997 a national databank to register waiting times for non-emergency hospital care wasestablished and most hospitals voluntarily provided information to this databank, thecomparability of the available information is somewhat questionable because uniform definitionsand standard methods of measurement were lacking.
9. The increase in life expectancy among the elderly is still continuing, as shown in a recentpublication by Statistics Netherlands (CBS, 2011). Between 2000 and 2010, life expectancy at birthfor men increased from 75.5 to 78.8 years and for women from 80.6 to 82.7 years.
10. This category of hospital services was labelled the “B-segment”, whereas the remaining categorycontaining more complex hospital services for which prices were still subject to price regulationwas labelled the “A-segment”.
11. In the Netherlands, general practitioners (GPs) function as gatekeepers, but they are notresponsible for choosing hospitals on the patient’s behalf. That is, there is freedom of choice forpatients but the decision about which hospital to visit is most often made in consultation with thepatient’s GP.
12. Prior to 2012, part of any deficits that health insurers incur on hospital services included in theregulated A-segment were retrospectively compensated by the government.
References
Baltesen, F. (2010), “Patiënt wenst operatie eerder, luxer en beter”, NRC Handelsblad, February 9, p. 3
Blank, J.L.T., A.C. Dumay and B.L. van Hulst (2011), Ziekenhuismiddelen in verband: een empirisch onderzoeknaar productiviteit en doelmatigheid in de Nederlandse ziekenhuizen 2003-2009, IPSE Studies ResearchReeks No. 2011-3, Delft.
Brouwer, W.B.F. and F.T. Schut (1999), “Priority Care for Employees: A Blessing in Disguise?”, HealthEconomics, Vol. 8, No. 1, pp. 65-73.
Brouwer, W., J. van Exel, B. Hermans and A. Stoop (2003), “Should I Stay or Should I Go? Waiting Listsand Cross-border Care in the Netherlands”, Health Policy, Vol. 63, No. 3, pp. 289-298.
Capaciteitsorgaan (2010), The 2010 Recommendations for Medical Specialist Training in Medical, Dental,Clinical Technological and Related Educational As Well As Further Training Areas, Advisory Committee onMedical Manpower Planning, Utrecht
CBS (2011), “Levensverwachting ouderen sterk gestegen”, Webmagazine, November 23, StatisticsNetherlands, www.cbs.nl/.
WAITING TIME POLICIES IN THE HEALTH SECTOR: WHAT WORKS? © OECD 2013198

II.10. THE NETHERLANDS
Commissie Van der Zwan (1996), Gezondheidszorg in tel 4, Nederlandse Zorgfederatie (NZf), Utrecht.
Consumentenbond (2011), “Wachtlijstbemiddeling. De snelste weg naar zorg”, Consumentengids,pp. 48-49, November.
European Union (2011), Directive on Cross-border Healthcare Adopted, Council of the European Union,7056/11, PRESSE 40, Brussels.
Folmer, K. and E. Westerhout (2002), Financing Medical Specialist Services in the Netherlands: WelfareImplications of Imperfect Agency, CPB Discussion Paper, No. 6, CPB Netherlands Bureau for EconomicPolicy Analysis, The Hague.
Laeven, A.M.W., B.L. van Hulst, S.W. Mathijssen and W. van Hulst (2000), Het wachtlijstfonds 1999: dederde inhaalslag?, Publication No. 200.018, Prismant, Utrecht.
Mackenbach, J.P., L. Slobbe, C.W.N. Looman, A. van der Heide, J. Polder and J. Garssen (2011), “SharpUpturn of Life Expectancy in the Netherlands: Effect of More Health Care for the Elderly?”, EuropeanJournal of Epidemiology, Vol. 26, No. 12, pp. 903-914.
Ministry of Health (2004), Rijksbegroting 2004: XVI, Tweede Kamer, vergaderjaar 2003-2004, The Hague.
Ministry of Health (2011), Zorg die loont, Tweede Kamer, vergaderjaar 2010-2011, 32620(6), The Hague.
Mot, E. (2002), Paying the Medical Specialist: The Eternal Puzzle. Experiments in the Netherlands, Dissertation,University of Amsterdam (UvA), Amsterdam.
NZa (2008), Regeling verplichte publicatie wachttijden somatische zorg, Nadere regel CI/NR-100.084, DutchHealthcare Authority, Utrecht.
NZa (2012), Marktscan medisch specialistische zorg: weergave van de markt 2006-2011, Dutch HealthcareAuthority, Utrecht.
OECD (2012a), OECD Health Data 2012, OECD Publishing, Paris, http://dx.doi.org/10.1787/health-data-en.
OECD (2012b), OECD Economic Surveys: Netherlands, OECD Publishing, Paris, http://dx.doi.org/10.1787/eco_surveys-nld-2012-en.
Scholten, G.R.M, A.J.M. Roex and J.W. Sindram (1998), “Cost-control and Medical Specialist Payment:The Dutch Alternative”, International Journal of Health Planning and Management, Vol. 13 No. 1,pp. 69-82.
Schut, F.T. (2003), “Gezondheidszorg”, in C.A. de Kam and A.P. Ros (eds.), Jaarboek Overheidsfinanciën2003, Sdu Uitgevers, The Hague, pp. 105-131.
Schut, F.T. and W.P.M.M. van de Ven (2005), “Rationing and Competition in the Dutch Health-careSystem”, Health Economics, Vol. 14, No. S1, pp. S59-S74.
Schut, F.T. and W.P.M.M. van de Ven (2011), “Effects of Purchaser Competition in the Dutch HealthSystem: Is the Glass Half Full or Half Empty?”, Health Economics, Policy and Law, Vol. 6, No. 1,pp. 109-123.
Schut, F.T., W.P.M.M. van de Ven and M. Varkevisser (2011), “Macrobudget ontkracht prijsconcurrentieziekenhuizen”, Economisch Statistische Berichten, Vol. 96, No. 4610, pp. 294-297.
Siciliani, L. and J. Hurst (2003), “Explaining Waiting Times Variations for Elective Surgery across OECDCountries”, OECD Health Working Papers, No. 7, OECD Publishing, Paris, http://dx.doi.org/10.1787/406746186162.
Treekoverleg (2000), Notitie Streefnormstelling wachttijden curatieve sector, Zeist.
Van de Vijsel, A.R., P.M. Engelfriet and G.P. Westert (2011), “Rendering Hospital Budgets Volume Basedand Open Ended to Reduce Waiting Lists: Does It Work?”, Health Policy, Vol. 100, No. 1, pp. 60-70.
Varkevisser, M. and S.A. van der Geest (2007), “Why Do Patients Bypass the Nearest Hospital? AnEmpirical Analysis for Orthopaedic Care and Neurosurgery in the Netherlands”, European Journal ofHealth Economics, Vol. 8, No. 3, pp. 287-295.
Varkevisser, M., S.A. van der Geest and F.T. Schut (2004), “Concurrentie tussen Nederlandseziekenhuizen”, Studies in Economic Policy, No. 13, OCFEB/iBMG, Erasmus University Rotterdam.
Varkevisser, M., S.A. van der Geest and F.T. Schut (2010), “Assessing Hospital Competition When PricesDon’t Matter to Patients: The Use of Time-elasticities”, International Journal of Health Care Finance andEconomics, Vol. 10, No. 1, pp. 43-60.
WAITING TIME POLICIES IN THE HEALTH SECTOR: WHAT WORKS? © OECD 2013 199


Waiting Time Policies in the Health Sector
What Works?
© OECD 2013
PART II
Chapter 11
New Zealand
by
Jacqueline Cumming,
Health Services Research Centre, School of Government, Victoria University of Wellington
Long waiting lists, and hence long waiting times, for elective surgery have been akey feature of the New Zealand health system for many years. During the past18 years, New Zealand governments have implemented a formal set of prioritysetting policies for elective services, prioritising which patients can be treated withinavailable resources in a timely way. This chapter reflects on these policies,identifying failures and successes and key issues for the future. The chapteremphasises the need for the country’s governments to ensure overall equity ofaccess to elective services, a major policy goal that is yet to be achieved. There isalso a need to improve our understanding of the performance of priority setting toolsthrough further research and evaluation, and to provide further informationpublicly on how the priority-setting system for elective services actually works andthe implications of current policy settings for New Zealanders’ overall access toelective services. This is particularly important given the lack of availableinformation on how many patients miss out on care altogether and what happensto their quality of life as a result.
201

II.11. NEW ZEALAND
IntroductionThe New Zealand health system has had long waiting lists, and hence long waiting
times, for elective surgery for many years. Since the 1960s, political pressure has been
placed regularly on Ministers of Health to reduce the numbers of people waiting for elective
(non-urgent) operations, such as hip and knee surgery and cataract replacements. In the
early 1990s, the country’s governments began to set in place a new series of policies aimed
both at better prioritising which patients should receive publicly funded elective services
and at better managing waiting lists and times. This chapter reflects on the past 18 years
of policies on waiting lists and times in New Zealand, identifying failures and successes
and key issues for the future. The emphasis is on waiting lists and times for elective
services; some information on other services is also included at the end of the chapter.
The first section of the chapter provides an overview of the funding and organisational
arrangements of the New Zealand health system. The following section sets out the
problems facing New Zealand in relation to waiting lists and times. The third section
focuses on the development and implementation in the 1990s of new policies to prioritise
which patients should receive publicly funded operations and to better manage waiting
lists and times. The next section discusses how newer versions of these policies now work
in New Zealand, which is followed by a discussion of a number of key issues with respect
to further achieving key objectives relating to elective services over the next few years. The
final section provides some concluding comments.
Main characteristics of the New Zealand health systemThe health system in New Zealand is characterised by universal coverage. Since the
1940s, the country’s health care system has been predominantly publicly funded, with
83.2% of an estimated USD 13 194.6 million (purchasing power parity) in health
expenditure in 2010 coming from public sources (OECD, 2012). Private funding is mostly
made up of out-of-pocket payments (10.5% of expenditure in 2010) and voluntary private
insurance (4.9% of expenditure) (OECD, 2012). A separate publicly funded accident
compensation insurance scheme (known as ACC) funds accident-related care, which
accounted for 8.4% of expenditure in 2010 (Ministry of Health, 2012).
A Minister of Health oversees the health sector, supported by a central Ministry of
Health (MoH). Twenty publicly owned District Health Boards (DHBs) are funded to
undertake the planning for all publicly funded health services for their geographic
populations and to ensure their delivery. DHBs own public hospitals, and they themselves
deliver a wide range of services, including out-patient, day-patient, and in-patient medical
and surgical, maternity and rehabilitation services and some community-based district
nursing and mental health services. DHBs also purchase (through explicit contracts) many
primary health care and community services from a range of for-profit and not-for-profit,
privately owned providers (e.g. general practices; community-based health promotion,
WAITING TIME POLICIES IN THE HEALTH SECTOR: WHAT WORKS? © OECD 2013202

II.11. NEW ZEALAND
mental health and aged care service providers, including Mãori- and Pacific-led providers).
DHBs may also purchase some surgical and medical services from private hospital
providers.
Hospitals
In-patient and out-patient care is provided mainly by public hospitals that are
administered by the DHBs. In 2011, there were 164 hospitals with 12 348 beds (2.8 per
1 000 population) (OECD, 2012). Eighty-six public hospitals account for 84% of all beds,
while 78 private hospitals account for the remaining 16% (OECD, 2012). Private hospitals
provide mainly elective surgery and long-term geriatric care but in general do not provide
highly specialised care (French et al., 2001).
Hospital remuneration
Public hospitals are paid through a fixed operating budget that is intended to cover all
operating expenses (major capital expenditure excluded). Hospitals are paid for each
patient according to a set price and volume schedule, where the price refers to diagnosis-
related groups (DRGs), within their overall budget.
Specialist remuneration
Most specialists work within public hospitals and are paid on a salary basis, but many
also maintain their private practices through which they can supplement their incomes.
On the other hand, in the private sector specialists are paid on a fee-for-service basis (The
Commonwealth Fund, 2011). The income of a salaried specialist was 3.58 per average wage
in 2011 (OECD, 2012).
Co-payments
There are no charges for in-patient and out-patient care in public hospitals. For
primary care medical services, however, there are co-payments for patients. For primary
care visits with a general practitioner (GP) or a nurse, patients must pay a fee, ranging from
NZD 0 for children and around NZD 10 to NZD 70 (EUR 6 to EUR 36) for adults (Cumming
et al., 2008; Cumming and Mays, 2011).
Private health insurance and out-of-pocket payments
Private insurance was held by 38.4% of adults and 31.3% of children in 2006/07, but is
likely to have reduced since then; it offers faster access to elective surgery, better facilities,
and a choice of surgeon, and can also cover primary health care user charges. Voluntary
private insurance accounted for 4.9% of health expenditure in 2010 (OECD, 2012).
Primary care
Residents are able to choose their GPs, who act as gatekeepers – individuals cannot
access public hospitals if they are not referred by their GPs. GPs are in general self-
employed and paid by a mix of capitation and other payment types, including fee-for-
service co-payments. Higher capitation payment rates are paid for those practices that
agree to keep their fees below a certain level (Cumming et al., 2008; Cumming and
Mays, 2011). In 2009, the income of a self-employed GP per average wage was 3.14, whilst
the corresponding figure for a salaried GP was 1.751 (OECD, 2012).
WAITING TIME POLICIES IN THE HEALTH SECTOR: WHAT WORKS? © OECD 2013 203

II.11. NEW ZEALAND
Surgical activity
Of all the surgical procedures performed as in-patient (per 100 000 population), the
highest growth rates were attributable to percutaneous coronary interventions (PTCA and
stenting) (65%) and knee replacement (50.5%) (Table 11.1). Coronary bypass (in-patient) and
tonsillectomy with or without adenoidectomy (both in-patient and day-case) have seen the
largest decreases (approximately 20%).
Health expenditure
Total health expenditure has steadily increased in New Zealand from 7.6% of GDP in
2000 to 10.1% in 2010, which is higher than the OECD average of 9.5%. New Zealand ranks
below the OECD average in terms of health spending per capita, with spending of
USD 3 022 in 2010 (adjusted for purchasing power parity), compared with an OECD average
of USD 3 268. Between 2000 and 2009, total health spending in New Zealand increased in
real terms by 5.8% per year on average, a faster rate than the OECD average of 4.7%. The
growth rate slowed to 3.4% in 2010, but this was much higher than the OECD average of
zero growth. The increase in health expenditure is mainly attributed to the increase in
public health expenditure. Public health expenditure has increased from 78% of total
health expenditure in 2000 to 83.2% (well above the OECD average of 72.2%) in 2010, while
private health expenditure (private health insurance contributions and out-of-pocket
Table 11.1. Surgical procedures per 100 000 population,New Zealand, 2000 and 2010
Surgical procedures by ICD-9-CM 2000 2010% change
in surgical proceduresbetween 2000 and 2010
Cataract surgery:
In-patient 23.1 13.0 -43.70
Day-case 224.4 312.8 39.40
Tonsillectomy with or without adenoidectomy:
In-patient 78.0 61.6 -21.00
Day-case 56.0 44.7 -20.10
Percutaneous coronary interventions (PTCA and stenting): in-patient 71.4 118.4 65.00
Coronary bypass: in-patient 51.4 41.6 -19.00
Appendectomy: in-patient 137.2 134.5 -1.90
Cholecystectomy:
In-patient 98.2 106.2 8.10
Day-case 1.3 7.9 507.70
Laparoscopic cholecystectomy:
In-patient 81.7 91.9 12.50
Day-case 1.3 7.7 492.30
Inguinal and femoral hernia:
In-patient 64.7 49.7 -23.10
Day-case 51.0 52.8 3.50
Hip replacement: in-patient 119.4 143.4 20.10
Knee replacement: in-patient 62.9 94.7 50.50
Source: OECD (2012), OECD Health Data 2012, OECD Publishing, Paris, http://dx.doi.org/10.1787/health-data-en.1 2 http://dx.doi.org/10.1787/888932755186
WAITING TIME POLICIES IN THE HEALTH SECTOR: WHAT WORKS? © OECD 2013204

II.11. NEW ZEALAND
payments) has decreased from 22% of total health expenditure to 16.8% within the same
period (OECD, 2012).
Physicians
New Zealand has fewer physicians per capita than most other OECD countries. The
number of practising physicians has increased from 2.23 (per 1 000 population) in 2000 to
2.61 in 2010, which is well below the OECD average of 3.1 (OECD, 2012).
Ageing and life expectancy
The percentage of the population aged 65 and over has increased from 11.8% in year
2000 to 13.3% in 2011. Average life expectancy, which increased from 78.3 to 81 years from
2000 to 2010 (OECD, 2012), is more than one year higher than the OECD average of 79.8 years.
Waiting lists and times for elective surgeryElective surgery is formally defined in New Zealand as cases where a patient is to be
treated seven or more days after a decision is made by the specialist that treatment is
warranted (Ministry of Health, 2011d). In 2009/10, it was estimated that the health sector
spent NZD 1 billion on elective services, or 7.7% of the MoH’s total funding to DHBs (Office
of the Auditor General, 2011).
Given the system’s limited resources, waiting for an elective operation has been a
feature of health care in New Zealand for many years. Traditionally, New Zealand used a
“triage” system and “first-come, first-served” waiting lists to determine which patients
would receive elective care and when they would receive it. Once a patient had been
referred by their GP to a specialist, specialists would categorise patients as urgent, semi-
urgent or routine. Patients categorised as urgent would receive care immediately; those
who were semi-urgent would receive care within a short period of time; while those
categorised as requiring routine care would be allocated to a waiting list (Roake, 2003).
From the 1960s onwards, the length of waiting lists and long waiting times were a
major focus of attention, with significant political pressure placed regularly on Ministers of
Health to reduce the numbers waiting when waiting lists or times grew long (New Zealand
Government, 1969; New Zealand Government, 1974; Health Benefits Review, 1986; Hospital
and Related Services Taskforce, 1988; Hay, 1989; Upton, 1991; Gauld, 2009). Historically, key
initiatives were taken to reduce waiting lists and times, including: reviews of the lists to
remove those no longer needing treatment; increased use of day- and out-patient care
(Hay, 1989); efficiency improvements (Fraser et al., 1993); and the provision of new funding
to enable additional elective operations to take place (Fraser et al., 1993; Gauld, 2009). At
times, however, such actions simply resulted in new referrals coming into hospitals, with
consequent increases in waiting lists and times (Fraser et al., 1993).
Table 11.2 sets out the estimated number of New Zealanders waiting and the waiting
times for various points in time between 1967 and 1999. These estimates are taken from a
variety of sources, as indicated in the table. Note that after about 1996, the concept of the
“waiting list” changed, and the reported numbers of people waiting signify those who have
been formally placed on a waiting list using a new process to manage elective surgery
waiting times (discussed below); thus, the data after 1996 are not directly comparable to
data from earlier years.
WAITING TIME POLICIES IN THE HEALTH SECTOR: WHAT WORKS? © OECD 2013 205

II.11. NEW ZEALAND
Reform of elective surgery policies in the 1990sIn 1993, following many years of ineffective policies to reduce waiting lists and waiting
times, and with waiting lists ever lengthening, government reforms to the organisation of
the New Zealand health sector led to a greater interest in better managing waiting lists and
times. The government emphasised that reduced waiting lists and times would be a
positive outcome of major reforms to the health sector (Upton, 1991), but the key factor in
reviewing waiting lists and times came about as a result of an increased focus on how New
Zealand might better set priorities for publicly funded health care. Thus, the newly
established Core Services Committee (later, the National Health Committee) (National
Advisory Committee on Core Health and Disability Support Services, 1992) oversaw a
review of elective surgery waiting lists (Fraser et al., 1993) in one of the first efforts to better
set priorities.
In that review, concerns were raised over the lack of transparency in the prioritisation
of patients and the management of waiting lists, including whether or not those with the
greatest needs or those most likely to benefit were the ones who were more likely to
receive care in a timely way. There were also concerns about the length of time some
patients had to wait, the significant differences in waiting times around the country, and
the uncertainty patients faced, with many never sure whether they would ever receive
treatment (Fraser et al., 1993). The review found that waiting lists were managed differently
in different parts of the country, and that they did not necessarily include only those who
could actually be operated on immediately if resources became available: some on the list
had already had their operation (perhaps in the private sector), or no longer needed the
operation, or were not yet in a serious enough condition to warrant treatment (Fraser et al.,
1993; Roake, 2003). Furthermore, not every patient who might benefit from an operation
ended up on the waiting list, as both GPs referring patients to specialists and the specialists
Table 11.2. Reported waiting list numbers and times for surgery, New Zealand
YearTotal waiting list
numbersNumber of patients waitingand reported waiting times
Source
1967 31 928 Hay (1989)
1969 38 164 Hay (1989)
1981 38 501 Upton (1991)
1985 46 502 Health Benefits Review (1986)
1987 > 50 000 8 000 patients waiting for over two years Hospital and Related Services Taskforce (1988)
1991 62 035 Estimated likely waits: Upton (1991)
28 000 patients (45%) – less than six months
13 600 – between six months and one year
11 000 – between one and two years
3 000 (15%) – > two years
1992 64 000 Fraser et al. (1993)
1993 72 647
1994 77 558
1995 85 574 35 794 (41.8%) < 6 months Ministry of Health (1997)
18 523 (21.6% ) 6-11 months
16 356 (19.1%) 12-23 months
14 901 (17.4%) 2 + months
1996 94 057 Ministry of Health (1997)
1997 91 243 Ministry of Health (1998)
1998 65 801 Residual waiting list (not booked,not given certainty)
Health Funding Authority (1998)
WAITING TIME POLICIES IN THE HEALTH SECTOR: WHAT WORKS? © OECD 2013206

II.11. NEW ZEALAND
themselves adjusted their behaviour as waiting lists and times grew (Fraser et al., 1993;
Roake, 2003). There were also concerns raised about the incentives faced by specialists
working in publicly owned hospitals. Many also work in privately owned hospitals, where
they earn higher fees, and they therefore have a financial incentive to keep waiting lists
and waiting times long, which in turn might encourage patients to have their operations
done in privately owned hospitals (Health Benefits Review, 1986), either paid for through
private insurance or out-of-pocket.
The review authors proposed that a new system be put in place to assess patients
against an agreed set of criteria, based on the need for surgery and its potential benefits
(Fraser et al., 1993). Those who met the criteria would be offered a guarantee of receiving
surgery and be “booked” for their surgery. Those who did not meet the criteria would be
referred back to their GP, for future referral if their condition deteriorated. This system would
ensure that the patients with the highest needs or greatest ability to benefit would be treated
first. The system would also provide certainty for patients: once scored against the agreed
criteria, patients would know whether or not they were to receive their surgery in the
publicly funded sector, or whether they would need to pay for it themselves. Such
transparency and certainty would also reduce the ability of specialists to suggest that, as a
result of long waiting lists and times, patients might want to have their surgery done more
quickly in a private hospital. It was recommended that this be a national system. The review
authors also noted the importance of engaging with clinicians if the system were to work,
and of ensuring sufficient resources would be made available to ensure that all those booked
would indeed receive their care within the specified time frames (Fraser et al., 1993).
As a result of the review of elective surgery waiting lists, new policies and processes to
manage these lists were implemented from the mid-1990s on, with a focus on ensuring
that patients with the greatest potential benefit would get priority (Hadorn and
Holmes, 1997a). The first steps in implementation included: the development by
consensus groups of clinical priority assessment criteria2 (CPAC) for key conditions;
reviews of waiting lists, including informing patients that they would be unlikely ever to
receive their procedure and that they were therefore being removed from the list; and
additional funding to increase the number of operations performed (where assessment
tools such as CPAC were being used) (Hadorn and Holmes, 1997b; Ministry of Health, 1998).
CPAC tools were developed during this time to support the process of prioritising
elective surgery (Hadorn and Holmes, 1997a; Hadorn and Holmes, 1997b; Barber et al., 2011).
From early on, multiple instruments were developed to determine surgical priority, rather
than a single universal CPAC instrument. Many CPAC tools were (and remain, see below)
multi-dimensional, integrating both objective and subjective clinical and social measures
for specific conditions or specialties. With the early tools, key criteria were determined
by specialists and then weighted by importance to produce an overall score (Barber
et al., 2011). Integrated tools were also developed in some specialty areas (such as
orthopaedics, ophthalmology and plastic surgery), where specialists first ranked individual
conditions against each other, with each condition then being allocated a specified range
of scores on an overall scale of 1-100. Specialists then scored each patient within the
specified range available for the particular condition the patient was suffering from, using
a visual analogue scale (Roake, 2003). (For examples of current tools, which generally follow
the same multi-criteria approach used for the early tools, see below.)
WAITING TIME POLICIES IN THE HEALTH SECTOR: WHAT WORKS? © OECD 2013 207

II.11. NEW ZEALAND
At one point, there were CPAC for 29 specialities listed on the MoH website (McLeod
et al., 2004b), with national tools more likely to be used in some specialities (e.g. for
coronary artery bypass grafts, hip and knee joint replacements), while a number of local
tools were also in use (e.g. in general and vascular surgery) (Roake, 2003; Dew et al., 2005).
Early on, a distinction was made between the “clinical” threshold where it was felt patients
would benefit from treatment, and a (higher) “financial” threshold, the level at which
the health system could afford to offer care, which operated as the threshold
above which patients would be offered treatment within the publicly funded system
(McLeod et al., 2004b). A clinical over-ride was also possible where clinicians felt a CPAC tool
did not appropriately reflect the patient’s condition/need.
These first forays into more explicit priority setting for elective surgery in
New Zealand faced a number of problems.
First, the system developed in ways that could not immediately ensure equity of
access, a key goal of the elective services policy. Although some national tools were used
across New Zealand, many local tools were also established, which meant that different
hospitals did not always use the same tools for the same conditions or specialties. Even
where there were national tools, they were not necessarily used in the same ways: patients
were not always scored completely accurately (in particular, if it was obvious that patients
would reach the financial threshold score), and not all hospitals used the scores to rank the
order in which patients should be treated, with some hospitals using CPAC tools to identify
whether a patient would score over the threshold but then using a different process to
determine the order in which patients were treated (Roake, 2003; McLeod et al., 2004a;
McLeod et al., 2004b; Office of the Auditor General, 2011). Even where national tools were in
use, different thresholds for treatment were used across the country.
Second, CPAC scoring as a priority setting process could work only if surgeons in
particular accepted it as a valid and legitimate process, and if the scoring process could not
be gamed to a large degree. Research undertaken in 2001/02 showed that although
around 70% of surgeons agreed that it was essential to have a nationally consistent method
to determine priority patients, the same number felt that their clinical judgement was the
most effective way to do this. At the time of the survey, 19.5% felt that the then-existing
CPAC provided an effective method for prioritising patients, while 44.8% felt the further
development of tools had the potential to be an effective means of prioritisation
(McLeod et al., 2004a). Many did not believe the tools were clinically relevant, for example,
because of variations in clinical judgement, because the tools could not discriminate
between cases, because there was a lack of evidence about ability to benefit, or because the
tools did not work well for all cases (McLeod et al., 2004b). Concern was also expressed over
a lack of consultation on a number of the CPAC tools and the processes for scoring and
booking patients (Roake, 2003). It was also acknowledged that “gaming” could and did
occur (Roake, 2003; Gauld, 2009); for example, in a survey of surgeons and registrars
undertaken in 2001/02, it was found that the financial threshold was a major influence for
13.5% of surgeons (McLeod et al., 2004a).
A third problem concerned the need for CPAC tools to be valid (i.e. to measure what
they set out to measure) and reliable (i.e. consistently applied). Validity is related to the
purpose of the tools, which in New Zealand has been to provide a means of prioritising
patients consistently across the country. Priority setting may be done on the basis of
criteria such as severity, urgency and expected benefit, but the overlap between these
WAITING TIME POLICIES IN THE HEALTH SECTOR: WHAT WORKS? © OECD 2013208

II.11. NEW ZEALAND
concepts, a lack of agreement on these and other related terms (such as “need”), and the
fact that the tools are often assessing multiple criteria can result in disagreements about
the appropriateness of particular CPAC tools. A lack of evidence about the circumstances
under which the most benefit (i.e. improved health) can be achieved from elective surgery
has also been a problem in reaching agreement on the tools.
There was very little empirical validation of the development of the CPAC tools, and
almost none was published. A number of early studies have, however, examined the tools’
performance. One study found that CPAC scores for coronary artery bypass graft in New
Zealand did not correlate with readmission due to cardiac events or death while waiting
(Jackson et al., 1999). Another study found moderate correlations between CPAC scores and
need (as assessed by disease-specific health status tools) for cataract and prostrate patients,
but only weak correlations for hip and knee joint replacements, and weak correlations
between CPAC scores and improvement in health following surgery for all three conditions
(Derrett et al., 2002). Some have also questioned whether for certain conditions CPAC scoring
prioritised patients more accurately than the original surgeons’ triage categories or other
condition-specific tools, including cholecystectomy (Dennett et al., 1998), general surgery
(Dennett and Parry, 1998), coronary artery bypass surgery (Jackson et al., 1999; Seddon
et al., 1999) and hip and knee joint replacement (Colmean et al., 2005). In addition, a number
of studies have shown poor intra-rater (Graham et al., forthcoming) and inter-rater (Dennett
et al., 1998; Halliwell, 1998; Graham et al., forthcoming) reliability, due at least in part to
acknowledged variable clinical judgement (MacCormick et al., 2003; McLeod et al., 2004b;
Graham et al., forthcoming).
Although various governments aimed to have a national system fully operational at
various points in time (Shipley, 1996; New Zealand Government, 2000), a number of major
problems with implementation slowed the achievement of key policy goals. In addition to
concerns over the performance of particular tools, the problems included confusion over key
aspects of the policy (McLeod et al., 2002; Roake, 2003), delays with developing CPAC tools
[particularly national tools (Gauld, 2009)], delays in developing the infrastructure to support
the CPAC processes (Gauld, 2009) and the slow development of accountability processes. As
a result, the elective services policy has been refreshed a number of times (Shipley, 1996;
New Zealand Government, 2000; Gauld, 2009; Ministry of Health, 2011b), and at various
points in time people have been removed from waiting lists (Derrett et al., forthcoming). The
policy remains in place today, however, with new processes for developing CPAC tools, new
tools, and a number of other policies in place to support the policy goals on elective services.
However, although the policy has resulted in some improvements overall, the key goal of
national equity of access has yet to be achieved (see below).
Current elective services policiesThe current objectives of the elective services programme are set out in Box 11.1.
The current prioritisation processes now involve:
● Patients referred (usually by their GP) for potential elective surgery must be informed
within ten days of whether they will be assessed by a specialist. Those to be assessed are
to have their needs and ability to benefit assessed in a first specialist assessment (FSA),
which is to occur within six months of referral.
● Prioritisation is undertaken once it is decided that surgery is the best option for the
patient and they are deemed fit to undergo the treatment. Formal CPAC tools are used to
WAITING TIME POLICIES IN THE HEALTH SECTOR: WHAT WORKS? © OECD 2013 209
II.11. NEW ZEALAND
assess (and score) need and ability to benefit for most elective surgical services. Tools are
generally completed by clinicians, but should include discussion with patients, while in
some cases patients complete parts of the process themselves (e.g. for cataract surgery).
A clinical override is possible where, in the specialist’s opinion, the CPAC tool does not
adequately represent an individual patient’s ranking relative to other patients, due to
factors or criteria additional to those assessed by the relevant prioritisation tool. It is
expected that the use of a clinical over-ride should only occur in 5-10% of cases and must
be clearly documented (personal communication, Ministry of Health).
● A threshold treatment score is established by each specialty within a DHB: this is set so
that the number of patients accepted for treatment can be treated within the capacity
available. Those accepted for treatment must receive their care within a maximum of six
months.
● Based on their CPAC score, patients are then either: a) immediately booked for surgery,
to occur within six months; or given certainty that they will receive their operation
within six months but actually booked for surgery not long after their FSA; b) placed
under “active review” in case their condition deteriorates; or c) returned to their GP for
“usual care”. Patients under “active review” are those close to the treatment threshold,
where there is a realistic probability that the patient’s condition may meet the threshold
for treatment in the foreseeable future (e.g. within 12 months). Such patients are not
given certainty that they will receive treatment within six months, but they are to
receive a clinical review within six months of their being placed under “active review”
(Ministry of Health, 2011a).
The process for developing CPAC tools has also now changed. Medical colleges are
encouraged to take the lead in developing and “owning” the tools, with the development of
national CPAC tools often now involving a more sophisticated decision-making process,
including improved face-validity reviews and checks on test-retest reliability (Barber
et al., 2011). Patients are also now being involved in the development of some tools (Barber
et al., 2011). In certain cases, ranges of CPAC scores are now associated with specific agreed
treatment times (Office of the Auditor General, 2011).
In 2012, there were 30 national tools covering 19 specialties as well as 57 nationally
recognised (i.e. nationally approved) local tools in use. DHB reporting shows that national
or nationally recognised local tools were used for 98% of all elective prioritisations reported
in 2010/11. National tools were used for 67% of prioritisation events and nationally
recognised local tools for 31% (personal communication, Ministry of Health). All elective
cardiac surgery, orthopaedic, ophthalmology, neurosurgery and gynaecology services use
national tools, while local tools are used particularly for general surgery, urology, vascular
surgery and endoscopy, as well as in some specialised services (e.g. paediatric
orthopaedics). The development and implementation of each tool is estimated to cost
around NZD 90 000 (personal communication, Ministry of Health).
In addition, each DHB’s performance is regularly assessed, using data reported on the
MoH website and based on seven indicators (Elective Services Patient Flow Indicators or ESPIs):
● DHB services that appropriately acknowledge and process all patient referrals within ten working
days; the goal is that all services appropriately acknowledge and process every referral
within ten working days.
● Patients waiting longer than six months for their first specialist assessment (FSA); the goal is to
have no patients waiting more than six months for an FSA.
WAITING TIME POLICIES IN THE HEALTH SECTOR: WHAT WORKS? © OECD 2013210

II.11. NEW ZEALAND
● Patients waiting without a commitment to treatment whose priorities are higher than the actual
treatment threshold (aTT); the goal is to have no patients above the aTT without a
commitment to treatment. (The aTT is a priority score equal to the CPAC score at which
90% of patients received surgery over the last 12 months. Assuming a constant
treatment pattern and service mix, a DHB can use the aTT to estimate the number of
patients that can be treated within six months of being given certainty of treatment over
the next 12 months.)
● Clarity of treatment status; following specialist assessment, all patients should know if and/or
when they will receive treatment. Thus patients within the booking system should be
assigned a status appropriate to their priority. Where no such status is allocated, patients
default to a residual waiting list. Since 1 July 2006, residual waiting list status has not been a
status option for patients on the booking system; therefore this measure is now redundant
and is being removed from the suite of indicators from July 2012.
● Patients given a commitment to treatment but not treated within six months; the goal is to
ensure no patients with this status remain untreated after six months.
● Patients in active review who have not received a clinical assessment within the last six months; the
goal is to ensure no patients in active review fail to receive their review every six months.
● Patients who have not been managed according to their assigned status and who should have
received treatment; the goal is that no patients appear in this indicator.
● The proportion of patients treated who were prioritised using nationally recognised processes or
tools; the goal is to have all patients prioritised using nationally recognised processes or
tools (Ministry of Health, 2011a).
These measures are designed to assess DHB performance, and reporting focuses on
the number and percentage of patients within a DHB that meet each target indicator. The
indicators are difficult to interpret, and the reporting system is not designed, for example,
to give New Zealanders a clear picture of the circumstances under which they may or may
not reach the threshold for treatment. There is also currently no information available
publicly on the numbers of people who are returned to their GP for care, meaning that the
system cannot currently be used to identify overall “demand” for elective surgery in the
country. It is anticipated that such information will be made publicly available in future
(personal communication, Ministry of Health).
Box 11.1. Strategy objectives for elective services, 2000
To ensure:
● A maximum waiting time of six months for first specialist assessment.
● All patients with a level of need that can be met within the resources (funding) availableare provided with surgery within six months of assessment.
● Delivery of a level of publicly funded service that is sufficient to ensure access to electivesurgery before patients reach a state of unreasonable distress, ill health and/orincapacity.
● National equity of access to electives, so that patients have similar access to electiveservices regardless of where they live.
Source: New Zealand Government (2000), Reduced Waiting Times for Public Hospital Elective Services, New ZealandGovernment, Wellington.
WAITING TIME POLICIES IN THE HEALTH SECTOR: WHAT WORKS? © OECD 2013 211

II.11. NEW ZEALAND
Figure 11.1 shows the number of patients waiting longer than six months for their FSA
(ESPI 2 above) and the number of patients given a commitment to treatment (CT) but not
treated within the six-month period (ESPI 5 above) between 2000 and 2011.
The data show that, even in the early 2000s, large numbers of patients were waiting
longer than the stipulated six months for their FSA, with the numbers falling slowly over
the early 2000s. The significant drop in the number of patients waiting for their first FSA
in 2006 arose in part from an increase in service delivery and in part from reviews of
waiting lists. The reviews tidied up the waiting list data, removing patients who were on
more than one list or who had already received treatment. Many patients were also
informed that they would not be assessed and were therefore being returned to their GP for
on-going care (Willcox et al., 2007; Gauld, 2009; Office of the Auditor General, 2011).3 In
terms of receiving treatment, the numbers waiting over six months crept up over time
from the end of 2001 to just over 8 000 in 2003, before falling to around 7 500 at the end
of 2005.
Since 2006, the elective services system has been applied more consistently over time,
with lower numbers of patients not receiving their FSAs or their treatment within the
specified time frames. As of December 2011, 2 821 patients had not had their FSA within
six months and 2 447 patients had not been treated within six months (personal
communication, Ministry of Health) (see also Ministry of Health, 2011e).
These reductions in waiting lists and times have been achieved against a backdrop of
recent significant increases in elective surgery, the use of financial incentives and targets,
and increased attention being paid to elective services management.
Formal financial incentives and targets aim to ensure delivery of a certain number of
FSAs and elective operations by each DHB, and to move to a position where the number of
elective operations per head of population is more equal across the DHBs.
Thus each DHB is contracted to deliver a particular number of elective operations,
within their overall funding. The MoH also holds a budget for elective operations, which is
available for allocation to each DHB in proportion to their population. This makes up
Figure 11.1. Numbers of people waiting more than six months for treatmentand first specialist assessment, New Zealand, 2000 to 2011
Source: Personal Communication with New Zealand Ministry of Health.1 2 http://dx.doi.org/10.1787/888932754198
45 000
40 000
25 000
20 000
15 000
10 000
5 000
0
35 000
30 000
2000 2001 2002 2003 2004 2005 2006 2007 2008 2009 2010 2011
1 3492 310
3 8995 152
6 868 7 428 8 1347 059 6 474 7 055 7 079 7 532
6 683
3 650 3 204 2 969 3 322 3 395 3 022 3 234 2 989 3 425 2 483 2 447
41 903
37 152 36 251
39 694
32 197
28 056 28 04025 622 25 130
24 129 24 062
15 523
5 5044 484 4 067 4 083 4 050 3 829 4 622 3 766 3 775 3 335 2 821
June Dec. June Dec. June Dec. June Dec. June Dec. June Dec. June Dec. June Dec. June Dec. June Dec. June Dec. June Dec.
> 6 months for treatment > 6 months for first specialist assessment
WAITING TIME POLICIES IN THE HEALTH SECTOR: WHAT WORKS? © OECD 2013212

II.11. NEW ZEALAND
around 25% of the funding available for elective surgery. This additional funding is
available to support increases in elective surgery (see below). DHBs are incentivised to
ensure they deliver an agreed level of service above base levels of electives. In addition,
funding can be withheld if DHBs do not meet ESPI targets. Both aspects of the elective
services programme have been effective in improving the management of elective surgery,
with most DHBs accessing most of their funding since 2008/09, and no DHBs have lost
funding for failing to meet their ESPI targets in the last three years (personal
communication, Ministry of Health).
Since 2007/08, the government has set out a series of “Health Targets” that DHBs must
meet. These are reported on publicly. Elective surgery targets have been included since the
first targets were set in 2007/08. Initially, each DHB had two targets to meet: first, to comply
with all ESPI indicators and second, to deliver an agreed additional volume of elective
services. Across all the DHBs, the target in 2007/08 was to achieve a 10% increase in elective
services volumes over and above base-funded volumes. Since 2009/10, the government set a
national target of an average of 4 000 additional operations (compared to the average of 1 400
additional operations in earlier years). As a result, DHBs have further significantly increased
the volume of elective surgical discharges over recent years (see Figure 11.2). In 2007/08,
DHBs ensured the delivery of 117 964 elective surgical discharges; in 2010/11, this had
increased to 145 414, a rise of 23%.
These increases in elective surgery have been supported by additional funding
available to the DHBs from 2006/07, totalling around NZD 761 million up to 2010/11 (Office
of the Auditor General, 2011). DHBs have used a number of approaches to increase the
volume of surgery being delivered. These include:
● Redesigns of elective services systems, including developing referral guidelines for GPs
and making these easily accessible, increasing access to diagnostic services, upskilling
GPs in the management of conditions to reduce hospital referrals, enhancing the GP
liaison role with hospitals, ensuring appropriate hand-over processes, and training
registrars to be generalists and better linking training with elective surgery procedures.
● Enabling non-contact FSAs to ensure all patients receive an FSA in a timely way.
Figure 11.2. Publicly funded elective surgical discharges,New Zealand, 2007-08/2010-11
Source: Personal Communication with New Zealand Ministry of Health.1 2 http://dx.doi.org/10.1787/888932754217
160 000
155 000
150 000
145 000
140 000
135 000
130 000
120 000
125 000
115 000
110 000
105 000
100 0002007/08 2008/09 2009/10 2010/11
121 964125 964
129 964
117 964
129 965
138 521
145 414
Target of average 4 000 per annum increase Number of discharges delivered
WAITING TIME POLICIES IN THE HEALTH SECTOR: WHAT WORKS? © OECD 2013 213

II.11. NEW ZEALAND
● Developing the role of alternative providers, such as GPs with special interests, Nurse
Practitioners and Advanced practice physiotherapists to assess and treat patients.
● Encouraging the development of dedicated operating theatres or centres for solely
elective operations, and streamlining theatre scheduling and management.
● Developing integrated patient pathways that provide patients with information on their
condition and treatment and streamline patient care processes.
● A greater proportion of patients being admitted on the day of their surgery, increased day
surgery and improved discharge planning processes that reduce the overall length of
stay (Ministry of Health, 2012).
In the election campaign of late 2011, the then governing National Party (which
subsequently formed a coalition government at the end of 2011) promised to further increase
the number of elective operations performed and to reduce waiting times, such that patients
will wait no more than five months in 2013 and four months by the end of 2014 for their FSAs
and operations (Ryall 3 February 2012; New Zealand National Party 2011) (see Box 11.2).
DiscussionNew Zealand has had a more formal set of priority setting policies for elective services
for 18 years, and they now have a firm place in the country’s health sector. These policies
have focused on new processes to prioritise which patients receive care, providing
transparency and certainty for patients, and more recently on new ways to ensure that
elective services are delivered to those who need them in a timely way. As a result, long
waiting lists and times no longer exist, although ensuring that they do not increase beyond
the agreed timeframes is still a matter of significant policy emphasis, suggesting that they
remain a highly important political issue. In recent years, a significant increase in elective
surgery operations has also been achieved in New Zealand.
A number of issues, however, remain to be resolved with respect to electives services
policies in the country.
First is the issue of equity of access. Throughout the various policy iterations, a key goal
has been that all New Zealanders would be treated equally, regardless of where they live
Box 11.2. Elective programme objectives 2011
From 2011, the Elective Programme has prioritised the following objectives:
● Increase available services by improving capacity, productivity and efficiency.
● Work towards everyone having equal access to elective surgery no matter where they live.
● Improve the way patients are prioritised to ensure fairness and value for money and thatthose who access services are those with the greatest need and ability to benefit.
● Improve the management of patients (patient flow) to reduce waiting times.
● Support new and innovative ways of providing electives, such as adopting alternativepathways and models of care.
● Support clinical networks, such as the National Cardiac Surgery Clinical Network(Ministry of Health 2011), to improve service delivery.
Source: New Zealand Ministry of Health (2011), “About the Elective Services Programme”, Retrieved 6 January 2012,from www.health.govt.nz/our-work/hospitals-and-specialist-care/elective-services/about-electives-programme.
WAITING TIME POLICIES IN THE HEALTH SECTOR: WHAT WORKS? © OECD 2013214

II.11. NEW ZEALAND
(Shipley, 1996; New Zealand Government, 2000; Dew et al., 2005; Ministry of Health, 2011b). As
Box 11.2 shows, equity of access remains a current policy objective. With respect to CPAC,
and the goal of achieving horizontal equity (i.e. that similar patients are treated the same
way), this would require that national tools be used throughout New Zealand; that they be
used in a consistent way; and that the thresholds for treatment are all the same. Some
progress has been made towards achieving improved equity of access through the use of
CPAC tools, but there is still some way to go.There are no national tools to ensure that similar
patients from around New Zealand are all referred for a FSA, and it has been reported that it
is unlikely that patients are selected for an FSA on a consistent basis (Office of the Auditor
General, 2011). National CPAC tools are now in wider use than in the past, but around 31% of
prioritised events still use local tools (albeit tools that are nationally recognised), potentially
resulting in different approaches to prioritisation around the country. But even where
national tools are used, different thresholds for treatment remain, also undermining the
achievement of equity of access nationwide. With respect to vertical equity, patients with
higher scores should usually be treated earlier than other patients, but evidence suggests
that patients do not always get treated in priority order (Office of the Auditor General, 2011).
Each of these issues will need to be tackled over the next few years if the government is to
achieve equal access. Improved equity between DHBs is also being promoted by policies that
encourage DHBs to move towards a national, standardised intervention ratio, but this policy
uses overall proxy measures of relative need to standardise intervention ratios (such as age,
gender, ethnicity and deprivation) rather than the CPAC tools’ more sophisticated measures
of need and ability to benefit.
Second, as noted above, CPAC scoring as a priority setting process can only work if
specialists in particular accept it as a valid and legitimate process and if the scoring
process is undertaken appropriately and consistently and is not gamed to a large degree.
New processes to encourage the medical colleges to take ownership of CPAC tools have
been implemented since 2005, but it is not known whether on the whole specialists are
now more supportive of the CPAC processes than in earlier years, or whether consistency
in scoring has improved over time. Few recent studies are available about the performance
of the CPAC tools. One (2007/08) relating to heart valve surgery found that only 23.5% of
patients were treated within the recommended time frames; there were seven major adverse
cardiac events (out of 137 patients) and four of these would have been avoided had the
recommended treatment time frames been adhered to, while three would not have been
(Sasse et al., 2011). Another study has shown that the national tool for prioritising patients for
assisted reproductive technology is discriminating well between patients who might
spontaneously become pregnant and those who might not (Gillett et al., 2012). More such
studies are needed to assess the performance of CPAC tools to ensure confidence in their use.
Third is the issue of transparency. Individual patients are now generally significantly
more likely to get an early indication of whether or not they will be treated, and hence can
make decisions about whether to fund care privately if they do not have a sufficiently high
priority to be offered publicly funded treatment. But during implementation of the priority
setting processes for elective services, patients have been removed from waiting lists in
order for DHBs to not be penalised for failing to treat patients within the targeted waiting
time (Derrett et al., forthcoming). This undermines the system, and it is to be hoped that
these problems will not recur.
WAITING TIME POLICIES IN THE HEALTH SECTOR: WHAT WORKS? © OECD 2013 215

II.11. NEW ZEALAND
In addition, the system has not provided overall transparency on some key issues:
● No information is provided to the public on the types of needs that may never be treated,
or where treatment may be possible only for the very worst cases. Some DHBs are
reported to send GPs details of certain conditions such as hernias, varicose veins and
bunions that they cannot treat, but this information is not made public (Office of the
Auditor General, 2011).
● The ESPI system is designed to monitor how well DHBs manage patient flows, and
focuses on the numbers of patients waiting and the proportion of patients in the elective
services system within each DHB that meet particular performance indicators (such as
the proportion of patients not treated within six months). But these data include some
tolerance, such that a reported 100% compliance may mean that compliance was not
reached for 1-2% of patients.
● No information is publicly reported on actual waiting times, although the data are
collected (Office of the Auditor General, 2011).
● No national data is publicly reported on those patients referred back to their GP because
the resources are not available to treat the patient within six months, although such
information is likely to be made available in future.
● No information is available to monitor how much the thresholds differ from one DHB to
another or how much they shift from year to year.
Better information on these issues would help clarify what the publicly funded system
can and cannot fund and give New Zealanders more certainty about their eligibility for care.
Box 11.3. Waiting times for other services
Reduced cancer waiting times
“Reduced cancer waiting times” has been a goal in New Zealand since targets wereintroduced in 2007/08, with all patients in categories A, B and C supposed to wait less thaneight weeks between FSA and the start of radiation oncology treatment (Minister of Health,2007 and Ministry of Health 2008b). Then everyone needing radiation treatment wassupposed to receive it within six weeks by end July 2012 (Ministry of Health, 2009) and fourweeks in January 2011 (Ministry of Health, 2011c). In 2003, around 90% of patients weretreated in less than eight weeks (Minister of Health, 2007); in April 2007, 93% were treatedwithin eight weeks (Minister of Health, 2007), and in mid-2011, 99.95% were treated withinfour weeks (Ministry of Health, 2011c).
Shorter stays in emergency departments
Since 2009/10, the target for emergency departments has been that 95% of patients willbe admitted, discharged or transferred from an emergency department within six hours. InSeptember 2009, the target was reached in 80.1% of cases; by mid-2011, the target wasachieved for 91.6% of patients (Ministry of Health, 2011c). Individual DHBs have their owntargets for emergency stays (Ministry of Health, 2009).
WAITING TIME POLICIES IN THE HEALTH SECTOR: WHAT WORKS? © OECD 2013216
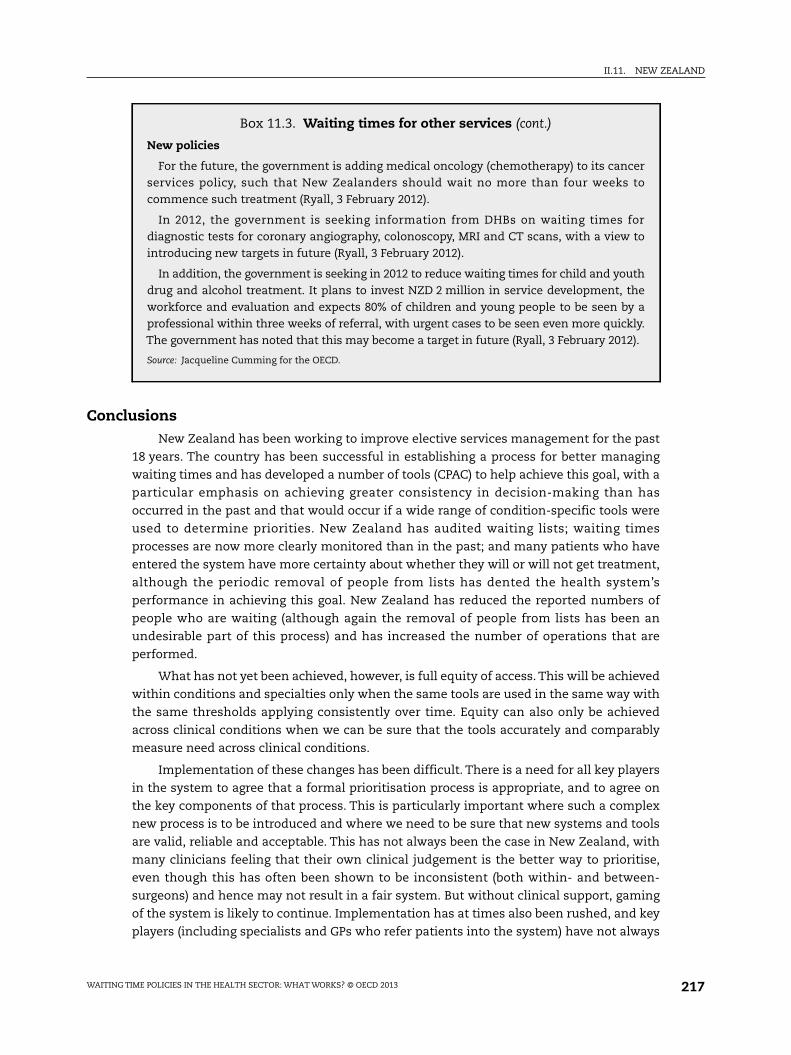
II.11. NEW ZEALAND
ConclusionsNew Zealand has been working to improve elective services management for the past
18 years. The country has been successful in establishing a process for better managing
waiting times and has developed a number of tools (CPAC) to help achieve this goal, with a
particular emphasis on achieving greater consistency in decision-making than has
occurred in the past and that would occur if a wide range of condition-specific tools were
used to determine priorities. New Zealand has audited waiting lists; waiting times
processes are now more clearly monitored than in the past; and many patients who have
entered the system have more certainty about whether they will or will not get treatment,
although the periodic removal of people from lists has dented the health system’s
performance in achieving this goal. New Zealand has reduced the reported numbers of
people who are waiting (although again the removal of people from lists has been an
undesirable part of this process) and has increased the number of operations that are
performed.
What has not yet been achieved, however, is full equity of access. This will be achieved
within conditions and specialties only when the same tools are used in the same way with
the same thresholds applying consistently over time. Equity can also only be achieved
across clinical conditions when we can be sure that the tools accurately and comparably
measure need across clinical conditions.
Implementation of these changes has been difficult. There is a need for all key players
in the system to agree that a formal prioritisation process is appropriate, and to agree on
the key components of that process. This is particularly important where such a complex
new process is to be introduced and where we need to be sure that new systems and tools
are valid, reliable and acceptable. This has not always been the case in New Zealand, with
many clinicians feeling that their own clinical judgement is the better way to prioritise,
even though this has often been shown to be inconsistent (both within- and between-
surgeons) and hence may not result in a fair system. But without clinical support, gaming
of the system is likely to continue. Implementation has at times also been rushed, and key
players (including specialists and GPs who refer patients into the system) have not always
Box 11.3. Waiting times for other services (cont.)
New policies
For the future, the government is adding medical oncology (chemotherapy) to its cancerservices policy, such that New Zealanders should wait no more than four weeks tocommence such treatment (Ryall, 3 February 2012).
In 2012, the government is seeking information from DHBs on waiting times fordiagnostic tests for coronary angiography, colonoscopy, MRI and CT scans, with a view tointroducing new targets in future (Ryall, 3 February 2012).
In addition, the government is seeking in 2012 to reduce waiting times for child and youthdrug and alcohol treatment. It plans to invest NZD 2 million in service development, theworkforce and evaluation and expects 80% of children and young people to be seen by aprofessional within three weeks of referral, with urgent cases to be seen even more quickly.The government has noted that this may become a target in future (Ryall, 3 February 2012).
Source: Jacqueline Cumming for the OECD.
WAITING TIME POLICIES IN THE HEALTH SECTOR: WHAT WORKS? © OECD 2013 217

II.11. NEW ZEALAND
felt adequately consulted about the processes involved (Roake, 2003). New Zealand’s
experience also shows that new policies and processes to manage elective services can
take a considerable amount of time to bed in. The country made a number of attempts at
improving its performance with respect to elective surgery before achieving more
sustained success in the past few years in particular. That success required sustained
attention, the use of new funding, and new financial incentives and targets.
Much of the research and evaluation work that took place in New Zealand occurred in
the early years of the priority setting processes for elective services, and little recent work
has been published to inform us about how this system is now operating. It is also not clear
overall whether the tools have fundamentally changed the ways in which patients are
prioritised, thereby resulting in improved average outcomes over all elective surgery
operations, nor whether any additional benefits have been worth the significant costs
involved in the process. With one key goal today being to ensure equity of access across the
country, and the need to ensure our programmes are effective and efficient, it is timely to
review how the system is working and what further improvements are needed over the
next few years.
Notes
1. The Ministry of Health has investigated a range of recent survey-based estimates for remunerationof salaried and self-employed GPs in New Zealand. Unfortunately, none of these are reliableenough to provide nationally representative figures according to the OECD definitions.
2. Sometimes called “clinical priority access criteria”.
3. It is not clear overall what proportions of those who had been on a waiting list were removed dueto data inaccuracies or due to lack of resources to treat patients. In one DHB, however, anestimated 40% of the drop in the patient waiting list arose from the tidy-up of the lists (personalcommunication, Ministry of Health).
References
Barber, A., P. Hansen et al. (2011), “Who’s Next? A New Process for Creating Points Systems forPrioritising Patients for Elective Health Services”, School of Business, University of Otago, Dunedin.
Colmean, B., S. McChesney et al. (2005), “Does the Priority Scoring System for Joint Replacement ReallyIdentify those Most in Need?”, New Zealand Medical Journal, Vol. 118, No. 1215.
Commonwealth Fund (2011), “International Profiles of Health Care Systems 2011”, The New ZealandHealth Care System 2011, The Commonwealth Fund, New York.
Cumming, J. and N. Mays (2011), “New Zealand’s Primary Health Care Strategy: Early Effects of the NewFinancing and Payment System for General Practice and Future Challenges”, Health Economics, Policyand Law, Vol. 6, No. 1, pp. 1-21.
Cumming, J., N. Mays and B. Gribben (2008), “Reforming Primary Health Care: Is New Zealand’s PrimaryHealth Care Strategy Achieving its Early Goals?”, Australia and New Zealand Health Policy, Vol. 5:24.
Dennett, E.R. and B.R. Parry (1998), “Generic Surgical Priority Critiera Scoring System: The ClinicalReality”, New Zealand Medical Journal, Vol. 111, pp. 163-166.
Dennett, E.R., R.R. Kipping et al. (1998), “Priority Access Criteria for Elective Cholecystectomy: AComparison of Three Scoring Methods”, New Zealand Medical Journal, Vol. 111, pp. 231-233.
Derrett, S., K. Cousins et al. (forthcoming), “A Messy Reality: An Analysis of New Zealand’s ElectiveSurgery Scoring System Via Media Sources, 2000-2006”, International Journal of Health Planning andManagement.
Derrett, S., C. Paul et al. (2002), “Evaluation of Explicit Prioritisation for Elective Surgery: A ProspectiveStudy”, Journal of Health Services Research and Policy, Vol. 7, Suppl. No. 1, pp. S14-22.
WAITING TIME POLICIES IN THE HEALTH SECTOR: WHAT WORKS? © OECD 2013218
II.11. NEW ZEALAND
Dew, K., J. Cumming et al. (2005), “Explicit Rationing of Elective Services: Implementing the NewZealand Reforms”, Health Policy, Vol. 74, pp. 1-12.
Fraser, G., P. Alley et al. (1993), “Waiting Lists and Waiting Times: Their Nature and Management”,National Advisory Committee on Core Health and Disability Support Services, Wellington.
French, S., A. Old and J. Healy (2001), “Health Care Systems in Transition, New Zealand”, Health Systemsin Transition, Vol 3, No. 19, pp. 1-128.
Gauld, R. (2009), “Revolving Doors: New Zealand's Health Reforms – The Continuing Saga”, Institute ofPolicy Studies and the Health Services Research Centre, Wellington.
Gillett, W.R., J.C. Peek et al. (2012), “Development of Clinical Priority Access Criteria for AssistedReproduction and its Evaluation on 1 386 Infertile Couples in New Zealand”, Human Reproduction,Vol. 27, No. 1, pp. 131-141.
Graham, P., G. Martin et al. (forthcoming), “Equity of Access and Variation in General Surgeons’ ClinicalJudgements of Patient Priority”, International Journal of Person Centred Medicine.
Hadorn, D. and A. Holmes (1997a), “The New Zealand Priority Critieria Project. Part I: Overview”, BritishMedical Journal, Vol. 314, pp. 131-134.
Hadorn, D. and A. Holmes (1997b), “The New Zealand Priority Criteria Project. Part 2: Coronary ArteryBypass Graft Surgery”, British Medical Journal, Vol. 314, pp. 135-138.
Halliwell, T. (1998), “How Fair Is Cataract Prioritisation?”, New Zealand Medical Journal, Vol. 111,pp. 405-407.
Hay, I. (1989), “The Caring Commodity: The Provision of Health Care in New Zealand”, OxfordUniversity Press, Auckland.
Health Benefits Review (1986), “Choices for Health Care: Report of the Health Benefits Review”, HealthBenefits Review, Wellington.
Health Funding Authority (1998), “Booking Systems First Quarterly Report 1 July-30 September1998-99”, Health Funding Authority, Wellington.
Health Funding Authority (2000), “Booking Systems First Quarterly Report 1999/00”, Health FundingAuthority, Wellington.
Hospital and Related Services Taskforce (1988), “Unshackling the Hospitals”, Hospital and RelatedServices Taskforce, Wellington.
Jackson, N.W., M.P. Doogue et al. (1999), “Priority Points and Cardiac Events While Waiting for CoronaryBypass Surgery”, Heart, Vol. 81, No. 4, pp. 367-373.
MacCormick, A., C. Doughty et al. (2003), “Reliability of Surgical Priority Tools in General Surgery”, ANZJournal of Surgery, Vol. 73, Suppl. No. A45.
McLeod, D., S. Morgan et al. (2004a), “Clinicians’ Reported Use of Clinical Priority Assessment Criteriaand their Attitudes to Prioritization for Elective Surgery: A Cross-sectional Survey”, ANZ Journal ofSurgery, Vol. 74, No. 11, pp. 1003-1009.
McLeod, D., S. Morgan et al. (2004b), “Use of, and Attitudes to, Clinical Priority Assessment Criteria inElective Surgery in New Zealand”, Journal of Health Services Research Policy, Vol. 9, No. 2, pp. 91-99.
McLeod, D., S. White et al. (2002), “CPAC Evaluation Project: Descriptive Study. A Report to the Ministryof Health”, Health Services Research Centre, Victoria University of Wellington, Wellington,pp. 1-101.
Minister of Health (2007), “Health Targets: Moving Towards Healthier Futures 2007/08”, Ministry ofHealth, Wellington.
Ministry of Health (1997), Purchasing for Your Health: 1995/96, Ministry of Health, Wellington.
Ministry of Health (1998), Purchasing for Your Health: 1996/97, Ministry of Health, Wellington.
Ministry of Health (2012), Health Expenditure Trends in New Zealand 2000-2010, Ministry of Health,Wellington.
Ministry of Health (2008), Health Targets: Moving Towards Healthier Futures, Ministry of Health,Wellington.
Ministry of Health (2009), Health Targets: 2009/10, Ministry of Health, Wellington.
WAITING TIME POLICIES IN THE HEALTH SECTOR: WHAT WORKS? © OECD 2013 219

II.11. NEW ZEALAND
Ministry of Health (2011a), “About Elective Services Patient Flow Indicators (ESPIs)”, Retrieved 6January 2012 from www.health.govt.nz/our-work/hospitals-and-specialist-care/elective-services/elective-services-and-how-dhbs-are-doing/about-elective-services-patient-flow-indicators-espis.
Ministry of Health (2011b), “About the Elective Services Programme”, Retrieved 6 January 2012, fromwww.health.govt.nz/our-work/hospitals-and-specialist-care/elective-services/about-electives-programme.
Ministry of Health (2011c), “Annual Report for the year ended 30 June 2011: Including the Director-General of Health’s Annual Report on the State of Public Health”, Ministry of Health, Wellington.
Ministry of Health (2011d), “Elective Services”, Retrieved 6 January 2012, from www.health.govt.nz/our-work/hospitals-and-specialist-care/elective-services/about-electives-programme.
Ministry of Health (2011e), “Latest Summary – Elective Services Patient Flow Indicators (ESPIs)”,Retrieved 6 January 2012 from www.health.govt.nz/our-work/hospitals-and-specialist-care/elective-services/elective-services-and-how-dhbs-are-doing/latest-summary-elective-services-patient-flow-indicators-espis.
Ministry of Health (2011f), “National Cardiac Surgery Update: and the formation of the New ZealandCardiac Network”, Ministry of Health, Wellington.
Ministry of Health (2012), “Improving the System: Meeting the Challenge – Improving Patient Flow forElectives. A Toolkit for District Health Boards”, Ministry of Health, Wellington.
National Advisory Committee on Core Health and Disability Support Services (1992), “Core Health andDisability Support Services for 1993/94”, Ministry of Health, Wellington.
New Zealand Government (1969), A Review of Hospital and Related Services in New Zealand, Departmentof Health, Wellington.
New Zealand Government (1974), A Health Service for New Zealand, Government Printer, Wellington.
New Zealand Government (2000), Reduced Waiting Times for Public Hospital Elective Services, New ZealandGovernment, Wellington.
New Zealand National Party (2011), “Health: Shorter Waiting Times: Building Better Public Services”,retrieved from www.national.org.nz/files/2011/Shorter_Waiting_Times_policy.pdf.
OECD (2012), OECD Health Data 2012, OECD Publishing, Paris, DOI: 10.1787/health-data-en.
Office of the Auditor General (2011), “Progress in Delivering Publicly Funded Scheduled Services toPatients”, Office of the Auditor General, Wellington.
Roake, J. (2003), “Managing Waiting Lists. Health Care Management and Delivery in New Zealand”, inR. Gauld (ed.), Continuity amid Chaos, Dunedin, Otago University Press, pp. 107-121.
Ryall, H.T. (2012). “Expectations Around Improved Access to Services 2012/13 and Beyond”, Ministry ofHealth, 3 February.
Sasse, A.S., B.D. Mahon et al. (2011), “Validation of the Cardiac Prioritisation Score for Heart ValveSurgery”, Heart, Lung and Circulation, Vol. 20, No. 6, p. 407.
Seddon, M.E., J.K. French et al. (1999), “Waiting Times and Prioritisation for Coronary Artery BypassSurgery in New Zealand”, Heart, Vol. 81, pp. 586-592.
Shipley, J. (1996), “Policy Guidelines for Regional Health Authorities, 1996/97”, Ministry of Health,Wellington.
Upton, S. (1991), “Your Health and the Public Health: A Statement of Government Health Policy”,Minister of Health, Wellington.
Willcox, S., M. Seddon et al. (2007), “Measuring and Reducing Waiting Times: A Cross-NationalComparison Of Strategies”, Health Affairs, Vol. 26, No. 4, pp. 1078-1087.
WAITING TIME POLICIES IN THE HEALTH SECTOR: WHAT WORKS? © OECD 2013220

Waiting Time Policies in the Health Sector
What Works?
© OECD 2013
PART II
Chapter 12
Norway
by
Jan Erik Askildsen,
Stein Rokkan Centre for Social Studies, Uni Research, Bergen,
Tor Iversen,
Department of Health Management and Health Economics, University of Oslo
and
Oddvar Kaarboe,
Department of Economics and Health Economics Bergen, University of Bergen
Norway has a predominantly public health care sector. Municipalities have theresponsibility for primary care, while specialist health care is organised in regionalhealth authorities owned by the central government. These regional authorities areresponsible for specialist health care for the population in their catchment areas,and they own the main providers. There is a system of referral to specialist care,with primary care physicians as gate keepers. The reduction of waiting times inspecialist health care has been considered a major political challenge. Nationalguidelines have been developed, which stipulate maximum medically acceptablewaiting times for the patients for a range of diagnoses. These vertical andindividualised prioritisation rules make the Norwegian system for waiting timeregulation quite unique. The chapter details the organisation of the health caresector, and we report some results from empirical analyses of developments inwaiting times for specialist health care.
221

II.12. NORWAY
IntroductionThe Norwegian health care sector is organised into primary and secondary health care
sectors. The former is the responsibility of the municipalities, and consists of primary care
physicians (GPs) and home and institutional care services. GPs refer patients to specialist
treatment. The latter is the responsibility of the central government and is organised
through four Regional Health Authorities (RHA). The RHAs are responsible for
commissioning and financing health care services for the population in the region, and
then for providing these services. The provision takes place mainly through the RHA’s own
enterprises (hospitals), or the services are supplied by independent private institutions,
usually not-for-profit, under contract with the RHAs. Patients may choose the hospital for
treatment. They are not, however, allowed to choose a hospital that is more specialised, e.g.
a university hospital, than the one they have been referred to. Primary health care services
are financed by the municipalities, which receive their income from taxes and a block grant
from the central government. The funding of the primary health care services is
supplemented by user-payments. Specialist health care is financed through a combination
of block grants and activity-based financing using diagnosis-related groups (DRGs), which
is presently 60/40 for somatic health care services. Patients enter hospital either as
emergency patients or as elective patients referred by GPs. Waiting lists are primarily
relevant for the specialist health care sector (which includes both specialist visits and
surgical/medical treatment); we therefore concentrate on waiting times at hospitals.
Waiting time is measured in days from the day the hospital receives the referral to the day
treatment starts. Average waiting time has risen from 72 to 77 days from 2007 to 2011,
while the median waiting time during this period has been 48-50 days (see Figure 12.1).
Waiting times fell slightly from 2010 to 2011.
Main characteristics of the Norwegian health systemThe Norwegian health system is characterised by universal coverage and is financed
mainly through taxation and only to a small extent by out-of-pocket payments. Prior to
2002, the health system was organised in three main political and administrative levels:
national government (legislation and regulation), counties (secondary care) and
municipalities (primary care). Since January 2002, responsibility for the hospitals,
including their ownership, was transferred from the counties to the state. Four Regional
Health Authorities were established,1 each with its own professional board. The RHAs have
structured the hospitals around 25 health enterprises. These are separate legal entities,
and thus not an integral part of the central government administration. The main health
policy objectives are set by the central government and form the basis for the management
of the enterprises (Johnsen, 2006). The RHAs have statutory responsibility for ensuring the
provision of health services to the inhabitants in their geographical area, but patients can
choose to be treated outside the region’s catchment area. Services can be provided through
own enterprises, contracted private hospitals, or contracted private specialists. The
municipalities are still responsible for primary health care.
WAITING TIME POLICIES IN THE HEALTH SECTOR: WHAT WORKS? © OECD 2013222
II.12. NORWAY
Hospitals
The central government’s takeover of responsibility for the hospitals breaks a tradition
of over 30 years of the hospitals being owned and run by the counties. Norway has
65 hospitals for its 5 million inhabitants (OECD, 2012). Even though the number of private
hospitals has been growing in recent years, they play a relatively minor role in Norway.
In 2010, the private hospitals (both not-for-profit and for-profit privately owned hospitals)
accounted for 1 601 beds, approximately 10% of the total of 16 117 beds (OECD, 2012). The
not-for-profit hospitals include hospitals with their own catchment areas and hospitals
specialised in open heart surgery and orthopaedics and rheumathology. The private for-
profit clinics have specialised in minor surgical procedures such as arthroscopy and
sterilisation, as well as inguinal hernia, cataracts and varicose vein operations in response
to long waiting lists for such care in the public hospitals. The RHAs may use contracting
with private hospitals. Patients enter hospital either as emergency patients or as elective
patients referred by their GPs and may, subject to some restrictions, choose the hospital
where they are treated.
Hospital remuneration
In 1997, a partial activity-based financing system between the state and the counties
based on diagnosis-related groups (DRGs) was introduced. Since 2002, all regional
enterprises have implemented this form of financing (Johnsen, 2006). Today, specialist
somatic health care is financed through a combination of block grants and DRG-centered
activity-based financing, which is presently 60/40 for somatic health care services. Out-
patient consultations have been financed since 1980 by the National Insurance
Administration on a cost-per-case basis. In 2009, somatic out-patient consultations were
included in the DRG-based funding.
Specialist remuneration
As a general rule, specialists working in public hospitals are remunerated on a salary
basis. To remunerate overtime work in relation to projects, the Health Authorities may use
financial incentives locally. The type of financial incentives may vary among the different
projects. The extent to which specialists are allowed to work both in private and publicly
funded hospitals has not been subject to national regulation. However, most hospitals have
imposed certain restrictions on both of these practices. The income of salaried specialists
was 1.77 per average wage in 20102 (OECD, 2012).
Co-payments
There are no co-payments for in-patients, pharmaceuticals included. Patients
pay NOK 180 for a GP visit and NOK 307 (USD 33 and USD 56) for a specialist visit
(The Commonwealth Fund, 2011). However, if the patient has already spent NOK 1 980
within the same year, they are exempted from further payment.
Private health insurance
Private health insurance plays a minor role in Norway. Approximately 5% of
the population has a private voluntary health insurance, mainly provided by employers
(The Commonwealth Fund, 2011).
WAITING TIME POLICIES IN THE HEALTH SECTOR: WHAT WORKS? © OECD 2013 223
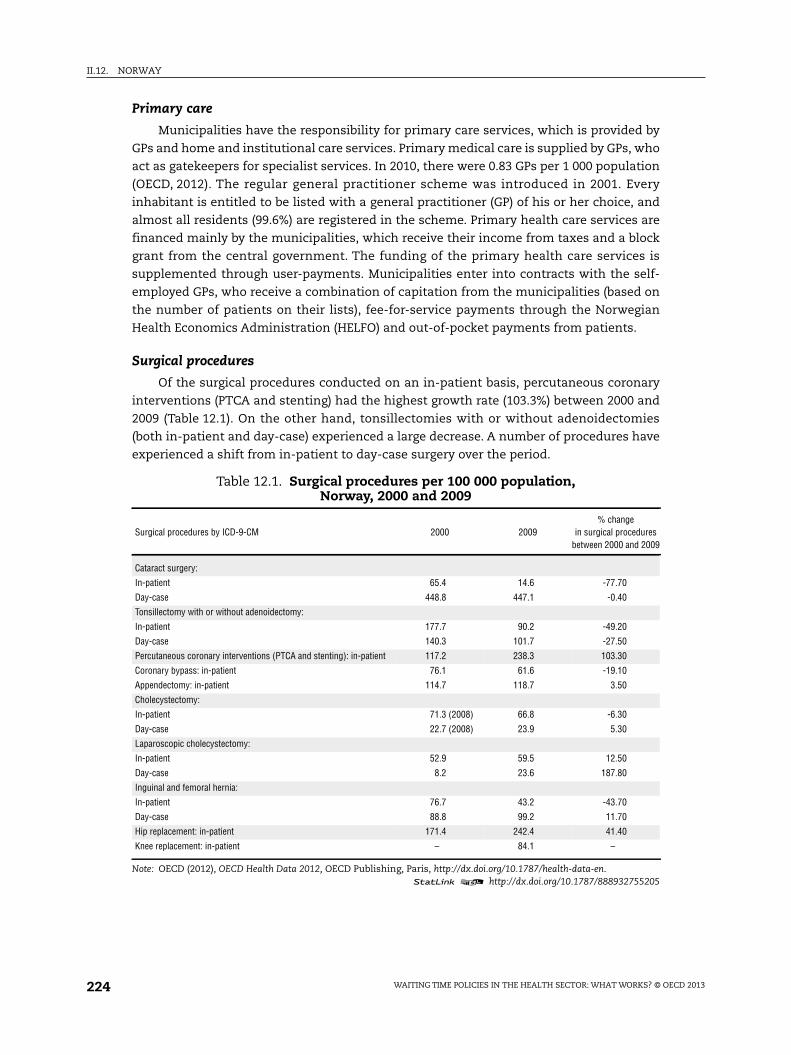
II.12. NORWAY
Primary care
Municipalities have the responsibility for primary care services, which is provided by
GPs and home and institutional care services. Primary medical care is supplied by GPs, who
act as gatekeepers for specialist services. In 2010, there were 0.83 GPs per 1 000 population
(OECD, 2012). The regular general practitioner scheme was introduced in 2001. Every
inhabitant is entitled to be listed with a general practitioner (GP) of his or her choice, and
almost all residents (99.6%) are registered in the scheme. Primary health care services are
financed mainly by the municipalities, which receive their income from taxes and a block
grant from the central government. The funding of the primary health care services is
supplemented through user-payments. Municipalities enter into contracts with the self-
employed GPs, who receive a combination of capitation from the municipalities (based on
the number of patients on their lists), fee-for-service payments through the Norwegian
Health Economics Administration (HELFO) and out-of-pocket payments from patients.
Surgical procedures
Of the surgical procedures conducted on an in-patient basis, percutaneous coronary
interventions (PTCA and stenting) had the highest growth rate (103.3%) between 2000 and
2009 (Table 12.1). On the other hand, tonsillectomies with or without adenoidectomies
(both in-patient and day-case) experienced a large decrease. A number of procedures have
experienced a shift from in-patient to day-case surgery over the period.
Table 12.1. Surgical procedures per 100 000 population,Norway, 2000 and 2009
Surgical procedures by ICD-9-CM 2000 2009% change
in surgical proceduresbetween 2000 and 2009
Cataract surgery:
In-patient 65.4 14.6 -77.70
Day-case 448.8 447.1 -0.40
Tonsillectomy with or without adenoidectomy:
In-patient 177.7 90.2 -49.20
Day-case 140.3 101.7 -27.50
Percutaneous coronary interventions (PTCA and stenting): in-patient 117.2 238.3 103.30
Coronary bypass: in-patient 76.1 61.6 -19.10
Appendectomy: in-patient 114.7 118.7 3.50
Cholecystectomy:
In-patient 71.3 (2008) 66.8 -6.30
Day-case 22.7 (2008) 23.9 5.30
Laparoscopic cholecystectomy:
In-patient 52.9 59.5 12.50
Day-case 8.2 23.6 187.80
Inguinal and femoral hernia:
In-patient 76.7 43.2 -43.70
Day-case 88.8 99.2 11.70
Hip replacement: in-patient 171.4 242.4 41.40
Knee replacement: in-patient – 84.1 –
Note: OECD (2012), OECD Health Data 2012, OECD Publishing, Paris, http://dx.doi.org/10.1787/health-data-en.1 2 http://dx.doi.org/10.1787/888932755205
WAITING TIME POLICIES IN THE HEALTH SECTOR: WHAT WORKS? © OECD 2013224

II.12. NORWAY
Health expenditure
Total health expenditure has varied in Norway over the last ten years. In 2000, total
health expenditure accounted for 8.4% of GDP, rising to 10% in 2003 and falling back to 8.6%
in 2008. In 2010, health expenditure increased again to 9.4% (OECD, 2012), just below the
OECD average of 9.5%. In terms of health spending per capita, Norway ranked second-
highest among OECD countries in 2010 (after the United States), with spending of
USD 5 388 (adjusted for purchasing power parity), well above the OECD average of
USD 3 268. Health spending per capita in Norway increased, in real terms, by 3.7% per year
on average between 2000 and 2009, and then decreased by 0.8% in 2010. In Norway, 85.5%
of health spending was funded by public sources in 2010, well above the OECD average of
72.2% (OECD, 2012).
Physicians
Norway employs more human resources in the health sector than most OECD countries.
The number of practising physicians has increased from 3.38 per 1 000 population in 2000
to 4.07 in 2010, compared to an average of 3.1 in OECD countries (OECD, 2012). About 10% of
physicians engaged in specialist health care are in private practice.
Ageing and life expectancy
Life expectancy has increased from 78.8 years in 2000 to 81.2 in 2010, which is higher
than the OECD average of 79.8. The percentage of the population aged 65 and over has
remained stable between 2000 and 2010 at around 15.2% (OECD, 2012).
Current policiesPublic specialised health care in Norway has been organised since 2002 through
state-owned enterprises within four regional health authorities; north, mid, west and
south-east.3 The RHAs are responsible for providing specialist health care to all patients
within the region.4
According to the Act on Patients’ Rights and the Priority Regulations, patients who are
referred to the specialist health care sector have the right to an evaluation of their medical
condition and to an assessment of whether this condition is such that it demands a right
to treatment within an individually fixed waiting time, termed the “right to necessary
treatment” (Ministry of Health and Social Services, 1999; 2003). More precisely, all patients
may be grouped into one of the following categories:
1. Emergency care3.
2. Elective treatment, with an individual maximum waiting time (elective with).
3. Elective treatment, without an individual maximum waiting time (elective without).
4. Other health care services that may be demanded.
In addition to emergency care patients, for whom the hospitals are obliged to deliver
health care services, it is patients in priority Group 2 (elective with) who comprise the core
health care supply of the public hospitals. Patients in Group 3 (elective without) should,
however, also be given treatment.5 It is only demand from patients in Group 4 that is
excluded from the mandatory activities of the public health enterprises. Few hospital
services fit into the latter category, with cosmetic surgery being one example. In general,
these are services related to conditions that do not seriously affect well-being.
WAITING TIME POLICIES IN THE HEALTH SECTOR: WHAT WORKS? © OECD 2013 225
II.12. NORWAY
From September 2004, patients who are referred to the specialist health care sector
have the right, within 30 days from referral, to an evaluation of whether their medical
condition is such that it gives a legal right to treatment within an individual maximum
waiting time, i.e. whether they are in Group 2. For elective patients, the priority regulations
establish that, upon referral, the assessment of a patient’s condition must consider:
i) The degree of severity.
ii) The expected efficacy of treatment.
iii) The cost in relation to the expected outcome of the treatment.
A patient satisfies the first criterion when life expectancy or the quality of life most
probably is reduced if specialised health care is not provided. According to the second
criterion, it should be considered whether access to specialised health care may improve
the patient’s health status, or reduce impairment. The third criterion emphasises that it is
the cost relative to the expected outcome of the treatment that shall be considered, and
not the absolute level of cost. Hence, the current priority regulation is a mix of
prioritisation based on clinical urgency and cost effectiveness. All three criteria should be
fulfilled, but the criteria are inter-related. This implies that a low score on one of the
criteria can be compensated with a high score on one of the other criteria. For each patient
that is referred, all three criteria must be considered. On that basis, patients are divided
into Group 2 or 3 (Group 1 is emergency), giving the patients the right to elective treatment
“with” or “without” a maximum waiting time. For patients in Group 2, a finer grouping
grants them an individual medically acceptable maximum waiting time before treatment
is to take place. This maximum waiting time may be considered as a proxy for
prioritisation, in the sense that medical conditions that demand a short maximum waiting
time are considered to have high treatment priority. Also, patients in Group 3 benefit from
treatment, but the benefit and/or benefit relative to treatment cost are considered to be
insufficient to deserve a maximum waiting time.
The allocation of prioritisation status to elective patients is formally managed as
follows. Upon receipt of a referral, the hospital has 30 days to determine whether the
patient belongs to Group 2 or 3, or whether (s)he should not receive treatment. This
decision is based solely on the description of the medical condition provided by the
primary care physician: the categorisation is therefore determined by the hospital
specialist based on the information provided by the GP. If the specialist considers that the
information given by the GP is inadequate, the specialist will summon the patient to obtain
more exact information. Each patient is to be considered, by the specialist, according to the
priority regulations, i.e. criteria I-III above. If the patient is considered as belonging to Group 2
(elective with), (s)he is given an individual maximum waiting time until the start of treatment.
If the waiting time is exceeded, the patient has the right to file a complaint. However, very few
patients do file complaints, according to the Norwegian Health Economics Administration
around 2 200 patients in 2011. The hospital is then given a short time frame for providing
treatment (typically 14 days). If treatment is still not given, the patient can choose treatment at
another hospital, public, private or abroad, at the cost of the initial health enterprise. The
Norwegian Directorate of Health has organised a special unit to help patients choose a
provider. This unit will also handle administrative tasks and ensure that the new provider is
paid. According to the Directorate of Health (2011), the proportion of maximum waiting times
that are violated was 11% in the last four month period of 2011, a reduction from 16% in the last
four month period of 2008. The reduction in the proportion of violations parallels the
WAITING TIME POLICIES IN THE HEALTH SECTOR: WHAT WORKS? © OECD 2013226

II.12. NORWAY
reduction in the proportion of patients who are given a maximum waiting time and a small
reduction in actual waiting times for these patients.
There are now national guidelines that have been developed in co-operation between
the Norwegian Directorate of Health and the Regional Health Authorities covering medical
conditions within 32 main “medical chapters”. These guidelines stipulate recommendations
on priority status and maximum waiting times for a range of diagnoses.6 The guidelines
describe a selection of medical conditions, and based on a typical patient with these
conditions, a recommendation is made on what the maximum waiting time should be. The
actual allocation of waiting time, which is decided by a physician, then has to take into
account the total condition of the particular patient. This means that it is the physicians at
the hospitals who decide on the individual treatment status. The actual waiting time may
therefore vary over recommendations, for example, due to the patient’s age, which may
affect treatment efficacy, or the existence of co-morbidities.
These guidelines are convenient for testing what determines waiting times for patients
with different priorities. It may be assumed that the length of the medically acceptable
waiting time signals prioritisation. By the allocation of ICD codes to the medical descriptions,
the actual waiting times can be found in official medical registers for patient groups of key
interest. Often waiting times are reported on an aggregated level, and policy actions may be
based on the development of the average waiting times and the average number of persons
on the waiting lists. From an efficiency point of view, it may be considered more important
to investigate which patient groups experience changes in waiting times. In particular, it is
valuable to have a procedure for studying how interventions and reforms may affect
treatment access for patients with different priorities. By comparing the actual waiting times
of different patient groups, or by comparing changes in actual waits over time, it is possible
to reach conclusions about the development of waiting times not only at an aggregate level,
but also for different patient groups.
A caveat should be made when it comes to empirical analyses based on guidelines.
The national guidelines have not yet been coded. Therefore, when investigating
developments in waiting times, guidelines developed in one of the RHAs have been used.
They were developed prior to the national guidelines, and we assume that they are
representative also at a national level.7
Askildsen et al. (2011) make use of individual in-patient data from the Norwegian Patient
Register (NPR) during the period 2003-06.These individual level records contain information on
waiting time and patient characteristics, such as age, gender, and main and secondary
diagnoses. The waiting time is measured from the referral until the patient meets with a
specialist from the hospital. This indicates the start of treatment, even though this may
include periods of further diagnosing of the patient. Patients are allocated into six groups, such
that patients with maximum waiting times of two, three or four weeks are in Group 1, those
with a maximum waiting time of eight weeks are in Group 2, and patients with a maximum
waiting time of 12 weeks are in Group 3. When the maximum waiting time is up to 16 weeks,
patients are allocated to Group 4, when up to 26 weeks to Group 5, while Group 6 contains
patients with no maximum waiting time (elective without) or a maximum waiting time of
52 weeks. This categorisation implies that patients in prioritisation Group 1 have the highest
priority, while patients in Group 6 have the lowest priority.
Table 12.2 reports descriptive statistics for actual average waiting times for patients in
the six groups. We see that patients in priority Group 1 wait on average 65 days, and that
WAITING TIME POLICIES IN THE HEALTH SECTOR: WHAT WORKS? © OECD 2013 227

II.12. NORWAY
the waiting times for Groups 2, 3 and 4 are 71, 91 and 139 days, respectively. Hence, the
waiting time is higher when the priority status is lower. However, Group 5 patients wait on
average 114 days, and thus experience a shorter waiting time than patients in Group 4,
while the lowest prioritised patients (Group 6) do have the longest average waiting time
(157 days).
Table 12.2 also presents information on the demographic characteristics of the
patients, and some data on medical conditions.8 There is a majority of female patients in
all priority groups except Group 2. The share of males is low in Group 5 (28.4%) where
almost 45% of the patients have diseases of the musculoskeletal system. There are some,
but not large, age variations across the groups. The average DRG weight differs among the
prioritisation groups. This is to be expected, since the DRG weights measure how resource-
intensive different treatments are, and there is no reason to believe that there is a one-to-
one relationship between treatment and prioritisation. The number of secondary
diagnoses decreases monotonically in the prioritisation groups, which is also expected.
Surgery comprises more than half of the patients, but with some variation over priority
groups. The table may conceal interesting variations over regions. Regional variation has
been an important motivation for implementing national guidelines. We return to the
subject below.
The regression results, which include control variables like age, gender, type of
hospital, etc., presented in Askildsen et al. (2011) indicate an even higher prioritisation of
patients suffering from the least severe conditions relative to patients of higher priority
than was suggested by the descriptive statistics.
Januleviciute et al. (2012a) analyse the impact that the differential maximum waiting
time target-reform will have on the distribution of waiting times. The authors use data
from the National Patient Register and regress patient-level waiting times on patient
Table 12.2. Waiting times according to priorities, Norway, 2003-06
Group 1 Group 2 Group 3 Group 4 Group 5 Group 6
Recommended maximum waiting days 28 56 84 112 182 365
Actual waiting time 65.18 71.63 91.15 139.24 114.69 157.59
(117.22) (118.82) (122.85) (157.74) (130.39) (153.89)
Proportion of waiting above maximum waiting time 0.538 0.504 0.48 0.482 0.421
Male (share) 0.461 0.646 0.484 0.447 0.284 0.492
Age groups (share):
Age 80 + 0.129 0.151 0.097 0.145 0.113 0.089
Age 67-80 0.276 0.342 0.199 0.272 0.294 0.149
Age 30-66 0.452 0.458 0.423 0.361 0.531 0.602
Age 15-29 0.064 0.023 0.09 0.075 0.039 0.095
Age 0-14 0.08 0.026 0.191 0.147 0.024 0.065
DRG-weight 1.686 1.768 1.069 1.985 2.098 0.895
(1.556) (1.954) (1.137) (1.864) (1.4819) (0.790)
Number secondary diagnoses 1.629 1.613 1.117 1.086 1.019 0.624
(1.672) (1.591) (1.371) (1.442) (1.275) (1.020)
Surgery (share) 0.416 0.577 0.72 0.668 0.78 0.766
Number of observations 48 615 27 266 89 577 11 327 68 096 42 985
Note: Mean (standard deviations in parentheses) or proportions of variables.Source: Individual patient data from 2003-2006, Norwegian Patient Register (NPR), in Askildsen, J.E., T.H. Holmås andO.M. Kaarbøe (2011), “Monitoring Prioritization in the Public Health Care Sector by Use of Medical Guidelines: TheCase of Norway”, Health Economics, Vol. 20, pp. 958-970.
1 2 http://dx.doi.org/10.1787/888932755224
WAITING TIME POLICIES IN THE HEALTH SECTOR: WHAT WORKS? © OECD 2013228

II.12. NORWAY
characteristics and on a post-reform indicator interacted with the patient’s priority group.
Interestingly, the reform does not seem to have a positive effect for the patients with the
highest priority. If anything, there are some indications that they wait longer than before.
On the contrary, it is the patients with lowest priority who have benefited by a reduction in
waiting times. This may seem strange, but recall that there is no difference in the possible
penalties for patients of different priorities, conditional on having been allocated an
individual maximum waiting time (elective with). Thus, from a budgetary point of view, the
hospitals are just as concerned about a violation of a contract for a high priority patient as
for a low priority patient. Since low priority patients actually do have the longest waiting
times, a response may therefore have been to target waiting time reductions as such,
which is achieved most easily by reducing the longest waits.
We end this section by presenting average waiting times for the years 2008-11, using
the official waiting time data published by the Directorate of Health.9 The first table shows
waiting times for somatic patients both with and without the right to necessary
treatments. Waiting time is measured as the duration from when the hospital received the
referral until the start of treatment, and refers to the wait for patients treated during a four-
month period.
From Figure 12.1, we notice that the average waiting time for all patients has been
relatively stable in this period, e.g. average waiting times in the second four month period
are about 71-73 days. The figure also shows that the average waiting times for patients
with a right to necessary treatment are lower than the corresponding waiting times for
those without a legal right to necessary treatment.
Figure 12.2 shows the regional variation of the share of patients with a right to
necessary treatment. The figure shows that the share varied considerably in 2008, but that
a more homogeneous pattern emerges over time. The share of patients with a right to
necessary treatment varied from 52% (Health region North) to 67% (Health region Mid) in
the last year. One possible reason for the emergence of a more homogeneous pattern might
be the implementation of the national guidelines.
Figure 12.1. Average waiting times in Norway for somatic,in-patient and out-patient care
Source: Norwegian Directorate of Health’s data generator (http://nesstar2.shdir.no/npr/).1 2 http://dx.doi.org/10.1787/888932754236
120
100
80
60
40
20
0
2008 2009 2010 2011 2012
All patients Patients with right to necessary treatment Patients without right
1. tertile 2. tertile 3. tertile 1. tertile 2. tertile 3. tertile 1. tertile 2. tertile 3. tertile 1. tertile 1. tertile2. tertile 3. tertile
Days
Time
WAITING TIME POLICIES IN THE HEALTH SECTOR: WHAT WORKS? © OECD 2013 229

II.12. NORWAY
Past policiesIn 1997, Norway introduced activity-based financing of hospitals. A proportion of the
global budget from the state to the county councils (hospital owners at that time) was
replaced by a component that depends on the number and composition of the patients
treated. The proportion has varied between 35% and 60%. Theory predicts that a switch
from a global budget to activity-based financing is likely to increase both hospital
efficiency and activity in terms of the number of treated patients. The reason is that the
reward from effort in terms of number of treated patients10 increases, hence creating an
incentive to increase both efficiency and the number of treated patients. There are two
empirical studies of the change in hospital financing system in Norway. Biørn et al. (2003)
suggest that the change led to a rise in the annual growth rate of activity from 2% between
1992 and 1996 to 3.2% between 1997 and 1999. Kjerstad (2003) utilises the fact that not all
hospital owners implemented activity-based financing for hospitals simultaneously, even
though the counties themselves received activity-based financing from the central
government. He finds that after 1997 activity increased by 4% in hospitals that were paid
with an activity-based funding method, while the increase was only 2% in hospitals that
were not. Kjerstad therefore suggests that the activity-based funding contributed an extra
2 percentage points to the increase in activity. Biørn et al. (2003) also find an increase in
technical efficiency, while the cost efficiency is unaffected or showed a decline. The
suggested reason is an increase in input prices (wages) due to a higher demand for man-
hours. The increased activity is likely to have implied a reduction in hospital waiting times
in the period 1996-2000.
Activity-based financing (ABF) is more vulnerable than fixed budgets to priority
decisions that deviate from the national regulations. Under a fixed budget, the number and
type of patient treated does not affect the transfer to the hospital. Under ABF, there is a
transfer attached to each patient depending on the patient characteristics and treatment.
If the transfer relative to treatment cost is higher for one patient than for another, there
might be an incentive at the hospital level to give priority to the patient with a low cost
Figure 12.2. Share of patients with a right to necessary treatment, Norway
Source: Norwegian Directorate of Health’s data generator (http://nesstar2.shdir.no/npr/).1 2 http://dx.doi.org/10.1787/888932754255
100
80
90
60
70
40
50
20
30
10
0
2008 2009 2010 2011
Health region South East Health region WestHealth region Mid Health region North
1. tertile 2. tertile 3. tertile 1. tertile 2. tertile 3. tertile 1. tertile 2. tertile 3. tertile 1. tertile 2. tertile
Days
Time
WAITING TIME POLICIES IN THE HEALTH SECTOR: WHAT WORKS? © OECD 2013230

II.12. NORWAY
relative to the transfer received. The patient with a low cost may be a less severely ill
patient. The topic is studied empirically by Januleviciute et al. (2012b) They use data from
the Norwegian patient register and analyse individual level waiting times for all elective
treatments (in-patients and day cases) during the years 2004-07. The authors estimate
different models for different priority groups, where the priority groups are defined as in
Askildsen et al. (2011). The results indicate a negative price effect on waiting time, where
price variations have been caused by changes in national average treatment costs
two years prior to the price changes. The price effect varies among the different priority
groups. The lowest- and no-priority groups seem to be most responsive to price, indicating
that when price increases, waiting times are reduced most for these groups. The authors
suggest the following two explanations for their results: First, patients with low or no-
priority status are by definition healthier and might therefore be more mobile. As free
hospital choice applies to all patients, it might be more likely that they would be seeking
treatments outside the natural catchment area. If reimbursements favour healthier
patients within low priority groups, hospitals may compete for these patients by keeping
waiting times low. Secondly, pressure to reduce overall waiting times could be another
explanation.
As part of the Act on patient rights, free choice of hospital for elective treatment was
introduced from 1 January 2001. The motivations were to strengthen patients’ positions as
decision-makers, to improve access and to reduce regional differences in waiting times for
treatment. Some studies indicate that relatively few patients seem to have opted for the
possibility of receiving treatment outside of the hospitals’ natural catchment areas (Kjerstad
and Kristiansen, 2005; Vrangbæk et al., 2007). Whether or not a free choice of hospital will
contribute to a decline in waiting time depends on patients’ willingness to travel to obtain
treatment. Monstad et al. (2006) estimate the trade-off between waiting time and distance
using patient level data on total hip replacements in Norway in 2001-03. The authors find
that both waiting time and distance reduce the probability of choosing a particular hospital.
Patients are willing to wait a considerable length of time to avoid travelling. The reluctance
to travel increases with age and decreases with level of education. Bjorvatn and Ma (2011)
find that patient mobility responds to differences in hospital waiting times. A greater
difference in waiting time between a patient’s local hospital and other hospitals makes it
more likely that the patient bypasses his local hospital.
In November 2000, the Norwegian Parliament decided to spend NOK 1 billion to treat
abroad patients who had experienced a long wait. The initiative was temporary (most
patients were treated during 2001), and the purpose was to shorten patients’ waiting times
without driving up national costs. An office was set up under the National Insurance
Administration to handle the initiative, including the negotiation of contracts with public
and private hospitals abroad. More than 10 000 patients were treated under the extra funding
arrangement (the Patient Bridge). Botten et al. (2004) sum up the main findings from an
evaluation of its effects. The most frequent treatments were orthopaedic and general
surgery. The authors find that the Patient Bridge turned out to be quite expensive, partly
because of transaction costs (including travel and accommodation costs for relatives or
nurses from Norway) and treatment costs. Excessive treatment costs were considered to be
a result of an insufficient cost-consciousness of the purchasing office. This is perhaps
somewhat surprising, since the existence of a multitude of potential suppliers should have
put the purchasing office in a favourable position. Patients who were treated abroad
experienced shorter waiting times and were generally satisfied with the arrangement. Given
WAITING TIME POLICIES IN THE HEALTH SECTOR: WHAT WORKS? © OECD 2013 231

II.12. NORWAY
the fixed capacity at home, it is also likely that in the short-term waiting times for those
treated at home were reduced. There are no studies of the long-term effect of the Patient
Bridge on hospital waiting times. According to theory and other studies, it seems unlikely
that a temporary increase in supply has negative long-term impacts on waiting times.
The regular general practitioner scheme was introduced in 2001. In contrast to the
previous situation, every GP is now responsible for a list of individual patients, and every
inhabitant is entitled to be listed with a GP of his or her choice. A GP is paid by a
combination of fee-for-service (70% of the practice income) and a flat capitation payment
(30% of the practice income). The capitation component replaced a previous practice
allowance that was independent of the number of patients served by the practice. Parallel
to the introduction of the regular GP scheme, the GPs’ role as gatekeepers to specialist
health care was strengthened. Except for acute cases, diagnostics and treatment in
specialised care require a referral from a GP. Although the referral requirement in itself
pulls in the direction of less demand for specialist care, the effect of the total package of
changes in primary care is less clear. The greater continuity of care implied by the regular
GP scheme may lead to less resort to specialist care, since GPs have access to more
information about their patients. On the other hand, playing the role of the patient’s agent
may increase the number of referrals, in an effort to please the patient, as was found by
Carlsen and Norheim (2003). Also, the replacement of the practice allowance by the
capitation component pulls in the direction of more referrals, since it becomes more
profitable for the GP to have a long list of patients. An increased referral rate shifts some of
the burden of a long list onto specialist care. There are not many empirical studies about
the net effect of a regular GP scheme with a gatekeeping role on the GPs’ referral rates.
Iversen and Lurås (2000) found some evidence from a trial that preceded the nationwide
implementation that the regular GP scheme was associated with an increase in the referral
rate from GPs. The absence of a negative effect on referral rates is in accordance with the
observation that countries with a gatekeeping system often show longer waiting times
than countries where patients have direct access to specialist care. More theoretical and
empirical studies of how gatekeeping influences GP agency and hospital waiting times
seem to be of interest.
The impact on waiting times of the 2002 governmental take-over of the hospitals has
been analysed by Askildsen et al. (2010). Two of the concerns leading up to the reforms were
that 19 counties did not manage to utilise spare capacity in other counties, and regional
variations in access and waiting times were considered excessive. Askildsen et al. (2010)
thus investigated whether a common, state-controlled ownership would lead to more
equal access and waiting times across the country. Waiting times before and after the take-
over were compared for each of the (then) five regional health authorities, and for health
enterprises within each region. The same categorisation of patients into priority groups
was used as described above.
Table 12.3 reports the results for average waiting times and the share of patients with
excessive waiting times. Except for Health Region North, we see that both average waiting
times and the proportion of patients who wait longer than the prescribed maximum
waiting time were reduced considerably, with the largest reduction in Health Region South.
However, both in the pre-reform and the post-reform periods there are relatively large
differences across health regions in the reported measures, indicating that the hospital
reform has not led to equalisation of waiting times. Further statistical analyses with more
controls for other relevant factors confirm these results.
WAITING TIME POLICIES IN THE HEALTH SECTOR: WHAT WORKS? © OECD 2013232

II.12. NORWAY
Another important question was whether the hospital reform led to a better practice
of prioritisation. Because patients with different diagnoses are allocated into the
prioritisation groups according to the recommended maximum waiting time, it is expected
that patients in Group 1 experience the shortest waiting times, and that patients
in Group 5 experience the longest waiting times. If waiting times increase when moving
from the highest (1) to lowest (5) prioritisation group,11 it indicates that in relative terms
the health enterprises experience waiting times that are in accordance with administrative
regulations.
Table 12.4 shows average waiting times and the proportion of patients with excessive
waiting times in five prioritisation groups prior to and after the hospital reform. Column 2
shows the recommended maximum waiting time in number of days. High priority patients
wait less than low priority patients; however, the average waiting times in Groups 1 and 2 are
higher than the recommended maximum waiting times. Group 4 patients wait less than the
maximum recommended waiting time, and during the period 1999-2001 Group 3 patients’
average waiting time corresponded to the recommended waiting time. Looking at the
proportion of patients with excessive waiting times, compared to patients with a lower
priority, relatively more high-priority patients wait longer than prescribed. The results
indicate that in relative terms, lower-priority patients have a relatively better access
to hospitals than higher-priority patients. Furthermore, comparing waiting times and the
proportion of patients with excessive waiting times in the pre- and post-reform periods,
it can be seen that low-priority patients have obtained improved access in the post-reform
period.
Analyses of changes in waiting times within health regions did not reveal a tendency
to greater equalisation of waiting times.
ConclusionsWhat do we know about the social welfare loss from hospital waiting times? In the
second section, we described the Norwegian system, where the consultant assigns to each
patient a right to treatment based on an assessment of the individual patient. A patient
who is given a right to treatment is also given a maximum waiting time based on an
assessment of the patient’s medical condition and prospects. The regulations specify that
the maximum waiting time is not supposed to take into account the hospital’s available
Table 12.3. Average waiting times in days and proportion of patientswith excessive waiting times per health region,
NorwayPercentage, standard deviations in parentheses
Average waiting times Proportion of patients with excessive waiting
1999-2001 2002-2005 1999-2001 2002-2005
Health region East 138.94 (153.25) 119.65 (152.37) 38.19 33.56
Health region South 149.22 (152.37) 122.55 (152.50) 43.62 36.52
Health region West 152.46 (159.16) 132.05 (140.39) 44.94 41.26
Health region Mid 153.08 (157.80) 132.84 (140.82) 43.87 39.00
Health region North 126.79 (141.20) 124.75 (138.41) 37.16 37.82
Source: Individual patient data from 1999-2005, Norwegian Patient Register (NPR), in Askildsen, J.E., T.H. Holmås andO.M. Kaarbøe (2010), “Prioritization and Patients’ Rights: Analysing the Effect of a Reform in the Norwegian HospitalSector”, Social Science and Medicine, Vol. 70, pp. 199-208.
1 2 http://dx.doi.org/10.1787/888932755243
WAITING TIME POLICIES IN THE HEALTH SECTOR: WHAT WORKS? © OECD 2013 233

II.12. NORWAY
resources. If we accept the consultant’s evaluation of a patient’s condition, a conservative
judgment would suggest no welfare loss for waiting times shorter than the maximum
waiting time. Information about the welfare loss from waiting can then be derived from the
proportion of patients who experience a violation of the maximum time and the wait they
experience beyond that maximum. According to the Directorate of Health (2011), the
proportion of maximum waiting times violated fell during the period 2006 to 2011. The
reduction in the proportion of violations was paralleled by a reduction in the proportion of
patients who were given a maximum waiting time and a small reduction in the actual
waiting times for these patients. In the second section, we also described a reduction in the
variation across the regional health authorities for the proportion of patients who are given
a maximum waiting time and for their mean waiting times. During the period 2008-11,
detailed guidelines for setting priorities within each medical speciality were implemented.
The guidelines are likely to have contributed to less discretion at the level of the individual
consultant and may have contributed to the changes observed.
Assigning a right to treatment at the individual patient level may be a means of
introducing transparency and predictability for the individual patient. Firstly, there is a
clear distinction between those who will get treatment from the public sector, those who
will not, and those who may expect to wait for a long time. The latter group may then
consider alternative treatment options. Secondly, every patient who is prioritised is to be
informed about their treatment status and rights, including the procedure for making a
complaint if the given individual waiting time is exceeded. However, there are few
complaints, whereas a number of patients seem to have been waiting too long. Thus, policy
ambitions may be hard to fulfil in practice.
The system relies on the possibility of making a clear distinction between patients who
should be entitled to treatment and patients who should not. The more there is discretion at
the individual patient level, the more resource-consuming the system is likely to be due to
complaints and possible lawsuits. There has been very limited public debate about this
aspect of the reform, apart from the regional differences in the allocation of patient rights.
However, in this respect the greater problem has been that too many patients have been
given priority. Over time these differences seem to have been reduced. On the other hand,
when it comes to access to treatment in terms of the waiting times experienced, the
Table 12.4. Average waiting times in days, and the proportion of patientswith excessive waiting times in the prioritisation groups,
NorwayStandard deviations in parentheses
Maximum acceptablewaiting days
Average waiting times Proportion of patients with excessive waiting
1999-2001 2002-2005 1999-2001 2002-2005
Group 1 28 74.53 (126.22) 74.21 (124.76) 42.0 42.93
Group 2 84 130.06 (147.34) 112.91 (132.18) 44.38 39.94
Group 3 182 182.93 (155.34) 156.61 (138.32) 39.10 32.12
Group 4 365 194.10 (169.59) 194.50 (173.41) 16.62 17.32
Group 5 – 202.42 (152.95) 167.05 (136.20) – –
Source: Individual patient data from 1999-2005, Norwegian Patient Register (NPR), in Askildsen, J.E., T.H. Holmås andO.M. Kaarbøe (2010), “Prioritization and Patients’ Rights: Analysing the Effect of a Reform in the Norwegian HospitalSector”, Social Science and Medicine, Vol. 70, pp. 199-208.
1 2 http://dx.doi.org/10.1787/888932755262
WAITING TIME POLICIES IN THE HEALTH SECTOR: WHAT WORKS? © OECD 2013234

II.12. NORWAY
introduction of individual waiting times seems to have had limited effect. The allocation of
rights seems to have followed the established medical practice, and there seems to be no
indication that the situation has improved for the most highly prioritised patients.
From 2012, the so-called co-ordination reform is being implemented in the Norwegian
health system. Patients who are admitted to hospitals are gradually being offered more of
their treatment in a primary care or intermediate care setting. The plan is thus to slow the
growth in the number of patients treated in hospitals.
Whether or not a reduced demand for hospital admissions will also reduce hospital
waiting times will depend on the development in the supply of hospital admissions.
Notes
1. Five until 2007.
2. Data cover salaried specialists working in all central government-maintained hospitals.
3. Five until June 2007, when South and East were merged.
4. Prior to 2002, 19 county councils were responsible for supplying specialised health care services.Hagen and Kaarbøe (2006) and Magnussen, Hagen and Kaarbøe (2007) describe the motivation forthe reform and evaluate and discuss some of its effects.
5. Examples of care in group 3 include: gallstone without complications, mild psoriasis, infertilityand cataract with vision better than 0.5 in the best eye.
6. www.helsedirektoratet.no/kvalitet-planlegging/prioriteringer/riktigere-prioritering/Sider/default.aspx.
7. See Askildsen et al. (2011) for a description of the procedure.
8. Note that data cover a period before and after the patients’ rights reform implemented inSeptember 2004. Thus, they are meant to describe the actual waiting times, not to analyse changesover time.
9. The figure is generated using the Directorate of Health data generator. The generator is availableof the following web-page: http://nesstar2.shdir.no/npr/.
10. Assuming that hospital management and staff have a preference for treating patients.
11. Here we use five priority groups: 0-4 weeks (Group 1), 5-12, 13-26, 27-52 weeks, and without right(Group 5).
References
Askildsen, J.E., T.H. Holmås and O.M. Kaarbøe (2010), “Prioritization and Patients’ Rights: Analysing theEffect of a Reform in the Norwegian Hospital Sector”, Social Science and Medicine, Vol. 70, pp. 199-208.
Askildsen, J.E., T.H. Holmås and O.M. Kaarbøe (2011), “Monitoring Prioritization in the Public HealthCare Sector by Use of Medical Guidelines: The Case of Norway”, Health Economics, Vol. 20,pp. 958-970.
Biørn E., T.P. Hagen, T. Iversen and J. Magnussen (2003), “The Effect of Activity-based Financing onHospital Efficiency. A Panel Data Analysis of DEA Efficiency Scores 1992-2000”, Health CareManagement Science, Vol. 6, pp. 271-283.
Bjorvatn, A. and Ching-to Albert Ma (2011), “Patient Mobility and Hospital Free Choice Reform”, Mimeo.
Botten, G., S. Grepperud and S.M. Nerland (2004), “Trading Patients: Lessons from Scandinavia”, HealthPolicy, Vol. 69, pp. 317-327.
Carlsen, B. and O.F. Norheim (2003), “Introduction of the Patient-list System in General Practice:Changes in Norwegian Physicians’ Perception of their Gatekeeper Role”, Scandinavian Journal ofPrimary Health Care, Vol. 21, pp. 209-213.
Commonwealth Fund (2011), “International Profiles of Health Care Systems 2011”, The NorwegianHealth Care System 2011, The Commonwealth Fund, New York.
WAITING TIME POLICIES IN THE HEALTH SECTOR: WHAT WORKS? © OECD 2013 235

II.12. NORWAY
Directorate of Health (2011), “Ventetider og pasientrettigheter 2. tertial 2011. (Waiting Times andPatients’ Rights 2nd four month period of 2011) Rapport IS-1930”, Helsedirektoratet, Oslo.
Hagen, T.P. and O.M. Kaarbøe (2006), “The Norwegian Hospital Reform of 2002: Central GovernmentTakes Over Ownership of Public Hospitals”, Health Policy, Vol. 76, pp. 320-333.
Iversen, T. and H. Lurås (2000), “The Effect of Capitation on GPs’ Referral Decisions”, Health Economics,Vol. 9, pp. 199-210.
Januleviciute, J., O. Kaarboe and M. Sutton (2012b), “Waiting Times, Prices and Priority Groups”, Mimeo,University of Bergen.
Januleviciute, J., J.E. Askildsen, O. Kaarboe, T.H. Holmås and M. Sutton (2012a), “The Impact of DifferentPrioritisation Policies on Waiting Times: A Case Study for Norway and Scotland”, Mimeo,University of Bergen.
Johnsen, J.R. (2006), Health Systems in Transition: Norway, WHO Regional Office for Europe on behalf ofthe European Observatory on Health Systems and Policies, Copenhagen.
Kjerstad, E.M. (2003), “Prospective Funding of General Hospitals in Norway: Incentives for HigherProduction?”, International Journal of Health Care Finance and Economics, Vol. 4, pp. 231-251.
Kjerstad, E and F. Kristiansen (2005), “Free Choice, Waiting Time and Length of Stay in NorwegianHospitals”, Working Paper, University of Bergen.
Magnussen, J., T.P. Hagen and O.M. Kaarbøe (2007), “Centralized or Decentralized? A Case Study ofNorwegian Hospital Reform”, Social Science & Medicine, Vol. 64, pp. 2129-2137.
Ministry of Health and Social Services (1999), “Lov om pasientrettigheter. Innstilling O. nr. 91 (1998-99)”,Patient Rights Act.
Ministry of Health and Social Services (2003), “Endring i lov 2. juli 1999 nr. 63 om pasientrettigheter.Besl. O. nr 23 (2003-2004)”, Amendment to Patient Rights Act.
Monstad, K., L.B. Engesæter and B. Espehaug (2006), “Patients’ Preferences for Choice of Hospital”,Working Paper No. 05/06, Health Economics Bergen, Bergen.
OECD (2012), OECD Health Data 2012, OECD Publishing, Paris, http://dx.doi.org/10.1787/health-data-en.
Vrangbæk, K, K. Ostergren, H.O. Birk and U. Winblad (2007), “Patients’ Reactions to Hospital Choice inNorway, Denmark and Sweden”, Health Economics, Policy and Law, Vol. 2, pp. 125 – 152.
WAITING TIME POLICIES IN THE HEALTH SECTOR: WHAT WORKS? © OECD 2013236

Waiting Time Policies in the Health Sector
What Works?
© OECD 2013
PART II
Chapter 13
Portugal
by
Pedro Pita Barros,
Nova School of Business and Economics, Universidade Nova de Lisboa
and
Rita Cristovão and Pedro Andrade Gomes,
Administração Central do Sistema de Saúde (ACSS),
Unidade Central de Gestão de Inscritos para Cirurgia
Waiting lists and waiting times have been an issue for the Portuguese NationalHealth Service (NHS) for a long time. Over the years, several special programmeshave attempted to solve the problem. But only after 2005, with the creation of theSIGIC, a waiting time and waiting list management system, do we observe aconsistent decrease in waiting times for surgical intervention. The new managementsystem is based on a centralised electronic platform and on a set of rules that allowspatients to move within the health system. It also allows for activity-based funding atthe margin for hospitals that show the ability to treat more patients in waiting list.Target (maximum) waiting times were set from the start, and then updated to moredemanding values after three years of operation. The SIGIC system allows thetransfer of patients to another hospital (either public or private) when 75% of themaximum waiting time is reached. The creation of the IT platform on a centralizedbasis, under a unified set of rules and procedures and with direct access to hospitaldata, was key to ensuring a detailed knowledge of waiting lists and waiting timesacross providers, across procedures and across time. This also allowed for moredetailed information to be provided to patients (who now have a frequently updatedestimate of the likely moment of intervention). The SIGIC has provided a solution forthe problem of excessive waiting times whereas earlier programmes that simplyprovided additional funds for additional activity had failed.
237

II.13. PORTUGAL
IntroductionA recurrent hot topic in policy discussions in Portugal is the existence of waiting lists
and long waiting times for surgical intervention, which is an issue in particular for the
National Health Service (NHS). Privately provided services seldom have waiting times or
waiting lists. Given the existence of waiting lists in the public sector, one might expect
private health insurance to be taken up as a way to bypass the queues in the NHS, but
private health insurance has not fully developed this role. Estimates of the coverage by
private health insurance vary somewhat (from 8% in the National Health Survey of 2005/
2006 to 20% reported by the Portuguese Association of Insurance Companies), which limits
the role of voluntary private health insurance as a funding instrument to avoid public
sector waiting times. The diversion of patients waiting for treatment from public to private
providers also requires appropriate capacity in private hospitals, which until recently did
not match the level of equipment and differentiation existing in the public sector.
In 2011, the number of patients cancelled from the waiting list for surgery with the
motive of being treated in another hospital was 3 667, which represents 4% of the total
episodes cancelled from the waiting list for surgery. Although the private sector has been
growing in Portugal in the last few years, so has the demand for elective surgery, which has
increased by 41% in the NHS over the last six years; the contribution of private providers is
thus still insignificant compared to the public sector.
Moreover, an increasing number of private entities participate in the current system of
waiting list management. The advantage and scope of directly moving to the private sector
thus seems less relevant (more on this below). While some people have resorted to the
private market for more common surgeries, the private health insurance market has not
been a general solution to the problem of waiting in the NHS. The management of waiting
lists and waiting times is therefore still a relevant issue for the NHS. The developments
observed, and documented below, are due to management changes in the NHS, and not to
moving patients from public to private hospitals.
As waiting lists and waiting times are long-standing issues, it comes as no surprise
that several policy measures have been adopted over time to address them. We can identify
five main initiatives in the past 18 years.
In 1995, a specific funding programme to address waiting lists was created, the PERLE
– Programa Específico de Recuperação de Listas de Espera (Specific Programme for Waiting List
Recovery), which evolved in 1998 into the PPA – Programa de Promoção do Acesso (Programme
to Promote Access).
In 2002, yet another programme was initiated: the PECLEC – Programa Especial de
Combate às Listas de Espera Cirúrgicas (Special Programme to Fight Surgical Waiting Lists)
(Resolution of the Council of Ministers No. 100/2002). This programme aimed at
eliminating waiting lists within two years. The objective was later redefined by political
agents as eliminating the waiting list that existed as of June 2002, while ignoring
subsequent additions to the list in order to dub the programme a success.
WAITING TIME POLICIES IN THE HEALTH SECTOR: WHAT WORKS? © OECD 2013238

II.13. PORTUGAL
The continued existence of waiting lists despite these interventions led to the
adoption of a different approach. This involved the creation of a nation-wide information
system to identify and manage waiting lists and waiting times, the SIGIC – Sistema Integrado
de Gestão de Inscritos para Cirurgia (Integrated Management System for the Surgery Waiting
List). Roll-out started in 2004, fully reaching the five health regions of continental Portugal
by late 2005 (the regions of the Azores and Madeira have their own health systems and are
not covered by the SIGIC). This was a major departure from previous attempts to curb
waiting times and waiting lists.
Finally, in 2008, under the pressure of public opinion about cataract waiting lists, a
specific programme for ophthalmology, the PIO – Programa de Intervenção em Oftalmologia
(Intervention Programme in Ophthalmology), was designed and adopted, lasting one year.
As described in detail later, the PIO addressed both waiting lists for a visit to a specialist
(ophthalmologist) and waiting lists for surgery. The latter was already covered by the SIGIC,
but not the former.
Before we review the available evidence, it is useful to clearly identify in the National
Health Service when and why waiting lists and waiting times occur. We then concentrate
attention on the two more recent initiatives, the SIGIC and the PIO.
Main characteristics of the Portuguese health systemThe Portuguese National Health Service (NHS), established in 1979, guarantees
universal access to healthcare for all citizens, and is mainly funded through taxation: taxes
account for around 90% of all public health expenditure. Health care services are provided
by a mix of public and private providers. The Ministry of Health is in charge of managing
and co-ordinating health care provision and the financing of public health care services
within the NHS. The five Regional Health Administrations (RHAs) in Portugal hold certain
responsibilities, such as the oversight of hospitals, the management of primary care
centres and the implementation of national health policy objectives at a regional level.
Private health insurance in the form of Voluntary Health Insurance (VHI) and occupational
health subsystems remain important components of health service delivery and coverage
in Portugal, and are predominantly remnants of the wider systems which pre-existed the
NHS. Even after the establishment of the National Health Service, the private sector
remains a significant provider of health care services in Portugal, in particular diagnostic,
therapeutic and dental services, some ambulatory consultations, rehabilitation and
psychiatric care.
Hospitals
Of 231 hospitals in Portugal in 2010, 129 were publicly owned, 50 were privately owned
and not-for for profit, while only 52 were private for-profit. 73% of all beds were in publicly
owned hospitals (OECD, 2012). The RHAs supervise and manage the public hospitals, but
their budgets are still set by the central health authority (Barros et al., 2011). Since 2003, the
majority of public hospitals have been turned into public enterprises (“autonomous public
hospitals”) “in order to provide autonomy and management accountability to hospital
boards” (Barros et al., 2011).
Hospital remuneration
Hospital budgets are set by the Ministry of Health – the central health authority – and
have traditionally been prospective budgets based on the previous year’s funding, adjusted
WAITING TIME POLICIES IN THE HEALTH SECTOR: WHAT WORKS? © OECD 2013 239

II.13. PORTUGAL
for inflation. A proportion of the hospital budget is adjusted for case-mix, and for activity,
based on Diagnosis-Related Groups (DRGs). The case-mix-adjusted component of the
hospital budget has progressively increased since the late 1990s. Public hospitals are
reimbursed on a case-by-case basis for care provided to patients covered by VHI and health
subsystems, following a DRG-defined price list. Hospitals generate income for the NHS
through these private payments, and through co-payments and additional payments from
patients for extra services such as private rooms and flat-rate admission charges. Total
supplementary payments amount to 15% to 20% of the overall hospital budget. The main
source of funding for public hospitals is a transfer from the National Health Service,
which is detailed in yearly contracts signed between the hospitals and the relevant RHA
(Barros et al., 2011).
Specialist remuneration
All doctors working for the Portuguese NHS are government employees, with fixed
salaries established based on a matrix for professional category and duration of employment,
with no measure of productivity (Barros et al., 2011). Specialists often add to their income
through private sector activity, which under some conditions can be undertaken within public
facilities (i.e. public hospitals), for which they receive a fee-for-service rate. Overtime payment
and payment for additional activity exist in some cases (for example, payment for patients
transferred from another institution under the waiting list management system). The income
of salaried specialists per average wage was 3.23 times the average wage in 20051 (OECD, 2012).
Co-payments
Private households’ out-of-pocket payments in Portugal are estimated to be among the
highest in Europe, accounting for 26% of total health expenditure in 2010 (OECD, 2012).
Co-payments are usually set at a fixed amount for a given service, for example for
consultations, emergency visits, diagnostic tests and home visits, and there is no ceiling
on total co-payments. In 2007, co-payments were also introduced for hospital admissions –
due to their economic insignificance, however, they were removed in 2009 (Barros et al., 2011).
From January 2012, the level of user charges increased significantly (roughly doubling), which
was compensated by a more generous system of exemptions for these charges (it is predicted
that exemptions may cover circa 70% of the population, up from 45-50% previously) (Barros,
2012).
Surgical activity
Of all the surgical procedures performed as in-patient, the greatest growth rates
between 2001 and 2009 were attributable to knee replacement (239%) and percutaneous
coronary interventions (PTCA and stenting) (159.5%). Only appendectomy had a negative
growth rate over the period (18.9%). For a number of procedures, day-case surgery has
considerably increased.
Private health insurance
Private voluntary health insurance (VHI) exists in addition to the NHS, and 20-25% of
the population are covered by some kind of health subsystem or by VHI. Some specific
professions and their families are compulsorily included within these “special public and
private insurance schemes” (subsistemas) (Barros et al., 2011). These occupational health
organisations pre-date the establishment of the system of national health coverage, and
WAITING TIME POLICIES IN THE HEALTH SECTOR: WHAT WORKS? © OECD 2013240

II.13. PORTUGAL
continue to provide coverage for around 16% of the population, with approximately 10% to
20% covered by a private VHI, while less than 2% had cumulative coverage from both VHI
and health subsystems (Barros et al., 2011). The largest health subsystem, the ADSE
(Assistência a Doença dos Servidores do Estado), was previously mandatory for civil
servants, but is now optional and covers almost 10% of the population (Barros et al., 2011).
The ADSE is predicted to move toward a self-sustained health insurance system, as
specified in the Memorandum of Understanding signed with the financial support of the
European Commission, the European Central Bank and the International Monetary Fund.
Health expenditure
Total health spending accounted for 10.7% of GDP in Portugal in 2010, more than one
percentage point higher than the OECD average of 9.5%. Despite allocating a relatively high
proportion of its GDP to health, Portugal spent only USD 2 728 on health per capita in 2010
(adjusted for purchasing power parity), a lower figure than the OECD average of USD 3 268.
Health spending in Portugal increased in real terms by 2.3% per year on average between
2000 and 2009, but this growth rate slowed to only 0.6% in 2010. In Portugal, 65.8% of health
spending was funded by public sources in 2010, less than the OECD average of 72.2%. Public
and private expenditure as shares of total expenditure have remained relatively stable over
the period 2000 to 2010, public expenditure accounting for around 66% and private 34%,
respectively (OECD, 2012).
Table 13.1. Surgical procedures per 100 000 population,Portugal, 2000 and 2009
Surgical procedures by ICD-9-CM 2000 2009% change
in surgical proceduresbetween 2000 and 2009
Cataract surgery:
In-patient 254.9 113.3 -55.6
Day-case 26.1 1 276.9 4 792.3
Tonsillectomy with or without adenoidectomy:
In-patient 42.9 51.3 19.6
Day-case 1.8 27.4 1 422.2
Percutaneous coronary interventions (PTCA and stenting): in-patient 45.5 118.1 159.5
Coronary bypass: in-patient 22.9 39.7 73.3
Appendectomy: in-patient 120.1 97.4 -18.9
Cholecystectomy:
In-patient 150.7 (2006) 145.3 -3.6
Day-case 2.2 (2006) 7.5 240.9
Laparoscopic cholecystectomy:
In-patient 52.5 110.8 111.5
Day-case 0.2 7.4 3 600.0
Inguinal and femoral hernia:
In-patient 157.3 120.2 -23.6
Day-case 12.9 63.6 393.0
Hip replacement: in-patient 71.9 87.8 22.1
Knee replacement: in-patient 18.2 61.7 239.0
Source: OECD (2012), OECD Health Data 2012, OECD Publishing, Paris, http://dx.doi.org/10.1787/health-data-en.1 2 http://dx.doi.org/10.1787/888932755281
WAITING TIME POLICIES IN THE HEALTH SECTOR: WHAT WORKS? © OECD 2013 241

II.13. PORTUGAL
Primary care
In 2008, primary care groups (ACES: Agrupamentos de Centros de Saúde) were
established to enhance the use of resources and management structures. The ACES are
intended to provide services to the population in a given geographic area with between
50 000 and 200 000 patients. Primary care in the public sector is mostly delivered through
the ACES and primary care centres by GPs and nurses. Patients must be registered with a
GP, who they can choose from a given geographical area, and who act as gate-keepers to
further services. Patients going directly to the emergency room of public hospitals can
by-pass GP gate-keeping and access specialist care, including hospital care, immediately
(Barros et al., 2011). GP payments depend on their performance and the case-mix of their
patients (Barros et al., 2011). In 2010, there were 0.5 GPs per 1 000 population in Portugal
(OECD, 2012).
Practising physicians
In the last ten years, the number of physicians licensed to practice has increased
from 3.1 (per 1 000 population) in 2000 to 3.82 in 2010 (OECD, 2012).
Ageing and life expectancy
The percentage of the population aged 65 and over has increased from 16.2 in 2000 to
18.2 in 2011. Life expectancy has increased from 76.7 years in 2000 to 79.8 in 2010
(OECD, 2012).
Policy interventions aimed at waiting listsOver the last 18 years, several specific policy interventions aimed at waiting lists have
been devised and implemented in Portugal. These can be divided into two broad groups.
The first aims at increasing activity levels by making available extra funding. The second
group aims at improving management and organisation, namely using information
technologies and clear and enforceable rules of transfer associated with target times.2
Waiting times for elective surgery are measured from the registration date of the patient
in the national waiting list for surgery (which occurs in the hospital appointment once the
surgical indication is identified) until the surgery date. The time when the patient is not
available to be scheduled for surgery due to personal reasons (maximum one year) or clinical
reasons (maximum four months) is subtracted from the patient’s official waiting time.
The national waiting list for surgery is built from the records of the hospital local
information systems. An annual report is published with aggregate performance indicators
and statistics on the mean and the median waiting times for surgery, among other
statistical measures.
The discussion of waiting times for surgery needs to recognise that waits can occur at
several points, with the main ones being after referral from primary care to a (hospital)
specialist, after indication for surgery, after admission to the list, and after admission to the
hospital are the main ones. We look only at the waiting time after an indication for surgery
was accepted and the patient was included on the waiting list until the day of surgery.
The existence of some waiting time is almost unavoidable in a national health service.
The demand for surgery occurs in a random way, so there is no way to predict how many
interventions will be necessary at each moment in time. Treatment capacity must be
managed, as organising it to treat the maximum possible demand would usually entail idle
WAITING TIME POLICIES IN THE HEALTH SECTOR: WHAT WORKS? © OECD 2013242
II.13. PORTUGAL
capacity, i.e. a waste of resources. Thus, waiting lists and waiting times follow easily from
the difference between the arrival of patients for treatment and the available capacity in
the system to satisfy the demand.
The drivers of waiting lists can be grouped into three categories: increased demand for
surgical interventions (ageing of the population, clinical choices associated with new
technologies, patient expectations, etc.); the definition of supply capacity (how much
equipment is made available); and the efficiency of the health system (including
organisational and management skills, uncertainty regarding clinical outcomes, the
commitment and performance of staff, etc.).
The policy interventions aimed at reducing waiting lists and waiting times for surgery
have focussed mainly on the last two aspects.
From an organisational viewpoint, the NHS needs to find a balance between reducing
waiting times and avoiding the waste of resources (idle capacity). The first instrument to
manage this balance is the definition of the clinically acceptable waiting time. This allows
the existence of a waiting list that smoothes the random arrivals of new patients into the
health system for surgery. It also implies a basic prioritisation system (four levels)
according to clinical need.
Another way to find a balance between reducing waiting times and avoiding waste
from idle resources at the level of the individual hospital (or health care provider) is by the
aggregation of uncertain cases. A small hospital, with a small catchment area, may have a
higher variability in demand. Large hospitals, through the simple aggregation of large
numbers in their catchment area, will have a more predictable aggregate demand for
health care services. From this follows the idea that the aggregation of patient needs and
their redistribution across hospitals will help to reduce uncertainty at the unit level and
reaps the benefits from the better scheduling of surgical activities. As will be detailed
below, the current system of management of waiting lists, the SIGIC, performs this
aggregating role as it controls transfers of patients across hospitals when required to meet
patient waiting time targets.
In the past 20 years as described above, several waiting list recovery programmes have
been devised and implemented: the PERLE (Programa Específico de Resolução de Listas de
Espera, 1995), the PPA (Programa de Promoção do Acesso, 1999), the PECLEC (Programa Especial
de Combate às Listas de Espera Cirúrgicas, 2002), the SIGIC (Sistema Integrado de Gestão de
Inscritos para Cirurgia, 2004) and the PIO (Programa de Intervenção em Oftalmologia, 2008).
All these policy interventions except the SIGIC had the common feature of making
available further funding to perform extra surgery. Under the PERLE, the extra funding was
targeted at buying capacity in the private sector. Under the PPA, the PECLEC and the PIO,
the extra funding was mainly directed to NHS hospitals, although this involved contracting
out in the private sector, both non-profit and for-profit. There is no systematic review of the
performance of the early programmes. The available information comes mainly from
Barros and Olivella (2001) and more recently from Reis (2011). It strongly suggests that at
the end of each of these programmes, the waiting lists were larger than at the start. Only
scant information on waiting times is available, as no central records exist.
At the heart of the SIGIC is an IT system for managing waiting lists and waiting times,
taking advantage of the referral of patients across institutions and the imposition of
maximum waiting times.
WAITING TIME POLICIES IN THE HEALTH SECTOR: WHAT WORKS? © OECD 2013 243
II.13. PORTUGAL
The creation of the SIGIC, which will be discussed below, led to an important change
in the public discussion and perception of waiting lists in Portugal. The information
provided by the SIGIC about waiting times and the size of the waiting lists is far more
reliable than the previous information on waiting list sizes, and virtually no systematic
information on waiting times existed.
The existence and availability of new reliable information changed the discussion
from the number of people on the waiting list to the mean and median waiting times. The
latter has actually become the norm in reporting information on waiting lists and waiting
times. Thus, the SIGIC also contributed to a more rational public discussion of waiting lists.
A new approach: the SIGIC
The birth of the SIGIC
The SIGIC resulted from the relative failure of the immediately previous programme
for waiting lists, the PECLEC, as well as the earlier programmes, in reducing waiting times
on a permanent basis. By failure is meant that after the PECLEC, there were still a large
number of people on the surgery waiting lists.
The PECLEC itself was actually close to meeting an announced target of solving the
clinical needs of patients who were on the waiting list at its starting date, but it did not
change the underlying dynamics of waiting list growth.
The objective of the PECLEC was initially defined as the elimination of waiting lists
within a period of two years, but soon was rephrased to be to provide treatment within
two years to all patients registered on the waiting list at the end of the first semester of
2002. By the second definition, the objective was met to a considerable extent: 93.5% of
people waiting were no longer on the waiting list after two years.
However, the number of new patients added to the list more than compensated the
exits from the list. At 31 December 2002, there were 182 473 patients waiting for surgery in
the Portuguese NHS. Of these, 58 926 were removed due to various reasons, including
death, undue indication for surgery, surgery already performed in the private sector, etc.
The number of patients eligible for surgery was thus actually 123 547. Of these, 115 568
were subject to surgery within the two years of the programme. There is not much
information publicly available about waiting times during this programme or about
differences in waiting times across groups (namely, the eligible patients and patients that
are new additions to the waiting list). Mean waiting times, a more relevant measure from
an economic viewpoint, decreased from 19 months in June 2002 to 8.7 months in April 2004
(see Reis, 2011).
The inability of current NHS to satisfy the demand, and the consequent accumulation
of waiting lists, resulted in a decision to adopt a different approach, i.e. a national system
for managing surgery waiting times, allowing for explicit transfers of patients between
institutions when needed to meet target times for maximum waits. The SIGIC was then
born.
One relevant issue is whether other changes in the NHS besides these policy initiatives
may have contributed to an increase in productivity and a decrease in waiting lists and
waiting times, in particular the introduction of DRGs.
However, the introduction of DRGs was not a determinant factor in increasing hospital
productivity in either the PECLEC or the SIGIC. The implementation of DRGs in Portugal
WAITING TIME POLICIES IN THE HEALTH SECTOR: WHAT WORKS? © OECD 2013244
II.13. PORTUGAL
started in 1984 when a contract was signed between the Ministry of Health and the
University of Yale. The first law to fund health care services provided for by the NHS and
paid by a DRG pricing list was officially released in 1990. Nonetheless, the existence of soft
budget constraints in hospitals, together with an approach that set global budgets to
hospitals only partially based on DRG costs, implied that DRGs never worked as a
prospective payment system. SIGIC measures with a (potentially) significant impact on
productivity were: payment per surgery in additional surgery production (after working
hours contracted with the surgical teams); the patients’ transfer between hospitals; and
the official release of hospital performance indicators.
The DRG system was also not a pre-condition for the SIGIC to set uniform prices across
hospitals for elective surgery. In the PECLEC, there was a different pricing system for the
elective surgery, and it didn´t cover all elective surgery. In the SIGIC, there was a big
concern to have a uniform billing process, and DRGs were an instrument to facilitate the
billing and funding of elective surgery, but this was not itself determinant for the increase
in hospital productivity. DRGs thus were a relevant instrument, but not the main driver of
productivity increases.
Patient choice was introduced only with the SIGIC. In earlier programmes such as the
PECLEC the patient was not allowed to choose between hospitals.
There were no clear policies on demand management prior to the SIGIC. The concern
was to increase access to elective surgery in the NHS. Other programmes managed by the
SIGIC, such as the PTCO – the Programme of surgical treatment of obesity – are now
integrated programmes for a set of pathologies, which include the regulation and
monitoring of elective surgery but also hospital referrals, hospital appointments and other
medical treatment. The regulation limits access to informal referral for surgical treatment.
Characteristics of the SIGIC
The SIGIC – Integrated Management System for the Surgery Waiting List – is an
integrated management system aimed at promoting access to hospital surgical services in
terms of quality, equal treatment, efficiency and effectiveness, so as to achieve
sustainability in the National Health Service (NHS), along with transparency and
accountability in process and patient management. SIGIC manages all NHS patients and
involves both public and private healthcare providers of surgical treatment. Its backbone is
an information system (SIGLIC), which receives information from all the relevant
providers, public and private. The information collected by the SIGLIC allows the
computation of waiting times and the size of waiting lists, and registers movements of
patients between providers, especially in the case of waiting times approaching threshold
values.
The SIGIC manages all NHS patients seeking surgical treatment and involves all public
healthcare providers with surgical services (58) and 60 private healthcare providers with
agreements for surgical treatment within the NHS. One of the big innovations in the
system is that it includes waiting time information from both public and private providers.
Every year it covers 500 000 surgeries, 4.5 million surgery appointments and a business
volume of more than EUR 1.5 billion for surgical services.
One of the instruments created to support the SIGIC was a price list by surgical DRG to
pay additional hospital production, i.e. the surgical production performed outside the hired
WAITING TIME POLICIES IN THE HEALTH SECTOR: WHAT WORKS? © OECD 2013 245

II.13. PORTUGAL
working hours of surgical teams. This functions works as activity-based payment at the
margin.
The elective surgery contracted by public hospitals has two components. One is
designated by “basic surgery production” and takes into account all hospital fixed costs,
including employment contracts, and uses the historical production as a reference. This
production is paid by the NHS pricing list, which defines the price for a given year for each
DRG for all the treatments provided to patients within the NHS. The second component of
contracted elective surgery production is designated by “additional production”; this
results from the optimisation of hospital resources to produce more surgeries and is
rewarded per surgery performed. This production is paid through the pricing list for
additional production, and is on average 30% cheaper than the price paid for basic surgery
production. The additional surgery production results from patient transfers. It is
performed by public and private hospitals that have an agreement with the SIGIC. So
concerning additional production, the public and private providers are paid at the same
prices per DRG, which are 70% of the price value paid to public hospitals for basic
production (reflecting a lower marginal cost of the former activity). The payment of
additional surgery at a 30% discount relative to the average payment (which is designed to
pay for general infrastructure costs as well) is usually seen as a net saving for the NHS
funding requirements. The clear payment structure of the SIGIC, with a single price for all
providers, promotes patient choice. As the price is determined ex-ante, hospitals have an
incentive to be efficient and to compete by increasing the quality of care to rank higher in
the patient’s preferences.
The SIGIC is supported by several instruments created to monitor and manage access
to elective surgery treatment in the NHS. These include the information system (developed
in-house), the legal instruments for the SIGIC rules, the funding and billing system, the
patient transfer system and others. The information system developed by the SIGIC team
is a unique system invented to respond to SIGIC’s special needs and requirements and
allows collecting data from the hospital local systems for the central SIGIC database. That
information system is named SIGLIC.
The SIGLIC information system shares the information collected from different
sources (hospitals, regional health administrations, patients, ACSS, among others) with all
the stakeholders involved such as public and private healthcare providers, regional
healthcare administrations, the central NHS administration, patients, medical and clinical
practitioners and the government. It provides clinical and administrative information,
including on clinical governance, because all the information related to the patient’s
treatment and their circuit within the SIGIC, including any transfer to another hospital, is
recorded in the SIGLIC. The information is accessed by users according to their access
privileges. The SIGLIC thus provides information according to the stakeholder’s needs,
keeping the necessary restrictions to the patient’s sensitive personal data. To this end, the
SIGLIC has several entities connected by codes that are not accessible to users and which
dissociate the patient’s personal data from their clinical data, along with a system of user
profiles. The result is that clinical information is provided only to clinical personnel,
management information is provided to executive and unit directors, and administrative
information is provided to management assistants and administrative personnel. Each
hospital has access only to its unit information, and so on. All the stakeholders can share
their opinion by using the same tool.
WAITING TIME POLICIES IN THE HEALTH SECTOR: WHAT WORKS? © OECD 2013246

II.13. PORTUGAL
The SIGLIC reports the information for clinical governance in an innovative way,
because the information structure of the electronic clinical process was adapted to be more
appealing and useful to the clinical personnel, in particular the surgeons. It focuses on the
events involved in the interaction between the hospital and the patient, such as when the
surgeon identifies and classifies the patient health problems in scientific terms, as well as
the corresponding treatment. The set of diseases and treatment procedures is designated
by a nosological unit. To facilitate clinical governance, the SIGIC created nosological units,
which are sets of diseases and its corresponding treatment procedures, which allows an
easier macro-analysis of the patient clinical process and the creation of performance
indicators to monitor not only the patient care process, but also the clinical process, the
resources allocated and the procedures established in the treatment of similar diseases.
This model makes it possible to monitor the hospital or service for a given pathology and
treatment (i.e. the cure for inguinal hernia, in-patient time, number of hours of operating
rooms, age and sex distribution of the patients, etc.).
Another key feature of the SIGLIC is the aggregation of the basic parts of the events
into episodes that represent the set of interactions for the resolution of identified problems
in the context of a defined plan of care. That is, the SIGLIC allows recording and following
the whole patient journey, from the moment of the first hospital appointment to the end
of treatment in the hospital. The goal is to control the patient journey, from primary care
to the completion of treatment in the NHS.
The SIGLIC ensures reliable information by guaranteeing the integrity of data collected
in the source, the hospital operational systems. To this end, a redundant system was
implemented with several check points to permanently validate information quality in the
central database. This process is extremely important so that the right care is provided to
a given patient, the hospital administration makes the right management decisions and
the hospitals have the right funding from the NHS, based on correct information. The
information collected in the central database takes into account the rules of the Portuguese
law on data security and the protection of data privacy. The data is anonymised so that the
patient is not identified in the central database. The patient clinical process is identifiable
through the episode number and process number in the hospital. The SIGLIC collects
881 input variables, with clinical and administrative information about the patient journey
and treatment in the hospital. For example, it collects data from the patient plan of care,
such as the diagnostics and surgical procedures and the corresponding ICD-9-CM codes,
clinical priority, date of entry on the waiting list for surgery, whether out-patient or in-
patient surgery, the ASA risk,3. etc. It collects data from the patient scheduling, the surgery,
any post-surgery complications, the discharge of the patient from the hospital, the DRG of
the episode for clinical and billing purposes, and more.
The design of the system defined the procedures for information collection centrally,
thus ensuring consistency of information across hospitals. The centralised approach to
waiting list management in Portugal was decided after failure of a first attempt at co-
ordinating efforts across health regions. By collecting the raw data directly, the SIGLIC
avoids issues associated with the harmonisation of data concepts across hospitals. For
example, the SIGLIC collects all relevant dates of the patient’s journey, from which it
computes all the relevant waiting time measures. If hospitals were to report waiting times
themselves, then standards would have to be defined and co-ordinated across hospitals,
i.e. whether waiting times for a particular month mean episodes ending in that month or
WAITING TIME POLICIES IN THE HEALTH SECTOR: WHAT WORKS? © OECD 2013 247

II.13. PORTUGAL
episodes starting in that month. Regardless of how the SIGIC reports the data, we can be
sure that the same methodology was applied to all hospitals.
The evaluation of the overall waiting time implies knowledge of all the split times and
an understanding of the interfaces between the assessment of clinical needs, the
evaluation period, the treatment period and ultimately the evaluation of the patient gains
in health. The (future) inclusion of primary care in the process would record the referral
stage and the corresponding access time as well as evaluating the results of the external
entity, the attending physician. In order to measure the access and waiting times for
elective surgery accurately, the SIGLIC is intended to include all the information about the
patient treatment journey, including information on primary care, but for now it collects
only hospital data. In the near future, SIGLIC will have an interface (already being
developed) with health unit local systems for this purpose.
The activity of surgical services is not limited to performing surgical procedures. It
encompasses every phase of screening, investigative procedures, analysis, complementary
medical treatments and the pre-and post-operative follow-up of patients with a pathology
that at some stage can benefit from a surgical approach. The activity of these services
cannot be addressed in isolation, in other words, without taking into account that this
involves an integrated network of care, which includes primary care, hospital and
continued care in order to follow the entire patient journey.
Access is a function whose variables include the existing supply of care, the
population and the related health needs. In this context, it is not enough to ensure that the
service is provided on time; it is also necessary to observe whether it is provided in
accordance with requirements, with good quality, equitably, the extent to which providers
adapt to patient needs, the results of the services provided, as well as the costs involved
and their correlation with the value perceived by the patients. One reason why all these
aspects have to be considered in decisions about promoting access to care access is the
need to not compromise the sustainability of the NHS.
A patient in the SIGIC can be transferred to another hospital in order to guarantee
meeting the maximum waiting time established by clinical priority and adjusted by the
type of pathology. When a public hospital proves unable to treat a patient within the
maximum waiting time established by the Ministry of Health for their particular problem,
the SIGIC guarantees the transfer of the patient to a hospital capable of treating them on
time. Transfers do not involve costs to the original hospital.
Besides recording information in a consistent way, the SIGIC thus handles the active
management of waiting times, using both public and private providers to ensure the
patient’s right to be treated within the maximum guaranteed waiting time. To this end,
action is taken before reaching the maximum guaranteed waiting time.
Under the SIGIC, when the patient on the waiting list reaches 75% of the maximum
waiting time for surgery guaranteed by law, a voucher is produced allowing the patient to
demand treatment elsewhere (including the private sector).
The voucher allows patients to choose the public or private hospital where they want
to be treated. The choice available in the voucher is restricted only to hospitals that offer
the surgical procedure recommended to the patient in the plan of care. Payment by the
NHS is the same, irrespective of provider.
For elective surgery (SIGIC), the current targets defined by law for waiting times are as
listed in Table 13.2.
WAITING TIME POLICIES IN THE HEALTH SECTOR: WHAT WORKS? © OECD 2013248

II.13. PORTUGAL
As hospitals change their decisions in order to avoid losing patients, efficiency gains
would shift the distribution of waiting times towards lower values, with the possibility of a
clustering of cases below the threshold triggering a patient transfer. From this, we can
expect a reduction in mean waiting times, although the effect on median waiting times
may be less impressive. The hospital has a clear interest in meeting the maximum waiting
time for patients without inducing transfers. The active management of surgical
appointments can achieve this. The hospital will schedule patients with already long
waiting spells and thus delay treatment for patients with shorter waiting spells. Over time,
a clustering of waiting times per episode below the transfer threshold is likely.
The providers are not interested in having patients transferred to another hospital
because they have already incurred costs with that patient and will lose a percentage of the
NHS financing. Public hospitals have to fulfil the production contract signed with the ACSS,
including goals for production volume. Otherwise, they will suffer financial penalties
specified in the contract. For the 2012 contract, for each transferred patient, the public
hospital has a penalty of 10% of the episode billing. So it is in their own interest to make
efforts to treat their patients on time, optimising the use of their resources for which they
already have fixed costs that must be paid whether or not they produce care services for
the patients.
The SIGIC implemented a controlled competitive system with private providers based
on access times and prices. In the PECLEC, the waiting list recovery programme previous to
the SIGIC, there were also private providers involved in the programme to increase access
to elective surgery. Groups of patients in waiting lists were created and contracted out for
treatment. The use of private providers was therefore quite distinct from what is done
under the SIGIC, where private providers are a more permanent partner.
The SIGIC has also implemented procedures for regular monitoring and reporting that
attend the various steps in the patient management process through the SIGLIC
information system, such as a warning system to alert institutions for non-compliances
and reminders to perform the procedures in accordance with applicable law. There is a
dashboard with performance indicators that are updated from the operational database. It
Table 13.2. Current targets for waiting times in Portugal,as defined by the Ordinance No. 1529/2008
of 26 December 2008
Level of clinical priority Group of pathologies Maximum waiting times in days
P1 – Normal General 270
Cancer 60
Obesity 270
P2 – Priority General 60
Cancer 45
Obesity 60
P3 – High priority General 15
Cancer 15
Obesity 15
P4 – Urgent General 3
Cancer 3
Obesity 3
Source: Portuguese Ministry of Health, Ordinance No. 1529/2008 of 26 December 2008, Diário daRepública, 1ª Série.
WAITING TIME POLICIES IN THE HEALTH SECTOR: WHAT WORKS? © OECD 2013 249

II.13. PORTUGAL
actively mobilises demand by disseminating and providing access to alternative but
efficient providers, according to the waiting times for elective surgery.
The SIGIC established indicators and periodic reports on compliance procedures, the
results on access, productivity, human and physical capacity, and economic and financial
measures. It also regularly audits health providers and reports on results, compliances and
constraints, and makes recommendations to their supervisors.
The SIGLIC, the information system that supports and controls the SIGIC and interacts
with public and private healthcare providers, the RHAs and the central NHS
administration, is involved in the different components of the process, such as the
registration and control of demand for surgical procedures; the referral networks and
management of the communications network; the registration of patient interactions with
healthcare providers; the portfolio of surgical services and physical and human resources;
professionals, their accreditations and allocation to services; the registration and
production of the services provided (supply); the results obtained (in services provided
according to procedures, in gains in health and in the perception of added value to the
patient’s health); and the funding and billing of the entire process.
There can be more than one episode in the patient’s treatment, depending on their
care pathway, and the patient can be treated in more than one service or hospital. But the
SIGLIC takes into account the single episode that aggregates all the therapeutic episodes
and therefore the global time the patient waited to be treated from the moment their
clinical needs were identified. The other SIGIC stakeholders can access the information
through reports from the SIGLIC.
An important issue in waiting list management is the existence of prioritisation.
Several countries, such as Norway and New Zealand, have adopted explicit criteria for
inclusion on the waiting list and for the definition of maximum guaranteed times. The
Portuguese system, the SIGIC, also defines priority levels, as briefly mentioned above. The
criteria to define a patient’s priority level is the severity of the clinical condition, the
treatment’s benefit to the patient and their social conditions. The assessment is performed
by the doctor who follows the patient. Each priority level has a corresponding maximum
waiting time for intervention. A distinct set of priority definitions is applied to cancer
patients. Table 13.3 summarises.
The SIGIC also has an important role in patient information. It currently allows each
patient on the waiting list to know their current position on the list and provides an
expected moment for intervention. The expected moment of intervention is computed
Table 13.3. Maximum waiting times guarantees over time, Portugal
Priority level14 Jan 2008 to present 25 Nov. 2004 to 14 Jan. 2008
General case Cancer patients General case Cancer patients
1 9 months 2 months 12 months 12 months
2 2 months 1.5 month 2 months 2 months
3 2 weeks 2 weeks 2 weeks 2 weeks
4 3 days 3 days 3 days 3 days
Source: First two columns: Portuguese Ministry of Health, Ordinance No. 45/2008 of 15 January; last two columns:Ordinance No. 1450/2004 of 25 November, Diário da República, 1ª Série.
WAITING TIME POLICIES IN THE HEALTH SECTOR: WHAT WORKS? © OECD 2013250

II.13. PORTUGAL
using an algorithm containing the past performance of the hospital of interest, which is
updated regularly.
To sum up, the SIGIC is a system that brings together public and private hospitals and
provides waiting time guarantees and information on waiting lists for surgery and the
quality of care provided to the patients in the NHS. It comprises the following key
components:
● Information system to manage and provide information about the programme.
● Patient referral network and transfer system between hospitals to guarantee the
targeted waiting times.
● Electronic clinical processing of the patient available to the hospitals involved in the
patient’s treatment.
● System of warnings for detection of non-compliances according to the law on the
hospital procedures.
● System of financial incentives and penalties in case of non-compliance.
● System of funding and billing the additional surgery production.
● Electronic communications network to exchange information between the stakeholders
in each clinical case.
● Clinical and quality protocols management system.
● Dashboard of performance indicators and data to support a business intelligence
system.
● Information quality system to guarantee the reliability of the information provided.
The next steps for the SIGIC are to implement a system to measure the patient’s
perceived value of the care provided and the quality of surgical treatments relative to heath
regulations. The SIGIC’s ultimate goal is to improve access to elective surgery by providing
information and knowledge that actually facilitates the hospital process management,
disease management, patient management and the measurement of gains in health.
The results of the new approach
Figure 13.1 shows the changes in the national waiting list for surgery since the SIGIC
was implemented in the NHS.
In five years the SIGIC reduced the waiting list for surgery by almost 35%, but it also
achieved a significant decrease in the (median) waiting time for surgery, as shown in
Figure 13.2.
With the SIGIC, the median waiting time for elective surgery was reduced by almost
63%, from over eight months to three months, which represents a considerable
improvement in access to surgical treatment in the NHS.
This improvement was only possible due to the increased effectiveness in the
management of patients registered for surgery brought about by the SIGIC. The
introduction of the SIGIC has been associated with an increase of almost 40% in surgical
production in the last five years, either by public hospitals or private hospitals performing
surgery on the NHS through agreements, as shown by Figure 13.3. The use of the SIGIC
helped to increase production through three channels: increased production during
regular hours, increased capacity by additional surgery production in NHS hospitals and
the contracting of production to private hospitals. By performing surgery outside working
WAITING TIME POLICIES IN THE HEALTH SECTOR: WHAT WORKS? © OECD 2013 251

II.13. PORTUGAL
hours, the teams are paid per procedure in public hospitals, so there was an increase in
additional production by public providers. The private sector also contributed to the
increase in surgery production by absorbing the surgeries for which the public hospitals
were unable to respond in time. Payment by activity at the margin, both intra moenia to the
NHS, and to external providers, defined an adjustment margin in terms of treatment
capacity. Since NHS hospitals are funded by global budgets, it is difficult to disentangle the
effects of several changes that occurred during this period and attribute to the SIGIC a
specific share in the explanation of the gains in efficiency. Moreover, hospital budgets have
generally increased, and the build-up of arrears (debt due to lack of payment to suppliers,
mostly but not exclusively pharmaceutical companies) suggests that the increased activity
did come at a budget cost. We cannot extrapolate the observed ability to reduce waiting
times to increased technological or allocative efficiency. As the SIGIC involves extra
payments for any additional activity of NHS hospitals within the context of waiting list and
waiting time management, it is worth referring to the financial data for 2011. In that year,
Figure 13.1. Evolution of national waiting list for surgery in Portugalbetween 2005 to 2011 (at 31 December)
Source: Based on data provided by SIGIC (SIGLIC), the Integrated Management System of the Waiting List for Surgery.1 2 http://dx.doi.org/10.1787/888932754274
Figure 13.2. Evolution of the national waiting time for surgery in Portugal,2005 to 2011
Source: Based on data provided by SIGIC (SIGLIC), the Integrated Management System of the Waiting List for Surgery.1 2 http://dx.doi.org/10.1787/888932754293
300 000
250 000
200 000
150 000
100 000
0
50 000
2005 2006 2007 2008 2009 2010 2011
248 404221 208
197 150174 179 164 751 161 621 175 282
Number of surgical episodes
10
9
8
7
6
5
4
3
1
2
02005 2006 2007 20092008 2010 2011
8.6
6.9
4.43.7 3.4 3.3 3.2
Median waiting time in months
WAITING TIME POLICIES IN THE HEALTH SECTOR: WHAT WORKS? © OECD 2013252

II.13. PORTUGAL
EUR 11.5 million were spent on additional activity intra moenia to the NHS, EUR 50.1 million
were paid to private providers outside the NHS and EUR 1 006 million were imputed to the
NHS for normal surgical activity managed through the SIGIC. Thus, activity-based funding
in the NHS represents about about 1% of total funding, while private hospitals account for
about 5%.
Not only has surgical production increased, but the time patients actually wait for
surgery has also fallen by 28% to 2.97 months. Median waiting times have consistently
decreased since 2005, the starting date of the SIGIC, up to 2011. The increase in production
was due to the funding model for additional surgery production and to the contracts signed
with public hospitals. The system’s clear rules made it possible to increase the use of
hospital resources and to optimise them for a more efficient production flow.
The decrease in waiting time for surgery was achieved mostly through the better
management of access to surgical care provided by public entities, which was boosted by
the rules and guidelines issued by the SIGIC. As Figure 13.4 shows, from 2006 to 2011
entries of new patients onto the national waiting list for surgery increased by almost 41%,
but that didn´t stop the decrease in waiting time. The role of the private sector in this
evolution was modest, as there was no massive public-private migration of patients (as
would be the case if waiting times had not decreased in the public sector). Currently, the
private sector intervenes only when the patient reaches 75% of the waiting time targeted
by law for the given clinical priority and disease and receives a voucher to be transferred to
another hospital. Recently, some private hospitals celebrated protocols with the NHS to
receive patient referrals from primary care, but due to their small number this has had
almost no expression in total entries onto the waiting list for surgery.
In 2013, the management unit of SIGIC is planning to integrate private hospitals
outside the SIGIC into a voluntary regime where they will be monitored and subjected to
the benchmarking of hospitals in elective surgery and published online and in official
releases. In this way, the SIGIC will be able to collect data about national demand for
elective surgery, including the private sector.
Figure 13.5 shows improvements in the quality of healthcare access made by the SIGIC.
Figure 13.3. Evolution of scheduled surgical production in Portugal, 2006 to 2011
Source: Based on data provided by SIGIC (SIGLIC), the Integrated Management System of the Waiting List for Surgery.1 2 http://dx.doi.org/10.1787/888932754312
600 000
500 000
400 000
300 000
200 000
100 000
02006 2007 2008 2009 2010 2011
345 321403 061
455 503 475 293 482 928 504 014
Number of surgical episodes
WAITING TIME POLICIES IN THE HEALTH SECTOR: WHAT WORKS? © OECD 2013 253

II.13. PORTUGAL
The proportion of patients waiting for their surgery longer than the target set by the SIGIC
according to the clinical priority and type of pathology decreased from 54% to 15% in the last
seven years, which proves an improvement in the quality of access to surgical care in Portugal.
The trends depicted above can be made more precise by the use of regression analysis.
Using completed episodes initiated in the years 2006 to 2010 and already completed (we
exclude episodes that started in 2011, as there will be an increasing number of patients put
on the waiting list who are not yet treated, especially as we approach the end of the year),4
clear negative time trends exist in both the median and mean waiting times. This holds
true under different conditions. Figure 13.6 shows the values for the mean and median
waiting times per month.
The more pronounced fall in the mean waiting times, compared with the median
waiting times, suggests that long waits have also been addressed to a significant extent
during this period.5
Figure 13.4. Evolution of new entries to the national waiting list for surgeryin Portugal, 2006 to 2011
Source: Based on data provided by SIGIC (SIGLIC), the Integrated Management System of the Waiting List for Surgery.1 2 http://dx.doi.org/10.1787/888932754331
Figure 13.5. Evolution of the percentage of the national waiting list for surgerywith times above those set by the SIGIC, Portugal, 2005 to 2011
Source: Based on data provided by SIGIC (SIGLIC), the Integrated Management System of the Waiting List for Surgery.1 2 http://dx.doi.org/10.1787/888932754350
700 000
600 000
500 000
400 000
300 000
200 000
100 000
02006 2007 2008 2009 2010 2011
426 949497 813 522 470
560 695 565 971 600 328
New entries
60
50
40
30
20
10
02005 2006 2007 2008 2009 2010 2011
0.54
0.46
0.2750.228
0.1940.147 0.151
% waiting list time above
WAITING TIME POLICIES IN THE HEALTH SECTOR: WHAT WORKS? © OECD 2013254
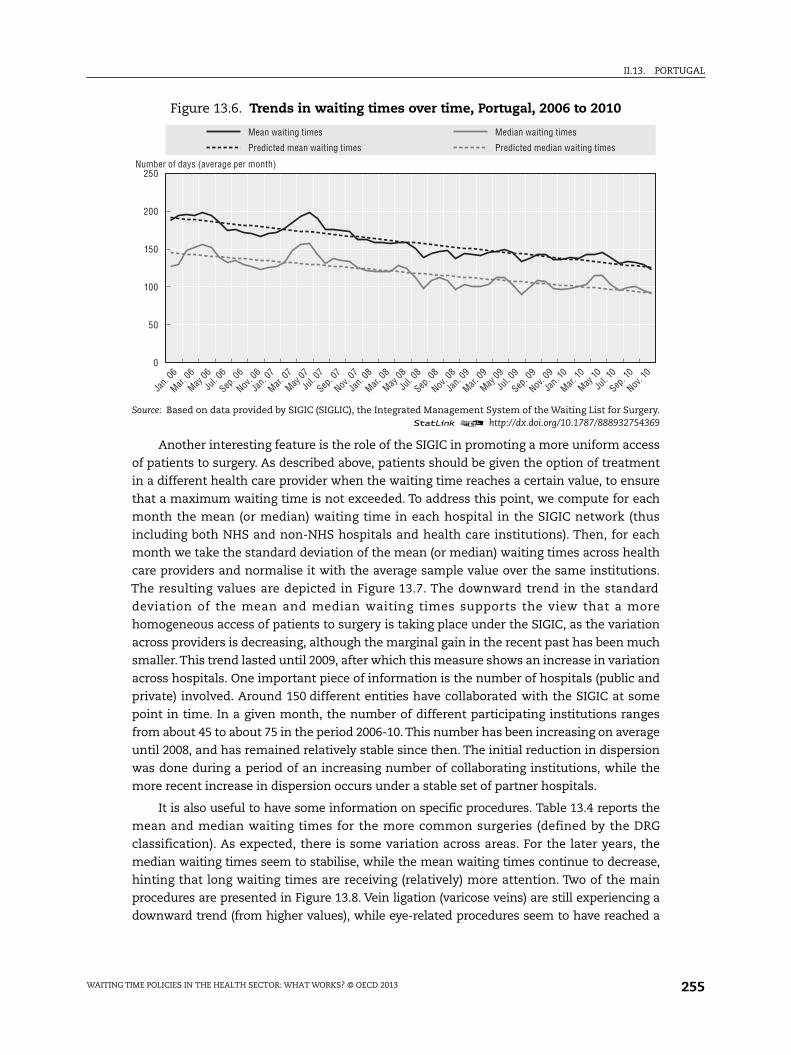
II.13. PORTUGAL
Another interesting feature is the role of the SIGIC in promoting a more uniform access
of patients to surgery. As described above, patients should be given the option of treatment
in a different health care provider when the waiting time reaches a certain value, to ensure
that a maximum waiting time is not exceeded. To address this point, we compute for each
month the mean (or median) waiting time in each hospital in the SIGIC network (thus
including both NHS and non-NHS hospitals and health care institutions). Then, for each
month we take the standard deviation of the mean (or median) waiting times across health
care providers and normalise it with the average sample value over the same institutions.
The resulting values are depicted in Figure 13.7. The downward trend in the standard
deviation of the mean and median waiting times supports the view that a more
homogeneous access of patients to surgery is taking place under the SIGIC, as the variation
across providers is decreasing, although the marginal gain in the recent past has been much
smaller. This trend lasted until 2009, after which this measure shows an increase in variation
across hospitals. One important piece of information is the number of hospitals (public and
private) involved. Around 150 different entities have collaborated with the SIGIC at some
point in time. In a given month, the number of different participating institutions ranges
from about 45 to about 75 in the period 2006-10. This number has been increasing on average
until 2008, and has remained relatively stable since then. The initial reduction in dispersion
was done during a period of an increasing number of collaborating institutions, while the
more recent increase in dispersion occurs under a stable set of partner hospitals.
It is also useful to have some information on specific procedures. Table 13.4 reports the
mean and median waiting times for the more common surgeries (defined by the DRG
classification). As expected, there is some variation across areas. For the later years, the
median waiting times seem to stabilise, while the mean waiting times continue to decrease,
hinting that long waiting times are receiving (relatively) more attention. Two of the main
procedures are presented in Figure 13.8. Vein ligation (varicose veins) are still experiencing a
downward trend (from higher values), while eye-related procedures seem to have reached a
Figure 13.6. Trends in waiting times over time, Portugal, 2006 to 2010
Source: Based on data provided by SIGIC (SIGLIC), the Integrated Management System of the Waiting List for Surgery.1 2 http://dx.doi.org/10.1787/888932754369
250
200
150
100
50
0
Predicted mean waiting times
Mean waiting times
Predicted median waiting times
Median waiting times
Jan.
06
Mar.
06
May
06
Jul. 0
6
Sep
. 06
Nov
. 06
Jan.
07
Mar.
07
May
07
Jul. 0
7
Sep
. 07
Nov
. 07
Jan.
08
Mar.
08
May
08
Jul. 0
8
Sep
. 08
Nov
. 08
Jan.
09
Mar.
09
May
09
Jul. 0
9
Sep
. 09
Nov
. 09
Jan.
10
Mar.
10
May
10
Jul. 1
0
Sep
. 10
Nov
. 10
Number of days (average per month)
WAITING TIME POLICIES IN THE HEALTH SECTOR: WHAT WORKS? © OECD 2013 255

II.13. PORTUGAL
level around which fluctuations occur. Due to the lack of availability of information, we cannot
extend the analysis to the period prior to a complete roll-out of the SIGIC in the country.
Another interesting indicator is the percentage of cancelations over time, whatever
the reason for cancellation. A decreasing pattern will be a signal of the increasing ability of
the system to solve patients’ problems, taking into account that patients may have
resorted to other choices, may have died while waiting or may have been removed from the
list for any other reason. Figure 13.9 shows that the percentage of cancelations has been
decreasing over time for each monthly cohort of patients. This figure also reports the
percentage of patients waiting more than 30 days, which is slightly increasing.
Figure 13.7. Evolution of the standard deviation of waiting times across providers,Portugal, 2006 to 2010
Normalised by the mean
Source: Based on data provided by SIGIC (SIGLIC), the Integrated Management System of the Waiting List for Surgery.1 2 http://dx.doi.org/10.1787/888932754388
Table 13.4. Waiting times in days, Portugal
Hip procedures Hernia Vein ligationCarpal tunnel
releaseEye procedures Cholecystectomy CABG
(DRG 209, 210,211)
(DRG 160, 162) (DRG 119) (DRG 6) (DRG 39)(DRG 195, 196,198, 493, 494)
(DRG 107, 109)
Mean Median Mean Median Mean Median Mean Median Mean Median Mean Median Mean Median
2006 137.53 83 153.03 101 253.78 257 122.28 88 196.01 171 142.61 99 19.32 2
2007 147.97 108 140.43 89 232.25 236 197.84 69 172.19 142 142.36 92 24.53 2
2008 126.50 90 117.29 77 201.74 192 97.32 63 101.49 75 129.96 86 42.50 6
2009 124.73 72 119.54 78 182.72 158 94.29 62 79.14 60 127.30 87 27.16 3
2010 138.99 105 116.22 85 167.47 154 98.56 67 71.86 55 115.46 79 25.53 2
Source: Authors computations based on data from SIGIC, the Integrated Management System of the Waiting Listfor Surgery.
1 2 http://dx.doi.org/10.1787/888932755300
1.2
1.0
0.8
0.6
0.2
0.4
0
Predicted standard deviation median
Standard deviation of median
Predicted standard deviation mean
Standard deviation of mean
Jan.
06
Mar.
06
May
06
Jul. 0
6
Sep
. 06
Nov
. 06
Jan.
07
Mar.
07
May
07
Jul. 0
7
Sep
. 07
Nov
. 07
Jan.
08
Mar.
08
May
08
Jul. 0
8
Sep
. 08
Nov
. 08
Jan.
09
Mar.
09
May
09
Jul. 0
9
Sep
. 09
Nov
. 09
Jan.
10
Mar.
10
May
10
Jul. 1
0
Sep
. 10
Nov
. 10
Standard deviations across entities
WAITING TIME POLICIES IN THE HEALTH SECTOR: WHAT WORKS? © OECD 2013256
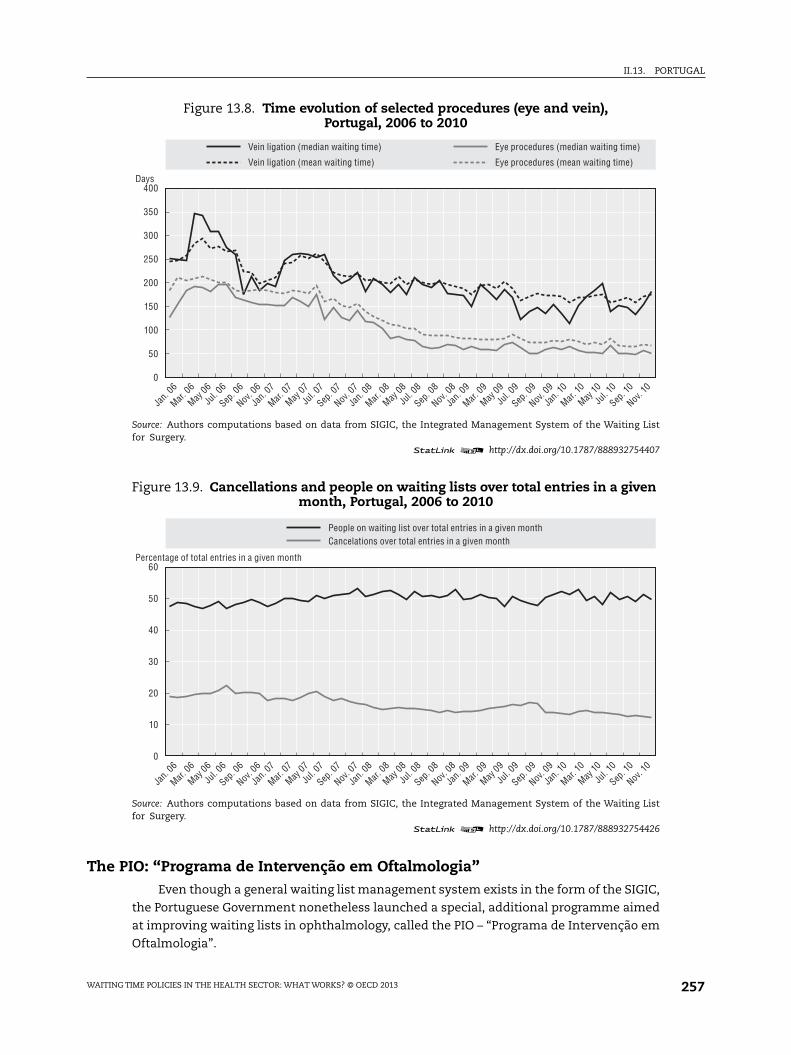
II.13. PORTUGAL
The PIO: “Programa de Intervenção em Oftalmologia”Even though a general waiting list management system exists in the form of the SIGIC,
the Portuguese Government nonetheless launched a special, additional programme aimed
at improving waiting lists in ophthalmology, called the PIO – “Programa de Intervenção em
Oftalmologia”.
Figure 13.8. Time evolution of selected procedures (eye and vein),Portugal, 2006 to 2010
Source: Authors computations based on data from SIGIC, the Integrated Management System of the Waiting Listfor Surgery.
1 2 http://dx.doi.org/10.1787/888932754407
Figure 13.9. Cancellations and people on waiting lists over total entries in a givenmonth, Portugal, 2006 to 2010
Source: Authors computations based on data from SIGIC, the Integrated Management System of the Waiting Listfor Surgery.
1 2 http://dx.doi.org/10.1787/888932754426
400
250
350
200
300
150
50
100
0
Vein ligation (mean waiting time)
Vein ligation (median waiting time)
Eye procedures (mean waiting time)
Eye procedures (median waiting time)
Jan.
06
Mar.
06
May
06
Jul. 0
6
Sep
. 06
Nov
. 06
Jan.
07
Mar.
07
May
07
Jul. 0
7
Sep
. 07
Nov
. 07
Jan.
08
Mar.
08
May
08
Jul. 0
8
Sep
. 08
Nov
. 08
Jan.
09
Mar.
09
May
09
Jul. 0
9
Sep
. 09
Nov
. 09
Jan.
10
Mar.
10
May
10
Jul. 1
0
Sep
. 10
Nov
. 10
Days
60
30
50
20
40
10
0
People on waiting list over total entries in a given monthCancelations over total entries in a given month
Jan.
06
Mar.
06
May
06
Jul. 0
6
Sep
. 06
Nov
. 06
Jan.
07
Mar.
07
May
07
Jul. 0
7
Sep
. 07
Nov
. 07
Jan.
08
Mar.
08
May
08
Jul. 0
8
Sep
. 08
Nov
. 08
Jan.
09
Mar.
09
May
09
Jul. 0
9
Sep
. 09
Nov
. 09
Jan.
10
Mar.
10
May
10
Jul. 1
0
Sep
. 10
Nov
. 10
Percentage of total entries in a given month
WAITING TIME POLICIES IN THE HEALTH SECTOR: WHAT WORKS? © OECD 2013 257
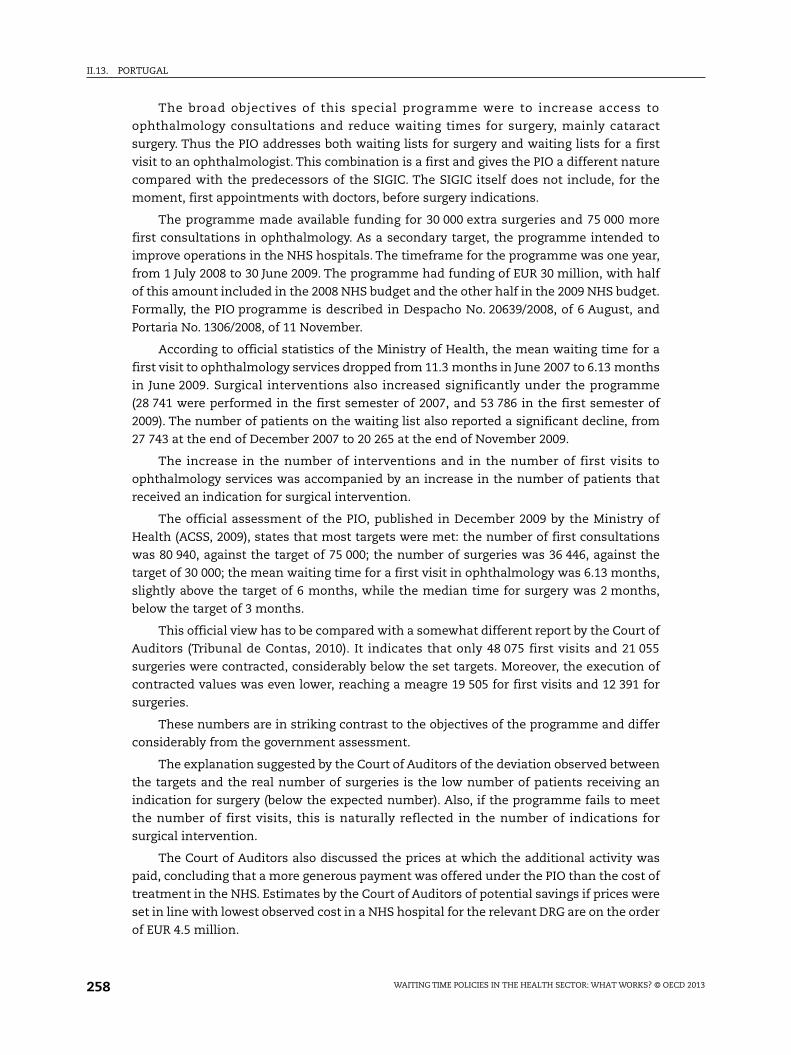
II.13. PORTUGAL
The broad objectives of this special programme were to increase access to
ophthalmology consultations and reduce waiting times for surgery, mainly cataract
surgery. Thus the PIO addresses both waiting lists for surgery and waiting lists for a first
visit to an ophthalmologist. This combination is a first and gives the PIO a different nature
compared with the predecessors of the SIGIC. The SIGIC itself does not include, for the
moment, first appointments with doctors, before surgery indications.
The programme made available funding for 30 000 extra surgeries and 75 000 more
first consultations in ophthalmology. As a secondary target, the programme intended to
improve operations in the NHS hospitals. The timeframe for the programme was one year,
from 1 July 2008 to 30 June 2009. The programme had funding of EUR 30 million, with half
of this amount included in the 2008 NHS budget and the other half in the 2009 NHS budget.
Formally, the PIO programme is described in Despacho No. 20639/2008, of 6 August, and
Portaria No. 1306/2008, of 11 November.
According to official statistics of the Ministry of Health, the mean waiting time for a
first visit to ophthalmology services dropped from 11.3 months in June 2007 to 6.13 months
in June 2009. Surgical interventions also increased significantly under the programme
(28 741 were performed in the first semester of 2007, and 53 786 in the first semester of
2009). The number of patients on the waiting list also reported a significant decline, from
27 743 at the end of December 2007 to 20 265 at the end of November 2009.
The increase in the number of interventions and in the number of first visits to
ophthalmology services was accompanied by an increase in the number of patients that
received an indication for surgical intervention.
The official assessment of the PIO, published in December 2009 by the Ministry of
Health (ACSS, 2009), states that most targets were met: the number of first consultations
was 80 940, against the target of 75 000; the number of surgeries was 36 446, against the
target of 30 000; the mean waiting time for a first visit in ophthalmology was 6.13 months,
slightly above the target of 6 months, while the median time for surgery was 2 months,
below the target of 3 months.
This official view has to be compared with a somewhat different report by the Court of
Auditors (Tribunal de Contas, 2010). It indicates that only 48 075 first visits and 21 055
surgeries were contracted, considerably below the set targets. Moreover, the execution of
contracted values was even lower, reaching a meagre 19 505 for first visits and 12 391 for
surgeries.
These numbers are in striking contrast to the objectives of the programme and differ
considerably from the government assessment.
The explanation suggested by the Court of Auditors of the deviation observed between
the targets and the real number of surgeries is the low number of patients receiving an
indication for surgery (below the expected number). Also, if the programme fails to meet
the number of first visits, this is naturally reflected in the number of indications for
surgical intervention.
The Court of Auditors also discussed the prices at which the additional activity was
paid, concluding that a more generous payment was offered under the PIO than the cost of
treatment in the NHS. Estimates by the Court of Auditors of potential savings if prices were
set in line with lowest observed cost in a NHS hospital for the relevant DRG are on the order
of EUR 4.5 million.
WAITING TIME POLICIES IN THE HEALTH SECTOR: WHAT WORKS? © OECD 2013258

II.13. PORTUGAL
The assessment by the Court of Auditors coincides with the official assessment of
gains in waiting times: from December 2007 to December 2009, the Court of Auditors
indicates a reduction in median waiting times for surgery from 3.67 months to
1.93 months.
One of the second-order, but long-term, objectives of this programme was to induce
greater efficiency in the normal operations of NHS hospitals. However, the changes
induced by the PIO seem to be transitory, not permanent. Although waiting times and the
numbers on the waiting list decreased under the PIO, once it was over their values resumed
previous levels.
Cataracts, a large group within ophthalmology, have shown a more permanent
decrease in waiting times, though, despite some increase in consultations and surgeries
that remained even after the end of the PIO programme.
ConclusionsFor a long time Portugal faced a problem of excessive waiting times for elective
surgery. Initial attempts to solve the problem followed a traditional approach of
temporarily increasing supply capacity. Special government programmes provided more
funding to increase hospital activity levels. At the end of each programme, the waiting lists
were usually larger than at the start. No information was widely available on waiting times
for surgery. The extra funding provided to NHS hospitals and to private hospitals under
contract did not succeed in achieving efficiency gains to curb the waiting lists and waiting
times. They may have actually contributed to lower efficiency, as managerial efforts were
diverted from current operations to the special waiting-list recovery programmes. A less
demanding clinical criterion to receive a surgery indication may also have existed.
In a general context of global budgets for hospital funding, the initial programmes to
address waiting lists looked like activity-based payments. They were unable to produce a
solution to the waiting list and waiting time problem, leading to the search for a different
approach. The creation of the system to centrally manage waiting lists and waiting times
was the new solution; roll-out started in 2004, and covered the entire country by the end of
2005 (excluding the Autonomous Regions of Azores and Madeira, which have their own
regional health systems).
Table 13.5. The effect of the Intervention Programme in Ophthalmology (PIO)in Portugal
Ophthalmology Cataracts
Median waiting time(months)
Patients in the list(number)
Median waiting time(months)
Patients in the list(number)
December 2007 3.67 27 743 n.a. n.a.
June 2008 2.90 25 813 2.90 21 324
December 2008 2.23 25 291 2.17 20 634
June 2009 1.90 23 014 1.87 18 533
December 2009 1.93 20 425 1.93 15 784
June 2010 2.88 19 465 1.90 14 502
Source: Tribunal de Contas (2010), “Auditoria de Resultados ao Programa de Intervenção em Oftalmologia”, RelatórioNo. 48/2010, Processo No. 49/2009-Audit, Vol. I.
1 2 http://dx.doi.org/10.1787/888932755319
WAITING TIME POLICIES IN THE HEALTH SECTOR: WHAT WORKS? © OECD 2013 259

II.13. PORTUGAL
The backbone of the waiting list management system, the SIGIC, is its IT platform, the
SIGLIC, though its role extends beyond providing information. As maximum waiting times
were defined and transfers to other hospitals become a possibility when 75% of the
maximum waiting time is reached, management of waiting times becomes a central
feature of the system. In addition, the SIGIC was centrally designed and directly and
routinely collects the required information from hospital IT systems. This provides timely
and reliable information for handling the transfer of patients and billing and payment.
There is an element of activity-related payment in the management of waiting times, as
both private and NHS hospitals can receive patients who have a transfer voucher. The
additional activity intra moenia to the NHS represents about 1% of total funding, and private
hospitals about 5%.
Since 2005, waiting times have been decreasing considerably, and total surgery activity
has grown overall. Thus, activity levels increased after the introduction of the SIGIC.
Certainly not all of this can be attributed to the SIGIC. This new system had other relevant
effects. It changed the public discussion from the size of the waiting lists to waiting times.
The focus shifted from individual hospitals to the NHS in terms of responsibility for
treating patients. At the level of patient information and patient rights, the SIGIC allows
the patient on the waiting list to obtain an estimate of the length of their wait for surgery.
The patient can consult this estimate, which is updated regularly, through an internet-
based interface.
The increased activity levels in surgery are mostly funded through hospitals’ global
budgets, on top of which the intra moenia payments accrue to the operating teams. The
centralisation of information, the definition of maximum guaranteed waiting times, the
definition of clear patient transfer rules to meet these targets, even if at no financial cost
to the original hospital (targets without “terror”), seem to have produced a response from
the NHS hospitals, which led to a decrease in waiting times. Although resorting to activity-
based payments within the NHS and to private hospitals is possible and occurs, these
represent a small part of total activity and funding.
Notes
1. Data cover all categories of GPs and specialists working in the National Health Service (Chief ofService, Graduated Assistant and Assistant), including both those with “exclusive” schedules(which do not allow private activity) and those with “non-exclusive” schedules (which do allowprivate activity). GPs are considered specialist Family Doctors, and they account for less than one-third of the total practicing physicians in the National Health Service. Data do not include anyincome from private practice.
2. For a general view of waiting lists in several OECD countries, see Siciliani and Hurst (2004, 2005).
3. ASA risk is the ASA physical status classification system of the American Society ofAnesthesiologists (ASA) that adopted the six-category physical status classification system whichare:
● A normal healthy patient.
● A patient with mild systemic disease.
● A patient with severe systemic disease.
● A patient with severe systemic disease that is a constant threat to life.
● A moribund patient who is not expected to survive without the operation.
● A declared brain-dead patient whose organs are being removed for donor purposes
WAITING TIME POLICIES IN THE HEALTH SECTOR: WHAT WORKS? © OECD 2013260

II.13. PORTUGAL
4. Episodes completed in 2011 are included as long as patients have been put onto the waiting listbefore January 2011. Episodes that started before 2011 and are not yet completed are not included.Only full spell episodes are considered in this picture. Only episodes with more than 30 days havebeen included in the analysis.
5. This effect is even more pronounced if all episodes, including those with less than 31 days ofwaiting time, are considered (not reported, available upon request from the authors).
References
ACSS (2009), “Programa de Intervenção em Oftalmologia – Avaliação 2008/2009”, Ministry of Health.
Barros, P. (2012), “Health Policy Reform in Tough Times: The Case of Portugal”, Health Policy, Vol. 106,pp. 17-22.
Barros, P. and P. Olivella (2001), “Managed Health Care: Incentive Theory and Empirical Evidence”,Coordinación e incentivos en sanidad, Asociación de Economia de La Salud, pp. 155-170.
Barros, P., S. Machado and J. Simões (2011), “Portugal: Health System Review”, Health Systems inTransition, Vol. 13, No. 4, pp. 1-156.
Gomes, P. and L. Lapão (2009), “The Role of a Nation-wide Information System in Improving the Accessto Surgery in Portugal”, in K.P. Adlassnig, B. Blobel, J. Manta and I. Masic (eds.), Medical Informationin a United and Health Europe, pp. 71-75.
OECD (2012), OECD Health Data 2012, OECD Publishing, Paris, http://dx.doi.org/10.1787/health-data-en.
Reis, A. (2011), “As listas de espera para cirurgia nos últimos dez anos: Portugal e o SIGIC”, Mestradoem Economia Industrial, Faculdade de Economia da Universidade de Coimbra.
Siciliani, L. and J. Hurst (2005a), “Explaining Waiting-time Variations for Elective Surgery across OECDCountries”, OECD Economic Studies, Vol. 38, No. 1, pp. 95-123, http://dx.doi.org/10.1787/eco_studies-v2004-art5-en.
Siciliani, L. and J. Hurst (2005b), “Tackling Excessive Waiting Times for Elective Surgery: A ComparativeAnalysis of Policies in 12 OECD Countries”, Health Policy, Vol. 72, pp. 201-215.
Tribunal de Contas (2005), “Auditoria ao Programa Especial de Combate às Listas de Espera Cirúrgicas– PECLEC”, Relatório No. 15/05, Processo No. 01/04-AUDIT.
Tribunal de Contas (2007), “Auditoria do Acesso aos Cuidados de Saúde do SNS – Sistema Integrado deGestão de Inscritos para Cirurgia – SIGIC”, Relatório No. 25/07 – 2ªS, Processo No. 50/05-AUDIT.
Tribunal de Contas (2010), “Auditoria de Resultados ao Programa de Intervenção em Oftalmologia”,Relatório No. 48/2010, Processo No. 49/2009-Audit, Vol. I.
WAITING TIME POLICIES IN THE HEALTH SECTOR: WHAT WORKS? © OECD 2013 261


Waiting Time Policies in the Health Sector
What Works?
© OECD 2013
PART II
Chapter 14
Spain
by
Manuel García-Goñi,
Departamento de Economía Aplicada II, Universidad Complutense de Madrid
and
Joan Costa-Font,
Departments of Social Policy and Centre for Economic Performance (CEP) and LSE Health,
London School of Economics and Political Science
This chapter first reviews the criteria for managing health care waiting lists inSpain and the country’s experience with them. We then consider challenges to themanagement of health care delivery, and suggest some key issues for policydiscussion and the notion of what a waiting list actually is. Data is provided toascertain the scale of the waiting lists and times, including for comparativepurposes. The chapter critically evaluates the policies in place and contains somesuggestions for policy reform.
263

II.14. SPAIN
IntroductionThe emergence of waiting lists is an inevitable consequence of time constraints in the
production of health services. It reflects the existence of certain monetary barriers to entry
combined with limited incentives to swiftly deliver health care services on time. Hence,
waiting lists develop when the supply of health care is insufficient to meet the demand
(Hadorn et al., 2000). Generally, it is possible to identify two different types of waiting list:
those for the initial visit, when the patient has not yet been evaluated; and those for visits to
the corresponding diagnostic (tests) or therapeutic service (radiotherapy, surgery, etc.) once
the physician has issued a patient diagnosis. In Spain, it is the latter that is most commonly
termed a “waiting list” (Insalud, 1998). However, there are important disagreements about
how waiting lists are computed. In the early 2000s, a debate in Spain centered on using the
concept “average delay” as opposed to “average waiting time”, as the latter was heavily
politicised to hide the development of waiting lists at a time of significant health care reform.
The difference between the notions dwells in whether to include the time waited to access
specialist care.1
Alongside waiting lists, the meaning of the concept of a waiting time to access health
care is considered, along with ways to measure this. Waiting times are commonly defined
as the time (the number of days, weeks or months) that elapses from when the patient is
placed on the list until he or she receives the service indicated. Waiting time is frequently
more difficult to calculate, as it is more complex than simply the volume of people in the
queue. In addition, it is harder to explain insofar it is determined by a complex series of
factors, including individual characteristics of patients, the supply of services and the
specific disease (Peiró and Ridao, 2004).
Similarly, in the absence of significant prices that act as demand moderators, the
priority given to patients is based on waiting times, which take account of the severity of
patients’ conditions, their disabilities and the risk of premature death, as well as an
evaluation of the expected costs and benefits of the health service provision, given a
certain level of urgency (and need) as well as other socioeconomic and clinical criteria.
Waiting lists (and times) develop when at some point in time the demand (and need
and use) of health services exceeds the supply, and time is used as an equilibrium device.
As a consequence, any solution to this concern should address the need for the supply and
organisation of health service provision to correspond to demand. Furthermore, the
“absence of transparent information on waiting lists counterbalances tight NHS budgets
(particularly in the last decade), with the former playing the role of “implicit prices’”
(Lopez-Casasnovas et al., 2005).
This chapter will proceed as follows: the organisation of the Spanish health system is
first described; the policy challenges of managing waiting lists and waiting times for both
surgical procedures and visits to specialists are then examined using the latest available
information for Spain; and finally the various policy measures that different regions have
implemented in the last decades to reduce waiting lists are outlined.
WAITING TIME POLICIES IN THE HEALTH SECTOR: WHAT WORKS? © OECD 2013264

II.14. SPAIN
Organisation of the Spanish health systemThe analysis of the adequacy of supply to health service needs must necessarily take
into account the organisation and delivery of health services provision, and thus, the health
system. The Spanish National Health System (NHS) is publicly funded through general taxes
(excluding civil servants’ mutual funds). This basically means that it provides universal
coverage, which translates into a package of benefits to all inhabitants independently of their
ability to pay. One of the main characteristics of the Spanish NHS is that it is free of charge at
the point of delivery, with the exception of pharmaceuticals prescribed to people under age
65, which require a 40% co-payment, with certain exceptions (García-Armesto et al., 2010).
One direct consequence of this characteristic is that demand for health services exists
whenever the marginal benefit of the provision is positive, which, depending on the
elasticity of the demand for each specific service, is (much) greater than the efficient
amount. The latter results in a potential increase in the volume of demand for health visits,
and thus, waiting lists and times. Hence, there are no demand-side policies implemented in
order to reduce waiting lists in Spain. As a consequence, the challenge of waiting lists in
Spain has always been addressed through the implementation of supply-side policies.
Another major feature of the Spanish NHS is its regional structure, which is a result of
a process of devolution, in which 17 regions, called Autonomous Communities (ACs), have
the power to establish their own health plans and to organise their own health services,
with responsibility for the funding, organisation and delivery of health services within
their territory. The Spanish Ministry of Health and Social Policy and Equality (MSPSI)
therefore has limited jurisdiction, with its main purpose being to ensure national
co-ordination and cohesion (García-Armesto et al., 2010; García-Goñi et al., 2012).
Importantly, the Autonomous Communities are also responsible for setting the health
budgets and for the system of evaluating the delivery of their health services. As waiting
lists and times are very visible measures of patients’ satisfaction, it is important to
understand the way in which different regions have managed this concern. Given the
pressure to reduce waiting lists that existed in the 1990s, regional decentralisation brought
about a significant reduction in the length of stay in Andalusia (33%), Basque Country and
Catalonia (23%) (Lopez-Casasnovas et al., 2005).
Hospitals
In 2010, there were 324 publicly owned hospitals, 133 privately owned not-for-profit
hospitals and 302 privately owned for-profit hospitals. In 2010, 67.3% of all hospital beds
were in publicly owned hospitals, 13.2% were in privately owned not-for-profit hospitals and
19.3% were in privately owned for-profit hospitals (OECD, 2012). The regions provide publicly
funded health services under the Spanish NHS, mainly through publicly owned hospitals but
also through private (profit or non-profit) hospitals to which NHS services are contracted out.
In recent decades, around 15%-20% of public health expenditure has been used to contract
out services to private providers. Around 40% of the costs of all patients discharged from
privately owned hospitals in Spain are funded by the NHS (García-Armesto, 2010).
Hospital remuneration
Among the publicly funded hospitals, publicly owned hospitals are in general
remunerated with a global budget. Hospital budgets are set prospectively, attaching
regional hospital objectives to financing, and making adjustments to financing based on a
WAITING TIME POLICIES IN THE HEALTH SECTOR: WHAT WORKS? © OECD 2013 265

II.14. SPAIN
number of indicators. The main contracting criteria for the determination of the budget at
hospital level are past expenditure, DRG-like activity measures and the case mix of the
hospital (García-Armesto, 2010). Since the late 1990s, hospitals have been allowed to raise
income by providing services to people who are not covered by the national health service,
which forms a minor source of revenue.
Specialist remuneration
Specialists working in publicly funded hospitals are salaried workers and are not
allowed to treat private out-patients or to operate on private patients within the same
public hospital. However, specialists working in publicly funded hospitals are allowed to
work in privately funded hospitals too. Finally, specialists working in publicly funded
hospitals who do not also work in privately funded hospitals have a greater remuneration
from the publicly funded hospital than specialists who also work in privately funded
hospitals. The estimated income of salaried specialists per average national wage was 2.7
in 2010 (OECD, 2012).
Co-payments
The Spanish NHS is free of charge at the point of delivery, with the exception of the
prescription of pharmaceuticals. A recently passed regulation (Real Decreto Ley 16/2012, on
20 April 2012) increased the co-payment levels for pharmaceuticals prescribed to patients
under 65 based on three different ranges of income, and also introduced some copayment
for pharmaceuticals prescribed for retirees (previously exempted), with a ceiling that was
also based on three income ranges. Some patients can be exempted from prescription
charges under certain conditions. Dental and optical services and over-the-counter
medication are subject to charges and are not fully covered under the NHS.
Primary care
General practitioners, the usual first point of contact for NHS patients, act as gate-
keepers and make specialist referrals. Patients receiving specialist care return to general
practitioners for follow-up treatment upon discharge from any specialist treatment or care.
In 2010, there were 0.75 GPs per 1 000 population. The estimated income of salaried GPs
was 2.51 per average national wage in 2010 (OECD, 2012).
Surgical activity
For all the surgical procedures under ICD-9-CM, rates have increased between 2000
and 2010. The greatest increase was attributable to percutaneous coronary interventions
(PTCA and stenting) (+221%). Knee replacement also experienced a considerable increase
(+115.7%). Spain has also seen a move from in-patient to day-case surgery over the period
for a number of procedures.
Health expenditure
Total health spending accounted for 9.6% of GDP in Spain in 2009, slightly higher than
the OECD average (9.5%). The recent recession led to a big rise in the health spending share
of GDP in Spain, as GDP began to fall sharply in the second half of 2008 and in 2009, while
health spending continued to increase, albeit at a slower pace in 2009. As a result, the
percentage of GDP devoted to health in Spain increased by over one percentage point
between 2007 and 2009, from 8.5% in 2007, to 9.0% in 2008 and 9.6% in 2009.
WAITING TIME POLICIES IN THE HEALTH SECTOR: WHAT WORKS? © OECD 2013266

II.14. SPAIN
Spain ranks slightly below the OECD average in health spending per capita, with
spending of USD 3 076 in 2009 (adjusted for purchasing power parity), compared with an
OECD average of USD 3 268 in 2010. Health spending in Spain grew, in real terms, by an
average of 5.6% per year between 2000 and 2009, slightly faster than the OECD average of
4.7%. In Spain, 73.6% of health spending was funded by public sources in 2009, slightly
more than the OECD average of 72.2%.
Physicians
There are more physicians per capita in Spain than in most other OECD countries. The
number of practising physicians in Spain increased from 3.3 (per 1 000 population) in 2000
to 4.1 in 2011, which is well above the OECD average of 3.1 (OECD, 2012).
Ageing and life expectancy
The percentage of the population aged 65 and over has increased from 16.8 in 2000 to 17.6
in 2011. Life expectancy has increased from 79.4 years in 2000 to 82.2 in 2010 (OECD, 2012).
Waiting lists in Spain: the state of the artThe Ministry of Health, Social Policy and Equality (2010) in Spain provides information on
the evolution of surgical waiting lists (Table 14.2) and the evolution of waiting lists for visits to
specialists (external visits, Table 14.3). From Table 14.1, we learn that the exit of patients from
the surgical waiting lists upon receipt of the surgical procedure parallels the entry onto the
waiting list, that is, both supply and demand follow the same path. This finding is similar to
the argument discussed in the literature, for example in Blundell and Windmeijer (2000).
Table 14.1. Surgical procedures per 100 000 populationin Spain, 2000 and 2010
Surgical procedures by ICD-9-CM 2000 2010% change
in proceduresbetween 2000 and 2010
Cataract surgery:
In-patient 115.5 23.8 -79.40
Day-case 338.5 (2004) 552.7 63.30
Tonsillectomy with or without adenoidectomy:
In-patient 28.1 43.9 56.20
Day-case 8.8 (2004) 15.9 80.70
Percutaneous coronary interventions (PTCA and stenting): in-patient 42.3 135.8 221.00
Coronary bypass: in-patient 17.3 17.4 0.57
Appendectomy: in-patient 105.3 110.9 5.30
Cholecystectomy:
In-patient 104.4 154.6 48.10
Day case 1.9 (2004) 6.5 242.10
Laparoscopic cholecystectomy:
In-patient 54.7 121.0 121.20
Day-case 1.8 (2004) 6.3 250.0
Inguinal and femoral hernia:
In-patient 135.4 120.7 -10.90
Day-case 50.4 (2004) 71.7 42.30
Hip replacement: in-patient 72.2 97.0 34.30
Knee replacement: in-patient 48.4 104.4 115.70
Source: OECD (2012), OECD Health Data 2012, OECD Publishing, Paris, http://dx.doi.org/10.1787/health-data-en.1 2 http://dx.doi.org/10.1787/888932755338
WAITING TIME POLICIES IN THE HEALTH SECTOR: WHAT WORKS? © OECD 2013 267

II.14. SPAIN
The way waiting times develop can give rise to two different effects. On the one hand, a
change in demand is followed by a change in supply so that there is a process of adaptation
– organisations get accustomed to running their health services with waiting times, as
appears to be the case in Spain. On the other hand, as more technology becomes available
there is a reduction in the time needed to treat patients, and more patients can be treated
with surgical procedures, so they become more common and standardised, and there is a
consequent increase in demand (Cutler and McClellan, 2001), which triggers longer waiting
lists.2However, it is more complex to identify this latter dynamic empirically.
It is important to note that this information has been gathered by most (but not all)
regions. Specifically, Table 14.2refers to 15 Spanish Autonomous Communities and the
autonomous cities of Ceuta and Melilla; and Table 14.3refers to 14 Spanish Autonomous
Communities plus Ceuta and Melilla (Agencia de Calidad del Sistema Nacional de Salud,
Ministry of Health, Social Policy and Equality, 2003 to 2009).
Hence, the first limitation that we find when we want to analyse the evolution of
waiting lists in Spain is the lack of complete information per Autonomous Community
(AC). As each AC has competences in health planning and service delivery, they do have
adequate information, although they do not always provide this information to the central
authority – the Spanish Ministry of Health and Social Policy and Equality. Furthermore,
each AC is supposed to compute its waiting lists in a homogeneous fashion (based on an
agreement signed at the Inter-territorial Council of the National Health System, composed
of representatives of all ACs and the Ministry), but it is difficult to check this. As a
consequence, the available information can be considered as a proxy to the challenge
posed by waiting lists, but it is not state of the art or definitive. Although most ACs do
provide the necessary information to the Ministry, there is no agreement to make that
information publicly available per Autonomous Community. It is thus not feasible to
evaluate the implementation of different policies. Some regional data is, however, available
on each Autonomous Community website, although there is no guarantee that this data is
homogeneous. As Peiró and Ridao (2004) note, the cause of this problem is the great
importance given to waiting lists and times in the health policy agenda. Waiting lists and
Table 14.2. Evolution of surgical waiting lists in Spain,2004 to 2010
2004 2005 2006 2007 2008 2009 2010
Waiting list intake 652 882 636 323 654 551 679 407 750 130 729 532 709 198
Ratio per 1 000 inhabitants 21.12 20.59 21.18 21.442 23.67 23.024 22.382
Waiting list out-take by procedure 518 338 508 842 556 596 593 149 637 319 613 376 606 776
Population 30 094 010 30 907 201 31 354 137 31 685 757 32 119 709 32 139 600 32 443 691
Source: Authors’ elaboration using data from the Spanish Ministry of Health, Social Policy and Equality.1 2 http://dx.doi.org/10.1787/888932755357
Table 14.3. Evolution of waiting lists for visits to specialist, Spain,2003 to 2009
Dec-06 Dec-07 Dec-08 Dec-09
Ratio of patients with a wait exceeding 60 days 29 34 37 37
Average waiting time 54 58 59 59
Number of patients in waiting list per 1 000 inhabitants 35 412 39 344 37 485 40 236
Source: Authors’ elaboration using data from the Spanish Ministry of Health, Social Policy and Equality.1 2 http://dx.doi.org/10.1787/888932755376
WAITING TIME POLICIES IN THE HEALTH SECTOR: WHAT WORKS? © OECD 2013268

II.14. SPAIN
times are very sensitive to the reaction of interest groups and public opinion, which
sometimes leads to policy measures that focus more on improving the image of the health
system than on solving the real problems.
In order to determine whether waiting times and the size of waiting lists is a greater
problem in Spain than in other countries, international data needs to be compared.
Unfortunately, no international comparison has been made since Hurst and
Siciliani (2003). In that work, the authors present the mean in-patient waiting times of
patients admitted by surgical procedure in different countries, using data from 2000. Spain
(Insalud population) showed average impatient waiting times for most procedures that
were consistently greater than in the Netherlands or Denmark, but consistently lower than
times for England, Finland and Australia.
In 1996, there was a Waiting Times for Surgery Interventions Reduction Plan adopted
by the Autonomous Communities that remained centralised. However, after 1999, waiting
lists began to increase considerably. In 2000, that increase was especially strong in the
“more than 6 months” list for heart surgery. Consequently, in 2000 a further Strategic Plan
was adopted, with the aim of fixing the waiting time in this speciality to a maximum of
30 days. In just 3 months the 6 months “heath surgery” list fell from 602 patients to 28.
With respect to the last decade, Table 14.4 presents the evolution of waiting times for
surgical procedures of different specialties from 2003 to 2009. In most of them, the average
waiting time has remained stable, with small increases or decreases, as the increase in
demand for surgery has been compensated with an increase in the supply of surgical
procedures. However, some specific services have dramatically decreased their waiting
times, such as maxillofacial surgery and dermatology. These services have benefited most
in terms of the increase in the general provision and structure of hospitals. Moreover, these
procedures have mostly been implemented in the last decade as ambulatory or day-case
surgery, while others such as ophthalmology had benefited from this innovation in the
1990s (García-Goñi, 2006).
Table 14.4. Evolution of waiting time for surgical procedures,Spain, 2003 to 2009
Days
Dec-03 Dec-04 Dec-05 Dec-06 Dec-07 Dec-08 Dec-09
General surgery and digestive 70 68 85 68 71 68 65
Gynecology surgery 68 66 62 61 68 66 59
Ophthalmology surgery 69 66 71 64 64 60 57
ORL 84 75 83 66 70 73 69
Traumatology surgery 87 84 92 83 86 88 75
Urology surgery 62 61 70 61 66 68 62
Heart surgery 66 69 76 73 81 70 66
Angiology surgery 93 84 80 69 74 70 69
Maxillofacial surgery 162 107 161 76 82 82 85
Pediatric surgery 77 74 87 72 79 80 76
Plastic surgery 83 102 112 82 90 95 91
Thoracic surgery 70 68 82 88 72 63 55
Neurosurgery 96 110 111 88 91 75 81
Dermatology surgery 113 49 53 46 45 45 44
TOTAL 77 74 83 70 74 71 67
Source: Authors’ elaboration using data from the Spanish Ministry of Health, Social Policy and Equality.1 2 http://dx.doi.org/10.1787/888932755395
WAITING TIME POLICIES IN THE HEALTH SECTOR: WHAT WORKS? © OECD 2013 269
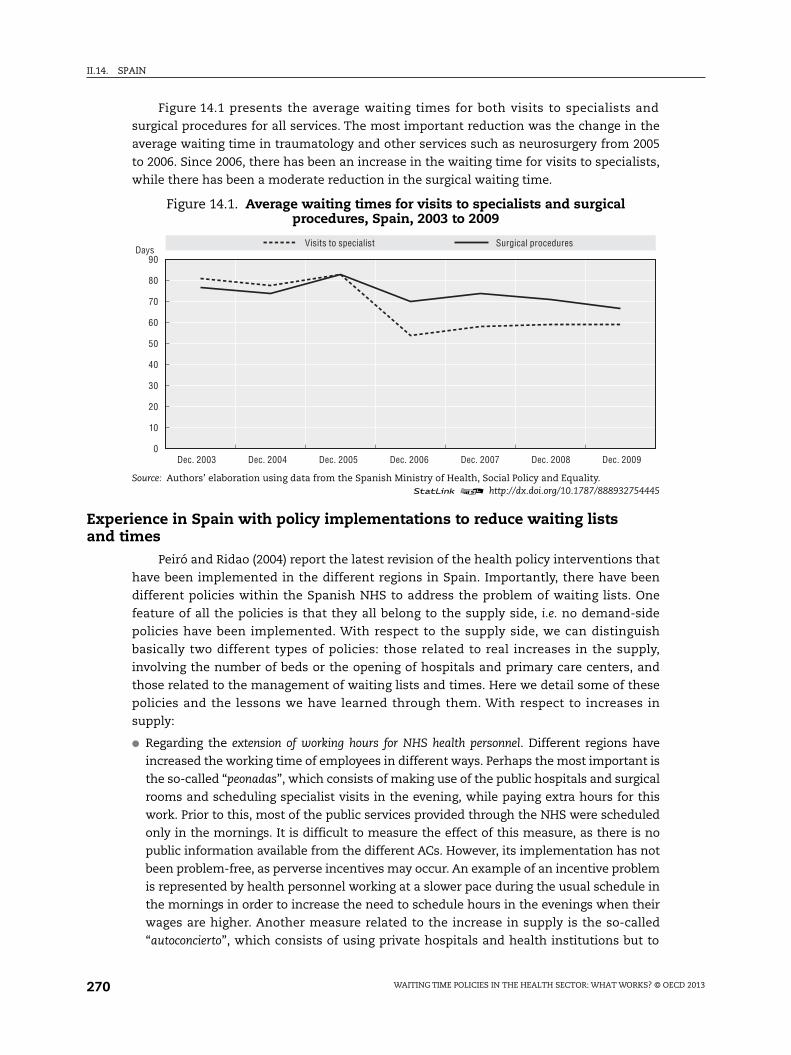
II.14. SPAIN
Figure 14.1 presents the average waiting times for both visits to specialists and
surgical procedures for all services. The most important reduction was the change in the
average waiting time in traumatology and other services such as neurosurgery from 2005
to 2006. Since 2006, there has been an increase in the waiting time for visits to specialists,
while there has been a moderate reduction in the surgical waiting time.
Experience in Spain with policy implementations to reduce waiting listsand times
Peiró and Ridao (2004) report the latest revision of the health policy interventions that
have been implemented in the different regions in Spain. Importantly, there have been
different policies within the Spanish NHS to address the problem of waiting lists. One
feature of all the policies is that they all belong to the supply side, i.e. no demand-side
policies have been implemented. With respect to the supply side, we can distinguish
basically two different types of policies: those related to real increases in the supply,
involving the number of beds or the opening of hospitals and primary care centers, and
those related to the management of waiting lists and times. Here we detail some of these
policies and the lessons we have learned through them. With respect to increases in
supply:
● Regarding the extension of working hours for NHS health personnel. Different regions have
increased the working time of employees in different ways. Perhaps the most important is
the so-called “peonadas”, which consists of making use of the public hospitals and surgical
rooms and scheduling specialist visits in the evening, while paying extra hours for this
work. Prior to this, most of the public services provided through the NHS were scheduled
only in the mornings. It is difficult to measure the effect of this measure, as there is no
public information available from the different ACs. However, its implementation has not
been problem-free, as perverse incentives may occur. An example of an incentive problem
is represented by health personnel working at a slower pace during the usual schedule in
the mornings in order to increase the need to schedule hours in the evenings when their
wages are higher. Another measure related to the increase in supply is the so-called
“autoconcierto”, which consists of using private hospitals and health institutions but to
Figure 14.1. Average waiting times for visits to specialists and surgicalprocedures, Spain, 2003 to 2009
Source: Authors’ elaboration using data from the Spanish Ministry of Health, Social Policy and Equality.1 2 http://dx.doi.org/10.1787/888932754445
90
80
70
60
50
40
30
20
10
0
Visits to specialist Surgical procedures
Dec. 2003 Dec. 2004 Dec. 2005 Dec. 2006 Dec. 2007 Dec. 2008 Dec. 2009
Days
WAITING TIME POLICIES IN THE HEALTH SECTOR: WHAT WORKS? © OECD 2013270

II.14. SPAIN
deliver public health services that are financed and provided by NHS personnel, which is
conveniently expanded to cover any additional demand. The latter has the advantage of
cutting the waiting lists, but the disadvantage of pushing up health care expenditures.
Finally, different regions have used “mobile health teams” that travel from one health
institution to another where they are most needed in order to reduce waiting lists.
● Different regions have included in their health policy programmes commitments on
expected waiting times (e.g. in 2005 Galicia passed a decree that fixed the maximum
waiting times at 180 days, however other regions such as Navarra have established a
limit of 120 days), which are projected on historical patterns but usually linked to
economic incentives set out in health care contracts when health care is outsourced.
However, these incentives have not been strong enough to modify the behaviours and
motivations of NHS health personnel.
● Another policy measure taken, the so-called “plan de choque”, provides for massive
referrals from the NHS to private health providers when waiting lists or times are too large or
unacceptable, although these are still financed publicly. This measure, similar to the
above-mentioned autoconcierto, reduces waiting lists and times, but imposes the
outsourcing of NHS services and gives rise to higher health expenditures.
● Funds have been increased for specific waiting lists. This is particularly common for some
surgical procedures, such as cardiovascular. It allows managers to choose among various
alternatives for that specific health service, such as increasing the working time, or
expanding the team. Although flexible, it is used only for the most visible waiting lists.
As a consequence, policy makers might have incentives to focus their efforts on only a
few procedures rather than solving the larger waiting list problem.
● Out-patient ambulatory surgery and some forms of out-patient care centres have been
developed. In the last decades, as mentioned above, the adoption of innovative health
technologies has favoured the implementation of ambulatory surgery in a number of
surgical procedures, thus fuelling supply and demand for the procedure, and hence the
relevant waiting lists (García-Goñi, 2006). The adoption of innovations usually pre-
supposes the solution of a bottleneck, and different surgical procedures have dealt with
the bottleneck in their provision, for example, the number of surgical rooms in the
hospital dealing with the specific procedure.
● Most region states (Autonomous Communities) had defined a guaranteed maximum wait
for different surgical procedures by 2009. Although this commitment is very positive for
society, and helps to make health policy more transparent to public demands, in practice
it has not imposed hard constraints and is easily manipulated. Indeed, it is very difficult
to evaluate the effect of such a policy, as, in order to avoid waiting list inflation and thus
artificially meet targets, the regional health services keep modifying the criteria for
including patients on waiting lists. Paradoxically then, what a priori seems a constraint
has barely had any impact. Another noteworthy policy has been the agreement in 2010
between the Spanish Ministry of Health and Social Policy and Equality and the Inter-
territorial Council of the National Health System representing the regional states to
establish a guaranteed maximum waiting time of 180 days for specific surgical
procedures (cataracts, cardiovascular and hip and knee replacements). Again, however,
this agreement has actually had a limited impact, as the 180 day ceiling they have set is
much higher than the current mean waiting times.
WAITING TIME POLICIES IN THE HEALTH SECTOR: WHAT WORKS? © OECD 2013 271

II.14. SPAIN
With respect to policies that address the management of waiting lists:
● Information systems are one of the main problems in achieving a state-of-the-art
analysis of waiting lists and evaluation of policy. Indeed the current state of Spain’s
information systems has improved in the last decade. The National Health Institute and
some regions have been trying to standardise the criteria for including patients on
waiting lists. Although there is still a long way to go, at the moment most regions provide
homogeneous information to the Ministry of Health, Social Policy and Equality.
Nevertheless, this information is still not available from the Ministry for making a
comparative analysis of the regions.
● Nevertheless, some regions publish their waiting lists on the Internet, although again this
information is not necessarily suitable for regional comparisons.
● Some other attempts have been made in different regions with regard to the prioritisation
of specific pathologies and the implementation of clinical guidelines. The criteria recommended
for prioritisation in Catalonia includes from the following the impact of the surgical
procedures on the patient’s quality of life, the risk arising from the waiting time, the length
of the waiting time, the clinical effectiveness of the surgical procedure, and the demand or
use by patients of other health services during the waiting time (Adam et al., 2010).
Table 14.5, which is adapted from Peiró and Ridao (2004) and then updated, presents
the most important policy implementations related to an increase in the supply of health
provision.
Waiting times in general, and more specifically for elective surgery, are of paramount
health policy concern, as they generate dissatisfaction among patients and the general
public (Hurst and Siciliani, 2003). Dissatisfaction with waiting to access health care can
Table 14.5. Regional practices related to an increase in the supplyof health services, Spain
Massive referralsto private providers
Increasein working hours
Mobile healthteams
Commitmenton waiting timewith economic
incentives
Specificfunding
Guaranteeof maximumwaiting time
Andalucía YES YES YES YES YES YES
Aragón YES YES YES YES
Asturias YES YES YES YES YES
Baleares YES
Canarias YES YES YES YES YES YES
Cantabria YES YES YES
C-León YES YES YES
C-La Mancha YES YES YES YES
Cataluña YES YES YES YES YES
C.Valenciana YES YES YES YES
Extremadura YES YES YES YES
Galicia YES YES
Madrid YES YES YES YES YES
Murcia YES YES YES YES
Navarra YES YES YES
País Vasco YES YES YES YES YES
Rioja YES YES YES YES YES
Source: Adapted and updated from Peiró, S. and M. Ridao (2004), “Experiencias autonómicas en la gestión de las listasde espera”, Unpublished report, Agencia de Calidad del Sistema Nacional de Salud, Ministerio de Sanidad y Consumo.
1 2 http://dx.doi.org/10.1787/888932755414
WAITING TIME POLICIES IN THE HEALTH SECTOR: WHAT WORKS? © OECD 2013272

II.14. SPAIN
influence perceptions of health care quality (Costa-Font and Garcia, 2003), which is
reflected in turn in decisions to opt out (Costa-Font and Jofre-Bonet, 2006a; Costa-Font and
Jofre-Bonet, 2006b) to the private sector. Generally speaking, about one-sixth of the Spanish
population purchase supplementary health insurance, mostly in richer urban areas, as a
means of avoiding “waiting lists” for elective care, among other reasons. As Lopez-
Casasnovas et al. (2005) argue, the “absence of transparent waiting lists information
counterbalances tight NHS budgets (particularly in the last decade), with the former
playing the role of ’implicit prices’”.
ConclusionsWaiting lists and waiting times represent an important concern in the Spanish
National Health System, both for medical visits and especially for surgical procedures.
Waiting times are one of the clearest triggers of patient dissatisfaction, and hence very
sensitive information for health policy makers. Perhaps for this reason data on surgical
waiting times and lists are very difficult to obtain from the Autonomous Communities in
Spain. Given the decentralisation of health provision and planning in Spain in favour of the
Autonomous Communities, the Ministry of Health, Social Policy and Equality is unable to
provide data from all the regions (ACs). Even if in recent years there have been advances in
the management of waiting lists, there is still room for improvement. However, spending
cuts appear to be having a negative effect on waiting lists and times. Some evidence from
Catalonia suggests that in 2011 waiting lists increased by 42%.3
The rise of waiting lists is particularly concerning given that dissatisfaction with waiting
to access health care can impact perceptions of health care quality (Costa-Font and Garcia,
2003), which is reflected in turn in decisions (Costa-Font and Jofre-Bonet, 2006a; Costa-Font
and Jofre-Bonet, 2006b) to opt out of the public sector.4
Different health policies have been implemented regionally in order to reduce the size
of waiting lists. However all of them are oriented to the supply side. The most important
policy interventions involve the extension of working time for health personnel, although
they are not free of incentive problems. Other policy interventions include increasing funds
in order to cut the waiting list for specific conditions and procedures and guaranteeing a
maximum waiting time. The management of waiting lists has also been improved in the
last decade, as a result of an effort (still to be completed) to standardise the way in which
waiting lists are composed among regions. All these measures, together with the adoption
of new health technology, seem to have improved patients’ access to surgical procedures
and health service provision. Paradoxically this has in turn led to an increase in the
demand for those services, and an adaptation of supply, and thus counteractive effects on
waiting lists and times.
Notes
1. The latter is quite important, as long waiting times to access specialist care are a common reasonfor patients to go private (Costa-Font and Font-Vilalta, 2004).
2. The existence of both effects – substitution and expansion – in the evolution of waiting lists wasevidenced and discussed with regard to the adoption of different innovations at a public hospitalin Spain (García-Goñi, 2006).
3. http://ccaa.elpais.com/ccaa/2012/04/03/catalunya/1333484655_960475.html.
WAITING TIME POLICIES IN THE HEALTH SECTOR: WHAT WORKS? © OECD 2013 273

II.14. SPAIN
4. Generally speaking, about one-sixth of the Spanish population purchase supplementary healthinsurance, mostly in richer urban areas, as a means of avoiding “waiting lists” in elective care,among other reasons.
References
Adam, P., S. Alomar, M. Espallargues, M. Herdman, L. Sanz, O. Sola -Morales and C. Tebe (2010),“Prioritzacio entre procediments quiru rgics electius amb llista d’espera del sistema sanitaripu blic a Catalunya”, Age ncia d’Informacio , Avaluacio i Qualitat en Salut (AIAQS), Departamentde Salut, Catalunya.
Agencia de Calidad del Sistema Nacional de Salud, Ministerio de Sanidad, Política Social e Igualdad(2003 to 2009), “Sistema de Información sobre las listas de espera en el Sistema Nacional de Salud”,available at: www.msssi.gob.es/estadEstudios/estadisticas/inforRecopilaciones/listaEspera.htm.
Blundell, R. and F. Windmeijer (2000), “Identifying Demand for Health Resources Using Waiting TimesInformation”, Health Economics, Vol. 9, No. 6, pp. 465-474.
Costa-Font, J. and M. Font-Vilalta (2004), “Preference for National Health Service Use and the Demand forPrivate Health Insurance in Spain”, Geneva Papers on Risk and Insurance, Vol. 29, No. 4, pp. 705-718.
Costa-Font, J. and J. Garcia (2003), “Demand for Private Health Insurance: How Important Is the QualityGap?”, Health Economics, Vol. 12, No. 7, pp. 587-599.
Costa-Font, J. and M. Jofre-Bonet (2006a), “Is There a “Secession of the Wealthy’? Private HealthInsurance Uptake and National Health System Support”, Bulletin of Economic Research, Vol. 60,No. 3, pp. 265-287.
Costa-Font, J. and M. Jofre-Bonet (2006b), “Are Private Health Insurance Subscribers Unsatisfied withthe Spanish National Health System?”, Geneva Papers on Risk and Insurance, Vol. 31, No. 4,pp. 650-668.
Cutler, D.M. and M. McClellan (2001), “Is Technological Change In Medicine Worth It?”, Health Affairs,Vol. 20, No. 5, pp. 11-29.
García-Armesto, S., M.B. Abadía-Taira, A. Durán, C. Hernández-Quevedo and E. Bernal-Delgado (2010),“Spain: Health System Review”, Health Systems in Transition, Vol. 12, No. 4, pp. 1-295.
García-Goñi, M. (2006), “Diferencias y similitudes entre los procesos de adopcio n de innovacionestecnolo gicas y organizacionales en los hospitales”, Gaceta Sanitaria, Vol. 20, Suppl. No. 2, pp. 51-62.
García-Goñi, M., C. Hernández-Quevedo, R. Nuño-Solinís and F. Paolucci (2012), “Pathways TowardsChronic Care-focused Healthcare Systems: evidence from Spain”, Health Policy, forthcoming, http://dx.doi.org/10.1016/j.healthpol.2012.09.014.
Hadorn, D.C. and the Steering Committee of the Western Canada Waiting List Project (2000), “SettingPriorities for Waiting Lists: Defining Our Term”, Canadian Medical Association Journal 2000, Vol. 163,No. 7, pp. 857-886, available at www.cmaj.ca/content/163/7/857.full.pdf, accessed 15 December 2011.
Hurst, J. and L. Siciliani (2003), “Tackling Excessive Waiting Times for Elective Surgery: A Comparisonof Policies in Twelve OECD Countries”, OECD Health Working Paper, No. 6, OECD Publishing, Paris,http://dx.doi.org/10.1787/108471127058.
Insalud (1998), “Guía para la gestión de la lista de espera quirúrgica”, Instituto Nacional de la Salud(Insalud), Ministerio de Sanidad y Consumo, Madrid.
Lopez-Casasnovas, G., J. Costa-i-Font and I. Planas (2005), “Diversity and Regional Inequalities in theSpanish System of Health Care Services”, Health Economics, Vol. 14, No. S1. pp. 221-235.
Ministerio de Sanidad, Política Social e Igualdad (2010), “Sistema de información sobre listas de esperaen el Sistema Nacional de Salud”, Agencia de Calidad del Sistema Nacional de Salud. Instituto deInformación Sanitaria, available at www.msc.es/estadEstudios/estadisticas/inforRecopilaciones/docs/ListaEsperaJunio10_CISNS.pdf, accessed 19 December 2011.
OECD (2012), OECD Health Data 2012, OECD Publishing, Paris, http://dx.doi.org/10.1787/health-data-en.
Peiró, S. and M. Ridao (2004), “Experiencias autonómicas en la gestión de las listas de espera”, Unpublishedreport, Agencia de Calidad del Sistema Nacional de Salud, Ministerio de Sanidad y Consumo.
Siciliani, L. and R. Verzulli (2009), “Waiting Times and Socioeconomic Status Among Elderly Europeans:Evidence from SHARE”, Health Economics, Vol. 18, pp. 1295-1306.
WAITING TIME POLICIES IN THE HEALTH SECTOR: WHAT WORKS? © OECD 2013274

Waiting Time Policies in the Health Sector
What Works?
© OECD 2013
PART II
Chapter 15
Sweden
by
Ulrika Winblad,
Health Services Research, Department of Public Health
and Caring Sciences, Uppsala University
and
Marianne Hanning,
Department of Statistics, Monitoring and Evaluation, Unit for Performance Assessment,
National Board of Health and Welfare
Waiting times have been a salient problem in the Swedish health care system sincethe 1980s. Various initiatives have been taken at the national level since then tocome to terms with this problem. The most prominent initiative has been theimplementation of waiting time guarantees that set out specific time limits withinwhich patients are to be treated. The last two decades display a pattern oftemporarily reduced waiting times due to the guarantees. However, the currentguarantee, designed in 2005, seems to have had a more positive, long-term effect onwaiting times. More patients than before are receiving treatment and surgerywithin 90 days. The current guarantee, which was made statutory in 2010, iseconomically supported by the Queue Billion programme. The economic policy toolswere weaker for the earlier guarantees, whereas the Queue Billion provides cleareconomic incentives for the individual clinics to cut waiting times. There is, however,a need for more thorough research to assess the causal mechanisms behind thereduced waiting times. Economic incentives, administrative interventions such as“cleaning” the waiting lists, and the purchase of services from other producers arementioned in some counties as causes of the improvements.
275

II.15. SWEDEN
IntroductionLong waiting times, which are often referred to as the Achilles heel of Sweden’s health
services (Hanning, 2005), have been a long-standing problem in the health care system. In
1981, the National Board of Health and Welfare was already reporting that long waiting
times were the cause of most complaints about the country’s health care services. Various
initiatives have been taken at the national level since then. County councils, hospitals and
clinical departments have addressed the problem and in various ways tried to remedy the
long waiting times. A Eurobarometer from 2007 that surveyed the opinions of citizens in
27 EU countries showed that the issue of long waits was still troublesome and that Swedish
patients were especially dissatisfied compared to patients in other European countries
(European Commission, 2007). A recent study from the Commonwealth Fund shows that
fewer than 50% of Swedish patients obtained an appointment with a GP or a nurse on the
day they tried, placing Sweden last among the countries studied (Ramböll, 2012). Criticism
from citizens and patients has led to several political initiatives that address the issue of
long waiting times, including measures to increase productivity, such as activity-based
payments, the reorganisation of the delivery structure to reduce bed days, and shifting
from in-hospital care to ambulatory treatment. One type of policy that has been especially
important for addressing the waiting problem is the so-called waiting time guarantee,
which sets specific time limits within which patients are to be treated. Over time, the
Swedish Government has introduced waiting time guarantees on three different occasions.
Since the waiting time guarantees, in combination with different forms of economic
incentives, are the dominant measures taken at the national level to reduce waiting times
in Sweden, these will be particularly highlighted in the following chapter.
Main characteristics of the Swedish health care systemThe Swedish health system is characterised by universal coverage and is financed
mainly through general taxation by 21 regional bodies, the so-called county councils. It is
highly decentralised, as both the financing and production of health care rest with the
county councils. This means that the implementation of national initiatives, such as the
waiting time guarantee, is highly dependent on the actions taken at regional and local
levels. The health system is organised into three main political and administrative levels:
national government (legislation and control), county councils (primary and secondary
care) and local municipalities (elderly care and nursing homes). Approximately 80% of the
total health care budget is financed through regional taxation and about 15-20% comes
from earmarked state grants (OECD, 2012). Patient fees finance only a small part. The
county councils are responsible for purchasing all health care for their inhabitants through
regional health authorities. Most GPs are salaried or on contracts, and most hospitals are
owned by the county councils.
Each county council is free to choose how to organise its health care provision.
However, often the responsibility of providing health services to the population is divided
WAITING TIME POLICIES IN THE HEALTH SECTOR: WHAT WORKS? © OECD 2013276

II.15. SWEDEN
into several health care areas within each county council. Usually each area has one
hospital and several primary health care units (Anell et al., 2012).
Hospitals
The 21 county councils are responsible for secondary care in Sweden, and most of the
hospitals and clinics are owned and managed by the county councils. All in all, there are
approximately 70 hospitals in Sweden, including eight regional hospitals where patients
with more complex conditions are treated. Whilst the number of private nursing homes
and private local health centers has been increasing, there are only six private hospitals,
only one of which is an emergency hospital (Anell et al., 2012).
During the 2000s, a considerable reduction (-24.2%) in the number of hospital beds
took place, from 31 765 beds in 2000 to 25 566 (2.73 beds per 1 000 population) in 2010
(OECD, 2012). This reflected a more intensive use of bed resources and a shift to day-case
surgery. In addition, more space was created in the hospitals through a policy, which was
part of the ÄDEL reform, under which the municipalities (and not the counties) were
required to pay a penalty fee for elderly patients who were ready to be discharged from the
hospitals but not taken care of by the municipalities. Due to the reform, 15% more beds
became accessible for other patients (Styrborn, 1994).
Hospital remuneration
Since the county councils are free to choose how to deliver health care, the hospital
remuneration arrangements differ among them, and the counties generally use a mix of
payment mechanisms (Anell et al., 2012). Some county councils have introduced a
purchaser/provider split, where the regional health authorities act as purchasers and the
hospitals as providers. In 2011, the NordDRG system was commonly used, and only
five counties out of 21 did not implement this system at least to some extent. The
NordDRG system is generally used as an accounting tool, and in 2011 six counties
integrated it fully as a budgeting tool to allocate funding within the hospitals
(Socialstyrelsen, 2011a). The utilisation of remuneration systems based on diagnosis-
related groups (DRGs) has often been accompanied by the introduction of price or volume
ceilings. Some counties have also developed pay-for-performance programmes for
hospital payment (Anell et al., 2012). Retrospective fees for service reimbursements are
used for patients who receive their treatment in a regional hospital outside the county of
residence.
Specialist remuneration
Traditionally, Swedish health care personnel have been employed by the county
councils and receive a monthly salary, but an increasing proportion, approximately 10%, is
nowadays employed by private employers within specialist care.
Co-payments
Each county council decides the level of cost-sharing by patients. The patients usually
pay a symbolic daily fee, SEK 80 (EUR 9), for each day spent in the hospital. In primary care,
patient fees vary among counties, ranging from approximately SEK 100 (EUR 11) to SEK 200
(EUR 22). Patients pay an additional fee of between SEK 230 (EUR 25) and SEK 320 (EUR 35)
for a specialist visit. However, if the patients have already spent SEK 1 100 (EUR 122) within
the same fiscal year, they are exempted from further payments.
WAITING TIME POLICIES IN THE HEALTH SECTOR: WHAT WORKS? © OECD 2013 277

II.15. SWEDEN
Private health insurance
Private health care insurance is limited and primarily provided and paid by employers
(Anell et al., 2012). In terms of total health expenditure, the share of private insurance
is marginal, accounting for merely 0.1% in 2000, which increased only to 0.3% in 2010
(OECD, 2012). It typically provides supplementary coverage (mainly coverage for elective
surgery) to the public health system. Due to long waiting lists for elective treatment under
the county councils, the demand for voluntary health insurance has grown: private
insurance guarantees a rapid access to ambulatory care when needed. In 2010,
382 000 people had supplementary voluntary insurance, compared to approximately
103 000 people in 2000 (Anell et al., 2012).
Primary care
Sweden has a very low ratio of GPs to population, 0.63 (per 1 000 population) in 2009,
which was up only slightly from 0.53 in 2000 (OECD, 2012). Much of the access to hospital
services follows referral from a GP, but gate-keeping is not mandatory and customs vary
between counties. Indeed, many patients access hospital out-patient departments directly.
Surgical activity
For a number of procedures, Sweden has experienced a shift from in-patient to day-
case surgery between 2000 and 2010. Of procedures performed as in-patient, percutaneous
coronary interventions (PTCA and stenting) had the highest growth rate (251%), whereas
the largest decrease was attributable to coronary bypass (-41.7%) during this period
(Table 15.1).
Table 15.1. Surgical procedures per 100 000 population,Sweden, 2000 and 2010
Surgical procedures by ICD-9-CM 2000 2010% change
in surgical proceduresbetween 2000 and 2010
Cataract surgery:
In-patient 27.8 16.3 -41.40
Day-case 357.9 605.0 69.00
Tonsillectomy with or without adenoidectomy:
In-patient 79.4 48.5 -38.90
Day case 8.2 34.8 324.40
Percutaneous coronary interventions (PTCA and stenting): in-patient 51.2 179.7 251.00
Coronary bypass: in-patient 72.9 42.5 -41.70
Appendectomy: in-patient 141.5 118.1 -16.50
Cholecystectomy:
In-patient 127.9 114.3 -10.60
Day-case 5.1 23.4 358.80
Laparoscopic cholecystectomy:
In-patient 91.4 87.7 -4.00
Day-case 5.0 22.6 35.00
Inguinal and femoral hernia:
In-patient 72.9 46.5 -36.20
Day-case 105.4 121.9 15.70
Hip replacement: in-patient 165.0 210.4 27.50
Knee replacement: in-patient 70.5 125.3 77.70
Source: OECD (2012), OECD Health Data 2012, OECD Publishing, Paris, http://dx.doi.org/10.1787/health-data-en.1 2 http://dx.doi.org/10.1787/888932755433
WAITING TIME POLICIES IN THE HEALTH SECTOR: WHAT WORKS? © OECD 2013278

II.15. SWEDEN
Health expenditure
Total health spending accounted for 9.6% of GDP in Sweden in 2010, which was just
above the OECD average of 9.5%. Sweden also spends more on health per capita than many
OECD countries, with spending of USD 3 758 in 2010 (adjusted for purchasing power parity),
compared with an OECD average of USD 3 268. Health spending in Sweden increased in
real terms by 3.9% per year on average between 2000 and 2009, but this growth rate slowed
to 2.0% in 2010. In Sweden, 81% of health spending was funded by public sources in 2010,
well above the OECD average of 72%.
Practising physicians
In 2009 (latest year available), Sweden had 3.8 practising physicians per
1 000 population, compared with an average of 3.1 in the OECD countries.
Life expectancy and population
The quality of health care in Sweden has to be considered good, since life expectancy
in Sweden is one of the highest among the OECD countries: 81.5 years in 2010, almost two
years higher than the OECD average (79.8 years). The percentage of the population aged 65
and over was 19.3% in 2011 (OECD, 2012).
Past policies to reduce waiting timesLong waiting times and a lack of productivity within the health care system has been
a subject for discussion in Sweden for several decades. In the 1980s and 1990s, a so-called
“technology revolution” took place, during which new methods for efficient treatment
were developed and initiated. This made it possible to treat more patients, including at
older ages, but also increased the waiting times (Andersson, 2007). Waiting times increased
further as a result of budget constraints in the wake of the major financial crisis in the
early 1990s. The retrenchments resulted in a heavy reduction in hospital beds which led to
a move towards more out-patient care (SALAR, 2009).
However, several national initiatives and interventions were put in force to combat the
long waiting times and enhance accessibility. In 1987, an agreement between the
government and the Federation of County Councils (FCC) established that the county
councils should collaborate and that patients could be referred across county borders for
cataracts, hip replacements and coronary artery operations (Regeringen, 1986). Another
initiative by the government and the FCC was the national project DAGMAR 50, which was
in force during the period 1989-91. Its main aim was to describe and compare capacity and
accessibility in six specialist areas among hospitals in Sweden. The result showed
generally long waiting times but with great variation between different hospitals and
specialist areas. As part of the project, support was given to hundreds of local projects with
the aim of promoting knowledge about effective interventions to enhance productivity and
reduce waiting times (Spri, 1992). Another national intervention to release capacity within
the hospitals was the above-mentioned ÄDEL reform from 1992. Under this reform, the
municipalities were supposed to take responsibility for elderly patients who were ready to
be discharged from the hospitals. If the municipalities did not, they were charged a sum
per every elderly person not discharged. As a result of the reform, altogether 15% of the
beds become accessible for other patients, leading to an increase in productivity at the
hospitals and thereby reducing hospital waiting times (Styrborn, 1994).
WAITING TIME POLICIES IN THE HEALTH SECTOR: WHAT WORKS? © OECD 2013 279

II.15. SWEDEN
As shown above, the initiatives taken to solve the problem of long waiting times have
mostly focused on the supply side instead of restricting the demand for health care. There
has been neither a substantial rise in patient fees nor authorisation for private producers
to take responsibility for parts of the health care system, thereby reducing the demand for
public services. Instead, the focus has been on enhancing capacity and efficiency, for
instance by cutting down on hospital beds and introducing market-oriented steering into
the health care system. One example is DRG-based remuneration and the pay-for-
performance arrangement with both public and private producers that was introduced in
many county councils at the beginning of the 1990s (Anell et al., 2012). Despite these
initiatives and reforms, waiting times remained long, and the situation reached a point
when the legitimacy of the public health care system was in danger. Hence, the politicians
found it necessary to introduce a waiting time guarantee to make the provider’s
responsibilities to the patient explicit, thereby reinforcing the legitimacy of the public
health care system (Andersson, 2007).
Maximum waiting time guarantees in Sweden 1992-2004
The introduction of national waiting time guarantees has been considered the most
important policy tool in Sweden to combat long waiting times. All in all, three different
guarantees have been introduced during the last two decades. Repeated evaluations have
found shortcomings and inadequacies, leading to new, remodelled reforms.
The first waiting time guarantee was introduced in 1992 and lasted until 1997. Its main
aim was to reduce waits in 12 different interventions1 for both surgery and treatments for
which there had been particularly long waiting times. The guarantee was based on an
agreement between the government and the Federation of County Councils (FCC) and did
not have legal status, even though all the county councils accepted it. Patients awaiting a
procedure within the 12 specialist areas were guaranteed a waiting time of at most three
months from the physician’s decision to treat/operate. If the guarantee was not fulfilled,
the patient had the right to be treated by other public or private care producers at the cost
of the home clinic/hospital. The initial agreement was to be in force for one year, and a
grant of SEK 500 million (USD 72 million) was appropriated for the initiative. The guarantee
was prolonged by annual decisions and remained in force from 1993 through 1995. But no
extra resources were set aside for these years (Hanning, 2005).
In general, waiting times decreased substantially during the first year of the
guarantee. By the end of 1992 only a few departments were unable to serve patients within
three months. The overall success result seems to have been achieved mainly by increased
production, improved administration of the waiting lists and a change in attitudes towards
waiting lists. However, during 1993 the number of patients on the waiting lists ceased to
fall, and by the end of the year waiting times for some procedures was again tending to rise.
The expectation that the guarantee would lead to a more even use of resources across
different county counties was not realised, and it appeared that hospital departments
chose to expand their own activities rather than use the new opportunity offered by the
guarantee to refer patients to other hospitals (Hanning, 1996). In December 1996, four years
after the guarantee was introduced, the waiting lists had reached the same level as at the
outset.
Figure 15.1 shows the development for one of the treatments, namely cataract surgery
(Hanning and Lundström, 2007). An evaluation concluded that even if the percentage of
patients who received care within three months increased in the initial year after the
WAITING TIME POLICIES IN THE HEALTH SECTOR: WHAT WORKS? © OECD 2013280

II.15. SWEDEN
guarantee, the effects seemed to be short-lived, and the guarantee was abandoned in 1996
(Socialstyrelsen, 1997). Briefly, the diminishing effect of the reform was explained by
increased demand due to several technological improvements that also led doctors to reset
their clinical thresholds, and thereby operate on more patients.
The guarantee also faced criticism on other grounds. The National Priorities
Commission concluded in their report “Vårdens svåra val” (SOU, 1995:5) that the guarantee
was unethical, as it excluded patients with conditions not included in the 12 selected areas.
This was especially noticeable as several areas of treatment in the guarantee were not the
most prioritised according to the new priority principles set out by the national commission.
With this criticism in mind, the government and the FCC decided to “redesign the
guarantee” in 1997 to focus more explicitly on patients’ first visit to the GP or specialist in
secondary care instead of treatment for surgery. Also, in the original guarantee, only
certain patient groups were included – which was criticised by the national commission. In
the new visit guarantee, all patients groups were included. More precisely, the new
guarantee set out that a patient should be put in contact with primary care by telephone
the same day and with their GP within seven days. In addition to this, patients with a letter
of referral should get a secondary care visit within 90 days (Hanning, 2005).
In 1997, the same year as the new visit guarantee was introduced, discussion arose
concerning an expansion of the guarantee to also include a maximum waiting time for
treatment/surgery within secondary care. This was a controversial suggestion. The
National Board of Health and Welfare (NBHW) criticised it and pointed out that a treatment
guarantee may have negative crowding-out effects and could therefore lead to setting
wrong priorities. Further, they claimed that the guarantee demanded considerable
resources and was unlikely to succeed due to a lack of medical specialists in certain areas
(Socialstyrelsen, 1999). Because of the criticism, the government chose not to proceed with
the proposal (Andersson, 2007). Instead, other, different initiatives were taken to enhance
accessibility and strengthen patients’ rights and involvement. For instance, initiatives to
enable patients to choose health care providers resulted in the “Choice of provider” policy,
Figure 15.1. Number of cataract operations and percentage of patients waiting lessthan three months, Sweden, 1980 to 2002
Source: Hanning, M. and M. Lundström (2007), “Waiting for Cataract Surgery – Effects of a Maximum Waiting-timeGuarantee”, Journal of Health Services Research & Policy, Vol. 12, No. 1, pp. 5-10.
1 2 http://dx.doi.org/10.1787/888932754464
90 000
80 000
70 000
60 000
50 000
40 000
30 000
20 000
10 000
0
60.00
50.00
40.00
30.00
20.00
10.00
0
1980
1981
1982
1983
1984
1985
1986
1987
1988
1989
1990
1991
1992
1993
1994
1995
1996
1997
1998
1999
2000
2001
2002
Number of operations % waiting < 3 months
WAITING TIME POLICIES IN THE HEALTH SECTOR: WHAT WORKS? © OECD 2013 281

II.15. SWEDEN
which came into force on 1 July 2003 (Regeringen, 2002). With a few exceptions, this policy
entitled patients to seek care throughout the entire country at primary care centres and at
certain hospitals or private clinics. Highly specialised care was excluded. This initiative
enabled patients to seek care more quickly. Another initiative to promote patient choices
and combat long waiting times was the national waiting time database launched in April
2000 by the FCC. The development of the database is described more thoroughly below.
Waiting times – measuring and monitoring
In 1998, a project called “Waiting Times in Health Care” (Väntetider i vården) was
initiated by the FCC as part of the greater mission to combat long waiting times and
enhance accessibility and patient influence. To battle the long waiting times, accurate and
comparable information about accessibility and the waiting time situation was thought to
be of great importance. As part of the project, a national database was developed and
launched in 2000. The purpose was to compile information about hospital waiting times
and make this available for patients as well as caregivers, which would create
opportunities to co-ordinate care better and to obtain a balance between supply and
demand. The database has gradually expanded and now also includes waiting time data
for primary care and telephone accessibility. The data reported to the database also provide
the basis for the Queue Billion remuneration (explained below). Table 15.2 outlines the
content of the database and how the data are measured. The database is continuously
evolving to take better account of actual waiting times. A new initiative to measure waiting
times is at present under development at the NBHW. The aim is to make it possible to
follow “the patient’s journey” through the care system. Cancer care is a pilot area where a
model for measuring has been developed (Socialstyrelsen, 2011c).
Towards a new agreement – the 2005 guarantee
As mentioned above, ideas about an extended guarantee were already on the agenda at
the end of the 1990s, but after a critical assessment by the NBHW (Socialstyrelsen, 1999) the
Table 15.2. The national waiting time database, content and measures,Sweden, 2012
Waiting time to: Measurement Measuring method Reporting frequency
Get in contactwith primary care on phone
Share (%) of phone calls answeredthe same day
Reported by the primary care centerswith a surveillance telephone
Monthly
Visit a GP(time from first contacton phone)
Share (%) of visits within seven days All first visitors during two weeksare monitored. Actual waiting times arereported by the primary care centres
Two times a year,fall and spring
First visit with specialist,when referred
● Number of patients waiting The county councils report aggregateddata from the administrative systems
Since 2009,monthly
● Share (%) of patients waiting less than90 days (since 2011 also < 60 days)
● Number of self-elected waiting patients
● Number of patients waiting dueto medical reasons
Treatment from dateof referral
● Number of patients waiting The county councils report aggregateddata from the administrative systems
Since 2009,monthly
● Share (%) of patients waiting less than90 days (since 2011 also < 60 days)
● Number of self-elected waiting patients
● Number of patients waiting dueto medical reasons
WAITING TIME POLICIES IN THE HEALTH SECTOR: WHAT WORKS? © OECD 2013282
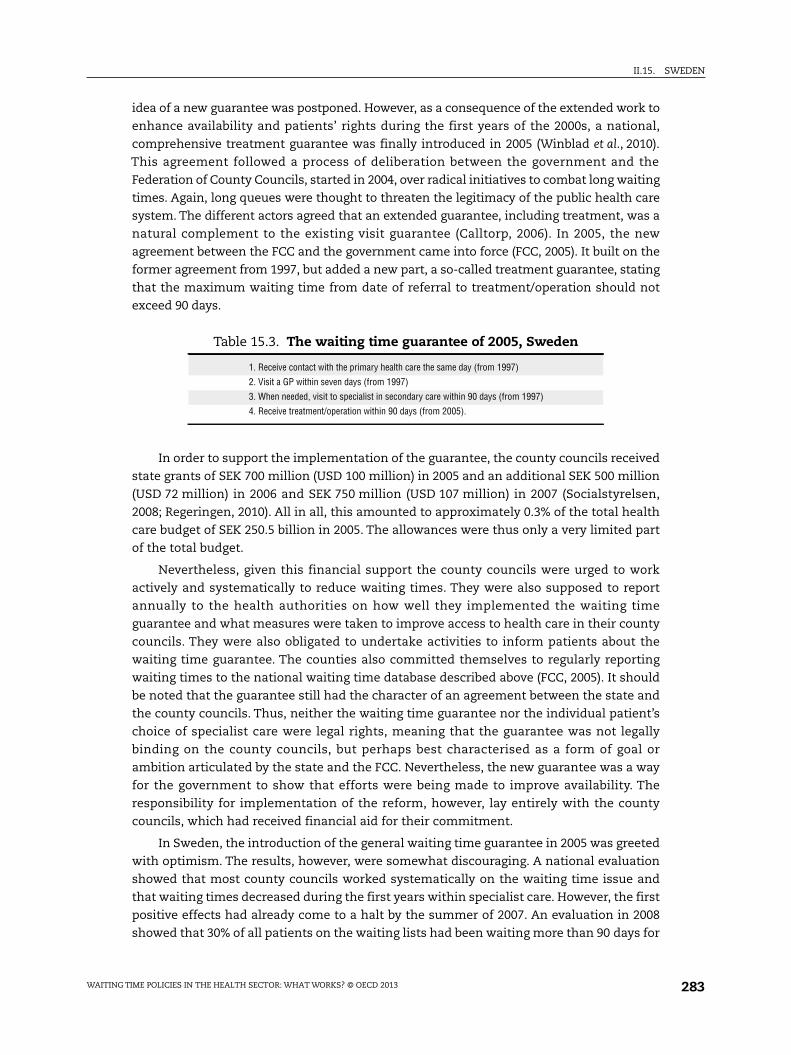
II.15. SWEDEN
idea of a new guarantee was postponed. However, as a consequence of the extended work to
enhance availability and patients’ rights during the first years of the 2000s, a national,
comprehensive treatment guarantee was finally introduced in 2005 (Winblad et al., 2010).
This agreement followed a process of deliberation between the government and the
Federation of County Councils, started in 2004, over radical initiatives to combat long waiting
times. Again, long queues were thought to threaten the legitimacy of the public health care
system. The different actors agreed that an extended guarantee, including treatment, was a
natural complement to the existing visit guarantee (Calltorp, 2006). In 2005, the new
agreement between the FCC and the government came into force (FCC, 2005). It built on the
former agreement from 1997, but added a new part, a so-called treatment guarantee, stating
that the maximum waiting time from date of referral to treatment/operation should not
exceed 90 days.
In order to support the implementation of the guarantee, the county councils received
state grants of SEK 700 million (USD 100 million) in 2005 and an additional SEK 500 million
(USD 72 million) in 2006 and SEK 750 million (USD 107 million) in 2007 (Socialstyrelsen,
2008; Regeringen, 2010). All in all, this amounted to approximately 0.3% of the total health
care budget of SEK 250.5 billion in 2005. The allowances were thus only a very limited part
of the total budget.
Nevertheless, given this financial support the county councils were urged to work
actively and systematically to reduce waiting times. They were also supposed to report
annually to the health authorities on how well they implemented the waiting time
guarantee and what measures were taken to improve access to health care in their county
councils. They were also obligated to undertake activities to inform patients about the
waiting time guarantee. The counties also committed themselves to regularly reporting
waiting times to the national waiting time database described above (FCC, 2005). It should
be noted that the guarantee still had the character of an agreement between the state and
the county councils. Thus, neither the waiting time guarantee nor the individual patient’s
choice of specialist care were legal rights, meaning that the guarantee was not legally
binding on the county councils, but perhaps best characterised as a form of goal or
ambition articulated by the state and the FCC. Nevertheless, the new guarantee was a way
for the government to show that efforts were being made to improve availability. The
responsibility for implementation of the reform, however, lay entirely with the county
councils, which had received financial aid for their commitment.
In Sweden, the introduction of the general waiting time guarantee in 2005 was greeted
with optimism. The results, however, were somewhat discouraging. A national evaluation
showed that most county councils worked systematically on the waiting time issue and
that waiting times decreased during the first years within specialist care. However, the first
positive effects had already come to a halt by the summer of 2007. An evaluation in 2008
showed that 30% of all patients on the waiting lists had been waiting more than 90 days for
Table 15.3. The waiting time guarantee of 2005, Sweden
1. Receive contact with the primary health care the same day (from 1997)
2. Visit a GP within seven days (from 1997)
3. When needed, visit to specialist in secondary care within 90 days (from 1997)
4. Receive treatment/operation within 90 days (from 2005).
WAITING TIME POLICIES IN THE HEALTH SECTOR: WHAT WORKS? © OECD 2013 283

II.15. SWEDEN
an appointment for treatment in specialist care (Socialstyrelsen, 2008). Also, the
dissemination of information varied remarkably among the counties. Some of the county
councils set up specific waiting time offices with staff that helped patients to arrange
journeys to clinics in other counties. However, many county councils were reluctant to
disseminate information about the guarantee to both patients and personnel. One
explanation was that the county councils hesitated to inform patients about their rights,
due to the risk of being held responsible for paying the patients’ expenses (Socialstyrelsen,
2008). The national evaluation showed further that waiting times had not fallen as fast as
expected, and that some waiting times even increased during the period under study,
especially for first visits to doctors in specialist care. Furthermore, there was wide variation
among the 21 county councils, with some managing well while others failed completely to
fulfil the intentions of the guarantee. The general conclusion was that the guarantee had
had a limited impact on waiting times, suggesting that the implementation of the reform
had not been completely successful (Socialstyrelsen, 2008). A similar pattern, with a
successful start and then a tailing-off in the reduction of waiting times, had been observed
in the evaluation of the first waiting time guarantee in 1992 (Hanning, 2005). Thus, it seems
like the same type of policy led to the same results – short reductions in waiting times for
a couple of years, and then back to longer waiting times.
Recent developments – clearer economic incentives and a legislated waitingtime guarantee
As we have seen, the first evaluation of the waiting time guarantee indicated a fading
success. Hence, stronger tools were needed. In order to strengthen the implementation
process and speed up the effects, different policy instruments were at hand, in particular
legal regulations, economic incentives and information (Bemelmans-Videc et al., 2003). To
meet the goals of the waiting time guarantee, all of these instruments have been used
lately. The Queue Billion programme was introduced in 2009 as an economic incentive, and
later on the guarantee was legislated. As for information as a policy tool, both the
agreement itself and then the legislation of the guarantee put emphasis on patients’ rights
and on the county councils’ responsibility to inform patients about their rights
(Socialstyrelsen, 2012).
The Queue Billion – an efficient way to make clinics work in line with the guarantee?
As a result of the failure in many counties to shorten waiting times, the government and
the Swedish Association of Local Authorities and Regions, SALAR (before 2007 called the
Federation of County Councils) made an additional agreement in the autumn of 2008. The
purpose was to introduce economic incentives to encourage hospital clinics to fulfil the
guarantee (Socialdepartementet, 2009a). So far, neither positive nor negative incentives had
been directly linked to the implementation of the guarantee – state grants had been
allocated to the county councils centrally, and not directly to hospital clinics based on their
activities. In 2009, the Queue Billion programme (Kömiljard) was initiated, which consisted of
a performance-based model of financial contribution that required county councils to
demonstrate clear results in order to take advantage of SEK 1 billion per year
(USD 143 million). More precisely, the money was distributed during the years of 2009-112 to
the counties that reached the goals set out in the agreement for the Queue Billion
(Socialdepartementet, 2011).
WAITING TIME POLICIES IN THE HEALTH SECTOR: WHAT WORKS? © OECD 2013284

II.15. SWEDEN
Under the Queue Billion agreement, the NBHW was assigned to monitor and evaluate
the project. A first report was presented in March 2010, which showed that the number of
patients waiting more than 90 days for specialist care had fallen which was an improvement
(Socialstyrelsen, 2012). In spring 2010, 20 of 21 counties reported an improvement in waiting
times, and thus managed to qualify for the Queue Billion (Socialstyrelsen, 2010). However,
there was a rise in patients who said that they did not want to be treated by other health care
providers and therefore waived the right to invoke the guarantee, as well as in patients who
had to wait longer than 90 days due to medical reasons. Since these two categories of “self-
elected waiting patients” and “patients waiting due to medical reasons” were not initially
included in the waiting time statistics, it was questionable whether the waiting times had
become shorter in reality or whether the reduction was just an effect of how the statistics
were collected. The evaluation emphasised that many of the initiatives were short-term (like
going through the waiting lists, reviewing the referral systems and targeted interventions)
and emphasised the need to work in a more structured way with the care processes as well
as with logistics to ensure a more longer-term impact on waiting times (Socialstyrelsen,
2010). It also called for more homogeneous ways to measure waiting times. As a
consequence of this criticism, the way to define waiting patients was modified. From the
summer of 2010, it was no longer possible to exclude “self-elected waiting patients” or
“patients waiting due to medical reasons” in order to obtain the allowance from the
Queue Billion, which made it harder for the clinic to report “good results”
(Socialstyrelsen, 2011b).
An overall analysis of the changes between 2009 and 2011 indicates that the share of
patients waiting more than seven days for a primary care appointment declined: less than
10% of the patients waited during this period for more than seven days for a primary care
visit. Within specialised care, the share of patients waiting more than 90 days for a visit or for
treatment declined slightly between 2009 and 2011, with the greatest reduction during 2009
and 2010 (see Figure 15.2). However, due to changes in the definition of “self-elected waiting
patients” and “patients waiting due to medical reasons”, it is not possible to make precise
comparisons over time (Socialstyrelsen, 2012). To give specific numbers, in 2011, on the
national level, 88% of all patients got an appointment with a specialist within 90 days, and
hence met the standards set in the statute. Also, 86% of the patients on the waiting lists had
a waiting time of 90 days or less for treatment (see Figure 15.3) (SALAR, 2012).
To summarise, one can notice a reduction in waiting times in Swedish health care in
recent years. Although the NBHW emphasises that it is difficult to determine how much of
this is due to long-term changes and how much to short-term initiatives like scanning the
waiting list (Socialstyrelsen, 2012), it seems that a major part of the effect is the result of the
Queue Billion. Studies confirm that many clinicians felt huge pressure to fulfil the guarantee
in order for their clinics to receive money from the programme (Winblad and Andersson,
2010). In the earlier guarantees, resources were allocated to each county as a lump sum per
individual. In the Queue Billion, the allocation of resources to counties was based on their
performance, creating clear incentives to increase production at the clinical level.
A legislated waiting time guarantee
Another policy instrument used by the government to increase the influence of the
guarantee was to legalise it in 2010. Traditionally, health policy in Sweden is managed
through consensus-based politics, i.e. mostly through negotiations between the government
and SALAR (Fredriksson et al., 2011). This time, though, the government felt an urge to
WAITING TIME POLICIES IN THE HEALTH SECTOR: WHAT WORKS? © OECD 2013 285

II.15. SWEDEN
consolidate the waiting time guarantee by legislation. The legislative bill mentioned that the
former agreement made the relationship between the state and the county councils unclear
and that the voluntary character of the agreement led to varying results in implementation
by the county councils (Socialdepartementet, 2009b). Legislation was considered an efficient
way to overcome inequalities in different parts of the country and thereby strengthen
patients’ use of the guarantee. The waiting time guarantee, which had the same content as
the agreement from 2005, was formally added as an amendment to the Health and Medical
Service Act on 1 July 2010 (SFS, 1982:763). Also, the patient’s right to proper information about
the waiting time guarantee was made clear in the new law. Although the purpose of the
legislation was to strengthen patient rights, this was formulated as an obligation for the
health care producer but not as a right for the patients. Thus the practical implications of the
legislation for patients’ ability to use the guarantee remains unclear, since patients have no
legal right to appeal to a court if the guarantee is not met (Rynning, 2012).
Figure 15.2. Number of patients on waiting lists for treatment(specialist care), and how long they waited between decision to treat
and treatment, Sweden, 2009 to 2011
Source: Swedish Association of Local Authorities and Regions (SALAR).1 2 http://dx.doi.org/10.1787/888932754483
Figure 15.3. Patients on waiting lists for treatment (42 different procedures),Sweden, 31 December 2011
Source: Database on waiting times, SALAR, 2012.1 2 http://dx.doi.org/10.1787/888932754502
100 000
90 000
80 000
70 000
60 000
50 000
40 000
30 000
20 000
10 000
012 122 4 6 8 10 122 4 6 8 10 122 4 6 8 10
2009 2010 2011
< 90 days Patient’s choice > 90 days Missing data (estimated)
Waited > 90 days10%Patient’s choice4%
Waited < 90 days86%
WAITING TIME POLICIES IN THE HEALTH SECTOR: WHAT WORKS? © OECD 2013286
II.15. SWEDEN
What causes reductions in waiting times?
The waiting time database allows quantitative comparisons and analysis regarding
changes in waiting times. As we have seen, waiting times have been reduced in several
counties. However, the data do not explain how these changes took place, i.e. what
procedures or mechanisms caused the improvements. A few qualitative studies of waiting
time reduction in Sweden have been carried out, giving us a few hints of what may cause
long-term reductions in waiting times.
As a part of its assigned mission to evaluate the waiting time guarantee, the NBHW
carried out a survey and interviews of waiting time co-ordinators in the county councils.
The purpose was to find out what strategies the county councils used to implement the
guarantee and how well they succeeded. Many respondents pointed out that the success of
the guarantee was dependent on the attitude and commitment of the politicians and
management. One recent positive development that they reported was that the issue of
access3 is now given greater priority than in 2008, partly due to the incentives created by
the Queue Billion. The division of responsibilities was made clearer, and 15 out of
21 county councils stated in a survey from 2011 that the county councils had developed
specific policies for better usage of waiting time statistics. Many county councils also had
regular follow-ups of patient flows and working processes. Regarding more long-term
effects, many respondents in the surveys pointed out that initiatives for improvement
often involved improvement in logistics in the health care process, often inspired by “lean
health care”, where the goal was to optimise patient flows and improve the planning of
production. Many respondents also stated that they bought care from other counties or
from private producers to meet the time limits set out in the waiting time guarantee. The
usage of ambulating doctors rented out from private companies is also an example of
short-term solutions that have become more or less permanent (Socialstyrelsen, 2012).
Another early example of strategies to make the chain of care more efficient is a
project first introduced in the county council of Jönköping. In 1999, the council began to
develop a conceptual model for improved access and reduced queues. The model, called
“Bra Mottagning” (“Good Clinic”), is based on logistics principles and collaborative learning.
The model was inspired by the “Breakthrough Model” first developed by the Institute for
Healthcare Improvement in Boston. To improve access, three general strategies were
formulated to guide the work: shaping or reducing demand, matching supply and demand
and redesigning the system to increase supply. A team met during four learning sessions
over a period of eight to nine months with the purpose of developing a model for enhanced
efficiency and accessibility. First they identified access-related problems, designed a survey
and developed ways to measure the “baseline” for waiting times and access. In the second
learning session they analysed the survey results, and based on those they developed a
strategy for how to balance demand and supply to improve access. Later on in the process,
the team met to learn from each other and to make sure that the gained knowledge was
implemented in the system. The results are positive: among the first 11 participating
teams in the county of Jönköping, median waiting times were reduced in 8 months from
90 days to 7 days, results that have been sustained over the last seven years. The model has
been spread on a national level, and 16 county councils have participated in the
“Bra Mottagning” collaborations. Access was improved in 80% of the participating counties.
A general impression is that the top managers’ commitments and attitudes toward the
project are of great importance to its success (Strindhall and Henriks, 2007).
WAITING TIME POLICIES IN THE HEALTH SECTOR: WHAT WORKS? © OECD 2013 287
II.15. SWEDEN
In the county of Gävleborg, the “Division Operation” project was introduced in 2009.
Inspired by the industry, it focused on production and accessibility. The goal was to
guarantee high-quality health care for the citizens in an efficient way without increasing
the costs. The new model implied a change of focus, from long waiting times to the core
activity, namely the surgery. According to the model, planning and follow-ups were
systematically carried out to create potential for a successful outcome. The “production”
was evaluated at all levels, from managers to staff. As a result of the project, during the last
two years the numbers of surgeries increased by 18% with the same amount of staff. The
waiting times were reduced: the number of patients waiting more than 90 days for a first
visit decreased from 4 900 to 600, and the number of patients waiting for surgery decreased
from 2 700 to 170. These reductions also mean less suffering and lower costs for medical
products and sick leave. The new model also changed the work tasks among some of the
personnel, towards more planning and administrative tasks (SALAR, 2011). Although these
results cannot be generalised to all of Sweden, they serve as interesting examples of how
long-term efforts to reduce waiting times and enhance efficiency are being carried out.
Negative effects due to the waiting time guarantee
In 1999, concern was already being raised about the risk of a “crowding-out” effect due
to the waiting time guarantee (Socialstyrelsen, 1999). The concept of crowding-out in this
case refers to clinics prioritising lower-priority patients at the expense of sicker and higher-
priority patient groups in order to fulfil the criteria for the guarantee and the Queue Billion.
Despite the concerns, the empirical evidence is scarce and difficult to measure. One kind of
crowding-out is to prolong the waiting time for check-ups and readmissions. However, only
a few counties are following up waiting times for those categories of visits. The NBHW has,
however, compiled a number of smaller studies to give an initial glimpse. These results
clearly show that crowding-out has occurred for readmissions but we still know little of the
extent. A number of interviews were also carried out among personnel within different parts
of the health care system; the results are diverse. Doctors seem to be more concerned than
management and administrative personnel about crowding-out effects. A common view is
that, due to the waiting time guarantee and the Queue Billion, readmissions and check-ups
are being de-prioritised for the benefit of first-time visitors (Socialstyrelsen, 2012).
Moreover, results from a survey of all orthopaedists in Sweden showed that a large
majority of them believed that the medical priorities of different groups of patients were
adversely affected by the waiting time guarantee and the Queue Billion. The doctors
experienced that younger, healthier and more-demanding patients received faster care at
the expense of other patient groups. The fact that certain groups are crowded out is not,
according to the doctors, compatible with the basic principle of equitable health care
provision according to need (Winblad & Andersson, 2010).
ConclusionsAs shown in this chapter, waiting times have been a salient problem in the Swedish
health care system since the 1980s. Politicians have feared that people’s trust in a general
tax-financed health care system would decrease if measures were not taken to improve
accessibility. This, in turn, has made governments willing to introduce different measures,
for instance waiting time guarantees, to come to terms with long waiting times for
health care.
WAITING TIME POLICIES IN THE HEALTH SECTOR: WHAT WORKS? © OECD 2013288
II.15. SWEDEN
Looking back, the previous two decades display a pattern of temporary reductions in
waiting times in the first years after the introduction of a new waiting time guarantee. A
couple of years later on, the effects on waiting times have subsided, followed by a new
sharper guarantee. However, the current guarantee, redesigned in 2005, seems to have had
a more positive effect on waiting times. In recent years a positive trend has shown that
more patients than before are receiving treatment and surgery within 90 days. It is too
early to determine whether the previous pattern of a subsiding effect will appear again. It
should, however, be added that the current guarantee, made statutory in 2010, is
economically supported by the Queue Billion, which seems to have provided a strong
incentive for clinics to live up to the intentions of the guarantee. The economic policy tools
were weaker for the former guarantees, whereas the Queue Billion has given clear
economic incentives for the individual clinics to cut waiting times.
An alternative explanation for the better results of the new guarantee might be its
statutory form. The former waiting time guarantees consisted of agreements between the
state and the county councils. Agreements, i.e. a form of consensual steering, have been
typical for Swedish governance within health care (Fredriksson et al., 2011) and allow for a
gradual adaptation to the needs and resources of the health care system at the local level.
This flexibility was one reason why the SALAR favoured the agreement over legislation. On
the downside, an agreement is a weaker juridical form, and it is plausible that this created
a diffuse policy content, with the result that the county councils in practice prioritised the
guarantee differently, possibly leading to differences in waiting times among the regions.
Moreover, patients were definitely uncertain about the claims that they could make to their
providers. When all counties are obliged to act according to rules formulated at the
national level, this may also lead to greater equality in health care between regions. It is
plausible that the legalisation of the waiting time guarantee in 2010 might have led to
improvements in this respect, but since the change is new it is hard to draw any final
conclusion about the change. It is important to remember, though, that the design of the
guarantee does not make it possible for patients to sue their providers (Rynning, 2012).
There is, however, a need for more thorough research to assess what causal
mechanisms explain the reduced waiting times. Some interviews and hearings have been
conducted among county council officials and medical doctors about possible
explanations. Economic incentives, administrative interventions such as “cleaning up” the
waiting lists and the purchase of services from other producers are mentioned in some
counties as causes of improvement.
From a governance perspective, the national waiting time guarantee is also interesting
to examine since, in some respects, it seems to stand in opposition to medical logic. The
guarantee aims to put greater pressure on health care providers to shorten waiting lists, but
also questions the usual procedures that doctors use to determine when patients should be
treated. Never before has the state intervened and regulated the time frame within which a
treatment should be performed in such a conspicuous manner – this has traditionally been
regarded as the medical profession’s domain. As mentioned above, the waiting time
guarantee has been criticised by individual physicians, as they believe that it breaches the
parliament’s priority guidelines (Winblad and Andersson, 2010). These physicians assert, for
example, that younger patients with less severe symptoms are prioritised before the elderly,
the chronically ill and more severely ill patients, which is contrary to the profession’s views
on how health care should be planned and conducted. This clearly illustrates the difficult
conflicts that may result when the state chooses to legislate or regulate areas of health care,
WAITING TIME POLICIES IN THE HEALTH SECTOR: WHAT WORKS? © OECD 2013 289

II.15. SWEDEN
while at the same time trying to maintain a relatively autonomous medical profession with
expertise and the ability to make independent decisions.
A fundamental condition for the waiting time guarantee to be fully implemented is
that the staff and patients know what their rights are. This problem poses a serious threat
to the success of the guarantees insofar as empowering patients is concerned
(Socialstyrelsen, 2011b). A new evaluation by the NBHW reports that information about the
guarantee given by the county councils to the citizens differs between counties, and many
counties cannot give patients specific information about current waiting times. Further, a
survey among the citizens shows that overall knowledge about the guarantee is rather low,
and many patients do not know where to go to get information or to complain about long
waiting times (Socialstyrelsen, 2012).
Another issue that needs to be raised is the design of the guarantee. Certain negative
sanctions are built into the guarantee. Patients are allowed to use their “choice mechanism”,
i.e. to seek care at another hospital if they are not treated within the set time limit. It is either
the patient’s home clinic or the county council centrally that pays for patients seeking care
elsewhere. As shown above, the counties are highly autonomous, and in practice there are
large variations in how the county councils have chosen to cover costs for patients who use
the guarantee in other regions. Presumably, clinics paying themselves for waiting time
patients are less inclined to refer patients to other care providers if they themselves must
bear the costs. On the other hand, this might be an effective incentive to keep waiting times
short, and might be more effective in the long run. Here, more research is needed to find out
which design is the most effective on a national basis.
A major shortcoming of the evaluations of the waiting time guarantee and the
Queue Billion, though, is the lack of studies regarding changes in production. As mentioned
before, an improvement in waiting times, measured as fewer patients waiting more than
90 days for a visit or treatment, does not necessarily mean that more patients are being
examined or treated. Hence, one can argue for the need for complementary measurements
like changes in production to better evaluate health care accessibility. The empirical findings
regarding production are still few, but there have been some studies of changes in the
number of operations which indicate that the number of procedures within ten areas of
specialist care did increase between 2004 and 2010, with 27.3% of the major improvement
taking place between 2008 and 2010, i.e. during the time of the Queue Billion. One might
expect that reduced waiting times would follow an increase in production. However, in some
cases the analysis suggests a reversed pattern. Two areas of specialist care with distinct
problems in meeting the waiting time guarantee were at the same time best when it came to
increasing productivity (Socialstyrelsen, 2012). This pattern highlights the need to also
consider the demand side in the analysis of waiting times. It is still unknown whether the
medical indications for being put on the waiting list have been sharpened or broadened and
how other demographic aspects might change the demand side.
Notes
1. Hip replacement, knee replacement, surgery for cataracts, prolapse operations, surgery for urinaryincontinence, gallstone surgery, hernia surgery, PTCA, coronary artery surgery, angiography,surgery for prostate enlargement and fitting of hearing aids.
2. In December 2011, a decision was made by the government to prolong the Queue Billion foranother year (Socialdepartementet, 2011, Protokoll 1:7, S2011/11007/FS).
3. The survey was carried out in 2011.
WAITING TIME POLICIES IN THE HEALTH SECTOR: WHAT WORKS? © OECD 2013290

II.15. SWEDEN
References
Andersson, C. (2007), “Kan politiken styra vården? – om hinder för implementering av en nationellvårdgaranti i sjukvården”, Bachelor Thesis, Department of Government, Uppsala University.
Anell, A., A.H. Glenngård and S. Merkur (2012), “Sweden: Health System Review”, Health Systems inTransition, Vol. 14, No. 5, pp. 1-159.
Bemelmans-Videc, M., R.C. Rist and E. Vedung (eds.) (2003), Carrots, Sticks & Sermons: Policy Instrumentsand their Evaluation, Transaction, New Brunswick, NJ.
Calltorp, J. (2006), “Projektet Vårdgaranti 05 – mot en“kö-fri’ sjukvård”, Socialmedicinsk tidskrift, Vol. 5-6/2006, pp. 351-356.
European Commission (2007), Eurobarometer No. 283, “Health and Long-term Care in the EuropeanUnion”.
Federation of County Councils – FCC (2005), “Överenskommelse mellan staten och Landstingsförbundetom införande av en nationell vårdgaranti och en fortsatt satsning på förbättrad tillgänglighet i hälso-och sjukvården”.
Fredriksson, M., P. Blomqvist and U. Winblad (2011), “Conflict and Compliance in Swedish Health CareGovernance: Soft Law in the ‘Shadow of Hierarchy’”, Scandinavian Political Studies, E-pub ahead ofprint.
Hanning, M. (1996), “Maximum Waiting-time Guarantee – An Attempt to Reduce Waiting Lists inSweden”, Health Policy, Vol. 36, pp. 17-35.
Hanning, M. (2005), “Maximum Waiting-time Guarantee – A Remedy to Long Waiting Lists?”,Dissertation, Acta Universitatis Upsaliensis, Uppsala University.
Hanning, M. and M. Lundström (2007), “Waiting for Cataract Surgery – Effects of a Maximum Waiting-time Guarantee”, Journal of Health Services Research & Policy, Vol. 12, No. 1, pp. 5-10.
OECD (2012), OECD Health Data, OECD Publishing, Paris, http://dx.doi.org/10.1787/health-data-en.
Ramböll (2012), “The 2011 Commonwealth Fund International Health Policy Survey Result”, Resultatetför äldre i Sverige, January.
Regeringen (1986), “Särskild ersättning till sjukvårdshuvudmännen för att öka operationskapaciteteninom sjukvården”, Prop. 1986/87:114.
Regeringen (2002), “Redogörelse för en överenskommelse mellan staten och Landstingsförbundet omvissa ersättningar till hälso- och sjukvården för år 2003”, Regeringens skrivelse, Vol. 2002/03:51.
Regeringen (2010), “Förslag till statsbudget för 2011: Hälsovård, sjukvård och social omsorg”,Regeringens Prop. 2010/11:1, Utgiftsområde 9.
Rynning, E. (2012), Email correspondence, June 2012.
SALAR – Swedish Association of Local Authorities and Regions (2009), “Utvecklingen i svensk hälso-och sjukvård”, Sveriges Kommuner och Landsting, Stockholm.
SALAR – Swedish Association of Local Authorities and Regions (2011), Ekonomirapporten, SverigesKommuner och Landsting (SKL), Stockholm.
SALAR – Swedish Association of Local Authorities and Regions (2012), “Väntetider i vården”, availableat: www.vantetider.se, accessed 22 February 2012.
SFS (1982), “Hälso-och sjukvårdslag”, Vol. 1982:763, Health and Medical Services Act.
Socialdepartementet (2009a), “Överenskommelse mellan staten och Sveriges Kommuner ochLandsting om en nationell satsning för en fungerande vårdgaranti”.
Socialdepartementet (2009b), “Stärkt ställning för patienten – vårdgaranti, fast vårdkontakt ochförnyad medicinsk bedömning”, Prop. 2009/10:67.
Socialdepartementet (2011), “Uppdrag att utbetala medel för den s.k. kömiljarden utifrån uppnåddaresultat under 2010”, Regeringsbeslut, S2010/4889/FS.
Socialstyrelsen (1997), “Fyra år med vårdgaranti – erfarenheter och effekter. Socialstyrelsen följer uppoch utvärderar”.
Socialstyrelsen (1999), “En behandlingsgaranti i sjukvården – förutsättningar och konsekvenser”.
Socialstyrelsen (2008), “Uppföljning av den nationella vårdgarantin”.
WAITING TIME POLICIES IN THE HEALTH SECTOR: WHAT WORKS? © OECD 2013 291
II.15. SWEDEN
Socialstyrelsen (2010), “Uppföljning av den nationella vårdgarantin och “kömiljarden’”, Årsrapport 2010.
Socialstyrelsen (2011a), “NordDRG: DRG-användning i svenska landsting år 2011”, available online at:www.socialstyrelsen.se/klassificeringochkoder/norddrg, accessed 21 June 2012.
Socialstyrelsen (2011b), Uppföljning av den nationella vårdgarantin och “kömiljarden”, Årsrapport 2011.
Socialstyrelsen (2011c), Väntetider inom cancervården – från remiss till behandling.
Socialstyrelsen (2012), Vårdgaranti och kömiljard – uppföljning 2009-2011.
SOU (1995), Vårdens svåra val, 1995:5, Swedish Government Official Report.
Spri (1992), Mer sjukvård för pengarna – sammanfattning av DAGMAR 50, Spri Report No. 329, SwedishInstitute for Health Services Development, Stockholm.
Strindhall, M. and G. Henriks (2007), “How Improved Access to Healthcare Was Successfully Spreadacross Sweden”, Quality in Management of Health Care, Vol. 16, No. 1, pp. 16-24.
Styrborn, K. (1994), “Geriatric Decision-making: A Study of Medical and Organizational Aspects ofDischarge Planning”, Dissertation, Acta Universitatis Upsaliensis, Uppsala University.
Winblad, U. and C. Andersson (2010), “Kåren och köerna: en ESO-rapport om den medicinskaprofessionens roll i styrningen av svensk hälso- och sjukvård”, Finansdepartementet.Regeringskansliet, Stockholm.
Winblad U, K. Vrangbæk and K. Östergren (2010), “Do the Waiting-time Guarantees in theScandinavian Countries Empower Patients?”, International Journal of Public Sector Management,Vol. 23, No. 4, pp. 353-363.
WAITING TIME POLICIES IN THE HEALTH SECTOR: WHAT WORKS? © OECD 2013292

Waiting Time Policies in the Health Sector
What Works?
© OECD 2013
PART II
Chapter 16
United Kingdom
by
Peter C. Smith,
Imperial College Business School and Centre for Health Policy
and
Matt Sutton,
Institute of Population Health, University of Manchester
and Health Economics Research Unit, University of Aberdeen
Waiting times for elective hospital treatment have traditionally been a very highpolitical priority in the United Kingdom, and there have been numerous initiativesover the last twenty years designed to tackle them. The most successful was thesystem of waiting time targets, under which all National Health Service organisationswere given very clear maximum waiting times.
In England in 2009, a new NHS Constitution established a guarantee of a maximumwait of 18 weeks from initial referral to a specialist until eventual treatment. This hasbeen accompanied by a shift of emphasis away from centrally specified targetstowards patient choice.
Scotland performs well in comparison to the other countries of the United Kingdom,but recent relaxation of the “zero-tolerance” approach to violations of the targets hasbeen associated with deteriorating waiting times performance. Frequent revisions ofthe measurement of waiting times and the publication of increasingly complexstatistics on performance make it difficult to track consistent trends. The ultimateaims of waiting times policy in Scotland have not been evaluated.
293
II.16. UNITED KINGDOM
Main characteristics of the health-care system in the United KingdomIn the United Kingdom, there is the National Health System (NHS), created in 1948,
which provides “universal coverage” and is financed and delivered primarily by the public
sector. In 2010, public spending accounted for 83.2% of health spending in the United
Kingdom, which is higher than the average of 72.2% in the OECD countries.
The political devolution carried out in 1999 by the United Kingdom Parliament
transferred a range of powers to the Scottish Parliament and the Assemblies in Wales and
Northern Ireland. Health was one of the main powers devolved, and this has created some
divergence in the way the National Health Service is organised in England and Scotland.
However, it is important to note that political devolution has not been accompanied by
fiscal devolution, and the NHS is financed by general taxation and national insurance
contributions for the United Kingdom as a whole.
In England, there has been significant re-organisation of the NHS with the passage of
the Health and Social Care Bill in 2012. During the period covered by this case study, the
Department of Health, under the direction of the Secretary of State for Health, had overall
responsibility for the NHS. The Department operated at a regional level through 10
strategic health authorities (SHAs). Responsibility for commissioning health services at the
local level was through 151 Primary Care Trusts (PCTs), each covering a geographically
defined population (Boyle, 2011). In 2004, Monitor was created as an independent regulator
reporting directly to Parliament in order to strengthen the financial regulation of health
providers known as NHS Foundation Trusts. Monitor determines whether NHS Trusts are
ready to become Foundation Trusts and ensures NHS Foundation Trusts are well-led and
financially robust (Monitor, 2012).
Under the recent re-organisation in England, there has been a separation of functions
between the Department of Health and the newly established NHS Commissioning Board.
The Commissioning Board is responsible for the day-to-day running of the NHS, whilst the
Department of Health will focus mainly on public health and social care. The Strategic
Health Authorities and Primary Care Trusts have been abolished. Local commissioning will
be the responsibility of Clinical Commissioning Groups, made up of consortia of General
Practices, which will become the major purchasers of many NHS services, including
commissioning services from hospitals within their catchment area. The recent reforms
also enhance the role of Monitor as an independent economic regulator, including with
regard to competition and the integration of the health services. Monitor will also play a
more active role in price-setting in collaboration with the NHS Commissioning Board.
In Scotland, the operation of the NHS has always been separate from the rest of the
United Kingdom, but responsibility for the NHS was formally devolved to the Scottish
Government in 1999. The NHS in Scotland is organised into 14 regional health authorities
(called NHS Boards), which are both purchasers and providers. The Boards receive annual
budgets from the central government, based on weighted capitation, to finance the
delivery of health care for geographically defined populations. The Boards are responsible
WAITING TIME POLICIES IN THE HEALTH SECTOR: WHAT WORKS? © OECD 2013294
II.16. UNITED KINGDOM
for providing all health services to a geographical population, purchasing and providing
services. In Scotland, there is no purchaser/provider split, and primary and secondary care
are integrated.
Hospitals
In the United Kingdom, the number of beds in publicly owned hospitals decreased by
23.7% between 2000 and 2010, leaving 2.96 beds per 1 000 population in 2010, compared to
4.1 per 1 000 in 2000 (OECD, 2012).
In England, publicly owned hospitals are known as “trusts”. In 2004, a new form of
governance for NHS Trusts was introduced – NHS Foundation Trusts (FTs) – under the
Health and Social Care (Community and Health Standards) Act 2003. These are
independent public benefit corporations controlled and run locally, not centrally, and they
have more freedom to retain surpluses and to recruit and employ their own staff (Boyle,
2011). As of April 2012, there were 144 NHS FTs, of which 41 are mental health trusts and
three are ambulance trusts (Monitor, 2012).
In Scotland, the NHS Boards own, manage and run hospitals.
Hospital remuneration
In England, there has been a separation since 1991 between purchasers (Primary Care
Trusts – PCTs), which are soon to be replaced by the “Clinical Commissioning Groups”, and
providers of hospital and community services. Public hospitals are remunerated following
contracts that specify the services to be provided and the terms on which they are to be
supplied. National “Payment by Results” (PbR) tariffs (akin to diagnosis-related group
payments) were introduced in 2004 and have been extended across a large range of NHS
services (Department of Health, 2011c). PbR links the hospital’s case mix to remuneration,
with payments being made per patient according to the complexity of their healthcare
needs (Department of Health Payment by Result Team, 2011). PbR tariffs currently cover the
majority of acute care in hospitals, including admitted patient care, outpatient
attendances, some outpatient procedures and accident and emergency care (ibid.).
In Scotland, there is no distinction between the financing of health boards and
hospitals as there is no purchaser/provider split. NHS Boards receive a budget based on
weighted capitation (as do PCTs in England) and run hospitals (rather than contracting for
hospital services as in England).
Specialist remuneration
Across the United Kingdom, public hospital doctors are salaried; full-time NHS
consultants (i.e. senior specialists) are also permitted to work privately for fee-paying
patients (NHS Employers, 2003). Private consultations and treatments can take place in
publicly funded hospitals as well as in private hospitals. The NHS consultant contract (NHS
Employers, 2003) includes contributions to an on-call rota, and sets out conditions under
which additional payments for services or overtime may be given.
Since 2004, the NHS Scotland has been instituting “pay modernisation”, “which
encourage staff to broaden their skills and embrace new working methods” through a
series of new contracts for consultants, GPs and non-medical NHS staff (Scottish
Government, 2009). A new contract for NHS Scotland “Specialty Doctors and Associate
Specialists” (SAS contract) is being implemented at present. The 2004 consultant contract
WAITING TIME POLICIES IN THE HEALTH SECTOR: WHAT WORKS? © OECD 2013 295
II.16. UNITED KINGDOM
for the NHS Scotland sets out new terms and conditions for consultants, along with a pay
rise. This contract created a new pay grade for NHS medical staff and specifies that
consultants are entitled to receive fees for work completed in their own time, and should
not receive fees for work done during programmed activities for the NHS (British Medical
Association, 2011).
In the United Kingdom, the income of salaried specialists was 2.64 per average wage in
2010 (OECD, 2012).
Co-payments
In England and Scotland, patients do not have co-payments for hospital services. In
England, prescription charges are set at a basic rate of GBP 7.40, although 90% are exempt
from payment. This prescription charge does not include medication administered in NHS
hospitals. Co-payments on prescriptions were cancelled in 2011 in Scotland.
Private health insurance
In the United Kingdom, private insurance accounted for 3.2% of total health
expenditure in 2010, down from 4.1% in 2000 (OECD, 2012). In 2008, there were
approximately 4.4 million subscribers to private medical insurance covering 7.6 million
people or 13% of population. Of the 4.4 million subscribers, 3.3 million were to employer
insurance schemes and 1.1 million to individual schemes (Boyle, 2011). Private insurance is
supplementary to NHS services and allows patients to decrease waiting times for elective
surgery.
Primary care
In England and Scotland, general practitioners (GPs) act as providers of general
medical services and as gatekeepers to secondary care. Patients can directly access
specialist hospital care in an emergency through accident and emergency facilities, but for
all other hospital care (known as elective care), they must first contact their GP. GPs are
usually organised in groups or practices and are primarily remunerated by capitation
according to the number of patients on their list. Since 2004, the Quality and Outcomes
Framework (QoF) was introduced across the United Kingdom; this is a large-scale pay-for-
performance scheme, where payment is linked to the achievement of targets related to
quality indicators.
In the United Kingdom, the income of salaried GPs was 1.92 per average wage in 2009.
Self-employed GPs had a much higher income, 3.5 per average wage the same year
(OECD, 2012).
Surgical activity
For a number of procedures, the UK experienced a shift from in-patient to day-case
surgery between 2007 and 2010. Of procedures performed as in-patient within the same
period, coronary bypass has experienced the largest decrease (-21.7%). Day-care surgery
rates increased more rapidly in England. In 1996, England had lower rates than Scotland,
but by 2006 England had higher rates (Connolly et al., 2010).
Health expenditure
Health spending accounted for 9.6% of GDP in the United Kingdom in 2010, just above
the OECD average of 9.5%. In terms of per capita spending on health, the United Kingdom
WAITING TIME POLICIES IN THE HEALTH SECTOR: WHAT WORKS? © OECD 2013296
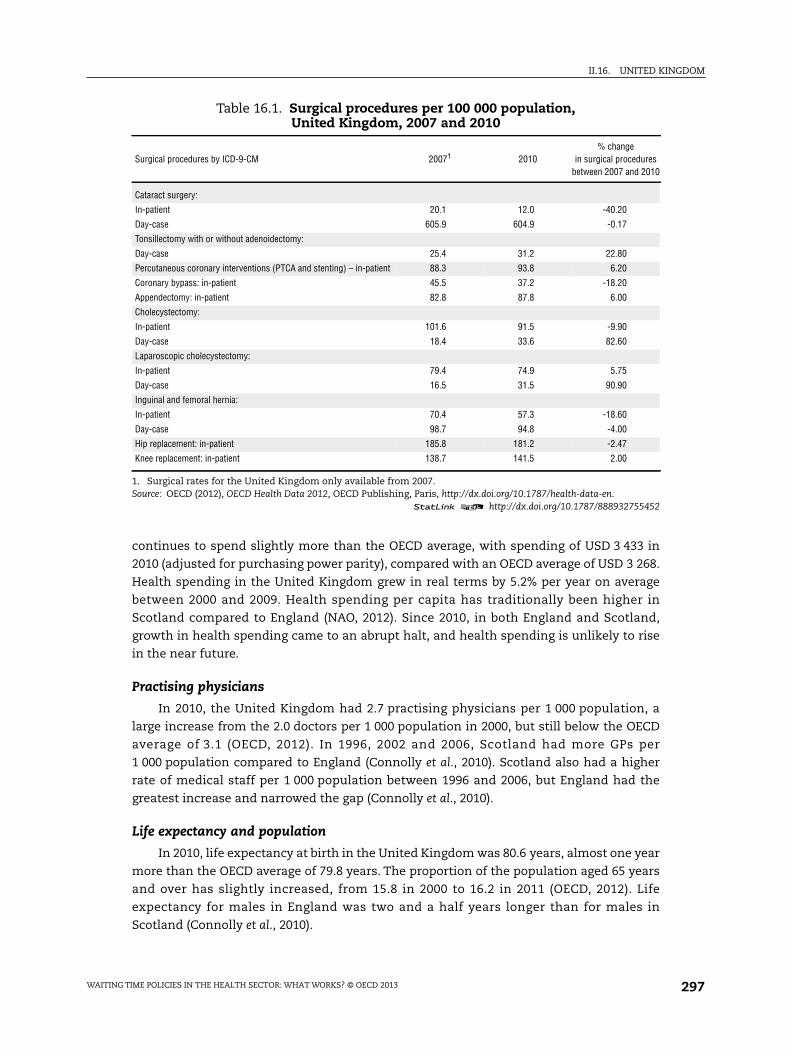
II.16. UNITED KINGDOM
continues to spend slightly more than the OECD average, with spending of USD 3 433 in
2010 (adjusted for purchasing power parity), compared with an OECD average of USD 3 268.
Health spending in the United Kingdom grew in real terms by 5.2% per year on average
between 2000 and 2009. Health spending per capita has traditionally been higher in
Scotland compared to England (NAO, 2012). Since 2010, in both England and Scotland,
growth in health spending came to an abrupt halt, and health spending is unlikely to rise
in the near future.
Practising physicians
In 2010, the United Kingdom had 2.7 practising physicians per 1 000 population, a
large increase from the 2.0 doctors per 1 000 population in 2000, but still below the OECD
average of 3.1 (OECD, 2012). In 1996, 2002 and 2006, Scotland had more GPs per
1 000 population compared to England (Connolly et al., 2010). Scotland also had a higher
rate of medical staff per 1 000 population between 1996 and 2006, but England had the
greatest increase and narrowed the gap (Connolly et al., 2010).
Life expectancy and population
In 2010, life expectancy at birth in the United Kingdom was 80.6 years, almost one year
more than the OECD average of 79.8 years. The proportion of the population aged 65 years
and over has slightly increased, from 15.8 in 2000 to 16.2 in 2011 (OECD, 2012). Life
expectancy for males in England was two and a half years longer than for males in
Scotland (Connolly et al., 2010).
Table 16.1. Surgical procedures per 100 000 population,United Kingdom, 2007 and 2010
Surgical procedures by ICD-9-CM 20071 2010% change
in surgical proceduresbetween 2007 and 2010
Cataract surgery:
In-patient 20.1 12.0 -40.20
Day-case 605.9 604.9 -0.17
Tonsillectomy with or without adenoidectomy:
Day-case 25.4 31.2 22.80
Percutaneous coronary interventions (PTCA and stenting) – in-patient 88.3 93.8 6.20
Coronary bypass: in-patient 45.5 37.2 -18.20
Appendectomy: in-patient 82.8 87.8 6.00
Cholecystectomy:
In-patient 101.6 91.5 -9.90
Day-case 18.4 33.6 82.60
Laparoscopic cholecystectomy:
In-patient 79.4 74.9 5.75
Day-case 16.5 31.5 90.90
Inguinal and femoral hernia:
In-patient 70.4 57.3 -18.60
Day-case 98.7 94.8 -4.00
Hip replacement: in-patient 185.8 181.2 -2.47
Knee replacement: in-patient 138.7 141.5 2.00
1. Surgical rates for the United Kingdom only available from 2007.Source: OECD (2012), OECD Health Data 2012, OECD Publishing, Paris, http://dx.doi.org/10.1787/health-data-en.
1 2 http://dx.doi.org/10.1787/888932755452
WAITING TIME POLICIES IN THE HEALTH SECTOR: WHAT WORKS? © OECD 2013 297

II.16. UNITED KINGDOM
Waiting times in the English national health service: a policy success story1
Introduction
The English National Health Service is an archetypical centrally planned health system.
The bulk of its revenue comes from general national taxes, and user fees are zero for most
services. When it was created in 1948, the NHS inherited a list of over 400 000 patients
waiting for hospital in-patient treatment in England and Wales. Ever since then, waiting lists
and waiting times have been a stubborn feature of the NHS that has often become a focus of
intense national political debate and controversy. Waits occur throughout the NHS, for
example in emergency rooms, and in securing access to primary care, diagnostic tests and
specialist consultations. However, until recently the main focus of attention was the wait for
non-emergency hospital treatment. Figure 16.1 shows the size of this waiting list over time.
Note that waits for hospital day-case treatment as well as in-patient treatment are
conventionally included in these data.
A signal of the long-standing political concern with NHS waiting has been the large
number of initiatives launched by successive governments to reduce the waiting time for
treatment. These include: periodic injections of special finance directed at hospitals with
especially long waits; a 1991 “Patient’s Charter” that guaranteed all patients in-patient
treatment within two years (soon reduced to 18 months); and encouragement for patients
and their general practitioners to seek out providers who offer short waits. There has
historically been a small private market for elective treatment that has used long NHS
waiting times as an important marketing device.
In examining English experience with waiting lists, it is important to note the role of
general practitioners (GPs) in shaping demand for health care. Every citizen must be
registered with a general practitioner, who acts as a “gatekeeper” to NHS specialist care.
No-one can secure an initial appointment with an NHS specialist without a referral by a GP
or other approved clinician, and patients have historically relied heavily on GP advice.
Reforms currently being implemented create an even more important role for GPs, as they
will become members of GP consortia that are given budgets with which to purchase the
Figure 16.1. The National Health Service waiting list, England,1949 to 2010
Source: UK Department of Health, www.performance.doh.gov.uk/waitingtimes/index.htm.1 2 http://dx.doi.org/10.1787/888932754521
1 400 000
1 200 000
1 000 000
800 000
600 000
400 000
200 000
0
1949
1952
1955
1958
1961
1964
1967
1970
1973
1976
1979
1982
1985
1988
1991
1994
1997
2000
2003
2006
2009
WAITING TIME POLICIES IN THE HEALTH SECTOR: WHAT WORKS? © OECD 2013298

II.16. UNITED KINGDOM
bulk of secondary care for their patients (Department of Health 2010a). This will give GPs a
dual role, in advising patients on their health needs and safeguarding taxpayers’ funds.
When the Blair Government came to power in 1997 the size of the waiting list was
rising rapidly, and reduction of the list was a high political priority. Throughout its 13 years
of government (until May 2010), health care waiting times were a major preoccupation of
the Labour Government, with attention moving beyond routine hospital treatment to
embrace increasingly detailed scrutiny of waiting times for suspected cancer referrals,
ambulance responses, diagnostic tests, general practitioner visits, and accident and
emergency treatment.
This chapter summarises experience in England since 2000, when the influential NHS
Plan was published (Department of Health, 2000). The Plan reflected a recognition that the
English health system had for many years been underfunded relative to its international
counterparts, and appeared to perform relatively poorly on measures of clinical quality
and waiting times. The intention was to inject considerable extra funding into the NHS, in
exchange for a marked improvement in performance, in particular in relation to waiting
times. Numerous reforms were implemented as a result, and this chapter describes the
most important.
The next section describes current waiting time policies. We then describe the system
of “Public Service Agreements” that formed the backdrop for public sector reform in
England through most of the 2000s and for the subsequent evolution of waiting time
targets over the decade. This is followed by brief descriptions of other relevant policy
instruments developed over the same period: the promotion of patient choice and the
associated provider payment mechanism; the search to improve the quality of NHS
purchasing; the promotion of diversity among providers; improved information for
patients and purchasers; and direct support and intervention by the health ministry. We
conclude with an assessment of the English experience.
Throughout it is important to recognise the different metrics that have been used to
measure waiting at different stages in NHS history. So far as waits for elective surgery are
concerned, early attention focused on the size of the in-patient waiting list. This is readily
measured, but is only a very indirect indicator of the waiting time experience by
individuals, the prime metric of concern. Therefore from the early 1990s attention shifted
to the time patients wait for treatment. At first this referred to the time between a decision
that in-patient treatment was needed and the treatment being received. This was captured
by a) a quarterly census of all patients on the waiting list, which could be used to identify
patients with especially long waits, and was therefore a useful management tool, and
b) administrative data on the length of time patients who received treatment had waited,
a more retrospective indicator of provider performance. As described below, from 2008
attention shifted to measuring the time patients took to complete the entire journey, from
initial referral to eventual treatment. In contrast to the previous metric, this “referral to
treatment” wait included the wait for an initial specialist appointment, as well as for any
subsequent diagnostic tests.
Current policies
Until recently, the NHS has with some success relied on central planning and explicit
waiting time targets to secure reductions in waiting times. This experience is described in
more detail in the following sections. However, the most recent trend, started by the Labour
WAITING TIME POLICIES IN THE HEALTH SECTOR: WHAT WORKS? © OECD 2013 299

II.16. UNITED KINGDOM
Government and retained and extended by the incoming coalition government, has been
to rely more on markets and competition to increase supply (including private provision)
and reduce waiting times. At the point of first referral, patients have the right to choose any
public or private provider authorised to provide NHS treatment.
This right has been reinforced by the creation of a set of patient entitlements, through a
new legal instrument known as the NHS Constitution (Department of Health, 2010b). This
was established in 2009 and sets out the rights and responsibilities of patients and citizens
in areas such as access to care, quality of care, respect and confidentiality, choice, and
complaint and redress. In particular, in 2010 it created entitlements in respect of waiting
times, expressed as follows: “You have the right to access services within maximum waiting
times, or for the NHS to take all reasonable steps to offer you a range of suitable alternative
providers if this is not possible.” The Constitution embraced two existing rights (to treatment
within 18 weeks of first referral by a general practitioner, and to be seen by a cancer specialist
within two weeks of GP referral for suspected cancer). In addition, Table 16.1 sets out a
further 12 government pledges on waiting times for patients with urgent conditions, such as
cancer and heart disease, which were in force in November 2011.
The fundamental benchmark for waiting time for elective specialist treatment has
from 2008 been the wait from initial general practitioner referral to the start of specialist
treatment (whether or not treatment requires admission to hospital), known as the referral
to treatment (RTT) wait. The NHS Constitution states that “you have a right to start your
consultant-led treatment within a maximum of 18 weeks from referral for non-urgent
conditions”. The Department of Health undertakes monthly monitoring of the 18-week
metric for all specialities and providers, and has set operational standards that 90% of
patients admitted to hospital for treatment and 95% of those not requiring hospital
admission should be treated within the 18-week limit. The “standard” NHS contract with
providers for acute services requires that – subject to certain limitations – any breach of
these targets will result in a reduction of up to 5% of revenue for the relevant speciality in
the month in which the breach occurs (Department of Health, 2011a).
Trends in RTT since 2008 are shown in Figure 16.2, which shows the median RTT wait
and the 95th percentile for patients admitted to hospital. It indicates a stable median, and
rapid reduction in the number of “long” waiters when the metric was first adopted, to
Table 16.2. NHS pledges on waiting times, England, November 2011
● a maximum 31-day wait after diagnosis for surgery for cancer;● a maximum 31-day wait after diagnosis for start
of an anti-cancer drug regimen;● a maximum 62-day wait from referral for suspected cancer
to first treatment for all cancers;● a maximum two-week wait to see a specialist for all patients
referred for investigation of breast symptoms, even if cancer isnot initially suspected;
● a maximum four-hour wait in A&E from arrival to admission,transfer or discharge;
● access to a primary care professional within 24 hoursor a primary care doctor within 48 hours;
● a maximum three-month wait for patients who needa revascularisation;
● a maximum two-week wait for Rapid Access Chest Pain Clinics;● access to a genito-urinary medicine clinic within 48 hours
of contacting a service;● all patients who have operations cancelled, on or after the day
of admission (including the day of surgery), for non-clinicalreasons to be offered another binding date within 28 days,or the patient’s treatment to be funded at the timeand hospital of the patient’s choice;
● all ambulance trusts to respond to 75% of Category A calls withineight minutes and to respond to 95% of Category A calls within19 minutes of a request being made for a fully equippedambulance vehicle (car or ambulance) able to transportthe patient in a clinically safe manner; and
● all ambulance trusts to respond to 95% of Category Bcalls within 19 minutes.
Source: Handbook to the NHS Constitution (Department of Health, 2010), accessed 16 December 2011: www.nhs.uk/choiceintheNHS/Rightsandpledges/NHSConstitution/Documents/nhs-constitution-interactive-version-march-2010.pdf.
WAITING TIME POLICIES IN THE HEALTH SECTOR: WHAT WORKS? © OECD 2013300

II.16. UNITED KINGDOM
below 20 weeks. There is some suggestion of reduced levels of performance in 2011, with
95% of patients securing treatment within 23 weeks. The equivalent data for non-admitted
patients show great stability since early 2009, with a median of about four weeks and a
95th percentile of up to 16 weeks. Over 2011, the proportion of patients meeting the 18-
week target stabilised at about 90%, down from a maximum of 93.7% in May 2009.
Additional patient rights contained in the NHS Constitution include:
● A right to be seen by a cancer specialist within a maximum of two weeks from GP referral
for urgent referrals where cancer is suspected.
● A maximum 62-day wait from referral for suspected cancer to first treatment, for all cancers.
● A maximum 31-day wait for subsequent treatment after cancer is diagnosed.
Attainment of these targets by providers is monitored quarterly, but they are not
considered further in this chapter.
These recent developments represent a consolidation of major efforts made in the
decade from 2000 to tackle the chronic NHS waiting list problem. The reforms over that
decade, described in the next section, secured major improvements in NHS waiting times.
The 18-week RTT target was first set in 2004. Further major improvements in NHS waiting
times are unlikely to be sought in the foreseeable future, so the emphasis on the supply
side has shifted to preserving the gains that have been made, and keeping an operational
focus on maintaining the waiting time standards.
On the demand side, the creation of patient entitlements is a new development, the
full implications of which have yet to be observed. In combination with an increased
emphasis on market power through patient choice, the entitlements should be leading to
enhanced patient empowerment and increased pressure on providers to pay attention to
waiting time. However, producing evidence to confirm this trend will be challenging, and
there are at this time few observable indications of increased patient assertiveness
attributable specifically to waiting time pressures (Dixon et al., 2010).
Figure 16.2. Trends in “referral to treatment” waiting times for patients admittedto hospital (adjusted), England, 2008 to 2011
Source: UK Department of Health, available at http://transparency.dh.gov.uk/2012/06/29/rtt-waiting-times/.1 2 http://dx.doi.org/10.1787/888932754540
30
25
20
15
10
5
0
Median95th percentileWeeks
Mar. 08 Aug. 08 Jan. 09 Jun. 09 Nov. 09 Apr. 10 Sep. 10 Feb. 11 Jul. 11 Dec. 11
WAITING TIME POLICIES IN THE HEALTH SECTOR: WHAT WORKS? © OECD 2013 301

II.16. UNITED KINGDOM
A further potential demand-side influence is the role played by strategic purchasers of
health services. At present this role is fulfilled in England mainly by Primary Care Trusts,
local agencies that purchase health services on behalf of their populations. However,
imminent reforms envisage transferring the strategic purchase role to consortiums of
general practitioners, in what are to be known as Clinical Commissioning Groups. These
will be given annual budgets with which to purchase the bulk of health care for their
registered populations. An important research question will be the extent to which these
new clinically led purchasing groups maintain the existing managerial focus on waiting
times.
A requirement of any successful demand-side initiative is the availability of
meaningful information with which patients can reliably compare providers. The NHS
Choices website (www.nhs.uk/Pages/HomePage.aspx) offers a resource with which patients
can compare local hospitals on a range of criteria, including the average time for a first
appointment and average RTT waiting time for the specified procedure. However, at
present, a choice of provider is offered only at the point of first referral by a general
practitioner, at which time the patient may not know what the nature of the health
problem or recommended treatment might be. Furthermore, the website offers
comparison only between hospitals, and not between individual practitioners. As a result,
the power of the choice mechanism is likely to be severely blunted.
When it came to power in May 2010, the incoming Coalition government immediately
asked the Department of Health to abandon direct performance management of the
18-week RTT waiting time in June 2010. They argued that the RTT target was distorting
clinical priorities, and that patient choice and more active purchasing by general
practitioners would in any case remove the need for it. However, the 18-week commitment
remained in the NHS Constitution, the government continued to monitor median and
95th percentile RTT times achieved by organisations, and the NHS Operating Framework
continues to place great emphasis on RTT times.
Indeed, in the most recent NHS Operating Framework (November 2011), very detailed
operational standards are set out to achieve the benchmarks of 90% for admitted and 95%
for non-admitted completed waits within 18 weeks (Department of Health, 2011b). In order
to sustain the delivery of these standards for treated patients, the Operating Framework
argues that hospitals “will need to ensure that 92% of patients on an incomplete pathway
should have been waiting no more than 18 weeks”. This new standard seeks to overcome
the problem that the previous emphasis on completed treatments offered no incentive to
treat patients once they had breached the 18-week limit.
Earlier experience
Public service agreements
When it came to power in 1997, the Blair Government sought to revolutionise the way
in which UK public services are planned and delivered (Smith, 2007). To this end, the
principal initiatives that were introduced were:
● A system of explicit objectives and measurable national targets for government
ministries, in the form of what were known as Public Service Agreements (PSAs).
● A high profile “delivery unit” charged with monitoring progress against PSA targets and
where necessary demanding corrective action.
WAITING TIME POLICIES IN THE HEALTH SECTOR: WHAT WORKS? © OECD 2013302

II.16. UNITED KINGDOM
● A range of instruments designed by individual ministries to encourage local service
providers to achieve the national PSA targets.
Throughout, the prime minster placed considerable emphasis on the PSA regime, and
gave it active support at the highest level.
In common with other government ministries, from 1998 the Department of Health
set strategic targets every two years as part of the PSA system. For example, its 2004 PSA
targets covered four broad objectives, as follows:
1. Improve the health of the population.
2. Improve health outcomes for people with long-term conditions.
3. Improve access to services, in particular waiting times.
4. Improve the patient and user experience.
Objective 3 highlighted the importance of waiting times, which featured prominently
amongst the department’s objectives over the course of the PSA regime.
Table 16.3 summarises the evolution of relevant Department of Health objectives.
Throughout, it is important to note that PSA targets were generally used only where
significant change was a priority. Once a target was achieved, it usually became a separate
standard to be maintained. Waits for a first specialist appointment where cancer was
suspected were targeted in 1998, reflecting a concern at that time that England was
securing particularly poor cancer outcomes. General waits for a first out-patient
appointment with a hospital specialist were targeted from 2000, in addition to waits for
hospital treatment. Waits in accident emergency departments and for general practitioner
appointments were addressed for the first time in 2002.
The NHS Plan
The NHS Plan in 2000 was a comprehensive reassessment of the organisation of the
NHS, designed to secure marked changes in performance, in line with the PSA targets. It
was accompanied by a major increase in funding, to be phased in over several years. In
implementing its NHS Plan, the government claimed that “special effort will be focused on
Table 16.3. National waiting time objectives, England, 1999 to 2010
Spending review Targets
1998 CSR Ensure everyone with suspected cancer is able to see a specialist within two weeks of their GP deciding they need to be seenurgently and requesting an appointment for all patients with suspected breast cancer from April 1999, and for all othercases of suspected cancer by 2000.
2000 SR Reduce the maximum wait for an out-patient appointment to three months and the maximum wait for in-patient treatmentto six months by the end of 2005.
2002 SR Reduce the maximum wait for an out-patient appointment to three months and the maximum wait for in-patient treatmentto six months by the end of 2005; and achieve progressive further cuts with the aim of reducing the maximum in-patientand day-case waiting time to three months by 2008.Reduce to four hours the maximum wait in A&E from arrival to admission, transfer or discharge, by the end of 2004;and reduce the proportion waiting over one hour.Guarantee access to a primary care professional within 24 hours and to a primary care doctor within 48 hours by 2004.
2004 SR Ensure that by 2008 no-one waits more than 18 weeks from GP referral to hospital treatment.
2007 CSR The government is committed to ensuring that, by December 2008, no-one waits more than 18 weeks from GP referral tothe start of hospital treatment or other clinically appropriate outcome (for clinically appropriate patients who choose to starttheir treatment within 18 weeks). This target will apply to both admitted (to hospital) and non-admitted patients.
Source: Comprehensive Spending Reviews (CSR) and Spending Reviews (SR) 1998-2007 (accessed 16 December 2011):www.dh.gov.uk/en/Aboutus/HowDHworks/Servicestandardsandcommitments/DHPublicServiceAgreement/index.htm,www.hm-treasury.gov.uk/d/pbr_csr07_psa19.pdf.
WAITING TIME POLICIES IN THE HEALTH SECTOR: WHAT WORKS? © OECD 2013 303

II.16. UNITED KINGDOM
reducing waiting times for treatment since this is the public’s principal concern about the
NHS”. The main improvements projected for hospital patients are summarised in
Table 16.4. These include a dramatic reduction in maximum waiting times (measured from
the time that treatment was deemed necessary to the receipt of that treatment), to be
phased in over a six-year period. These targets were indeed largely achieved.
The NHS Plan also for the first time incorporated targets for the reduction of
maximum waiting times in accident and emergency departments to four hours by 2004,
suggesting further progressive reductions in the future. In addition, there was a
commitment to guarantee that by 2004 patients would be able to see a general practitioner
within 48 hours, or another primary care professional within 24 hours.
There was some concern that separate in-patient and out-patient targets failed to
address the real concern of patients with the total time taken to secure specialist
treatment, especially as it ignored the time taken for diagnostic tests and other activities
between the first appointment and a decision to put the patient on a treatment waiting list.
In 2004, the separate in-patient and out-patient targets were therefore integrated into the
single 18-week referral-to-treatment (RTT). By the time the final PSA targets were
published (in 2007), pursuit of lower waiting times had become embedded in the NHS
culture, and the 2007 “Comprehensive Spending Review” reiterated the central importance
of the 18-week RTT target. As explained above, this metric still forms the basis for NHS
waiting time standards and data reporting.
Performance report cards
Throughout the PSA regime, a central role of the Department of Health was to devise
operational instruments that transmitted the national PSA priorities to the local level. The
most important initiative to this end was the development of a system of “performance
ratings” for individual NHS organisations. From 2001 to 2009, every NHS organisation was
ranked annually on a four-point scale (zero to three stars) according to a series of about forty
performance indicators, amongst which waiting times featured prominently. In particular,
the national targets set out in Table 16.2 were embedded in these local report cards.
The indicators were intended directly to reflect the objectives of the NHS, as embodied
in the national PSA targets. They were combined according to a complex algorithm to
produce the star rating. The most important determinant of an organisation’s rating was
its performance against a set of about ten “key indicators”, which were dominated by
measures of various aspects of patient waiting times. This was augmented by a composite
measure of performance based on the 30 or so subsidiary indicators, combined in the form
of a “balanced scorecard” view of the organisation. Clinical quality comprised only a small
Table 16.4. Waiting time targets set in 2002, England
Date Maximum out-patient waiting time (weeks) Maximum in-patient waiting time (months)
March 2002 26 15
March 2003 21 12
December 2005 14 6
December 2008 – 3
Source: UK Department of Health (2002), Delivering the NHS Plan: Next Steps on Investment, Next Steps on Reform,Department of Health, London.
1 2 http://dx.doi.org/10.1787/888932755471
WAITING TIME POLICIES IN THE HEALTH SECTOR: WHAT WORKS? © OECD 2013304

II.16. UNITED KINGDOM
ar)
element of the calculation. As an illustration, Box 16.1 shows the key indicators and the
subsidiary indicators for NHS hospitals in 2004.
Box 16.1 underlines the key importance of various aspects of waiting in the
construction of the report cards. Important clinical issues such as the 30-minute door to
needle time for thrombolysis and the one-month diagnosis to treatment for breast cancer
were included amongst the subsidiary indicators, and therefore played only a modest role
in determining the organisation’s rating. It is also important to note that the early metrics
used for waiting time were often constructed such that a single breach of the maximum
standard led to a reduction in the overall score of the organisation, and a potential
reduction in the number of stars awarded.
The most striking innovation associated with performance ratings was the
introduction of very strong managerial incentives that depended on the level of
attainment, which some commentators characterised as a regime of “targets and terror”
(Bevan and Hood, 2006a). The Prime Minister’s Delivery Unit was also relentless in
reinforcing the pre-eminence of targets. The need to achieve targets became the dominant
focus of managerial attention, and the jobs of senior executives of poorly performing
organisations came under severe threat. Alongside the sanctions, rewards for good
Box 16.1. Indicators for constructing acute hospitals’ performance ratings, 2003-04
Key targets
● 12-hour wait standard for emergency in-patient admission
● Two-week wait for first appointment for suspected cancer
● Achieving financial balance
● Satisfactory hospital cleanliness
● Improving working lives of staff
● Achieving targets for booking out-patient and elective appointments
● Out-patient waiting standards (21 weeks reducing to 17 weeks over course of the year)
● Non-emergency in-patient waiting standards (12 months reducing to nine months over course of the ye
● Accident and emergency wait of four hours or less
Balanced scorecard indicators
Clinical focus
● Child protection
● Clinical governance composite indicator
● Clinical negligence
● Composite of participation in clinical audits
● Deaths following a heart bypass operation
● Deaths following selected non-elective surgical procedures
● Emergency readmission following discharge (adults)
● Emergency readmission following discharge for a fractured hip
● Indicator on stroke care
● Infection control
● Thrombolysis, 30-minute door to needle time
● Infection control
WAITING TIME POLICIES IN THE HEALTH SECTOR: WHAT WORKS? © OECD 2013 305
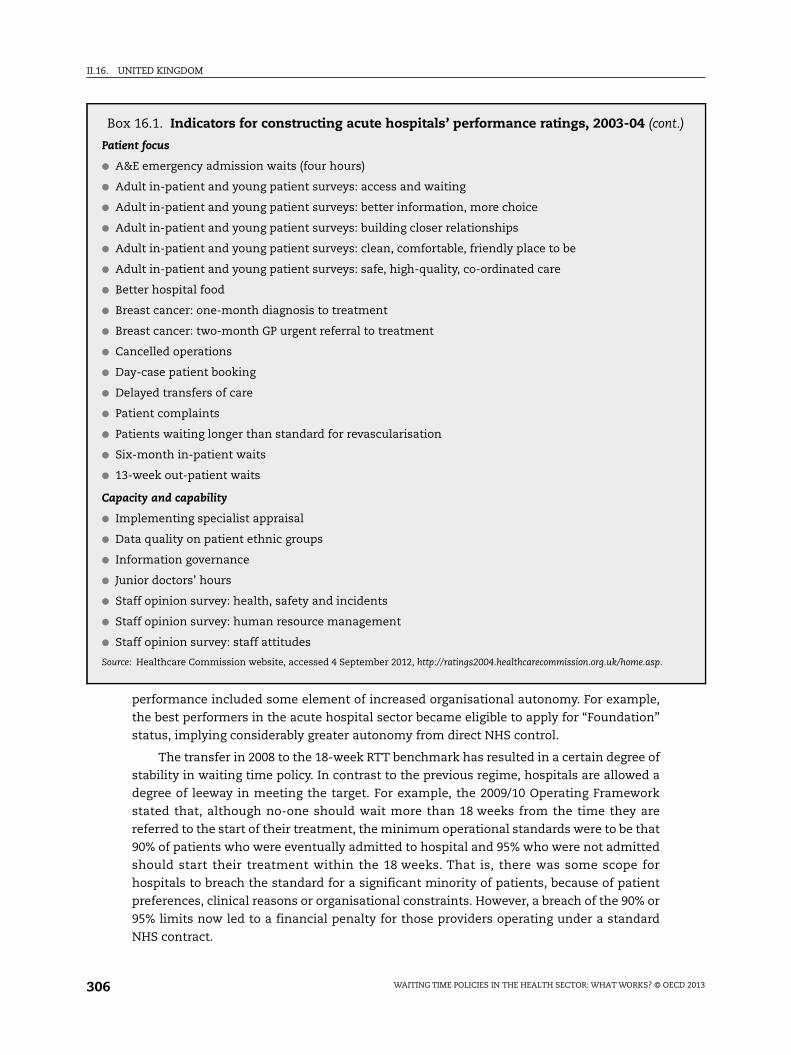
II.16. UNITED KINGDOM
t.)
performance included some element of increased organisational autonomy. For example,
the best performers in the acute hospital sector became eligible to apply for “Foundation”
status, implying considerably greater autonomy from direct NHS control.
The transfer in 2008 to the 18-week RTT benchmark has resulted in a certain degree of
stability in waiting time policy. In contrast to the previous regime, hospitals are allowed a
degree of leeway in meeting the target. For example, the 2009/10 Operating Framework
stated that, although no-one should wait more than 18 weeks from the time they are
referred to the start of their treatment, the minimum operational standards were to be that
90% of patients who were eventually admitted to hospital and 95% who were not admitted
should start their treatment within the 18 weeks. That is, there was some scope for
hospitals to breach the standard for a significant minority of patients, because of patient
preferences, clinical reasons or organisational constraints. However, a breach of the 90% or
95% limits now led to a financial penalty for those providers operating under a standard
NHS contract.
Box 16.1. Indicators for constructing acute hospitals’ performance ratings, 2003-04 (con
Patient focus
● A&E emergency admission waits (four hours)
● Adult in-patient and young patient surveys: access and waiting
● Adult in-patient and young patient surveys: better information, more choice
● Adult in-patient and young patient surveys: building closer relationships
● Adult in-patient and young patient surveys: clean, comfortable, friendly place to be
● Adult in-patient and young patient surveys: safe, high-quality, co-ordinated care
● Better hospital food
● Breast cancer: one-month diagnosis to treatment
● Breast cancer: two-month GP urgent referral to treatment
● Cancelled operations
● Day-case patient booking
● Delayed transfers of care
● Patient complaints
● Patients waiting longer than standard for revascularisation
● Six-month in-patient waits
● 13-week out-patient waits
Capacity and capability
● Implementing specialist appraisal
● Data quality on patient ethnic groups
● Information governance
● Junior doctors’ hours
● Staff opinion survey: health, safety and incidents
● Staff opinion survey: human resource management
● Staff opinion survey: staff attitudes
Source: Healthcare Commission website, accessed 4 September 2012, http://ratings2004.healthcarecommission.org.uk/home.asp.
WAITING TIME POLICIES IN THE HEALTH SECTOR: WHAT WORKS? © OECD 2013306

II.16. UNITED KINGDOM
More recent policy therefore to some extent represents something of a retreat from the
uncompromising targets regime. This process was started by the Labour Government,
architect of the targets, but was reinforced by the coalition government, which argued that
there was no place for such “politically motivated” targets. It can be argued that the targets
had done their job, by securing a step change in English waiting times, and that the focus
should change to maintaining the enhanced standards that had been achieved.
Other reforms
Numerous other reforms of the English NHS were undertaken in the period following
the publication of the NHS Plan (Smith and Goddard, 2009). These included:
● Enhanced choice of provider for patients, including from 2008 complete freedom of
choice at the point of initial GP referral.
● Increased emphasis on strategic purchasing (commissioning) of health services, with
efforts to devolve some responsibilities and budgets to general practitioners.
● Increased plurality of health care providers, including the development of not-for-profit
foundation trusts and private providers, with competition on the basis of waiting time
intended to be a central feature.
● Better alignment of payment mechanisms with the volume of work undertaken through
diagnosis-related group (DRG) financing.
● Changes to employee contracts to raise quality and productivity.
The emerging model of health system organisation and delivery can be viewed as a
coherent package (Stevens, 2004). A major underlying objective of the mix of demand-side
and supply-side reforms was to promote competitive forces within the market for elective
treatment, and to improve the quality of care, not least waiting times. Provider choice and
improved information formed the basis for demand-side reforms, alongside a desire for
better strategic purchasing.
Addressing supply-side constraints was an especially important requirement for
achieving the waiting time targets. The fundamental prerequisite was the substantial
increase in funding secured for the NHS in 2000. This was in part used to promote
increased plurality of providers, for example by creating incentives for new private sector
entrants. One example was the creation of private sector “treatment centres”, which were
offered generous financial incentives to treat NHS elective patients. Also, in contrast to
their predecessor NHS organisations, the new foundation trusts were allowed to retain
financial surpluses, effectively requiring a boost to NHS funding. Finally, the new volume-
related payment mechanism, using an English version of diagnosis-related groups, was in
part intended to stimulate provision amongst all providers, and to encourage utilisation of
slack capacity.
Evaluation of these reforms has been challenging, as many changes have been made
simultaneously and there are few independent benchmarks against which to monitor
progress. An assessment by the Healthcare Commission and the Audit Commission (2008)
is typical in concluding that:
“progress on the implementation of the reform programme has been limited by
several factors. These include two major structural reorganisations; underdeveloped
commissioning capacity; and weaknesses in the infrastructure to support and monitor
the reforms, particularly in regard to data collection.”
WAITING TIME POLICIES IN THE HEALTH SECTOR: WHAT WORKS? © OECD 2013 307

II.16. UNITED KINGDOM
It concluded that “other policies pursued by the government, such as waiting list
targets, have had a much greater impact”. However, it should be underlined that some of
these reforms were necessary for the success of the targets.
One scheme that was evaluated was the London Patient Choice Project, an early
attempt to reduce waiting times. Patients at risk of breaching in-patient waiting time
targets were offered the choice of an alternative hospital with a guaranteed shorter wait.
Dawson et al. (2007) use a difference-in-difference econometric methodology to estimate
the impact of the project on ophthalmology waiting times, and find that it led to shorter
average waiting times in the London region (relative to the rest of England) and to a
convergence in waiting times amongst London hospitals. However, this approach to choice
was not replicated elsewhere, and did not form the basis for future policy.
Without question the targets regime had a major influence on system behaviour, and
specifically on NHS waiting times (Bevan and Hood, 2006b). Figure 16.3 summarises trends
in the quarterly census of patients waiting for treatment, highlighting the virtual
elimination of long-waiters over the period in question. The abrupt halt to the numbers
waiting coincided with the abandonment of the targets regime. Propper et al. (2008) used
econometric methods to assess the change in English waiting times relative to those in
Scotland (where different policies were applied, see later in this chapter) and found a
distinct reduction that they attribute to the English targets regime.
Figure 16.3 captured only patients on the waiting list on the quarterly census dates,
whose treatment was therefore incomplete. Figure 16.4 shows trends in the median
waiting time for treatment to be initiated for all patients admitted for elective surgery,
reflecting the same pattern of substantial improvement since 2003. Note that, in contrast
to the RTT data, these figures show only the wait once a need for treatment has been
established (when the patient was placed on the waiting list).
Figure 16.3. Trends in quarterly waiting list by time waited, England
Source: “Knowledge and Intelligence Statistical Information: Inpatient and Outpatient Waiting Times”, March 2009/10, available at www.dh.gov.uk/prod_consum_dh/groups/dh_digitalassets/@dh/@en/@ps/@sta/@perf/documents/digitalasset/dh_118419.xls.
1 2 http://dx.doi.org/10.1787/888932754559
1 400 000
1 200 000
1 000 000
800 000
600 000
400 000
200 000
0
1995
1996
1997
1998
1999
2001
2000
2002
2003
2004
2005
2006
2007
2008
2009
Patients waiting for treatment
13-15 months
0-3 months
16-18 months
4-6 months
18+ months
7-9 months 10-12 months
WAITING TIME POLICIES IN THE HEALTH SECTOR: WHAT WORKS? © OECD 2013308

II.16. UNITED KINGDOM
The response to performance ratings amongst NHS managers was mixed. Many
criticised the system because of some of the apparently arbitrary ways in which the ratings
were calculated and their sensitivity to small fluctuations in data (Barker et al., 2004).
However, some acknowledged that the system gave managers a better focus and a real
lever with which to affect organisational behaviour and clinical practice.
Reaction amongst health care professionals was less ambiguous, with a widespread
view that targets distorted clinical priorities and undermined professional autonomy
(Mannion et al., 2005). This was not surprising, as one of the aims of the national and local
targets was to challenge traditional NHS behaviour, and to direct more attention to issues
such as waiting times that had not always been a high priority. However, there is a
persistent (albeit unsubstantiated) anxiety that political targets undermine the concept of
“professionalism”, the essence of which is that professionals will do the “right thing” even
in the absence of explicit incentives. This tension suggests that – to have a sustained
impact – a targets regime may need to enjoy at least some degree of support amongst
clinical professionals.
The persistent criticisms of distorted clinical priorities, particularly in media reports,
may have led to the abandonment in 2008 of the heavy reliance on report cards and
performance ratings. It also appears to have been a motivation for the current coalition
government’s decision to abandon certain targets when it came to power (Guardian, 2011).
Notwithstanding the anecdotes of such unintended consequences, it has been difficult to
find secure evidence that clinical outcomes have suffered at the expense of improved
waiting times (Appleby et al., 2004). However, given the tensions they create, it may be the
case that “extreme” command-and-control mechanisms such as the NHS targets regime
can be sustained only for a limited period.
ConclusionsHealth service waiting times have been a major preoccupation of British governments
since 1997. Policy in England has undoubtedly been effective in virtually eliminating the
Figure 16.4. Median waiting time, elective admissions, England, 1993 to 2009
Source: “Knowledge and Intelligence Statistical Information: Inpatient and Outpatient Waiting Times”, March 2009/10, available at www.dh.gov.uk/prod_consum_dh/groups/dh_digitalassets/@dh/@en/@ps/@sta/@perf/documents/digitalasset/dh_118419.xls.
1 2 http://dx.doi.org/10.1787/888932754578
18
16
12
14
10
8
6
4
2
0
199
3
199
4
199
4
199
5
199
6
199
7
199
7
199
8
199
9
2000
2000
2001
2002
2003
2003
2004
2005
2006
2006
2007
2008
2009
2009
Weeks
WAITING TIME POLICIES IN THE HEALTH SECTOR: WHAT WORKS? © OECD 2013 309

II.16. UNITED KINGDOM
very long waits that some patients suffered for elective treatment. Furthermore, the
emphasis on the total time to treatment, and attention to rapid referrals for suspected
cancer, represent a more refined approach to waiting than hitherto.
The main direct contributory factor has been the use of clear targets for providers over
an extended period, with obvious and serious sanctions if those targets were breached.
Moreover, it is unlikely that the success in reducing long waiting times would have
occurred without:
● Sustained political commitment to the issue, at the very highest level.
● A central government commitment to timely monitoring, reporting and (where
necessary) intervention to secure success.
● A carefully crafted mechanisms for transmitting national targets to the local level (the
report cards).
● Adequate additional resources to ensure that the targets were attainable.
The use of targets has been augmented with other major reforms, such as enhanced
levels of patient choice, increased competition and diversity in the provider market,
reformed provider payment mechanisms, and increased attention to the strategic
purchasing of health services. The contribution of these reforms is less easy to gauge, and
the current consensus amongst commentators is that they have secured less direct impact
on waiting times. They may nevertheless have been important prerequisites for success.
Given the sustained emphasis on NHS waiting times, a major issue that has arisen is
the precise nature of the metrics to be used for assessing provider performance. The
original emphasis was on patients on the waiting list on a particular census date, giving
rise to opportunities for distortion, for example, if providers delayed placing patients on
the waiting list until just after the quarterly date. The shift to RTT targets gave a much
reduced incentive to treat a patient once the 18-week threshold had been passed. There are
also unsubstantiated reports of “hidden” waiting lists, on which patients are placed
pending a transfer to the official waiting list. Such opportunities for gaming and distortion
highlight the need for a strong audit function and high-quality governance to ensure that
the spirit of the waiting time targets is respected.
The English experience is without question a success story that deserves scrutiny by
those seeking to address long waiting times in other health systems. The reforms described
above have undoubtedly required a very large commitment of expenditure, and there are
questions over whether they represent the best use that could have been made of the
substantial increases in funding enjoyed by the NHS. However, the combination of
mechanisms has led to major improvements in NHS waiting times, to the benefit of many
patients, which is a possible reason for the high levels of satisfaction with the NHS recorded
recently in general surveys of the population (Appleby and Philips, 2009; Schoen et al., 2010).
Waiting times in the Scottish National Health Service: qualified evidenceon the effectiveness of hard and soft targets2
Introduction
Long waiting times for NHS treatment were a significant source of public and policy
concern across the United Kingdom throughout the 1990s. Health policy became seriously
focused on reducing maximum waiting times in Scotland a few years later than in England,
but a similar policy instrument of setting high-profile targets and accompanying these
WAITING TIME POLICIES IN THE HEALTH SECTOR: WHAT WORKS? © OECD 2013310

II.16. UNITED KINGDOM
with strict monitoring and enforcement was adopted. This sub-chapter reflects on
experience in Scotland over the last 12 years of managing downwards the maximum
length of time that patients can wait for NHS treatment. While the basic policy instrument
adopted in Scotland is similar to that adopted in England, the structures of the health
systems in which it has been introduced have increasingly diverged over time.
The first section describes the development of waiting times policies over time.
Current policy is then documented in detail. The limited academic research evaluating the
success of these policies is summarised in the third section. The fourth section provides
some statistics on long-term trends in waiting times in Scotland and the fifth section
concludes with some reflections on lessons from Scotland’s experience.
Development of waiting times policies over time
Until recently, waiting times in Scotland were measured in parts of the patient
journey. There was separate measurement of a) the wait between GP referral and the first
specialist visit (called the out-patient wait) and b) the wait between the specialist’s
decision to admit a patient and the patient’s receipt of treatment (the in-patient wait).
Prior to devolution in 1999, limits on the length of the in-patient wait were set by the
Patients’ Charter (Department of Health, 1995). This charter was common to England and
Scotland and for 1997 and 1998 set a maximum waiting time of 18 months for England and
12 months for Scotland. However, this Charter was not rigorously enforced.
Following devolution, the Scottish Executive focused on the abolition of the 1990s
“quasi-market” and the re-introduction of a professionally led, integrated system based on
concepts such as managed clinical networks (Alvarez-Rosete et al., 2005). The overall
guarantee of 12 months remained after devolution, though there were (new) exceptions for
certain (undefined) conditions of “low clinical priority”.
The first aspiration to reduce waiting times by the new devolved administration was
announced in 2000 (Scottish Executive, 2000). The maximum waiting time for in-patients
was to be reduced from 12 months to nine months by December 2003. In addition, patients
were to wait no more than 12 weeks for angiography or 24 weeks for revascularisation by
end 2002. Finally, a target of two months from urgent referral to treatment for all cancers
(and one month for breast cancer) was set, to be achieved by the end of 2005.
A more ambitious target of six months for in-patients was announced for 2005 in a
2002 press release (Audit Scotland, 2006). This press release also announced targets of
eight weeks for angiography or 18 weeks for revascularisation by end 2004. A later press
release the same year in November set a target of six months for new out-patients by
end 2006. However, it was not until February 2003 that these aspirations became firm
policy commitments in a health White Paper (Scottish Executive, 2003), which also brought
the date for achieving the out-patient target forward from 2006 to 2005. Just a year later,
in 2004, a further White Paper pledged to reduce waiting times to 18 weeks for in-patients
and 18 weeks for out-patients by the end of 2007 (Scottish Executive, 2004). The target for
cardiac surgery was shortened to 16 weeks, and new targets were set for cataract surgery
of 18 weeks from referral to treatment and nine weeks for eight key diagnostic tests, to be
achieved by the end of 2007.
The policy was implemented through the imposition of high-profile national targets.
Hospitals did not risk any economic penalty if waiting time violations occurred. However,
the regional health boards were monitored on a monthly basis on their complete
WAITING TIME POLICIES IN THE HEALTH SECTOR: WHAT WORKS? © OECD 2013 311

II.16. UNITED KINGDOM
achievement of the maximum waiting times targets. Individual “breaches” of the waiting
times targets had to be reported to the Scottish Executive and were rigorously investigated.
The targets could be monitored using two forms of data. First, there were censuses of
people waiting for treatment at the end of each month, both for a new out-patient
appointment and for an admission to hospital. Second, two activity datasets recorded the
lengths of time that people seen at out-patient clinics waited before being admitted as in-
patients or day cases. The government used the census measure of waiting time for
patients still on the waiting list in preference to the actual retrospective measure of time
waited to treatment because the former:
● Focused on the most up-to-date monthly data available about waiting.
● Focused attention on the most recent long-waiters who need to be seen quickly to avoid
breaching the waiting time guarantee before the next monthly census.
● Enabled the performance of Boards in delivering shorter waiting times to be managed
closest to real time to achieve success.
These advantages were felt to outweigh the acknowledged disadvantage that the
snapshot censuses could not measure the actual achievement of a waiting time target,
only evidence of near achievement.
The monitoring regime was similar in approach to the “targets and terror” regime that
had been adopted in England some years earlier (Propper et al., 2008), and the dissolution
of one regional health board in 2006 was credited to its poor performances on waiting times
and finances.
Patients at risk of breaching the targets were diverted to a national waiting times
centre, a dedicated hospital that the NHS had bought from the private sector. It has been
estimated that about GBP 116 million was spent on tackling waiting times in 2004/05.
Approximately 40% (GBP 45.7 million) of this was spent on the national waiting time centre
(Scottish Parliament, 2006). This additional expenditure on reducing waiting times was
made at a time of substantial growth in the general resources spent on the hospital sector
in Scotland. Annual growth rates in expenditure on the hospital sector in Scotland were
6.0% in 2000/01, 7.4% in 2001/02, 9.6% in 2002/03, 7.0% in 2003/04, 11.1% in 2004/05, 7.2% in
2005/06 and 4.8% in 2006/07.
The maximum waiting time guarantees covered only patients without an Availability
Status Code (ASC). An ASC was assigned to patients who were “unavailable” or “medically
unsuitable” for treatment. The strict monitoring regime gave hospitals incentives to
allocate patients an Availability Status Code, since these patients were not counted in the
achievement of targets. Between June 2003 and September 2005, the number of patients
with an ASC increased from 28 349 to 35 048 (peaking in June 2005 at 35 910), representing
around 32% of all patients waiting for care (Audit Scotland, 2006).
Box 16.2 summarises how the maximum waiting times target for all hospital care in
Scotland has been reduced over the period 2003-11.
Most recently, in a White Paper, Better Health Better Care, the Scottish Government set
out a commitment that: “The 18 week referral to treatment (RTT) standard will address the
whole patient care pathway, from receipt of a GP referral, up to the point at which each
patient is actually admitted to hospital for treatment.” (Scottish Government, 2007) The
responsibility for delivering the 18-week RTT target lies with the NHS Board that receives
the initial referral.
WAITING TIME POLICIES IN THE HEALTH SECTOR: WHAT WORKS? © OECD 2013312

II.16. UNITED KINGDOM
The 18-week RTT target is to be delivered for at least 90% of patients, rather than the
previous zero tolerance approach that had been taken to maximum waiting time targets.
Current policy
The Scottish Government’s current policy seeks to improve the quality of patient care
through reducing maximum waits, increasing the coverage of waiting times targets and
increasing transparency on performance. The policy approach is described as being based
on improvement science, and involves setting out a vision for what is to be achieved,
prioritising improvement actions, engaging with the workforce, supporting shared-
learning, developing transparent and frequent measurement, and proactively managing
risk.
Each year, the Scottish Government sets performance targets for NHS Boards that are
focused on its priorities and its strategy for the future. These targets are focused on health
improvement, efficiency, access and treatment, and are known collectively as HEAT
targets. Once the HEAT targets have been agreed, NHS Boards prepare and publish their
Local Delivery Plans (LDPs), which describe how they will achieve their stated objectives.
The government holds a public review of each NHS Board’s performance, and HEAT
performance data are reported through the government’s website, which gives the latest
information on progress by the Scottish Government across a range of outcomes.
The current waiting times targets are largely encapsulated in the Access to Services
domain of the Scottish Government’s HEAT targets. A description of the current system is
available at this website: www.scotland.gov.uk/Topics/Health/NHS-Scotland/17273/targets.
Box 16.3 lists the waiting times targets that are currently in place or have been announced
as forthcoming. More recently, the government has introduced a universal 12-week
Box 16.2. Reduction in the maximum waiting times targets in Scotland,2003-11
Maximum waiting time between specialist decision to treat and in-patient/day-casetreatment:
9 months by end December 2003
6 months by end December 2005
18 weeks by end December 2007
15 weeks by end March 2009
12 weeks by end March 2010
9 weeks by end March 2011
Maximum waiting time between referral and first specialist assessment as an out-patient:
6 months by end December 2005
18 weeks by end December 2007
15 weeks by end March 2009
12 weeks by end March 2010
Maximum waiting time from referral to treatment:
18 weeks by end 31 December 2011
WAITING TIME POLICIES IN THE HEALTH SECTOR: WHAT WORKS? © OECD 2013 313

II.16. UNITED KINGDOM
Box 16.3. Current and forthcoming maximum waiting times targetsin Scotland, April 2012
Referral to treatment
From 31 December 2011, the national maximum waiting time for the whole journey fromgeneral practitioner referral to treatment (RTT) will be 18 weeks. All NHS Boards havetargets of 90% for the RTT standard.
Hospital in-patient or day-case treatment
From 31 March 2011, no patient waiting for treatment as an in-patient or day case willwait longer than nine weeks.
New out-patient appointments
From 31 March 2010, no patient referred from any source should wait longer than12 weeks for a new out-patient appointment at a consultant-led clinic.
Key diagnostic tests
From 31 March 2009, patients will wait no more than six weeks for eight key diagnostictests: four radiological (imaging) investigations (magnetic resonance imaging, computerisedtopography, ultrasound and barium enema); and four endoscopic procedures (uppergastrointestinal endoscopy, colonoscopy, cystoscopy and sigmoidoscopy).
Coronary heart disease
From 31 March 2010, no patient referred through a rapid access chest pain clinic orequivalent will wait more than 16 weeks for cardiac intervention. From 31 December 2007,no patient will wait more than 16 weeks for treatment after they have been seen as an out-patient by a heart specialist and the specialist has recommended treatment.
Cancer
From 31 December 2011, the maximum wait to treatment for patients screened positiveor with an urgent referral with a suspicion of cancer is 62 days, and the maximum waitfrom decision to treat to first treatment for all patients diagnosed with cancer is 31 days.The target is that 95% of all eligible patients should wait no longer than these limits.
Cataract surgery
From 31 December 2007, the maximum wait from referral by a GP or optometrist tocataract surgery will be 18 weeks.
Accident and emergency
From 31 December 2007; 98% of patients in Accident and Emergency Units will wait nolonger than four hours between arriving at a unit and admission, discharge or transfer(unless there are stated clinical reasons for keeping the patient in the unit).
Addiction services
By 31 March 2013, 90% of clients will wait no longer than three weeks from referralreceived to appropriate drug or alcohol treatment that supports their recovery. As an interimmilestone, by December 2010, 90% of clients referred for drug treatment will receive anassessment date that falls within four weeks of referral being received and 90% of clients willreceive a treatment date that falls within four weeks of their care plan being agreed.
Primary care
By 31 March 2011, access within 48-hours to an appropriate member of the GP PracticeTeam. All NHS Boards have a local target of 90%.
WAITING TIME POLICIES IN THE HEALTH SECTOR: WHAT WORKS? © OECD 2013314

II.16. UNITED KINGDOM
Treatment Time Guarantee, which is enshrined in law and came into force on 1st October
2012.
These waiting times targets have been specified because it is believed that short
waiting times can improve health, reduce anxiety, reduce inequalities and increase
economic productivity:
“Shorter waits can lead to earlier diagnosis and better outcomes for many patients as
well as reducing unnecessary worry and uncertainty for patients and their relatives. It
also reduces inequalities by addressing variations in waiting times between NHS
Boards or individual hospitals. Shorter waiting times will have a positive impact on the
health of the patient, but in the long-term may result in some positive impact on all
businesses, as key workers who are absent from the work due to illness may be treated
earlier and will therefore be able to return to the workplace earlier.”3
For young people it is believed that quick access to psychological therapies will also
influence education and social development:
“Early action is more likely to result in full recovery and in the case of children and
young people will also minimise the impact on other aspects of their development
such as their education, so improving their wider social development outcomes.”4
The Scottish Government does not commission a regular, ongoing and independent
evaluation of the impact of its waiting times policies. We have found no research that
considers the effects of the current policy. There is therefore no reliable evidence of the
effects on patient and population health or on the well-being of the patients who are
waiting, and no assessment of inequalities or the effect on economic productivity.
There is little published information on how NHS Boards are rewarded for meeting the
local targets or penalised for missing them. However, these targets are supported by
regular public reports in the press about performance on waiting times statistics, which is
then debated in the Parliament and the media. Performance against all targets is collected
and reported by the Information and Services Division of the NHS National Services
agency. This agency is quasi-independent, and its publications conform to National
Statistics standards, which involve the prior announcement of publication dates and
publication of the names of the organisations given advanced copies of the statistics prior
to publication.
For several of the new waiting times targets, national data systems to measure
performance are currently being established. For example, in March 2012 the “referral to
treatment” (RTT) waiting times in December 2011 could be measured for 87.5% of
qualifying patients (Table 16.5). The NHS achieved the stated target of seeing 90% of
Box 16.3. Current and forthcoming maximum waiting times targetsin Scotland, April 2012 (cont.)
Child and adolescent mental health services
From 31 March 2013, 26 weeks referral to treatment for specialist Child and AdolescentMental Health Services (CAMHS) services, reducing to 18 weeks by December 2014.
Psychological therapies
From 31 December 2014, 18 weeks referral to treatment for patients of all ages forpsychological therapies.
WAITING TIME POLICIES IN THE HEALTH SECTOR: WHAT WORKS? © OECD 2013 315

II.16. UNITED KINGDOM
patients within 18 weeks, failing in only 8.0% of cases. Over the previous 12 months, the
NHS in Scotland had improved both in terms of measurement of the RTT waiting time and
in the achievement of the target.
The richest data are published on the in-patient/day-case waiting times target. They
are published quarterly, two months after the end of the quarter. The published statistics
exclude patients who are referred to three specialties: mental health, obstetrics and
homeopathy. When a patient is recorded as unavailable for treatment for medical or social
reasons, the reported waiting time excludes the period for which the patient was
unavailable. If a patient cancels or does not attend an appointment, their waiting time is
reset to zero.
The key performance statistics reported quarterly are:
● The length of time that patients still waiting for treatment on the census date have been
waiting, for out-patients and for in-patients separately.
● The length of time that patients receiving care during the quarter had waited by the time
they were seen, for out-patient and for in-patients separately.
● The total length of time from referral to treatment.
● The proportions of patients reported as unavailable, by reason.
● The proportions removed from the waiting list, by reason.
● The proportions not attending, by reason.
At the end of December 2011, 97.1% of new out-patients had been waiting 12 weeks or
less, and 93.3% of in-patients and day cases had been waiting less than nine weeks. During
the three-month period between 1 July and 30 September 2011, 96.1% of new out-patients
seen and 94.8% of in-patients and day cases treated had waited less than the respective
targets of 12 and nine weeks. According to the charts provided in the quarterly reports
published by the ISD (Information Services Division, 2012a), these figures represent
deteriorations in performance since March 2010. These deteriorations in performance are
concentrated in one NHS Board and are associated with industrial action in November 2011.
Table 16.5. Performance in 2011 on the referral to treatment target, Scotland
NHS Scotland: Patient journeys within 18 weeks and patient journeys that could be fully measured,for January to December 2011
MonthPatient journeys
within 18 weeks (%)Number of patient journeys
within 18 weeksNumber of patient journeys
over 18 weeksPatient journeys that could
be fully measured (%)
January 2011 82.1 77 353 16 857 69.1
February 2011 83.7 76 471 14 874 70.8
March 2011 85.2 90 714 15 795 68.3
April 2011 85.4 69 967 11 994 70.4
May 2011 88.1 86 434 11 658 73.8
June 2011 89.7 90 844 10 477 74.7
July 2011 89.4 74 014 8 775 76.7
August 2011 89.7 91 862 10 601 78.4
September 2011 89.7 86 213 9 910 81.3
October 2011 89.4 84 687 10 017 83.9
November 2011 89.6 95 437 11 100 85.4
December 2011 92.0 89 478 7 770 87.5
Note: These data are reported by ISD Scotland to be still at an early stage of development.Source: Information Services Division (ISD) Scotland.
1 2 http://dx.doi.org/10.1787/888932755509
WAITING TIME POLICIES IN THE HEALTH SECTOR: WHAT WORKS? © OECD 2013316
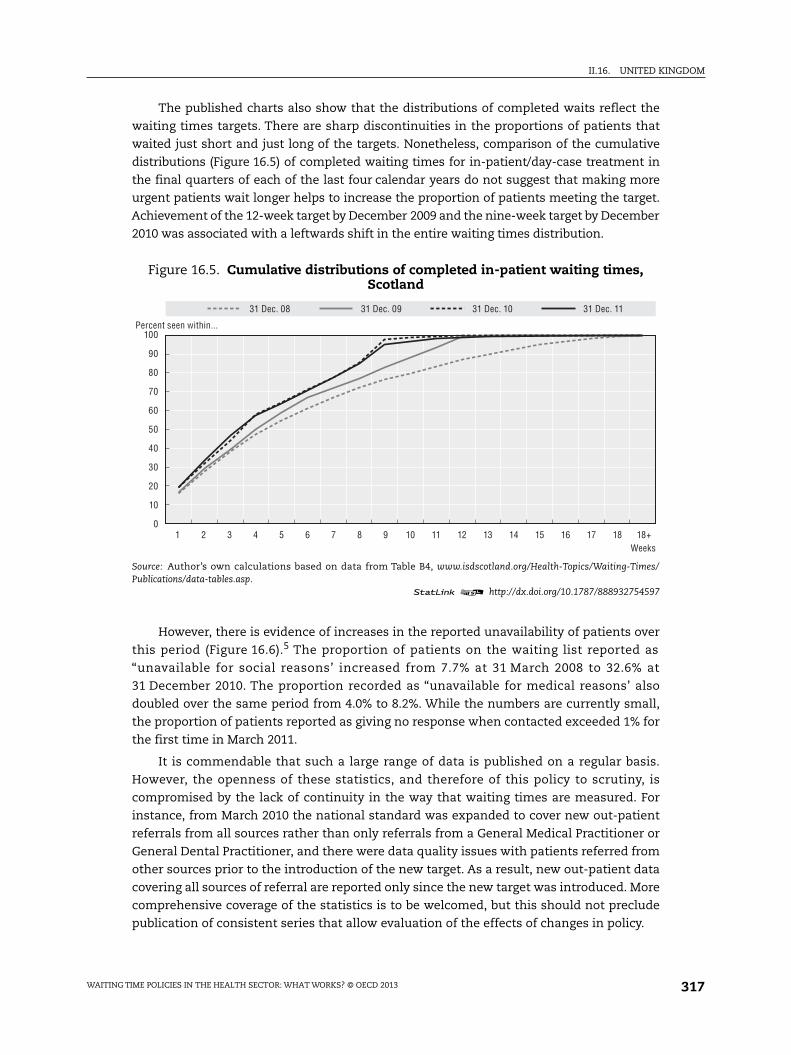
II.16. UNITED KINGDOM
The published charts also show that the distributions of completed waits reflect the
waiting times targets. There are sharp discontinuities in the proportions of patients that
waited just short and just long of the targets. Nonetheless, comparison of the cumulative
distributions (Figure 16.5) of completed waiting times for in-patient/day-case treatment in
the final quarters of each of the last four calendar years do not suggest that making more
urgent patients wait longer helps to increase the proportion of patients meeting the target.
Achievement of the 12-week target by December 2009 and the nine-week target by December
2010 was associated with a leftwards shift in the entire waiting times distribution.
However, there is evidence of increases in the reported unavailability of patients over
this period (Figure 16.6).5 The proportion of patients on the waiting list reported as
“unavailable for social reasons’ increased from 7.7% at 31 March 2008 to 32.6% at
31 December 2010. The proportion recorded as “unavailable for medical reasons’ also
doubled over the same period from 4.0% to 8.2%. While the numbers are currently small,
the proportion of patients reported as giving no response when contacted exceeded 1% for
the first time in March 2011.
It is commendable that such a large range of data is published on a regular basis.
However, the openness of these statistics, and therefore of this policy to scrutiny, is
compromised by the lack of continuity in the way that waiting times are measured. For
instance, from March 2010 the national standard was expanded to cover new out-patient
referrals from all sources rather than only referrals from a General Medical Practitioner or
General Dental Practitioner, and there were data quality issues with patients referred from
other sources prior to the introduction of the new target. As a result, new out-patient data
covering all sources of referral are reported only since the new target was introduced. More
comprehensive coverage of the statistics is to be welcomed, but this should not preclude
publication of consistent series that allow evaluation of the effects of changes in policy.
Figure 16.5. Cumulative distributions of completed in-patient waiting times,Scotland
Source: Author’s own calculations based on data from Table B4, www.isdscotland.org/Health-Topics/Waiting-Times/Publications/data-tables.asp.
1 2 http://dx.doi.org/10.1787/888932754597
100
90
80
70
60
50
40
30
20
10
01 2 3 4 5 6 7 8 9 10 11 12 13 14 15 16 17 18 18+
31 Dec. 08 31 Dec. 09 31 Dec. 10 31 Dec. 11
Weeks
Percent seen within...
WAITING TIME POLICIES IN THE HEALTH SECTOR: WHAT WORKS? © OECD 2013 317

II.16. UNITED KINGDOM
The publication of figures on absolute performance has some limited uses. It is
possible to compare performance across each of the regional NHS Boards and to judge
whether the NHS as a whole has met the standards expected by the government. However,
the value of these statistics is greatly increased by comparison over time and to other
health care systems.
Since 2005/06, the UK Comparative Waiting Times Group (UKCWTG) has analysed the
length of time a patient has waited for treatment, from the initial decision to admit to the
date of admission for the procedure, including periods of suspension from the waiting list
for medical and social reasons. These figures are produced for Scotland, England, Wales
and Northern Ireland for 11 in-patient procedures (Office for National Statistics, 2010). The
analysis measures the median and 90th percentile completed waiting time in days for:
angioplasty; angiography; artery bypass surgery; cataract surgery; hip replacement; knee
replacement; endoscope of the bladder; endoscope of the upper gastrointestinal tract;
hernia repair; tonsillectomy and adenoidectomy; and varicose surgery. Scotland had the
shortest median wait for seven of the 11 procedures in 2005/06 and 2009/10.
Research studies
There have been a number of papers that have examined how the divergence in
waiting times policies across the United Kingdom following devolution affected waiting
times. Alvarez-Rosete et al. (2005), Bevan (2006), and Bevan and Hood (2006a and b)
examined trends at the country level. Propper et al. (2008) looked at differences between
England and Scotland and estimated differences in difference models of the proportion of
people on the waiting list at three points in the waiting times distribution (the proportion
who waited over six, nine and 12 months). They showed that trends in waiting times were
statistically the same in the two countries before the divergence in policy, but that the
policy in England between the financial years 2000/01 and 2003/04 reduced the proportion
of the persons on the list waiting longer than the targets. Propper et al. (2010) refined this
Figure 16.6. Trends in unavailability of patients on the in-patient/day-casewaiting list, Scotland, 2008 to 2011
Source: Authors’ own calculations based on data from Table C2, www.isdscotland.org/Health-Topics/Waiting-Times/Publications/data-tables.asp.
1 2 http://dx.doi.org/10.1787/888932754616
35
30
25
20
15
10
5
0
% Unavailable – social Unavailable – medical Unavailable – no response
Mar. 08
Jun.
08
Sep. 0
8
Dec. 0
8
Mar. 09
Jun.
09
Sep. 0
9
Dec. 0
9
Mar. 10
Jun.
10
Sep. 1
0
Dec. 1
0
Mar. 11
Jun.
11
Sep. 1
1
Dec. 1
1
WAITING TIME POLICIES IN THE HEALTH SECTOR: WHAT WORKS? © OECD 2013318
II.16. UNITED KINGDOM
analysis to examine the whole distribution of waiting times. The effect of the policy in
England was to pull the distribution leftwards at the right tail. In contrast, in Scotland the
distribution moved rightwards, increasing the number of longer waits and reducing the
number that waited below the target set for England. However, at the bottom end of the
distribution (the 10th and the 25th percentile) the policy in England appeared to have
resulted in English waits that were slightly higher.
Januleviciute et al. (2010) studied how the prioritisation of patients in Scotland
changed over the period during which the waiting times targets regime was in force. The
unconditional maximum waiting time targets introduced in Scotland do not take into
account the severity of the patient’s condition, and one concern was whether there would
be diversion of effort towards the least needy patients. Januleviciute et al. (2010) used a
system of explicit priorities that had been derived in Norway based on each patient’s
primary diagnosis. Although derived in another country, Scotland’s waiting times
distribution was found to accord with this prioritisation; patients with diagnoses that were
accorded greater priority had shorter waiting times. Moreover, the focus on maximum
waiting times did not upset this clinical prioritisation. The lowest priority groups
experienced the largest (proportionate) reductions in waiting times, but the highest
priority groups did not experience an increase in their waiting times.
Long-term trends
The introduction of a new way of defining and measuring waiting lists on
31 December 2007 led to a significant change in how NHS Scotland collects and defines
waiting times, and also how waiting lists are clinically and administratively managed. Key
changes were:
● Changes in how waiting times are measured and reported.
● Introduction of the concept of a “reasonable offer” of appointment or admission.
● Better recording and reporting on patient non-attendance and unavailability.
● Ending of the use of “Availability Status Codes”.
The system to monitor waiting times now takes account of the unavailability of
patients, the refusal to accept reasonable offers of treatment, and patient non-attendance.
In such circumstances a patient’s “waiting time clock” is stopped for a period, or reset to
zero. This changed the previous system where such patients were not included when
assessing the performance of boards against the waiting times guarantees. Because “New
Ways” was seen as a radical change from the previous method of measuring and reporting
waiting times, it was not judged possible to statistically compare previous waiting times
with those produced via “New Ways” after 2007.
Nevertheless, it appears possible, with an acceptable degree of inconsistency, to
compare some limited statistics on the distribution of times waited between specialist
decision to treat and receipt of in-patient/day-case treatment over a longer time period.
Figures on the median, the 90th percentile, and the proportion waiting under 18 weeks
have been published on an annual, then quarterly, basis since March 1998. Figure 16.7
shows that the 90th percentile wait increased until March 2004 and then declined once the
targets started to bite. The median rose until December 2006 and has declined thereafter.
The proportion seen within 18 weeks has exceeded 99% since March 2008 when the
18-week target came into force.
WAITING TIME POLICIES IN THE HEALTH SECTOR: WHAT WORKS? © OECD 2013 319

II.16. UNITED KINGDOM
ConclusionsWhere comparable statistics on waiting times can be produced, Scotland appears to
perform well in comparison with other countries of the United Kingdom, and it achieved
significant improvements in waiting times performance between 2004 and 2010.
These improvements in waiting times were associated with the introduction of
shorter targets for maximum waiting times, which were constantly monitored and strictly
enforced. The focus on maximum waiting times has two potential risks: an increase in the
mean waiting time; and more concentration of effort on long-waiters who may be kept
waiting a long time for legitimate reasons, i.e. low priority. The recent relaxation of the
“zero-tolerance” approach to waiting times targets may reduce these risks but also appears
to have reduced the policy’s effectiveness, as waiting times have risen over the last
eighteen months.
Over the last ten years, there has been a tendency to find exceptional health
conditions or services that require additional prioritisation rather than a systematic
approach to prioritisation by waiting time. The appearance is one of no formal or strategic
protection of priorities. As Godden and Pollock (2009) have noted, clinical need should be
the main determinant of time waited, yet most data do not currently indicate what
patients are waiting for, who these patients are, or whether they have been prioritised to
treat those in most urgent need.
The highly political nature of waiting times in Scotland means that governments set
great store by their ability to meet waiting times targets. Consequently, there is regular
revision of the performance indicators, and this precludes easy evaluation of particular
policy changes. The close coupling of policy and monitoring means that it is difficult to
learn from trends over time or from comparisons across countries because of changes or
differences in the definition of waiting times measures. Moreover, there are examples of
Figure 16.7. Long-term trends in completed in-patient/day-case waits, Scotland,March 1998 onwards
Source: ISD Scotland. Discontinuity in March 2008 caused by the introduction of the “New Ways” system formeasuring and monitoring waiting times.
1 2 http://dx.doi.org/10.1787/888932754635
250 100
90
80
70
60
50
40
30
20
10
0
200
150
100
50
0
Median (days) 90th percentile (days) % seen within 18 weeks
Days
Mar. 98
Sep. 9
8
Mar. 99
Sep. 9
9
Mar. 00
Sep. 0
0
Mar. 01
Sep. 0
1
Mar. 02
Sep. 0
2
Mar. 03
Sep. 0
3
Mar. 04
Sep. 0
4
Mar. 05
Sep. 0
5
Mar. 06
Sep. 0
6
Mar. 07
Sep. 0
7
Mar. 08
Sep. 0
8
Mar. 09
Sep. 0
9
Mar. 10
Sep. 1
0
Mar. 11
Sep. 1
1
Percentage
WAITING TIME POLICIES IN THE HEALTH SECTOR: WHAT WORKS? © OECD 2013320

II.16. UNITED KINGDOM
policy aspirations being set on statistics that cannot be measured in time for an
assessment of whether the policy has achieved its aims.
The current government’s policy of full publication of waiting times information
increases transparency and reduces the political controversy but makes it more complex to
hold the responsible organisations to account. There is a risk of obfuscation in the plethora
of statistics that are published, and a risk of tolerance of poor performance because of the
complexity of what is being reported and a failure to create the “mission” and “terror”
advantage of simple targets.
There needs to be a clearer distinction between the reporting of performance
information on waiting times and the refinement of policy on waiting times. Over recent
years, the scope of the targets has been extended, and the measurement of the length of
time that patients waited for treatment has been refined. These are welcome
developments, but are distinct from the impact on performance that consistent public
reporting of data is designed to produce through enabling public and political scrutiny and
research evaluation. Naturally, governments will wish to monitor whether their aspirations
are being delivered, and statistics that relate specifically to their current target definition
are most useful in this situation. However, the creation of an evidence base for the policy
making community requires something different – indicators that can be compared over
time and/or across different health systems. For public reporting of performance to be an
effective policy, it is necessary both for the public to have information that it can use to
judge whether performance is improving relative to what would have happened otherwise
and for those whose performance is to be reported to know that that will be the case.
The Scottish Government does not commission a regular, ongoing and independent
evaluation of the impact of its waiting times policies, and we have found no research that
considers the effects of the current policy. Finally, the waiting times policy has grand aims,
such as improving health and raising economic productivity. These aims too are not
evaluated.
Notes
1. This section has been written by Peter C. Smith, Imperial College Business School and Centre forHealth Policy.
2. This section has been written by Matt Sutton, Institute of Population Health, University ofManchester and Health Economics Research Unit, University of Aberdeen.
3. www.scotland.gov.uk/About/scotPerforms/partnerstories/NHSScotlandperformance/18weeksRTT.
4. www.scotland.gov.uk/About/scotPerforms/partnerstories/NHSScotlandperformance/CAMHS.
5. In waiting times publications, unavailability is defined this: “If a patient is unavailable fortreatment and unable to accept an offer of appointment then this is recorded. If a patient informsthe hospital that they will be unable to accept an appointment because, for example, they are onholiday for a fortnight, then this is recorded as Social Unavailability. If a patient is medically unableto undergo a procedure because, for example, they have another medical issue such as raised bloodpressure that makes treatment inadvisable then this is recorded as Medical Unavailability.”(ISDScotland, 2012a, p. 7).
WAITING TIME POLICIES IN THE HEALTH SECTOR: WHAT WORKS? © OECD 2013 321

II.16. UNITED KINGDOM
References
Alvarez-Rosete, A., G. Bevan, N. Mays and J. Dixon (2005), “Effects of Diverging Policy across the NHS”,British Medical Journal, Vol. 331, pp. 946-950.
Appleby, J. and M. Philips (2009), “Satisfied Now?”, in A. Park, J. Curtice, K. Thomson, M. Phillips and E.Clery (eds.), British Social Attitudes: The 25th Report, Sage, London.
Appleby, J., S. Boyle, N. Devlin, M. Harley, T. Harrison, L. Locock and R. Thorlby (2004), SustainingReductions in Waiting Times: Identifying Successful Strategies, King’s Fund, London.
Audit Scotland (2006), Tackling Waiting Times in the NHS in Scotland, Edinburgh.
Barker, R., M. Pearce and M. Irving (2004), “Star Wars, NHS Style”, British Medical Journal, Vol. 329,pp. 107-109.
Bevan, G. (2006) “Setting Targets for Health Care Performance: Lessons from a Case Study of the EnglishNHS”, National Institute Economic Review, Vol. 197, No. 1, pp. 67-79.
Bevan, G. and C. Hood (2006a), “Have Targets Improved Performance in the English NHS?”, BritishMedical Journal, Vol. 332, pp. 419-422.
Bevan, G. and C. Hood (2006b), “What’s Measured Is What Matters: Targets and Gaming in the EnglishPublic Health Care System”, Public Administration, Vol. 84, No. 3,pp. 517-538.
Boyle, S. (2011), “United Kingdom (England): Health System Review”, Health Systems in Transition,Vol. 13, No. 1, pp. 1-486.
British Medical Association (2011), “A Scottish Consultants Committee guide to the “Basics” of the 2004Consultant Contract (Scotland)”, available online at bma.org.uk/-/media/.../Contracts/consscbasiccontractguidancenov2011.pdf.
Connolly, S., G. Bevan and N. Mays (2010), “Funding and Performance of Healthcare Systems in the FourCountries of the UK Before and After Devolution”, Nuffield Trust.
Dawson, D., H. Gravelle, R. Jacobs, S. Martin and P.C. Smith (2007), “The Effects of Expanding PatientChoice of Provider on Waiting Times: Evidence from a Policy Experiment”, Health Economics, Vol. 16,No. 2, pp. 113-128.
Department of Health (1995), Patient’s Charter, London.
Department of Health (2000), The NHS Plan: A Plan for Investment, A Plan for Reform, TSO, London.
Department of Health (2010a), Equity and Excellence: Liberating the NHS, Department of Health, London.
Department of Health (2010b), The NHS Constitution for England, Department of Health, London.
Department of Health (2010c), The Handbook to the NHS Constitution for England, Department of Health,London.
Department of Health (2011a), NHS Standard Contracts for 2012/13, Department of Health, London.
Department of Health (2011b), Operating Framework for the NHS in England 2012/13, Department ofHealth, London.
Department of Health (2011c), 2011/12 Annex to the Guidance for the 2010/11 NHS Standard Contract.
Department of Health Payment by Results Team (2011), A Simple Guide to Payment by Results.
Dixon, A., R. Robertson, J. Appleby, P. Burge, N. Devlin and H. Magee (2010), Patient Choice: How PatientsChoose and How Providers Respond, King’s Fund, London.
Godden, S. and A.M. Pollock (2009), “Waiting List and Waiting Time Statistics in Britain: A CriticalReview”, Public Health, Vol. 123, pp. 47-51.
Guardian (2011), “NHS Waiting Times Force Coalition U-turn on Targets”, available atwww.guardian.co.uk/society/2011/nov/17/nhs-waiting-times-u-turn.
Healthcare Commission and Audit Commission (2008), Is the Treatment Working? Progress with the NHSSystem Reform Programme, The Healthcare Commission, London.
Hood, C. and G. Bevan (2005), “Governance by Targets and Terror: Synecdoche”, Westminster EconomicsForum, Issue No. 15.
Information Services Division (2012a), “Inpatient, Day Case and Outpatient Stage of Treatment WaitingTimes (Formerly known as New Ways), Monthly & Quarterly Data to 31 December 2011”,
WAITING TIME POLICIES IN THE HEALTH SECTOR: WHAT WORKS? © OECD 2013322

II.16. UNITED KINGDOM
28 February 2012, available at www.isdscotland.org/Health-Topics/Waiting-Times/, accessed 1 April2012.
Information Services Division (2012b), “18 Weeks Referral to Treatment. Quarter Ending 31 December2011”, 28 February 2012, available at www.isdscotland.org/Health-Topics/Waiting-Times/, accessed 1 April2012.
Januleviciute, J., J.E. Askildsen, O.M. Kaarboe, T.H. Holmas and M. Sutton (2010), “The Impact ofDifferent Prioritisation Policies on Waiting Times: Case Studies of Norway and Scotland”,unpublished manuscript.
Mannion, R., H. Davies and M. Marshall (2005), “Impact of Star Performance Ratings in English AcuteHospital Trusts”, Journal of Health Services Research and Policy, Vol. 10, No. 1, pp. 18-24.
Monitor (2012), available at www.monitor-nhsft.gov.uk/.
NAO (2012), “Healthcare across the UK: A Comparison of the NHS in England, Scotland, Wales andNorthern Ireland”, Nati onal Audit office, Stationery Office, London.
NHS Employers (2003), Terms and Conditions – Consultants (England) 2003.
OECD (2012), OECD Health Data 2012, OECD Publishing, Paris, http://dx.doi.org/10.1787/health-data-en.
Office for National Statistics (2010), United Kingdom Health Statistics 2010, Edition No. 4, pp. 1752-1777.
Propper, C., M. Sutton, C. Whitnall and F. Windmeijer (2008), “Did “Targets and Terror’ Reduce WaitingTimes in England for Hospital Care?”, B.E. Journal of Economic Analysis & Policy, Vol. 8, No. 2, Article 5.
Propper, C., M. Sutton, C. Whitnall and F. Windmeijer (2010). “Incentives and targets in hospital care:Evidence from a natural experiment”, Journal of Public Economics, Vol. 94, No. 3-4, pp. 318-335.
Schoen, C., R. Osborn, D. Squires, M. Doty, R. Pierson and S. Applebaum (2010), “How Health InsuranceDesign Affects Access to Care and Costs, by Income, in Eleven Countries”, Health Affairs, Vol. 29,No. 12, pp. 2323-2334.
Scottish Executive (2000), Our National Health: A Plan for Action, a Plan for Change, Scottish Executive,Edinburgh.
Scottish Executive (2003), Partnership for Care: Scotland’s Health White Paper, Scottish Executive,Edinburgh.
Scottish Executive (2004). Fair to All, Personal to Each. Scottish Executive, Edinburgh.
Scottish Government (2007). Better Health, Better Care: An Action Plan. Edinburgh.
Scottish Government (2009), “Scottish Draft Budget 2010-11”, Edinburgh.
Scottish Parliament (2006). “Tackling Waiting Times in the NHS in Scotland”, Audit Committee Report,3rd Report, Session 2, SP Paper No. 590, Edinburgh.
Smith, P. (2007), “Performance Budgeting in England: Public Service Agreements”, in M. Robinson (ed.),Performance Budgeting: Linking Funding and Results, International Monetary Fund, Washington DC.
Smith, P. and M. Goddard (2009), “The English National Health Service: An Economic Health Check”,OECD Economics Department Working Paper No. 716, OECD Publishing, Paris.
Stevens, S. (2004), “Reform Strategies for the English NHS”, Health Affairs, Vol. 23, No. 3, pp. 37-44.Boyle, S. (2011), “United Kingdom (England): Health System Review”, Health Systems in Transition,Vol. 13, No. 1, pp. 1-486.
WAITING TIME POLICIES IN THE HEALTH SECTOR: WHAT WORKS? © OECD 2013 323


ORGANISATION FOR ECONOMIC CO-OPERATIONAND DEVELOPMENT
The OECD is a unique forum where governments work together to address the economic, social and
environmental challenges of globalisation. The OECD is also at the forefront of efforts to understand and
to help governments respond to new developments and concerns, such as corporate governance, the
information economy and the challenges of an ageing population. The Organisation provides a setting
where governments can compare policy experiences, seek answers to common problems, identify good
practice and work to co-ordinate domestic and international policies.
The OECD member countries are: Australia, Austria, Belgium, Canada, Chile, the Czech Republic,
Denmark, Estonia, Finland, France, Germany, Greece, Hungary, Iceland, Ireland, Israel, Italy, Japan, Korea,
Luxembourg, Mexico, the Netherlands, New Zealand, Norway, Poland, Portugal, the Slovak Republic, Slovenia,
Spain, Sweden, Switzerland, Turkey, the United Kingdom and the United States. The European Union takes
part in the work of the OECD.
OECD Publishing disseminates widely the results of the Organisation’s statistics gathering and
research on economic, social and environmental issues, as well as the conventions, guidelines and
standards agreed by its members.
OECD PUBLISHING, 2, rue André-Pascal, 75775 PARIS CEDEX 16
(81 2012 09 1 P) ISBN 978-92-64-17906-6 – No. 60173 2013

OECD Health Policy Studies
Waiting Time Policies in the Health Sector WHAT WORKS?Contents
Executive summary
Part I. OverviewChapter 1. Waiting times for heath care: A conceptual framework
Chapter 2. Measuring waiting times across OECD countries
Chapter 3. A review of waiting times policies in 13 OECD countries
Part II. Review of waiting times policies: Country case studiesChapter 4. Australia
Chapter 5. Canada
Chapter 6. Denmark
Chapter 7. Finland
Chapter 8. Ireland
Chapter 9. Italy
Chapter 10. Netherlands
Chapter 11. New Zealand
Chapter 12. Norway
Chapter 13. Portugal
Chapter 14. Spain
Chapter 15. Sweden
Chapter 16. United Kingdom
ISBN 978-92-64-17906-6 81 2012 09 1 P -:HSTCQE=V\^U[[:
Waitin
g T
ime P
olicies in th
e Health S
ector W
HA
T W
OR
KS
?O
EC
D H
ealth Po
licy Stu
dies
OECD Health Policy Studies
Waiting Time Policies in the Health Sector WHAT WORKS?
Consult this publication on line at http://dx.doi.org/9789264179080-en
This work is published on the OECD iLibrary, which gathers all OECD books, periodicals and statistical databases. Visit www.oecd-ilibrary.org for more information.