wake characteristics of large-scale wind turbines
TRANSCRIPT

2015 European Rotorcraft ForumSeptember 1 - 4, Munich, Germany
Paper 087
Wake Characteristics of Large-scale Wind Turbines
Yaxing Wang, Vladimir Leble, Mark White and George N. Barakos
School of Engineering, University of Liverpool, L69 3GH, U.K.Email: [email protected]
Abstract
The next generation of large-scale wind turbines will exceed 10 MW of rated power and will reach rotor diameters of about200 m. Their rotor aerodynamics are also extreme with Reynolds numbers that reach 40 million. The wakes generated by thesewind turbines cover a very large area downstream of their installation positions which increases the possibility that the wakevortices generated by these large wind turbines may affect passing-byflying vehicles. In this paper a CFD study of a large windturbine was carried out to predict the power curves and aerodynamic loads on the rotor blades. Flow control devices of activeleading and trailing edge flaps were also considered in the CFD study and theeffects of flaps were investigated. The near wakeflow was captured in the CFD study and the flaps add more complexity to the wake flow. To study the potential wind turbinewake encounters by aircraft, engineering wake models were developed to predict the wind turbine far wakes. The wake inducedvelocity fields were integrated into an aircraft flight dynamics model to simulate wind turbine wake encounter scenarios, designedfor a light aircraft approaching an airport, where a wind turbine is installed. The severity of the wind turbine wake encounterwas analysed using off-line flight simulations. The off-line simulation results indicated that the wake encounter severity washighly dependent on the ways that the wake vortex circulation and the coresize were calculated, which suggested that fieldmeasurements of large wind turbines wake flow are needed to verify the modelling and CFD results.
1 INTRODUCTION
The wake vortices generated by a wind turbine or a wind farmhave similar, but not identical, characteristics as aircraft wakevortices. The next generation of large-scale wind turbineswillexceed 10 MW of rated power and will reach rotor diametersof about 200 m [1]. The rotor aerodynamics are also extremewith Reynolds numbers reaching 40 million. The wakes gen-erated by these wind turbines cover a very large area down-stream of their installation positions which increases thepos-sibility that the wake vortices generated by these large windturbines may affect passing-by flying vehicles. In the past,theUniversity of Liverpool (UoL) has studied the wake encoun-ters between relatively small wind turbine wakes and lightGA aircraft using engineering modelling, CFD, LIDAR fieldmeasurements and piloted flight simulations [13].
The advent of the large-scale wind turbines presents newchallenges not only for the CFD study of wind turbine perfor-mance and prediction of aerodynamic loads, but also for thewind turbine wake evaluations.
To obtain realistic wake data may be difficult unless highresolution CFD is used [5]. This is not only due to the largescale wake but also due to the complexity of the flow causedby flaps on the blades. Flaps are to be used on these large-scale wind turbines to control the flow and alleviate aerody-namic loads. The flaps will produce their own tip vorticesand the wake now is difficult to predict with engineering wakemodels.
UoL is participating in the European project AVATAR
concerning the development of next generation very largewind turbines with a power output of 10 MW. Advanced aero-dynamic CFD studies were conducted to predict the powercurves and detailed loads of such wind turbines.
In the UK wind turbines are being proposed and builtclose to aerodromes, indicating an urgent need to assess thepotential impact of wake turbulence on aircraft and in partic-ular, to light aircraft and helicopters [3]. So the understandingand prediction of wind turbine wake characteristics are vitalto prevent flight accidents during wind turbine wake encoun-ters.
Wind turbine wakes can be divided into near and far wakeregions [10, 12]. The near wake is the area just behind therotor up to approximately one rotor diameter downstream,where the effect of rotor properties, including the blade aero-dynamics and geometry determine the flow field. Near wakeresearch is focused on the wind turbine performance and thephysics of power extraction. The far wake is the region be-yond the near wake, where the details of the rotor are lessimportant. The main interest in this area is the wake inter-ference with other wind turbines (wind farm) or passing-byaircraft (wind turbine wake encounter). Here, the flow con-vection and turbulent diffusion are the two main mechanismsthat determine the far flow field.
There are similarities between helicopter rotor wakes andwind turbine wakes and the vortex methods that are used forthe analysis of helicopter wake problems can be adopted torepresent the strengths and the spatial locations of the vorticalwake elements that are trailed by each blade and convected
1

into downstream. Prescribed vortex wake models [6] havealso been developed for wind turbine applications. Like thehelicopter rotor wake cases, the models are usually based onthe assumption of incompressible, potential flow, and experi-mental observations. The free wake model [7, 8] determinesthe wake shape based on the local velocity field, and the wakestructure is represented by a large number of free vortex fil-aments. These filaments can propagate freely in the inducedvelocity field. Its solution can only be obtained by iterations.
CFD simulation of wind turbine wakes is an active areaof research, and with increasing computer power, grid-basedCFD simulation of wind turbine from Navier–Stokes (NS)equations are practical. However, the far wake simulationneeds fine grid resolution. Actuator disk [10, 12] and actu-ator line [11] methods were used to simulate the rotor andthe rest of flow was simulated by solving the NS equations,which enabled the CFD domain to cover the region extendingfrom rotor plane to several diameters downstream to studyboth the near and far wake development. Recently, full CFDmethods [4, 5] were used to study the wake development andbreakdown. These methods are very computationally expen-sive and require fine grids to cover the far wake region. Inmost CFD wake studies, the flow conditions were treated asideal. The effects of wind shear, terrain and ambient turbu-lence were normally ignored. This results in predictions thatshow much stronger and coherent vortices.
For large wind turbines, the full CFD simulation of windturbine far wake requires very fine grid and large domain cov-ering a long distance (at least 4D-5D) downstream to capturethe detailed physics of the wake evolutions. This restrictionmakes the full CFD study of a wind turbine wake deemed tobe impractical, especially for the generation of wake databasefor the flight simulations. To this end, engineering modelswith reasonable accuracy and low computational cost weresought. The Kocurek wake model and freewake model weredeveloped and validated with available measurements.
The velocity data generated by the models were applied inthe off-line flight simulations to study the wake hazard sever-ity when a light aircraft configured based on a Grob Tutor air-craft, encounters the wind turbine wake. The Kocurek modeland the free wake model were applied for large wind turbinesfor the generation of wake induced flow.
In this paper, CFD results on the next generation largewind turbines are introduced. The power output and the aero-dynamic loads on rotor blades were evaluated, and the effectsof trailing and leading edge oscillating flaps on blade loadsand flow were investigated. The near wake characteristics ofthe wind turbine are presented and compared with and with-out the actions of flaps.
Different engineering wind turbine wake models that wereused in the previous wake studies were applied to the largewind turbine. Off-line flight simulations were carried out toanalyse the hazard severity when a GA aircraft encounteredthese large wind turbine wakes.
2 CFD SIMULATION OF THE AVATAR WIND
TURBINE
AVATAR is the next generation wind turbine developed forpower output of 10 MW. The rotor diameter reaches to
205.8m. To predict the performance and potential flow con-trol devices in the form of active flaps, CFD analyses of theAVATAR wind turbine have been conducted. The HelicopterMulti-Block (HMB2) solver developed at Liverpool Univer-sity was used to estimate the aerodynamic forces and bladedeformation. The HMB2 solver has so far been validated forseveral wind turbine cases, including the NREL and Mexicoproject [4] experiments.
2.1 Numerical methods
The HMB2 code is a 3D multi-block structured solver andsolves the Navier-Stokes equations in the 3D Cartesian frameof reference. HMB2 solves the Navier-Stokes equations inintegral form using the arbitrary Lagrangian-Eulerian formu-lation for time-dependent domains with moving boundaries.The solver uses a cell-centred finite volume approach com-bined with an implicit dual-time method. The Osher upwindscheme is used to resolve the convective fluxes. Central dif-ferencing (CD) spatial discretisation method is used to solvethe viscous terms. The non-linear system of equations that isgenerated as a result of the linearisation is then solved by inte-gration in pseudo-time using a first-order backward differencemethod. A Generalised Conjugate Gradient (GCG) methodis then used in conjunction with a Block Incomplete Lower-Upper (BILU) factorisation as a pre-conditioner. The HMB2solver has a library of turbulence closures including severalone-equation and two-equation turbulence models, and tur-bulence simulation is also possible using either the Large-Eddy or the Detached-Eddy simulation approach. The solverwas designed with parallel execution in mind and the MPI li-brary along with a load-balancing algorithm are used to thisend. The flow solver can be used in serial or parallel fash-ion for large-scale problems. Depending on the purposes ofthe simulations, steady and unsteady wind turbine CFD sim-ulations can be performed in HMB2 using single or full rotormeshes generated using the ICEM-Hexa tool. Rigid or elas-tic blades can be simulated using static or dynamic compu-tations. To account for low-speed flows, the Low-Mach Roescheme (LM-Roe) [4] was developed for wind turbine cases.
2.2 CFD results
2.2.1 Power and loads predictions
First, steady and unsteady computations were preformed as-suming rigid blades. The thrust and mechanical power asfunction of wind speed are presented in Figure 1. The k-ωSST turbulence model was employed for the computations.The computation domain included a single blade taking ad-vantage of the flow periodic in the space. The grid size was9.7M cells with an initial wall distance of10−6 of the blademaximum chord to resolve the thin boundary layers. The re-sults were compared with that of different CFD solvers usedby various AVATAR partners and relatively good agreementwas achieved. As can be seen the thrust values are far beyondthe conventional wind turbines.
2
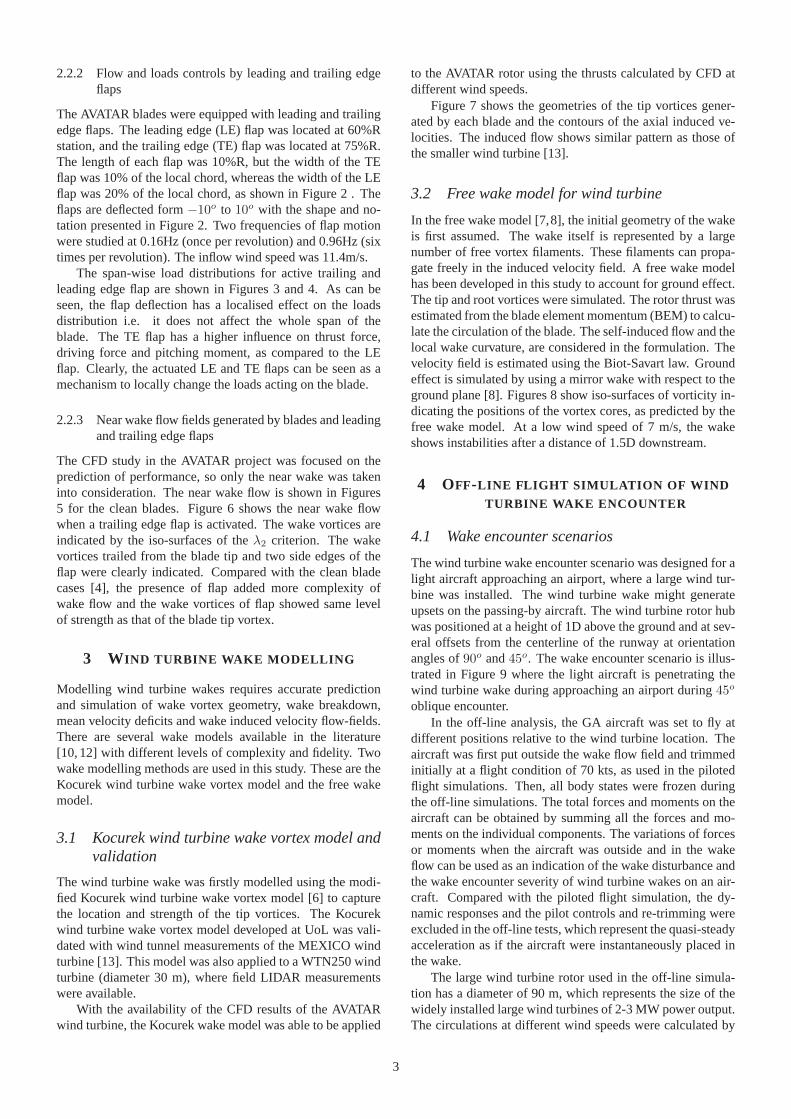
2.2.2 Flow and loads controls by leading and trailing edgeflaps
The AVATAR blades were equipped with leading and trailingedge flaps. The leading edge (LE) flap was located at 60%Rstation, and the trailing edge (TE) flap was located at 75%R.The length of each flap was 10%R, but the width of the TEflap was 10% of the local chord, whereas the width of the LEflap was 20% of the local chord, as shown in Figure 2 . Theflaps are deflected form−10o to 10o with the shape and no-tation presented in Figure 2. Two frequencies of flap motionwere studied at 0.16Hz (once per revolution) and 0.96Hz (sixtimes per revolution). The inflow wind speed was 11.4m/s.
The span-wise load distributions for active trailing andleading edge flap are shown in Figures 3 and 4. As can beseen, the flap deflection has a localised effect on the loadsdistribution i.e. it does not affect the whole span of theblade. The TE flap has a higher influence on thrust force,driving force and pitching moment, as compared to the LEflap. Clearly, the actuated LE and TE flaps can be seen as amechanism to locally change the loads acting on the blade.
2.2.3 Near wake flow fields generated by blades and leadingand trailing edge flaps
The CFD study in the AVATAR project was focused on theprediction of performance, so only the near wake was takeninto consideration. The near wake flow is shown in Figures5 for the clean blades. Figure 6 shows the near wake flowwhen a trailing edge flap is activated. The wake vortices areindicated by the iso-surfaces of theλ2 criterion. The wakevortices trailed from the blade tip and two side edges of theflap were clearly indicated. Compared with the clean bladecases [4], the presence of flap added more complexity ofwake flow and the wake vortices of flap showed same levelof strength as that of the blade tip vortex.
3 WIND TURBINE WAKE MODELLING
Modelling wind turbine wakes requires accurate predictionand simulation of wake vortex geometry, wake breakdown,mean velocity deficits and wake induced velocity flow-fields.There are several wake models available in the literature[10, 12] with different levels of complexity and fidelity. Twowake modelling methods are used in this study. These are theKocurek wind turbine wake vortex model and the free wakemodel.
3.1 Kocurek wind turbine wake vortex model andvalidation
The wind turbine wake was firstly modelled using the modi-fied Kocurek wind turbine wake vortex model [6] to capturethe location and strength of the tip vortices. The Kocurekwind turbine wake vortex model developed at UoL was vali-dated with wind tunnel measurements of the MEXICO windturbine [13]. This model was also applied to a WTN250 windturbine (diameter 30 m), where field LIDAR measurementswere available.
With the availability of the CFD results of the AVATARwind turbine, the Kocurek wake model was able to be applied
to the AVATAR rotor using the thrusts calculated by CFD atdifferent wind speeds.
Figure 7 shows the geometries of the tip vortices gener-ated by each blade and the contours of the axial induced ve-locities. The induced flow shows similar pattern as those ofthe smaller wind turbine [13].
3.2 Free wake model for wind turbine
In the free wake model [7,8], the initial geometry of the wakeis first assumed. The wake itself is represented by a largenumber of free vortex filaments. These filaments can propa-gate freely in the induced velocity field. A free wake modelhas been developed in this study to account for ground effect.The tip and root vortices were simulated. The rotor thrust wasestimated from the blade element momentum (BEM) to calcu-late the circulation of the blade. The self-induced flow and thelocal wake curvature, are considered in the formulation. Thevelocity field is estimated using the Biot-Savart law. Groundeffect is simulated by using a mirror wake with respect to theground plane [8]. Figures 8 show iso-surfaces of vorticity in-dicating the positions of the vortex cores, as predicted by thefree wake model. At a low wind speed of 7 m/s, the wakeshows instabilities after a distance of 1.5D downstream.
4 OFF-LINE FLIGHT SIMULATION OF WIND
TURBINE WAKE ENCOUNTER
4.1 Wake encounter scenarios
The wind turbine wake encounter scenario was designed for alight aircraft approaching an airport, where a large wind tur-bine was installed. The wind turbine wake might generateupsets on the passing-by aircraft. The wind turbine rotor hubwas positioned at a height of 1D above the ground and at sev-eral offsets from the centerline of the runway at orientationangles of90o and45o. The wake encounter scenario is illus-trated in Figure 9 where the light aircraft is penetrating thewind turbine wake during approaching an airport during45o
oblique encounter.In the off-line analysis, the GA aircraft was set to fly at
different positions relative to the wind turbine location.Theaircraft was first put outside the wake flow field and trimmedinitially at a flight condition of 70 kts, as used in the pilotedflight simulations. Then, all body states were frozen duringthe off-line simulations. The total forces and moments on theaircraft can be obtained by summing all the forces and mo-ments on the individual components. The variations of forcesor moments when the aircraft was outside and in the wakeflow can be used as an indication of the wake disturbance andthe wake encounter severity of wind turbine wakes on an air-craft. Compared with the piloted flight simulation, the dy-namic responses and the pilot controls and re-trimming wereexcluded in the off-line tests, which represent the quasi-steadyacceleration as if the aircraft were instantaneously placed inthe wake.
The large wind turbine rotor used in the off-line simula-tion has a diameter of 90 m, which represents the size of thewidely installed large wind turbines of 2-3 MW power output.The circulations at different wind speeds were calculated by
3

using the following Beddoes formula [2].
Γ/(cRΩ) = 2.4cT /σ (1)
wherecT = Thrust/(ρπR4Ω2), σ is the solidity of rotorblades,Ω is the rotation speed of the rotor andc is the chordof blades.
It can also be calculated by using scaling laws from asmall wind tunnel wind turbine wake measurement [9].
The initial wake vortex core is set to be 5 percent of the av-eraged chord [2, 7]. In the off-line analysis the enlarged coresize (20 percent chord) was also used to consider a worst-case-scenario.
In this paper, "model 1" and "model 2" are used to indi-cate that the Beddoes formula and the scaling laws circulationformula [9].
The decay of local wake vortex circulationΓi after time tcan be calculated by
Γi/Γ0 = exp(−CtΓ0/(2πb2
0Tc)) (2)
whereΓ0 is the initial circulation,b0 is the vortex span, andC is a constant of 0.45.Tc is determined by
ǫ∗(Tc)4/3 = 0.7475 (3)
ǫ∗ = 2πb0/(Γ0(ǫb0)1/3) (4)
whereǫ is the turbulent intensity. For a high turbulence caseat the turbulent intensity of 10%,ǫ is 0.01.
The final circulation decay is
Γi/Γ0 = exp(−Ct(ǫΓ0)1/4/(0.956(π)1/4b0)) (5)
4.1.1 Wake induced crosswinds of a large wind turbine
There is a limit on the magnitude of the allowed crosswinddependent on the airport and the aircraft. The wind turbinewake induced flow can be seen as crosswind to the encounter-ing aircraft. The wake induced velocity fields were obtainedon a large wind turbine using the Kocurek wake model. Thedominant velocity component is the axial velocity U. The Vand W velocities are one order of magnitude smaller than theU velocity. In the crossing or oblique encounters, the axialvelocity constitutes the crosswind, which is one of the criteriaused for evaluation of the encountering hazard. For an airport(codes A-I or B-I) that is expected to accommodate single en-gine aircraft, the maximum crosswind is 12.10 mph (17.75ft/s) [9].
Two wind speeds of 32.8 ft/s and 65.6 ft/s were used inthe off-line simulations. The wake induced crosswind speedsof this large wind turbine in the wake region are shown inFigure 10. The wake induced crosswind speeds calculated inmodel 1 are less than the criteria in the whole wake region;while in model 2, the induced crosswind speeds exceeded thecrosswind criterion of the A-IV through D-VI airports in theregion within 65D for the lower wind speed of 32.8 ft/s and inall region up to 100D for the higher wind speed of 65.6 ft/s.
4.1.2 Variations of forces and moments of the GA duringwake encounters
For the GA aircraft based on the Grob Tutor configuration, thewing areaSwing = 131.4ft2 and the wind spansp = 32.8ft.A flight speedwf = 70kt (118ft/s) was used in the off-linesimulations. The forces and moments were normalised by0.5ρwf2Swing and0.5ρwf2Swingsp ,respectively, to obtainthe force and moment coefficients. The off-line simulation re-sults of crossing encounters are shown in Figures 11 and 12,where variations of the forces and moments coefficients onthe GA as it encountered the wind turbine wake along the run-way central line at an offset of 3D were plotted. The figuresshow similar trends as the small wind turbine with a domi-nant yaw moment disturbance. However, the magnitudes ofthe coefficients of the forces and moments were much largerthan that of a small wind turbine. The circulations calculatedin model 2 were larger than these in model 1, and resulted inmuch large variations.
4.1.3 Analysis of the roll upsets during wake encounters
In the off-line flight simulation, the aircraft might have missedthe positions where the induced velocities are large when itflew through the wake. So the off-line results of the rollingmoment coefficient might not account for very localised peakvelocities. In this section, an analytical method was adoptedto calculate the rolling moment coefficients on the points ofafine grid in the wake field. The wake induced velocity com-ponents were extracted in the regions close to the rotor tip,where the induced velocities reach the maximum and min-imum values with rapid changes. According to the reportof [9], this is the area that the wake caused the largest rollupsets on the encountering aircraft. If the wake vortex corewas assumed to be comparable with the aircraft wing span,and when the aircraft was positioned in the vortex center andwas orientated with the vortex axis, the vortex produced up-wash on one side of the wing and downwash on the otherside, which resulted maximum induced velocities in the ver-tical direction and hence generated the largest roll momenton the aircraft. The same methodology of calculating the rollmoment was also adopted here. The wake induced velocitycomponents were obtained using a fine grid with resolutionof 1 ft in the regions close to the vortex tip-path. The aircraftwas configured to be flying in an orientation that the threevelocity components could be treated as the vertical veloci-ties on the wing. An integration of the induced velocities atthe computing points was then carried out to obtain the rollmoment coefficients at each position.
The contours of the wake induced rolling moment coef-ficients caused by the velocity componentsVy and Vx areshown in Figure 13. A higher wind speed of 65.6 ft/s andthe circulation formula of model 2, and an enlarged core sizeof 20 percent chord were used in the calculations of the wakeinduced rolling moment coefficients. This was considered tobe the worst case scenario. The GA aircraft geometry is alsoplotted in the figure for comparison.
The peaks and valleys of the rolling moment coefficientswere well captured by using the fine grid. The maximumrolling moment coefficients were approximately 0.06 and 0.1induced by the velocity componentsVy andVx, respectively.
4

The criteria of the rolling moment coefficient is 0.28, whichwas calculated by considering the maximum rolling momentthat the aileron on a normal aircraft can generate at the maxi-mum deflection angle [9].
5 CONCLUSIONS AND FUTURE WORK
A CFD study of the next generation large (AVATAR) windturbine of 10 MW was carried out to predict the power out-put and aerodynamic loads on the rotor blades. The effects offlow control devices in the form of trailing and leading edgeflaps were investigated. The near wake characteristics of theAVATAR wind turbine were captured in the CFD predictions.However, based on the previous CFD study of the wind tur-bine wake breakdown, the far wake CFD study requires a veryfine grid and a large computational domain covering a longdistance (at least 4D-5D) downstream to capture the detailedphysics of the wake evolutions. This restriction makes the fullCFD study of wind turbine wake impractical, especially, forthe generation of wake database for the flight simulations.
Different engineering wake models were sought to gener-ate wake data with reasonable accuracy and low computationcost. A Kocurek wake model and a freewake model were de-veloped and validated with available measurements. Thesemodels generated wake induced velocity fields with essentialfeatures. The velocity data generated by the models were ap-plied to the off-line flight simulations to study the wake haz-ard severity when a light aircraft approximating a Grob Tutoraircraft, encounters the wind turbine wake.
The wake induced crosswinds were compared with thecriteria of FAA [9] for different types of airports. The wakeinduced rolling moments on the encountering aircraft wereanalysed and compared with the rolling criterion which isbased on the maximum roll moment produced by the aileron.The ways of calculation of wake vortex circulation and coresize was found to play a vital role in the evaluation of wakeencounter severity. The Beddoes circulation formula, whichwas developed for helicopter rotors and is supported by ex-perimental evidence, produced less crosswind and rolling mo-ments than those predicted by the scaling laws from a smallwind tunnel experimental data. This suggested that field LI-DAR measurements of large wind turbine wakes are neededto verify the wind turbine wake modelling, wake strength, de-cay and full CFD simulation results.
Piloted fight simulations are planned to put pilots in theloop to study the wake encounter severity on the encounter-ing light aircraft and helicopters in the same fashion as that ofthe previous study of a small wind turbine wake encounters.Wind turbine wakes with higher spatial resolutions will begenerated for both piloted and off-line flight simulations.Un-steady wakes with different turbulence intensities are plannedto be implemented in future fight simulations.
AcknowledgementsThe financial supports from the AVATAR project (FP7-ENERGY-2013-1/N608396), the MARE-WINT project and the Civil Aviation
Authority (CAA) UK and the University of Liverpool are gratefullyacknowledged.
COPYRIGHT STATEMENT
The author(s) confirm that they, and/or their company or organisa-tion, hold copyright on all of the original material included in thispaper. The authors also confirm that they have obtained permission,from the copyright holder of any third party material included in thispaper, to publish it as part of their paper. The author(s) confirm thatthey give permission, or have obtained permission from the copy-right holder of this paper, for the publication and distribution of thispaper as part of the ERF2015 proceedings or as individual offprintsfrom the proceedings and for inclusion in a freely accessible web-based repository.
REFERENCES
[1] AVATAR Project. AVATAR next generation of large scale windturbines, 2014.
[2] T.S. Beddoes. A Wake Model for High Resolution Airloads.U.S. Army/AHS Conference on Rotorcraft Basic Research,February 1985.
[3] CAA. CAA Policy and Guidelines on Wind Turbines. Techni-cal report, Civil Aviation Authority, January 2012.
[4] M. Carrion, R. Steijl, M. Woodgate, and G. Barakos. CFDAnalysis of the Wake of the MEXICO Wind Turbine.WindEnergy, 00:1–17, 2012.
[5] M. Carrion, M. Woodgate, R. Steijl, G. Barakos, S. Gomez-Iradi, and X. Munduate. Understanding Wind Turbine WakeBreakdown Using CFD.Journal of AIAA, Accepted, 2014.
[6] D. Kocurek. Lifting Surface Performance Analysis for Hori-zontal Axis Wind Turbines. Technical Report SERI/STR-217-3163, Solar energy research institute, US department of energy,1987.
[7] G. Leishman. Principles of Helicopter Aerodynamics. Cam-bridge aerospace series book, Cambridge, UK, second edition,2007.
[8] J.G. Leishman, M.J. Bhagwat, and A. Bagai. Free-Vortex Fil-ament Methods for the Analysis of Helicopter Rotor Wakes.Journal of Aircraft, 39(5):759–775, 2002.
[9] T.E. Mulinazzi and Z.C. Zheng. Wind Farm Turbulence Im-pacts on General Aviation Airports in Kansas. TechnicalReport K-TRAN KU-13-6, Kansas State University, January2014.
[10] B. Sanderse. Aerodynamics of Wind Turbine Wakes. TechnicalReport ECN-E-09-016, Energy research centre of the Nether-lands, 2000.
[11] N. Troldborg, J.N. Sorensen, and R. Mikkelsen. NumericalSimulations of Wake Characteristics of a Wind Turbine in Uni-form Inflow. Wind Energy, 13:86–99, 2010.
[12] L. Vermeer, J. Sorensen, and A. Crespo. Wind Turbine WakeAerodynamics.Progress in Aerospace Sciences, 39:467–510,2003.
[13] Y. Wang, M. White, G. Baracos, S. Wheeler, P. Tormey, andP. Pantazopoulou. Wind turbine wake encounter by light air-craft. In 40th European Rotorcraft Forum, Southampton, UK,September 2014.
5

Wind Speed (m/s)
Pow
er (
KW
)
5 10 15 200
2000
4000
6000
8000
10000
12000
(a)
Wind Speed (m/s)
Thr
ust (
KN
)
5 10 15 200
200
400
600
800
1000
1200
1400
1600
(b)
Figure 1: Power and thrust of the AVATAR wind turbine rotor, CFD simulation, rotor diameter 205.8 m with varying pitch androtation speed.
(a) Flap locations (b) Trailing edge flap (c) Leading edge flap
Figure 2: Flap locations on the AVATAR wind turbine blade andflap deflections.
r/R [-]
Thr
ust F
orce
[N/m
]
0 0.2 0.4 0.6 0.8 10
2000
4000
6000
8000
10000
12000=-10.0=-8.7=-5.0=0.0=5.0=8.7=10.0
(a)
r/R [-]
Tan
gent
ial F
orce
[N/m
]
0 0.2 0.4 0.6 0.8 1
0
200
400
600
800
1000
1200
=-10.0=-8.7=-5.0=0.0=5.0=8.7=10.0
(b)
r/R [-]
Pitc
hing
Mom
ent [
Nm
/m]
0 0.2 0.4 0.6 0.8 1-6000
-5000
-4000
-3000
-2000
-1000
0
1000
=-10.0=-8.7=-5.0=0.0=5.0=8.7=10.0
(c)
Figure 3: Spanwise distributions of forces and pitch momentof the AVATAR wind turbine blade with a trailing edge flap, windspeed 11.4 m/s, flap deflection range -10 deg to 10 deg at a frequency of 0.96Hz (6 Per rev).
6

(a) (b) (c)
Figure 4: Spanwise distributions of forces and pitch momenton the AVATAR wind turbine blade with a leading edge flap, windspeed 11.4 m/s, flap deflection range -10 deg to 10 deg at a frequency of 0.96Hz (6 6 Per rev).
Figure 5: Iso-surfaces of Q=0.1 generated by clean blades and coloured using Cp.
7

Figure 6: Contours of iso-surfaces ofλ2 of an AVATAR blade with an active trailing edge flap.
Figure 7: AVATAR wake geometries generated by Kocurek modelat wind speed of 10.5 m/s.
8

(a) Wind speed 7 m/s
(b) Wind speed 10.5 m/s
(c) Wind speed 20 m/s
Figure 8: Contours of iso-surfaces of vorticity and inducedaxial velocities predicted by free wake model at wind speedsof 7m/s, 10.5 m/s and 20 m/s.
9

Figure 9: Oblique wind turbine (45o) wake encounter scenario.
X/D
U (
ft/s)
20 40 60 80 1000
50
100
150
200
250
Model 1 V32.8Model 2 V32.8Model 1 V65.6Model 2 V65.6AI-BIAIV-DVI
Figure 10: Wake induced crosswind speeds against distances, 90 m diameter large wind turbine, wind speed 32.8 ft/s and 65.6ft/s. AI-BI: airport codes expected to accommodate single engine aircraft; AIV-DIV: airport codes for larger air carrier airports.
10

Figure 11: Variations of coefficients of forces and moments during off-line crossing wake encounter, GA flew along the runwayCentral line, offset 3D, model 1, normal core size, wind speed 32.8 ft/s.
Figure 12: Variations of coefficients of forces and moments during off-line crossing wake encounter, GA flew along the runwaycentral line, offset 3D, model 2, enlarged core size, wind speed 32.8 ft/s.
11

X/D
Z/D
-1 -0.8 -0.6 -0.4 -0.2 0 0.2 0.4 0.6 0.8 14
4.2
4.4
4.6
4.8
5
Crm
0.060.050.040.030.020.010
-0.01-0.02-0.03-0.04-0.05-0.06
(a) Rolling moment coefficients induced byVy
X/D
Z/D
-1 -0.8 -0.6 -0.4 -0.2 0 0.2 0.4 0.6 0.8 14
4.2
4.4
4.6
4.8
5
Crm1
0.10.080.060.040.020
-0.02-0.04-0.06-0.08-0.1
(b) Rolling moment coefficients induced byVx
Figure 13: Wake induced rolling moment coefficients of a large wind turbine with a 90 m diameter, model 2, wind speed 65.6ft/s, the outline of the GA aircraft used for off-line flight simulations is also shown.
12