wake-up-word technology and it’s applications dr. veton këpuska wake-up-word (wuw) speech...
TRANSCRIPT

Wake-Up-Word Technology and it’s Applications
Dr. Veton Këpuska•Wake-Up-Word (WUW) Speech Recognition Voice Only Activated Air-Traffic Control of Unmanned Aircraft.
•Surveillance for suspicious activity, intrusion, and breach with a proven covert seismic technology known as Seismic Arrays for Local Situation Awareness (SALSA) with a proven speech recognition technology known as Wake-Up Word (WUW)

Spontaneous Human-Machine Interface
• Architecture of WUW driven voice only interface system
COTSSpeech-to-Text/DataText/Data-to-Speech
Nuance TTS
Command and Control
Nuance ASR/OSR
DavidClarkHeadset
VAD & DavidClark
HeadsetSignal Enhancement
Algorithm
Lowest Score of an OOV Sample
See Previous Figure
Lowest Score of an OOV Sample
See Previous Figure
WUW Recognizer
External Speaker

Covert Perimeter Monitoring, Detection and Cueing • Seismic Arrays for Local Situation Awareness
(SALSA) with a proven Wake-Up Word (WUW) speech recognition technology SALSA:WUW
Past Projects
• SAR-LAB: Speech Processing, Analysis and Recognition
• Processing & Analyzing Signals• Digital Signal Processing
• Recognition of Patterns• Pattern Recognition

Machine Learning
• Dr. Georgios Anagnostopoulos

An Intro to Clustering• Clustering refers to grouping data points into “natural” / ”meaningful”
groupings. These groupings are called clusters.• What constitutes a “natural” grouping is sometimes very subjective… See
example below with 2D data:
Group 1 Group 2
Obvious natural grouping Not so obvious natural grouping
3 groups?
2 groups?
1 group?

An Intro to Clustering• Nevertheless, clustering plays an important role in Machine Learning (ML)
and other disciplines.
• For example, it is reasonable to assume (at least, in principle) that two groups of money borrowers exist: “responsible” and “irresponsible”. Financial institutions like banks, which need to make decisions whether they are going to lend money or not to a given customer, have to base their decision on the customer’s credit history (data points). Therefore it may make sense to group customers into 2 groups based on their credit history.
• However, a more fine-grained grouping with 3 clusters, such as “responsible”, “occasionally responsible” and “irresponsible”, may also be desirable. Notice the subjectivity involved in clustering depending on the particular application…
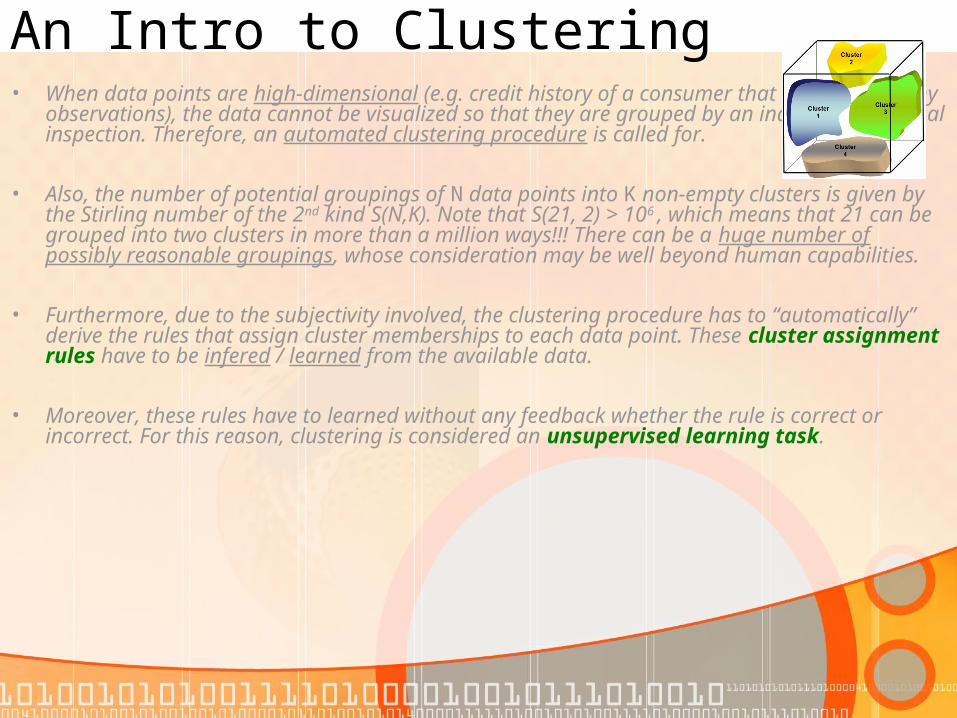
An Intro to Clustering• When data points are high-dimensional (e.g. credit history of a consumer that consists of many
observations), the data cannot be visualized so that they are grouped by an individual via visual inspection. Therefore, an automated clustering procedure is called for.
• Also, the number of potential groupings of N data points into K non-empty clusters is given by the Stirling number of the 2nd kind S(N,K). Note that S(21, 2) > 106 , which means that 21 can be grouped into two clusters in more than a million ways!!! There can be a huge number of possibly reasonable groupings, whose consideration may be well beyond human capabilities.
• Furthermore, due to the subjectivity involved, the clustering procedure has to “automatically” derive the rules that assign cluster memberships to each data point. These cluster assignment rules have to be infered / learned from the available data.
• Moreover, these rules have to learned without any feedback whether the rule is correct or incorrect. For this reason, clustering is considered an unsupervised learning task.

An Intro to Clustering• Clustering criteria are mainly based on data point similarity, such as intra-
group and between-group point similarities. Many times relative inter-point distance between data points is used as a measure of similarity. Actually, in the examples of the 1st slide you unknowingly used relative inter-point distances to decide whether a collection of points forms a cluster or not!
• When clusters are described by a representative data point (cluster prototype), such as the mean vector of all patterns belonging to the same cluster, clustering can be thought as a data compression effort: the N original data points are replaced by the K cluster prototypes (K<<N). The collection of cluster prototypes is sometimes referred to as a codebook.• As a matter of fact, some image compression algorithms indeed use clustering at
some stage of their operation.
The k-Means Clustering Algorithm• A very popular clustering
procedure is the k-Means Algorithm.
• It is a prototype-based algorithm using the mean vector (cluster center) of all data points belonging to a cluster as the cluster representative (thus its name).
• A data point is assigned to a cluster if the cluster mean vector is the closest one among the other mean vectors (point to cluster points similarity).

The k-Means Clustering Algorithm• Here’s roughly how it works
• Initialization: Randomly specify K cluster centers(Note: each time you run k-Means you may get different clustering results!)
• Until no data point changes cluster assignment do the following:
• Assign each point to the cluster whose center is closest (according to the usual Euclidean distance) to the point.
• For each cluster re-compute its center as the mean vector of its data points.
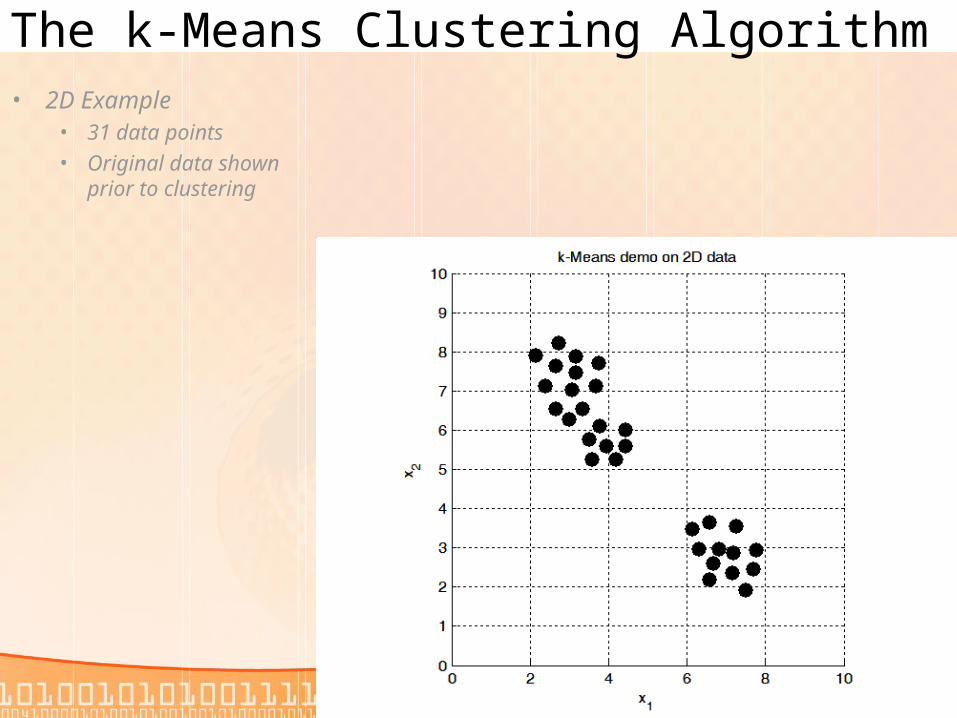
The k-Means Clustering Algorithm• 2D Example
• 31 data points• Original data shown
prior to clustering

The k-Means Clustering Algorithm• 2D Example
• K-Means runwith K=2.
• Run completedafter 2 iterations.
• Cluster centersare indicated bycrosses.

The k-Means Clustering Algorithm• 2D Example
• K-Means runwith K=3.
• Run completedafter 3 iterations.
• Cluster centersare indicated bycrosses.

The k-Means Clustering Algorithm• 2D Example
• K-Means runa 2nd timewith K=3.
• Run completedafter 5 iterations.
• Cluster centersare indicated bycrosses.
• Notice that thistime we gotslightly differentresults.
The k-Means Clustering Algorithm• 2D Example
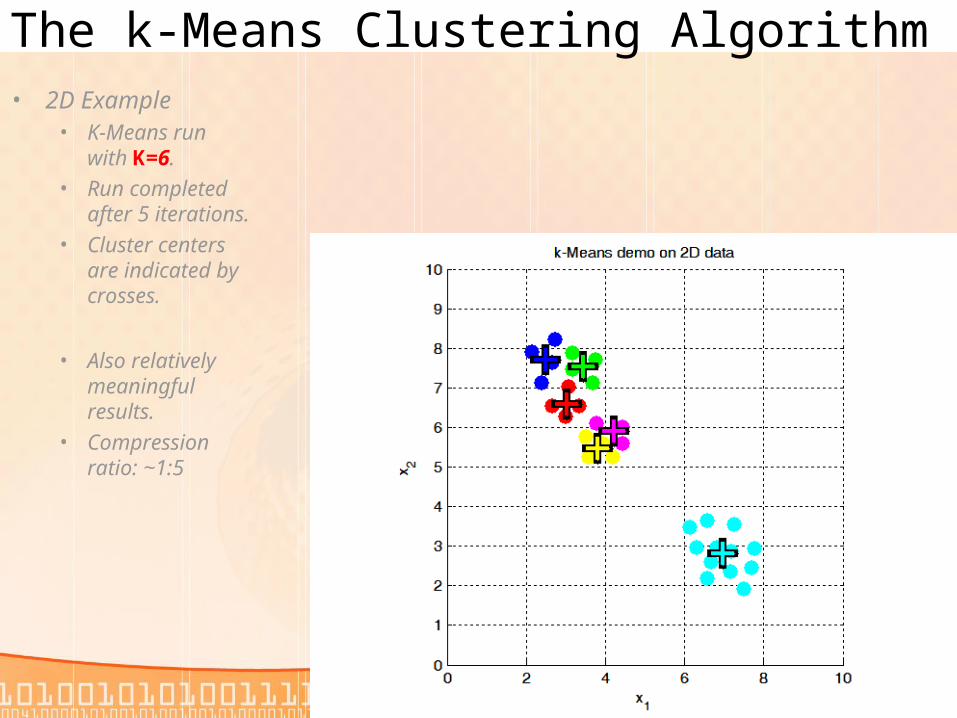
• K-Means runwith K=6.
• Run completedafter 5 iterations.
• Cluster centersare indicated bycrosses.
• Also relativelymeaningfulresults.
• Compressionratio: ~1:5
The k-Means Clustering Algorithm
• Initiate MATLAB live demo here…

An Intro to Classification• While during clustering data points are assigned cluster memberships
in an unsupervised way, during classification (a.k.a pattern recognition) we are given data and their corresponding group memberships (class labels). This makes classification a supervised learning task.
• The goal of classification is to identify rules from the available data points and their class labels (cumulatively known as the training data) so that additional, unseen, future data (termed test data) will be assigned the correct class labels (classified).
• In practice we want to derive rules that will lead to the minimum misclassification error, because we may not be able to avoid errors (mislabelings).
• The set of classification rules is a called a classification model or, simply, a classifier.

An Intro to Classification• Classification is a vast field, much richer and many times trickier to accomplish than clustering.
We will not provide further details at this point.• Below is a pictorial example of a 2-class problem known as the “noisy circle in the square”. The
classification task is to derive decision rules that discriminate points falling outside a red circle (blue) from the ones falling within (yellow). Notice that the model on the left gave more complicated rules that the one on the left and also makes more mistakes.

The ID3 Classification Algorithm• Here are some features of ID3:
• It can process data that are of mixed mode nature: data point “coordinates” (a.k.a. attributes) can be numerical and/or categorical (e.g. “red”, “tall”, etc.)
• The classification rules it produces are of the form of IF-THEN rules.
• Moreover, the number of derived rules is kept to a minimum, which is highly desirable.
• The classification rules are represented by a tree structure. Thus, ID3 is called a decision tree algorithm.

The ID3 Classification Algorithm• Consider an over-simplified, 2-class medical diagnosis related example:
• We have collected data from a number of potential patients. In specific, we recorded whether they feature a Symptom 1 (S1) and Symptom 2 (S2) and whether they have a specific disease (D=1) or not (D=0); D plays the role of the class label.
• Each person’s record consists of a triplet of values (S1, S2, D). “0” (“1”) signifies absence (presence) of the corresponding symptom. E.g.: For a person that has Symptom 1 but not 2 that has the disease the recorded measurement is (1,0,1).
• The rules that need to be infered from the available data are of the form: IF S1=x AND S2=y THEN D=z. For this simple problem there are only 8 class assignment rules to be considered (all 0-1 combinations of x,y,z).
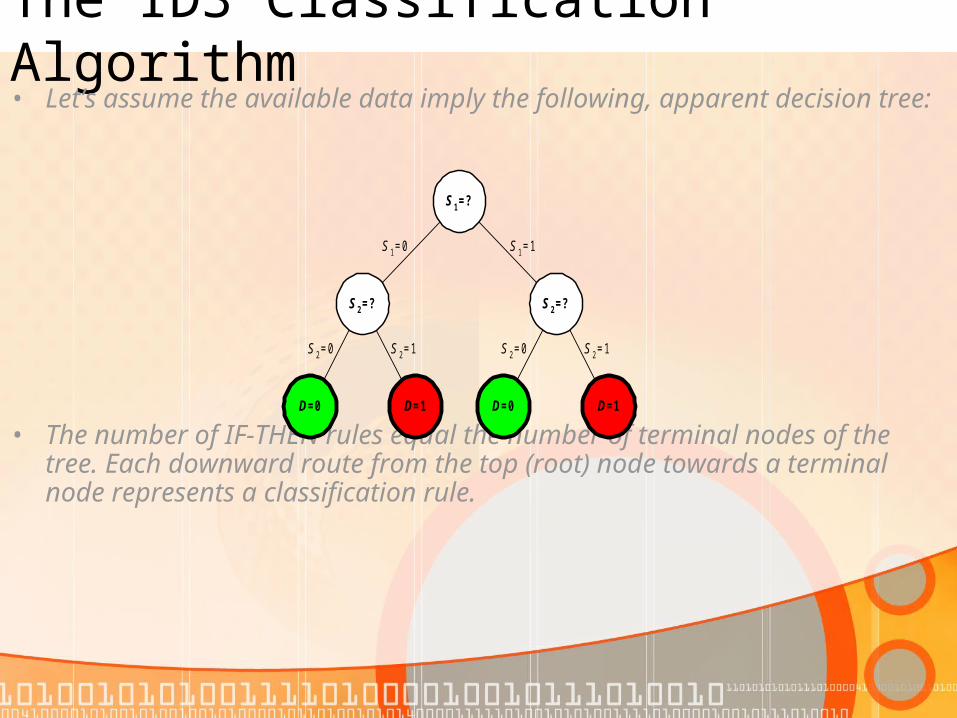
The ID3 Classification Algorithm• Let’s assume the available data imply the following, apparent decision tree:
• The number of IF-THEN rules equal the number of terminal nodes of the tree. Each downward route from the top (root) node towards a terminal node represents a classification rule.
S 2=1
S1=?
S2=? S2=?
D=0D=0 D=1
S 1=0 S 1=1
S 2=0 S 2=0 S 2=1
D=1

The ID3 Classification Algorithm• ID3 will generate the following decision tree
• ID3 will discover that attribute S1 is irrelevant for correct classification and creates only 2 rules.
• While this example was too simple and we have not explained how ID3 infers its rules, examining all possible decision trees for large datasets and many attributes is almost impossible for humans. In these cases, ID3 usually provides a reasonable solution that leads to small classification error.
S2=?
D=0 D=1
S 2=0 S 2=1

Genetic Algorithms in ML• Genetic Algorithms (GAs) is a
biologically-inspired, stochastic heuristic for solving combinatorial problems (e.g. find the combination that gives you best results).
• In clustering, GAs may aid in inferring the best (in some predefined sense) cluster assignments.
• In classification, GAs may aid in identifying the appropriate combination of decision rules that minimizes the misclassification error for a particular problem.

Genetic Algorithms in ML• The idea behind GAs is to treat the combinatorial solution (the “combination”) like a
DNA string of an “individual”.
• For example, consider the solution to a clustering problem with 2 clusters and 4 data points p1, p2, p3, p4, that assigned to clusters 1, 2, 1, 2 respectively. Then, this solution (phenotype, in GA terminology) would correspond to a DNA string, a.k.a. genotype, of [1 2 1 2].
• The GA starts off with a collection (population) of individuals featuring random genotypes and roughly performs the following steps:
• The “fitness” of each individual is evaluated• Randomly, but according to their fitness, individuals are selected for “mating” (selection
step).• Individuals “mate” (chromosomal crossover step) “giving birth” to offsprings.• Offspring are randomly mutated (mutation step) with a low probability• Offspring replace their parents and form the next generation.

Genetic Algorithms in ML• The previous process is called evolution of the population.• The measure of fitness for each clustering solution would make sense to
depend on how compact the produced clusters are and how well they are separated.
• Below is an example of how crossover would work. The selected individuals are paired up. Then a random crossover point is selected and 2 new individuals are produced.

Genetic Algorithms in ML• In the mutation step a position in the genotype (a gene) is randomly selected
with very small probability and is randomly changed like below:
• The amazing fact about GAs is that given a large population and having it evolve for many generations will eventually produce high-quality solutions (in our clustering example, good cluster assignments). And all this by imitating nature!