wakefield housing market demand: final · pdf file · 2014-03-252.0 housing market...
TRANSCRIPT

Wakefield Housing Market Demand:
Final Report

arc4 2
TABLE OF CONTENTS
1.0 INTRODUCTION................................................................................................. 3
2.0 HOUSING MARKET DEMAND........................................................................... 7
3.0 CONCLUSIONS AND POLICY RECOMMENDATIONS................................... 21
Publishing Date: 20th March 2008
arc4 Studio 2C Beehive Mills Jersey Street Ancoats Manchester M4 6JG T: 0161 228 1689 F: 0161 228 6514 Email: [email protected] Website: www.arc4.co.uk

arc4 3
Wakefield Housing Market Demand
1.0 INTRODUCTION
Background 1.1 This study has been commissioned by Wakefield Council in order to assess
general market demand across the Borough. The study complements the preliminary Strategic Housing Market Assessment which was published in September 2007.
1.2 The overall objectives of the market demand study are to:
• Assess general market requirements across Wakefield; and
• Provide information required under Planning Policy Statement 3 which the Council needs to feed into the preparation of its Local Development framework.
Planning Policy Statement 3
1.3 Achieving a mix of housing to promote mixed communities is a national planning
policy set out in PPS3. PPS3 states (p.9) that Local Authorities need to set out in their LDFs:
• The likely overall proportions of households that require market or affordable housing;
• The likely profile of household types requiring market housing; and
• The size and type of affordable housing required. 1.4 The preliminary Strategic Housing Market Assessment completed in September
2007 provides information relating to affordable requirements. This market demand study provides the outstanding range of information required to inform PPS3.

arc4 4
Methodology
1.5 The research has adopted a multi-method approach comprising a survey of movers, stakeholder consultation and analysis of relevant secondary data such as house price information.
1.6 An on-line survey of households planning to move in the general market was prepared. This was well publicised through the Council’s email system, to partner organisations and Estate Agents. A total of 232 responses were received and assuming that around 8% of households move each year, this equates to a sample error of +/-6.2% which the Office for National Statistics would describe as ‘reasonably precise’.
1.7 A range of Estate Agents across the Wakefield area were also interviewed to ascertain their views on market dynamics and trends. This also helped to ground the findings of the on-line survey in a wider context.
1.8 Data from the 2005 housing needs assessment and information relating to house prices has also provided a useful insight into market trends over the recent past.
1.9 Please note that data from the on-line survey is presented as reported and not weighted or grossed up.
Study area
1.10 For the purpose of this research, Wakefield was sub-divided into five distinctive market areas which had been used to underpin findings of the Preliminary SHMA and Housing Needs Survey (Map 1.1). Estate Agents concurred that these market areas reflected different market characteristics across Wakefield.

arc4 5
Housing market context 1.11 The Preliminary SHMA published in September 2007 provides a wealth of
information on Wakefield’s housing market context, supply of open market housing, dwelling turnover and house price trends. Views from Estate Agents also add further depth to an understanding of Wakefield.
1.12 In summary, across Wakefield:
• 64.9% of properties are owner-occupied (around 88,500 dwellings), 4.6% are privately rented and 0.2% are intermediate tenure; and
• Median prices have increased by 85% over the period 2002 to 2007 (from £66,850 to £123,865).
1.13 Estate Agents commented that overall, prices in Wakefield are still slightly lower than for the region as a whole. This has fuelled migration from Leeds along the M62 corridor by purchasers wishing to access more affordable properties. Estate Agents commented that in the City of Wakefield, prices are relatively low compared with rural areas. Higher prices are particularly evident in rural areas in proximity to Leeds.
1.14 Estate Agents also reported that there is a strong supply of inner city terraced housing and competitively priced three bedroomed semi-detached suburban homes. More family homes are needed desperately to cater for the needs of the typical buyer (married couple with children). There has been an increase in the building of four bedroomed detached houses and in more recent years, a real growth in city living apartments, both newbuild and conversions. Overall, Estate Agents commented that newbuild activity is providing greater choice to property buyers in the Wakefield area. This has resulted in increasing numbers of younger couples, older single people and retired couples moving into the City of Wakefield and other urban centres.
1.15 Regarding first time buyers, Estate Agents commented that demand cooled in January as new buyer enquiries were held back by the recent interest rate rises and has prevented first time buyers from accessing the market. Estate Agents felt that new buyer enquiries were likely to weaken further in the coming months as interest rate rise results in a further deterioration in buyer affordability.
1.16 Estate Agents identified a slow-down in home sales but this was attributed to the normal seasonal slow-down rather than interest rate rises and ability to secure a mortgage.
1.17 Local economic conditions are a key factor underpinning housing market activity. Estate Agents commented that the Wakefield economy is relatively strong and investment in new homes and employment remains high giving a continued air of confidence in the property market. The continued influence of the very strong Leeds economy continues to support the Wakefield property scene, with a good number of Leeds workers choosing to buy in the Wakefield area. Coupled with new housing development, Estate Agents were confident that the Wakefield housing market will remain strong over the next few years and ahead of some other West Yorkshire districts.
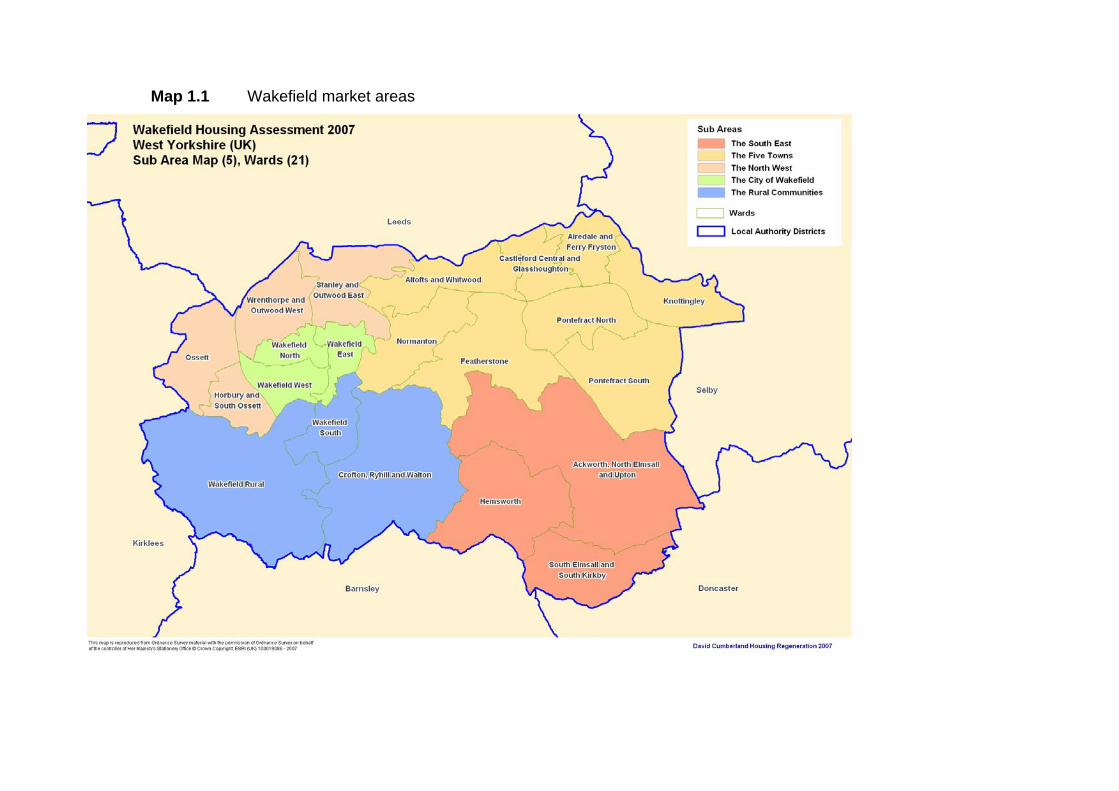
Map 1.1 Wakefield market areas

1.18 For further information on Wakefield’s housing market context, please see the Preliminary SHMA report.
2.0 HOUSING MARKET DEMAND
Past trends in market preferences
2.1 The 2005 Housing Needs Assessment provided a review of households who had moved in the open market in the preceding year (details of 11,928 moves were recorded). Table 3.1 summaries the range of property types and sizes moved into by owner occupiers and private renters.
Table 3.1 Property type and size moved into by open market movers No. Bedrooms Property Type
Up to 2 3 4+ TOTAL Base Detached House 0.3 5.5 7.1 12.9 1527 Semi-detached House 9.9 15.0 1.8 26.7 3166 Terraced House 11.8 9.2 0.7 21.6 2565 Bungalow 8.2 2.2 0.2 10.5 1246 Flat/Maisonette 25.9 1.0 0.0 26.8 3182 Other 1.0 0.4 0.0 1.4 166 Total 57.0 33.2 9.8 100.0 Base 6759 3936 1157 11852
Note: 1. % figures relate to the table percent i.e. 1374 moved into terraced houses with up to two bedrooms, representing 11.8% of all movers. 2. Some incomplete responses so base is 11852
Source: 2005 Housing Needs Assessment
2.2 Table 3.1 illustrates that:
• A majority of movers moved into properties with up to two bedrooms (57%) and a further 33.2% into 3 bedroom properties;
• 26.7% moved into semi-detached houses, 21.6% into terraced houses and 26.8% into flats/maisonettes.
2.3 The main reasons for moving are shown in Table 3.2. Setting up an independent home, to move to a larger home, family stress/disagreement and starting a new relationship were the key reasons why households were moving in the open market.

arc4 8
Table 3.2 Main reasons for moving
Main reason % To set up an independent home 13.7 To move to a larger home 11.6 Family stress/disagreement 10.5 To set up a new relationship 10.0 To be closer to work 8.1 Closer to family and friends 6.4 To move to a better neighbourhood 5.2 Wanted to buy 4.9 To move to a better quality home 4.1 To move to a smaller home 3.8 To move to a cheaper home 3.4 To improve the living situation of a disabled person 2.8 To improve living standards of an elderly person 2.3 Base: 11,928
Source: 2005 Housing Needs Assessment
2.4 The characteristics of households moving into open market accommodation are
summarised in Table 3.3. Of particular note, market movers tended to have higher incomes, with 39.1% having a monthly income of at least £1,600; movers tended to be singles and couples under 60 and couples with children; and a large majority originated from within Wakefield. Table 3.3 Characteristics of moving households Income (per month) % <£450 10.7 £450 to <£1000 23.7 £1,000 to <£1600 26.5 £1600 or more 39.1 Total 100.0 Base 11928 Household type % 1 individual under pensionable age 27.2 2 adults under pensionable age 32.7 One adult with child(ren) 10.1 Couple with child(ren) 18.6 1 pensioner 4.5 Pensioner couple 3.9 Other household 3.0 Total 100 Base 11928 Origin % Within Wakefield 71.5 Outside Wakefield 28.5 Base 11928
Source: 2005 Housing Needs Assessment

arc4 9
2.5 Of households moving from outside Wakefield, around 35.7% had moved from
elsewhere in West Yorkshire, 24.2% from elsewhere in Yorkshire and the Humber, 32.6% from elsewhere in the UK and 7.5% from outside the UK.
Market aspirations 2.6 In order to assess future housing market aspirations, this additional research has
been necessary. By analysing market preferences and aspirations, it is possible to ascertain the extent to which the existing housing offer provides an appropriate range of housing to satisfy aspirations for different household types.
Who is driving market demand?
2.7 General market demand in Wakefield is being driven by a range of household types, as demonstrated in Table 3.4. Overall, of survey respondents, 36.8% are couples with children; 26.6% couples with no children and 15.3% are singles under 60. Table 3.4 Types of household moving in the general market Household type % Single Person <60 15.3 Single Person 60 or over 1.1 Couple only <60 26.6 Couple only over 60 2.8 Couple with 1 or 2 child(ren) 32.8 Couple with 3 or more children 4.0 Lone Parent with 1 or 2 child(ren) 4.5 Lone Parent with 3 or more children 0.6 Other type of household 12.4 Total 100 Base 232
Source: On-line survey
2.8 Overall, 57.9% of respondents were in the 18-39 age group, 38.6% in the 40-59
age group and 3.5% were 60 and over. 2.9 Estate Agents consulted found it hard to define who was driving market demand
which reflects the empirical evidence that a range of households are looking to buy on the open market. Generally speaking, Estate Agents felt that the majority were families and young professionals.

arc4 10
Table 3.5 Age profile of heads of households moving in the general market
Age group % 18-39 57.940-59 38.660+ 3.5TOTAL 100.0Base 232
Source: On-line survey
2.10 Table 3.6 demonstrates that the vast majority of households seeking to move in
the general market were economically active. Overall, 88% of respondents and 72.2% of all household members were working either full- or part-time.
Table 3.6 Economic activity in households moving in the general market
Economic activity Respondent (%) All Household members (%)
Working full time (30+hrs per week) 75.3 60.6 Working part-time (under 30 hrs pw) 12.7 11.6 Unemployed 1.2 2.5 Full time carer 0.6 0.5 Wholly retired from work 4.2 4.2 Permanently sick/disabled 3.6 3.5 Mainly doing unpaid household duties 1.2 2.2 In full-time education/training 1.2 14.9 Total 100.0 100.0 Base (total people) 232 404
Source: On-line survey
2.11 Of people in employment, the vast majority worked in Wakefield District (Table
3.7) with a further 14.2% working in Leeds and 3.7% in York.

arc4 11
Table 3.7 Workplace of economically active household members
Workplace Respondent (%) All Household members (%)
Work from home 9.2 6.1 Elsewhere in Wakefield District 77.8 69.9 Leeds 9.2 14.2 Bradford 1.7 Calderdale 0.3 Kirklees 1.3 1.4 Barnsley 1.0 Rotherham 0.7 Selby 0.7 1.0 York 2.0 3.7 Total 100.0 100.0 Base (total people) 204.0 292.0
Source: On-line survey
Income and relative affordability
2.12 The income profile of households intending to move in the open market is summarised in Table 3.8. Overall, around 60% of households have an income of at least £400 per week (£20,800 per year). Table 3.8 Household income Gross income per week % households Up to £200 6.7 Between £200 and up to £300 15.9 Between £300 and up to £400 17.7 Between £400 and up to £500 17.1 Between £500 and up to £600 12.8 Between £600 and up to £700 7.3 £700 or more 22.6 Total 100.0 Base 232
Source: On-line survey
Note: It is important to note that this analysis is based on the profiles of on-line survey respondents and not the population as a whole.
2.13 The ability to buy on the open market is influenced not only by income but also access to savings and equity in existing property. Taking these factors into account results in the calculation of an affordability threshold of households i.e. the amount which they could potentially afford.

arc4 12
Table 3.9 Affordability thresholds Affordability threshold and % who could afford
Property value (£) Income+Savings+Equity Income+Savings Only £50,000 89.3 87.4 £60,000 81.1 74.9 £70,000 76.9 68.9 £80,000 74.0 58.7 £90,000 69.8 51.5
£100,000 65.1 45.5 £110,000 65.1 41.9 £120,000 60.4 37.7 £130,000 58.0 34.7 £140,000 55.0 31.7 £150,000 50.3 27.5 £160,000 46.7 24.0 £170,000 42.6 21.6 £180,000 40.2 18.6 £190,000 37.9 18.0 £200,000 37.3 16.8
Base 232 232
Note: It is important to note that this analysis is based on the profiles of on-line survey respondents and not the population as a whole.
Source: On-line survey
2.14 Table 3.9 clearly demonstrates that without any existing equity, around half of
households could afford a property valued at around £90,000 and only around one-quarter could afford a property valued at £160,000. In contrast, once existing equity is taken into account, around half of households could afford a £150,000 property and over one-third of households could afford in excess of £200,000.
2.15 To put this into context, for the first two quarters of 2007, the lower quartile price in Wakefield was £97,750 and median price was £123,865 and Table 3.10 illustrates the proportion of households who could afford these prices based on an analysis of their income, savings and equity.
Table 3.10 Relative affordability of lower quartile and median prices
Affordability threshold and % who could afford Property value (£) Income+Savings+Equity Income+Savings Only
Lower Quartile (£97,750) 65.7 46.7 Median (£123,865) 59.2 36.5
Base 232 232
Source: On-line survey
Note: It is important to note that this analysis is based on the profiles of on-line survey respondents and not the population as a whole.

arc4 13
2.16 Analysis suggests that there is an ability to access open market accommodation within Wakefield, particularly amongst households who have existing equity. However, if only income and savings are considered, the ability to access the market is more restricted with less than half of households able to afford lower quartile prices.
Reason for moving 2.17 The reasons for moving within the general market are summarised in Table 3.11.
The most frequently cited reason for moving was wanting a larger property or one that was better in some way (40.6% of main reasons and mentioned by 61.9% of households). Other reasons included to move to a better neighbourhood/more pleasant area and needing a smaller property.
Table 3.11 Reasons for moving ALL REASONS MAIN REASON Frequency % % mentioning Frequency % Want larger property or one that is better in some way 78 22.9 61.9 39 40.6 Need smaller property 14 4.1 11.1 7 7.3 Cannot afford rent/mortgage payments 7 2.1 5.6 2 2.1 Need housing suitable for older/disabled person 13 3.8 10.3 3 3.1 Want to buy 20 5.9 15.9 5 5.2 Lack or need separate kitchen/bathroom/toilet 1 0.3 0.8 Major disrepair of home 2 0.6 1.6 Want own home/live independently 21 6.2 16.7 8 8.3 Divorce/separation/family stress 5 1.5 4.0 2 2.1 Marriage/to live together 12 3.5 9.5 4 4.2 Living in temporary accommodation 3 0.9 2.4 Forced to move 4 1.2 3.2 To be closer to family/friends to give/receive support 8 2.3 6.3 To be closer to family/friends for social reasons 11 3.2 8.7 1 1.0 To move to a better neighbourhood/more pleasant area 42 12.3 33.3 12 12.5 To be closer to facilities e.g. shops, doctors 7 2.1 5.6 To be closer to work/new job 19 5.6 15.1 3 3.1 To be in a particular school catchment 11 3.2 8.7 3 3.1 To be closer to university/college etc 1 0.3 0.8 1 1.0 Want smaller garden 7 2.1 5.6 1 1.0 Want larger garden 31 9.1 24.6 Harassment/Threat of Harassment/Crime 10 2.9 7.9 2 2.1 Overcrowding 14 4.1 11.1 3 3.1 Base (Total reasons mentioned) 341 100.0 270.6 Base (Households responding) 136 100.0
Source: On-line survey
arc4 14
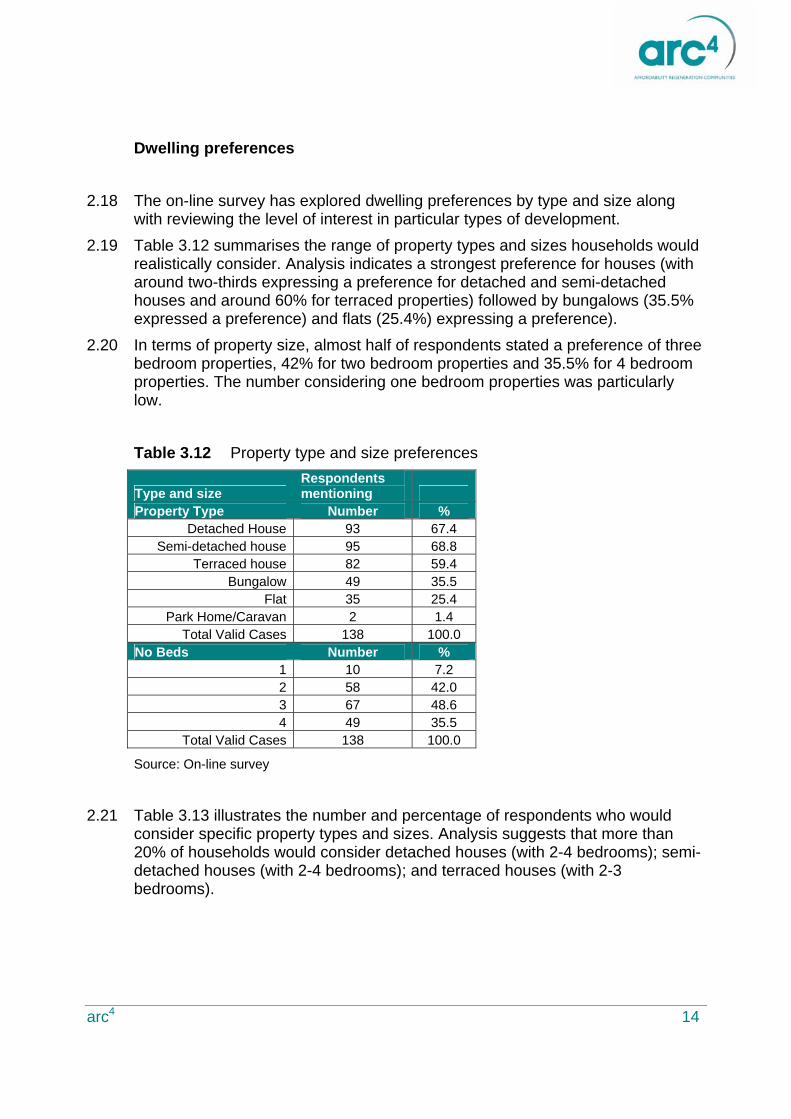
Dwelling preferences
2.18 The on-line survey has explored dwelling preferences by type and size along with reviewing the level of interest in particular types of development.
2.19 Table 3.12 summarises the range of property types and sizes households would realistically consider. Analysis indicates a strongest preference for houses (with around two-thirds expressing a preference for detached and semi-detached houses and around 60% for terraced properties) followed by bungalows (35.5% expressed a preference) and flats (25.4%) expressing a preference).
2.20 In terms of property size, almost half of respondents stated a preference of three bedroom properties, 42% for two bedroom properties and 35.5% for 4 bedroom properties. The number considering one bedroom properties was particularly low. Table 3.12 Property type and size preferences
Type and size Respondents mentioning
Property Type Number % Detached House 93 67.4
Semi-detached house 95 68.8 Terraced house 82 59.4
Bungalow 49 35.5 Flat 35 25.4
Park Home/Caravan 2 1.4 Total Valid Cases 138 100.0
No Beds Number % 1 10 7.2 2 58 42.0 3 67 48.6 4 49 35.5
Total Valid Cases 138 100.0
Source: On-line survey
2.21 Table 3.13 illustrates the number and percentage of respondents who would
consider specific property types and sizes. Analysis suggests that more than 20% of households would consider detached houses (with 2-4 bedrooms); semi-detached houses (with 2-4 bedrooms); and terraced houses (with 2-3 bedrooms).

arc4 15
Table 3.13 Property type and size preferences
Dwelling type Responses
N Percent
% of valid cases
Detached House 1 Bed 3 0.6 2.2 Detached House 2 Beds 33 6.9 23.9 Detached House 3 beds 51 10.6 37.0 Detached House 4 Beds 42 8.7 30.4 Semi-Detached House 1 Bed 5 1.0 3.6 Semi-Detached House 2 Beds 38 7.9 27.5 Semi-Detached House 3 Beds 62 12.9 44.9 Semi-Detached House 4 Beds 29 6.0 21.0 Terraced House 1 Bed 5 1.0 3.6 Terraced House 2 Beds 32 6.7 23.2 Terraced House 3 Beds 40 8.3 29.0 Terraced House 4 Beds 12 2.5 8.7 Bungalow 1 Bed 3 0.6 2.2 Bungalow 2 Beds 28 5.8 20.3 Bungalow 3 Beds 27 5.6 19.6 Bungalow 4 Beds 13 2.7 9.4 Flat 1 Bed 7 1.5 5.1 Flat 2 beds 27 5.6 19.6 Flat 3 Beds 14 2.9 10.1 Flat 4 Beds 6 1.2 4.3 Caravan/Park Home 1 Bed 1 0.2 0.7 Caravan/Park Home 2 Beds 2 0.4 1.4 Caravan/Park Home 3 Beds 1 0.2 0.7 Total Responses 481 100.0 348.6 Total Valid Cases 138
Source: On-line survey
Tenure preferences
2.22 Table 3.14 demonstrates that the vast majority of on-line respondents were likely to move into an owner-occupied property (with a mortgage). Additionally, some would consider renting either privately or from a social landlord. Fewer than 10% of respondents would consider intermediate tenure properties such as shared ownership or homebuy and only 2.7% consider this to be the most likely tenure moved into.

arc4 16
Table 3.14 Tenure preferences
Tenure Would consider Most likely tenure
Frequency %
% of Valid
Cases Frequency % Owned (no mortgage) 49 15.7 35.0 15 13.2 Owned (with mortgage) 110 35.3 78.6 72 63.2 Rented from WDH 35 11.2 25.0 16 14.0 Rented from Housing Association 22 7.1 15.7 2 1.8 Private Rented 25 8.0 17.9 6 5.3 Shared Ownership 25 8.0 17.9 1 0.9 Homebuy 26 8.3 18.6 2 1.8 Discounted Home Ownership 20 6.4 14.3 Total 312 100.0 222.9 Valid Cases 140 114
Source: On-line survey
Types of development
2.23 Table 3.15 reflects upon the degree of interest in different types of development. Overall, interest is strongest for more traditional forms of dwellings, with over half very or fairly interested in properties on new suburban estates. The lowest degree of interest was for town centre apartments although Estate Agents commented that there is demand for luxury city living apartments. Estate Agents also commented that there was strong demand for more traditional, particularly three bedroom, family homes.
Table 3.15 Interest in different types of development
Development type % very/fairly interested Base Canal/waterside houses 30.8 133 Properties on new suburban estates 51.1 131 Executive housing 28.6 126 Town centre apartments 16.1 124 Town centre houses 25.4 126
Source: On-line survey

arc4 17
Location preferences
2.24 Table 3.16 reviews the location preference stated by respondents. Overall, households were most likely to consider properties in the Rural Communities and North West sub-areas; they were least likely to consider properties in the South East. Around one-fifth stated that they were most likely to move outside the District and of these households, 34% were likely to move to another location in West Yorkshire, notably Leeds; and a further 13.6% were likely to move to South Yorkshire, particularly Barnsley and Doncaster. Table 3.16 Location preferences
Location % of
Households Most Likely would consider Location (%) The South East 23.1 11.8 The Five Towns 32.7 21.0 North West 39.5 17.6 City of Wakefield 35.4 16.8 Rural Communities 44.2 13.4 Outside Wakefield 38.8 19.3 100.0 Valid Cases 119
Source: On-line survey
2.25 Estate Agents reported that the South East of the District is increasingly
becoming a favoured location for many people due to an increase in the number of job opportunities in the area, along with major improvements in transport links. A number of attractive new housing developments, including the redevelopment of the former Southmoor Hospital site and the former Hemsworth College site, are fuelling demand. There is demand for luxury city living apartments as well as more traditional three bedroom family homes.
Area and property factors
2.26 Respondents were asked to comment on the relative importance of different area- and property-related factors.
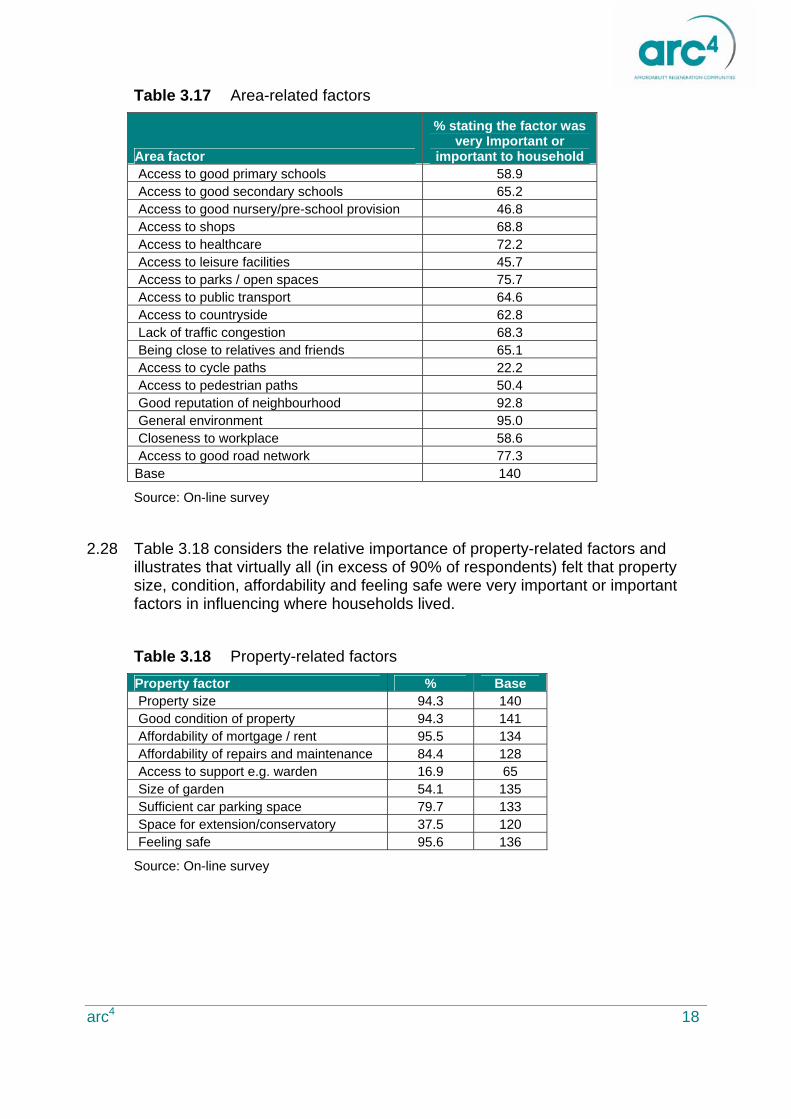
2.27 Table 3.17 illustrates that general environment, good reputation, access to parks/open space and access to healthcare were particularly important factors influencing where households lived.
arc4 18
Table 3.17 Area-related factors
Area factor
% stating the factor was very Important or
important to household Access to good primary schools 58.9 Access to good secondary schools 65.2 Access to good nursery/pre-school provision 46.8 Access to shops 68.8 Access to healthcare 72.2 Access to leisure facilities 45.7 Access to parks / open spaces 75.7 Access to public transport 64.6 Access to countryside 62.8 Lack of traffic congestion 68.3 Being close to relatives and friends 65.1 Access to cycle paths 22.2 Access to pedestrian paths 50.4 Good reputation of neighbourhood 92.8 General environment 95.0 Closeness to workplace 58.6 Access to good road network 77.3 Base 140
Source: On-line survey
2.28 Table 3.18 considers the relative importance of property-related factors and
illustrates that virtually all (in excess of 90% of respondents) felt that property size, condition, affordability and feeling safe were very important or important factors in influencing where households lived.
Table 3.18 Property-related factors Property factor % Base Property size 94.3 140 Good condition of property 94.3 141 Affordability of mortgage / rent 95.5 134 Affordability of repairs and maintenance 84.4 128 Access to support e.g. warden 16.9 65 Size of garden 54.1 135 Sufficient car parking space 79.7 133 Space for extension/conservatory 37.5 120 Feeling safe 95.6 136
Source: On-line survey
arc4 19
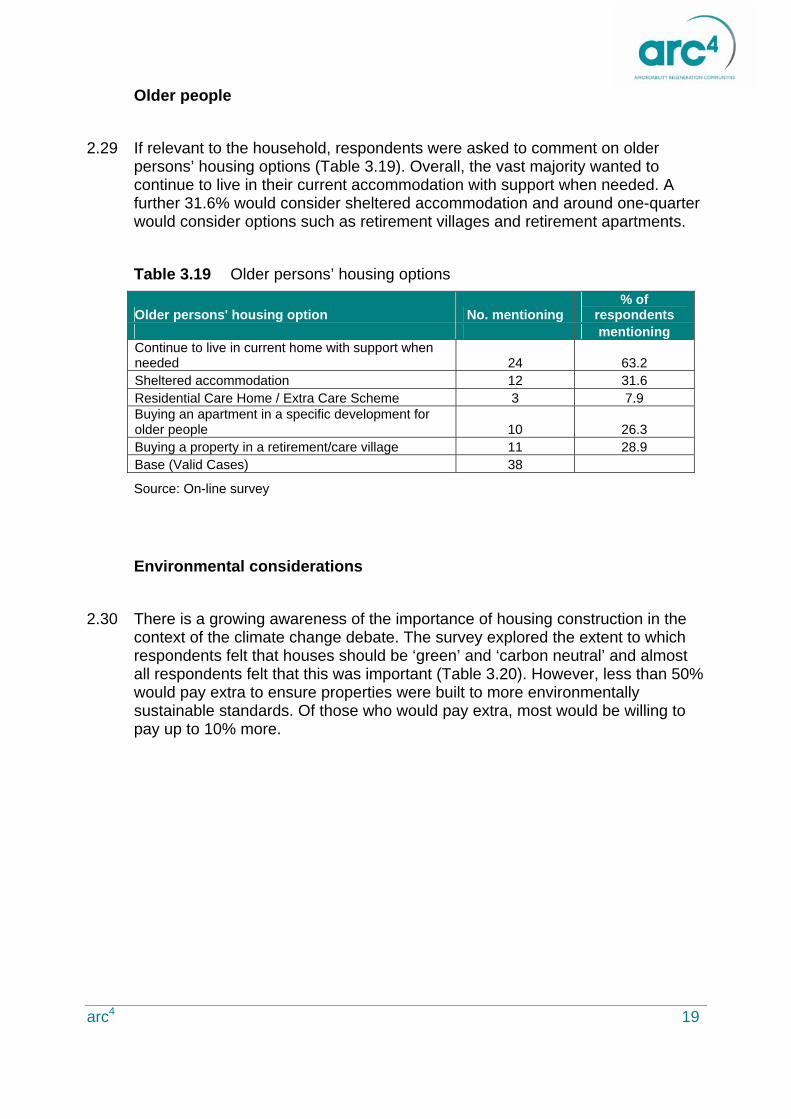
Older people
2.29 If relevant to the household, respondents were asked to comment on older persons’ housing options (Table 3.19). Overall, the vast majority wanted to continue to live in their current accommodation with support when needed. A further 31.6% would consider sheltered accommodation and around one-quarter would consider options such as retirement villages and retirement apartments.
Table 3.19 Older persons’ housing options
Older persons' housing option No. mentioning % of
respondents mentioning Continue to live in current home with support when needed 24 63.2 Sheltered accommodation 12 31.6 Residential Care Home / Extra Care Scheme 3 7.9 Buying an apartment in a specific development for older people 10 26.3 Buying a property in a retirement/care village 11 28.9 Base (Valid Cases) 38
Source: On-line survey
Environmental considerations
2.30 There is a growing awareness of the importance of housing construction in the context of the climate change debate. The survey explored the extent to which respondents felt that houses should be ‘green’ and ‘carbon neutral’ and almost all respondents felt that this was important (Table 3.20). However, less than 50% would pay extra to ensure properties were built to more environmentally sustainable standards. Of those who would pay extra, most would be willing to pay up to 10% more.

arc4 20
Table 3.20 Environmental considerations
How important do you think homes should be 'green' and 'carbon neutral' % Very important 47.6 Fairly important 47.6 Not important 4.9 Total 100.0 Would you pay extra for a green/carbon neutral home? % Yes 43.9 No 56.1 Total 100.0 If yes, how much? % up to 5% more 50.0 Between 5% and up to 10% more 37.1 Between 10% and up to 15% more 6.5 Between 15% and up to 20% more 6.5 Total 100.0 Base (all responses) 148 Base (would pay extra) 65
Source: On-line survey

arc4 21
3.0 CONCLUSIONS AND POLICY RECOMMENDATIONS 3.1 This piece of work has specifically focused on market demand issues in
Wakefield. It has reviewed past market trends and future aspirations drawing upon a range of primary and secondary quantitative evidence and enhanced through discussions with Estate Agents across Wakefield.
3.2 Wakefield’s housing market is strong. It has been enriched through newbuild activity which is helping to diversify the housing offer; relative price differentials and good access are making Wakefield a choice of location for commuters to Leeds and other areas; and a general sense of economic well-being and investment in new homes continues to give an air of confidence in the property market across Wakefield. Notwithstanding this, it is important to note that the current tightening of mortgage lending in the light of the ‘credit crunch’ may impact on market activity.
3.3 This research has provided evidence regarding the aspirations of households seeking open market accommodation across Wakefield. In summary:
• Aspirations are generally traditional: aspirations towards living in suburban estates, preferences for 2 and 3 bedroom semi-detached, detached and terraced housing;
• There is a degree of aspiration towards larger properties with three or more bedrooms;
• There is some appetite for city-centre apartment living;
• Households responding to the survey generally had sufficient financial resources to access the open market, although households without existing equity would have more difficultly in servicing a mortgage debt;
• There is limited interest in intermediate tenure properties and clearly more work is needed to publicise this type of provision, particularly given the government policy driver of increasing provision across this tenure type.
Implications for LDF and development briefs
3.4 This analysis of general market demand completes the required information to feed into the preliminary SHMA process. The SHMA material provides the Council with an understanding of overall affordable requirements and general market demand and is now in a position to:
• Review overall targets for affordable housing provision;
• Review development briefs and ensure that new development focuses particularly on the delivery of:
− 2-4 bedroom houses (detached and semi-detached in particular); and
− bungalows (particularly 2 bedroom)

arc4 22
• There is a degree of interest in flats/apartments, particularly in inner-urban locations, but the overwhelming aspiration it towards more traditional houses and bungalows.
End of Document