walmart reports q3 eps of $1.14, updates full year...
TRANSCRIPT

For Immediate Release Media Relations Contact Randy Hargrove 800-331-0085
Investor Relations Contact Carol Schumacher 479-277-1498
Pre-recorded management call 877-523-5612 (U.S. and Canada) 201-689-8483 (other countries) Passcode: 9256278 (Walmart) For webcast version click here
Walmart reports Q3 EPS of $1.14, updates full year guidance; Aggressive holiday plans to drive sales
• Wal-Mart Stores, Inc. (Walmart) reported third quarter diluted earnings per share from continuing
operations (EPS) of $1.14, a 6.5 percent increase compared to last year's $1.07, which reflects $0.01 per share from Vips restaurants in Mexico now in discontinued operations.
• The company forecasted fourth quarter EPS guidance to range between $1.50 and $1.60. The
company's guidance includes the impact of approximately $0.10 per share for certain items which we previously disclosed, including store closures in Brazil and China and ending our retail franchise agreement in India. Accounting for these factors, the company's guidance for fourth quarter underlying1 EPS is a range between $1.60 and $1.70.
• The company updated its full year EPS guidance to range between $5.01 to $5.11. After considering certain items that will impact the fourth quarter, the company's guidance for full year underlying1 EPS will be between $5.11 and $5.21.
• Consolidated net sales reached $114.9 billion, an increase of $1.8 billion, or 1.6 percent, led by
Walmart U.S. with $67.7 billion in net sales. On a constant currency basis,1 consolidated net sales would have been $116.2 billion.
• Consolidated operating income was $6.3 billion, an increase of 3.6 percent. Walmart U.S. grew
operating income by 5.8 percent. Sam's Club grew operating income, without fuel,1 by 9.4 percent. On a constant currency basis,1 International increased operating income by 8.0 percent.
• Walmart U.S. comp sales declined 0.3 percent in the 13-week period ended Oct. 25, 2013. Comp
sales for the Neighborhood Market format rose approximately 3.4 percent. Walmart U.S. again gained market share2 in the measured category of "food, consumables and health & wellness/OTC."
• Sam's Club comp sales, without fuel,1 were up 1.1 percent during the 13-week period.
• Walmart International grew net sales to $33.1 billion. On a constant currency basis,1 net sales would have increased 4.1 percent to $34.4 billion.
• Walmart reported free cash flow1 of $3.8 billion for the nine months ended Oct. 31, 2013.
• The company returned $3.2 billion to shareholders through dividends and share repurchases in the quarter.
1 See additional information at the end of this release regarding non-GAAP financial measures.
2 Source: The Nielsen Company, 13-weeks ended Oct. 26, 2013.

2
BENTONVILLE, Ark., Nov. 14, 2013 -- Wal-Mart Stores, Inc. (NYSE: WMT) today reported financial results for the third quarter ended Oct. 31, 2013. Net sales were $114.9 billion, an increase of 1.6 percent over last year. This quarter included the negative impact of approximately $1.6 billion from currency exchange rate fluctuations. On a constant currency basis,1 net sales would have increased 2.7 percent to $116.2 billion. Membership and other income increased 12.3 percent versus last year. Total revenue was $115.7 billion, an increase of $1.9 billion, or 1.7 percent over last year.
Consolidated net income attributable to Walmart was $3.7 billion, up 2.8 percent. Diluted earnings per share from continuing operations attributable to Walmart were $1.14, a 6.5 percent increase, compared to $1.07 last year, which reflects $0.01 per share from Vips restaurants in Mexico now in discontinued operations. In our financial statements, Vips operating results are presented in discontinued operations, both in the current and prior periods.
Solid earnings performance
"Walmart delivered solid earnings growth that was within our guidance range. We had strong operating income across our segments, with Walmart U.S. growing almost 6 percent, Sam's Club increasing more than 9 percent, and International up 8 percent on a constant currency1 basis," said Mike Duke, Wal-Mart Stores, Inc. president and chief executive officer. "Our most important priority is growing top line sales, including comp sales," Duke added. "The retail environment, both in stores and online, remains competitive. Walmart has aggressive plans to help our customers enjoy the holiday season, and there is no doubt that we plan to win for our customers and shareholders throughout the holidays."
Leverage
Two years ago, Walmart committed to reduce operating expenses as a percentage of net sales by 100 basis points by fiscal year 2017. Duke said the company remains committed to that goal. "The company's expense leverage metric improved from last quarter. Walmart U.S. delivered strong expense leverage, and International made good progress on reducing costs in key markets," said Duke. "Throughout the company, we constantly focus on managing our costs so we can provide the low prices our customers count on."
Returns
"We managed our business well and delivered solid returns to shareholders," said Charles Holley, executive vice president and chief financial officer.
During the third quarter, the company repurchased approximately 23 million shares for $1.7 billion. In addition, the company paid $1.5 billion in dividends. In total, the company returned $3.2 billion to shareholders through dividends and share repurchases in the quarter.
Return on investment1 (ROI) for the trailing 12-months ended Oct. 31, 2013 was 17.5 percent, compared to 18.0 percent for the prior period. The decline was principally due to investments in fixed assets, growth in working capital, and the impact of acquisitions. Free cash flow1 was $3.8 billion for the nine months ended Oct. 31, 2013, compared to $7.0 billion in the prior year. Timing of payments associated with taxes and payables, as well as higher capital expenditures were the primary drivers of the reduction. 1 See additional information at the end of this release regarding non-GAAP financial measures.

3
Guidance
The company's guidance reflects a view of global economic trends, including ongoing headwinds from currency exchange rate fluctuations, a competitive holiday season, and a full-year effective tax rate that is expected to range between 31 and 33 percent. "For the fourth quarter, we expect EPS to range between $1.50 and $1.60. Our guidance includes the impact of approximately $0.10 per share for certain items described below. Accounting for these factors, we believe our fourth quarter underlying1 EPS will range between $1.60 and $1.70," said Holley. "For the full year, we are updating our EPS guidance to range between $5.01 and $5.11. Accounting for the $0.10 of certain items that will impact the fourth quarter, our full year underlying1 EPS will range between $5.11 and $5.21," added Holley. Two items impact our guidance by approximately $0.10 per share.
• The company is closing approximately 50 under-performing stores in Brazil and China. The impact of these closures will be dilutive to EPS by about $0.06.
• The company will independently own and operate the wholesale format in India and will end its franchise agreement with Bharti Retail for the retail business. This transaction is subject to regulatory approval. The net impact is expected to be dilutive to EPS by approximately $0.04.
The company agreed to the sale of its Vips restaurants in Mexico, which is still subject to regulatory approval and is now recorded in discontinued operations. Outside of diluted earnings per share from continuing operations, discontinued operations for the fourth quarter is expected to include an estimated gain of $0.06 per share from the sale of Vips.
U.S. comparable store sales results
The company reported U.S. comparable store sales based on its 13-week and 39-week retail calendar for the periods ended Oct. 25, 2013 and Oct. 26, 2012 as follows:
Without Fuel With Fuel Fuel Impact
13 Weeks Ended 13 Weeks Ended 13 Weeks Ended
10/25/2013 10/26/2012 10/25/2013 10/26/2012 10/25/2013 10/26/2012
Walmart U.S. -0.3% 1.5% -0.3% 1.5% 0.0% 0.0% Sam’s Club 1.1% 2.7% 0.1% 3.8% -1.0% 1.1%
Total U.S. -0.1% 1.7% -0.2% 1.9% -0.1% 0.2%
Without Fuel With Fuel Fuel Impact
39 Weeks Ended 39 Weeks Ended 39 Weeks Ended
10/25/2013 10/26/2012 10/25/2013 10/26/2012 10/25/2013 10/26/2012
Walmart U.S. -0.7% 2.1% -0.7% 2.1% 0.0% 0.0% Sam’s Club 1.0% 4.1% 0.5% 4.4% -0.5% 0.3%
Total U.S. -0.4% 2.4% -0.5% 2.5% -0.1% 0.1%
During the 13-week period, Walmart U.S. comp traffic decreased 0.4 percent, while average ticket increased 0.1 percent. E-commerce sales positively impacted comp sales by approximately 0.2 percent for the 13-week period.
4
1 See additional information at the end of this release regarding non-GAAP financial measures.
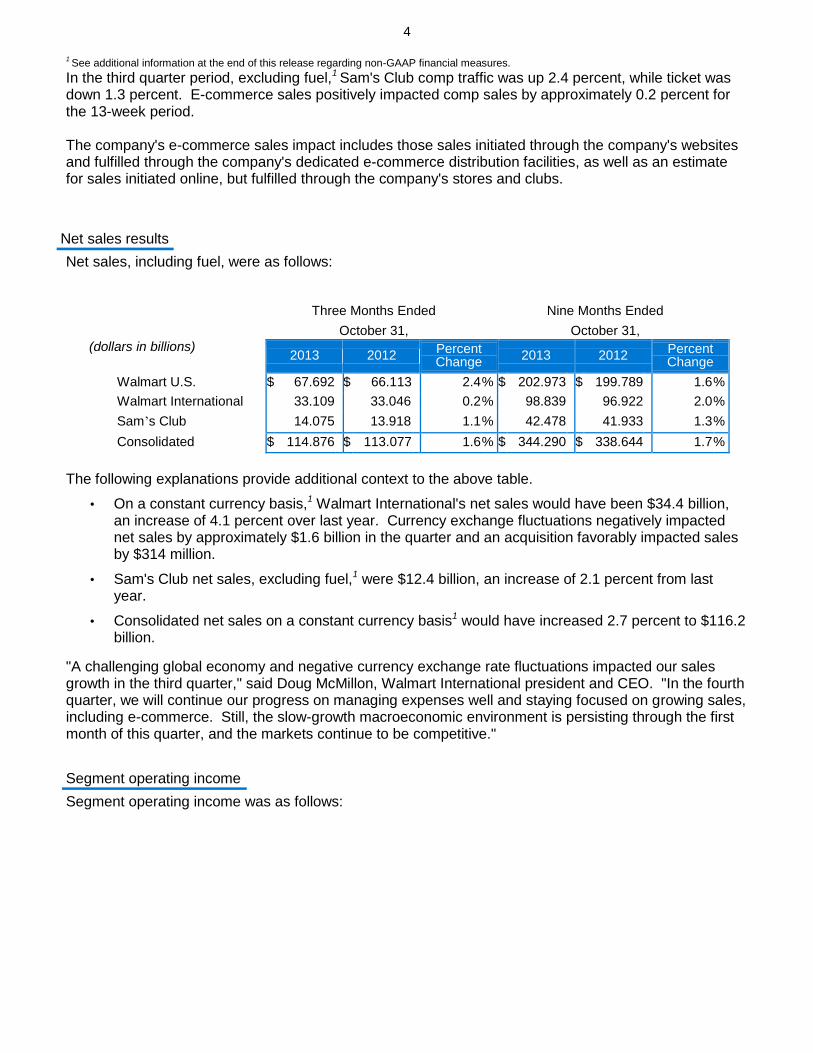
In the third quarter period, excluding fuel,1 Sam's Club comp traffic was up 2.4 percent, while ticket was down 1.3 percent. E-commerce sales positively impacted comp sales by approximately 0.2 percent for the 13-week period. The company's e-commerce sales impact includes those sales initiated through the company's websites and fulfilled through the company's dedicated e-commerce distribution facilities, as well as an estimate for sales initiated online, but fulfilled through the company's stores and clubs.
Net sales results
Net sales, including fuel, were as follows:
Three Months Ended Nine Months Ended
October 31, October 31, (dollars in billions)
2013 2012
Percent Change
2013 2012 Percent Change
Walmart U.S. $ 67.692 $ 66.113 2.4 % $ 202.973 $ 199.789 1.6 %
Walmart International 33.109 33.046 0.2 % 98.839 96.922 2.0 %
Sam’s Club 14.075 13.918 1.1 % 42.478 41.933 1.3 %
Consolidated $ 114.876 $ 113.077 1.6 % $ 344.290 $ 338.644 1.7 %
The following explanations provide additional context to the above table.
• On a constant currency basis,1 Walmart International's net sales would have been $34.4 billion, an increase of 4.1 percent over last year. Currency exchange fluctuations negatively impacted net sales by approximately $1.6 billion in the quarter and an acquisition favorably impacted sales by $314 million.
• Sam's Club net sales, excluding fuel,1 were $12.4 billion, an increase of 2.1 percent from last year.
• Consolidated net sales on a constant currency basis1 would have increased 2.7 percent to $116.2 billion.
"A challenging global economy and negative currency exchange rate fluctuations impacted our sales growth in the third quarter," said Doug McMillon, Walmart International president and CEO. "In the fourth quarter, we will continue our progress on managing expenses well and staying focused on growing sales, including e-commerce. Still, the slow-growth macroeconomic environment is persisting through the first month of this quarter, and the markets continue to be competitive."
Segment operating income
Segment operating income was as follows:

5
Three Months Ended Nine Months Ended
October 31, October 31, (dollars in billions)
2013 2012
Percent Change
2013 2012 Percent Change
Walmart U.S. $ 5.123 $ 4.841 5.8 % $ 15.973 $ 15.122 5.6 %
Walmart International 1.457 1.432 1.7 % 4.144 4.201 -1.4%
Sam’s Club 0.474 0.434 9.2 % 1.550 1.458 6.3 %
Sam's Club (excluding fuel) 0.466 0.426 9.4 % 1.537 1.424 7.9 % 1 See additional information at the end of this release regarding non-GAAP financial measures.
"Walmart U.S. delivered almost $68 billion in net sales, and we continued to deliver strong bottom line results in a difficult sales environment," said Bill Simon, Walmart U.S. president and CEO. "Operating income grew by 5.8 percent to over $5.1 billion in the quarter."
"We're pleased with our third quarter results, especially our positive comp sales and steady increase in traffic," said Rosalind Brewer, Sam's Club president and CEO. "This led to strong growth in operating income, increasing 9.2 percent to $474 million."
U.S. comp sales forecasts "The team has developed our best holiday plan ever. We are committed to being the number one retail destination," said Simon. "We're making sure our shelves are well-stocked with the most popular toys, and we're guaranteeing low prices all season in the store through the Christmas Ad Match Program."
For the 14-week period ending Jan. 31, 2014, Walmart U.S. expects comp store sales to be relatively flat. Last year, Walmart's comp sales rose 0.3 percent for the 14-week period ended Feb. 1, 2013. "At Sam's Club, the holiday season is well under way, and we're investing in price for the fourth quarter," said Brewer. "Our members will be rewarded with two Instant Savings Books and an exclusive VIP event, and we've collaborated with e-commerce to provide the best online program we've ever had."
Sam's Club expects comp sales, excluding fuel,1 for the 14-week period ending Jan. 31, 2014 to range between flat and 2 percent. Last year comp sales, excluding fuel,1 increased 1.8 percent for the 14-week period ended Feb. 1, 2013. Walmart U.S. and Sam's Club will report comparable sales for the 14-week period ending Jan. 31, 2014 on Feb. 20, 2014, when the company reports fourth quarter results. For fiscal year 2014, Walmart will report comparable store sales on a 53-week basis, with 4-5-5 week reporting for the fourth quarter. Wal-Mart Stores, Inc. (NYSE: WMT) helps people around the world save money and live better -- anytime and anywhere -- in retail stores, online, and through their mobile devices. Each week, more than 245 million customers and members visit our 11,096 stores under 69 banners in 27 countries and e-commerce websites in 10 countries. With fiscal year 2013 sales of approximately $466 billion, Walmart employs more than 2 million associates worldwide. Walmart continues to be a leader in sustainability, corporate philanthropy and employment opportunity. Additional information about Walmart can be found by visiting http://corporate.walmart.com on Facebook at http://facebook.com/walmart and on Twitter at http://twitter.com/walmart. Online merchandise sales are available at http://www.walmart.com and http://www.samsclub.com.

6
Notes
After this earnings release has been furnished to the Securities and Exchange Commission (SEC), a pre recorded call offering additional comments on the quarter will be available to all investors. Information included in this release, including reconciliations, and the pre-recorded phone call can be accessed via webcast by visiting the investor information area on the company's website at www.stock.walmart.com. Callers within the U.S. and Canada may dial 877-523-5612 and enter passcode 9256278. All other callers can access the call by dialing 201-689-8483 and entering passcode 9256278.
Editor's Note
High resolution photos of Walmart U.S., Sam's Club and International operations are available for download at www.stock.walmart.com 1 See additional information at the end of this release regarding non-GAAP financial measures.

7
Forward Looking Statements
This release contains statements as to Wal-Mart Stores, Inc. management's forecasts or estimates of the company's diluted earnings per share from continuing operations attributable to Walmart for the three months and fiscal year ending Jan. 31, 2014, the company’s underlying diluted earnings per share
from continuing operations attributable to Walmart for the three months and fiscal year ending Jan. 31, 2014 calculated by adjusting for the anticipated effect on the company’s diluted earnings per share from
continuing operations attributable to Walmart for the three months ending Jan. 31, 2014 of the ending of the company’s retail franchise agreement in India and the closure of certain stores in Brazil and China,
which are expected to occur during the three months ending Jan 31, 2014, the anticipated amount of the impact of such items on the company’s diluted earnings per share from continuing operations
attributable to Walmart for the three months ending Jan. 31, 2014, the estimated amount by which the sale of the Vips restaurant business will be accretive to diluted earnings per share from discontinued operations for the three months ending Jan. 31, 2014, the company’s effective tax rate for the fiscal year
ending Jan. 31, 2014, the comparable store sales of the Walmart U.S. segment of the company and the comparable club sales, excluding fuel, of the Sam's Club segment of the company for the 14-week period from Oct. 26, 2013 through Jan. 31, 2014, and certain assumptions on which those forecasts and estimates are based, as well as statements of the company’s objective to reduce its operating expenses
as a percentage of net sales by 100 basis points by Jan 31, 2017 and of management's expectations for the company’s Walmart International segment continuing its progress in managing its expenses well and staying focused on growing sales, including e-commerce, and the company’s Sam’s Club segment
providing Instant Savings Books and a VIP event to certain of its members in the 2013 holiday season that the company believes are "forward-looking statements" within the meaning of the Private Securities Litigation Reform Act of 1995, as amended. These statements are intended to enjoy the protection of the safe harbor for forward-looking statements provided by that act. Those statements can be identified by the use of the word or phrase "are updating," "anticipate," “estimated,” "expect," “expected,” "expects," "forecast," “goal,” "guidance," “is expected,” "will be," "will continue," and "will range" in the statements
or relating to such statements. These forward-looking statements are subject to risks, uncertainties and other factors, domestically and internationally, including: general economic conditions; business trends in the company's markets; economic conditions affecting specific markets in which we operate; competitive pressures; the amount of inflation or deflation that occurs, both generally and in certain product categories; consumer confidence, disposable income, credit availability, spending levels, spending patterns and debt levels; consumer demand for certain merchandise in the 2013 holiday season; customer traffic in Walmart's stores and clubs and average ticket size; consumer acceptance of the company’s merchandise offerings; the disruption of seasonal buying patterns in the United States
and other markets; geo-political conditions and events; weather conditions and events and their effects; catastrophic events and natural disasters and their effects on Walmart's business; public health emergencies; civil unrest and disturbances and terrorist attacks; commodity prices; the cost of goods Walmart sells; transportation costs; the cost of diesel fuel, gasoline, natural gas and electricity; the selling prices of gasoline; disruption of Walmart's supply chain, including transport of goods from foreign suppliers; trade restrictions; changes in tariff and freight rates; labor costs; the availability of qualified labor pools in Walmart's markets; changes in employment laws and regulations; the cost of healthcare and other benefits; casualty and other insurance costs; accident-related costs; adoption of or changes in tax and other laws and regulations that affect Walmart's business, including changes in corporate tax rates; developments in, and the outcome of, legal and regulatory proceedings to which Walmart is a party or is subject and the costs associated therewith; the requirements for expenditures in connection with the FCPA matters, including enhancements to Walmart's compliance program and ongoing investigations; currency exchange rate fluctuations; changes in market interest rates; conditions and events affecting domestic and global financial and capital markets; the company not obtaining in the three months ending Jan. 31, 2014 the necessary approvals for the sale of the Vips restaurant business and the ending of the company’s retail franchise agreement in India; failure of the purchaser of the Vips
restaurant business to perform its obligations regarding the purchase of the Vips restaurant business; delays in the closure of the stores in Brazil and China proposed to be closed in the quarter ending Jan. 31, 2014; and other risks. Factors that may affect the company’s effective tax rate include changes in the company’s assessment of certain tax contingencies, valuation allowances, changes in law,
outcomes of administrative audits, the impact of discrete items, and the mix of earnings among the

8
company’s U.S. and international operations. The company discusses certain of the factors described
above more fully in certain of its filings with the SEC, including its most recent annual report on Form 10-K filed with the SEC (in which the company also discusses other factors that may affect its operations, results of operations and comparable store and club sales) and this release should be read in conjunction with that annual report on Form 10-K, together with all of the company's other filings, including its quarterly reports on Form 10-Q and current reports on Form 8-K, made with the SEC through the date of this release. The company urges readers to consider all of these risks, uncertainties and other factors carefully in evaluating the forward-looking statements contained in this release. As a result of these matters, changes in facts, assumptions not being realized or other circumstances, the company's actual results may differ materially from the expected results discussed in the forward-looking statements contained in this release. The forward-looking statements contained in this release are as of the date of this release, and Walmart undertakes no obligation to update these forward-looking statements to reflect subsequent events or circumstances.

9
Wal-Mart Stores, Inc.
Condensed Consolidated Statements of Income (Unaudited)
Three Months Ended Nine Months Ended
SUBJECT TO RECLASSIFICATION October 31, October 31,
(Dollars in millions, except share data) 2013 2012 Percent Change 2013 2012
Percent Change
Revenues:
Net sales $ 114,876 $ 113,07
7 1.6 % $ 344,29
0 $ 338,64
4 1.7 %
Membership and other income 812 723 12.3 % 2,298 2,231 3.0 %
Total revenues 115,688 113,800 1.7 % 346,588 340,875 1.7 %
Costs and expenses:
Cost of sales 86,687 85,470 1.4 % 260,098 256,226 1.5 %
Operating, selling, general and administrative expenses 22,691 22,237 2.0 % 66,965 65,504 2.2 %
Operating income 6,310 6,093 3.6 % 19,525 19,145 2.0 %
Interest:
Debt 527 522 1.0 % 1,556 1,512 2.9 %
Capital leases 65 68 (4.4 )% 198 205 (3.4 )%
Interest income (12 ) (44 ) (72.7 )% (92 ) (131 ) (29.8 )%
Interest, net 580 546 6.2 % 1,662 1,586 4.8 %
Income from continuing operations before income taxes 5,730 5,547 3.3 % 17,863 17,559 1.7 %
Provision for income taxes 1,860 1,738 7.0 % 5,856 5,718 2.4 %
Income from continuing operations 3,870 3,809 1.6 % 12,007 11,841 1.4 %
Income from discontinued operations, net of income taxes 15 16 6.3 % 38 39 2.6 %
Consolidated net income 3,885 3,825 1.6 % 12,045 11,880 1.4 %
Less consolidated net income attributable to noncontrolling interest (147 ) (190 ) (22.6 )% (454 ) (487 ) (6.8 )%
Consolidated net income attributable to Walmart $ 3,738 $ 3,635 2.8 % $ 11,591 $ 11,393 1.7 %
Income from continuing operations attributable to Walmart:
Income from continuing operations $ 3,870 $ 3,809 1.6 % $ 12,007 $ 11,841 1.4 %
Less income from continuing operations attributable to noncontrolling interest
(143 ) (185 ) (22.7 )% (443 ) (475 ) (6.7 )%
Income from continuing operations attributable to Walmart
$ 3,727 $ 3,624 2.8 % $ 11,564 $ 11,366 1.7 %
Basic net income per common share:
Basic net income per common share from continuing operations attributable to Walmart
$ 1.14 $ 1.08 5.6 % $ 3.52 $ 3.35 5.1 %
Basic net income per common share from discontinued operations attributable to Walmart
$ 0.01 — 100.0 % 0.01 0.02 (50.0 )%
Basic net income per common share attributable to Walmart $ 1.15 $ 1.08 6.5 % $ 3.53 $ 3.37 4.7 %
Diluted net income per common share:
Diluted net income per common share from continuing operations attributable to Walmart
$ 1.14 $ 1.07 6.5 % $ 3.51 $ 3.34 5.1 %
Diluted net income per common share from discontinued operations attributable to Walmart
— 0.01 (100.0 )% 0.01 0.01 — %
Diluted net income per common share attributable to Walmart $ 1.14 $ 1.08 5.6 % $ 3.52 $ 3.35 5.1 %
Weighted-average common shares outstanding:
Basic 3,257 3,364 3,279 3,385
Diluted 3,271 3,379 3,293 3,400
Dividends declared per common share $ — $ — $ 1.88 $ 1.59

10
Wal-Mart Stores, Inc.
Condensed Consolidated Balance Sheets (Unaudited)
SUBJECT TO RECLASSIFICATION
(Dollars in millions) October 31, January 31, October 31,
ASSETS 2013 2013 2012
Current assets:
Cash and cash equivalents $ 8,736 $ 7,781 $ 8,643
Receivables, net 6,206 6,768 5,567
Inventories 49,673 43,803 47,487
Prepaid expenses and other 2,160 1,588 1,654
Current assets of discontinued operations 367 — 80
Total current assets 67,142 59,940 63,431
Property and equipment:
Property and equipment 170,967 165,825 163,011
Less accumulated depreciation (56,313 ) (51,896 ) (50,450 )
Property and equipment, net 114,654 113,929 112,561
Property under capital leases:
Property under capital leases 5,668 5,899 5,900
Less accumulated amortization (3,095 ) (3,147 ) (3,208 )
Property under capital leases, net 2,573 2,752 2,692
Goodwill 19,729 20,497 20,572
Other assets and deferred charges 5,778 5,987 6,562
Total assets $ 209,876 $ 203,105 $ 205,818
LIABILITIES AND EQUITY
Current liabilities:
Short-term borrowings $ 12,817 $ 6,805 $ 8,740
Accounts payable 39,221 38,080 40,272
Dividends payable 1,573 — 1,381
Accrued liabilities 18,606 18,808 18,536
Accrued income taxes 255 2,211 1,010
Long-term debt due within one year 4,147 5,587 6,550
Obligations under capital leases due within one year 315 327 331
Current liabilities of discontinued operations 87 — 25
Total current liabilities 77,021 71,818 76,845
Long-term debt 41,702 38,394 38,872
Long-term obligations under capital leases 2,841 3,023 2,964
Deferred income taxes and other 8,298 7,613 8,044
Redeemable noncontrolling interest 1,492 519 492
Commitments and contingencies
Equity:
Common stock 324 332 336
Capital in excess of par value 2,364 3,620 3,861
Retained earnings 72,888 72,978 70,256
Accumulated other comprehensive income (loss) (2,183 ) (587 ) (562 )
Total Walmart shareholders’ equity 73,393 76,343 73,891
Nonredeemable noncontrolling interest 5,129 5,395 4,710
Total equity 78,522 81,738 78,601
Total liabilities and equity $ 209,876 $ 203,105 $ 205,818

11
Wal-Mart Stores, Inc.
Condensed Consolidated Statements of Cash Flows (Unaudited)
Nine Months Ended
SUBJECT TO RECLASSIFICATION October 31,
(Dollars in millions) 2013 2012
Cash flows from operating activities:
Consolidated net income $ 12,045 $ 11,880
Income from discontinued operations, net of income taxes (38 ) (39 )
Income from continuing operations 12,007 11,841
Adjustments to reconcile consolidated net income to net cash provided by operating activities:
Depreciation and amortization 6,600 6,304
Deferred income taxes 594 279
Other operating activities 465 138
Changes in certain assets and liabilities:
Receivables, net 191 501
Inventories (6,230 ) (6,459 )
Accounts payable 2,089 3,545
Accrued liabilities (95 ) (82 )
Accrued income taxes (2,301 ) (160 )
Net cash provided by operating activities 13,320 15,907
Cash flows from investing activities:
Payments for property and equipment (9,506 ) (8,921 )
Proceeds from the disposal of property and equipment 521 343
Investments and business acquisitions, net of cash acquired (15 ) (716 )
Other investing activities 58 (58 )
Net cash used in investing activities (8,942 ) (9,352 )
Cash flows from financing activities:
Net change in short-term borrowings 6,046 4,700
Proceeds from issuance of long-term debt 7,053 199
Payments of long-term debt (4,943 ) (639 )
Dividends paid (4,625 ) (4,034 )
Purchase of Company stock (5,806 ) (4,657 )
Other financing activities (960 ) (263 )
Net cash used in financing activities (3,235 ) (4,694 )
Effect of exchange rates on cash and cash equivalents (188 ) 232
Net increase in cash and cash equivalents 955 2,093
Cash and cash equivalents at beginning of year 7,781 6,550
Cash and cash equivalents at end of period $ 8,736 $ 8,643

12
Wal-Mart Stores, Inc. Reconciliations of and Other Information Regarding Non-GAAP Financial Measures
(Unaudited) (In millions, except per share data)
The following information provides reconciliations of certain non-GAAP financial measures presented in the press release to which this reconciliation is attached to the most directly comparable financial measures calculated and presented in accordance with generally accepted accounting principles ("GAAP"). The company has provided the non-GAAP financial information presented in the press release, which is not calculated or presented in accordance with GAAP, as information supplemental and in addition to the financial measures presented in the press release that are calculated and presented in accordance with GAAP. Such non-GAAP financial measures should not be considered superior to, as a substitute for, or as an alternative to, and should be considered in conjunction with the GAAP financial measures presented in the press release. The non-GAAP financial measures in the press release may differ from similar measures used by other companies.
Calculation of Return on Investment and Return on Assets
Management believes return on investment ("ROI") is a meaningful metric to share with investors because it helps investors assess how effectively Walmart is deploying its assets. Trends in ROI can fluctuate over time as management balances long-term potential strategic initiatives with any possible short-term impacts.
ROI was 17.5 percent and 18.0 percent for the trailing twelve months ended October 31, 2013 and 2012, respectively. The decline was principally due to investments in fixed assets, growth in working capital, and the impact of acquisitions.
We define ROI as adjusted operating income (operating income plus interest income, depreciation and amortization, and rent expense) for the trailing twelve months divided by average invested capital during that period. We consider average invested capital to be the average of our beginning and ending total assets, plus average accumulated depreciation and average amortization less average accounts payable and average accrued liabilities for that period, plus a rent factor equal to the rent for the fiscal year or trailing twelve months multiplied by a factor of eight. When we have discontinued operations, we exclude the impact of the discontinued operations.
Our calculation of ROI is considered a non-GAAP financial measure because we calculate ROI using financial measures that exclude and include amounts that are included and excluded in the most directly comparable GAAP financial measure. For example, we exclude the impact of depreciation and amortization from our reported operating income in calculating the numerator of our calculation of ROI. In addition, we include a factor of eight for rent expense that estimates the hypothetical capitalization of our operating leases. We consider return on assets ("ROA") to be the financial measure computed in accordance with generally accepted accounting principles ("GAAP") that is the most directly comparable financial measure to our calculation of ROI. ROI differs from ROA (which is consolidated net income for the period divided by average total assets for the period) because ROI: adjusts operating income to exclude certain expense items and adds interest income; adjusts total assets for the impact of accumulated depreciation and amortization, accounts payable and accrued liabilities; and incorporates a factor of rent to arrive at total invested capital.
Although ROI is a standard financial metric, numerous methods exist for calculating a company's ROI. As a result, the method used by Walmart's management to calculate ROI may differ from the methods other companies use to calculate their ROI. We urge you to understand the methods used by other companies to calculate their ROI before comparing our ROI to that of such other companies.

13
The calculation of ROI, along with a reconciliation to the calculation of ROA, the most comparable GAAP financial measure, is as follows:
Wal-Mart Stores, Inc.
Return on Investment and Return on Assets
Trailing Twelve Months Ended
October 31,
(Dollars in millions) 2013 2012
CALCULATION OF RETURN ON INVESTMENT
Numerator
Operating income $ 28,181 $ 27,546
+ Interest income 148 162
+ Depreciation and amortization 8,797 8,367
+ Rent 2,688 2,560
Adjusted operating income $ 39,814 $ 38,635
Denominator
Average total assets of continuing operations1 $ 207,624 $ 200,447
+ Average accumulated depreciation and amortization1 56,533 50,382
- Average accounts payable1 39,747 38,914
- Average accrued liabilities1 18,571 17,713
+ Rent x 8 21,504 20,480
Average invested capital $ 227,343 $ 214,682
Return on investment (ROI) 17.5 % 18.0 %
CALCULATION OF RETURN ON ASSETS
Numerator
Income from continuing operations $ 17,922 $ 17,278
Denominator
Average total assets of continuing operations1 $ 207,624 $ 200,447
Return on assets (ROA) 8.6 % 8.6 %
As of October 31,
Certain Balance Sheet Data 2013 2012 2011
Total assets of continuing operations2 $ 209,509 $ 205,738 $ 195,155
Accumulated depreciation and amortization 59,408 53,658 47,106
Accounts payable 39,221 40,272 37,555
Accrued liabilities 18,606 18,536 16,890 1 The average is based on the addition of the account balance at the end of the current period to the account balance at the end of the prior
period and dividing by 2. 2 Total assets of continuing operations as of October 31, 2013, 2012 and 2011 in the table above exclude assets of discontinued operations that
are reflected in the Company's Condensed Consolidated Balance Sheets of $367 million, $80 million and $89 million, respectively.

14
Free Cash Flow
We define free cash flow as net cash provided by operating activities in a period minus payments for property and equipment made in that period. Free cash flow was $3.8 billion and $7.0 billion for the nine months ended October 31, 2013 and 2012, respectively. Timing of payments associated with taxes and payables, as well as higher capital expenditures were the primary drivers of the reduction.
Free cash flow is considered a non-GAAP financial measure. Management believes, however, that free cash flow, which measures our ability to generate additional cash from our business operations, is an important financial measure for use in evaluating the company's financial performance. Free cash flow should be considered in addition to, rather than as a substitute for consolidated net income as a measure of our performance and net cash provided by operating activities as a measure of our liquidity.
Additionally, Walmart's definition of free cash flow is limited, in that it does not represent residual cash flows available for discretionary expenditures due to the fact that the measure does not deduct the payments required for debt service and other contractual obligations or payments made for business acquisitions. Therefore, we believe it is important to view free cash flow as a measure that provides supplemental information to our condensed consolidated statements of cash flows.
Although other companies report their free cash flow, numerous methods may exist for calculating a company's free cash flow. As a result, the method used by our management to calculate our free cash flow may differ from the methods other companies use to calculate their free cash flow. We urge you to understand the methods used by other companies to calculate their free cash flow before comparing our free cash flow to that of such other companies.
The following table sets forth a reconciliation of free cash flow, a non-GAAP financial measure, to net cash provided by operating activities, which we believe to be the GAAP financial measure most directly comparable to free cash flow, as well as information regarding net cash used in investing activities and net cash used in financing activities.
Nine Months Ended
October 31,
(Dollars in millions) 2013 2012
Net cash provided by operating activities $ 13,320 $ 15,907
Payments for property and equipment (9,506 ) (8,921 )
Free cash flow $ 3,814 $ 6,986
Net cash used in investing activities1 $ (8,942 ) $ (9,352 )
Net cash used in financing activities $ (3,235 ) $ (4,694 )
1 "Net cash used in investing activities" includes payments for property and equipment, which is also included in our computation of free cash
flow.
15
Constant Currency
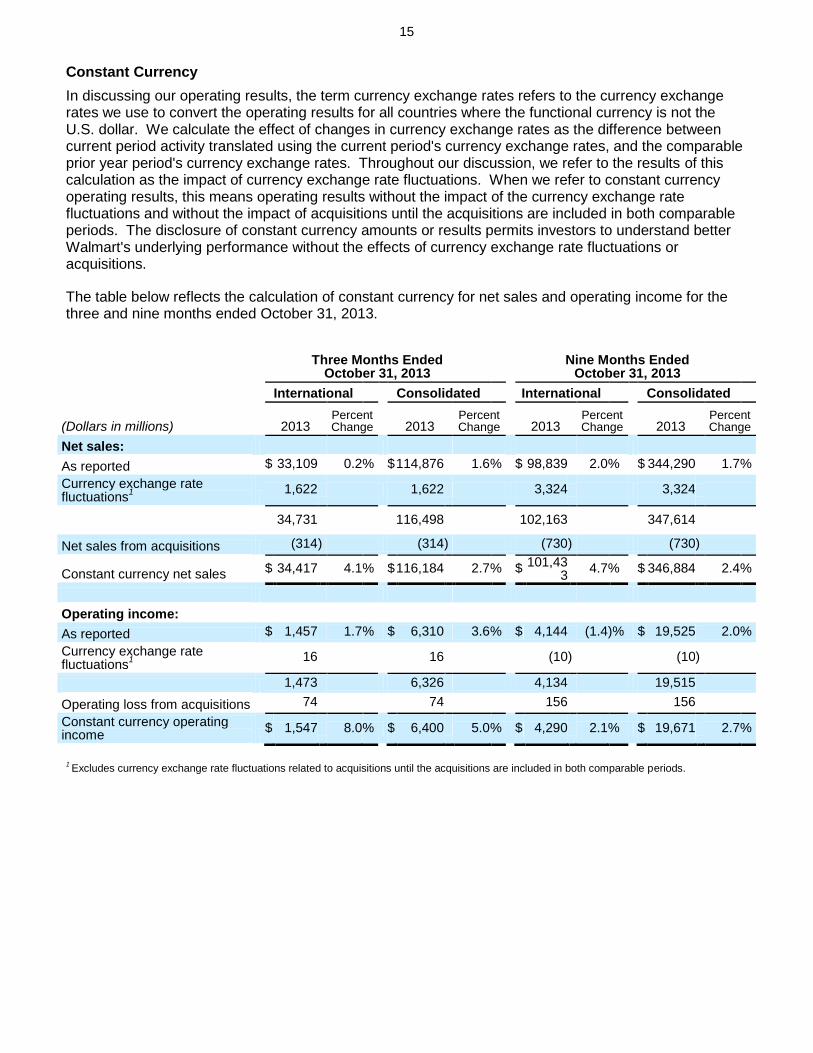
In discussing our operating results, the term currency exchange rates refers to the currency exchange rates we use to convert the operating results for all countries where the functional currency is not the U.S. dollar. We calculate the effect of changes in currency exchange rates as the difference between current period activity translated using the current period's currency exchange rates, and the comparable prior year period's currency exchange rates. Throughout our discussion, we refer to the results of this calculation as the impact of currency exchange rate fluctuations. When we refer to constant currency operating results, this means operating results without the impact of the currency exchange rate fluctuations and without the impact of acquisitions until the acquisitions are included in both comparable periods. The disclosure of constant currency amounts or results permits investors to understand better Walmart's underlying performance without the effects of currency exchange rate fluctuations or acquisitions.
The table below reflects the calculation of constant currency for net sales and operating income for the three and nine months ended October 31, 2013.
Three Months Ended
October 31, 2013 Nine Months Ended
October 31, 2013
International Consolidated International Consolidated
(Dollars in millions) 2013 Percent Change 2013
Percent Change 2013
Percent Change 2013
Percent Change
Net sales:
As reported $ 33,109 0.2 % $ 114,876 1.6 % $ 98,839 2.0 % $ 344,290 1.7 %
Currency exchange rate fluctuations
1
1,622 1,622 3,324 3,324
34,731 116,498 102,163 347,614
Net sales from acquisitions (314 ) (314 ) (730 ) (730 )
Constant currency net sales $ 34,417 4.1 % $ 116,184 2.7 % $ 101,433
4.7 % $ 346,884 2.4 %
Operating income:
As reported $ 1,457 1.7 % $ 6,310 3.6 % $ 4,144 (1.4 )% $ 19,525 2.0 %
Currency exchange rate fluctuations
1
16 16 (10 ) (10 )
1,473 6,326 4,134 19,515
Operating loss from acquisitions 74 74 156 156
Constant currency operating income
$ 1,547 8.0 % $ 6,400 5.0 % $ 4,290 2.1 % $ 19,671 2.7 %
1 Excludes currency exchange rate fluctuations related to acquisitions until the acquisitions are included in both comparable periods.

16
EPS and Underlying EPS Guidance
The estimated range for the underlying diluted earnings per share from continuing operations attributable to Walmart ("Underlying EPS") for the three months and the fiscal year to end Jan. 31, 2014 is considered a non-GAAP financial measure under the SEC’s rules because the Underlying EPS for each
such period includes certain amounts not included in the estimated range of diluted earnings per share from continuing operations attributable to Walmart ("EPS") calculated in accordance with GAAP for the three months and the fiscal year to end Jan. 31, 2014. Management believes that the Underlying EPS for the three months and the fiscal year to end Jan. 31, 2014 is a meaningful metric to share with investors because that metric, which adjusts EPS for each of such periods for certain items expected to be recorded in the three months to end Jan. 31, 2014, is the metric that best compares with the EPS for the three months and the fiscal year ended Jan. 31, 2013, respectively. In addition, the metric affords investors a view of management’s expectations for Walmart’s core earnings performance for the three months and the fiscal year to end Jan. 31, 2014 and the ability to make a more informed assessment of such expected core earnings performance for each of such periods when compared to Walmart’s
earnings performance for the three months and the fiscal year ended Jan. 31, 2013, respectively. We have calculated the range of Underlying EPS for the three months and the fiscal year to end Jan. 31, 2014 by adding to the range of EPS for each such period the approximate amount of the expected dilutive impact of: (1) the ending of Walmart’s retail franchise agreement in India (the "India
Transaction"); and (2) the planned closure of approximately 50 under-performing stores in Brazil and China (the "Store Closures") on EPS for the three months to end Jan. 31, 2014.
EPS for the three months and the fiscal year to end Jan. 31, 2014 is the financial measure calculated in accordance with GAAP that is most directly comparable to the Underlying EPS for the three months and the fiscal year to end Jan. 31, 2014, respectively. The calculation of the Underlying EPS for each such period and the reconciliation of the Underlying EPS for each such period to EPS for such period are as follows:
EPS Guidance for the Three Months to End January 31, 2014
Adjustments to EPS Guidance
EPS Store Closures India Transaction Underlying EPS
Diluted net income per common share:
Diluted income per common share from continuing operations attributable to Walmart
1.50 - 1.60 0.06 0.04 1.60 - 1.70
EPS Guidance for the Twelve Months to End January 31, 2014
Adjustments to EPS Guidance
EPS Store Closures India Transaction Underlying EPS
Diluted net income per common share:
Diluted income per common share from continuing operations attributable to Walmart
5.01 - 5.11 0.06 0.04 5.11 - 5.21

17
Comparable Sales Measures and Sam's Club Measures
The following financial measures presented in the press release to which this reconciliation is attached are non-GAAP financial measures as defined by the SEC's rules:
• the comparable club sales of the company's Sam's Club operating segment ("Sam's Club") for the thirteen-week and thirty-nine week periods ended Oct. 25, 2013 and Oct. 26, 2012, projected comparable club sales of Sam's Club for the fourteen weeks ending Jan. 31, 2014 and comparable club sales of Sam's Club for the fourteen weeks ended Feb. 1, 2013, in each case calculated by excluding Sam's Club's fuel sales for such periods (the "Comparable Sales Measures");
• the net sales of Sam's Club for the three months and nine months ended Oct. 31, 2013 and the percentage increase in the net sales of Sam's Club for the three months and nine months ended Oct. 31, 2013 over the net sales Sam's Club for the three months and nine months ended Oct. 31, 2012, in each case calculated by excluding Sam's Club's fuel sales for the relevant period; and
• the segment operating income of Sam's Club for the three months and nine months ended Oct. 31, 2013 and 2012 and the percentage increase in the segment operating income of Sam's Club for the three months and nine months ended Oct. 31, 2013 over the segment operating income of Sam's Club for the three months and nine months ended Oct. 31, 2012, in each case calculated by excluding Sam's Club's fuel sales for the relevant period.
The measures described in the second and third bullet points above are referred to herein as the "Sam's Club Measures."
We believe the Sam's Club's comparable club sales for the historical periods for which the corresponding Comparable Sales Measures are presented calculated by including fuel sales and their effects are the financial measures computed in accordance with GAAP most directly comparable to the respective Comparable Sales Measures. We believe the Sam's Club's projected comparable club sales for the fourteen weeks ending Jan. 31, 2014 calculated by including fuel sales and their effects is the financial measure computed in accordance with GAAP most directly comparable to the projected comparable club sales of Sam's Club for the fourteen weeks ending Jan. 31, 2014 calculated by excluding fuel sales. We believe the reported Sam's Club's net sales, percentage increase in net sales, segment operating income and percentage increase in segment operating income for the periods for which the corresponding Sam's Club Measures are presented are the most directly comparable financial measures computed in accordance with GAAP to the respective Comparable Sales Measures.
We believe that the presentation of the Comparable Sales Measures and the Sam's Club Measures provides useful information to investors regarding the company's financial condition and results of operations because that information permits investors to understand the effect of the fuel sales of Sam's Club, which are affected by the volatility of fuel prices, on Sam's Club's comparable club sales and on Sam's Club's net sales and operating income for the periods presented.