warm-up ch. 3 textbook review a simple random sample of eight drivers was selected. all eight...
TRANSCRIPT
Warm-upCh. 3 Textbook Review
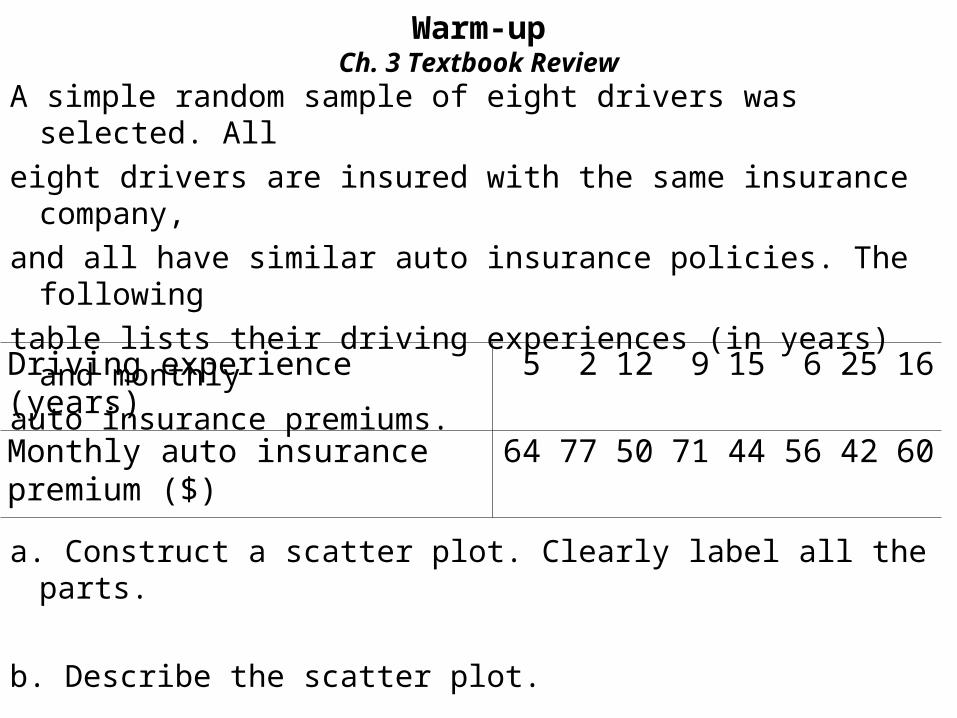
A simple random sample of eight drivers was selected. Alleight drivers are insured with the same insurance company,and all have similar auto insurance policies. The followingtable lists their driving experiences (in years) and monthlyauto insurance premiums.
a. Construct a scatter plot. Clearly label all the parts.
b. Describe the scatter plot.
Driving experience (years) 5 2 12 9 15 6 25 16Monthly auto insurance premium ($) 64 77 50 71 44 56 42 60

Student of the day!Block 1

Student of the day!Block 2
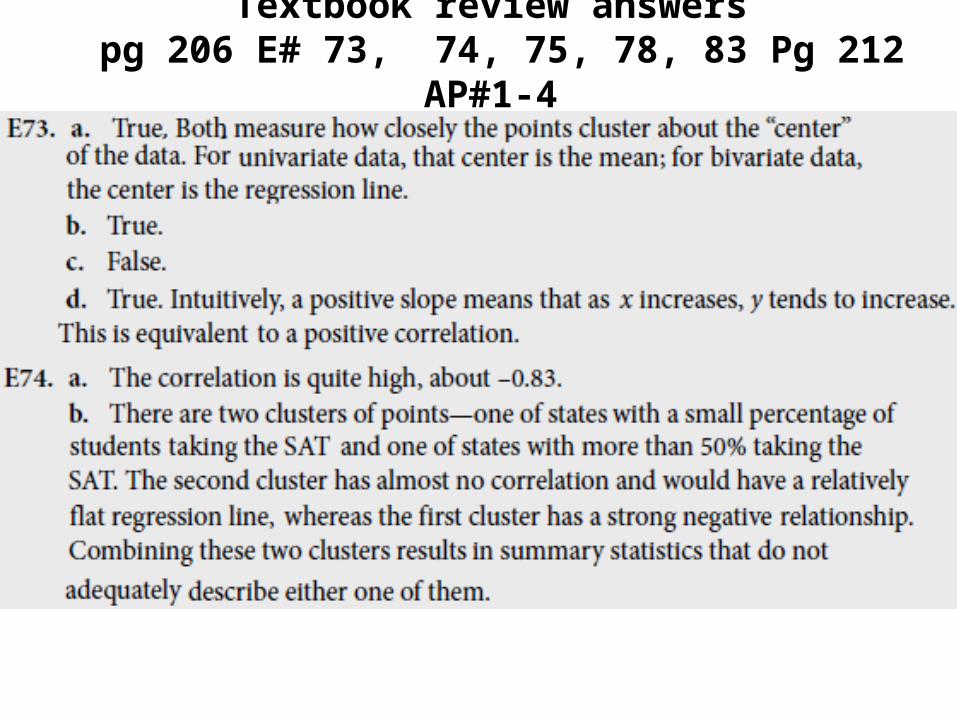
Textbook review answers pg 206 E# 73, 74, 75, 78, 83 Pg 212 AP#1-4
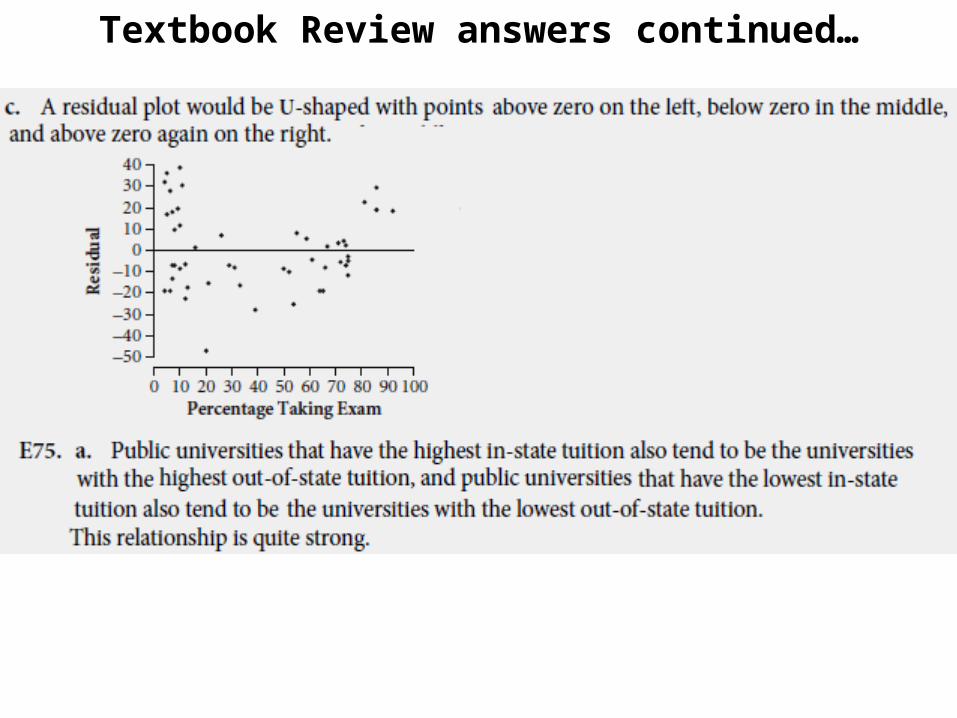
Textbook Review answers continued…
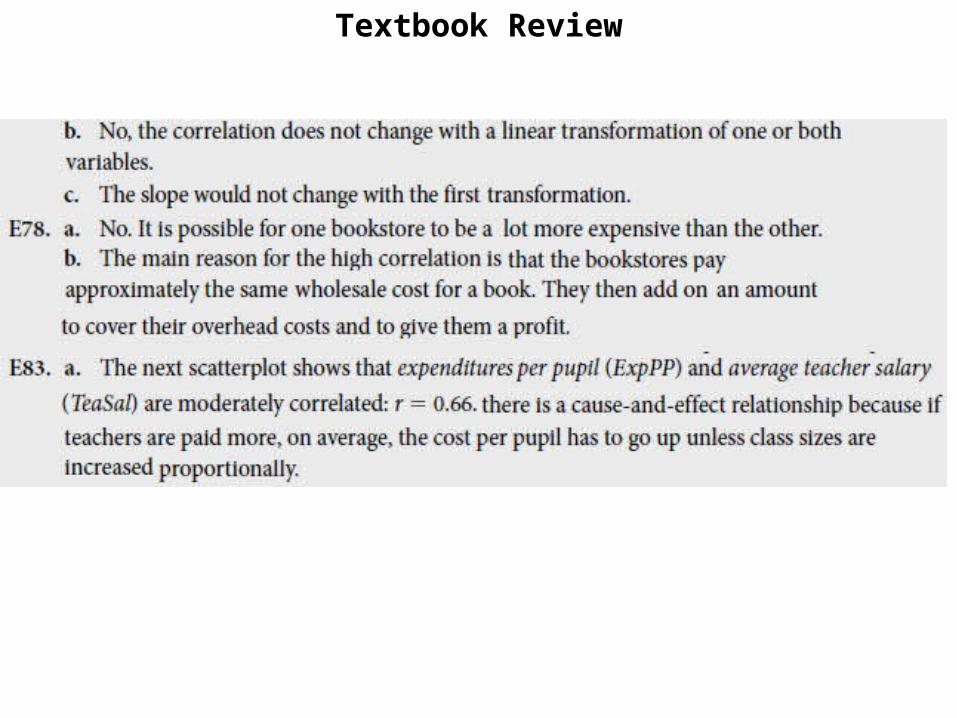
Textbook Review
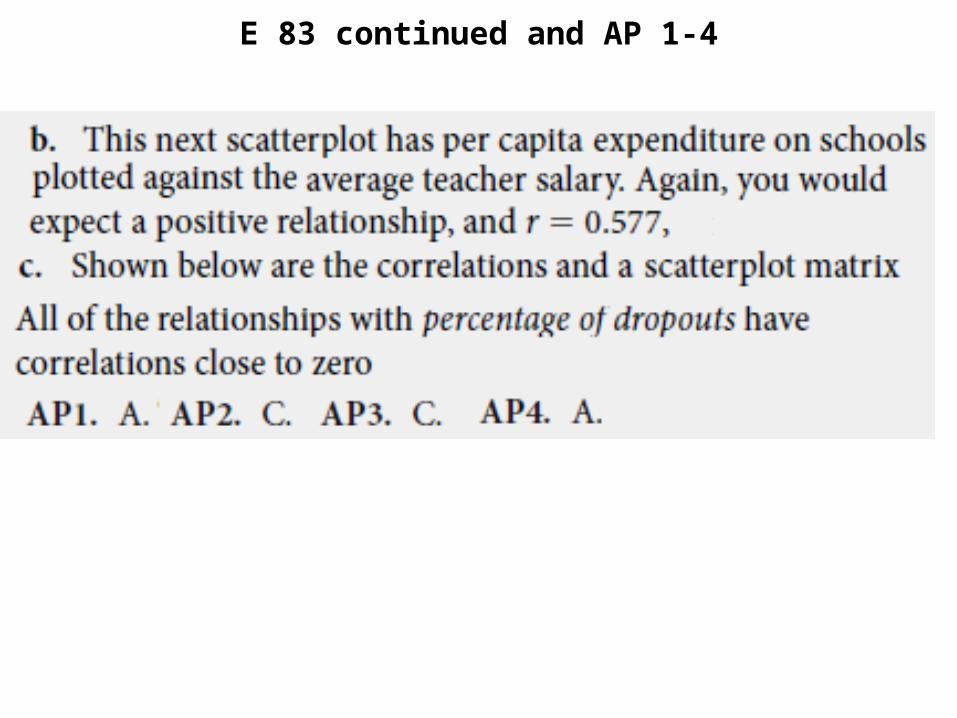
E 83 continued and AP 1-4
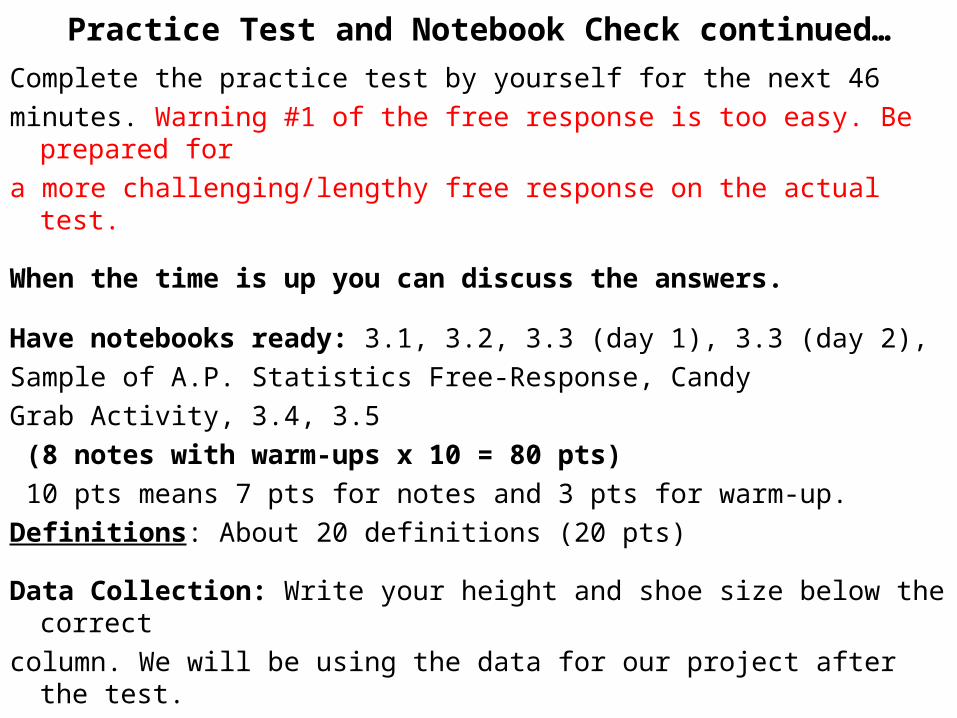
Practice Test and Notebook Check continued…
Complete the practice test by yourself for the next 46minutes. Warning #1 of the free response is too easy. Be prepared fora more challenging/lengthy free response on the actual test.
When the time is up you can discuss the answers.
Have notebooks ready: 3.1, 3.2, 3.3 (day 1), 3.3 (day 2),Sample of A.P. Statistics Free-Response, CandyGrab Activity, 3.4, 3.5 (8 notes with warm-ups x 10 = 80 pts) 10 pts means 7 pts for notes and 3 pts for warm-up.Definitions: About 20 definitions (20 pts)
Data Collection: Write your height and shoe size below the correctcolumn. We will be using the data for our project after the test.
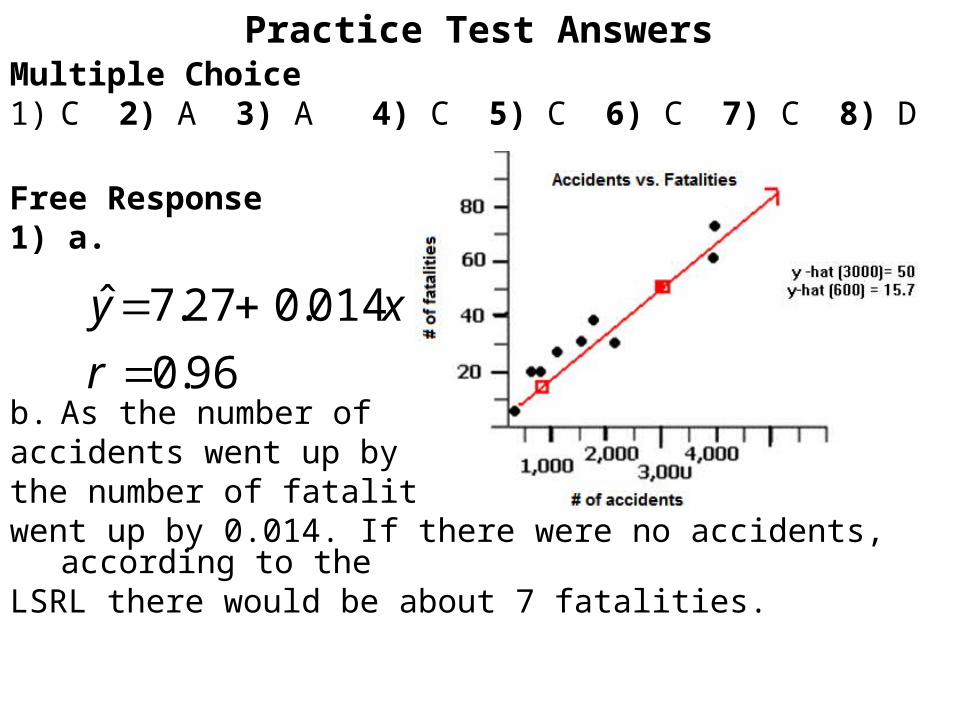
Practice Test AnswersMultiple Choice1) C 2) A 3) A 4) C 5) C 6) C 7) C 8) D
Free Response1) a.
b. As the number of accidents went up by 1the number of fatalities went up by 0.014. If there were no accidents, according to theLSRL there would be about 7 fatalities.
96.0
014.027.7ˆ
r
xy
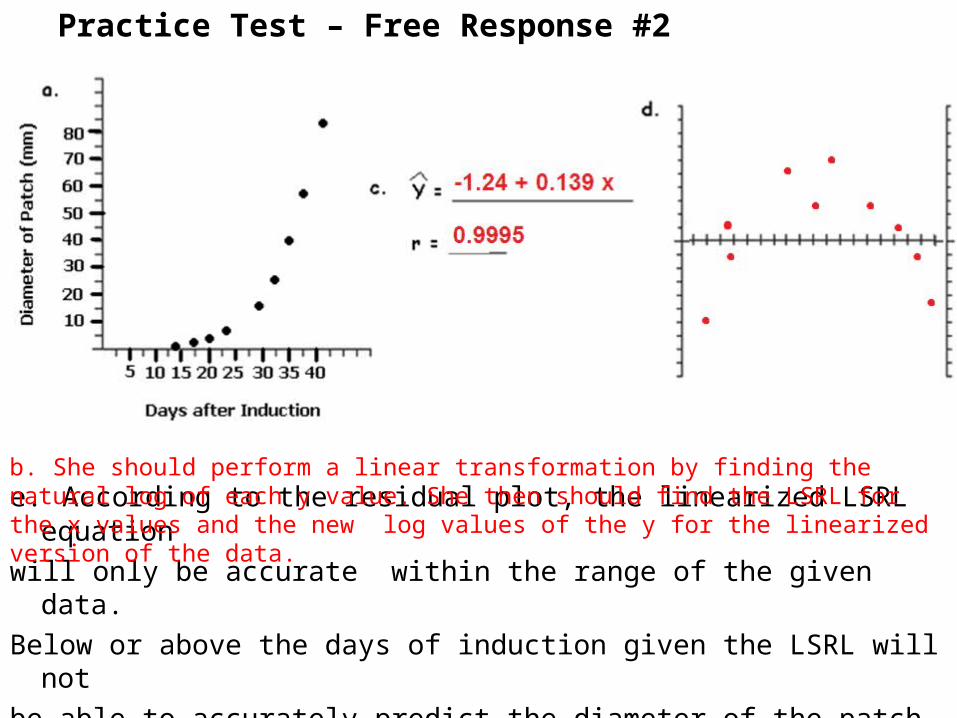
Practice Test – Free Response #2
e. According to the residual plot, the linearized LSRL equationwill only be accurate within the range of the given data.Below or above the days of induction given the LSRL will notbe able to accurately predict the diameter of the patch.
b. She should perform a linear transformation by finding the natural log of each y value. She then should find the LSRL for the x values and the new log values of the y for the linearized version of the data.

Homework and Next Block
• Read and write 2 questions related to the Unit 1 Review.
• We will discuss them before everyone starts the test.