warrawoona gold project soil and landform …
TRANSCRIPT

WARRAWOONA GOLD PROJECT
SOIL AND LANDFORM ASSESSMENT
JULY 2019
The leading mine closure planning consultancy
MINE EARTHFirst Floor, 13 Phillimore StFremantle WA 6160
+ 61 8 9431 [email protected]
Mine Earth Pty Ltd (ACN 141 633 696)

ii
Author Checked Distribution Date Version
M. Braimbridge S. Mackenzie K. George 11 July 2019 Revision A
DISCLAIMER, CONFIDENTIALITY AND COPYRIGHT STATEMENT
© Mine Earth. All rights reserved. No part of this work may be reproduced in any material form or communicated by any means without the permission of the copyright owner.
This document is confidential. Neither the whole nor any part of this document may be disclosed to any third party without the prior written approval of both Mine Earth and the recipient.
Mine Earth and their subconsultants undertook the work and prepared this document, in accordance with specific instructions from the recipient to whom this document is addressed, within the time and budgetary requirements of the recipient. The conclusions and recommendations stated in this document are based on those instructions and requirements, and they could change if such instructions and requirements change or are in fact inaccurate or incomplete.
Mine Earth has prepared this document using data, information and estimates supplied to Mine Earth by the recipient and other individuals and organisations, most of whom are referred to in this document. Where possible, throughout the document the source of data used has been identified. Unless stated otherwise, Mine Earth has not verified such data and information. Mine Earth does not represent such data and information as true or accurate, and disclaims all liability with respect to the use of such data and information. All parties relying on this document do so entirely at their own risk in the knowledge that the document was prepared using information that Mine Earth has not verified.
This document is intended to be read in its entirety, and sections or parts of the document should therefore not be read and relied on out of context.
The conclusions and recommendations contained in this document reflect the professional opinion of Mine Earth, using the data and information supplied. Mine Earth has used reasonable care and professional judgment in its interpretation and analysis of the data. The conclusions and recommendations must be considered within the agreed scope of work, and the methodology used to carry out the work, both of which are stated in this document.
This document was intended for the sole use of the recipient and only for the use for which it was prepared, which is stated in this document. Any representation in the document is made only to the recipient. Mine Earth disclaims all liability with respect to the use of this document by any third party, and with respect to the use of and reliance upon this document by any party, including the recipient for a purpose other than the purpose for which it was prepared.
M. Braimbridge K. George 18 July 2019 Revision 0
iii
Warrawoona Gold Project – Soil Assessment
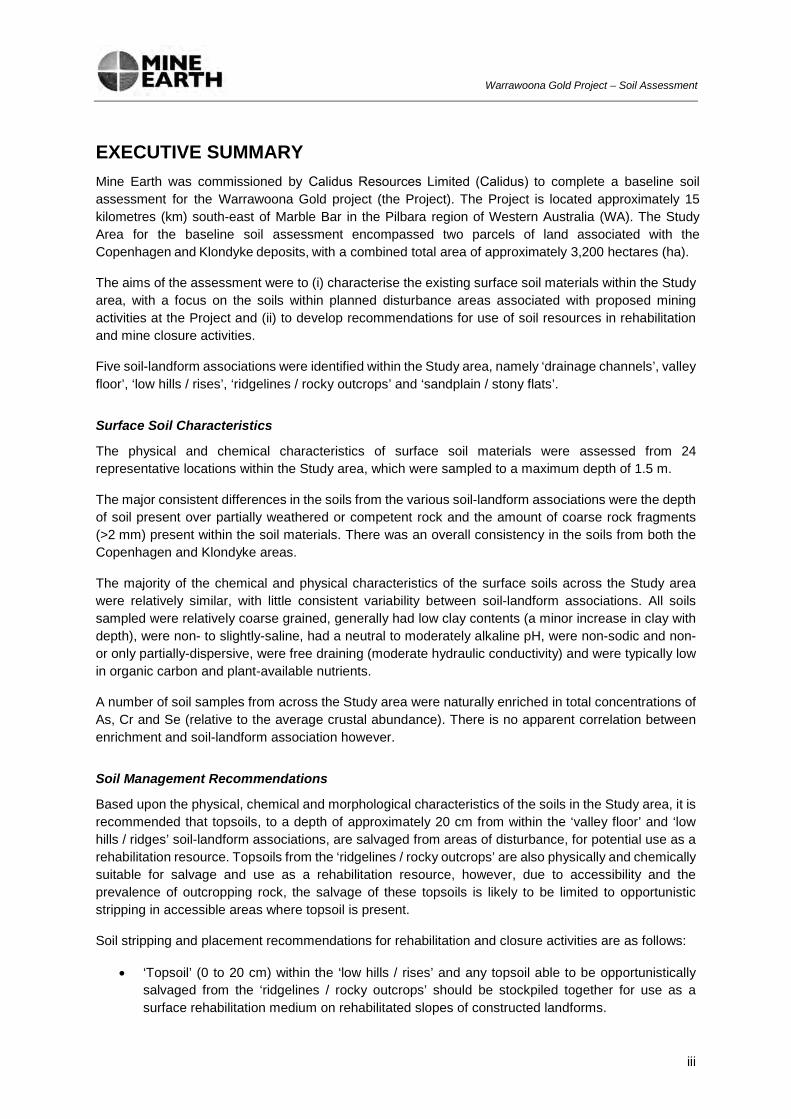
EXECUTIVE SUMMARY Mine Earth was commissioned by Calidus Resources Limited (Calidus) to complete a baseline soil assessment for the Warrawoona Gold project (the Project). The Project is located approximately 15 kilometres (km) south-east of Marble Bar in the Pilbara region of Western Australia (WA). The Study Area for the baseline soil assessment encompassed two parcels of land associated with the Copenhagen and Klondyke deposits, with a combined total area of approximately 3,200 hectares (ha).
The aims of the assessment were to (i) characterise the existing surface soil materials within the Study area, with a focus on the soils within planned disturbance areas associated with proposed mining activities at the Project and (ii) to develop recommendations for use of soil resources in rehabilitation and mine closure activities.
Five soil-landform associations were identified within the Study area, namely ‘drainage channels’, valley floor’, ‘low hills / rises’, ‘ridgelines / rocky outcrops’ and ‘sandplain / stony flats’.
Surface Soil Characteristics
The physical and chemical characteristics of surface soil materials were assessed from 24 representative locations within the Study area, which were sampled to a maximum depth of 1.5 m.
The major consistent differences in the soils from the various soil-landform associations were the depth of soil present over partially weathered or competent rock and the amount of coarse rock fragments (>2 mm) present within the soil materials. There was an overall consistency in the soils from both the Copenhagen and Klondyke areas.
The majority of the chemical and physical characteristics of the surface soils across the Study area were relatively similar, with little consistent variability between soil-landform associations. All soils sampled were relatively coarse grained, generally had low clay contents (a minor increase in clay with depth), were non- to slightly-saline, had a neutral to moderately alkaline pH, were non-sodic and non- or only partially-dispersive, were free draining (moderate hydraulic conductivity) and were typically low in organic carbon and plant-available nutrients.
A number of soil samples from across the Study area were naturally enriched in total concentrations of As, Cr and Se (relative to the average crustal abundance). There is no apparent correlation between enrichment and soil-landform association however.
Soil Management Recommendations
Based upon the physical, chemical and morphological characteristics of the soils in the Study area, it is recommended that topsoils, to a depth of approximately 20 cm from within the ‘valley floor’ and ‘low hills / ridges’ soil-landform associations, are salvaged from areas of disturbance, for potential use as a rehabilitation resource. Topsoils from the ‘ridgelines / rocky outcrops’ are also physically and chemically suitable for salvage and use as a rehabilitation resource, however, due to accessibility and the prevalence of outcropping rock, the salvage of these topsoils is likely to be limited to opportunistic stripping in accessible areas where topsoil is present.
Soil stripping and placement recommendations for rehabilitation and closure activities are as follows:
• ‘Topsoil’ (0 to 20 cm) within the ‘low hills / rises’ and any topsoil able to be opportunisticallysalvaged from the ‘ridgelines / rocky outcrops’ should be stockpiled together for use as asurface rehabilitation medium on rehabilitated slopes of constructed landforms.

iv
Warrawoona Gold Project – Soil Assessment
• ‘Topsoil’ (0 to 20 cm) from the ‘valley floor’ soil-landform association are less suitable forplacement on rehabilitated slopes due to the lower coarse rock fraction and tendency for partialdispersion of the clay fraction following disturbance. It is recommended that the topsoil fromwithin the ‘valley floor’ disturbance areas are stockpiled separately from the ‘low hills / rises’and ‘ridgelines / rocky outcrop’ topsoil, for preferential placement on flat rehabilitation areas.
• The deeper soils from within the ‘valley floor’ soil-landform association (i.e. soils fromapproximately 20 to 90 cm depth) may also be considered as a potential surface / near surfacerehabilitation medium, should additional soil material be required for rehabilitation activities.

v
Warrawoona Gold Project – Soil Assessment
TABLE OF CONTENTS EXECUTIVE SUMMARY ....................................................................................................................... iii 1 Introduction .............................................................................................................................. 1
1.1 Project background .................................................................................................................... 1 1.2 Objectives ................................................................................................................................... 1
2 Description of Study Area ....................................................................................................... 3 2.1 Land Use .................................................................................................................................... 3 2.2 Climate ....................................................................................................................................... 3 2.3 Geology ...................................................................................................................................... 4
2.3.1 Regional Geology .................................................................................................................. 4 2.3.2 Local Geology ....................................................................................................................... 4
2.4 Land Systems ............................................................................................................................. 5 3 Materials and Methods ............................................................................................................. 8
3.1 Sampling Regime ....................................................................................................................... 8 3.2 Test Work and Procedures......................................................................................................... 8
4 Results and Discussion ......................................................................................................... 11 4.1 Sample Site and Soil Profile Descriptions ................................................................................ 11 4.2 Soil Physical Characteristics .................................................................................................... 36
4.2.1 Soil Profile Morphology ....................................................................................................... 36 4.2.2 Soil Texture ......................................................................................................................... 36 4.2.3 Soil Structure ....................................................................................................................... 37 4.2.4 Structural Stability ............................................................................................................... 37 4.2.5 Hydraulic conductivity ......................................................................................................... 38
4.3 Soil Chemical Characteristics................................................................................................... 40 4.3.1 Soil pH and Electrical Conductivity ..................................................................................... 40 4.3.2 Soil Organic Matter ............................................................................................................. 42 4.3.3 Exchangeable Cations and Exchangeable Sodium Percentage ........................................ 43 4.3.4 Soil Nutrients ....................................................................................................................... 44 4.3.5 Total metal concentrations .................................................................................................. 48
5 Soil Landform Association Mapping .................................................................................... 49 6 Conclusions and Recommendations ................................................................................... 52
6.1 Soil Management Recommendations ...................................................................................... 53 7 References .............................................................................................................................. 55
Figures
Figure 1 Regional location of the Warrawoona Gold Project .............................................................. 2 Figure 2 Mean monthly rainfall and mean monthly maximum temperature at the Marble Bar weather
station .................................................................................................................................... 4

vi
Warrawoona Gold Project – Soil Assessment
Figure 3 Land systems and tenement boundaries within the Study area (Copenhagen area) ........... 6 Figure 4 Land systems and tenement boundaries within the Study area (Klondyke area) ................. 7 Figure 4 Soil sampling locations within the Study area (Copenhagen area) ...................................... 9 Figure 5 Soil sampling locations within the Study area (Klondyke deposit area) ............................. 10 Figure 7 Average Ksat values (mm/hr) for topsoil materials (0-5cm sample) grouped into soil-
landform associations. ........................................................................................................ 40 Figure 7 Individual and average pH (H2O) of soils with depth for each soil-landform association ... 41 Figure 8 Individual and average EC (dS/m) of soils with depth for each soil-landform association . 42 Figure 9 Individual and average Organic C concentration (%) of soils with depth for each soil-
landform association ........................................................................................................... 43 Figure 10 Individual and average Nitrate-N concentration (mg/kg) of soils with depth for each soil-
landform association ........................................................................................................... 45 Figure 11 Individual and average Ammonium-N concentration (mg/kg) of soils with depth for each soil-
landform association ........................................................................................................... 45 Figure 12 Individual and average plant-available phosphorus concentration (mg/kg) of soils with depth
for each soil-landform association ...................................................................................... 46 Figure 13 Individual and average plant-available potassium concentration (mg/kg) of soils with depth
for each soil-landform association ...................................................................................... 47 Figure 14 Individual and average plant-available sulphur concentration (mg/kg) of soils with depth for
each soil-landform association (note logarithmic scale of x-axis on individual values figure) ..................................................................................................................................... 47
Figure 16 Soil-landform associations within the Study area (Copenhagen area) ............................... 50 Figure 17 Soil-landform associations within the Study area (Klondyke area) ..................................... 51
Tables
Table 1 Land systems within the Study area ..................................................................................... 5 Table 2 Soil texture and Emerson Test Class for selected soil samples ......................................... 38 Table 3 Saturated hydraulic conductivity (Ksat) for selected soils ................................................... 39 Table 4 Exchangeable cations and ESP of selected samples. Shading of ESP values denotes non-
sodic, sodic and highly sodic classifications ....................................................................... 44 Table 5 Total metal concentration for selected samples.................................................................. 48
Appendices
Appendix A Soil analysis classifications Appendix B CSBP Laboratory Analysis Certificate

1
Warrawoona Gold Project – Soil Assessment
1 INTRODUCTION
1.1 Project background Calidus Resources Limited (Calidus) are the proponents of the proposed Warrawoona Gold project (the Project), located approximately 20 km south-east of the town of Marble Bar in the Pilbara region of Western Australia (Figure 1). The Project is likely to consist of a several open pits associated with the Klondyke deposit and a cutback to a historical mine pit at the Copenhagen deposit. Expected mine life for the Project is currently estimated at six years. Proposed infrastructure at the Project will consist of waste rock landforms (WRLs), a tailings storage facility (TSF), run-of-mine (ROM) pad, administration buildings, workshop/laydown area and access roads.
1.2 Objectives An assessment of soil and landform associations within the Project area was undertaken to support regulatory approvals, to identify potential utilisation of soil resources in rehabilitation activities and to facilitate mine closure planning.
This report includes:
• A review of relevant site information, land system and regional soil information.
• A description of the materials and methods used for sample collection and analysis.
• Surface soil profile descriptions.
• A description of soil physical characteristics including surface soil profile morphology, soiltexture, structure, structural stability and hydraulic conductivity.
• A description of soil chemical characteristics including pH, electrical conductivity, organicmatter, exchangeable cations, exchangeable sodium percentage, plant-available nutrients andtotal metal concentrations.
• Mapping of the soil-landform associations within the Study area.
• Soil management recommendations for topsoil stripping, handling and placement as arehabilitation resource.

COPENHAGEN KLONDYKE
121°0'0"E120°0'0"E119°0'0"E
20°0
'0"S
20°0
'0"S
21°0
'0"S
21°0
'0"S
Project Location Figure
1´0 10 20 30 40 50
km
Scale: 1:1,000,000 @ A3GCS GDA 1994
Job: WAR-1903Date: 4/07/2019Ph: + 61 8 9431 7318www.mineearth.com.auPO Box 404, Fremantle, WA, 6959
C:\GIS\Jobs\Mine Earth\WAR-1903 - Warrawoona Gold Project\F igures\WAR-1903_F01 Project Location_190704.mxd
COPYRIGHT: THIS DOCUMENT IS AND SHALL REMAIN THE PROPERTY OF MINE EARTH. THIS DOCUMENT MAY ONLY BE USED FOR THE PURPOSE FOR WHICH IT WAS COMMISSIONED AND IN ACCORDANCE W ITH THE TERMS OF ENGAGEMENT. MINE EARTH DOES NOT HOLD ANY RESPONSIBILITY FOR THE MISUSE OF THIS DOCUMENT.
!
!
!
!
!
!
!
!
!
!
SHARK BAY
ALBANY
PERTH
KALGOORLIE-BOULDER
LEONORA
KALBARRI
MEEKATHARRA
EXMOUTH
MARBLE BAR
PORT HEDLAND
0 200
km

3
Warrawoona Gold Project – Soil Assessment
2 DESCRIPTION OF STUDY AREA The Study area encompassed two parcels of land associated with the Copenhagen and Klondyke deposits, with a combined total area of approximately 3,200 hectares (ha). The combined area is inclusive of the following mining leases associated with the Project (Figure 3 and Figure 4):
• Klondyke area;
o M 45/668
o M 45/671
o M 45/552
o M 45/669
o M 45/547
o M 45/670
• Copenhagen area;
o M 45/240
o M 45/682 (partial)
2.1 Land Use The Study area comprises both Crown Land and an area of the Eginbah Pastoral Station. Historic mining activities have occurred within the area since the late 1800’s, with historical workings present within and around both the Copenhagen and Klondyke areas.
2.2 Climate The Study area is located within the Chichester subregion of the Pilbara Craton bioregion, which experiences a semi-desert-tropical climate characterised by hot, dry summers and cool, dry winters (McKenzie, N.l., May, J.E. and McKenna, S., 2003).
The closest Bureau of Meteorology (BOM) weather station to the Study area is located at Marble Bar (Station Number 4106), situated approximately 15 km to the north-west.
The mean maximum temperature for Marble Bar is highest in December and January at over 40° Celsius (C) and lowest in June at 28°C (Figure 1). Rainfall occurs mainly over the months of January to March (Figure 1) and is typically associated with thunderstorm and cyclonic activity. The mean average yearly rainfall is approximately 394 millimetres (mm) (BOM, 2019).

4
Warrawoona Gold Project – Soil Assessment
Figure 2 Mean monthly rainfall and mean monthly maximum temperature at the Marble Bar weather station
2.3 Geology
2.3.1 Regional Geology The Project is situated within Eastern Pilbara Domain of the Archean Pilbara Craton. The area is dominated by granite-greenstone terrain in which large granitic batholiths are disconnected by synclinally folded volcanic belts with interbedded volcaniclastic and clastic successions. The Archean greenstone terrain is subdivided into two major stratigraphic units, the Warrawoona Group and the Gorge Creek Group (Calidus Resources Ltd).
2.3.2 Local Geology The Klondyke deposit is situated within the Warrawoona Group which is characterised by high-Mg basaltic lavas with lesser tholeiite, andesite, sodic dacite, potassic rhyolite, chert and banded iron formation (BIF). The greenstone belt comprises part of the Warrawoona Syncline which accommodates several quartz lode gold deposits. The deposits are hosted within three main shear zones, namely the Klondyke, Copenhagen and Fielding's Find shear zones.
5
Warrawoona Gold Project – Soil Assessment
Gold mineralisation at Copenhagen is hosted by a sheared high-Ti ultramafic unit sandwiched between two chert layers. The Copenhagen lode is between 10-80 m thick, is strongly sheared and carbonate/silica altered (Calidus Resources Ltd).
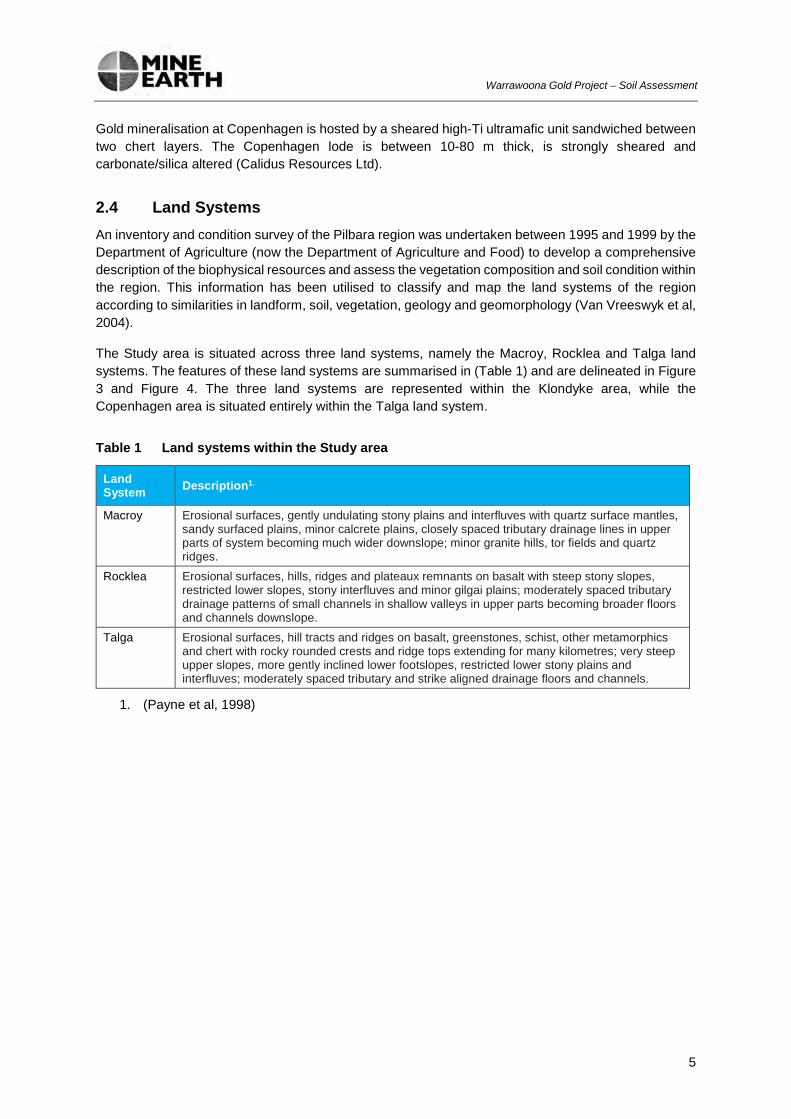
2.4 Land Systems An inventory and condition survey of the Pilbara region was undertaken between 1995 and 1999 by the Department of Agriculture (now the Department of Agriculture and Food) to develop a comprehensive description of the biophysical resources and assess the vegetation composition and soil condition within the region. This information has been utilised to classify and map the land systems of the region according to similarities in landform, soil, vegetation, geology and geomorphology (Van Vreeswyk et al, 2004).
The Study area is situated across three land systems, namely the Macroy, Rocklea and Talga land systems. The features of these land systems are summarised in (Table 1) and are delineated in Figure 3 and Figure 4. The three land systems are represented within the Klondyke area, while the Copenhagen area is situated entirely within the Talga land system.
Table 1 Land systems within the Study area
Land System Description1.
Macroy Erosional surfaces, gently undulating stony plains and interfluves with quartz surface mantles, sandy surfaced plains, minor calcrete plains, closely spaced tributary drainage lines in upper parts of system becoming much wider downslope; minor granite hills, tor fields and quartz ridges.
Rocklea Erosional surfaces, hills, ridges and plateaux remnants on basalt with steep stony slopes, restricted lower slopes, stony interfluves and minor gilgai plains; moderately spaced tributary drainage patterns of small channels in shallow valleys in upper parts becoming broader floors and channels downslope.
Talga Erosional surfaces, hill tracts and ridges on basalt, greenstones, schist, other metamorphics and chert with rocky rounded crests and ridge tops extending for many kilometres; very steep upper slopes, more gently inclined lower footslopes, restricted lower stony plains and interfluves; moderately spaced tributary and strike aligned drainage floors and channels.
1. (Payne et al, 1998)

CORUNNA DOWNS ACCESS
280Tl280Tl
E 45/4622
E 45/4622
E 45/4666
M 45/240
M 45/672
M 45/682
119°49'0"E119°48'0"E
21°1
8'0"
S
21°1
8'0"
S
21°1
9'0"
S
21°1
9'0"
S
Copenhagen Land Systems Figure
3
LEGEND
Study Area Tenement
280Tl: Talga System
´0 0.1 0.2 0.3 0.4 0.5
km
Scale: 1:10,000 @ A3GCS GDA 1994
Job: WAR-1903Date: 4/07/2019Ph: + 61 8 9431 7318www.mineearth.com.auPO Box 404, Fremantle, WA, 6959
C:\GIS\Jobs\Mine Earth\WAR-1903 - Warrawoona Gold Project\F igures\WAR-1903_F02a Land Systems_190704.mxd
COPYRIGHT: THIS DOCUMENT IS AND SHALL REMAIN THE PROPERTY OF MINE EARTH. THIS DOCUMENT MAY ONLY BE USED FOR THE PURPOSE FOR WHICH IT WAS COMMISSIONED AND IN ACCORDANCE W ITH THE TERMS OF ENGAGEMENT. MINE EARTH DOES NOT HOLD ANY RESPONSIBILITY FOR THE MISUSE OF THIS DOCUMENT.
LAND SYSTEMS

CORUNNA DOWNS ACCESS
283Mc283Mc
283Mc283Mc
283Mc283Mc
280Tl280Tl
283Tl283Tl
280Rk280Rk
283Ri283Ri
E 45/3381
E 45/3381
E 45/4533
E 45/4666
E 45/4905 E 45/4906
E 45/5100
L 45/399
L 45/523
M 45/4
M 45/547
M 45/552
M 45/656
M 45/668
M 45/669
M 45/670
M 45/671
P 45/2781
P 45/2980
P 45/3033
P45/3100-S
119°54'0"E119°52'0"E119°50'0"E
21°2
0'0"
S
21°2
0'0"
S
21°2
2'0"
S
21°2
2'0"
S
Klondyke Land Systems Figure
4
LEGENDStudy area Tenement
280Rk, Rocklea System280Tl, Talga System283Mc, Macroy System283Ri, River System
´0 0.3 0.6 0.9 1.2 1.5
km
Scale: 1:30,000 @ A3GCS GDA 1994
Job: WAR-1903Date: 4/07/2019Ph: + 61 8 9431 7318www.mineearth.com.auPO Box 404, Fremantle, WA, 6959
C:\GIS\Jobs\Mine Earth\WAR-1903 - Warrawoona Gold Project\F igures\WAR-1903_F02b Land Systems_190704.mxd
COPYRIGHT: THIS DOCUMENT IS AND SHALL REMAIN THE PROPERTY OF MINE EARTH. THIS DOCUMENT MAY ONLY BE USED FOR THE PURPOSE FOR WHICH IT WAS COMMISSIONED AND IN ACCORDANCE W ITH THE TERMS OF ENGAGEMENT. MINE EARTH DOES NOT HOLD ANY RESPONSIBILITY FOR THE MISUSE OF THIS DOCUMENT.
LAND SYSTEMS
8
Warrawoona Gold Project – Soil Assessment
3 MATERIALS AND METHODS
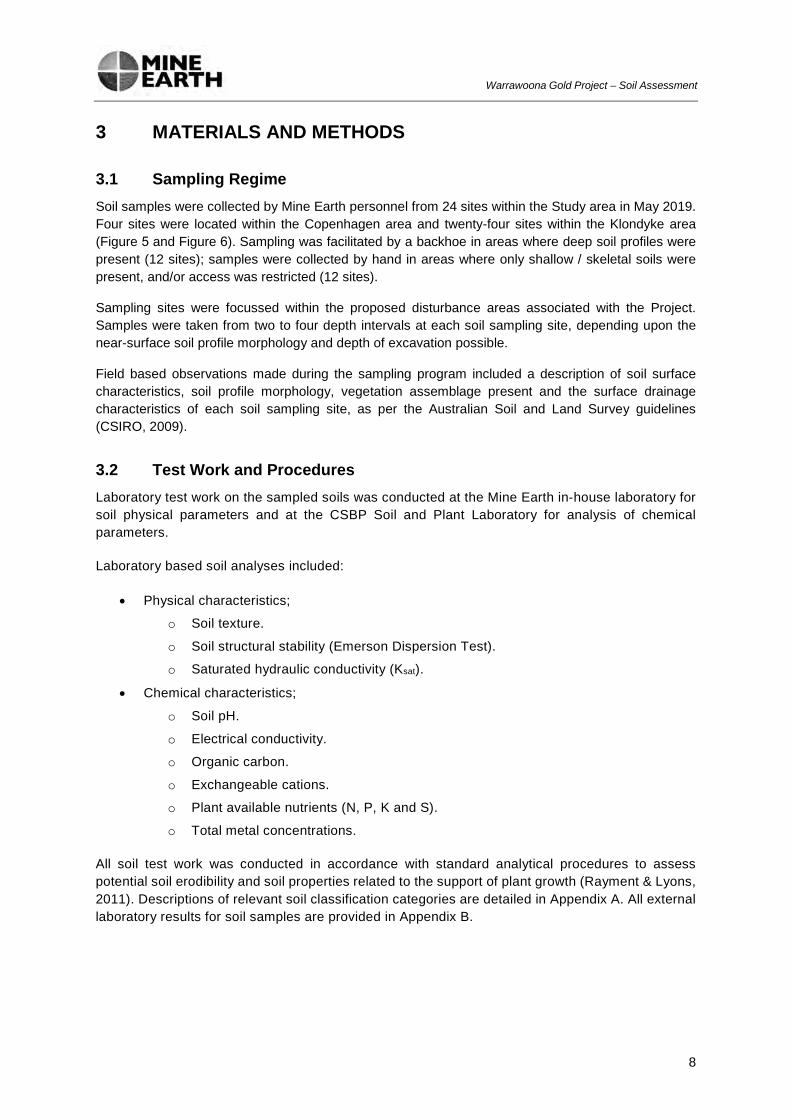
3.1 Sampling Regime Soil samples were collected by Mine Earth personnel from 24 sites within the Study area in May 2019. Four sites were located within the Copenhagen area and twenty-four sites within the Klondyke area (Figure 5 and Figure 6). Sampling was facilitated by a backhoe in areas where deep soil profiles were present (12 sites); samples were collected by hand in areas where only shallow / skeletal soils were present, and/or access was restricted (12 sites).
Sampling sites were focussed within the proposed disturbance areas associated with the Project. Samples were taken from two to four depth intervals at each soil sampling site, depending upon the near-surface soil profile morphology and depth of excavation possible.
Field based observations made during the sampling program included a description of soil surface characteristics, soil profile morphology, vegetation assemblage present and the surface drainage characteristics of each soil sampling site, as per the Australian Soil and Land Survey guidelines (CSIRO, 2009).
3.2 Test Work and Procedures Laboratory test work on the sampled soils was conducted at the Mine Earth in-house laboratory for soil physical parameters and at the CSBP Soil and Plant Laboratory for analysis of chemical parameters.
Laboratory based soil analyses included:
• Physical characteristics;
o Soil texture.
o Soil structural stability (Emerson Dispersion Test).
o Saturated hydraulic conductivity (Ksat).
• Chemical characteristics;
o Soil pH.
o Electrical conductivity.
o Organic carbon.
o Exchangeable cations.
o Plant available nutrients (N, P, K and S).
o Total metal concentrations.
All soil test work was conducted in accordance with standard analytical procedures to assess potential soil erodibility and soil properties related to the support of plant growth (Rayment & Lyons, 2011). Descriptions of relevant soil classification categories are detailed in Appendix A. All external laboratory results for soil samples are provided in Appendix B.

!(
!(!(
!(
CORUNNA DOWNS ACCESS
E 45/4666
M 45/240
M 45/682
Soil 21
Soil 22Soil 23
Soil 24
119°49'30"E119°49'0"E119°48'30"E
21°1
8'0"
S
21°1
8'0"
S
21°1
8'30
"S
21°1
8'30
"S
Copenhagen Soil Sampling Sites Figure
3a
LEGEND Study Area
Tenement!( Soil Sample Site
´0 100 200 300 400
m
Scale: 1:7,500 @ A3GCS GDA 1994
Job: WAR-1903Date: 4/07/2019Ph: + 61 8 9431 7318www.mineearth.com.auPO Box 404, Fremantle, WA, 6959
C:\GIS\Jobs\Mine Earth\WAR-1903 - Warrawoona Gold Project\F igures\WAR-1903_F03a Soil Sampling Sites_190704.mxd
COPYRIGHT: THIS DOCUMENT IS AND SHALL REMAIN THE PROPERTY OF MINE EARTH. THIS DOCUMENT MAY ONLY BE USED FOR THE PURPOSE FOR WHICH IT WAS COMMISSIONED AND IN ACCORDANCE W ITH THE TERMS OF ENGAGEMENT. MINE EARTH DOES NOT HOLD ANY RESPONSIBILITY FOR THE MISUSE OF THIS DOCUMENT.

!(
!(
!(
!(
!(!(
!(
!(
!(!(
!(
!(
!(
!(
!(
!(
!(
!(
!(
!(
CORUNNA DOWNS ACCESS
E 45/3381
E 45/3381
E 45/4533
E 45/4666
E 45/4905 E 45/4906
E 45/5100
L 45/399
L 45/523
M 45/4
M 45/547
M 45/552
M 45/656
M 45/668
M 45/669
M 45/670
M 45/671
P 45/2781
P 45/2980
P 45/3033
P45/3100-S
Soil 1
Soil 14
Soil 11
Soil 13
Soil 8Soil 2
Soil 15
Soil 12
Soil 4Soil 5
Soil 16
Soil 19Soil 18
Soil 17
Soil 9
Soil 10Soil 7
Soil 6Soil 3
Soil 20
119°54'0"E119°52'0"E119°50'0"E
21°2
0'0"
S
21°2
0'0"
S
21°2
2'0"
S
21°2
2'0"
S
Klondyke Soil Sampling Sites Figure
6
LEGEND Study Area
Tenement!( Soil Sample Site
´0 0.3 0.6 0.9 1.2 1.5
km
Scale: 1:30,000 @ A3GCS GDA 1994
Job: WAR-1903Date: 4/07/2019Ph: + 61 8 9431 7318www.mineearth.com.auPO Box 404, Fremantle, WA, 6959
C:\GIS\Jobs\Mine Earth\WAR-1903 - Warrawoona Gold Project\F igures\WAR-1903_F03b Soil Sampling Sites_190704.mxd
COPYRIGHT: THIS DOCUMENT IS AND SHALL REMAIN THE PROPERTY OF MINE EARTH. THIS DOCUMENT MAY ONLY BE USED FOR THE PURPOSE FOR WHICH IT WAS COMMISSIONED AND IN ACCORDANCE W ITH THE TERMS OF ENGAGEMENT. MINE EARTH DOES NOT HOLD ANY RESPONSIBILITY FOR THE MISUSE OF THIS DOCUMENT.

11
Warrawoona Gold Project – Soil Assessment
4 RESULTS AND DISCUSSION The findings of the soil survey and laboratory test work program are presented and discussed in the following sections.
4.1 Sample Site and Soil Profile Descriptions Sampling site and surface soil profile descriptions for the 24 sites within the Study area are presented below.

12
Warrawoona Gold Project – Soil Assessment
Site Reference: Warrawoona Site 1 Datum: GDA 1994 MGA
Zone 50
Site Description: Klondyke area Flat valley floor, adjacent to drainage channel
Easting: 797358
Soil Landform Association: Valley floor Northing: 7638478
Soil profile description:
0-20 cm: Well-structured soil with polyhedral aggregates of moderate strength. Approximately 5% sub-angular to sub-rounded coarse fragments, 5 to 20 mm in size. Plant root abundance classified as ‘few’.
20-100 cm: Well-structured, friable soil with polyhedral aggregates of moderate strength. Soil strength increasing with depth. Approximately 5 to 10% sub-angular to sub-rounded coarse fragments, 5 to 20 mm in size. Plant root abundance classified as ‘few’, decreasing with depth.
>100 cm: Weathered / transitional rock.
Plate 1 Surface soil profile at Site 1
Soil surface: Variable (20 to 90% cover) lag of angular to sub-rounded coarse fragments (ironstone and quartz) at surface, with less than 5% litter cover.
Vegetation: Spinifex, scattered acacia and eucalypt species.
Plate 2 Soil surface / vegetation at Site 1

13
Warrawoona Gold Project – Soil Assessment
Site Reference: Warrawoona Site 2 Datum: GDA 1994 MGA
Zone 50
Site Description: Klondyke area Flat valley floor, adjacent to drainage channel
Easting: 797630
Soil Landform Association: Valley floor Northing: 7637968
Soil profile description:
0-20 cm: Well-structured soil with polyhedral aggregates of moderate strength. Approximately 20% sub-angular to sub-rounded coarse fragments, 5 to 30 mm in size. Plant root abundance classified as ‘few’.
20-110 cm: Well-structured, friable soil with polyhedral aggregates of moderate strength. Approximately 40 to 50% sub-angular to sub-rounded coarse fragments, 5 to 40 mm in size, increasing in abundance with depth. Plant root abundance classified as ‘few’, decreasing with depth.
>110 cm: Weathered / transitional rock.
Plate 3 Surface soil profile at Site 2
Soil surface: Variable (50 to 90% cover) lag of angular to sub-rounded coarse fragments (ironstone and quartz) at surface, with less than 5% litter cover.
Vegetation: Spinifex, sparse acacia and eucalypt species.
Plate 4 Soil surface / vegetation at Site 2

14
Warrawoona Gold Project – Soil Assessment
Site Reference: Warrawoona Site 3 Datum: GDA 1994 MGA
Zone 50
Site Description: Klondyke area, within major drainage channel
Easting: 798171
Soil Landform Association: Drainage channel Northing: 7637980
Soil profile description:
0-20 cm: Single grained coarse sand with sub-angular to sub-rounded and rounded rock fragments 5 to 100 mm in size.
Plate 5 Surface soil at Site 3
Soil surface: Variable particle size distribution reflecting areas of erosion and deposition in drainage channel.
Vegetation: Spinifex, acacia and eucalypt species along edges of drainage channel.
Plate 6 Soil surface / vegetation at Site 3

15
Warrawoona Gold Project – Soil Assessment
Site Reference: Warrawoona Site 4 Datum: GDA 1994 MGA
Zone 50
Site Description: Klondyke area Flat valley floor, adjacent to drainage channel
Easting: 798576
Soil Landform Association: Valley floor Northing: 7637913
Soil profile description:
0-30 cm: Well-structured soil with polyhedral aggregates of moderate strength. Approximately 40% sub-angular to sub-rounded coarse fragments, 5 to 30 mm in size. Plant root abundance classified as ‘few’.
30-110 cm: Moderately well-structured, friable soil with polyhedral aggregates of moderate strength. Approximately 40 to 50% sub-angular to sub-rounded coarse fragments, 5 to 40 mm in size, increasing in abundance with depth. Plant root abundance classified as ‘few’, decreasing with depth.
>110 cm: Weathered / transitional rock
Plate 7 Surface soil profile at Site 4
Soil surface: Weak soil crust over approximately 40% of soil surface. Variable cover (10 - 75% sub-rounded ironstone nodules at surface, with less than 5% litter cover.
Vegetation: Spinifex, sparse acacia and eucalypt species.
Plate 8 Soil surface / vegetation at Site 4

16
Warrawoona Gold Project – Soil Assessment
Site Reference: Warrawoona Site 5 Datum: GDA 1994 MGA
Zone 50
Site Description: Klondyke area Flat valley floor
Easting: 799071
Soil Landform Association: Valley floor Northing: 7637818
Soil profile description:
0-20 cm: Well-structured soil with polyhedral aggregates of moderate strength. Approximately 20% sub-angular to sub-rounded coarse fragments, 5 to 20 mm in size. Plant root abundance classified as ‘few’.
30-90 cm: Variable depth to transitional and competent rock, friable soil with polyhedral aggregates of moderate strength. Approximately 50% sub-angular to sub-rounded coarse fragments, 5 to 40 mm in size, increasing in abundance with depth. Plant root abundance classified as ‘few’, decreasing with depth.
>90 cm: Weathered / transitional rock.
Plate 9 Surface soil profile at Site 5
Soil surface: Weak soil crust over approximately 10% of soil surface. Approximately 75-90% sub-rounded ironstone nodules at surface, with less than 5% litter cover. Some isolated outcropping rock at surface.
Vegetation: Spinifex, sparse acacia and eucalypt species.
Plate 10 Soil surface / vegetation at Site 5

17
Warrawoona Gold Project – Soil Assessment
Site Reference: Warrawoona Site 6 Datum: GDA 1994 MGA
Zone 50
Site Description: Klondyke area, within Klondyke deposit footprint
Easting: 800455
Soil Landform Association: Ridgeline / rocky outcrop Northing: 7637735
Soil profile description:
0-10 cm (variable): Shallow, skeletal surface soil with approximately 50% angular and sub-angular coarse fragments, 5 to 100 mm in size. Plant root abundance classified as ‘few’.
>10 cm: Predominantly single grained weathered regolith within 75 to 90% (variable) partially weathered to competent rock. Plant root abundance classified as ‘few’.
Plate 11 Surface soil profile at Site 6
Soil surface: Approximately 90% sub-angular coarse fragments at surface, outcropping rock prevalent over approximately 40% of surface.
Vegetation: Spinifex.
Plate 12 Soil surface / vegetation at Site 6

18
Warrawoona Gold Project – Soil Assessment
Site Reference: Warrawoona Site 7 Datum: GDA 1994 MGA
Zone 50
Site Description: Klondyke area, within Klondyke deposit footprint
Easting: 800802
Soil Landform Association: Ridgeline / rocky outcrop Northing: 7637601
Soil profile description:
0-20 cm (variable): Shallow, skeletal surface soil with approximately 60% angular and sub-angular coarse fragments, 5 to 300 mm in size. Plant root abundance classified as ‘few’.
>20 cm: Predominantly single grained weathered regolith within 75 to 90% (variable) partially weathered to competent rock. Plant root abundance classified as ‘few’.
Plate 13 Surface soil at Site 7
Soil surface: Approximately 90% angular to sub-angular coarse fragments at surface, outcropping rock prevalent over approximately 30 - 40% of surface.
Vegetation: Spinifex.
Plate 14 Soil surface / vegetation at Site 7

19
Warrawoona Gold Project – Soil Assessment
Site Reference: Warrawoona Site 8 Datum: GDA 1994 MGA
Zone 50
Site Description: Klondyke area, within Klondyke deposit footprint
Easting: 799871
Soil Landform Association: Ridgeline / rocky outcrop Northing: 7637872
Soil profile description:
0-10 cm (variable): Shallow, skeletal surface soil with approximately 60% angular and sub-angular coarse fragments, 5 to 300 mm in size. Plant root abundance classified as ‘few’.
>10 cm: Single grained weathered regolith within 75 to 90% (variable) partially weathered to competent rock. Plant root abundance classified as ‘few’.
Plate 15 Surface soil at Site 8
Soil surface: Approximately 90% angular to sub-angular coarse fragments at surface, outcropping rock prevalent over approximately 25% of surface.
Vegetation: Spinifex.
Plate 16 Soil surface / vegetation at Site 8

20
Warrawoona Gold Project – Soil Assessment
Site Reference: Warrawoona Site 9 Datum: GDA 1994 MGA
Zone 50
Site Description: Klondyke area, within Klondyke deposit footprint
Easting: 800209
Soil Landform Association: Ridgeline / rocky outcrop Northing: 7637537
Soil profile description:
0-10 cm (variable): Shallow, skeletal surface soil with approximately 75% angular and sub-angular coarse fragments, 5 to 300 mm in size. Plant root abundance classified as ‘few’.
>10 cm: Single grained weathered regolith within 75 to 90% (variable) partially weathered to competent rock. Plant root abundance classified as ‘few’.
Plate 17 Surface soil at Site 9
Soil surface: Approximately 90% sub-angular coarse fragments at surface, outcropping rock prevalent over approximately 25% of surface.
Vegetation: Spinifex.
Plate 18 Soil surface / vegetation at Site 9

21
Warrawoona Gold Project – Soil Assessment
Site Reference: Warrawoona Site 10 Datum: GDA 1994 MGA
Zone 50
Site Description: Klondyke area, within Klondyke deposit footprint
Easting: 800924
Soil Landform Association: Ridgeline / rocky outcrop Northing: 7637240
Soil profile description:
0-10 cm (variable): Shallow, skeletal surface soil with approximately 60% angular and sub-angular coarse fragments, 5 to 200 mm in size. Plant root abundance classified as ‘few’.
>10 cm: Single grained weathered regolith within approximately 60% (variable) partially weathered to competent rock. Plant root abundance classified as ‘few’.
Plate 19 Surface soil profile at Site 10
Soil surface: Approximately 75 to 90% sub-angular coarse fragments at surface, outcropping rock prevalent over approximately 30% of surface.
Vegetation: Spinifex.
Plate 20 Soil surface / vegetation at Site 10

22
Warrawoona Gold Project – Soil Assessment
Site Reference: Warrawoona Site 11 Datum: GDA 1994 MGA
Zone 50
Site Description: Klondyke area, within Klondyke deposit footprint
Easting: 799768
Soil Landform Association: Ridgeline / rocky outcrop Northing: 7637581
Soil profile description:
0-10 cm (variable): Shallow, skeletal surface soil with approximately 75% angular and sub-angular coarse fragments, 5 to 100 mm in size. Plant root abundance classified as ‘few’.
>10 cm: Single grained weathered regolith within approximately 75% (variable) partially weathered to competent rock. Plant root abundance classified as ‘few’.
Plate 21 Surface soil at Site 11
Soil surface: Approximately 90% sub-angular coarse fragments at surface, outcropping rock prevalent over approximately 25% of surface.
Vegetation: Spinifex.
Plate 22 Soil surface / vegetation at Site 11

23
Warrawoona Gold Project – Soil Assessment
Site Reference: Warrawoona Site 12 Datum: GDA 1994 MGA
Zone 50
Site Description: Klondyke area Flat valley floor
Easting: 799969
Soil Landform Association: Valley floor Northing: 7637300
Soil profile description:
0-20 cm: Well-structured soil with polyhedral aggregates of moderate strength. Approximately 25% sub-angular to sub-rounded coarse fragments, 5 to 30 mm in size. Plant root abundance classified as ‘few’.
20-100 cm: Well-structured, friable soil with polyhedral aggregates of moderate strength. Approximately 40 to 50% sub-angular to sub-rounded coarse fragments, 5 to 40 mm in size, increasing in abundance with depth. Plant root abundance classified as ‘few’, decreasing with depth.
>100 cm: Weathered / transitional rock.
Plate 23 Surface soil profile at Site 12
Soil surface: Weak soil crust over approximately 25% of soil surface. Variable cover (20 to 60% sub-rounded ironstone nodules at surface, with less than 5% litter cover.
Vegetation: Spinifex, sparse acacia and eucalypt species.
Plate 24 Soil surface / vegetation at Site 12

24
Warrawoona Gold Project – Soil Assessment
Site Reference: Warrawoona Site 13 Datum: GDA 1994 MGA
Zone 50
Site Description: Klondyke area Mid-slope of small hill
Easting: 800457
Soil Landform Association: Low hills / rises Northing: 7636928
Soil profile description:
0-10 cm (variable): Shallow, skeletal surface soil with approximately 60% angular and sub-angular coarse fragments, 5 to 100 mm in size. Plant root abundance classified as ‘few’.
>10 cm: Single grained weathered regolith within approximately 60% (variable) partially weathered to competent rock. Plant root abundance classified as ‘few’.
Plate 25 Surface soil at Site 13
Soil surface: Approximately 90% sub-angular coarse fragments at surface, outcropping rock prevalent over approximately 20% of surface.
Vegetation: Spinifex.
Plate 26 Soil surface / vegetation at Site 13

25
Warrawoona Gold Project – Soil Assessment
Site Reference: Warrawoona Site 14 Datum: GDA 1994 MGA
Zone 50
Site Description: Klondyke area Eastern end of Study area
Easting: 800944
Soil Landform Association: Valley floor Northing: 7637012
Soil profile description:
0-20 cm: Well-structured soil with polyhedral aggregates of moderate strength. Approximately 30% sub-angular to sub-rounded coarse fragments, 5 to 30 mm in size. Plant root abundance classified as ‘few’.
20-60 cm: Well-structured, friable soil with polyhedral aggregates of moderate strength. Approximately 30% sub-angular to sub-rounded coarse fragments, 5 to 50 mm in size, increasing in abundance with depth. Plant root abundance classified as ‘few’, decreasing with depth.
>60 cm: Weathered transitional rock.
Plate 27 Surface soil profile at Site 14
Soil surface: Approximately 90% cover of sub-angular and sub-rounded quartz and ironstone coarse fragments at surface.
Vegetation: Spinifex, sparse acacia and eucalypt species.
Plate 28 Soil surface / vegetation at Site 14

26
Warrawoona Gold Project – Soil Assessment
Site Reference: Warrawoona Site 15 Datum: GDA 1994 MGA
Zone 50
Site Description: Klondyke area Lower slope
Easting: 801400
Soil Landform Association: Low hills / rises Northing: 7636803
Soil profile description:
0-20 cm (variable): Shallow, skeletal surface soil with approximately 80% angular and sub-angular coarse fragments, 5 to 50 mm in size. Plant root abundance classified as ‘few’.
>20 cm: Single grained weathered regolith within approximately 80% (variable) partially weathered to competent rock. Plant root abundance classified as ‘few’, decreasing in abundance with depth.
Plate 29 Surface soil profile at Site 15
Soil surface: Approximately 90% cover of sub-angular and sub-rounded quartz and ironstone coarse fragments at surface.
Vegetation: Spinifex, sparse acacia and eucalypt species.
Plate 30 Soil surface / vegetation at Site 15

27
Warrawoona Gold Project – Soil Assessment
Site Reference: Warrawoona Site 16 Datum: GDA 1994 MGA
Zone 50
Site Description: Klondyke area Lower slope
Easting: 800554
Soil Landform Association: Low hills / rises Northing: 7636701
Soil profile description:
0-20 cm (variable): Shallow, skeletal surface soil with approximately 75% angular and sub-angular coarse fragments, 5 to 50 mm in size. Plant root abundance classified as ‘few’.
>20 cm: Single grained weathered regolith within approximately 80% (variable) partially weathered to competent rock. Plant root abundance classified as ‘few’, decreasing in abundance with depth.
Plate 31 Surface soil at Site 16
Soil surface: Approximately 90% cover of sub-angular and sub-rounded ironstone coarse fragments at surface.
Vegetation: Spinifex, sparse acacia species.
Plate 32 Soil surface / vegetation at Site 16

28
Warrawoona Gold Project – Soil Assessment
Site Reference: Warrawoona Site 17 Datum: GDA 1994 MGA
Zone 50
Site Description: Southern section of Klondyke Study area. Flood plain.
Easting: 794804
Soil Landform Association: Sandplain / stony flats Northing: 7637026
Soil profile description:
0-20 cm: Well-structured soil with polyhedral aggregates of weak strength. Approximately 5% sub-angular to sub-rounded coarse fragments, 5 to 10 mm in size. Plant root abundance classified as ‘few’.
20-110 cm: Massive soil structure with strong consistence. Approximately 5% sub-angular coarse fragments, 5 to 10 mm in size, increasing in abundance with depth. Plant root abundance classified as ‘few’, decreasing with depth.
>110 cm: Weathered / transitional rock.
Plate 33 Surface soil profile at Site 17
Soil surface: Loose, sandy surface with approximately 5 to 10% cover of sub-angular coarse fragments at surface. Less than 10% litter cover.
Vegetation: Spinifex, sparse acacia species.
Plate 34 Soil surface / vegetation at Site 17

29
Warrawoona Gold Project – Soil Assessment
Site Reference: Warrawoona Site 18 Datum: GDA 1994 MGA
Zone 50
Site Description: Southern section of Klondyke Study area. Stoney flats.
Easting: 797960
Soil Landform Association: Sandplain / stony flats Northing: 7635839
Soil profile description:
0-20 cm: Well-structured surface soil with polyhedral aggregates of weak strength. Approximately 20% sub-angular to sub-rounded coarse fragments, 5 to 30 mm in size. Plant root abundance classified as ‘few’.
>20 cm: Massive soil structure with strong consistence. Approximately 30% sub-angular to sub-rounded coarse fragments, 5 to 40 mm in size, increasing in abundance with depth.
Plate 35 Surface soil at Site 18
Soil surface: Weak soil crust over approximately 30% of soil surface. Approximately 50% (variable) sub-rounded to sub-angular coarse fragments at surface, with less than 5% litter cover.
Vegetation: Spinifex, sparse acacia species.
Plate 36 Soil surface / vegetation at Site 18

30
Warrawoona Gold Project – Soil Assessment
Site Reference: Warrawoona Site 19 Datum: GDA 1994 MGA
Zone 50
Site Description: Southern section of Klondyke Study area. Stony rise.
Easting: 799178
Soil Landform Association: Sandplain / stony flats Northing: 7635509
Soil profile description:
0-20 cm: Well-structured surface soil with polyhedral aggregates of weak strength. Approximately 30% sub-angular to sub-rounded coarse fragments, 5 to 40 mm in size. Plant root abundance classified as ‘few’.
>20 cm: Massive soil structure with strong consistence. Approximately 40% sub-angular to sub-rounded coarse fragments, 5 to 50 mm in size, increasing in abundance with depth.
Plate 37 Surface soil at Site 19
Soil surface: Weak soil crust over approximately 20% of soil surface. Approximately 60% sub-rounded ironstone nodules at surface, with less than 5% litter cover.
Vegetation: Spinifex, sparse acacia and eucalypt species.
Plate 38 Soil surface / vegetation at Site 19

31
Warrawoona Gold Project – Soil Assessment
Site Reference: Warrawoona Site 20 Datum: GDA 1994 MGA
Zone 50
Site Description: Southern section of Klondyke Study area.
Easting: 795411
Soil Landform Association: Drainage channel Northing: 7635738
Soil profile description:
0-20 cm: Single grained coarse sand with sub-angular to sub-rounded and rounded rock fragments 5 to 10 mm in size.
Plate 39 Surface soil at Site 20
Soil surface: Variable particle size distribution reflecting areas of erosion and deposition in drainage channel. Primarily loose soil surface.
Vegetation: Spinifex, sparse acacia species.
Plate 40 Soil surface / vegetation at Site 20

32
Warrawoona Gold Project – Soil Assessment
Site Reference: Warrawoona Site 21 Datum: GDA 1994 MGA
Zone 50
Site Description: Copenhagen deposit area. West of historic pit
Easting: 791905
Soil Landform Association: Low hills / rises Northing: 7641320
Soil profile description:
0-20 cm (variable): Shallow, skeletal surface soil with approximately 60% angular and sub-angular coarse fragments, 5 to 50 mm in size. Plant root abundance classified as ‘few’.
20-70 cm: Single grained weathered regolith within approximately 80% (variable) partially weathered to competent rock. Competent rock increasing with depth. Plant root abundance classified as ‘few’, decreasing in abundance with depth.
Plate 41 Surface soil profile at Site 21
Soil surface: Approximately 75% sub-angular and sub-rounded coarse fragments at surface, outcropping rock prevalent over approximately 10% of surface.
Vegetation: Spinifex, sparse acacia and eucalypt species.
Plate 42 Soil surface / vegetation at Site 21

33
Warrawoona Gold Project – Soil Assessment
Site Reference: Warrawoona Site 22 Datum: GDA 1994 MGA
Zone 50
Site Description: Copenhagen deposit area. West of historic pit
Easting: 791885
Soil Landform Association: Northing: 7641251
Soil profile description:
0-15 cm: Moderately well-structured surface soil with polyhedral aggregates of weak strength. Approximately 30% sub-angular to sub-rounded coarse fragments, 5 to 40 mm in size. Plant root abundance classified as ‘few’.
15-90 cm: Massive soil structure with approximately 40% sub-rounded calcareous coarse fragments, 5 to 75 mm in size, increasing in abundance with depth.
Plate 43 Surface soil profile at Site 22
Soil surface: Approximately 90% sub-angular and sub-rounded coarse fragments at surface, outcropping rock prevalent over approximately 10% of surface.
Vegetation: Spinifex, sparse acacia and eucalypt species.
Plate 44 Soil surface / vegetation at Site 22

34
Warrawoona Gold Project – Soil Assessment
Site Reference: Warrawoona Site 23 Datum: GDA 1994 MGA
Zone 50
Site Description: Copenhagen deposit area. South of drainage line / historic pit
Easting: 791647
Soil Landform Association: Low hills / rises Northing: 7641316
Soil profile description:
0-15 cm: Moderately well-structured surface soil with polyhedral aggregates of weak strength. Approximately 30% sub-angular to sub-rounded coarse fragments, 5 to 40 mm in size. Plant root abundance classified as ‘few’.
15-100 cm: Massive soil structure with approximately 60% sub-rounded to subangular calcareous coarse fragments, 5 to 75 mm in size, increasing in abundance with depth.
Plate 45 Surface soil profile at Site 23
Soil surface: Approximately 90% sub-angular and sub-rounded coarse fragments at surface, outcropping rock prevalent over approximately 10% of surface.
Vegetation: Spinifex, sparse acacia and eucalypt species.
Plate 46 Soil surface / vegetation at Site 23

35
Warrawoona Gold Project – Soil Assessment
Site Reference: Warrawoona Site 24 Datum: GDA 1994 MGA
Zone 50
Site Description: Copenhagen deposit area. Adjacent to minor drainage channel. West of historic waste landform
Easting: 791463
Soil-Landform Association: Valley floor Northing: 7641670
Soil profile description:
0-25 cm: Moderately well-structured surface soil with polyhedral aggregates of weak strength. Approximately 20% sub-angular to sub-rounded coarse fragments, 5 to 30 mm in size. Plant root abundance classified as ‘few’.
25-100 cm: Predominantly massive structure with carbonate mottles. Approximately 20% sub-rounded to sub-angular coarse fragments, 5 to 20 mm in size, increasing in abundance with depth. Plant root abundance classified as ‘few’.
Fractured / weathered and competent rock beyond approximately 100 cm depth.
Plate 47 Surface soil profile at Site 24
Soil surface: Weak soil crust over approximately 60% of soil surface. Approximately 10% sub-rounded ironstone nodules at surface, with approximately 30% litter cover.
Vegetation: Spinifex, sparse acacia and eucalypt species.
Plate 48 Soil surface / vegetation at Site 24

36
Warrawoona Gold Project – Soil Assessment
4.2 Soil Physical Characteristics The physical characteristics of the surface soils within the Study area, as determined by the field investigation and laboratory analysis of collected samples, are discussed in the following sections.
4.2.1 Soil Profile Morphology The surface soil profiles within the Study area exhibited a substantial degree of variation in terms of morphological characteristics. The soil profiles within the Study area were grouped into five soil-landform associations, namely ‘drainage channel’, ‘valley floor’, ‘sandplain / stony flats’, ‘low hills / rises’ and ‘ridgelines / rocky outcrops’. The landform and soil profiles within these soil associations were typically characterised as follows:
• Drainage channels;
○ Distinct incised channels through valley floor.
○ Variable particle size distribution reflecting areas of erosion and deposition in drainage channel. Typically, coarse sands comprise the bulk of the soil sized fraction.
• Valley floor;
○ Flat, depositional areas adjacent to drainage channels at low point in local landscape.
○ Deep soils (in comparison to surrounding soil profiles) to depths >1 m.
○ Well structured ‘topsoil’ layer to approximately 20 cm depth.
○ Relatively low coarse fraction (>2 mm).
• Sandplain / stony flats;
○ Flat depositional plains in southern part of Study area.
○ Deep soil profiles with well structured ‘topsoil’ layer to approximately 15-20 cm depth.
○ Typically, low coarse fraction through soil profile (apart from stony rises).
• Low hills / rises;
○ Low undulating hills, minor outcropping rock in some areas.
○ Shallow surface soils (variable, approximately 15-20 cm) over fractured / weathered and competent rock.
○ High percentage of competent rock fragments through the surface soil profile.
• Ridgelines / rocky outcrops;
○ Shallow / skeletal soils over fractured / weathered and competent rock.
○ Outcropping rock present at the surface (approximately 20% cover).
○ High percentage of competent rock fragments through the surface soil profile.
4.2.2 Soil Texture Soil texture describes the proportions of sand, silt and clay (the particle size distribution) within the <2 mm fraction of a soil. The particle size distribution and resulting textural class of a soil is an important factor influencing most physical, and many chemical and biological, properties. Soil structure, water holding capacity, hydraulic conductivity, soil strength, fertility, erodibility and susceptibility to compaction are some of the factors closely linked to the texture of a soil material.
There were a narrow range of particle size distributions exhibited throughout the Study area, with soil textures ranging from ‘loamy sand’ (approximately 5% clay) to ‘sandy clay loam’ (approximately 20 to

37
Warrawoona Gold Project – Soil Assessment
25% clay) (Table 2). There was typical only a minor change observed in soil texture from the surface to the maximum sampling depth at each location.
As would be expected, samples collected from low in the landscape (e.g. valley floor soils) were typically finer grained with a slightly higher clay content than those soils from higher in the landscape. Soil texture within the drainage lines was variable. with some areas comprised of more sand dominant soils, and / or finer textured soils within depositional areas of the drainage lines.
4.2.3 Soil Structure Soil structure describes the arrangement of solid particles and void space in a soil. It is an important factor influencing the ability of soil to support plant growth, store and transmit water and resist erosional processes. A well-structured soil is one with a range of different sized aggregates; with component particles bound together to give a range of pore sizes facilitating root growth and the transfer of air and water.
Soil structure can be influenced by the particle size distribution, chemical composition and organic matter content of a soil. Soil structure is often affected by root growth, vehicle compaction and, with respect to reconstructed soil profiles, the methods of soil handling and deposition. When a soil material is disturbed, the breakdown of aggregates into primary particles can lead to structural decline (Moore, 1998). This can result in hard-setting and crusting at the soil surface and a ‘massive’ soil structure at depth, potentially reducing the ability of seeds to germinate, roots to penetrate the soil matrix and water to infiltrate to the root zone.
The structure of the surface soils within the Study area was relatively consistent, with the topsoil materials at most of the sampling locations recording moderately to well-structured soils with weak to moderate aggregation. Soil structure typically decreased with depth to massive or single grained soils beyond approximately 20 cm depth.
4.2.4 Structural Stability The structural stability of a soil and its susceptibility to structural decline is complex and depends on the net effect of several properties, including the amount and type of clay present, organic matter content, soil chemistry and the nature of disturbance. Soil aggregates that slake and, particularly those that disperse, indicate a weak soil structure that is easily degraded. These soils can be problematic when used as a rehabilitation medium, particularly if left exposed at the surface.
The Emerson Aggregate Test identifies the potential slaking and dispersive properties of soil aggregates. The dispersion test identifies the properties of the soil materials under a worst-case scenario, where severe stress is applied to the soil material. Generally, samples allocated into Emerson Classes 1 and 2 are those most likely to exhibit dispersion of the clay sized fraction and therefore be the most problematic.
The majority of surface soils from the Study area were identified as either Emerson Class 3b (slaking, remoulded soil partially dispersed) or Emerson Class 6 (slaking, carbonates / gypsum absent, soil:water suspension remains flocculated) (Table 2). These results indicate that the soils are not prone to dispersion of the clay fraction in their natural state, but, in the case of the Class 3b soils, may exhibit dispersion following severe disturbance (e.g. earthworks). Care should be taken to minimise the handling of these materials where possible, particularly when wet.
Those soils classified at Emerson Class 6 exhibit no dispersion of the clay fraction and are considered structurally stable.

38
Warrawoona Gold Project – Soil Assessment
Table 2 Soil texture and Emerson Test Class for selected soil samples
Site # Depth (cm)
Soil-landform association
Soil texture (< 2 mm soil fraction)
Emerson Test Class
Site 1 0-5
Valley floor Loamy sand 3b
40-50 Sandy loam 3b
Site 5 0-5
Valley floor Loamy sand 3b
40-50 Sandy loam 3b
Site 7 0-5
Ridgeline / rocky outcrop Loamy sand 6
10-20 Loamy sand 6
Site 9 0-5
Ridgeline / rocky outcrop Loamy sand 6
10-20 Loamy sand 6
Site 12 0-5
Valley floor Loamy sand 3b
40-50 Sandy loam 3b Site 13 0-5 Low hills / rises Loamy sand 6
Site 14 0-5
Valley floor Loamy sand 6
40-50 Sandy loam 3b
Site 16 0-5
Low hills / rises Loamy sand 6
10-20 Loamy sand 6
Site 17 0-5
Sandplain / stony flats Sandy loam 6
40-50 Sandy clay loam 3b Site 18 0-5 Sandplain / stony flats Loamy sand 6 Site 19 0-5 Sandplain / stony flats Loamy sand 3b Site 21 0-5 Low hills / rises Sandy loam 6
Site 22 0-5
Low hills / rises Loamy sand 6
40-50 Sandy loam 6
Site 23 0-5
Low hills / rises Loamy sand 6
40-50 Sandy clay loam 4
Site 24 0-5
Valley floor Sandy loam 6
40-50 Sandy clay loam 4
4.2.5 Hydraulic conductivity Hydraulic conductivity (Ksat) refers to the saturated permeability of soil, or the ability of water to infiltrate and drain through the soil matrix, and is dependent on soil properties such as texture and structure (Moore, 1998). Freely draining soils with high Ksat values will generally be less susceptible to surface runoff and erosion. Slow draining soils with low Ksat values, are more likely to experience waterlogging, increased surface runoff and erosion.
Saturated hydraulic conductivity was determined for selected soil samples from the Study area. Drainage classes were determined for each sample according to their Ksat (Hunt, N and Gilkes, R, 1992) (Table 3). Average Ksat values for each soil-landform association are presented in Figure 7.
The drainage class of the samples tested ranged between ‘moderate’ and ‘rapid’ (Table 3 and Figure 7). As would be expected, the coarse textured soils from within the drainage lines recorded the highest hydraulic conductivity. There was typically a slight decrease in the hydraulic conductivity of soils with depth through the soil profiles corresponding to the small increases in the amount of clay present in the <2 mm sized soil fraction of the materials.

39
Warrawoona Gold Project – Soil Assessment
The soils from the Study area are considered to be relatively free-draining, however the Ksat values may decrease if the soils are compacted during salvage and rehabilitation operations.
Table 3 Saturated hydraulic conductivity (Ksat) for selected soils
Site # Depth (cm) Soil-landform association Ksat (mm/hr) Drainage Class 1.
Site 1 0-5
Valley floor 46.1 Moderate
40-50 26.6 Moderate
Site 5 0-5
Valley floor 57.7 Moderate
40-50 41.6 Moderate
Site 7 0-5
Ridgeline / rocky outcrop 48.3 Moderate
10-20 35.6 Moderate
Site 9 0-5
Ridgeline / rocky outcrop 53.1 Moderate
10-20 29.7 Moderate
Site 12 0-5
Valley floor 50.8 Moderate
40-50 42.4 Moderate Site 13 0-5 Low hills / rises 51.8 Moderate
Site 14 0-5
Valley floor 43.3 Moderate
40-50 34.9 Moderate Site 16 0-5 Low hills / rises 52.4 Moderate Site 17 0-5 Sandplain / stony flats 65.2 Moderately rapid Site 18 0-5 Sandplain / stony flats 77.7 Moderately rapid Site 19 0-5 Sandplain / stony flats 67.4 Moderately rapid Site 20 0-5 Drainage channel 154.9 Rapid Site 22 0-5 Low hills / rises 59.9 Moderate Site 23 0-5 Low hills / rises 47.1 Moderate
Site 24 0-5
Valley floor 36.7 Moderate
40-50 26.7 Moderate
1. (Hunt, N and Gilkes, R, 1992)

40
Warrawoona Gold Project – Soil Assessment
Figure 7 Average Ksat values (mm/hr) for topsoil materials (0-5cm sample) grouped into soil-landform associations.
4.3 Soil Chemical Characteristics
4.3.1 Soil pH and Electrical Conductivity Soil pH (H2O) measures the acidity or alkalinity of the soil in relation to suitability for plant growth. Ratings for soil pH are based on the Land Evaluation Standards for Land Resource Mapping categories (van Gool, 2005).
Soil pH (H2O) showed substantial variation between and within the various soil-landform associations / sampling locations within the Study area, ranging from 6.3 (classified as ‘slightly acidic’) for the surface of a ‘sandplain / stony rise’ sample to 9.2 (‘strongly alkaline’) for one of the valley floor samples at 90-100 cm depth (Figure 4). On average, the soils were typically pH neutral to moderately alkaline, with a relative consistency in pH through the soil profile (Figure 5).

41
Warrawoona Gold Project – Soil Assessment
Figure 8 Individual and average pH (H2O) of soils with depth for each soil-landform association
Electrical conductivity (EC) is a measurement of the soluble salts in soils or water. Soil salinity results from natural processes of landscape evolution, hydrological processes and rainfall (Hunt, N and Gilkes, R, 1992). The EC of the soils from the Study area ranged between 0.010 dS/m (non-saline) 4.08 dS/m (extremely saline) based on the standard USDA and CSIRO electrical conductivity categories (Appendix A).
While there was a range of soil salinities measured across the Study area, the majority of the soil samples were classed as either ‘non- saline’ (< 0.17 dS/m) or ‘slightly saline’ (0.17 to 0.33 dS/m) (Figure 8). The most saline sample, which was collected from the ‘ridgeline / rocky outcrop’ at Klondyke, was unusually high in comparison to other values recorded for similar soils in the Study area and may have been impacted by nearby drilling activities.

42
Warrawoona Gold Project – Soil Assessment
Figure 9 Individual and average EC (dS/m) of soils with depth for each soil-landform association
4.3.2 Soil Organic Matter The organic matter content of soil is an important factor influencing many physical, chemical and biological soil characteristics. Directly derived from plants and animals, its functions in soil include supporting the micro and macro fauna and flora populations in the soil, increasing the water retention capacity, buffering pH and improving soil structure.
The organic matter content of the soils within the Study area was determined as a measure of the soil organic carbon percentage (SOC%). The SOC% of the soil samples was low, as is typical of most highly weathered soils in the Pilbara, ranging between 0.01% and 1.01% (Figure 9). As would be expected, the coarse textured soils from the ‘drainage channels’ recorded the lowest concentration of SOC. On average, there was typically a small decrease on SOC% with depth through the soil profiles (Figure 9).

43
Warrawoona Gold Project – Soil Assessment
Figure 10 Individual and average Organic C concentration (%) of soils with depth for each soil-
landform association
4.3.3 Exchangeable Cations and Exchangeable Sodium Percentage Exchangeable cations, held on clay surfaces and within organic matter, are an important source of soil fertility and can influence the physical properties of soil. Generally, if cations such as Ca2+, Mg2+ and K+ are dominant on the clay exchange surfaces, the soil will typically display increased physical structure and stability, leading to increased aeration, drainage and root growth (Moore, 1998). If Na cations (Na+) are dominant on exchange surfaces and the exchangeable sodium percentage (ESP) exceeds more than 6% of the total exchangeable cations, then the soil is considered to be sodic, which can lead to poor physical properties (i.e. dispersion, hardsetting and erosion in clay-rich soils). ESP values over 15% are classified as highly sodic.
Exchangeable cation concentration, effective cation exchange capacity (eCEC) and exchangeable sodium percentage (ESP) results were variable across the various soil-landform associations (Table 4). The exchangeable cations and eCEC were generally very low, reflecting the highly weathered and typically coarse textured (i.e. low clay contents) nature of the soils present. The ESP results indicate that there is generally a low risk of clay dispersion.
Although several samples recorded a very high sodicity values, is should be noted that the eCEC for some of these samples was very low (Table 4). This indicates that the influence of the high percentage of sodium ions on clay dispersion is not likely to be severe. This is evidenced by the Emerson Test results for the relevant samples, with an Emerson Test Class of 3b, indicating only partial clay dispersion upon severe disturbance.

44
Warrawoona Gold Project – Soil Assessment
Table 4 Exchangeable cations and ESP of selected samples. Shading of ESP values denotes
non-sodic, sodic and highly sodic classifications
Site # Depth (cm)
Soil-landform association
Exchangeable cations (meq/100g) eCEC (meq/100g)
ESP (%) Ca Mg K Na
Site 1 0-5
Valley floor 0.05 0.31 0.04 0.23 0.63 36.5
40-50 0.95 2.28 0.02 6.07 9.32 65.1
Site 5 0-5
Valley floor 0.11 0.32 0.08 0.03 0.54 5.6
40-50 0.65 0.79 0.05 0.03 1.52 2.0
Site 7 0-5 Ridgeline / rocky
outcrop 0.36 0.57 0.12 0.06 1.11 5.4
10-20 0.77 0.63 0.01 0.85 2.26 37.6
Site 9 0-5 Ridgeline / rocky
outcrop 7.65 9.67 0.07 15.6 32.99 47.3
10-20 0.75 0.95 0.05 2.15 3.90 55.1
Site 12 0-5
Valley floor 0.15 0.20 0.05 0.01 0.41 2.4
40-50 0.22 0.51 0.03 0.02 0.78 2.6 Site 13 0-5 Low hills / rises 0.14 0.34 0.03 0.02 0.53 3.8
Site 14 0-5
Valley floor 0.09 0.27 0.06 0.02 0.44 4.5
40-50 0.43 0.50 0.03 0.07 1.03 6.8
Site 16 0-5
Low hills / rises 0.10 0.28 0.06 0.01 0.45 2.2
10-20 0.12 0.34 0.04 0.01 0.51 2.0
Site 17 0-5 Sandplain / stony
flats 0.04 0.10 0.06 0.005 0.20 2.4
40-50 0.28 0.63 0.23 0.04 1.18 3.4
Site 18 0-5 Sandplain / stony flats 0.03 0.18 0.1 0.04 1.18 3.4
Site 19 0-5 Sandplain / stony flats 0.07 1.05 0.12 3.00 4.24 70.8
Site 21 0-5 Low hills / rises 0.22 0.21 0.03 0.03 0.49 6.1
Site 22 0-5
Low hills / rises 0.32 0.58 0.05 0.01 0.96 1.0
40-50 0.52 0.65 0.01 0.04 1.22 3.3
Site 23 0-5
Low hills / rises 0.44 0.27 0.04 0.005 0.75 0.7
40-50 0.80 0.48 0.01 0.02 1.31 1.5
Site 24 0-5
Valley floor 0.35 .048 0.05 0.01 0.89 1.1
40-50 0.69 0.81 0.01 0.08 1.59 5.0
4.3.4 Soil Nutrients The most important macro-nutrients for plant growth are nitrogen (N), phosphorus (P), potassium (K), and sulphur (S). These nutrients are largely derived from the soil mineral component and organic matter. Native plant species have several physiological adaptations that enable them to be productive in areas where the supply of macronutrients is limited. There is limited information available which details the specific nutritional requirements for native plant species in the semiarid zone of WA. Therefore, the use of analogue sites is an effective way to baseline the soil nutritional requirements of native plant species within the Study area.
The plant-available nitrogen concentrations of the soils from the Study area were variable, but generally very low ranging from <1 (below detection limit) to 31 mg/kg nitrate (Figure 10) and from <1 (below

45
Warrawoona Gold Project – Soil Assessment
detection limit) to 4 mg/kg ammonium (Figure 9). There was no apparent relationship between plant-available nitrogen concentrations and soil-landform association, or sample depth.
Figure 11 Individual and average Nitrate-N concentration (mg/kg) of soils with depth for each
soil-landform association
Figure 12 Individual and average Ammonium-N concentration (mg/kg) of soils with depth for each soil-landform association

46
Warrawoona Gold Project – Soil Assessment
Phosphorus is essential for the growth of vegetation as it plays a key role in the formulation of energy producing organic compounds. Adequate phosphorus nutrition enhances many aspects of plant physiology, including the fundamental processes of photosynthesis, nitrogen fixation, flowering, fruiting (including seed production), and maturation (Brady, N. and Weil, R., 2002).
The plant-available phosphorus concentrations of the majority of soils from the Study area were classed as low for most samples (<10 mg/kg) (Figure 12). Although there was little consistent correlation with soil-landform association, there was a general reduction in plant-available P concentration with sample depth.
Figure 13 Individual and average plant-available phosphorus concentration (mg/kg) of soils with depth for each soil-landform association
Potassium (K) plays a critical role in several plant physiological processes. Adequate amounts of K have been linked to improved drought tolerance, better resistance to certain fungal diseases, and greater tolerance to insect pests (Brady, N. and Weil, R., 2002).
The plant-available K concentrations of the soils from the Study area were classed as moderate to high (high rating: >200 mg/kg (Moore, 1998)) for most samples, with little consistent correlation between the soils from the various soil-landform associations (Figure 13). On average, there was a general decrease in plant-available P concentration with sample depth.
There was a wide range of plant-available sulphur (S) concentrations measured for soils from the Study area, with individual values ranging from <0.5 mg/kg (below detection limit), to 841 mg/kg (classed as very high (Moore, 1998)). Most soils however, reported low concentrations. Generally speaking, there was little consistent correlation in plant-available S between the soils from the various soil-landform associations, or any trend with sample depth (Figure 13).

47
Warrawoona Gold Project – Soil Assessment
Figure 14 Individual and average plant-available potassium concentration (mg/kg) of soils with depth for each soil-landform association
Figure 15 Individual and average plant-available sulphur concentration (mg/kg) of soils with depth for each soil-landform association (note logarithmic scale of x-axis on individual values figure)

48
Warrawoona Gold Project – Soil Assessment
4.3.5 Total metal concentrations The total concentration of nominated metals was measured for selected samples, with the results presented in Table 5. As a point of comparison, the average crustal abundance (Reimann, C. and de Caritat, P, 1998) for each metal is also provided in Table 5.
Of note are the very high baseline concentrations of As, Cr and Se in many of the analogue soils tested, relative to the average crustal abundance. There is no apparent correlation in total metal concentration between the soils from the various soil-landform associations, or any trend with sample depth.
Table 5 Total metal concentration for selected samples
Site # Depth (cm)
Soil-landform association
Total metal concentrations (ug/kg) As Cd Cr Co Pb Mo Se
Site 1 0-5
Valley floor 9,600 38.9 578,525 34,703 4,060 193.3 1,087.9
40-50 30,723 41.8 712,545 165,391 4,650 185.0 1,512.0
Site 5 0-5
Valley floor 37,344 146.9 834,868 38,443 9,247 245.0 996.1
40-50 22,439 79.8 814,734 39,095 3,671 135.1 650.8
Site 7 0-5 Ridgeline /
rocky outcrop 295,139 101.2 942,491 27,070 9,840 313.3 2,104.8
10-20 125,552 229.4 538,392 36,404 7,294 190.9 1,003.3
Site 9 0-5 Ridgeline /
rocky outcrop 52,620 113.8 979,641 80,256 6,448 329.8 2,187.2
10-20 17,109 91.6 1,382,940 59,824 2,487 188.2 1,141.0
Site 12
0-5 Valley floor
7,353 34.3 329,066 34,504 3,244 169.2 586.8 40-50 7,423 23.4 377,635 39,329 3,585 154.3 875.0
Site 13 0-5 Low hills /
rises 13,938 25.3 1,049,778 94,659 3,113 154.1 621.4
Site 14
0-5 Valley floor
41,088 65.2 247,834 41,723 9,611 370.5 811.9 40-50 25,371 29.0 160,067 43,070 5,100 210.2 1,031.3
Site 16
0-5 Low hills / rises
3,422 40.8 413,696 36,145 4,277 187.6 902.4 10-20 3,815 21.6 495,039 32,312 3,772 157.5 671.8
Site 17
0-5 Sandplain / stony flats
1,120 20.2 19,185 3,945 5,189 151.7 442.2 40-50 2,231 12.6 29,103 6,544 10,737 193.0 1,016.4
Site 18 0-5 Sandplain /
stony flats 2,352 12.1 62,815 6,146 8,755 258.7 544.7
Site 19 0-5 Sandplain /
stony flats 2,903 13.8 820,409 23,419 4,937 208.1 464.7
Site 21 0-5 Low hills /
rises 15,064 40.9 159,544 28,867 3,377 151.4 508.7
Site 22
0-5 Low hills / rises
28,523 66.6 545,802 40,229 3,670 228.9 419.9 40-50 70,099 149.5 484,354 33,159 1,405 645.4 368.5
Site 23
0-5 Low hills / rises
10,424 41.7 486,971 27,473 4,251 147.0 339.5 40-50 4,940 70.2 615,782 28,843 2,454 93.8 251.6
Site 24
0-5 Valley floor
12,606 31.8 109,641 30,529 3,337 129.0 410.4 40-50 12,950 52.7 100,678 25,657 3,128 121.7 353.2
Average crustal abundance1. 1,700 100 126,000 24,000 14,800 1,100 120
1. (Reimann, C. and de Caritat, P, 1998)

49
Warrawoona Gold Project – Soil Assessment
5 SOIL LANDFORM ASSOCIATION MAPPING Five soil-landform associations were identified within the Study area namely; ‘drainage channels’, valley floor’, ‘low hills / rises’, ‘ridgelines / rocky outcrops’ and ‘sandplain / stony flats’. Identification of the soil-landform associations was based on field observations of morphological differences between the soil profiles, position within the landscape and analysis of physical and chemical soil characteristics. Approximate boundaries of the soil-landform associations within the Study area are detailed in Figure 16 (Copenhagen) and Figure 17 (Klondyke).
The classification of these soil-landform units provides a means of identifying soils that may be considered for salvage, storage and use in future rehabilitation activities associated with the Project. When identifying the potential salvage of soils from these units during mining activities, the areas of disturbance, practicalities of soil stripping (e.g. machinery access) and requirements for rehabilitation resources associated with the Project should be considered.

CORUNNA DOWNS ACCESS
E 45/4666
E 45/4666
M 45/240
M 45/682
119°49'0"E119°48'30"E
21°1
8'30
"S
21°1
8'30
"S
Copenhagen Soil-Landform Associations Figure 16
LEGEND Study areaTenement
Soil-Landform AssociationsRidgelines / Rocky OutcropsLow Hills / RisesSandplain / Stoney FlatsValley FloorDrainage ChannelDisturbed Area
´0 60 120 180 240
m
Scale: 1:5,000 @ A3GCS GDA 1994
Job: WAR-1903Date: 4/07/2019Ph: + 61 8 9431 7318www.mineearth.com.auPO Box 404, Fremantle, WA, 6959
C:\GIS\Jobs\Mine Earth\WAR-1903 - Warrawoona Gold Project\F igures\WAR-1903_F04a Soil-Landform Associations_190704.mxd
COPYRIGHT: THIS DOCUMENT IS AND SHALL REMAIN THE PROPERTY OF MINE EARTH. THIS DOCUMENT MAY ONLY BE USED FOR THE PURPOSE FOR WHICH IT WAS COMMISSIONED AND IN ACCORDANCE W ITH THE TERMS OF ENGAGEMENT. MINE EARTH DOES NOT HOLD ANY RESPONSIBILITY FOR THE MISUSE OF THIS DOCUMENT.

CORUNNA DOWNS ACCESS
E 45/3381E 45/3381
E 45/4533
E 45/4666
E 45/4905 E 45/4906
E 45/5100
L 45/399
L 45/523
M 45/4
M 45/547
M 45/552
M 45/656
M 45/668
M 45/669
M 45/670
M 45/671
P 45/2781
P 45/2980
P 45/3033
P45/3100-S
119°54'0"E119°52'0"E119°50'0"E
21°2
0'0"
S
21°2
0'0"
S
21°2
2'0"
S
21°2
2'0"
S
Klondyke Soil-Landform Associations Figure
17
LEGEND Study Area
TenementSoil-Landform Associations
Ridgelines / Rocky OutcropsLow Hills / RisesSandplain / Stoney FlatsValley FloorDrainage ChannelDisturbed Area
´0 0.3 0.6 0.9 1.2 1.5
km
Scale: 1:30,000 @ A3GCS GDA 1994
Job: WAR-1903Date: 4/07/2019Ph: + 61 8 9431 7318www.mineearth.com.auPO Box 404, Fremantle, WA, 6959
C:\GIS\Jobs\Mine Earth\WAR-1903 - Warrawoona Gold Project\F igures\WAR-1903_F04b Soil-Landform Associations_190704.mxd
COPYRIGHT: THIS DOCUMENT IS AND SHALL REMAIN THE PROPERTY OF MINE EARTH. THIS DOCUMENT MAY ONLY BE USED FOR THE PURPOSE FOR WHICH IT WAS COMMISSIONED AND IN ACCORDANCE W ITH THE TERMS OF ENGAGEMENT. MINE EARTH DOES NOT HOLD ANY RESPONSIBILITY FOR THE MISUSE OF THIS DOCUMENT.

52
Warrawoona Gold Project – Soil Assessment
6 CONCLUSIONS AND RECOMMENDATIONS The primary objective of this investigation was to characterise the existing surface soils that occur within the Study area, to identify any potentially problematic soil materials and to determine the optimal use of the soils as a rehabilitation resource. Information detailed within this report can be used to assist the planning and adoption of appropriate soil management and rehabilitation prescriptions for the Project.
Five soil-landform associations were identified within the Study area namely; ‘drainage channels’, valley floor’, ‘low hills / rises’, ‘ridgelines / rocky outcrops’ and ‘sandplain / stony flats’. The major consistent differences in the soils from the various soil-landform associations were the depth of soil present over partially weathered or competent rock, and the amount of coarse rock fragments (>2 mm) present within the soil materials. There was an overall consistency in the physical and chemical soil characteristics within both the Copenhagen and Klondyke components of the Study area.
Most of of the chemical and physical characteristics of the surface soils across the Study area were relatively similar, with little consistent variation associated with soil-landform association. All soils sampled were relatively coarse grained, with generally low clay contents (minor increase in clay with depth), were non- to slightly-saline, were non- or only partially-dispersive, were free draining (moderate hydraulic conductivity) and were typically low in organic carbon and plant-available nutrients.
Various soil samples from across the Study area were naturally enriched in total concentrations of As, Cr and Se (relative to the average crustal abundance), however there is no apparent correlation with soil-landform associations.
The soils present within the various soil-landform associations are summarised as follows:
• Drainage channels;
○ Variable soil texture reflecting areas of erosion and deposition in drainage channel, but typically very coarse sands.
○ Very low plant-available nutrient concentration.
○ Rapid hydraulic conductivity.
• Valley floor;
○ Deep soil profiles (in comparison to surrounding soil profiles) to depths >1 m.
○ Well structured ‘topsoil’ layer to approximately 20 cm depth.
○ Relatively low coarse fraction (>2 mm) and low clay content.
○ Exhibit partial clay dispersion upon severe disturbance.
○ Moderate hydraulic conductivity.
○ Low plant-available nutrient concentration.
• Sandplain / stony flats;
○ Deep soil profiles with weak to moderately structured ‘topsoil’ layer to approximately 15-20 cm depth.
○ Typically, moderate coarse fraction and low to moderate clay content through soil profile.
○ Moderately rapid hydraulic conductivity.
○ Non-dispersive or partial clay dispersion upon severe disturbance.
○ Low plant-available nutrient concentration.

53
Warrawoona Gold Project – Soil Assessment
• Low hills / rises;
○ Shallow surface soils (variable, approximately 15-20 cm) over fractured / weathered and competent rock.
○ High percentage of competent rock fragments through the surface soil profile.
○ Moderate hydraulic conductivity.
○ Non-dispersive.
○ Low plant-available nutrient concentration.
• Ridgelines / rocky outcrops;
○ Shallow / skeletal soils over fractured / weathered and competent rock.
○ Moderate hydraulic conductivity.
○ High percentage of competent rock fragments through the surface soil profile.
○ Non-dispersive.
In general, the topsoil materials (0 to 20 cm depth) across all soil-landform associations have characteristics which indicate a low inherent erodibility (i.e. low clay content, non- to only partially-dispersive, high coarse material content and free draining). While some of the topsoils sampled (especially from the ‘valley floor’) contained relatively low amounts of coarse material (i.e. rock >2 mm) and may be prone to minor clay dispersion upon severe disturbance, all are considered a potential resource for use in rehabilitation activities. The exception to this are the ‘drainage channel’ soils. As no ‘topsoil’ is present within the ‘drainage channels’ and the soils present represent a very small percentage of the total soil available, it is recommended that soils are not salvage from those areas.
6.1 Soil Management Recommendations It is recommended that topsoils, to a depth of approximately 20 cm from within the ‘valley floor’ and ‘low hills / ridges’ soil-landform associations, are salvaged from disturbance areas for potential use as a rehabilitation resource. Topsoils from the ‘ridgelines / rocky outcrops’ are also physically and chemically suitable for salvage and use as a rehabilitation resource, however, due to accessibility and the prevalence of outcropping rock, the salvage of these topsoils is likely to be opportunistic.
Ideally, topsoils salvaged from disturbance areas within the ‘low hills / rises’ and any topsoil able to be opportunistically salvaged from the ‘ridgelines / rocky outcrops’ should be stockpiled together for use as a surface rehabilitation medium on rehabilitated slopes of constructed landforms. The high coarse fraction, low clay content, non-dispersive and free draining nature of these topsoils indicate a low inherent erodibility and suitability for use on rehabilitated sloped areas.
Topsoils from the ‘valley floor’ soil-landform association are considered less suitable for placement on rehabilitated slopes due to the lower coarse rock fraction and tendency for partial dispersion of the clay fraction following disturbance. These soils however, are still considered a valuable rehabilitation resource for flat surfaces. It is recommended that the topsoil from disturbance areas within the ‘valley floor’ soil-landform association are stockpiled separately from the ‘low hills / rises’ and ‘ridgelines / rocky outcrop’ topsoil, for preferential placement on flat rehabilitation areas.
Topsoils from within the ‘sandplain’ / stony flats’ to the south of the Study area are considered suitable for salvage and use as a surface rehabilitation medium, particularly for flat rehabilitation areas situated within the southern section of the Study area. Soils within the ‘drainage channels’ are variable and present in insufficient volumes to consider as a separate management unit.

54
Warrawoona Gold Project – Soil Assessment
The deeper soils from within the ‘valley floor’ soil-landform association (i.e. soils from approximately 20 to 90 cm depth) may also be considered as a potential surface / near surface rehabilitation medium, should additional materials be required to make up a forecast deficit in soil resources for rehabilitation.
It is recommended that, once disturbance footprints for the Project are finalised, that a topsoil inventory is developed to identify the volume of topsoil likely to be available for salvage from disturbance areas, and the amount of soil material required for rehabilitation and closure of WRLs and other rehabilitation areas. This will inform requirements for any additional soil resources to be salvaged from the deeper soil profiles within the ‘valley floor’ soil-landform association.
Specific topsoil management and handling recommendations which can optimise the success of future rehabilitation are as follows:
• It is recommended that the upper 0.2 m (topsoil) of the soil profiles within the proposed disturbance areas is stripped and placed in stockpiles.
• Any rock fragments and surface litter present within the soil profiles should be collected and stockpiled with the topsoil.
• Machinery operators should minimise the frequency and intensity of disturbance, so they do not compromise the structural integrity of the material.
• Soil stripping should occur as close as possible to the time when the proposed disturbance is scheduled to commence and ideally placed directly on the rehabilitated areas where possible.
• Where stockpiling is required, stripped soil should be paddock-dumped into piles no greater than two metres in height. The piles should have adequate distance between them to create a series of mounds and troughs.
• Excessive traffic and disturbance of the stockpiles should be minimised to minimise erosion and degradation of soil structure. Care should be taken to minimise the handling of the soils where possible, particularly when wet.
• As a general rule, topsoil rehabilitation materials should not be placed at depths greater than 0.2 m on rehabilitated areas. This is particularly the case for slope areas of rehabilitation.
Although the majority of soils within the Study area, and particularly those from the low hills / rises’ and ‘ridgelines / rocky outcrop’ soil-landform associations, have a high percentage of competent rock and expected low erodibility, it is recommended that consideration is given to incorporation (via deep ripping) of additional competent, benign waste rock into final rehabilitated surfaces to further armour against surface erosion. This is particularly the case for constructed slopes of waste landforms.

55
Warrawoona Gold Project – Soil Assessment
7 REFERENCES BOM. (2019, June 10). Climate Statistics for Australian locations. Retrieved from BOM.
Brady, N. and Weil, R. (2002). The Nature and Properties of Soils - Thirteenth Edition. New Jersey: Prentice Hall.
Calidus Resources Ltd. (n.d.). Geology of the Warawoona Gold Project.
CSIRO. (2009). Australian Soil and Land Survey Field Handbook. CSIRO Publishing.
Hunt, N and Gilkes, R. (1992). Farm monitoring handbook, a practical down-to-earth manual for farmers and other land users. Perth: The University of Western Australia.
McKenzie, N.l., May, J.E. and McKenna, S. (2003). Bioregional Summary of the 2002 Biodiversity Audit for Western Australia. Department of Conservation and Land Management.
Moore, G. (1998). Soilguide. A handbook for understanding and managing agricultural soils. Bulletin No. 4343. Perth: Agriculture Western Australia.
Payne, A L, van Vreeswyk, A M, Leighton, K A, Pringle, H J, and Hennig, P. (1998). An inventory and condition survey of the Sandstone-Yalgoo-Paynes Find area, Western Australia. Technical Bulletin 90. Perth, Western Australia: Department of Agriculture and Food.
Reimann, C. and de Caritat, P. (1998). Chemical Elements in the Environment. Berlin: Springer.
van Gool, D. T. (2005). Land evaluation standards for land resource mapping. Agriculture Western Australia.
Van Vreeswyk, A., Payne, A., Leighton, K and Hennig, P. (2004). An inventory and condition survey of the Pilbara Region of WA. Perth: Depertment of Agriculture.

56
Warrawoona Gold Project – Soil Assessment
Soil analysis classifications

Warrawoona Gold Project – Soil Assessment
Emerson Dispersion Test Classes (Moore 1998)
Soil Electrical conductivity classes (based on standard USDA and CSIRO categories)
Soil pH classes

Warrawoona Gold Project – Soil Assessment
Appendix B
CSBP Laboratory Analysis Certificates

Lab No
ZWS19009 ZWS19010 ZWS19011 ZWS19012 ZWS19013 ZWS19014 ZWS19015 ZWS19016
Name W1 W1 W2 W2 W2 W2 W3 W3
Code 2 4 5 6 7 8 9 10
Customer Mine Earth Mine Earth Mine Earth Mine Earth Mine Earth Mine Earth Mine Earth Mine Earth
Depth 10-20 90-100 0-5 10-20 40-50 90-100 0-5 10-20
Colour DKBR DKBR BR DKBR DKBR DKBR BRGR BRGR
Gravel % 0 0 0 0 0 0 5 5
Texture 3.0 3.0 2.5 2.5 3.0 3.0 1.0 1.0
Ammonium Nitrogen mg/kg < 1 < 1 < 1 < 1 < 1 < 1 < 1 < 1
Nitrate Nitrogen mg/kg 4 3 < 1 < 1 < 1 < 1 < 1 < 1
Phosphorus Colwell mg/kg < 2 2 7 < 2 < 2 < 2 3 2
Potassium Colwell mg/kg 116 66 163 40 34 42 134 113
Sulfur mg/kg 70.6 406.5 0.8 < 0.5 < 0.5 < 0.5 < 0.5 < 0.5
Organic Carbon % 0.21 0.14 0.30 0.20 0.20 0.16 0.07 0.07
Conductivity dS/m 1.587 2.018 0.015 0.014 0.014 0.022 0.027 0.023
pH Level (CaCl2) 6.2 8.0 6.1 6.8 6.7 7.0 7.3 7.0
pH Level (H2O) 6.6 8.5 6.9 8.0 7.9 8.4 8.1 8.0
CSBP Lab. Extract Value.
Analysis Results
90423Mine Earth Pty Ltd
CSBP Soil and Plant Laboratory

Lab No
ZWS19017 ZWS19018 ZWS19019 ZWS19020 ZWS19021 ZWS19022 ZWS19023 ZWS19024
Name W4 W4 W4 W4 W5 W5 W6 W6
Code 11 12 13 14 16 18 19 20
Customer Mine Earth Mine Earth Mine Earth Mine Earth Mine Earth Mine Earth Mine Earth Mine Earth
Depth 0-5 10-20 40-50 90-100 10-20 90-100 0-5 10-20
Colour BR DKBR DKBR BR BRYW GRBR GRBR GRBR
Gravel % 0 0 0 0 0 0 0 0
Texture 3.5 3.0 3.5 3.0 3.0 3.0 3.0 3.0
Ammonium Nitrogen mg/kg < 1 < 1 < 1 < 1 < 1 < 1 < 1 < 1
Nitrate Nitrogen mg/kg 2 6 4 10 < 1 2 2 < 1
Phosphorus Colwell mg/kg 5 < 2 < 2 < 2 2 2 2 < 2
Potassium Colwell mg/kg 216 58 56 45 165 57 82 25
Sulfur mg/kg 0.8 2.9 5.4 46.6 < 0.5 0.6 2.0 1.7
Organic Carbon % 0.27 0.24 0.18 0.13 0.30 0.30 0.48 0.33
Conductivity dS/m 0.021 0.030 0.039 0.505 0.020 0.065 0.066 0.062
pH Level (CaCl2) 6.7 6.7 7.0 7.6 6.8 7.8 8.0 8.0
pH Level (H2O) 8.0 7.7 7.8 8.1 7.6 8.6 8.8 8.9
CSBP Lab. Extract Value.
Analysis ResultsCSBP Soil and Plant Laboratory

Lab No
ZWS19025 ZWS19026 ZWS19027 ZWS19028 ZWS19029 ZWS19030 ZWS19031 ZWS19032
Name W8 W8 W10 W10 W11 W11 W12 W12
Code 23 24 27 28 29 30 32 34
Customer Mine Earth Mine Earth Mine Earth Mine Earth Mine Earth Mine Earth Mine Earth Mine Earth
Depth 0-5 10-20 0-5 10-20 0-5 10-20 10-20 90-100
Colour LTBR LTGR BRGR LTBR GRBR GRBR DKBR BRRD
Gravel % 0 0 0 0 0 0 0 0
Texture 3.5 3.5 2.5 3.0 2.0 2.5 3.0 3.5
Ammonium Nitrogen mg/kg 4 < 1 < 1 < 1 < 1 < 1 < 1 < 1
Nitrate Nitrogen mg/kg 7 < 1 16 < 1 1 1 < 1 < 1
Phosphorus Colwell mg/kg < 2 < 2 6 < 2 12 9 3 < 2
Potassium Colwell mg/kg 116 28 136 67 137 119 212 48
Sulfur mg/kg 4.9 1.3 462.2 3.6 1.6 0.9 < 0.5 < 0.5
Organic Carbon % 0.41 0.22 0.27 0.20 0.55 0.55 0.34 0.27
Conductivity dS/m 0.058 0.059 2.047 0.060 0.072 0.063 0.016 0.017
pH Level (CaCl2) 7.4 8.1 7.5 7.5 7.9 7.9 7.3 7.0
pH Level (H2O) 8.4 8.9 8.0 8.3 8.8 8.7 8.5 8.2
CSBP Lab. Extract Value.
Analysis ResultsCSBP Soil and Plant Laboratory

Lab No
ZWS19033 ZWS19034 ZWS19035 ZWS19037 ZWS19038 ZWS19039 ZWS19040 ZWS19041
Name W13 W14 W15 W15 W15 W17 W17 W18
Code 36 38 40 41 42 46 48 50
Customer Mine Earth Mine Earth Mine Earth Mine Earth Mine Earth Mine Earth Mine Earth Mine Earth
Depth 10-20 10-20 0-5 10-20 40-50 10-20 90-100 10-20
Colour BRGR BRRD GRBR GRBR BRGR BROR BR BROR
Gravel % 0 0 0 0 0 0 0 0
Texture 3.0 3.0 2.5 3.0 3.5 2.0 3.0 2.5
Ammonium Nitrogen mg/kg < 1 < 1 < 1 < 1 < 1 < 1 1 < 1
Nitrate Nitrogen mg/kg < 1 < 1 4 2 2 < 1 < 1 < 1
Phosphorus Colwell mg/kg 3 2 9 3 3 2 < 2 3
Potassium Colwell mg/kg 55 44 263 266 190 149 52 157
Sulfur mg/kg 0.8 < 0.5 1.5 1.2 1.2 < 0.5 < 0.5 1.3
Organic Carbon % 0.53 0.37 1.01 0.69 0.53 0.24 0.14 0.29
Conductivity dS/m 0.030 0.016 0.055 0.075 0.083 < 0.010 0.021 0.015
pH Level (CaCl2) 7.0 6.8 7.3 7.8 7.8 6.0 6.6 6.3
pH Level (H2O) 8.0 8.0 7.9 8.5 8.6 7.2 7.8 7.7
CSBP Lab. Extract Value.
Analysis ResultsCSBP Soil and Plant Laboratory

Lab No
ZWS19042 ZWS19043 ZWS19044 ZWS19045 ZWS19046 ZWS19047 ZWS19048 ZWS19049
Name W19 W20 W21 W22 W23 W23 W24 W24
Code 52 53 55 57 60 62 64 66
Customer Mine Earth Mine Earth Mine Earth Mine Earth Mine Earth Mine Earth Mine Earth Mine Earth
Depth 10-20 0-5 10-20 10-20 10-20 90-100 10-20 90-100
Colour DKBR LTBR LTGR LTBR LTBR BRGR DKBR GRBR
Gravel % 0 5 0 0 0 0 0 0
Texture 3.5 1.0 2.0 3.0 3.0 3.0 3.5 2.5
Ammonium Nitrogen mg/kg < 1 < 1 < 1 < 1 < 1 < 1 < 1 < 1
Nitrate Nitrogen mg/kg 31 < 1 < 1 < 1 < 1 < 1 < 1 < 1
Phosphorus Colwell mg/kg 3 2 3 < 2 < 2 < 2 < 2 < 2
Potassium Colwell mg/kg 176 85 31 48 44 34 33 33
Sulfur mg/kg 841.8 2.5 1.3 1.1 < 0.5 < 0.5 < 0.5 4.6
Organic Carbon % 0.19 0.10 0.41 0.32 0.37 0.28 0.25 0.21
Conductivity dS/m 2.311 0.046 0.066 0.077 0.063 0.064 0.062 0.119
pH Level (CaCl2) 7.1 8.1 7.9 8.0 7.9 7.9 7.9 8.2
pH Level (H2O) 7.9 9.0 8.8 8.9 8.7 8.8 8.7 9.2
CSBP Lab. Extract Value.
Analysis ResultsCSBP Soil and Plant Laboratory

Lab No
ZWS19050 ZWS19051 ZWS19052 ZWS19053 ZWS19054 ZWS19055 ZWS19056 ZWS19057
Name W1 W1 W5 W5 W7 W7 W9 W9
Code 1 3 15 17 21 22 25 26
Customer Mine Earth Mine Earth Mine Earth Mine Earth Mine Earth Mine Earth Mine Earth Mine Earth
Depth 0-5 40-50 0-5 40-50 0-5 10-20 0-5 10-20
Colour BR DKBR GRBR GRBR LTBR GRPK BRGR LTGR
Gravel % 0 0 0 0 0 0 0 0
Texture 3.0 2.5 2.0 2.5 3.0 1.5 2.5 2.0
Ammonium Nitrogen mg/kg < 1 < 1 < 1 < 1 < 1 < 1 < 1 < 1
Nitrate Nitrogen mg/kg < 1 2 2 < 1 < 1 3 7 < 1
Phosphorus Colwell mg/kg 2 < 2 11 < 2 2 < 2 7 8
Potassium Colwell mg/kg 200 67 276 78 73 22 148 77
Sulfur mg/kg 1.2 108.7 0.8 < 0.5 2.1 86.7 511.5 170.6
Organic Carbon % 0.19 0.16 0.53 0.25 0.41 0.34 0.43 0.53
Conductivity dS/m 0.065 1.788 0.026 0.059 0.070 0.334 4.087 0.702
pH Level (CaCl2) 6.7 8.2 6.7 7.9 8.0 8.1 7.3 8.3
pH Level (H2O) 7.5 8.6 7.4 8.8 8.8 8.8 7.6 8.9
Calcium Water Soluble meq/100g 0.05 0.95 0.11 0.65 0.36 0.77 7.65 0.75
Magnesium Water Soluble meq/100g 0.31 2.28 0.32 0.79 0.57 0.63 9.67 0.95
Potassium Water Soluble meq/100g 0.04 0.02 0.08 0.05 0.12 0.01 0.07 0.05
Sodium Water Soluble meq/100g 0.23 6.07 0.03 0.03 0.06 0.85 15.60 2.15
Arsenic ug/kg 9600.31 30723.45 37344.50 22439.78 295139.88 125552.21 52620.27 17109.18
Cadmium ug/kg 38.90 41.88 146.98 79.86 101.28 229.41 113.83 91.68
Chromium ug/kg 578525.41 712545.93 834868.47 814734.67 942491.01 538392.63 979641.97 1382940.30
Cobalt ug/kg 34703.24 165391.65 38443.30 39095.38 27070.44 36404.46 80256.91 59824.69
CSBP Lab. Extract Value.
Analysis Results
90423Mine Earth Pty Ltd
CSBP Soil and Plant Laboratory

Lab No
ZWS19058 ZWS19059 ZWS19060 ZWS19061 ZWS19062 ZWS19063 ZWS19064 ZWS19065
Name W12 W12 W13 W14 W14 W16 W16 W17
Code 31 33 35 37 39 43 44 45
Customer Mine Earth Mine Earth Mine Earth Mine Earth Mine Earth Mine Earth Mine Earth Mine Earth
Depth 0-5 40-50 0-5 0-5 40-50 0-5 10-20 0-5
Colour BRGR DKBR BRGR BROR BRGR BR BR BR
Gravel % 0 0 0 0 0 0 0 0
Texture 1.5 3.0 3.0 2.5 3.0 3.0 2.5 1.5
Ammonium Nitrogen mg/kg < 1 1 < 1 < 1 < 1 < 1 < 1 < 1
Nitrate Nitrogen mg/kg < 1 < 1 1 1 < 1 1 < 1 < 1
Phosphorus Colwell mg/kg 8 < 2 8 18 < 2 9 5 6
Potassium Colwell mg/kg 288 65 138 175 36 190 118 157
Sulfur mg/kg 0.6 < 0.5 1.0 0.7 0.5 0.9 0.7 < 0.5
Organic Carbon % 0.36 0.35 0.47 0.43 0.31 0.51 0.46 0.46
Conductivity dS/m 0.019 0.020 0.027 0.017 0.071 0.025 0.019 < 0.010
pH Level (CaCl2) 6.7 6.6 6.8 6.1 7.8 6.3 6.3 5.4
pH Level (H2O) 7.3 7.5 7.7 7.1 8.7 7.2 7.2 6.6
Calcium Water Soluble meq/100g 0.15 0.22 0.14 0.09 0.43 0.10 0.12 0.04
Magnesium Water Soluble meq/100g 0.20 0.51 0.34 0.27 0.50 0.28 0.34 0.10
Potassium Water Soluble meq/100g 0.05 0.03 0.03 0.06 0.03 0.06 0.04 0.06
Sodium Water Soluble meq/100g 0.01 0.02 0.02 0.02 0.07 0.01 0.01 < 0.01
Arsenic ug/kg 7353.05 7423.36 13938.99 41088.79 25371.76 3422.13 3815.37 1120.43
Cadmium ug/kg 34.38 23.42 25.30 65.23 29.04 40.80 21.65 20.29
Chromium ug/kg 329066.65 377635.00 1049778.69 247834.68 160067.33 413696.19 495039.19 19185.10
Cobalt ug/kg 34504.35 39329.36 94659.35 41723.23 43070.90 36145.93 32312.95 3945.46
CSBP Lab. Extract Value.
Analysis ResultsCSBP Soil and Plant Laboratory

Lab No
ZWS19066 ZWS19068 ZWS19069 ZWS19070 ZWS19071 ZWS19072 ZWS19073 ZWS19074
Name W17 W18 W19 W21 W22 W22 W23 W23
Code 47 49 51 54 56 58 59 61
Customer Mine Earth Mine Earth Mine Earth Mine Earth Mine Earth Mine Earth Mine Earth Mine Earth
Depth 40-50 0-5 0-5 0-5 0-5 40-50 0-5 40-50
Colour BRRD BR BRGR GRBR BRGR LTBR GRBR LTBR
Gravel % 0 0 0 0 0 0 0 0
Texture 1.5 2.0 2.0 2.0 2.5 2.5 3.0 3.0
Ammonium Nitrogen mg/kg 2 < 1 < 1 2 < 1 < 1 < 1 < 1
Nitrate Nitrogen mg/kg < 1 2 11 < 1 < 1 < 1 < 1 < 1
Phosphorus Colwell mg/kg < 2 10 5 7 5 < 2 3 < 2
Potassium Colwell mg/kg 63 162 138 102 271 19 205 31
Sulfur mg/kg < 0.5 0.8 126.8 1.0 0.7 1.2 0.7 < 0.5
Organic Carbon % 0.20 0.37 0.23 0.33 0.34 0.16 0.75 0.32
Conductivity dS/m 0.018 0.012 0.624 0.030 0.057 0.067 0.068 0.063
pH Level (CaCl2) 6.4 5.1 6.7 7.3 7.9 8.1 7.7 7.8
pH Level (H2O) 7.2 6.3 7.5 8.2 8.8 9.1 8.6 8.8
Calcium Water Soluble meq/100g 0.28 0.03 0.07 0.22 0.32 0.52 0.44 0.80
Magnesium Water Soluble meq/100g 0.63 0.18 1.05 0.21 0.58 0.65 0.27 0.48
Potassium Water Soluble meq/100g 0.23 0.10 0.12 0.03 0.05 0.01 0.04 0.01
Sodium Water Soluble meq/100g 0.04 0.04 3.00 0.03 0.01 0.04 < 0.01 0.02
Arsenic ug/kg 2231.02 2352.68 2903.95 15064.95 28523.35 70099.61 10424.13 4940.05
Cadmium ug/kg 12.61 12.12 13.83 40.94 66.65 149.59 41.79 70.23
Chromium ug/kg 29103.77 62815.65 820409.05 159544.09 545802.19 484354.27 486971.56 615782.86
Cobalt ug/kg 6544.43 6146.51 23419.32 28867.11 40229.64 33159.42 27473.62 28843.85
CSBP Lab. Extract Value.
Analysis ResultsCSBP Soil and Plant Laboratory

Lab No
ZWS19075 ZWS19076
Name W24 W24
Code 63 65
Customer Mine Earth Mine Earth
Depth 0-5 40-50
Colour BR BR
Gravel % 0 0
Texture 2.5 3.0
Ammonium Nitrogen mg/kg < 1 < 1
Nitrate Nitrogen mg/kg < 1 < 1
Phosphorus Colwell mg/kg 5 < 2
Potassium Colwell mg/kg 169 37
Sulfur mg/kg 0.6 0.6
Organic Carbon % 0.38 0.19
Conductivity dS/m 0.049 0.069
pH Level (CaCl2) 7.7 8.0
pH Level (H2O) 8.6 9.0
Calcium Water Soluble meq/100g 0.35 0.69
Magnesium Water Soluble meq/100g 0.48 0.81
Potassium Water Soluble meq/100g 0.05 0.01
Sodium Water Soluble meq/100g 0.01 0.08
Arsenic ug/kg 12606.06 12950.66
Cadmium ug/kg 31.85 52.78
Chromium ug/kg 109641.71 100678.64
Cobalt ug/kg 30529.95 25657.83
CSBP Lab. Extract Value.
Analysis ResultsCSBP Soil and Plant Laboratory

Lab No
ZWS19050 ZWS19051 ZWS19052 ZWS19053 ZWS19054 ZWS19055 ZWS19056 ZWS19057
Lead ug/kg 4060.39 4650.88 9247.29 3671.50 9840.54 7294.71 6448.35 2487.78
Molybdenum ug/kg 193.3 185.0 245.0 135.1 313.3 190.9 329.8 188.2
Selenium ug/kg 1087.99 1512.07 996.12 650.84 2104.86 1003.30 2187.26 1141.07
CSBP Lab. Extract Value.
Analysis ResultsCSBP Soil and Plant Laboratory

Lab No
ZWS19058 ZWS19059 ZWS19060 ZWS19061 ZWS19062 ZWS19063 ZWS19064 ZWS19065
Lead ug/kg 3244.37 3585.01 3113.45 9611.05 5100.25 4277.77 3772.67 5189.29
Molybdenum ug/kg 169.2 154.3 154.1 370.5 210.2 187.6 157.5 151.7
Selenium ug/kg 586.84 875.00 621.42 811.98 1031.36 902.43 671.82 442.21
CSBP Lab. Extract Value.
Analysis ResultsCSBP Soil and Plant Laboratory

Lab No
ZWS19066 ZWS19068 ZWS19069 ZWS19070 ZWS19071 ZWS19072 ZWS19073 ZWS19074
Lead ug/kg 10737.04 8755.42 4937.10 3377.71 3670.68 1405.37 4251.69 2454.08
Molybdenum ug/kg 193.0 258.7 208.1 151.4 228.9 645.4 147.0 93.8
Selenium ug/kg 1016.40 544.74 464.77 508.78 419.92 368.53 339.56 251.66
CSBP Lab. Extract Value.
Analysis ResultsCSBP Soil and Plant Laboratory

Lab No
ZWS19075 ZWS19076
Lead ug/kg 3337.93 3128.34
Molybdenum ug/kg 129.0 121.7
Selenium ug/kg 410.42 353.82
CSBP Lab. Extract Value.
Analysis ResultsCSBP Soil and Plant Laboratory