warren wilson college - appalachian state university
TRANSCRIPT

Warren Wilson College Greenhouse Gas Emissions Inventory 2008-2009 Academic Year
Lead Author Amy Wagner, class of 2011 Mentor Stan Cross, Environmental Leadership Center Education Director
Additional Support Margo Flood, Environmental Leadership Center Executive Director, editor Mark Begley, 2007-2008 Inventory Author Barnaby Ohrstrom, ELC Student Crew Member Ansley Rawlins, ELC Student Crew Member Callie Baruch, ELC Student Crew Member

Warren Wilson College Greenhouse Gas Emissions Inventory 2008-2009
1
Table of Contents
I. Executive Summary……………………………………………………………………………..2
II. 2008-09 Greenhouse Gas Emissions Inventory Final Report
A. Introduction …………………………………………………………………………………..4
B. Total Emissions...………………………………...…………………….………...........6
C. Total Energy Costs………………………………………………………………….……….9
III. The Three Major Emissions Sources
A. Electricity……………………………………………………………………………………….10
1. Renewable / Alternative Energy …………………………………….....17
B. Natural Gas …………………………………………………………………………………..18
C. Transportation……... ………………………………………………………………………24
1. International Flights…………………………………………………………….24
2. Student, Staff, and Faculty Fuel Use (from commuting)……...26
3. Campus Vehicle Fleet Fuel Use…………………………………………….28
IV. The Remaining Sources
A. Solid Waste…………………………………………………………………………………….30
B. Agriculture……………………………………………..……………………………………...32
C. Miscellaneous……………………………………………………………………............34
1. Future Initiative: Food Policy & GHG Emissions…………………...35
V. Conclusion………………………………………………...…………………………………………36
VI. Areas for Improving the Inventory……………………………………………………….37
VII. Appendix I: In Detail Methods and Data by Source………………………………38
VIII. Appendix II: Data……………………………………………………………………...………..41
IX. Footnotes …………………………………………………………………………………………...41
Warren Wilson College Greenhouse Gas Emissions Inventory 2008-2009
2
I. Executive Summary
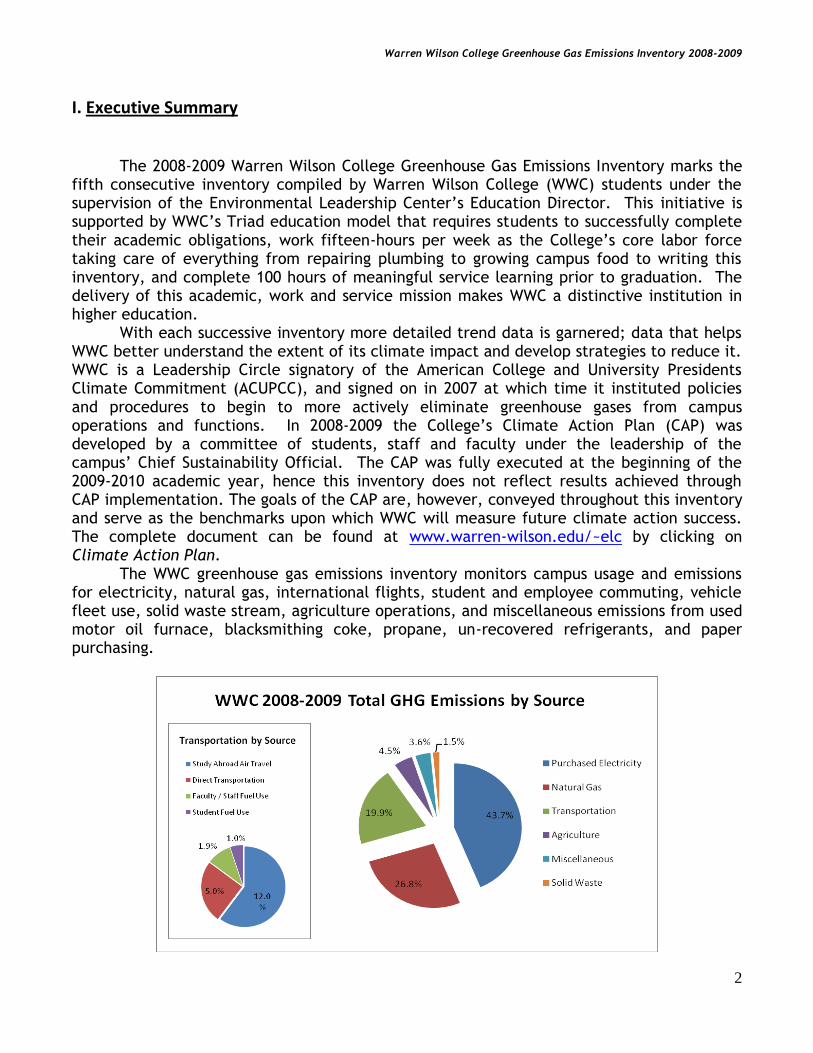
The 2008-2009 Warren Wilson College Greenhouse Gas Emissions Inventory marks the fifth consecutive inventory compiled by Warren Wilson College (WWC) students under the supervision of the Environmental Leadership Center‘s Education Director. This initiative is supported by WWC‘s Triad education model that requires students to successfully complete their academic obligations, work fifteen-hours per week as the College‘s core labor force taking care of everything from repairing plumbing to growing campus food to writing this inventory, and complete 100 hours of meaningful service learning prior to graduation. The delivery of this academic, work and service mission makes WWC a distinctive institution in higher education. With each successive inventory more detailed trend data is garnered; data that helps WWC better understand the extent of its climate impact and develop strategies to reduce it. WWC is a Leadership Circle signatory of the American College and University Presidents Climate Commitment (ACUPCC), and signed on in 2007 at which time it instituted policies and procedures to begin to more actively eliminate greenhouse gases from campus operations and functions. In 2008-2009 the College‘s Climate Action Plan (CAP) was developed by a committee of students, staff and faculty under the leadership of the campus‘ Chief Sustainability Official. The CAP was fully executed at the beginning of the 2009-2010 academic year, hence this inventory does not reflect results achieved through CAP implementation. The goals of the CAP are, however, conveyed throughout this inventory and serve as the benchmarks upon which WWC will measure future climate action success. The complete document can be found at www.warren-wilson.edu/~elc by clicking on Climate Action Plan. The WWC greenhouse gas emissions inventory monitors campus usage and emissions for electricity, natural gas, international flights, student and employee commuting, vehicle fleet use, solid waste stream, agriculture operations, and miscellaneous emissions from used motor oil furnace, blacksmithing coke, propane, un-recovered refrigerants, and paper purchasing.

Warren Wilson College Greenhouse Gas Emissions Inventory 2008-2009
3
The 2008 – 2009 Greenhouse Gas Emissions Inventory lends further data to support three trends over the past five academic years (2004/05-2008/09) that give cause for celebration:
Overall total campus per capita emissions are down nearly 10%, with the downturn beginning in 2008 - 2009;
Electricity per capita emissions (the largest source on campus) are down nearly 14%;
Natural gas per capita emissions (second largest source) are down 8%.
These trends mean that each individual student and employee is doing a better job reducing energy use. Campus population, however, just like global population, continues to increase. When looking at emissions totals not adjusted per capita, the findings are sobering:
Overall total campus emissions are UP nearly 3.5%;
Electricity emissions are DOWN 0.8%;
Natural gas emissions are UP nearly 5.5%
In addition, the inventory process brings to light key areas where improved campus energy use data collection is needed - data is currently insufficient or not available as a result of either lacking infrastructure or process:
Sub-meter all buildings for natural gas use;
Track miles traveled and mode of transportation for all College-related travel;
Track campus water usage;
Track all building‘s energy efficiency improvements data to support return on investment calculations;
Centralize campus purchasing and data collection to improve the quality of purchased product emissions data (such as paper and food).
Clearly there is work to be done. Results of Year 1 Climate Action Plan implementation will be tabulated over the coming months, and will hopefully indicate campus emissions improvements. By inspiring students and employees to change energy use behaviors, developing and executing sound energy efficiency policy, and continuing to measure and disseminate emissions data, Warren Wilson College will continue to be a national leader in the fight to reduce global greenhouse gas emissions.
Stan Cross Education Director
Environmental Leadership Center May 2010

Warren Wilson College Greenhouse Gas Emissions Inventory 2008-2009
4
II. 2008-09 Greenhouse Gas Emissions Inventory Final Report
A. Introduction
The Warren Wilson College Greenhouse Gas Emissions Inventory 2008-2009 is the fifth annual
emissions inventory the college has produced. It is now possible to examine five-year trends of
Warren Wilson‘s energy use, energy costs, and GHG Emissions, which provides a broader picture of
the college‘s environmental impact. With this enhanced knowledge, Warren Wilson College can set
accurate goals for emissions and energy use reductions.
This is also the first inventory to be conducted after filing WWC‘s Climate Action Plan with
ACUPCC, which aims to reduce WWC‘s overall greenhouse gas emissions to 80% less than its 2007
levels by 2020. This goal will be accomplished in two phases. Phase 1 aims for a 40% carbon emissions
reduction from 2007 levels during 2009 to 2014. This goal will be accomplished in a three-part
process:
1) Achieve a 25% total reduction in electric use campus-wide at 5% per year, from 2009
to 2014, based on a combination of behavior changes and retrofits;
2) Achieve a 50% total reduction in transportation carbon footprint from 2009 to 2014
based upon fleet upgrades, use of alternative transportation, and meaningful
voluntary carbon offsets for faculty/staff business and commuter travel, international
programs, service learning, and student driving;
3) Achieve a 20% reduction in natural gas carbon emissions based on gradual upgrades
of heating/cooling systems, building envelopes, and installation of geothermal and
high functioning systems.
The figures reported in this inventory are invaluable to the college‘s efforts to monitor progress of
the Climate Action Plan.
This inventory examines the following sources of GHG emissions: Electricity; Natural Gas;
Transportation (International Flights and Fuel Use); Solid Waste; Agriculture; and Miscellaneous
which includes the Used Motor Oil Burner, Escaped Refrigerants, Paper Consumption, and
Blacksmithing Coke. In this inventory, ‗per capita‘ trends are based upon the entire population of the
campus (students, staff and faculty combined), and ‗per capita‘ in residence halls.
In the 2007-2008 Greenhouse Gas Emissions Inventory, the college chose to transition from its
own custom-made emissions template to the Clean Air—Cool Planet Campus Carbon Calculator, which
is a standardized, nationally-utilized and well-known tool. In this 2008-2009 inventory, the transition
was made complete; old data, whenever possible, was imported into the Calculator to yield new

Warren Wilson College Greenhouse Gas Emissions Inventory 2008-2009
5
totals for past years‘ figures. The Calculator computes emissions in either pounds or metric tonnes
(MT) of carbon dioxide equivalents (eCO2). Nitrous oxide and methane ―are more potent greenhouse
gases than carbon dioxide in regard to climate change, so by using the measurement of eCO2, a valid
comparison can be made across sources of different types of emissions.”1
Figure 1.1, below, depicts the relative composition of Warren Wilson College‘s GHG Emissions
by total amount.
Fig. 1.1

Warren Wilson College Greenhouse Gas Emissions Inventory 2008-2009
6
B. Total Emissions
Table 1.1, below, depicts total GHG Emissions for Warren Wilson College over the past five years.
Table 1.1
It is important to note that the figures in Table 1.1 differ from those reported in previous
inventories, and are to be considered the most accurate figures to date. For this inventory, the raw
values from all previous inventories were imported into the Clean Air-Cool Planet Campus Carbon
Calculator, which systematized emissions calculations and generated new totals. These totals allow
for the most accurate comparison of the college‘s emissions from year to year. Unfortunately, raw
data for the college‘s paper consumption and student/staff/faculty driving practices are not
available for the academic years of 2004-2005, 2005-2006, and 2006-2007, so the corresponding Total
GHG values are missing these emissions totals.
In the five years between academic years 2004-2005 and 2008-2009, total GHG emissions at
Warren Wilson College increased 3.5%. During this time, the total campus population grew by 14.7%
(from 986 to 1,131, for all students, staff, and faculty). During this period, the total square footage
of campus buildings that are inventoried increased by approximately 6.13%. In comparison to last
year (07-08), total GHG emissions decreased by 10.6%.
The college‘s carbon dioxide emissions are primarily the result of its electricity and natural
gas consumption, while methane emissions are the result of solid waste production and agricultural
WWC Annual Greenhouse Gas Emissions
Carbon Dioxide
Emissions (MT)
Methane Emissions (MT eCO2)
Nitrous Oxide
Emissions Total GHG (MT eCO2)
(MT eCO2)
2004-2005 4,560 154 35 4,782
2005-2006 4,850 136 37 5,215
2006-2007 4,469 214 30 5,337
2007-2008 5,162 208 74 5,536
2008-2009 4,473 215 79 4,951
Warren Wilson College Greenhouse Gas Emissions Inventory 2008-2009
7
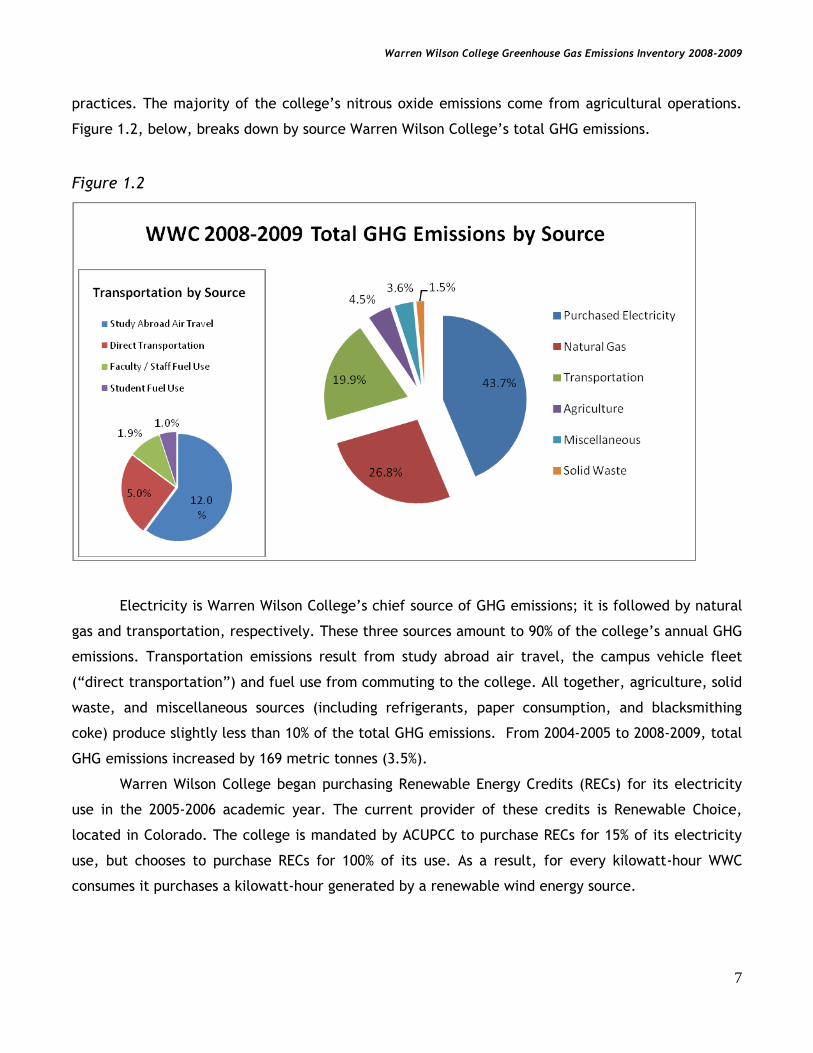
practices. The majority of the college‘s nitrous oxide emissions come from agricultural operations.
Figure 1.2, below, breaks down by source Warren Wilson College‘s total GHG emissions.
Figure 1.2
Electricity is Warren Wilson College‘s chief source of GHG emissions; it is followed by natural
gas and transportation, respectively. These three sources amount to 90% of the college‘s annual GHG
emissions. Transportation emissions result from study abroad air travel, the campus vehicle fleet
(―direct transportation‖) and fuel use from commuting to the college. All together, agriculture, solid
waste, and miscellaneous sources (including refrigerants, paper consumption, and blacksmithing
coke) produce slightly less than 10% of the total GHG emissions. From 2004-2005 to 2008-2009, total
GHG emissions increased by 169 metric tonnes (3.5%).
Warren Wilson College began purchasing Renewable Energy Credits (RECs) for its electricity
use in the 2005-2006 academic year. The current provider of these credits is Renewable Choice,
located in Colorado. The college is mandated by ACUPCC to purchase RECs for 15% of its electricity
use, but chooses to purchase RECs for 100% of its use. As a result, for every kilowatt-hour WWC
consumes it purchases a kilowatt-hour generated by a renewable wind energy source.

Warren Wilson College Greenhouse Gas Emissions Inventory 2008-2009
8
Figures 1.3 and 1.4, below, depict the five year trend of Warren Wilson College‘s annual GHG
emissions, with and without RECs.
Figure 1.3
Figure 1.4
Although total greenhouse gas emissions for the college increased by 3.53% from 2004-2005 to
2008-2009, when RECs are factored in, there was an almost 40% decrease in GHG emissions within
the same time-span.
↓ 10.57% Since last year
↑3.53% 5-year trend
↓ 15.56% Since last year
↓39.96% 5-year trend

Warren Wilson College Greenhouse Gas Emissions Inventory 2008-2009
9
C. Total Energy Costs
Total energy costs for all of the previous inventoried years have been updated for inclusion in
this year‘s inventory. In 2008-2009, the college spent $637,380 on energy (including electricity,
natural gas, and fuel used by the Campus Vehicle Fleet), which is a 12.97% increase from 2004-2005,
or a cost increase of $73,150. In addition to these direct energy costs, WWC also spent $19,712 on
RECs for electricity. While some of the total cost increase can be attributed to increased energy use,
much of it is instead the result of inflation. The Clean Air-Cool Planet Campus Carbon Calculator
adjusts energy costs for inflation, producing new figures which allow for a more accurate comparison
among years. Figures 1.5 and 1.6, below, depict the five year trend of total energy costs in both
actual dollars and dollars adjusted by the Calculator for inflation. For 2009-2010 Progress had an 11%
increase and is likely to have two more. The calculator will not be accurate for such a significant
increase so beware in the next inventory of using it.
Figure 1.5
Figure 1.6
↓ 5.96% Since last year
↑12.97% 5-year trend
↓ 7.89% Since last year
↑1.19% 5-year trend

Warren Wilson College Greenhouse Gas Emissions Inventory 2008-2009
10
III. The Three Major Emissions Sources
A. Electricity
Climate Action Plan Goal: ↓25% of 2007 GHG emissions by 2014
Electricity consumption is the largest source of greenhouse gas emissions at Warren Wilson
College. The college purchases its electricity from Progress Energy, which utilizes a variety of energy
sources. The precise percentage of electricity generation from each source was factored into the
Clean Air—Cool Planet Campus Carbon Calculator to ensure that the correct emissions factors were
used in all calculations for this inventory.
The breakdown of electricity generation sources for Progress Energy is depicted below, in
figure 2.1.
Figure 2.1

Warren Wilson College Greenhouse Gas Emissions Inventory 2008-2009
11
Table 2.1, below, depicts Warren Wilson College‘s total electricity consumption, costs, and
resulting GHG emissions over the past five years.
Table 2.1
Electricity Use by WWC
Total Use
(kWh)
Total Use per capita
(kWh) Costs
Costs per capita
Electricity GHG
Emissions (MT eCO2)
Electricity GHG
Emissions per capita
(MT eCO2)
2004-2005 4,337,732 4,399 $298,831 $303 2,087 2.1
2005-2006 4,333,775 4,187 $311,186 $301 2,091 2.0
2006-2007 4,403,183 4,242 $342,123 $330 2,127 2.0
2007-2008 4,426,319 4,114 $344,432 $320 2,124 2.0
2008-2009 4,312,467 3,812 $349,732 $309 2,070 1.8
From 2004-05 to 2008-09, annual electricity usage dropped by 0.58%, even though the campus
population increased by 14.70% (from 986 to 1131). However, despite the slight drop in usage, the
amount of money spent annually on electricity rose by 17.03%.

Warren Wilson College Greenhouse Gas Emissions Inventory 2008-2009
12
Figure 2.2, below, depicts the total electricity consumption of the college‘s top-consuming
buildings.
Figure 2.2
Note: Although Orr Cottage is LEED Gold Certified, it is metered together with Ransom, and the combined electricity usage of these buildings ranks them in the top 10 of total electricity consumers.
Gladfelter‘s air-conditioning system consumes about 15% of the total electricity used by the
college, making it the single largest user. This has been a trend over the last five years, but it is still
a significant figure, given the system is used for only a few months in a year, and it is not tied to
Gladfelter‘s lighting. Devries Gymnasium is the second largest consumer of electricity on campus,
followed by Hamill Science Center, which is commonly referred to as Morse and Witherspoon.
Sunderland is the only residence hall in the top ten ranking of electricity users, which is logical, since
it houses the most students of all residence halls on campus. Sunderland is also at the top of the
residence hall list in terms of greatest electricity consumption per capita.

Warren Wilson College Greenhouse Gas Emissions Inventory 2008-2009
13
Figure 2.3, below, depicts the breakdown of electricity consumption per capita of the
college‘s residence halls.
Figure 2.3

Warren Wilson College Greenhouse Gas Emissions Inventory 2008-2009
14
Figure 2.4, below, depicts the breakdown of electricity consumption per capita of the
college‘s non-residential buildings.
Figure 2.4

Warren Wilson College Greenhouse Gas Emissions Inventory 2008-2009
15
Figure 2.5, below, depicts building electricity use per building square foot.
Figure 2.5

Warren Wilson College Greenhouse Gas Emissions Inventory 2008-2009
16
From 2004-2005 to 2008-2009, Warren Wilson College‘s electricity usage decreased by 25,265
kWh, or about 0.6%. This reduction is notable, given that the total campus population increased by
14.7% during the same period of time. On a per capita basis, and without considering RECs, the
college‘s electricity-related GHG emissions decreased by 13.7% between 2004-2005 and 2008-2009.
The five year trend of electricity emissions per capita is depicted below, in figure 2.6.
Figure 2.6
From 2004-2005 to 2008-2009, the total cost of electricity rose by $50,901. However, during
the same period, electricity costs per capita dropped by $10.94. Figure 2.7, below, depicts the five
year trend of electricity costs per capita for the college.
Figure 2.7
↓ 7.11% Since last year
↓ 13.68% 5-year trend
↓ 3.42% Since last year
↑2.01% 5-year trend

Warren Wilson College Greenhouse Gas Emissions Inventory 2008-2009
17
1. Renewable / Alternative Energy
Warren Wilson College produces some solar energy on location. According to an agreement
made with the donor of the college‘s 13 kW photovoltaic array, the electricity is sold to the electric
grid at a premium rate, through the NC GreenPower program. In the 2008-2009 academic year, the
array produced 17,864 kWh. Revenue generated from selling this electricity to the grid is used to
fund energy efficiency efforts in the community surrounding Warren Wilson College. These efforts
help educate about and reduce total GHG emissions in the community.
Warren Wilson‘s Ecodorm includes a 2 KW solar array that provides electricity to the
residence hall, and a solar water heating system, that provides domestic hot water and fuels the
residence hall‘s radiant in-floor heating system. In addition, the college operates three geothermal
heat pump systems that provide heating and cooling to the Jensen, Laursen, and Orr Cottage
buildings. Many other buildings on campus utilize passive solar heating and day-lighting, which helps
decrease the buildings‘ energy consumption.

Warren Wilson College Greenhouse Gas Emissions Inventory 2008-2009
18
B. Natural Gas
Climate Action Plan Goal: ↓20% of 2007 GHG emissions by 2014
Emissions from Natural Gas constitute 27% of the college‘s total GHG emissions. Natural Gas
is used to heat campus buildings and also, to a much smaller extent, to heat water and cook food.
Table 3.1, below, depicts Warren Wilson College‘s natural gas usage, costs, and GHG
emissions for the past five years.
Table 3.1
Natural Gas Use by WWC
Total Use (therms)
Total Use per capita
(therms) Costs Costs per
capita
Natural Gas GHG Emissions (MT eCO2)
Natural Gas GHG
Emissions per capita (MT eCO2)
2004-2005 227,913 231 $153,946 $156 1,206 1.2
2005-2006 227,933 220 $233,443 $226 1,206 1.2
2006-2007 249,029 240 $209,162 $202 1,318 1.3
2007-2008 227,828 212 $185,873 $173 1,205 1.1
2008-2009 240,465 213 $223,539 $198 1,272 1.1 Note: A therm is equal to 100 cubic feet of natural gas.
Since 2004-2005, natural gas usage has increased by 12,552 therms, or 5.5%. This has resulted
in an increase of 66.5 metric tons of eCO2 emissions. On a per square foot basis, the increase in GHG
emissions was even greater, rising 7.2% during this period. However, on a per capita basis, GHG
emissions actually decreased by 8.0% from 2004-2005 to 2008-2009.

Warren Wilson College Greenhouse Gas Emissions Inventory 2008-2009
19
Figure 3.1, below, depicts the total natural gas consumption of the college‘s top-consuming
buildings.
Figure 3.1
The Boiler Room is high in usage because it directly heats or dispenses natural gas to multiple
buildings on campus: Bannerman, Carson, Spidel, Dodge, Gladfelter, the Library, the Work Program
Office, Morse, Witherspoon, Ogg, Fletcher, Ransom, the Blacksmith Shop, the Greenhouses, the Paint
Shed, the Recycling Complex, the Piggery (Farrowing House), the Garden Cabin, FMTS, and the Farm
Office. Since all of these buildings are metered together, we do not know the precise natural gas
usage of each included building. However, we can estimate the individual usages by assuming that
each building uses natural gas in proportion to its size. Since we know the area of each building, as
well as the combined area of all the buildings on the meter, we can correlate a single building‘s
percentage of total area to its percentage of total natural gas consumption, thereby deriving an
estimate of therms per square foot for each building heated by or provided natural gas through the
Boiler Room.

Warren Wilson College Greenhouse Gas Emissions Inventory 2008-2009
20
Figure 3.2, below, depicts the breakdown of natural gas consumption per square foot of the
college‘s residence halls.
Figure 3.2

Warren Wilson College Greenhouse Gas Emissions Inventory 2008-2009
21
Figure 3.3, below, depicts the breakdown of natural gas consumption per square foot of the
college‘s non-residential buildings (the usage of buildings connected to the boiler room has been
approximated).
Figure 3.3

Warren Wilson College Greenhouse Gas Emissions Inventory 2008-2009
22
Figure 3.4, below, depicts which buildings consume the most natural gas per capita (the
usage of buildings connected to the boiler room has been approximated).
Figure 3.4

Warren Wilson College Greenhouse Gas Emissions Inventory 2008-2009
23
Figure 3.5, below, depicts the five year trend of natural gas GHG emissions per square foot.
Figure 3.5
From 2004-2005, the total annual cost of natural gas for the college rose by $69,593, or
45.2%.
Figure 3.6, below, depicts the five year trend of natural gas costs.
Figure 3.6
↑ 3.59% Since last year
↓0.64% 5-year trend
↑14.39% Since last year
↑25.56% 5-year trend

Warren Wilson College Greenhouse Gas Emissions Inventory 2008-2009
24
C. Transportation
Climate Action Plan Goal: ↓50% of 2007 GHG emissions by 2014
1. International Flights
The college-sponsored study abroad air travel portion of transportation is the third largest
greenhouse gas emissions sector, at 12% of the total GHG emissions. The study abroad trips are a
crucial component of Warren Wilson College‘s educational offerings. They provide students with
enriching global learning experiences. Dozens of students participate in the study abroad programs
each year and some of the program costs are covered by tuition.
For inclusion within the inventory, annual round trip air travel mileage has been multiplied by
the number of study abroad passengers to yield a figure for passenger miles. Passenger miles were
imported into the Clean Air-Cool Planet Campus Carbon Calculator to determine the total emissions
for the college-sponsored study abroad flights.
Each year the college selects different program destinations, which means that round trip
mileage varies considerably from year to year. The number of participants also varies, so passenger
mileage is affected. Thus, increases or decreases in total GHG emissions among years are not
indicative of any particular trend. Table 4.1, below, depicts the total passenger miles per year and
the resulting GHG emissions (in pounds).

Warren Wilson College Greenhouse Gas Emissions Inventory 2008-2009
25
Table 4.1
Warren Wilson College International Flights
Passenger Miles
International Flights GHG Emissions (MT eCO2)
GHG Emissions per participant (MT eCO2)
2004-2005 1,126,931 875 10.2
2005-2006 1,416,440 1,100 12.8
2006-2007 738,668 573 6.7
2007-2008 1,282,706 996 11.6
2008-2009 729,957 567 6.6
From 2004-2005 to 2008-2009, study abroad passenger miles decreased by 35%; so did total
GHG Emissions. At least three student participants chose to purchase carbon offsets for their travel;
the college always encourages this option.
Figure 4.1, below, depicts the five year trend of study-abroad air travel GHG Emissions.
Figure 4.1
↓ 43.07% Since last year
↓ 35.2% 5-year trend

Warren Wilson College Greenhouse Gas Emissions Inventory 2008-2009
26
2. Student, Staff, and Faculty Fuel Use (from commuting)
The Warren Wilson College community has chosen to track and include fuel usage from
commuting in its annual GHG inventory. Automotive fuel usage by members of the campus population
is estimated each year by surveying students, staff, and faculty during the academic year of the
relevant inventory. For this inventory, the campus population was surveyed during the Spring
semester of 2008-2009, while in previous inventories the survey was issued in the fall semesters.
Table 5.1, below, depicts annual fuel usage by the various sectors of the population, and the
resulting GHG emissions.
Table 5.1
2008-2009 WWC Faculty, Staff and Student Commuting
Total Gas & Diesel Usage
(gallons)
Total Gas & Diesel Usage per
capita (gallons)
Commuting GHG
Emissions (MT eCO2)
Commuting GHG
Emissions per capita
(MT eCO2) Faculty 2,970 39 27 0.35
Staff 7,288 54 65 0.49
Resident Students 2,022 2 18 0.02
Day Students 3,359 33 30 0.30
Gas and Diesel consumption per capita is the most accurate representation of the primary
users of fuel at the college. The survey revealed that staff members consume the most fuel per
capita, at 54 gallons per person. Faculty consumption follows at 39 gallons per capita, while day
students consume 33 gallons per capita. Resident students consume much less fuel: only 2 gallons per
person for the year. The fuel use for each group reflects the gallons of fuel that are consumed in the

Warren Wilson College Greenhouse Gas Emissions Inventory 2008-2009
27
commute to and from Warren Wilson College. About 90% of the college‘s enrolled students live on
campus, and freshman are not permitted to have cars. In addition, the college mandate of 15 hours
per week of on-campus work for each student discourages most resident students from obtaining
outside employment. Thus, it is not surprising that fuel consumption due to commuting is so low for
resident students. However, since about 1/3 of staff and faculty live on campus, it is interesting that
the fuel use for these groups outweighs the fuel use of day students.
It is not accurate to construct a five-year trend for student, staff, and faculty fuel use
because the total gallons consumed were calculated by the Clean Air—Cool Planet Campus Carbon
Calculator for this inventory, but not for previous inventories. Instead, previous inventories relied
upon student-created templates, which yielded much higher estimates of fuel use than the
Calculator produces. It was hoped that the raw numbers which were used to calculate gallons in
previous years could be imported into the Calculator, but this was not an option because previous
inventories asked survey questions which are incompatible with the Calculator.
Figure 5.1, below, depicts a comparison of the fuel use by the four sectors of commuters, for
the 2008-2009 year.
Figure 5.1

Warren Wilson College Greenhouse Gas Emissions Inventory 2008-2009
28
3. Campus Vehicle Fleet Fuel Use
The Campus Vehicle Fleet is composed of all the vehicles Warren Wilson College maintains for
use in work crews, service trips, academics, athletics, and the Motorpool (which provides cars to
community members for school-related purposes). ―Direct Transportation,‖ when used in this
inventory, refers to the Campus Vehicle Fleet in combination with the propane (1019 gallons) used in
the landscaping crew‘s lawnmowers and the off-road diesel fuel (1203 gallons) purchased by Warren
Wilson College in 2008-09. ―Direct Transportation‖ thus represents a sum total of all fuel
consumption by on-campus college-owned vehicles. At 5% of the total GHG Emissions, Direct
Transportation is the fourth largest emitter at the college.
Table 6.1, below, summarizes fuel use of the Campus Vehicle Fleet over the past five years
(excluding propane and off-road diesel use).
Table 6.1
WWC Campus Vehicle Fleet Fuel Summary
Academic Year Total Fuel
Usage (gallons*)
Total Fuel Usage per
capita (gallons)
Costs Average Cost per
gallon fuel**
Fleet Fuel GHG Emissions (MT eCO2)
2004-2005 23,041 23.4 $46,817 $1.92 209.6
2005-2006 27,831 26.9 $66,999 $2.58 241.6
2006-2007 27,550 26.5 $76,868 $2.60 238.2
2007-2008 29,857 27.7 $88,239 $2.96 264.5
2008-2009 26,613 23.5 $60,337 $2.27 235.9 * This is combined gallons gas and diesel fuel. ** Before 2007-08, national average fuel prices were used. In 2007-08 and 2008-09, calculations of total cost and average fuel prices were provided by John Verba, Office Manager/Motorpool Supervisor. ***In contrast to previous inventory years, total GHG Emissions were computed by the Clean Air—Cool Planet Campus Carbon Calculator, instead of by self-generated templates (previous years‘ data was imported into the Calculator to generate new totals).
According to the recomputed totals, annual fuel usage by the Campus Vehicle Fleet has
increased by 3,572 gallons, or 15.5%, since 2004-2005. Subsequent emissions have risen by 12.5%.

Warren Wilson College Greenhouse Gas Emissions Inventory 2008-2009
29
Figure 6.1, below, depicts the five year trend of Campus Vehicle Fleet Fuel Use.
Figure 6.1
The five-year increase in fuel use is significant, given that the average cost per gallon of fuel
rose by 18.22% from 2004-05 to 2008-09. The total cost of fuel to the college has risen by 28.88%, or
$13,520, during the five year period. Interestingly, usage dropped when average fuel prices
dropped; from 2007-08 to 2008-09, fuel consumption by the campus vehicle fleet dropped by 10.87%,
alongside a 23.31% drop in the price per gallon.
Figure 6.2, below, depicts campus vehicle fleet fuel usage on a per capita basis, for the five
year trend.
Figure 6.2
↓ 10.87% Since last year
↑15.50% 5-year trend
↓ 15.16% Since last year
↑ 0.43% 5-year trend

Warren Wilson College Greenhouse Gas Emissions Inventory 2008-2009
30
The above representation is only partly accurate, as it is flawed by the fact that previous
inventory authors have gathered campus vehicle fleet fuel usage in different ways. In 2004-05 and
2005-06, ―fuel purchases from the Autoshop were used to extrapolate usage, and only work crews,
service-learning trips, and athletic game trips were estimated.‖2 The author of the 2006-07 inventory
instead examined and summed data from the individual gas logs. In 2007-08 and 2008-09, compiled
fuel usage was provided directly to the inventory author by the WWC Motor Pool. The different
methods of data collection certainly affect the estimates of campus vehicle fleet fuel use and
associated emissions. As of last year, ―Crew- and department-specific fuel use information is
available in quarterly energy reports produced by the Environmental Leadership Center of WWC.‖1
IV. The Remaining Sources
A. Solid Waste
The disposal and burial of solid waste into landfills results in decomposition which releases
methane into the atmosphere. Warren Wilson College operates a composting program which serves to
reduce methane production from our waste stream, since the process of aerobic composting does not
produce methane. In 2006-2007 and 2008-2009, the Buncombe County Landfill conducted partial
flaring of the accumulated waste, which acts to reduce total GHG emissions (in prior inventory years,
no flaring was done).
Table 7.1, below, depicts Warren Wilson‘s waste stream for the past five years.
Table 7.1
WWC Solid Waste GHG Emissions Summary
Material 2004-05
(short tons) 2005-06
(short tons) 2006-07
(short tons) 2007-08
(short tons) 2008-09
(short tons)
to landfill: Trash 326.4 279.5 255.2 257.4 259.1
diverted from landfill:
Recycling 137.1 134.9 163.6 181.2 142.8
Reusables 3.0 2.1 3.0 4.9 3.4
Compost 0.0 32.5 21.3 31.7 24.9
TOTAL 466.5 449.0 443.0 475.1 430.2

Warren Wilson College Greenhouse Gas Emissions Inventory 2008-2009
31
Landfilled solid waste produces the most methane of all sources at Warren Wilson College.
When it is weighted in terms of its global warming potential, in carbon dioxide equivalents, the
methane produced by decomposing solid waste accounts for 1% of the college‘s total GHG Emissions.
Due to a reconstruction of the program, no composting occurred in 2004-05, but it has occurred in all
following years.
If the college did not participate in composting, its waste-related GHG emissions still would
have decreased by 20.6% from 2004-05 to 2008-09. However, thanks to composting, actual solid
waste GHG emissions have been reduced by 31.0% during this period.
Figure 7.1, below, depicts the comparison of what our GHG emissions would have been
without composting to what they actually were, in a five year trend.
Figure 7.1
ACTUAL ↓ 31.03%
5-year trend
WITHOUT COMPOSTING
↓ 20.61% 5-year trend

Warren Wilson College Greenhouse Gas Emissions Inventory 2008-2009
32
Figure 7.2, below, depicts the same comparison, but in GHG emissions per capita.
Figure 7.2
B. Agriculture
Warren Wilson College operates a farm, which produces agricultural emissions of methane
(from animals and their waste) and nitrous oxide (from fertilizers). Methane and nitrous oxide are
greenhouse gases with higher global warming potential than carbon dioxide. The Clean Air—Cool
Planet Campus Carbon Calculator allowed input of amounts of fertilizer (both organic and synthetic)
used and also numbers of animals (horses, pigs, cattle, chickens, and goats) maintained on the farm.
Previous inventories (before 2007-08) did not differentiate between organic fertilizer and synthetic
fertilizer.
ACTUAL ↓ 30.86%
5-year trend
WITHOUT COMPOSTING
↓ 20.99% 5-year trend

Warren Wilson College Greenhouse Gas Emissions Inventory 2008-2009
33
The resulting 2008-09 agricultural GHG emissions, as computed by the Calculator, are
depicted in Figure 8.1, below.
Figure 8.1
Note: Emissions from vehicles associated with agriculture have been included within the Direct Transportation category.
In 2008-2009, the nitrous oxide released from fertilizer application accounted for 0.94% of the
college‘s total GHG Emissions, while the methane produced by livestock accounted for 3.52% of the
total. From 2004-05 to 2008-09, methane production increased by 118%, while nitrous oxide
production increased by 263%, due to an augmentation in fertilizer application and numbers of
animals. Total GHG Emissions increased by 185%, or 124.6 MT.
Figure 8.2, below, depicts the five year trend of GHG Emissions from agriculture.
Figure 8.2
↑ 10.10% Since last year
↑ 185.43% 5-year trend

Warren Wilson College Greenhouse Gas Emissions Inventory 2008-2009
34
C. Miscellaneous
The Miscellaneous sector, as referred to in this inventory, consists of GHG emissions from 1)
the used motor oil burned (in previous years) at the Autoshop; 2) escaped refrigerants; 3) paper
consumption; and 4) coke used by the blacksmithing crew. Before the 2007-08 inventory, propane
was also included in Miscellaneous; it is now categorized under ―Direct Transportation.‖ The 2007-08
and 2008-09 inventories are the only ones which have tabulated paper consumption and lost
refrigerants, because the Clean Air—Cool Planet Campus Carbon Calculator specifically asks for these
values. However, for the purpose of accurate comparison, an attempt was made to collect previous
years‘ values for used motor oil, lost refrigerants, and blacksmithing coke; these, when available,
were imported into the Calculator. Unfortunately there was no way to compute paper consumption
for the previous years, since it is not tracked by the college.
In 2008-09, the Autoshop ceased burning used motor oil, but it was left in the category of
Miscellaneous for comparison purposes with last year.
Table 9.1, below, depicts the total use and resulting GHG Emissions for Miscellaneous sources
in 2008-09.
Table 9.1
2008-2009 WWC Miscellaneous GHG Emissions
Source Total Use Total GHG Emissions
(MT eCO2)
Used Motor Oil (Furnace)
0 gal. 0 MT
Paper Purchasing 22,000 lbs. 22.6 MT
Coke (Blacksmith) 2.5 short tons 4.8 MT
Refrigerants (escaped/lost)
188 lbs. 144.4 MT
Warren Wilson College Greenhouse Gas Emissions Inventory 2008-2009
35
These sources comprise 4% of the college‘s total GHG Emissions. Since previous inventories
tracked different items as part of the ―Miscellaneous‖ category, it would not be accurate to sum the
miscellaneous category for a five-year trend comparison. However, since the individual values are
mostly available, comparisons are possible. Since 2005-06 (the first year for which all values, except
paper, are known), 1) used motor oil consumption has decreased by 2,000 gallons (100%); 2) coke
usage has increased by 1 short ton (67%); 3) refrigerants lost have decreased by 46 pounds (20%).
1. Future Initiative: Food Policy & GHG Emissions
Warren Wilson College also produces emissions through the food consumed in the campus
dining locations. Gladfelter Cafeteria and Cowpie Café are contracted with Sodexo, Inc., but they
also serve some food from the college‘s farm and garden. In addition, the farm and garden host
garden markets and meat sales, supplying food directly to the college community. There has never
been a study on emissions quantities from food consumption, but the college had always aimed to
make this a sustainable sector. It is ―currently working through its Sustainable Foods Policy Task
Force to design and implement a local foods policy to guide purchases through Sodexo and develop a
formula to prioritize purchase of foods with fewer miles traveled,‖1 thereby reducing GHG emissions.

Warren Wilson College Greenhouse Gas Emissions Inventory 2008-2009
36
V. Conclusion
Compiling an annual Greenhouse Gas Emissions Inventory enables Warren Wilson College to
critically assess its environmental impact both in the present and over time. Table 10.1, below,
depicts the five year sum changes in GHG Emissions for the various sectors discussed in this
inventory.
Table 10.1
WWC Percent Change in GHG emissions from 2004-05 to 2008-09
Sector Per Capita Per Square Foot Total
Overall Total ↓ 9.69% ↑ 5.23% ↑ 3.53% Electricity* ↓ 13.68 ↓ 6.32% ↓ 0.81% Natural Gas ↓ 8.01% ↓ 0.64% ↑ 5.51%
Transportation** n/a n/a ↓ 33.45%
Study Abroad International Flights ↓ 43.51% n/a n/a
Staff / Faculty Commuting** ↓ 55.16% n/a n/a
Student Commuting** ↓ 50.56% n/a n/a Campus Vehicle Fleet ↓ 1.88% n/a n/a
Solid Waste (landfill only) ↓ 30.80% n/a ↓ 20.62 Solid Waste (total) ↓ 30.86% n/a ↓ 31.03%
Miscellaneous*** ↓ 33.88% n/a ↓ 27.75%
*This is not including RECs. ** This is for a two year trend; 2007-08 to 2008-09, because these two years are the only ones for which raw commuting data was available for input in the Clean Air—Cool Planet Campus Carbon Calculator for emissions calculations. However, survey questions varied between years, causing some of the percent change. ***This is for a three-year trend; 2005-06 to 2008-2009. Individual values for the items in what is now known as the Miscellaneous category were tallied up for 2005-06 as for 2008-09, for comparison. Paper was not included, since the figure is not known for 2005-06.
The above trends and those cited throughout this inventory are not just summaries of data;
they are crucial indicators of Warren Wilson College‘s progress towards sustainability and carbon
neutrality. These are figures that will be relied upon as the college continues to structure policies
and decide upon long-term plans. For instance, ―the presidentially-appointed Greenhouse Gas

Warren Wilson College Greenhouse Gas Emissions Inventory 2008-2009
37
Emissions Reduction Task Force and its Behavior Change Committee will [utilize] this information to
help generate institutional goals and campaign plans for energy and emissions reductions as it guides
the College toward a more sustainable future.‖ 3 The inventory is thus crucial to the support of the
American College and University Presidents Climate Commitment and WWC‘s Climate Action Plan. In
addition, it is hoped that future inventories will be able to examine more sectors in order to draw a
more complete vision of the college‘s current impact on the environment.
VI. Areas for Improving the Inventory
In line with the observation of last year’s inventory author, ―The most impactful way to improve
this inventory would be to improve College record- keeping. More organized, accessible, and
formatted data would reduce time investment required and increase accuracy.‖1
Data collection could be improved through the following actions:
Sub-meter the buildings which are heated by or receive their natural gas from the Boiler
Room. Doing so would allow WWC to understand the actual energy consumption of each
building, rather than relying on informed estimates when making sustainability decisions.
Track miles logged and fuel consumed for business travel by all departments.
Track water usage by building.
Track all building energy efficiency improvements by date and amount invested so as to be
able to calculate return on investment if a drop in energy usage occurs.
Track paper purchasing more accurately (currently, this figure is a best estimate).

Warren Wilson College Greenhouse Gas Emissions Inventory 2008-2009
38
VII. Appendix I: In Detail Methods and Data by Source
Electricity
Electricity data was gathered from the Progress Energy website (http://www.progress-
energy.com/), which provides access to monthly bills for all on-campus electricity meters. The data
was tabulated in Microsoft Excel and individual building electricity consumption was computed. The
sum annual electricity usage for the college was then input into the Clean Air—Cool Planet Campus
Carbon Calculator to generate total GHG emissions from electricity. Costs were also computed.
Natural Gas
Natural gas data was collected from the PSNC website, located at
http://www.psncenergy.com. The data was tabulated in Microsoft Excel and individual building
natural gas consumption was computed. The sum annual usage for the college was then input into
the Clean Air—Cool Planet Campus Carbon Calculator to generate total GHG emissions from natural
gas. Costs were also computed.
International Travel
The college International Programs office supplied itineraries and total passengers for each
of the college-sponsored study abroad trips that occurred in this year. The distance traveled from
location to location on the itineraries was then calculated by using the Geobytes City Distance
Tool.2 The total mileage was multiplied by the number of WWC student passengers to get passenger
miles, the sum of which was entered into the Campus Carbon Calculator for GHG emissions
calculations.
Staff, Faculty, and Student Commuting
Fuel Use surveys were issued to the WWC community in the Spring semester of 2008-2009.
The raw numbers generated from the responses were tabulated and entered into the Campus
Carbon Calculator for GHG emissions calculations.

Warren Wilson College Greenhouse Gas Emissions Inventory 2008-2009
39
Campus Vehicle Fleet
Methods were as stated in the 2007-2008 Greenhouse Gas Emissions Inventory:
―This inventory included all gasoline and diesel purchased for use in campus fleet vehicles.
Record keeping was inadequate to calculate the total exact miles driven, and no records exist for
gasoline purchases made on long-distance trips – such as those often made by sectors like athletics
and service-learning; also, the Autoshop loans vehicles to departments on campus, and the amount
of miles traveled for those vehicle is logged in separate data sheets. However, the sum of all
vehicle fuel sold through the campus pumps is available since it is recorded by accounting, and this
was entered into the Campus Carbon Calculator.
The information that was available on fuel usage and corresponding cost were provided in
Excel spreadsheets by the Office Manager / Motor Pool Supervisor. While the Calculator only calls
for the combined total gallons of vehicle fuel (gasoline and diesel) consumed, the College does have
more specific data on the breakdown by crew or department on record should this be needed in the
future.‖1
Solid Waste
The Recycling and Solid Waste Manager provided a spreadsheet with all current and
historical solid waste data tabulated. The historical data was updated for this inventory, as an error
in past calculations was discovered. Raw data was input into the Campus Carbon Calculator, which
considers composting an ―offset with additionality,‖ meaning that ―the methane production avoided
by diverting composted material from the landfill is now counted in the total College’s GHG
emissions but discounted in its net emissions.‖1
Agriculture Agricultural data was supplied by the WWC Farm Manager. The data, including the number of
farm animals, pounds of synthetics fertilizer, pounds of organic fertilizer, and percent of nitrogen
in the fertilizers, was input into the Clean Air—Cool Planet Campus Carbon Calculator to generate
total GHG emissions from agriculture.

Warren Wilson College Greenhouse Gas Emissions Inventory 2008-2009
40
Miscellaneous Sources
Used Motor Oil
The Autoshop supervisor reported that no used motor oil was burned in the Autoshop for
heating this year, as a departure from previous years.
Propane
The Purchasing Department director provided a spreadsheet of the total gallons of propane
purchased by the landscaping crew each month for use in the riding lawnmowers. This information
was then input in the Clean Air—Cool Planet Campus Carbon Calculator.
Refrigerants
Refrigerants were first included in the 2007-2008 inventory, and the same methods of
collecting the data were used for this year’s inventory: ―Data on refrigerant usage and loss were
provided by the HVAC crew in Excel spreadsheets, and the poundage of escaped (non-recovered)
refrigerants from July 200[8] to June 200[9] was entered into the Campus Carbon Calculator.‖1
Paper Purchasing
Paper purchasing was first included in the 2007-2008 inventory, and the same methods of
collecting the data were used for this year’s inventory: ―The College Press Manager was interviewed
and gave an estimate for the amount of paper products purchased by the College in the 0[8]-0[9]
academic year.‖
Coke
The Blacksmithing crew supervisor provided via email the figure for total tons of coke
burned this year. As with last year’s inventory, ―It was assumed that emissions are similar to the
burning of conventional coal, and this information was entered into the Calculator as ―Coal (Steam
Coal)‖ under the On Campus Stationary category.‖1

Warren Wilson College Greenhouse Gas Emissions Inventory 2008-2009
41
VIII. Appendix II: Data
More information about the GHG emissions of Warren Wilson College is available through the
ACUPCC Reporting System at http://acupcc.aashe.org. For more detailed data regarding specific
sources mentioned in this inventory, or for other comments or questions, contact Stan Cross,
Environmental Leadership Center Education Director and Campus Greening Crew Supervisor,
IX. References & Footnotes
Clean Air–Cool Planet Campus Carbon Calculator. Available at http://www.cleanair-coolplanet.org
1 Mark Begley, 2007-2008 WWC Emissions Inventory