warrick's mobile home park
TRANSCRIPT

OFFERING MEMORANDUM
Warrick's MobileHome Park
Orchard StreetPort Byron, NY 13140

Warrick's Mobile Home ParkCONTENTS
Exclusively Marketed by:
Steven Tomaso
We obtained the following information above from sources we believe to be reliable. However, we have not verified its accuracy and make no guarantee, warranty or representation about it. It is submitted subject to the possibility of errors, omissions, change of price, rental or otherconditions, prior sale, lease or financing, or withdrawal without notice. We include projections, opinions, assumptions or estimates for example only, and they may not represent the current or future performance of the property. You and your tax and legal advisors should conduct yourown investigation of the property and transaction.
01 Executive Summary Investment Summary 5 Location Summary 6
02 Property Description Aerial Map 8
03 Rent Roll Rent Roll Details 10
04 Financial Analysis Income & Expense Analysis 12 Multiyear Cash Flow Assumptions 13 Cash Flow Analysis 14
05 Demographics Demographics 17 Demographic Charts 18

The information contained in the following offering memorandum is proprietary and strictly confidential. It is intended to be reviewed only by the party receiving it from IRE Investment and it shouldnot be made available to any other person or entity without the written consent of IRE Investment. By taking possession of and reviewing the information contained herein the recipient agrees to hold and treat all such information in the strictest confidence. The recipient further agrees thatrecipient will not photocopy or duplicate any part of the offering memorandum. If you have no interest in the subject property, please promptly return this offering memorandum to IRE Investment.This offering memorandum has been prepared to provide summary, unverified financial and physical information to prospective purchasers, and to establish only a preliminary level of interest inthe subject property. The information contained herein is not a substitute for a thorough due diligence investigation. IRE Investment has not made any investigation, and makes no warranty or representation withrespect to the income or expenses for the subject property, the future projected financial performance of the property, the size and square footage of the property and improvements, the presenceor absence of contaminating substances, PCBs or asbestos, the compliance with local, state and federal regulations, the physical condition of the improvements thereon, or financial condition orbusiness prospects of any tenant, or any tenant’s plans or intentions to continue its occupancy of the subject property. The information contained in this offering memorandum has been obtained from sources we believe reliable; however, IRE Investment has not verified, and will not verify, any of the informationcontained herein, nor has IRE Investment conducted any investigation regarding these matters and makes no warranty or representation whatsoever regarding the accuracy or completeness ofthe information provided. All potential buyers must take appropriate measures to verify all of the information set forth herein. Prospective buyers shall be responsible for their costs and expenses ofinvestigating the subject property.
Warrick's Mobile Home Park Confidentiality and Disclaimer | 03
CONFIDENTIALITY AND DISCLAIMER
PROPERTY SHOWINGS ARE BY APPOINTMENT ONLY.PLEASE CONTACT IRE INVESTMENT FOR MORE DETAILS.Copyright © 2019 CREOP, LLC. All Rights Reserved.

Warrick's M
obile Hom
e Park | Executive Summ
ary
Executive Summary
WA
RR
ICK
'S M
OB
ILE
HO
ME
PAR
K
01
......
......
......
......
......
......
......
......
Investment Summary
Location Summary

Warrick's Mobile Home Park Investment Summary | 05
OFFERING SUMMARYADDRESS Orchard Street
Port Byron NY 13140COUNTY CayugaACRES 4NUMBER OF UNITS 22OWNERSHIP TYPE Fee Simple
FINANCIAL SUMMARYOFFERING PRICE $699,000PRICE PER UNIT $31,773OCCUPANCY 96.00 %NOI (CURRENT) $55,372NOI (2021) $62,013CAP RATE (CURRENT) 7.92 %CAP RATE (2021) 8.87 %GRM (CURRENT) 6.60GRM (2021) 6.41
PROPOSED FINANCINGLOAN TYPE Fully AmortizedDOWN PAYMENT $209,700LOAN AMOUNT $489,300INTEREST RATE 5.35 %ANNUAL DEBT SERVICE $35,534LOAN TO VALUE 70 %AMORTIZATION PERIOD 25 YearsNOTES Presumable savings and loan bank
financing
DEMOGRAPHICS 1 MILE 3 MILE 5 MILE2019 Population 1,549 3,105 8,5272019 Median HH Income $51,750 $54,207 $60,0492019 Average HH Income $59,709 $64,968 $74,611
*10 sites of the 22 site park is classified as 55+
*City water and city sewer
*Long term owner
*Park in very good condition
*Well maintained landscaping

Warrick's Mobile Home Park Location Summary | 06

Warrick's M
obile Hom
e Park | Property Description
Property Description
WA
RR
ICK
'S M
OB
ILE
HO
ME
PAR
K
02
......
......
......
......
......
......
......
......
Aerial Map
Parcel Map

Warrick's Mobile Home Park Aerial Map | 08

Warrick's M
obile Hom
e Park | Rent R
oll
Rent Roll
WA
RR
ICK
'S M
OB
ILE
HO
ME
PAR
K
03
......
......
......
......
......
......
......
......
Rent Roll Details
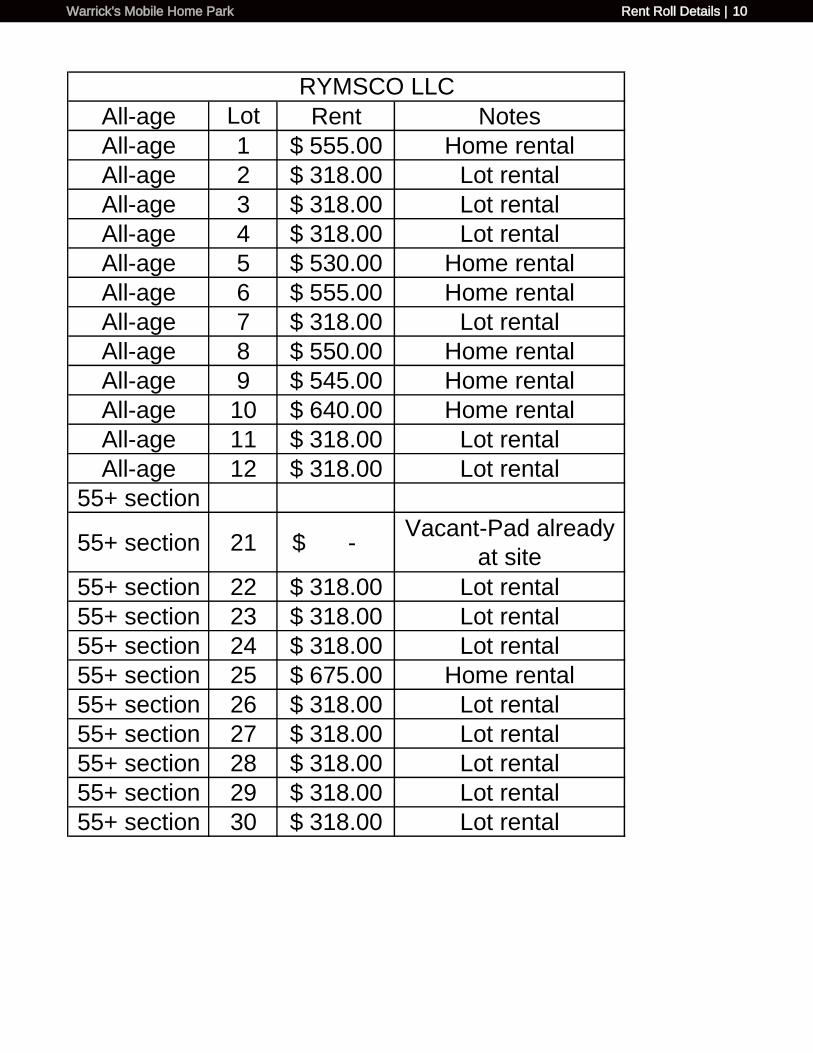
All-age Lot Rent Notes
All-age 1 555.00$ Home rental
All-age 2 318.00$ Lot rental
All-age 3 318.00$ Lot rental
All-age 4 318.00$ Lot rental
All-age 5 530.00$ Home rental
All-age 6 555.00$ Home rental
All-age 7 318.00$ Lot rental
All-age 8 550.00$ Home rental
All-age 9 545.00$ Home rental
All-age 10 640.00$ Home rental
All-age 11 318.00$ Lot rental
All-age 12 318.00$ Lot rental
55+ section
55+ section 21 -$ Vacant-Pad already
at site
55+ section 22 318.00$ Lot rental
55+ section 23 318.00$ Lot rental
55+ section 24 318.00$ Lot rental
55+ section 25 675.00$ Home rental
55+ section 26 318.00$ Lot rental
55+ section 27 318.00$ Lot rental
55+ section 28 318.00$ Lot rental
55+ section 29 318.00$ Lot rental
55+ section 30 318.00$ Lot rental
RYMSCO LLC
Warrick's Mobile Home Park Rent Roll Details | 10
Warrick's M
obile Hom
e Park | Financial Analysis
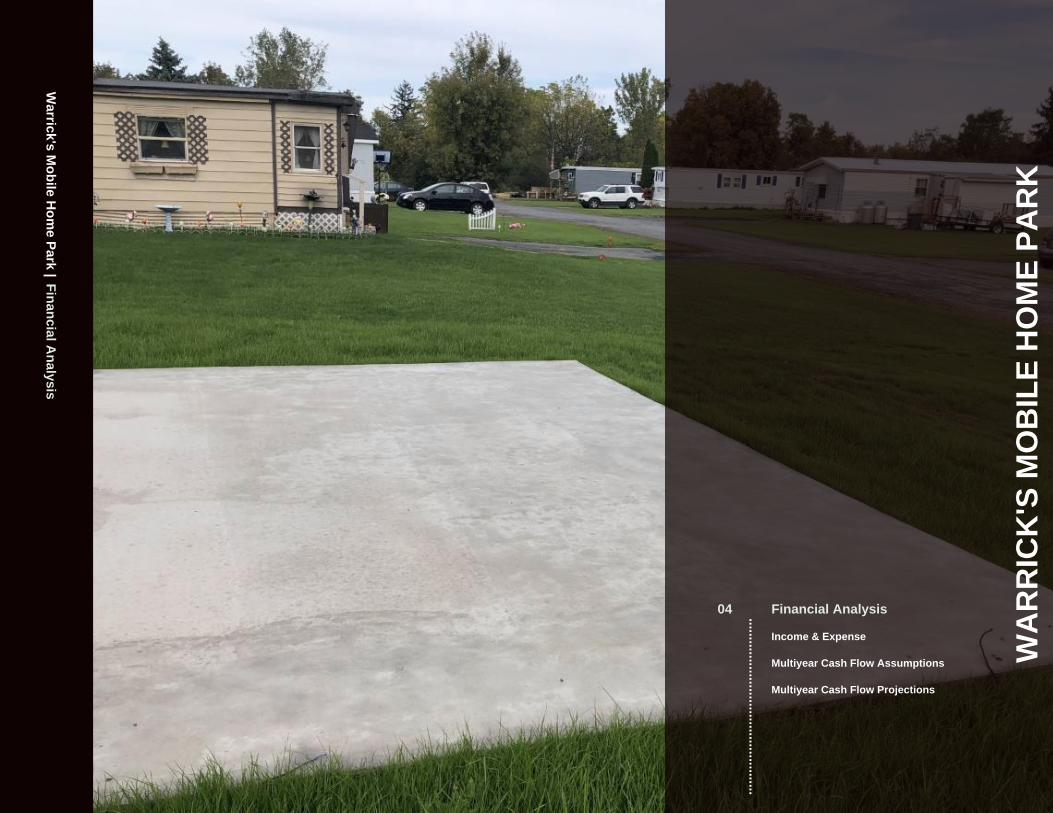
Financial Analysis
WA
RR
ICK
'S M
OB
ILE
HO
ME
PAR
K
04
......
......
......
......
......
......
......
......
Income & Expense
Multiyear Cash Flow Assumptions
Multiyear Cash Flow Projections

Warrick's Mobile Home Park Income & Expense Analysis | 12
INCOME CURRENT 2021Gross Potential Income $105,840 $109,015
Less: General Vacancy $3,816
Effective Gross Income $102,024 $109,015
Less: Expenses $46,652 $47,002
Net Operating Income $55,372 $62,013
Principal Reduction $9,356 $9,356
Total Return 13.9 % $29,194 17.1 % $35,836
Income Notes: Rental rate increases take place on January 1. Pro-forma includes last lot beingfilled and 3% annual lot rent increases.
EXPENSES CURRENT 2021
Real Estate Taxes $577 $12,694 $577 $12,694
Insurance $86 $1,881 $86 $1,881
Management Fee $232 $5,101 $248 $5,451
Marketing $11 $241 $11 $241
Repairs & Maintenance $297 $6,531 $297 $6,531
Administration $20 $435 $20 $435
Utilities $899 $19,769 $899 $19,769
Total Operating Expense $2,121 $46,652 $2,136 $47,002
Annual Debt Service $1,615 $35,534 $1,615 $35,534
% of EGI 45.73 % 43.11 %
Per Unit Per Unit
REVENUE ALLOCATION
DISTRIBUTION OF EXPENSES

Warrick's Mobile Home Park Multiyear Cash Flow Assumptions | 13
GLOBALSale Price $699,000
INCOMEGross Potential Rent 3.00 %
EXPENSESReal Estate Taxes 1.40 %Insurance 1.40 %Marketing 1.40 %Repairs & Maintenance 1.40 %Administration 1.40 %Utilities 1.40 %
PROPOSED FINANCINGLoan Type Fully AmortizedDown Payment $209,700Loan Amount $489,300Interest Rate 5.35 %Annual Debt Service $35,534Loan to Value 70 %Amortization Period 25 YearsNotes Presumable savings and loan
bank financing

Warrick's Mobile Home Park Cash Flow Analysis | 14
CASH FLOWCalendar Year CURRENT Year 2 Year 3 Year 4 Year 5 Year 6 Year 7 Year 8 Year 9 Year 10Gross Potential RevenueGross Rental Income $105,840 $109,015 $112,285 $115,654 $119,124 $122,697 $126,378 $130,170 $134,075 $138,097Gross Potential Income $105,840 $109,015 $112,285 $115,654 $119,124 $122,697 $126,378 $130,170 $134,075 $138,097General Vacancy $3,816 $0 $0 $0 $0 $0 $0 $0 $0 $0Effective Gross Income $102,024 $109,015 $112,285 $115,654 $119,124 $122,697 $126,378 $130,170 $134,075 $138,097Operating ExpensesReal Estate Taxes $12,694 $12,694 $12,872 $13,052 $13,235 $13,420 $13,608 $13,798 $13,991 $14,187Insurance $1,881 $1,881 $1,907 $1,934 $1,961 $1,989 $2,016 $2,045 $2,073 $2,102Management Fee $5,101 $5,451 $5,614 $5,783 $5,956 $6,135 $6,319 $6,508 $6,704 $6,905Marketing $241 $241 $244 $248 $251 $255 $258 $262 $266 $269Repairs & Maintenance $6,531 $6,531 $6,622 $6,715 $6,809 $6,904 $7,001 $7,099 $7,199 $7,299Administration $435 $435 $441 $447 $454 $460 $466 $473 $479 $486Utilities $19,769 $19,769 $20,046 $20,326 $20,611 $20,900 $21,192 $21,489 $21,790 $22,095Total Operating Expense $46,652 $47,002 $47,747 $48,505 $49,277 $50,062 $50,861 $51,674 $52,502 $53,344Net Operating Income $55,372 $62,013 $64,538 $67,149 $69,847 $72,635 $75,517 $78,495 $81,573 $84,753Annual Debt Service $35,534 $35,534 $35,534 $35,534 $35,534 $35,534 $35,534 $35,534 $35,534 $35,534Cash Flow $19,838 $26,480 $29,005 $31,615 $34,313 $37,102 $39,984 $42,962 $46,039 $49,219
Effective Gross Income vs Operating Expenses Cash Flow

Warrick's Mobile Home Park Cash Flow Analysis | 15
Calendar Year CURRENT Year 2 Year 3 Year 4 Year 5 Year 6 Year 7 Year 8 Year 9 Year 10Financial MetricsCash on Cash Return b/t 9.46 % 12.63 % 13.83 % 15.08 % 16.36 % 17.69 % 19.07 % 20.49 % 21.95 % 23.47 %CAP Rate 7.92 % 8.87 % 9.23 % 9.61 % 9.99 % 10.39 % 10.80 % 11.23 % 11.67 % 12.12 %Debt Coverage Ratio 1.56 1.75 1.82 1.89 1.97 2.04 2.13 2.21 2.30 2.39Operating Expense Ratio 45.72 % 43.11 % 42.52 % 41.93 % 41.36 % 40.80 % 40.24 % 39.69 % 39.15 % 38.62 %Gross Multiplier (GRM) 6.60 6.41 6.23 6.04 5.87 5.70 5.53 5.37 5.21 5.06Loan to Value 69.99 % 68.63 % 67.18 % 65.71 % 64.07 % 62.39 % 60.59 % 58.73 % 56.75 % 54.63 %Breakeven Ratio 80.56 % 75.71 % 74.17 % 72.66 % 71.20 % 69.76 % 68.36 % 67.00 % 65.66 % 64.36 %Price / Unit $31,773 $31,773 $31,773 $31,773 $31,773 $31,773 $31,773 $31,773 $31,773 $31,773

Warrick's M
obile Hom
e Park | Dem
ographics
Demographics
WA
RR
ICK
'S M
OB
ILE
HO
ME
PAR
K
05
......
......
......
......
......
......
......
......
Demographic Details
Demographic Charts

Warrick's Mobile Home Park Demographics | 17
POPULATION 1 MILE 3 MILE 5 MILE
2000 Population 1,542 3,101 8,552
2010 Population 1,499 3,017 8,283
2019 Population 1,549 3,105 8,527
2024 Population 1,535 3,073 8,442
2019 African American 20 34 61
2019 American Indian 5 9 28
2019 Asian 3 6 22
2019 Hispanic 37 70 153
2019 White 1,467 2,962 8,234
2019 Other Race 12 21 36
2019 Multiracial 42 72 143
2019-2024: Population: Growth Rate -0.90 % -1.05 % -1.00 %
2019 HOUSEHOLD INCOME 1 MILE 3 MILE 5 MILE
less than $15,000 52 97 228
$15,000-$24,999 57 103 268
$25,000-$34,999 93 178 422
$35,000-$49,999 80 156 396
$50,000-$74,999 141 275 685
$75,000-$99,999 64 145 496
$100,000-$149,999 101 214 628
$150,000-$199,999 7 23 98
$200,000 or greater 0 11 97
Median HH Income $51,750 $54,207 $60,049
Average HH Income $59,709 $64,968 $74,611
HOUSEHOLDS 1 MILE 3 MILE 5 MILE
2000 Total Housing 609 1,229 3,440
2010 Total Households 579 1,174 3,241
2019 Total Households 596 1,202 3,318
2024 Total Households 590 1,189 3,278
2019 Average Household Size 2.58 2.57 2.56
2000 Owner Occupied Housing 463 943 2,627
2000 Renter Occupied Housing 116 223 563
2019 Owner Occupied Housing 433 897 2,615
2019 Renter Occupied Housing 163 305 703
2019 Vacant Housing 42 84 277
2019 Total Housing 638 1,286 3,595
2024 Owner Occupied Housing 428 885 2,577
2024 Renter Occupied Housing 162 303 701
2024 Vacant Housing 55 112 357
2024 Total Housing 645 1,301 3,635
2019-2024: Households: Growth Rate -1.00 % -1.10 % -1.20 %
Source: esri

Warrick's Mobile Home Park Demographic Charts | 18
1 Mile Radius 3 Mile Radius 5 Mile Radius
2019 Household Income
1 Mile Radius 3 Mile Radius 5 Mile Radius
2019 Population by Race

Warrick's Mobile Home Park Demographic Charts | 19
2019 Household Occupancy - 1 Mile Radius
Average Income Median Income
2019 Household Income Average and Median

Warrick's Mobile Home Park
Exclusively Marketed by:
Steven Tomaso
powered by CREOP