was hayek an ace? - queen mary university of londonugte173/pub/sej.pdf · · 2012-07-09was hayek...
TRANSCRIPT
Southern Economic Journal 2002, 68(4), 811-840
Was Hayek an Ace?
Nicolaas J. Vriend*
To address the question whether Hayek might have been an agent-based computational econ- omist (ACE) avant-la-lettre, I consider an ACE model concerning the phenomenon of infor- mation contagion. Alongside increasing returns, network externalities, and information cas- cades, information contagion has been presented in the literature as an explanation for particular patterns of macrobehavior that may seem at odds with the underlying micromotives. Whereas these other explanations have been shown to have a proper microfoundation, information con- tagion has remained a phenomenon that seemed to occur only when certain ad hoc rules of thumb for individual behavior are assumed. I show how information-contagious behavior can emerge in a coevolutionary process of interacting adaptive agents, how this is related to various Hayekian themes, and how ACE research in general can be seen as an application of Hayek's methodological insights.
1. Introduction
Hayek was without doubt one of the great minds of economics, and not only of economics.
Obviously, this paper will not pretend to question his being an ace. The Ace in the title rather
refers to agent-based computational economist (ACE). As Tesfatsion puts it on the ACE Web
site:
"Agent-based computational economics (ACE) is roughly characterized as the computational study of econ- omies modelled as evolving decentralized systems of autonomous interacting agents. A central concern of ACE researchers is to understand the apparently spontaneous formation of global regularities in economic
processes, such as the unplanned coordination of trade in decentralized market economies that economists associate with Adam Smith's invisible hand. The challenge is to explain how these global regularities arise from the bottom up, through the repeated local interactions of autonomous agents channeled through socio- economic institutions, rather than from fictitious top-down coordination mechanisms such as imposed market
clearing constraints or an assumption of single representative agents. ACE is thus a specialization to eco- nomics of the basic complex adaptive systems (CAS) paradigm." (Tesfatsion 1998)
The descriptions used in this informal definition of ACE must look rather familiar to experts of Hayek. Given the easily recognizable affinity between Hayek and ACE it is no surprise that
many Hayek experts seem interested in the recent ACE literature. At the same time, however,
many ACE researchers seem hardly aware of Hayek's work. Every now and then somebody
might mention that it would be interesting to have a closer look at Hayek's work, but that is
about it. In this paper I will take up these suggestions. I present a concrete example of an ACE
research project concerning the phenomenon of information contagion as a guide to address in
* Queen Mary, University of London, Department of Economics, Mile End Road, London, El 4NS, UK; E-mail [email protected].
Comments by Pierre Barbaroux, Bruce Caldwell, Augustino Manduchi, Martin Posch, Jan Tuinstra, seminar and conference participants in Genova, London (Q.M. and R.H.), Amsterdam, Aix-en-Provence, Vienna, Barcelona, Pisa (S. Anna), Essex, Salerno, and in particular participants of the Liberty Fund symposium on "The Legacy of F.A. Hayek" in Freiburg (Germany) are gratefully acknowledged. The usual disclaimer applies.
Received December 1999; accepted May 2001.
811
812 Nicolaas J. Vriend
great detail the question whether Hayek might have been an ACE avant-la-lettre. Apart from the purely intellectual motivation for such a study, some of the underlying questions motivating this project are: How could Hayek's insights and theories help to understand ACE research? And what, if anything, could we learn from current ACE research about Hayek's work? Far from offering definite answers to these questions, this paper will suggest that there might be some reasons to believe that a close encounter between Hayek and ACE has potential benefits that might work in both directions.
This paper is organized as follows. Section 2 outlines the interest of Hayek in complex adaptive systems, and discusses some methodological issues concerning ACE modeling, relating it to Hayek's work. Section 3 presents an ACE model of the emergence of information conta-
gion, whereas section 4 presents an analysis of the properties of the model. In section 5 I relate the specifics of my ACE model to Hayek's work on the division of knowledge and information
aggregation, and section 6 concludes.
2. Hayek, Complex Systems, the Methodology of the Social Sciences, and ACE Modeling
Hayek shared with ACE the belief that the economy needs to be understood from a bottom-
up perspective. In this he stood out from both Keynesian macroeconomics and Walrasian general equilibrium theory, which came to dominate the field of economics during Hayek's life. He insisted on the need to consider a market economy as a truly decentralized system of interacting individual agents. One of the central questions Hayek analyzed was: "How can the combination of fragments of knowledge existing in different minds bring about results which, if they were to be brought about deliberately, would require a knowledge on the part of the directing mind which no single person can possess?" (Hayek 1948b, p. 54). In much of his work Hayek took the view that to explain such phenomena one must start the analysis from the level of individ- uals. His view of individual behavior was firmly rooted in the "antirationalistic" (Hayek 1948a,
p. 8) approach of the English individualism as known, for example, from Adam Smith's Invisible Hand metaphor: "... true individualism is the only theory which can claim to make the for- mation of spontaneous social products intelligible" (p. 10), and "true individualism believes ... that, if left free, men will often achieve more than individual reason could design or foresee"
(p. 11). With respect to general equilibrium theory, Hayek pointed out: "The equilibrium re-
lationships cannot be deduced merely from the objective facts, since the analysis of what people will do can start only from what is known to them" (p. 44), and: "... the general question of
why the subjective data to the different persons correspond to the objective facts. Our problem of knowledge here is just the existence of this correspondence .. " (pp. 51-52). In this respect, Hayek clearly distinguished himself from Keynes: "Keynes' theories will appear merely as the most prominent and influential instance of a general approach to philosophical justification of which seems to be highly questionable. Though with its reliance on apparently measurable
magnitude it appears at first more scientific than the older micro-theory, it seems to me that it has achieved this pseudo-exactness at the price of disregarding the relationships which really govern the economic system" (Hayek 1978, p. 289).
Starting from his 'true individualism' and his skepticism concerning the approaches fol- lowed by Keynes and Walrasian general equilibrium theorists, and his view that what really mattered was something to do with the interactions between the individual agents, during the
Was Hayek an Ace? 813
1950s Hayek came to consider the economy as a complex adaptive system. A lucid account of the developments in Hayek's work in the 1950s and 1960s is given in Caldwell (2000), who describes how "(b)y the 1960s Hayek was seeing complex orders everywhere" (p. 19), with the underlying principles best understood from an evolutionary perspective.
Hayek's research followed two tracks in the 1950s. First, his interest in the methodology of the social sciences led him back to his earlier work on theoretical psychology. In Hayek (1952) the sensory order of the human brain is described as an example of a self-organizing complex order, with linkages within the brain being strengthened or weakened as a result of feedback from the external environment. This work was one of the principal readings for
Hayek's 1952 seminar at the University of Chicago on "Scientific Method and the Study of
Society", in which people like Enrico Fermi and Sewell Wright participated, and that focussed on methodological issues concerning the study of complex phenomena.
The second track followed by Hayek during the 1950s concerned his work on political theory. In Hayek (1960) the development of civilization is related to the growth of knowledge, where knowledge was seen broadly, including things such as habits, skills, emotional attitudes, tools, institutions, and even ethical and aesthetical principles. These various forms of knowledge evolve as a result of random variations (accidents) and "selective elimination of less suitable conduct" (p. 26).1 Hence, Hayek started looking at cultural evolution as the evolution of a tradition of learned rules of conduct and social norms. "We understand now that all enduring structures above the level of the simplest atoms, and up to the brain and society, are the results
of, and can be explained only in terms of, processes of selective evolution, and that the more
complex ones maintain themselves by constant adaptation of their internal states to changes in the environment" (Hayek 1979, p. 158).
Some of the methodological insights developed in Hayek's work on cultural evolution seem to be of particular interest to ACE research. Not so much because, starting from Hayek's work, ACE introduces novel methodological developments, but because ACE turns out to be a very advantageous way to actually apply the abstract methodological insights of Hayek and others.
Moreover, acknowledging this, in turn, helps to put ACE research in the right perspective, facilitating a fruitful interpretation of its results as well.
Social theory attempts to explain social phenomena, and as Weimer (1982) puts it: "ex-
planation is modeling" (p. 271). According to Hayek (1948c), what we do is, "we construct
hypothetical models in an attempt to reproduce the patterns of social relationships which we know in the world around us" (p. 68). In contrast to the natural sciences, in the social sciences
"(e)xperimentation is impossible, and we have therefore no knowledge of definite regularities in the complex phenomena in the same sense as we have in the natural sciences" (Hayek 1948f,
p. 126). That is, as Weimer (1982) explains, in the natural sciences there is the ability to simplify and control a situation to the extent that it can be repeated, either under identical conditions or those that we choose to vary systematically, such that we can isolate and identify the definite
regularities in observed phenomena.2 However, "(t)he empirical research in complex social
Hayek's interest in the interface between psychology and the study of society, and his belief that the common governing principle was evolution, is also suggested by the fact that the two panel discussions of the Darwin Centennial Celebration at the University of Chicago in which Hayek participated in 1959 were titled "The Evolution of Mind" and "Social and Cultural Evolution" (see Caldwell 2000).
2 Although in the meantime experimental economics has been established as a well-developed research field, what still sets economics apart from, for example, physics is that in economics there are no natural laws or universal constants, leaving parallelism (the presumed relation between the laboratory and the outside world) a controversial issue.
814 Nicolaas J. Vriend
phenomena consists in the construction of situations in which we demonstrate to ourselves that
we can produce "facts" of which we are already well aware. Our demonstrations "test" our
theoretical models only in the sense already noted; they compare the consistency of our theo-
retical model with an analogical knowledge of social phenomena, but they neither confirm nor
refute them in any logical sense" (Weimer 1982, p. 252). And Hayek (1948c): "The theory itself, the mental scheme for the interpretation, can never be "verified" but only tested for its
consistency. It may be irrelevant because the conditions to which it refers never occur; or it
may prove inadequate because it does not take account of a sufficient number of conditions.
But it can no more be disproved by facts than can logic or mathematics" (p. 73). And ".. . a
simple theory of phenomena which are in their nature complex ... is probably merely of
necessity false . . . " (Hayek 1967b, p. 28). Hence, it is not possible to test the truth of a social theory, and the best we can aim for
is doing consistency checks. "We may not be able directly to confirm that the causal mechanism
determining the phenomenon in question is the same as that of our model. But we know that, if the mechanism is the same, the observed structures must be capable of showing some kinds
of action and unable to show others; and if, and so long as, the observed phenomena keep within the range of possibilities indicated as possible, that is so long as our expectations derived
from the model are not contradicted, there is good reason to regard the model as exhibiting the
principle at work in the more complex phenomenon. ... Our conclusions and predictions will
also refer only to some properties of the resulting phenomenon, in other words, to a kind of
phenomenon rather than to a particular event" (Hayek 1967a, p. 15). Hence, Hayek advocates not only some kind of 'as if' argument, but he also argues that
we can hope to explain at best general principles, or stylized facts. Although he did not discuss
ACE models as such, Hayek (1982) seems to use the same argument concerning the degree of
explanation that we can achieve also with respect to ACE models of complex social phenomena. "Assume I could construct a rat-that is, a mechanical model that can do all a rat does. ...
To be a really true model, it would clearly have to do also a great many things we could not
predict, even though we know precisely how the mechanism we have built works. It would
both occasionally have to respond to external stimuli in a manner that we cannot predict, but
also have to act "spontaneously" in response to internal processes that we cannot observe. The
reason for our inability to predict, in spite of our precise knowledge of the mechanism that
moves it, would be that our mind is not capable of perceiving and digesting, in the same manner
as the mechanical rat does, all the particular stimuli that operate upon it and all the processes of classification that proceed in it. The only means by which we could achieve predictions would be to build a computer that imitates all that the mechanism of the rat performs; or, in
other words, to build another rat identical in structure with the first one and making it live from
the beginning in exactly the same environmental conditions, so it would perceive and learn
exactly what the first rat does. That is, in order to understand what a rat will do and why it
does it, we would have to become another rat" (Hayek 1982, pp. 292-293; emphasis added).
Perhaps it is useful to stress that Hayek is here arguing in favor of building a "really true
model" of a rat (or ACE models, for that matter). The skeptical part of his remarks is related
to the fact that he explicitly uses this illustration to justify his contention concerning the "ab-
solute limit to our powers of explanation" (p. 292). In exactly the same way, ACE models are
abstractions from reality, and not aimed at replicating reality. Hence the term 'simulation' to
describe ACE models might create confusion, since ACE models do not try to simulate reality as such, but only to understand some general phenomena, the stylized facts. As Kirman and
Was Hayek an Ace? 815
Vriend (2000) explain: "We will not try to build a model fitting all aspects of the real world
for the following reasons. First, every model is by definition an abstraction. If enough data can
be collected, statistical testing will reject any model. Second, when modeling by building arti-
ficial worlds, one might get a very good fit without gaining understanding. There exist economic
simulation models with more than 10,000 variables. At some point it might be that one mainly succeeds in building a copy of the real world, about which we have the same degree of under-
standing as about the real world. Therefore, we will only consider specific questions concerning the stylized facts of the real market that appear remarkable or important. We will try to build
a minimal model that generates, and with which to test those stylized facts. This might suggest
ways to understand, or not, those phenomena. This understanding is of the same type as with
formal mathematical models. The question is whether we might consider the real world to be
working 'as if' it were like our model" (pp. 37-38). Hence, social theories attempt to provide explanations of social phenomena, and such
explanations typically involve the use of models. Models can be presented in various forms.
They could be either purely informal (verbal) or formal (mathematical or computational). That
is, a computer program as used in ACE constitutes a model. And since explanation is modeling, and this is what social theory is about, an ACE computer program as such is social theory. The
only, and essential, reason to execute an ACE computer program is to carry out the consistency checks; both with respect to reality and with what one anticipated the model to produce.3 A
possible advantage of quantitative models in general might be that they can be analyzed more
precisely. That is, the consistency checks can be done more carefully. Such a consistency anal-
ysis can be a formal, mathematical analysis, or it could be a numerical analysis. Notice that the essential questions to be asked concerning a given ACE model are, first,
whether, the behavior of the model is consistent with the phenomena that one would like to
explain, and second, whether the model is an appealing one. Hence if one believes the phenom- ena to be explained are complex, then a model capturing the self-organizing aspects might be both appealing and performing better in the consistency checks with reality. But the question of whether an ACE model has emergent properties is irrelevant in itself.
3. An ACE Model of Information Contagion
The basic choice problem I consider is that of a population of individual agents who,
sequentially, each face a decision problem between two items with uncertain qualities. I can think of these two items as new products, movies, technologies, services, financial gurus, or whatever binary choice agents might need to make frequently in everyday life.
The only information the agents have is the choices plus the corresponding values expe- rienced by a sample of other agents who had faced the same decision problem before them. This implies that there is an 'information externality'. That is, the choice of an agent does not
3 Notice that this implies that the following view of ACE research is incorrect. Reality leads to facts (which need to be explained), and a computer simulation produces artifacts (which, in turn, need to be explained). The alleged objective, then, would be to show that the explanation for the facts could be the same as the explanation for the artifacts, but achieving this is meaningless because the facts produced by the computer program are inferior and subordinate anyway as they concern only artifacts. As I explained, the output of an ACE computer program is not artifacts to be explained. The computer program itself is the model that explains the social facts. In fact, an ACE model stands to executing its program as a mathematical model stands to solving its equations.
816 Nicolaas J. Vriend
only lead to utility for himself, but it will also be added to the pool of information from which other agents sample. The question, then, is what are the consequences of this information ex-
ternality? This basic choice problem has been considered in the literature. See in particular Arthur
and Lane (1991), Dosi, Ermoliev, and Kaniovski (1994), Narduzzo and Warglien (1996), and Lane and Vescovini (1996). Basically what this literature shows, both theoretically and empir- ically, is that agents may behave in a way that the decision of a given agent positively affects the expected decisions of subsequent agents, leading to path-dependent lock-in effects.4 That is, there may be a diffusion process such that a certain choice once it starts being made by a certain number of people spreads quickly in a population (without the values actually experienced
necessarily implying this). Since the only link between the decisions of the agents is the infor-
mation externality, this contagious phenomenon is called 'information contagion'. What is miss-
ing in this literature is an explanation as to why we should expect people to behave in such a
way that the information externality does indeed imply information contagion. In this respect the literature on information contagion differs from the literature on increasing returns (Arthur 1989), network externalities (Katz and Shapiro 1985, 1986), information cascades (Bikhchan- dani, Hirshleifer, and Welch 1992), and herding behavior (Banerjee 1992). All these models
have been presented in the literature as an explanation for particular patterns of macrobehavior
(for example, path-dependence and lock-in effects) that may seem at odds with the underlying micromotives. But whereas these other explanations have been shown to have a proper micro-
foundation (either related to changing productivity or changing preferences, or to Bayesian
updating in the face of uncertainty), information contagion has remained a phenomenon that
occurs only when certain ad hoc rules of thumb for individual behavior are assumed.5 My ACE
model will provide an explanation for information contagion.6
The Basic Choice Situation
The model has a population of 100 decision makers. In a given period they face a choice
between two items that were previously unknown to them. Each new item i is characterized by the expected value of the utility it will generate, EVi. These expected values are unknown to
the individual agents. Given an expected value, EVi, the value that a specific agent will actually
experience from an item will be a random draw from a uniform distribution with support from
EVi - 0.25 to EVi + 0.25. Hence, if a given item i is characterized by an EVi of, say, 0.40, the actual utility levels experienced by the individual agents choosing this item will range from
0.15 to 0.65, with every utility level in this range equally likely to occur. The stochastic character
of the payoffs generated reflects idiosyncratic productivity or taste factors, but I can also think
of the random component of the payoffs as measurement errors of a given item's actual value.
Notice that I do not have any increasing real returns to scale of any form, no change in
taste, endogenously determined utility depending on the number of adopters, nor are there
complementarities or network externalities. Each individual agent's utility of a certain item i is
4 A more extensive discussion of this and some related literature, such as Ellison and Fudenberg (1993) on social learning, can be found in Vriend (1999).
5 A difference between the information-contagion literature on the one hand, and the literature on information cascades and herding behavior on the other hand, is that in the latter an agent does not observe the payoffs generated by other agents, but only their choices as such.
6 The ACE model will be described in the next sections. The pseudo-code of the model can be found in the Appendix.
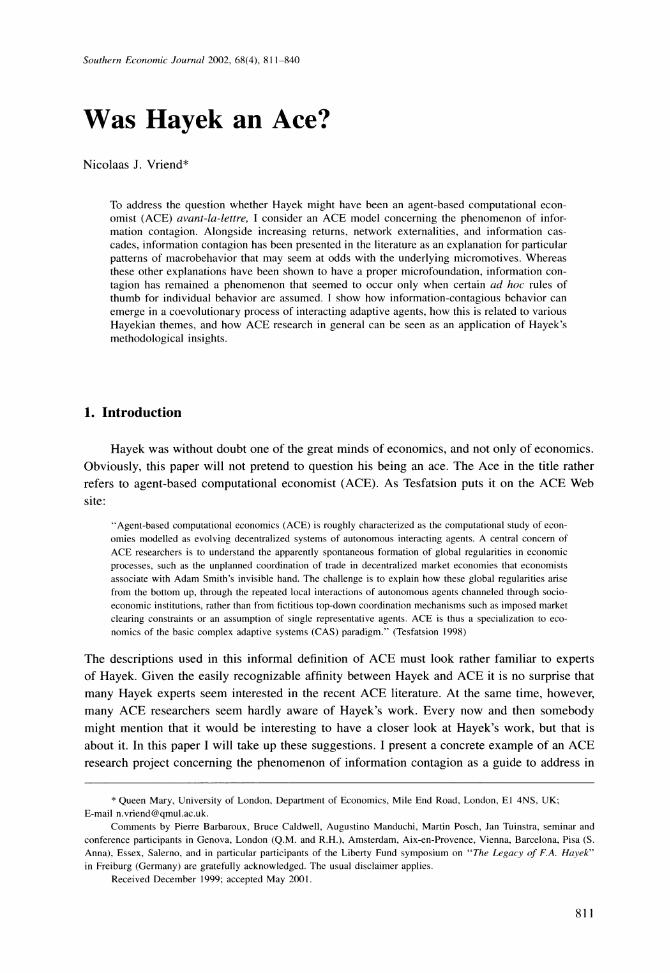
Was Hayek an Ace? 817
- item 1
2 , ---- item 2
0 - -.- ^ ..& ^ 0 0.15 0.30 0.65 0.80 1.00 value V
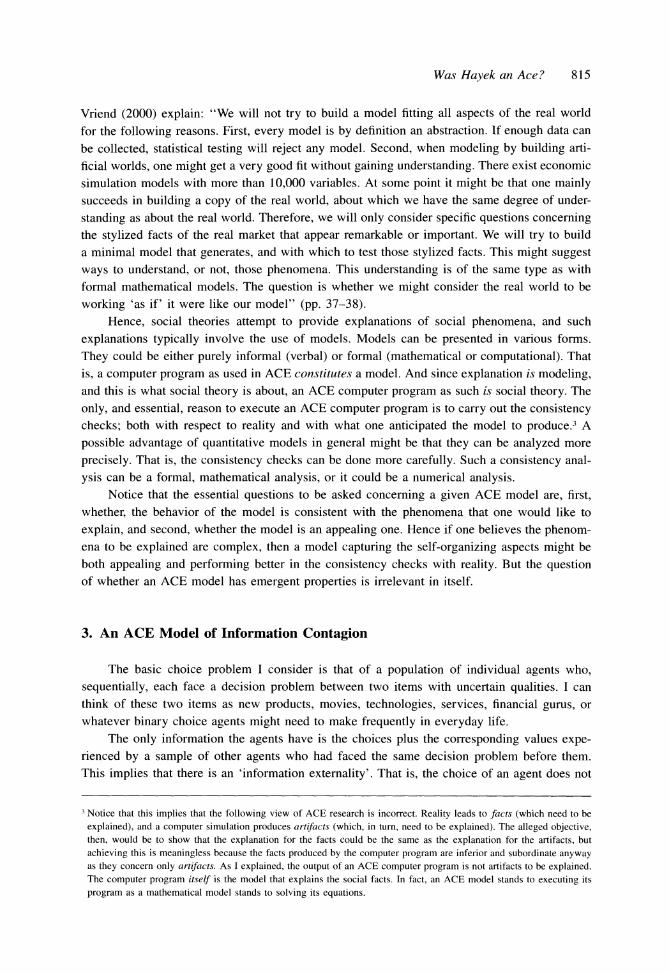
Figure 1. Probability Density Function for Values of Two Items, with Expected Value (EV), = 0.40 and EV2 = 0.55
simply an independent draw from the same uniform distribution characterized by the item's
expected value EVi. Figure 1 gives an example of two items with expected values EV1 = 0.40, and EV2 = 0.55.
The agents, then, face their choice problem sequentially, with the order of the agents being random. Although each individual agent himself has no experience with these two specific new
items, he can draw six random samples from the people that have made already a decision before him. For each of the elements in his sample, he can observe the choice made, and the value actually experienced by the agent. Given this sample information, an agent makes a choice
himself, and then the next agent in the queue makes his decision, until the end of the queue is reached. Before the first agent in the sequence makes his decision in a given period, I add six
dummy agents. Three of these dummies choose one item, and the other three the other item. This 50-50 seeding prevents any bias at the start of a period. The reason to do this is that lock- in due to the choice of the very first agents would be an uninteresting artifact.
As Figure 1 illustrates, in general the information sampled will be far from conclusive to determine which of the two items has the greatest expected value. For example, a utility level of 0.60 experienced by a specific agent in a sample could have been generated by an item with an expected value of 0.35, but also by an item with an expected value of 0.85. Obviously, this
uncertainty matters a great deal for an agent that needs to make such a decision. I assume that each agent has in mind a set of simple rules of thumb to choose an item, and that the propensity to use any of these rules may change over time as a result of an agent's experience in the use of these rules. Therefore, before I explain in detail the modeling of the decision making and
learning by the individual agents, I need to clarify how the individual agents face a similar basic choice problem over and over again.
Choice Dynamics
All individual agents face the same basic choice problem for 25,000 periods. In every period two new items arrive that are completely independent from all earlier items, and all
agents sequentially face a choice between them, with the order of the agents being determined
818 Nicolaas J. Vriend
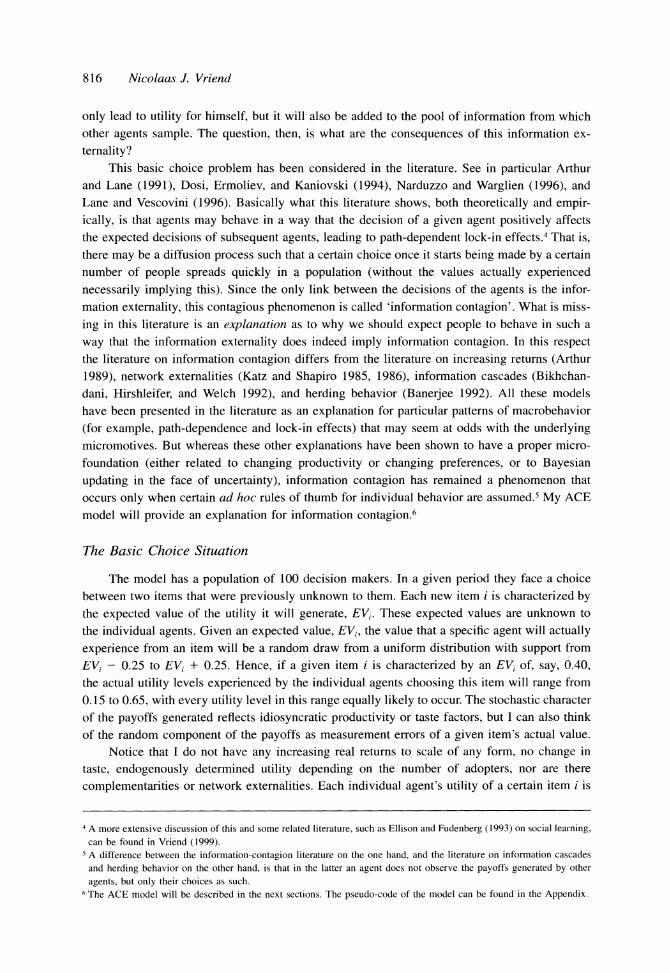
condition
if.... .. ....
action
then .... ..... .. ...
Figure 2. Classifier System
at random in every single period. The fact that I modeled the sampling in a given period as random is a shortcut to take into account that for every day-to-day decision an individual agent may have a different relevant 'neighborhood'. As I want to focus on the issue of information
contagion (analyzing the meaning of the information externality), I do not want to impose any
given, fixed structure on these neighborhoods, nor do I want to consider the endogenous for-
mation of 'neighborhood' structures. As explained in the previous discussion, every item appearing is characterized by its ex-
pected value. This expected value itself, which is unknown to the agents, is also a random draw
from a uniform distribution; this time with support from 0.25 to 0.75. Hence, the worst item that can ever appear has an expected value of 0.25 (generating values for individual agents between 0.00 and 0.50), and the best possible item has an expected value of 0.75 (yielding
utility levels between 0.50 and 1.00). Obviously, the ranges of utility levels that can be generated
by intermediate items overlap with each other, as shown in Figure 1. Every 500th period, the
expected values of the two items are identical (0.50). These identical expected value cases will
serve as useful benchmarks to see how much information contagion has emerged. While I use
this benchmark every 500th period, in all other periods the expected value of the two items
will not be identical, with one of the two items being superior in a statistical sense.
Although I have not said much about individual decision making and learning yet, intuition
might suggest that this must be a trivial problem. If I run the model for 25,000 periods, and if
in every period (apart from the benchmark periods) one of the two items is superior, then,
surely, eventually every agent will easily discover which item is better. However, matters are
slightly more complicated. Every period, two new, unknown items appear, and each item is up for choice only once during the entire history. Hence, the learning concerns the general rules of behavior, and not the specific, particular items as such. The fact that the agents learn the
usefulness of general rules of behavior, and not the value of specific items, also implies that if
an agent oversees a certain sample of prior adoptions by other agents he might choose item 1, whereas he might choose 2 if he were confronted with the same two items but a different sample of prior adoptions.
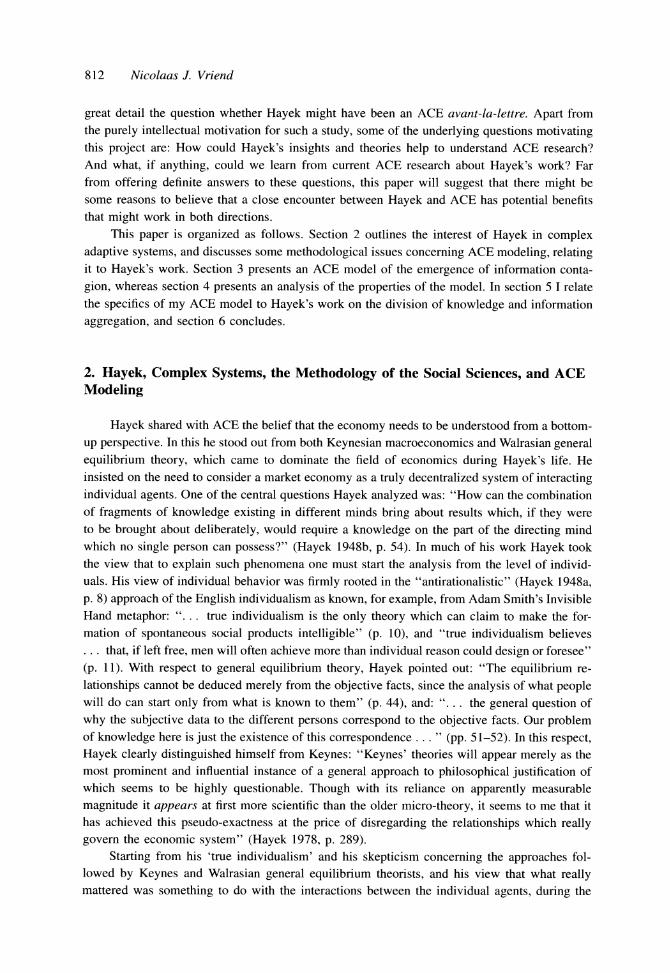
Individual Decision Making and Learning
The individual agent's decision making is modeled for each individual agent separately by means of a classifier system. Figure 2 presents one such stylized classifier system.
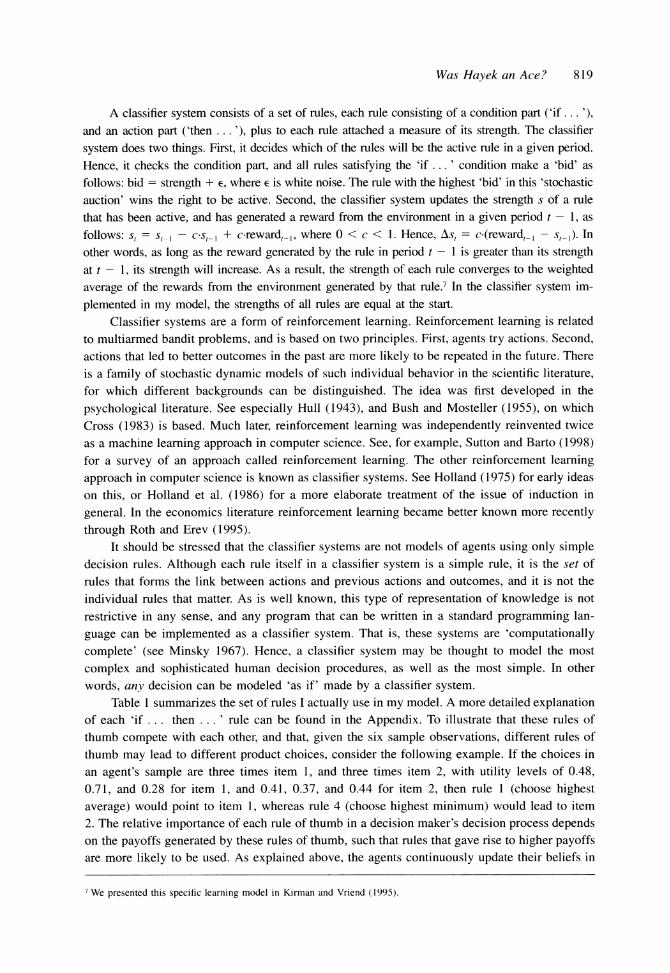
Was Hayek an Ace? 819
A classifier system consists of a set of rules, each rule consisting of a condition part ('if... '), and an action part ('then ... '), plus to each rule attached a measure of its strength. The classifier
system does two things. First, it decides which of the rules will be the active rule in a given period. Hence, it checks the condition part, and all rules satisfying the 'if . ..' condition make a 'bid' as
follows: bid = strength + E, where e is white noise. The rule with the highest 'bid' in this 'stochastic
auction' wins the right to be active. Second, the classifier system updates the strength s of a rule
that has been active, and has generated a reward from the environment in a given period t - 1, as
follows: s, = s,_ - cst-i + c-reward ,, where 0 < c < 1. Hence, Ast = c-(reward,_i - s,_). In
other words, as long as the reward generated by the rule in period t - 1 is greater than its strength at t - 1, its strength will increase. As a result, the strength of each rule converges to the weighted
average of the rewards from the environment generated by that rule.7 In the classifier system im-
plemented in my model, the strengths of all rules are equal at the start.
Classifier systems are a form of reinforcement learning. Reinforcement learning is related
to multiarmed bandit problems, and is based on two principles. First, agents try actions. Second, actions that led to better outcomes in the past are more likely to be repeated in the future. There
is a family of stochastic dynamic models of such individual behavior in the scientific literature, for which different backgrounds can be distinguished. The idea was first developed in the
psychological literature. See especially Hull (1943), and Bush and Mosteller (1955), on which
Cross (1983) is based. Much later, reinforcement learning was independently reinvented twice
as a machine learning approach in computer science. See, for example, Sutton and Barto (1998) for a survey of an approach called reinforcement learning. The other reinforcement learning
approach in computer science is known as classifier systems. See Holland (1975) for early ideas
on this, or Holland et al. (1986) for a more elaborate treatment of the issue of induction in
general. In the economics literature reinforcement learning became better known more recently
through Roth and Erev (1995). It should be stressed that the classifier systems are not models of agents using only simple
decision rules. Although each rule itself in a classifier system is a simple rule, it is the set of
rules that forms the link between actions and previous actions and outcomes, and it is not the
individual rules that matter. As is well known, this type of representation of knowledge is not
restrictive in any sense, and any program that can be written in a standard programming lan-
guage can be implemented as a classifier system. That is, these systems are 'computationally
complete' (see Minsky 1967). Hence, a classifier system may be thought to model the most
complex and sophisticated human decision procedures, as well as the most simple. In other
words, any decision can be modeled 'as if' made by a classifier system. Table 1 summarizes the set of rules I actually use in my model. A more detailed explanation
of each 'if . . . then . . . ' rule can be found in the Appendix. To illustrate that these rules of
thumb compete with each other, and that, given the six sample observations, different rules of
thumb may lead to different product choices, consider the following example. If the choices in
an agent's sample are three times item 1, and three times item 2, with utility levels of 0.48,
0.71, and 0.28 for item 1, and 0.41, 0.37, and 0.44 for item 2, then rule 1 (choose highest
average) would point to item 1, whereas rule 4 (choose highest minimum) would lead to item
2. The relative importance of each rule of thumb in a decision maker's decision process depends on the payoffs generated by these rules of thumb, such that rules that gave rise to higher payoffs are more likely to be used. As explained above, the agents continuously update their beliefs in
7 We presented this specific learning model in Kirman and Vriend (1995).
820 Nicolaas J. Vriend
Table 1. Decision Rules
Rule Choice
1 Highest average 2 Highest average (2) 3 Highest average (3) 4 Highest minimum 5 Highest minimum (2) 6 Highest minimum (3) 7 Highest maximum 8 Highest maximum (2) 9 Highest maximum (3)
10 Majority 11 Majority (3) 12 Majority (5) 13 Follow last 14 Follow last (2) 15 Follow last (3) 16 Random 17-31 Opposite choice of rules 1-15
this respect.8 Besides through the white noise added to the 'bids' of the classifier system (see above), the agents experiment through some kind of 'trembling hand', mistakenly picking the item they did not intend to with a given small probability.
4. Analysis of the Model
In this section I will show that the ACE model described in section 3 provides a possible explanation for information-contagious behavior. Moreover, I will show that information con-
tagion is an inherently complex dynamic phenomenon. To analyze the properties of my ACE
model, I examine 10 runs of the model, each with 100 agents for 25,000 periods. From an objective point of view, in almost every period one of the two items is superior,
but knowledge is very much divided in my model. Each individual agent has a sample of six
observations, and such a sample may overlap with the samples of some other agents. Hence, some more specific questions to answer are the following. Do the agents through their interaction learn to use rules of thumb that solve the division of knowledge problem? What do the market outcomes look like? Do I get path-dependence and lock-in effects?
Path Dependence and Lock In
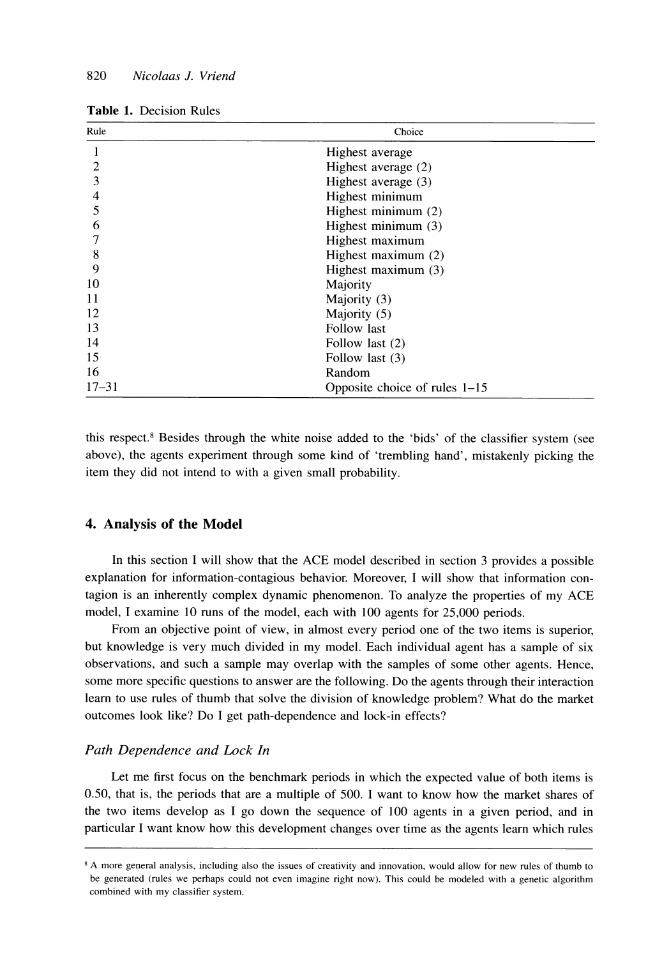
Let me first focus on the benchmark periods in which the expected value of both items is
0.50, that is, the periods that are a multiple of 500. I want to know how the market shares of the two items develop as I go down the sequence of 100 agents in a given period, and in
particular I want know how this development changes over time as the agents learn which rules
8 A more general analysis, including also the issues of creativity and innovation, would allow for new rules of thumb to be generated (rules we perhaps could not even imagine right now). This could be modeled with a genetic algorithm combined with my classifier system.
Was Hayek an Ace? 821
cumulative market share item 1 1-
0.75
0.5
0.25
0 agents 100 a
cumulative market share item 1 1
0.75
0.5 -
0.25
0 agents 100
cumulative market share item 1 1
0.75
0.5
0.25
c 0 agents 100
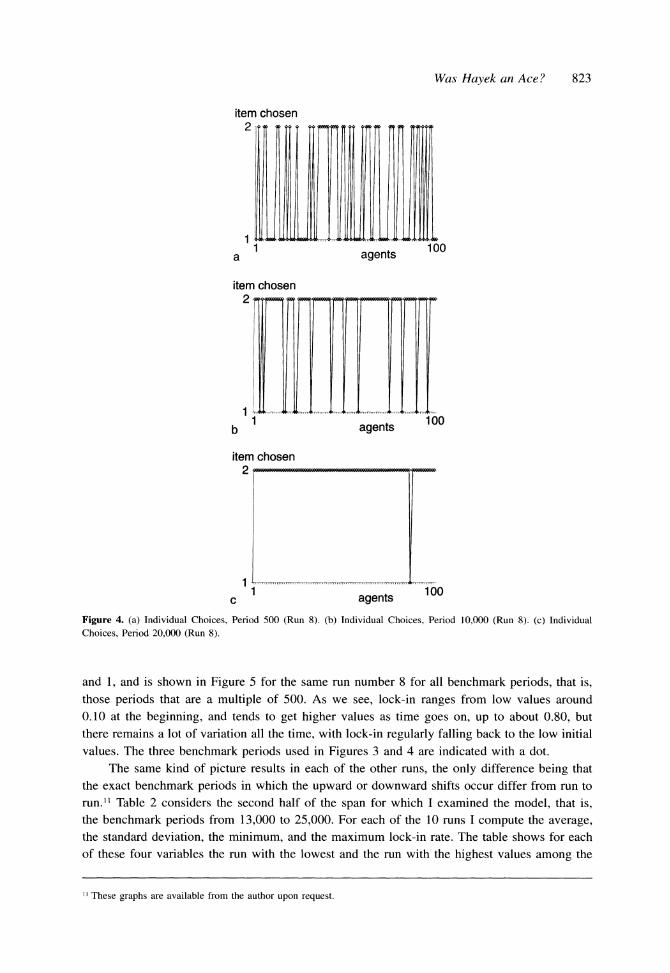
Figure 3. (a) Cumulative Market Share, Period 500 (Run 8). (b) Cumulative Market Share, Period 10,000 (Run 8). (c) Cumulative Market Share, Period 20,000 (Run 8).
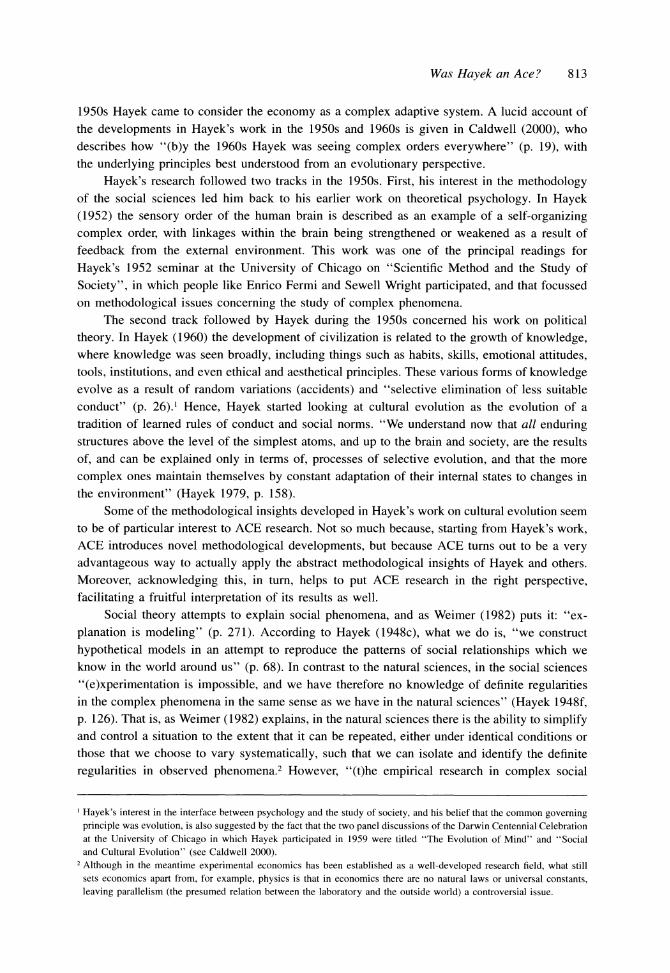
of thumb to use. Figure 3 shows some examples of a typical run: the development of the
cumulative market share of one of the items in the periods 500, 10,000, and 20,000.9 Each
sequence starts with a market share of 0.50 because of the initial choices by the six dummies.
The market share of the other item is just one minus the share of the item shown, that is, the
curve shown mirrored in the straight line at 0.50.
If there were no information externalities at all, every choice would be an independent decision, with each of the two items being equally likely to be chosen (as in these benchmark
periods the two items were equally good), and the development of the market shares would more or less zigzag around a 0.50 market share. As is shown in Figure 3a, the cumulative
market share curve for period 500 looks as if there is no information externality. This is because
the agents have had only little opportunity to learn, and they basically behave like 'zero intel-
ligence' agents (see Gode and Sunder 1993), choosing behavioral rules at random. As a result,
9 We will see below that these examples have been carefully selected in a certain sense.
822 Nicolaas J. Vriend
no information contagion occurs. If this curve were shown in period 500 for different runs, or other benchmark periods toward the beginning of a run, I would get a series of different zigzag curves that all stay close to the 0.50 market share line.'0 The market share curve shown in
Figure 3b for period 10,000 looks very different. Just as in period 500, I see some deviations from a 0.50 share early on, but unlike in period 500, this time I see that the item that gets a smaller market share early on continues to lose ground. Eventually, its share stabilizes at a level of about 16%. The rather smooth curve for period 20,000 shows the positive feedback effect even stronger. Right from the beginning of this period, one item (the one not shown) increases its market share continually until it dominates the market completely. Although the two items are identical in this period, the information contagion leads to lock-in. Which of the two items
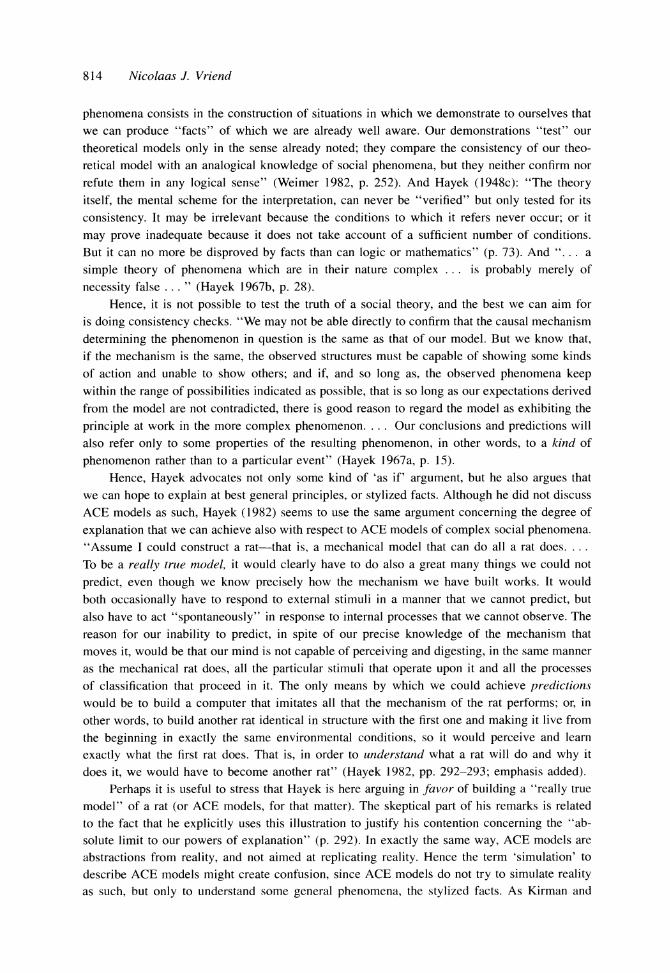
gets to dominate is basically random, due to small historical events. That is, it is path dependent. Figure 4 looks at the same phenomenon, the emergence of information contagion, focusing
on the individual choices of the 100 agents as such in the same periods as shown in Figure 3. In Figure 4a I see an almost random sequence of choices in period 500, shifting from one item to the other item all the time, and there is very little order, if any. In Figure 4b, showing the same for period 10,000, and in Figure 4c for period 20,000, I see an increasingly orderly pattern. In Figure 4c, although the two items are identical, item 1 does not seem very fashionable, with
agent after agent choosing item 2, and only an occasional deviation from the norm. The market share curves and the individual choice curves shown suggest a simple story.
As time goes on, the more the choice behavior of the population becomes self-organized and the more information contagion develops. As a result, the development of market shares more and more gets a particular pattern, with rather smooth curves concentrated in a relatively small
space with either a very high or a very low cumulative market share. However, as I will show in a moment, matters are slightly more complicated. The spontaneous order emerging turns out to be far from absolute, and the examples just shown have been carefully selected. In every run it takes some time before the information contagion emerges, giving rise to lock-in and
path-dependence effects, but once the population gets self-organized this turns out to be not a monotonic process at all. This would be clear from looking at the market share curves shown in Figure 3 for different benchmark periods. Sometimes one item almost completely dominates the market; other times I see the fashion switching at some point from one item to the other, and sometimes this switching occurs so frequently that I get a zigzag curve similar to the one shown for period 500. Hence, the curves seem to drift about in all directions, and the system moves all the time between almost complete order and almost complete disorder, but never
stays at either of these. I will explain this phenomenon in the next section, but first I will illustrate it by using different measures for what goes on in these markets.
Obviously, the final market share of an item is not exhaustively informative concerning the amount of lock-in generated. One change in fashion at the middle of the sequence would be sufficient to end up with 50-50 shares. Therefore, I take as a measure of the path dependence in the population's decisions the size of the area between the cumulative market share curve
(as shown in Figure 3) and the straight line at 0.50, relative to the area of the rectangle defined
by the axes and the 0.50 line. The more systematically the market stays away from a 50-50
distribution, the more lock-in we have. This measure, the lock-in rate, is a number between 0
10 The fact that the zigzag pattern appears to become smoother toward the end of the sequence is due to the fact that each additional decision maker carries less weight in the cumulative market share as I move down the line of 100
agents.
Was Hayek an Ace? 823
item chosen 2 * _* QD 00 O 10 *l0 t O 1
1 100 a agents
item chosen 2
1 100 b b 1 agents
item chosen 2 _------
1 c
1 agents 100
Figure 4. (a) Individual Choices, Period 500 (Run 8). (b) Individual Choices, Period 10,000 (Run 8). (c) Individual Choices, Period 20,000 (Run 8).
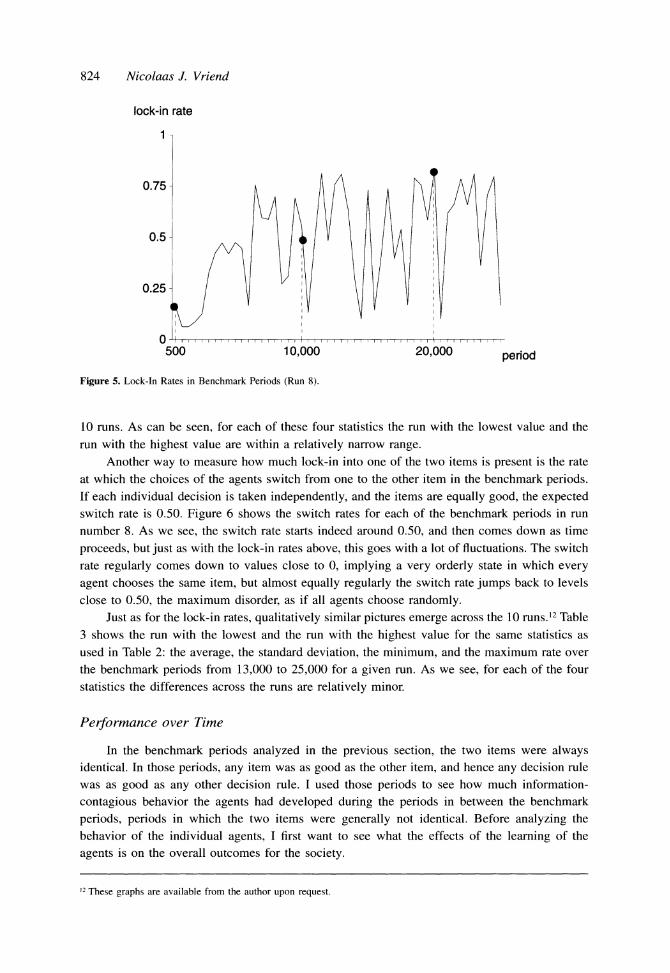
and 1, and is shown in Figure 5 for the same run number 8 for all benchmark periods, that is, those periods that are a multiple of 500. As we see, lock-in ranges from low values around 0.10 at the beginning, and tends to get higher values as time goes on, up to about 0.80, but there remains a lot of variation all the time, with lock-in regularly falling back to the low initial values. The three benchmark periods used in Figures 3 and 4 are indicated with a dot.
The same kind of picture results in each of the other runs, the only difference being that the exact benchmark periods in which the upward or downward shifts occur differ from run to run." Table 2 considers the second half of the span for which I examined the model, that is, the benchmark periods from 13,000 to 25,000. For each of the 10 runs I compute the average, the standard deviation, the minimum, and the maximum lock-in rate. The table shows for each of these four variables the run with the lowest and the run with the highest values among the
I' These graphs are available from the author upon request.
824 Nicolaas J. Vriend
lock-in rate
1-
0.75-
0.5-
0 t/ 1 I H 0.25-
500 10,000 20,000 period
Figure 5. Lock-In Rates in Benchmark Periods (Run 8).
10 runs. As can be seen, for each of these four statistics the run with the lowest value and the
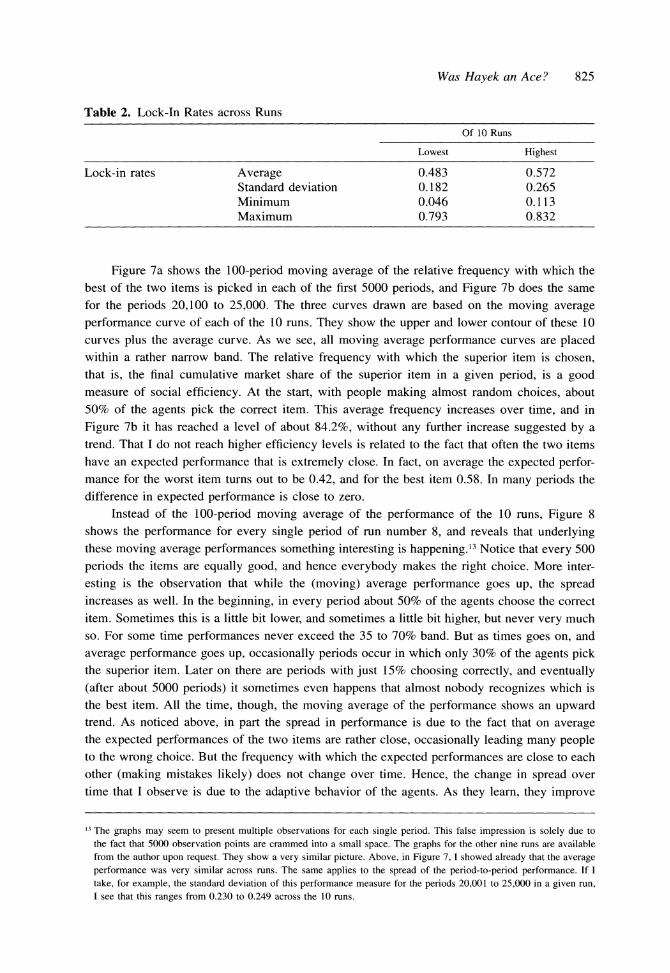
run with the highest value are within a relatively narrow range. Another way to measure how much lock-in into one of the two items is present is the rate
at which the choices of the agents switch from one to the other item in the benchmark periods. If each individual decision is taken independently, and the items are equally good, the expected switch rate is 0.50. Figure 6 shows the switch rates for each of the benchmark periods in run
number 8. As we see, the switch rate starts indeed around 0.50, and then comes down as time
proceeds, but just as with the lock-in rates above, this goes with a lot of fluctuations. The switch
rate regularly comes down to values close to 0, implying a very orderly state in which every
agent chooses the same item, but almost equally regularly the switch rate jumps back to levels
close to 0.50, the maximum disorder, as if all agents choose randomly. Just as for the lock-in rates, qualitatively similar pictures emerge across the 10 runs.'2 Table
3 shows the run with the lowest and the run with the highest value for the same statistics as
used in Table 2: the average, the standard deviation, the minimum, and the maximum rate over
the benchmark periods from 13,000 to 25,000 for a given run. As we see, for each of the four
statistics the differences across the runs are relatively minor.
Performance over Time
In the benchmark periods analyzed in the previous section, the two items were always identical. In those periods, any item was as good as the other item, and hence any decision rule was as good as any other decision rule. I used those periods to see how much information-
contagious behavior the agents had developed during the periods in between the benchmark
periods, periods in which the two items were generally not identical. Before analyzing the behavior of the individual agents, I first want to see what the effects of the learning of the
agents is on the overall outcomes for the society.
12 These graphs are available from the author upon request.
Was Hayek an Ace? 825
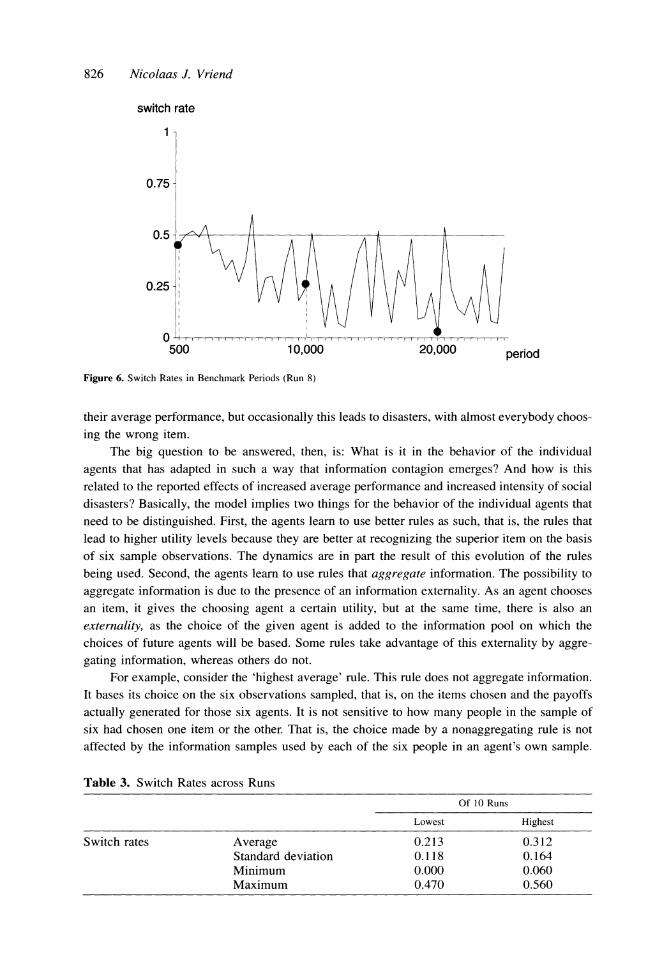
Table 2. Lock-In Rates across Runs
Of 10 Runs
Lowest Highest
Lock-in rates Average 0.483 0.572 Standard deviation 0.182 0.265 Minimum 0.046 0.113 Maximum 0.793 0.832
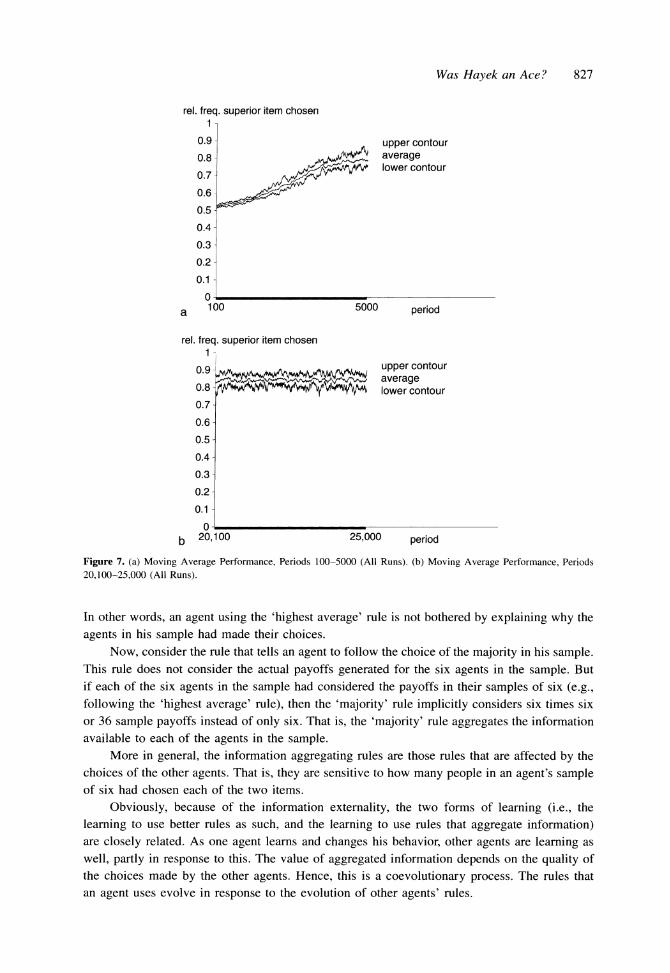
Figure 7a shows the 100-period moving average of the relative frequency with which the best of the two items is picked in each of the first 5000 periods, and Figure 7b does the same for the periods 20,100 to 25,000. The three curves drawn are based on the moving average performance curve of each of the 10 runs. They show the upper and lower contour of these 10 curves plus the average curve. As we see, all moving average performance curves are placed within a rather narrow band. The relative frequency with which the superior item is chosen, that is, the final cumulative market share of the superior item in a given period, is a good measure of social efficiency. At the start, with people making almost random choices, about 50% of the agents pick the correct item. This average frequency increases over time, and in
Figure 7b it has reached a level of about 84.2%, without any further increase suggested by a trend. That I do not reach higher efficiency levels is related to the fact that often the two items have an expected performance that is extremely close. In fact, on average the expected perfor- mance for the worst item turns out to be 0.42, and for the best item 0.58. In many periods the difference in expected performance is close to zero.
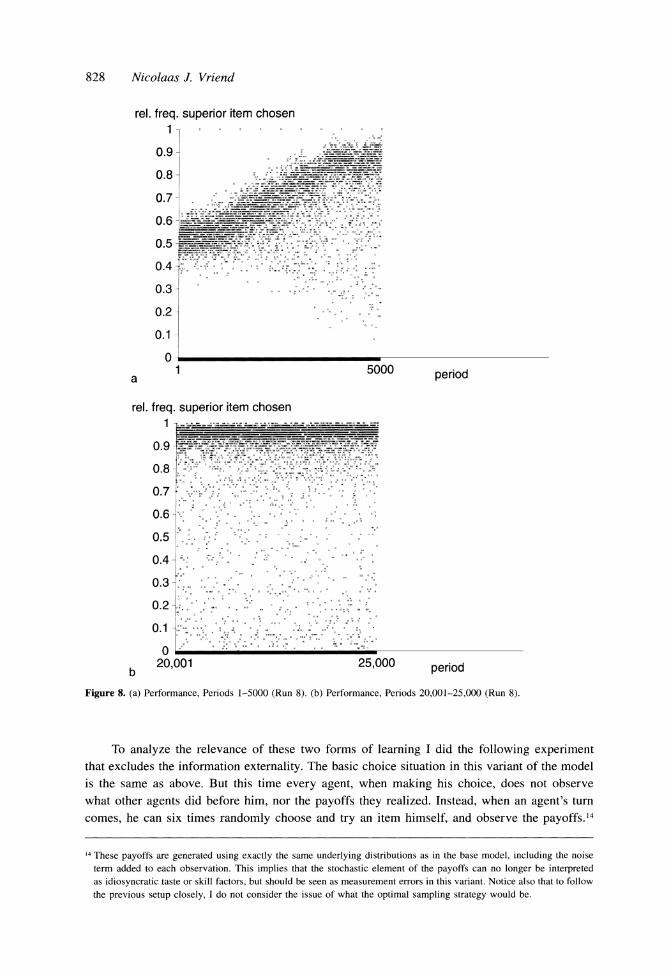
Instead of the 100-period moving average of the performance of the 10 runs, Figure 8 shows the performance for every single period of run number 8, and reveals that underlying these moving average performances something interesting is happening.13 Notice that every 500
periods the items are equally good, and hence everybody makes the right choice. More inter-
esting is the observation that while the (moving) average performance goes up, the spread increases as well. In the beginning, in every period about 50% of the agents choose the correct item. Sometimes this is a little bit lower, and sometimes a little bit higher, but never very much so. For some time performances never exceed the 35 to 70% band. But as times goes on, and
average performance goes up, occasionally periods occur in which only 30% of the agents pick the superior item. Later on there are periods with just 15% choosing correctly, and eventually (after about 5000 periods) it sometimes even happens that almost nobody recognizes which is the best item. All the time, though, the moving average of the performance shows an upward trend. As noticed above, in part the spread in performance is due to the fact that on average the expected performances of the two items are rather close, occasionally leading many people to the wrong choice. But the frequency with which the expected performances are close to each other (making mistakes likely) does not change over time. Hence, the change in spread over time that I observe is due to the adaptive behavior of the agents. As they learn, they improve
13 The graphs may seem to present multiple observations for each single period. This false impression is solely due to the fact that 5000 observation points are crammed into a small space. The graphs for the other nine runs are available from the author upon request. They show a very similar picture. Above, in Figure 7, I showed already that the average performance was very similar across runs. The same applies to the spread of the period-to-period performance. If I take, for example, the standard deviation of this performance measure for the periods 20,001 to 25,000 in a given run, I see that this ranges from 0.230 to 0.249 across the 10 runs.
826 Nicolaas J. Vriend
switch rate
1-
0.75-
0.5
0.25-
500 10,000 20,000 period
Figure 6. Switch Rates in Benchmark Periods (Run 8)
their average performance, but occasionally this leads to disasters, with almost everybody choos-
ing the wrong item.
The big question to be answered, then, is: What is it in the behavior of the individual
agents that has adapted in such a way that information contagion emerges? And how is this
related to the reported effects of increased average performance and increased intensity of social
disasters? Basically, the model implies two things for the behavior of the individual agents that
need to be distinguished. First, the agents learn to use better rules as such, that is, the rules that
lead to higher utility levels because they are better at recognizing the superior item on the basis
of six sample observations. The dynamics are in part the result of this evolution of the rules
being used. Second, the agents learn to use rules that aggregate information. The possibility to
aggregate information is due to the presence of an information externality. As an agent chooses
an item, it gives the choosing agent a certain utility, but at the same time, there is also an
externality, as the choice of the given agent is added to the information pool on which the
choices of future agents will be based. Some rules take advantage of this externality by aggre- gating information, whereas others do not.
For example, consider the 'highest average' rule. This rule does not aggregate information.
It bases its choice on the six observations sampled, that is, on the items chosen and the payoffs actually generated for those six agents. It is not sensitive to how many people in the sample of
six had chosen one item or the other. That is, the choice made by a nonaggregating rule is not affected by the information samples used by each of the six people in an agent's own sample.
Table 3. Switch Rates across Runs
Of 10 Runs
Lowest Highest
Switch rates Average 0.213 0.312 Standard deviation 0.118 0.164 Minimum 0.000 0.060 Maximum 0.470 0.560
Was Hayek an Ace? 827
rel. freq. superior item chosen 1-
0.9 upper contour 0.8 - average
0.7 -^ lower contour 0.7
0.6
0.5 -
0.4-
0.3- 0.2-
0.1-
0 a 100 5000 period
rel. freq. superior item chosen 1 -
0.9\ ,2za ej ~upper contour 0O.g.9 ~l~~v~ average
~0.8 - lower contour 0.7-
0.6-
0.5-
0.4- 0.3- 0.2-
0.1-
b 20,100 25,000 period
Figure 7. (a) Moving Average Performance, Periods 100-5000 (All Runs). (b) Moving Average Performance, Periods 20,100-25,000 (All Runs).
In other words, an agent using the 'highest average' rule is not bothered by explaining why the
agents in his sample had made their choices.
Now, consider the rule that tells an agent to follow the choice of the majority in his sample. This rule does not consider the actual payoffs generated for the six agents in the sample. But if each of the six agents in the sample had considered the payoffs in their samples of six (e.g., following the 'highest average' rule), then the 'majority' rule implicitly considers six times six or 36 sample payoffs instead of only six. That is, the 'majority' rule aggregates the information available to each of the agents in the sample.
More in general, the information aggregating rules are those rules that are affected by the choices of the other agents. That is, they are sensitive to how many people in an agent's sample of six had chosen each of the two items.
Obviously, because of the information externality, the two forms of learning (i.e., the
learning to use better rules as such, and the learning to use rules that aggregate information) are closely related. As one agent learns and changes his behavior, other agents are learning as
well, partly in response to this. The value of aggregated information depends on the quality of the choices made by the other agents. Hence, this is a coevolutionary process. The rules that an agent uses evolve in response to the evolution of other agents' rules.
828 Nicolaas J. Vriend
rel. freq. superior item chosen
0.2 0.1 0.7-
0.62-
~~~~~0.5~, 9
0.3 , ??p
0.9 - i'-' c
0.13
b 20,001 25,000 period
Figure 8. (a) Performance, Periods 1-5000 (Run 8). (b) Performance, Periods 20,001-25,000 (Run 8).
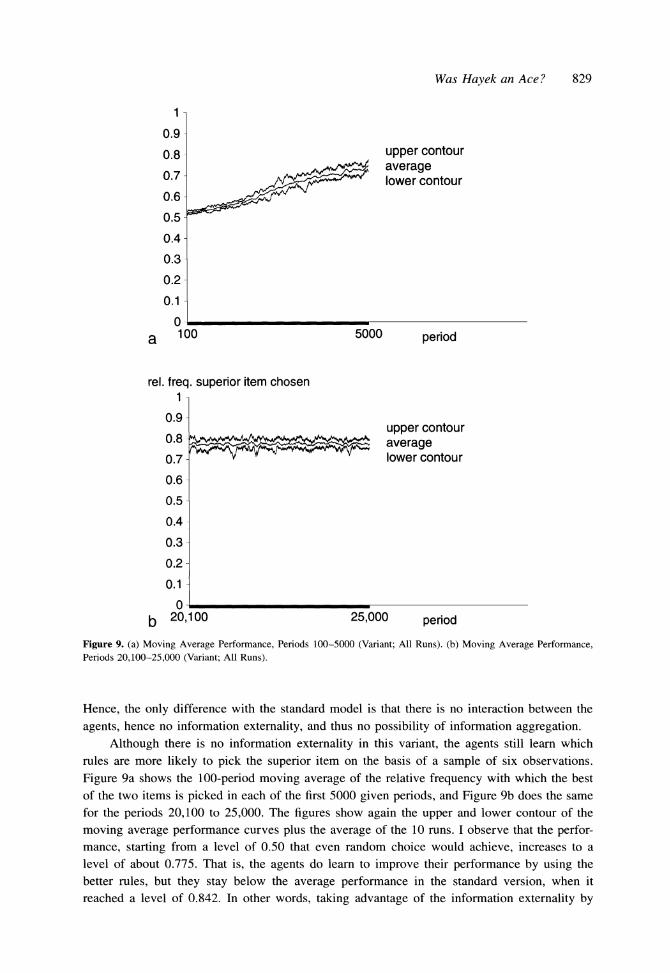
To analyze the relevance of these two forms of learning I did the following experiment that excludes the information externality. The basic choice situation in this variant of the model is the same as above. But this time every agent, when making his choice, does not observe what other agents did before him, nor the payoffs they realized. Instead, when an agent's turn
comes, he can six times randomly choose and try an item himself, and observe the payoffs.14 comes, he can six times randomly choose and try an item himself, and observe the payoffs.TM
14 These payoffs are generated using exactly the same underlying distributions as in the base model, including the noise term added to each observation. This implies that the stochastic element of the payoffs can no longer be interpreted as idiosyncratic taste or skill factors, but should be seen as measurement errors in this variant. Notice also that to follow the previous setup closely, I do not consider the issue of what the optimal sampling strategy would be.
Was Hayek an Ace? 829
5000
upper contour average lower contour
period
rel. freq. superior item chosen 1 -
upper contour average lower contour
25,000 period
Figure 9. (a) Moving Average Performance, Periods 100-5000 (Variant; All Runs). (b) Moving Average Performance, Periods 20,100-25,000 (Variant; All Runs).
Hence, the only difference with the standard model is that there is no interaction between the
agents, hence no information externality, and thus no possibility of information aggregation. Although there is no information externality in this variant, the agents still learn which
rules are more likely to pick the superior item on the basis of a sample of six observations.
Figure 9a shows the 100-period moving average of the relative frequency with which the best of the two items is picked in each of the first 5000 given periods, and Figure 9b does the same for the periods 20,100 to 25,000. The figures show again the upper and lower contour of the
moving average performance curves plus the average of the 10 runs. I observe that the perfor- mance, starting from a level of 0.50 that even random choice would achieve, increases to a level of about 0.775. That is, the agents do learn to improve their performance by using the better rules, but they stay below the average performance in the standard version, when it reached a level of 0.842. In other words, taking advantage of the information externality by
1-
0.9
0.8
0.7-
0.6
0.5 -
0.4-
0.3
0.2-
0.1-
0- 10 a I0
0.9
0.8
0.7
0.6
0.5
0.4-
0.3-
0.2-
0.1- A V
b 20,100 I
rel. freq. superior item chosen
0.9
0.8 -
0.7
0.
0.4 *T:
0.3
0.2
0.1-
0
a
rel. freq. superior item chosen
0.8
0.7 -.?!i:?%-,,.
0.5 ::
~9:'" : '-
0.4-
0.3
0.2-
0.1-
b 20,001
Figure 10. (a) Performance, Periods 1-5000 (Variant; Run 1). (b) Performance, Periods 20,001-25,000 (Variant; Run 1).
aggregating knowledge, the agents succeeded in winning another 8.6% in performance in the
standard version.15
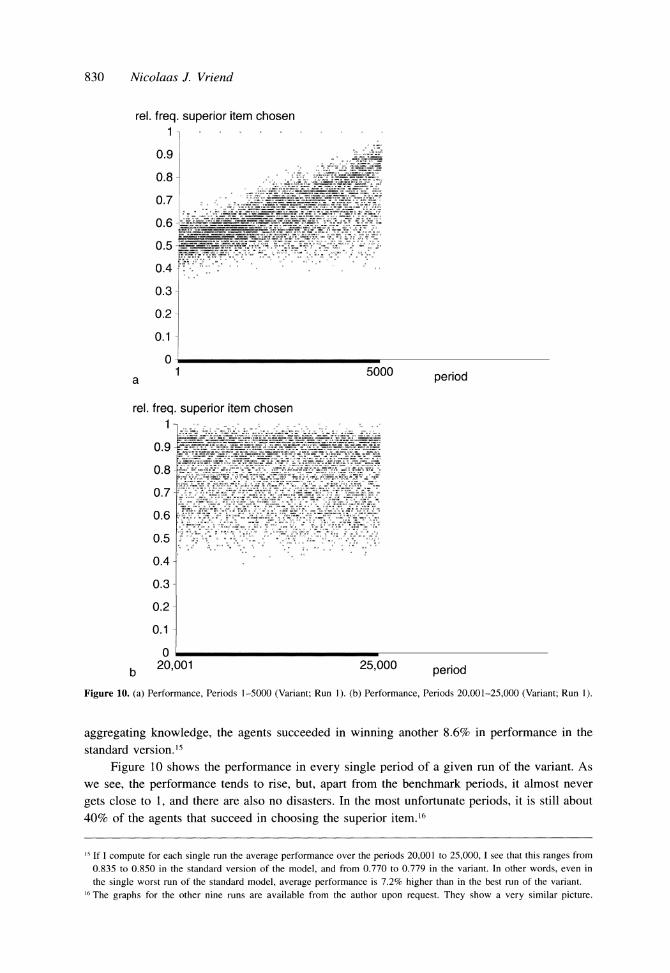
Figure 10 shows the performance in every single period of a given run of the variant. As
we see, the performance tends to rise, but, apart from the benchmark periods, it almost never
gets close to 1, and there are also no disasters. In the most unfortunate periods, it is still about
40% of the agents that succeed in choosing the superior item.16
'5 If I compute for each single run the average performance over the periods 20,001 to 25,000, I see that this ranges from
0.835 to 0.850 in the standard version of the model, and from 0.770 to 0.779 in the variant. In other words, even in
the single worst run of the standard model, average performance is 7.2% higher than in the best run of the variant. 16 The graphs for the other nine runs are available from the author upon request. They show a very similar picture.
830 Nicolaas J. Vriend
5000
25,000
period
period
1
Im.u . ,u uru, .ui ail Immm rnm rPPanmra on wo, nm Om0100(0mlDDL(I O mo ma ooaamo uu, -mu uou u au ru--n uaulmo?-mruu u iruoaru -nuoruoo rar mni mo rrt ii UP L1 m IPIilD1IPIUI IPYY 4 mm mm-no o na, no r moor no oon mmen m ormra ulrm ru umoULm lummo "oP"- a aoPmao III ooao 4 mom ooa mar omra rmcl oan, m m nan m Pn o 3 o mlnom nmn ? on rrllruau auu ulm oorm u o llumu uuru m amoooo a Pa omora a loma ao Il,m;?a.llu omlnau -i no oilnoa UDP)?UUmPU YY-YLILY41"C 10003 Pmaaa ooo IPl(i DLmllRII- YY I WZU nYr) YLDY? YYY Ym UU VO Y U UrYiY L1YII YmnUaa U EIIE a a an D-C on om-or, m m a a cam nno o - ?or rnn ri- enm mo aa m ouu uul N a ull nuua D rma mon mmiooom oar m m, n rn an anr n oooon rm muuouamuuuu u nuua ar a- no oo onnmP oaE o oilo o m m rm--nllno nnl onmommcnrm m Pa ouulrrr uo u a a mil uuoarumi my ro pm D?L1 na aP mao a oaan (m(P r -nrm a on nnno UP a u uuutausu ruiuU lom;uo uromu IIUUI aJ (PI?CSDPI D m- YY 1LI Um E YUU ?IDIEYUUIU UUI m(l? no in a n man 115 no OOIODDm OD CII*lml mon onon nloor naoo o 3ilno E om o o mo nnn -? n non P no ra-r m orrn;lnc?rm o nrr m uL uoou., irp :ri ma oora arm m 71m eucu uu mv u oull E; on a a r`a r np n nomo rm st uo us uiu uL Iran m
a
Was Hayek an Ace? 831
cumulative market share item 1
1
0.9-
0.8-
0.7 - upper contour 0.7-
0.6-
0.5
0.4- 0.3
lower contour 0.2
0.1-
0 100 agents
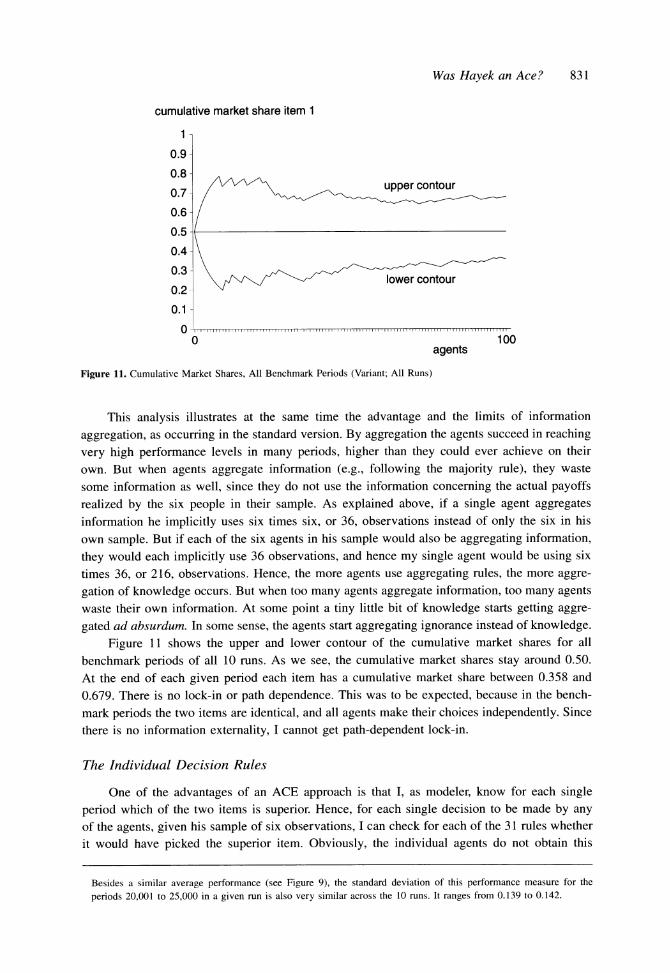
Figure 11. Cumulative Market Shares, All Benchmark Periods (Variant; All Runs)
This analysis illustrates at the same time the advantage and the limits of information
aggregation, as occurring in the standard version. By aggregation the agents succeed in reaching
very high performance levels in many periods, higher than they could ever achieve on their
own. But when agents aggregate information (e.g., following the majority rule), they waste
some information as well, since they do not use the information concerning the actual payoffs realized by the six people in their sample. As explained above, if a single agent aggregates information he implicitly uses six times six, or 36, observations instead of only the six in his
own sample. But if each of the six agents in his sample would also be aggregating information,
they would each implicitly use 36 observations, and hence my single agent would be using six
times 36, or 216, observations. Hence, the more agents use aggregating rules, the more aggre-
gation of knowledge occurs. But when too many agents aggregate information, too many agents waste their own information. At some point a tiny little bit of knowledge starts getting aggre-
gated ad absurdum. In some sense, the agents start aggregating ignorance instead of knowledge.
Figure 11 shows the upper and lower contour of the cumulative market shares for all
benchmark periods of all 10 runs. As we see, the cumulative market shares stay around 0.50.
At the end of each given period each item has a cumulative market share between 0.358 and
0.679. There is no lock-in or path dependence. This was to be expected, because in the bench-
mark periods the two items are identical, and all agents make their choices independently. Since
there is no information externality, I cannot get path-dependent lock-in.
The Individual Decision Rules
One of the advantages of an ACE approach is that I, as modeler, know for each single
period which of the two items is superior. Hence, for each single decision to be made by any of the agents, given his sample of six observations, I can check for each of the 31 rules whether
it would have picked the superior item. Obviously, the individual agents do not obtain this
Besides a similar average performance (see Figure 9), the standard deviation of this performance measure for the
periods 20,001 to 25,000 in a given run is also very similar across the 10 runs. It ranges from 0.139 to 0.142.
832 Nicolaas J. Vriend
rel. freq. best-reply
1
0.9 majority
t- ----------------.-------.-- m---- m ax. 0.8- avg.
------~~<~~~~~~ rlast 0.7-
min.
0.6-/
0.5 _ _--__----_-_-__---__----_--_ __-_-__ _ -__-_-_ _ _random
. 4 i i i i 1 r i i T , f , f , l l l l l l l l l t l l l ll l rlll l l l l l l l 500 period 25,000 period
Figure 12. Specific Rules as Best Replies (All Runs)
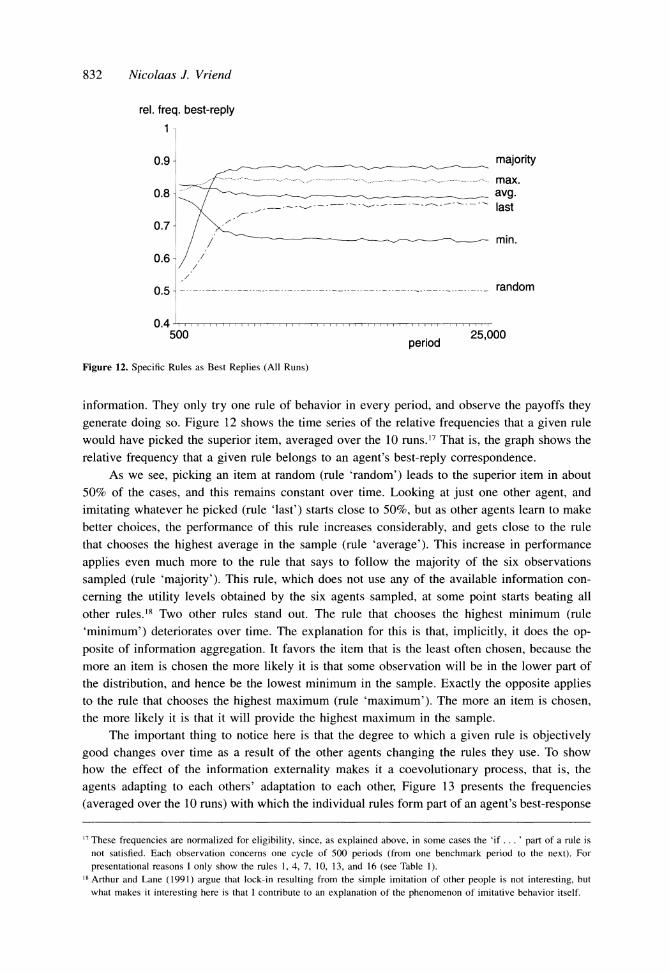
information. They only try one rule of behavior in every period, and observe the payoffs they
generate doing so. Figure 12 shows the time series of the relative frequencies that a given rule
would have picked the superior item, averaged over the 10 runs.17 That is, the graph shows the
relative frequency that a given rule belongs to an agent's best-reply correspondence. As we see, picking an item at random (rule 'random') leads to the superior item in about
50% of the cases, and this remains constant over time. Looking at just one other agent, and
imitating whatever he picked (rule 'last') starts close to 50%, but as other agents learn to make
better choices, the performance of this rule increases considerably, and gets close to the rule
that chooses the highest average in the sample (rule 'average'). This increase in performance
applies even much more to the rule that says to follow the majority of the six observations
sampled (rule 'majority'). This rule, which does not use any of the available information con-
cerning the utility levels obtained by the six agents sampled, at some point starts beating all
other rules.18 Two other rules stand out. The rule that chooses the highest minimum (rule
'minimum') deteriorates over time. The explanation for this is that, implicitly, it does the op-
posite of information aggregation. It favors the item that is the least often chosen, because the
more an item is chosen the more likely it is that some observation will be in the lower part of
the distribution, and hence be the lowest minimum in the sample. Exactly the opposite applies to the rule that chooses the highest maximum (rule 'maximum'). The more an item is chosen, the more likely it is that it will provide the highest maximum in the sample.
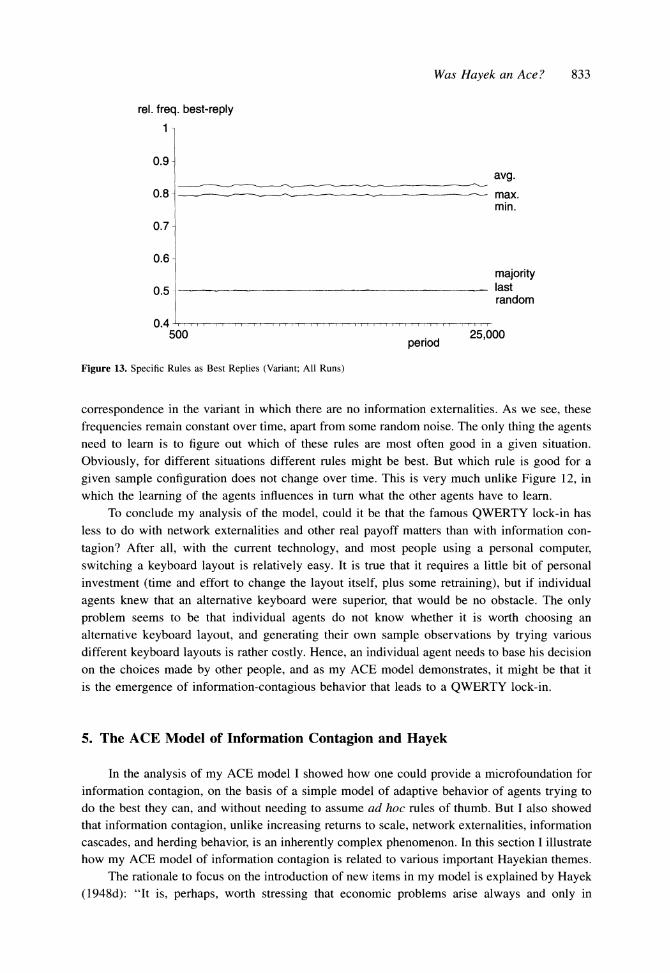
The important thing to notice here is that the degree to which a given rule is objectively
good changes over time as a result of the other agents changing the rules they use. To show how the effect of the information externality makes it a coevolutionary process, that is, the
agents adapting to each others' adaptation to each other, Figure 13 presents the frequencies
(averaged over the 10 runs) with which the individual rules form part of an agent's best-response
7 These frequencies are normalized for eligibility, since, as explained above, in some cases the 'if . . . ' part of a rule is not satisfied. Each observation concerns one cycle of 500 periods (from one benchmark period to the next). For presentational reasons I only show the rules 1, 4, 7, 10, 13, and 16 (see Table 1).
18 Arthur and Lane (1991) argue that lock-in resulting from the simple imitation of other people is not interesting, but what makes it interesting here is that I contribute to an explanation of the phenomenon of imitative behavior itself.
Was Hayek an Ace? 833
rel. freq. best-reply 1-
0.9- avg.
0.8 - max. min.
0.7-
0.6- majority
0.5 - last random
0.4 .. . 1 ] 500 d 25,000
period
Figure 13. Specific Rules as Best Replies (Variant; All Runs)
correspondence in the variant in which there are no information externalities. As we see, these
frequencies remain constant over time, apart from some random noise. The only thing the agents need to learn is to figure out which of these rules are most often good in a given situation.
Obviously, for different situations different rules might be best. But which rule is good for a
given sample configuration does not change over time. This is very much unlike Figure 12, in
which the learning of the agents influences in turn what the other agents have to learn. To conclude my analysis of the model, could it be that the famous QWERTY lock-in has
less to do with network externalities and other real payoff matters than with information con-
tagion? After all, with the current technology, and most people using a personal computer,
switching a keyboard layout is relatively easy. It is true that it requires a little bit of personal investment (time and effort to change the layout itself, plus some retraining), but if individual
agents knew that an alternative keyboard were superior, that would be no obstacle. The only problem seems to be that individual agents do not know whether it is worth choosing an
alternative keyboard layout, and generating their own sample observations by trying various different keyboard layouts is rather costly. Hence, an individual agent needs to base his decision on the choices made by other people, and as my ACE model demonstrates, it might be that it
is the emergence of information-contagious behavior that leads to a QWERTY lock-in.
5. The ACE Model of Information Contagion and Hayek
In the analysis of my ACE model I showed how one could provide a microfoundation for information contagion, on the basis of a simple model of adaptive behavior of agents trying to do the best they can, and without needing to assume ad hoc rules of thumb. But I also showed that information contagion, unlike increasing returns to scale, network externalities, information
cascades, and herding behavior, is an inherently complex phenomenon. In this section I illustrate how my ACE model of information contagion is related to various important Hayekian themes.
The rationale to focus on the introduction of new items in my model is explained by Hayek (1948d): "It is, perhaps, worth stressing that economic problems arise always and only in
834 Nicolaas J. Vriend
consequences of change. As long as things continue as before, or at least as they were expected to, there arise no new problems requiring a decision, no need to form a new plan" (p. 82).
The basic choice problem faced by the individual agents might seem a simple statistical
problem that could be solved by a central planner. However, as explained by Hayek (1948d), "... the sort of knowledge with which I have been concerned is knowledge of the kind which
by its nature cannot enter into statistics and therefore cannot be conveyed to any central authority in statistical form. The statistics which such a central authority would have to use would have
to be arrived at precisely by abstracting from minor differences between the things, by lumping
together, as resources of one kind, items which differ as regards location, quality, and other
particulars, in a way which may be very significant for the specific decision. It follows from
this that central planning based on statistical information by its nature cannot take direct account
of these circumstances of time and place and that the central planner will have to find some
way or other in which the decisions depending on them can be left to the "man on the spot"" (p. 83).19
The fact that different individual agents will have different samples implies that "... we
deal . . . with a situation in which a number of persons are attempting to work out their separate
plans, (and hence) we can no longer assume that the data are the same for all the planning minds" (Hayek 1948e, p. 93). The fact that no individual agent observes all data concerning a
new item reflects Hayek's (1948d) observation concerning ".. . an essential part of the phe- nomena with which we have to deal: the unavoidable imperfection of man's knowledge and the
consequent need for a process by which knowledge is constantly communicated and required"
(p. 91). The sampling of observations models the fact that we are dealing with "a process which
necessarily involves continuous changes in the data for the different individuals. (T)he causal
factor enters here in the form of the acquisition of new knowledge by the different individuals
or of changes in their data brought about by the contacts between them" (Hayek 1948e, p. 94). The random element of the payoffs generated by a given item reflects Hayek's observations
that "every individual has some advantage over all others because he possesses unique infor-
mation of which beneficial use might be made" (Hayek 1948d, p. 80) of the item, and that
"(a)t any given moment the equipment of a particular firm is always largely determined by historical accident, and the problem is that it should make the best use of the given equipment ..." (Hayek 1948e, p. 101).
Concerning the learning model that I use to model the adaptive behavior of the individual
agents, it is interesting to note that many of the insights of the recent literature on learning and
adaptive behavior seem to have been anticipated by Hayek (see, e.g., Hayek 1952). Whereas
adaptive behavior is nowadays usually linked to the concept of 'bounded rationality' (see, e.g., Simon 1955, 1957, 1959, or 1976), Hayek (1948a) called it 'antirationalistic': "The antiration-
alistic approach, which regards man not as a highly rational and intelligent but as a very irrational and fallible being, whose individual errors are corrected only in the course of a social
process, and which aims at making the best of a very imperfect material, is probably the most
characteristic feature of English individualism" (pp. 8-9). In Savage's (1954) terminology, the
adaptive behavior implied by this bounded rationality is known as following the 'cross that
bridge when you meet it' principle, which is necessary when an agent is in a 'large world', as
opposed to the 'small world' to which subjective expected utility theory applies. In a large world, the agent's situation is ill-defined in the sense that he does not have a well-specified
19 Ellison and Fudenberg (1993) give some agricultural examples that illustrate this point.
Was Hayek an Ace? 835
model of his environment. Hence, instead of deducing optimal actions from universal truths, he will need to use inductive reasoning, that is, proceeding from the actual situation he faces.
As Hayek (1973) put it: "'Learning from experience' ... is a process not primarily of
reasoning but ... of practices which have prevailed because they were successful" (p. 18). And
"(w)hat we call understanding is in the last resort simply his capacity to respond to his envi-
ronment with a pattern of actions that helps him to persist" (p. 18). Hayek then goes on "to
use the conception of evolution ... as an explanation of the rise of rules of conduct" (p. 24) instead of "construct(ing) such rules by deduction from explicit premises" (p. 21). Hence, using the label of "(e)volutionary rationalism" (p. 30) Hayek advocates an inductive approach as
worked out in great detail in Holland et al. (1986).
Hayek also saw this adaptive behavior in terms of 'if ... then ...' rules. "Whenever a
type of situation evokes in an individual a disposition towards a certain pattern of response, that basic relation which is described as 'abstract' is present" (Hayek 1973, p. 30). And ab-
stractness is "the basis of man's capacity to move successfully in a world very imperfectly known to him-an adaptation to his ignorance of most of the particular facts of his surround-
ings" (p. 30).
Continuing this motif of ignorance, Hayek (1973) goes on: "... the rules ... need not
be rules which are 'known' to these elements; it is sufficient that the elements actually behave in a manner which can be described by such rules" (p. 43). This corresponds to my discussion of classifier systems, where I argued that they can be seen as a minimal form of modeling learning, in the sense that we do not need to make many assumptions about the reasoning procedures actually followed by the agents. As Hayek put it: "... we can make use of so much
experience, not because we possess the experience, but because, without our knowing it, it has become incorporated in the schemata of thought which guide us" (pp. 30-31).
Hayek's view that it is not the use of simple rules of thumb as such that matters, but the fact that this usage is based all the time on the agents' experience is confirmed in my ACE model. Using fixed rules of thumb to model individual behavior would not work. For example, in my model the information aggregation, and in particular the rule to follow the majority, emerge. If I specify a priori that the individual agents follow the majority rule then I would
stay at a performance level of 0.50. Also, when the majority rule emerges as a good rule, this does not imply that everybody should follow it. If they did, then the performance would fall back again to 0.50. Hence, what matters is also the precise configuration of rules used in the
population. And the continuously changing configurations that emerge turn out to lead to both a high performance level and information contagion with path-dependent lock-in.
But one important difference between some of Hayek's work and more recent approaches to adaptive behavior should be noticed. When, for example, Hayek (1973) uses the evolutionary argument, what he has in mind is that "... selection will operate as between societies of different types" (p. 44). Rules of behavior emerge ". .. often not because they conferred any recognizable benefit on the acting individual but because they increased the chances of survival of the group to which he belonged" (p. 18). In the classifier system literature, and the rein- forcement learning literature in general, the evolutionary argument operates at the level of the rules of behavior or conduct, nowadays usually known as rules of thumb, themselves. That is, each individual agent considers a set of rules, and these rules compete with each other. But
obviously, the social element has not disappeared completely. Which rules are good depends on which rules other people follow as well. Hence, evolution also takes place at a social level. This is called coevolution: One individual's set of rules evolves in response to the rules used
836 Nicolaas J. Vriend
by other individuals, with the sets of all these individuals evolving at the same time. In my ACE model the beneficial information aggregation, particularly the best rule being the one to follow the majority, did not emerge because of an evolutionary process working through group selection, nor did it come through a selection of individuals. It arose through a coevolutionary process, the simultaneous evolution of rules of behavior used by the individual agents.
As Figures 3 and 4 show, the decentralized interaction of the individual agents leads to a situation in which almost all agents choosing the same item often emerged as a spontaneous order, where "(b)y 'order' we ... describe a state of affairs in which a multiplicity of elements
of various kinds are so related to each other that we may learn from our acquaintance with
some spatial or temporal part of the whole to form correct expectations concerning the rest, or
at least expectations which have a good chance of proving correct" (Hayek 1973, p. 36). The behavior of a complex system is often said to be characterized by a '2 + 2 = 5
effect', the system being more than the sum of its parts (see, e.g., Parker and Stacey 1994). It
might be that this term comes from the description of the behavior of simple nonlinear dynamic functions, where the chaotic outcomes, going 'all over the place', seem profuse given the simple
input specification. However, the striking feature of self-organized systems, as stressed by Hayek (1973), is not their chaos (that anything can happen), but quite on the contrary their order (that
something very precise happens). As Hayek (1967c) put it: "The overall order of actions in a
group is ... more than the totality of regularities observable in the actions of the individuals
and cannot be wholly reduced to them" (p. 70; emphasis added). In other words, the behavior
of a complex system is not so much more than the sum of its parts, but less than the sum of
its parts, with the difficulty arising because one cannot predict which of the possibilities will
be realized by examining only the constituent parts. Hence, when it comes to describing the
self-organizing behavior of a complex adaptive system, it might be useful to call it a '2 + 2 =
3 effect' (Huynen 1995).
My ACE model exhibits self-organization through information-contagious behavior, and
the emergence of spontaneous orders, in which typically most agents choose the same, superior item as "such an order will utilize the separate knowledge of all its several members, without
this knowledge ever being concentrated in a singe mind ... " (Hayek 1973, p. 41). But it turns
out that this is not a simple monotonic process from disorder to order until the solution has
been reached, with a happy ending. Instead, the system continually moves back and forth be-
tween order and disorder. That is, the self-organization is a continuing, ongoing story, in which
the emerging order unravels time and again. In many of his writings Hayek focused on the question of what set of institutional arrangements
would, in his view, be least likely to hinder the coordination of divided knowledge (such as the
rule of law, democratic polity, enforced and exchangeable property rights, and a market system with
freely adjustable prices). More in general, Hayek seemed to share with Adam Smith the belief that
an emergent, spontaneous order tends to be beneficial (see, e.g. Hayek 1948b, d).20 On the one
hand, my ACE model shows that matters may be slightly more complicated than perhaps expected
by Hayek. The emerging spontaneous order is beneficial. That is, on average. But along with the
improved average performance I also see an increase in both the number and degree of disasters.
This is related to the tension between generating knowledge and aggregating knowledge. If enough
knowledge is generated by the individual agents, aggregation leads to good outcomes, but if every-
body would merely aggregate over and over again a tiny little bit of knowledge, this might lead
20 Although, for example, Hayek (1960) shows that he did not believe this to be guaranteed.
Was Hayek an Ace? 837
occasionally to very bad outcomes for the society as it is ignorance that is coordinated. In fact, it
is this which keeps the self-organizing process from being a monotonic one. If it were monotonic, I would get stuck with only disasters. On the other hand, my ACE model can also be seen as
confirming Hayek's vision. That is, pointing to occasional disasters (QWERTY?, VHS?) is not sufficient to reject Hayek's conjecture. As my model shows, these occasional disasters are in some sense the flip side of the improved average performance that comes through the emergence of information contagion.
6. Conclusion
It would probably be presumptuous to judge whether Hayek might have been an ACE, but it seems clear that ACE is social theory in a Hayekian tradition. And therefore a further ex-
change of insights would seem fruitful.
Appendix Al Definition of the 31 Decision Rules of the Classifier System Listed in Table 1
1 highest average If both items are present in the sample of 6 observations then choose the item that has the
highest average performance in the sample. Otherwise, if the condition is not satisfied, the rule is not eligible and will be neglected.
2 highest average (2)
If both items are present in the sample of 6 observations and the item with the highest average performance occurs at least twice in the sample then choose the item that has the highest average performance. Otherwise, neglect this rule.
3 highest average (3)
If both items are present in the sample of 6 observations and the item with the highest average performance occurs at least three times in the sample then choose the item that has the highest average performance. Otherwise, neglect this rule.
4 highest minimum
If both items are present in the sample of 6 observations then choose the item that has the highest minimum performance in the sample. Otherwise, neglect this rule.
5 highest minimum (2)
If both items are present in the sample of 6 observations and the item with the highest minimum performance occurs at least twice in the sample then choose the item that has the highest minimum performance. Otherwise, neglect this rule.
6 highest minimum (3)
If both items are present in the sample of 6 observations and the item with the highest minimum performance occurs at least three times in the sample then choose the item that has the highest minimum performance. Otherwise, neglect this rule.
7 highest maximum
If both items are present in the sample of 6 observations then choose the item that has the highest maximum performance in the sample. Otherwise, neglect this rule.
8 highest maximum (2)
If both items are present in the sample of 6 observations and the item with the highest maximum performance occurs at least twice in the sample then choose the item that has the highest maximum performance. Otherwise, neglect this rule.
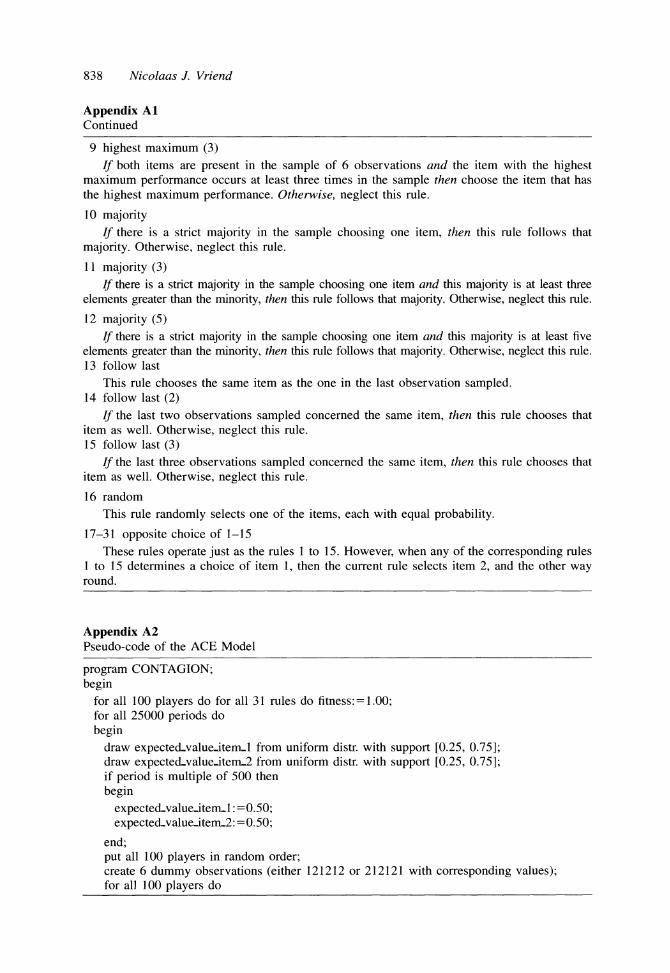
838 Nicolaas J. Vriend
Appendix Al Continued
9 highest maximum (3)
If both items are present in the sample of 6 observations and the item with the highest maximum performance occurs at least three times in the sample then choose the item that has the highest maximum performance. Otherwise, neglect this rule.
10 majority If there is a strict majority in the sample choosing one item, then this rule follows that
majority. Otherwise, neglect this rule.
11 majority (3)
If there is a strict majority in the sample choosing one item and this majority is at least three elements greater than the minority, then this rule follows that majority. Otherwise, neglect this rule.
12 majority (5)
If there is a strict majority in the sample choosing one item and this majority is at least five elements greater than the minority, then this rule follows that majority. Otherwise, neglect this rule. 13 follow last
This rule chooses the same item as the one in the last observation sampled. 14 follow last (2)
If the last two observations sampled concerned the same item, then this rule chooses that item as well. Otherwise, neglect this rule. 15 follow last (3)
If the last three observations sampled concerned the same item, then this rule chooses that item as well. Otherwise, neglect this rule.
16 random This rule randomly selects one of the items, each with equal probability.
17-31 opposite choice of 1-15
These rules operate just as the rules 1 to 15. However, when any of the corresponding rules 1 to 15 determines a choice of item 1, then the current rule selects item 2, and the other way round.
Appendix A2 Pseudo-code of the ACE Model
program CONTAGION; begin
for all 100 players do for all 31 rules do fitness:= 1.00; for all 25000 periods do
begin draw expected_valueitem-1 from uniform distr. with support [0.25, 0.75]; draw expected_value-item-2 from uniform distr. with support [0.25, 0.75]; if period is multiple of 500 then begin
expected_valueitem-1: =0.50; expected-value-item-2: =0.50;
end; put all 100 players in random order; create 6 dummy observations (either 121212 or 212121 with corresponding values); for all 100 players do
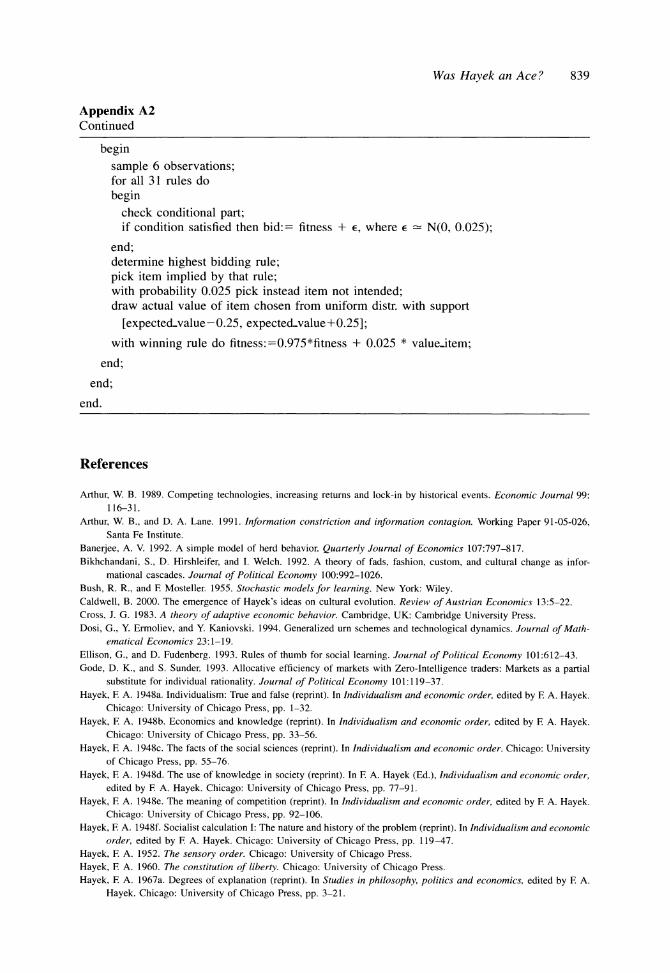
Was Hayek an Ace? 839
Appendix A2 Continued
begin
sample 6 observations; for all 31 rules do begin
check conditional part; if condition satisfied then bid:= fitness + E, where E - N(0, 0.025);
end; determine highest bidding rule; pick item implied by that rule; with probability 0.025 pick instead item not intended; draw actual value of item chosen from uniform distr. with support
[expected-value-0.25, expected-value+0.25];
with winning rule do fitness:=0.975*fitness + 0.025 * value-item;
end;
end;
end.
References
Arthur, W. B. 1989. Competing technologies, increasing returns and lock-in by historical events. Economic Journal 99: 116-31.
Arthur, W. B., and D. A. Lane. 1991. Information constriction and information contagion. Working Paper 91-05-026, Santa Fe Institute.
Banerjee, A. V. 1992. A simple model of herd behavior. Quarterly Journal of Economics 107:797-817. Bikhchandani, S., D. Hirshleifer, and I. Welch. 1992. A theory of fads, fashion, custom, and cultural change as infor-
mational cascades. Journal of Political Economy 100:992-1026. Bush, R. R., and F Mosteller. 1955. Stochastic models for learning. New York: Wiley. Caldwell, B. 2000. The emergence of Hayek's ideas on cultural evolution. Review of Austrian Economics 13:5-22. Cross, J. G. 1983. A theory of adaptive economic behavior. Cambridge, UK: Cambridge University Press. Dosi, G., Y. Ermoliev, and Y. Kaniovski. 1994. Generalized urn schemes and technological dynamics. Journal of Math-
ematical Economics 23:1-19. Ellison, G., and D. Fudenberg. 1993. Rules of thumb for social learning. Journal of Political Economy 101:612-43. Gode, D. K., and S. Sunder. 1993. Allocative efficiency of markets with Zero-Intelligence traders: Markets as a partial
substitute for individual rationality. Journal of Political Economy 101:119-37. Hayek, F A. 1948a. Individualism: True and false (reprint). In Individualism and economic order, edited by F A. Hayek.
Chicago: University of Chicago Press, pp. 1-32. Hayek, F A. 1948b. Economics and knowledge (reprint). In Individualism and economic order, edited by F A. Hayek.
Chicago: University of Chicago Press, pp. 33-56. Hayek, F A. 1948c. The facts of the social sciences (reprint). In Individualism and economic order. Chicago: University
of Chicago Press, pp. 55-76. Hayek, F A. 1948d. The use of knowledge in society (reprint). In F A. Hayek (Ed.), Individualism and economic order,
edited by F A. Hayek. Chicago: University of Chicago Press, pp. 77-91. Hayek, F A. 1948e. The meaning of competition (reprint). In Individualism and economic order, edited by F A. Hayek.
Chicago: University of Chicago Press, pp. 92-106. Hayek, F A. 1948f. Socialist calculation I: The nature and history of the problem (reprint). In Individualism and economic
order, edited by F A. Hayek. Chicago: University of Chicago Press, pp. 119-47. Hayek, F A. 1952. The sensory order. Chicago: University of Chicago Press. Hayek, F A. 1960. The constitution of liberty. Chicago: University of Chicago Press. Hayek, F A. 1967a. Degrees of explanation (reprint). In Studies in philosophy, politics and economics, edited by F A.
Hayek. Chicago: University of Chicago Press, pp. 3-21.
840 Nicolaas J. Vriend
Hayek, F A. 1967b. The theory of complex phenomena (reprint). In Studies in philosophy, politics and economics, edited by F A. Hayek. Chicago: University of Chicago Press, pp. 22-42.
Hayek, F A. 1967c. Notes on the evolution of systems of rules of conduct (reprint). In Studies in philosophy, politics and economics, edited by F A. Hayek. Chicago: University of Chicago Press, pp. 66-81.
Hayek, F A. 1973. Law, legislation, and liberty. Vol. 1, Rules and order. Chicago: University of Chicago Press. Hayek, F A. 1978. New studies in philosophy, politics, economics, and the history of ideas. Chicago: University of
Chicago Press. Hayek, F A. 1979. Law, legislation, and liberty. Vol. 3, The political order of a free people. Chicago: University of
Chicago Press. Hayek, F A. 1982. The sensory order after 25 years. In Cognition and the symbolic processes, volume 2, edited by W.
B. Weimer and D. S. Palermo. Hillsdale, NJ: Lawrence Erlbaum, pp. 287-93. Holland, J. H. 1975. Adaptation in natural and artificial systems. Ann Arbor: University of Michigan Press. Holland, J. H., K. J. Holyoak, R. E. Nisbett, and P. R. Thagard. 1986. Induction: Processes of inference, learning, and
discovery. Cambridge, MA: MIT Press. Hull, C. L. 1943. Principles of behavior. New York: Appleton-Century-Crofts. Huynen, M. 1995. Private conversation. Katz, M., and C. Shapiro. 1985. Network externalities, competition and compatibility. American Economic Review 75:
424-40. Katz, M., and C. Shapiro. 1986. Technology adoption in the presence of network externalities. Journal of Political
Economy 94:822-41. Kirman, A. P., and N. J. Vriend. 1995. Evolving market structure: A model of price dispersion and loyalty (mimeo).
Paper presented at the Workshop Economic ALife, Santa Fe Institute. Kirman, A. P, and N. J. Vriend. 2000. Learning to be loyal. A study of the Marseille fish market. In Interaction and
market structure. Essays on heterogeneity in economics. (Lecture notes in economics and mathematical systems 484), edited by D. Delli Gatti, M. Gallegati, and A. P Kirman. Berlin: Springer, pp. 33-56.
Lane, D., and R. Vescovini. 1996. Decision rules and market share: Aggregation in an information contagion model. Industrial and Corporate Change 5:127-46.
Minsky, M. L. 1967. Computation: Finite and infinite machines. Englewood Cliffs, NJ: Prentice-Hall. Narduzzo, A., and M. Warglien. 1996. Learning from the experience of others: An experiment on information contagion.
Industrial and Corporate Change 5:113-26. Parker, D., and R. Stacey. 1994. Chaos, management and economics. London: Institute for Economic Affairs. Roth, A. E., and I. Erev. 1995. Learning in extensive-form games: Experimental data and simple dynamic models in the
intermediate term. Games and Economic Behavior 8:164-212. Savage, L. J. 1954. The foundations of statistics. New York: Wiley. Simon, H. A. 1955. A behavioral model of rational choice. Quarterly Journal of Economics 69:99-118. Simon, H. A. 1957. Administrative behavior. New York: Free Press. Simon, H. A. 1959. Theories of decision-making in economics and behavioral science. American Economic Review 49:
253-83. Simon, H. A. 1976. From substantive to procedural rationality. In Method and appraisal in economics, edited by S. J.
Latsis. Cambridge: Cambridge University Press, pp. 129-48. Sutton, R. S., and A. G. Barto. 1998. Reinforcement learning: An introduction. Cambridge, MA: MIT Press. Tesfatsion, L. 1998. Agent-based computational economics (http://www.iastate.edu/tesfatsi/ace.htm). Vriend, N. J. 1999. Was Hayek an ace? (Working Paper No. 403) Queen Mary and Westfield College, University of
London. Weimer, W. B. 1982. Problems of complex phenomena: An introduction to the theoretical psychology of the sensory
order. In Cognition and the symbolic processes, volume 2, edited by W. B. Weimer and D. S. Palermo. Hillsdale, NJ: Lawrence Erlbaum, pp. 241-85.