was nafta necessary? trade policy and relative economic ... files/06-043.pdf · 4 bulmer-thomas...
TRANSCRIPT

06-043
Copyright © 2006 Noel Maurer.
Working papers are in draft form. This working paper is distributed for purposes of comment and discussion only. It may not be reproduced without permission of the copyright holder. Copies of working papers are available from the author.
Was NAFTA Necessary? Trade Policy and Relative Economic Failure since 1982
Noel Maurer Harvard Business School


HBS WORKING PAPER 06-043
June 13, 2006
________________________________________________________________________________________________________________
N oe l Ma ur er
Was NAFTA Necessary? Trade Policy and Relative Economic Failure since 1982
Abstract Mexico signed NAFTA in 1994. NAFTA’s primary importance was not in providing market access to the United States. Rather, its primary importance was in providing investor protections to foreign direct investment. NAFTA succeeded in its instrumental goal of increasing foreign direct investment. Increased FDI, however, was limited mostly to manufacturing and has had relatively little impact on the bulk of the economy. Without reforms in the finance and energy sectors, and greater security of property rights for domestic investors, Mexico will be doomed to continuing subpar economic per-formance.
In 1986, Mexico joined the General Agreement on Tariffs and Trade (GATT), breaking with 165 years of protectionism. Eight years later, Mexico took an even more radical step, signing the North American Free Trade Agreement (NAFTA) with the U.S. and Canada. Why did Mexico make such a radical break with its past? What effects did NAFTA have on the Mexican economy?
The 1982 crisis and its aftermath lie behind Mexico’s decision that an agreement with the United States and Canada was the best way to promote growth. Mexico signed NAFTA not to encourage trade, paradoxically, but to encourage investment. NAFTA, unlike earlier trade pacts, contains explicit investor protections and allows the U.S. to use market access to coerce Mexico into respecting property rights. Mexico, in essence, tried to use an international agreement to substitute for poor domestic investor protections.
Did Mexico’s strategy work? There have been some positive outcomes. Since NAFTA was ratified in 1994, the Mexican economy has grown, Mexican wages have risen, and inequality appears to have declined slightly. On the other hand, produc-tivity gains have not spread outside the manufacturing sector, real wages are still well below the level of 1982, and Mexico’s relative position vis-à-vis Europe and the United States has yet to regain its 1994 level, let alone its 1982 peak. NAFTA did succeed in dramatically increasing the level of foreign investment. These gains, however, were mostly exhausted by 2001.

Was NAFTA Necessary?
2
NAFTA failed to produce dramatic growth in Mexico because, quite simply, it had little effect on most of the domestic economy. Foreign direct investment (FDI), for all its merits, is not a substitute for domestic investment. FDI tends to cluster in the production of tradable goods (e.g., automobiles, electronics), but tends not to oc-cur in the production of non-tradables (e.g., services, with the partial exceptions of banking and large-scale retailing). Most people in Mexico (as in the U.S.) produce non-tradables. Moreover, the production of traded goods requires inputs from the non-traded sector. Imagine, for example, an automobile manufacturer financed with FDI. Its output (automobiles) is tradable, and it consumes many tradable goods (tires, windshields, brake linings, cylinder heads). It also consumes a wide variety of non-tradables (building materials, machinery repairs and maintenance, electricity, accounting and legal services). The workers in this firm also consume a wide vari-ety of non-tradables (haircuts, restaurant meals, public transportation, electricity, housing), and they must price their labor in accordance with the prices they face from the non-tradable sector. Thus, much of the costs of the firm are determined by the productivity of the non-tradables sector. If productivity growth in the non-trad-ables sector is slow, then firms in the tradables sector will face higher prices than they would otherwise. These higher prices will, in turn, influence the prices that firms in the tradables sector must charge for their output. In short, the long-run per-formance of the economy hinges upon the performance of a myriad of economic sec-tors which do not attract much (if any) FDI.
Precursors to the Crash of 1982
Mexico’s government increasingly discouraged both foreign trade and foreign in-vestment throughout the twentieth century. These policies produced disappointing results long. (See Table 1.) Between 1950 and 1980, many Southern European coun-tries that were poorer than Mexico in 1950 overtook it and became substantially rich-er. Italy and Mexico had comparable levels of labor productivity in 1950; by 1980 Italy was closer to the United States than to Mexico. In the 1950s, Spain’s productiv-ity hovered around 90 percent of the Mexican level. Franco began economic reforms in 1960; within five years, Spain had overtaken Mexico. Even poor Greece managed to overtake Mexico by 1970. Only Portugal, which stubbornly pursued autarky un-til the Revolution of 1974, failed to overtake Mexico before 1980.
FIGURE 1 AROUND HERE
In short, the much-vaunted “Mexican Miracle” was far short of miraculous. In fact, productivity in Mexican manufacturing stagnated from the 1950s onwards. Mexico’s growth during the miracle years came from the movement of capital and labor from the countryside into urban manufacturing. 1 Productivity in the leading 1 Reynolds (1970): 52.

Was NAFTA Necessary?
3
sector—and, eventually, the country as a whole—fell further behind Europe and the United States.
Slow growth, however, is a far cry from the collapse that occurred in 1982. What caused the crisis? The answer is twofold. First, Mexico’s foreign indebtedness rose vertiginously during the 1970s. Second, two external shocks in 1981 and 1982 struck the fragile and highly indebted Mexican economy.
Why did foreign debt rise so dramatically during the 1970s? The oil price boom after 1973 transferred resources from the OECD oil-consuming nations to the OPEC producers of the Persian Gulf. The oil producers wanted to earn returns on their new-found wealth. The Arab oil states, therefore, deposited their oil receipts in the European affiliates of American-owned banks. The banks, however, in turn needed to find a profitable outlet for these funds.2 Mexico appeared to be a particularly good recipient for foreign loans, since the country had recently discovered large oil deposits, but needed capital in order to take advantage of them.
In 1972 explorers found in the states of Tabasco and Campeche found huge reser-voirs of petroleum extending for 200 kilometers northeast below the Bahía de Cam-peche. In 1974 Mexico announced additional petroleum discoveries in the states of Baja California, Chiapas, Tabasco, and Veracruz. For the first time, Mexico’s oil production surpassed its 1921 peak of 190 million barrels. Foreign bankers, there-fore, assumed that Mexico would easily be able to repay from the future stream of oil revenues that the loans would finance.3
FIGURE 2 AROUND HERE
The formation of syndicates and the introduction of flexible interest rates further reduced the risks U.S. banks faced when lending to Mexico (and other Latin Ameri-can countries). Bank syndicates spread risk among several financial institutions. Flexible interest rates on dollar-denominated loans, meanwhile, meant that the banks would be protected from both exchange-rate risk and increases in the U.S. in-flation rate.4
Low real interest rates during the 1970s made borrowing from U.S. banks particu-larly attractive for Mexico. Real interest rates on loans to Latin American countries averaged only 0.3 percent in 1974-78, and actually turned negative in 1979.5 In short, American banks had a large supply of loanable funds, and Mexico possessed a high-demand for dollar-denominated loans.
2 Thorp (1998): 207. 3 Meyer and Morales (1990): 174. Also see www.folium.ro/world-encyclopedia/mexico/78.htm. 4 Bulmer-Thomas (1994): 361. 5 World Financial Markets, Morgan Guaranty, various issues.
Was NAFTA Necessary?
4
As a result, Mexico borrowed massively and used the proceeds to finance the ex-pansion of the oil industry. Between 1974 and 1981, 45 percent of all foreign borrow-ing went to Pemex, the national oil company. Pemex used the money to construct offshore drilling platforms, build onshore processing facilities, enlarge refineries, explore for more oil, prove fresh reserves, and purchase capital goods and technical expertise from abroad.6
FIGURE 3 AROUND HERE
The “Perfect Storm”
Mexico’s spiraling indebtedness only set the stage for Mexico’s perfect storm of 1982. It took three external factors to provoke the crisis. The first factor was a ten percent drop in oil prices in 1981. While minor on the scale of the run-up in oil prices from 1973 to 1981, the decline caused investors to begin to doubt projections of ever-rising Mexican oil revenues.
The second factor was that Mexico stopped discovering new oil. In 1982, in fact, Mexico’s proven oil reserves did not expand at all. (See Figure 2.) If oil prices fell further and the volume of output began to stagnate, where would Mexico get the dollars to pay back its loans?
The third factor was the increase in U.S. interest rates begun by Federal Reserve Chairman Paul Volcker. Since Mexico’s dollar-denominated bank loans were made at flexible interest rates, Volcker’s anti-inflationary moves substantially increased the burden of Mexico’s debts.
In order to meet rising interest payments on the country’s long-term debt, the Mexico’s government began to resort to short-term borrowing. In 1981, short-term debt rose from $1.5 billion to $10.8 billion. 7 Unfortunately, Mexico had no central control over borrowing nor any way to gather the relevant information about the extent of its growing debt. Its state-owned companies and government agencies borrowed with few restrictions and little coordination. The country was regularly 12 to 18 months late in making its reports to the IMF.8
No one in the Mexican government seemed to realize exactly how much was be-ing borrowed, or on what terms. On August 21st, 1981, the Ministry of Planning and Budget estimated that the 1981 deficit would be 490 billion pesos. Three days later, the cabinet’s technical secretary, Carlos Salinas, revised the figure to 530 billion pe-sos. The Finance Minister, Davíd Ibarra, contradicted Salinas, and declared that the
6 Meyer and Morales (1990): Chapter 7. 7 Cárdenas (1996): 113-14. 8 Thorp (1998): 207.
Was NAFTA Necessary?
5
deficit would come to 640 billion pesos. The cabinet rejected Ibarra’s estimate, in the belief that Ibarra wanted to make the country look as though it were facing an eco-nomic crisis in order to make himself the obvious man to succeed López Portillo as President in 1982. In fact, Ibarra turned out to have been too optimistic. President José López Portillo wrote in his diary: “We will end 1981 with a deficit of 715 billion pesos. I couldn’t believe it. Smiling, Ibarra answered, ‘What about it? I told you so.’” In late October the Ministry of Planning and Budget presented a new deficit estimate of 761 billion pesos, and the year ended with a total deficit of 866 billion pe-sos, 77 percent higher than the estimate made less than four months previously.9
American bankers also failed to monitor Mexico’s borrowing. Syndication meant that the risk from foreign loans was spread over various banks, reducing the incen-tive for any particular bank lender to make the effort to monitor precisely how the Mexican government and its agencies were using their credit.10 American banks, therefore, continued to lend to Mexico throughout 1981 and the first half of 1982.
Mexico made heroic efforts to avoid default, but these efforts ultimately proved counterproductive. The first line of defense was the peso devaluation of February 18th, 1982, which cut the exchange rate from 26.9 pesos per dollar to 47 pesos per dollar. Unfortunately, the devaluation meant that Mexico’s dollar GDP dropped 42 percent on the day of the devaluation. The dollar value of its debts remained un-changed, whereas Mexico’s exports did not react, and the debt burden increased.
Mexico then sought additional credit from U.S. banks, which extended $2.5 bil-lion between February and July 1982. On August 5th, the country imposed multiple exchange rates in order to conserve foreign exchange. Importers of “unnecessary” goods had to use an exchange rate twice as high as that used for debt repayments. The hope was that Mexicans would import less, and instead choose to make their dollars available to the central bank. Unfortunately, the policy failed to stem the outflow of dollars.
The government then decided to confiscate all dollar deposits in the country. The confiscated deposits would then be converted to pesos at an exchange rate about a third lower than the prevailing rate, while capital controls would prevent people from spiriting their savings out of the country. The controls did not work very well. Mexico’s borders were simply too permeable.
On August 20th, 1982, Mexico announced that it was unable to repay the roughly $10 billion in short-term debt that was due to expire in the next few days.11 In a last ditch effort to prevent the private sector from using the financial system to spirit 9 Castañeda (2000): 51-52. 10 Pill (1997). 11 Cárdenas (1996): 114-15.
Was NAFTA Necessary?
6
dollars out of the country, President López Portillo followed the suspension of debt payments with the expropriation of the entire banking system on September 1st.
The combined effect of the bank expropriation and the debt default was to send the economy into a tailspin. Real GDP began to fall in September. Unemployment doubled from 4 percent at the beginning of 1982 to 8 percent by the end of the year.12 Gross new investment dropped 27.8 percent in real terms.13 The decline continued in 1983. Real GDP fell another 3.2 percent. Productivity dropped 5.9 percent and gross new investment decreased a further 30.6 percent.14
Economic Crisis and Trade Opening
Most countries faced with a massive balance of payments crisis try to reduce im-ports as much as possible, in order to conserve foreign exchange. Brazil’s reaction to the economic troubles of the 1980s provides an example. In 1980, Brazil created a so-called “negative list” of items whose import was banned. In 1982, the Brazilian gov-ernment expanded the negative list and established a formal import control pro-gram, in which all imports had to be approved by the Department of Foreign Trade. These restrictions gave Brazil a trade surplus of 6.1 percent of GDP by 1984.15 Brazil finally began to liberalize trade in 1990, long after the crisis had passed. Other Latin American victims of the debt crisis, like Argentina and Perú, restricted trade in the wake of the crisis and retained the restrictions until 1989 and 1990 respectively. Even free-trading Chile raised trade barriers, hiking its uniform tariff from 10 per-cent to 20 percent in 1983, and then to 35 percent in 1984, only gradually reducing it thereafter.16
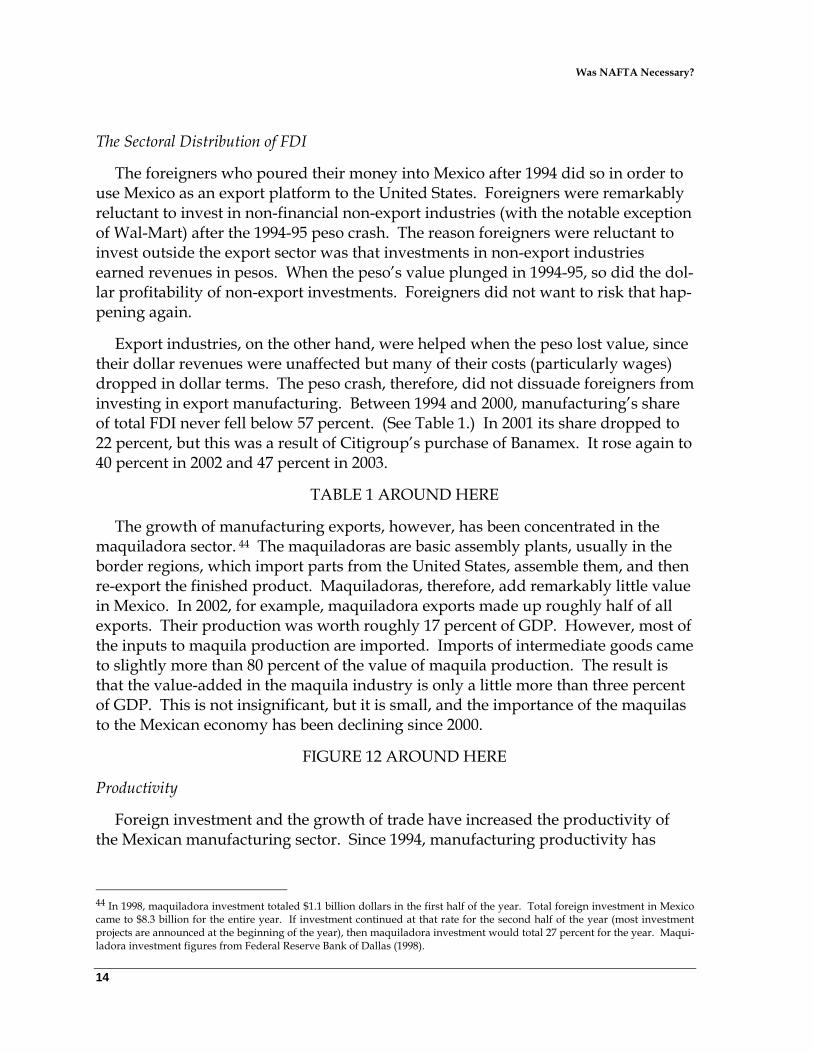
Mexico, however, began to liberalize its trade policies immediately after the debt crisis. In 1983, the new president, Miguel de la Madrid, lowered the coverage of im-port quotas from 100 percent of all manufactured products to 83.6 percent. He also reduced the import-weighted average tariff from 23.0 percent to 21.8 percent.17 In 1985, De la Madrid announced that Mexico would join the General Agreement on Tariffs and Trade. By the end of the year, less than half of manufactured products were still subject to import permits. By 1990, import permits covered only 11 per-cent of manufactured goods. Only tobacco products still enjoyed significant protec-tion from import permits.18
12 Cárdenas (1996): 116. 13 Heston et. al. (2002). 14 Heston et. al. (2002). 15 Federal Research Division. (1997): 2. 16 Bergoeing, et al (2002): 10. 17 Cárdenas (1996): 137. 18 Tornell (1995): 5. Some small categories of motor vehicles and processed food products were also subject to import permits in 1990, but this was a relatively small percentage of production in both categories.

Was NAFTA Necessary?
7
FIGURE 4 AROUND HERE
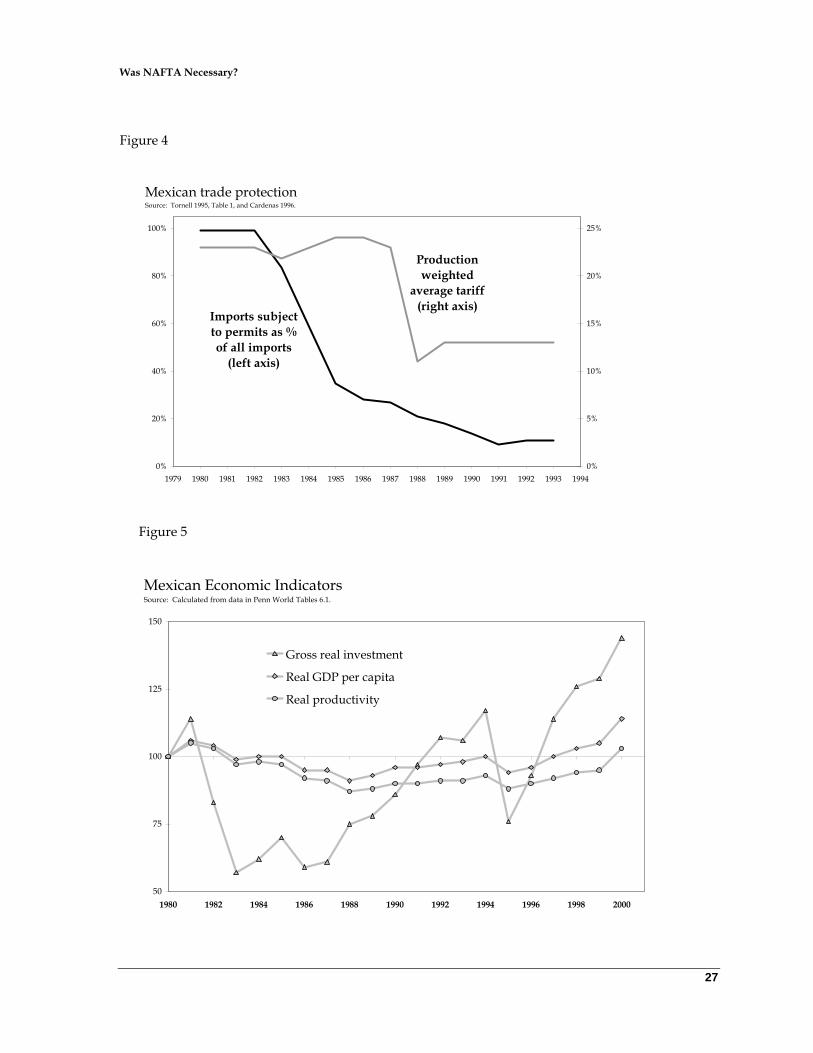
Why did Mexico liberalize so rapidly? The answer is that the government was desperately trying to regain the confidence of the private sector after the shock of the bank expropriation. A 1985 survey of 200 Mexican businesses linked the dramatic fall in investment (see Figure 5) with the bank nationalization: 96 percent of those surveyed called the decision to nationalize the banks “extremely important” in terms of reducing their confidence in the government and all the remaining respon-dents called the decision “very important.” 74 percent of the businesses surveyed said that confidence in the government was “important,” “very important” or “ex-tremely important” for their investment decisions.19 José María Basagoiti, the head of Coparmex (the national employer’s federation), summarized the attitude of pri-vate businesses when he stated that after the bank nationalization, “anything could happen in Mexico.”20
FIGURE 5 AROUND HERE
Before the 1982 crisis, Mexico’s political system had been based on an “alliance for profits” between the government and the private sector. The government might attack the property rights of foreign investors through its policy of “Mexicaniza-tion,” but the country’s domestic business class was the primary beneficiary of those attacks. The bank nationalization of 1982, however, attacked the property rights of the domestic business class itself.
Mexico’s business class reacted to the bank expropriation in two ways. The first was to send as much as of their wealth as possible to the United States. The second was to switch their political support from the ruling PRI to the conservative opposi-tion, represented by the Partido de Acción Nacional, or PAN.21 The former head of Concanaco, the National Chamber of Commerce, explicitly said that businesspeople should stop supporting state interventionism, which had previously benefited them, because they could no longer constrain the state.22 This was new: businessmen had not openly opposed Mexico’s “official” party since the 1940s.23
The PRI could not rely on labor to compensate for the loss of the political support of the country’s business class. In order to repair its finances and close the budget deficit, Mexico’s government (like many others in Latin America) began a large-scale privatization program. The privatizations threw workers out of their jobs and re-duced the wages of those who remained.
19 Maxfield (1989): 227-29. 20 Hernández Rodríguez (1987): 260. 21 Maxfield (1989): 232. 22 Hernández Rodríguez (1987): 258. 23 Hernández Rodríguez (1987): 259.

Was NAFTA Necessary?
8
FIGURE 6 AROUND HERE
The decision to sign GATT, therefore, was a gamble. The government hoped that trade opening would kick-start economic growth. 24 Unfortunately, GATT had little effect on the economy’s performance. As Figure 5 shows, neither investment nor economic growth accelerated after the trade opening. In 1985, the government could blame its poor performance on the Mexico City earthquake. In 1986, it could blame the continuing stagnation on the collapse in international oil prices. By the late 1980s, however, it became clear that GATT had changed little in terms of investment or economic growth.
In fact, joining GATT changed little even in terms of Mexico’s trade. Trade (meas-ured as imports plus exports over GDP) only rose from 30 percent to 34 percent be-tween 1982 (the year the crisis began) and 1993 (the last year before NAFTA). Mex-ico’s trade performance looked even worse compared to the NICs of East Asia. South Korea’s trade coefficient in 1993, for example, was 55 percent. The Philippines clocked in at 71 percent, Thailand at 79 percent, Taiwan at 86 percent, and Malaysia at an astounding 164 percent.25 The presence of hundreds or thousands of miles of ocean between them and their principal markets failed to prevent the Asian coun-tries from trading far more than Mexico, which was separated from its principal market by nothing more than a line in the sand.
GATT did alter the distribution of manufacturing production. Industries like cigarettes, textiles, shoes, and electrical machinery declined, while motor vehicles, engines and auto parts, glass, cement, and chemicals boomed.26 Additionally, the imposition of GATT rules increased competition, by prohibiting certain sorts of gov-ernment subsidies. For example, before GATT a company called Hylsa (a subsidiary of Grupo Alfa) was the only private integrated steel producer in Mexico. It com-peted only with the state-owned steel complex. By 1994, however, there were five producers competing for the Mexican market: Hylsa, GAN, IMSA, Villacero, and ISPAT, the first four domestically-owned and the last owned by Indian investors.27
Surprisingly, however, neither the increase in competition nor the redistribution of economic activity (which presumably involved the death of relatively unproduc-tive firms and their replacement by more productive ones) had much effect on the overall level of Mexican productivity. Output per worker fell 6.1 percent between GATT’s signing in 1985 and the last per-NAFTA year of 1993. Even if one takes 1987
24 Cárdenas (1996): 136. 25 Heston et. al. (2002). 26 Tornell (1995): Figure 8. 27 Tornell (1995): 20. Mexico’s post-GATT tariff of 10.1 percent on steel was much lower than before, when steel imports were effectively prohibited, but still put foreign producers (primarily Brazilian, Korean, and Japanese) at a significant cost disadvan-tage.

Was NAFTA Necessary?
9
as a base year, in order to compensate for the effects of the 1986 oil-price collapse, Mexico’s labor productivity fell 0.9 percent.28 Manufacturing productivity did slightly better than the overall economy, but not by much, growing a desultory 0.4 percent between 1987 and 1993.29 FDI also stagnated between 1987 and 1993. (See Figure 7.) With investors skittish from the bank nationalization, gross real invest-ment remained depressed.
Simply put, a decade of slashing tariffs, privatizing industries, and reducing infla-tion had not generated by 1993 the kind of investment that would be needed in or-der to increase Mexico’s productivity and, ultimately, its living standards.
FIGURE 7 AROUND HERE
How did President Carlos Salinas (who took over from De la Madrid in 1988) manage the situation? His first step was to renegotiate the foreign debt. Unless pay-ments could be reduced, investors would be reluctant to put more money into Mex-ico, since the government would still have incentives to default on its debts or con-fiscate private investments in order to pay for them.
On February 4th, 1990, President Salinas signed an agreement that slashed the Mexican government’s debt payments. The agreement converted Mexico’s bank debt into “Brady bonds,” named after the U.S. Treasury Secretary, Nicholas Brady. The U.S. government guaranteed the interest on the bonds, based on US$5.4 billion in collateral financed by new borrowing from the World Bank, IMF, and Ex-Im Bank of Japan. Mexico’s total debt rose, but its annual debt payments declined to a more manageable level.30 Unfortunately, the Brady plan brought neither a tidal wave of new foreign investment nor sparked a rebirth of domestic confidence. Investment rose in 1989, but as a percentage of Mexico’s GDP it remained roughly 30 percent below its 1981 level.
President Salinas’s second step was to liberalize restrictions on foreign invest-ment. In 1989, he authorized the Foreign Investment Commission (CNIE) to waive any restrictions on foreign investment that it considered against the “public inter-est.” The 1989 reforms also allowed the CNIE to allow foreigners to own up to 100 percent of manufacturing businesses located outside the major cities and purchase equities issued by Mexican firms, albeit without voting rights.31 In 1991, President
28 Heston et. al. (2002). 29 Manufacturing productivity indexed calculated by the author from data on output and hours-worked from INEGI. The figures cited in the text mask a sharp decline in productivity in 1987 and 1988, followed by a slow recovery. 30 Orme (1996): 30-31. 31 Clarkson (2002): 237.

Was NAFTA Necessary?
10
Salinas removed the remaining limitations on foreign investment, except in the en-ergy and banking sectors.32
The third step in Salinas’s program to attract more foreign investment was the continuation of privatization. In 1991, the Mexican government sold off the banks for more than three times their book value, twice the typical valuation of an Ameri-can bank.33 It also sold off the steel plants, airlines, and the telephone monopoly.34 These sales generated more than US$25 billion in revenues and moved the budget into surplus by 1992.35
Unfortunately, President Salinas’s program failed to attract the hoped-for wave of foreign investment. Mexico was still tarred by record of erratic policy shifts, “Mexi-canization” laws, and the bank expropriation. Salinas’s reforms to date had failed to convince foreign investors—or domestic ones, whom the Mexican government be-lieved held more than $20 billion in offshore investments—that Mexico was a safe place for their money.36 Yet without new investment, Mexico would have trouble regaining its 1981 per capita income, let alone catch up with Europe or the United States.
Therefore, Carlos Salinas proposed the North American Free Trade Agreement. Salinas hoped that institutionalizing his reforms by means of an international agree-ment with the United States would make them more credible. NAFTA was an in-ternational treaty, and as such it would not be easily revoked by future Mexican administrations.
NAFTA, from the Mexican point of view, was not about market access. With the exception of steel, textiles, and a few agricultural products of which Mexico was not a major exporter, average U.S. tariffs on the goods Mexico produced were only 3.5 percent. In addition, NAFTA did relative little to open American markets. First, NAFTA phased in liberalization. In its first year, the percentage of Mexican exports that would enter duty-free only increased from 45 percent to 68 percent. That num-ber was slated to increase to 77 percent by 1999, and 99 percent by 2004, but agricul-tural tariffs would not be fully liberalized until 2009.37
Second, and much more importantly, NAFTA did not touch anti-dumping rules. American anti-dumping laws were, in fact, the biggest obstacle faced by Mexican firms when they tried to export to the U.S. The Mexican company IMSA, for exam-
32 Pill (1997a): 2. 33 Orme (1996): 33. 34 Pastor and Wise (2002): 183. 35 Pill (1997a): 12-13. 36 Orme (1996): 32. 37 Orme (1996): 37.
Was NAFTA Necessary?
11
ple, was accused of dumping in a project to export batteries to the U.S. before ex-ports had even started. American competitors also accused Mexico’s largest glass company, Vitro, of dumping when it attempted to export porcelain-enameled steel, and threatened further suits regarding its exports of flat glass. In 1989, the United States charged cement-manufacturer Cemex with a 58-percent “compensatory tax” on its exports of cement under the anti-dumping laws. As a result, Cemex’s exports were down 30 percent.38
Economists realized that NAFTA would have very little direct economic impact: studies that attempted to measure the impact of lowering U.S. tariffs from 4 percent to zero and Mexican tariffs from 20 percent to zero all came up with very small one-time gains, no more than 3 percent of Mexico’s GDP, or about one year of economic growth.39
Why then did President Salinas push so hard for an agreement? Mexico wanted NAFTA in order to guarantee foreign investors that their property rights would be protected. Mexico agreed to remove all limits on the ability of NAFTA companies to repatriate their profits and to treat American and Canadian companies exactly like domestic ones. Mexico could no longer require U.S.-owned plants, for example, to export a greater value of goods than they imported.40 In fact, not only did Chapter 11 of NAFTA require governments to give foreign investors “fair and equitable treatment,” Article 1110(1) specifically stated:
No Party may directly or indirectly nationalize or expropriate an investment of an in-vestor of another Party … or take a measure tantamount to nationalization or expro-priation … except: (a) for a public purpose; (b) on a nondiscriminatory basis; (c) in accordance with due process of law … and (d) in payment of compensation.
Article 1139 extended the protection of Article 1110(1) to all “property, tangible or intangible, acquired in the expectation or used for the purpose of economic benefit or other business purpose.” In fact, Article 1139 was so broad that many lawyers argued that it includes goodwill and corporate reputation.41
NAFTA created institutions with the means to punish the Mexican government should it violate the agreement. Investors may demand compensation and have their cases judged by an international NAFTA tribunal. Actions by state and local governments are specifically included, although the federal government is responsi-ble for paying compensation. In fact, private parties can appeal national court deci-sions before a NAFTA tribunal should national courts make rulings which are, in the
38 De los Angeles (1993): 35-36. 39 Tornell (1995): 26. 40 Orme (1996): 130. 41 Condon and Sinha (2003): 129.

Was NAFTA Necessary?
12
words of Condon and Sinha, “incompatible with a rule of international law, consti-tute a denial of justice, or, in exceptional circumstances, be contrary to the law of the country in question.” The decisions of NAFTA tribunals cannot be summarily over-turned by governments without risking sanctions.
The decisions of NAFTA tribunals can be appealed to national courts, but only in the country where the case is brought. For example, in 1997, Mexico appealed an ad-verse tribunal ruling to the Supreme Court of British Columbia, with partial success, but the Mexican government could not appeal to Mexican courts. 42 Chapter 11, therefore, is a powerful deterrent against legislation or executive actions that may cause significant harm to cross-border investments.
By providing foreign investors with guarantees that their property rights would be respected, Carlos Salinas hoped that foreign capital would flow to Mexico. Mod-ern enterprises, financed by foreigners, would then raise Mexican productivity. They would raise productivity directly by creating more productive enterprises, and they would raise productivity indirectly by forcing Mexican companies to compete. Mexico’s economy would then, as a result, grow rapidly.
NAFTA and the Mexican Economy
How well has NAFTA met expectations? The results have been disappointing. Since 1994, the Mexican economy has grown, wages have risen, and inequality ap-pears to have declined slightly. On the other hand, productivity gains have not spread outside manufacturing, real wages are still below the level of 1982, and Mex-ico remains poorer relative to Europe and the United States than it was in 1982.
Foreign Direct Investment
NAFTA was successful in its immediate goal of increasing FDI. In the nine years before NAFTA (1984-93), FDI averaged $3.1 billion per year. In the nine years after NAFTA (1994-2003), FDI averaged $12.0 billion per year. As a percentage of all in-vestment (including inventories), FDI made up 4.0 percent of investment in 1986-93 and 7.1 percent of investment in 1994-2000. (See Figure 8.) In fact, FDI leaped in the very quarter that NAFTA was ratified by the United States Congress. As one would expect, the bulk of the increase in FDI came from U.S. investors. (See Figure 7.)
FIGURE 8 AROUND HERE
Unfortunately, Mexico’s ability to attract foreign investment after NAFTA when the benchmark is other countries rather than Mexico’s own pre-1994 performance. Figure 9 shows FDI flows for Mexico, Canada, Brazil, and China. Canada and China
42 Condon and Sinha (2003): 127-28.

Was NAFTA Necessary?
13
have overtaken Mexico as a desirable destination for foreign capital, especially when one takes into account the fact that half of Mexico’s 2001 figure was generated by a one-time event: Citigroup’s purchase of Mexico’s largest bank, Banamex.
FIGURE 9 AROUND HERE
In fact, taken as a percentage of all fixed capital formation, FDI is currently less important in Mexico than it is in the United States and Canada. In 1997, FDI pro-vided about 10 percent of Canada’s fixed capital formation and around 8 percent of the United States’, whereas it made up 18 percent of Mexico’s. By 2000, however, FDI had expanded to make up 18 percent of U.S. fixed capital formation and a stun-ning 47 percent of Canada’s capital formation, while it had declined to 12 percent in Mexico. This decline is consistent with the recent decline in FDI as a percentage of all investment reported in Figure 8.43
FIGURE 10 AROUND HERE
Figures on the stock of FDI as a percentage of GDP tell a similar story: Mexico has not done well when compared to its NAFTA partners. (see Figure 11.) Another way to consider the same data is to note that between 1995 and 2000, the total cumu-lative amount of FDI in Mexico (accounting for depreciation) grew 17 percent com-pared to 36 percent in Canada and 70 percent in the United States.
FIGURE 11 AROUND HERE
In short, NAFTA succeeded in attracting FDI compared to Mexico’s own per-formance before 1994. What the agreement did not do was boost investment suffi-ciently to put Mexico firmly on the road to riches. In fact, what investment that Mexico did attract had remarkably little effect on the overall economy.
Why didn’t NAFTA make more of an impact on the Mexican economy? Foreign investment increased and trade boomed. One would have expected that the combi-nation of increased foreign investment and increased foreign competition should have produced rapid economic growth.
There are three reasons why NAFTA produced such disappointing results. First, the increased flows of FDI and the increased competition caused by free trade dis-proportionately went into the manufacturing sector. Their impact was minimal in the rest of the economy. Second, NAFTA did little to increase Mexico’s overall in-vestment rate. Third, major bottlenecks to future growth were not addressed by the trade pact, notably transportation, education, energy, and the financial system.
43 The differences between Table 5 and Table 7 derive from the restrictive definition of fixed capital formation, which includes only purchases of plant, equipment, and structures. FDI that does not finance the purchase of new plant, equipment, and structures is not included in the numerator of the UNCTAD estimates, and the denominator excludes all non-fixed investment.
Was NAFTA Necessary?
14
The Sectoral Distribution of FDI
The foreigners who poured their money into Mexico after 1994 did so in order to use Mexico as an export platform to the United States. Foreigners were remarkably reluctant to invest in non-financial non-export industries (with the notable exception of Wal-Mart) after the 1994-95 peso crash. The reason foreigners were reluctant to invest outside the export sector was that investments in non-export industries earned revenues in pesos. When the peso’s value plunged in 1994-95, so did the dol-lar profitability of non-export investments. Foreigners did not want to risk that hap-pening again.
Export industries, on the other hand, were helped when the peso lost value, since their dollar revenues were unaffected but many of their costs (particularly wages) dropped in dollar terms. The peso crash, therefore, did not dissuade foreigners from investing in export manufacturing. Between 1994 and 2000, manufacturing’s share of total FDI never fell below 57 percent. (See Table 1.) In 2001 its share dropped to 22 percent, but this was a result of Citigroup’s purchase of Banamex. It rose again to 40 percent in 2002 and 47 percent in 2003.
TABLE 1 AROUND HERE
The growth of manufacturing exports, however, has been concentrated in the maquiladora sector. 44 The maquiladoras are basic assembly plants, usually in the border regions, which import parts from the United States, assemble them, and then re-export the finished product. Maquiladoras, therefore, add remarkably little value in Mexico. In 2002, for example, maquiladora exports made up roughly half of all exports. Their production was worth roughly 17 percent of GDP. However, most of the inputs to maquila production are imported. Imports of intermediate goods came to slightly more than 80 percent of the value of maquila production. The result is that the value-added in the maquila industry is only a little more than three percent of GDP. This is not insignificant, but it is small, and the importance of the maquilas to the Mexican economy has been declining since 2000.
FIGURE 12 AROUND HERE
Productivity
Foreign investment and the growth of trade have increased the productivity of the Mexican manufacturing sector. Since 1994, manufacturing productivity has
44 In 1998, maquiladora investment totaled $1.1 billion dollars in the first half of the year. Total foreign investment in Mexico came to $8.3 billion for the entire year. If investment continued at that rate for the second half of the year (most investment projects are announced at the beginning of the year), then maquiladora investment would total 27 percent for the year. Maqui-ladora investment figures from Federal Reserve Bank of Dallas (1998).

Was NAFTA Necessary?
15
risen 41 percent. That is to say, a Mexican factory worker today produces almost half again as much as he or she did seven years ago.
Unfortunately, productivity across the entire Mexican economy is not growing at that rate. Productivity in services, which employ the lion’s share of the workforce, has actually dropped since 1994. Across the entire economy, productivity has grown at an annual rate of only 1.0 percent since 1994.45 Even, if one takes 1995 as a base year, to avoid the effects of the peso crash of December 1994 and the ensuing bank-ing collapse, countries as diverse as Chile, South Korea, Taiwan, Thailand, and Tur-key have enjoyed faster growth than Mexico. In fact, if one ignores the 2002-04 ac-celeration of American productivity growth, Mexico will not catch up with the United States until the middle of the 22nd century at current rates. This is an ex-tremely slow rate of convergence.
FIGURE 13 AROUND HERE
Mexico’s productivity performance has not been sufficient to bring Mexico back to the same level relative to Europe or the United States that it enjoyed in 1982. (See Figure 1.) In fact, Mexico’s growth rate is particularly disappointing considering that all of this growth has done nothing more than take Mexico back to the same ab-solute level of productivity that it had enjoyed in 1982, when the economy was ham-strung by import substitution. (See Figure 5.)
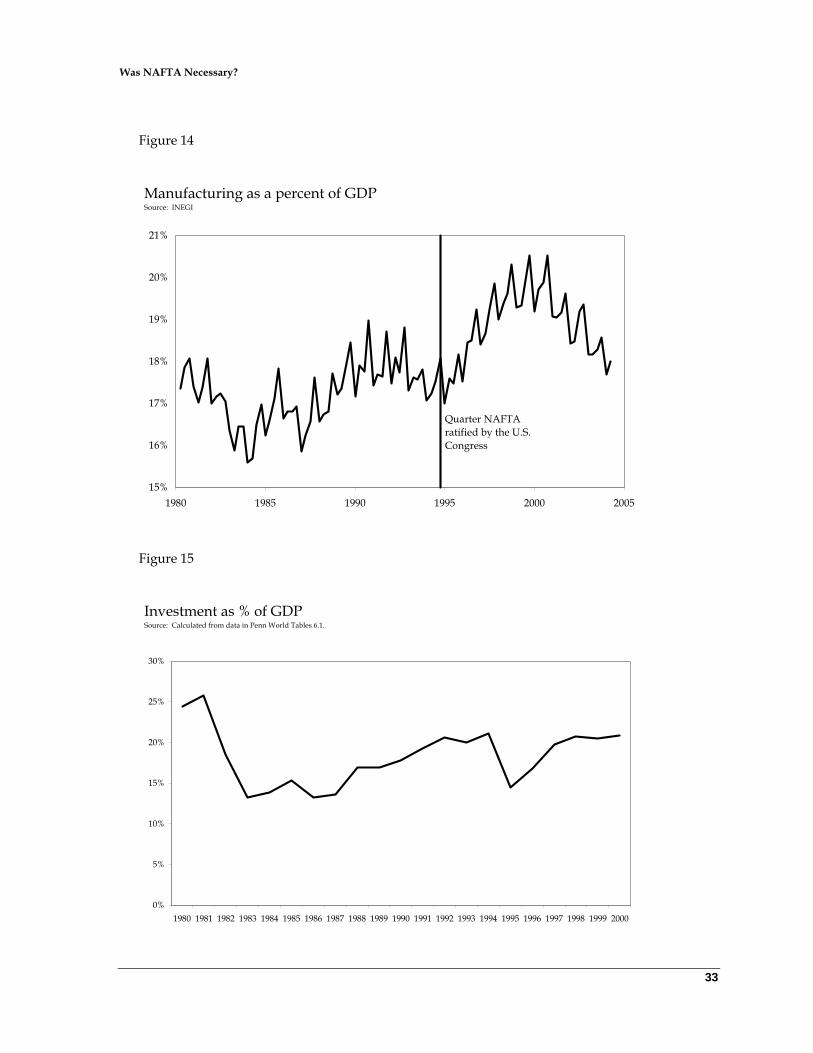
Why hasn’t productivity growth in manufacturing sector had a bigger impact on the rest of the economy? The essential problem is that manufacturing is only a fifth of the Mexican economy. Manufacturing rose from about 17 percent of GDP to around 20 percent by its peak in 2000, but its share has since fallen. Manufacturing’s share of the work force has similarly stagnated around 20 percent. Without enough investment to substantially raise manufacturing’s share of economic activity, rises in manufacturing productivity will have limited effects in the overall economy as long as productivity in services and agriculture remains flat.
FIGURE 14 AROUND HERE
Investment bottlenecks
FDI is not enough to change the Mexican economy. FDI may have quadrupled af-ter NAFTA, but it never exceeded nine percent of total investment. Total investment as a share of the Mexican economy remains lower than it had been in 1980. In order to increase domestic investment, the Mexican government needs to reform energy and petroleum, telecoms, education, infrastructure, and the tax system, but the country has made very little progress on any of these fronts.
45 Author’s calculation, using raw data on output and work hours from INEGI.

Was NAFTA Necessary?
16
FIGURE 15 AROUND HERE
Mexico still effectively prohibits private investment in the energy and petroleum sectors. In theory, NAFTA’s Chapter Six allows private companies to build power plants for industrial consumers and sell excess power to the Federal Electricity Com-mission (CFE), which has a monopoly over distribution.46 In reality, regulatory con-fusion (long-term sales contracts to CFE, for example, are prohibited) means that only 3.3 percent of Mexico’s electricity is privately generated. This is a serious prob-lem, since electricity constitutes a very substantial cost for many of Mexico’s indus-tries. (See Table 2.) Mexico’s demand for electricity is growing at about six percent per year, and would probably grow even faster if not for the fact that electricity prices for industrial producers (and individual consumers outside Mexico City) are very high. Rates have, in fact, risen 50 percent in the last five years.47 Electricity costs in northwest Mexico, for example, are now more than twice the level in Ari-zona, and as a result Mexico’s major copper refiner is considering moving its opera-tions to the U.S.48
The petroleum sector, meanwhile, remains almost entirely closed to private in-vestment. Private investors are forbidden from participating in either drilling or ba-sic refining. The end result is slow growth in what should be a booming industry. Even more perversely, Mexico is a net importer of gasoline. The government tried to attract private capital into “secondary petrochemicals,” but the 1999 auction of downstream petrochemical plants attracted no bidders.49
TABLE 2 AROUND HERE
Telecommunications and Internet-connection rates (for both land lines and wire-less) are high because the government makes it difficult to compete with Teléfonos de México (Telmex). Telmex owns almost all fixed-lines and controls two-thirds of the cellular market. The regulations governing how other companies could access Telmex’s network were not written until 1996. Telmex continued to limit access, so in 1997 federal regulators drew up new regulations designed to force Telmex to open the market. Telmex fought these in the courts, however, and the regulations did not go into effect until September 2000. Since then, Telmex has continued to fight the rules on interconnection rates, service quality, and information given to consumers. The result is that Mexico remains deficient in telecoms, and charges re-main high by international standards.50
46 Clarkson (2002): 239. 47 OECD (2002): 82 and Planea Grupo México llevar operación a EU,” Reforma, 6/24/04, p. A1. 48 “Planea Grupo México llevar operación a EU,” Reforma, 6/24/04, p. A1. 49 OECD (2002): 81-82. 50 OECD (2002): 81-82.

Was NAFTA Necessary?
17
Mexico also suffers from a shortfall of public investment. Public investment is in-adequate because the government collects an astonishingly low 18 percent of its GDP in taxes. (The U.S. collected about 28 percent of GDP in taxes in 2003, and spent about 33 percent.) Oil taxes account for almost half of that figure. The pri-mary reason is that out of a population of 100 million people, only 4 to 5 million pay any income tax at all. Meanwhile, among those who make enough money to pay taxes, loopholes and exemptions allow the wealthy to reduce their tax burden. For example, fringe benefits are completely untaxed, and both mortgage interest and medical expenses can be deducted. Mexico, therefore, relies heavily on a 15-percent value-added tax (VAT), but many Mexicans avoid this tax by shopping in Mexico’s large informal sector. VAT collections, therefore, amount to less than three percent of Mexico’s GDP.
As a result of the low tax take, Mexico spends too little on education. Mexico in-vests about six percent of its GDP in public education, roughly the same as Greece or Japan. Mexico, however, has a far younger population than those two countries. As a percent of GDP, therefore, Mexico spends only about half as much as much per student as Greece.51 In absolute terms (adjusted for purchasing power), the gap is even larger: Mexico’s per-student expenditures are only 30 percent of Greece’s, 18 percent of Japan’s, and 16 percent of the USA’s.52
As a result, the country’s educational levels, while improving, are still quite low. In 2000, only 70.5 percent of Mexican workers in the tradable sector (mostly manu-facturing) had more than six years of education. While an improvement on the 1987 figure of 55.9 percent, it is still very low by international standards. Mexico has been even slower to increase the number of workers with at least a high school education: the percentage of such workers in the tradable sector rose only from 11.4 percent in 1987 to 15.1 percent in 2000.53 When figures for workers outside the traded sector are taken into account, the figure rises slightly, but it still true that only 20 percent of the population aged 25-64 graduated from high school, and only 60 percent made it past the sixth grade.54
Carlos Salinas tried to free up public resources by attracting private capital into the provision of infrastructure. His attempts succeeded at building infrastructure, but not in reducing the burden on the public sector. The foremost example is the private toll highways. In theory, roadbuilding provides large social benefits, since it does little good for the U.S. to eliminate tariffs on Mexican goods if transport costs
51 OECD (2002): 72. 52 Authors’ calculation, using raw data provided by the OECD and Heston et. al. (2002). 53 Arenas Velázquez (2004): 13. 54 OECD (2002): 71.

Was NAFTA Necessary?
18
to the border are high. Mexico, therefore, built 3,249 miles of modern limited-access toll highways under build-operate-transfer contracts between 1989 and 1995.55
In practice, however, the initial traffic loads proved too light to bear the construc-tion and interest costs. Light traffic loads meant high tolls, which meant that traffic did not increase, which meant that tolls remained high. In 1995, the highway com-panies went bankrupt and the toll roads had to be nationalized, at a total cost to the taxpayer of over US$12 billion.56 The government has continued to build toll high-ways using its own revenues, but at a much slower rate.
In conclusion, Mexico’s investment remains below the levels needed to produce rapid economic growth and allow the country to catch up with Europe and the Uni-ted States. Mexico also does not collect sufficient taxes to build the infrastructure it needs and still maintain its already low spending on public education, health, law enforcement, and national defense.
Wages and living standards
What did NAFTA do to Mexico’s wages and income distribution? The decennial census gives us a snapshot of the overall level of wages in the Mexican economy. In 1990, average male wages had a U.S.-equivalent value of $1.99 per hour in 2000 dol-lars. In 2000, average male wages still had a U.S.-equivalent value of only $1.99 per hour in 2000 dollars. Female real wages increased, but by less than nine percent over ten years, from $1.86 per hour to $2.02.57
Annual data on real manufacturing wages let us track the changes in wage levels over the decade, at least for the fifth of the workforce that labors in the manufactur-ing sector. 58 Real manufacturing wages, adjusted for both inflation and the lower cost-of-living in Mexico, fell 40 percent during the 1994-95 peso crisis. Since then real manufacturing wages have increased strongly, but this growth has only brought real wages back to 48 percent of their 1981 peak. In relative terms, Mexican manufac-turing wages have decreased from 34 percent of U.S. manufacturing wages in 1981 to 16 percent of U.S. wages in 2000.
FIGURE 16 AROUND HERE
The wage distribution has improved, but the overall income distribution has not. In other words, the gap between skilled and unskilled workers has decreased slight- 55 Rachide et. al. (2002): 1. 56 OECD (2002): 81 and Rachide et. al. (2002): 1. 57 Average total hourly compensation (e.g., including benefits) for production workers (in all non-agricultural sectors of the economy, manufacturing and services) in the United States was $14.02 in 2000. 58 The share of manufacturing workers in the labor force declined slightly from 20.7 percent in 1990 to 20.0 percent in 2000. Hanson (2003): 33. The share of manufacturing workers in the labor force declined further to 19.6 percent by 2003. INEGI. Encuesta Nacional de Empleo Urbano.

Was NAFTA Necessary?
19
ly since 1994, but labor’s share of overall income has decreased. These two points are taken in turn.
The gap between floor workers (“obreros”) and white-collar employees (“em-pleados”) has declined by about five percent since 1994. The decline, however, has not been enough to compensate for the large increase in wage inequality that oc-curred in the 1980s and early 1990s. Between 1987 and 1993, for example, the wages of urban workers with only a primary education fell 15 percent relative to workers with a secondary education and 60 percent relative to workers with post-secondary education. 59
Why did wages become more unequal in the 1980s and early 1990s? The reason is that Mexico’s initial trade opening in 1983-86 caused the relative wages of unskilled workers to fall. Industries intensive in the use of unskilled labor—such as textiles, wood furniture, and shoes—were the most protected under Mexico’s old trade re-gime. When Mexico joined GATT and began lowering tariffs (a process that was mostly complete by 1987) the relative price of products intensive in the use of un-skilled-labor dropped more than the prices of other products, and so did the wages of their workers.60
Why did the wage gap stop increasing after NAFTA? Mexico’s tariff reductions under NAFTA were concentrated in relatively skill-intensive industries, like auto-mobiles and auto parts. In addition, NAFTA gave the Mexican textile industry privileged access to the U.S. market, and the textile industry uses a lot of unskilled labor. After 1994, therefore, the demand for skilled workers fell, while the demand for unskilled workers rose.61 As a result, NAFTA appears to have at least temporar-ily stopped the rise in wage inequality.62
The above analysis bodes ill for the future of unskilled workers in Mexico. China’s entry into the WTO will dramatically affect the ability of Mexico’s low-skilled industries to compete. While Mexico may be able to prosper in industries such as automobiles and auto parts, it is unlikely that its textile and shoe industries will survive in their present form. The relative demand for unskilled workers is likely to drop in the future, therefore, along with their relative wages.
In addition, NAFTA has done little to raise labor’s share of total national income. In fact, labor’s share of national income has dropped 60 percent between 1981 and
59 See Robertson (2001) for a full discussion. 60 See Robertson (2001) for a full discussion. 61 Arenas Velázquez (2004): 28. 62 See Robertson (2001) for a full discussion. The recent expiry of the MFA has ended Mexico’s privileged textile access to the U.S. market, and may result in a worsening of Mexico’s wage distribution as workers in that industry endure wage cuts or job losses.

Was NAFTA Necessary?
20
1994. The overall income distribution deteriorated massively. Between 1984 and 1994, the richest ten percent of Mexican households increased their share of national income by seven full percentage points, from 34 percent to an astronomical 41 per-cent. More than half of this increase came at the expense of Mexico’s middle class: the share of income of households in the 50th to 90th percentile declined 4 percentage points. There has been scant improvement since Mexico signed NAFTA in 1994.
FIGURE 17 AROUND HERE
Regional impacts
Part of the rise in inequality is regional: northern Mexico has benefited more than the rest of the country from NAFTA. First, northern Mexico is close to the United States. In a country with a poor transport infrastructure, locating export industries close to their final market provides a great competitive advantage. Second, the pub-lic infrastructure is far better in the northern states. They have more modern roads, sewer systems, electric transmission networks, and telecommunications. They also have—some of the border cities, like Ciudad Juárez and Nuevo Laredo, excepted—lower crime rates. Lastly, the northern states have a better educated population and an existing network of large and medium-sized firms that are capable of taking ad-vantage of export opportunities. The southern states lack this capacity, being spe-cialized in agricultural production and lacking large enterprises.63
Since 1993, per capita GDP has fallen at an annual rate of 1 percent in the south-ern states.64 (See Table 3.) The south’s economic decline means that extreme pov-erty remains widespread. As of 1998, half the population of the southern states lived on less than two dollars a day. There seem to be only two possible solutions to the problem of southern poverty: either the government will design programs to aid the southern poor or there will be large-scale migration from the south to northern Mexico and the United States.65
TABLE 3 AROUND HERE
Conclusion
Mexico signed NAFTA in a gamble to restore investor confidence. NAFTA effec-tively contracted out the enforcement of private property rights for foreign investors to the American and Canadian judicial systems.
NAFTA succeeded in raising the level of FDI and increasing the country’s foreign trade. It also succeeded in raising manufacturing productivity, although Mexico’s 63 OECD (2002): 68. 64 OECD (2002): 68. 65 OECD (2002): 69.

Was NAFTA Necessary?
21
relative productivity continues to lag. Unfortunately, NAFTA did not raise invest-ment rates or living standards back to their pre-1982 levels.
A Mexico without NAFTA would clearly have been poorer. It would have at-tracted less FDI. Its industries, therefore, would have grown more slowly. Real manufacturing wages would have failed to improve. In short, Mexico would be worse off without NAFTA. That said, the agreement has not created anything at all like an economic miracle of the sort that the European Union produced for its Medi-terranean members or Ireland. NAFTA has been so limited because foreign invest-ment is only a partial and imperfect substitute for domestic investment. Unless Mexico reforms the institutions governing domestic investment and finance, it will continue to suffer slow growth and fall further behind the developed world.
REFERENCES
Arenas Velázquez, Erika. (2004.) “Efectos de la apertura comercial en la brecha sala-rial entre trabajadores calificados y no calificados en México durante el periodo 1987-2000.” Gaceta Económica 9 (18): 5-39.
Averbug, André. (1999.) “Brazilian Trade Liberalization and Integration in the 1990s,” BNDES-PNUD working paper, mimeo, p. 11.
Banco de México. Cuadernos de Información Económica.
Bergoeing, Raphael, Patrick Kehoe, Timothy Kehoe y Raimundo Soto. (2002.) “Pol-icy-Driven Productivity in Chile and Mexico in the 1980s and 1990s,” American Economic Review, Papers and Proceedings, 92 (2): 16-21.
Bulmer-Thomas, Victor. (1994.) The Economic History of Latin America since Independ-ence. New York: Cambridge University Press.
Cárdenas, Enrique. (1996.) La política económica de México, 1950-1994. México, D.F.: Fondo de Cultura Económica.
Castañeda, Jorge. (2000.) Perpetuating Power: How Mexican Presidents were Chosen. New York: The New Press.
Clarkson, Stephen. (2002.) “NAFTA and the WTO in the Transformation of Mex-ico's Economic System,” in Mexico’s Politics and Society in Transition, edited by Joseph Tulchin and Andrew Selee, pp. 215-254. Boulder: Lynne Rienner Pub-lishers.

Was NAFTA Necessary?
22
Condon, Bradly, and Tapen Sinha. (2003.) Drawing Lines in Sand and Snow: Border Security and North American Economic Integration. Armonk, New York: M.E. Sharpe.
De los Angeles Pozas, María. (1993.) Industrial Restructuring in Mexico. San Diego: Center for US-Mexico Studies.
Federal Research Division. (1997.) Brazil: A Country Study. Washington, D.C.: Li-brary of Congress.
Federal Reserve Bank of Dallas. (1998.) Business Frontiers, Issue 4.
Hanson, Gordon. (2003.) “What Has Happened to Wages in Mexico since NAFTA?” NBER working paper w9563.
Hernández Rodríguez, Rogelio. (1987.) “La política y los empresarios después de la nacionalización bancaria,” Foro Internacional 27(2): 247-65.
Heston, Alan, Robert Summers and Bettina Aten. (2002.) Penn World Table Version 6.1, Center for International Comparisons at the University of Pennsylvania (CICUP).
INEGI. Encuesta Nacional de Empleo Urbano.
Maxfield, Sylvia. (1989.) “International Economic Opening and Government-Business Relations,” in Mexico’s Alternative Political Futures, edited by Wayne Cornelius, Judith Gentleman, and Wayne Smith, pp. 215-36. San Diego: UCSD Press.
Meyer, Lorenzo, and Isidro Morales. (1990.) Petróleo y nación: La política petrolera en México (1900-1987). México, D.F.: Fondo de Cultura Económica.
Morgan Guaranty Trust Company of New York. World Financial Markets, various is-sues.
OECD. (2002.) Economic Survey of Mexico.
Orme, William. (1996.) Understanding NAFTA: Mexico, Free Trade, and the New North America. Austin: University of Texas Press.
Pastor, Manuel, and Carol Wise. (2002.) “A Long View of Mexico's Political Econ-omy: What's Changed? What Are the Challenges?” in Mexico’s Politics and Soci-ety in Transition, edited by Joseph Tulchin and Andrew Selee, pp.179-214. Boul-der: Lynne Rienner Publishers.

Was NAFTA Necessary?
23
Pill, Huy. (1997.) “The Recycling Problem: International Bank Lending in the 1970s.” Harvard Business School case 9-736-131.
Pill, Huy. (1997a.) “Reform and Crisis,” Harvard Business School case 9-797-050.
Reforma, 24 Junio 2004, Mexico City.
Rachide, Mary, Isabelle Niño, Luis Calzada, Alberto Gómez, and Stephen Smith. (2003.) “Mexican Road Re-privatization: A new attempt to Attract Private In-vestment to the Road Network.” Mimeo, Fuqua School of Business.
Reynolds, Clark. (1970.) The Mexican Economy: Twentieth-Century Structure and Growth. New Haven: Yale University Press.
Robertson, Raymond. (2001.) “Relative Prices and Wage Inequality: Evidence from Mexico,” mimeo, Macalaster College.
Thorp, Rosemary. (1998.) Progress, Poverty and Exclusion: An economic History of Latin America in the 20th Century. Baltimore, Maryland: Johns Hopkins Univer-sity Press.
Tornell, Aaron. (1995.) “The Political Economy of Mexico's Entry to NAFTA,” NBER working paper w5322.
UNCTAD. (2002.) World Investment Report.

Was NAFTA Necessary?
24
Table 1 Percent of FDI, by sector
Manufac-
turing
Banking and finan-
cial services
Transport and communi-
cations Com-merce
Hotels, res-taurants, and professional
services Electric power
Construc-tion Mining
Agri-culture
1994 58% 9% 7% 12% 11% 0% 2% 1% 0% 1995 58% 13% 11% 12% 5% 0% 0% 1% 0% 1996 61% 16% 6% 9% 6% 0% 0% 1% 0% 1997 60% 9% 6% 16% 7% 0% 1% 1% 0% 1998 62% 9% 5% 12% 10% 0% 1% 1% 0% 1999 68% 6% 2% 9% 11% 1% 1% 1% 1% 2000 57% 29% 14% 14% 11% 1% 1% 1% 1% 2001 22% 54% 11% 6% 5% 1% 0% 0% 0% 2002 40% 32% 6% 10% 7% 2% 1% 2% 0% 2003 47% 19% 16% 9% 8% 1% 1% 0% 0% Source: Secretaría de Economía. Dirección General de Inversión Extranjera.
Table 2 Nontradable inputs in traded goods industries, percent of total expenses
Total Outsourcing Repairs and maintenance
Freight & transport Electricity
Rentals &
leases Other
Textiles and apparel 23% 16.5% 2.4% 1.7% 0.8% 1.2% 0.5%
Paper and printing 25% 11.5% 3.5% 1.1% 3.1% 3.3% 2.3%
Chemicals 28% 1.1% 6.8% 1.0% 8.2% 8.2% 2.4%
Non-metallic mineral products 23% 30.0% 9.5% 2.0% 5.6% 4.9% 1.0%
Discs and magnetophonic tapes 23% 4.8% 8.8% 1.0% 1.2% 4.0% 2.7%
Total manufacturing 12% 2.1% 3.4% 2.2% 1.7% 1.3% 1.7% Source: Tornell, Westermann, and Martinez 2004, Table 2.

Was NAFTA Necessary?
25
Table 3: Regional comparisons North South
1993 2000 1993 2000 Population (1000s) 9,336 11,402 8,850 10,439 Insured (formal sector) workers 1,678 2,295 276 321 Manufacturing employment (1000s) 677 987 65 93 Average wage, % of North 85% 77% Manufacturing productivity, % of North 87% 70% Real GDP per capita, % of North 73% 68% Note: "North" is Sonora, Chihuahua, Coahuila, and Nuevo Leon. "South" is Guerrero, Oaxaca, and Chiapas. Source: OECD 2002, Table 12.
Figure 1
Productivity as % of MexicoSource: Penn World Tables, version 6.1.
USA
Italy
Spain
Greece Portugal
50%
100%
150%
200%
250%
1950 1955 1960 1965 1970 1975 1980 1985 1990 1995 2000

Was NAFTA Necessary?
26
Figure 2
Mexican Oil Exports and ReservesSource: 1974-82, Pemex, Anuario Estadistico 1985, p. 116. 1959-73, Meyer & Morales, Table 19. Reserves, Gavin, Table 1.
Exports, millions of
barrels(left axis)
Reserves, billions of
barrels(right axis)
-
100,000
200,000
300,000
400,000
500,000
600,000
1965 1966 1967 1968 1969 1970 1971 1972 1973 1974 1975 1976 1977 1978 1979 1980 1981 1982
Mill
ions
of b
arre
ls
-
10,000
20,000
30,000
40,000
50,000
60,000
70,000
80,000
Bill
ions
of b
arre
ls
Figure 3
Mexico's foreign debtSource: Meyer and Morales, Table 39.
Pemex
Rest of Public Sector
$-
$10,000
$20,000
$30,000
$40,000
$50,000
$60,000
1974 1975 1976 1977 1978 1979 1980 1981 1982
Mill
ions
of d
olla
rs
Was NAFTA Necessary?
27
Figure 4
Mexican trade protectionSource: Tornell 1995, Table 1, and Cardenas 1996.
Imports subject to permits as % of all imports
(left axis)
Production weighted
average tariff (right axis)
0%
20%
40%
60%
80%
100%
1979 1980 1981 1982 1983 1984 1985 1986 1987 1988 1989 1990 1991 1992 1993 19940%
5%
10%
15%
20%
25%
Figure 5
Mexican Economic IndicatorsSource: Calculated from data in Penn World Tables 6.1.
50
75
100
125
150
1980 1982 1984 1986 1988 1990 1992 1994 1996 1998 2000
Gross real investment
Real GDP per capita
Real productivity

Was NAFTA Necessary?
28
Figure 6
State-owned companies in MexicoSource: Cardenas, Figure 4.9.
300
400
500
600
700
800
900
1000
1100
1200
1982 1983 1984 1985 1986 1987 1988 1989
Figure 7
FDI in MexicoSource: Secretaría de Economía. Dirección General de Inversión Extranjera.
$0
$5,000
$10,000
$15,000
$20,000
$25,000
1975 1980 1985 1990 1995 2000 2005
Total From USA

Was NAFTA Necessary?
29
Figure 8
FDI as % of total gross new investmentSource: Secretaría de Economía. Dirección General de Inversión Extranjera.
Last year before NAFTA
0%
2%
4%
6%
8%
10%
12%
14%
1980 1985 1990 1995 2000 2005
Figure 9
FDI flows to various countriesSource: World Investment Report, UNCTAD, 2002; INEGI for 2002 and 2003. 2002 data from OECD. 2003 data from World Bank. Note: All figures in 2001 dollars.
Canada
China
Brazil
Mexico
$-
$10,000
$20,000
$30,000
$40,000
$50,000
$60,000
$70,000
1970 1975 1980 1985 1990 1995 2000 2005
Mill
ions
of d
olla
rs
CanadaChinaBrazilMexico

Was NAFTA Necessary?
30
Figure 10
19971998
19992000
Mexico
USACanada
10%
19% 19%
47%
8%12%
18%18%18%
14%12%
12%0%
5%
10%
15%
20%
25%
30%
35%
40%
45%
50%
FDI as % of total fixed investmentSource: World Investment Report, UNCTAD, 2002

Was NAFTA Necessary?
31
Figure 11
19801985
19901995
2000
USAMexico
Canada
20%18% 20% 21%
29%
4%
10%9%
14%17%
3% 4%7% 7%
12%
0%
5%
10%
15%
20%
25%
30%
FDI as percent of GDPSource: World Investment Report, UNCTAD, 2002

Was NAFTA Necessary?
32
Figure 12
Maquiladoras and the Mexican economySource: INEGI. Sistema de Cuentas Nacionales de México.
Gross value of maquiladora exports, %
of GDP
Maquiladora value-added, % of GDP
0%
2%
4%
6%
8%
10%
12%
14%
16%
18%
1993 1994 1995 1996 1997 1998 1999 2000 2001 2002
Perc
ent o
f GD
P
Figure 13
Productivity in Mexico, by sectorSource: Banco de Mexico
7883
88
94
100103
111
116120
124
130 132
139141
100
87 8884 85 87
90
8381
84
70
80
90
100
110
120
130
140
150
1990 1992 1994 1996 1998 2000 2002 2004
ManufacturingServices
Was NAFTA Necessary?
33
Figure 14
Manufacturing as a percent of GDPSource: INEGI
Quarter NAFTA ratified by the U.S. Congress
15%
16%
17%
18%
19%
20%
21%
1980 1985 1990 1995 2000 2005
Figure 15
Investment as % of GDPSource: Calculated from data in Penn World Tables 6.1.
0%
5%
10%
15%
20%
25%
30%
1980 1981 1982 1983 1984 1985 1986 1987 1988 1989 1990 1991 1992 1993 1994 1995 1996 1997 1998 1999 2000

Was NAFTA Necessary?
34
Figure 16
Mexican manufacturing wagesSource: PWT 6.1 for PPP exchange rate in 1981-2000, BLS for 1981-2000 wage data. INEGI for 2001-03 wage data. Note: PPP factor for 2001-03 calculated by author, based on data on U.S. and Mexican inflation and exchange rates
Hourly wages adjusted for inflation and
purchasing power
Hourly wage in current dollars
Percent of U.S. wages (right axis)
$0.00
$0.50
$1.00
$1.50
$2.00
$2.50
$3.00
$3.50
$4.00
$4.50
$5.00
$5.50
$6.00
$6.50
1980 1985 1990 1995 2000 2005
Dol
lars
per
hou
r
0%
10%
20%
30%
40%
50%
60%
70%
80%
90%
100%
Figure 17
Bottom 10percent 10-50
50-7070-90
Top 10percent
1984
1994
2000
1%
10%16%
28%
40%
1%
10%15%
27%
41%
1%11%
17%
29%34%
0%
5%
10%
15%
20%
25%
30%
35%
40%
45%
The Mexican income distributionSource: INEGI.