(wash) – mongolia
TRANSCRIPT
Equity in Public Financing of Water, Sanitation and Hygiene (WASH)
MONGOLIA
unite forchildren
UNICEF East Asia and Pacific Regional OfficeJune 2016

©2016 UNICEF/EAPRO East Asia and Pacific Regional Office,19 Phra Atit Road, Bangkok 10200, Thailand Tel: +66 2356 9274www.unicef.org/eapro All cover photos ©UNICEF
unite forchildren
Equity in Public Financing of Water, Sanitation and Hygiene (WASH)
MONGOLIAUNICEF East Asia and Pacific Regional Office
June 2016
PREFACE
This report is an output of the project contracted by UNICEF to OPM to assess WASH financing processes and outcomes in three countries in East Asia. The purpose of the assignment was to map and analyse decision-making, financial flows, allocation criteria and spending levels relevant to WASH services in Viet Nam, Indonesia and Mongolia to inform UNICEF programming and advocacy for promoting equitable and sustainable WASH services for children.
This MONGOLIA report is the end product of a desk review of existing literature to establish the institutional setup and management of the WASH sector in regards to the assignment of functions and finances to local governments, and meetings with development partners and government officials at the central, provincial and district level. This is complemented by a similar set of outputs from Viet Nam and Indonesia. The other deliverables under this contract include a regional analysis report with key recommendations for improved WASH financing for children based on the findings of the three country case studies.
UNICEF EAPRO recognizes the high quality expertise and professionalism provided by the OPM team – Mark Ellery and Henlo van Nieuwenhuyzen – in undertaking this assignment. Special gratitude is expressed to Batnasan Nyamsuren (Chief WASH, UNICEF Mongolia) and Enkhnasan Nasan-Ulzii (Chief Social Policy, UNICEF Mongolia) for providing their generous support and expertise in the research process.
EAPRO also recognizes the crucial role of UNICEF staff from the Mongolia country office, the regional office, and national consultants, who dedicated their time and enthusiasm to ensuring that the project was a success. UNICEF also acknowledges the contributions from the various donor organizations, ministries and local government staff who made themselves available for interviews and whose dedication to addressing the challenges within the WASH sector is very much respected.
Chander Badloe
Regional Adviser - Water, Sanitation & Hygiene (WASH) UNICEF East Asia and Pacific Regional Office (EAPRO)
Gaspar Fajth
Regional Adviser - Social Policy and Economic Analysis, UNICEF East Asia and Pacific Regional Office (EAPRO)

EQUITY IN PUBLIC FINANCING OF WATER, SANITATION & HYGIENE (WASH) MONGOLIA
v
CONTENTS
List of figures and tables vi
Acronyms vii
Executive summary 1
Introduction 3
1. WASH SECTOR CONTEXT 4
1.1 Water supply 4 1.2 Sanitation 4 1.3 Solid waste 6
2. INSTITUTIONAL FRAMEWORK AND 7 PUBLIC RESPONSIBILITIES FOR WASH SERVICE
2.1 Mongolia’s government structure 7 2.2 Public sector functionaries 8 2.3 WASH functional assignment 9 2.4 Responsibility by WASH subjects 10 2.5 Summary of WASH functions 13
3. WASH FINANCING 14
3.1 Financing for WASH infrastructure 14 3.2 Financing for operation and maintenance of WASH infrastructure 17
4. PUBLIC SECTOR FINANCIAL MANAGEMENT 20
4.1 Public sector budget management 20 4.2 Programme budgeting 21
5. RECOMMENDATIONS 23
5.1 Revise water tariff structures 23 5.2 Municipal engines of growth 24 5.3 Programme-based budgeting 24 5.4 Performance agreements 26
Annex - References 30
EQUITY IN PUBLIC FINANCING OF WATER, SANITATION & HYGIENE (WASH) MONGOLIA
vi
LIST OF FIGURES AND TABLES
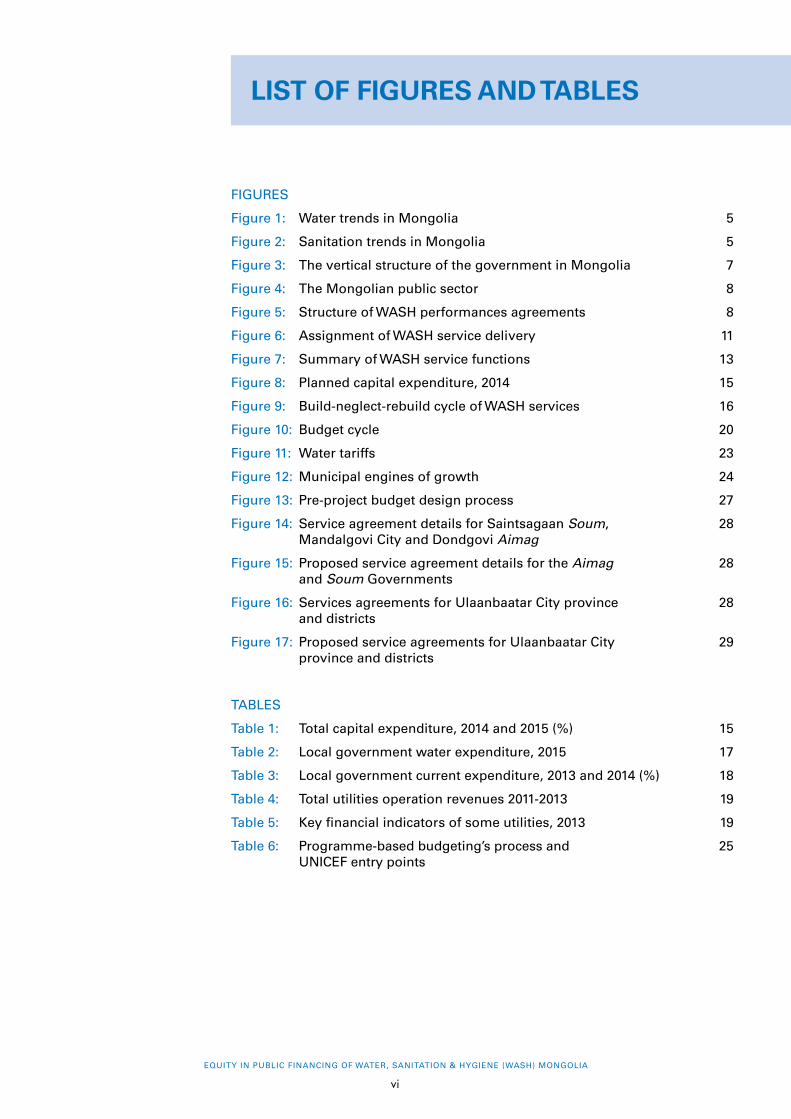
FIGURES
Figure 1: Water trends in Mongolia 5
Figure 2: Sanitation trends in Mongolia 5
Figure 3: The vertical structure of the government in Mongolia 7
Figure 4: The Mongolian public sector 8
Figure 5: Structure of WASH performances agreements 8
Figure 6: Assignment of WASH service delivery 11
Figure 7: Summary of WASH service functions 13
Figure 8: Planned capital expenditure, 2014 15
Figure 9: Build-neglect-rebuild cycle of WASH services 16
Figure 10: Budget cycle 20
Figure 11: Water tariffs 23
Figure 12: Municipal engines of growth 24
Figure 13: Pre-project budget design process 27
Figure 14: Service agreement details for Saintsagaan Soum, 28 Mandalgovi City and Dondgovi Aimag
Figure 15: Proposed service agreement details for the Aimag 28 and Soum Governments
Figure 16: Services agreements for Ulaanbaatar City province 28 and districts
Figure 17: Proposed service agreements for Ulaanbaatar City 29 province and districts
TABLES
Table 1: Total capital expenditure, 2014 and 2015 (%) 15
Table 2: Local government water expenditure, 2015 17
Table 3: Local government current expenditure, 2013 and 2014 (%) 18
Table 4: Total utilities operation revenues 2011-2013 19
Table 5: Key financial indicators of some utilities, 2013 19
Table 6: Programme-based budgeting’s process and 25 UNICEF entry points
EQUITY IN PUBLIC FINANCING OF WATER, SANITATION & HYGIENE (WASH) MONGOLIA
vii
ACRONYMS
AFCCP Authority for Fair Competition and Consumer Protection
CBO community-based organization
GASI General Agency for Specialized Investigation
GLDF General Local Development Fund
LDF Local Development Fund
JMP Joint Monitoring Programme for Water Supply and Sanitation (WHO/UNICEF)
MASM Mongolian Agency for Standardization and Metrology
MCUD Ministry of Construction and Urban Development
MDG Millennium Development Goal
MNT Mongolian Tugrik
MUB Municipality of Ulaanbaatar
ODA official development assistance
O&M operations and maintenance
OPM Oxford Policy Management
OSNAAG Housing and Communal Authority
PFM public financial management
UNDP United Nations Development Programme
UNICEF United Nations Children’s Fund
USUG Water Supply and Sewerage Authority of Ulaanbaatar City
WASH water, sanitation and hygiene
WSRC Water Services Regulatory Commission

EXECUTIVE SUMMARY
1
EXECUTIVE SUMMARY
Mongolia has made positive steps towards Millennium Development Goal (MDG) 7 “to halve, by 2015, the proportion of people without access to safe drinking water and basic sanitation”, while recording relatively low levels of public expenditure over the last decade. Improvements in access were primarily the result of relatively high levels of expenditure by households/users, along with recurrent expenditure by service providers. Furthermore, the expansion of new infrastructure services has disproportionately favoured cities and district capitals, leaving rural localities lagging behind in access to water, sanitation and hygiene (WASH) services. As a consequence, water and sanitation coverage rates are over 30 per cent lower in rural areas in comparison to urban areas.
The report methodology is based on a synthesis of all the available data and information from existing studies. This research was instrumental to mapping out institutional structures and financing flows within the WASH sector and identifying the key bottlenecks hampering the delivery of services and the achievement of desired WASH outcomes. Primary data, in the form of information collected in-country as well as key informant interviews, were also critical to this analysis.
Despite the substantial progress made to date, public financial management (PFM) and subnational financing systems for WASH still face considerable challenges in Mongolia.
One key challenge is the low water tariffs that decrease the viability of service provision, hampering the efforts of providers to expand and meet growing demand, and compromising the inclusiveness of access to water and sewerage services. The absence of 100 per cent water-metering fosters inequities in the consumption of water and allows the wastage of drinking water to persist unchecked. This absence has contributed to a dysfunctional sectoral relationship, which is prone to political patronage resulting in the poor subsidizing the consumption of the rich. The inability of local governments to generate the revenue from the sector to reinvest in upgrading/expanding assets has led to a culture of build-neglect-rebuild, where local governments allow assets to ‘run down’ in order to lobby the central government to re-invest in asset improvements.
Another challenge is the separation of capital and recurrent expenditures for WASH services, with perverse consequences for operations and maintenance (O&M) of infrastructure and, therefore, the delivery of services. In addition, the bulk of capital spending on WASH comes from central rather than local governments.
There are also concerns about the transfer of public WASH assets to public service, which undermines, rather than enhances, service provider viability, and concerns about local governments’ quality assurance role for the services delivered by those providers. There are challenges with accounting, budgeting codes and budget structures. A scarcity of information on subnational financing of WASH and spending efficiency and effectiveness makes it more difficult to address the bottlenecks.
EQUITY IN PUBLIC FINANCING OF WATER, SANITATION & HYGIENE (WASH) MONGOLIA
2
The first priority for the water sector is the raising and re-structuring of volumetric tariffs. The increasing of tariffs to cover the full cost of service provision (asset creation, O&M, depreciation) can address the incentives created by depressed tariffs. This could also include the imposition of ‘headworks fees’ on property developers to finance major capital works expansions to the headworks to meet the future needs of these properties. This will enable local governments and their providers to utilize their water revenues to expand their water infrastructure to meet the increased demand for services. This will also exchange the current system in which the poor subsidise the consumption of the rich to be rebalanced.
The second priority is for the WASH sector to improve the targets defined in the performance contracts signed between local government governors and their providers. In the case of the
local government owned providers this necessitates separating the local government incentive for viability exercised through ownership and representation on the Board of the Company from the incentive for inclusion/quality exercised by the local government department through a contract/license agreement.
There is an opportunity for UNICEF to engage with the Water Services Regulatory Commission (WSRC) on technical research and advocacy on the pro-poor nature of tariffs that enable full cost recovery (i.e., O&M, asset creation and a return on sunk investments). There is also an opportunity for UNICEF to engage with the local government in relation to performance agreements that bind budget-holding service providers to meet minimum WASH, health, education and child protection standards.
INTRODUCTION
3
INTRODUCTION
Mongolia has made considerable progress in access to improved water and sanitation facilities. Moving away from a system of strict state control of services, the country has assigned increasing WASH functional and financial resources to local government while shifting towards a market-based economy. With its economy and budget dependent on mining revenues, the country’s economic outlook tends to change sharply based on increases and decreases in the price of copper.
It is in this context that UNICEF East Asia and Pacific Regional Office, in collaboration with the Mongolia Country Office, government partners and technical assistance from Oxford Policy Management (OPM), undertook this study. The objective of the research is a comprehensive understanding of the institutions, decision-making processes and key bottlenecks in the financing of the WASH sector, particularly at the subnational level where service delivery takes place. The study aims to provide key policy recommendations and entry points for UNICEF programming and advocacy to improve the effectiveness of WASH service financing in Mongolia.
This study builds on existing initiatives that have contributed to an improved understanding of WASH financing systems. The report methodology is based on a synthesis of all the available data and information from existing studies. Primary data in the form of information collected in-country and key informant interviews were also critical to this analysis.
However, there are many impediments to a comprehensive understanding of public financing bottlenecks in the Mongolian WASH sector. The main challenges are the scarcity of information on the national and subnational financing of WASH, spending efficiency and effectiveness caused by the existing accounting, budgeting codes, and budget structures.
The study concludes that despite the substantial progress made to date, PFM and subnational financing systems for WASH still need to be addressed.
One key barrier is the low water tariffs. Another is the separation of capital and recurrent expenditures for WASH services, with perverse consequences for the operation and maintenance of infrastructure and, therefore, the delivery of services. There are also challenges in the performance contracts.
This report is structured as follows:
• Section 1 provides a stocktaking assessment of the water and sanitation sector in Mongolia.
• Section 2 examines the stakeholders involved in the provision of WASH, their role, responsibilities and the performance contract’s instrument.
• Section 3 analyses the current WASH financing mechanisms.
• Section 4 describes the PFM system in Mongolia.
• Section 5 presents recommendations and entry points for UNICEF programming in PFM and subnational financing to improve the quality and equity of WASH services.
EQUITY IN PUBLIC FINANCING OF WATER, SANITATION & HYGIENE (WASH) MONGOLIA
4
1WASH SECTOR CONTEXT
For this study, the WASH sector is defined as as large-scale water supply and sewerage systems in addition to WASH in schools, health facilities and communities in rural and urban areas.
Mongolia has made positive steps towards MDG 7 “to halve, by 2015, the proportion of people without access to safe drinking water and basic sanitation”. However, the expansion of new infrastructure services has disproportionately favoured cities and district capitals, leaving rural localities lagging behind in access to WASH services. As a consequence, water and sanitation coverage rates are over 30 per cent lower in rural areas in comparison to urban areas.
1.1 WATER SUPPLY
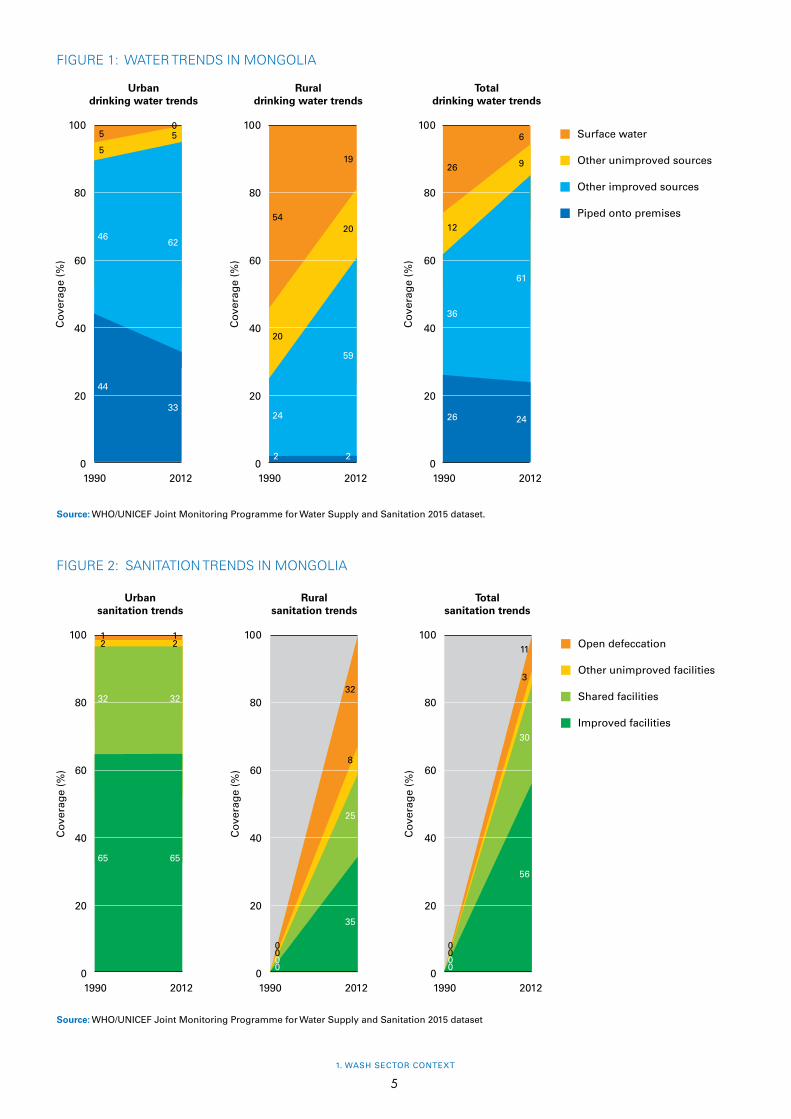
Mongolia has been making steady progress towards improving access to water supplies over the last 15 years and there has been a 26 per cent increase (to 85 per cent) in the population having access to water services (see Figure 1). This means the MDG goal for water has been achieved. However, access is heavily skewed towards urban areas (100 per cent access). Rural areas only have access rates of 53 per cent.1
Approximately 80 per cent of Mongolia’s water consumption is provided from ground water sources and the rest from surface water. The majority of this is consumed by industry (39 per cent) with additional and significant consumption as part of animal husbandry (24 per cent) and irrigation (17 per cent). Around one fifth (20 per cent) is used for drinking water and domestic uses.2
1.2 SANITATION
As Figure 2 shows, sanitation has received little attention at both the central and local government level and it is unlikely that the MDG target for sanitation will be met. Progress on the MDG has been slow with access to improved sanitation increasing to 56 per cent in 2012 while 11 per cent of the population still practice open defecation.3
1 WHO/UNICEF (2013), Joint Monitoring Programme for Water Supply and Sanitation (JMP).2 United Nations Development Programme (2013), Mongolia national sector assessment, Country Sector Assessments: Volume 2, New
York, U.S.A.3 UNDP (2010) advises that evaluation of MDG implementation in Mongolia should be treated with caution, as headline rates may
be increasing but well-accepted figures on water supply and sanitation are notably absent and the sector lacks a set of commonly agreed categorization, statistics and goals.
1. WASH SECTOR CONTEXT
5
Source: WHO/UNICEF Joint Monitoring Programme for Water Supply and Sanitation 2015 dataset.
FIGURE 1: WATER TRENDS IN MONGOLIA
FIGURE 2: SANITATION TRENDS IN MONGOLIA
Surface water
Other unimproved sources
Other improved sources
Piped onto premises
Rural drinking water trends
Cov
erag
e (%
)
100
80
60
40
20
0 1990 2012 1990 2012
Total drinking water trends
Cov
erag
e (%
)
100
80
60
40
20
0
Urban drinking water trends
Cov
erag
e (%
)
100
80
60
40
20
0 1990 2012
5
5
46
44
05
62
33
Source: WHO/UNICEF Joint Monitoring Programme for Water Supply and Sanitation 2015 dataset
Open defeccation
Other unimproved facilities
Shared facilities
Improved facilities
Rural sanitation trends
Cov
erag
e (%
)
100
80
60
40
20
0 1990 2012
Total sanitation trends
Cov
erag
e (%
)
100
80
60
40
20
0 1990 2012
Urban sanitation trends
Cov
erag
e (%
)
100
80
60
40
20
0 1990 2012
1122
3232
6565
11
3
30
56
19
20
59
22
54
20
24
26
12
36
26
6
9
61
24
32
8
25
35
0 00 00 00 0
EQUITY IN PUBLIC FINANCING OF WATER, SANITATION & HYGIENE (WASH) MONGOLIA
6
In local government areas in 2008, most of the waste treatment facilities had closed down due to operational shortages (lack of institutional support and human resources). Of the 103 wastewater treatment plants in Mongolia in 2001, only 41 were operational, 27 were partially operational and 35 were non-operational.
Sanitation in the ger areas (areas where people live in traditional tents or ‘gers’) is particularly bad, with a 2007 survey finding 100 per cent of ger residents complaining about insect and rodent infestations associated with poor sanitation and waste collection. In Ulaanbaatar city, where more than 60 per cent of the population live in ger areas, it is estimated that:
• there are at least 100,000 outhouse pit latrines;
• 14 per cent and 34 per cent of the population have no access to pit latrines or soak pits, respectively; and
• 180,000 cubic metres of wastewater has been dumped into the Tuul River without treatment.
Of the 200 million cubic metres of wastewater transported in sewerage networks across Mongolia, only an estimated 60 per cent is treated, while the rest is discharged into the environment. This is a major problem in urban centres across Mongolia.
1.3 SOLID WASTE
With a largely rural, historically nomadic and sparsely populated country, averaging 1.7 persons per square kilometre, the small volumes of solid waste are primarily buried or burnt in small dump sites. In recent years, rapid urbanization and economic growth have contributed to a growing solid waste management challenge. The Sanitation Law (1998) assigns responsibilities to individuals to observe the sanitary regime while the local government is responsible for involving economic entities and individuals in the collection, transportation and disposal of solid waste. Solid waste management is primarily undertaken through user pay systems using local government owned assets and/or providers.
2. INSTITUTIONAL FRAMEWORK AND PUBLIC RESPONSIBILITIES FOR WASH SERVICE
7
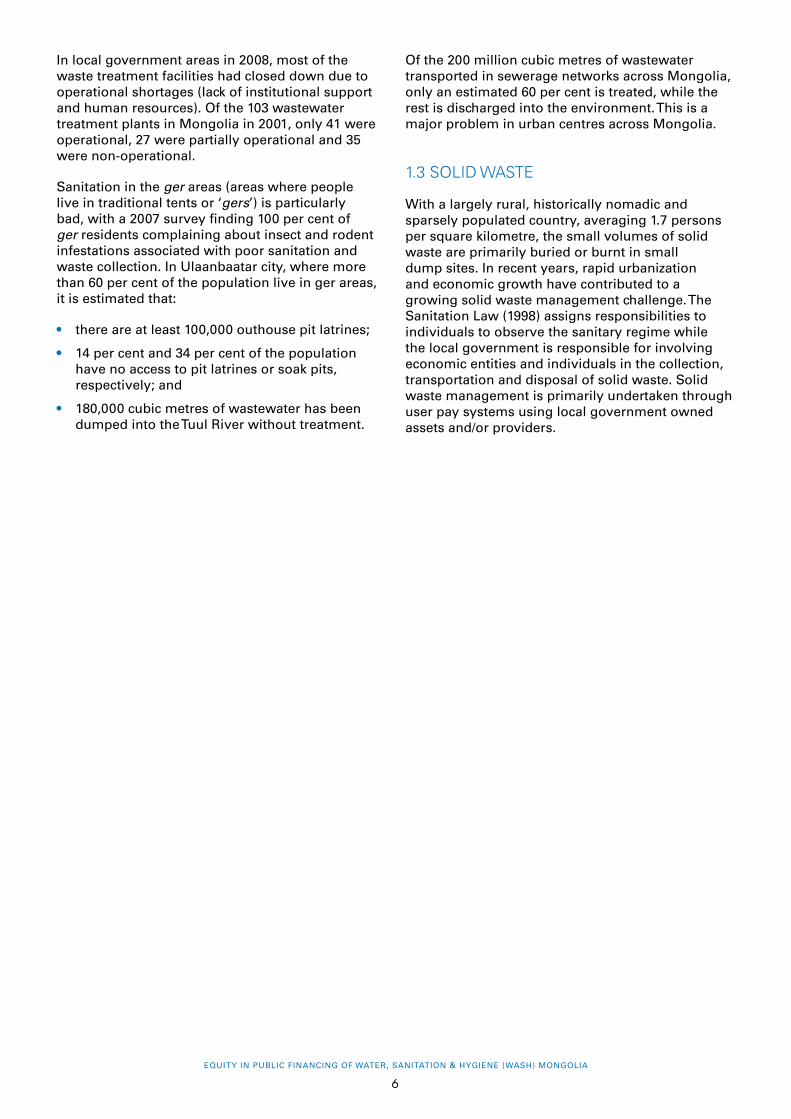
Source: Adapted from Siegel (2012)
Elected Administrative
State
Aimag (21)
Capital (1)
Khoroos (121)
Soum(340)
Districts (9)
Bagh(1,664)
2 INSTITUTIONAL FRAMEWORK AND PUBLIC RESPONSIBILITIES FOR WASH SERVICE
2.1 MONGOLIAN STRUCTURE OF GOVERNMENT
Mongolia’s public sector is divided into 21 provinces known as aimags and one independent provincial municipality, Ulaanbaatar. These major administrative units are then sub-divided into 340 districts known as soums, which in turn are composed of 1,664 sub-districts (baghs), which are the smallest administrative unit in Mongolia. Ulaanbaatar, the capital city, is composed of nine districts and 121 sub-districts known as khoroos.
According to the Constitution, the administrative units of Mongolia are organized on the basis of both self-governance and state administration (see Figure 3). As a result, Mongolia has a dual system in which administrative and territorial units have both a governor and a local council. Within each aimag and soum there is a democratically elected council (khural) of local citizens that serve for a term of four years. The khural nominates a governor who presides over the local government office. Article 62 of the Constitution empowers local self-governing bodies to make “independent decisions on matters of socio-economic life” and explicitly states that “the authority of higher instance shall not make decisions on matters coming under the jurisdiction of local self-governing”.
FIGURE 3: THE VERTICAL STRUCTURE OF THE GOVERNMENT IN MONGOLIA
Classification of the functions of
government
General administration
Economic affairs
Public worksand housing
Environmental protection
Water supply
Health
Education
Social protection
Land use/planning
Sanitation
Drainage
Solid waste
Hygiene
EQUITY IN PUBLIC FINANCING OF WATER, SANITATION & HYGIENE (WASH) MONGOLIA
8
2.2 PUBLIC SECTOR FUNCTIONARIES
Recent changes in the structure of local government include the transfer of all local government functionaries onto the local government budget. Although local government staff are engaged under general public service rules, all of these staff are engaged, managed and paid by local governments.
The most impressive aspect of the local government human resource management system is that all local government staff are employed by delegated budget-holding units. These budget-holding unit managers hire and fire, budget and manage their staff under a performance agreement signed with their respective governor. The details of the performance agreement are negotiated locally as well as through a performance agreement signed between the governor and the respective manager. This means that central-line department influence over local-line department staff is mediated through the governor. However, given the highly centralized legacy of the public sector, the influence of central departments is still significant.
The Mongolian public services adopted the New Zealand public management model in 1996, which requires managers to sign contracts promising results in exchange for budget and management autonomy. This management structure possibly reflects the legacy of how Genghis Khan organized his army into arbans (10 people), zuuns (100 people), mingghans (1,000 people) and tumens (10,000 people). Coupled with the introduction of various downward accountability measures (i.e., the Glass Account disclosing all budget and procurement details), the efficiency of public services employees is increasingly evaluated both through these contracts and through citizen engagement.
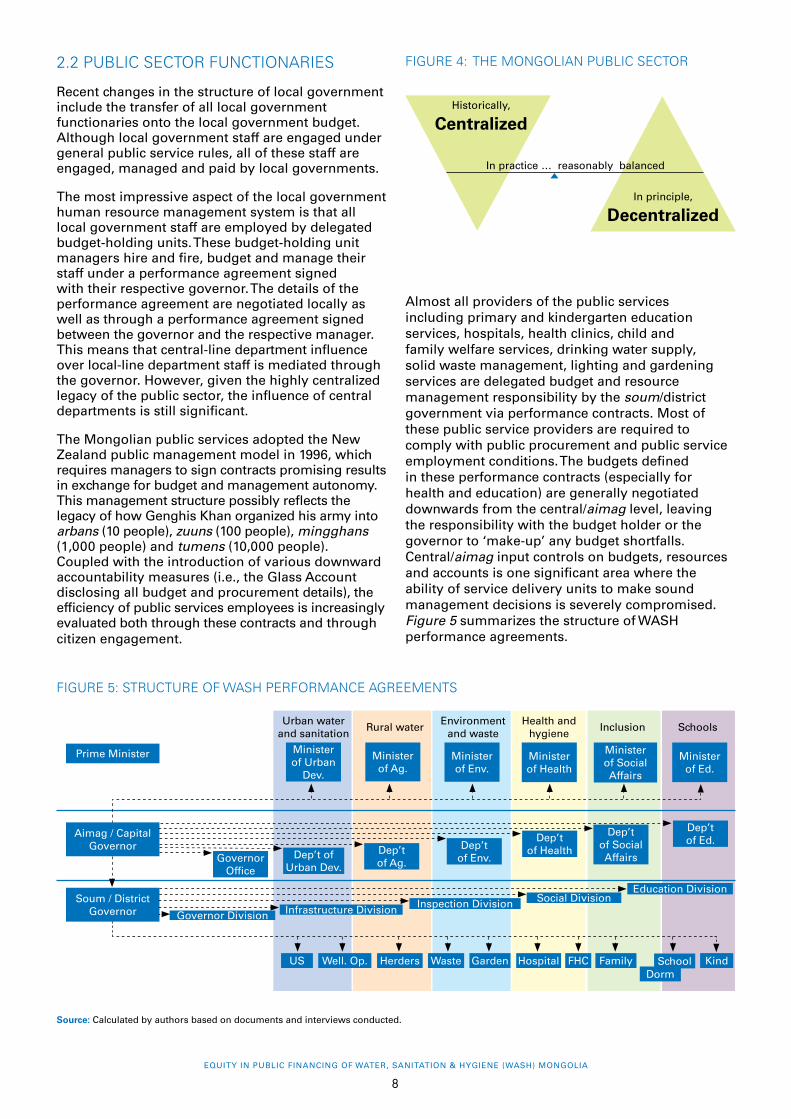
FIGURE 4: THE MONGOLIAN PUBLIC SECTOR
Almost all providers of the public services including primary and kindergarten education services, hospitals, health clinics, child and family welfare services, drinking water supply, solid waste management, lighting and gardening services are delegated budget and resource management responsibility by the soum/district government via performance contracts. Most of these public service providers are required to comply with public procurement and public service employment conditions. The budgets defined in these performance contracts (especially for health and education) are generally negotiated downwards from the central/aimag level, leaving the responsibility with the budget holder or the governor to ‘make-up’ any budget shortfalls. Central/aimag input controls on budgets, resources and accounts is one significant area where the ability of service delivery units to make sound management decisions is severely compromised. Figure 5 summarizes the structure of WASH performance agreements.
Historically,
Centralized
In principle,
Decentralized
In practice … reasonably balanced
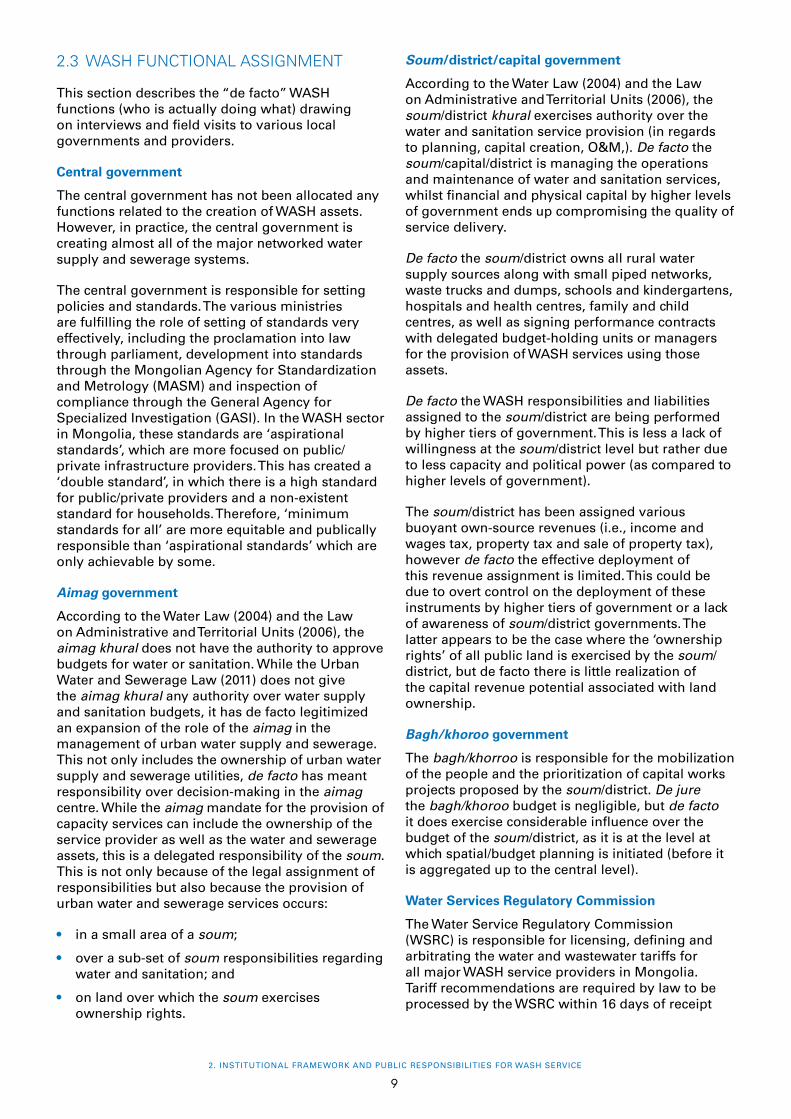
FIGURE 5: STRUCTURE OF WASH PERFORMANCE AGREEMENTS
Source: Calculated by authors based on documents and interviews conducted.
Prime Minister
Aimag / Capital Governor
Urban water and sanitation
Rural water Inclusion SchoolsEnvironment
and wasteHealth and
hygiene
GovernorOffice
Governor Division
US Well. Op. Herders Waste Garden Family School KindDorm
Hospital FHC
Infrastructure Division Inspection DivisionEducation Division
Social Division
Dep’t of Urban Dev.
Dep’t of Ag.
Dep’t of Env.
Dep’t of Health
Dep’t of Social Affairs
Dep’t of Ed.
Soum / District Governor
Minister of Urban
Dev.
Minister of Ag.
Minister of Env.
Minister of Health
Minister of Social Affairs
Minister of Ed.
2. INSTITUTIONAL FRAMEWORK AND PUBLIC RESPONSIBILITIES FOR WASH SERVICE
9
2.3 WASH FUNCTIONAL ASSIGNMENT
This section describes the “de facto” WASH functions (who is actually doing what) drawing on interviews and field visits to various local governments and providers.
Central government
The central government has not been allocated any functions related to the creation of WASH assets. However, in practice, the central government is creating almost all of the major networked water supply and sewerage systems.
The central government is responsible for setting policies and standards. The various ministries are fulfilling the role of setting of standards very effectively, including the proclamation into law through parliament, development into standards through the Mongolian Agency for Standardization and Metrology (MASM) and inspection of compliance through the General Agency for Specialized Investigation (GASI). In the WASH sector in Mongolia, these standards are ‘aspirational standards’, which are more focused on public/private infrastructure providers. This has created a ‘double standard’, in which there is a high standard for public/private providers and a non-existent standard for households. Therefore, ‘minimum standards for all’ are more equitable and publically responsible than ‘aspirational standards’ which are only achievable by some.
Aimag government
According to the Water Law (2004) and the Law on Administrative and Territorial Units (2006), the aimag khural does not have the authority to approve budgets for water or sanitation. While the Urban Water and Sewerage Law (2011) does not give the aimag khural any authority over water supply and sanitation budgets, it has de facto legitimized an expansion of the role of the aimag in the management of urban water supply and sewerage. This not only includes the ownership of urban water supply and sewerage utilities, de facto has meant responsibility over decision-making in the aimag centre. While the aimag mandate for the provision of capacity services can include the ownership of the service provider as well as the water and sewerage assets, this is a delegated responsibility of the soum. This is not only because of the legal assignment of responsibilities but also because the provision of urban water and sewerage services occurs:
• in a small area of a soum;
• over a sub-set of soum responsibilities regarding water and sanitation; and
• on land over which the soum exercises ownership rights.
Soum/district/capital government
According to the Water Law (2004) and the Law on Administrative and Territorial Units (2006), the soum/district khural exercises authority over the water and sanitation service provision (in regards to planning, capital creation, O&M,). De facto the soum/capital/district is managing the operations and maintenance of water and sanitation services, whilst financial and physical capital by higher levels of government ends up compromising the quality of service delivery.
De facto the soum/district owns all rural water supply sources along with small piped networks, waste trucks and dumps, schools and kindergartens, hospitals and health centres, family and child centres, as well as signing performance contracts with delegated budget-holding units or managers for the provision of WASH services using those assets.
De facto the WASH responsibilities and liabilities assigned to the soum/district are being performed by higher tiers of government. This is less a lack of willingness at the soum/district level but rather due to less capacity and political power (as compared to higher levels of government).
The soum/district has been assigned various buoyant own-source revenues (i.e., income and wages tax, property tax and sale of property tax), however de facto the effective deployment of this revenue assignment is limited. This could be due to overt control on the deployment of these instruments by higher tiers of government or a lack of awareness of soum/district governments. The latter appears to be the case where the ‘ownership rights’ of all public land is exercised by the soum/district, but de facto there is little realization of the capital revenue potential associated with land ownership.
Bagh/khoroo government
The bagh/khorroo is responsible for the mobilization of the people and the prioritization of capital works projects proposed by the soum/district. De jure the bagh/khoroo budget is negligible, but de facto it does exercise considerable influence over the budget of the soum/district, as it is at the level at which spatial/budget planning is initiated (before it is aggregated up to the central level).
Water Services Regulatory Commission
The Water Service Regulatory Commission (WSRC) is responsible for licensing, defining and arbitrating the water and wastewater tariffs for all major WASH service providers in Mongolia. Tariff recommendations are required by law to be processed by the WSRC within 16 days of receipt
EQUITY IN PUBLIC FINANCING OF WATER, SANITATION & HYGIENE (WASH) MONGOLIA
10
of application, in practice, however, very few of the requests for tariff revisions have been cleared by the Authority for Fair Competition and Consumer Protection (AFCCP). Although the AFCCP is designed to be independent, its position within the Deputy Prime Ministers office means that its decisions are subject to political influence.
The operational costs for four part-time and one full-time staff are fully funded from licenses issued to the 116 service providers, which strengthens the incentives of the WSRC to align with providers requests. The WSRC is designed to be independent but its location under the Ministry of Construction and Urban Development (MCUD) means that its ability to demand tariff revisions is limited.
Service providers
Almost all WASH services in Mongolia are supplied by providers under service agreements with the respective aimag/capital or soum/district government (and in the case of the ger water kiosks, the agreement is with the government-owned provider). In almost all cases, the ownership of water and sanitation assets is retained with the local government.
In most of the urban centres in Mongolia, the provision of water supply and sewerage services is managed by either state/local/mixed government-owned providers through performance contracts. The Government has recently established a central state-owned company (Mongol US) for water resources monitoring and O&M of state-owned water infrastructure. In some areas (i.e., rural water supply, rural waste management and ger area water kiosks), water and sanitation services are provided by private service providers, herder communities and individual households under some form of service agreement with the local government. WASH services with a potential revenue stream are generally engaged through some form of public procurement/auction that seeks to balance quality and price. For wells or water services in remote areas, agreements with herders/communities/families to operate and maintain these facilities is normally undertaken without any licensing fee or tariff.
In some sub-sectors (i.e., education and health, child and mother’s welfare), WASH services from local government-owned assets are managed by delegated budget-holding entities. Although de facto the performance agreement with the responsible manager should ensure the quality and safety of operations and maintenance of WASH facilities, this is not explicitly included in the signed agreement.
2.4 RESPONSIBILITY BY WASH SUBJECTS
Water supply
The responsibility for water supply service delivery is assigned to the soum/district. De facto, this varies greatly and is dependent on the level of urbanization.
For instance, in the heavily urbanized areas of Ulaanbaatar, the district has no responsibility for water supply. This is in contrast to the satellite cities where the district manages all distribution of bulk water purchased from the city, while in the rural areas all aspects of water supply are managed by the district.
Sanitation
The responsibility for sanitation service delivery is assigned to the soum/district however de facto this also varies with the level of urbanization. In Ulaanbaatar, the
district has no role in sewerage, while in the satellite cities the districts manage sewerage collection and are supposed to discharge to the city mains for a fee. The fee-based public service of making available trucks for emptying of on-site septic tanks and discharging into the sewerage system is managed by the city in Ulaanbaatar and the district in satellite areas.
Solid waste
Within Ulaanbaatar city, the collection and transportation of solid waste is undertaken by the district and the management of the solid waste treatment
site is undertaken by the city. The enforcement and collection of penalties for littering are the responsibility of the khoroo, local inspectors are often too busy with other duties to enforce penalties on polluters. In the rural areas and peri-urban areas, the soums that own trucks and dump sites will license the private sector to charge households and collect waste.
Drainage
Within Ulaanbaatar city, the khoroo governor organizes campaigns for cleaning drains, while the district manages the feeder drains. The Capital
City Waste Consortium has responsibility for the management of the major drains and reservoirs. Within the rural areas and small towns there are generally no storm water drainage facilities.
2. INSTITUTIONAL FRAMEWORK AND PUBLIC RESPONSIBILITIES FOR WASH SERVICE
11
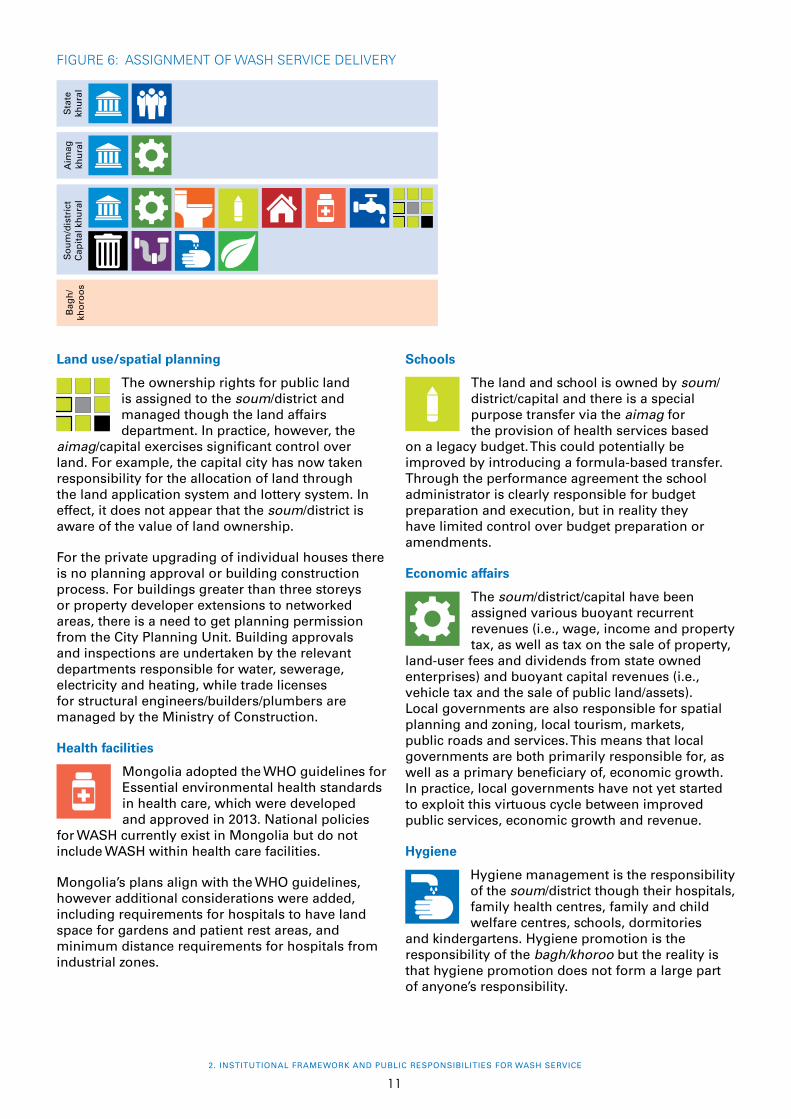
Land use/spatial planning
The ownership rights for public land is assigned to the soum/district and managed though the land affairs department. In practice, however, the
aimag/capital exercises significant control over land. For example, the capital city has now taken responsibility for the allocation of land through the land application system and lottery system. In effect, it does not appear that the soum/district is aware of the value of land ownership.
For the private upgrading of individual houses there is no planning approval or building construction process. For buildings greater than three storeys or property developer extensions to networked areas, there is a need to get planning permission from the City Planning Unit. Building approvals and inspections are undertaken by the relevant departments responsible for water, sewerage, electricity and heating, while trade licenses for structural engineers/builders/plumbers are managed by the Ministry of Construction.
Health facilities
Mongolia adopted the WHO guidelines for Essential environmental health standards in health care, which were developed and approved in 2013. National policies
for WASH currently exist in Mongolia but do not include WASH within health care facilities.
Mongolia’s plans align with the WHO guidelines, however additional considerations were added, including requirements for hospitals to have land space for gardens and patient rest areas, and minimum distance requirements for hospitals from industrial zones.
Schools
The land and school is owned by soum/district/capital and there is a special purpose transfer via the aimag for the provision of health services based
on a legacy budget. This could potentially be improved by introducing a formula-based transfer. Through the performance agreement the school administrator is clearly responsible for budget preparation and execution, but in reality they have limited control over budget preparation or amendments.
Economic affairs
The soum/district/capital have been assigned various buoyant recurrent revenues (i.e., wage, income and property tax, as well as tax on the sale of property,
land-user fees and dividends from state owned enterprises) and buoyant capital revenues (i.e., vehicle tax and the sale of public land/assets). Local governments are also responsible for spatial planning and zoning, local tourism, markets, public roads and services. This means that local governments are both primarily responsible for, as well as a primary beneficiary of, economic growth. In practice, local governments have not yet started to exploit this virtuous cycle between improved public services, economic growth and revenue.
Hygiene
Hygiene management is the responsibility of the soum/district though their hospitals, family health centres, family and child welfare centres, schools, dormitories
and kindergartens. Hygiene promotion is the responsibility of the bagh/khoroo but the reality is that hygiene promotion does not form a large part of anyone’s responsibility.
FIGURE 6: ASSIGNMENT OF WASH SERVICE DELIVERYS
tate
kh
ura
lS
ou
m/d
istr
ict
Cap
ital
kh
ura
lA
imag
kh
ura
lB
agh
/kh
oro
os
EQUITY IN PUBLIC FINANCING OF WATER, SANITATION & HYGIENE (WASH) MONGOLIA
12
USUG
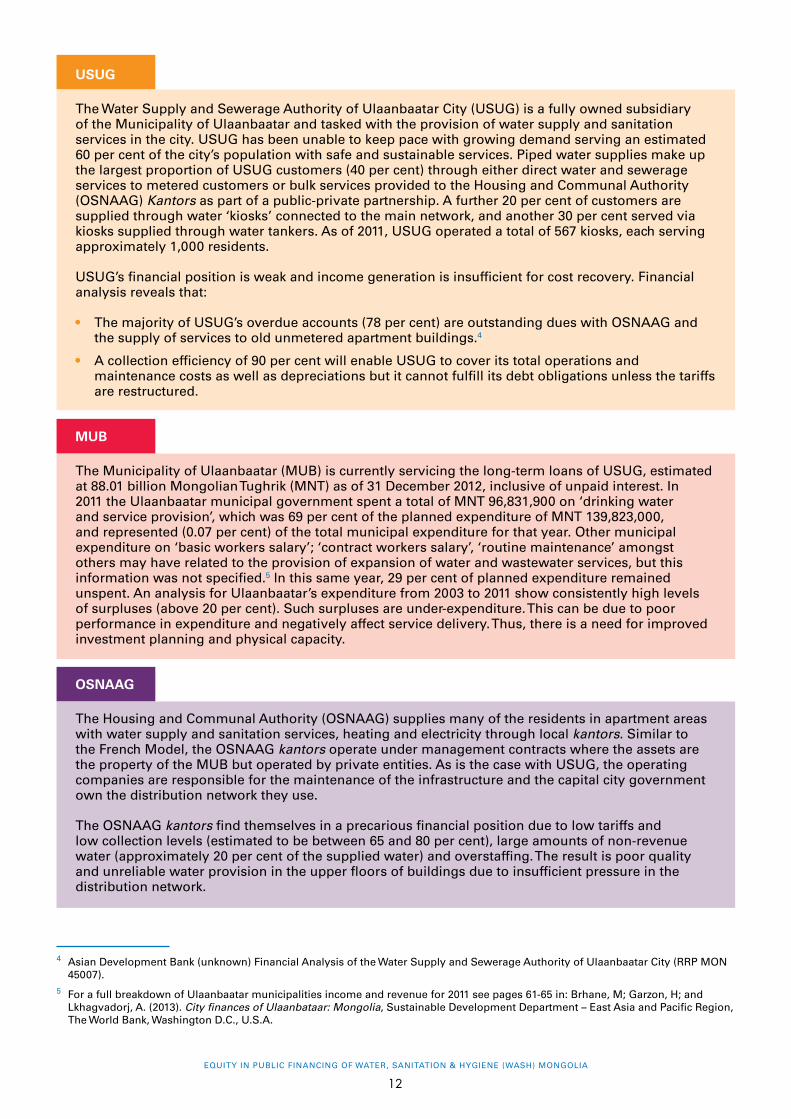
The Water Supply and Sewerage Authority of Ulaanbaatar City (USUG) is a fully owned subsidiary of the Municipality of Ulaanbaatar and tasked with the provision of water supply and sanitation services in the city. USUG has been unable to keep pace with growing demand serving an estimated 60 per cent of the city’s population with safe and sustainable services. Piped water supplies make up the largest proportion of USUG customers (40 per cent) through either direct water and sewerage services to metered customers or bulk services provided to the Housing and Communal Authority (OSNAAG) Kantors as part of a public-private partnership. A further 20 per cent of customers are supplied through water ‘kiosks’ connected to the main network, and another 30 per cent served via kiosks supplied through water tankers. As of 2011, USUG operated a total of 567 kiosks, each serving approximately 1,000 residents.
USUG’s financial position is weak and income generation is insufficient for cost recovery. Financial analysis reveals that:
• The majority of USUG’s overdue accounts (78 per cent) are outstanding dues with OSNAAG and the supply of services to old unmetered apartment buildings.4
• A collection efficiency of 90 per cent will enable USUG to cover its total operations and maintenance costs as well as depreciations but it cannot fulfill its debt obligations unless the tariffs are restructured.
MUB
The Municipality of Ulaanbaatar (MUB) is currently servicing the long-term loans of USUG, estimated at 88.01 billion Mongolian Tughrik (MNT) as of 31 December 2012, inclusive of unpaid interest. In 2011 the Ulaanbaatar municipal government spent a total of MNT 96,831,900 on ‘drinking water and service provision’, which was 69 per cent of the planned expenditure of MNT 139,823,000, and represented (0.07 per cent) of the total municipal expenditure for that year. Other municipal expenditure on ‘basic workers salary’; ‘contract workers salary’, ‘routine maintenance’ amongst others may have related to the provision of expansion of water and wastewater services, but this information was not specified.5 In this same year, 29 per cent of planned expenditure remained unspent. An analysis for Ulaanbaatar’s expenditure from 2003 to 2011 show consistently high levels of surpluses (above 20 per cent). Such surpluses are under-expenditure. This can be due to poor performance in expenditure and negatively affect service delivery. Thus, there is a need for improved investment planning and physical capacity.
OSNAAG
The Housing and Communal Authority (OSNAAG) supplies many of the residents in apartment areas with water supply and sanitation services, heating and electricity through local kantors. Similar to the French Model, the OSNAAG kantors operate under management contracts where the assets are the property of the MUB but operated by private entities. As is the case with USUG, the operating companies are responsible for the maintenance of the infrastructure and the capital city government own the distribution network they use.
The OSNAAG kantors find themselves in a precarious financial position due to low tariffs and low collection levels (estimated to be between 65 and 80 per cent), large amounts of non-revenue water (approximately 20 per cent of the supplied water) and overstaffing. The result is poor quality and unreliable water provision in the upper floors of buildings due to insufficient pressure in the distribution network.
4 Asian Development Bank (unknown) Financial Analysis of the Water Supply and Sewerage Authority of Ulaanbaatar City (RRP MON 45007).
5 For a full breakdown of Ulaanbaatar municipalities income and revenue for 2011 see pages 61-65 in: Brhane, M; Garzon, H; and Lkhagvadorj, A. (2013). City finances of Ulaanbataar: Mongolia, Sustainable Development Department – East Asia and Pacific Region, The World Bank, Washington D.C., U.S.A.
2. INSTITUTIONAL FRAMEWORK AND PUBLIC RESPONSIBILITIES FOR WASH SERVICE
13
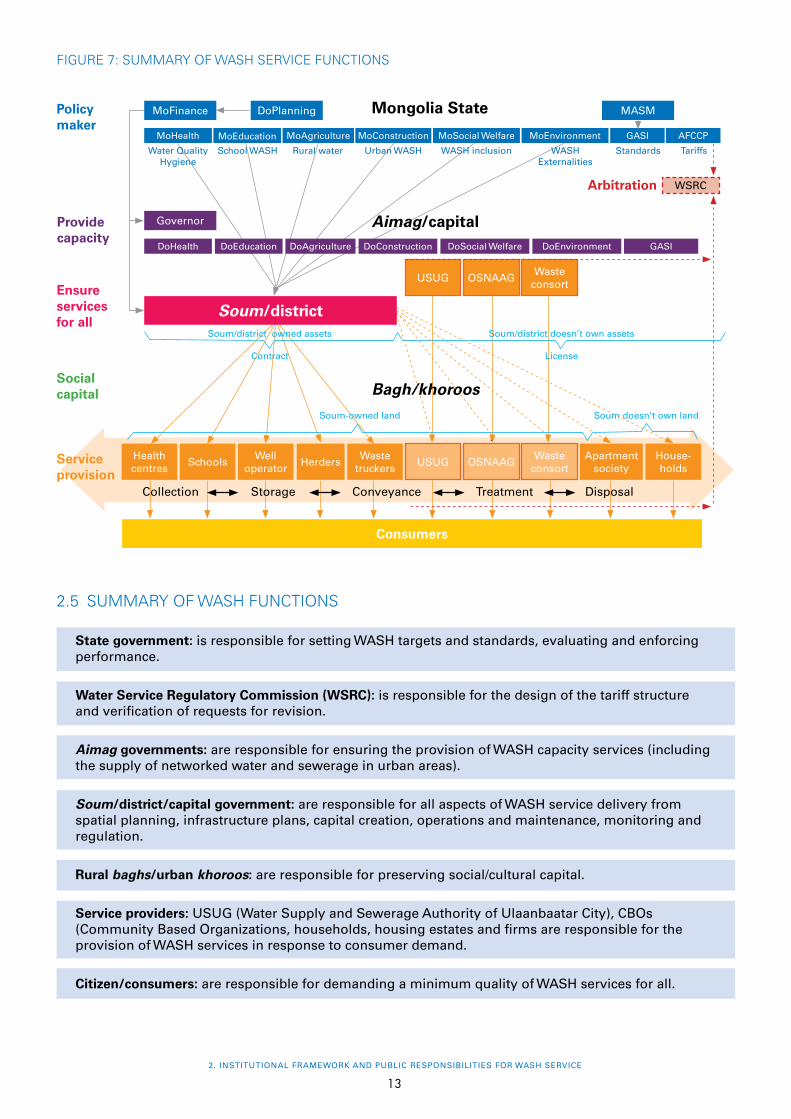
2.5 SUMMARY OF WASH FUNCTIONS
State government: is responsible for setting WASH targets and standards, evaluating and enforcing performance.
Water Service Regulatory Commission (WSRC): is responsible for the design of the tariff structure and verification of requests for revision.
Aimag governments: are responsible for ensuring the provision of WASH capacity services (including the supply of networked water and sewerage in urban areas).
Soum/district/capital government: are responsible for all aspects of WASH service delivery from spatial planning, infrastructure plans, capital creation, operations and maintenance, monitoring and regulation.
Rural baghs/urban khoroos: are responsible for preserving social/cultural capital.
Service providers: USUG (Water Supply and Sewerage Authority of Ulaanbaatar City), CBOs (Community Based Organizations, households, housing estates and firms are responsible for the provision of WASH services in response to consumer demand.
Citizen/consumers: are responsible for demanding a minimum quality of WASH services for all.
FIGURE 7: SUMMARY OF WASH SERVICE FUNCTIONS
Arbitration
Social capital
USUG OSNAAGWaste
consort
Policy maker
Consumers
Ensure services for all
WSRC
Serviceprovision
Health centres
SchoolsWell
operatorHerders
Waste truckers
USUG OSNAAGWaste
consortApartment
societyHouse-holds
Soum doesn’t own land
Collection Storage Conveyance Treatment Disposal
Soum/district owned assets
Contract
Soum/district doesn’t own assets
License
Soum-owned land
Bagh/khoroos
Soum/district
Mongolia StateMoFinance
MoHealth
Water QualityHygiene
School WASH Rural water Urban WASH WASH inclusion Standards TariffsWASH Externalities
MoEducation MoAgriculture MoConstruction MoSocial Welfare MoEnvironment GASI AFCCP
DoPlanning MASM
Aimag/capitalProvide capacity
Governor
DoHealth DoEducation DoAgriculture DoConstruction DoSocial Welfare DoEnvironment GASI
EQUITY IN PUBLIC FINANCING OF WATER, SANITATION & HYGIENE (WASH) MONGOLIA
14
3 WASH FINANCING
The quantitative generation and allocation of budgets to the water and sanitation sector in Mongolia is extremely difficult to identify. This is because the majority of recurrent revenues and expenditures are incurred by providers while the majority of capital expenditures are simply captured as ‘capital works for network infrastructure’. Adopting unified, internationally recognized budgeting, accounting and reporting standards will enable better analysis of revenue and expenditure trends.
3.1 FINANCING FOR WASH INFRASTRUCTURE
Most of the capital revenues for major WASH infrastructure are raised at the central level through the government taxation system and form part of the state budget allocated by ministries (primarily through the MCUD).
Central government ministries are the primary creators of new capital infrastructure in Mongolia.
Over the period from 2002 to 2010, the estimated total water and sanitation-related expenditure represented 2.1 per cent of the total government expenditure. Between 2003 and 2011, the Mongolian government spent an average of US$15 million per year (at the 2010 constant US$ value) on water and sanitation infrastructure and programmes. In comparison, official development assistance (ODA) over the same period was slightly lower at US$12.2 million on average per year. Nearly half (49.9 per cent) of governmental expenditure in the period was focused on large water and sanitation systems (defined as large reticulated water supply systems, sewerage networks and waste treatment facilities), whereas the primary focus of ODA was on ‘basic’ water and sanitation (such as small-scale or point-source/on-site water and sanitation infrastructure). In 2007, only 16 per cent of the state budget that was allocated to water supply and sanitation was directed towards rural areas with 84 per cent towards urban areas. In 2008, this changed to 37 per cent towards rural areas and 63 per cent towards urban areas. The 2008 increase is mainly attributable to an increased budget for the irrigation of pasturelands and agricultural activities.6
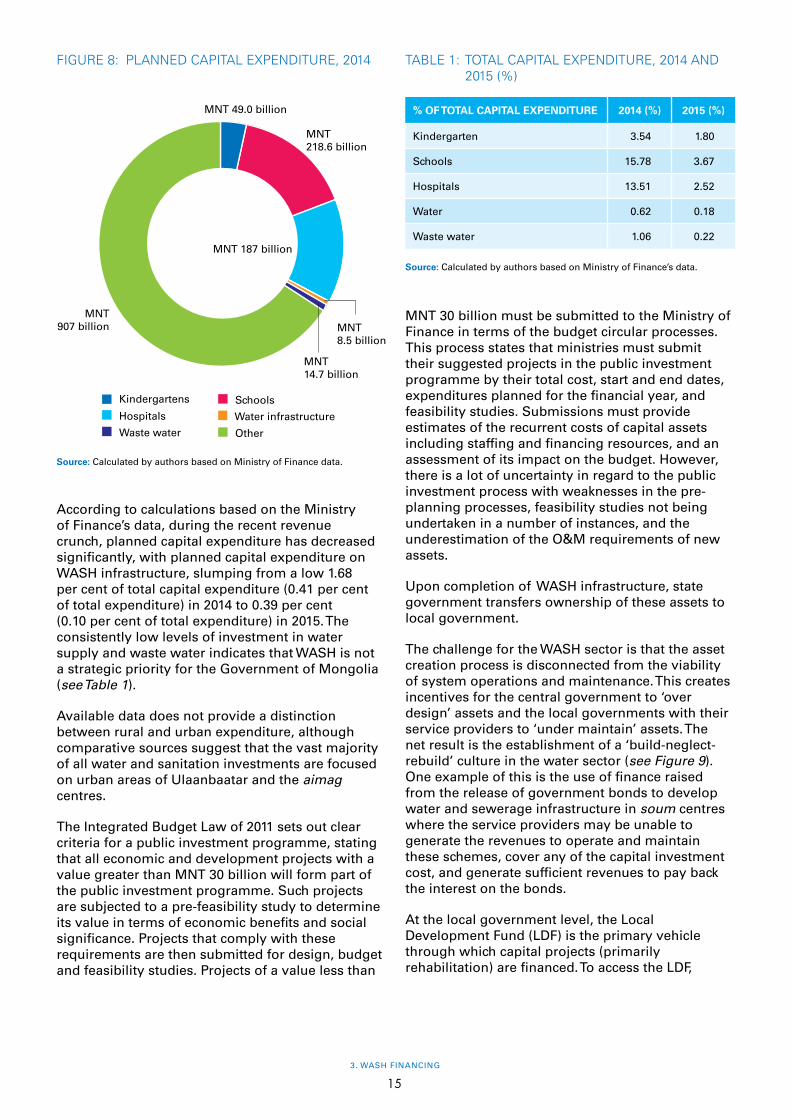
Capital expenditure by the central government amounted to MNT 1.3 billion in 2014. WASH related projects were primarily focussed on water services infrastructure projects amounting to MNT 8.5 billion and wastewater capital expenditure amounting to MNT 14.6 billion (see Figure 8).
For the 2015 financial year, there has been a sharp decrease in capital expenditure. The central government is planning capital expenditure on kindergartens amounting to MNT 17.1 billion; MNT 56 billion on schools; and MNT 38.4 billion on hospitals. This decrease in planned capital expenditure is linked to the sharp decline in available revenue of central government in 2015.
6 UNICEF (2009), Improving Local Service Delivery for the Millennium Development Goals: Rural Water Supply and Sanitation in Mongolia
3. WASH FINANCING
15
According to calculations based on the Ministry of Finance’s data, during the recent revenue crunch, planned capital expenditure has decreased significantly, with planned capital expenditure on WASH infrastructure, slumping from a low 1.68 per cent of total capital expenditure (0.41 per cent of total expenditure) in 2014 to 0.39 per cent (0.10 per cent of total expenditure) in 2015. The consistently low levels of investment in water supply and waste water indicates that WASH is not a strategic priority for the Government of Mongolia (see Table 1).
Available data does not provide a distinction between rural and urban expenditure, although comparative sources suggest that the vast majority of all water and sanitation investments are focused on urban areas of Ulaanbaatar and the aimag centres.
The Integrated Budget Law of 2011 sets out clear criteria for a public investment programme, stating that all economic and development projects with a value greater than MNT 30 billion will form part of the public investment programme. Such projects are subjected to a pre-feasibility study to determine its value in terms of economic benefits and social significance. Projects that comply with these requirements are then submitted for design, budget and feasibility studies. Projects of a value less than
MNT 30 billion must be submitted to the Ministry of Finance in terms of the budget circular processes. This process states that ministries must submit their suggested projects in the public investment programme by their total cost, start and end dates, expenditures planned for the financial year, and feasibility studies. Submissions must provide estimates of the recurrent costs of capital assets including staffing and financing resources, and an assessment of its impact on the budget. However, there is a lot of uncertainty in regard to the public investment process with weaknesses in the pre-planning processes, feasibility studies not being undertaken in a number of instances, and the underestimation of the O&M requirements of new assets.
Upon completion of WASH infrastructure, state government transfers ownership of these assets to local government.
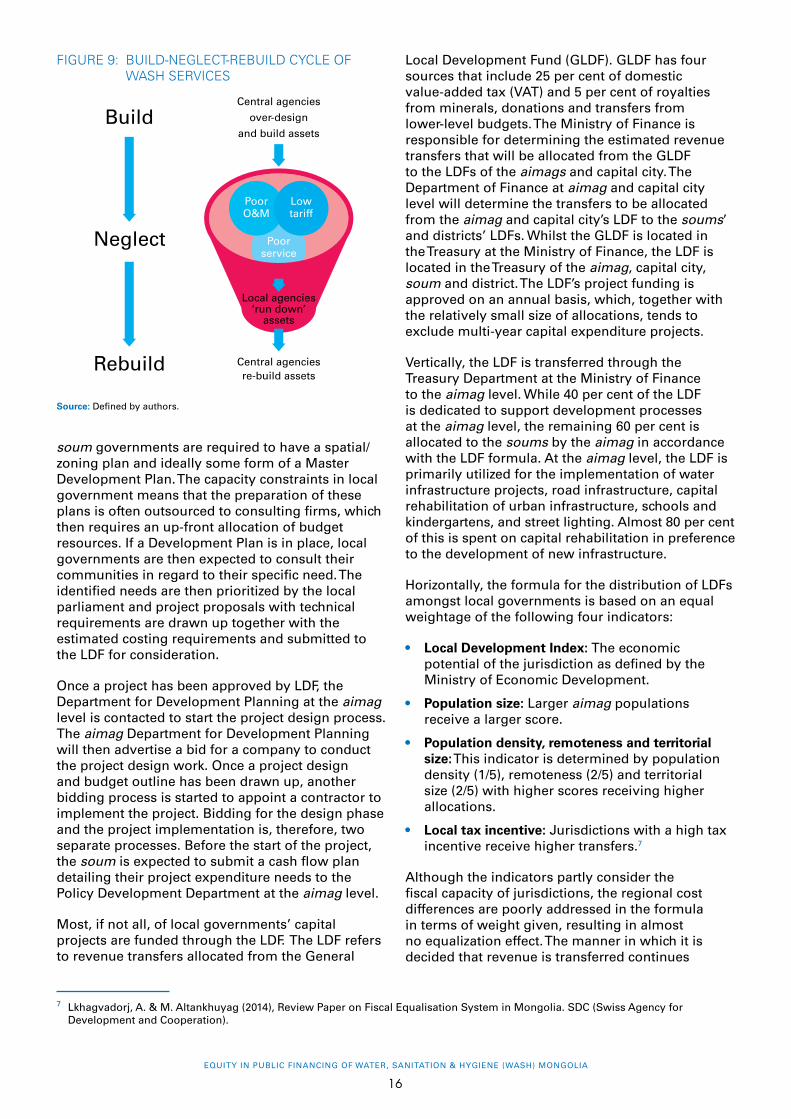
The challenge for the WASH sector is that the asset creation process is disconnected from the viability of system operations and maintenance. This creates incentives for the central government to ‘over design’ assets and the local governments with their service providers to ‘under maintain’ assets. The net result is the establishment of a ‘build-neglect-rebuild’ culture in the water sector (see Figure 9). One example of this is the use of finance raised from the release of government bonds to develop water and sewerage infrastructure in soum centres where the service providers may be unable to generate the revenues to operate and maintain these schemes, cover any of the capital investment cost, and generate sufficient revenues to pay back the interest on the bonds.
At the local government level, the Local Development Fund (LDF) is the primary vehicle through which capital projects (primarily rehabilitation) are financed. To access the LDF,
FIGURE 8: PLANNED CAPITAL EXPENDITURE, 2014
Source: Calculated by authors based on Ministry of Finance data.
Kindergartens Schools
Hospitals Water infrastructure
OtherWaste water
MNT 49.0 billion
MNT 8.5 billion
MNT 14.7 billion
MNT 218.6 billion
MNT 187 billion
MNT 907 billion
TABLE 1: TOTAL CAPITAL EXPENDITURE, 2014 AND 2015 (%)
Source: Calculated by authors based on Ministry of Finance’s data.
% OF TOTAL CAPITAL EXPENDITURE 2014 (%) 2015 (%)
Kindergarten 3.54 1.80
Schools 15.78 3.67
Hospitals 13.51 2.52
Water 0.62 0.18
Waste water 1.06 0.22
EQUITY IN PUBLIC FINANCING OF WATER, SANITATION & HYGIENE (WASH) MONGOLIA
16
soum governments are required to have a spatial/zoning plan and ideally some form of a Master Development Plan. The capacity constraints in local government means that the preparation of these plans is often outsourced to consulting firms, which then requires an up-front allocation of budget resources. If a Development Plan is in place, local governments are then expected to consult their communities in regard to their specific need. The identified needs are then prioritized by the local parliament and project proposals with technical requirements are drawn up together with the estimated costing requirements and submitted to the LDF for consideration.
Once a project has been approved by LDF, the Department for Development Planning at the aimag level is contacted to start the project design process. The aimag Department for Development Planning will then advertise a bid for a company to conduct the project design work. Once a project design and budget outline has been drawn up, another bidding process is started to appoint a contractor to implement the project. Bidding for the design phase and the project implementation is, therefore, two separate processes. Before the start of the project, the soum is expected to submit a cash flow plan detailing their project expenditure needs to the Policy Development Department at the aimag level.
Most, if not all, of local governments’ capital projects are funded through the LDF. The LDF refers to revenue transfers allocated from the General
Central agencies
over-design
and build assets
Poor service
Central agencies re-build assets
Poor O&M
Local agencies ‘run down’
assets
Low tariff
Local Development Fund (GLDF). GLDF has four sources that include 25 per cent of domestic value-added tax (VAT) and 5 per cent of royalties from minerals, donations and transfers from lower-level budgets. The Ministry of Finance is responsible for determining the estimated revenue transfers that will be allocated from the GLDF to the LDFs of the aimags and capital city. The Department of Finance at aimag and capital city level will determine the transfers to be allocated from the aimag and capital city’s LDF to the soums’ and districts’ LDFs. Whilst the GLDF is located in the Treasury at the Ministry of Finance, the LDF is located in the Treasury of the aimag, capital city, soum and district. The LDF’s project funding is approved on an annual basis, which, together with the relatively small size of allocations, tends to exclude multi-year capital expenditure projects.
Vertically, the LDF is transferred through the Treasury Department at the Ministry of Finance to the aimag level. While 40 per cent of the LDF is dedicated to support development processes at the aimag level, the remaining 60 per cent is allocated to the soums by the aimag in accordance with the LDF formula. At the aimag level, the LDF is primarily utilized for the implementation of water infrastructure projects, road infrastructure, capital rehabilitation of urban infrastructure, schools and kindergartens, and street lighting. Almost 80 per cent of this is spent on capital rehabilitation in preference to the development of new infrastructure.
Horizontally, the formula for the distribution of LDFs amongst local governments is based on an equal weightage of the following four indicators:
• Local Development Index: The economic potential of the jurisdiction as defined by the Ministry of Economic Development.
• Population size: Larger aimag populations receive a larger score.
• Population density, remoteness and territorial size: This indicator is determined by population density (1/5), remoteness (2/5) and territorial size (2/5) with higher scores receiving higher allocations.
• Local tax incentive: Jurisdictions with a high tax incentive receive higher transfers.7
Although the indicators partly consider the fiscal capacity of jurisdictions, the regional cost differences are poorly addressed in the formula in terms of weight given, resulting in almost no equalization effect. The manner in which it is decided that revenue is transferred continues
FIGURE 9: BUILD-NEGLECT-REBUILD CYCLE OF WASH SERVICES
Source: Defined by authors.
Build
Neglect
Rebuild
7 Lkhagvadorj, A. & M. Altankhuyag (2014), Review Paper on Fiscal Equalisation System in Mongolia. SDC (Swiss Agency for Development and Cooperation).
3. WASH FINANCING
17
to be ad hoc. This lack of revenue predictability undermines public investment planning processes. In practice this means that once parliament has approved the medium-term fiscal framework, city and district councils approves or in effect rubber-stamps the budget without any process of budget interrogation. Increasing revenue collection effort by the local government is also discouraged under the present system, as the central government has the right to capture any additional revenue collected.
At the soum level, the LDF is primarily utilized to fund projects for the rehabilitation of wells, the establishment of green spaces and other urban development projects. Revenue transfers are made on a monthly basis and, in theory, in accordance with the monthly and quarterly cash-flow plan estimates submitted by aimags and the capital city to central government, and by soums and districts to aimags and the capital city.
The introduction of LDF (block grants to local governments) has increased capital revenues at the local level that appear to have localized the costs (i.e., trade-offs) as well as the benefits of new WASH asset creation.
These transfers, while welcome, are insufficient to fund the capital expenditure liabilities for the WASH sector and other sectors for which the soum/district are responsible. Other potential local sources of capital revenue for soums/districts (i.e., land sale, property development) have tended to be captured by higher tiers of government.
However, while intergovernmental transfers can increase capital revenues for WASH expansion, and while local governments have their own various buoyant revenue sources, it is preferable if the revenues for capital creation are driven off a revenue surplus from the provision of existing WASH services. This is because O&M viability is probably the most important determinant of efficient asset creation in the WASH sector.
The local government’s budget allocates only minimal capital expenditure for the upgrading of WASH capital assets or for minor capital works. As the LDF allocations are insufficient to deal with major WASH capital works, expenditure at this level focuses on the installation of remote manual wells, motorized water wells in small centres and, in a few cases, small networked water systems.
Calculations based on LDF allocations to Dundgobi province in 2014 indicate that, of the total MNT 4 billion, MNT 1.3 billion was spent on water related projects. Based on the criteria for the use of the LDF, these projects would primarily be for the capital refurbishment of existing water infrastructure.
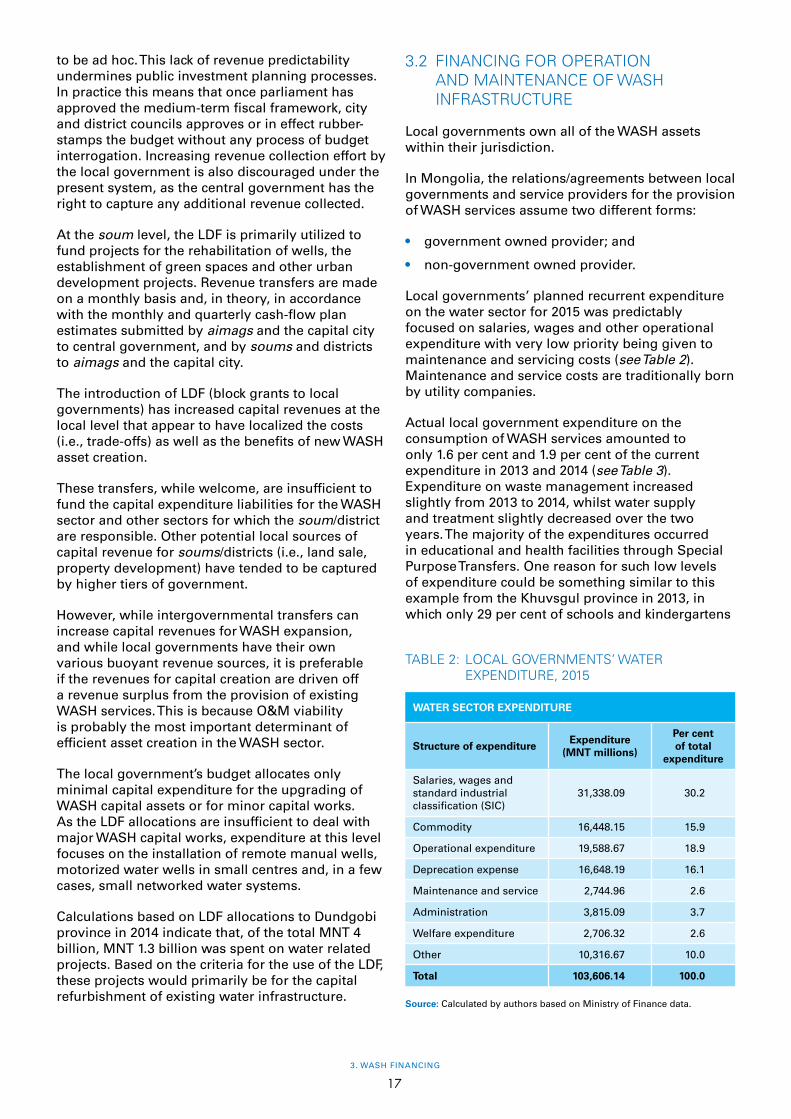
TABLE 2: LOCAL GOVERNMENTS’ WATER EXPENDITURE, 2015
3.2 FINANCING FOR OPERATION AND MAINTENANCE OF WASH INFRASTRUCTURE
Local governments own all of the WASH assets within their jurisdiction.
In Mongolia, the relations/agreements between local governments and service providers for the provision of WASH services assume two different forms:
• government owned provider; and
• non-government owned provider.
Local governments’ planned recurrent expenditure on the water sector for 2015 was predictably focused on salaries, wages and other operational expenditure with very low priority being given to maintenance and servicing costs (see Table 2). Maintenance and service costs are traditionally born by utility companies.
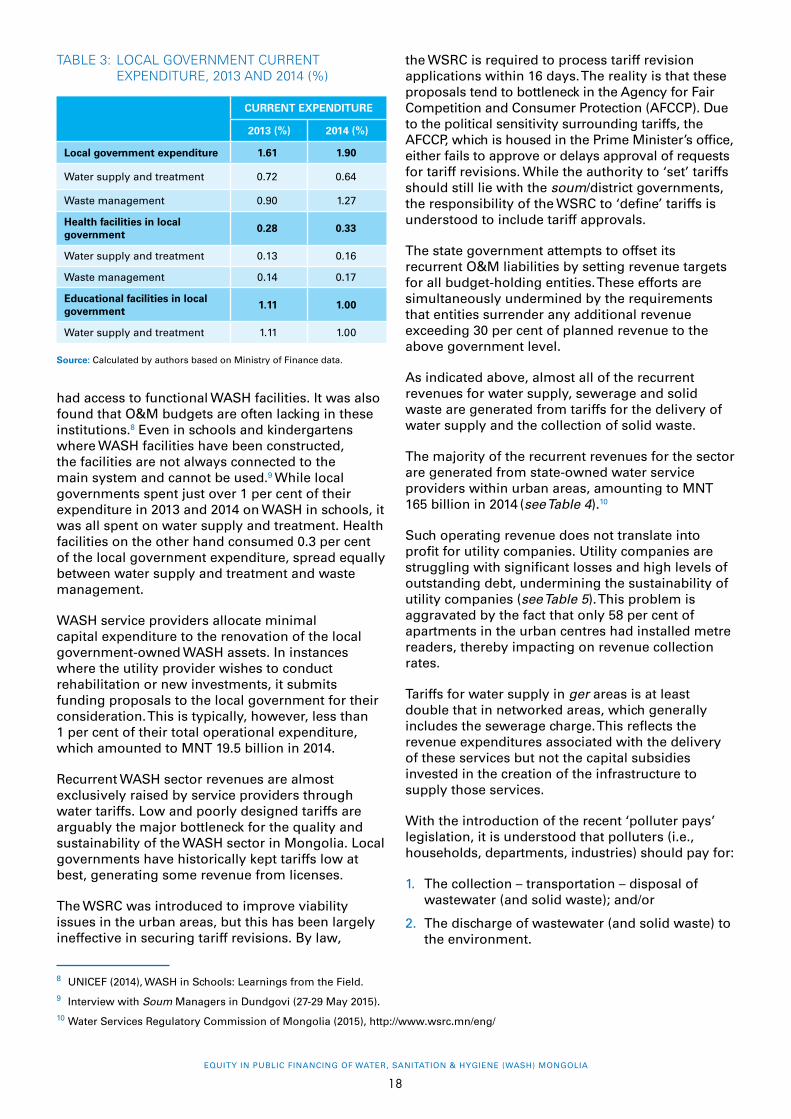
Actual local government expenditure on the consumption of WASH services amounted to only 1.6 per cent and 1.9 per cent of the current expenditure in 2013 and 2014 (see Table 3). Expenditure on waste management increased slightly from 2013 to 2014, whilst water supply and treatment slightly decreased over the two years. The majority of the expenditures occurred in educational and health facilities through Special Purpose Transfers. One reason for such low levels of expenditure could be something similar to this example from the Khuvsgul province in 2013, in which only 29 per cent of schools and kindergartens
Source: Calculated by authors based on Ministry of Finance data.
WATER SECTOR EXPENDITURE
Structure of expenditureExpenditure
(MNT millions)
Per cent of total
expenditure
Salaries, wages and standard industrial classification (SIC)
31,338.09 30.2
Commodity 16,448.15 15.9
Operational expenditure 19,588.67 18.9
Deprecation expense 16,648.19 16.1
Maintenance and service 2,744.96 2.6
Administration 3,815.09 3.7
Welfare expenditure 2,706.32 2.6
Other 10,316.67 10.0
Total 103,606.14 100.0
EQUITY IN PUBLIC FINANCING OF WATER, SANITATION & HYGIENE (WASH) MONGOLIA
18
had access to functional WASH facilities. It was also found that O&M budgets are often lacking in these institutions.8 Even in schools and kindergartens where WASH facilities have been constructed, the facilities are not always connected to the main system and cannot be used.9 While local governments spent just over 1 per cent of their expenditure in 2013 and 2014 on WASH in schools, it was all spent on water supply and treatment. Health facilities on the other hand consumed 0.3 per cent of the local government expenditure, spread equally between water supply and treatment and waste management.
WASH service providers allocate minimal capital expenditure to the renovation of the local government-owned WASH assets. In instances where the utility provider wishes to conduct rehabilitation or new investments, it submits funding proposals to the local government for their consideration. This is typically, however, less than 1 per cent of their total operational expenditure, which amounted to MNT 19.5 billion in 2014.
Recurrent WASH sector revenues are almost exclusively raised by service providers through water tariffs. Low and poorly designed tariffs are arguably the major bottleneck for the quality and sustainability of the WASH sector in Mongolia. Local governments have historically kept tariffs low at best, generating some revenue from licenses.
The WSRC was introduced to improve viability issues in the urban areas, but this has been largely ineffective in securing tariff revisions. By law,
TABLE 3: LOCAL GOVERNMENT CURRENT EXPENDITURE, 2013 AND 2014 (%)
Source: Calculated by authors based on Ministry of Finance data.
the WSRC is required to process tariff revision applications within 16 days. The reality is that these proposals tend to bottleneck in the Agency for Fair Competition and Consumer Protection (AFCCP). Due to the political sensitivity surrounding tariffs, the AFCCP, which is housed in the Prime Minister’s office, either fails to approve or delays approval of requests for tariff revisions. While the authority to ‘set’ tariffs should still lie with the soum/district governments, the responsibility of the WSRC to ‘define’ tariffs is understood to include tariff approvals.
The state government attempts to offset its recurrent O&M liabilities by setting revenue targets for all budget-holding entities. These efforts are simultaneously undermined by the requirements that entities surrender any additional revenue exceeding 30 per cent of planned revenue to the above government level.
As indicated above, almost all of the recurrent revenues for water supply, sewerage and solid waste are generated from tariffs for the delivery of water supply and the collection of solid waste.
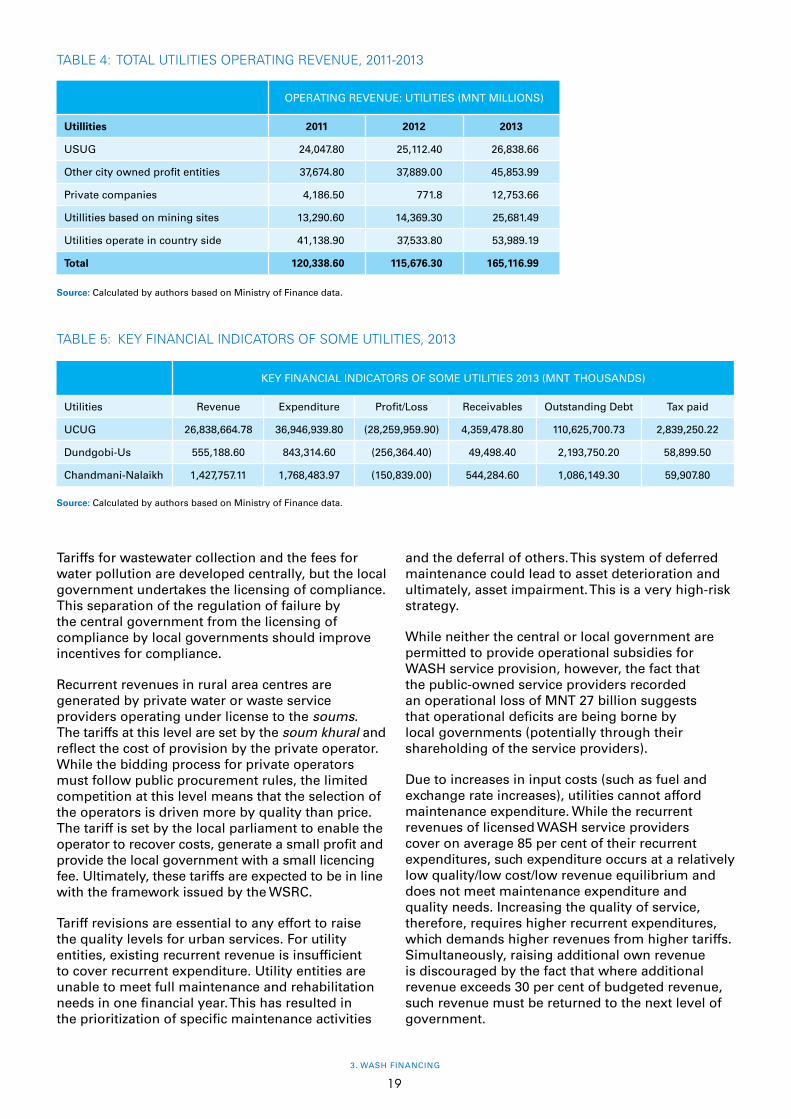
The majority of the recurrent revenues for the sector are generated from state-owned water service providers within urban areas, amounting to MNT 165 billion in 2014 (see Table 4).10
Such operating revenue does not translate into profit for utility companies. Utility companies are struggling with significant losses and high levels of outstanding debt, undermining the sustainability of utility companies (see Table 5). This problem is aggravated by the fact that only 58 per cent of apartments in the urban centres had installed metre readers, thereby impacting on revenue collection rates.
Tariffs for water supply in ger areas is at least double that in networked areas, which generally includes the sewerage charge. This reflects the revenue expenditures associated with the delivery of these services but not the capital subsidies invested in the creation of the infrastructure to supply those services.
With the introduction of the recent ‘polluter pays’ legislation, it is understood that polluters (i.e., households, departments, industries) should pay for:
1. The collection – transportation – disposal of wastewater (and solid waste); and/or
2. The discharge of wastewater (and solid waste) to the environment.
CURRENT EXPENDITURE
2013 (%) 2014 (%)
Local government expenditure 1.61 1.90
Water supply and treatment 0.72 0.64
Waste management 0.90 1.27
Health facilities in localgovernment
0.28 0.33
Water supply and treatment 0.13 0.16
Waste management 0.14 0.17
Educational facilities in localgovernment
1.11 1.00
Water supply and treatment 1.11 1.00
8 UNICEF (2014), WASH in Schools: Learnings from the Field. 9 Interview with Soum Managers in Dundgovi (27-29 May 2015).10 Water Services Regulatory Commission of Mongolia (2015), http://www.wsrc.mn/eng/
3. WASH FINANCING
19
Tariffs for wastewater collection and the fees for water pollution are developed centrally, but the local government undertakes the licensing of compliance. This separation of the regulation of failure by the central government from the licensing of compliance by local governments should improve incentives for compliance.
Recurrent revenues in rural area centres are generated by private water or waste service providers operating under license to the soums. The tariffs at this level are set by the soum khural and reflect the cost of provision by the private operator. While the bidding process for private operators must follow public procurement rules, the limited competition at this level means that the selection of the operators is driven more by quality than price. The tariff is set by the local parliament to enable the operator to recover costs, generate a small profit and provide the local government with a small licencing fee. Ultimately, these tariffs are expected to be in line with the framework issued by the WSRC.
Tariff revisions are essential to any effort to raise the quality levels for urban services. For utility entities, existing recurrent revenue is insufficient to cover recurrent expenditure. Utility entities are unable to meet full maintenance and rehabilitation needs in one financial year. This has resulted in the prioritization of specific maintenance activities
and the deferral of others. This system of deferred maintenance could lead to asset deterioration and ultimately, asset impairment. This is a very high-risk strategy.
While neither the central or local government are permitted to provide operational subsidies for WASH service provision, however, the fact that the public-owned service providers recorded an operational loss of MNT 27 billion suggests that operational deficits are being borne by local governments (potentially through their shareholding of the service providers).
Due to increases in input costs (such as fuel and exchange rate increases), utilities cannot afford maintenance expenditure. While the recurrent revenues of licensed WASH service providers cover on average 85 per cent of their recurrent expenditures, such expenditure occurs at a relatively low quality/low cost/low revenue equilibrium and does not meet maintenance expenditure and quality needs. Increasing the quality of service, therefore, requires higher recurrent expenditures, which demands higher revenues from higher tariffs. Simultaneously, raising additional own revenue is discouraged by the fact that where additional revenue exceeds 30 per cent of budgeted revenue, such revenue must be returned to the next level of government.
TABLE 4: TOTAL UTILITIES OPERATING REVENUE, 2011-2013
TABLE 5: KEY FINANCIAL INDICATORS OF SOME UTILITIES, 2013
Source: Calculated by authors based on Ministry of Finance data.
Source: Calculated by authors based on Ministry of Finance data.
OPERATING REVENUE: UTILITIES (MNT MILLIONS)
Utillities 2011 2012 2013
USUG 24,047.80 25,112.40 26,838.66
Other city owned profit entities 37,674.80 37,889.00 45,853.99
Private companies 4,186.50 771.8 12,753.66
Utillities based on mining sites 13,290.60 14,369.30 25,681.49
Utilities operate in country side 41,138.90 37,533.80 53,989.19
Total 120,338.60 115,676.30 165,116.99
KEY FINANCIAL INDICATORS OF SOME UTILITIES 2013 (MNT THOUSANDS)
Utilities Revenue Expenditure Profit/Loss Receivables Outstanding Debt Tax paid
UCUG 26,838,664.78 36,946,939.80 (28,259,959.90) 4,359,478.80 110,625,700.73 2,839,250.22
Dundgobi-Us 555,188.60 843,314.60 (256,364.40) 49,498.40 2,193,750.20 58,899.50
Chandmani-Nalaikh 1,427,757.11 1,768,483.97 (150,839.00) 544,284.60 1,086,149.30 59,907.80

EQUITY IN PUBLIC FINANCING OF WATER, SANITATION & HYGIENE (WASH) MONGOLIA
20
44.1 PUBLIC SECTOR BUDGET MANAGEMENT
The financial year in Mongolia runs from 1 January to 31 December. An annual budget cycle consists of a strategic planning, budget preparation, budget implementation, reporting and monitoring, as well as an audit and evaluation phase (see Figure 10).
Planning
There is currently no real linkage between the National Development Strategy and the budget.11 The strategic importance placed on the WASH sector, therefore, has not been reflected in the planned capital expenditure for water supply and wastewater. As a result, water and wastewater capital expenditures only amounted to around 2 per cent of the total capital expenditure by the central government in 2015. In terms of strategic planning, the focus at local government level appears to be predominantly on spatial and master planning, as this is a pre-requisite for accessing the LDF.
WASH FINANCING
FIGURE 10: BUDGET CYCLE
11 Government of Mongolia (2008) Millennium Development Goals-based Comprehensive National Development Strategy of Mongolia.
Source: Defined by authors.
Planning
Budget preparation
Budget implementation
Monitoring accounting and
reporting
Auditing and evaluation

4. PUBLIC SECTOR FINANCIAL MANAGEMENT
21
Budget preparation
The budget is formulated in terms of programmes, activities and economic classification; however, there is no discernible linkage between these different formats. The programme classification system is not based on genuine programmes (formulated around strategic objectives), but, in fact, is a reflection of government functions. In its current format, the programmes and the government’s performance against these programmes are neither a true reflection of performance towards the achievement of strategic objectives as determined by the National Development Strategy, nor an accurate reflection of government expenditure.
A World Bank study on the finances of the Ulaanbaatar city government found that the current budgeting format has a number of weaknesses that hamper decision-making in the provision of services.12 For example, expenditures linked with operation and maintenance of public services were difficult to discern in the budget. Where such expenditure is incurred by local government-owned utilities and the data is not reflected in any budget documentation, the World Bank report proposed the following:
• Expenditures associated with the operation and maintenance of public services should be reported separately from general administration costs to enable the costs of providing specific services to be known. When these services are supplied indirectly through local service companies (as is the case with water and wastewater), these expenditures should be reported in the budget annex.
• The budget should draw a clear distinction between human resource costs associated with administration and those associated with service provision. This is in line with the programme budgeting principle of attributing costs to services.
• All inter-governmental fiscal transfers to local and municipal governments should be captured in the budget.
• The budgeting system should also specify which districts (soums) are benefitting from investments in public services by the city (aimag) government.
Budget implementation
Budgets submitted by local governments do not appear to correlate with the budgets agreed by the aimag government and approved by the central government. In many cases, service provision units
are left with the responsibility to bridge the public expenditure deficit by trying to either cut costs or identify additional revenue sources.
In terms of budget implementation, revenue transfers are made on a monthly basis. These transfers are supposed to be made based on the monthly and quarterly cash flow estimates submitted by soums to aimags, and the aimags to the central government, but in reality these transfers are based on the division of the budget into 12 equal monthly instalments.
Monitoring and reporting
The Integrated Budget Law states that monthly budget execution reports must be prepared by aimag governments; whilst soum treasuries must prepare and submit semi-annual budget execution reports and consolidated financial statements. Educational and health facilities submit monthly expenditure reports to the Department of Budget at the aimag level, which are consolidated and submitted to central government.
Audit and evaluation
The state audit body conducts annual audits based on the end-of-year budget execution reports and financial statements. General budget governors have also been given particular internal auditing responsibilities.
4.2 PROGRAMME BUDGETING
The Government of Mongolia started piloting programme budgeting with a small number of ministries in the 2008 budget, with a plan to expand this to all ministries by 2016. This process has been delayed but plans are underway to roll out programme budgeting within three ministries in 2016.
The current national budget programme structure (along with sub-programmes and activities) is not linked with the priorities the government identified in the long-term National Development Strategy. In other words, the programme budget structure should link the strategic goals of the government with its detailed operational budgets, but this link is broken.
In the current structure, each identified programme has outcomes and outputs but these are not linked to the budget. The budget is currently still approved at an input level by the parliament and specific-purpose grants are allocated on an input
12 Brhane, M; Garzon, H; & A. Lkhagvadorj. (2013), City finances of Ulaanbataar: Mongolia, Sustainable Development Department – East Asia and Pacific Region, The World Bank, Washington D.C., U.S.A.
EQUITY IN PUBLIC FINANCING OF WATER, SANITATION & HYGIENE (WASH) MONGOLIA
22
basis leaving the governor with little managerial discretion.13 While programme budgeting seeks to increase local accountability for results and autonomy over inputs, the current centralized control over inputs needs to be reduced as local accountability for results increases. Urgent attention is also needed in aligning the programme outcomes and outputs to the budget.
Budget-holding entities
In Mongolia, all budget entities function as service delivery units of the local government. All budget entities are expected to prepare their annual budget requests, which are then submitted to the appropriate provincial government department. Provincial departments consolidate all budget requests and then submit these to the respective sector ministries. Sector ministries in turn consolidate all provincial budget requests and present them to the Ministry of Finance. The Ministry of Finance allocates funds to each of the budget entities through the specific sectors. Funds are controlled by the budget entity and disbursed through regional treasury offices.
Public-sector accounting
The Ministry of Finance has recently undergone a process to align the budget and accounting codes with international standards. It is expected that the process to align accounting codes to a new programme budgeting approach will facilitate easier comparisons between budget and accounting data. This process is still ongoing.
Currently, the accounting codes do not allow for a detailed level assessment of expenditure. While each budget-holding unit has a unique code, the accounting system in not sufficiently layered by type, economic classification or activity to enable the accounts to be filtered by level.
At the local level, the accounting staff have been recently centralized to the soum office from the various budget-holding entities. This is intended to strengthen the oversight of the soum over the standardization of accounting processes across budget-holding units, and reduce the influence of ministries over the accounts.
13 Interview with Soum Managers in Dundgovi (27th of May – 29th of May 2015).
5. RECOMMENDATIONS
23
5 RECOMMENDATIONS
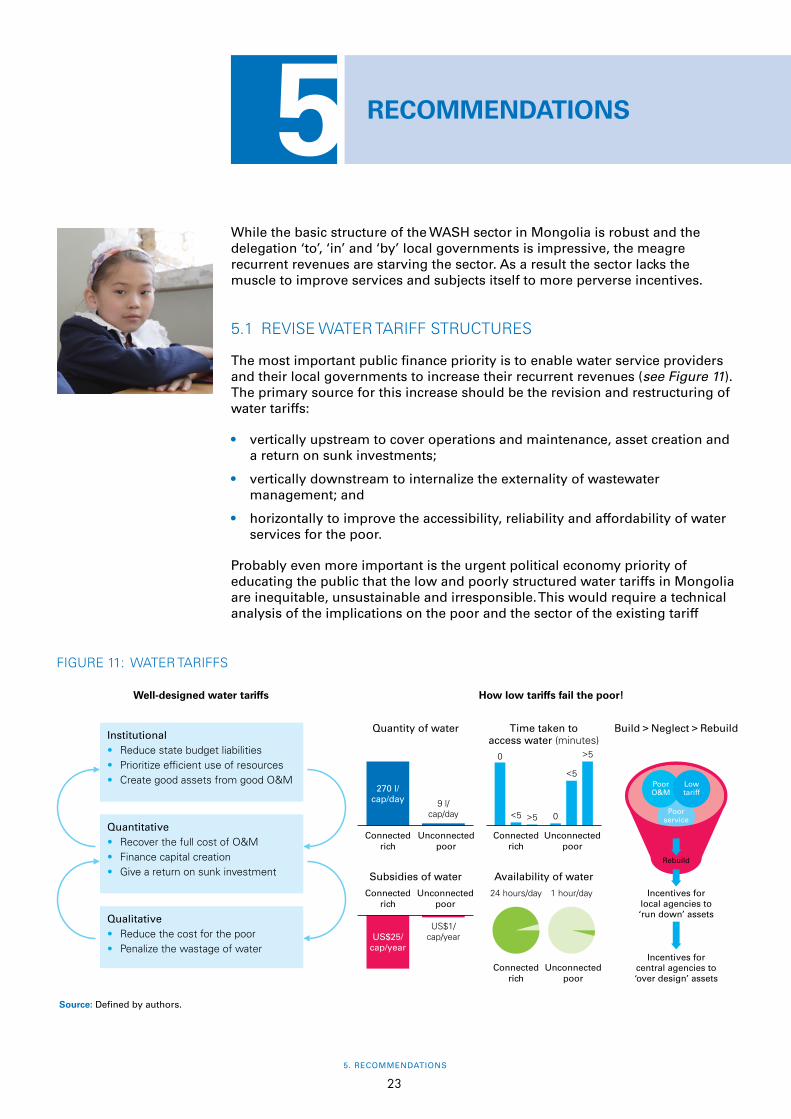
While the basic structure of the WASH sector in Mongolia is robust and the delegation ‘to’, ‘in’ and ‘by’ local governments is impressive, the meagre recurrent revenues are starving the sector. As a result the sector lacks the muscle to improve services and subjects itself to more perverse incentives.
5.1 REVISE WATER TARIFF STRUCTURES
The most important public finance priority is to enable water service providers and their local governments to increase their recurrent revenues (see Figure 11). The primary source for this increase should be the revision and restructuring of water tariffs:
• vertically upstream to cover operations and maintenance, asset creation and a return on sunk investments;
• vertically downstream to internalize the externality of wastewater management; and
• horizontally to improve the accessibility, reliability and affordability of water services for the poor.
Probably even more important is the urgent political economy priority of educating the public that the low and poorly structured water tariffs in Mongolia are inequitable, unsustainable and irresponsible. This would require a technical analysis of the implications on the poor and the sector of the existing tariff
FIGURE 11: WATER TARIFFS
Source: Defined by authors.
Well-designed water tariffs
Institutional• Reduce state budget liabilities• Prioritize efficient use of resources• Create good assets from good O&M
Quantitative• Recover the full cost of O&M• Finance capital creation• Give a return on sunk investment
Qualitative• Reduce the cost for the poor• Penalize the wastage of water
How low tariffs fail the poor!
Quantity of water
Connected rich
Unconnected poor
270 l/ cap/day 9 l/
cap/day
Subsidies of water
Connected rich
Unconnected poor
US$25/ cap/year
US$1/ cap/year
Time taken to access water (minutes)
Connected rich
Unconnected poor
0
<5 >5 0
<5
>5
Availability of water
Connected rich
Unconnected poor
24 hours/day 1 hour/day
Build > Neglect > Rebuild
Poor service
Incentives for local agencies to ‘run down’ assets
Poor O&M
Rebuild
Low tariff
Incentives for central agencies to ‘over design’ assets
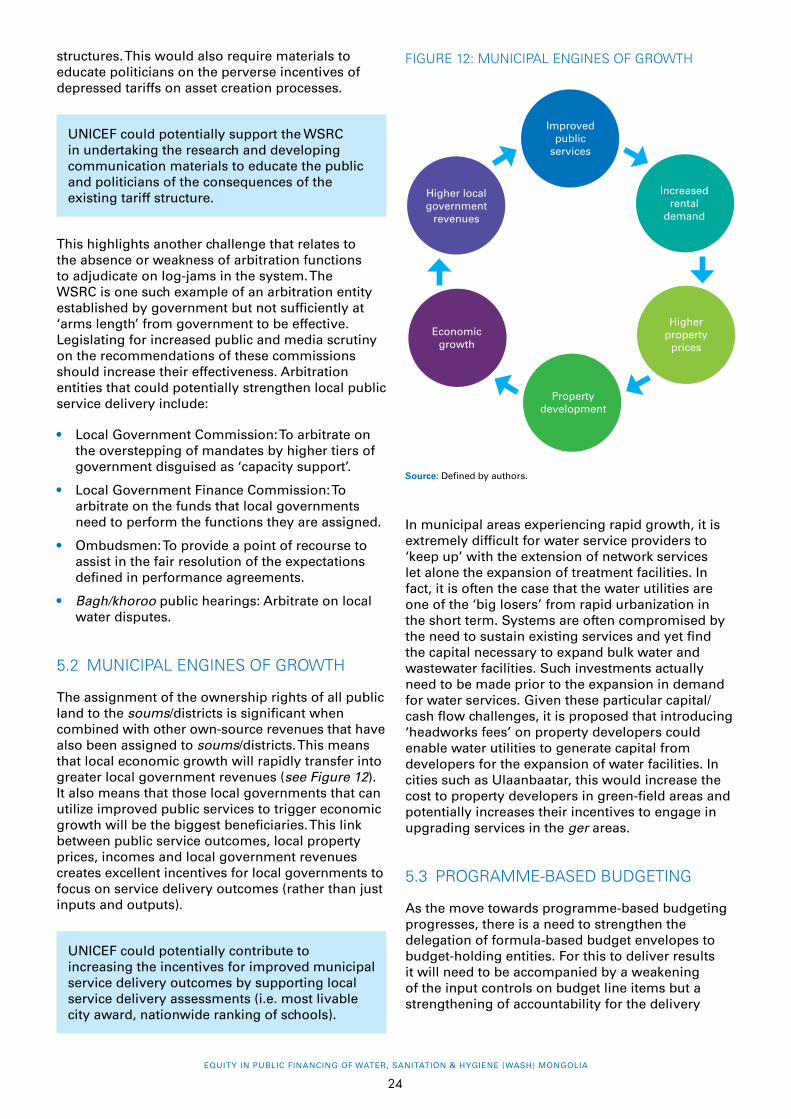
EQUITY IN PUBLIC FINANCING OF WATER, SANITATION & HYGIENE (WASH) MONGOLIA
24
structures. This would also require materials to educate politicians on the perverse incentives of depressed tariffs on asset creation processes.
UNICEF could potentially support the WSRC in undertaking the research and developing communication materials to educate the public and politicians of the consequences of the existing tariff structure.
This highlights another challenge that relates to the absence or weakness of arbitration functions to adjudicate on log-jams in the system. The WSRC is one such example of an arbitration entity established by government but not sufficiently at ‘arms length’ from government to be effective. Legislating for increased public and media scrutiny on the recommendations of these commissions should increase their effectiveness. Arbitration entities that could potentially strengthen local public service delivery include:
• Local Government Commission: To arbitrate on the overstepping of mandates by higher tiers of government disguised as ‘capacity support’.
• Local Government Finance Commission: To arbitrate on the funds that local governments need to perform the functions they are assigned.
• Ombudsmen: To provide a point of recourse to assist in the fair resolution of the expectations defined in performance agreements.
• Bagh/khoroo public hearings: Arbitrate on local water disputes.
5.2 MUNICIPAL ENGINES OF GROWTH
The assignment of the ownership rights of all public land to the soums/districts is significant when combined with other own-source revenues that have also been assigned to soums/districts. This means that local economic growth will rapidly transfer into greater local government revenues (see Figure 12). It also means that those local governments that can utilize improved public services to trigger economic growth will be the biggest beneficiaries. This link between public service outcomes, local property prices, incomes and local government revenues creates excellent incentives for local governments to focus on service delivery outcomes (rather than just inputs and outputs).
UNICEF could potentially contribute to increasing the incentives for improved municipal service delivery outcomes by supporting local service delivery assessments (i.e. most livable city award, nationwide ranking of schools).
FIGURE 12: MUNICIPAL ENGINES OF GROWTH
Source: Defined by authors.
Improved public
services
Increased rental
demand
Higher property
prices
Property development
Economic growth
Higher local government
revenues
In municipal areas experiencing rapid growth, it is extremely difficult for water service providers to ‘keep up’ with the extension of network services let alone the expansion of treatment facilities. In fact, it is often the case that the water utilities are one of the ‘big losers’ from rapid urbanization in the short term. Systems are often compromised by the need to sustain existing services and yet find the capital necessary to expand bulk water and wastewater facilities. Such investments actually need to be made prior to the expansion in demand for water services. Given these particular capital/cash flow challenges, it is proposed that introducing ‘headworks fees’ on property developers could enable water utilities to generate capital from developers for the expansion of water facilities. In cities such as Ulaanbaatar, this would increase the cost to property developers in green-field areas and potentially increases their incentives to engage in upgrading services in the ger areas.
5.3 PROGRAMME-BASED BUDGETING
As the move towards programme-based budgeting progresses, there is a need to strengthen the delegation of formula-based budget envelopes to budget-holding entities. For this to deliver results it will need to be accompanied by a weakening of the input controls on budget line items but a strengthening of accountability for the delivery
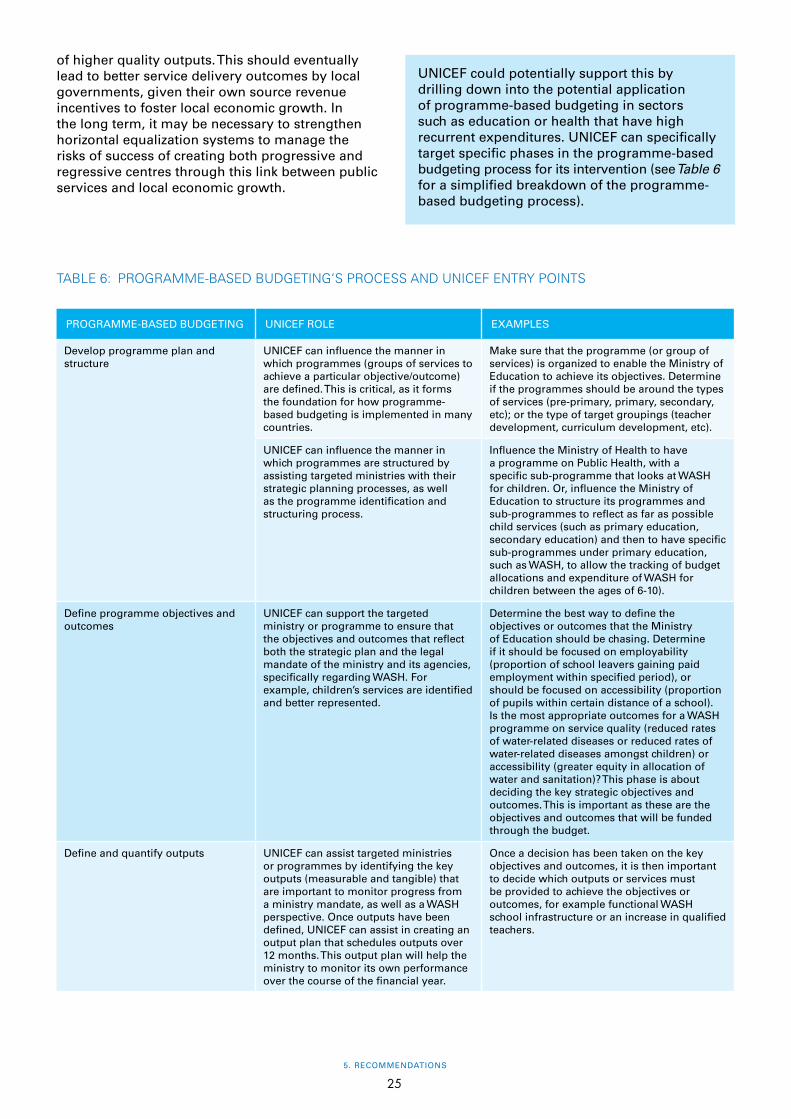
5. RECOMMENDATIONS
25
of higher quality outputs. This should eventually lead to better service delivery outcomes by local governments, given their own source revenue incentives to foster local economic growth. In the long term, it may be necessary to strengthen horizontal equalization systems to manage the risks of success of creating both progressive and regressive centres through this link between public services and local economic growth.
TABLE 6: PROGRAMME-BASED BUDGETING’S PROCESS AND UNICEF ENTRY POINTS
PROGRAMME-BASED BUDGETING UNICEF ROLE EXAMPLES
Develop programme plan and structure
UNICEF can influence the manner in which programmes (groups of services to achieve a particular objective/outcome) are defined. This is critical, as it forms the foundation for how programme-based budgeting is implemented in many countries.
Make sure that the programme (or group of services) is organized to enable the Ministry of Education to achieve its objectives. Determine if the programmes should be around the types of services (pre-primary, primary, secondary, etc); or the type of target groupings (teacher development, curriculum development, etc).
UNICEF can influence the manner in which programmes are structured by assisting targeted ministries with their strategic planning processes, as well as the programme identification and structuring process.
Influence the Ministry of Health to have a programme on Public Health, with a specific sub-programme that looks at WASH for children. Or, influence the Ministry of Education to structure its programmes and sub-programmes to reflect as far as possible child services (such as primary education, secondary education) and then to have specific sub-programmes under primary education, such as WASH, to allow the tracking of budget allocations and expenditure of WASH for children between the ages of 6-10).
Define programme objectives and outcomes
UNICEF can support the targeted ministry or programme to ensure that the objectives and outcomes that reflect both the strategic plan and the legal mandate of the ministry and its agencies, specifically regarding WASH. For example, children’s services are identified and better represented.
Determine the best way to define the objectives or outcomes that the Ministry of Education should be chasing. Determine if it should be focused on employability (proportion of school leavers gaining paid employment within specified period), or should be focused on accessibility (proportion of pupils within certain distance of a school). Is the most appropriate outcomes for a WASH programme on service quality (reduced rates of water-related diseases or reduced rates of water-related diseases amongst children) or accessibility (greater equity in allocation of water and sanitation)? This phase is about deciding the key strategic objectives and outcomes. This is important as these are the objectives and outcomes that will be funded through the budget.
Define and quantify outputs UNICEF can assist targeted ministries or programmes by identifying the key outputs (measurable and tangible) that are important to monitor progress from a ministry mandate, as well as a WASH perspective. Once outputs have been defined, UNICEF can assist in creating an output plan that schedules outputs over 12 months. This output plan will help the ministry to monitor its own performance over the course of the financial year.
Once a decision has been taken on the key objectives and outcomes, it is then important to decide which outputs or services must be provided to achieve the objectives or outcomes, for example functional WASH school infrastructure or an increase in qualified teachers.
UNICEF could potentially support this by drilling down into the potential application of programme-based budgeting in sectors such as education or health that have high recurrent expenditures. UNICEF can specifically target specific phases in the programme-based budgeting process for its intervention (see Table 6 for a simplified breakdown of the programme-based budgeting process).
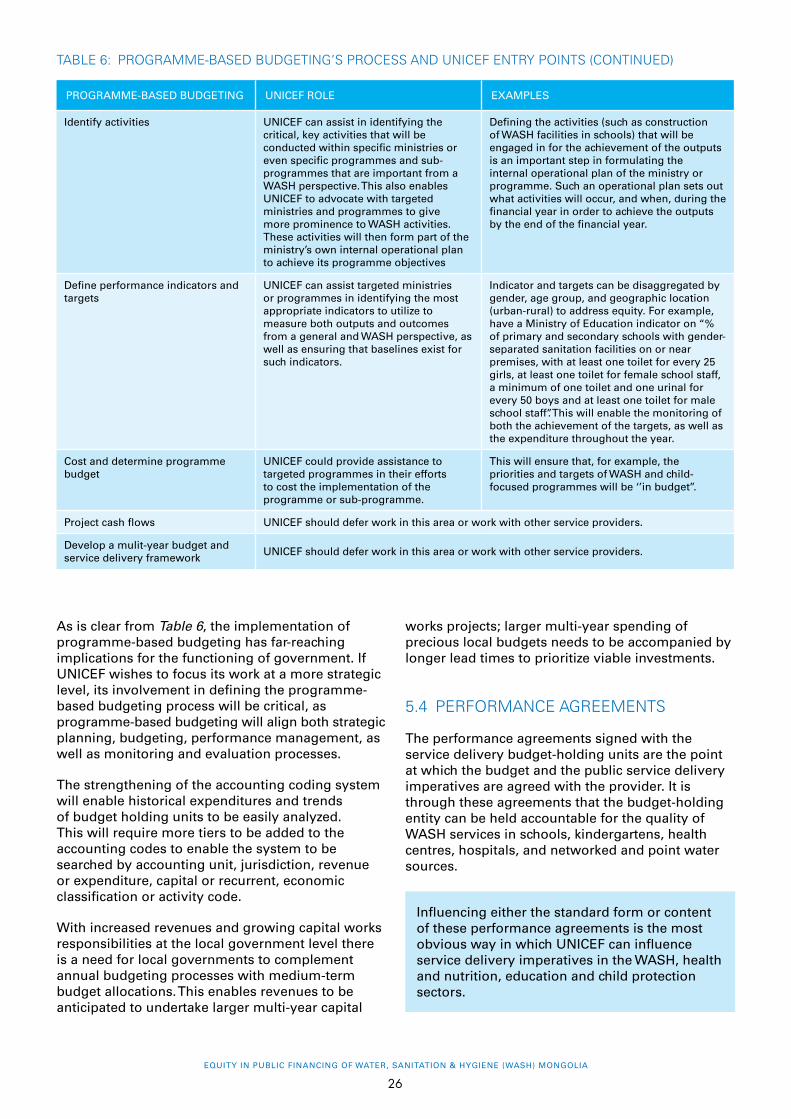
EQUITY IN PUBLIC FINANCING OF WATER, SANITATION & HYGIENE (WASH) MONGOLIA
26
As is clear from Table 6, the implementation of programme-based budgeting has far-reaching implications for the functioning of government. If UNICEF wishes to focus its work at a more strategic level, its involvement in defining the programme-based budgeting process will be critical, as programme-based budgeting will align both strategic planning, budgeting, performance management, as well as monitoring and evaluation processes.
The strengthening of the accounting coding system will enable historical expenditures and trends of budget holding units to be easily analyzed. This will require more tiers to be added to the accounting codes to enable the system to be searched by accounting unit, jurisdiction, revenue or expenditure, capital or recurrent, economic classification or activity code.
With increased revenues and growing capital works responsibilities at the local government level there is a need for local governments to complement annual budgeting processes with medium-term budget allocations. This enables revenues to be anticipated to undertake larger multi-year capital
works projects; larger multi-year spending of precious local budgets needs to be accompanied by longer lead times to prioritize viable investments.
5.4 PERFORMANCE AGREEMENTS
The performance agreements signed with the service delivery budget-holding units are the point at which the budget and the public service delivery imperatives are agreed with the provider. It is through these agreements that the budget-holding entity can be held accountable for the quality of WASH services in schools, kindergartens, health centres, hospitals, and networked and point water sources.
Influencing either the standard form or content of these performance agreements is the most obvious way in which UNICEF can influence service delivery imperatives in the WASH, health and nutrition, education and child protection sectors.
PROGRAMME-BASED BUDGETING UNICEF ROLE EXAMPLES
Identify activities UNICEF can assist in identifying the critical, key activities that will be conducted within specific ministries or even specific programmes and sub-programmes that are important from a WASH perspective. This also enables UNICEF to advocate with targeted ministries and programmes to give more prominence to WASH activities. These activities will then form part of the ministry’s own internal operational plan to achieve its programme objectives
Defining the activities (such as construction of WASH facilities in schools) that will be engaged in for the achievement of the outputs is an important step in formulating the internal operational plan of the ministry or programme. Such an operational plan sets out what activities will occur, and when, during the financial year in order to achieve the outputs by the end of the financial year.
Define performance indicators and targets
UNICEF can assist targeted ministries or programmes in identifying the most appropriate indicators to utilize to measure both outputs and outcomes from a general and WASH perspective, as well as ensuring that baselines exist for such indicators.
Indicator and targets can be disaggregated by gender, age group, and geographic location (urban-rural) to address equity. For example, have a Ministry of Education indicator on “% of primary and secondary schools with gender-separated sanitation facilities on or near premises, with at least one toilet for every 25 girls, at least one toilet for female school staff, a minimum of one toilet and one urinal for every 50 boys and at least one toilet for male school staff”. This will enable the monitoring of both the achievement of the targets, as well as the expenditure throughout the year.
Cost and determine programme budget
UNICEF could provide assistance to targeted programmes in their efforts to cost the implementation of the programme or sub-programme.
This will ensure that, for example, the priorities and targets of WASH and child-focused programmes will be ‘’in budget’’.
Project cash flows UNICEF should defer work in this area or work with other service providers.
Develop a mulit-year budget and service delivery framework
UNICEF should defer work in this area or work with other service providers.
TABLE 6: PROGRAMME-BASED BUDGETING’S PROCESS AND UNICEF ENTRY POINTS (CONTINUED)
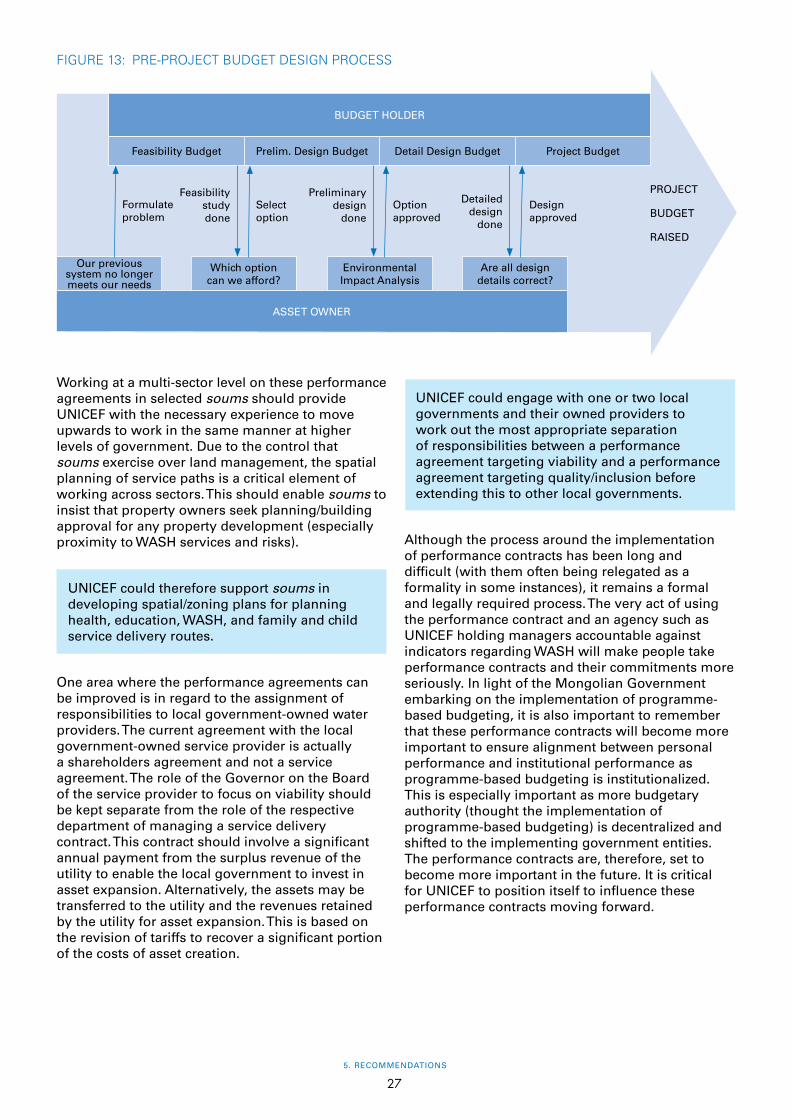
5. RECOMMENDATIONS
27
Working at a multi-sector level on these performance agreements in selected soums should provide UNICEF with the necessary experience to move upwards to work in the same manner at higher levels of government. Due to the control that soums exercise over land management, the spatial planning of service paths is a critical element of working across sectors. This should enable soums to insist that property owners seek planning/building approval for any property development (especially proximity to WASH services and risks).
UNICEF could therefore support soums in developing spatial/zoning plans for planning health, education, WASH, and family and child service delivery routes.
One area where the performance agreements can be improved is in regard to the assignment of responsibilities to local government-owned water providers. The current agreement with the local government-owned service provider is actually a shareholders agreement and not a service agreement. The role of the Governor on the Board of the service provider to focus on viability should be kept separate from the role of the respective department of managing a service delivery contract. This contract should involve a significant annual payment from the surplus revenue of the utility to enable the local government to invest in asset expansion. Alternatively, the assets may be transferred to the utility and the revenues retained by the utility for asset expansion. This is based on the revision of tariffs to recover a significant portion of the costs of asset creation.
FIGURE 13: PRE-PROJECT BUDGET DESIGN PROCESS
BUDGET HOLDER
Feasibility Budget Detail Design BudgetPrelim. Design Budget Project Budget
Our previous system no longer meets our needs
Which option can we afford?
Environmental Impact Analysis
Are all design details correct?
ASSET OWNER
Formulate problem
Select option
Option approved
Design approved
PROJECT
BUDGET
RAISED
Detaileddesign
done
Preliminary design
done
Feasibility study done
UNICEF could engage with one or two local governments and their owned providers to work out the most appropriate separation of responsibilities between a performance agreement targeting viability and a performance agreement targeting quality/inclusion before extending this to other local governments.
Although the process around the implementation of performance contracts has been long and difficult (with them often being relegated as a formality in some instances), it remains a formal and legally required process. The very act of using the performance contract and an agency such as UNICEF holding managers accountable against indicators regarding WASH will make people take performance contracts and their commitments more seriously. In light of the Mongolian Government embarking on the implementation of programme-based budgeting, it is also important to remember that these performance contracts will become more important to ensure alignment between personal performance and institutional performance as programme-based budgeting is institutionalized. This is especially important as more budgetary authority (thought the implementation of programme-based budgeting) is decentralized and shifted to the implementing government entities. The performance contracts are, therefore, set to become more important in the future. It is critical for UNICEF to position itself to influence these performance contracts moving forward.
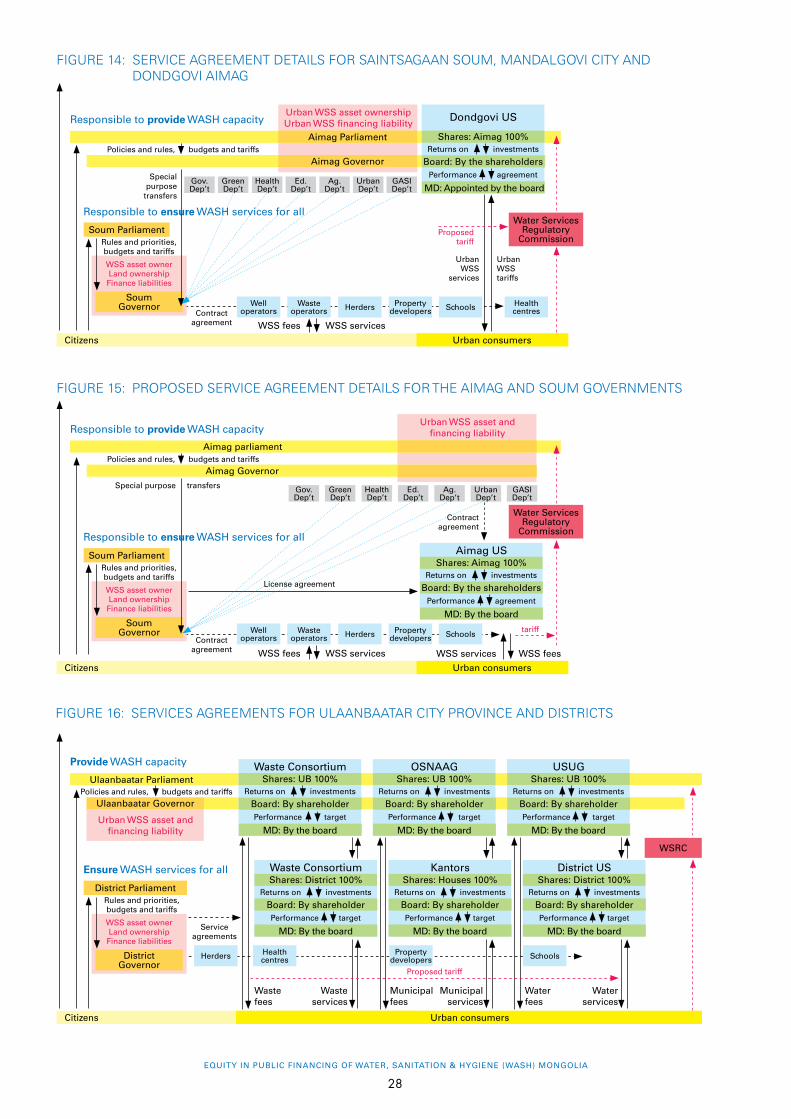
EQUITY IN PUBLIC FINANCING OF WATER, SANITATION & HYGIENE (WASH) MONGOLIA
28
FIGURE 14: SERVICE AGREEMENT DETAILS FOR SAINTSAGAAN SOUM, MANDALGOVI CITY AND DONDGOVI AIMAG
FIGURE 15: PROPOSED SERVICE AGREEMENT DETAILS FOR THE AIMAG AND SOUM GOVERNMENTS
Urban WSS asset ownershipUrban WSS financing liability
Gov.Dep’t
GreenDep’t
Health Dep’t
Ed.Dep’t
Ag. Dep’t
UrbanDep’t
GASIDep’t
Water Services Regulatory
Commission
Well operators
Wasteoperators Herders Property
developers Schools Health centres
Responsible to provide WASH capacity
Policies and rules, budgets and tariffs
Aimag Parliament
Special purpose
transfers
Soum Parliament
Soum Governor
Rules and priorities,budgets and tariffs
WSS asset ownerLand ownership Finance liabilities
Dondgovi US
Shares: Aimag 100%Returns on investments
Performance agreement
Board: By the shareholders
MD: Appointed by the board
Aimag Governor
Citizens Urban consumers
WSS fees WSS services
Proposedtariff
Contractagreement
Urban WSS
services
Urban WSS tariffs
Responsible to ensure WASH services for all
Urban WSS asset andfinancing liability
Gov.Dep’t
GreenDep’t
Health Dep’t
Ed.Dep’t
Ag. Dep’t
UrbanDep’t
GASIDep’t
Water Services Regulatory
Commission
Well operators
Wasteoperators Herders Property
developers Schools
Responsible to provide WASH capacity
Policies and rules, budgets and tariffs
Aimag parliament
Special purpose transfers
Soum Parliament
Soum Governor
Rules and priorities,budgets and tariffs
WSS asset ownerLand ownership Finance liabilities
Aimag USShares: Aimag 100%
Returns on investments
Performance agreement
Board: By the shareholders
MD: By the board
Aimag Governor
Citizens Urban consumers
WSS fees WSS services WSS services WSS fees
tariffContract
agreement
License agreement
Contractagreement
Responsible to ensure WASH services for all
FIGURE 16: SERVICES AGREEMENTS FOR ULAANBAATAR CITY PROVINCE AND DISTRICTS
WSRC
Health centresHerders Property
developers Schools
Provide WASH capacity
Policies and rules, budgets and tariffsUlaanbaatar Parliament
District Parliament
DistrictGovernor
Rules and priorities,budgets and tariffs
WSS asset ownerLand ownership Finance liabilities
Citizens Urban consumers
Proposed tariff
Service agreements
Ensure WASH services for all
Ulaanbaatar Governor
Urban WSS asset andfinancing liability
Waste ConsortiumShares: District 100%
Returns on investments
Performance target
Board: By shareholder
MD: By the board
OSNAAGShares: UB 100%
Returns on investments
Performance target
Board: By shareholder
MD: By the board
KantorsShares: Houses 100%
Returns on investments
Performance target
Board: By shareholder
MD: By the board
USUGShares: UB 100%
Returns on investments
Performance target
Board: By shareholder
MD: By the board
District USShares: District 100%
Returns on investments
Performance target
Board: By shareholder
MD: By the board
Waste fees
Municipal fees
Water fees
Waste services
Municipal services
Water services
Waste ConsortiumShares: UB 100%
Returns on investments
Performance target
Board: By shareholder
MD: By the board
5. RECOMMENDATIONS
29
Service agreement details
The performance agreement that local governments sign with their 100-per-cent-owned service providers is actually a shareholder agreement. This shareholder agreement is driving both the service delivery targets and viability imperatives for the service provider. The role that local government plays in trying to manage these two diverse imperatives through a single agreement has the effect of strengthening the incentives for political patronage, which tends to drive down tariffs and subsequently the quality of services.
Ideally, the viability imperatives driven through the performance contract of the CEO with the Board, based on shareholding representation, should be kept separate from the public service delivery imperatives driven through the performance contract with the respective department (see Figures 14 and 15). The performance contract should set the service levels and the revenue targets for the providers to enable the asset owner (i.e., the aimag) to invest in capital expansion. This also means that the tariffs set by the WSRC should be sufficient to cover the full cost of service provision (i.e., O&M and asset creation). Any losses or dividends reside with the aimag as the owner of the provider through the shareholding agreement. When an aimag-owned urban service provider performs a soum function using aimag-owned assets on soum-owned land, the authority to do so needs to be delegated by the soum to the aimag through a license agreement.
Service agreements in Ulaanbaatar province
The provision of WASH services within Ulaanbaatar is de jure the responsibility of the districts who exercise ownership rights over land and WASH assets. However, de facto within the city centre, the Ulaanbaatar aimag exercises ownership of the major urban WASH service providers (i.e., USUG, OSNAAG, Waste Consortium) and the major urban WASH assets. There are also districts which own urban WASH providers and WASH assets which have bulk purchase agreements with the Ulaanbaatar-owned providers. The health centres and schools are owned by Ulaanbaatar city, but the service agreement for the provision of services is signed with the district. Tariffs are set by the WSRC by different providers (see Figure 16).
Given the prospective financial viability of water supply and waste management services, it is suggested that institutional viability will be better served by transferring asset ownership rights and financing liabilities to the local government-owned service providers. This will require tariffs to be set at a level that enables the providers to recover the full cost of service delivery. This includes the full cost of operation and maintenance, including capital investments in new assets, plus a return on sunk investments to the respective local government (see Figure 17).
FIGURE 17: PROPOSED SERVICE AGREEMENTS FOR ULAANBAATAR CITY PROVINCE AND DISTRICTS
PlanDep’t
GASIDep’t
Health Dep’t
Health Dep’t
Ed.Dep’t
Green Dep’t Social Dep’t Urban Dep’t WSRC
Health centresHerders Property
developers Schools
Provide WASH capacity
Policies and rules, budgets and tariffsAimag Parliament
District Parliament
DistrictGovernor
Rules and priorities,budgets and tariffs
WSS asset ownerLand ownership Finance liabilities
Citizens Urban consumers
Service agreements
Licenseagreements
Ensure WASH services for all
Aimag Governor
Urban waste assets and finance liability
Waste ConsortShares: UB / District
Returns on investments
Performance target
Board: By shareholder
MD: By the board
Urban waste assets and finance liability
OSNAAGShares: UB 100%
Returns on investments
Performance target
Board: By shareholder
MD: By the board
Urban waste assets and finance liability
USShares: UB/District
Returns on investments
Performance target
Board: By shareholder
MD: By the board
Proposed tariff
Waste fees
Municipal fees
Returns on sunk investments
Water fees
Waste services
Municipal services
License agreements
Water services
EQUITY IN PUBLIC FINANCING OF WATER, SANITATION & HYGIENE (WASH) MONGOLIA
30
ANNEX
References
ADB, Financial Analysis of the Water Supply and Sewerage Authority of Ulaanbaatar City (RRP MON 45007)
Bock, F. ACF (2014), Water Supply, Sanitation and Hygiene in Mongolia, An Institutional Analysis
Brhane M. Garzon H. and Lkhagvadorj A. The World Bank (2013). City finances of Ulaanbataar
Government of Mongolia (2008) Millennium Development Goals based Comprehensive National Development Strategy of Mongolia
Government of Mongolia (2011) Integrated Budget Law. The State News
Lkhagvadorj A. and Altankhuyag M. Swiss Development Cooperation (2014), Review Paper on Fiscal Equalisation Sytem in Mongolia.
Sigel, K (2012), Urban water supply and sanitation in Mongolia: A description of the political, legal, and institutional framework
The World Bank (2009), Consolidating the Gains, Managing the Booms and Busts and Moving to Better Service Delivery: A Public Expenditure and Financial Management Review
The World Bank (2010), Enhancing Policies and Practices for Ger Area Developments in Ulaanbataar
UN WATER (2011) UN Water Country Brief: Mongolia
UNDP (2010) Country Sector Assessments: UNDP GOAL WASH Programme, Volume 2 (Mongolia case study)
UNDP (2013) Improving Water and Sanitation Services in Mongolia
UNDP (2013), Mongolia national sector assessment
UNDP Dasandorj D. & Singh S. (2008), Local service delivery: RWSS in Mongolia
UNICEF & UNDP (2009), Improving Local Service Delivery for the Millennium Development Goals, Rural Water Supply and Sanitation in Mongolia
UNICEF (2009) Improving Local Service Delivery for the Millennium Development Goals: Rural Water Supply and Sanitation in Mongolia.
UNICEF (2009), Improving Local Service Delivery for the Millennium Development Goals: Rural Water Supply and Sanitation in Mongolia.
UNICEF (2010) Mongolia Multiple Indicator Cluster Survey, Child Development 2010
UNICEF (2011), Economic Impacts of Sanitation in Mongolia, A Country Study under the Economics of Sanitation Initiative (ESI)
UNICEF (2014), WASH in Schools: Learnings from the Field 2014
WHO and UNICEF (2013) Joint Monitoring Programme for Water Supply and Sanitation

UNICEF East Asia and Pacific Regional Office (EAPRO)19 Phra Atit RoadBangkok 10200 ThailandTel: (66 2) 356-9499Fax: (66 2) 280-3563E-mail: [email protected]/eapro
UNICEF would like to acknowledge the financial support from the Bill and Melinda Gates Foundation (BMGF), the Australian National Committee for UNICEF, as well as Thematic WASH contributions for undertaking this study and the publication of this report.