washington, d.c. psd permit no. se 09-01 )filings...epa region 9 hereby submits the attached...
TRANSCRIPT

BEFORE THE ENVIRONMENTAL APPEALS BOARD UNITED STATES ENVIRONMENTAL PROTECTION AGENCY
WASHINGTON, D.C. ____________________________________ ) In re: ) ) Palmdale Hybrid Power Plant ) PSD Appeal No. 11-07 ) PSD Permit No. SE 09-01 ) ___________________________________ )
EPA REGION 9’S EXCERPTS OF RECORD
EPA Region 9 hereby submits the attached Excerpts of Record in support of EPA Region
9’s Response to Petition for Review in the above-referenced case.
Date: February 17, 2012 Respectfully submitted, /S/ Julie Walters ___________________________ Julie Walters Office of Regional Counsel EPA Region 9 75 Hawthorne St. Mail Code ORC-2 San Francisco, CA 94105 Telephone: (415) 972-3892 Facsimile: (415) 947-3570 Email: [email protected]
Kristi Smith Air and Radiation Law Office Office of General Counsel (MC 2344-A) Environmental Protection Agency 1200 Pennsylvania Ave. N.W. Washington, DC 20460 Telephone: (202) 564-3068 Facsimile: (202) 564-5603
Email: [email protected]

EPA Region 9’s Excerpts of Record
1. Proposed PSD Permit for the PHPP, 8-11-2011 (AR Index No. IV-1) 2. Public Notice (English), 8-11-2011 (AR Index No. IV-3) 3. Fact Sheet for the Proposed PHPP PSD Permit, 8-2011 (AR Index No. IV-2) 4. Response to Public Comments, 10-18-2011 (AR Index No. VII-3) 5. Final PSD Permit, 10-18-2011 (AR Index No. VII-2) 6. Email from R. Simpson to EPA (D. Jordan) requesting reconsideration of extending comment period , 9-12-2011 (AR Index No. V-7) 7. Letter from April Sommer transmitting comments on behalf of R. Simpson
and HHT, 9-14-2011 (AR Index No. V-17) 8. Email from EPA (L. Beckham) to April Sommer with attachments, 11-18-
2011 (AR Index n/a) 9. Letter from AECOM transmitting comments from City of Palmdale, 9-14-
2011 (AR Index No. V-13) 10. Excerpt from Russell City Energy Center PSD Permit, issued by Bay Area Air Quality Management District, PSD Permit Application No. 15487, 2-3-2010 (AR Index n/a)

Excerpt
1
1
Palmdale Hybrid Power Project (SE 09-01) Proposed PSD Permit August 2011
PALMDALE HYBRID POWER PROJECT (SE 09-01)
PREVENTION OF SIGNIFICANT DETERIORATION PERMIT PROPOSED PERMIT CONDITIONS
PROJECT DESCRIPTION The proposed Palmdale Hybrid Power Project (Project) consists of two General Electric (GE) Frame 7FA natural gas-fired combustion turbine-generators (CTGs) rated at 154 megawatt (MW, gross) each, two heat recovery steam generators (HRSGs), one steam turbine generator (STG) rated at 267 MW, and 251 acres of parabolic solar-thermal collectors with associated heat-transfer equipment. The Project will have an electrical output of 570 MW (nominal) or 563 MW (net). The Project will be located on a parcel of land owned by the city of Palmdale, currently zoned for industrial use, in Los Angeles County. The approximately 333-acre parcel is west of the northwest corner of Air Force Plant 42, and east of the intersection of Sierra Highway and East Avenue M. The City of Palmdale is located within the Antelope Valley Air Quality Management District (District). This proposed Prevention of Significant Deterioration (PSD) permit for the Project requires the use of Best Available Control Technology (BACT) to limit emissions of nitrogen oxides (NOX), carbon monoxide (CO), total particulate matter (PM), particulate matter under 10 micrometers (μm) in diameter (PM10), particulate matter under 2.5 (μm) in diameter (PM2.5), and greenhouse gases (GHG), to the greatest extent feasible. Air pollution emissions from the Project would not cause or contribute to violations of any National Ambient Air Quality Standards (NAAQS) or any applicable PSD increments for the pollutants regulated under the PSD permit. Additional equipment includes auxiliary equipment including a natural gas heater and boiler, a diesel-fired emergency generator and emergency firewater pump engine, cooler towers, and circuit breakers. EQUIPMENT LIST The following devices and activities are subject to this PSD permit:
2
Palmdale Hybrid Power Project (SE 09-01) Proposed PSD Permit August 2011
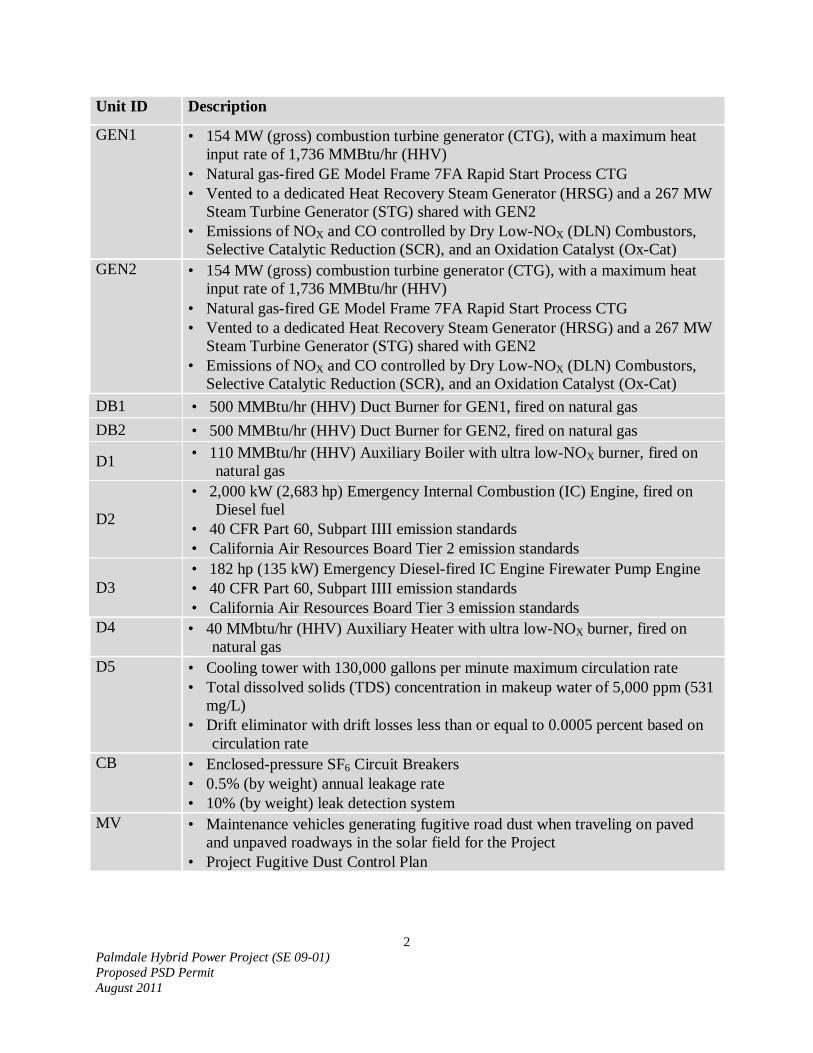
Unit ID Description
GEN1
• 154 MW (gross) combustion turbine generator (CTG), with a maximum heat input rate of 1,736 MMBtu/hr (HHV)
• Natural gas-fired GE Model Frame 7FA Rapid Start Process CTG • Vented to a dedicated Heat Recovery Steam Generator (HRSG) and a 267 MW
Steam Turbine Generator (STG) shared with GEN2 • Emissions of NOX and CO controlled by Dry Low-NOX (DLN) Combustors,
Selective Catalytic Reduction (SCR), and an Oxidation Catalyst (Ox-Cat) GEN2
• 154 MW (gross) combustion turbine generator (CTG), with a maximum heat input rate of 1,736 MMBtu/hr (HHV)
• Natural gas-fired GE Model Frame 7FA Rapid Start Process CTG • Vented to a dedicated Heat Recovery Steam Generator (HRSG) and a 267 MW
Steam Turbine Generator (STG) shared with GEN2 • Emissions of NOX and CO controlled by Dry Low-NOX (DLN) Combustors,
Selective Catalytic Reduction (SCR), and an Oxidation Catalyst (Ox-Cat) DB1 • 500 MMBtu/hr (HHV) Duct Burner for GEN1, fired on natural gas DB2 • 500 MMBtu/hr (HHV) Duct Burner for GEN2, fired on natural gas
D1 • 110 MMBtu/hr (HHV) Auxiliary Boiler with ultra low-NOX burner, fired on natural gas
D2
• 2,000 kW (2,683 hp) Emergency Internal Combustion (IC) Engine, fired on Diesel fuel
• 40 CFR Part 60, Subpart IIII emission standards • California Air Resources Board Tier 2 emission standards
D3 • 182 hp (135 kW) Emergency Diesel-fired IC Engine Firewater Pump Engine • 40 CFR Part 60, Subpart IIII emission standards • California Air Resources Board Tier 3 emission standards
D4 • 40 MMbtu/hr (HHV) Auxiliary Heater with ultra low-NOX burner, fired on natural gas
D5 • Cooling tower with 130,000 gallons per minute maximum circulation rate • Total dissolved solids (TDS) concentration in makeup water of 5,000 ppm (531
mg/L) • Drift eliminator with drift losses less than or equal to 0.0005 percent based on
circulation rate CB • Enclosed-pressure SF6 Circuit Breakers
• 0.5% (by weight) annual leakage rate • 10% (by weight) leak detection system
MV • Maintenance vehicles generating fugitive road dust when traveling on paved and unpaved roadways in the solar field for the Project
• Project Fugitive Dust Control Plan

3
Palmdale Hybrid Power Project (SE 09-01) Proposed PSD Permit August 2011
PERMIT CONDITIONS I. PERMIT EXPIRATION
As provided in 40 CFR § 52.21(r), this PSD Permit shall become invalid if construction: A. is not commenced (as defined in 40 CFR § 52.21(b)(9)) within 18 months after
the approval takes effect; or B. is discontinued for a period of 18 months or more; or C. is not completed within a reasonable time.
II. PERMIT NOTIFICATION REQUIREMENTS
Permittee shall notify EPA Region IX by letter or by electronic mail of the:
A. date construction is commenced, postmarked within 30 days of such date; B. actual date of initial startup, as defined in 40 CFR § 60.2, postmarked within 15
days of such date; C. date upon which initial performance tests will commence, in accordance with the
provisions of Condition X.G, postmarked not less than 30 days prior to such date. Notification may be provided with the submittal of the performance test protocol required pursuant to Condition X.G; and
D. date upon which initial performance evaluation of the continuous emissions
monitoring system (CEMS) will commence in accordance with 40 CFR § 60.13(c), postmarked not less than 30 days prior to such date. Notification may be provided with the submittal of the CEMS performance test protocol required pursuant to Condition X.F.
III. FACILITY OPERATION At all times, including periods of startup, shutdown, shakedown, and malfunction, Permittee shall, to the extent practicable, maintain and operate the Facility, including associated air pollution control equipment, in a manner consistent with good air pollution control practice for minimizing emissions. Determination of whether acceptable operating and maintenance procedures are being used will be based on information available to EPA, which may include, but is not limited to, monitoring results, opacity observations, review of operating maintenance procedures and inspection of the Facility.

4
Palmdale Hybrid Power Project (SE 09-01) Proposed PSD Permit August 2011
IV. MALFUNCTION REPORTING
A. Permittee shall notify EPA at [email protected] within two (2) working days following the discovery of any failure of air pollution control equipment or process equipment, or failure of a process to operate in a normal manner, which results in an increase in emissions above the allowable emission limits stated in Section X of this permit.
B. In addition, Permittee shall provide an additional notification to EPA in writing or
electronic mail within fifteen (15) days of any such failure described under Condition IV.A. This notification shall include a description of the malfunctioning equipment or abnormal operation, the date of the initial malfunction, the period of time over which emissions were increased due to the failure, the cause of the failure, the estimated resultant emissions in excess of those allowed in Section X, and the methods utilized to mitigate emissions and restore normal operations.
C. Compliance with this malfunction notification provision shall not excuse or
otherwise constitute a defense to any violation of this permit or any law or regulation such malfunction may cause.
V. RIGHT OF ENTRY
The EPA Regional Administrator, and/or an authorized representative, upon the presentation of credentials, shall be permitted:
A. to enter the premises where the Facility is located or where any records are
required to be kept under the terms and conditions of this PSD Permit; B. during normal business hours, to have access to and to copy any records required
to be kept under the terms and conditions of this PSD Permit; C. to inspect any equipment, operation, or method subject to requirements in this
PSD Permit; and D. to sample materials and emissions from the source(s).
VI. TRANSFER OF OWNERSHIP
In the event of any changes in control or ownership of the Facility, this PSD Permit shall be binding on all subsequent owners and operators. Within 14 days of any such change

5
Palmdale Hybrid Power Project (SE 09-01) Proposed PSD Permit August 2011
in control or ownership, Permittee shall notify the succeeding owner and operator of the existence of this PSD Permit and its conditions by letter. Permittee shall send a copy of this letter to EPA Region IX within thirty (30) days of its issuance.
VII. SEVERABILITY
The provisions of this PSD Permit are severable, and, if any provision of the PSD Permit is held invalid, the remainder of this PSD Permit shall not be affected.
VIII. ADHERENCE TO APPLICATION AND COMPLIANCE WITH OTHER
ENVIRONMENTAL LAWS
Permittee shall construct the Project in compliance with this PSD permit, the application on which this permit is based, and all other applicable federal, state, and local air quality regulations. This PSD permit does not release the Permittee from any liability for compliance with other applicable federal, state and local environmental laws and regulations, including the Clean Air Act.
IX. RESERVED

6
Palmdale Hybrid Power Project (SE 09-01) Proposed PSD Permit August 2011
X. SPECIAL CONDITIONS
A. Annual Facility Emission Limits
1. Annual emissions, in tons per year (tpy) on a 12-month rolling average basis, shall not exceed the following:
NOX CO PM PM10 PM2.5
Total Facility 114.9 tpy 250.2 tpy 79.1 tpy 62.5 tpy 56.0
CO2e
Total Facility 1,913,000 tpy
2. Only Public Utilities Commission (PUC)-quality pipeline natural gas shall be fired at this Facility. PUC-quality pipeline natural gas shall not exceed a sulfur content of 0.20 grains per 100 dry standard cubic feet on a 12-month rolling average basis and shall not exceed a sulfur content of 1.0 grains per 100 dry standard cubic feet, at any time.
B. Air Pollution Control Equipment and Operation
As soon as practicable following initial startup of the power plant (startup as defined in 40 CFR § 60.2) but prior to commencement of commercial operation (as defined in 40 CFR § 72.2), and thereafter, except as noted below in Condition X.D, Permittee shall install, continuously operate, and maintain the SCR systems for control of NOX and the Ox-Cat systems for control of CO for Units GEN1 and GEN2. Permittee shall also perform any necessary operations to minimize emissions so that emissions are at or below the emission limits specified in this permit.
C. Combustion Turbine Generator (CTG) Emission Limits 1. Except as noted below under Condition X.D, on and after the date of initial
startup, Permittee shall not discharge or cause the discharge of emissions from each CTG Unit (of GEN1 and GEN2) into the atmosphere in excess of the following:

7
Palmdale Hybrid Power Project (SE 09-01) Proposed PSD Permit August 2011
Emission Limit (per CTG) (no duct burning)
Emission Limit (per CTG) (with duct burning)
NOX • 11.55 lb/hr • 1-hr average • 2.0 ppmvd @ 15% O2
• 14.60 lb/hr • 1-hr average • 2.0 ppmvd @ 15% O2
CO
3-Year Demonstration Period • 7.65 lb/hr • 1-hr average • 2.0 ppmvd @ 15% O2
Post-Demonstration Period
• 5.74 lb/hr • 1-hr average • 1.5 ppmvd @ 15% O2
Conditions in X.C.3 may affect the timing and applicability of post-demonstration period emission limits.
• 8.90 lb/hr • 1-hr average • 2.0 ppmvd @ 15% O2
PM, PM10, PM2.5
• 0.0027 lb/MMBtu • 4.7 lb/hr • 3-hr average • PUC-quality natural gas
(Sulfur content of no greater than 0.20 grains per 100 dscf on a 12-month average and not greater than 1.0 gr/dscf at any time)
• 0.0035 lb/MMBtu • 8.0 lb/hr • 3-hr average • PUC-quality natural gas
(Sulfur content of no greater than 0.20 grains per 100 dscf on a 12-month average and not greater than 1.0 gr/dscf at any time)
GHG
• 774 lb CO2/MWh source-wide net output • 117 lb CO2/MMBtu heat input, each GEN1/DB1 and
GEN2/DB2 • 30-day rolling average
2. Combined hours of operation for both duct burners (DB1 and DB2) shall not
exceed 2,000 hours per 12-month rolling average. Permittee shall ensure that the duct burners are not operated unless the associated turbine units are in operation.

8
Palmdale Hybrid Power Project (SE 09-01) Proposed PSD Permit August 2011
3. CO Emissions Limit Demonstration Period – The Demonstration Period is
defined as the first 3 years immediately following the commencement of commercial operations (as defined in 40 CFR § 72.2). a. Permittee shall design the gas turbines to achieve a CO emission rate of
1.5 ppmvd @ 15% O2 and 5.74 lb/hr over a 1-hour period without duct firing. Prior to construction, Permittee shall submit design specifications to EPA as proof that the gas turbines were designed to achieve such a rate, and a plan that sets forth the measures that will be taken to maintain the system and optimize its performance.
b. During the Demonstration Period, Permittee shall operate the gas turbines
according to the design specifications, within the design parameters, and consistent with the maintenance and performance optimization plan described above in Condition X.C.3.a. During the Demonstration Period, Permittee shall not discharge or cause the discharge of CO emissions from each CTG Unit (GEN1 and GEN2) into the atmosphere in excess of the following amounts over a 1-hour averaging period: 2.0 ppmvd CO @ 15% O2 and (1) 8.90 lb/hr with duct firing or (2) 7.65 lb/hr without duct firing.
c. Following the Demonstration Period, Permittee shall not discharge or
cause the discharge of CO emissions from each CTG Unit (GEN1 and GEN2) into the atmosphere in excess of the following amounts over a 1-hour averaging period except as specified in Condition X.C.3.d:
i. 1.5 ppmvd @ 15% O2 without duct firing;
ii. 2.0 ppmvd @ 15% O2 with duct firing;
iii. 5.74 lb/hr without duct firing; and
iv. 8.90 lb/hr with duct firing.
d. If, during the Demonstration Period, Permittee determines that the CO limits in Conditions X.C.3.i or X.C.3.iii are not feasible, Permittee shall submit an application to EPA prior to the end of the Demonstration Period requesting a revision of those limits. Such an application must contain data and information that demonstrates that the Facility was operated according to the design specifications and parameters, and the maintenance and performance optimization plan, identified above in Condition X.C.3.a, as well as a technical justification explaining why the lower limits are not feasible. If, after the applicable review process following such a submission (which will include an opportunity for public

9
Palmdale Hybrid Power Project (SE 09-01) Proposed PSD Permit August 2011
review and comment), it is determined through data and information gathered during the Demonstration Period that different CO limits are necessary, the limits in Condition X.C.3.i and X.C.3.iii will be revised accordingly. Provided that the application specified in this condition is postmarked prior to the end of the Demonstration Period, the emission limits in Condition X.C.3.b shall remain in effect until EPA evaluates the application and makes a final decision regarding the revision of the limits in Conditions X.C.3.i or X.C.3.iii.
D. Requirements during Gas Turbine (GEN1 and GEN2) Startup and Shutdown
1. Startup is defined as the period beginning with ignition and lasting until either the equipment complies with all operating permit limits for two consecutive 15-minute averaging periods or the maximum time allowed for the event after ignition, whichever occurs first; and the period of time during which a unit is brought from a shutdown status to its operating temperature and pressure, including the time required by the unit’s emission control system to reach full operations and demonstrate compliance with Condition X.C. a. A cold startup means a startup when the CTG has not been in operation
during the preceding 48 hours.
b. Warm and hot start-ups include all startups that are not a cold startup.
2. Shutdown is defined as the period beginning with the lowering of equipment from normal operating load and lasting until fuel flow is completely off and combustion has ceased.
3. The duration of startup and shutdown periods and emissions of NOX and CO
shall not exceed the following, for each CTG (GEN1 and GEN2) and associated HRSG unit, as verified by the CEMS:
NOX CO Duration
Cold Startup 52.4 lb/hr 96 lb/event
224 lb/hr 410 lb/event 110 minutes
Warm and Hot Startup
30 lb/hr 40 lb/event
247 lb/hr 329 lb/event 80 minutes
Shutdown 114 lb/hr 57 lb/event
674 lb/hr 337 lb/event 30 minutes

10
Palmdale Hybrid Power Project (SE 09-01) Proposed PSD Permit August 2011
4. Permittee must operate the CEMS during startup and shutdown periods. 5. Permittee must record the time, date, and duration of each startup and
shutdown event. The records must include calculations of NOX and CO emissions during each event based on the CEMS data. These records must be kept for five years following the date of such event.
6. During startup, the SCR system, including ammonia injection, shall be
operated as soon as the SCR reaches an operating temperature of 550 degrees Fahrenheit.
E. Auxiliary Combustion Equipment Emission Limits and Work Practices
1. At all times, including equipment startup and shutdown, Permittee shall not discharge or cause the discharge of emissions from each unit into the atmosphere in excess of the following, and shall otherwise comply with the following specifications:
Unit ID NOX CO PM / PM10 PM2.5 GHG
Unit D1 110 MMBtu/hr (HHV) Boiler
• 9 ppmvd @ 3% O2
• 3-hr average
• 50 ppmvd @ 3% O2
• 3-hr average
• 0.8 lb/hr • PUC-quality
pipeline natural gas
Annual boiler tune-ups
Unit D2 2,000 kW (2,683 hp) engine
• 6.4 g/kW-hr, (4.8 g/hp-hr), includes NMHC
• 3-hr average
• 3.5 g/KW-hr,
(2.6 g/hp-hr)
• 0.20 g/kW-hr, (0.15 g/hp-hr )
• Use of ultra-low sulfur fuel, not to exceed 15 ppmvd fuel sulfur
• Fuel supplier certification
Not applicable
Unit D3 182 hp firewater pump
• 4.0 g/KW-hr, (3.0 g/hp-hr), includes NMHC
• 3-hr average
Not applicable
Unit D4 40 MMBtu/hr (HHV) Heater
• 9 ppmvd @ 3% O2
• 3-hr average
• 50 ppmvd @ 3% O2
• 3-hr average
• 0.3 lb/hr • PUC-quality
pipeline natural gas
Annual boiler tune-ups

11
Palmdale Hybrid Power Project (SE 09-01) Proposed PSD Permit August 2011
Unit D5 130,000 gpm Cooling Tower
Not applicable
Not applicable
• 1.6 lb/hr (as total PM)
• < 0.0005% drift • < 5,000 ppm total
dissolved solids
Not applicable
CB SF6 Circuit Breakers
Not applicable
Not applicable
Not applicable
• 9.56 tpy CO2e • 12-month
rolling total MV Maintenance Vehicles
Not applicable
Not applicable
Conditions in X.E.9 including a Fugitive Dust Control Plan
Not applicable
2. Unit D1 shall not operate during normal operations of GEN1 or GEN2, except
during periods of, or immediately following, startup. Unit D1 shall be shut down as soon as practicable after the completion of any startup process as defined in Condition X.D.1. Annual hours of operation for Unit D1 shall not exceed 500 hours per 12-month rolling average.
3. Except during an emergency, Unit D2 shall be limited to operation of the engine for maintenance and testing purposes. Annual hours of operation for Unit D2, for maintenance and testing, shall not exceed 50 hours per 12-month rolling average.
4. Except during an emergency, Unit D3 shall be limited to operation of the
engine for maintenance and testing purposes, including as required for fire safety testing. Annual hours of operation for Unit D3, for maintenance and testing, shall not exceed 50 hours per 12-month rolling average.
5. Units D2 and D3 shall not operate during startup of GEN1 or GEN2, except
when Units D2 or D3 are required for emergency operations.
6. Unit D4 restrictions on usage shall be limited to annual hours of operation of not to exceed 1,000 hours per 12-month rolling average.
7. Unit D5 cooling tower emission limits shall not exceed the following:
a. drift rate shall not exceed 0.0005% with a maximum circulation rate of
130,000 gallons per minute (gpm). The maximum total dissolved solids (TDS) shall not exceed 5,000 ppm.
b. The maximum hourly total PM emission rate from the cooling tower and

12
Palmdale Hybrid Power Project (SE 09-01) Proposed PSD Permit August 2011
the evaporative condenser combined shall not exceed 1.6 lb/hr. 8. Unit CB enclosed-pressure SF6 circuit breakers:
a. Emissions shall not exceed an annual leakage rate of 0.5% by weight; and
b. Shall be equipped with a 10% by weight leak detection system. 9. For Unit MV, maintenance vehicles that travel on paved and unpaved
roadways in the solar field associated with the Project, Permittee shall complete the following prior to the commencement of commercial operation (as defined in 40 CFR § 72.2):
a. Pave the main access road into the plant site; b. Submit a Project Fugitive Dust Control Plan to EPA that includes
fugitive road dust control measures for unpaved and paved roads, including, but not limited to: i. use of a durable non-toxic soil stabilizer applied throughout the solar
field for dust control; ii. use of a durable non-toxic soil stabilizer to treat unpaved roads
within the solar field used by wash trucks that spray and clean the mirrors;
iii. inspection and maintenance procedures to ensure that the unpaved roads remain stabilized;
iv. use of water trucks applying water on disturbed areas where soil stabilizers are not as effective;
v. use of water in the mirror washing for incidental dust control; and vi. limiting vehicle speeds to no more than 10 miles per hour on
unpaved roadways, with the exception that vehicles may travel up to 25 miles per hour on stabilized unpaved roads as long as such speeds do not create visible dust emissions.
10. Units D1 and D4 shall undergo annual tune-ups and meet the associated
requirements of Condition X.I.9 as follows (if the unit is not operating on the required date for a tune-up, the tune-up must be conducted within one week of startup):
a. Inspect the burner, and clean or replace any components of the burner as necessary (you may delay the burner inspection until the next scheduled unit shutdown, but you must inspect each burner at least once every 18 months).
b. Inspect the flame pattern, and adjust the burner as necessary to optimize the flame pattern. The adjustment should be consistent with the manufacturer's specifications.
c. Inspect the system controlling the air-to-fuel ratio, and ensure that it is

13
Palmdale Hybrid Power Project (SE 09-01) Proposed PSD Permit August 2011
correctly calibrated and functioning properly. d. Optimize total emissions of carbon monoxide. This optimization should
be consistent with the manufacturer's specifications. e. Measure the concentrations in the effluent stream of carbon monoxide in
parts per million, by volume, and oxygen in volume percent, before and after the adjustments are made (measurements may be either on a dry or wet basis, as long as it is the same basis before and after the adjustments are made).
F. Continuous Emissions Monitoring System (CEMS) for GEN1 and GEN2
1. At the earliest feasible opportunity after first fire of GEN1 and GEN2 and
before GEN1 and GEN2 commence commercial operation (as defined in 40 CFR § 72.2), in accordance with the recommendations of the equipment manufacturer and the construction contractor:
a. Permittee shall install, calibrate, and operate a CEMS each for GEN1 and GEN2 that measures stack gas NOX, CO, and CO2 concentrations in ppmv. The concentrations shall be corrected to 15% O2 on a dry basis. No later than the end of the shakedown period as defined in Condition X.J. or upon commencing commercial operations, whichever comes first, Permittee shall also maintain, certify, and quality-assure a CEMS for each CTG that measures stack gas NOX, CO, and CO2 concentrations in ppmv, and shall conduct initial certification of the CEMS in accordance with Condition X.F.6. The concentrations shall be corrected to 15% O2 on a dry basis.
b. If Permittee chooses to install an O2 CEMS, it shall be installed, calibrated and operated to measure O2 concentrations in ppmv. No later than the end of the shakedown period as defined in Condition X.J. or upon commencing commercial operations, whichever comes first, Permittee shall also maintain, certify, and quality-assure the CEMS for each CTG that measures O2 concentrations in ppmv, and shall conduct initial certification of the CEMS in accordance with Condition X.F.6. Permittee may not install an O2 CEMS in lieu of the CO2 CEMS in Condition X.F.1.a.
2. The NOX, CO2, and O2 CEMS shall meet the applicable requirements of 40
CFR Part 75.
3. The CO CEMS shall meet the applicable requirements of 40 CFR Part 60 Appendix B, Performance Specification 4, and 40 CFR Part 60 Appendix F, Procedure 1, except the relative accuracy specified in section 13.2 of 40 CFR

14
Palmdale Hybrid Power Project (SE 09-01) Proposed PSD Permit August 2011
Part 60 Appendix B, Performance Specification 4 shall not exceed 20 percent. 4. Each CEMS shall complete a minimum of one cycle of operation (sampling,
analyzing, and data recording) for each successive 15-minute clock-hour period.
5. The CEMS shall be tested in accordance with Conditions X.F.2 and X.F.3.
6. The initial certification of the CEMS may either be conducted separately, as
specified in 40 CFR § 60.334(b)(1), or as part of the initial performance test of each emission unit. The CEMS must undergo and pass initial performance specification testing on or before the date of the initial performance test.
7. The CEMS shall meet the requirements of 40 CFR § 60.13. Data sampling,
analyzing, and recording shall also be adequate to demonstrate compliance with emission limits during startup and shutdown.
8. Not less than 90 days prior to the date of initial startup of the Facility, the
Permittee shall submit to the EPA a quality assurance project plan for the certification and operation of the CEMS. Such a plan shall conform to EPA requirements contained in 40 CFR Part 60 Appendix F for CO, 40 CFR Part 75 for NOX and O2 or CO2, and 40 CFR Part 75 Appendix B for stack flow. The plan shall be updated and resubmitted upon request by EPA. The protocol shall specify how emissions during startups and shutdowns will be determined and calculated, including quantifying flow accurately if calculations are used.
9. The gas turbine CEMS shall be audited quarterly and tested annually in
accordance with 40 CFR Part 60 Appendix F, Procedure 1. Permittee shall perform a full stack traverse during initial run of annual RATA testing of the CEMS, with testing points selected according to 40 CFR Part 60 Appendix A, Method 1.
10. Permittee shall submit a CEMS performance test protocol to the EPA no later
than 30 days prior to the test date to allow review of the test plan and to arrange for an observer to be present at the test. The performance test shall be conducted in accordance with the submitted protocol and any changes required by EPA.
11. Permittee shall furnish the EPA a written report of the results of performance
tests within 60 days of completion.
12. The stack gas volumetric flow rates shall be calculated in accordance with the

15
Palmdale Hybrid Power Project (SE 09-01) Proposed PSD Permit August 2011
fuel flowmeter requirements of 40 CFR Part 75 Appendix D in combination with the appropriate parts of EPA Method 19.
13. Prior to the date of initial startup of GEN1 and GEN2, Permittee shall install,
and thereafter maintain and operate, continuous monitoring and recording systems to measure and record the following operational parameters:
a. The ammonia injection rate of the ammonia injection system of the
SCR system. b. Exhaust gas temperature at the inlet to the SCR reactor.
14. Permittee shall measure and record, for each Unit GEN1/DB1 and Unit GEN2/DB2, the following:
a. The actual heat input and the heat input corrected to ISO standard day conditions (288 degrees Kelvin, 60 percent relative humidity, and 101.3 kPal pressure) on an hourly basis;
b. The pounds of CO2 per heat input (lb CO2/MMBtu) corrected to ISO standard day conditions on an hourly basis; and
c. The 30-day rolling average emission rate lb CO2/MMBtu (at ISO standard day conditions). The 30-day rolling average shall be based on the average hourly lb/MMBtu recordings.
15. Permittee shall measure and record, for the entire facility, the following: a. Net energy output (MWhnet) on an hourly basis; b. Pounds of CO2 per net energy output (lb CO2/MWhnet) on an hourly
basis; c. The 30-day rolling average emission rates for lb CO2/MWhnet. The 30-
day rolling average shall be based on the average hourly lb CO2/MWhnet recordings.
G. Performance Tests
1. Stack Tests
a. Within 60 days after achieving normal operation, but not later than 180 days after the initial startup of equipment, and, unless otherwise specified, annually thereafter (within 30 days of the initial performance test anniversary), Permittee shall conduct performance tests (as described in 40 CFR § 60.8) as follows: i. NOX, CO, CO2, PM, PM10, and PM2.5 emissions from each gas turbine

16
Palmdale Hybrid Power Project (SE 09-01) Proposed PSD Permit August 2011
(Units GEN1/DB1 and GEN2/DB2); ii. NOX and CO emissions from the 110 MMBtu/hr boiler (D1) and the
40 MMBtu/hr heater (D4); PM, PM10, and PM2.5 emissions from the 110 MMBtu/hr boiler (D1) and the 40 MMBtu/hr heater (D4) shall be tested initially and at least every five years (within 30 days of the initial performance test anniversary);
iii. NOX, CO, PM, PM10, and PM2.5 emissions from the 2,000 kW (2,683 hp) internal combustion engine (D2), initial performance test only;
iv. NOX, CO, PM, PM10, and PM2.5 emissions from the 182 hp firewater pump (D3), initial performance test only; and
v. PM, PM10, and PM2.5 emissions from the cooling tower (D5). b. Permittee shall submit a performance test protocol to EPA no later than 30
days prior to the test to allow review of the test plan and to arrange for an observer to be present at the test. The performance test shall be conducted in accordance with the submitted protocol, and any changes required by EPA.
c. Performance tests shall be conducted in accordance with the test methods set forth in 40 CFR § 60.8 and 40 CFR Part 60 Appendix A, as modified below. In lieu of the specified test methods, equivalent methods may be used with prior written approval from EPA:
i. EPA Methods 1-4 and 7E for NOX emissions measured in ppmvd ii. EPA Methods 1-4, 7E, and 19 for NOX emissions measured on a heat
input basis iii. EPA Methods 1-4 and 10 for CO emissions
iv. EPA Methods 1-4 and 3B for CO2 emissions v. EPA Methods 5 and 202, or Methods 201A and 202, for PM, PM10,
and PM2.5, in accordance with the test methods set forth in 40 CFR § 60.8, 40 CFR Part 60 Appendix A, and 40 CFR Part 51 Appendix M; in lieu of Method 202, Permittee may use EPA Conditional Test Methods for particulate matter CTM-039
vi. Modified Method 306 or the Cooling Tower Institute’s heated bead test method for PM emissions from the cooling tower, and
vii. the provisions of 40 CFR § 60.8 (f). d. The initial performance test conducted after initial startup shall use the test
procedures for a “high NO2 emission site,” as specified in San Diego Test Method 100, to measure NOX emissions. The source shall be classified as

17
Palmdale Hybrid Power Project (SE 09-01) Proposed PSD Permit August 2011
either a “low” or “high” NO2 emission site based on these test results. If the emission source is classified as a:
i. “high NO2 emission site,“ then each subsequent performance test shall use the test procedures for a “high NO2 emission site,” as specified in San Diego Test Method 100.
ii. “low NO2 emission site,” then the test procedures for a “high NO2 emission site,” as specified in San Diego Test Method 100, shall be performed once every five years to verify the source's classification as a “low NO2 emission site.”
e. The performance test methods for NOX emissions specified in Condition X.G.1.c.i and ii., may be modified as follows: i. Perform a minimum of 9 reference method runs, with a minimum time
per run of 21 minutes, at a single load level, between 90 and 100 percent of peak (or the highest physically achievable) load, and
ii. Use the test data both to demonstrate compliance with the applicable NOX emission limit and to provide the required reference method data for the RATA of the CEMS.
f. Upon written request and adequate justification from the Permittee, EPA may waive a specific annual test and/or allow for testing to be done at less than maximum operating capacity.
g. For performance test purposes, sampling ports, platforms, and access shall be provided on the emission unit exhaust system in accordance with the requirements of 40 CFR § 60.8(e).
h. Permittee shall furnish the EPA a written report of the results of performance tests within 60 days of completion.
2. Cooling Tower Total Dissolved Solids Testing
a. Permittee shall perform weekly tests of the blow-down water quality using an EPA-approved method. The operator shall maintain a log that contains the date and result of each blow-down water quality test, and the resulting mass emission rate. This log shall be maintained onsite for a minimum of five years and shall be provided to EPA and District personnel upon request.
b. Permittee shall calculate PM, PM10, and PM2.5 emission rate using an EPA-approved calculation based on the TDS and water circulation rate.
c. The operator shall conduct all required cooling tower water quality tests in accordance with an EPA-approved test and emissions calculation protocol. Thirty (30) days prior to the first such test, the operator shall provide a

18
Palmdale Hybrid Power Project (SE 09-01) Proposed PSD Permit August 2011
written test and emissions calculation protocol for EPA review and approval, with a copy to the District as specified in Condition XII below.
d. A maintenance procedure shall be established that states how often and what procedures will be used to ensure the integrity of the drift eliminators, to ensure that the TDS limits are not exceeded, and to ensure compliance with recirculation rates. This procedure is to be kept onsite and made available to EPA and District personnel upon request. Permittee shall promptly report any deviations from this procedure.
3. Fuel Testing a. Permittee shall take monthly samples of the natural gas combusted. The
samples shall be analyzed for sulfur content using an ASTM method. The sulfur content test results shall be retained onsite and taken to ensure compliance with Special Conditions X.C and X.E for Units GEN1/DB1, GEN2/DB2, D1, and D4.
H. Monitoring for Auxiliary Equipment
1. Permittee shall install and maintain an operational non-resettable totalizing mass or volumetric flow meter in each fuel line for the 110 MMBtu/hr boiler (Unit D1) and the 40 MMBtu/hr heater (Unit D4).
2. Permittee shall install and maintain an operational non-resettable elapsed time
meter for the 110 MMBtu /hr boiler (Unit D1), 2,000 kW emergency use engine (Unit D2), the 182 hp emergency-use firewater pump (Unit D3), and the 40 MMBtu/hr heater (Unit D4).
3. Permittee shall install and maintain a leak detection system on the circuit
breakers that signals an alarm in the facility’s control room in the event that any circuit breaker loses more than 10% of its dielectric fluid. The owner/operator shall promptly respond to any alarm, investigate the circuit breaker involved, and fix any leak-tightness problems that caused the alarm.
I. Recordkeeping and Reporting
1. Permittee shall maintain a file of all records, data, measurements, reports, and documents related to the operation of the Facility, including, but not limited to, the following: all records or reports pertaining to adjustments and/or maintenance performed on any system or device at the Facility; all records relating to performance tests and monitoring of auxiliary combustion equipment; for each diesel fuel oil delivery, documents from the fuel supplier certifying compliance with the fuel sulfur content limit of Condition X.E; and

19
Palmdale Hybrid Power Project (SE 09-01) Proposed PSD Permit August 2011
all other information required by this permit recorded in a permanent form suitable for inspection.
2. Permittee shall maintain CEMS records that include the following: the occurrence and duration of any startup, shutdown, shakedown, or malfunction, performance testing, evaluations, calibrations, checks, adjustments, maintenance, duration of any periods during which a continuous monitoring system or monitoring device is inoperative, and corresponding emission measurements.
3. Permittee shall maintain records of all source tests and monitoring and
compliance information required by this permit.
4. Permittee shall maintain records and submit a written report of all excess emissions to EPA semi-annually, except when: more frequent reporting is specifically required by an applicable subpart; or the Administrator, on a case-by-case basis, determines that more frequent reporting is necessary to accurately assess the compliance status of the source. The report is due on the 30th day following the end of each semi-annual period and shall include the following:
a. Time intervals, data and magnitude of the excess emissions, the nature and cause (if known), corrective actions taken and preventive measures adopted;
b. Applicable time and date of each period during which the CEMS was inoperative (monitor down-time), except for zero and span checks, and the nature of CEMS repairs or adjustments;
c. A statement in the report of a negative declaration; that is, a statement when no excess emissions occurred or when the CEMS has not been inoperative, repaired, or adjusted;
d. Any failure to conduct any required source testing, monitoring, or other compliance activities; and
e. Any violation of limitations on operation, including but not limited to restrictions on hours of operation.
5. Excess emissions shall be defined as any period in which the Facility
emissions exceed the maximum emission limits set forth in this permit.
6. A period of monitor down-time shall be any unit operating clock hour in which sufficient data are not obtained by the CEMS to validate the hour for

20
Palmdale Hybrid Power Project (SE 09-01) Proposed PSD Permit August 2011
NOX, CO, CO2, or O2, while the CEMS is also meeting the requirements of Condition X.F.7.
7. Excess emissions indicated by the CEM system, source testing, or compliance
monitoring shall be considered violations of the applicable emission limit for the purpose of this permit.
8. Permittee shall maintain the Fugitive Dust Control Plan on-site, which shall
include all documentation related to demonstrating compliance with Condition X.E.9 for Unit MV, in a permanent form suitable for inspection.
9. Permittee shall conduct annual tune-ups as required by Condition X.E.10 for
Units D1 and D4 and maintain onsite, and submit if requested by the Administrator, a biennial report containing the information in paragraphs (a) through (c) below:
a. The concentrations of CO in the effluent stream in parts per million, by volume, and oxygen in volume percent, measured before and after the tune-up of the boiler.
b. A description of any corrective actions taken as a part of the tune-up of the boiler.
c. The type and amount of fuel used over the 12 months prior to the biennial tune-up of the boiler.
10. Permittee shall record the pounds of dielectric fluid added to the circuit
breakers each month. 11. All records required by this PSD Permit shall be retained for not less than five
years following the date of such measurements, maintenance, reports, and/or records.
J. Shakedown Periods The combustion turbine emission limits and requirements in Conditions X.C, X.D, and X.E shall not apply during combustion shakedown periods. Shakedown is defined as the period beginning with initial startup and ending no later than initial performance testing, during which the Permittee conducts operational and contractual testing and tuning to ensure the safe, efficient and reliable operation of the plant. The shakedown period shall not exceed 90 days. The requirements of Section III of this permit shall apply at all times.

21
Palmdale Hybrid Power Project (SE 09-01) Proposed PSD Permit August 2011
XI. ACROYNMS AND ABBREVIATIONS
AQMD Air Quality Management District ASTM American Society for Testing and Materials BACT Best Available Control Technology BTU British Thermal Unit CAA Clean Air Act CEMS Continuous Emissions Monitoring System CFR Code of Federal Regulations CO Carbon Monoxide CO2e Carbon Dioxide Equivalent CTG Combustion Turbine Generator CTM Conditional Test Method District Antelope Valley Air Quality Management District DLN Dry Low NOX (d)scf (dry) Standard Cubic Feet EPA Environmental Protection Agency FDOC Final Determination of Compliance g grams GE General Electric GHG Greenhouse Gas gpm Gallons Per Minute gr grains HHV Higher Heating Value HRSG Heat Recovery Steam Generator hp Horsepower hr Hour IC Internal Combustion kPa kilopascals kW Kilowatt lb Pounds lbs Pounds MMBtu Million British Thermal Units MW Megawatt NAAQS National Ambient Air Quality Standards NNSR Nonattainment New Source Review NO2 Nitrogen Dioxide NOX Oxides of Nitrogen NSPS New Source Performance Standards O2 Oxygen Ox-Cat Oxidation Catalyst PHPP Palmdale Hybrid Power Project

22
Palmdale Hybrid Power Project (SE 09-01) Proposed PSD Permit August 2011
PM Total Particulate Matter PM2.5 Particulate Matter with aerodynamic diameter less than 2.5 micrometers PM10 Particulate Matter with aerodynamic diameter less than 10 micrometers ppm Parts Per Million ppmvd Parts Per Million by Volume, Dry basis ppmv Parts Per Million by Volume PSD Prevention of Significant Deterioration PUC Public Utilities Commission RATA Relative Accuracy Test Audit SCR Selective Catalytic Reduction SF6 Sulfur Hexafluoride SO2 Sulfur Dioxide SOX Oxides of Sulfur STG Steam Turbine Generator TDS Total Dissolved Solids tpy Tons Per Year yr Year
XII. AGENCY NOTIFICATIONS
All correspondence as required by this Approval to Construct must be sent to:
A. Director, Air Division (Attn: AIR-5) EPA Region IX 75 Hawthorne Street San Francisco, CA 94105-3901 Email: [email protected] Fax: (415) 947-3579 With a copy to: B. Air Pollution Control Officer Antelope Valley Air Quality Management District 43301 Division Street, Suite 206 Lancaster, CA 93535 Fax: (661) 723-3450

Excerpt
2

Page 1 of 4
* * * PUBLIC NOTICE * * *
PALMDALE HYBRID POWER PROJECT
ANNOUNCEMENT OF PROPOSED PERMIT, PUBLIC INFORMATION MEETING AND PUBLIC HEARING, AND REQUEST FOR PUBLIC COMMENT ON PROPOSED CLEAN AIR ACT PREVENTION OF SIGNIFICANT DETERIORATION PERMIT
PERMIT APPLICATION NO. SE 09-01
The United States Environmental Protection Agency (EPA) provides notice of, and requests public comment on, EPA’s proposed action relating to the Prevention of Significant Deterioration (PSD) permit application for the Palmdale Hybrid Power Project (Project). EPA is issuing a proposed PSD permit that would grant conditional approval, in accordance with the PSD regulations (40 CFR 52.21), to the City of Palmdale to construct and operate a 570 megawatt (MW, nominal) electric generating facility. The address for the City of Palmdale is 38300 Sierra Highway, Suite A, Palmdale, CA 93550. The proposed location for the Project is 950 East Avenue M, Palmdale, California 93550. The proposed Project consists of two General Electric (GE) Frame 7FA natural gas-fired combustion turbine-generators (CTGs) rated at 154 megawatt (MW) each, two heat recovery steam generators (HRSGs), one steam turbine generator (STG) rated at 267 MW, and 251 acres of parabolic solar-thermal collectors with associated heat-transfer equipment with the capacity to provide up to 50 MW of supplemental energy. The Project will have an electrical output of 570 MW (nominal) or 563 MW (net). The Project will be located on a parcel of land owned by the city of Palmdale, currently zoned for industrial use, in Los Angeles County. The approximately 333-acre parcel is west of the northwest corner of Air Force Plant 42, and east of the intersection of Sierra Highway and East Avenue M. The City of Palmdale is located within the Antelope Valley Air Quality Management District. The proposed PSD permit for the Project would require the use of Best Available Control Technology (BACT) to limit emissions of nitrogen oxides (NOx), carbon monoxide (CO), total particulate matter (PM), particulate matter under 10 micrometers (μm) in diameter (PM10), particulate matter under 2.5 (μm) in diameter (PM2.5), and greenhouse gases (GHG), to the greatest extent feasible. Air pollution emissions from the Project would not cause or contribute to violations of any National Ambient Air Quality Standards (NAAQS) for the pollutants regulated under the PSD permit. The emissions of other air pollutants from the proposed Project, including the pollutants for which the area is not meeting the NAAQS (and precursors that lead to the formation of such pollutants), are regulated by the Antelope Valley Air Quality Management District (District), which implements the Nonattainment New Source Review (NNSR) permitting program for this area. On May 13, 2010, the District issued a Final Determination of Compliance (FDOC) for the Project, which includes the District’s NNSR permit requirements.

Page 2 of 4
Any interested person may submit written comments on EPA’s proposed PSD permit for the Project. All written comments on EPA’s proposed action must be received by EPA via email by September 14, 2011, or postmarked by September 14, 2011. Comments must be sent or delivered in writing to Lisa Beckham at one of the following addresses:
E-mail: [email protected] U.S. Mail: Lisa Beckham (AIR-3) U.S. EPA Region 9 75 Hawthorne Street San Francisco, CA 94105-3901 Phone: (415) 972-3811 Alternatively, written comments may be submitted to EPA at the Public Hearing for this matter that will be held on September 14, 2011, as described below. Comments should address the proposed permit and facility, including such matters as:
1. The Best Available Control Technology (BACT) determinations; 2. The effects, if any, on Class I areas; 3. The effect of the proposed facility on ambient air quality; and 4. The attainment and maintenance of the NAAQS.
EPA will hold a Public Information Meeting for the purpose of providing interested parties with additional information and an opportunity for informal discussion of the proposed Project. The date, time and location of the Public Information Meeting are as follows:
Date: September 14, 2011 Time: 4:00 p.m. - 6:00 p.m. Location: Larry Chimbole Cultural Center Manzanita Ballroom, 2nd Floor
38350 Sierra Highway Palmdale, California 93550-4611
Pursuant to 40 CFR 124.12, EPA also intends to hold a Public Hearing to provide the public with further opportunity to comment on the proposed permit. At this Public Hearing, any interested person may provide written or oral comments, in English or Spanish, and data pertaining to the proposed permit. The date, time and location of the Public Hearing are as follows:
Date: September 14, 2011 Time: 7:00 p.m. – 10:00 p.m. Location: Larry Chimbole Cultural Center Manzanita Ballroom, 2nd Floor
38350 Sierra Highway Palmdale, California 93550-4611

Page 3 of 4
English-Spanish translation services will be provided at both the Public Information Meeting and the Public Hearing. If you require a reasonable accommodation please contact Terisa Williams, EPA Region 9 Reasonable Accommodations Coordinator, by August 31, 2011 at (415) 972-3829, or [email protected]. All information submitted by the applicant is available as part of the administrative record. The proposed air permit, fact sheet/ambient air quality impact report, permit application and other supporting information are available on the EPA Region 9 website at http://www.epa.gov/region09/air/permit/r9-permits-issued.html#pubcomment. The administrative record may also be viewed in person, Monday through Friday (excluding federal holidays) from 9:00 AM to 4:00 PM, at the EPA Region 9 address above. Due to building security procedures, please call Lisa Beckham at (415) 972-3811 at least 24 hours in advance to arrange a visit. Hard copies of the administrative record can be mailed to individuals upon request in accordance with Freedom of Information Act requirements as described on the EPA Region 9 website at http://www.epa.gov/region9/foia/. EPA’s proposed PSD permit for the Project and the accompanying fact sheet/ambient air quality impact report are available for review at the following locations: Antelope Valley Air Quality Management District, 43301 Division Street, Suite 206, Lancaster, CA 93535, (661) 723-8070; Palmdale City Library, 700 East Palmdale Boulevard, Palmdale, CA 93550-4742, (661) 267-5600; Lancaster Regional Library, 601 W. Lancaster Boulevard, Lancaster, CA 93534-3398, (661) 948-5029; Lake Los Angeles Library, 16921 East Avenue O, Palmdale, CA 93591-3045, (661) 264-0593; and Quartz Hill Library, 42018 N. 50th Street West, Quartz Hill, CA 93536-3590, (661) 943-2454. All comments that are received will be included in the public docket without change and will be available to the public, including any personal information provided, unless the comment includes Confidential Business Information (CBI) or other information whose disclosure is restricted by statute. Information that you consider CBI or otherwise protected should be clearly identified as such and should not be submitted through e-mail. If you send e-mail directly to the EPA, your e-mail address will be automatically captured and included as part of the public comment. Please note that an e-mail or postal address must be provided with your comments if you wish to receive direct notification of EPA’s final decision regarding the permit. EPA will consider all written and oral comments submitted during the public comment period before taking final action on the PSD permit application and will send notice of the final decision to each person who submitted comments and contact information during the public comment period or requested notice of the final permit decision. EPA will respond to all substantive comments in a document accompanying EPA’s final permit decision and will make the Public Hearing proceedings available to the public. EPA’s final permit decision will become effective 30 days after the service of notice of the decision unless:

Page 4 of 4
1. A later effective date is specified in the decision; or 2. The decision is appealed to EPA’s Environmental Appeals Board pursuant to 40 CFR
124.19; or 3. There are no comments requesting a change to the proposed permit decision, in which
case the final decision shall become effective immediately upon issuance. If EPA issues a final decision granting the PSD permit application for the Project, and there is no appeal, construction of the Project may commence, subject to the conditions of the PSD permit and other applicable permit and legal requirements. If you have questions, please contact Lisa Beckham at (415) 972-3811 or email at [email protected]. If you would like to be added to our mailing list to receive future information about this proposed permit decision or other PSD permit decisions issued by EPA Region 9, please contact Lisa Beckham at (415) 972-3811 or send an email to [email protected], or visit EPA Region 9's website at http://www.epa.gov/region09/air/permit/psd-public-guidelines.html. Please bring the foregoing notice to the attention of all persons who would be interested in this matter.

Excerpt
3

U.S. ENVIRONMENTAL PROTECTION AGENCY REGION IX
FACT SHEET AND AMBIENT AIR QUALITY IMPACT REPORT
For a Clean Air Act Prevention of Significant Deterioration Permit
Palmdale Hybrid Power Project PSD Permit Number SE 09-01
August 2011

This page left intentionally blank.

PROPOSED PREVENTION OF SIGNIFICANT DETERIORATION PERMIT PALMDALE HYBRID POWER PROJECT
Fact Sheet and Ambient Air Quality Impact Report (PSD Permit SE 09-01)
Table of Contents Acronyms & Abbreviations .......................................................................................................... i Executive Summary..................................................................................................................... 1 1. Purpose of this Document...................................................................................................... 1 2. Applicant ............................................................................................................................... 1 3. Project Location .................................................................................................................... 2 4. Project Description ................................................................................................................ 3 5. Emissions from the Proposed Project ..................................................................................... 7 6. Applicability of the Prevention of Significant Deterioration Regulations ................................. 9 7. Best Available Control Technology...................................................................................... 12
7.1 BACT for Natural Gas Combustion Turbine Generators ................................................ 16 7.1.1 Nitrogen Oxide Emissions ...................................................................................... 16 7.1.2 Carbon Monoxide Emissions .................................................................................. 20 7.1.3 PM, PM10 and PM2.5 Emissions ............................................................................... 23 7.1.4 GHG Emissions ..................................................................................................... 27 7.1.5 BACT During Startup and Shutdown ..................................................................... 31
7.2. BACT for Auxiliary Boiler and Heater ..................................................................... 32 7.2.1 Nitrogen Oxide Emissions ...................................................................................... 32 7.2.2 Carbon Monoxide Emissions .................................................................................. 33 7.2.3 PM, PM10 and PM2.5 Emissions ........................................................................... 34 7.2.4 GHG Emissions ..................................................................................................... 37
7.3 BACT for Emergency Internal Combustion Engines....................................................... 38 7.3.1 NOX, CO, PM, PM10, PM2.5, and GHG Emissions ............................................... 38
7.4 BACT for Cooling Tower .............................................................................................. 40 7.5 BACT for Fugitive Road Dust ....................................................................................... 43 7.6 BACT for Circuit Breakers ............................................................................................ 45 7.6.1 GHG ...................................................................................................................... 45
8. Air Quality Impacts ............................................................................................................. 46 8.1 Introduction ................................................................................................................... 47 8.1.1 Overview of PSD Air Impact Requirements ........................................................... 47 8.1.2 Identification of PHPP Modeling Documentation ................................................... 48
8.2. Background Ambient Air Quality ............................................................................. 49 8.3 Modeling Methodology for Class II areas ...................................................................... 50 8.3.1 Model selection ...................................................................................................... 50 8.3.2 Meteorology model inputs...................................................................................... 51 8.3.3 Land characteristics model inputs ........................................................................... 51 8.3.4 Model receptors ..................................................................................................... 52 8.3.5 Load screening and stack parameter model inputs .................................................. 53

ii
8.3.6 Good Engineering Practice (GEP) Analysis ........................................................... 54 8.4 National Ambient Air Quality Standards and PSD Class II Increment Consumption Analysis ............................................................................................................................... 55 8.4.1 Pollutants with significant emissions ....................................................................... 55 8.4.2 Preliminary analysis: Project-only impacts .............................................................. 55 8.4.3 Cumulative impact analysis..................................................................................... 56
8.5 Class I Area Analysis ..................................................................................................... 62 8.5.1 Class I Increment Consumption Analysis ................................................................ 63 8.5.2 Visibility and Deposition in Class I areas ................................................................ 63
9. Additional Impact Analysis .................................................................................................. 65 9.1 Soils and Vegetation ...................................................................................................... 66 9.2 Visibility Impairment...................................................................................................... 68 9.3 Growth .......................................................................................................................... 68
10. Endangered Species ............................................................................................................. 69 11. Environmental Justice Analysis ............................................................................................ 70 12. Clean Air Act Title IV (Acid Rain Permit) and Title V (Operating Permit) ........................... 70 13. Comment Period, Hearing, Public Information Meeting, Procedures for Final Decision, and EPA Contact.............................................................................................................................. 70 14. Conclusion and Proposed Action ......................................................................................... 73
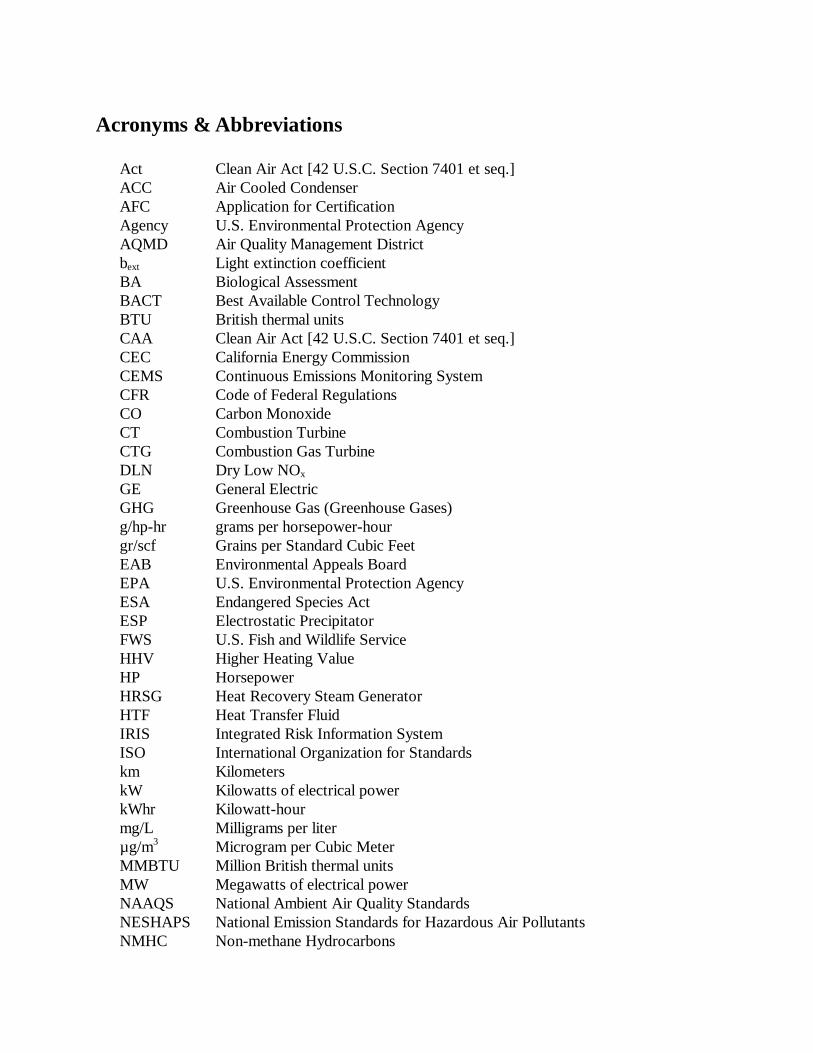
Acronyms & Abbreviations
Act Clean Air Act [42 U.S.C. Section 7401 et seq.] ACC Air Cooled Condenser AFC Application for Certification Agency U.S. Environmental Protection Agency AQMD Air Quality Management District bext Light extinction coefficient BA Biological Assessment BACT Best Available Control Technology BTU British thermal units CAA Clean Air Act [42 U.S.C. Section 7401 et seq.] CEC California Energy Commission CEMS Continuous Emissions Monitoring System CFR Code of Federal Regulations CO Carbon Monoxide CT Combustion Turbine CTG Combustion Gas Turbine DLN Dry Low NOx GE General Electric GHG Greenhouse Gas (Greenhouse Gases) g/hp-hr grams per horsepower-hour gr/scf Grains per Standard Cubic Feet EAB Environmental Appeals Board EPA U.S. Environmental Protection Agency ESA Endangered Species Act ESP Electrostatic Precipitator FWS U.S. Fish and Wildlife Service HHV Higher Heating Value HP Horsepower HRSG Heat Recovery Steam Generator HTF Heat Transfer Fluid IRIS Integrated Risk Information System ISO International Organization for Standards km Kilometers kW Kilowatts of electrical power kWhr Kilowatt-hour mg/L Milligrams per liter µg/m3 Microgram per Cubic Meter MMBTU Million British thermal units MW Megawatts of electrical power NAAQS National Ambient Air Quality Standards NESHAPS National Emission Standards for Hazardous Air Pollutants NMHC Non-methane Hydrocarbons

ii
NO Nitrogen oxide or nitric oxide NO2 Nitrogen dioxide NOx Oxides of Nitrogen (NO + NO2) NP National Park NSPS New Source Performance Standards, 40 CFR Part 60 NSR New Source Review O2 Oxygen PHPP Palmdale Hybrid Power Project PM Total Particulate Matter PM2.5 Particulate Matter less than 2.5 micrometers (μm) in diameter PM10 Particulate Matter less than 10 micrometers (μm) in diameter PPM Parts per Million PPMVD Parts per Million by Volume, on a Dry basis PSD Prevention of Significant Deterioration PTE Potential to Emit PUC Public Utilities Commission RATA Relative Accuracy Test Audit RBLC U.S. EPA RACT/BACT/LAER Information Clearinghouse SIL Significant Impact Level SF6 Sulfur Hexafluoride SNCR Selective Non-Catalytic Reduction SO2 Sulfur Dioxide SOx Oxides of Sulfur STG Steam Turbine Generator TDS Total Dissolved Solids TPY Tons per Year VV2 Victorville 2 (Hybrid Power Project) WA Wilderness Area

1
Proposed Prevention of Significant Deterioration (PSD) Permit Fact Sheet and Ambient Air Quality Impact Report
PALMDALE HYBRID POWER PROJECT
Executive Summary The City of Palmdale has applied to EPA Region 9 (EPA) for authorization under the Clean Air Act (CAA) Prevention of Significant Deterioration (PSD) program to construct a new power plant that will generate 570 megawatts (MW, nominal) of electricity using natural gas and solar energy. The power plant, known as the Palmdale Hybrid Power Project (PHPP or Project), will be located in the town of Palmdale, in Los Angeles County, California. EPA is issuing a proposed PSD permit for the PHPP, which is consistent with the requirements of the PSD program for the following reasons:
§ The proposed PSD permit requires the Best Available Control Technology
(BACT) to limit emissions of nitrogen oxides (NOx), carbon monoxide (CO), total particulate matter (PM), particulate matter under 10 micrometers (μm) in diameter (PM10), particulate matter under 2.5 (μm) in diameter (PM2.5), and greenhouse gases (GHG), to the greatest extent feasible;
§ The proposed emission limits will protect the National Ambient Air Quality
Standards (NAAQS) for nitrogen dioxide (NO2), CO, PM10, and PM2.5. There are no NAAQS for PM or Greenhouse Gases.
§ The facility will not adversely impact soils and vegetation, or air quality, visibility,
and deposition in Class I areas, which are parks or wilderness areas given special protection under the Clean Air Act.
1. Purpose of this Document
This document serves as the Fact Sheet and Ambient Air Quality Impact Report (Fact Sheet/AAQIR) for the proposed PSD permit for the City of Palmdale’s Project. This document describes the legal and factual basis for the proposed PSD permit, including requirements under the CAA, including CAA section 165 and the PSD regulations at Title 40 of the Code of Federal Regulations (CFR) section 52.21. This document also serves as a Fact Sheet for the proposed PSD permit per 40 CFR section 124.8.
2. Applicant
The name and address of the applicant is as follows:

2
City of Palmdale 38300 Sierra Highway, Suite A Palmdale, CA 93550
3. Project Location The proposed location for the Palmdale Hybrid Power Project is 950 East Avenue M, Palmdale, California 93550. It is located on an approximately 333-acre parcel west of the northwest corner of Air Force Plant 42, and east of the intersection of Sierra Highway and East Avenue M. The City of Palmdale is located within the Antelope Valley Air Quality Management District (District). The map below shows the approximate location of the proposed Project.

3
4. Project Description
The City of Palmdale has submitted to EPA an application for a PSD permit for the PHPP. The City of Palmdale’s application materials for the PSD permit for the Project are included in EPA’s administrative record for EPA’s proposed PSD permit. The PHPP will be owned by the City of Palmdale and the development of the Project will be managed by Inland Energy. We note that the City of Palmdale also has submitted applications for State and local construction approvals for the Project that are separate from EPA’s PSD permitting process. These applications are referred to as an Application for Certification (AFC) submitted to the California Energy Commission (CEC) and an application for a Determination of Compliance (DOC) submitted to the District. The District issued a final DOC for the Project on May 13, 2010. The CEC issued its Final Commission Decision approving the Project’s Application for Certification on August 10, 2011 (08-AFC-09). The PHPP is designed to use solar technology to generate a portion of the Project’s output. Primary equipment for the generating facility will include two General Electric (GE) Frame 7FA natural gas-fired combustion turbine-generators (CTGs) rated at 154 megawatt (MW, gross) each, two heat recovery steam generators (HRSGs), one steam turbine generator (STG) rated at 267 MW, and 251 acres of parabolic solar-thermal collectors with associated heat-transfer equipment. The Project will have an electrical output of 570 MW (nominal) or 563 MW (net). The GE CTG incorporates the “Rapid Start Process” (RSP), which allows for shorter startup durations of the gas turbines. Table 4-1 lists the equipment that will be regulated by this PSD permit:

4
Table 4-1: Equipment List
Equipment Description Two natural gas-fired GE 7FA Rapid Start Process combustion turbine generators (CTG) with Heat Recovery Steam Generators (HRSG)
• Each 154 MW (gross) CTG, with a maximum heat input rate of 1,736 MMBtu/hr (HHV)
• Equipped with natural gas duct burners, rated at 500 MMBtu/hr (HHV) for each turbine system
• Each CTG vented to a dedicated Heat Recovery Steam Generator (HRSG) and a shared 267 MW Steam Turbine Generator (STG)
• Emissions of NOX and CO controlled by Dry Low-NOX (DLN) Combustors, Selective Catalytic Reduction (SCR), and an Oxidation Catalyst (Ox-Cat)
Auxiliary Boiler • 110 MMBtu/hr (HHV) with ultra low-NOX burner, fired on natural gas
Emergency Diesel-fired Internal Combustion (IC) Engine
• 2,000 kW (2,683 hp) • 40 CFR Part 60, Subpart IIII emission standards • California Air Resources Board Tier 2 emission standards
Emergency Diesel-fired IC Firewater Pump Engine
• 182 hp (135 kW) • 40 CFR Part 60, Subpart IIII emission standards • California Air Resources Board Tier 3 emission standards
Auxiliary Heater • 40 MMBtu/hr (HHV) with ultra low-NOX burner, fired on natural gas
Cooling Tower • 130,000 gallons per minute maximum circulation rate • Total dissolved solids (TDS) concentration in makeup
water of 5,000 ppm (531 mg/L) • Drift eliminator with drift losses less than or equal to
0.0005 percent based on circulation rate Circuit Breakers • Enclosed-pressure SF6 Circuit Breakers
• 0.5% (by weight) annual leakage rate • 10% (by weight) leak detection system
Maintenance Vehicle Traffic Generating Fugitive Road Dust
• Maintenance vehicles generating fugitive road dust when traveling on paved and unpaved roadways in the solar field with the Project
• Project Fugitive Dust Control Plan
Electricity will be generated by the combustion turbine generators when the combustion of natural gas turns the turbine blades. The spinning blades will drive an electric generator with the potential to generate up to 154 megawatts (MW) of electricity from each turbine.

5
The facility will be operated in combined-cycle mode because each turbine will connect to a dedicated heat recovery steam generator (HRSG), where hot combustion exhaust gas will flow through a heat exchanger to generate steam. The facility will be equipped with duct burners firing natural gas to increase steam output from the HRSG during periods of peak demand. The hybrid plant design will include a 251-acre solar field that will consist of parabolic solar-thermal collectors and associated heat transfer equipment arranged in rows. The heat transfer fluid will be circulated to a boiler to supply steam directly to the HRSGs to increase electrical generation from the steam turbine. The fluid will then be recirculated to the solar arrays. An auxiliary heater will be used to ensure that the heat transfer fluid does not freeze and stays above 54 degrees F whenever the solar steam unit is off-line . The Project will require periodic vehicle travel over the unpaved portions of the solar field to perform routine maintenance including mirror washing, maintenance inspections and repairs of the piping network, herbicide application and dust suppressant application. Fugitive dust emissions are expected from maintenance vehicle traffic on the unpaved areas in the solar fields. The steam generated from each of the HRSGs will drive a 267 MW steam turbine. On sunny days, the solar array is capable of providing 50 MW of the total electrical generation from the steam turbine. Net power plant output, after subtracting electricity used on-site, will be 563 MW. Exhaust gas exiting the steam turbine will enter a condenser. Cooling water circulating through the condenser will condense the steam into water, which will be circulated back to each HRSG. The condenser cooling water will then flow through a mechanical draft wet cooling tower, where the remaining heat will be dissipated to the atmosphere, and small quantities of dissolved solids will become airborne as particulate matter. The diagram on the following page shows a simplified diagram of the proposed Palmdale Hybrid Power Project.

6

7
Air Pollution Control The PHPP will use Selective Catalytic Reduction (SCR) to reduce NOX emissions from the combustion turbine generators. The SCR will use aqueous ammonia as the reagent, where the catalyst facilitates the reaction of the ammonia with NOX to create atmospheric nitrogen (N2) and water. The PHPP will use an oxidation catalyst to reduce emissions of CO and volatile organic compounds (VOCs). Although CO is regulated in this proposed PSD permit, VOCs are regulated by the New Source Review (NSR) permit issued by the District, as explained in Section 6 below. Pipeline quality natural gas fuel and good combustion practices will be used to minimize particulate emissions. Thermal efficiency will be used to minimize GHG emissions. Additional equipment includes a natural gas-fired auxiliary boiler equipped with an ultra low-NOX burner, a natural gas-fired auxiliary heater equipped with an ultra low-NOX burner, a diesel-fired emergency generator and a diesel-fired emergency firewater pump engine both fired with ultra-low sulfur diesel fuel and compliant with federal NSPS requirements, and SF6 circuit breakers with leak detection systems. Power Plant Startup In a typical combined-cycle gas turbine power plant, components of the steam cycle cannot withstand rapid temperature changes, limiting how fast the steam turbine may be started. The “rapid start" design of the PHPP is expected to reduce the time required for the steam cycle to start up. This is important to air quality for two reasons. First, the exhaust gas temperature when the steam cycle is not operating is higher than the design temperature window for the SCR and oxidation catalysts. Second, the plant will generate more electricity for the amount of fuel burned when the hot gas turbine exhaust is used to power the steam generator in combined cycle.
The auxiliary boiler is primarily designed to shorten the duration of startups as part of GE’s RSP technology, thus minimizing emissions during CTG startup.
5. Emissions from the Proposed Project
This section describes the pollutants that are covered by the PSD program within the Antelope Valley Air Quality Management District (District), which is the area in which the Project is proposed to be located. The Clean Air Act’s New Source Review (NSR) provisions include two preconstruction permitting programs. First, the PSD program is intended to protect air quality in “attainment areas,”1 which are areas that meet the National Ambient Air Quality Standards (NAAQS). EPA is responsible for issuing PSD permits for major new stationary sources emitting pollutants that are in attainment with (or unclassifiable for) the NAAQS, in
1 PSD also applies to pollutants where the status of the area is uncertain (unclassifiable) for NAAQS.

8
general, and within the District. Second, the nonattainment NSR program applies in areas where pollutant concentrations exceed the NAAQS (“nonattainment areas”). The District implements the nonattainment NSR program for facilities within its boundaries emitting nonattainment pollutants and their precursors (e.g., volatile organic compounds and nitrogen oxides are precursors to ambient ozone). Therefore, pollutants that are in nonattainment with the NAAQS within the District are regulated under a separate nonattainment NSR permit issued by the District. Table 5-1 below describes the regulated pollutants that will be emitted by the Project and their attainment status within the District.
Table 5-1: National Ambient Air Quality Standard Attainment Status for Antelope Valley Air Quality Management District
Pollutant Attainment Status Permit Program
Nitrogen Dioxide (NO2) Attainment/Unclassifiable PSD Sulfur Dioxide (SO2) Attainment/Unclassifiable PSD
Carbon Monoxide (CO) Attainment PSD Particulate Matter (PM) n/a2 PSD
Particulate matter under 10 micrometers diameter (PM10)
Unclassifiable PSD
Particulate Matter under 2.5 micrometers diameter (PM2.5)
Attainment/Unclassifiable PSD
Ozone Nonattainment3 NA-NSR Lead (Pb) Attainment4 PSD
Sulfuric Acid Mist (H2SO4) n/a2 PSD Hydrogen Sulfide (H2S) n/a2 PSD
Total Reduced Sulfur (TRS) n/a2 PSD Fluorides n/a2 PSD
Greenhouse Gases (GHG) n/a2 PSD
The PSD program (40 CFR § 52.21) applies to “major” new sources of pollutants for which an area has been designated attainment or is unclassifiable. A fossil fuel-fired steam
2 There are no national ambient air quality standards (NAAQS) for PM, H2SO4, H2S, TRS, fluorides, or GHGs. However, in addition to other pollutants for which no NAAQS have been set, these pollutants are listed as regulated pollutants with a defined applicability threshold under the PSD regulations (40 CFR § 52.21). 3 Because NOx is also a precursor to ozone in this area, it will also be regulated by the separate District ozone non-attainment New Source Review permit in addition to this PSD permit. 4 Area has not yet been designated for lead and is therefore treated as an attainment area.

9
electric plant with a heat input capacity of 250 MMBtu/hr or greater, such as the PHPP, that emits or has the potential to emit (PTE) 100 tons per year (tpy) or more of any pollutant regulated under the Clean Air Act5, is defined as a “major source.”
6. Applicability of the Prevention of Significant Deterioration Regulations This section describes the PSD applicability thresholds, and our conclusion that NO2, CO, PM, PM10, PM2.5, and GHG will be regulated by EPA’s proposed PSD permit. The estimated emissions in Table 6-1 show that the PHPP will be a major source for NOx, CO, PM, PM10, PM2.5 and GHG. The annual emission data in Table 3 (based on allowable operation up to 8,760 hours per year) are based on the applicant’s maximum expected emissions, including emissions from startup and shutdown cycles. The applicant assumes that all combustion-related emissions of PM10 are of diameter less than 2.5 microns (i.e., PM2.5), which is a conservative estimate, as some particulate emissions may fall in the size fraction between 2.5 and 10 micrometers. Once a source is considered major for a PSD pollutant, PSD also applies to any other regulated pollutant that is emitted in a significant amount. The data in Table 3 show that emissions of sulfur dioxide (SO2) will be less than the major source threshold and less than the significant emission rate. Therefore, PSD does not apply for SO2. Estimated emissions of the PSD-regulated pollutants from each emission unit are listed in Table 6-1.
5 Other types of “source categories” are subject to either the same 100 tpy threshold, or else a 250 tpy threshold.

10
Table 6-1: Estimated Emissions and PSD Applicability
Pollutant Estimated Annual Emissions (tons/year)
Major Source Threshold (tons/year)
Significant Emission Rate
(tons/year)
Does PSD apply?
CO 250.2 100 100 Yes
NO2 114.9 100 40 Yes
PM 79.1 100 25 Yes
PM10 62.5 100 15 Yes
PM2.5 56.0 100 15 Yes
SO2 8.9 100 40 No
Pb 0 0.6 0.6 No
H2SO4 3.4 7 7 No
H2S (incl. TRS) 0 10 10
No
Fluorides 0 3 3 No
GHG (incl. CO2e) 1,913,000 100,000 75,000 Yes

11
Table 6-2: Estimated Emissions of PSD-Regulated Pollutants by Emission Unit
CO NOX PM PM10 PM2.5 GHG (a) CO2e (b)
Total Facility 250.2 tpy 114.9 tpy 79.1 tpy 62.5 tpy 56.0 1,913,376 1,913,000
CTG+HRSG (2) 248.0 113.7 47.8 47.8 47.8 1,908,074 1,908,000
Auxiliary Heater 0.74 0.22 0.15 0.15 0.15 2,340 2,000
Auxiliary Boiler 1.01 0.30 0.20 0.20 0.20 2,920 3,000 Emergency Diesel
Engine 0.39 0.67 0.02 0.02 0.02 27.6 0
Emergency Diesel Firewater Pump 0.03 0.03 0.002 0.002 0.002 4.41 0
Cooling Tower n/a n/a 7.13 7.13 7.13 n/a n/a Circuit Breakers n/a n/a n/a n/a n/a 9.56 0
Maintenance Vehicles (c) n/a n/a 23.80 7.16 0.72 n/a n/a
Notes:
(a) Represents all GHG emissions on a mass basis. (b) Represents the carbon dioxide equivalent (CO2e) of all GHG emissions, rounded to the nearest 1,000 tons. (c) This category represents fugitive road dust emissions (e.g., particulate matter emissions) that are expected from maintenance
vehicle traffic on the unpaved areas in the solar fields.

12
7. Best Available Control Technology
This section describes EPA’s Best Available Control Technology (BACT) analysis for the control of NOx, CO, PM, PM10, PM2.5, and GHG emissions from this facility. Section 169(3) of the Clean Air Act defines BACT as follows:
"The term 'best available control technology' means an emission limitation based on the maximum degree of reduction of each pollutant subject to regulation under the Clean Air Act emitted from or which results from any major emitting facility, which the permitting authority, on a case-by-case basis, taking into account energy, environmental, and economic impacts and other costs, determines is achievable through application of production processes and available methods, systems, and techniques, including fuel cleaning or treatment or innovative fuel combustion techniques for control of each such pollutant. In no event shall application of ‘best available control technology’ result in emissions of any pollutants which will exceed the emissions allowed by any applicable standard established pursuant to section 111 [New Source Performance Standards or NSPS] or 112 [or NESHAPS] of the Clean Air Act."
See also 40 CFR 52.21(b)(12). In accordance with 40 CFR 52.21(j), a new major stationary source is required to apply BACT for each regulated NSR pollutant that it would have the potential to emit (PTE) in significant amounts. EPA outlines the process it generally uses to do this case-by-case analysis (referred to as a “top-down” BACT analysis) in a June 13, 1989 memorandum. The top-down BACT analysis is a well-established procedure that EPA’s Environmental Appeals Board (EAB) has consistently followed in adjudicating PSD permit appeals. See, e.g., In re Knauf, 8 E.A.D. 121, 129-31 (EAB 1999); In re Maui Electric, 8 E.A.D. 1, 5-6 (EAB 1998).
In brief, under the top-down process, all available control technologies are ranked in descending order of control effectiveness. The PSD applicant first examines the most stringent technology. That technology is established as BACT unless it is demonstrated that technical considerations, or energy, environmental, or economic impacts justify a conclusion that the most stringent technology is not achievable for the case at hand. If the most stringent technology is eliminated, then the next most stringent option is evaluated until BACT is determined. The top-down BACT analysis is a case-by-case exercise for the particular source under evaluation. In summary, the five steps involved in a top-down BACT evaluation are:
1. Identify all available control options with practical potential for application to
the specific emission unit for the regulated pollutant under evaluation; 2. Eliminate technically infeasible technology options;

13
3. Rank remaining control technologies by control effectiveness; 4. Evaluate the most effective control alternative and document results,
considering energy, environmental, and economic impacts as appropriate; if top option is not selected as BACT, evaluate next most effective control option; and
5. Select BACT, which will be the most stringent technology not rejected based
on technical, energy, environmental, and economic considerations.
The proposed Project is subject to BACT for NOx, CO, PM, PM10, PM2.5, and GHG emissions. A BACT analysis was conducted for each of the following emission units: the two natural gas combustion turbines, the 40 MMBtu/hr auxiliary process heater, the 110 MMBtu/hr auxiliary boiler, the two diesel-fired internal combustion engines, the fugitive road dust emissions, the cooling tower and the circuit breakers. Tables 7-1 and 7-2 provide a summary of the BACT determinations for NOX, CO, PM, PM10, PM2.5, and GHG from the emission units listed above.

14
Table 7-1: Summary of NOX, CO, PM, PM10, and PM2.5 BACT Limits and Requirements for Testing and Monitoring6
NOX CO PM, PM10, and PM2.5
Restrictions on Usage
2 Combustion Turbines (each, no duct burning)
• 11.55 lb/hr • 1-hr average • 2.0 ppmvd, 15% O2 • CEMS • Quarterly and Annual
RATA for CEMs
• 5.74 lb/hr7 • 1-hr average • 1.5 ppmvd, 15% O2
8 • CEMS • Quarterly and Annual
RATA for CEMs
• 4.7 lb/hr • 3-hr average • 0.0027 lb/MMBtu • PUC natural gas (Sulfur
<0.20 gr/100 dscf on 12-month average and not exceed 1.0 gr/dscf at anytime)
• Annual Performance Testing
n/a
2 Combustion Turbines (each, with duct burning)
• 14.6 lb/hr • 1-hr average • 2.0 ppmvd, 15% O2
• 8.90 lb/hr • 1-hr average • 2.0 ppmvd,15% O2
• 8.0 lb/hr • 3-hr average • 0.0035 lb/MMBtu • PUC natural gas (Sulfur
<0.20 gr/100 dscf on 12-month average and not exceed 1.0 gr/dscf at anytime)
• Annual Performance Testing
• Total duct burning (D3 & D4) < 2,000 hrs/yr
2 Combustion Turbines (each, startup and shutdown)
• Cold Start - 52.4 lb/hr, 96 lb/event
• Warm/Hot – 30 lb/hr, 40 lb/event
• Shutdown – 114 lb/hr, 57 lb/event
• 1-hr average
• Cold Start - 224 lb/hr, 410 lb/event
• Warm/Hot – 247 lb/hr, 329 lb/event
• Shutdown – 674 lb/hr, 337 lb/event
• 1-hr average
n/a • Cold Start –110 minutes
• Warm/Hot – 80 minutes
• Shutdown – 674 30 minutes
Heater 40 MMBtu/hr (HHV)
• 9.0 ppm, 3% O2 • 3-hr average • Initial Performance
Testing and at least every 5 years
• 50.0 ppm, 3% O2 • 3-hr average • Initial Performance
Testing and at least every 5 years
• 0.3 lb/hr for Heater • 0.8 lb/hr for Boiler • 3-hr average • PUC natural gas (Sulfur
<0.20 gr/100 dscf on 12-month average and not exceed 1.0 gr/dscf at anytime)
• 1,000 hr/yr • Non-resettable
elapsed time meter
Boiler 35 MMBtu/hr (HHV)
• 500 hr/yr • Non-resettable
elapsed time meter
6 PHPP must keep all records of all testing, fuel use, and fuel testing requirements for a period of five (5) years and must report excess emissions to EPA semi-annually, except when: more frequent reporting is specifically required by an applicable subpart; or the Administrator, on a case-by-case basis, determines that more frequent reporting is necessary to accurately assess the compliance status of the source. . 7 During the initial 3-year demonstration period, the limit will be 7.65 lb/hr. 8 During the initial 3-year demonstration period, the limit will be 2.0 ppmvd, 15% O2.

15
NOX CO PM, PM10, and PM2.5
Restrictions on Usage
Emergency Generator 2000 KW (2,683 hp)
• 6.4 g/KW-hr, (4.8 g/hp-hr)9
• 3-hr average • Initial Performance
Testing
• 3.5 g/KW-hr, (2.6 g/hp-hr)
• 3-hr average • Initial Performance
Testing
• 0.20 g/KW-hr, (0.15 g/hp-hr)
• 3-hr average • Exclusive use of ultra
low sulfur fuel, not to exceed 15 ppmvd sulfur
• Fuel Supplier Certification
• Initial Performance Testing
• 50 hr/year • Non-resettable
elapsed time meter
Firewater Pump Engine 135 KW (182 hp)
• 4.0 g/KW-hr, (3.0 g/hp-hr)10
• 3-hr test average • Initial Performance
Testing
• 50 hr/year • As required for
fire testing • Non-resettable
elapsed time meter
Cooling tower 130,000 gpm
n/a n/a • 1.6 lb/hr (total PM) • < 0.0005% drift
eliminators • < 5000 ppm total
dissolved solids • Weekly water quality
testing
n/a
Circuit Breakers
na/ n/a n/a n/a
Maintenance Vehicle
n/a n/a • Fugitive Dust Control Plan
n/a
9 Emission standards for NOx in the New Source Performance Standard for stationary compression ignition internal combustion engines (40 CFR Part 60 Subpart IIII) and the California Tier Emission Standards are based on the sum of NOx and non-methane hydrocarbons (NMHC). For the NOx emission limits, the applicant assumes NMHC + NOx emissions from the engine are 95% NOX. 10 Ibid.

16
Table 7-2: Summary of GHG BACT Limits
and Requirements for Testing and Monitoring
GHG Testing and Monitoring
Restrictions on Usage
2 Combustion Turbines (each, no duct burning)
• 774 lb CO2/MWh source-wide net output
• 117 lb CO2/MMBtu heat input, each at ISO standard day conditions
• 30-day rolling average
• CEMS
n/a
2 Combustion Turbines (each, with duct burning)
• Total duct burning (D3 & D4) < 2,000 hrs/yr
2 Combustion Turbines (each, startup and shutdown)
• Cold Start –110 minutes
• Warm/Hot – 80 minutes
Heater 40 MMBtu/hr (HHV)
• Annual tune-ups
• Non-resettable elapsed time meter
• 1,000 hr/yr
Boiler 35 MMBtu/hr (HHV)
• Non-resettable elapsed time meter
• 500 hr/yr
Circuit Breakers
• 9.56 tpy CO2e • 0.5% maximum
annual leakage rate
• 10% leak detection system
• Monthly pounds of dielectric fluid added
n/a
7.1 BACT for Natural Gas Combustion Turbine Generators The PHPP will have two combined-cycle, natural gas-fired combustion turbines (CTs). Each CT has a maximum heat input capacity of 1,736 MMBtu/hr (at ISO conditions) and will have a dedicated heat recovery steam generator (HRSG) with a 550 MMBtu/hr duct burner. Each duct burner will be limited to 2,000 hours of operation per year. The CTs are subject to BACT for NOX, CO, PM, PM10, PM2.5, and GHGs. A top-down BACT analysis for each pollutant has been performed and is summarized below.
7.1.1 Nitrogen Oxide Emissions Step 1 - Identify All Control Technologies The following inherently lower-emitting control options for NOX emissions include:
• Low NOX burner design (e.g., dry low NOX (DLN) combustors)

17
• Water or steam injection • Inlet air coolers
The available add-on NOX control technologies include:
• Selective Catalytic Reduction (SCR) system • EMxTM system (formerly SCONOx) • Selective non-catalytic reduction (SNCR)
Step 2 – Eliminate Technically Infeasible Options All of the available control options identified in Step 1 are technically feasible. Step 3 – Rank Control Technologies A summary of recent BACT limits for similar combined-cycle, natural gas-fired CTs is provided in Table 7-3. There is one facility that was permitted with a BACT limit less than the limit proposed by the applicant. The IDC Bellingham facility in Massachusetts was permitted in 2000 with a limit of 1.5 ppm. However, this project was cancelled, so this limit has never been demonstrated as achievable. All recently issued permits indicate that a limit of 2.0 ppm based on a 1-hr average represents the highest level of NOX control. The available control technologies are ranked according to control effectiveness in Table 7-4. SCR and EMxTM for NOX Emissions Selective catalytic reduction (SCR) is a well-demonstrated technology for NOX control and has specifically achieved NOX emissions of 2.0 ppm on a 1-hr average on large CTs (greater than 100 MW). EMxTM technology (formerly SCONOx) is a relatively newer technology that has yet to be demonstrated in practice on CTs larger than 50 MW. The manufacturer has stated that it is a scalable technology and that NOX guarantees of <1.5 ppm are available.11 As a result, EMxTM is considered technically feasible for this facility. However, it is unclear what NOX emission levels can actually be achieved by the technology. We found only one BACT analysis that determined that EMxTM/SCONOx was BACT for a large CT. However, the accompanying permit for the facility, Elk Hills Power in California, allowed the use of SCR or SCONOx (the former name of EMxTM) to meet a permit limit of 2.5 ppm, and the actual technology that was installed in that case was SCR. We also note that the Redding Power Plant in California, a 43 MW gas-fired CT, was permitted with a 2.0 ppm demonstration limit using SCONOx. In a letter dated June 23, 2005 from the Shasta County Air Quality Management District (Shasta County AQMD) to the Redding Electric Utility, however, it was determined that the unit could not meet the demonstration limit and, as a result, the limit was revised to 2.5 ppm. Based on these two examples, it appears EMxTM has been demonstrated to achieve only 2.5 ppm and we are therefore evaluating it at this limit.
11 Information available at http://emerachemnew.ciplex.us/emx-product.html. See EMx White Paper 2008.
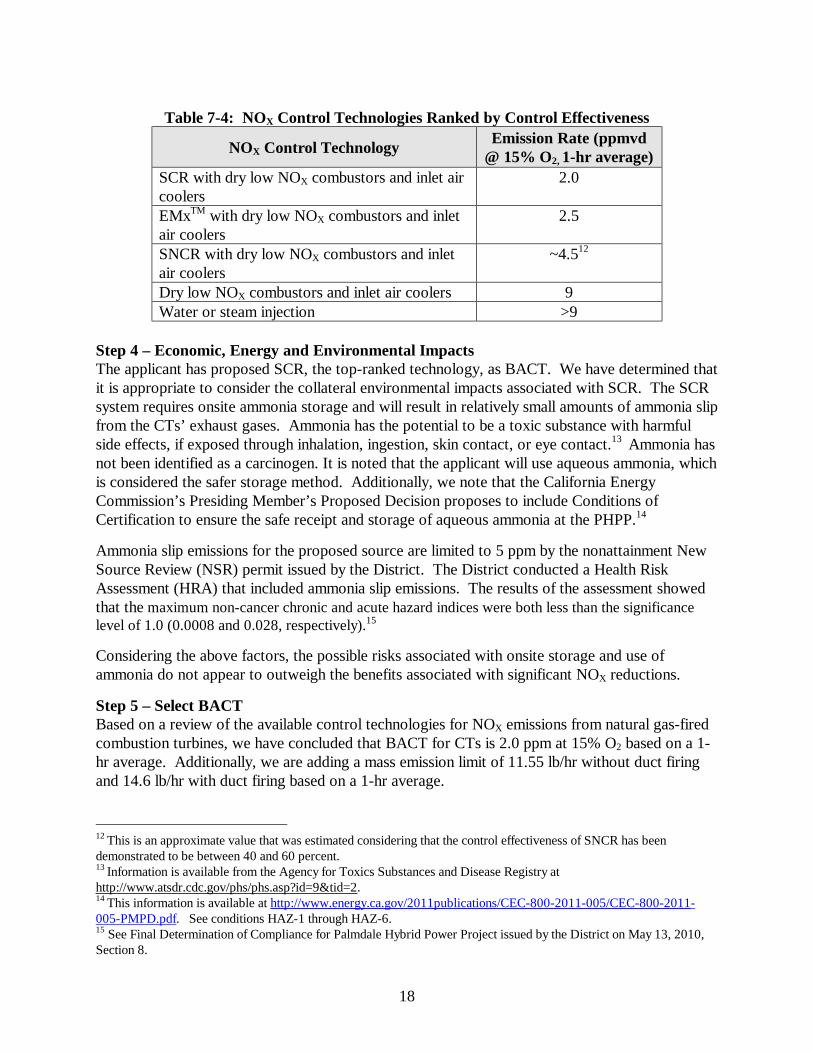
18
Table 7-4: NOX Control Technologies Ranked by Control Effectiveness
NOX Control Technology Emission Rate (ppmvd @ 15% O2, 1-hr average)
SCR with dry low NOX combustors and inlet air coolers
2.0
EMxTM with dry low NOX combustors and inlet air coolers
2.5
SNCR with dry low NOX combustors and inlet air coolers
~4.512
Dry low NOX combustors and inlet air coolers 9 Water or steam injection >9
Step 4 – Economic, Energy and Environmental Impacts The applicant has proposed SCR, the top-ranked technology, as BACT. We have determined that it is appropriate to consider the collateral environmental impacts associated with SCR. The SCR system requires onsite ammonia storage and will result in relatively small amounts of ammonia slip from the CTs’ exhaust gases. Ammonia has the potential to be a toxic substance with harmful side effects, if exposed through inhalation, ingestion, skin contact, or eye contact.13 Ammonia has not been identified as a carcinogen. It is noted that the applicant will use aqueous ammonia, which is considered the safer storage method. Additionally, we note that the California Energy Commission’s Presiding Member’s Proposed Decision proposes to include Conditions of Certification to ensure the safe receipt and storage of aqueous ammonia at the PHPP.14
Ammonia slip emissions for the proposed source are limited to 5 ppm by the nonattainment New Source Review (NSR) permit issued by the District. The District conducted a Health Risk Assessment (HRA) that included ammonia slip emissions. The results of the assessment showed that the maximum non-cancer chronic and acute hazard indices were both less than the significance level of 1.0 (0.0008 and 0.028, respectively).15
Considering the above factors, the possible risks associated with onsite storage and use of ammonia do not appear to outweigh the benefits associated with significant NOX reductions.
Step 5 – Select BACT Based on a review of the available control technologies for NOX emissions from natural gas-fired combustion turbines, we have concluded that BACT for CTs is 2.0 ppm at 15% O2 based on a 1-hr average. Additionally, we are adding a mass emission limit of 11.55 lb/hr without duct firing and 14.6 lb/hr with duct firing based on a 1-hr average. 12 This is an approximate value that was estimated considering that the control effectiveness of SNCR has been demonstrated to be between 40 and 60 percent. 13 Information is available from the Agency for Toxics Substances and Disease Registry at http://www.atsdr.cdc.gov/phs/phs.asp?id=9&tid=2. 14 This information is available at http://www.energy.ca.gov/2011publications/CEC-800-2011-005/CEC-800-2011-005-PMPD.pdf. See conditions HAZ-1 through HAZ-6. 15 See Final Determination of Compliance for Palmdale Hybrid Power Project issued by the District on May 13, 2010, Section 8.

19
Table 7-3: Summary of Recent NOX BACT Limits for Similar Combined-Cycle, Natural gas-fired CTs
Facility Location NOX Limit Averaging Period Control Permit Issuance Source
Avenal Energy Project16 California 2.0 ppm 1-hr SCR May 2011 PSD Permit Warren County Power Station Virginia 2.0 ppm 1-hr SCR/DLN December 2010 PSD Permit Carty Power Plant Oregon 2.0 ppm 3-hr rolling SCR Draft December 2010 RBLC # OR-0048 Langley Gulch Power Plant Idaho 2.0 ppm 3-hr rolling SCR/DLN Draft December 2010 RBLC # ID-0018 Live Oaks Power Plant Georgia 2.5 ppm 3-hr SCR/DLN April 2010 RBLC # GA-0138 Colousa Generating Station California 2.0 ppm 1-hr SCR March 2010 PSD Permit Victorville II Hybrid Power Project California 2.0 ppm 1-hr SCR February 2010 PSD Permit Madison Bell Energy Center Texas 2.0 ppm 24-hr rolling SCR August 2009 RBLC # TX-0548 Chouteau Power Plant Oklahoma 2.0 ppm 1-hr SCR/DLN January 2009 RBLC # OK-0129 Kleen Energy Systems Connecticut 2.0 ppm 1-hr SCR/LNB February 2008 RBLC # CT-0151 PSO Southwestern Power Plant Oklahoma 9.0 ppm -- DLN February 2007 RBLC # OK-0117 FPL West County Energy Center Unit 3 Florida 2.0 ppm 24-hr SCR/DLN July 2008 RBLC # FL-0303
FMPA Cane Island Power Park Florida 2.0 ppm 24-hr SCR September 2008 RBLC # FL-0304 Blythe Energy LLC (Blythe II) California 2.0 ppm 3-hr SCR/DLN April 2007 PSD Permit
Elk Hills Power California 2.5 ppm 1-hr SCR/DLN or SCONOX January 2006 PSD Permit
Modification
Rocky Mountain Energy Center Colorado 3.0 ppm 1-hr SCR/LNB May 2006 RBLC # C0-0056 San Joaquin Valley Energy Center California 2.0 ppm 1-hr SCR/DLN August 2006 PSD permit
Walnut Energy Center California 2.0 ppm 1-hr SCR 2004 California Energy Commission
Donald Von Raesfeld Power Plant California 2.0 ppm 1-hr SCR 2003 California Energy Commission
IDC Bellingham Massachusetts 1.5 ppm 1-hr SCR 2000 SCAQMD - project cancelled
16 We note that this permit is currently the subject of an administrative appeal to EPA’s EAB; however, the appeal does not pertain specifically to the BACT analysis for NOx or the permit’s emission limits for NOx.

20
7.1.2 Carbon Monoxide Emissions Step 1 – Identify All Control Technologies The inherently lower-emitting control options for CO emissions include:
• Good combustion practices The available add-on CO control technologies include:
• Oxidation catalyst • EMxTM
Step 2 – Eliminate Technically Infeasible All of the available control options identified in Step 1 are technically feasible. Step 3 – Rank Remaining Control Technologies A summary of recent BACT limits for similar combined-cycle, natural-gas fired CTs is provided in Table 7-5. The applicant proposed using oxidation catalyst with a limit of 2.0 ppm (with and without duct burning) based on a 1-hr average. Currently, the lowest permitted limit for oxidation catalyst is the Kleen Energy facility in Connecticut, which has a limit of 0.9 ppm (1.8 ppm with duct firing) based on a 1-hr average. The Kleen Energy facility has recently begun commercial operation, but results from compliance demonstration testing are not available at this time.17 The next most stringent permitted limit is the Avenal Energy Project in California, which has a limit of 1.5 ppm following a demonstration period18 (2.0 ppm with duct burning) and also uses oxidation catalyst. The Avenal Energy Project has not begun construction at this time. Based on this information, oxidation catalyst is being evaluated at the most stringent control option. Oxidation Catalyst and EMxTM Oxidation catalyst is a well-demonstrated technology for large CTs. As discussed in the NOX BACT analysis, it is clear that EMxTM is an available and technically feasible technology. However, it is unclear what level of control would be achieved by the technology on a long-term basis with a short (1-hr) averaging period. The manufacturer claims that emission rates below 1 ppm are achievable, but there is a lack of information that demonstrates this on large CTs. We are not aware of any BACT determinations that have required EMxTM for CO emissions. Based on the lack of information for similar units, EMxTM is conservatively being compared as equivalent to oxidation catalyst.
17 See August 4, 2011 email from Louis Corsino to Lisa Beckham – “Kleen Energy – Middletown, CT”. 18 This limit becomes effective after a 3-year demonstration period, during which the limit is 2.0 ppm. As noted above, this permit is currently the subject of an administrative appeal to EPA’s EAB; however, the appeal does not pertain specifically to the BACT analysis for CO or the permit’s emission limits for CO..

21
The available control technologies are ranked according to control effectiveness in Table 7-6.
Table 7-6: CO Control Technologies Ranked by Control Effectiveness
CO Control Technology
Emission Rate (ppmvd @ 15% O2, 1-hr average, without
duct firing)
Emission Rate (ppmvd @ 15% O2, 1-hr average, with
duct firing) Oxidation catalyst and good combustion practices
0.9-2.0 ppm 2.0-2.4 ppm
EMxTM and good combustion practices
0.9–2.0 ppm 2.0-2.4 ppm
Good combustion practices 8.0 ppm 8.0 ppm Step 4 – Economic, Energy and Environmental Impacts Although EMxTM is being considered equivalent to oxidation catalyst for controlling CO emissions, it was determined to be inferior to SCR for controlling NOX emissions. Because EMxTM would not ensure BACT is achieved for NOX, it is being eliminated in this step due to environmental impacts. Overall, better and more reliable pollution control for NOX and CO will be achieved for the Project with SCR and oxidation catalyst than with EMX
TM. We are not aware of any significant or unusual adverse environmental impacts associated with good combustion practices and an oxidation catalyst. Step 5 – Select BACT Based on the review of the available control technologies, we have concluded that BACT for CO is good combustion practices and an oxidation catalyst with a limit of 1.5 ppm at 15% O2 based on a 1-hr average without duct firing, and 2.0 ppm with duct firing. Additionally, we are adding a mass emission limit of 5.74 lb/hr without duct firing and 8.90 lb/hr with duct firing based on a 1-hr average. However, given the lack of long-term compliance data for the lower limits that would apply without duct firing, we feel it is appropriate to include permit provisions establishing a three-year demonstration period for those limits, during which time the limit will be 2.0 ppm at 15% O2 and 7.65 lb/hr based on a 1-hr average without duct firing. Demonstration period permit provisions will require that, prior to construction, the permittee submit design specifications as proof that the gas turbines were designed to achieve 1.5 ppm. The permittee must also submit a plan that sets forth the measures that will be taken to maintain the system and optimize its performance. The permittee must operate the gas turbines according to the design specifications and within the design parameters, and consistent with the maintenance and performance optimization plan. Following the first three years of commercial operation, the limits of 1.5 ppm (1-hour average) without duct firing will take effect unless the emissions and operating data collected by the applicant indicates that these limits are not feasible, and the applicant submits an application to EPA no later than the end of the 3-year period requesting a revision to the limit. If such a revision is requested but EPA determines that a revision is not warranted, the lower emission limit will become applicable.

22
Table 7-5: Summary of Recent CO BACT Limits for Similar Combined-Cycle, Natural gas-fired CTs
Facility Location CO Limit (CO Limit with duct
firing) Averaging Period Control Permit Issuance Source
Avenal Energy Project California 1.5 ppm19 (2.0 ppm) 1-hr Oxidation
catalyst June 2011 PSD Permit
Warren County Power Station Virginia 1.5 ppm (2.4
ppm with duct burning)
1-hr Oxidation catalyst/GCP December 2010 PSD Permit
Langley Gulch Power Plant Idaho 2.0 ppm 3-hr rolling Oxidation catalyst/GCP
Draft December 2010 RBLC # ID-0018
Live Oaks Power Plant Georgia 2.0 ppm 3-hr Oxidation catalyst/GCP April 2010 RBLC # GA-0138
Colousa Generating Station California 3.0 ppm 3-hr Oxidation catalyst March 2010 PSD Permit
Victorville II Hybrid Power Project California 2.0 ppm (3.0
ppm) 1-hr Oxidation catalyst February 2010 PSD Permit
Madison Bell Energy Center Texas 17.5 ppm 1-hr rolling GCP August 2009 RBLC # TX-0548
Chouteau Power Plant Oklahoma 8.0 ppm 1-hr GCP January 2009 RBLC # OK-0129 Lamar Power Partners II Texas 15 ppm 24-hr rolling GCP June 2009 RBLC # TX-0547
Patillo Branch Power Plant Texas 2.0 ppm 3-hr rolling Oxidation catalyst June 2009 RBLC # TX-0546
Cane Island Power Park Florida 8 ppm 24-hr GCP September 2008 RBLC # FL-0304
Elk Hills Power California 4.0 ppm 1-hr Oxidation catalyst January 2006 PSD Permit
Modification
Kleen Energy Systems Connecticut 0.9 ppm (1.8
ppm with duct firing)
1-hr Oxidation catalyst February 2008 RBLC # CT-0151
19 This limit becomes effective after a 3-year demonstration period. During the demonstration period, the limit is 2.0 ppm.

23
7.1.3 PM, PM10 and PM2.5 Emissions Because the applicant has assumed that all particulate emissions from the turbines are PM2.5, the BACT analyses for PM, PM10 and PM2.5 have been combined. Additionally, the analysis evaluates total particulate emissions – condensable and filterable. Step 1 – Identify All Control Technologies The following inherently lower-emitting control options for PM, PM10, and PM2.5 emissions include:
• Low particulate fuels, low sulfur fuels, and/or pipeline natural gas (also referred to as “clean fuel”)
• Good combustion practices (including air inlet filter) The available add-on PM, PM10, PM2.5 control technologies include:
• Cyclones (including multiclones) • Wet scrubber • Dry electrostatic precipitator (ESP) • Wet ESP • Baghouse/fabric filter.
Step 2 – Eliminate Technically Infeasible Control Options All of the control technologies identified are technically feasible except for cyclones (including multiclones). Although cyclones have been identified as being capable of marginal PM2.5 control20, the low grain loading makes them technically infeasible for this application. EPA’s Air Pollution Control Technology Fact Sheet for Cyclones (EPA-452/F-03-005) identifies typical grain loading for cyclones as ranging from 1.0 to 100 gr/scf and being as low as 0.44 gr/scf.21 In contrast, the grain loading for the CTs’ exhaust stream would be about 0.0015 gr/scf based on the applicant’s proposed BACT limits. Cyclones are generally used in high dust applications where a majority of the particulate emissions are filterable emissions. In contrast, the majority of emissions from the CTs will be condensable particulate matter. Step 3 – Rank Remaining Control Technologies A review of other BACT limits for similar combined-cycle natural gas-fired CTs is provided in Table 7-7. We note that many BACT determinations that were concluded prior to January 1, 2011 included limits only for filterable PM.22 Because our BACT analysis for the Project must address total PM (filterable plus condensable), we did not further evaluate PM limits addressing 20 –Information available at http://www.epa.gov/apti/Materials/APTI%20413%20student/413%20Student%20Manual/SM_ch%204.pdf. 21 Information is available at http://www.epa.gov/ttn/catc/dir1/fcyclon.pdf. 22 See 40 CFR 52.21(b)(50) – On or after January 1, 2011, such condensable particulate matter shall be accounted for in applicability determinations and in establishing emissions limitations for PM, PM2.5, and PM10 in PSD permits.

24
solely filterable PM, which would not be applicable here. The applicant proposed a total PM limit of 12 lb/hr without duct firing and 18 lb/hr with duct firing. In order to compare these emission rates to similar facilities, these limits were converted to lb/MMBtu – 0.0069 lb/MMBtu, and 0.0079 lb/MMBtu, respectively. The most recently permitted units with total PM limits using lb/MMBtu are Warren County Power Station in Virginia (Warren County) and the Chouteau Power Plant in Oklahoma (Chouteau). Of these two facilities, only the Chouteau unit is operational and demonstrated to be in compliance with its PM limits.23 The applicant’s proposed emission rates appear to be significantly higher on a lb/MMBtu basis when compared to Chouteau (0.0035 lb/MMBtu) and Warren County (0.0027 lb/MMBtu without duct burning and 0.0040 lb/MMBtu with duct burning). The results from the total PM testing at Chouteau showed total PM emissions to be equivalent to 0.0029 lb/MMBtu (with a 99 MMBtu/hr duct burner).24 Therefore, we believe the uncontrolled emission rates that should be evaluated are 0.0027 lb/MMBtu without duct burning and 0.0035 lb/MMBtu with duct burning. We were not able to identify any CT using add-on PM controls; however, such controls are considered technically feasible and are therefore being further evaluated. Wet ESP has been evaluated as the highest performing control option because all particulate emissions are expected to be PM2.5 and wet ESP is expected to perform better in this range as compared to the other add-on control technologies. The applicant eliminated the wet scrubber as an option due to possible increases in PM emissions associated with the total dissolved solids (TDS) content of the water available at the facility. However, it is not clear this has ever been demonstrated as a problem and therefore we have conservatively included wet scrubber for further consideration in the BACT analysis. We identified a control efficiency of 90% for this option based on the document used by the applicant for the economic analysis - “Controlling Fine Particulate Matter Under the Clean Air Act: A Menu of Options,” prepared by the State and Territorial Air Pollution Program Administrators (STAPPA) and Association of Local Air Pollution Control Officials (LAPCO) (hereinafter “Controlling Fine PM”). 25 The applicant also conservatively assumed 99% PM2.5 control for baghouse and dry ESP.
23 See August 3, 2011email from Lisa Beckham, EPA Region 9, to Shirley Rivera, EPA Region 9 re: “Chouteau Power Plant in Oklahoma”. 24 See August 8, 2011 emails from Lisa Beckham, EPA Region 9, to Shirley Rivera, EPA Region 9 re: “Chouteau Power Plant in Oklahoma”. 25 Information is available at http://www.4cleanair.org/PM25Menu-Final.pdf.

25
Table 7-7: Summary of Recent PM BACT Limits for Similar Combined-Cycle, Natural gas-fired CTs
Facility Location PM Limit (PM Limit w/Duct Firing)
Type of PM - Filterable(F),
Total(T)
Averaging Period Control Permit
Issuance Source
Avenal Energy Project26 California 8.91 lb/hr (11.78 lb/hr)27 TPM10
12-month rolling
Natural Gas Fuel June 2011 PSD Permit
Warren County Power Station Virginia 8 lb/hr (14 lb/hr) TPM10, TPM2.5 3-hr --- December 2010 PSD Permit
Warren County Power Station Virginia 0.0027 lb/MMBtu
(0.0040 lb/MMBtu) TPM10, TPM2.5 3-hr --- December 2010 PSD Permit
Carty Plant Oregon 2.5 lb/MMscf FPM10 --- Clean Fuel Draft December 2010 RBLC # OR-0048
Langley Gulch Power Plant Idaho No limit FPM10 --- GCP Draft December
2010 RBLC # ID-0018
Colusa Generating Station California 13.5 lb/hr TPM, TPM10 12-month
rolling Natural Gas
Fuel March 2010 PSD Permit
Victorville II Hybrid Power Project California 12.0 lb/hr (18.0 lb/hr) TPM, TPM2.5 12-month
rolling Natural Gas
Fuel March 2010 PSD Permit
Chouteau Power Plant Oklahoma 6.59 lb/hr, 0.0035 lb/MMBtu TPM10 3-hr Natural Gas
Fuel January 2009 RBLC # OK-0129
Cane Island Power Park Florida 2 gr S/100 scf TPM10 --- Fuel Spec September 2008 RBLC # FL-0304 FPL West County Energy
Center Unit 3 Florida 2 gr S/100 scf PM/PM10/PM2.5 --- Fuel Spec July 2008 RBLC # FL-0303
Plaquemine Cogeneration Facility Louisiana 33.5 lb/hr, 0.02
lb/MMBtu FPM10, TPM --- Clean Fuel July 2008 RBLC # LA-0136
Aresnal Hill Power Plant Louisiana 24.23 lb/hr FPM --- GCP/Pipeline NG Mar-08 RBLC # LA-0224
Kleen Energy Systems Connecticut 11 lb/hr (15.2 lb/hr) FPM10 --- --- February 2008 RBLC # CT-0151
26 As noted above, this permit is currently under administrative appeal; however, the appeal does not pertain specifically to the BACT analysis for PM10 or to the permit’s emissions limits for PM10. 27 These limits are equivalent to 0.0048 lb/MBBtu without duct firing and 0.0049 lb/MMBtu with duct firing, based on the size of the CTs and duct burners.

Palmdale (SE 09-01) Fact Sheet/Ambient Air Quality Impact Report August 2011
26
The available add-on control technologies are ranked according to control effectiveness in Table 7-8.
Table 7-8: PM Control Technologies Ranked by Control Effectiveness
PM Control Technologies Emission Rate
(lb/MMBtu, 3-hr average)
Emission Rate w/Duct Burners (lb/MMBtu, 3-hr
average) Wet ESP 0.00004 0.00004 Dry ESP/Baghouse 0.00004 0.00004 Wet Scrubber (Venturi) 0.0004 0.0004 Baseline (Clean Fuel) 0.0027 0.0035
Step 4 – Economic, Energy and Environmental Impacts The applicant provided a cost analysis based on information provided in Controlling Fine PM. A modified version of this analysis is provided in Table 7-9. The amount of PM2.5 removed is based on the baseline (natural gas) emission rates in Table 7-8. Because add-on PM controls have not been applied to CTs, the control efficiencies evaluated are considered conservative. With cost-effectiveness values ranging between $109,000 and $193,000 per ton of PM2.5 removed, add-on controls are considered cost-prohibitive for the PHPP.
Table 7-9: Cost Analysis for Add-on PM Control Technologies
Wet ESP Dry ESP Baghouse (pulse-jet cleaned)
Wet Scrubber (Venturi)
Flowrate (ft3/min) 946,777 946,777 946,777 946,777 Capital Costs ($/scfm) $20 $10 $6 $3 Capital Costs ($) $18,935,540 $9,467,770 $5,680,662 $2,366,942.50 Cost Recovery Factor 0.11 0.11 0.11 0.11 Annualized Capital Costs ($/yr) $2,082,909 $1,041,454.70 $624,872.82 $260,363.68 O & M Costs ($/scfm) $5 $3 $5 $4.40 O & M Costs ($/yr) $4,733,885 $2,840,331 $4,733,885 $4,165,819 Total Annualized Costs ($/yr) $6,816,794 $3,881,786 $5,358,758 $4,426,182 Removal Efficiency 99.1% 99% 99% 90% Tons of PM2.5 Removed (TPY) 35.38 35.34 35.34 32.13 Cost Effectiveness ($/ton removed) $192,680 $109,830 $151,620 $137,760 Step 5 – Select BACT After eliminating wet ESP, dry ESP, fabric filter, and wet scrubber due to economic impacts, we

Palmdale (SE 09-01) Fact Sheet/Ambient Air Quality Impact Report August 2011
27
have determined that BACT is clean fuel, good combustion practices, a PM, PM10, and PM2.5 limit of 0.0027 lb/MMBtu without duct burning and a limit of 0.0035 lb/MMBtu with duct burning based on a 3-hr average. Additionally, we are setting mass emission limits of 4.7 lb/hr without duct firing and 8.0 lb/hr with duct firing based on a 3-hr average. By “clean fuel” we mean Public Utilities Commission (PUC)-quality natural gas. PUC-quality pipeline natural gas shall not exceed a sulfur content of 0.20 grains per 100 dry standard cubic feet on a 12-month rolling average and shall not exceed a sulfur content of 1.0 grains per 100 dry standard cubic feet, at any time. This limit is lower than the limit proposed by the applicant. However, when comparing the applicant’s proposed emission rates to other recently permitted sources, the applicant’s values are in some cases twice as high. The applicant relied solely on the Victorville II facility in California in proposing emission rates. While the two facilities are very similar, a BACT analysis should be more comprehensive in evaluating proposed limits. A broader review of recent BACT determinations demonstrates that BACT is lower than the limits proposed by the applicant.
7.1.4 GHG Emissions Step 1 – Identify all control technologies The inherently lower-emitting control options for GHG emissions include28:
• Use of new thermally efficient combined cycle gas turbines – A combined-cycle gas turbine recovers the waste heat from the gas turbine using a heat recovery steam generator (HRSG). The use of the HRSG allows more energy to be produced without additional fuel use.
The add-on control options for GHG emissions include: • Carbon capture and sequestration (CCS) – CCS is a technology that involves capture and
storage of CO2 emissions to prevent their release to the atmosphere. For a gas turbine, this includes removal of CO2 emissions from the exhaust stream, transportation of the CO2 to an injection site, and injection of the CO2 into available sequestration sites. Potential CO2 sequestration sites include geological formations (including oil and gas fields for enhanced recovery) and ocean storage.
Step 2 – Eliminate technically infeasible control technologies CCS As described briefly above, CCS involves three main components: capturing the CO2 emissions from the exhaust stream, transporting the captured CO2 to the sequestration site, and injection of the CO2 into a geologic reservoir for long-term sequestration. All three of these aspects are relevant when determining whether CCS is technically feasible for a particular project.
28 In addition to the measures discussed here specifically for the gas turbines, we note that the project design includes 50 MW of potential solar thermal power generation, which represents an inherently lower-emitting technology for the facility as a whole.

Palmdale (SE 09-01) Fact Sheet/Ambient Air Quality Impact Report August 2011
28
The applicant proposed to eliminate CCS because CO2 capture is not technically feasible for CTs. The applicant identified three potential processes for capturing CO2 from flue gas: solvent-based processes, sorbent-based processes, and membrane-based processes. The applicant concluded that these processes were not technically feasible due to limited experience in the energy industry and lack of commercial demonstrations. However, commercial CO2 recovery plants have been in existence since the late 1970s, with at least one plant capturing CO2 from gas turbines.29,30 The applicant also identified as a hurdle that commercial demonstrations have only captured a fraction of the CO2 in flue gas. This consideration appears to be less of a technical feasibility issue than one of cost, which would be more appropriately addressed in Step 4 of the BACT analysis. Based on available information, we consider carbon capture from gas turbines to be technically feasible for the Project. In its application, the applicant identified several geological formations in the lower San Joaquin Valley and Ventura County that could potentially provide a suitable site for geologic sequestration; a map of those sites provided in the Project application is provided in Figure 7-1. While geotechnical analyses have not been conducted to verify the suitability of these sites, other proposals have been made to capture and sequester CO2 emissions in the San Joaquin Valley; as a result, there is a reasonable presumption that suitable sequestration sites do exist in these areas despite the lack of extensive studies prepared for this Project. Nevertheless, the primary issue with the feasibility of CCS in this case lies with the location of the PHPP in relation to the sequestration sites and the surrounding geography. As shown in the figure above, significant mountain ranges lie between the project location and the potential sequestration sites (oil fields, gas fields, and ocean storage). Sequestration of CO2 emissions from the Project would require construction of CO2 pipelines through these mountains. The offsite logistical barriers of constructing such a pipeline (e.g., land acquisition, permitting, liability, etc.) make this technology technically infeasible for the Project. Because constructing a new CO2 pipeline was determined to be technically infeasible, the applicant also evaluated whether CO2 pipelines were already available near the proposed Project. The Technical Advisory Committee for the California Carbon Capture and Storage Review Panel stated in an August 2010 report that there are no existing CO2 pipelines in California.31 In addition, based on a search of the California Environmental Quality Act (CEQA) State Clearinghouse database maintained by the California Office of Planning and Research, there are no CO2 pipeline projects underway in California subject to CEQA. Last, the applicant also contacted the Department of Oil, Gas and Geothermal Resources and facilities operating in Kern County, and again, found no existing pipelines in California. 29 Herzog, H.J., “An Introduction to CO2 Separation and Capture Technologies,” Energy Laboratory Working Paper, (1999). Available at http://sequestration.mit.edu/pdf/introduction_to_capture.pdf. 30 Johnson, D., Reddy, S., & Brown, J.H. (2009), Commercially Available CO2 Capture Technology. Power. Retrieved from http://www.powermag.com/coal/2064.html. 31 This information is available at http://climatechange.ca.gov/carbon_capture_review_panel/meetings/2010-08-18/white_papers/Carbon_Dioxide_Pipelines.pdf.

Palmdale (SE 09-01) Fact Sheet/Ambient Air Quality Impact Report August 2011
29
Figure 7-1 Potential CO2 Sequestration Sites in Southern California
Data source: National Energy Technology Laboratory, Department of Energy. 2010 Carbon
Sequestration Atlas of the United States and Canada, Third Edition
In sum, while we have determined that CO2 capture and storage is technically feasible, we conclude that transport of the captured CO2 to the potential sequestration sites is not feasible. As a result, CCS is not technically feasible for the Project and will not be considered further in the BACT analysis. We note that evaluation of long-term CO2 storage is an important part of the

Palmdale (SE 09-01) Fact Sheet/Ambient Air Quality Impact Report August 2011
30
technical feasibility analysis. However, because transport of CO2 is not technically feasible, it is not necessary to evaluate the feasibility of CO2 storage. Step 3 – Rank remaining control technologies After elimination of CCS as a potential control technology, the use of a thermally efficient combined-cycle gas turbine and a combined-cycle facility are the only control methods remaining. The expected emissions from a facility with these control options is compared with the emissions from a simple-cycle gas turbine in Table 7-10. Currently, the only other similar facility with a GHG BACT limit is the Russell City Energy Center, to be located in Hayward, California. The PSD permit for this facility has a voluntary GHG limit of a heat rate not to exceed 7,730 Btu/kWh for each CT and HRSG.
Table 7-10: GHG Control Technologies Ranked by Control Effectiveness
GHG Control Technologies Emission Rate (lb CO2/MWh)
New combined-cycle gas CT 774 Existing combined-cycle CTs32 824-996 Simple-cycle CTs33 1,319
Step 4 – Economic, Energy, and Environmental Impacts The applicant has chosen the highest ranked control option for each unit, and we are not aware of any significant or unusual adverse environmental impacts associated with the chosen technology. Step 5 – Select BACT Based on a review of the available control technologies for GHG emissions from natural gas-fired combustion turbines, we have concluded that BACT for this source is the use of new thermally efficient CTs and emission limits of 774 lb CO2/MWh for source-wide net output, and 117 lb CO2/MMBtu heat input for each gas turbine and duct burner (both based on a 30-day rolling average). The emission limits are based on the emission factor provided by the applicant of 53.06 kg/MMBtu, the 1,736 MMBtu/hr heat input of each CT operating 8,760 hours per year, and the 550 MMBtu/hr duct burner for each CT operating 2,000 hours per year. A number of issues regarding these limits bear clarification. First, the pollutant that is subject to regulation under the Clean Air Act for PSD permitting purposes is a group of six gases: carbon dioxide, methane, nitrous oxide, hydrofluorocarbons, perfluorocarbons, and sulfur hexafluoride. As a general matter, it may thus be appropriate to establish BACT limits on a CO2e basis. In this case, however, we have elected to establish the BACT limit for CO2 specifically. The purpose of this is to enable the use of CO2 CEMS for monitoring purposes. Because the CEMS are required for other regulatory purposes, they offer a cost-effective and reliable method for monitoring
32 These figures are based on GHG performance information provided by the applicant in Tables 3 and 4 to the PHPP GHG BACT Analysis dated May 2011. These values are derived from 2008 data from the California Energy Commission for similar facilities with energy output of at least 3,000 GWh per year. 33 These numbers are based on the proposed CTs operating in simple cycle with a gross output of 154 MW each.

Palmdale (SE 09-01) Fact Sheet/Ambient Air Quality Impact Report August 2011
31
compliance. Using CO2 as a surrogate for the total emissions on a CO2e basis is appropriate in this case because nitrous oxide and methane are emitted from CTs in minor amounts and the majority of the GHG emissions actually are CO2. For example, EPA’s emission factors for CO2, methane, and nitrous oxide from the combustion of natural gas are 53.06 kg/MMBtu, 0.0059 kg/MMBtu, and 0.0001 kg/MMBtu, respectively. The emission factor for all GHGs on a CO2e basis is 53.21 kg/MMBtu. Thus, even after accounting for the global warming potential of methane and nitrous oxide, the CO2 emission factor accounts for 99.7% of the emission on a CO2e basis. Further, an emission limitation that limits CO2 emissions from the combustion of natural gas inherently limits the emission of methane and nitrous oxide. As a result, we believe that for this particular source, formulating the emission limits and monitoring requirements in terms of CO2 rather than on a CO2e basis is appropriate. The applicant has proposed a BACT limit of 1,020,000 tons of CO2 per year for each CT. However, a limit based on the amount of CO2 generated per MWh will ensure that the CTs are operating at peak efficiency. An input-based limit is also necessary to ensure peak operating efficiency of the gas turbine because the solar thermal operation will at times contribute to the electric output.
7.1.5 BACT During Startup and Shutdown It is not technically feasible to use SCR and oxidation catalyst to control NOX and CO emissions when the equipment is outside of the manufacturer’s recommended operating temperature ranges. For SCR and oxidation catalyst this occurs during turbine startup or shutdown. Therefore, BACT is achieved by minimizing the time for startup and shutdown. The PHPP will have a 110 MMBtu/hr auxiliary boiler that will be used to reduce the startup time for each turbine. The applicant has proposed the following NOX and CO emission rate limits for each event:
• Hot/Warm Startup: 40 pounds of NOX and 329 pounds of CO per turbine • Cold Startup: 96 pounds of NOX and 410 pounds of CO per turbine • Shutdown: 57 pounds of NOX and 337 pounds of CO per turbine
An evaluation of startup and shutdown emission limits for other similar sources found a wide range of limits. In many cases, limits are based on pounds per hour or pound per event,34 and this approach makes it difficult to compare BACT determinations because mass emission rates vary based on the size of the unit. Other facilities have longer averaging periods (24-hr), which may incorporate startup and shutdown emissions. Because the PHPP has short 1-hour averaging periods, it is appropriate to set limits on a mass basis and limit the duration of startup and shutdown events. Based on the available information, the emission rate limits and fast startup and shutdown times for the CTs represent BACT for NOx and CO during startup and shutdown. Therefore, we have determined that BACT during startup and shutdown for NOX and CO for the PHPP is as described below in Table 7-11.
34 Recently issued permits with these types of limits include the permits for the Avenal Energy Project in California, the Russell City Energy Project in California, the Victorville II Hybrid Power Project in California, and the Colusa Generating Station in California.

Palmdale (SE 09-01) Fact Sheet/Ambient Air Quality Impact Report August 2011
32
In addition, we have determined that the startup duration limits also constitute BACT for GHG emissions, because the shorter startup time increases the overall thermal efficiency of the facility. Therefore, BACT for the PHPP’s GHG emissions during startup is 110 minutes for a cold startup and 80 minutes for a warm/hot startup.
Table 7-11: Summary of NOX and CO BACT Limits During Startup and Shutdown
NOX CO Duration
Cold Startup 96 lb/event 410 lb/event
110 minutes 52.4 lb/hr 224 lb/hr
Warm/Hot Startup 40 lb/event 329 lb/event
80 minutes 30 lb/hr 247 lb/hr
Shutdown 57 lb/event 337 lb/event
30 minutes 114 lb/hr 334.6 lb/hr
7.2. BACT for Auxiliary Boiler and Heater The applicant is proposing to construct a 110 MMBtu/hr boiler that will be used to start up the CTs, and a 40 MMBtu/hr heat transfer fluid (HTF) heater as part of the solar array system. Both units will be fired with natural gas. The boiler will be limited to 500 hours of operation per year and the HTF heater will be limited to 1,000 hours of operation per year. The low hours of operation and low emission rates proposed result in very low tons per year emission rates for each unit. The boiler and HTF heater are subject to BACT for NOX, CO, PM, PM10, PM2.5, and GHGs. A top-down BACT analysis for each pollutant has been performed and is summarized below.
7.2.1 Nitrogen Oxide Emissions Step 1 - Identify All Control Options The following inherently lower-emitting control options for NOX emissions include:
• Low NOX burner design (e.g. low NOX burners, flue gas recirculation) • Limited use of equipment (limits on the hours of operation)
The available add-on NOX control technologies include:
• Selective Catalytic Reduction (SCR) system • EMxTM system (formerly SCONOx) • Selective non-catalytic reduction (SNCR)
Step 2 – Eliminate Technically Infeasible Options SCR, EMxTM, and SNCR are considered technically infeasible control options. The applicant estimated the exhaust temperature for each unit at 300°F. This is below the temperature operating range for SCR, EMxTM, and SNCR, which are all generally above 400°F.

Palmdale (SE 09-01) Fact Sheet/Ambient Air Quality Impact Report August 2011
33
Step 3 – Rank remaining control technologies The applicant proposed a NOX emission limit of 9 ppm at 3% O2 based on a 3-hr average using ultra-low NOX burner design. With the proposed low NOX burner designs and limited hours of operation the auxiliary boiler will emit up to 0.30 TPY of NOX and the heater will emit up to 0.22 TPY. A review of other BACT determinations was not performed because it is very unlikely that a more detailed review would change the final determination due to the limited use and low ton per year emission rates associated with the proposed limits.
Table 7-12: .NOX Control Technologies Ranked by Control Effectiveness
NOX Control Technologies Emission Rate (ppmvd @ 3% O2)
Low NOX burners and limited use 9 Step 4 – Economic, Energy, and Environmental Impacts The applicant has chosen the highest ranked control option for each unit, and we are not aware of any significant or unusual environmental impacts associated with the chosen technology. Step 5 – Select BACT Based on the review of the available control technologies, we have concluded BACT is the limited hours of operation, ultra-low NOX burners and an emission rate of 9.0 ppm at 3% O2 based on a 3-hr test average.
7.2.2 Carbon Monoxide Emissions Step 1 – Identify All Control Technologies The following inherently lower-emitting control options for CO emissions include:
• Good combustion practices • Limited use (limits on the hours of operation)
The available add-on CO control technologies include:
• Oxidation catalyst • EMxTM (formerly SCONOX)
Step 2 – Eliminate Technically Infeasible Oxidation catalyst and EMxTM are considered technically infeasible control options. The applicant estimated the exhaust temperature for each unit at 300F. This is below the temperature operating range for oxidation catalyst and EMxTM, which are generally above 400F. Step 3 – Rank Remaining Control Technologies The applicant proposed a CO limit of 50 ppm at 3% O2 based on a 3-hr average using good combustion practices. With the proposed good combustion practices and limited hours of operation, the auxiliary boiler will emit up to 1.01 TPY, and the heater will emit up to 0.74 TPY, of CO. A review of other BACT determinations was not performed because it is very unlikely

Palmdale (SE 09-01) Fact Sheet/Ambient Air Quality Impact Report August 2011
34
that a more detailed review would change the final determination due to the limited use and low ton per year emission rates associated with the proposed limits.
Table 7-13: CO Control Technologies Ranked by Control Effectiveness
CO Control Technologies Emission Rate (ppmvd @ 3% O2)
Good combustion practices and limited use
50
Step 4 – Economic, Energy and Environmental Impacts The applicant has chosen the highest ranked control option for each unit, and we are not aware of any significant or unusual adverse environmental impacts associated with the chosen technology. Step 5 – Select BACT Based on the review of the available control technologies, we have concluded that BACT is the limited hours of operation, good combustion practices and an emission rate of 50.0 ppm at 3% O2
based on a 3-hr test average.
7.2.3 PM, PM10 and PM2.5 Emissions The applicant has assumed that all particulate emissions from the auxiliary boiler and process heater are PM2.5. As a result, the BACT analyses for PM, PM10 and PM2.5 have been combined. Additionally, the analysis evaluates total particulate matter – filterable and condensable. Step 1 – Identify All Control Technologies The following inherently lower-emitting control options for PM, PM10, and PM2.5 emissions include:
• Low particulate fuels, low sulfur fuels, and/or pipeline natural gas (also referred to as “clean fuel”)
• Good combustion practices (including air inlet filter) • Limited use (limits on the hours of operation)
The available add-on PM, PM10, PM2.5 control technologies include:
• Cyclones (including multiclones) • Wet scrubber • Dry electrostatic precipitator (ESP) • Wet ESP • Baghouse/fabric filter.
Step 2 – Eliminate Technically Infeasible Control Options

Palmdale (SE 09-01) Fact Sheet/Ambient Air Quality Impact Report August 2011
35
All of the control technologies identified are technically feasible except for cyclones (including multiclones). As evaluated for the CTs, the low grain loading associated with natural gas emissions makes cyclones technically infeasible for this application. Step 3 – Rank Remaining Control Technologies We were not able to identify any CT using add-on PM controls; however, they are considered technically feasible and are therefore being further evaluated. The available control technologies are ranked according to control effectiveness in Table 7-14. This analysis is based on the PM, PM10, and PM2.5 analysis for the CTs. With the proposed good combustion practices and limited hours of operation, the auxiliary boiler will emit up to 0.25 TPY of PM, PM10, and PM2.5 and the heater will emit up to 0.15 TPY. A review of other BACT determinations was not performed because it is very unlikely that a more detailed review would change the final determination due to the limited use and low ton per year emission rates associated with the proposed limits.
Table 7-14: PM Control Technologies Ranked by Control Effectiveness
PM Control Technologies Control Efficiency
Wet ESP 99.1% Dry ESP/baghouse 99% Wet Scrubber (Venturi) 90% Clean fuel, good combustion practices, and limited use 0% (baseline)
Step 4 – Economic, Energy and Environmental Impacts The applicant eliminated the use of add-on PM controls for each unit because of the associated economic impacts. The 110 MMBtu/hr auxiliary boiler is limited to 500 hours of operation per year and has a potential to emit 0.2 TPY of PM, PM10, and PM2.5. The 40 MMBtu/hr heater is limited to 1,000 hours of operation per year and has a potential to emit 0.15 TPY of PM, PM10, and PM2.5. Due to the limited hours of operation and limited environmental benefit it would be impractical to require add-on controls to remove less than 0.45 TPY of PM, PM10, and PM2.5. However, the applicant also provided an economic analysis for add-on controls, which is provided in Tables 7-15 and 7-16.

Palmdale (SE 09-01) Fact Sheet/Ambient Air Quality Impact Report August 2011
36
Table 7-15: Cost Analysis for Add-on PM Control Technologies for the Auxiliary Boiler
Control Device Wet ESP Dry ESP Pulse Jet Fabric Filter
Wet Scrubber
Flowrate (scfm) 28416 28416 28416 28416 Capital Costs ($/scfm) $20 $10 $6 $3 Capital Costs ($) $568,320 $284,160 $170,496 $71,040.00 Cost Recovery Factor 0.11 0.11 0.11 0.11 Annualized Capital Costs ($/yr) $62,515 $31,257.60 $18,754.56 $7,814.40 O & M Costs ($/scfm) $5 $3 $5 $4.40 O & M Costs ($/yr) $142,080 $85,248 $142,080 $125,030 Total Annualized Costs ($/yr) $204,595 $116,506 $160,835 $132,845 Removal Efficiency 99.1% 99% 99% 90% Tons of PM2.5 Removed (TPY) 0.20 0.20 0.20 0.18 Cost Effectiveness ($/ton removed) $1,032,300 $588,400 $812,300 $738,000
Table 7-16: Cost Analysis for Add-on PM Control Technologies for the HTF Heater
Control Device Wet ESP Dry ESP Baghouse (pulse- jet cleaned)
Wet Scrubber
Flowrate (scfm) 10612 10612 10612 10612 Capital Costs ($/scfm) $20 $10 $6 $3 Capital Costs ($) $212,240 $106,120 $63,672 $26,530.00 Cost Recovery Factor 0.11 0.11 0.11 0.11 Annualized Capital Costs ($/yr) $23,346 $11,673.20 $7,003.92 $2,918.30 O & M Costs ($/scfm) $5 $3 $5 $4.40 O & M Costs ($/yr) $53,060 $31,836 $53,060 $46,693 Total Annualized Costs ($/yr) $76,406 $43,509 $60,064 $49,611 Removal Efficiency 99.1% 99% 99% 90% Tons of PM2.5 Removed (TPY) 0.15 0.15 0.15 0.14 Cost Effectiveness ($/ton removed) $514,000 $293,000 $404,500 $367,500
Step 5 – Select BACT Based on the review of the available control technologies, we have concluded BACT is the limited hours of operation, good combustion practices, and clean fuel. By “clean fuel” we mean Public Utilities Commission (PUC)-quality natural gas. PUC-quality pipeline natural gas shall not exceed a sulfur content of 0.20 grains per 100 dry standard cubic feet on a 12-month rolling average and shall not exceed a sulfur content of 1.0 grains per 100 dry standard cubic feet, at any time.

Palmdale (SE 09-01) Fact Sheet/Ambient Air Quality Impact Report August 2011
37
Additionally, based on the PTE for each unit, we are setting a PM, PM10, and PM2.5 limit of 0.8 lb/hr for the boiler and 0.3 lb/hr for the HTF heater based on a 3-hr average.
7.2.4 GHG Emissions Step 1 – Identify all control technologies The applicant generally assumed that the auxiliary boiler and HTF heater would incorporate the newest designs that increase thermal efficiency, such as new burner technologies and modern optimized instrumentation and controls. The inherently lower-emitting control options for GHG emissions include:
• Conducting an annual boiler tune-up – this would ensure that optimal thermal efficiency is maintained. Maintaining higher thermal efficiency reduces the amount of fuel combusted, which helps to minimize GHG emissions.
The add-on control options for GHG emissions include: • CCS – CCS is a technology that involves capture and storage of CO2 emissions to prevent
their release to the atmosphere. For a gas turbine, this includes removal of CO2 emissions from the exhaust stream, transportation of the CO2 to an injection site, and injection of the CO2 into available sequestration sites. Potential CO2 sequestration sites include geological formations (including oil and gas fields for enhanced recovery) and ocean storage.
Step 2 – Eliminate technically infeasible control technologies CCS The GHG BACT analysis for the CTs, discussed above, concluded that although CO2 capture and storage is technically feasible, transport of the captured CO2 to the potential sequestration sites is not technically feasible. Using this same analysis, CCS is also not technically feasible for the auxiliary boiler and HTF heater and will not be considered further in the BACT analysis. Step 3 – Rank remaining control technologies After elimination of CCS as a potential control technology, the purchase of thermally efficient units and annual boiler tune-ups are the remaining technologies. Both of these options will be required. Step 4 – Economic, Energy, and Environmental Impacts The applicant has chosen the highest ranked control option for each unit, and we are not aware of any significant or unusual adverse environmental impacts associated with the chosen technology.

Palmdale (SE 09-01) Fact Sheet/Ambient Air Quality Impact Report August 2011
38
Step 5 – Select BACT Based on a review of the available control technologies for GHG emissions from natural gas-fired boilers and process heaters, we have concluded that BACT for this source is the purchase of thermally efficient units, conducting annual boiler tune-ups on each unit, limiting the auxiliary boiler to a heat input of 110 MMBtu/hr and 500 hours of operation per year based on a 12-month rolling total, and limiting the HTF heater to 40 MMBtu/hr and 1,000 hours of operation per year based on 12-month rolling total. Currently, there are no other facilities with GHG BACT limits for limited use natural gas-fired boilers and process heaters.
7.3 BACT for Emergency Internal Combustion Engines The project includes a 2,862 HP (2134 kW) diesel-fired emergency generator and a 182 HP (138kW) diesel-fired emergency fire pump engine. Each engine will be limited to 50 hours of operation each year. The low hours of operation result in very low tons per year emission rates for each unit. This equipment is subject to BACT for NOX, CO, PM, PM10, PM2.5, and GHGs. A top-down BACT analysis has been performed and is summarized below.
7.3.1 NOX, CO, PM, PM10, PM2.5, and GHG Emissions Step 1 -- Identify all control technologies The control options for NOX emissions from engines include SCR, NOX reducing catalyst, NOX adsorber, catalyzed diesel particulate filter, catalytic converter, and oxidation catalyst.35 A catalytic converter and oxidation catalyst are also control options for CO emissions. For PM, PM10, and PM2.5 emissions, a diesel particulate filter/trap can be added on. Unlike other combustion equipment (e.g., CTs and boilers), new engines are required to be certified in compliance with NSPS requirements, including emission limits, upon purchase. Different types of engines have different emission requirements based on the type of engine being purchased (emergency engine, emergency fire pump engine, or non-emergency engine). Engine manufacturers may need to employ some of the control technologies identified above in order to comply with the NSPS emission limits, depending on the type of engine and the applicable limits. The applicant is proposing to construct an emergency engine and an emergency fire pump engine. As a result, to comply with NSPS the applicant must purchase engines that meet the emission requirements for emergency engines and emergency fire pump engines. However, we note that the applicant could purchase engines that meet the NSPS standards for non-emergency engines, which have more stringent limits, and operate them as emergency engines. In addition, the applicant must comply with California Air Resources Board (CARB) emission standards (Tier 2 standards for the emergency generator and Tier 3 standards for the emergency fire pump engine); however, the CARB standards are the same as the applicable NSPS requirements. As a result, this review identifies the control technologies to be:
35 The applicant discusses these control options in Section 8.4 of the “Supplemental Information for the Application for PSD Permit” dated July 21, 2010.
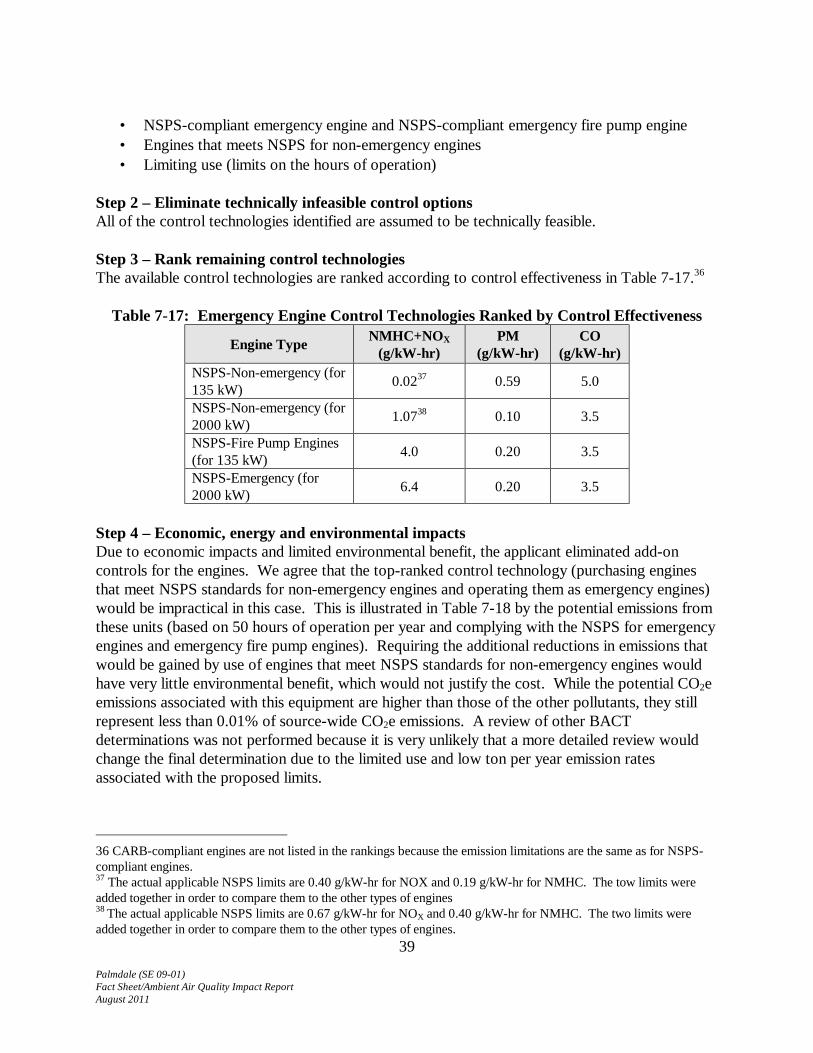
Palmdale (SE 09-01) Fact Sheet/Ambient Air Quality Impact Report August 2011
39
• NSPS-compliant emergency engine and NSPS-compliant emergency fire pump engine • Engines that meets NSPS for non-emergency engines • Limiting use (limits on the hours of operation)
Step 2 – Eliminate technically infeasible control options All of the control technologies identified are assumed to be technically feasible. Step 3 – Rank remaining control technologies The available control technologies are ranked according to control effectiveness in Table 7-17.36
Table 7-17: Emergency Engine Control Technologies Ranked by Control Effectiveness
Engine Type NMHC+NOX (g/kW-hr)
PM (g/kW-hr)
CO (g/kW-hr)
NSPS-Non-emergency (for 135 kW) 0.0237 0.59 5.0
NSPS-Non-emergency (for 2000 kW) 1.0738 0.10 3.5
NSPS-Fire Pump Engines (for 135 kW) 4.0 0.20 3.5
NSPS-Emergency (for 2000 kW) 6.4 0.20 3.5
Step 4 – Economic, energy and environmental impacts Due to economic impacts and limited environmental benefit, the applicant eliminated add-on controls for the engines. We agree that the top-ranked control technology (purchasing engines that meet NSPS standards for non-emergency engines and operating them as emergency engines) would be impractical in this case. This is illustrated in Table 7-18 by the potential emissions from these units (based on 50 hours of operation per year and complying with the NSPS for emergency engines and emergency fire pump engines). Requiring the additional reductions in emissions that would be gained by use of engines that meet NSPS standards for non-emergency engines would have very little environmental benefit, which would not justify the cost. While the potential CO2e emissions associated with this equipment are higher than those of the other pollutants, they still represent less than 0.01% of source-wide CO2e emissions. A review of other BACT determinations was not performed because it is very unlikely that a more detailed review would change the final determination due to the limited use and low ton per year emission rates associated with the proposed limits.
36 CARB-compliant engines are not listed in the rankings because the emission limitations are the same as for NSPS-compliant engines. 37 The actual applicable NSPS limits are 0.40 g/kW-hr for NOX and 0.19 g/kW-hr for NMHC. The tow limits were added together in order to compare them to the other types of engines 38 The actual applicable NSPS limits are 0.67 g/kW-hr for NOX and 0.40 g/kW-hr for NMHC. The two limits were added together in order to compare them to the other types of engines.

Palmdale (SE 09-01) Fact Sheet/Ambient Air Quality Impact Report August 2011
40
Table 7-18: Summary of Potential to Emit for Emergency Engines
Pollutant Emergency Generator
(TPY)
Emergency Fire Pump Engine
(TPY) NOX 0.67 0.03 CO 0.39 0.03 PM, PM10, PM2.5 0.02 <0.01 CO2e 27.6 4.41
Step 5 – Select BACT Based on the review of the available control technologies, we have concluded that BACT is the limited hours of operation and the emission limits listed in Table 7-19 based on a 3-hour average.39 The NSPS for engines does not currently regulate GHG emissions, but a separate GHG limit is not being proposed. It is assumed that newly purchased engines would be the most energy efficient available and that operating in compliance with NSPS requirements will ensure that each engine is properly maintained and as efficient as possible.
Table 7-19: Summary of BACT Emission Limits for Emergency Engines
Engine NMHC+NOX (g/kW-hr)
PM (g/kW-hr)
CO (g/kW-hr)
135 kW Emergency Fire Pump Engine 4.0 0.20 3.5
2000 kW Emergency Engine 6.4 0.20 3.5
7.4 BACT for Cooling Tower The PHPP includes a 130,000 gallons per minute (gpm), ten-cell evaporative (wet) cooling tower. Fugitive particulate emissions are generated from the cooling tower due to the total dissolved solids (TDS) in the water. The cooling tower is subject to BACT for PM, PM10, and PM2.5. A top-down BACT analysis has been performed and is summarized below. The applicant conservatively assumed PM, PM10 and PM2.5 emissions from the cooling tower were equivalent. Step 1 – Available Control Technologies The following inherently lower-emitting control options for PM, PM10, and PM2.5 emissions include:
• Dry cooling - uses an air cooled condenser (ACC) that cools the steam turbine-generators’ exhaust steam using a large array of fans that force air over finned tube heat exchangers. The exhaust from the steam turbine flows through a large diameter duct to the ACC where it is condensed inside the tubes through indirect contact with the ambient air. The heat is then released directly to the atmosphere.
39 These limits are the same as the applicable CARB Tier 2 and Tier 3 standards.

Palmdale (SE 09-01) Fact Sheet/Ambient Air Quality Impact Report August 2011
41
• Wet-dry hybrid cooling – uses wet and dry cooling technologies in parallel, and uses all of the equipment involved in both wet and dry cooling. Hybrid cooling technology divides the cooling function between the wet and dry systems depending on the capabilities of each system under different environmental and operational conditions.
The available add-on PM, PM10, and PM2.5 control technologies include:
• Drift eliminators Step 2 – Eliminate Technically Infeasible All of the available control options identified in Step 1 are technically feasible. Step 3 – Rank Remaining Control Technologies The types of cooling towers are ranked according to control effectiveness in Table 7-20.
Table 7-20: Cooling Tower Control Technologies Ranked by Control Effectiveness
Control Technologies Emission Rate
(TPY of PM/PM10/PM2.5)
Dry cooling 0 Wet-dry hybrid cooling 3.640 Wet cooling with 0.0005% drift eliminators
7.1
Step 4 – Economic, Energy and Environmental Impacts The applicant eliminated the use of both a dry cooling system and wet-dry hybrid cooling system due to the associated economic and environmental impacts. The use of a dry or hybrid wet-dry system would reduce the overall efficiency of the facility, due to the additional energy requirements for the wet and hybrid systems. The applicant also conducted an economic analysis comparing the annual operation costs of wet and dry cooling systems. The applicant’s analysis is reproduced in Table 7-21.
Table 7-21: Wet and Dry Cooling Tower Cost Analysis Provided by the Applicant
Wet Cooling Tower
Dry Cooling Tower
Required Power Fan Power(e) 1,700 kW 6,350 kW Circulating Pump Power 2,400 kW 0 kW
40 The applicant did not estimate potential emissions from a wet-dry hybrid system. We have approximated emissions from such a system to be one-half of those from a wet cooling system.

Palmdale (SE 09-01) Fact Sheet/Ambient Air Quality Impact Report August 2011
42
Wet Cooling Tower
Dry Cooling Tower
Power Loss Due to High Steam Turbine Backpressure 0 kW 536 kW Water Treatment Power Consumption (Zero Liquid Discharge) 850 kW <200 kW Total Net Power Loss Effect 12,798 kW 14,042 kW Costs Direct Capital Cost $26,000,000 $59,000,000(e) Water Pipeline Installation(f) ~$1,400,000 $0 Annualized Cost Capital Recovery(a) $1,940,000 $3,680,000 Equivalent Electrical Power Cost(b) $16,816,500 $18,451,000 Treatment Chemical Addition(c) $250,000 $0 Makeup Cooling Water(d) $824,200 ~$100,000 Total $/year $19,830,700 $22,231,000 Notes: a) Assumes a 30-year lifetime with a 5.75% interest rate. b) Assumes the facility operates 8,760 hour/yr and a power cost of $0.15/kWh. c) Assumes that water treatment chemicals would be needed in a wet tower to prevent corrosion, bio-fouling, etc., but would not be needed for an ACC. d) Estimated at $200/acre-foot and consumption of 4,121 acre-feet per year for wet cooling. e) Does not include additional costs required for a steam turbine that can be operated at high back pressure. f) Only includes the less than 2 miles of pipeline needed to connect to the regional backbone system. Dry cooling costs are underestimated since some water is needed even in a dry-cooled plant, which would still require a pipeline.
The cost effectiveness of using a dry cooling process to reduce 7.1 TPY of PM, PM10, and PM2.5 is $338,000 per ton. The applicant estimated a hybrid cooling system would have direct capital costs of $67 million and, as a result, would be even less cost-effective than a dry cooling system. Based on this information, we agree that using dry or hybrid cooling systems in this case would not be cost-effective and would contribute to a decrease in the overall energy efficiency of the facility. Considering collateral environmental impacts, the use of wet cooling has a potential impact associated with additional consumption of water resources. However, the water being used for the cooling tower is from the Palmdale Water Reclamation Plant and therefore wet cooling is not expected to result in any significant adverse impact on water resources in the area. Step 5 – Select BACT The applicant proposed using a wet cooling tower with 0.0005% drift eliminators as BACT for

Palmdale (SE 09-01) Fact Sheet/Ambient Air Quality Impact Report August 2011
43
the steam turbine cooling system. A comparison of the drift elimination rates for other recently permitted cooling towers is provided in Table 7-22. Based on the available information, we have determined that BACT for the cooling towers is 0.0005% drift eliminators. Additionally, we are setting a mass emission limit of 1.6 lb/hr and TDS limit of 5000 ppm.
Table 7-22: Summary of Recent BACT Determinations for Drift Eliminators
Facility Location Limit Permit Issuance Source
J.K. Smith Generating Station Kentucky 0.0005% April 2010 RBLC # KY-0100
Chocolate Bayou Facility Texas 0.0020% June 2009 RBLC # TX-0549
CPV St Charles Maryland 0.0005% November 2008 RBLC # MD-0040
John W Turk Jr Power Plant Arkansas 0.0005% November
2008 RBLC # AR-0094
7.5 BACT for Fugitive Road Dust Fugitive dust emissions will occur as a result of maintenance vehicle travel on paved and unpaved roadways in the solar field associated with the PHPP. Fugitive road dust is subject to BACT for PM, PM10, and PM2.5. A top-down BACT analysis has been performed and is summarized below. Step 1 – Available Control Technologies The control technologies for fugitive roadway dusts include: paved roads, gravel roads, chemical surfactants (also called “dust suppressants”), watering, and traffic speed controls. Step 2 – Eliminate Technically Infeasible All of the control technologies identified are technically feasible. Step 3 – Rank Remaining Control Technologies The available control options are ranked as follows:
• Paved roads • Gravel roads • Chemical surfactants, watering and traffic speed controls can result in various controls
efficiencies depending on how each technology is employed (e.g., rate of application, specific speed limit)
Step 4 – Economic, Energy and Environmental Impacts Paved roads – The applicant proposed to pave only the main access road to the plant because paving other less traveled roads would only have minimal environmental benefits. The applicant

Palmdale (SE 09-01) Fact Sheet/Ambient Air Quality Impact Report August 2011
44
noted that paving increases the amount of impervious surfaces, which increases storm water runoff, and that the infrequent rainstorms in the desert can also erode the dirt out from under the paved edges. Gravel roads - The applicant eliminated gravel roads due to the potential for rocks to become airborne and damage the parabolic mirrors in the solar field. This would result in additional costs for repairing mirrors and a reduction in solar energy production. Chemical surfactants, watering, and traffic speed controls - Surface watering and/or application of surfactants can be supplemented with limiting vehicle speed and restricting traffic in the unpaved areas. According to the applicant, experience in existing solar fields (e.g., the Solar Energy Generating Systems (SEGS) facility near Kramer Junction and Harper Lake) shows that use of a combination of the above methods is very effective in controlling fugitive dust. Use of soil stabilizers during the first few years of operation of the solar facility, followed by application of water and driving slowly in the solar field, leads to a very stable surface that yields only minor amounts of fugitive emissions. In addition, after the solar facility is built, it is in the operator’s best interest to keep dust emissions to a minimum in order to reduce the amount of mirror washing and loss of efficiency from dirty mirrors. Step 5 – Select BACT The applicant proposed BACT for fugitive road dust as:
• Paving the main access road into the plant site • Developing a dust control plan that includes inspection and maintenance procedures
undertaken to ensure that the unpaved roads remain stabilized • A durable non-toxic soil stabilizer will be applied through the solar field for dust control.
Additionally, unpaved roads within the solar field used by wash trucks that spray and clean the mirrors will be treated with soil stabilizers periodically.
• Water will be applied by water trucks on regularly disturbed areas where soil stabilizers are not as effective due to frequent use. The water used in the mirror washing will also provide for some incidental dust control.
• Vehicle speeds will be limited to no more than 10 miles per hour on unpaved roadways, with the exception that vehicles may travel up to 25 miles per hour on stabilized unpaved roads as long as such speeds do not create visible dust emissions.
Based on the information provided, we have determined that the above measures represent BACT for fugitive road dust, and the fugitive dust control plan must include, at a minimum, the requirements listed above. This determination is consistent with other BACT determinations, as illustrated in Table 7-23, for onsite operations that cause vehicle traffic.

Palmdale (SE 09-01) Fact Sheet/Ambient Air Quality Impact Report August 2011
45
Table 7-23: Summary of Recent BACT Determinations for Fugitive Road Dust Emissions
Facility Location Control Permit Issuance Source
V & M Star Ohio Water, sweeping, chemical stabilization or suppressants
Draft January
2011
RBLC # OH-0344
Nucor Steel Ohio Water, resurfacing, chemical stabilization, and/or speed reduction
Draft December
2010
RBLC # OH-0341
Flopam Inc. Maryland Paved where practical, precautions
taken to prevent dust from becoming airborne
June 2010 RBLC # LA-0240
Nucor Steel Louisiana
Paved where practical, for unpaved roads use water or dust suppressant chemicals to reduce emissions and
15 mph speed limit
May 2010 RBLC # AR-0094
John W. Turk Jr Power Plant Arkansas Water/dust suppressing chemicals November
2008 RBLC # AR-0094
7.6 BACT for Circuit Breakers
7.6.1 GHG The circuit breakers are subject to BACT for GHG emissions. The only GHG emitted from circuit breakers is sulfur hexafluoride (SF6). With the proposed control technologies, CO2e emissions are estimated at 9.56 TPY. Step 1 – Identify all control technologies The inherently lower-emitting control options for GHG emissions include:
• Use of dielectric oil or compressed air circuit breakers – these types of circuit breakers do not contain any GHG pollutants.
• Totally enclosed SF6 circuit breakers with leak detection systems – these types of circuit breakers have a maximum leak rate of 0.5% per year by weight and have an alarm warning when 10% of the SF6 has escaped. The use of an alarm identifies potential leak problems before the bulk of SF6 has escaped.
No add-on control options for GHG emissions were identified. Additionally, alternative gases to SF6 are also currently not available.41
41 Information is available at http://www.epa.gov/electricpower-sf6/documents/new_report_final.pdf.

Palmdale (SE 09-01) Fact Sheet/Ambient Air Quality Impact Report August 2011
46
Step 2 – Eliminate technically infeasible control technologies Both control options are assumed to be technically feasible. Step 3 – Rank remaining control technologies The expected emissions from the two control options are compared in Table 7-24. Currently, the only other similar facility with a GHG BACT limit is the Russell City Power Plant to be located in Hayward, California. The PSD permit for this facility has a voluntary GHG requirement to install the same leak detection system proposed for the PHPP.
Table 7-24: Circuit Breaker Control Technologies Ranked by Control Effectiveness
GHG Control Technologies CO2e Emission
Rate (TPY)
Dielectric oil or compressed air circuit breakers 0
Enclosed-pressure SF6 circuit breakers with 0.5% (by weight) annual leakage rate and leak detection systems
9.56
Step 4 – Economic, Energy, and Environmental Impacts The applicant eliminated the use of dielectric oil or compressed air circuit breakers because they are an outdated technology and the SF6 circuit breakers are more reliable. Specifically the applicant provides that according to the National Institute for Standards and Technology, SF6 “offers significant savings in land use, is aesthetically acceptable, has relatively low radio and audible noise emissions and enables substations to be installed in populated areas close to the loads.”42 Dielectric oil or compressed air circuit breakers therefore have been eliminated based on the potential adverse environmental and energy impacts. Additionally, we are not aware of any significant or unusual environmental impacts associated with the chosen technology. Step 5 – Select BACT Based on a review of the available control technologies for GHG emissions from circuit breakers, we have concluded that the applicant’s proposed requirements are BACT for this source: the use of enclosed-pressure SF6 circuit breakers with an annual leakage rate of 0.5% by weight, a 10% by weight leak detection system, and 9.56 TPY of CO2e based on a 12-month rolling total.
8. Air Quality Impacts
Clean Air Act section 165 and EPA’s PSD regulations at 40 C.F.R. section 52.21 require an examination of the impacts of the proposed PHPP on ambient air quality. The applicant must demonstrate, using air quality models, that the facility’s emissions of the PSD-regulated air pollutants would not cause or contribute to a violation of (1) the applicable
42 Ibid.
Palmdale (SE 09-01) Fact Sheet/Ambient Air Quality Impact Report August 2011
47
National Ambient Air Quality Standards (NAAQS), or (2) the applicable PSD increments (explained below in Section 8.4). This section includes a discussion of the relevant background data and air quality modeling, and our conclusion that the Project will not cause or contribute to an exceedance of the applicable NAAQS or applicable PSD increments and is otherwise consistent with PSD requirements governing air quality.
8.1 Introduction
8.1.1 Overview of PSD Air Impact Requirements Under the PSD regulations, permit applications for major sources must include an air quality analysis demonstrating that the facility’s emissions of the PSD-regulated air pollutants would not cause or contribute to a violation of the applicable NAAQS or applicable PSD increments. (A PSD increment for a pollutant applies only to areas that meet the corresponding NAAQS.) The applicant provides separate modeling analyses for each criteria pollutant emitted above the applicable significant emission rate. If a preliminary analysis shows that the ambient concentration impact of the project by itself is greater than the Significant Impact Level (SIL), then a full or cumulative impact analysis is required for that pollutant. The cumulative impact analysis includes nearby pollution sources in the modeling, and adds a monitored background concentration to account for sources not explicitly included in the model. The cumulative impact analysis must demonstrate that the Project will not cause or contribute to a NAAQS or increment violation. Required model inputs characterize the various emitting units, meteorology, and the land surface, and define a set of receptors (spatial locations at which to estimate concentrations, typically out to 50 km from the facility at issue). Modeling should be performed in accordance with EPA's Guideline on Air Quality Modeling, in Appendix W to 40 CFR Part 51 (GAQM or Appendix W). AERMOD with its default settings is the standard model choice, with CALPUFF available for complex wind situations. A PSD permit application typically includes a Good Engineering Practice (GEP) stack height analysis, to ensure a) that downwash is properly considered in the modeling for stacks less than GEP height, and b) that stack heights used as inputs to the modeling are no greater than GEP height, so as to disallow artificial dispersion from the use of overly tall stacks. The application may also include initial “load screening,” in which a variety of source operating loads and ambient temperatures are modeled, to determine the worst case scenario for use in the rest of the modeling. The PSD regulations also require an analysis of the impact on nearby Class I areas, generally those within 100 km, though the relevant Federal Land Manager (FLM) may specify additional or fewer areas. The analysis includes the NAAQS, PSD increments, and Air Quality Related Values (AQRVs). AQRVs are defined by the FLM, and typically limit visibility degradation and the deposition of sulfur and nitrogen. CALPUFF is the standard model choice for Class I analyses, since it can handle visibility chemistry as well as the typically large distances (over 50 km) to Class I areas.

Palmdale (SE 09-01) Fact Sheet/Ambient Air Quality Impact Report August 2011
48
Finally, the PSD regulations require an additional impact analysis, showing the Project's effect on visibility, soils, vegetation, and growth. This visibility analysis is independent of the Class I visibility AQRV analysis. The additional impact analysis for the PHPP is discussed in Section 9 below.
8.1.2 Identification of PHPP Modeling Documentation The PSD modeling analysis for the PHPP went through several stages, reflecting the regulatory requirements and guidance clarifications that came into effect over time, as well as discussions between the applicant and EPA about the appropriate methodologies for impact assessment. In general, the latest analyses submitted by the applicant are discussed in this AAQIR, with some references to earlier work. The PHPP modeling analysis comprises the eight documents listed in Table 8-1 below. The Class I and Class II Modeling Protocols (July 2008) describe the methods to be used for the air quality impact analyses, including choice of model and the preparation of model inputs such as meteorological data. The PSD Application (March 2009) contains the results of the modeling. After the application submittal, EPA policy changed so that the PM10 NAAQS could no longer be used as a surrogate for the PM2.5 NAAQS, and EPA promulgated the 1-hour NO2 NAAQS; neither PM2.5 nor 1-hour NO2 these was addressed in the original modeling. The applicant submitted Supplemental Information (June 2010) to update its modeling analysis by providing a PM2.5 analysis and a 1-hour NO2 analysis considering the Project and background concentrations; it also upgraded the additional impact analysis discussed in Section 9 below. The applicant's NO2 Memo #1 (October 2010) provides a cumulative 1-hour NO2 analysis, which includes nearby sources in addition to the Project itself. Finally, the Updated Analyses Memo (March 2011) revises the PM2.5 and 1-hour NO2 analyses to account for corrected hourly emissions estimates for the nearby U.S. Air Force Plant 42, and to use a more conservative estimate of the NO2 background concentration. The applicant also submitted additional documentation in NO2 Memo #2 (December 2010), and the NO2 Background Memo (July 2011), providing additional justification for the approaches taken for the applicant’s 1-hour NO2 analysis. Table 8-1: Modeling Documentation for Palmdale Hybrid Power Project PSD Application Short name Citation
Class I Modeling Protocol
“Class I Area Dispersion Modeling Protocol for the Proposed Palmdale Hybrid Power Project”, ENSR Corporation (document 10855-002-040C1MP), July 2008 (file "PHPP Class I Modeling Protocol.pdf"
Class II Modeling Protocol
“Class II Area Dispersion Modeling Protocol for the Proposed Palmdale Hybrid Power Project”, ENSR Corporation (document 10855-002-040C2MP), July 2008 (file "PHPP Class II Modeling Protocol.pdf")
Original PSD Application
“Application for Prevention of Significant Deterioration Permit for Palmdale Hybrid Power Project”, AECOM Environment (document 10855-002-040 PSD), March 2009 (file "Palmdale PSD Application.pdf")

Palmdale (SE 09-01) Fact Sheet/Ambient Air Quality Impact Report August 2011
49
Supplemental Information
“Palmdale Hybrid Power Project PSD Application, Supplemental Information”, AECOM, June 2010 (file "Supplemental PSD Submittal 072010.pdf")
NO2 Memo #1
“Response to EPA Comments on AECOM 1-hour NO2 NAAQS Analysis for PHPP”, Memorandum from Richard Hamel, AECOM, to Scott Bohning, EPA, October 7, 2010 (file "Response to EPA Comments on NO2 Modeling.pdf")
NO2 Memo #2
“Response to EPA Additional Comments on AECOM 1-hour NO2 NAAQS Analysis for Palmdale Hybrid Power Project”, Memorandum from Richard Hamel, AECOM, to Scott Bohning, EPA, December 14, 2010 (file "Response to 2nd set of EPA Comments on NO2 Modeling.pdf")
Updated Analyses Memo
“Final Update to 1-hour NO2 and 24-hour PM2.5 NAAQS Analyses for Palmdale Hybrid Power Project”, Memorandum from Richard Hamel, AECOM, to Scott Bohning, EPA, March 30, 2011 (file "Updated NO2 and PM2.5 Modeling Analyses for PHPP 033011.pdf")
NO2 Background Memo
“Justification of the use of the 3-year average 98th percentile ambient background concentration for PHPP 1-hour NO2 NAAQS Modeling”, Memorandum from Richard Hamel, AECOM, to Scott Bohning, EPA, July 21, 2011 (file "1-hour NO2 Ambient Background Justification for PHPP NAAQS Modeling 072111.pdf")
8.2. Background Ambient Air Quality The PSD regulations require the air quality analysis to contain air quality monitoring data as needed to assess ambient air quality in the area for the PSD-regulated pollutants for which there are NAAQS that may be affected by the source. In addition, for demonstrating compliance with the NAAQS, a background concentration is added to represent those sources not explicitly included in the modeling, so that the total accounts for all contributions to current air quality. For background concentrations, PHPP chose the Lancaster Division Street monitor, which is the nearest available, except for SO2, for which the Burbank West Palm Avenue is nearest. The most recent three years of data available at the time of the application are 2005-2007. (PSD Application p.6-2 pdf.47; see also Class II Modeling Protocol p.2-19 pdf.24) Based on their siting at more urbanized locations than the Project site, these monitors provide conservative estimates of background concentrations. The SO2 monitor at Burbank West Palm Avenue is 34 miles away, but is in the eastern portion of urbanized Los Angeles with its many pollution sources, and therefore it provides a conservative estimate of the SO2 background. The Lancaster Division Street monitor is just 2.5 miles from the PHPP power block; it is within the city of Lancaster, which has a population of some 150,000, and is near several roads; it is thus conservative for most pollutants. This site is discussed further below in the section on NO2-specific issues. Table 8-2 below describes the maximum background concentrations of the PSD-regulated pollutants for which there are NAAQS that may be affected by the Project’s emissions, and the corresponding NAAQS.

Palmdale (SE 09-01) Fact Sheet/Ambient Air Quality Impact Report August 2011
50
Table 8-2 Maximum background concentrations and NAAQS
NAAQS pollutant &
averaging time Background
Concentration, µg/m3 NAAQS, µg/m3 CO, 1-hr 3,680 40,000 (35 ppm) CO, 8-hr 1,840 10,000 (9 ppm) NO2, 1-hr 77.1 188 (100 ppb) NO2, annual 28.2 100 (53 ppb) PM10, 24-hr 86 150 PM2.5, 24-hr 16.3 35 PM2.5, annual 7.6 15
Note: The PM2.5 24-hr value is 98th percentile rather than maximum
8.3 Modeling Methodology for Class II areas The applicant modeled the impact of PHPP on the NAAQS and PSD Class II increments using AERMOD in accordance with EPA’s GAQM (Appendix W of 40 CFR Part 51). The modeling analyses included the maximum air quality impacts during startups and shut-downs, as well as a variety of conditions to determine worst-case short-term air impacts.
8.3.1 Model selection As discussed in the modeling protocol (Class II Modeling Protocol sec. 2, p.2-1 pdf.6; also PSD Application p.6-1 pdf.46), the model that the applicant selected for analyzing air quality impacts in Class II areas is AERMOD, along with AERMAP for terrain processing and AERMET for meteorological data processing. This accords with the default recommendations in EPA's GAQM, section 4.2.2 on Refined Analytical Techniques.

Palmdale (SE 09-01) Fact Sheet/Ambient Air Quality Impact Report August 2011
51
8.3.2 Meteorology model inputs AERMOD requires representative meteorological data in order to accurately simulate air quality impacts. For surface air data, PHPP selected 2002-2004 data from the Palmdale Regional Airport. Other nearby meteorological sites were examined, but the Palmdale Airport had better data completeness, is the closest, and has the same surface characteristics as the Project site. It is at or barely below 90% completeness for every quarter; it is within 2 miles, just on the other side of the airport's airstrip; and it is on flat, desert scrub land, with no intervening high ground between the Project and the meteorological tower (Class II Modeling Protocol p.2-4 pdf.9 and Figure 2-2, p.2-5 pdf.10). The applicant made additional comparisons of land surface characteristics of the Project and meteorological sites, in terms of surface roughness in each radial direction, concluding that because of the sites' proximity and essentially identical characteristics, the Palmdale Airport data should be considered “site specific” (or “on-site”) data (NO2 Memo #2 p.9ff pdf.9). Normally GAQM would require 5 years of airport data for modeling, but if on-site data is used, then a single year or those years available, may be used (GAMQ 8.3.3.2). In this case, additional data were available for 2005-2006, but the corresponding upper air data had a substantial amount of missing data (NO2 Memo #2 p.10 pdf.10). In any case, the wind roses for the various years are virtually indistinguishable, evidence that the 2002-2004 data are adequately representative of the meteorological conditions at the site. EPA believes that the chosen 2002-2004 Palmdale Regional Airport data is amply representative for the PHPP analysis. For upper air data, the applicant selected Mercury Desert Rock Airport in Mercury, Nevada, as being the most representative site available that had data complete enough to use (Class II Modeling Protocol p.2-4 pdf.9). PHPP later elaborated on the representativeness of the Mercury Desert Rock Airport Data, noting that Vandenberg AFB in Lompoc, CA and the Marine Corps Air Station in Miramar, CA, near San Diego are near the ocean and have a very different climate than the high-altitude, desert Palmdale location (NO2 Memo #1 p.2ff pdf.2). EPA agrees that it is appropriate to use the Mercury Desert Rock Airport upper air data for the PHPP analysis.
8.3.3 Land characteristics model inputs Land characteristics are used in the AERMOD modeling system in three ways: 1) via elevation within AERMOD to assess plume interaction with the ground; 2) via a choice of rural versus urban algorithm within AERMOD; and 3) via specific values of AERMET parameters that affect turbulence and dispersion, namely surface roughness, Bowen ratio, and albedo. The applicant used terrain elevations from United States Geological Survey (USGS) Digital Elevation Model (DEM) data for receptor heights for AERMOD, which uses them to assess plume distance from the ground for each receptor. The elevations were also used within the AERMAP preprocessor to determine hill height scales for each receptor, used by AERMOD to

Palmdale (SE 09-01) Fact Sheet/Ambient Air Quality Impact Report August 2011
52
determine whether the plume goes over or around the hill. For rural versus urban algorithm within AERMOD, the applicant classified land use within 3 km of the project using the 12-category Auer procedure, one of the methods recommended by EPA (GAQM 7.2.3(c)). Since desert scrub land is more than 50% of the area, it is classified as “rural” for choosing dispersion algorithms within AERMOD (Class II Modeling Protocol p.2-2 pdf.7, and Figure 2-1, p.2-3 pdf.8). The applicant followed EPA's “AERMOD Implementation Guide” (2008 version) in using EPA's AERSURFACE processor with the National Land Cover Data 1992 archive to determine surface characteristics for AERMET (Class II Modeling Protocol p.2-9 to 2-14 pdf.14 to 19). A 2005 satellite image shows no significant change in land use since the 1992 data was compiled, so it remains appropriate. Land use cover categories were translated by AERSURFACE into monthly parameter values used in AERMET's stage 3 input files. The AERSURFACE determination of surface roughness length used land cover in 2 radial sectors, desert scrub and the airport's airstrip, which appears reasonable. The Bowen ratio (ratio of sensible to latent heating, i.e., direct temperature change versus air heating via evaporation), and albedo (reflection coefficient) affect heat-driven turbulence and dispersion under daytime convective conditions. Seasonal Bowen ratio for the surrounding 10x10 km area was estimated by AERSURFACE using three surface moisture categories and the amount of precipitation relative to the 30-year climatological record. Seasonal albedo was also supplied by AERSURFACE for the 10x10 km area based on land cover. All of these are the standard EPA-recommended procedures for AERMOD inputs.
8.3.4 Model receptors Model receptors are chosen geographic locations at which the model estimates concentrations. The receptors should have good area coverage and be closely spaced enough so that the maximum model concentrations are be found. At larger distances, spacing between receptors may be greater than it is close to the source since concentrations vary less with increasing distance. The spatial extent of the receptors is limited by the applicable range of the model (roughly 50 km for AERMOD), and possibly by knowledge of the distance at which impacts fall to negligible levels. Receptors need be placed only in ambient air, that is, locations to which the public has access, and not inside the project fence line. In addition, to avoid overly conservative estimates when multiple sources are being modeled, separate modeling runs may be needed for different subsets of receptors, so that a given source's emissions are not counted toward concentrations within its own fence line. The applicant used receptors every 50 m along the project fence line, together with a Cartesian grid (rectangular array) of receptors, starting with 100 m spacing out to 3 km distant, and with progressively larger spacing, with 1000 m spacing between 10 and 20 km distant (PSD Application p.6-3 pdf.48). The applicant supplied a rationale for limiting the grid extent to 20 km, as opposed to 50 km. It found that short-term impacts were caused mainly by the ancillary

Palmdale (SE 09-01) Fact Sheet/Ambient Air Quality Impact Report August 2011
53
equipment, such as the emergency generator, rather than the main combustion turbines, and that maximum impacts were on the fence line or within 100 m, and likely driven by downwash effects. The applicant conducted additional modeling to compare distance impacts to those within the 20 km grid, and found that the maximum impacts within 20 km are 2 to 50 times higher than those outside, depending on averaging time (Supplemental Information p.6-1 pdf.41). EPA agrees that the receptor spacing and 20 km spatial extent are adequate for analysis of PHPP impacts.
8.3.5 Load screening and stack parameter model inputs The applicant performed initial “load screening” modeling, in which a variety of source operating loads and ambient temperatures were modeled, to determine the worst case stack parameter scenario for use in the rest of the modeling. It modeled 100% load, 100% with duct burners operating, 75% load, and 50% load. For annual averages, it used 100% load with a conservatively low temperature of 64°F (lower than actual annual average). (PSD Application Table 6-3, p.6-4 pdf.49) The choice of “worst case” is different for each pollutant, since different pollutants’ emissions respond differently to temperature and flow rate. Worst case for CO and NO2 was 100% with duct burners operating; for PM10 and PM2.5 it was 50% load (PSD Application p.6-6 pdf.51). The corresponding stack parameters were used in the remainder of the modeling to provide conservative estimates of PHPP impacts.

Palmdale (SE 09-01) Fact Sheet/Ambient Air Quality Impact Report August 2011
54
Table 8-3: Load screening and stack parameters
Source: PSD Application Table 6-3, p.6-4 pdf.49
8.3.6 Good Engineering Practice (GEP) Analysis The applicant performed a Good Engineering Practice (GEP) stack height analysis, to ensure a) that downwash is properly considered in the modeling for stacks less than GEP height, and b) that stack heights used as inputs to the modeling are no greater than GEP height, so as to disallow artificial dispersion from the use of overly tall stacks. As is typical, the GEP analysis was performed with EPA’s BPIP ( Building Profile Input Program) software, which uses building dimensions and stack heights. The analysis found that GEP stack height for the main combustion turbines was 83.8 m, greater than the planned actual height of 44.2 m. GEP stack height for the other equipment was similarly greater than the planned heights. So, for all emitting units, the AERMOD modeling used the planned actual stack heights, and included wind direction-specific Equivalent Building Dimensions to properly account for downwash. (PSD Application p.6-5 pdf.50)

Palmdale (SE 09-01) Fact Sheet/Ambient Air Quality Impact Report August 2011
55
8.4 National Ambient Air Quality Standards and PSD Class II Increment Consumption Analysis
8.4.1 Pollutants with significant emissions An air quality impact analysis is required for each PSD-regulated pollutant (for which there is a NAAQS) that is emitted in a significant amount, i.e., an amount greater than the Significant Emission Rate for the pollutant. Applicable PHPP emissions and the Significant Emission Rates are shown in Table 8-4 (derived from PSD Application Table 1-1, p.8 pdf.8). PHPP emissions of SO2 are not significant. However, PHPP emits significant amounts of CO, NOX, PM10, and PM2.5, so air impact analyses are required for CO, NO2, PM10, and PM2.5.
Table 8-4: PSD Applicability to PHPP: Pollutants Emitted in Significant Amounts
Criteria Pollutant PHPP Emissions,
tons/year Significant Emission
Rate, tons/year PSD applicable? CO 254.6 100 Yes NOX 114.9 40 Yes PM10 131.8 15 Yes PM2.5 125.3 10 Yes SO2 8.9 40 No
Source: PSD Application Table 1-1, p.8 pdf.8
8.4.2 Preliminary analysis: Project-only impacts EPA has established Significant Impact Levels (SILs) to characterize air quality impacts. A SIL is the ambient concentration resulting from the facility’s emissions, for a given pollutant and averaging period, below which the source is assumed to have an insignificant impact. For maximum modeled concentrations below the SIL, no further air quality analysis is required for the pollutant. For maximum concentrations that exceed the SIL, a cumulative modeling analysis, which incorporates the combined impact of nearby sources of air pollution, is required to determine compliance with the NAAQS and PSD increments. The results of the preliminary or Project-only analysis are shown in Table 8-5. PHPP impacts are significant for 1-hour NO2, 24-hour PM10, 24-hour PM2.5, and annual PM2.5, so cumulative impact analyses are required for these pollutants.
Table 8-5: PHPP Significant Impacts, Normal Operations NAAQS pollutant &
averaging time Project-only
Modeled Impact Significant Impact Level (SIL), μg/m3
Project impact significant?
CO, 1-hr 369.6 2000 No CO, 8-hr 20.4 500 No NO2, 1-hr 106.9 7.5 (4 ppb) Yes

Palmdale (SE 09-01) Fact Sheet/Ambient Air Quality Impact Report August 2011
56
NO2, annual 0.98 1 No PM10, 24-hr 12.7 5 Yes PM2.5, 24-hr 12.57 1.2 Yes PM2.5, annual 1.2 0.3 Yes Sources: Impacts (except for 1-hr NO2 and PM2.5): PSD Application p.6-7 pdf.52 NO2 1-hr: Supplemental Information p3-2. pdf.22 PM10: PSD Application Table 6-7, p.6-8 pdf.53 PM2.5: Updated Analyses Memo Table 9, p.15 pdf.15
8.4.3 Cumulative impact analysis A cumulative impact analysis includes nearby sources in addition to the Project itself. For demonstrating compliance with the PSD increment, only increment-consuming sources need be included, since the increment concerns only changes occurring since the applicable baseline date. However, a conservative and sometimes easier approach is simply to model all nearby sources; this was the approach taken by PHPP. For demonstrating compliance with the NAAQS, a background concentration is added to represent those sources not explicitly included in the modeling, so that the total accounts for all contribution to current air quality.
8.4.3.1 Nearby source emission inventory For both the PSD increment and NAAQS analyses, there may be a large number of sources that could potentially be included, so judgement must be applied to exclude small and/or distant sources that have only a negligible contribution to total concentrations. Only sources with a significant concentration gradient in the vicinity of the source need be included; the number of such sources is expected to be small except in unusual situations. (GAQM 8.2.3) The applicant identified two sources nearby for inclusion in the emission inventory for the cumulative analysis, based on discussions with the Antelope Valley Air Quality Management District (District) (PSD Application p.6-7 pdf.52). These are Lockheed Martin Aeronautics and Northrop Grumman, both within or adjacent to U.S. Air Force Plant 42 near the Palmdale airport. These sources had a large number of individual emitting sources (284), most of which had very low emissions. For practicality of modeling some of these were combined in a conservative way: emitters with less than 5% of total had their emissions added to the largest emitters. In support of limiting the inventory to these sources, the applicant quoted a statement from Mr. Chris Anderson, Air Quality Engineer, and Mr. Alan De Salvio, Supervisor of Air Quality Engineering, of the District: “Minor facilities located within the 6 mile radius are expected to be included in the background monitored at the AVAQMD [District] air monitoring station which is located in close proximity (approximately within 2 miles) of the PHPP site.” (NO2 Memo #2 p.11 pdf.11) The applicant also documented discussions with the District, Mojave Desert Air Quality

Palmdale (SE 09-01) Fact Sheet/Ambient Air Quality Impact Report August 2011
57
Management District (AQMD), Kern County Air Pollution Control District, and South Coast AQMD showing that there are few substantial PM2.5 sources nearby; however, Granite Rock Construction and Robertson’s Ready Mix were included in the modeling, both about 15 km (9 miles) from PHPP (Supplemental Information p.2-1 to 2-2 pdf.9 to 10, and Figure 2-1 p.2-3 pdf.11). Also, recent EPA NO2 guidance clarification states that the nearby source inventory “should focus on the area within about 10 kilometers of the project location”, which suggests that the PHPP inventory is adequate for NO2 analyses (p.16 of “Additional Clarification Regarding Application of Appendix W Modeling Guidance for the 1-hour NO2 National Ambient Air Quality Standard”, Memorandum from Tyler Fox, EPA Air Quality Modeling Group to EPA Regional Air Division Directors, March 1, 2011). Nevertheless, the applicant also performed a “Q/D” analysis, which provides another factor for consideration in determining whether sources with small emissions (Q) and/or at large distances (D) would be reasonable to exclude from the analysis. The applicant proposed that sources with a km distance greater than the NOX emissions in tons per year divided by 20 would be eligible for exclusion. (Updated Analyses Memo p.6 pdf.6, citing “Screening Method for PSD” developed by the North Carolina Air Quality Section of the North Carolina Department of Natural Resources, in file “NC 20D Letter to EPA.pdf”). The only sources to pass this initial screen were those within US Air Force Plant 42, already included in the cumulative modeling, and Bolthouse Farm emissions. In addition to being mostly downwind (east) of the project, the emissions of Bolthouse Farm are widely distributed throughout the area, and therefore are dispersed enough that they would have a negligible contribution to maximum concentrations (Updated Analyses Memo p.8 pdf.8). The Q/D analysis provides additional evidence that the source inventory is adequate for the cumulative impact analysis. EPA believes that the combination of a conservative background monitored concentration expected to include the effect of most nearby sources, EPA guidance clarification focusing on sources within 10 km, and the Q/D analysis are sufficient justification for the inventory used in the cumulative analysis.
8.4.3.2 PM2.5-specific issues The applicant originally relied on the PM10 NAAQS as a surrogate for the PM2.5 NAAQS, which was allowed under previous EPA policy. However, EPA repealed this policy (proposed February 11, 2010; final May 18, 2011), so that PM2.5 itself must be modeled. EPA also issued guidance clarification on how to combine modeled results with monitored background concentrations (“Modeling Procedures for Demonstrating Compliance with PM2.5 NAAQS”, memorandum from Stephen D. Page, Director, EPA OAQPS, March 23, 2010). Accordingly, the applicant replaced the original analysis with a new cumulative PM2.5 analysis. The applicant still conservatively used PM10 emissions as input to the modeling, so actual PM2.5 impacts may be lower than those indicated in the model results. Maximum model results were

Palmdale (SE 09-01) Fact Sheet/Ambient Air Quality Impact Report August 2011
58
correctly added to the ninety-eighth percentile of the monitored background concentration, as called for in the EPA guidance clarification. (Updated Analyses Memo p.12ff pdf.12) The PHPP application has little discussion of secondarily formed PM2.5 (as distinguished from directly emitted primary PM2.5). However, the applicant does cite an earlier AECOM analysis showing that that near the source, primary PM2.5 emissions dominate the modeled impacts (Supplemental Information, p.2-10 pdf. 18). EPA notes that, due to the time needed for chemical formation, secondary PM2.5 impacts are likely to occur much farther downwind than the significant primary impacts, which occur within 400 m of the project (Updated Analyses Memo p.12 pdf.12), and so are likely to be small and not overlapping with the impacts estimated in the application.
8.4.3.3 NO2-specific issues The applicant used the Ozone Limiting Method (OLM) option in AERMOD, in which ambient ozone concentrations limit the amount of emitted NO that is converted to NO2 (after an initial 10% conversion). In addition to requiring monitored ozone, the method requires specification of an in-stack NO2/NOX ratio. EPA believes the OLM method is justified in this area because while it has substantial ozone, most of that is due to transport from outside the area, rather than to photochemistry operating on VOC and NOX emiossions from sources within the area. Therefore, the alternative mechanisms for conversion of NO to NO2 by the hydroxyl and peroxy radicals are likely to be less important than the ozone conversion mechanism, and so the conversion is ozone-limited.
A. In-stack NO2/NOX ratio The applicant notes that since the Project would be located in an ozone nonattainment area, ozone concentrations are generally high, so that the initial in-stack NO2/NOX ratio is of less importance than would otherwise be the case, since plentiful ozone is available to convert NO to NO2 (NO2 Memo #2 p.3 pdf.3). GE Power and Water, the vendor of the GE7FA turbines planned for PHPP, provided an in-stack NO2/NOX ratio of 0.10 to 0.15 based on its review of available NO2 emission data; the Selective Catalytic Reduction (SCR) planned for PHPP would make this ratio even lower (NO2 Memo #1 p.8 pdf.8; NO2 Memo #2 p.3 pdf.3). Since little data is available for the ratio during startup and shutdown conditions, the applicant relied on a 0.4 ratio as recommended by the San Diego County Air Pollution Control District for a project with similar turbines, despite some evidence that the actual ratio could be lower for both startup and shutdown events. The short duration of these events implies that that actual ratio would be closer to the 0.10 used for normal operations (NO2 Memo #1 p.9 pdf.9).

Palmdale (SE 09-01) Fact Sheet/Ambient Air Quality Impact Report August 2011
59
B. NO2 monitor representativeness/conservativeness
As mentioned above, the applicant chose the Lancaster Division Street monitor for background NO2 concentrations. This monitor is just 2.5 miles from the PHPP power block, and is near the Sierra Highway (110 m), the Antelope Valley Freeway (SR-14) (4 km), commute traffic on Division Street (50 m), and the Southern Pacific Railway (80 m). EPA agrees with PHPP that this location is quite conservative for providing NO2 background concentrations.
C. O3 background monitor representativeness
The applicant notes that since O3 is a regionally formed pollutant, the nearness of the monitoring site to the project is the most important criterion for representativeness (NO2 Memo #1 p.10 pdf.10). The Lancaster Division Street monitor is just 2.5 miles away from the PHPP power block, and EPA agrees that it is adequately representative.
D. Missing O3 data procedure
The applicant filled in missing ozone data using a procedure to ensure that NO to NO2 conversion is not underestimated. When 1 or 2 hours are missing, the higher of the two endpoints are used for the missing hours. When 3 or more hours are missing, the higher of the two end points and of the corresponding hours from the two neighboring days are used for the missing hours. (NO2 Memo #2 p.8 pdf.8) Under this procedure, professional judgement is applied to ensure that the data from the neighboring days are not anomalously low. The applicant provided an example of the application of this procedure (Updated Analyses Memo p.3 to 4 pdf.3 to 4), as well as details of the full calculations (file “PHPP Ozone Filling Analysis.xlsx” from July 2011). EPA believes that the applicant followed a reasonable and conservative procedure for filling in missing ozone values.
E. Combining modeled and monitored values
Originally, the applicant combined each modeled concentration with the background concentration from the corresponding hour (“hour-by-hour” approach). The applicant later switched to a variant of EPA’s March 2011 memo’s43 “first tier” approach: it used the 98th percentile of all monitored values, though only for model receptors outside the USAF Plant 42 boundary; the hour-by-hour approach still applied to other receptors. (The EPA March 2011 memo’s “first-tier” approach uses the 98th percentile from among only the daily maxima, whereas 43 “Additional Clarification Regarding Application of Appendix W Modeling Guidance for the 1-hour NO2 National Ambient Air Quality Standard”, Memorandum from Tyler Fox, EPA Air Quality Modeling Group to EPA Regional Air Division Directors, March 1, 2011. http://www.epa.gov/ttn/scram/Additional_Clarifications_AppendixW_Hourly-NO2-NAAQS_FINAL_03-01-2011.pdf

Palmdale (SE 09-01) Fact Sheet/Ambient Air Quality Impact Report August 2011
60
the applicant’s variant uses the 98th percentile from among all hourly values.) While the applicant’s approach is less conservative than EPA’s first-tier approach, we believe that it remains conservative given the very conservative background monitor that is being used (NO2 Background Memo). The maximum values coincide with morning and evening commute traffic, due to the several roads near the monitor. A key concern expressed in EPA’s March 2011 memo about the hour-by-hour approach is that it implicitly assumes concentrations are spatially uniform, i.e., that the background monitor is representative of all locations44. Since this is not generally true, some degree of temporal conservativeness is warranted, as in the memo-recommended 98th-percentile of the available background concentrations by season and hour-of-day. However, for PHPP, the background monitor appears to be very conservative, so that the implicit spatial uniformity assumption of the hour-by-hour approach is actually a conservative assumption in this case. If the memo-recommended procedure were to be used in this case, then a single unusually high morning commute hourly concentration would be assumed to apply to every day of the season; a single NO2 exceedance would then become 90 exceedances, thus possibly causing an erroneous prediction of a 1-hour NO2 violation, an overly conservative approach. In addition, the applicant’s modeling included some intermittent sources (PHPP's emergency generators) that may not need to be included, per EPA’s March 2011 memo45 on hourly NO2 modeling, further adding to the conservativeness of the analysis. EPA believes that the applicant’s overall approach to the 1-hour NO2 analysis for the PHPP, including the emission inventory, background concentrations of NO2 and O3, and method for combining model results with monitored values, is adequately conservative.
8.4.3.4 Results of the cumulative impacts analysis The results of the PSD cumulative impacts analysis for PHPP’s normal operations is shown in Table 8-6. The analysis demonstrates that emissions from PHPP during normal operations will not cause or contribute to exceedances of the NAAQS for 1-hour NO2, 24-hour PM10, 24-hour PM2.5, or annual PM2.5 or applicable PSD increments. As discussed above, PHPP’s maximum modeled concentrations are below the SILs for annual NO2, 1-hour CO, and 8-hour CO; therefore, a cumulative impacts analysis was not required to demonstrate compliance for these pollutants/averaging times.
44 Ibid., p.21. 45 Ibid., p.10.

Palmdale (SE 09-01) Fact Sheet/Ambient Air Quality Impact Report August 2011
61
Table 8-6: PHPP Compliance with PSD Increments and NAAQS, Normal Operations NAAQS
pollutant & averaging
time
All Sources Modeled Impact
PSD Increment
Background Concentration
Cumulative impact w/
background NAAQS NO2, 1-hr; USAF 106.9 NA (hourly) 175.3 188 (100 ppb)
NO2, 1-hr; other 108.2 NA 77.1 185.3 188 (100 ppb)
PM10, 24-hr 12.9 30 86 98.9 150 PM2.5, 24-hr 12.58 NA 16.3 28.9 35 PM2.5, annual 1.3 NA 7.6 8.9 15 Notes: - “USAF” values are for receptors within USAF Plant 42; “other” is for receptors elsewhere; USAF Plant 42 receptors
are not ambient air with respect to its own emissions. - Background concentrations for USAF receptors were added hour-by-hour to modeled concentrations before computing
98th percentile total impact, rather than a single background value being added to the modeled impact as for the other cases.
Sources: NO2 USAF: Supplemental Information p3-2. pdf.22 NO2 other: Updated Analyses Memo Table 7, p.11 pdf.11, “Normal Operations - No PHPP Fire Water Pump” PM10: PSD Application Table 6-7, p.6-8 pdf.53 PM2.5: Updated Analyses Memo Table 9, p.15 pdf.15
8.4.3.5 Startup and shutdown analyses Combustion turbine CO and NOX emissions during startup and shutdown (SU/SD) are estimated to be substantially higher than during normal operations, and thus the applicant also modeled for shutdown, the condition having the highest emissions. Modeled stack parameters such as exit temperature and exhaust velocity were consistent with a 20% operating load; the ambient temperature used represented worst-case meteorological conditions, emission into a cool morning stable layer. Since shutdown duration may not exceed half an hour, worst case hourly emissions consist of a half-hour of normal operations followed by a shutdown event. For CO, this is 1/2 of 15.16 lb/hr, plus 337 lb, for a combined rate of 344.6 lb/hr per turbine (PSD Application p.6-9 pdf.54). For NOX, this is 1/2 of 16.6 lb/hr, plus 57 lb, for a combined rate of 65.3 lb/hr per turbine (Updated Analyses Memo Table 7, p.11 pdf.11). Emergency generator testing was not included in the NOX modeling, since it would not be undergoing testing during source shutdown. This 1-hour NO2 analysis continues to use the conservative assumptions discussed above for the analysis of normal operations. The model results are shown in Table 8-7 for the preliminary or Project-only analysis, and in Table 8-8 for the cumulative impacts analysis. The results demonstrate that emissions from PHPP will comply with the 1-hour NO2 NAAQS and both the 1-hour and 8-hour CO NAAQS under shutdown conditions (and therefore for startup conditions, for which emissions are lower). We note that the applicant was not required to, and did not, perform a cumulative impact analysis for CO, as its emissions are below the SILs; however, for informational purposes, Project impacts were added to background concentrations of CO for a rough comparison to the NAAQS.

Palmdale (SE 09-01) Fact Sheet/Ambient Air Quality Impact Report August 2011
62
Table 8-7: PHPP Significant Impacts, Startup/Shutdown
NAAQS pollutant & averaging time
Project-only Modeled Impact
Significant Impact Level (SIL), μg/m3
Project significant impact?
CO, 1-hr 674.6 2000 No CO, 8-hr 489.1 500 No NO2, 1-hr 136.4 7.5 (4 ppb) Yes Sources: CO: PSD Application Table 6-9, p.6-9 pdf.54 NO2 1-hr: Supplemental Information p3-3. pdf.23
Table 8-8: PHPP Compliance with NAAQS, Startup/Shutdown NAAQS
pollutant & averaging
time
Project-only
Modeled impact
All Sources Modeled Impact
Background Concentration
Cumulative impact w/
background NAAQS CO, 1-hr 674.6 NA 3,680 4,354.6 40,000 (35 ppm) CO, 8-hr 489.1 NA 1,840 2,329.1 10,000 (9 ppm) NO2, 1-hr; USAF
(not modeled) 136.4 (hourly) 180.3 188 (100 ppb)
NO2, 1-hr; other
(not modeled) 109.7 77.1 186.9 188 (100 ppb)
Notes: - There are no PSD increments defined for CO or for 1-hour NO2. - PHPP emissions are not significant for CO, so no cumulative analysis is required; “cumulative impact” here is PHPP-
only plus background. - “USAF” values are for receptors within USAF Plant 42; “other” is for receptors elsewhere; USAF Plant 42 receptors
are not ambient air with respect to its own emissions. Project-only impacts were not modeled for 1-hour NO2 startup/shutdown, rather only the full cumulative impact was modeled.
- Background concentrations for USAF receptors were added hour-by-hour to modeled concentrations before computing 98th percentile total impact, rather than a single background value being added to the modeled impact as for the other cases.”Project-only” and “all sources” are the same except for 1-hr NO2 “other” receptors.
Sources: CO: PSD Application Table 6-9, p.6-9 pdf.54; Project-only plus background NO2 USAF: Supplemental Information p3-3. pdf.23 NO2 other: Updated Analyses Memo Table 7, p.11 pdf.11, “Startup/Shutdown - No PHPP Emergency generator”
8.5 Class I Area Analysis The Class I area analysis was performed using CALPUFF Version 5.8 for long range transport, which required additional detailed meteorological data as explained in the applicant’s Class I Modeling Protocol. Additionally, the applicant used CALPUFF to assess PSD Class I increment consumption, regional haze, and acid deposition. The Class I modeling protocol was provided to the Federal Land Managers (FLMs) for the two relevant Class I areas, the Cucamonga and the San Gabriel Wilderness Areas. The FLMs raised no objections to the protocol or the modeling

Palmdale (SE 09-01) Fact Sheet/Ambient Air Quality Impact Report August 2011
63
itself.
8.5.1 Class I Increment Consumption Analysis The results of the PHPP Class I increment analysis are shown in Table 8-9; for the PSD pollutants for which there are applicable increments, PHPP impacts are less than the Class I Significant Impact Levels (SILs), and therefore the applicant has demonstrated that the Project will not cause or contribute to any Class I PSD increment violation.
Table 8-9: PHPP Class I Increment Impacts
Class I Area Pollutant and
averaging time Project Impact,
µg/m3
Significant Impact Level,
µg/m3
Class I PSD Increment,
µg/m3
Cucamonga Wilderness Area
NO2, annual 0.0010 0.1 2.5 PM10, 24-hr 0.059 0.3 8 PM10, annual 0.003 0.2 4
San Gabriel Wilderness Area
NO2, annual 0.0017 0.1 2.5 PM10, 24-hr 0.122 0.3 8 PM10, annual 0.004 0.2 4
Source: PSD Application, Table 6-10, p.6-11 pdf.56
8.5.2 Visibility and Deposition in Class I areas The PSD regulations at 40 C.F.R. section 52.21 require that PSD permit applicants address potential impairment to visibility (e.g., regional haze, plume blight) for Class I areas. The deposition of nitrogen is another potential concern due to potential effects on soils, vegetation, and other biological resources. For Cucamonga Wilderness Area (WA), which is located greater than 50 km from the Project, a Class I regional haze analysis was conducted. The modeling considered the two CTGs’ emissions of H2SO4, NOX, PM10, PM2.5, and SO2. The applicant used CALPUFF to predict visibility impacts at Class I areas. Visibility impacts are assessed using the extinction coefficient (bext), which represents the scattering of light by air pollutants, which appears as haze that reduces visibility. The results of the CALPUFF modeling for the three meteorology years (2001-2003) are shown in Table 8-10 and indicate that changes in light extinction (bext), averaged over a 24-hour period, at Cucamonga WA is predicted to be below the 5% change threshold46.
46 “Federal Land Managers’ Air Quality Related Values Workgroup (FLAG) Phase I Report” (December 2000), U.S. Forest Service, National Park Service, U.S. Fish And Wildlife Service. http://www2.nature.nps.gov/air/Permits/flag/

Palmdale (SE 09-01) Fact Sheet/Ambient Air Quality Impact Report August 2011
64
Table 8.10: Class I Area Regional Haze CALPUFF Modeling Results
Class I Area Maximum Predicted
% Change in bext Significance Threshold
(%) 2001 2002 2003
Cucamonga WA
1.77
2.14
1.92 5
Applicants are not required to perform a cumulative effects analysis of new source growth if the visibility impact of their proposed source is less than 5%. Based on the Class I regional haze results, emissions from the facility are not expected to have an adverse impact on visibility in the Cucamonga WA. For San Gabriel WA, which is within 50 km of the Project, the impact of the Project on visibility impairment, also known as plume blight, was assessed. The EPA VISCREEN screening model was used to estimate visibility impairment to the San Gabriel WA from the CTG emissions. Effects of plume blight are assessed as changes in plume perceptibility (ΔE) and plume contrast (Cp) for sky and terrain backgrounds. A Level 1 analysis, using default meteorological data and no site-specific conditions, was conducted. Because the Level 1 results of ΔE and Cp were above the screening thresholds, a Level 2 analysis was conducted. A detailed discussion of the VISCREEN plume blight impact analysis is presented in Section 6.2.4 of the applicant’s PSD permit application. The results of the VISCREEN modeling runs are presented in Tables 8-11 and 8-12. The VISCREEN results are presented for the two default worst-case theta angles – theta equal to 10 degrees representing the sun being in front of an observer, and theta equal to 140 degrees representing the sun being behind the observer. A negative plume contrast means the plume has a darker contrast than the background sky.
Table 8-11a: Class I VISCREEN Modeling Results of Changes in Plume Perceptibility (ΔE)
Background Distance Plume Perceptibility (ΔE) Theta 10 Theta 140 Criteria
Sky 47.4 0.135 0.261 2.00 Terrain 34.6 0.806 0.072 2.00

Palmdale (SE 09-01) Fact Sheet/Ambient Air Quality Impact Report August 2011
65
Table 8-11b: Class I VISCREEN Modeling Results of
Changes in Plume Contrast (Cp)
Background Distance Plume Contrast (Cp) Theta 10 Theta 140 Criteria
Sky 47.4 0.001 -0.009 0.05 Terrain 34.6 0.005 0.001 0.05
The results from the VISCREEN model show that changes in plume perceptibility and plume contrast for sky and terrain backgrounds are below the criteria thresholds. Therefore, the plume would not be perceptible against a sky or terrain background. For Cucamonga WA and San Gabriel WA, a deposition analysis was conducted for nitrogen compounds which considered Project emissions of NOX and conversion of NOX to nitrate and nitric acid. The results from the deposition analysis are presented in Table 8-12.
Table 8-12: Class I Nitrogen Deposition CALPUFF Modeling Results
Class I Area
Maximum Predicted Nitrogen Deposition – Annual average (g/ha/yr)
Deposition Analysis
Threshold (g/ha/yr)
2001 2002 2003
Cucamonga WA 0.496 0.521 0.458 5 San Gabriel WA 0.718 0.396 0.607 5
The Deposition Analysis Threshold was established by the Federal Land Managers, and represents a level below which deposition is deemed to have no adverse effect, and does not require further analysis.47 The maximum deposition rates modeled for PHPP are below the Class I Area Nitrogen Deposition Analysis Threshold of 0.005 kilograms per hectares per year, or below 5 grams per hectare per year (g/ha/yr), and therefore no further deposition analysis is necessary.
9. Additional Impact Analysis
In addition to assessing the ambient air quality impacts expected from a proposed new source, the PSD regulations require that EPA evaluate other potential impacts on 1) soils and vegetation; 2) growth; and 3) visibility impairment. 40 C.F.R. § 52.21(o). The depth of the analysis generally depends on existing air quality, the quantity of emissions, and the
47 “Guidance on Nitrogen and Sulfur Deposition Analysis Thresholds”, Attachment to Letter from Christine L. Shaver, National Park Service and Sandra V. Silva, U.S. Fish and Wildlife Service to S. William Becker, STAPPA/ALAPCO, January 3, 2002 (files DatNotifyLetter.pdf, nsDATGuidance.pdf) http://www.nature.nps.gov/air/Permits/flag/

Palmdale (SE 09-01) Fact Sheet/Ambient Air Quality Impact Report August 2011
66
sensitivity of local soils, vegetation, and visibility in the source's impact area.
9.1 Soils and Vegetation For the soils and vegetation analysis, the applicant considered as part of the impact area the 400 meter significant impact area considered in the initial PSD application for the Project. In the applicant’s July 2010 supplement (Section 5.0), the applicant provided additional information on the vegetation and soils inventory in the project area, a discussion of the potential impacts to those soils and vegetation types with respect to the five Class II areas (within 50 km of the project) discussed in Section 9.2, Visibility Impairment, and a discussion of nitrogen deposition. Also, the applicant noted there are no federal habitat areas of concern within 20 miles of the PHPP. For most types of soils and vegetation, ambient concentrations of criteria pollutants below the secondary NAAQS will not result in harmful effects because the secondary NAAQS are set to protect public welfare, including vegetation, crops, and animals. No harmful effects are expected from this project because the total estimated maximum ambient concentrations presented in Table 9-1 are below the primary NAAQS (listed in Table 8-1 of Section 8) and secondary NAAQS for NO2 (100 µg/m3) and PM2.5 (35 µg/m3 for 24-hour periods; and 15.0 µg/m3 over an annual period). There are no secondary NAAQS for CO. The initial application (dated March 2009) used EPA’s "Screening Procedure for the Impacts of Air Pollution Sources on Plants, Soils and Animals" (1980)48 to determine if maximum modeled ground-level concentrations of NO2 and CO could have an impact on plants, soils, and animals. The modeled impacts of NO2 and CO emissions from the facility, individually, and in addition to the background concentrations of NO2 and CO, are below the minimum impact level for sensitive plants. The following table summarizes information in this regard from the PSD application (Table 6-17, Soils and Vegetation Analysis).
Table 9. 1 Project Maximum Concentrations and EPA Guidance Levels
Criteria Pollutant and Guidance
Averaging Time
EPA Screening Concentration
(µg/m3)
Modeled Maximum Concentrations
(µg/m3)
Modeling Averaging
time NO2 4-Hours 3,760 419.7 1 hour NO2 8-Hours 3,760 419.7 1 hour NO2 1-Month 564 419.7 1 hour NO2 Annual 94 29.2 Annual CO Weekly 1,800,000 1,806.4 8 hour
48 Screening Procedure for the Impacts of Air Pollution Sources on Plants, Soils, and Animals,” EPA 450/2-81-078, December 1980.

Palmdale (SE 09-01) Fact Sheet/Ambient Air Quality Impact Report August 2011
67
As part of the July 2010 supplement regarding additional impacts to vegetation, the applicant also reviewed a document developed by the U.S. Department of Agriculture entitled “A Screening Procedure to Evaluate Air Pollution Effects in Region 1 Wilderness Areas” (1991). As a complement to the EPA 1980 screening procedure document, the applicant determined that for the NOX “sensitive” species of alfalfa, which is found nearby the project, the modeled air concentrations (Table 9-1) demonstrate that the impacts are below the significance criteria. The applicant also considered soil acidification and eutrophication as part of the July 2010 supplement regarding additional impacts on soil. Nitrogen deposition in soil can have beneficial effects to vegetation if they are lacking these elements; however, gaseous emissions impacts on soils at levels greater than vegetation requirements can cause acidic conditions to develop. Soil acidification and eutrophication can occur as a result of atmospheric deposition of nitrogen. The applicant determined that project-specific modeling for nitrogen deposition was not warranted because the estimated nitrogen deposition rates were negligible as a plant growth influence and because the effects of deposition on eutrophication were insignificant, as described below. When considering soil acidification, the applicant referred to the CALPUFF modeling conducted for the PHPP’s Class I analysis. The applicant also referred to the nitrogen deposition modeling analysis (using CALPUFF) performed for a similar project, the Victorville 2 (VV2) Hybrid Power Project.49 CALPUFF incorporates the atmospheric chemistry and chemical transformations to determine nitrogen deposition and provides results in units of kilograms per hectare per year, which can be converted to pounds per unit area. For the VV2 project, the modeled maximum annual deposition rate was considered to be very low. The PHPP is nearly identical to the VV2 hybrid solar-gas plant, with the exception of a larger natural gas-fired auxiliary boiler; the PHPP boiler is 110 MMBtu/hr, while the VV2 boiler is 40 MMBtu/hr. Additionally, the predominant wind direction for PHPP is the northeast of the power block, which is similar to the predominant wind direction for VV2. (There have not been pertinent upgrades to the CALPUFF model since the VV2 2008 analysis.). Because of the similarities between the PHPP and VV2, and VV2’s fence line deposition of 1.2 ounces of nitrogen per acre, the applicant determined that the nitrogen deposition rates for PHPP also would be considered negligible as a plant growth influence, and therefore no additional nitrogen deposition analysis was performed. In sum, based on our consideration of the information and analysis provided by the applicant, we do not believe that emissions associated with the Project will result in adverse impacts on soils or vegetation.
49 EPA Region 9 issued the initial PSD permit to the Victorville 2 Hybrid Power Project in 2010. EPA proposed the PSD permit in 2008, with Docket I.D. number EPA-R09-OAR-2008-0406. (http://www.regulations.gov/#!docketDetail;D=EPA-R09-OAR-2008-0406). The initial PSD permit was issued in 2010 with Docket I.D. number EPA-R09-OAR-2008-0765 (http://www.regulations.gov/#!docketDetail;D=EPA-R09-OAR-2008-0765 )

Palmdale (SE 09-01) Fact Sheet/Ambient Air Quality Impact Report August 2011
68
9.2 Visibility Impairment Using procedures in EPA’s Workbook for Plume Visual Impact Screening and Analysis50, the applicant evaluated visibility impairment for one Class I area and five Class II areas. The five Class II areas included three state parks, one woodland, and one wilderness area. In the initial PSD application, the applicant presented visibility impairment (e.g., plume blight) for the Class I area of San Gabriel Wilderness Area (see Section 8.5.2 of the application), which is located within 50 km of the proposed PHPP. The applicant provided supplemental application information for visibility impairment in July 2010 for five Class II areas identified as potentially sensitive state or federal parks, forests, monuments, or recreation areas within 50 km of the project. These five areas with their approximate closest distances to PHPP were:
• Antelope Valley Indian Museum State Park (23 km) • Saddleback Butte State Park (26 km) • Antelope Valley California Poppy State Reserve (26 km), • Arthur B. Ripley Desert Woodland (37 km), and • Sheep Mountain WA (43 km)
The applicant performed a Level 1 and Level 2 VISCREEN analysis for all five areas. The results of this analysis were below the significance criteria for three of the five areas. A further refinement in VISCREEN of plume perceptibility for the two exceptions – Saddleback Butte State Park and Antelope Valley Indian Museum State Park – was performed for the worst-case daytime meteorological conditions; the result is that the plume would not be perceptible at either site during daylight hours, based on low plume perceptibility and contrast predicted by VISCREEN. Based on the VISCREEN results, w believe that the Project would not contribute to visibility impairment.
9.3 Growth The growth component of the additional impact analysis considers an analysis of general commercial, residential, industrial and other growth associated with the PHPP. 40 C.F.R. § 52.21(o). The PHPP is expected to employ 36 employees, with an ample work force in the Southern California area to accommodate the PHPP estimated peak of 767 construction workers; impacts to the local population and housing needs are therefore expected to be minimal. Therefore, we do not expect this project to result in any significant growth. The applicant provided growth-related information in its initial PSD application and in supplemental application materials submitted to EPA in July 2010 and July 2011. The July 2011 supplement includes Attachment A, which is an updated version of the socioeconomics analysis PHPP prepared for its July 2008 California Energy Commission (CEC) Application for 50 “Workbook for Plume Visual Impact Screening and Analysis (Revised)”, EPA, EPA–454/R–92–023, 1992.

Palmdale (SE 09-01) Fact Sheet/Ambient Air Quality Impact Report August 2011
69
Certification (AFC). The applicant’s original July 2008 CEC AFC socioeconomics analysis was based on 2000 Census data; Attachment A of the July 2011 supplement includes updated information based on the available 2010 Census data regarding population and population growth projections.
The applicant’s initial PSD application growth analysis (Section 6.3.2) stated that “… no long-term growth is expected during project operations.” A Project labor force of 36 employees was estimated. The July 2010 supplement further discussed the Project’s potential growth-inducing activities. Additional details in this supplement included a summary of growth-inducing impacts associated with employment. The information submitted indicates that for the construction and operating phases of the Project, impacts to the population and housing needs are expected to be minimal, and are expected not to induce substantial population growth. With regards to the question of whether the Project’s power generation would induce growth, the applicant anticipates that the Project would likely displace the older once-through cooling facilities in the Southern California region that are expected to be retired in the future. Therefore, rather than induce growth, PHPP would supply energy to accommodate the existing demand and projected growth in the Southern California region. In sum, based on our consideration of the information and analysis provided by the applicant, we do not expect the Project to result in any significant growth.
10. Endangered Species Pursuant to section 7 of the Endangered Species Act (ESA), 16 U.S.C. 1536, and its implementing regulations at 50 C.F.R. Part 402, EPA is required to ensure that any action authorized, funded, or carried out by EPA is not likely to jeopardize the continued existence of any endangered or threatened species or result in the destruction or adverse modification of such species’ designated critical habitat. EPA has determined that this PSD permitting action is subject to ESA section 7 requirements. The applicant and EPA identified two federally-listed species,the desert tortoise Gopherus agassizii) and the arroyo toad (Bufo californica), that might be affected by the proposed PSD permitting action for the Project. In March 2009, a Draft Biological Assessment (BA) was submitted by the applicant to EPA and the U.S. Fish and Wildlife Service (FWS). Based on discussions between the applicant and FWS, in August 2009, the applicant submitted to EPA and FWS an Addendum to the BA. The BA Addendum further detailed that the PHPP “… may affect but is not likely to adversely affect the desert tortoise and will have no effect on the arroyo toad.” In July 2011, the applicant submitted a second Addendum to the BA to EPA and FWS, outlining updates to the Project scope and a further analysis supporting the conclusion that the PHPP may affect, but is not likely to adversely affect, the federally-listed desert tortoise and will have no effect on the federally-listed arroyo toad.

Palmdale (SE 09-01) Fact Sheet/Ambient Air Quality Impact Report August 2011
70
In a letter dated August 5, 2011, EPA requested FWS’s written concurrence with EPA’s determination under ESA section 7 that the proposed PSD permit for the PHPP is not likely to adversely affect the desert tortoise or arroyo toad. EPA will proceed with its final PSD permit decision after making a determination that issuance of the permit will be consistent with ESA requirements. In making this determination, EPA will consider actions taken, or to be taken, by the applicant to ensure ESA compliance.
11. Environmental Justice Analysis Executive Order 12898, entitled “Federal Actions To Address Environmental Justice in Minority Populations and Low-Income Populations,” states in relevant part that “each Federal agency shall make achieving environmental justice part of its mission by identifying and addressing, as appropriate, disproportionately high and adverse human health or environmental effects of its programs, policies, and activities on minority populations and low-income populations.” Section 1-101 of Exec. Order 12898, 59 Fed. Reg. 7629 (Feb. 16, 1994). EPA determined that there may be minority or low-income populations potentially affected by its proposed action on the PHPP PSD permit application, and determined that it would be appropriate to prepare an Environmental Justice Analysis for this action. EPA therefore prepared an Environmental Justice Analysis, which is included in the administrative record for EPA’s proposed PSD permit for the Project. EPA’s analysis concludes that the Project will not cause or contribute to air quality levels in excess of health standards for the pollutants regulated under EPA’s proposed PSD permit for the Project, and that therefore the Project will not result in disproportionately high and adverse human health or environmental effects with respect to these air pollutants on minority or low-income populations residing near the proposed Project, or on the community as a whole.
12. Clean Air Act Title IV (Acid Rain Permit) and Title V (Operating Permit) The applicant must apply for and obtain an acid rain permit and a Title V operating permit. The applicant will apply for these permits after the facility is constructed, as these permits are not required prior to construction. The District has jurisdiction to issue the Acid Rain Permit and the Operating Permit for the facility.
13. Comment Period, Hearing, Public Information Meeting, Procedures for Final Decision, and EPA Contact

Palmdale (SE 09-01) Fact Sheet/Ambient Air Quality Impact Report August 2011
71
The comment period for EPA’s proposed PSD permit for the Project begins on August 11, 2011. Any interested person may submit written comments on EPA’s proposed PSD permit for the Project. All written comments on EPA’s proposed action must be received by EPA via email by September 14, 2011, or postmarked by September 14, 2011. Comments must be sent or delivered in writing to Lisa Beckham at one of the following addresses:
E-mail: [email protected]
U.S. Mail: Lisa Beckham (AIR-3) U.S. EPA Region 9 75 Hawthorne Street San Francisco, CA 94105-3901 Phone: (415) 972-3811
Comments should address the proposed PSD permit and facility, including such matters as:
1. The Best Available Control Technology (BACT) determinations; 2. The effects, if any, on Class I areas; 3. The effect of the proposed facility on ambient air quality; and 4. The attainment and maintenance of the NAAQS.
Alternatively, written or oral comments may be submitted to EPA at the Public Hearing for this matter that EPA will hold on September 14, 2011, pursuant to 40 C.F.R. § 124.12, to provide the public with further opportunity to comment on the proposed PSD permit for the Project. At this Public Hearing, any interested person may provide written or oral comments, in English or Spanish, and data pertaining to the proposed permit. Prior to the Public Hearing, EPA will also hold a Public Information Meeting for the purpose of providing interested parties with additional information and an opportunity for informal discussion of the proposed Project. The date, time and location of the Public Information Meeting and the Public Hearing are as follows: Date: September 14, 2011 Time: 4:00 p.m. - 6:00 p.m. (Public Information Meeting) 7:00 p.m. – 10:00 p.m. (Public Hearing) Location: Larry Chimbole Cultural Center Manzanita Ballroom, 2nd Floor
38350 Sierra Highway Palmdale, California 93550-4611

Palmdale (SE 09-01) Fact Sheet/Ambient Air Quality Impact Report August 2011
72
English-Spanish translation services will be provided at both the Public Information Meeting and the Public Hearing. If you require a reasonable accommodation, by August 31, 2011 please contact Terisa Williams, EPA Region 9 Reasonable Accommodations Coordinator, at (415) 972-3829, or [email protected]. All information submitted by the applicant is available as part of the administrative record. The proposed air permit, fact sheet/ambient air quality impact report, permit application and other supporting information are available on the EPA Region 9 website at http://www.epa.gov/region09/air/permit/r9-permits-issued.html#pubcomment. The administrative record may also be viewed in person, Monday through Friday (excluding Federal holidays) from 9:00 AM to 4:00 PM, at the EPA Region 9 address above. Due to building security procedures, please call Lisa Beckham at (415) 972-3811 at least 24 hours in advance to arrange a visit. Hard copies of the administrative record can be mailed to individuals upon request in accordance with Freedom of Information Act requirements as described on the EPA Region 9 website at http://www.epa.gov/region9/foia/ . Additional information concerning the proposed PSD permit may be obtained between the hours of 9:00 a.m. and 4:00 p.m., Monday through Friday, excluding holidays, from:
E-mail: [email protected] U.S. Mail: Lisa Beckham (AIR-3) U.S. EPA Region 9 75 Hawthorne Street San Francisco, CA 94105-3901 Phone: (415) 972-3811
EPA’s proposed PSD permit for the Project and the accompanying fact sheet/ambient air quality impact report are also available for review at the following locations: Antelope Valley Air Quality Management District, 43301 Division Street, Suite 206, Lancaster, CA 93535, (661) 723-8070; Palmdale City Library, 700 East Palmdale Boulevard, Palmdale, CA 93550-4742, (661) 267-5600; Lancaster Regional Library, 601 W. Lancaster Boulevard, Lancaster, CA 93534-3398, (661) 948-5029; Lake Los Angeles Library, 16921 East Avenue O, Palmdale, CA 93591-3045, (661) 264-0593; and Quartz Hill Library, 42018 N. 50th Street West, Quartz Hill, CA 93536-3590, (661) 943-2454. All comments that are received will be included in the public docket without change and will be available to the public, including any personal information provided, unless the comment includes Confidential Business Information (CBI) or other information whose disclosure is restricted by statute. Information that is considered to be CBI or otherwise protected should be clearly identified as such and should not be submitted through e-mail. If a commenter sends e-mail directly to the EPA, the e-mail address will be automatically captured and included as part of the public comment. Please note that an e-mail or postal

Palmdale (SE 09-01) Fact Sheet/Ambient Air Quality Impact Report August 2011
73
address must be provided with comments if the commenter wishes to receive direct notification of EPA’s final decision regarding the permit. EPA will consider all written and oral comments submitted during the public comment period before taking final action on the PSD permit application and will send notice of the final decision to each person who submitted comments and contact information during the public comment period or requested notice of the final permit decision. EPA will respond to all substantive comments in a document accompanying EPA’s final permit decision and will make the Public Hearing proceedings available to the public. EPA’s final permit decision will become effective 30 days after the service of notice of the decision unless: 1. A later effective date is specified in the decision; or 2. The decision is appealed to EPA’s Environmental Appeals Board pursuant to 40 CFR
124.19; or 3. There are no comments requesting a change to the proposed permit decision, in which
case the final decision shall become effective immediately upon issuance.
14. Conclusion and Proposed Action
EPA is proposing to issue a PSD permit for the PHPP. We believe that the proposed Project will comply with PSD requirements, including the installation and operation of BACT, and will not cause or contribute to a violation of the applicable NAAQS or applicable PSD increments. We have made this determination based on the information supplied by the applicant and our review of the analyses contained in the permit application and other relevant information contained in our administrative record. EPA will make this proposed permit and this Fact Sheet/AAQIR available to the public for review, and make a final decision after considering any public comments on our proposal.

Excerpt
4

U.S. Environmental Protection Agency October 2011
Responses to Public Comments on the Proposed Prevention of Significant Deterioration Permit for the Palmdale Hybrid Power Project

2
Contents
I. INTRODUCTION ......................................................................................................................... 3 SUMMARY OF THE FORMAL PUBLIC PARTICIPATION PROCESS ............................................................. 3
II. EPA’S RESPONSES TO THE PUBLIC COMMENTS .............................................................. 5 A. WRITTEN COMMENTS .................................................................................................................. 5
Comments Submitted by Reed Glyer on behalf of the City of Lancaster ............................................ 5 Comments Submitted by Gideon Kracov on Behalf of Desert Citizens Against Pollution and California Communities Against Toxics ........................................................................................... 7 Comments Submitted by April Sommer on behalf of Rob Simpson and Helping Hand Tools ........... 10 Comments Submitted by Rob Simpson............................................................................................ 27 Comments Submitted by AECOM on behalf of the City of Palmdale ............................................... 48 Written Comments Received During the Informational Meeting and Formal Public Hearing on September 14, 2011 ....................................................................................................................... 56
B. ORAL COMMENTS RECEIVED DURING THE PUBLIC HEARING ON SEPTEMBER 14, 2011 .............. 57
III. REVISIONS IN FINAL PERMIT .......................................................................................... 58

3
I. Introduction
Summary of the Formal Public Participation Process The U.S. Environmental Protection Agency, Region 9 (EPA) proposed to issue a Prevention of Significant Deterioration (PSD) permit to the City of Palmdale for the Palmdale Hybrid Power Project (PHPP) on August 11, 2011. The public comment period on the proposal (Proposed Permit)1 began August 11, 2011 and closed on September 14, 2011. During the public comment period EPA took comments on the proposed permit and specifically requested comments regarding: 1) the best available control technology (BACT) determinations; 2) the effects, if any, on Class I areas; 3) the effect of the proposed facility on ambient air quality; and 4) the attainment and maintenance of the NAAQS. The purpose of this document is to respond to every significant issue raised in the public comments received during the public comment period and explain what changes have been made in the final permit (Final Permit) as a result of those comments. EPA announced the public comment period through public notices published in the Antelope Valley Press (in English and Spanish) on August 14, 2011, La Prensa Popular (in Spanish only) on August 16, 2011 and on Region 9’s website (in English and Spanish) on August 12, 2011. EPA also distributed the English and Spanish public notices to the necessary parties in accordance with 40 CFR Part 124, including notices sent by mail on August 11, 2011 and email on August 12, 2011. Parties notified by EPA included agencies, organizations, and public members for whom contact information was obtained through a number of different methods, including requests made directly to EPA through Region 9’s website (or through other means) from parties seeking notification regarding permit actions in California, within the Antelope Valley Air Quality Management District (District), within Los Angeles County, or specific to the PHPP; appropriate contacts from the California Energy Commission’s Palmdale mailing list; the mailing list used by the District; contacts provided by the City of Palmdale and the City of Lancaster; and other parties known to EPA that may have an interest in this action. EPA provided notice to numerous government agencies in accordance with 40 CFR Part 124, including, but not limited to, the California Energy Commission (CEC), the District, the City of Palmdale, the City of Lancaster, and the Department of the Air Force. The Administrative Record for the Proposed Permit was made available at EPA Region 9’s office. EPA also made the Proposed Permit, the Fact Sheet and Ambient Air Quality Impact Report (Fact Sheet) and other supporting documents available on Region 9’s website, at the District office in Lancaster, CA and at the following public libraries: the Palmdale City Library in Palmdale, CA, the Lancaster Regional Library in Lancaster, CA, the Lake Los Angeles Library in Palmdale, CA, and the Quartz Hill Library in Quartz Hill, CA.
1 We note that EPA’s permitting regulations at 40 CFR Part 124 refer to proposed permits as “draft permits.” See 40 CFR 124.6.

4
EPA held a formal public hearing, on September 14, 2011 in Palmdale, California. All oral public comments made were recorded by a court reporter, and a Spanish language interpreter was present for oral translation. EPA also held a public information meeting earlier on September 14, 2011 in Palmdale, California. The purpose of the public information meeting was to provide interested parties with additional information and an opportunity for informal discussion of the proposed Project. A Spanish language interpreter was present for oral translation. EPA responded to questions at these meetings but did not formally record remarks from those in attendance. However, attendees of the meeting were given the opportunity to submit written comments. EPA’s public notice for the Proposed Permit provided the public with notice of both the public hearing and the public information meeting. During the public comment period, EPA received several comment letters by mail and email. We also received written and oral comments at the public hearing. All comments received equal weight, regardless of the method used to submit them.

5
II. EPA’s Responses to the Public Comments This section summarizes all significant public comments received by EPA and provides our responses to the comments. In some instances, similar comments may be grouped together by topic into one comment summary, and addressed by one EPA response. The full text of all public comments and many other documents relevant to the permit can be accessed online through EPA’s website at http://www.epa.gov/region09/air/permit/r9-permits-issued.html.
A. Written Comments Comments Submitted by Reed Glyer on behalf of the City of Lancaster
1. Comment: The commenter raises concerns about the facility’s emissions’ compliance
with the State of California’s 1-hour standard for nitrogen dioxide (NO2) in the context of the California Energy Commission’s (CEC) Presiding Member’s Proposed Decision (PMPD). Response: Issues concerning the Project’s compliance with State of California air quality standards and the CEC’s licensing process for the Project are beyond the scope of matters regulated under the PSD permit for the Project. These matters are addressed through separate approval processes conducted for the Project under State and local laws by the Antelope Valley Air Quality Management District (District) and the CEC, which are separate from the PSD permitting process for the Project that is implemented by EPA.
2. Comment: The commenter stated the Project will result in an increase of particulate
matter under 2.5 µm in diameter (PM2.5) of 11.6 µg/m3, which is above the above the increment of 9 µg/m3. By exceeding the maximum allowable increase in 24-hour PM2.5 emissions, the Project would significantly deteriorate the air quality in the Antelope Valley.
The commenter stated that the Project would increase PM2.5 emissions levels by 70% in the Antelope Valley and prevent future industrial growth in the area needed for the local aerospace industry. The commenter is concerned that the Project would use the majority of the Antelope Valley’s remaining PM2.5 emissions allotment and would severely limit the future growth of the aerospace industry and permanently damage the long-term economic viability of the Valley.
Response: In promulgating the PM2.5 increments, EPA stated that we would begin implementing the Federal PSD program requirements for the PM2.5 increments on the effective date of those increments; that is, on October 20, 2011. Implementation for PSD permits issued after that date will include a review of the amount of increment consumed by major stationary sources after the PSD major source baseline date, October 20, 2010. See 75 Fed. Reg. 64877, 64898-99 (October 20, 2010) (“Accordingly, we are setting the effective date of the PM2.5 increments at 1 year from the date of promulgation of this final rule [October 20, 2010], consistent with the 1-year delay required under section 166(b) of the Act.”). Because the PSD permit for the PHPP is being issued prior to October 20, 2011, an increment analysis for PM2.5 is not required, even though, as explained below, the

6
emissions increase resulting from the source will count against the increments and must be accounted for by subsequent PSD sources proposing to locate in the area.
The concerns expressed by the commenter regarding the consumption of PM2.5 increment affecting future industrial growth in the area and associated economic impact are generally outside the scope of PSD review as the increment is not effective at this time.
However, for informational purposes, we believe it may be useful to point out that in general, while the impacts and percent increases in PM2.5 cited by the commenter are approximately correct summaries of the numerical results from the applicant’s modeling, we disagree that the results imply substantial air quality deterioration or restriction on future industrial growth, as explained below.
Because the Project would be constructed after the major source baseline date for the PM2.5
increment, it would consume PM2.5 increment, and could potentially affect the amount of increment available for future sources. The air quality impact analysis for any future project subject to PSD would have to take into account the consumption of increment by PHPP. The specific practical effect of this is not known at the current time, as the applicant’s modeling was a conservative National Ambient Air Quality Standards (NAAQS) analysis that does not constitute a cumulative PSD increment analysis.
However, the information available to EPA indicates that consumption of PM2.5 increment by PHPP is unlikely to substantially constrain the construction of additional sources. The area over which PHPP has a significant PM2.5 impact is limited in geographic scope to an area fairly close to the PHPP site. The area over which PHPP has a significant PM2.5 impact extends only about 1 mile beyond the PHPP property boundary. Therefore, an additional source would have to threaten the increment on its own within the 1 mile circle around PHPP before their combined impact would be a concern.2 In addition, the increment modeling analysis that would need to be performed for a future source would likely be different than the cumulative NAAQS analysis performed for PHPP. For example, PHPP conservatively used PM10 emissions for many of the sources in the PM2.5 NAAQS analysis; a more refined analysis could use only PM2.5. Since PM2.5 is a fraction of PM10, emissions would be substantially lower, and the impact areas described above would be even smaller. In summary, although a full PM2.5 increment analysis has not been performed, the modeling that is available gives strong assurance that a substantial portion of the PM2.5 increment remains available for future new sources.
3. Comment: Citing the California Code of Regulations (CCR), the commenter stated the
CEC and its PMPD did not comply with the CCR’s requirement to “find out and disclose” all foreseeable sources of emissions in the Valley. The commenter is concerned that the modeling analyses did not identify any future foreseeable sources of PM2.5 emissions in the Antelope Valley. The commenter states that a substantive consideration of foreseeable future sources of PM2.5 emissions, such as expansion of the existing aerospace and other
2 The Class I area Significant Impact Level (SILs) are lower than the Class II SILs discussed here, and so PHPP impacts would exceed them over a larger area. However, they apply only in Class I areas, where PHPP impacts would be far below the applicable SILs, and would impose essentially no constraint on future sources.

7
light industrial uses, is needed, and requests that EPA deny or delay the issuance of the permit until such an analysis is conducted.
Response: Concerns about compliance with the CCR and associated issues relating to the CEC’s PMPD are matters of State law and are generally outside the scope of matters regulated under the PSD permit for the Project; the commenter has not identified or described how the issues are relevant to EPA’s PSD permit or associated analysis. Also, as noted in Response 43, the impacts of future sources are outside the scope of the PSD air quality analysis for PHPP. The impacts of any such future source would be accounted for at the time it seeks its own PSD permit.
4. Comment: The commenter stated additional measures are needed to address the visual
blight associated with the Project, as required by the California Environmental Quality Act (CEQA). The commenter notes impacts associated with the facility’s structure, states that the 622 foot high water vapor plumes associated with the Project would have an “adverse effect on visual resources,” and states that the Project results in the complete obstruction of the “scenic views of the San Gabriel Mountains” from three of the four key observation points at the facility. The commenter requests that EPA delay or deny issuance of its PSD permit on these grounds.
Response: The commenter has not described how visual impacts from the facility’s structure or the CEC’s compliance with CEQA raise issues with EPA’s PSD permit or analysis for the Project; these issues generally appear to be outside the scope of the PSD program and the PSD permit for the Project. We note that EPA believes that PHPP adequately addressed the PSD regulatory requirements for assessing impairment to visibility (see 40 CFR 52.21(o)). The regulations require an assessment, but do not prescribe a particular test that a project must pass in order to receive a permit. To assess the visibility of the plume from the project, the applicant performed an extensive visibility analysis for nearby Class I areas and for some sensitive Class II areas (Sheep Mountain Wilderness Area, Saddleback Butte State Park, Antelope Valley Indian Museum State Park, Antelope Valley California Poppy State Reserve, and Arthur B. Ripley Desert Woodland). The impacts were found to be small, below the color difference and brightness contrast thresholds in EPA’s Workbook for Plume Visual Impact Screening and Analysis. In sum, EPA does not believe that the issue raised by the commenter provides grounds for delaying or denying issuance of EPA’s PSD permit.
Comments Submitted by Gideon Kracov on Behalf of Desert Citizens Against Pollution and California Communities Against Toxics
5. Comment: The commenter incorporated by reference and requested a response to attached
documents relating to the Project prepared by Lisa Belenky for the Center for Biological Diversity (CBD) and Dr. Phyllis Fox, consulting engineer for the CBD. Specifically, the commenter requested that EPA respond to those comments that addressed PM2.5 emissions,

8
interpollutant trading, and the air quality and other environmental impacts of the proposed use of road paving emission reduction credits.
Response: EPA acknowledges the documents provided by the commenter as attachments, and has included the attachments as part of the commenter’s comments in the record for this action. The commenter, however, has not explained with any specificity the relevance to EPA’s PSD permit decision of these attachments, which appear to have been created in the context of California Energy Commission (CEC) and/or local approval processes separate from the proposed PSD permitting action for the Project. Therefore, EPA cannot provide a detailed response. We note, however, that the issue of PM2.5 increments is discussed in detail in Response 2.
We also note that the attached document from Dr. Phyllis Fox dated July 19, 2010 asserts that road paving associated with the Project may raise the potential for impacts to Federally listed endangered species; the U.S. Fish and Wildlife Service (USFWS) considered the issue of road paving generally in the Endangered Species Act (ESA) section 7 consultation with EPA for the PHPP, and determined that EPA’s proposed action was not likely to adversely affect any Federally-listed species.
6. Comment: The commenter is concerned that the Project will consume much of the allowable criteria pollutant increment in the attainment area and, as a result, will prevent more environmentally friendly facilities from obtaining PSD permits in the future. The commenter is concerned this will have a negative impact on the economy and green jobs. The commenter requested that EPA provide how much increment for the various criteria pollutants will remain available in the attainment area. The commenter asked what the socioeconomic impacts are with increment consumption and stated that those impacts must be examined as part of the required socioeconomic impact analysis for the Project.
Response: The PSD increments that are currently in effect for the area in which the PHPP will be located are for annual, 24-hour, and 3-hour sulfur dioxide (SO2), annual NO2, and annual and 24-hour particulate matter under 10 µm in diameter (PM10). There are no increments defined for the other criteria pollutants regulated under the permit, except for PM2.5. However, as discussed in detail in Response 2, the effective date for the PM2.5 increments is October 20, 2011, and therefore the PHPP is not required to perform an increment analysis because it is being issued a final PSD permit prior to that date. Response 2 also notes that the information available indicates the area over which PHPP has a significant PM2.5 impact is limited in geographic scope to an area fairly close to the PHPP site. The PHPP would emit lower than the significant emission rate of 40 tons per year for SO2, so PSD is not applicable to PHPP for SO2. For annual NO2, the Project’s modeled impacts are less than the SIL of 1 µg/m3 and therefore further air quality modeling was not necessary to demonstrate compliance with the increment. For 24-hour PM10, the Project’s maximum modeled impact was 12.7 µg/m3, which is above the SIL of 5 µg/m3and required a cumulative increment analysis. The PM10 increment consumption was modeled to be 12.9 µg/m3, which is below the increment of 30 µg/m3. Further, these significant impacts all

9
occur within half a mile of the PHPP main stack. Thus, EPA finds that the Project’s increment consumption for these pollutants would not be expected to preclude the development of other facilities. With respect to the commenter’s suggestion that a socioeconomic impact analysis be conducted including potential impacts from the PHPP’s increment consumption on environmentally friendly facilities, the local economy and green jobs, we note that the Project will not exceed any applicable increments, and that such matters are generally beyond the scope of PSD review.
7. Comment: The commenter stated that the cooling tower monitoring must include
monitoring of the water circulation rate at the time of total dissolved solids (TDS) sampling (to calculate drift rate from water circulation rate and TDS content).
Response: We agree with the commenter that the permit should require the water circulation rate to be recorded at the time of TDS sampling. We have revised the Cooling Tower Dissolved Solids Testing Requirements in Condition X.G.2.a accordingly.
8. Comment: The commenter stated that stack tests for the boilers should be required
annually instead of once every five years.
Response: The commenter has not provided sufficient justification to require annual testing of the auxiliary boiler and the heat transfer fluid (HTF) heater. As part of the GHG BACT requirements, the units will have to conduct annual boiler tune-ups. The tune-ups are designed to ensure the units are properly maintained and continue to operate at optimal efficiency overtime. In addition, these units have limited hours of operation (500 hours per year for the auxiliary boiler and 1,000 hours per year for the HTF heater). Based on these other requirements in the permit, EPA does not find that annual testing is warranted for these units.
9. Comment: The commenter stated that the initial performance test for the emergency
firewater pump engine and emergency generator is insufficient because the performance of the engines will deteriorate over time. The commenter stated that a stack test should be required at least every five years.
Response: The BACT emission limits established for these engines are equivalent to the applicable New Source Performance Standards (NSPS) limits for compression ignition engines. Per 40 CFR 60.4203, the engines must meet the applicable emissions limits for the certified emissions life of the engine. The certified emissions life for these engines is 8,000 hours or ten years, whichever comes first (see 40 CFR 1039.101(g). Therefore, we believe that additional testing is not necessary until the end of the certified emissions life for the engine occurs. We have revised Conditions X.G.1.a.iii and X.G.1.a.iv to require testing every five years beginning at the end of the certified emissions life for each engine.

10
10. Comment: The commenter stated that no quantification of heat transfer VOC emissions has been conducted. The commenter stated that this is generally done based on estimated annual loss (based on experience at other facilities) and should be quantified.
Response: We assume the commenter is referring to fugitive VOC emissions from the heat transfer fluid (HTF) associated with the HTF heater for the solar component of the Project. VOC emissions are not regulated under this PSD permit. We note, however, that these emissions were quantified as part of the CEC’s PMPD. Fugitive VOC emissions from the HTF were estimated at 0.2 tpy and the CEC required a monitored vapor control system at points where HTF can vent to the atmosphere, as well as leak-free expansion tanks. Please see page 6.2-10 of the CEC’s PMPD.
11. Comment: The commenter stated that under the PM2.5 final rule, the two “screening tools”
which include the SIL and the Significant Monitoring Concentration (SMC) for PM2.5 went into effect as of December 20, 2010. The commenter stated that EPA is already using these screening tools to review PSD applications. The SIL provides significance thresholds above which new sources must comply with increment analysis under the PSD program. See 40 CFR 52.21(k)(2). The Project will emit PM2.5 at levels far above these SILs. The SIL thresholds indicated that the PM2.5 emissions from the Project are significant and should have been analyzed as such in order to comply with NEPA and CEQA. The commenter also included the SILs for annual and 24-hr PM2.5 for Class I, II, and III areas as part of the comment.
Response: The PM2.5 increments do not become effective until October 20, 2011; because the PSD permit for the PHPP is being issued prior to October 20, 2011, an increment analysis for PM2.5 is not required for the PHPP. Please see Response 2 for a detailed discussion of the applicability of the PM2.5 increment with respect to the PHPP. We note that the applicant did conduct appropriate PM2.5 modeling in accordance with the applicable PSD requirements. However, EPA’s PSD permitting action is not subject to CEQA, which is a California State law requirement, nor is it subject to the National Environmental Policy Act (NEPA), as actions taken under the Clean Air Act are specifically exempt from NEPA per section 7(c) of the Energy Supply and Environmental Coordination Act of 1974, 15 U.S.C. 793(c)(1).
Comments Submitted by April Sommer on behalf of Rob Simpson and Helping Hand Tools
12. Comment: The commenter stated that EPA’s environmental justice analysis is woefully
inadequate and does not support its conclusion that “there will not be disproportionately high and adverse human health or environmental effects with respect to these air pollutants on minority or low-income populations residing near the proposed Project or the community as a whole.” The commenter states that EPA will have failed its duty to insure the fair treatment and meaningful involvement of all people in the implementation of the Clean Air Act in approving a polluting industrial facility.
The commenter went on to state there has been no public involvement, much less meaningful involvement in the environmental justice analysis process. The commenter

11
quoted Section 5-5(c) of EO 12898, which states that “[e]ach Federal agency shall work to ensure that public documents, notices, and hearings relating to human health or the environment are concise, understandable, and readily accessible to the public.”3 The commenter states that EPA has failed both the objectives and mandates of the Executive Order in making no attempt to involve the public in addressing PHPP environmental justice and human health issues. The commenter states that EPA has not really addressed environmental justice or human health at all.
Response: EPA believes that it has fulfilled its responsibilities under Executive Order 12898 (EO 12898 or EO), including Section 5-5(c), with respect to its PSD permitting action for the Project, as described in detail below. EPA also believes that the Environmental Justice Analysis that EPA prepared in conjunction with its proposed PSD permit for the PHPP (hereinafter referred to as “EJ Analysis”) was properly drafted and well-reasoned, and contained appropriate and adequate support for its conclusions.
Background
Executive Order 12898, “Federal Actions to Address Environmental Justice in Minority Populations and Low-Income Populations,” was signed on February 11, 1994. The EO establishes federal executive policy on environmental justice. Its main provision directs federal agencies, to the greatest extent practicable and permitted by law, to make environmental justice part of their mission by identifying and addressing, as appropriate, disproportionately high and adverse human health or environmental effects of their programs, policies and activities on minority populations and low-income populations. The EO is designed to focus the attention of federal agencies on the human health and environmental conditions in minority communities and low-income communities with the goal of achieving environmental justice.
EPA has determined that the EO applies to our PSD permitting decisions. See, e.g., In re
Shell Gulf of Mexico, Inc. & In Re Shell Offshore, Inc. (Frontier Discovery Drilling Unit) 15 E.A.D.___, OCS Appeal Nos. 10-01 through 10-04, slip op. at 63-64 (EAB Dec. 30, 2010) (citing prior EPA Environmental Appeals Board (EAB) opinions) (“Shell II”). EPA defines environmental justice as the fair treatment and meaningful involvement of all people regardless of race, color, national origin, or income with respect to the development,
3 The commenter also quotes paragraph (d) of Section 5-5 of EO 12898, which reads: “The Working Group shall hold public meetings, as appropriate, for the purpose of fact-finding, receiving public comments, and conducting inquiries concerning environmental justice. The Working Group shall prepare for public review a summary of the comments and recommendations discussed at the public meetings.” The "Working Group" refers to the Federal Interagency Working Group on Environmental Justice (IWG) that was established under section 1-102 of EO 12898. The IWG is comprised of fifteen federal agencies and several White House offices. The role of IWG is to guide, support and enhance federal environmental justice and community-based activities. The functions of the IWG appear do not appear to be relevant to EPA’s PSD permitting action for the Project, and the commenter did not explain the relevance of IWG’s functions to this action, so EPA cannot provide a further response regarding paragraph (d).

12
implementation and enforcement of environmental laws, regulations and policies. EPA has this goal for all communities and persons.
EPA defines meaningful involvement to mean that 1) potentially affected community
residents have an appropriate opportunity to participate in decisions about a proposed activity that will affect their environment and/or health, 2) the public’s contribution can influence our decision, 3) the concerns of all participants involved will be considered in our decision-making process and 4) the decision makers seek out and facilitate the involvement of those potentially affected.
EPA’s Public Participation and Outreach Activities for the Proposed PSD Permit for the PHPP
With respect to public outreach and participation, EO 12898 affords EPA considerable discretion to determine appropriate outreach activities. In this case, EPA prepared the EJ Analysis and took numerous actions to facilitate input from the community regarding the Project, addressing the objectives described above. EPA’s enhanced public participation process, described below, went well beyond the specific regulatory requirements set forth in 40 CFR Part 124 for PSD permit proceedings, and clearly demonstrates a commitment on EPA’s part to ensuring meaningful participation by nearby communities in the decision making process.
First, in response to a request from the public, Region 9 determined that the level of public
interest in the Project warranted the scheduling of a public hearing in the City of Palmdale on September 14, 2011. Although not required as part of the public participation process in 40 CFR Part 124, EPA decided to hold a public information meeting in the City as well on the same date, prior to the public hearing, with Spanish translation services for both. While Spanish translation is not required by Part 124, EPA determined that it would be appropriate to provide Spanish translation services at the hearing and meeting, and to translate the public notice and certain other documents relating to the proposed PSD permit, in order to facilitate public involvement by Spanish-speaking members of nearby communities. In scheduling the public information meeting and hearing, Region 9 considered and balanced a variety of factors such as available resources, the availability of the meeting facilities and translators, the need to provide adequate time for public notice prior to the public information meeting and hearing, and the need to move forward with our permitting decision in a timely manner.
In August 2011, EPA provided notice of its proposed PSD permit for the Project, as well as the public information meeting and hearing, through a public notice issued in both English and Spanish. EPA distributed both the English-language and Spanish-language versions of the notice using a number of methods designed to reach the community in the area, including publishing the notices in the Antelope Valley Press (English and Spanish) and La Prensa Popular (Spanish only), and on the EPA Region 9’s website. EPA also distributed the public notices to the necessary parties in accordance with 40 CFR Part 124, as described above in Section I. The public notice provided the public with a clear explanation of how to obtain additional information about EPA’s action, including the fact

13
that detailed materials relating to EPA’s action were being made available at numerous locations in the communities near the Project site as well as on EPA Region 9’s website and at EPA’s office in San Francisco. The public notice also included the name, phone number and email address of a contact person so that members of the public could contact EPA directly to ask questions or obtain additional information.
EPA sent a copy of its public notice, the proposed PSD permit, and Fact Sheet/Ambient Air Quality Impact Report (hereinafter referred to as Fact Sheet) to the Antelope Valley Air Quality Management District in Lancaster, CA, and, although not required by Part 124, EPA also distributed these documents to numerous locations in communities near the Project site to facilitate review by members of nearby communities: the Palmdale City Library in Palmdale, CA; the Lancaster Regional Library in Lancaster, CA; the Lake Los Angeles Library in Palmdale, CA; and the Quartz Hill Library, in Quartz Hill, CA.
EPA also posted key documents in the administrative record for its Proposed Permit on the Region 9 website, including the Proposed Permit, Fact Sheet, permit application and other key supporting information. Although Part 124 does not specifically require this approach, EPA determined that it would facilitate community involvement by making key information more immediately accessible to the public.
In addition, in order to facilitate community understanding, EPA prepared numerous supplemental outreach materials for the public information meeting and hearing, which it also translated into Spanish. These documents included information on EPA’s public involvement process and how to comment on the proposed PSD permit; a Public Information Sheet including an overview of the proposed PSD permit, Project emissions, and air quality impacts; and information on key State and local agency contacts involved with the Project. These English-language and Spanish-language materials were also made available on EPA’s on-line docket for review by the public on August 12, 2011.
Further, EPA determined that there may be minority or low-income populations potentially affected by its proposed action on the PHPP PSD permit application, and determined that it would be appropriate to prepare a separate EJ Analysis for this particular action. EPA prepared the analysis and made it available as part of the administrative record for the Proposed Permit at the time EPA issued its proposed PSD permit for comment, so that the public could comment on the analysis if desired. The EJ Analysis was posted in EPA’s on-line docket during the comment period, and was briefly discussed in EPA’s Fact Sheet and Public Information Sheet for the Project.
EPA believes that all of these efforts, which went well beyond the required public notice and participation procedures in 40 CFR Part 124, were consistent with its public participation responsibilities under EO 12898, and served to ensure that the public documents, public notice, public hearing, and public information meeting relating to its proposed PSD permitting action for the Project were concise, understandable, and readily accessible to the public.

14
EPA’s EJ Analysis and Consideration of Environmental Justice Public Comments for the PHPP
With respect to EPA’s substantive consideration of environmental justice issues in the context of its PSD permitting action for the PHPP, EPA prepared a succinct, well-reasoned EJ Analysis to accompany its proposed PSD permit, in which EPA discussed potential impacts of its action on environmental justice communities. As noted previously, EPA made the EJ Analysis available for public review during the public comment period on the Proposed Permit. EPA’s EJ Analysis described EPA’s proposed PSD permitting action, included a brief description of the area near the Project and key demographic information regarding the surrounding communities, discussed the actions EPA was taking to provide enhanced public participation opportunities for its proposed PSD permit, and considered the impacts of EPA’s permitting action on nearby communities, as described in more detail below.
With respect to potential impacts on environmental justice communities from EPA’s proposed PSD permitting action, the EJ Analysis focused on the fact that the NAAQS are health-based standards, designed to protect public health with an adequate margin of safety, including sensitive populations such as children, the elderly, and asthmatics. The EJ analysis noted that as EPA’s EAB recently observed, in the context of an environmental justice analysis, compliance with the NAAQS is emblematic of achieving a level of public health protection that, based on the level of protection afforded by the NAAQS, demonstrates that minority or low-income populations will not experience disproportionately high and adverse human health or environmental effects due to exposure to relevant criteria pollutants. EJ Analysis at 1.
EPA’s EJ Analysis went on to explain that, in light of the health-based nature of the applicable NAAQS, EPA has determined that the modeled results indicate that proposed emissions of the pollutants regulated under EPA’s PSD permit for the PHPP would not cause or contribute to a violation of the NAAQS, and therefore will not result in disproportionately high and adverse human health or environmental effects on minority populations and low-income populations. Id. at 8.
The EJ Analysis also discussed the fact that the Project will emit pollutants for which the area is not meeting the NAAQS (and precursors that lead to the formation of such pollutants), which are regulated by the Antelope Valley Air Quality Management District (District), and noted that the District implements the Nonattainment New Source Review (NNSR) permitting program for this area as required under the Clean Air Act and 40 CFR 51.160 to 51.165. Id. at 3. The analysis later described health effects associated with ground-level ozone exposure and described the planning process that is being undertaken to address ozone nonattainment in the area. Id. at 8-9. For informational purposes, the EJ Analysis also mentioned the fact that the CEC analyzed environmental justice considerations. Id. at 9.

15
In addition to preparing its EJ Analysis, EPA has carefully considered comments submitted during the public comment period raising environmental justice issues related to EPA’s action and responded as appropriate.
In sum, EPA believes that its public participation process and substantive consideration of environmental justice issues with respect to its PSD permitting action for the Project were appropriate and consistent with its obligations under EO 12898 as well as its responsibilities under 40 CFR Part 124.
13. Comment: The commenter expressed a concern that EPA did not hold any public
meetings specific to environmental justice or human health issues. The commenter also raised a concern about the timing of the public information meeting EPA held, suggesting that the meeting’s timing was inadequate to afford the public the opportunity to formulate considered comments on environmental justice issues and the proposed permit, given that the meeting was held just before EPA’s public hearing and the close of the comment period. The commenter further stated that there was no indication that environmental justice or human health concerns would be discussed at the public information meeting.
Response: In general, public meetings are not required as part of the public participation process for PSD permitting actions per 40 CFR Part 124. At times, EPA schedules public meetings in conjunction with such actions when it believes community interest would make such a meeting appropriate and resources allow. In the case of EPA’s proposed PSD permit for the PHPP, EPA determined that it would be appropriate to conduct a public information meeting on September 14, 2011, prior to the public hearing, in order to provide an opportunity for the public to have face-to-face informal discussions with EPA staff, and to raise questions, regarding any issues the public wished to discuss relevant to EPA’s proposed PSD permitting action, including environmental justice issues. With respect to the public information meeting, EPA’s public notice stated: “EPA will hold a Public Information Meeting for the purpose of providing interested parties with additional information and an opportunity for informal discussion of the proposed Project.” The commenter has not explained why a separate meeting specifically focusing on environmental justice and human health issues would have been necessary in this case.
With respect to the timing of the public information meeting, as noted above, in scheduling the public information meeting and hearing, Region 9 had to balance a variety of factors such as available resources, the availability of the meeting facilities and translators, the need to provide adequate time for public notice prior to the information meeting and hearing, and the need to move forward with our permitting decision in a timely manner.
Further, it is important to note that there were numerous opportunities for members of the public to obtain information about EPA’s action at the outset of the public comment period, well before the public information meeting. EPA’s English-language and Spanish-language public notices notified the public about how to obtain additional information about EPA’s action, including the fact that detailed materials relating to EPA’s action were being made available on EPA’s website and at EPA’s office in San Francisco as well as at numerous locations in the communities near the Project site (as described above in

16
Response 12). The public notice also included the name, phone number and email address of a contact person so that members of the public could contact EPA directly to obtain additional information.
14. Comment: The commenter asserts that EPA should have issued a draft, rather than a final,
environmental justice analysis for public comment, and that it appeared that the public had not been or would not be consulted regarding the contents of the analysis.
Response: As discussed above in Responses 12-13, EPA made its EJ Analysis for the Project available as part of the administrative record during the public comment period on the Proposed Permit, along with the other analyses EPA conducted in conjunction with its PSD review. EPA also posted the EJ Analysis on its on-line docket, provided information to the public through several means about how to obtain additional documentation related to EPA’s Proposed Permit, and described the EJ Analysis in the Fact Sheet for the Project, as well as in the Public Information Sheet that was translated into Spanish and also available in EPA’s on-line docket. EPA believes that this approach afforded the public with an appropriate opportunity to comment on its EJ Analysis in this case and was consistent with the procedures in 40 CFR Part 124 as well as EO 12898.
15. Comment: The commenter stated that the public notice for the proposed PSD permit did
not mention environmental justice or human health.
Response: EPA’s public notice included appropriate information as required by the public notice content requirements in 40 CFR 124.10(d). We note that the public notice did state that “[a]ir pollution emissions from the Project would not cause or contribute to violations of any National Ambient Air Quality Standards (NAAQS) for the pollutants regulated under the PSD permit.” Consistent with 40 CFR 124.10(d), EPA did not describe in its public notice all of the analyses conducted in conjunction with its PSD review, such as the EJ Analysis; however, as discussed above in Response 12, the public notice directed the reader to locations, including EPA’s website, where it could obtain additional information concerning EPA’s proposed PSD permit, and provided contact information for EPA staff who could provide more information. The EJ Analysis was made available in EPA’s on-line docket, for which the public notice provided a web link. Further, as noted above, EPA’s Fact Sheet and the Public Information Sheet for the Project mentioned the EJ Analysis.
16. Comment: The commenter also stated that neither the EJ Analysis nor any other human
health information was made available at any locations near the site, while noting that other documents related to the Proposed Permit were available near the Project site.
Response: The commenter is correct that EPA did not send the EJ Analysis to the libraries and other locations near the Project site to which it sent its public notice in English and Spanish, the Proposed Permit, and the Fact Sheet. As discussed in more detail in Response 15, the EJ Analysis was one of many analyses and supporting documents included in EPA’s administrative record for the Project, and EPA believes that the methods used for

17
informing the public about the EJ Analysis and for making the document available to the public were appropriate in this case. See also Responses 17 and 19.
17. Comment: The commenter stated that EO 12898 Section 3-302 calls upon agencies to
include an analysis of human health risks in EJ analyses. The commenter also quoted EO 12898 Section 3-301, then stated that EPA does not appear to have collected, maintained, or analyzed any data on human health in reference to the PHPP.
Response: EO 12898 Section 3-301 provides directives for Federal agencies to follow when conducting human health and environmental research and analysis. Paragraph (a) of this section applies specifically to environmental human health research that involves epidemiological and clinical studies, and makes clear that its provisions are to be applied when “practicable and appropriate.” Paragraph (b) of Section 3-301 states that environmental human health analyses, “whenever practicable and appropriate,” shall consider multiple and cumulative exposures. Paragraph (c) states that Federal agencies shall provide minority populations and low-income populations the opportunity to comment on the development and design of research strategies undertaken pursuant to the EO.
EPA does not believe that that Section 3-301 was intended to apply to such matters as case-by-case permitting actions, including EPA’s PSD permitting decisions, that are not research studies and which do not include epidemiological and clinical studies or detailed environmental human health analysis. We note that human health studies are not among the requirements of the PSD program. Even if some portion of this section were potentially applicable to EPA’s PSD permit decisions, however, we believe that it is neither practicable nor appropriate to apply its provisions to EPA’s permitting action here on a case-specific basis, as EPA’s PSD permitting action in itself will not result in an adverse impact on any communities, as it ensures compliance with the NAAQS for the pollutants regulated under the permit, as discussed in detail in Response 12.
EO 12898 Section 3-302 states:
“Each Federal agency, whenever practicable and appropriate, shall collect, maintain, and analyze information assessing and comparing environmental and human health risks borne by populations identified by race, national origin, or income. To the extent practicable and appropriate, Federal agencies shall use this information to determine whether their programs, policies and activities have disproportionately high and adverse human health or environmental effects on minority populations and low-income populations.”
EPA believes that the first sentence of Section 3-302 describes general responsibilities for Federal agencies but does not mandate the collection, maintenance and analysis of such information in the context of any particular agency action, such as EPA PSD permitting decisions.
Further, to the extent that the second sentence of Section 3-302 could be interpreted as applicable to any particular case-specific agency action, it states that it applies “to the
18
extent practicable and appropriate,” and thereby provides EPA with considerable discretion in determining how to discharge such responsibilities in any particular case. In this case, as discussed above in Response 12, the modeling analyses for EPA’s PSD permit for the PHPP demonstrate that PHPP’s emissions will not cause or contribute to a violation of any NAAQS regulated under the PSD permit. The NAAQS are health-based standards, designed to protect public health with an adequate margin of safety, including sensitive populations such as children, the elderly and asthmatics, and therefore EPA’s issuance of a PSD permit for the PHPP will not cause any adverse health effects to the surrounding community, or any disproportionately high and adverse human health or environmental effects on minority populations and low-income populations. EPA believes that its primary focus on compliance with the NAAQS is appropriate in terms of considering impacts on nearby communities in this case. We note, however, that as discussed in Response 12 above, EPA’s EJ Analysis did consider demographic information relevant to environmental justice considerations for nearby communities and geographic areas, focusing on geographic areas with radii of 15 km, 25 km, and 50 km from the Project site, and compared these areas with the State as a whole. EPA’s demographic review for each geographic area considered percent minority, percent under age 18, percent over age 64, percent linguistically isolated, percent without a high school diploma, and average median household income. EPA’s analysis also noted the health impacts associated with exposure to ground-level ozone given the fact that the area in which the facility will be sited is an ozone non-attainment area.
18. Comment: The commenter stated that the EJ analysis does not mention the astronomically
higher rates of asthma in the Antelope Valley compared to the average rates in other areas in Los Angeles County, Los Angeles County as a whole, and the United States. The commenter pointed to information from the Los Angeles County Department of Public Health and the Centers for Disease Control and Prevention as the basis for this comment. The commenter stated that the data makes it clear that the communities closest to the PHPP are especially sensitive to the environmental hazards of air pollution.
Response: EPA agrees that individuals with asthma may be especially vulnerable to the health effects of air pollution. The commenter is correct that EPA’s EJ Analysis does not discuss asthma rates in the areas surrounding the PHPP. However, EPA does not believe that including such information in EPA’s EJ Analysis was necessary in this case. As described in detail above in Response 12, and in EPA’s EJ Analysis, the analyses supporting EPA’s PSD permit demonstrate that the Project will comply with all NAAQS regulated for the pollutants regulated under the PSD permit, designed to protect public health with an adequate margin of safety, including sensitive populations such as children, the elderly and persons with asthma.
We reviewed the data referenced by the commenter for both 2005 and 2007 (provided below) and note that the asthma prevalence rate for children (17 years and younger) decreased from 15.8 to 9.7 percent in 2007.

19
Percent of Adults (18+ years old) Diagnosed with Asthma, and Reported Either Currently Still has Asthma or had an Attack in the past 12 months, 2005 Asthma (current prevalence) Percent 95% CI Estimated # LA County 6.5% 5.9 - 7.1 472,000 Antelope Valley SPA 11.4% 8.9 - 13.9 26,000 San Fernando SPA 6.6% 5.2 - 8.0 102,000 San Gabriel SPA 5.8% 4.4 - 7.2 77,000 Metro SPA 6.2% 4.3 - 8.1 57,000 West SPA 7.6% 5.0 - 10.2 40,000 South SPA 7.2% 5.3 - 9.2 48,000 East SPA 5.1% 3.6 - 6.6 48,000 South Bay SPA 6.7% 5.1 - 8.2 76,000 Source: 2005 Los Angeles County Health Survey; Office of Health Assessment and Epidemiology, Los Angeles County Department of Health Services Note: Estimates are based on self-reported data by a random sample of 8,648 Los Angeles County adults, representative of the adult population in Los Angeles County. The percentages and numbers are the best estimates of the actual prevalence of each described characteristic in the population. The 95% confidence intervals (CI) represent the variability in the estimate due to sampling; the actual prevalence in the population, 95 out of 100 times sampled, would fall within the range provided.
Percent of Children (0-17 years) Ever Diagnosed with Asthma6 and Currently Still Have Asthma or Had an Asthma Attack in the past 12 months, 2005
Asthma (current prevalence) Percent 95% CI Estimated # Los Angeles County 8.8% 8.0 - 9.6 244,000 Antelope Valley SPA 15.8% 11.8 - 19.7 16,000 San Fernando SPA 7.9% 6.3 - 9.6 44,000 San Gabriel SPA 8.3% 6.4 - 10.1 41,000 Metro SPA 6.7% 4.4 - 9.0 20,000 West SPA** *4.9% 2.1 - 7.6 5,000 South SPA 9.0% 6.6 - 11.4 32,000 East SPA 8.8% 6.5 - 11.1 37,000 South Bay SPA 11.0% 8.6 - 13.4 48,000 Source: 2005 Los Angeles County Health Survey; Office of Health Assessment and Epidemiology, Los Angeles County Department of Health Services. *The estimate is statistically unstable (relative standard error >23%) and therefore may not be appropriate to use for planning or policy purposes. **2005 estimates for the West SPA may be unreliable due to small sample size and possible sampling bias. Therefore, these estimates should be interpreted with caution and may not be appropriate for examining trends over time, or for policy or planning purposes.

20
Percent of Children (0-17 years) Ever Diagnosed with Asthma6 and Currently Still Have Asthma, 2007 Asthma (current prevalence) Percent 95% CI Estimated # LA County 7.9% 7.0 - 8.7 220,000 Antelope Valley SPA 9.7% 6.7 - 12.7 10,000 San Fernando SPA 8.0% 6.1 - 9.8 44,000 San Gabriel SPA 7.6% 5.6 - 9.6 36,000 Metro SPA 4.1% 2.3 - 5.8 13,000 West SPA 7.6% 4.9 - 10.4 9,000 South SPA 7.8% 5.5 - 10.1 29,000 East SPA 8.8% 6.1 - 11.4 36,000 South Bay SPA 9.5% 7.2 - 11.9 42,000 Source: 2007 Los Angeles County Health Survey; Office of Health Assessment and Epidemiology, Los Angeles County Department of Public Health.
Note: The information presented is based on self-reported data from a randomly-selected, representative sample of 5,728 Los Angeles County parents/guardians. The 95% confidence intervals (CI) represent the margin of error that occurs with statistical sampling, and means that the actual prevalence in the population, 95 out of 100 times sampled, would fall within the range provided.
19. Comment: The commenter expressed concerns that EPA had not made information on human health readily accessible to the public, and stated that EPA’s EJ Analysis, Fact Sheet, and Public Information Sheet do not include any discussion of human health.
Response: In response, EPA is not aware of any specific human health information germane to its PSD permitting action for the Project that should have been provided to the public other than the discussion of the Project’s compliance with the NAAQS. As discussed above, the CAA does not provide for human health studies to be conducted in conjunction with review of specific PSD permit applications. All three of the documents mentioned by the commenter include some health-related information relevant to EPA’s PSD permitting action to the extent they discuss the fact that the analyses supporting the Proposed Permit demonstrate the Project’s compliance with the relevant NAAQS for the pollutants regulated under the PSD permit. EPA’s Fact Sheet provides a detailed description of the air quality impact analyses conducted in conjunction with EPA’s PSD review of the Project to support this conclusion. EPA’s EJ Analysis for the Project discusses the conclusions of EPA’s NAAQS analysis and explains why compliance with the NAAQS for the pollutants regulated under the PSD permit will ensure protection of public health, and also describes issues relating to the area’s ozone nonattainment status including health effects associated with exposure to ground-level ozone. EPA’s Public Information Sheet also briefly discusses the PHPP’s compliance with the NAAQS for the pollutants regulated under the PSD permit.4
4 As discussed above, EPA’s public notice for its proposed PSD permit for the PHPP also referenced EPA’s determination that emissions from the Project would not cause or contribute to violations of any NAAQS for the pollutants regulated under the PSD permit.

21
EPA has made these documents available to the public, and translated the Public Information Sheet into Spanish, as discussed in detail in Response 12 above, and believes that therefore the information included in the documents was made readily accessible to the public.
20. Comment: The commenter stated that EPA relied on alleged modeled compliance with
the NAAQS to avoid further investigation into the human health impacts of PHPP, including in the context of environmental justice. The commenter states that there are a number of problems with EPA determining that compliance with the applicable NAAQS is sufficient to satisfy the EO as to those regulated pollutants. The commenter states that EPA has acted as if the non-attainment New Source Review and PSD permitting processes exist entirely independent of one another and as if it can ignore any responsibility for environmental justice concerns based on alleged compliance with NAAQS. The commenter states that the Project will emit pollutants in excess of NAAQS and the EPA has a duty to address this in its environmental justice analysis. Additionally, the proposed mitigation of offsets for emissions in excess of NAAQS will be implemented in such a way that will almost certainly cause “disproportionately high and adverse human health or environmental effects with respect to these air pollutants on minority or low-income populations residing near the proposed Project.” The commenter states that regulation of air emissions does not exist in a vacuum. The commenter uses NOx as an example and states that because NOx is also a precursor to ozone EPA must include NOx as a precursor to ozone as part of the environmental justice analysis. The commenter also states that it is irresponsible of the EPA to justify non-compliance with the EO entirely based on estimates of emissions that are within 1% of exceeding the NAAQS.
Response: A new stationary source is subject to preconstruction review requirements under the PSD program if it will emit, or will have the potential to emit, in major amounts any criteria pollutant for which the area is designated attainment or unclassifiable with respect to the NAAQS. The location at which the Project will be located is currently designated attainment (or is unclassifiable) for the CO, NO2, SO2, PM10, PM2.5 and lead NAAQS. The level of each NAAQS is set in consideration of numerous health studies and input from experts and the public, and the NAAQS are set at a level to protect public health, including the health of individuals who might be sensitive to the effects of a particular criteria pollutant. The PSD program is designed to ensure that a new or modified facility will not cause or contribute to a violation of the NAAQS for the PSD pollutants to which a proposed project is subject, and that air quality in a particular area will not deteriorate and will continue to meet those NAAQS. The PSD regulations require a source impact analysis for each such pollutant emitted in significant amounts, and we consider a modeled impact less than the NAAQS adequate to show that public health will be protected.
EPA has carefully considered the potential impacts on air quality of these emissions from the PHPP. As required by the CAA and applicable PSD regulations, the terms and conditions of the final PSD permit help to demonstrate that activities authorized by the permit will not cause or contribute to a violation of the applicable NAAQS. Because this permit assures compliance with the applicable NAAQS and the NAAQS are set in such a

22
way that they are protective of public health, we are confident that with respect to these NAAQS, emissions of pollutants from the Project regulated under the PSD program will not cause any adverse health effects to the nearby community or to other members of the public.
We note that for purposes of EO 12898, EPA has recognized that compliance with the applicable NAAQS is emblematic of achieving a level of public health protection that demonstrates that EPA’s issuance of a PSD permit for a proposed facility will not have disproportionately high and adverse human health or environmental effects on minority populations and low-income populations. See, e.g., Shell II, Slip Op. at 74; In re Shell Offshore Inc., 13 E.A.D. 357, 404-5 (EAB 2007) (“Shell I”); In re Knauf Fiber Glass, GmbH, 9 E.A.D 1, 15-17 (EAB 2000) (“Knauf II”); In re AES Puerto Rico, L.P., 8 E.A.D. 324, 351 (EAB 1999). This is because the NAAQS are health-based standards, designed to protect public health with an adequate margin of safety, including sensitive populations such as children, the elderly and asthmatics. As the EAB recently observed, “[i]n the context of an environmental justice analysis, compliance with the NAAQS is emblematic of achieving a level of public health protection that, based on the level of protection afforded by the NAAQS, demonstrates that minority or low-income populations will not experience disproportionately high and adverse human health or environmental effects due to exposure to relevant criteria pollutants.” Shell II, Slip Op. at 73. This is supported by the fact that “[t]he Agency sets the NAAQS using technical and scientific expertise, ensuring that the primary NAAQS protects the public health with an adequate margin of safety.” Id.
With respect to the commenter’s argument that the Project’s NO2 impacts are too close to the NAAQS to provide a margin of safety to account for the environmental issues faced by the communities near the Project, EPA disagrees. The commenter expressed concern about the health protectiveness and realism of the modeled 1-hour NO2 impact of PHPP, which is only about 1% below the level of the NAAQS. As noted above, the level of the NAAQS is set to protect public health with an adequate margin of safety, so even an impact just below the NAAQS is protective of public health in the context of this PSD permit. The PHPP impacts are below the NAAQS for every criteria pollutant regulated under the PSD permit. EPA believes that reasonable assumptions were made in the PHPP modeling conducted by the applicant. We also believe that in this case the nearness of the 1-hour NO2 impacts to the NAAQS is an artifact of the conservative assumptions used in the modeling, for example the assumption of continuous testing of some emergency equipment, which in reality will operate very few times per year. Additional work could have been done to refine the model realism and lower the modeled impacts further, and EPA believes that the actual NO2 impacts are likely lower than those shown in the application. EPA believes that with additional modeling refinements, the NO2 impacts would likely be shown to be well below the NAAQS. But this additional work was not needed, since an acceptably conservative model run had already shown compliance with the NAAQS. It is therefore not surprising that the modeled impacts appear to be only just below the NAAQS.
For the annual NO2 NAAQS, the modeled project impact was 0.98 µg/m3. This is 98% of the NO2 Significant Impact Level of 1 µg/m3, but only about 1% of the NAAQS level of 100 µg/m3 (53 ppb). This concentration is so far below the NAAQS that EPA does not

23
believe there is any potential health issue related to PHPP impacts on the annual NO2 NAAQS.
With respect to the commenter’s concerns about ozone, as discussed above, the area in which the PHPP will be located is designated as a nonattainment area for ozone. While we appreciate the commenter’s concerns regarding the Project’s ozone emissions, the applicable regulations provide that emissions of ozone precursors from the Project are covered by nonattainment New Source Review (NNSR) permitting requirements and are not covered by the PSD permitting criteria in section 52.21 of EPA’s regulations that apply to EPA’s decision. See 40 CFR 52.21(i)(2). The NNSR and PSD permitting processes are, in fact, independent of each other. The NNSR program contains more extensive and often more stringent requirements for the control of emissions. In this case, the applicable NNSR program is administered by the District. Providing offsets is a requirement of the NNSR program. PSD review does not apply to ozone in this instance and concerns about the adequacy of any offsets required by the District in its permitting process or other aspects of the District’s permitting process for the Project are beyond the parameters that the PSD provisions of the CAA direct EPA to consider in this action.
Nevertheless, in this instance, our EJ Analysis discussed the fact that the PHPP will emit ozone precursors, and that these emissions are addressed through the District’s NNSR permitting process. The EJ Analysis noted that new source review in non-attainment areas is different from PSD review. Because the area already has air quality that does not meet national health standards, and yet to preserve the ability for economic development to occur in those areas without exacerbating air quality and public health concerns, the Clean Air Act requires that sources seeking to build or expand in a non-attainment area must meet the Lowest Achievable Emissions Rate (LAER) and offset their anticipated new emissions by eliminating emissions of an equal, or depending on the severity of the nonattainment, greater amount. LAER requires a level of emissions reduction, through the use of control technology or other approaches, that is as stringent as or more stringent than BACT, which is required in attainment/unclassifiable areas.
Our EJ Analysis also described health effects associated with ground-level ozone exposure and described the planning process that is being undertaken to address ozone nonattainment in the area. The EJ Analysis noted that the local air districts are working diligently to ensure that there is a comprehensive plan with adequate controls for attaining the 0.08 parts per million (ppm) NAAQS for ozone, and that EPA is currently reviewing the State of California plan for the Western Mojave Desert nonattainment area, which includes Antelope Valley.
EPA reads the language in EO 12898 directing federal agencies to identify and address impacts “as appropriate,” and “[t]o the greatest extent practicable and permitted by law,” to afford considerable discretion to the Agency in determining how to address any impacts or issues that we may identify in our review of environmental justice considerations. In addition, since the EO references all of the programs, policies and activities of each federal agency to which it applies, EPA may consider how best to respond to the environmental justice concerns raised in public comments within the larger context of the actions EPA is

24
taking to reduce environmental hazards in the communities potentially affected by emissions from the Project. EPA also believes it is appropriate to consider actions being taken by State and local government agencies to address these concerns.
As noted above, the provisions in the CAA and EPA regulations do not expressly contemplate that PSD permits will contain conditions addressing air pollutants for which an area is in nonattainment. EPA interprets the Act and court precedents to establish that emissions of nonattainment pollutants (and their precursors) from the Project should be directly addressed in the NNSR permit that was issued, in this instance, by the District. Nevertheless, EPA has considered in the context of our EJ Analysis for this permit the nonattainment conditions in the local area and the efforts in place to achieve attainment with the ozone NAAQS in the area. Given the larger context in which the commenter’s concerns regarding nonattainment pollutants has been raised, EPA’s judgment is that these concerns are best addressed through the other actions EPA and State and local agencies are taking outside the context of this permit application, and that it is not appropriate to address these issues further in the context of this PSD permitting action. We also refer the commenter to Responses 21-22.
21. Comment: The commenter stated that the EPA is ultimately responsible for enforcing the
CAA. The commenter states that the District issued its FDOC only under delegation of the EPA’s authority and duty to enforce the CAA. Referring to ozone emissions, the commenter states that it appears the EJ analysis was not conducted as part of the FDOC process and as a result no environmental justice analysis was conducted for the aspect of the PHPP that most risks human health.
Response: We note that EO 12898 applies only to Federal agencies, and the District did not issue its Final Determination of Compliance or “FDOC” under authority delegated by EPA. The District has a SIP-approved program for issuing NNSR permits under its own authority. To the extent that the commenter is asserting that EPA has an obligation to conduct an environmental justice analysis for a separate action taken by the local Air District under State and local law in light of its CAA oversight responsibilities, EPA is not aware that the Agency has ever conducted an environmental justice analysis under such circumstances and does not believe that it would be appropriate or practicable to do so in this case or that the Executive Order would call for doing so. Further, this PSD permitting action is not the appropriate context for EPA to exercise its oversight authority, as the District’s permitting process is not among the parameters that the PSD provisions of the CAA direct EPA to consider in this action. We also refer the commenter to Response 20.
22. Comment: The commenter stated that mitigation for NAAQS in the form of inter-district
emission control reduction offsets specifically impacts environmental justice concerns. The commenter states that the way NAAQS offsets will be implemented will almost certainly cause disproportionately high and adverse human health or environmental effects with respect to these air pollutants on minority or low-income populations residing near the proposed Project. The commenter states that mitigation calls for ERC NOx offsets located up to 116 miles upwind of the Project site and VOC ERCs are up to 285 miles upwind of the Project site. The commenter states that mitigation of emissions will be conducted far

25
outside of the communities most affected by the emissions and will not likely benefit those directly affected by the PHPP. The commenter states that this is the type of injustice the EO seeks to prevent.
The commenter further stated disagreement with the concept that because the modeling did not show expected impacts of NOx there are no environmental justice concerns. The commenter stated that as a precursor to ozone, any NOx emissions threatens the health of those living nearby and because those impacted include a high percentage of minority, poor, uneducated, linguistically isolated citizens, there are environmental justice concerns.
Response: Please see Responses 20-21.
Although, as discussed above, we are not evaluating in detail ozone issues in the Antelope Valley or ozone emissions from the PHPP in the context of this PSD permitting action, we believe that it is useful to note that ozone is formed by photochemical reactions involving NOx and VOC emissions, which occur over time during the day, rather than immediately at the location of the emissions. Ozone in the Antelope Valley is thought to be due mainly to transport of ozone and ozone precursors from the more populous and industrialized Los Angeles urban area, and can also be subject to overwhelming transport from the San Joaquin Valley.5 Emissions offsets in the upwind Los Angeles area and in San Joaquin Valley will have an ozone benefit in Antelope Valley, potentially more so than if the offsets were to occur within Antelope Valley itself.
Since most NOx emissions are in the form of NO (rather than NO2), and NO reacts quickly with any available ozone to form NO2 and oxygen (O2), the immediate effect of NOx emissions is actually to reduce ozone. It is additional chemical reactions involving VOC that lead to ozone increases further downwind. Conversely, nearby NOx reductions would tend to increase ozone; NOx reductions further upwind, such as in Los Angeles, would tend to decrease ozone in the Antelope Valley.
The Clean Air Act allows trading between one area and another where one area contributes to nonattainment in another. We also note that the San Joaquin Valley Air Pollution Control District closely tracks emission reduction credits (ERCs) and has a very rigorous process for assuring that the ERCs meet Federal requirements.
23. Comment: The commenter states that the emission impacts of NO2 emissions were within
0.02 percent and 0.014 percent of the standards and, as a result, there are no guarantees and a statistical likelihood that NOx emissions will exceed the NAAQS. The commenter asserts that this puts those living closest to the PHPP at the highest risk of suffering harm from NOx and ozone pollution. The commenter states that if the EPA relies on modeling estimates as part of the environmental justice analysis, then the estimates should without a doubt show that the standards could not conceivably be exceeded under any circumstances.
5 “Assessment of the Impacts of Transported Pollutants on Ozone Concentrations in California”. California Environmental Protection Agency, Air Resources Board, March 2001. Available at: http://www.arb.ca.gov/aqd/transport/assessments/assessments.htm

26
The commenter states that this is not the case for this project, so EPA should not rely on NAAQS compliance as part of the environmental justice analysis.
Response: As discussed above in Response 20, for the annual NO2 NAAQS, the maximum modeled project impact was 0.98 µg/m3. This is within 0.02 µg/m3, or 2 percent, of the NO2 Significant Impact Level of 1 µg/m3, but is less than 1 percent of the NAAQS level of 100 µg/m3 (53 ppb). This modeled concentration from the source is so far below the NAAQS that EPA does not believe there is any potential health issue related to PHPP impacts on the annual NO2 NAAQS. Also, as discussed above in Response 20, the nearness of the modeled impacts to the 1-hour NO2 NAAQS is an artifact of the conservative assumptions used in the modeling, and EPA believes the actual impact will likely be less. Under the Clean Air Act, any impact less than the NAAQS is sufficient, because the NAAQS is set to be protective of public health, with an adequate margin of safety. EPA does not agree that it is possible to guarantee “without a doubt” that the level of the standard will never “conceivably” be exceeded; any analysis of project impact will have some uncertainty. The AERMOD model used in the PHPP air quality impact analysis has undergone an extensive performance evaluation, as EPA described when it was promulgated (70 FR 68221, November 9, 2005) as an EPA-recommended model in the Guideline on Air Quality Models, Appendix W to 40 CFR 51. AERMOD performed well in predicting measured concentrations, especially in the higher concentration ranges, and EPA believes it is adequate and appropriate for assessing proposed project impacts for PSD permits. EPA also notes that, given the statistical form of the NAAQS, the concentration level of the 1-hour NO2 NAAQS may be exceeded a certain number of times per year without resulting in a violation (for both monitored and modeled impacts). In recognition of the variability of meteorological conditions and other factors, each NAAQS is defined in terms of multiyear averages, and of percentiles (except for annual NAAQS). The 1-hour NO2 NAAQS involves a three-year average of the 98th percentile of daily highs6. For a given year, the highest 2% of days, that is 7 days, are not counted in determining whether there is a violation. This avoids regulatory decisions about health impacts and emissions controls being driven by extreme conditions that seldom occur. The statistical form of the NAAQS is taken into account when the concentration of the NAAQS is set to the level that is protective of public health.
In sum, EPA believes that its reliance on compliance with the NAAQS in the context of the EJ Analysis was appropriate. See also Responses 21 and 22.
24. Comment: The commenter stated that EPA should not have relied on the CEC’s
environmental justice considerations in the PMPD (08-AFC-9) as part of its EJ Analysis. The commenter states that the CEC did not conduct a complete analysis because the CEC determined that all significant impacts of the Project were being mitigated below
6 Three years of data are used for monitoring NAAQS compliance; modeling may use a different number of years, although the PHPP analysis also used three years.

27
significance and, therefore, would not cause or contribute to disproportionate impacts upon minority or low income populations. The commenter disagrees with the CEC’s decision because the PMPD document also states that the CEC determined that the proposed VOC and NOx ERCs are not adequate to fully offset PHPP emissions, result in a net air quality benefit or meet the requirements of AVAQMD Rule 1305. The commenter also stated that the CEC called upon the EPA to further address the issue: “The project will be subject to review by the US EPA for purposes of determining compliance with the federal PSD program and it is expected that US EPA will review all aspects of PHPP, including offsets.” CEC Decision page 152.
Response: As noted in EPA’s EJ Analysis, EPA is not relying on the CEC’s environmental justice analysis as the basis for our own analysis but rather has provided a brief discussion of the CEC analysis in our EJ Analysis for informational purposes. The CEC’s environmental justice analysis was conducted in the context of the State licensing and District permitting processes for the Project, and issues concerning that process and the State’s analysis, including the manner in which those agencies addressed various pollutants, including nonattainment pollutants, i.e., ozone, and related issues such as offsets, are not among the parameters that the PSD provisions of the CAA direct EPA to consider in this action.7
Further, issues concerning how nonattainment pollutants are addressed are extremely complex and must be considered in the context of the larger ongoing CAA planning process established under separate provisions of the CAA to address nonattainment pollutants, in addition to the specific State and local approval processes governing the facility, as discussed in Responses 20 and 22 above.
Comments Submitted by Rob Simpson
25. Comment: The commenter stated that the commenter’s request for an additional 30 days
to comment on the proposed permit was denied and the commenter would like the EPA to provide all internal communications and the basis for the decision to deny an extension of the comment period. The commenter also requested that the commenter’s request be included as part of the administrative record for the permit. The commenter is concerned that the denial of the extension is an attempt to violate the commenter’s civil rights and limit the commenter’s participation in retaliation for involvement in past environmental justice related issues.
Response: The commenter’s request for an extension of the public comment period, which was received by EPA via email on September 12, 2011, stated that that there is a massive amount of information to review and requested that the public comment period be extended
7 To the extent that the CEC expressed the view that EPA reviews non-PSD requirements such as offsets as part of its PSD review, the CEC was incorrect. Reviewing the NNSR permit and offsets is a part of EPA’s oversight activities of a SIP-approved program.

28
by 30 days.8 When considering a request for an extension of the public comment period, EPA considers whether the commenter has demonstrated a need for additional time per 40 CFR 124.13. As described in Response 12 above, we believe EPA provided appropriate and sufficient notice to all interested parties, including the commenter, regarding the proposed Project, and we believe this notice provided the public with a reasonable opportunity to provide comments on EPA’s proposed PSD permit. We found no particular issue associated with the Project that warranted public review time beyond that established in the public notice and required by 40 CFR Part 124, nor did the commenter demonstrate a need for additional time per 40 CFR 124.13, and therefore the extension request was denied via an email from EPA dated September 12, 2011. The email from EPA notes that comments submitted by email needed to be submitted no later than 11:59 p.m. Pacific daylight time on September 14, 2011.
26. Comment: In response to EPA’s denial of his request for extension of the public comment period, the commenter stated that the application has been under review for several years, but EPA only posted the documents related to the Proposed Permit on August 12, 2011. The commenter stated that all of the posted documents equate to tens of thousands of pages of information and the EPA only intends to have an informational meeting on the last day of the public comment period. The commenter stated that previously, information was posted to the docket and accessible as it became available. The commenter stated that the present practice of withholding all information until the start of the public comment period, with the shortest public comment period that the law might allow, serves to preclude public participation. The commenter also stated that EPA had shortened the public comment period by one minute.9
Response: Please see Response 25. We are unaware of how the commenter determined that the documents associated with the Project equate to tens of thousands of pages of information. EPA reviewed the documents made available and estimated the number of pages of all documents at around 1,000 pages.10 EPA does not believe that the relevant information was particularly voluminous in this case, nor were the key documents especially lengthy.
8 The commenter’s request for a 30-day extension of the comment period is included in EPA’s administrative record for the PHPP. 9 We also note that on September 13, 2011, a community member conveyed an oral request for a 30-day extension to the public comment period for EPA’s proposed PSD permit for the PHPP to Mr. Steven John, Director of EPA’s Southern California Field Office, who is not associated with this permitting action. The commenter indicated that she was preparing to provide comments to EPA in a public hearing in Chicago and needed more time to prepare comments on the PHPP permit. The community member did not make her request in writing nor did she contact the EPA Region 9 contact person for this permitting action. Appropriate Region 9 personnel were informed of this request and notified Mr. John that this extension request was denied, and Mr. John conveyed that information to Ms. Williams via email. Emails documenting this oral request and EPA’s response are included as part of EPA’s administrative record for the PHPP. 10 In addition, documents referenced in the Fact Sheet were estimated at less than 1,000 pages, possibly making the total near 2,000 pages. The majority of those pages are attributed to the CEC’s PMPD, which is a 700-page document. While the Fact Sheet pointed to specific conditions referenced in the PMPD, it did not suggest that review of the entire PMPD was necessary.

29
As discussed in Responses 12-16 above, we believe that EPA’s public participation process for its Proposed Permit for the PHPP was appropriate, including the timing and methods used for making information and documentation relating to its action available to the public. EPA did not withhold information from the public; we note that the PSD public participation requirements at 40 CFR part 124 do not require that EPA post PSD permitting information to its website, and, with respect to past PSD permitting decisions, EPA Region 9 does not have a history of routinely posting documents associated with our proposed PSD permits on our website prior to issuance of the proposed permit. In sum, we do not believe that the commenter demonstrated a need for an extension of the public comment period. However, we appreciate the commenter’s concern and desire to participate in the permitting process and will consider these comments in future permitting actions. Finally, we disagree that the comment period was shortened by one minute. Comments submitted via email could be submitted as late as 11:59 p.m. on September 14, 2011, before the point when the public comment period elapsed at 12:00 a.m. on September 15, 2011.
27. Comment: The commenter stated that the public notice stated that the applicant was the
City of Palmdale, but that the EJ analysis stated that the “City of Palmdale, in conjunction with Inland Energy” applied to the EPA for a PSD permit. The commenter requested that EPA clarify who the applicant is for the Project and if Inland Energy is an applicant, then the EPA should reissue the public notice for the permit. The commenter also questioned who would actually construct and operate the Project. Additionally, the commenter stated that if it is a private developer that will construct the Project, then a new public notice should be issued.
Response: Inland Energy is the developer being used by the City of Palmdale for this project. The Project will be constructed, owned, and operated by the City of Palmdale. The application for the PSD permit was signed by Steve Williams, City Manager for Palmdale. The public notice and Proposed Permit correctly identified the applicant.
28. Comment: The commenter requested that EPA identify the public participation and
outreach conducted. The commenter requested how, when, where and for how long the EPA published its notice(s). The commenter questioned whether the EPA incorporated the CEC or air district service list, interested parties list or commenter list for the Project, or other projects, into its notice list for the proposed PSD permit. The commenter questioned whether the EPA provided notice to the CEC and ensured that the notice was posted to the CEC’s public docket, whether EPA provided notice to participants from other EPA actions, what government officials the EPA provided notice to, whether the air force was notified, and whether the City of Lancaster was notified. The commenter questioned how many notices the EPA delivered and to whom were they served.
The commenter requested the circulation rate of each publication in which the EPA published notice of the proposed permit (expressed as a gross number) and what percentage of the potentially affected population that number would represent. The commenter

30
requested the same information for distribution in the identified EJ communities, including the market penetration ratios for Spanish language notices to Spanish speaking people.
Response: The commenter is referred to Section I of this response to comments document and Responses 12 and 13 of this section. These sections describe EPA’s public participation process and we believe this information addresses the commenter’s concern that EPA provided sufficient notice to all interested parties on this matter. The Antelope Valley Press, which was used to issue EPA’s public notice in both English and Spanish was a daily newspaper of general circulation in the area and met the relevant requirements in 40 CFR 124.10(d). As part of its additional public outreach efforts, EPA also provided notice in a separate Spanish-language newspaper in the area that is published biweekly. It is not clear how the specific information requested by the commenter about newspaper circulation is pertinent to EPA’s PSD permit action.
29. Comment: The commenter questioned what outreach the EPA conducted in the identified
environmental justice community and whether EPA identified any pre-existing health issues or particular stressors in the identified environmental justice communities. The commenter questioned whether EPA had participated in any meetings, workshops, or other events where comments were made regarding this project that was not recorded and included in the comments regarding this project, and if so, why.
Response: The commenter is referred to Section I of this response to comments document and Responses 12-16 of this section. These sections describe EPA’s public participation process and EPA’s EJ Analysis and consideration of health concerns in detail. 40 CFR Part 124 provides that EPA is to consider all public comments on its proposed PSD permit submitted in writing during its public comment period or submitted at a public hearing held with respect to its proposed action. EPA has met this requirement.
30. Comment: The commenter questioned the reasoning of having an informational meeting
scheduled directly before the public hearing and on the day that the public comment period was scheduled to end. The commenter questioned whether any permit has changed based upon information that the public received at an informational meeting held on the last day of the public comment period.
Response: The commenter is referred to Response 13, which explains the scheduling of the public information meeting for EPA’s proposed permit for the PHPP, and notes that members of the public had numerous methods to obtain information about EPA’s action at the outset of the public comment period. Further, EPA does not agree with the commenter’s suggestion that changes to a permit are the only way to measure whether adequate public participation has occurred. Many well-formed comments do not result in changes to a permit, but allow EPA an opportunity to better explain the decision making process to the public.
31. Comment: The commenter stated that the contact phone number provided was a long distance call from the Project area. The commenter stated that a new notice should be

31
issued with a local or toll free number because the costs of a toll call may have prevented some low income persons from calling.
Response: Consistent with 40 CFR 124.10(d), EPA’s public notice for its proposed PSD permit for the PHPP provided the name, name, address and telephone number of a person from whom interested persons could obtain further information. EPA appreciates the commenter’s suggestion and will consider this issue when proposing future permits. We note, however, that calling the contact phone number was not the only way for the public to obtain additional information about EPA’s proposed PSD permit and the permitting process. The public notice included an email address for the contact person as well as an EPA website that persons of all income levels could use via the Internet at their local libraries, where documents associated with the proposed PSD permit for the PHPP were also available.
32. Comment: Quoting an environmental justice guidance document for Connecticut’s
Department for Environmental Protection, the commenter requested “all supporting documents, reports, studies, public announcements via alternative media, certified copy(ies) of the newspaper announcement(s), fliers, brochures, radio broadcasts, public meeting documentation (e.g. agenda, minutes, any handouts, presentation outline, and attendance signage sheets)”.
Response: The public participation process for EPA’s proposed PSD permit for the Project is described in detail in Section I of this response to comments document and in Response 12 of this section. The guidelines used by the State of Connecticut are not applicable to EPA’s PSD permit actions. We note, however, that relevant materials for EPA’s public participation process are included in EPA’s administrative record for this action.
33. Comment: The commenter questioned whether the EPA or other involved government
entities posted notice of the NAAQS, the area attainment status, or the Project’s effects in relationship to those standards. The commenter also questioned whether any notice identified the volume of pollutants in any form, whether this information could have been germane for decision makers (the public) to determine their approval or desire to participate in the permitting process, and whether this type of information was one of the reasons that the standards were created.
Response: We appreciate the commenter’s concern for ensuring the public is provided with sufficient information to determine whether to participate in the permitting process. As discussed in Response 12 above, EPA’s public notice for its proposed PSD permit for the PHPP included all information required by 40 CFR Part 124. The notice stated that air pollution emissions from the Project would not cause or contribute to violations of any NAAQS for the pollutants regulated under the PSD permit. The notice also included a website address that directed any concerned citizen to information associated with EPA’s proposed PSD permitting action for the Project, including the information identified by the commenter. EPA believes the public was provided with appropriate and adequate options to obtain information on the Project.

32
34. Comment: The commenter requested whether EPA agrees with Air Quality Table 5 of the
CEC final decision (on page 150 of 669). The commenter also questioned whether the table contradicts the statement in the public notice for the proposed permit that the “air pollution emissions from the Project would not cause or contribute to violations of any National Ambient Air Quality Standards (NAAQS) for the pollutants regulated under the PSD permit”. The commenter stated that these figures could affect public participation and the EPA should publish them in a new notice for this permitting action.
Response: As discussed in detail above in Responses 12, 15, and 19, EPA believes that its public notice and information in the Fact Sheet for its proposed PSD permit for the PHPP discussing EPA’s air quality analysis were appropriate and satisfied applicable regulatory requirements, and that additional public notice is not necessary. In assessing PHPP’s air quality impacts, EPA relied on the information in the PSD permit application submitted to EPA by the applicant, rather than on materials prepared for other regulatory processes related to the Project. The commenter has not pointed to a specific contradiction in the data or errors that the commenter believes EPA should address. Nevertheless, EPA has briefly reviewed the data the applicant points to, and continues to believe that the PHPP would not cause or contribute to any NAAQS violations.
We noticed one apparent discrepancy that it may be useful to address, for purposes of clarity. Background concentrations for the March 31, 2009 PHPP permit application were based on the years 2005-2007, the most recent three years at the time the original modeling work was prepared. We note that the values for the 24-hour PM10 background concentration used in the CEC table and the PSD application for this period are different. Both of the concentrations were monitored at the Lancaster Division Street site, but with different physical monitors, and on different days. The CEC table uses 181 µg/m3, recorded at monitor #1 on April 12, 2007; the PSD application uses 86 µg/m3, recorded at monitor #2 on October 20, 2007. Adjustment for atmospheric temperature and pressure was also different; when stated in terms of standard conditions, the 181 becomes 188 µg/m3, the value reported in EPA’s AQS database for monitor #1 on April 12, 2007 (the 86 is already at standard conditions).11
EPA believes it was appropriate to use the 86 µg/m3 value that was included in the Project’s PSD NAAQS analysis as the background concentration to add to the modeling results, rather than the 188 µg/m3 value in the CEC table. This is so for at least three reasons: 1) there is flexibility in choosing the particular statistic to use for background, 2) the 188 value is not representative of overall conditions in the area, and 3) the 188 value is an aberrant value.
11 The California PM10 standard is stated in terms of local conditions, the temperature and pressure at the time and place of the measurement. The PM10 NAAQS used by EPA is stated in terms of standard conditions of 25° C temperature and 101.3 kPa pressure, per 40 CFR 50, Appendix J; these conditions are used as part of the concentration measurement calculation.

33
For maximum conservatism, the very highest recorded concentration (1st high) may be used as the concentration to add to the modeling results, but this is not always required, and may be unnecessarily conservative. The 188 and the 86 values represent the 1st high 24-hour concentration during 2005-2007 for their respective monitors, and so are not representative of the background conditions that the PHPP plume would typically encounter. The 1st high would be a very conservative value to use for every day of the year, since generally most days have far lower concentrations. States vary in the statistic they use to choose a background concentration, in order that the analysis not be driven by the most extreme values, yet remain a conservative estimate. For example, States have used the 3-year average of the 1st highs of each year, the highest among the 2nd highs of each year, and the 4th high from among all three years. The 86 µg/m3 value is the 2nd high among all the data collected in 2005-2007, and EPA believes it is an adequately conservative value for a modeling background concentration.
Antelope Valley is a PM10 attainment area, so the 188 µg/m3, which exceeds the NAAQS level of 150 µg/m3, is not really representative of conditions throughout in the area, as would be appropriate to reflect nearby sources in a modeling analysis (Guideline on Air Quality Models, 40 CFR 51 Appendix W, section 8.2.3). We note that while the 188 is an exceedance of the 150 NAAQS level, that does not in itself mean that it is a NAAQS violation, since this NAAQS has a particular statistical form that allows one exceedance per year. This NAAQS is violated only if the expected number of times per year that the concentration exceeds the NAAQS is greater than one (40 CFR 50.6). For PM10 modeling, this is implemented as the use of the 4th high, when three years are modeled (since one exceedance per year is allowed, the top three are discarded). (Guideline on Air Quality Models, 40 CFR 51 Appendix W, section 7.2.1.1.b). Using the 188 as a background concentration, i.e., adding it the Project’s modeled impact, would mean that every modeled day would be an exceedance, even with a de minimis impact from the Project; this would guarantee a modeled NAAQS violation. EPA does not believe this procedure would be an accurate assessment of the Project’s impact, since it would artificially multiply the single monitored exceedance into 365 exceedances per year.
Finally, the 188 µg/m3 concentration appears to be an aberrant value. It is the only value during the 2005-2007 period that is above 75 for monitor #1. Thus, it appears to be an extreme outlier. This is also apparent from a time series plot of the data. In addition, the 188 value has been flagged by the State as due to a high wind event. The highest value at monitor #2, located at the same site as #1, is the 86 µg/m3 (although it was not operating during the period when the 188 was recorded). EPA believes that the 86 µg/m3 is a more representative concentration to use as a conservative background concentration for assessing the impacts of the PHPP.
In addition, even if the 188 µg/m3 were accepted as an appropriate background concentration for the NAAQS analysis, PHPP does not have a significant impact at the location where it was measured. The Project’s modeled impact is above the SIL of 5 µg/m3 only at locations within half a mile of the PHPP main stack. So, PHPP would not significantly contribute to a PM10 NAAQS violation, even if one were created by the 188.

34
In sum, EPA continues to find that PHPP would not cause or contribute to any NAAQS violation.
35. Comment: The commenter stated that Section 9.3 of the Fact Sheet, regarding growth, misinterpreted the growth analysis to include growth “induced” by the Project instead of growth “associated” with the Project. The commenter states that the Fact Sheet makes it clear that there is growth associated with the Project, but no meaningful analysis was provided. The commenter states that EPA should require a growth analysis which considers the growth associated with the Project because if a project can simply excuse itself from the regulation by pointing to projected growth, then no power plant would need to comply with the Clean Air Act. The commenter states EPA should look at the nuances of growth that would likely occur in this oversupply of fossil fuel burning electric generation market. The commenter questioned whether the growth that occurs would be dependent upon this generation, or whether without this oversupply the area would develop more efficient buildings, cleaner energy sources or development would not occur.
The commenter also stated that the Fact Sheet relied on a claim of displacing once through cooling facilities. The commenter states that once through cooling facilities hardly operate, as there is no demand for their power, just as there is not demand for the power generated by the proposed Project. The commenter states that a direct link between which facilities will close as a result of the Project should be provided and if the Project is to serve other “existing demand” that demand should also be demonstrated. The commenter states that the Project will interfere with the development of cleaner resources to serve growth and existing demand, and EPA should analyze this effect as a part of the growth analysis.
Response: As stated in the Fact Sheet, the growth analysis required by 40 CFR 52.21(o) considers an analysis of general commercial, residential, industrial and other growth associated with the source. EPA has previously interpreted section 52.21(o) to call for consideration of emissions generated by growth that will occur in the area due to the source. EPA’s 1990 Draft New Source Review Workshop Manual at D.2 – D.4. In conducting this review, we focus on residential, commercial and industrial growth that is likely to occur to support the source under review. Such an approach is consistent with that described in EPA’s 1990 NSR Workshop Manual, which we believe is persuasive on this point and, which we have determined is appropriate to follow here. As discussed in EPA’s Fact Sheet, EPA concluded, based on relevant information, that the additional employment growth was expected to accommodate the ample work force already available in Southern California. EPA did not identify any other commercial or industrial growth associated with the source. Although not germane to the residential, commercial and industrial growth that is likely to occur to support the source under review, the analysis also briefly noted the applicant’s projections concerning growth associated with the power generated by the Project, which indicated that the PHPP would supply energy to accommodate the existing demand and projected growth in the Southern California region. In sum, we believe that EPA’s growth analysis, as summarized in EPA’s Fact Sheet, considered the relevant information and leads to the conclusion that the Project will not cause significant growth in the area. As a result, EPA did not conduct further analysis associated with growth caused by the Project.
35
To the extent that the commenter is arguing that the Project’s addition of more electricity to the power grid should be analyzed in detail in EPA’s growth analysis for the Project, EPA disagrees, for the reasons discussed above concerning the appropriate scope of the analysis. Further, we note that the Project will provide wholesale power to the grid and use of the facility will be determined by power generation needs; determining the level of growth, if any, associated with those needs is not practicable or feasible in conjunction with EPA’s consideration of an individual PSD permit application. We also note that the commenter has not provided any specific information to support the notion that adding electricity to the grid from the Project would result in growth in distant areas. Indirect impacts such as those raised by the commenter are under State and local planning jurisdictions. It is unclear how some of the commenter’s other remarks pertain specifically to the criteria applicable to EPA’s PSD review for the PHPP, but the commenter appears to suggest that there is not a need for the facility. EPA has previously recognized that it may consider the need for a facility and a “no build” alternative within the context of CAA section 165(a)(2). In re Prairie State Generating Company, 13 E.A.D. 1, 32 (EAB 2006) (“Prairie State”). However, we have also observed that it is appropriate to refrain from analyzing whether a proposed facility is needed where the State has tasked another State agency with the authority to consider that issue. Id. Consistent with this precedent, EPA believes that mechanisms within the State of California provide the appropriate vehicles through which to address issues regarding the need for natural gas-fired power plants in the State, as these mechanisms involve the entities specifically authorized and best equipped to consider the State’s short- and long-term energy needs in the context of State renewable requirements, among other factors. Various mechanisms are in place within the State of California that provide a structure for considering the need for new natural gas-fired power plants in the context of the State’s renewable energy requirements and policies. These mechanisms include, among other things, a regular integrated assessment by the CEC of major energy trends and issues facing the State’s electricity and natural gas sectors, and the California Public Utilities Commission’s oversight of the very detailed planning processes and the procurement activities of investor-owned utilities within the State. We also note generally that the CEC has indicated relatively recently that there continues to be a need for natural gas-fired power plants in California in the context of increasing reliance on renewable generation. In the context of an informational proceeding held by the CEC to solicit comments and perspectives regarding how it should perform CEQA analyses for the thermal power plants that it licenses, the CEC’s committee report on the proceedings stated:
“The decline in the gas-fired energy in the system might easily mislead some to think that no more gas-fired power plants need be built. However, that misapprehends the nature of an electric system more reliant on “intermittent” renewable power such as wind and solar energy, and the need for reserve generation capacity when those intermittent renewable sources generate less. Wind power, for instance, is often less available on the hottest summer days when generation capacity is most needed to meet system load requirements.

36
Thus, a system that increasingly relies on renewable generation for energy must likewise provide gas-fired dispatchable capacity to make the system reliable when intermittent renewable generators are providing less. This is why the 2007 IEPR states that natural gas generation “must be used prudently as a complementary strategy to reduce greenhouse gas emissions.” [citation omitted] Many of the gas-fired license applications currently before the Energy Commission are for projects that will support a transition to a more renewable-based generation system, presumably because the procurement process favors such projects. This criterion—the degree to which a project supports the transition to a more renewable system, while preserving reliability—is important to the assessment of project GHG impacts in future licensing decisions.”
CEC Committee Guidance on Fulfilling CEQA Responsibilities at 224 (March 2009).12
Furthermore, a PSD permit issuing authority is not required to perform an independent analysis of alternatives, or an analysis that extends beyond that submitted by commenters. The EAB has explained that administrative imperatives are a key reason why the permitting authority is not required to undertake an independent evaluation of alternatives:
“These limits on the permit issuer’s obligation to consider alternatives are particularly important where…a rigorous and robust analysis would be time-consuming and burdensome for the permit issuer. In this context, the permit issuer must be granted considerable latitude in exercising its discretion to determine how best to apply scarce administrative resources.”
Prairie State at 33.
In California, in order to conduct a reasoned analysis to determine the need for new natural gas-fired power plants in general, or a specific natural gas-fired power plant in particular, either within the State as a whole, or in a particular geographic location within the State, EPA would need to consider a myriad of extremely complex factors and detailed information that EPA has neither the resources nor the expertise to analyze. Therefore, EPA does not believe that it is appropriate to conduct the type of rigorous and robust analysis that would be required to definitively determine the need for the Project. We note that even if EPA did have the expertise and resources to conduct such an analysis, the level of analysis and information submitted by the commenter does not consider all of the relevant factors or provide the type of detailed information necessary for such an analysis.
36. Comment: The commenter stated that EPA should provide a response to a question posed by Jason Caudle, the Deputy City Manager of the City of Lancaster, to the California Energy Commission: “What is now the cost associated with [PHPP]? What doesn’t get built? Does the transmission capacity in this valley get utilized by the ground energy, and therefore Edwards Air Force Base’s 500 megawatt solar plant doesn’t get built? Does our distributed generation program that we’re working on, distributed generation from the solar
12 See http://www.valleyair.org/programs/CCAP/documents/CEC-700-2009-004.pdf.

37
standpoint throughout the community, not get built as a result of it? Does additional manufacturing not get built as a result of this selling of this credit or selling of this increment? What manufacturing facility can’t come here because the threshold of significance has reached beyond the air quality standards?”
Response: The commenter does not explain how the issues raised by the City of Lancaster in the CEC proceeding relate to the CAA criteria applicable to EPA’s proposed PSD permit action for the PHPP. To the extent these issues concern increment consumed by the PHPP and associated economic issues for the local communities, please see Responses 2 and 6. We also note that the City of Lancaster submitted comments directly to EPA on the proposed PSD permit; please see Responses 1-4 above.
37. Comment: The commenter stated that the CO2 sequestration analysis that determined
CCS to be technically infeasible for this project was actually an issue of cost and not technical feasibility. The commenter states that the natural gas industry is familiar with pipeline construction and so it is unlikely that the logistics of constructing a pipeline are beyond the industry. The commenter provides information from the CEC describing the construction of 8.7 miles of natural gas lines through existing right of ways (ROWs) that will be designed and constructed by the Southern California Gas Company. The commenter also provides information from the CEC regarding the construction of 35.6 miles of transmission lines that would be constructed on new and existing ROWs, which would travel through and near a mixture of disturbed and undisturbed areas, which include desert areas, agricultural properties, industrial and residential areas. The commenter states that these routes extend into the mountains that are claimed to be insurmountable for a CO2 line.
Response: As noted by the commenter, the natural gas pipeline and power transmission lines needed for the Project will be built on new or existing ROWs. Despite the potential for CO2 sequestration as part of enhanced oil recovery (EOC) in the lower San Joaquin Valley, there are currently no CO2 pipelines in California. In order to build the CO2 pipeline the applicant would need to obtain the ROWs for approximate 50-100 miles to a sequestration site. It is not clear that the applicant could obtain the necessary ROWs.13 The power to obtain ROWs is usually limited to “public utilities”. The proposed facility will not operate as a public utility, so it is not clear that the applicant has the authority to obtain the needed ROWs outside the city limits. The barriers referenced in the Fact Sheet were not intended to imply that building a “long” pipeline through “mountains” was the logistical barrier. However, given that there is limited data in EPA’s record concerning potential logistical barriers relating to the building of CO2 pipelines for the PHPP or other technical or logistical barriers to implementing CCS for the Project, we are revising our BACT analysis to assume, for purposes of the analysis, that potential technical or logistical barriers would
13 See “Carbon Dioxide Pipelines:, California Carbon Capture and Storage Review Panel, August 10, 2010. Available at: http://www.climatechange.ca.gov/carbon_capture_review_panel/meetings/2010-08-18/white_papers/Carbon_Dioxide_Pipelines.pdf

38
not make CCS technically infeasible for the PHPP. As a result, CCS would be the top-ranked control option, and we proceed to Step 4 of the top-down BACT analysis to consider CCS. Our analysis assumes that 90% of CO2 emissions would be captured. GHG BACT Analysis – Step 4 - CCS Cost Analysis As provided in the CEC’s PMPD, the estimated capital costs for the PHPP are $615-$715 million dollars. For comparison purposes, if these capital costs were annualized (over 20 years) they are about $35 million. In comparison, the estimated annual cost for CCS is about $78 million, or more than twice the value of the facility’s annual capital costs.
Estimated Annual Cost for CCS14 $/year CO2 Capture and Compression $75,944,187.00 CO2 Transport $1,566,747.00 CO2 Capture Storage $878,067.00 Total Annual Cost $78,389,001.00
Accordingly, based on these costs, CCS is being eliminated as a control option because it is economically infeasible. BACT for this project remains the thermal efficiency associated with a natural gas-fired combined cycle power plant.
38. Comment: The commenter stated that EPA would create a no build zone near potential carbon sequestration sites if it chooses to exclude polluters who chose to develop away from sequestration sites or who chose not to prepare adequate studies for their projects. The commenter states that the analysis should be real, with real numbers on cost and polluters that choose to locate away from sequestration sites should not get a free ride.
Response: The commenter’s first remark is unclear and as a result EPA does not understand how it relates to EPA’s BACT analysis for GHGs for the PHPP. EPA believes that each PSD permit applicant must seriously consider all available technologies. As described in Response 37 above, EPA has fully considered CCS as part of the BACT analysis for the PHPP, and CCS was eliminated in this case due to economic infeasibility.
39. Comment: The commenter questioned whether tree planting could be a control technology. Additionally, the commenter questioned how many trees the applicant would need to plant to offset the GHG emissions from the Project. The commenter questioned whether algae ponds or changed forestry and farm practices could be used as GHG control technologies. The commenter questioned whether GHG controls can be located in another
14 The cost were estimated by using EPA’s GHG Mitigation Strategies Database and The Report of the Interagency Task Force on Carbon Capture and Storage (August 2010). This information is available at http://ghg.ie.unc.edu:8080/GHGMDB/ and http://www.epa.gov/climatechange/downloads/CCS-Task-Force-Report-2010.pdf, respectively. In each case, the lowest cost between the two sets of information was used for this analysis.

39
location or even air basin like the offsets proposed. The commenter questioned whether EPA is concerned about the localized effect of GHG emissions as identified in the Jacobson effect.
Response: EPA regulations do not require pollutant mitigation or offset practices to be control technologies that must be considered in the PSD permitting process. Applicants are only required to evaluate inherently lower-emitting technologies (that result in reductions from equipment at the facility) and add-on control technologies. While the identified practices can be a part of the overall climate change plan, they are not applicable to this PSD permitting process.
With the above comments, the commenter also provided a paper on the Jacobson effect, which identifies the possibility of increased ozone formation near facilities that are significant CO2 emitters. Based on the information and comment presented, it was not clear how the commenter thought the Jacobson effect should be analyzed within the context of the BACT analysis.
In general, we note that without the ability to quantify the possible contribution of CO2 emissions to ozone formation, it is difficult to consider this effect in any part of the BACT analysis. The paper does not provide sufficient information that would warrant a change to our BACT determination, nor has the commenter suggested that the Jacobson effect should change our determination. We note that any reduction or minimization of CO2 emissions would also reduce the Jacobson effect.
40. Comment: The commenter stated that EPA appears, in a footnote in the Fact Sheet, to
have indicated that the solar component is a GHG control technology for the Project. Additionally, the commenter states that EPA relied on the solar component of the Project to satisfy its environmental justice analysis. The commenter concludes that there should be a permit condition requiring the 50 MW solar generation.
The commenter is concerned that there may be plans to eliminate the solar component and that the permit is a scam. The commenter questioned whether EPA has any indication that some, or all, of the solar component may not be constructed. The commenter further questioned if it were possible that the Project could be advertised as a “hybrid” project to reduce public participation or increase public acceptance.
The commenter questioned that if 50 MW of solar represents a control technology, a greater solar component would represent greater control. The commenter also questions what the ideal ratio of solar to natural gas would be for maximum GHG and EJ benefits for this proposal.
Response: The solar component of the Project was described in the EJ Analysis, but was not the basis for any specific determination or conclusion in our analysis of the proposed permit’s limits or impacts. Upon review of this comment, we find it appropriate to clearly state that the solar component is a lower-emitting GHG technology at this facility. Because

40
the solar component is integrated into the heat recovery portion of the project, it has the potential to reduce GHG emissions by reducing use of the duct burners during peak energy demand. The Project, as described in the application, includes the development of 50 MW of solar energy. As an integrated part of the Project with the ability to reduce GHG emissions, we consider the solar component to be part of the GHG BACT determination for the combustion turbines and associated heat recovery system. In addition, the permit has been revised to ensure that the solar component is a required part of the facility. Conditions III.B, III.C, and X.I.11 have been added to the permit to require construction of a solar-thermal plant designed to generate 50 MW of power. Accordingly, the permit also requires the development of a maintenance plan to ensure the solar-thermal component is operated and maintained according to the designed parameters. While EPA agrees that for any project there are less GHG emissions per MWh from solar energy than from fossil fuel energy, the primary purpose of the PHPP is to provide 570 MW of baseload power to increase the reliability of the electrical supply for the City of Palmdale. In addition, the applicant has proposed to use solar technology to generate a portion of the facility’s power output to support the State of California’s goal of increasing the percentage of renewable energy in the State. The applicant is proposing to use 251 acres of a 331-acre lot for solar generation. An-all solar facility would not be feasible because of the space constraints of the 331-acre lot and because solar energy is not available at all times to meet baseload demands. Given the scope of the Project, it is not necessary for the applicant to determine an optimal ratio of solar to natural gas.15 Finally, we note that the incorporation of the solar power generation into the BACT analysis for this facility does not imply that other sources must necessarily consider alternative scenarios involving renewable energy generation in their BACT analyses. In this particular case, the solar component was a part of the applicant’s Project as proposed in its PSD permit application. Therefore, requiring the applicant to utilize, and thus construct, the solar component as a requirement of BACT did not fundamentally redefine the source. EPA has stated that an applicant need not consider control options that would fundamentally redefine the source. However, it is expected that each applicant consider all possible methods to reduce GHG emissions from the source that are within the scope of the proposed project.
41. Comment: The commenter stated that EPA did not appear to identify all GHG control technologies. The commenter concluded that EPA, DOE, and CEC and others appear to indicate that there are other GHG control technologies.
Response: The commenter has not specifically identified which technologies EPA did not consider. The commenter provided links to EPA websites on agriculture and forestry practices to reduce GHG emissions. As stated in Response 39, we do not believe these practices are appropriately considered as BACT for the facility at issue. The commenter also provided a link to a DOE paper regarding advances in CO2 capture. EPA’s Fact Sheet
15 The commenter has not explained how the ratio of solar to natural gas would impact EJ benefits. See Response to Comment 12 with respect to EPA’ general consideration of environmental justice concerns in the context of the PHPP.
41
indicated that EPA determined CO2 capture to be technically feasible, but that CCS was not being required because of the lack of a feasible sequestration option. EPA’s BACT analysis for CCS is supplemented in Response 37 above, where we assume for purposes of the BACT analysis that CO2 capture and sequestration would be technically feasible, but eliminate CCS due to economic infeasibility.
42. Comment: The commenter objects to the baseline emissions and modeling parameters.
The commenter questioned when the application was deemed complete. The commenter believes that a one year limitation for permitting decisions is to ensure that contemporaneous baseline, rules and pollution control techniques are utilized. The commenter questioned whether EPA agrees with this belief. The commenter questioned that if the one year decision mandate were adhered to would different years be required for the baseline period. The commenter questioned whether if 2009 and 2010 were used as the baseline would the project still fall just below the significance levels for the NAAQS, and cited EPA’s conclusions about the annual and 1-hour NO2 NAAQS.
Response: The one-year deadline in CAA section 165(c) for EPA to grant or deny a PSD permit application applies once EPA has determined a permit application to be complete. PHPP first submitted a PSD permit application on March 31, 2009, then supplemented its application on numerous occasions. The PHPP PSD application was determined by EPA to be complete on August 9, 2011, which started the clock on the one-year deadline in CAA section 165(c) for the Project. It is unclear how the commenter’s reference to adherence to the one-year deadline relates to the baseline data used. However, EPA believes that PHPP’s modeling analyses incorporated appropriate data and adhered to PSD modeling requirements.
With respect to the question of whether the Project would fall just below the SILs if 2009 and 2010 were used as the baseline, we note that in order to assess the significance of project impacts, the project is modeled by itself, with no other sources or background concentration, and its modeled impact is compared to the SIL. Therefore, choosing different years for other sources’ emissions would not affect the conclusions about the significance of project impacts for any NAAQS. We note that the commenter refers to the 1-hour NO2 NAAQS analysis, but for that analysis the impacts were not below, but above the SIL.
43. Comment: EPA received a comment stating that it appears that significant potential
emission sources were not included in the modeling results. The commenter questioned if the modeling included the cumulative impacts of the wastewater treatment plant emissions, airports and air plane emissions at Palmdale Regional Airport and the United States Air Force, the Lockheed Martin Aeronautics and Northrop Grumman facilities and “four future projects within the approximate distance from PHPP included: Fairway Business Park, 1.3 miles southwest; Palmdale Transit Village Specific Plan, 2.5 miles southwest; Amargosa Creek Specific Plan, 2 miles northwest; and 30th St W and Avenue K Projects, 3 miles northwest.” CEC Decision. The commenter questioned if the cumulative impacts included all local roadways and the increased potential traffic as a result of having the roads paved to create PM offsets.

42
Response: An air quality impact analysis includes the proposed source seeking a PSD permit. For any pollutant for which the proposed source has a modeled impact above the level of the SIL, an additional cumulative analysis is performed that includes nearby sources. Not all nearby sources need be explicitly included in the modeling, only those with a significant concentration gradient in the vicinity of the source. Other sources can be adequately accounted for with representative monitoring data, which is added to the modeling results. For the PHPP, the applicant included sources from the inventory supplied by the Antelope Valley and Mojave Desert Air Quality Management Districts, which did not include the specific sources listed by the commenter. The impact analysis also included conservative background concentrations, which reflect the impact of sources not explicitly included in the modeling. EPA found that this was adequate for assessing Project impacts.
As for future sources, a source that does not yet exist does not have an air quality impact. Its impacts would be considered at the time it seeks its own PSD permit, and it would have to account for sources existing at that time, including PHPP. Nevertheless, it is EPA policy for the cumulative analysis to include nearby sources that have not yet been constructed, if they have been issued a permit to construct, or if they have they have submitted a complete permit application at least 30 days prior to the proposed source’s permit application.16 There are no such permits or pending applications in the Palmdale area, so the PHPP analysis did not need to include any future sources.
44. Comment: The commenter questioned the variant approach used by the applicant from EPA’s 2011 memo for the NO2 1-hr modeling. The commenter questioned how this variation limits the results and the effect if receptors inside the USAF plant were included.
Response: As stated in the Fact Sheet (p.60, or page 66 in PDF file, that is, pdf.66), the variant of using 98th percentile from among hourly values is less conservative than the EPA “first tier” approach of using 98th percentile from among daily maxima; that is, it yields lower concentrations. However, EPA mainly accepted this as being more conservative (higher concentrations) than the hour-by-hour approach, which EPA believes would already have been adequately conservative in this case considering the very conservative NO2 background concentrations that were used. EPA does not believe that the method used limits the results in any way, but rather believes that it provides an appropriately conservative approach. Also, receptors both outside and within U.S. Air Force Plant 42 were included in the modeling analysis. Outside Plant 42, all emissions were included in the modeling; within Plant 42 only non-Plant 42 emissions were included. Plant 42 emissions count only at locations that are in ambient air with respect to Plant 42, that is, outside the Plant 42 property boundary.
45. Comment: The commenter stated that the analysis of secondary PM formation discussed
in Section 8 – Air Impact Analysis of the Fact Sheet is inadequate and should be supplemented. The commenter points to the March 23, 2010 PM2.5 memo that states “if the
16 45 Fed. Reg. 52676 (August 7, 1980), “Requirements for Preparation, Adoption, and Submittal of Implementation Plans; Approval and Promulgation of Implementation Plans” (amendments to the regulations for Prevention of Significant Deterioration) at p. 52718.

43
facility emits significant quantities of PM2.5 precursors, some assessment of their potential contribution to cumulative impacts as secondary PM2.5 may be necessary”.
Response: The commenter recommended that EPA supplement the Fact Sheet statements about the formation of secondary PM2.5 from precursor emissions, but did not state any particular objections to the analysis performed by the applicant. EPA believes that the Fact Sheet statements (p.58, pdf.64) are sufficient on this issue. EPA notes that the PHPP emissions of 8.9 tpy SO2 emissions are less than the SO2 SER of 40 tpy, and would not be expected to result in significant secondary PM2.5. The PHPP NO2 emissions of 114.9 tpy are above the NO2 SER of 40 tpy. However, secondary PM2.5 formation occurs only as a result of chemical transformations that would affect only a portion of those emissions, and which occur gradually over time as the plume travels and becomes increasingly diffuse, and would be expected to be considerably smaller than the impacts from the 88 tpy of directly emitted primary PM2.5. The maximum impact of source primary PM2.5 was 12.6 μg/m3 for 24-hour PM2.5 and 1.2 μg/m3 for annual PM2.5; including background concentrations this leaves 6.1 μg/m3 available before the NAAQS is reached (35 – 28.9 for the 24-hour, and 15 – 8.9 for the annual). Since the secondary PM2.5 formation from PHPP’s NOx emissions would be expected to be considerably smaller than the primary PM2.5 impacts, they would also be smaller than the additional 6.1 μg/m3 needed to cause or contribute a PM2.5 NAAQS violation. In addition, as EPA noted in the Fact Sheet, secondary PM2.5 impacts were likely to occur relatively far downwind, and unlikely to overlap with primary PM2.5 impacts that are very nearby. EPA found that the applicant adequately followed the recommendations in “Modeling Procedures for Demonstrating Compliance with PM2.5 NAAQS”, memorandum from Stephen D. Page, Director, EPA OAQPS, March 23, 2010.
46. Comment: The commenter stated that the proposal fails to conform to the new PM2.5 increment regulations released on October 20, 2010 and the project will not have a final permit by October 20, 2011, so the permit should be denied.
Response: The final permit is being issued prior to October 20, 2011, and as a result a PM2.5 increment analysis is not required. See Response 2.
47. Comment: EPA received a comment stating that the CEC was unable to justify the offsets
proposed by the applicant as part of the non-attainment NSR permitting process through the District. Despite the CEC acknowledging that it did not agree with the proposed offsets, the EPA still relied on the CEC’s determination that there were no significant impacts from the proposed project as part of the EPA’s environmental justice analysis. The commenter also points to the CEC relying on the 2004 Ozone Attainment Plan submitted by the District to CARB and EPA for incorporation into the SIP and noted that EPA has not approved an attainment plan for this area since 1997.
Response: The commenter is referred to Response 24 regarding the CEC’s EJ analysis and Response to Comment 20 regarding ozone nonattainment.

44
48. Comment: EPA received a comment questioning if the Antelope Valley is severe nonattainment for ozone because EPA has not approved an attainment plan for the area since 1997.
Response: We appreciate the commenter’s concerns about ozone nonattainment in the Antelope Valley, but the commenter has not explained how the specific question being raised is germane to EPA’s PSD permitting decision for the PHPP. As discussed above in Response 22, ozone in the Antelope Valley is thought to be due mainly to transport of ozone and ozone precursors from the more populous and industrialized Los Angeles urban area, and can also be subject to overwhelming transport from the San Joaquin Valley.
49. Comment: EPA received a comment asking if EPA issued letters to the District regarding
the proposed offsets prior to the determination that an environmental justice community exists. The commenter also questioned if EPA considered its environmental justice mandate with respect to the offsets for this project. The commenter states that limiting the EJ analysis to only the impacts associated with the proposed permit is overly narrow and disguises the true impacts of this project and is unsupported by the record in the proceeding and the mandate contained in Executive Order 12898. The commenter states that EPA’s action to approve or disapproved the offsets is subject to its EJ analysis, because the PSD pollutants are precursors to ozone.
Response: The commenter is referred to Responses 20-22 and 24.
50. Comment: EPA received a comment stating that precursors are also subject to LAER, as described in the EJ Analysis. The commenter questioned whether EPA delegated its environmental justice responsibilities to another agency, the air district, the CEC or the applicant. The commenter further questioned if the EPA monitored any action to ensure that the EPA environmental justice mandate was satisfied, and at what time the EPA conducted outreach. The commenter also questioned whether EPA satisfied any of the precepts in the Illinois EPA’s Environmental Justice Public Participation Policy.
Response: EPA agrees that precursors to ozone are subject to LAER under the District’s NNSR permit, as discussed above. As described in detail in Responses 12 and 20-24 above, EPA believes that the actions it has taken in conjunction with its issuance of the PSD permit for the PHPP appropriately address environmental justice concerns and EPA’s responsibilities under EO 12898. The commenter has not explained how the Illinois EPA’s Environmental Justice Public Participation Policy is germane to EPA’s PSD permitting action for the PHPP.
51. Comment: EPA received a comment stating that the EJ analysis basically said that
protection of the NAAQS means we do not need further EJ analysis. The commenter then questions that if the NAAQS adequately protects why the area is in severe ozone nonattainment.
Response: The commenter is referred to Responses 12, 20, 22 and 48.

45
52. Comment: EPA received a comment stating that the use of ammonia to reduce NOx emissions at the Project will result in some un-reacted ammonia being emitted, which is known as ammonia slip. The ammonia slip emissions, in the form of ammonium nitrate and ammonium sulfates are constituents of airborne fine particulate matter (PM2.5), and can contribute significantly to visibility and impairment and regional haze. The commenter states the top down BACT analysis for NOx fails to consider the collateral impacts of the use of ammonia in the SCR system. The commenter points to information from the CEC that estimates potential ammonia emissions at over 60 tons per year. The commenter states that considerable secondary particulate formation can occur as ammonia is a known precursor to secondary particulate and the project area is ammonia limited according to available research. The commenter concludes that the BACT analysis and visibility analysis are defective since they ignore the collateral impacts from the project’s ammonia emissions. Response: The collateral impacts analysis in the NOx BACT analysis for the PHPP did not include secondary PM formation from ammonia emissions. Any ammonia slip emissions contributing directly to PM formation will be measured at the time PM testing is completed. As described in Response 45, secondary PM formation is likely to occur relatively far downwind, and unlikely to overlap with primary PM2.5 impacts that are very nearby. EPA found that the applicant adequately followed the recommendations in “Modeling Procedures for Demonstrating Compliance with PM2.5 NAAQS”, memorandum from Stephen D. Page, Director, EPA OAQPS, March 23, 2010. As a result, we do not expect significant collateral impacts to result from the Project’s ammonia emissions.
53. Comment: EPA received a comment stating that EPA is proposing to issue the permit
after receiving concurrence from the USFWS on the ESA analysis. The commenter states that this precludes the public from meaningful comments on its ESA Section 7 consultation since it will be completed after the PSD comment period has expired. The commenter notes that several projects are impacting the desert tortoise at this time and several planned projects also are expected to have significant impacts on the desert tortoise. As an example, the commenter points to the Ivanpah Solar project, as a solar project in the desert that has recently been forced to halt construction due to exceeding the limits on incidental take for the desert tortoise. The commenter concludes that EPA must do a comprehensive analysis of this massive utilization of desert property and must hold the public comment period open until USFWS has issued its opinion for public comments.
Response: Neither ESA section 7 nor its implementing regulations at 50 CFR Part 402 provide for a public comment or public participation process for ESA consultations. Likewise, neither CAA section 165 nor its implementing regulations require that EPA provide for public participation concerning ESA consultations on PSD permit actions. Nevertheless, EPA described in its Fact Sheet for the PHPP the fact that in a letter dated August 5, 2011, EPA requested the USFWS’s written concurrence with EPA’s determination under ESA section 7 that the proposed PSD permit for the PHPP is not likely to adversely affect the desert tortoise or arroyo toad. EPA’s Fact Sheet also stated that EPA would issue a final permit decision after making a determination that its decision would be consistent with ESA requirements. EPA’s Public Information Sheet also mentioned that EPA was conducting an ESA section 7 consultation with USFWS with

46
respect to its proposed PSD permit for the PHPP. In addition, EPA posted its biological assessments and related correspondence with USFWS on its electronic docket for EPA’s Proposed Permit for PHPP on August 12, 2011. On September 14, 2011, EPA received the USFWS’s written concurrence with its determination of no likely adverse effect, completing the consultation process and ensuring compliance with ESA section 7. The commenter has not identified any deficiencies in EPA’s compliance with the CAA’s public notice requirements for PSD permit actions with respect to this issue. EPA believes that its actions here are consistent with its public notice obligations for PSD review and its responsibilities under the ESA.
54. Comment: EPA received a comment stating that carbon sequestration in algae ponds is a
feasible technology to capture GHG emissions from the proposed Palmdale Project and should be included in the BACT evaluation for GHG emissions. The commenter states that the permit ignores GHG emissions from maintenance vehicles for the solar component of the project. The commenter states that electrical powered maintenance vehicles can eliminate virtually all GHG emissions from vehicles used to maintain the solar field and should be considered in the BACT analysis for GHG emissions.
Response: As discussed in Response 39, we do not believe algae ponds are a GHG technology at this time. The commenter has not provided any information indicating that the use of algae ponds is currently available for carbon sequestration. Additionally, while electric powered vehicles would reduce GHG emissions from the source, mobile source emissions are not regulated under the PSD program.
55. Comment: EPA received a comment stating that the permit fails to establish a heat rate as
BACT for GHG emissions. For these turbines a net facility heat rate of 6,752 (HHV) has been accepted as the achievable net facility heat rate. The comment states that the permit must establish some quantifiable and verifiable heat rate as BACT for GHG emissions, otherwise the permit provides no GHG limits and does not comply with new federal GHG regulations.
Response: The proposed PSD permit for the PHPP included three separate limits on GHG emissions – a facility wide annual GHG limit expressed in tons per year of CO2 equivalent (CO2e)), a lb CO2/MMBtu limit, and a lb CO2/MWh limit. However, based on the comments received regarding the GHG BACT analysis for the Project, we are revising the proposed limits in the final permit. The commenter is generally referred to Responses 40 and 66, which describe changes related to the GHG limits and the solar component. Specifically, with regard to the heat rate issues identified in the comment, the heat input limit (lb/MMBtu) is being replaced with a heat rate requirement (Btu/kWh) to measure the efficiency of the Project.
56. Comment: The commenter stated that the proposed permit eliminates road paving for
control of fugitive dust even though it is the number one option. The commenter states that technology is established as BACT unless it is demonstrated that technical considerations, or energy, environmental, or economic impacts justify a conclusion that the most stringent technology is not achievable for the case at hand. The permit eliminates the road paving

47
option without demonstrating that the option is not economically feasible. The permit must make the demonstration to eliminate the top control option of road paving. The commenter concludes the BACT analysis is inadequate as it eliminates the top option without a cost effectiveness analysis.
Response: The BACT determination for the fugitive dust emissions includes a mixture of paved and unpaved roadways. As identified in EPA’s Fact Sheet, requiring only paved roads would result in impacts in terms of an increase in the amount of impervious surfaces, which increases storm water runoff, and erosion of the dirt from under the paved edges from the infrequent rainstorms in the desert, as compared with minimal environmental benefits from paving the less traveled roads. We disagree that a cost-effectiveness analysis is the only way to eliminate a technology during Step 4 of the BACT analysis. EPA determined that, given all the available information, the use of paved and unpaved roadways is BACT for this project. We believe that our determination of a fugitive dust plan for the unpaved roadways is BACT and consistent with other BACT determinations.
57. Comment: The commenter stated that the fugitive dust BACT analysis is inadequate as it
fails to consider other dust control options. The commenter stated that speeds of maintenance vehicles can be lower than 10 miles an hour during dry conditions and limit fugitive dust even further.
Response: The only other dust control option identified by the commenter was to establish a speed limit less than 10 miles per hour. A lower speed could reduce emissions further, but the commenter has not identified what speed would result in a notable reduction in emissions. The use of speed controls is one of several controls measures being used by the applicant (including chemical stabilizers, water suppression, and a maintenance plan). We determined that the combination of control measures represents BACT in this case.
58. Comment: The commenter stated that proposed permit limits for CO emissions during
startup and shutdown are not comparable with current BACT limits for similar sources. The commenter uses startup and shutdown emission limits for the Oakley Generating Station (OGS) as an example. The commenter also listed the NOx startup and shutdown limits for the OGS.
Response: The OGS and PHPP will use two different types of GE 7FA turbine technology. The OGS facility will use two gas turbine generators and one steam turbine generator to produce 624 MW of power. The PHPP will use two gas turbine generators with duct burners and one steam turbine generator to produce 570 MW of power. The lb/event limits for the two facilities are summarized below:
Oakley Generation Station
Cold Startup
(lb/event) Hot/Warm Startup
(lb/event) Shutdown (lb/event)
NOx 96.3 22.3 39.3 CO 360.2 85.2 140.2

48
Palmdale Hybrid Power Project
Cold Startup
(lb/event) Hot/Warm Startup
(lb/event) Shutdown (lb/event)
NOx 96 40 57 CO 410 329 337
Because the emission limits are on a mass basis we find that the difference in size and setup of the two facilities does not make the emissions during startup and shutdown directly comparable. For example, a larger unit will generate more emissions on a mass basis (lb/hr or lb/event in this case) but on a concentration basis (ppm or lb/MMBtu) the emissions could be equivalent. This is demonstrated by the NOx limits during normal operations for these two facilities Both facilities must meet 2.0 ppm but OGS has a lb/hr emission limit of 15.52 whereas PHPP’s lb/hr emission limit is 13.47 lb/hr (without duct burning). We continue to conclude that BACT during startup and shutdown is the lb/event limits and duration limits in the Proposed Permit. We continue to conclude that BACT during startup and shutdown is the lb/event limits and duration limits in the proposed permit.
59. Comment: The commenter attached a copy of a legal brief prepared on behalf of the
Chabot-Las Positas Community College District regarding the Eastshore Energy Center. Response: EPA acknowledges that this legal brief was provided by the commenter as an attachment to his comments, and has included the attachment as part of the commenter’s comments in the record for this action. The commenter, however, has not mentioned or referenced this brief in his comments, or otherwise explained with any specificity the relevance to EPA’s PSD permit decision of this document, which appears to have been created in the context of a proceeding before the CEC for a different project, the Eastshore Energy Center. Therefore, EPA cannot provide a detailed response.
Comments Submitted by AECOM on behalf of the City of Palmdale
60. Comment: The commenter stated that the hourly NOx and CO pound per hour emission
limits for the combustion turbine generators (CTGs) in Condition X.C.1 should be revised to correspond to the load data provided in Appendix A of the application and to reflect the CO limits from the BACT analysis. The commenter states that the maximum hourly limits should correspond to the low temperature case (23°F) in the emissions data as that is expected to be the maximum hourly concentrations for the Project. The commenter states that it is standard practice for combined-cycle projects to use the low temperature case as the governing limit for maximum hourly values, as was done in the District’s FDOC for the PHPP. The commenter states that the NOx limits in Condition X.C.1 should be 13.47 lb/hr without duct burning and 16.60 lb/hr with duct burning. The CO limits in Condition X.C.1 should be 8.20 lb/hr (during the demonstration period) and 6.15 lb/hr (after the demonstration

49
period) without duct burning and 10.10 lb/hr with duct burning. These revisions will also require Condition X.C.3 to be revised.
Response: Upon review of the emissions data provided in the application and the BACT limits established on a concentration basis (ppmvd), we agree with the commenter and have revised the lb/hr emission limits in Conditions X.C.1 and X.C.2 accordingly and made associated changes to Condition X.C.3. We note that the lb/hr emission limits listed in the Proposed Permit were an inadvertent error and these revisions do not affect the air quality impact analysis. The revised lb/hr emission limits are either equal to or less than the emission rates used for the air quality impact analysis.
61. Comment: The commenter is concerned that the proposed language in the permit limits
the combined operation of the two duct burners to 2,000 hours each year. The commenter stated that the PSD application requested that the hours of operation for each duct burner be limited to 2,000 hours. The Fact Sheet reflects that the emissions are based on the assumption that the hours of operation for each duct burner would be limited to 2,000 hours for each duct burner (see for example, Section 7.1, page 16), and the commenter believes the wording in the permit to be an inadvertent error. Response: We agree with the commenter’s comment and request. Consistent with the PSD permit application, Condition X.C.2 has been revised to reflect that each duct burner is limited to 2,000 hours of operation each year.
62. Comment: The commenter states that the applicant disagrees with EPA’s determination
for BACT for PM, PM10 and PM2.5, and believes that the proposed limits are not achievable. The proposed limits are lower than the emission guarantees provided by the manufacturer, General Electric (GE), for the GE 7FA combustion turbines. The commenter states that EPA’s proposed PHPP PM limits without duct burning are based on the PSD permit for three Mitsubishi M501 GAC turbines at the Warren County Power Station (WCPS) in Virginia. The PM emission limits in the permit issued for the WCPS were based on the manufacturer’s guarantee for this specific turbine. Emission limits for the WCPS are given in terms of both lb/hr and lb/MMBtu: 8 lb/hr or 0.0027 lb/MMBtu without duct burning and 14 lb/hr or 0.0040 lb/MMBtu with duct burning. The commenter does not agree that the specific limits for the WCPS should be considered as the basis for the PM limits of the PHPP. This facility has not yet been constructed and has not demonstrated compliance with the proposed PM limits. The commenter states that differences in the equipment and the specific manufacturer’s guarantees should be taken into consideration. The commenter does agree with using the manufacturer’s guarantee as the basis for the limit. The commenter states that the basis for EPA’s proposed PHPP PM limits during duct burning is the Chouteau Power Plant in Oklahoma. The Choteau permit does not provide a separate limit without duct burning. The Chouteau Plant has installed two Siemens Model V84.3A turbines. The commenter contacted the permit writer, Mr. Eric Milligan, at Oklahoma Department of Environmental Quality and was informed that recent stack tests

50
(July 2011) had determined that the Chouteau Plant was not in compliance with its PM limits. The commenter also reviewed the May 2011 test report for the Choteau Plant. Averages of the 3 runs for each hourly test show that results from two of the three tests are not in compliance with the proposed lb/MMBtu limit. The commenter also states that it does not appear that the duct burners were operating during any of these tests. The commenter was told by Mr. Milligan that the permit limits in the permit are not what Chouteau had intended. The Choteau applicant had intended to request permit limits of 10.56 lb/hr and 0.0056 lb/MMBtu, but somehow an error was made and the permit gave limits of 6.59 lb/hr and 0.0035 lb/MMBtu. The commenter states that late last year (12/2010), a new Method 202 was adopted which reduces the amount of condensable PM formed in the sample. Because the applicant is proposing a low sulfur fuel, the commenter does not expect the test results for the new Method 202 to change considerably for natural gas-fired turbines.
The commenter states that since the only control technologies in use on modern combined-cycle turbines for control of PM/PM10/PM2.5 emissions are the use of low-sulfur, pipeline quality natural gas and good combustion practices, a facility has little control over the emission rate and is reliant on the manufacturer’s guarantee. Some applicants have taken a strategy of proposing very low PM10 limits as a way to reduce the number of offsets that must be provided. The fact that these applicants are willing to accept a compliance risk to reduce their requirements should not be imposed on other operators. If the limit is below the manufacturer’s guarantee, the operator has no recourse if the unit is not compliant. The commenter therefore believes that BACT should be set based on a manufacturer’s guarantee, unless there is substantial evidence that a facility will be able to meet a more stringent limit on a long term basis, and should not be forced to accept a limit which creates a risk for the facility without any true air quality benefit.
The commenter reviewed the PM limits and test data for a variety of other facilities and proposed PM limits of 9 lb/hr without duct firing and 14 lb/hr with duct firing. The commenter stated that if the applicant is able to obtain additional information from GE or others that would support lower limits, in particular manufacturer’s guarantees, they would provide these data to EPA Region 9.
Response: After reviewing the information provided by the commenter we are revising the proposed BACT limits for PM, PM10, and PM2.5 (collectively referred to hereafter in this particular response as “PM”). We acknowledge that recent stack testing mentioned by the commenter demonstrates that PM emissions can be variable and many factors must be taken into account when setting BACT limits. As was described in Section 7.1.3 of the Fact Sheet for the PHPP, our PM BACT analysis evaluated facilities that considered total PM emissions (filterable and condensable) when setting BACT limits. We are now aware that while the limits for the Chouteau Power Plant are for total PM emissions, they were set using data only for filterable emissions.17 For that reason, and without further analyzing the
17 See email communications dated September 7, 2011 from Eric Milligan to Lisa Beckham – “RE: Chouteau Power Plant”.
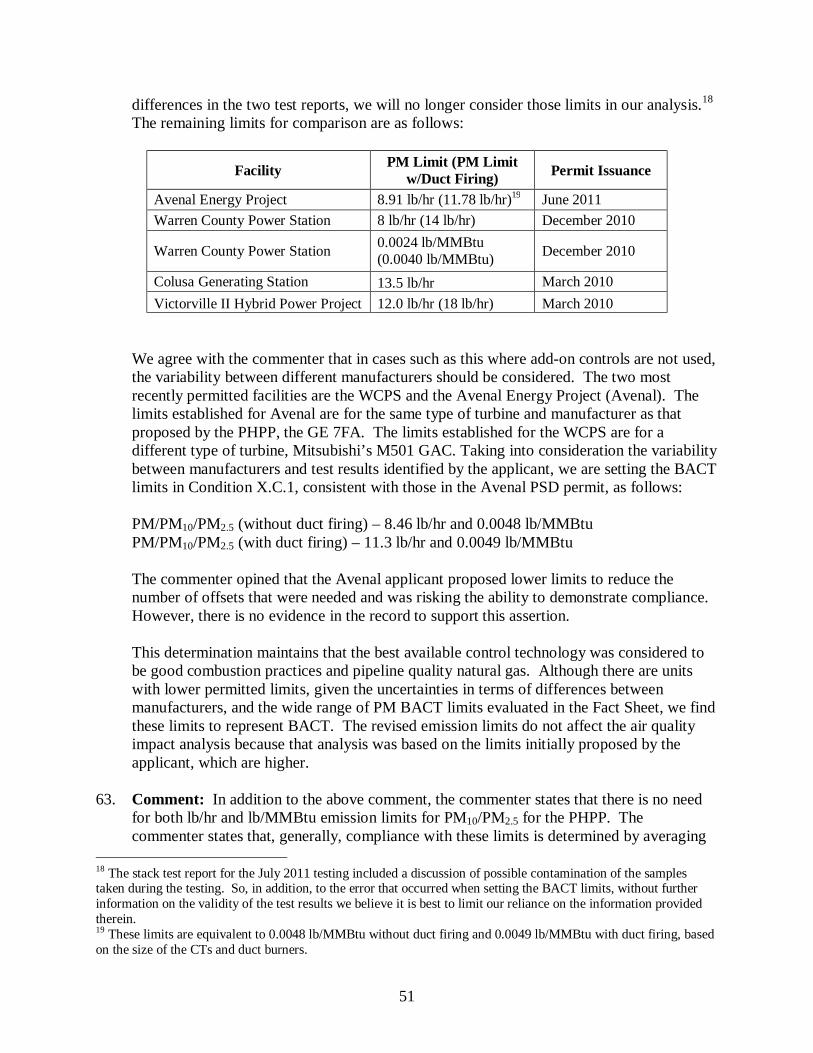
51
differences in the two test reports, we will no longer consider those limits in our analysis.18 The remaining limits for comparison are as follows:
Facility PM Limit (PM Limit w/Duct Firing) Permit Issuance
Avenal Energy Project 8.91 lb/hr (11.78 lb/hr)19 June 2011 Warren County Power Station 8 lb/hr (14 lb/hr) December 2010
Warren County Power Station 0.0024 lb/MMBtu (0.0040 lb/MMBtu) December 2010
Colusa Generating Station 13.5 lb/hr March 2010 Victorville II Hybrid Power Project 12.0 lb/hr (18 lb/hr) March 2010
We agree with the commenter that in cases such as this where add-on controls are not used, the variability between different manufacturers should be considered. The two most recently permitted facilities are the WCPS and the Avenal Energy Project (Avenal). The limits established for Avenal are for the same type of turbine and manufacturer as that proposed by the PHPP, the GE 7FA. The limits established for the WCPS are for a different type of turbine, Mitsubishi’s M501 GAC. Taking into consideration the variability between manufacturers and test results identified by the applicant, we are setting the BACT limits in Condition X.C.1, consistent with those in the Avenal PSD permit, as follows: PM/PM10/PM2.5 (without duct firing) – 8.46 lb/hr and 0.0048 lb/MMBtu PM/PM10/PM2.5 (with duct firing) – 11.3 lb/hr and 0.0049 lb/MMBtu The commenter opined that the Avenal applicant proposed lower limits to reduce the number of offsets that were needed and was risking the ability to demonstrate compliance. However, there is no evidence in the record to support this assertion. This determination maintains that the best available control technology was considered to be good combustion practices and pipeline quality natural gas. Although there are units with lower permitted limits, given the uncertainties in terms of differences between manufacturers, and the wide range of PM BACT limits evaluated in the Fact Sheet, we find these limits to represent BACT. The revised emission limits do not affect the air quality impact analysis because that analysis was based on the limits initially proposed by the applicant, which are higher.
63. Comment: In addition to the above comment, the commenter states that there is no need for both lb/hr and lb/MMBtu emission limits for PM10/PM2.5 for the PHPP. The commenter states that, generally, compliance with these limits is determined by averaging
18 The stack test report for the July 2011 testing included a discussion of possible contamination of the samples taken during the testing. So, in addition, to the error that occurred when setting the BACT limits, without further information on the validity of the test results we believe it is best to limit our reliance on the information provided therein. 19 These limits are equivalent to 0.0048 lb/MMBtu without duct firing and 0.0049 lb/MMBtu with duct firing, based on the size of the CTs and duct burners.

52
the results of 3 source tests conducted over one hour each. The commenter states that it is not possible to hold the units at exactly the same heat rate over a single hourly test, much less over 3 hourly tests. These gas-fired units are not required to be continuously monitored for PM, and the test results will be targeted to be at as close to 100% load as possible. The vendor guarantee for the GE 7FA is given as a maximum lb/hr emission rate. The majority (if not all) of the combined-cycle projects previously permitted by EPA Region 9, including Avenal, which was permitted only a couple of months before this proposed permit, have had only a lb/hr limit for PM/PM10/PM2.5. The commenter asserts that a lb/MMBtu limit is unnecessary and provides no additional air quality protection given that: i) the test accuracy is not sufficient; ii) compliance will generally be determined near the maximum heat rate only; iii) there is nothing the operator can do to adjust the emissions for different heat rates; and iv) the vendor guarantee is in lb/hr. Additional limits that provide no benefit should be deleted as they create additional regulatory burden and risk.
Response: As demonstrated in EPA’s Fact Sheet accompanying its proposed PSD permit for the Project, other sources have been required to meet lb/hr and lb/MMBtu emissions limits. For NOx and CO, the applicant is required to meet both a mass emission rate and a concentration emission rate. A concentration emission rate is appropriate to ensure that BACT is achieved at the time compliance is demonstrated. Setting only a lb/hr emission rate does not evaluate the effectiveness of the control technology. As stated by the commenter, it appears that Mitsubishi, the manufacturer of the M501 GAC, provided lb/MMBtu guarantees. The lack of a lb/MMBtu guarantee by the manufacturer of the turbines proposed for the PHPP is not sufficient justification for not requiring such a limit. Regarding the testing conditions, we are revising the averaging period for the PM limits to reflect the circumstances needed to properly conduct the required compliance testing. Because of inherently low emissions, PM emissions are generally below the detection limit for the test methods (Method 5 and 202/201A) when using one hour sampling times. For example, the Chouteau Power Plant testing used two-hour sampling times for each test run. However, we believe three-hour test runs may be more appropriate and would account for more variability in operations than the shorter 1-hr test runs referenced by the commenter.20 Condition X.C.1 has been revised to reflect the revision to a 9-hr averaging period.
64. Comment: Considering the above comments regarding CO and PM, the commenter stated
that the annual emission limits for CO and PM/PM10/PM2.5 given in Condition X.A.1 should be revised. The commenter stated that CO emissions should be revised to 244.1 tpy, PM revised to 120.1 tpy, PM10 to 103.5 tpy, and PM2.5 to 97.0 tpy. Additionally, the commenter noted that these emissions are reduced from the initial PHPP application.
Response: We have revised the annual emission limits in Condition X.A.1 to reflect our responses to Comments 60 and 62.
20 See July 8, 2009, email from Ron Myers to Anita Lee, “Re: question about PM2.5 form natural gas”.

53
65. Comment: The commenter stated that Condition X.A.1 contains the facility wide annual emission limits for GHG (in tons per year of CO2 equivalent (CO2e). Condition X.C.1 of the proposed PSD permit contains both a lb CO2/MMBtu and a lb CO2/MWh limit for GHG. The commenter believes that the CO2 emission limit of 774 lb CO2/MWh is a redundant emission limit, provides no compliance benefit beyond that established by the emission limit of 117 lb CO2/MMBtu, and should be removed from the permit. The 117 lb CO2/MMBtu emission limit is essentially the EPA default emission factor for CO2 for natural gas combustion of 53.02 kg CO2/MMBtu with a unit conversion applied, and rounded to three significant figures (40 CFR 98 subpart C, Table C-i). This emission factor is based on the U.S. average high heating value (HHV) for natural gas of 1,028 Btu/scf. The commenter agrees that this emission factor constitutes a reasonable emission limitation for the PHPP. However, the commenter fails to see the benefit of the emission limitation of 774 lb CO2/MWh. This MWh based emission limitation is derived from the EPA emission factor of 117 lb/MMBtu, the expected annual output of 563 MW at the assumed heat rate and 8,760 hours of operation. The actual MW output will vary depending on the actual ambient (e.g., temperature and relative humidity) conditions under which operations occur over the year. Compliance tracking for the 774 lb CO2/MWh emission limit would be based on CEMS monitoring that is conducted on an hourly basis. But such monitoring will also be used to ensure compliance with the 117 lb CO2/MMBtu emission limit upon which the 774 lb CO2/MWh emission limit is based. If compliance with the 117 lb CO2/MMBtu is demonstrated on an ongoing basis through CEMS, then the annual 774 lb CO2/MWh emission limit will not be exceeded. Furthermore, Condition X.A.1 already limits the annual GHG CO2e emissions. The 774 lb CO2/MWh rate is dependent on other variables and is not a standardized measure.
66. Response: The output-based emissions limit is an important aspect of setting a GHG
BACT limit. Because thermal efficiency was determined to be BACT, measuring thermal efficiency on a CO2/MWh basis is necessary to ensure that BACT is achieved. An annual tpy emission limit or a heat input-based limit does little to measure the thermal efficiency of the equipment. Another commenter (see Comment 55) asserted that the permit must establish some quantifiable and verifiable heat rate as BACT for GHG emissions, because otherwise the permit provides no GHG limits and does not comply with new federal GHG regulations.
In response, we are revising the GHG BACT emissions limits to remove the 117 lb/MMBtu limit and instead include a heat rate limit of 7,319 Btu/kWh. We are also revising the averaging period (from a 30-day rolling average to 365-day rolling average) for the 774 lb CO2/MWh to take into consideration the variability of operations (e.g., temperature and humidity). Revisions were made to Conditions X.C.1, X.F.14, and X.F.15. Heat Rate Chosen for BACT As a part of the GHG BACT analysis, the applicant included a list of the average heat rates (Btu/kWh based on the HHV) for various facilities near southern California. The applicant listed the heat rate for the PHPP as 6,970 Btu/kWh. This heat rate was lower than all of the other facilities that were listed. EPA also looked at other recent permitting decisions to determine whether the PHPP value was comparable. One commenter (see Comment 55) pointed to the Oakley Generating Station, which has a heat rate of 6,752 Btu/kWh.

54
However, that heat rate was not included as part of the limits in the permit. The Russell City Energy Center has a voluntary GHG heat rate limit of 7,730 Btu/kWh in its PSD permit. And, on September 28, 2011, EPA Region 6 issued a draft PSD permit for the Lower Colorado River Authority’s combustion turbines (CTs) with a GHG heat rate limit of 7,720 Btu/kWh. These limits considered a variety of factors that can affect heat rate, including seasonal variations (i.e. temperature, humidity) and equipment degradation. As a result, we are setting the BACT limit for the PHPP at 7,319 Btu/kWh to ensure the limit is achievable over various operating conditions and during the life of the equipment. Because the heat rate for the PHPP is comparable, and in fact lower, than other permitted or proposed limits, we find that 7,319 Btu/kWh represents BACT for this facility.
67. Comment: The commenter requested that the lb/hr NOx and CO limits during startup and
shutdown for the CTs be removed and replaced with only a combined NOx limit during cold startup for both CTs. The application for the Project estimated NOx and CO emissions during startup and shutdown based on the pounds of pollutant emitted during the entire startup and shutdown event and did not anticipate hourly limits. The application estimated 65 lb/hr of NOx emissions from each turbine as the worst-case emission scenario. The modeling for the 1-hour NO2 NAAQS assumed both turbines were operating simultaneously under the worst-case, so total emissions from the turbines were modeled at 130 lb/hr. The commenter stated that typical emission profiles during startup show that most of the emissions occur in the first hour. After considering the hourly limits in the proposed permit the commenter does not believe that they are achievable during startup. However, the commenter does believe that the combined emission rate of the two CTs – 130 lb/hr – is an achievable limit and ensures compliance with the 1-hour NO2 NAAQS. As a result, the applicant is proposing to replace the individual NOx startup and shutdown lb/hr emission limits for each turbine with one combined NOx limit of 130 lb/hr for both CTs during cold startups. The commenter also requested removing the lb/hr limits for CO emissions because even if all the emissions allowed for each startup or shutdown event were emitted in the first hour, a 1-hr CO NAAQS violation is not possible (since modeled emissions were below the SIL).
Response: The commenter is correct that the lb/hr limits were set to ensure compliance with the modeled worst-case emission rates. To illustrate the commenter’s concern, it is expected that most of the 96 pounds of NOx emissions during a 110-minute cold startup are emitted in the first hour. This makes it possible for an individual CT to exceed 65 lb/hr during startup. So if emissions during actual operations show this to be true, then the 130 lb/hr combined limit ensures the applicant cannot startup both CTs at the same time. The proposed permit had lb/hr emission rates averaged over the lb/event limits rather than being based on the modeled emission rates. Because the lb/hr limits were set to ensure compliance with the NAAQS, the emission rates used for modeling should be used as the BACT lb/hr limits. In this case, the limits will be based on a combined emission rate. We disagree that the emission limits for CO should be removed; as discussed above the limit is needed to ensure compliance with modeled emission rates. The NOx and CO limits in Condition X.D.3, X.D.7, and X.D.8 were revised and added accordingly. The revision of

55
these lb/hr emission limits does not affect the lb/event and time duration limits established as part of the BACT determination and does not allow operation of the facility in a manner that would exceed the modeled emission rates.
68. Comment: The commenter disagrees with the testing requirements for the cooling tower
in the proposed permit. Condition X.G.1.a.v. requires that PM, PM10, and PM2.5 emissions from the cooling tower be tested within 60 days after achieving normal operation, but not later than 180 days after the initial startup of equipment, and, unless otherwise specified, annually thereafter. The commenter believes source testing of the cooling tower is unreasonable and should not be required. PHPP is making the very conservative assumption that all total dissolved solids (TDS) emitted from the cooling tower are emitted as PM10 and PM2.5. The commenter believes that based on prior discussions with EPA Region 9, only towers that assume less than 100% of TDS is emitted as PM10 and PM2.5 might be subject to this requirement. The commenter knows of no other projects that have made this 100% assumption and have this testing requirement. There are many combined-cycle projects permitted which assume only 50%, 33% or even as low as 10% of the TDS will be emitted as PM10, and these projects are not required to test the cooling tower. Cooling tower testing is very difficult and costly to perform, and does not provide very accurate data due to these difficulties. When the commenter looked into this requirement in the past (for the Victorville 2 Hybrid Power Project), the commenter was told that there is only one testing firm in the U.S. (located in Kansas) that is able to perform this testing. The commenter believes testing of a full size cooling tower is quite challenging because of the probe size and the fact that the testing is done on the exhaust plume outside where the concentrations will be influenced by wind. The exhaust plume/stream is saturated which means that testing for PM10 and PM2.5 cannot be done to quantify each size range specifically. The PSD permit requires the use of Modified Method 306, which measures PM only. A method such as EPA Method 201A, which provides particulate size distribution, would not work since the cyclones on the head of the probe only work when moisture is in the vapor state. Response: We agree with the commenter that estimating all TDS emitted as PM10 and PM2.5 is a conservative assumption. However, a testing requirement is still needed to demonstrate compliance with the use of 0.0005% drift eliminators. We do recognize that estimating the size distribution from cooling towers can be difficult to determine, which is why the applicant is only required to measure PM emissions. The permit also allows the applicant to use equivalent test methods from the Cooling Tower Institute. Further, Condition X.G.1.f allows the applicant to request, with adequate justification, a waiver of a specific annual test. And finally, Condition X.G.1.c also allows the applicant to use an alternate test method, with prior EPA approval, should a better method for estimating cooling tower emissions be developed in the future.
69. Comment: The commenter requested that some of the compliance testing and monitoring proposed in the permit be consistent with the District’s FDOC/Authority to Construct (ATC) permit. The District FDOC/ATC permit was also incorporated into the CEC Final Decision. Specifically, the commenter requested that Condition X.G.3.a be revised to allow the use of laboratory analysis from the fuel supplier in lieu of taking monthly
56
samples of natural gas to be analyzed for the sulfur content. The commenter also requested that the requirement to install flow meters on the auxiliary boiler and heat transfer fluid heater be removed. Both the District permit and CEC approval only require hour meters; however, the proposed PSD permit is requiring both hour meters and fuel meters. The commenter does not believe that both a fuel meter and an hour meter are necessary for this equipment since the equipment will only be used for limited hours during the year and as support equipment.
Response: The fuel testing requirement in Condition X.G.3.a has been revised to allow the applicant to obtain a laboratory analysis from the fuel supplier on a monthly basis. We are not making a change to the metering requirements for the auxiliary boiler and HTF heater because the permit already allows for this flexibility. Condition X.H.1 states “Permittee shall install and maintain an operational non-resettable totalizing mass or volumetric flow meter” (emphasis added).
Written Comments Received During the Informational Meeting and Formal Public Hearing on September 14, 2011
70. Comment: EPA received a comment expressing concern about the Air Force testing too
close to the proposed project.
Response: The commenter expressed concern about the potential for aircraft to crash at the PHPP site. While this issue appears to be outside the scope of PSD review, we note that the CEC’s PMPD discusses this issue (see page 6.5-4), and determined that the probability of a flight accident is very low, and noted that PHPP would be located to the side of the runway, and thus not in the path of aircraft taking off or landing. Please also see Comment 73 from the Department of the Air Force.
71. Comment: EPA received a comment expressing concern regarding trucking gasses in the
power plant.
Response: EPA believes that the commenter is expressing concern about the transport of hazardous ammonia for use in the SCR NOx control equipment. As noted in EPA’s Fact Sheet (p.18 pdf.24), the applicant will not be using anhydrous ammonia, which can be hazardous, but rather aqueous ammonia. The CEC examined this issue and concluded that “the potential for accidental release during transport is exceedingly low”. The CEC’s PMPD proposes to include Conditions of Certification to ensure the safe receipt and storage of aqueous ammonia at the PHPP safer storage method. (See PMPD, conditions HAZ-1 through HAZ-6, and page 6.5-2.)
72. Comment: EPA received a comment expressing concern about having air pollution
control inside the building, and keeping workers informed of indoor air quality.
Response: The air quality inside of buildings is outside the scope of this PSD permitting action, which concerns only impacts in ambient air, to which the general public has access. Air quality inside buildings is covered under OSHA regulations.

57
73. Comment: EPA received a copy of a letter from the Department of the Air Force to the District. The letter stated that after review and analysis of the placement and air quality rules for the PHPP, the Air Force and the Plant 42 contractors (Boeing, Lockheed Martin, and Northrop Grumman) were unable to identify any issues or impacts to their current programs and operations at Air Force Plant 42.
Response: Comment acknowledged.
B. Oral Comments Received During the Public Hearing on September 14, 2011
1. Comment from Laurie Lile, representing the City of Palmdale: The commenter stated that the applicant is anxious for the PSD permit to be issued and the City is available to answer any questions the EPA has with respect to the application. The commenter also stated that the City’s consultant also submitted comments that they would like EPA to consider.
Response: We acknowledge the applicant’s comment. EPA’s responses to comments submitted by the City’s consultant are included in Section A, Responses to Comments 60-68.

58
III. Revisions in Final Permit The following is a list of revisions and minor changes for the Palmdale Hybrid Power Project (SE 09-01) Prevention of Significant Deterioration Permit, Final Permit Conditions. Minor corrections and clarifications are in addition to those referenced above in this Response to Comments document. 1. Cover Sheet
The cover sheet titled “Prevention of Significant Deterioration Permit Issued Pursuant to the Requirements of 40 CFR 52.21” has been added, and does not result in changes to the specific terms and conditions that were included in the Proposed Permit.
2. Equipment List
Under the Description for Unit GEN1 and Unit GEN2 we have added a description of the solar-thermal plant, which now reads as follows:
• Integrated (through the HRSG and STG) with a 251-acre solar-thermal plant (STP) consisting of parabolic solar-thermal collectors and associated heat-transfer equipment designed to contribute up to 50 MW of generation from the STG
3. Conditions III.B, III.C and X.I.11 – Facility Operation
We have added conditions for the STP: • Condition III.B states: The Permittee shall operate and maintain the STP in a
manner consistent with good engineering practices for its full utilization. • Condition III.C states: As soon as practicable following initial startup of the power
plant (as defined in 40 CFR § 60.2) but prior to commencement of commercial operation (as defined in 40 CFR § 72.2), and thereafter, the Permittee shall develop and implement an operation and maintenance plan for the STP, consistent with Condition III.B above. At a minimum, the plan shall identify measures for assessing the performance of the STP, the acceptable range of the plant performance measures for achieving the design electrical output, the methods for monitoring the plant performance measures, and the routine procedures for maintaining the STP in good operating condition.
• Condition X.I.11 states: The Permittee shall maintain a copy of the current operation and maintenance plan for the STP, and shall keep a copy of all prior versions of the plan for a minimum of five years. The Permittee shall also keep records of the monitoring data for each of the plant performance measures and all maintenance activities; the Permittee shall maintain such records for a minimum of five years following the date they are created.
4. Condition X.A.1
We have revised the annual facility emission limits for CO, PM, PM10, and PM2.5 as follows:
CO PM PM10 PM2.5
244.1250.2 tpy 111.179.1tpy 94.562.5tpy 88.056.0tpy

59
5. Condition X.C.1
We have revised the table establishing the emission limits for each CTG (with and without duct burning):
Emission Limit (per CTG) (no duct burning)
Emission Limit (per CTG) (with duct burning)
NOx • 13.4711.55 lb/hr • 1-hr average • 2.0 ppmvd @ 15% O2
• 16.6014.60 lb/hr • 1-hr average • 2.0 ppmvd @ 15% O2
CO
3-Year Demonstration Period • 8.207.65 lb/hr • 1-hr average • 2.0 ppmvd @ 15% O2
Post-Demonstration Period
• 6.155.74 lb/hr • 1-hr average • 1.5 ppmvd @ 15% O2
Conditions in X.C.3 may affect the timing and applicability of post-demonstration period emission limits.
• 10.108.90 lb/hr • 1-hr average • 2.0 ppmvd @ 15% O2
PM, PM10, PM2.5
• 0.00480.0027 lb/MMBtu • 8.464.78 lb/hr • 9-hr average3-hr average • PUC-quality natural gas
(Sulfur content of no greater than 0.20 grains per 100 dscf on a 12-month average and not greater than 1.0 gr/dscf at any time)
• 0.00490.0035 lb/MMBtu • 11.38.0 lb/hr • 9-hr average3-hr average • PUC-quality natural gas
(Sulfur content of no greater than 0.20 grains per 100 dscf on a 12-month average and not greater than 1.0 gr/dscf at any time)
GHG
• 774 lb CO2/MWh source-wide net output • 7,319 Btu/kWh source-wide net heat rate117 lb CO2/MMBtu
heat input, each GEN1/DB1 and GEN2/DB2 • 36530-day rolling average
6. Condition X.C.2:
We have revised hours of operation for each duct burner as follows:

60
• Combined The hours of operation for both each duct burners (DB1 and DB2) shall not exceed 2,000 hours per 12-month rolling average. Permittee shall ensure that the duct burners are not operated unless the associated turbine units are in operation.
7. Condition X.C.3.a through X.C.3.d:
We have revised the lb/hr emission rates for CO as follows: • Condition X.C.3.a: Permittee shall design the gas turbines to achieve a CO emission
rate of 1.5 ppmvd @ 15% O2 and 5.74 6.15 lb/hr over a 1-hour period without duct firing.
• Condition X.C.3.b: During the Demonstration Period, Permittee shall not discharge or cause the discharge of CO emissions from each CTG Unit (GEN1 and GEN2) into the atmosphere in excess of the following amounts over a 1-hour averaging period: 2.0 ppmvd CO @ 15% O2 and (1) 8.90 10.10 lb/hr with duct firing or (2) 7.658.20 lb/hr without duct firing.
• Condition X.C.3.c.iii: 5.74 6.15 lb/hr without duct firing; and • Condition X.C.3.c.iv: 8.9010.10 lb/hr with duct firing.
8. Conditions X.D.3, X.D.7, and X.D.8:
We have revised the lb/hr emission limits during startup and shutdown for each CTG by removing them from X.D.3 and adding conditions X.D.7 and X.D.8 as follows:
• Condition X.D.3:
NOx CO Duration
Cold Startup 52.4 lb/hr 96 lb/event
224 lb/hr 410 lb/event 110 minutes
Warm and Hot Startup
30 lb/hr 40 lb/event
247 lb/hr 329 lb/event 80 minutes
Shutdown 114 lb/hr 57 lb/event
674 lb/hr 337 lb/event 30 minutes
• Condition X.D.7: During startup or shutdown, emissions of NOx from both CTGs
(GEN1 and GEN2) combined shall not exceed 130 lb/hr, as verified by the CEMS. • Condition X.D.8: During startup or shutdown, emissions of CO from both CTGs
(GEN1 and GEN2) combined shall not exceed 790 lb/hr, as verified by the CEMS. 9. Condition X.F.14:
We have revised the heat input monitoring requirements for each CTG and associated duct burner as follows:
• Permittee shall measure and record, for each Unit GEN1/DB1 and Unit GEN2/DB2, the following: the actual heat input (Btu) on an hourly basis. a. The actual heat input and the heat input corrected to ISO standard day conditions
(288 degrees Kelvin, 60 percent relative humidity, and 101.3 kPal pressure) on an hourly basis;

61
b. The pounds of CO2 per heat input (lb CO2/MMBtu) corrected to ISO standard day conditions on an hourly basis; and
c. The 30-day rolling average emission rate lb CO2/MMBtu (at ISO standard day conditions). The 30-day rolling average shall be based on the average hourly lb/MMBtu recordings.
10. Condition X.F.15:
We have revised the monitoring requirements for CO2 emissions and added monitoring of the heat rate as follows:
a. Net energy output (MWhnet and kWhnet) on an hourly basis; b. Pounds of CO2 per net energy output (lb CO2/MWhnet) on an hourly basis; c. Net heat rate (Btu/kWhnet) on an hourly basis, based on total heat input for the
facility; d. The 30365-day rolling average emission rate for of lb CO2/MWhnet and
Btu/kWhnet. The 30365-day rolling average shall be based on the average hourly lb CO2/MWhnet recordings.
11. Condition X.G.1.a.iii and X.G.1.a.iv; We have revised the testing requirements for the emergency engines as follows:
• Condition X.G.1.a.iii: NOX, CO, PM, PM10, and PM2.5 emissions from the 2,000 kW (2,683 hp) internal combustion engine (D2), initial performance test and at least every five years beginning ten years after the initial performance test (within 30 days of the initial performance test anniversary) only;
• Condition X.G.1.a.iv: NOX, CO, PM, PM10, and PM2.5 emissions from the 182 hp firewater pump (D3), ), initial performance test and at least every five years beginning ten years after the initial performance test (within 30 days of the initial performance test anniversary) only;
12. Condition X.G.2.a:
We revised the cooling tower total dissolved solids testing to require recording of the water circulation rate as follows:
• Permittee shall perform weekly tests of the blow-down water quality using an EPA-approved method. The operator shall maintain a log that contains the date and result of each blow-down water quality test, the water circulation rate at the time of the test, and the resulting mass emission rate. This log shall be maintained onsite for a minimum of five years and shall be provided to EPA and District personnel upon request.
13. Condition X.G.3.a We have revised the fuel testing requirement as follows:
• Permittee shall take monthly samples of the natural gas combusted. The samples shall be analyzed for sulfur content using an ASTM method. The sulfur content test results shall be retained onsite and taken to ensure compliance with Special Conditions X.C and X.E for Units GEN1/DB1, GEN2/DB2, D1, and D4. As an alternative, Permittee may obtain laboratory analysis of sulfur content from the fuel supplier on a monthly basis, if Permittee can demonstrate that the fuel tested is representative of fuel delivered to the facility.

62
14. Condition X.I.12: We clarified this condition to read as follows:
• Unless otherwise specified herein, aAll records required by this PSD Permit shall be retained for not less than five years following the date of such measurements, maintenance, reports, and/or records.

Excerpt
5

PREVENTION OF SIGNIFICANT DETERIORATION PERMITISSUED PURSUANT TO THE REQUIREMENTS AT 40 CFR § 52.21
U.S. ENVIRONMENTAL PROTECTION AGENCY, REGION IX
PSD PERMIT NUMBER: SE 09-01
PERMITTEE: City of Palmdale38300 Sierra Highway, Suite APalmdale, CA 93550
FACILITY NAME: Palmdale Hybrid Power Project
FACILITY LOCATION: 950 East Avenue MPalmdale, CA
Pursuant to the provisions of the Clean Air Act (CAA), Subchapter I, Part C (42 U.S.C.Section 7470, et. seq.), and the Code of Federal Regulations (CFR) Title 40, Section52.21, the United States Environmental Protection Agency Region 9 (EPA) is issuing aPrevention ofSignficanz’ Deterioration (PSD) permit to the City of Palmdale. The Permitapplies to the construction and operation of a new 570 megawatt (MW, nominal) naturalgas-fired combined-cycle power plant, with an integrated 50 MW solar-thermal plant,known as the Palmdale Hybrid Power Project (PHPP) in Palmdale, California.
The City of Palmdale is authorized to construct and operate the PHPP power plant asdescribed herein, in accordance with the permit application (and plans submitted with thepermit application), the federal PSD regulations at 40 CFR § 52.21, and other terms andconditions set forth in this PSD Permit. Failure to comply with any condition or term setforth in this PSD Permit may result in enforcement action pursuant to Section 113 of theClean Air Act. This PSD Permit does not relieve the City of Palmdale from theresponsibility to comply with any other applicable provisions of the Clean Air Act(including applicable implementing regulations in 40 CFR Parts 51, 52, 60, 61, 63, and72 through 75), or other federal, state, and Antelope Valley Air Quality ManagementDistrict requirements.
Per 40 CFR § 124.15(b), this PSD Permit becomes effective 30 days after the service ofnotice of this final permit decision unless review is requested on the permit pursuant to40 CFR § 124.19.
/,? 1•
________________
/ (--cfDeborah Jordaj DATE
Director, Air iivision

PALMDALE HYBRID POWER PROJECT (SE 09-01)PREVENTION OF SIGNIFICANT DETERIORATION PERMIT
PERMIT CONDITIONS
PROJECT DESCRIPTION
The Palmdale Hybrid Power Project (Project) consists of two General Electric (GE) Frame 7FAnatural gas-fired combustion turbine-generators (CTGs) rated at 154 megawatt (MW, gross)each, two heat recovery steam generators (HRSGs), one steam turbine generator (STG) rated at267 MW, and 251 acres of parabolic solar-thermal collectors with associated heat-transferequipment. The Project will have an electrical output of 570 MW (nominal) or 563 MW (net).The Project will be located on a parcel of land owned by the city of Palmdale, currently zonedfor industrial use, in Los Angeles County. The approximately 333-acre parcel is west of thenorthwest corner of Air Force Plant 42, and east of the intersection of Sierra Highway and EastAvenue M. The City of Palmdale is located within the Antelope Valley Air QualityManagement District (District).
This Prevention of Significant Deterioration (PSD) permit for the Project requires the use of BestAvailable Control Technology (BACT) to limit emissions of nitrogen oxides (NO), carbonmonoxide (CO), total particulate matter (PM), particulate matter under 10 micrometers (jim) indiameter (PM10), particulate matter under 2.5 (jim) in diameter (PM25), and greenhouse gases(GHG), to the greatest extent feasible. Air pollution emissions from the Project would not causeor contribute to violations of any National Ambient Air Quality Standards (NAAQS) or anyapplicable PSD increments for the pollutants regulated under the PSD permit.
Additional equipment includes auxiliary equipment including a natural gas heater and boiler, adiesel-fired emergency generator and emergency firewater pump engine, cooler towers, andcircuit breakers.
EQUiPMENT LIST
The following devices and activities are subject to this PSD permit:
Palindale Hybrid Power Project (SE 09-0 1)PSD PermitOctober 2011

Unit ID Description
GEN I • 154 MW (gross) combustion turbine generator (CTG), with a maximum heat
input rate of 1,736 MMBtu/hr (H1-IV)
• Natural gas-fired GE Model Frame 7FA Rapid Start Process CTG
• Vented to a dedicated 1-teat Recovery Steam Generator (HRSG) and a 267 MW
Steam Turbine Generator (STG) shared with GEN2
• Integrated (through the HRSG and STG) with a 251 -acre solar-thermal plant
(STP) consisting of parabolic solar-thermal collectors and associated heat-
transfer equipment designed to contribute up to 50 MW of generation from the
STG• Emissions of NO and CO controlled by Dry Low-NOx (DLN) Combustors,
Selective Catalytic Reduction (SCR), and an Oxidation Catalyst (Ox-Cat)
GEN2 • 154 MW (gross) combustion turbine generator (CTG), with a maximum heat
input rate of 1,736 MMBtulhr (HHV)
• Natural gas-tired GE Model Frame 7FA Rapid Start Process CTG
• Vented to a dedicated Heat Recovery Steam Generator (HRSG) and a 267 MW
Steam Turbine Generator (STG) shared with GEN2
• Integrated (through the HRSG and STG) with a 251-acre solar-thermal plant
(STP) consisting of parabolic solar-thermal collectors and associated heat-
transfer equipment designed to contribute up to 50 MW of generation from the
STG• Emissions of NO and CO controlled by Dry Low-NOx (DLN) Combustors,
Selective Catalytic Reduction (SCR), and an Oxidation Catalyst (Ox-Cat)
DBI • 500 MMBtuJhr (HHV) Duct Burner for GENI, fired on natural gas
DB2 • 500 MMBtu/hr (FIHV) Duct Burner for GEN2, fired on natural gas
Dl• 110 MMBtu/hr (HHV) Auxiliary Boiler with ultra low-NOx burner, fired on
natural gas• 2,000 kW (2,683 hp) Emergency Internal Combustion (IC) Engine, fired on
D2Diesel fuel
• 40 CFR Part 60, Subpart 1111 emission standards
• California Air Resources Board Tier 2 emission standards
• 182 hp (135 kW) Emergency Diesel-fired IC Engine Firewater Pump Engine
D3 • 40 CFR Part 60, Subpart 1111 emission standards
• California Air Resources Board Tier 3 emission standards
2Palindaic’ Hybrid Power Project (SE 09-0 1)PSD PermitOctober2011

Unit ID Description
D4 • 40 MMbtulhr (HHV) Auciliary Heater with ultra low-NOx burner, fired onnatural gas
D5 • Cooling tower with 130,000 gallons per minute maximum circulation rate• Total dissolved solids (TDS) concentration in makeup water of 5,000 ppm (531
mg/L)• Drift eliminator with drift losses less than or equal to 0.0005 percent based on
circulation rateCB • Enclosed-pressure SF6 Circuit Breakers
• 0.5% (by weight) annual leakage rate• 10% (by weight) leak deWction system
MV • Maintenance vehicles generating fugitive road dust when traveling on pavedand unpaved roadways in the solar field for the Project
• Project Fugitive Dust Control Plan
PERMIT CONDITIONS
I. PERMIT EXPIRATION
As provided in 40 CFR § 52.21(r), this PSD Permit shall become invalid if construction:
A. is not commenced (as defined in 40 CFR § 52.2 1(b)(9)) within 18 months after theapproval takes effect; or
B. is discontinued for a period of 18 months or more; or
C. is not completed within a reasonable time.
II. PERMIT NOTIFICATION REQUIREMENTS
Permittee shall notify EPA Region IX by letter or by electronic mail of the:
A. date construction is commenced, postmarked within 30 days of such date;
B. actual date of initial startup, as defined in 40 CFR § 60.2, postmarked within 15 daysof such date;
C. date upon which initial performance tests will commence, in accordance with theprovisions of Condition X.G, postmarked not less than 30 days prior to such date.Notification may be provided with the submittal of the performance test protocolrequired pursuant to Condition X.G; and
3Pabndale Hybrid Power Project (SE 09-0 1)PSD PermitOctober 2011

D. date upon which initial performance evaluation of the continuous emissions
monitoring system (CEMS) will commence in accordance with 40 CFR § 60.13(c),
postmarked not less than 30 days prior to such date. Notification may be provided
with the submittal of the CEMS performance test protocol required pursuant to
Condition X.F.
IlL FACILITY OPERATION
A. At all times, including periods of startup, shutdown, shakedown, and malfunction,
Permittee shall, to the extent practicable, maintain and operate the Facility, including
associated air pollution control equipment, in a manner consistent with good air
pollution control practice for minimizing emissions. Determination of whether
acceptable operating and maintenance procedures are being used will be based on
information available to EPA, which may include, but is not limited to, monitoring
results, opacity observations, review of operating maintenance procedures and
inspection of the Facility.
B. The Permittee shall operate and maintain the STP in a manner consistent with good
engineering practices for its full utilization.
C. As soon as practicable following initial startup of the power plant (as defined in 40
CFR § 60.2) but prior to commencement of commercial operation (as defined in 40
CFR § 72.2), and thereafter, the Permittee shall develop and implement an operation
and maintenance plan for the STP, consistent with Condition III.B above. At aminimum, the plan shall identify measures for assessing the performance of the STP,
the acceptable range of the plant performaice measures for achieving the design
electrical output, the methods for monitoring the plant performance measures, and the
routine procedures for maintaining the STP in good operating condition.
IV. MALFUNCTION REPORTING
A. Permittee shall notify EPA at R9.AEOepa.gov within two (2) working days
following the discovery of any failure of air pollution control equipment or process
equipment, or failure of a process to operate in a normal manner, which results in an
increase in emissions above the allowable emission limits stated in Section X of this
permit.
B. In addition, Permittee shall provide an additional notification to EPA in writing or
electronic mail within fifteen (15) days of any such failure described under Condition
IV.A. This notification shall include a description of the malfunctioning equipment
or abnormal operation, the date of the initial malfunction, the period of time overwhich emissions were increased due to the failure, the cause of the failure, the
4Palmdale Hhrid Power Project (SE 09-0 1)PSD PermitOctober 2011

estimated resultant emissions in excess of those allowed in Section X, and themethods utilized to mitigate emissions and restore normal operations.
C. Compliance with this malfunction notification provision shall not excuse or otherwiseconstitute a defense to any violation of this permit or any law or regulation suchmalfunction may cause.
V. RIGHT OF ENTRY
The EPA Regional Administrator, andlor an authorized representative, upon thepresentation of credentials, shall be permitted:
A. to enter the premises where the Facility is located or where any records are requiredto be kept under the terms and conditions of this PSD Permit;
B. during normal business hours, to have access to and to copy any records required tobe kept under the terms and conditions of this PSD Permit;
C. to inspect any equipment, operation, or method subject to requirements in this PSDPermit; and
D. to sample materials and emissions from the source(s).
VI. TRANSFER OF OWNERSHIP
In the event of any changes in control or ownership of the Facility, this PSD Permit shallbe binding on all subsequent owners and operators. Within 14 days of any such changein control or ownership, Permittee shall notify the succeeding owner and operator of theexistence of this PSD Permit and its conditions by letter. Permittee shall send a copy ofthis letter to EPA Region IX within thirty (30) days of its issuance.
VI!. SEVERABILITY
The provisions of this PSD Permit are severable, and, if any provision of the PSD Permitis held invalid, the remainder of this PSD Permit shall not be affected.
VIII. ADHERENCE TO APPLICATION AND COMPLIANCE WITH OTHERENVIRONMENTAL LAWS
Permittee shall construct the Project in compliance with this PSD permit, the application
5Palmdale [-lybrid Power Project (SE 09-01)PSD PermitOctober 2011

on which this permit is based, and all other apilicab1e federal, state, and local air quality
regulations. This PSD permit does not release the Permittee from any liability for
compliance with other applicable federal, state and local environmental laws and
regulations, including the Clean Air Act.
IX. RESERVED
6
Palrndale Hybrid Power Project (SE 09-01)PSD PermitOctober 2011

X. SPECIAL CONDITIONS
A. Annual Facility Emission Limits
1. Annual emissions, in tons per year (tpy) on a 12-month rolling average basis, shall notexceed the following:
NO CO PM PM10 PM2.
Facility114.9 ipy 244.1 tpy 111.Itpy 94.5tpy 88.0
CO2e
Total Facility 1,913,000 tpy
2. Only Public Utilities Commission (PUC)-quality pipeline natural gas shall be fired at thisFacility. PUC-quality pipeline natural gas shall not exceed a sulfur content of 0.20 grainsper 100 dry standard cubic feet on a 12-month rolling average basis and shall not exceeda sulfur content of 1.0 grains per 100 dry standard cubic feet, at any time.
B. Air Pollution Control Equipment and Operation
As soon as practicable following initial startup of the power plant (startup as defined in40 CFR § 60.2) but prior to commencement of commercial operation (as defined in 40CFR § 72.2), and thereafter, except as noted below in Condition X.D, Permittee shallinstall, continuously operate, and maintain the SCR systems for control of NOx and theOx-Cat systems for control of CO for Units GEN1 and GEN2. Permittee shall alsoperform any necessary operations to minimize emissions so that emissions are at or belowthe emission limits specified in this permit.
C. Combustion Turbine Generator (CTG) Emission Limits
1. Except as noted below under Condition X.D, on and after the date of initial startup,Permittee shall not discharge or cause the discharge of emissions from each CTG Unit (ofGEN1 and GEN2) into the atmosphere in excess of the following:
7Palmdale Hybrid Power Project (SE 09-01)PSD PermitOctober 2011

Emission Limit (per CTG)(no duct burning)
• 13.47 lb/hr• 1-hr average
• 2.Oppmvd@15%02
3-Year Demonstration Period• 8.20 lb/hr• 1-hr average
• 2.Oppmvd@15%02
Post-Demonstration Period• 6.15 lb/hr• 1-hr average
• 1.5ppmvd@15%02
Emission Limit (per CTG)(with duct burning)
• 16.60 lb/hr• 1-hr average
• 2.Oppmvd@15%02
• 10.10 lb/hr• 1 -hr average
• 2.Oppmvd@15%02
PM, PM10,PM2.5
Conditions in X.C.3 may affectthe timing and applicability ofpost-demonstration periodemission limits.
• 0.0048 lb/MMBtu• 8.46 lb/hr• 9-hr average• PUC-quality natural gas
(Sulfur content of nogreater than 0.20 grains per100 dscf on a 12-monthaverage and not greaterthan 1.0 gr/dscf at anytime)
• 0.0049 lb/MMBtu• 11.31b/hr• 9-hr average• PUC-quality natural gas
(Sulfur content of no greaterthan 0.20 grains per 100dscf on a 12-month averageand not greater than 1.0gr/dscf at any time)
• 774 lb C02/MWh source-wide net output• 7,319 Btu/kWh source-wide net heat rate• 365-day rolling average
NO,
Co
GHG
2. The hours of operation for each duct burner (DBI and DB2) shall not exceed 2,000 hours
per 12-month rolling average. Permittee shall ensure that the duct burners are notoperated unless the associated turbine units are in operation.
8Palrndale Hybrid Power Pro/ect (SE 09-01)PSD PermitOctober 2011

3. CO Emissions Limit Demonstration Period — The Demonstration Period is defined as thefirst 3 years immediately following the commencement of commercial operations (asdefined in 40 CFR § 72.2).
a. Permittee shall design the gas turbines to achieve a CO emission rate of 1.5 ppmvd @15% 02 and 6.15 lb/hr over a 1 :hour period without duct firing. Prior to construction,Permittee shall submit design specifications to EPA as proof that the gas turbineswere designed to achieve such a rate, and a plan that sets forth the measures that willbe taken to maintain the system and optimize its performance.
b. During the Demonstration Period, Permittee shall operate the gas turbines accordingto the design specifications, within the design parameters, and consistent with themaintenance and performance optimization plan described above in ConditionX.C.3.a. During the Demonstration Period, Permittee shall not discharge or cause thedischarge of CO emissions from each CTG Unit (GEN1 and GEN2) into theatmosphere in excess of the following amounts over a 1-hour averaging period: 2.0ppmvd CO @ 15% 02 and (1) 10.10 lb/hr with duct firing or (2) 8.20 lb/hr withoutduct firing.
c. Following the Demonstration Period, Permittee shall not discharge or cause thedischarge of CO emissions from each CTG Unit (GEN 1 and GEN2) into theatmosphere in excess of the following amounts over a 1-hour averaging period exceptas specified in Condition X.C.3.d:
i. 1.5 ppmvd @ 15% 02 without duct firing;ii. 2.0 ppmvd @ 15% 02 with duct firing;
iii. 6.15 lb/hr without duct firing; andiv. 10.10 lb/hr with duct firing.
d. If, during the Demonstration Period, Permittee determines that the CO limits inConditions X.C.3.i or X.C.3.iii are not feasible, Permittee shall submit an applicationto EPA prior to the end of the Demonstration Period requesting a revision of thoselimits. Such an application must contain data and information that demonstrates thatthe Facility was operated according to the design specifications and parameters, andthe maintenance and performance optimization plan, identified above in ConditionX.C.3.a, as well as a technical justification explaining why the lower limits are notfeasible. If, after the applicable review process following such a submission (whichwill include an opportunity for public review and comment), it is determined throughdata and information gathered during the Demonstration Period that different COlimits are necessary, the limits in Condition X.C.3.i and X.C.3.iii will be revisedaccordingly. Provided that the application specified in this condition is postmarkedprior to the end of the Demonstration Period, the emission limits in Condition X.C.3.b
9Palmdale Hybrid Power Project (SE 09-01)PSD PermitOctober 201]

shall remain in effect until EPA evaluates the application and makes a final decision
regarding the revision of the limits in Conditions X.C.3.i or X.C.3.iii.
D. Requirements during Gas Turbine (GEN1 and GEN2) Startup and Shutdown
1. Startup is defined as the period beginning with ignition and lasting until either the
equipment complies with all operating permit limits for two consecutive 15-minute
averaging periods Or the maximum time allowed for the event after ignition, whichever
occurs first; and the period of time during whih a unit is brought from a shutdown status
to its operating temperature and pressure, including the time required by the unit’s
emission control system to reach full operations and demonstrate compliance with
Condition X.C.
a. A cold startup means a startup when the CTG has not been in operation during the
preceding 48 hours.
b. Warm and hot start-ups include all startups that are not a cold startup.
2. Shutdown is defined as the period beginning with the lowering of equipment from normal
operating load and lasting until fuel flow is completely off and combustion has ceased.
3. The duration of startup and shutdown periods and emissions of NO and CO shall not
exceed the following, for each CTG (GEN1 and GEN2) and associated HRSG unit, as
verified by the CEMS:
NO . CO Duration
Cold Startup 96 lb/event 410 lb/event 110 minutes
Warm and Hot 40 lb/event 329 lb/event 80 minutesStartup
Shutdown 57 lb/event 337 lb/event 30 minutes
4. Permittee must operate the CEMS during startup and shutdown periods.
5. Permittee must record the time, date, and duration of each startup and shutdown event.
The records must include calculations of NOx and CO emissions during each event based
on the CEMS data. These records must be kept for five years following the date of such
event.
6. During startup, the SCR system, including ammonia injection, shall be operated as soon
as the SCR reaches an operating temperature of 550 degrees Fahrenheit.
10
Palmda/e Hybrid Power Project (‘SE 09-01)PSD PermitOctober 2011

7. During startup or shutdown, emissions ofNO from both CTGs (GEN1 and GEN2)combined shall not exceed 130 lb/br, as verified by the CEMS.
8. During startup or shutdown, emissions of CO from both CTGs (GEN1 and GEN2)combined shall not exceed 790 lb/hr, as verified by the CEMS.
E. Auxiliary Combustion Equipment Emission Limits and Work Practices
1. At all times, including equipment startup and shutdown, Permittee shall not discharge orcause the discharge of emissions from each unit into the atmosphere in excess of thefollowing, and shall otherwise comply with the following specifications:
UnitiD NO CO PM/PM10PM2.5 GHG
Unit Dl • 9 ppmvd @ • 50 ppmvd • 0.8 lb/hr Annual boiler110 MMBtu!hr 3% 02 3% 02 • PUC-quality tUfle-UpS
(l-IHV) Boiler • 3-hr average • 3-hr average pipeline natural gas• 6.4 g/kW-hr, • 0.20 g/kW-hr, Not applicable
Unit D2 (4.8 g/hp-hr), (0.15 g/hp-hr )000 kW includes • 3.5 g/KW-hr, • Use of ultra-low
(2,683 hp) engine NMHC . (2.6 g/hp-hr) sulfur fuel, not to• 3-hr average exceed 15 ppm
fuel sulfurUnit D3 • 4.0 g/KW-hr, • Fuel supplier Not applicable182 hp firewater (3.0 g/hp-hr), certificationpump includes
NMHC• 3-hr average
Unit D4 • 9 ppmvd @ • 50 pprnvd @ • 0.3 lb/hr Annual boiler40 MMBtu/hr 3% 02 3% 02 • PUC-quality tune-ups(HHV) Heater • 3-hr average • 3-hr average pipeline natural
gas
Unit D5 • 1.6 lb/hr (as total130,000 gpm Not applicable Not applicable PM) Not applicableCooling Tower • <0.0005% drift
• <5,000 ppm totaldissolved solids
11Palmdale Hybrid Power Project (SE 09-01)PSD PermitOctober 2011
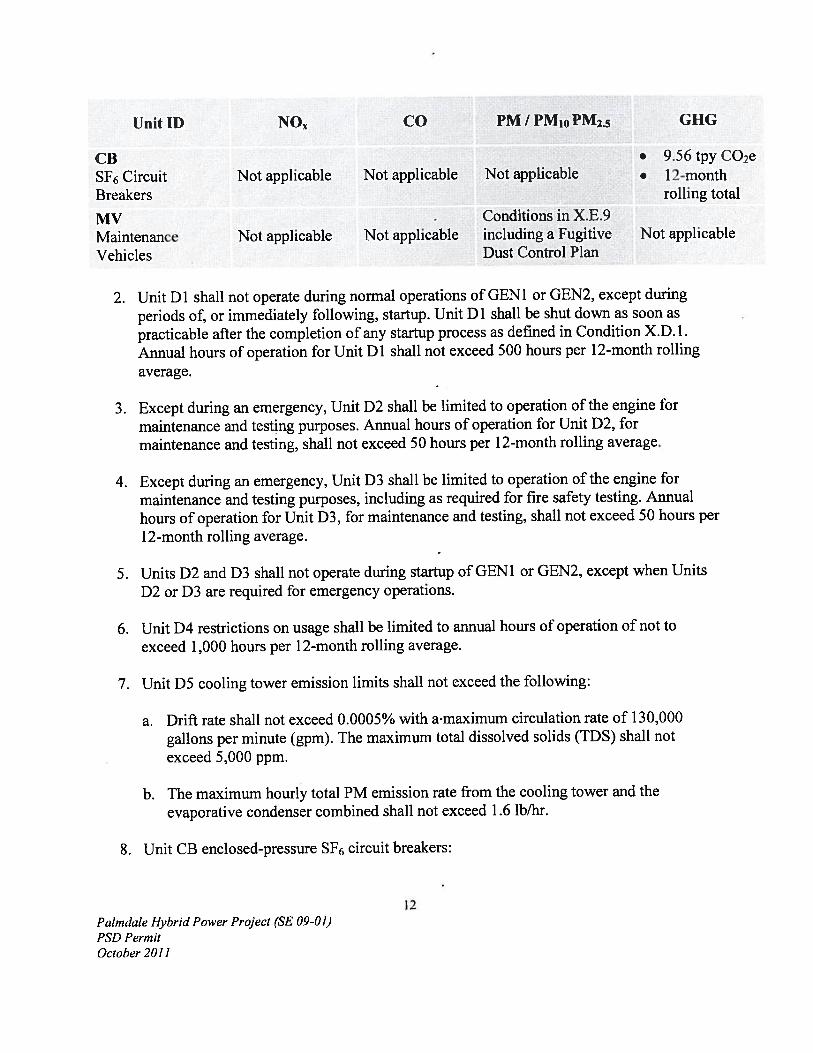
Unit ID NO CO PM / PM0PM2.5 GHG
CB • 9.56 tpy C02eSF Circuit Not applicable Not applicable Not applicable • 12-monthBreakers rolling total
MV Conditions in X.E.9Maintenance Not applicable Not applicable including a Fugitive Not applicable
Vehicles Dust Control Plan
2. Unit Dl shall not operate during normal operations of GEN1 or GEN2, except during
periods of, or immediately following, startup. Unit Dl shall be shut down as soon aspracticable after the completion of any startup process as defined in Condition X.D. 1.
Annual hours of operation for Unit Dl shall not exceed 500 hours per 12-month rolling
average.
3. Except during an emergency, Unit D2 shall be limited to operation of the engine formaintenance and testing purposes. Annual hours of operation for Unit D2, formaintenance and testing, shall not exceed 50 hours per 12-month rolling average.
4. Except during an emergency, Unit D3 shall be limited to operation of the engine formaintenance and testing purposes, including as required for fire safety testing. Annual
hours of operation for Unit D3, for maintenance and testing, shall not exceed 50 hours per
12-month rolling average.
5. Units D2 and D3 shall not operate during startup of GEN1 or GEN2, except when UnitsD2 or D3 are required for emergency operations.
6. Unit D4 restrictions on usage shall be limited to annual hours of operation of not toexceed 1,000 hours per 12-month rolling average.
7. Unit D5 cooling tower emission limits shall not exceed the following:
a. Drift rate shall not exceed 0.0005% with amaximum circulation rate of 130,000gallons per minute (gpm). The maximum total dissolved solids (TDS) shall notexceed 5,000 ppm.
b. The maximum hourly total PM emission rate from the cooling tower and theevaporative condenser combined shall not exceed 1.6 lb/hr.
8. Unit CB enclosed-pressure SF6 circuit breakers:
12Palmdale Hybrid Power Project (SE 09-01)PSI) PermitOctober 2011

a. Emissions shall not exceed an annual leakage rate of 0.5% by weight; and
b. Shall be equipped with a 10% by weight leak detection system.
9. For Unit MV, maintenance vehicles that travel on paved and unpaved roadways in thesolar field associated with the Project, Permittee shall complete the following prior to thecommencement of commercial operation (as defined in 40 CFR § 72.2):
a. Pave the main access road into the plant site;
b. Submit a Project Fugitive Dust Control Plan to EPA that includes fugitive road dustcontrol measures for unpaved and paved roads, including, but not limited to:
i. use of a durable non-toxic soil stabilizer applied throughout the solar field for dustcontrol;
ii. use of a durable non-toxic soil stabilizer to treat unpaved roads within the solarfield used by wash trucks that spray and clean the mirrors;
iii. inspection and maintenance procedures to ensure that the unpaved roads remainstabilized;
iv. use of water trucks applying water on disturbed areas where soil stabilizers are notas effective;
v. use of water n the mirror washing for incidental dust control; andvi. limiting vehicle speeds to no more than 10 miles per hour on unpaved roadways,
with the exception that vehi1es may travel up to 25 miles per hour on stabilizedunpaved roads as long as such speeds do not create visible dust emissions.
10. Units Dl and D4 shall undergo annual tune-ups and meet the associated requirements ofCondition X.I.9 as follows (if the unit is not operating on the required date for a tune-up,the tune-up must be conducted within one week of startup):
a. Inspect the burner, and clean or replace any components of the burner as necessary(you may delay the burner inspection until the next scheduled unit shutdown, but youmust inspect each burner at least once every 18 months).
b, Inspect the flame pattern, and adjust the burner as necessary to optimize the flamepattern. The adjustment should be consistent with the manufacturer’s specifications.
c. Inspect the system controlling the air-to-fuel ratio, and ensure that it is correctlycalibrated and functioning properly.
d. Optimize total emissions of carbon monoxide. This optimization should be consistentwith the manufacturer’s specifications.
13Palmdale Hybrid Power ProJect (SE 09-01)PSD PermitOctober 201!

e. Measure the concentrations in the effluent stream of carbon monoxide in parts permillion, by volume, and oxygen in volume percent, before and after the adjustments
are made (measurements may be either on a dry or wet basis, as long as it is the same
basis before and after the adjustments are made).
F. Continuous Emissions Monitoring System (CEMS) for GEN1 and GEN2
1. At the earliest feasible opportunity after first fire of GEN I and GEN2 and before GEN 1
and GEN2 commence commercial operation (as defined in 40 CFR § 72.2), in accordance
with the recommendations of the equipment manufacturer and the construction
contractor:
a. Permittee shall install, calibrate, and operate a CEMS each for GEN1 and GEN2 thatmeasures stack gas N0, CO, and CO2 concentrations in ppmv. The concentrations
shall be corrected to 15% 02 on a dry basis. No later than the end of the shakedown
period as defined in Condition X.J. or upon commencing commercial operations,
whichever comes first, Permittee shall also maintain, certify, and quality-assure aCEMS for each CTG that measures stack gas NOx, CO, and CO2 concentrations inppmv, and shall conduct initial certification of the CEMS in accordance withCondition X.F.6. The concentrations shall be corrected to 15% 02 on a dry basis.
b. If Permittee chooses to install an 02 CEMS, it shall be installed, calibrated andoperated to measure 02 concentrations in ppmv. No later than the end of theshakedown period as defined in Condition X.J. or upon commencing commercialoperations, whichever comes first, Permittëe shall also maintain, certify, and quality-
assure the CEMS for each CTG that measures 02 concentrations in ppmv, and shallconduct initial certification of the CEMS in accordance with Condition X.F.6.Permittee may not install an 02 CEMS in lieu of the CO2 çEMS in ConditionX.F. I .a.
2. The NON, CU2, and 02 CEMS shall meet the applicable requirements of 40 CFR Part 75.
3. The CO CEMS shall meet the applicable requirements of 40 CFR Part 60 Appendix B,Performance Specification 4, and 40 CFR Part 60 Appendix F, Procedure 1, except the
relative accuracy specified in section 13.2 of 40 CFR Part 60 Appendix B, Performance
Specification 4 shall not exceed 20 percent.
4. Each CEMS shall complete a minimum of one cycle of operation (sampling, analyzing,
and data recording) for each successive 15-minute clock-hour period.
5. The CEMS shall be tested in accordance with Conditions X.F.2 and X.F.3.
14Palmdale Hybrid Power Project (SE 09-01)PSD PermitOctober 2011

6. The initial certification of the CEMS may either be conducted separately, as specified in40 CFR § 60.334(b)(1), or as part of the initial performance test of each emission unit.The CEMS must undergo and pass initial performance specification testing on or beforethe date of the initial performance test.
7. The CEMS shall meet the requirements of 40 CFR § 60.13. Data sampling, analyzing,and recording shall also be adequate to demonstrate compliance with emission limitsduring startup and shutdown.
8. Not less than 90 days prior to the date of initial startup of the Facility, the Permittee shallsubmit to the EPA a quality assurance project plan for the certification and operation ofthe CEMS. Such a plan shall conform to EPA requirements contained in 40 CFR Part 60Appendix F for CO, 40 CFR Part 75 for NOx and 02 or C02, and 40 CFR Part 75Appendix B for stack flow. The plan shall be updated and resubmitted upon request byEPA. The protocol shall specify how emissions during startups and shutdowns will bedetermined and calculated, including quantifying flow accurately if calculations are used.
9. The gas turbine CEMS shall be audited quarterly and tested annually in accordance with40 CFR Part 60 Appendix F, Procedure 1. Permittee shall perform a full stack traverseduring initial run of annual RATA testing of the CEMS, with testing points selectedaccording to 40 CFR Part 60 Appendix A, Method 1.
10. Permittee shall submit a CEMS performance test protocol to the EPA no later than 30days prior to the test date to allow r.eview of the test plan and to arrange for an observer tobe present at the test. The performance test shall be conducted in accordance with thesubmitted protocol and any changes required by EPA.
11. Permittee shall furnish the EPA a written report of the results of performance tests within60 days of completion.
12. The stack gas volumetric flow rates shall be calculated in accordance with the fuelflowmeter requirements of 40 CFR Part 75 Appendix D in combination with theappropriate parts of EPA Method 19.
13. Prior to the date of initial startup of GEN1 and GEN2, Permittee shall install, andthereafter maintain and operate, continuous monitoring and recording systems to measureand record the following operational parameters:
a. The ammonia injection rate of the ammonia injection system of the SCR system.
b. Exhaust gas temperature at the inlet to the SCR reactor.
15Palm dale Hybrid Power Project (SE 09-01)PSD PermitOctober 2011

14. Permittee shall measure and record, for each Unit GEN 1/DB 1 and Unit GEN2/DB2, the
actual heat input (Btu) on an hourly basis.
15. Permittee shall measure and record, for the entire facility, the following:
a. Net energy output (MWhnet afld kWhnet) on an hourly basis;
b. Pounds of CO2 per net energy output (lbC02/MWhnet) on an hourly basis;
c. Net heat rate (BtulkWhnet) on an hourly basis, based on total heat input for the
facility;
d. The 365-day rolling average emission rate of lb C02/MWhnet and BtUlkWhnet. The
365-day rolling average shall be based on the average hourly recordings.
G. Performance Tests
1. Stack Tests
a. Within 60 days after achieving normal operation, but not later than 180 days after
the initial startup of equipment, and, unless otherwise specified, annually thereafter
(within 30 days of the initial performance test anniversary), Permittee shall conduct
performance tests (as described in 40 CFR § 60.8) as follows:
i. NOx, CO, C02, PM, PM10, and PM25 emissions from each gas turbine (Units
GEN1/DB1 and GEN2/DB2);ii. NOx and CO emissions from the 110 MMBtu/hr boiler (Dl) and the 40
MMBtuJhr heater (D4); PM, PM10, and PM25 emissions from the 110 MMBtuJhr
boiler (Dl) and the 40 .MMBtuJhr heater (D4) shall be tested initially and at least
every five years (within 30 days of the initial performance test anniversary);
iii. NOx, CO. PM, PM10, and PM25 emissions from the 2,000 kW (2,683 hp) internal
combustion engine (D2), initial performance test and at least every five years
beginning ten years after the initial performance test (within 30 days of the initial
performance test anniversary);
iv. NOx, CO. PM, PM10, and PM25 emissions from the 182 hp firewater pump (D3),
initial performance test and at least every five years beginning ten years after the
initial performance test (within 30 days of the initial performance test
anniversary); andv. PM, PM10, and PM25 emissions from the cooling tower (D5).
b. Permittee shall submit a performance test protocol to EPA no later than 30 days prior
to the test to allow review of the test plan and to arrange for an observer to be present
16Palmdale Hybrid Power Project (‘SE 09-01)PSD PermitOctober 2011

at the test. The performance test shall be conducted in accordance with the submittedprotocol, and any changes required by EPA.
c. Performance tests shall be conducted in accordance with the test methods set forth in40 CFR § 60.8 and 40 CFR Part 60 Appendix A, as modified below. In lieu of thespecified test methods, equivalent methods may be used with prior written approvalfrom EPA:
i. EPA Methods 1-4 and 7E for NOx emissions measured in ppmvdii. EPA Methods 1-4, 7E, and 19 for NOx emissions measured on a heat input basisiii. EPA Methods 1-4 and 10 for CO emissionsiv. EPA Methods 1-4 and 3B for CO2 emissionsv. EPA Methods 5 and 202, or Methods 201A and 202, for PM, PM10, and PM25, in
accordance with the test methods set forth in 40 CFR § 60.8, 40 CFR Part 60Appendix A, and 40 CFR Part 51 Appendix M; in lieu of Method 202, Permitteemay use EPA Conditional Test Methods for particulate matter CTM-039
vi. Modified Method 306 or the Cooling Tower Institute’s heated bead test methodfor PM emissions from the cooling tower, and
vii. the provisions of 40 CFR § 60.8(f).
d. The initial performance test conducted after initial startup shall use the testprocedures for a “high NO2 emission site,” as specified in San Diego Test Method100, to measure NOx emissions. The source shall be classified as either a “low” or“high” NO2 emission site based on these test results. If the emission source isclassified as a:
i. “high NO2 emission site,” then each subsequent performance test shall use the testprocedures for a “high NO2 emission site,” as specified in San Diego Test Method100.
ii. “low NO2 emission site,” then the test procedures for a “high NO2 emission site,”as specified in San Diego Test Method 100, shall be performed once every fiveyears to verify the source’s classification as a “low NO2 emission site.”
e. The performance test methods for NO emissions specified in Condition X.G. 1 .c.iand ii., may be modified as follows:
i. Perform a minimum of 9 reference method runs, with a minimum time per run of21 minutes, at a single load level, between 90 and 100 percent of peak (or thehighest physically achievable) load, and
ii. Use the test data both to demonstrate compliance with the applicable NOxemission limit and to provide the required reference method data for the RATA ofthe CEMS.
17Pabndale Hybrid Power Project (SE 09-01)PSD PermitOctober 2011

f. Upon written request and adequate justification from the Permittee, EPA may waive a
specific annual test andlor allow for testing to be done at less than maximum
operating capacity.
g. For performance test purposes, sampling ports, platforms, and access shall be
provided on the emission unit exhaust system in accordance with the requirements of
40 CFR § 60.8(e).
h. Permittee shall furnish the EPA a written report of the results of performance tests
within 60 days of completion.
2. Cooling Tower Total Dissolved Solids Testing
a. Permittee shall perform weekly tests of the blow-down water quality using an EPA-
approved method. The operator. shall maintain a log that contains the date and result
of each blow-down water quality test, the water circulation rate at the time of the test,
and the resulting mass emission rate. This log shall be maintained onsite for a
minimum of five years and shall be provided to EPA and District personnel upon
request.
b. Permittee shall calculate PM, PM10, and PM2.5 emission rate using an EPA-approved
calculation based on the TDS and water circulation rate.
c. The operator shall conduct all required cooling tower water quality tests in
accordance with an EPA-approved test and emissions calculation protocol. Thirty
(30) days prior to the first such test, the operator shall provide a written test and
emissions calculation protocol for EPA review and approval, with a copy to the
District as specified in Condition XII below.
d. A maintenance procedure shall be established that states how often and what
procedures will be used to ensure the integrity of the drift eliminators, to ensure that
the TDS limits are not exceeded, and to ensure compliance with recirculation rates.
This procedure is to be kept onsite and made available to EPA and District personnel
upon request. Permittee shall promptly report any deviations from this procedure.
3. Fuel Testing
a. Permittee shall take monthly samples of the natural gas combusted. The samples
shall be analyzed for sulfur content using an ASTM method. The sulfur content test
results shall be retained onsite and taken to ensure compliance with Special
Conditions X.C and X.E fbr Units GEN1/DBI, GEN2/DB2, Dl, and D4. As an
18
Palmdale Hybrid Power Project (‘SE 09-0 1)PSD PermitOctober 2011
alternative, Permittee may obtain laboratory analysis of sulfur content from the fuelsupplier on a monthly basis, if Permittee can demonstrate that the fuel tested isrepresentative of fuel delivered/to the facility.
H. Monitoring for Auxiliary Equipment
1. Permittee shall install and maintain an operational non-resettable totalizing mass orvolumetric flow meter in each fuel line for the 110 MMBtuJhr boiler (Unit Dl) and the 40MMBtuJhr heater (Unit D4).
2. Permittee shall install and maintain an operational non-resettable elapsed time meter forthe 110 MMBtu /hr boiler (Unit D t), 2,000 kW emergency use engine (Unit D2), the 182hp emergency-use firewater pump (Unit D3), and the 40 MMBtuJhr heater (Unit D4).
3. Permittee shall install and maintain a leak detection system on the circuit breakers thatsignals an alarm in the facility’s control room in the event that any circuit breaker losesmore than 10% of its dielectric fluid. The owner/operator shall promptly respond to anyalarm, investigate the circuit breaker involved, and fix any leak-tightness problems thatcaused the alarm.
I. Recordkeeping and Reporting
1. Permittee shall maintain a file of all records, data, measurements, reports, and documentsrelated to the operation of the Facility, including, but not limited to, the following: allrecords or reports pertaining to adjustments and/or maintenance performed on any systemor device at the Facility; all records relating to performance tests and monitoring ofauxiliary combustion equipment; for each diesel fuel oil delivery, documents from thefuel supplier certifying compliance with the fuel sulfur content limit of Condition X.E;and all other information required by this permit recorded in a permanent form suitablefor inspection.
2. Permittee shall maintain CEMS records that include the following: the occurrence andduration of any startup, shutdown, shakedown, or malfunction, performance testing,evaluations, calibrations, checks, adjustments, maintenance, duration of any periodsduring which a continuous monitoring system or monitoring device is inoperative, andcorresponding emission measurements.
3. Permittee shall maintain records of all source tests and monitoring and complianceinformation required by this permit.
4. Permittee shall maintain records and submit a written report of all excess emissions toEPA semi-annually, except when: more frequent reporting is specifically required by an
19Palmdale ifybrid Power Project (SE 09-01)PSD PermitOctober 2011

applicable subpart; or the Administrator, on a case-by-case basis, determines that more
frequent reporting is necessary to accurately assess the compliance status of the source.
The report is due on the 30th day following the end of each semi-annual period and shall
include the following:
a. Time intervals, data and magnitude of the excess emissions, the nature and cause (if
known), corrective actions taken and preventive measures adopted;
b. Applicable time and date of each period during which the CEMS was inoperative
(monitor down-time), except for zero and span checks, and the nature of CEMS
repairs or adjustments;
c. A statement in the report of a negative declaration; that is, a statement when no
excess emissions occurred or when the CEMS has not been inoperative, repaired, or
adjusted;
d. Any failure to conduct any required source testing, monitoring, or other compliance
activities; and
e. Any violation of limitations on operation, including but not limited to restrictions
on hours of operation.
5. Excess emissions shall be defined as any period in which the Facility emissions exceed
the maximum emission limits set forth in this permit.
6. A period of monitor down-time shall be any unit operating clock hour in which sufficient
data are not obtained by the CEMS to validate the hour for NOx, CO, C02, or 02, while
the CEMS is also meeting the requirements of-Condition X.F.7.
7. Excess emissions indicated by the CEM system, source testing, or compliance monitoring
shall be considered violations of the applicable emission limit for the purpose of this
permit.
8. Permittee shall maintain the Fugitive Dust Control Plan on-site, which shall include all
documentation related to demonstrating compliance with Condition X.E.9 for Unit MV,
in a permanent form suitable for inspection.
9. Permittee shall conduct annual tune-ups as required by Condition X.E. 10 for Units Dl
and D4 and maintain onsite, and submit if requested by the Administrator, a biennial
report containing the information in paragraphs (a) through (c) below:
a. The concentrations of CO in the effluent stream in parts per million, by volume, and
20Palmdale Hybrid Power Project (SE 09-01)PSD PermitOctober 2011

oxygen in volume percent, measured before and after the tune-up of the boiler.
b. A description of any corrective actions taken as a part of the tune-up of the boiler.
c. The type and amount of fuel used over the 12 months prior to the biennial tune-upof the boiler.
10. Permittee shall record the pounds of dielectric fluid added to the circuit breakers eachmonth.
11. The Permittee shall maintain a cop5r of the current operation and maintenance plan for theSTP, and shall keep a copy of all prior versions of the plan for a minimum of five years.The Permittee shall also keep records of the monitoring data for each of the plantperformance measures and all maintenance activities; the Permittee shall maintain suchrecords for a minimum of five years following the date they are created
12. Unless otherwise specified herein, all records required by this PSD Permit shall beretained for not less than five years following the date of such measurements,maintenance, reports, andJor records.
J. Shakedown Periods
The combustion turbine emission limits and requirements in Conditions X.C, X.D, andX.E shall not apply during combustion shakedown periods. Shakedown is defined as theperiod beginning with initial startup and ending no later than initial performance testing,during which the Permittee conducts operational and contractual testing and tuning toensure the safe, efficient and reliable operation of the plant. The shakedown period shallnot exceed 90 days. The requirements of Section III of this permit shall apply at all times.
21Palm dale Hybrid Power Project (SE 09-0!)PSD PermitOctober 2011

Xl. ACROYNMS AND ABBREVIATIONS
AQMD Air Quality Management DistrictASTM American Society for Testing and Materials
BACT Best Available Control TechnologyBTU British Thermal UnitCAA Clean Air ActCEMS Continuous Emissions Monitoring System
CFR Code of Federal RegulationsCO Carbon MonoxideC02e Carbon Dioxide EquivalentCTG Combustion Turbine GeneratorCTM Conditional Test MethodDistrict Antelope Valley Air Quality Management District
DLN Dry LowNOx(d)scf (dry) Standard Cubic FeetEPA Environmental Protection AgencyFDOC Final Determination of Compliance
g gramsGE General ElectricGHG Greenhouse Gasgpm Gallons Per Minutegr grainsHHV Higher Heating Valuel-IRSG Heat Recovery Steam Generatorhp Horsepowerhr HourIC Internal CombustionkPa kilopascalskW Kilowattlb Poundslbs PoundsMMBtu Million British Thermal UnitsMW MegawattNAAQS National Ambient Air Quality StandardsNNSR Nonattainment New Source ReviewNO2 Nitrogen DioxideNO Oxides of NitrogenNSPS New Source Performance Standards
02 OxygenOx-Cat Oxidation CatalystPHPI Palmdale Hybrid Power Project
22Palmdale Hybrid Power Project (SE 09-0 1)PSD PermitOctober 2011

PM Total Particulate MatterPM25 Particulate Matter with aerodynamic diameter less than 2.5 micrometersPM10 Particulate Matter with aerodynamic diameter less than 10 micrometersppm Parts Per Millionppmvd Parts Per Million by Volume, Dry basisppmv Parts Per Million by VolumePSD Prevention of Significant DeteriorationPUC Public Utilities CommissionRATA Relative Accuracy Test AuditSCR Selective Catalytic ReductionSF6 Sulfur HexafluorideSO2 Sulfur Dioxide5Ox Oxides of SulfurSTG Steam Turbine GeneratorSTP Solar-thermal PlantTDS Total Dissolved Solidstpy Tons Per Yearyr Year
XII. AGENCY NOTIFICATIONS
All correspondence as required by this Approval to Construct must be sent to:
A. Director, Air Division (Attn: AIR-5)EPA Region IX75 Hawthorne StreetSan Francisco, CA 94105-3901
Email: R9.AEOepa.govFax: (415) 947-3579
With a copy to:
B. Air Pollution Control OfficerAntelope Valley Air Quality Management District43301 Division Street, Suite 206Lancaster, CA 93535Fax: (661)723-3450
23Palmdale Hybrid Power Project (SE 09-0])PSD PermitOctober 2011

Excerpt
6

Dear Ms. Jordan, Thank you for the prompt response to my request. Please reconsider your position. The EPA has apparently had this project on its books for years and yet only posted all of the documents, which equates to 10s of thousands of pages of information, on 8/12/2011 and only intends to have an informational meeting on the last day of the public comment period. This hardly gives adequate time for review and comment. It used to be that information was posted on the docket and accessible as it became available, kind of like the courts and other agencies do. The dockets used to function like a, real time, summary of the proceeding. The present practice of withholding all information until the start of the public comment period, with the shortest public comment period that the law might allow, serves to preclude public participation. Your response also appears to in fact shorten the comment period by one minute. Thank you Rob Simpson
-------- Original Message -------- Subject: [SPAM] Palmdale Hybrid Power Project PSD Permit Number SE 09-01 From: [email protected] Date: Mon, September 12, 2011 2:00 pm To: <[email protected]>, "April Sommer" <[email protected]> Cc: [email protected], [email protected], [email protected] Dear Mr. Simpson,
Palmdale Hybrid Power Project PSD Permit Number SE 09-01 rob to: Deborah Jordan 09/12/2011 06:03 PM Cc: Julie Walters, Gerardo Rios, Lisa Beckham, "April Sommer" Hide Details From: <[email protected]> To: Deborah Jordan/R9/USEPA/US@EPA Cc: Julie Walters/R9/USEPA/US@EPA, Gerardo Rios/R9/USEPA/US@EPA, Lisa Beckham/R9/USEPA/US@EPA, "April Sommer" <[email protected]>
Page 1 of 2
9/13/2011file://C:\Documents and Settings\lbeckham\Local Settings\Temp\notesBAAA25\~web509...

Thank you for your interest in EPA's proposed PSD permit for the Palmdale Hybrid Power Project. EPA has reviewed and considered your request for an extension of the comment period for this action. I decline to grant your request. Therefore, the public comment period will close as scheduled on September 14, 2011. Please note that comments submitted by email must be submitted no later than 11:59 pm Pacific daylight time on September 14, 2011. We look forward to receiving and reviewing your comments on EPA's proposed action. Sincerely, Deborah Jordan _________________ Deborah Jordan Director, Air Division U.S. EPA Region 9 phone: (415) 972-3133 fax: (415) 947-3581
Page 2 of 2
9/13/2011file://C:\Documents and Settings\lbeckham\Local Settings\Temp\notesBAAA25\~web509...

Excerpt
7

1
April Rose Sommer Attorney at Law P.O. Box 6937, Moraga, CA 94570 (510) 423-0676 [email protected] Environmental Litigation ♦ Non-Profit Counseling
September 14, 2011
Lisa Beckham (AIR-3)
U.S. EPA Region 9
75 Hawthorne Street
San Francisco, CA 94105-3901
Re: Palmdale Hybrid Power Project PSD Permit Number SE 09-01
Dear Ms. Beckham:
Please accept the following comments on the proposed PSD permit for the Palmdale Hybrid
Power Project (PHPP) submitted on behalf of my clients Rob Simpson and Helping Hand Tools.
Helping Hand Tools is a humanitarian and environmental non-profit corporation that extensively
supports involvement in the licensing proceedings of new natural gas power plants in California.
The EPA’s environmental justice (EJ) analysis is woefully inadequate and does not support the
conclusion that “there will not be disproportionately high and adverse human health or
environmental effects with respect to these air pollutants on minority or low-income populations
residing near the proposed Project or the community as a whole.” PHPP EPA EJ Analysis, page
9. If the EPA issues the PHPP a PSD permit based upon the existing EJ analysis, the EPA will
have failed its duty to insure the fair treatment and meaningful involvement of all people in the
implementation of the Clean Air Act in approving a polluting industrial facility.
I. There Has Been NO Public Involvement, Much Less Meaningful Involvement in the EJ
Analysis Process
Meaningful involvement is an easily understood concept – the EPA has a duty to inform and
consider the concerns of those who will be most affected by their actions. Executive Order
12898 section 5-5 specifically calls upon agencies to do the following
Each Federal agency shall work to ensure that public documents, notices, and hearings
relating to human health or the environment are concise, understandable, and readily
accessible to the public.
The Working Group shall hold public meetings, as appropriate, for the purpose of fact-
finding, receiving public comments, and conducting inquiries concerning environmental
justice. The Working Group shall prepare for public review a summary of the comments
and recommendations discussed at the public meetings.

2
The EPA has failed both the objectives and mandates of the Executive Order in making no
attempt to involve the public in addressing PHPP environmental justice and human health issues.
In fact, the EPA really has not addressed environmental justice or human health issues at all.
The EPA has not made any information on human health readily accessible to the public. The EJ
Analysis, Fact Sheet and Ambient Air Quality Impact Report, and the Public Information Sheet
do not include any discussion of human health. The only mention of human health in the Fact
Sheet is a short analysis of the hazards of ammonia and a brief summary of the EJ Analysis.
The EPA does not appear to have held any public meetings and has not noticed any future
meeting on environmental justice or human health issues. The EPA never issued a draft EJ
analysis, only a document entitled “Palmdale Hybrid Power Project Proposed PSD Permit No.
SE 09-01 Environmental Justice Analysis August 2011.” There is no indication on this
document that it is a draft, or that the public has been or will be consulted regarding the contents
of the document. The document is drafted in such a way that the reader is led to believe it is a
final document.
The EPA has not made the EJ Analysis or any other information on human health available for
review at any locations near the site. Strangely, the EJ Analysis informs the public that other
documents, the proposed PSD permit and fact sheet/ambient air quality impact report, are
available for review at some Antelope Valley locations but does not indicate that the document
itself is available.
The joint notice for the proposed permit, public information meeting and public hearing makes
no mention of environmental justice or human health including in its request for comments:
Comments should address the proposed permit and facility, including such matters as:
1. The Best Available Control Technology (BACT) determinations;
2. The effects, if any, on Class I areas;
3. The effect of the proposed facility on ambient air quality; and
4. The attainment and maintenance of the NAAQS.
The EPA apparently plans to hold the first and only “informational meeting” for the public one
hour before the public hearing on the approval of the proposed permit, late in the last day of
public comment. There is no indication that environmental justice or human health concerns will
be discussed at the informational meeting. Even if it was included, does the EPA really consider
it adequate, especially given the acknowledged language and education barriers of the effected
population, to give the public one hour between the informational meeting and public hearing to
be able to formulate considered comments not only on environmental justice issues but the
proposed permit as a whole?
II. EPA Has Not Considered Human Health as Required by the Executive Order
Executive Order 12898 section 3-302 calls upon agencies to include an analysis of human health
risks in EJ analyses. “[E]ach Federal agency, whenever practicable and appropriate, shall collect,
maintain, and analyze information assessing and comparing environmental and human health
risks borne by populations identified by race, national origin, or income. To the extent practical

3
and appropriate, Federal agencies shall use this information to determine whether their programs,
policies, and activities have disproportionately high and adverse human health or environmental
effects on minority populations and low-income populations.”
Section 3-301 details the requirements for adequate Human Health and Environmental Research
and Analysis.
(a) Environmental human health research, whenever practicable and appropriate, shall
include diverse segments of the population in epidemiological and clinical studies,
including segments at high risk from environmental hazards, such as minority
populations, low-income populations and workers who may be exposed to substantial
environmental hazards.
(b) Environmental human health analyses, whenever practicable and appropriate, shall
identify multiple and cumulative exposures.
(c) Federal agencies shall provide minority populations and low-income populations the
opportunity to comment on the development and design of research strategies undertaken
pursuant to this order.
EPA does not appear to have collected, maintained, or analyzed any data on human health in
reference to PHPP. Most strikingly, the EJ analysis makes no mention of the astronomically
high rates of asthma in the Antelope Valley. The preexisting research is very easy to obtain and
makes it clear that the communities closest to the PHPP include minority and low-income
populations that are especially sensitive to the environmental hazards of air pollution.
Current asthma prevalence percentage children
Antelope Valley* 15.7
Next highest rate in Los Angeles County* 11.0
Los Angeles County average* 8.8
United States+ 9.1
Current asthma prevalence percentage adults
Antelope Valley* 11.4
Next highest rate in Los Angeles County* 7.6
Los Angeles County average* 6.5
United States+ 7.3
*Los Angeles County Department of Public Health, Key Indicators of Health April 2007
+Centers for Disease Control and Prevention. 2007 National Health Interview Survey Data
The EPA seems content to rely on alleged modeled compliance with NAAQS to excuse its total
failure to investigate the human health impacts of PHPP in any way, including in the context of
environmental justice. “EPA has determined that compliance with the applicable NAAQS is
sufficient to satisfy the Executive Order as to those regulated pollutants. There are a number of
problems with this reasoning.

4
III. The EPA’s Total Reliance on Claimed Compliance with NAAQS is Insufficient
The EPA acts as if the non-attainment New Source Review and PSD permitting processes exist
entirely independent of one another and as if it can wash its hands of any responsibility for
environmental justice concerns based on alleged compliance with NAAQS. This is wrong for a
number of reasons. First, this project will emits pollutants in excess of NAAQS and the EPA has
a duty to address this in its environmental justice analysis. Additionally, the proposed mitigation
of offsets for emissions in excess of NAAQS will be implemented in such a way that will almost
certainly cause “disproportionately high and adverse human health or environmental effects with
respect to these air pollutants on minority or low-income populations residing near the proposed
Project.”
Second, the regulation of air emissions does not exist in a vacuum – the dynamic nature of air
pollution is the entire reason that Congress enacted the Clean Air Act. The best example of this
is the regulation of NOx. As the EPA admits "Because NOx is also a precursor to ozone in this
area, it will also be regulated by the separate District ozone nonattainment New Source Review
permit in addition to this PSD permit." Logically, NOx emissions as NOx emissions and as
precursor-to- ozone emissions must be looked at together. Here the EPA has wrongly attempted
to dismiss any responsibility for conducting an environmental justice analysis NOx precursor-to-
ozone emissions. Finally, it is irresponsible of the EPA do justify non-compliance with the
Executive Order entirely based on estimates of emissions that are within 1% of exceeding
NAAQS.
a. The EPA Is Ultimately Responsible for Enforcing the CAA
The EPA’s failure to address the environmental justice concerns for this project as a whole is
unacceptable. The PHPP will emits pollutants in excess of NAAQS, specifically ozone. The
Antelope Valley Air Quality Management District (AVAQMD) is in severe non-attainment for
ozone. As the EJ analysis explains, ozone is a pollutant that is highly dangerous to human
health. “Scientific studies have linked ground level ozone exposure to a variety of problems,
including, for example, airway irritation, coughing, and pain when taking a deep breath;
wheezing and breathing difficulties during exercise or outdoor activities; inflammation, which is
much like a sunburn on the skin; aggravation of asthma and increased susceptibility to
respiratory illnesses like pneumonia and bronchitis; and permanent lung damage with repeated
exposures.”
Ozone non-attainment triggered New Sources Review permitting by the AVAQMD, in the form
of the FDOC. The AVAQMD issued its FDOC only under a delegation of the EPA's authority
and duty to enforce the CAA. It does not appear that any EJ analysis was conducted as part of
the FDOC process. The EPA’s current EJ Analysis refuses to address any action taken by the
district. The EPA seems content with passing the buck on ozone to the AVAQMD and the CEC:
"As discussed above, the District’s FDOC, rather than EPA’s PSD permit, addresses non-
attainment pollutants, i.e., ozone precursors associated with the Project . . . EPA’s environmental
justice analysis focuses on the potential effects on minority or low income populations from
emissions that may affect the NAAQS that are applicable in this PSD permit application." This

5
has resulted in no environmental justice analysis of the aspect of the PHPP that most risks human
health – those emissions, specifically ozone and its precursors, that will be contribute to an
exceedence of NAAQS. This is unacceptable.
b. Mitigation for NAAQS in the Form of Inter-District Emission Control Reduction Offsets
Specifically Implacts Environmental Justice Concerns
Additionally, the proposed mitigation of offsets for emissions in excess of NAAQS will be
implemented in such a way that will almost certainly cause “disproportionately high and adverse
human health or environmental effects with respect to these air pollutants on minority or low-
income populations residing near the proposed Project.”
The mitigation calls for Emission Reduction Control (ERC) NOx offsets located up to 116 miles
upwind of the project site and VOC ERCs are up to 285 miles upwind of the project site.
Mitigation of the emission of pollutants hazardous to human health will be conducted far outside
of the communities most effected by the emissions. The EJ Analysis demonstrates that these
communities have high levels of uneducated, linguistically isolated, poor, and minority residents.
So, those most affected by PHPP pollution, those living closest to the plant, will be unlikely to
directly benefit from mitigation. This is precisely the type of injustice that the Executive Order
seeks to prevent.
c. Modeled Emissions Estimates
EPA's argument that, because the modeling did not show an expected impact of NOx there are
no environmental justice concerns, does not stand. As a precursor to ozone, any NOx emissions
threaten the health of those living nearby. When those who will suffer the greatest impact of the
negative effects of federal project include a high percentage of minority, poor, uneducated,
linguistically isolated citizen, there are environmental justice concerns. This is exactly the
situation here.
The EPA entire justification for non-compliance with the Executive Order is based on a modeled
estimates of emissions that allegedly shows compliance with NAAQS. But, the modeling shows
NOx emissions perilously close to the edge of exceeding NOx NAAQS’s. NO2 impact was
modeled at 0.98 μg/m3, where the Significant Impact Level (SIL) is 1 μg/m3 and the cumulative
1-hour NO2 impact was modeled at 185.3 μg/m3, as compared with the NAAQS of 188 μg/m3.
The EJ analysis states that the impact is .98 and 185.3 as if this were established fact rather than
the result of the use of modeling to estimate impacts. With the modeled estimates within .02%
and .014% of the standards, there are certainly no guarantees, and a high statistical likelihood
that the NOx emissions will exceed NAAQS. This puts those living closest to the PHPP at the
highest risk of suffering harm from NOx and ozone pollution. If an agency is going to rely on
estimates to justify non-complaince with an Executive Order, the estimates should without-a-
doubt show that the standards could not conceivably be exceeded under any circumstances. This
is not the case here and so the EPA’s reliance on compliance with NAAQS is unfounded.
Reliance on the CEC EJ “Analysis” and Offset Disparity

6
The EPA’s EJ analysis is further undercut by its reliance on the CEC’s entirely deficient
analysis. The EPA EJ analysis states:
In order to provide further information about the potential air quality impacts of the
Project, EPA notes that the CEC analyzed environmental justice considerations in the
Presiding Member’s Proposed Decision (08-AFC-9), pp. 8.3-6 to 8.3-8 (June 2011). The
Commission proposed, based on the evidentiary record that the fully mitigated project
would not result in any significant adverse environmental or public health impacts to any
population. Id. at 8.3-8. With respect to air quality impacts, the Commission found that
the PHPP will not cause or contribute to disproportionate impacts upon minority or low
income populations, as all PHPP significant impacts will be mitigated below significance.
Id. at 8.3-8.
The CEC's environmental justice analysis in the Presiding Member’s Proposed Decision and
Final Decision is non-existent. The CEC gathered some information on demographics but then
failed to analyze the evidence to determine whether there was a need for an environmental
justice analysis. Having failed to determine if an environmental justice analysis is even
necessary, the CEC then offers the bald conclusion that "In light of our finding that all PHPP
significant impacts are mitigated below significance, we find the PHPP will not cause or
contribute to disproportionate impacts upon minority or low income populations." CEC Decision
page 533.
A quick read of the scant six paragraph coverage of environmental justice in the CEC decision,
reproduced in Appendix A, reveals that there is no substantive analysis whatsoever.
The final conclusory statement is unsupported by any evidence. Furthermore, it is not an accurate
statement of the CEC’s true position. A more careful reading of the CEC decision reveals that
the CEC did not actually find that all significant impacts are mitigated below significance. The
CEC Decision reads: “Based on the large distance between the project site and ERC [emission
reduction credit] sources, the need for offset ratios that are based on these distances and the lack
of information on offset ratios needed for adequate abatement, the evidence shows that the
proposed VOC and NOx ERCs are not adequate to fully offset PHPP emissions, result in a net
air quality benefit or meet the requirements of AVAQMD Rule 1305.” CEC decision
Any finding that impacts have been mitigated below significance is dependent on VOC and NOx
Emissions Reduction Credits adequate to fully offset PHPP emissions. The CEC indicated that
this was not assured and called upon the EPA to further address the issue: “The project will be
subject to review by the US EPA for purposes of determining compliance with the federal PSD
program and it is expected that US EPA will review all aspects of PHPP, including offsets.”
CEC Decision page 152
Based on the inadequate Rob Simpson and Helping Hand Tools urge the EPA to not issue this
PSD permit.
Thank you,

Excerpt
8

PHPP Request to Reopen PHPP PSD PermitLisa Beckham to: April Sommer 11/18/2011 11:42 AM
Cc:Deborah Jordan, Elizabeth Adams, Kerry Drake, Gerardo Rios, Julie Walters, rob
Ms. Sommer,
I may have sent the first email to the wrong address - I have two for you.
Lisa BeckhamEnvironmental EngineerAir Division, Permits OfficeU.S. EPA Region 9(415) 972-3811
----- Forwarded by Lisa Beckham/R9/USEPA/US on 11/18/2011 11:40 AM -----
From: Lisa Beckham/R9/USEPA/USTo: April Rose Sommer <[email protected]>Cc: Deborah Jordan/R9/USEPA/US@EPA, Elizabeth Adams/R9/USEPA/US@EPA, Kerry
Drake/R9/USEPA/US@EPA, Gerardo Rios/R9/USEPA/US@EPA, Julie Walters/R9/USEPA/US@EPA, [email protected]
Date: 11/18/2011 11:39 AMSubject:
Ms. Sommer,
Please find the attached letter with our response to your request to re-open the public comment period for the Palmdale Hybrid Power Project PSD permit.
PHPP Request to Reopen 11182011.PDFPHPP Request to Reopen 11182011.PDF
Enclosure_Notice of Final Permit Decision.pdfEnclosure_Notice of Final Permit Decision.pdf
Thanks,Lisa BeckhamEnvironmental EngineerAir Division, Permits OfficeU.S. EPA Region 9(415) 972-3811

S7q.
UNITED STATES ENVIRONMENTAL PROTECTION AGENCYREGION IX
75 Hawthorne StreetSan Francisco, CA 94105
April Rose SommerAttorney at LawP.O. Box 6937Moraga, CA 94570Sent via email to: [email protected]
Re: Request to Reopen Comment Period for Palmdale Hybrid Power Project PSD Permit
Dear Ms. Sommer:
Thank you for your letter to EPA Region 9’s Regional Administrator Jared Blumenfeld dated November15, 2011, on behalf of Rob Simpson and Helping Hand Tools. Your letter requests that EPA reopen thecomment period for the Clean Air Act Prevention of Significant Deterioration (PSD) permit issued byEPA on October 18, 2011, to the City of Palmdale for the Palmdale Hybrid Power Project (PHPP)pursuant to 40 CFR 124.14(b).
EPA declines to grant your request to reopen the comment period for EPA’s PSD permit for the PHPPunder 40 CFR 124.14(b). As discussed in more detail in EPA’s notice of final permit decision, whichwas previously sent to you and is also enclosed herewith, petitions for review of EPA’s final permitdecision for the PHPP may be filed with the EPA Environmental Appeals Board. Petitions for reviewmust be filed within 30 days after service of notice announcing the final permit decision.
Sincerely,
..Dorah JordanDirector, Air Division
Enclosure

*** ANNOUNCEMENT *** OF A FINAL DECISION TO ISSUE A PSD PERMIT THAT REGULATES THE
EMISSION OF AIR POLLUTANTS PALMDALE HYBRID POWER PROJECT
PERMIT APPLICATION NO. SE 09-01 In August 2011, the United States Environmental Protection Agency, Region 9 (EPA) requested public comment on our proposal to issue a Prevention of Significant Deterioration (PSD) permit authorizing the construction and operation of a 570 megawatt (MW) natural gas-fired combined-cycle power plant, with an integrated 50 MW solar-thermal plant, known as the Palmdale Hybrid Power Project (PHPP or Project), in Palmdale, California. During the public comment period, which ended on September 14, 2011, EPA received written and oral comments regarding its proposed PSD permitting action for the Project. EPA has carefully reviewed each of the comments submitted and, after consideration of the expressed views of all commenters, the pertinent Federal statutes and regulations, and additional material relevant to the application and contained in our Administrative Record, EPA has made a decision in accordance with 40 CFR 52.21 to issue a final PSD permit to the City of Palmdale for the Project. The final permit was signed on October 18, 2011. Key portions of the Administrative Record for this decision (including the final permit, all public comments, EPA’s responses to the public comments, and additional supporting information) are available online at www.regulations.gov (Docket ID # EPA-R09-OAR-2011-0560), with a link from our website at www.epa.gov/region09/air/permit/r9-permits-issued.html#psd. Hard copies of the final permit and EPA’s responses to the public comments, and the Administrative Record for this action, may also be viewed in person, Monday through Friday from 9:00 AM to 4:00 PM, at the EPA Region 9 address below. Due to building security procedures, please call Lisa Beckham at (415) 972-3811 to arrange a visit at least 24 hours in advance. Hard copies of the final permit and EPA’s responses to the public comments are available upon request in writing, by e-mail, or by fax to: U.S. Environmental Protection Agency Air Permits Office (AIR-3) Attn: Lisa Beckham 75 Hawthorne Street San Francisco, CA 94105 E-mail: [email protected] Fax: 415-947-3579 The contact information above may also be used to request copies of other portions of the administrative record for this action. Within 30 days after the service of notice announcing this final permit decision, any

person who filed comments on the proposed permit for the Project or participated in any of the public hearings for the Project may petition EPA’s Environmental Appeals Board (EAB) to review any condition of the final permit. Persons who did not file comments or participate in the public hearings may petition for administrative review only to the extent of changes from the proposed to the final permit decision. The petition must include a statement of the reason(s) for requesting review by the EAB, including a demonstration that any issues being raised were raised during the public comment period to the extent required by the regulations at 40 CFR Part 124 and when appropriate, a showing that the conditions in question are based on 1) a finding of fact or conclusion of law which is erroneous, or 2) an exercise of discretion or an important policy consideration which the EAB should, in its discretion, review. Please see 40 CFR 124.19 and visit http://www.epa.gov/eab/ for important information regarding the procedures for appeal of a PSD permit decision to the EAB. EPA’s PSD permit for the Project shall take effect thirty (30) days from the date of service of notice of this permit decision unless a petition for review is properly and timely filed with the EAB. In the event that a petition for review is filed with the EAB, construction of the facility is not authorized under this PSD permit until resolution of the EAB petition(s).
*** END OF ANNOUNCEMENT *** Issued October 19, 2011

Excerpt
9

AECOM (805)388-3775 tel 1220 Avenida Acaso (805)388-3577 fax Camarillo, CA 93012
September 14, 2011
Lisa Beckham (AIR-3) via email to [email protected] EPA Region 9 75 Hawthorne Street San Francisco, CA 94105-3901
Subject: Comments Regarding the Proposed Palmdale Hybrid Power Project Prevention of Significant Deterioration Permit
Re: Permit Application No. SE 09-01
Dear Ms. Beckham:
On behalf of the City of Palmdale and Inland Energy Inc., AECOM has reviewed the proposed PSD permit for the Palmdale Hybrid Power Project (PHPP) and is providing the following comments:
1) Annual Facility Emission Limits for CO, PM, PM10 and PM2.5
The annual emission limits given in conditions X.A.1 should be revised to reflect the revised hourly BACT limits for CO as proposed by EPA (i.e., reduced from 3.0 ppm to 2.0 ppm) and for PM/PM10/PM2.5 as discussed in comment 3 below. Applicant’s proposed levels (discussed below in comment #3) result in the following revised facility annual emission levels (which are reduced from the initial PHPP application):
NOx CO PM PM10 PM2.5
Total Facility 114.9 tpy 244.1 250.3 tpy 120.1 79.1 tpy 103.5 62.5 tpy 97.0 56.0 tpy
2) Combustion Turbine Generator (CTG) NOx and CO Limits – Normal Operations
The hourly NOx and CO limits for the CTGs given in condition X.C.1 should be revised to be those listed in Table 1 below. These limits should correspond to the CTG load data given in the PHPP PSD application as provided in Appendix A, but revised to reflect the new CO ppm limits. The maximum hourly limits should correspond to the low temperature (23 °F) case in the emissions data as that is expected to be the maximum hourly concentrations for this project. It is standard practice for combined-cycle projects to use the low temperature case as the governing limit for maximum hourly values, as was done in the AVAQMD Final Determination of Compliance for the PHPP. The revised turbine load data results are attached, see highlighted maximum values.
Also, the PSD application requested that the hours of operation for the duct burners be limited to 2,000 hours each, for the two CTGs, not total combined. The AAQIR reflects that the emissions are based on this assumption (see for example, Section 7.1, page 16), and we believe the wording to be an inadvertent error. Therefore, condition X.C.2 should be revised as follows:
2. Combined hHours of operation for botheach duct burners (DB1 and DB2) shall not exceed 2,000 hours per 12-month rolling average. Permittee shall ensure that the duct burners are not operated unless the associated turbine units are in operation.

AECOM 2
Table 1 Maximum Emissions from The Combustion Turbine Generators
Emissions Limit (per CTG) (no duct burning)
Emission Limit (per CTG) (with duct burning)
NOx • 11.55 13.47
• 1-hr average
lb/hr
• 2.0 ppmvd @ 15% O2
• 14.60 16.60
• 1-hr average
lb/hr
• 2.0 ppmvd @ 15% O2
CO 3-Year Demonstration Period
• 7.65 8.20
• 1-hr average
lb/hr
• 2.0 ppmvd @ 15% O2
Post-Demonstration Period
• 5.74 6.15
• 1-hr average
lb/hr
• 1.5 ppmvd @ 15% O2
Conditions in X.C.3 may affect the timing and applicablilityof post-demonstration period emission limits.
• 8.90 10.10
• 1-hr average
lb/hr
• 2.0 ppmvd @ 15% O2
PM, PM10, PM2.5
• 0.0027 lb/MMBtu
• 4.7 9.0 lb/hr
• 3-hr average
• PUC-quality natural gas (Sulfur content of no greater than 0.20 grains per 100 dscf on a 12-month average and not greater than 1.0 gr/dscf at any time)
• 0.0035 lb/MMBtu
• 8.0 14.0 lb/hr
• 3-hr average
• PUC-quality natural gas (Sulfur content of no greater than 0.20 grains per 100 dscf on a 12-month average and not greater than 1.0 gr/dscf at any time)
GHG • 774 lb CO2/MWh source-wide net output
• 117 lb CO2/MMBtu heat input, each GEN1/DB1 and GEN2/DB2
• 30-day rolling average
The CO limits in Condition X.C.3 should be revised to be consistent with the CO emission limits shown in Table 1, i.e., in (a.) revise 5.74 lb/hr to be 6.15 lb/hr; in (b.) revise 8.90 lb/hr and 7.65 lb/hr to be 10.10 and 8.20 lb/hr respectively; and in (c.iii and c.iv) revise 5.74 lb/hr and 8.90 lb/hr to be 6.15 and 10.10 lb/hr respectively.
3) Turbine PM Limits
The Applicant disagrees with EPA’s findings on BACT for PM, PM10 and PM2.5 as shown in Table 1 above, and believes that the proposed limits are not achievable. These limits are significantly lower than the emissions guarantees provided by General Electric (GE) for the model GE 7FA combustion turbines that have been proposed for the PHPP.

AECOM 3
The BACT analysis for the Project provided by EPA in the Fact Sheet and Ambient Air Quality Impact Report (AAQIR) evaluated total particulate emissions, filterable plus condesable. The AAQIR (Section 7.1.3) states that since BACT analyses completed prior to January 1, 2011 included only limits for filterable PM1
The basis for EPA’s proposed PHPP PM limits
, EPA relied on the most recently permitted projects with total PM limits, Warren County Power Station in Virginia, and Chouteau Power Plant in Oklahoma.
without duct burners
AECOM does not agree that the specific limits for this project should be considered as the basis for the PM limits of the PHPP without duct firing. This facility has not yet been constructed and has not demonstrated compliance with the proposed PM limits. The PHPP is not installing Mitusbishi turbines as is Warren County Power Station, and differences in the equipment and the specific manufacturer’s guarentees should be taken into consideration. We do agree with using the manufacturer’s guarantee as the basis for the limit.
is the Warren County Power Station in Virginia. AECOM contacted Mr. Janardan Pandey, Air Permits Manager at the Valley Regional Office of the Virgina Department of Environmental Quality regarding the Warren County Power Station. He informed us that the station has not yet been constructed, and although the station originally considered installing two GE 7FA turbines, the updated permit reflects the three Mitsubishi M501 GAC turbines they now intend to install. The PM emission limits issued in the permit for this facility were based on the manufacturer’s guarantee for this specific turbine. Emission limits for this facility are given in terms of both lb/hr and lb/MMBtu: 8 lb/hr or 0.0027 lb/MMBtu without duct burning and 14 lb/hr or 0.0040 lb/MMBtu with duct burning.
The basis for EPA’s proposed PHPP PM limits with duct burners
The testing conducted in May 2011 at this facility was referenced in the PHPP AAQIR, and states that Chouteau’s total PM emissions are equivalent to 0.0029 lb/MMBtu while duct burners are operating, and are therefore meeting their limit of 0.0035 lb/MMBtu. However, AECOM reviewed the May test report and the 0.0029 lb/MMBtu test value appears to have been for only one run from one unit. The testing report shows results from nine runs between the two units and at different loads. The referenced run is the only run that was below the 0.0035 lb/MMBtu limit, two runs were equal to the limit. Averages of the 3 runs for each hourly test show that two of the three tests are not in compliance with the proposed lb/MMBtu limit. A summary of the May stack test results are shown in Table 3. Note, it does not appear that the duct burners were operating during any of these tests.
is the Chouteau Power Plant in Oklahoma. This permit does not provide a separate limit without duct burning. The Chouteau Plant has installed two Siemens Model V84.3A turbines which only became operational this year. AECOM contacted the permit writer, Mr. Eric Milligan, at Oklahoma Department of Environmental Quality. Although the AAQIR for PHPP indicated that the facilitiy had demonstrated compliance with the permit limits, AECOM was told that more recent stack tests had determined that Chouteau was not in compliance with their PM limits. As shown below in Table 2, the July 2011 stack test report found that PM10 was not in compliance with the permit limits.
We were also told by Mr. Milligan that the permit limits in the permit are not what Chouteau had intended. They had intended to request permit limits of 10.56 lb/hr and 0.0056 lb/MMBtu, but somehow an error was made and the permit gave limits of 6.59 lb/hr and 0.0035 lb/MMBtu. Mr. Milligan informed AECOM
1 We believe this statement to be incorrect, as all combined-cycle permits in California as well as other states within EPA Region 9 for more than the past decade have been permitted with PM10 limits that account for condensable as well as filterable particulate.

AECOM 4
that the basis for the permit limits was the stack testing of a similar unit. We were also told the facility does not believe these limits are achievable. We do not agree with using limited testing data from other facilities as the basis for setting permit limits.
Table 2. July Stack Test Results - Chouteau Power Plant
Unit / Condition
PM10total Test
Average
Permit limits – PM10total
PM10total Test
Average
Permit limits – PM10total
In Compliance?
lb/MMBtu lb/MMBtu lb/hr lb/hr
Unit 21 – 60% CT 0.0050
0.0035
6.21
6.59
lb/hr – Yes lb/MMBtu – No
Unit 21 – 100% CT, 70% DB 0.0055 10.0 No
Unit 21 – 100% CT, 100% DB 0.0068 12.7 No
Unit 22 – 100% CT, 70% DB 0.0074 13.3 No
Unit 22 – 100% CT, 100% DB 0.0049 9.14 No
More than 10 years ago, EPA promulgated source test Method 202 that is to be used in conjunction with Method 5 or 201A to measure the condensable portion of the PM emissions. Late last year (12/2010), a new Method 202 was adopted which uses a water-jacketed condenser system to cool the stack gas, which reduces the amount of condensable PM formed in the sample. It is AECOM’s understanding that agencies expect that the tested emission levels will be lower when this revised source test Method 202 is used. While the new Method 202 provides more accurate results, it is mainly an improvement for facilities with relatively high sulfur content in the gas. PHPP has proposed the extremely low sulfur limit of 0.02 grains per 100 dry standard cubic feet of gas. Therefore, the new Method 202 is not expected to provide dramatically different results over the previous method. We also note that test results for PM emissions from combustion turbines tend to display a significant variability, as demonstrated in the results shown in Tables 2 and 3, as well as other test data from similar facilities. Therefore, we also do not think it is realistic to base permit limits on a limited amount of test data at a facility in a different location, and in some cases with different equipment, as being conclusive that a facility can meet stringent limits over a variety of conditions and as the units age.
A manufacturer’s guarantee takes these sorts of issues into consideration. GE has reviewed a significant amount of source test data specific to GE 7FAs. Anecdotally, the early results of GE’s reviews showed that initially there was scarce test data available and the most statistically significant variable in the test results for PM was the company performing the source tests. Because of this relatively huge variability, GE set their guarantee levels high, and there are combined-cycle projects with GE 7FAs that were permitted with total PM10 emission levels per CTG of over 30 lb/hr depending on the size of the duct burners. However, as more careful testing procedures were used and more GE 7FA units started operation, lower limits are being proposed for these units.

AECOM 5
Table 3. May Stack Test Results - Chouteau Power Plant
Unit / Condition
PM10total Test
Average
Permit limits – PM10total
PM10total Test
Average
Permit limits – PM10total
In Compliance?
lb/MMBtu lb/MMBtu lb/hr lb/hr
Unit 21, Run 1 – 100% CT 0.0036
0.0035
6.01
6.59
Yes
Unit 21, Run 2 – 100% CT 0.0029 4.70
Unit 21, Run 3 – 100% CT 0.0035 5.56
Average 0.0033 5.42
Unit 22, Run 1 – 100% CT 0.0042
0.0035
7.09
6.59
lb/hr – Yes lb/MMBtu – No
Unit 22, Run 2 – 100% CT 0.0035 5.68
Unit 22, Run 3 – 100% CT 0.0040 6.52
Average 0.0039 6.43
Unit 22, Run 1 – 60% CT 0.0056
0.0035
6.97
6.59
lb/hr – Yes lb/MMBtu – No
Unit 22, Run 2 – 60% CT 0.0043 5.41
Unit 22, Run 3 – 60% CT 0.0048 6.15
Average 0.0049 6.18
We note that since the only control technologies in use on modern combined-cycle turbines for control of PM/PM10/PM2.5 emissions are the use of low-sulfur, pipeline quality natural gas and good combustion practices, a facility has little control over the emission rate and is reliant on the manufacturer’s guarantee. Unlike the situation where there is an add-on control technology, such as SCR or an oxidation catalyst, the operator has little ability to make changes to the turbine operation to reduce the emissions if the test results show non-compliance. Therefore, giving very stringent limits does little in actual air quality protection (and in some respects, is less protective since then fewer offsets are required). Some applicants have taken a strategy of proposing very low PM10 limits as a way to reduce the number of offsets that must be provided. The fact that these applicants are willing to accept a compliance risk to reduce their requirements should not be imposed on other operators. If the limit is below the manufacturer’s guarantee, the operator has no recourse if the unit is not compliant. We therefore believe that BACT should be set based on a manufacturer’s guarantee, unless there is substantial evidence that a facility will be able to meet a more stringent limit on a long term basis, and should not be forced to accept a limit which creates a risk for the facility without any true air quality benefit.

AECOM 6
With this philosophy in mind, the Applicant and AECOM approached GE to determine if a lower PM10/PM2.5 emissions guarantee than previously provided can be offered on GE 7FA units with Rapid Start Process (RSP) technology. When permitting was initiated on this project in 2007-2008, the RSP was still only in the pilot test phase and the standard GE guarantee on the 7FAs was 18 lb/hr for total (front filterable plus back condensables) PM. Since this guarantee did not include duct burners, the PHPP proposed limit of 18 lb/hr was below the guarantee level, but was consistent with the PM10 limits for the Victorville 2 Hybrid Power Project which was permitted by EPA Region 9 in 2010. Subsequent to issuance of the PHPP proposed PSD permit, we have been unable to obtain information from GE regarding lower guarantee levels. However, we are aware that projects have been permitted with lower PM10 emission limits, such as the Avenal permit recently (June 2011) issued by EPA Region 9, with a PM10 limit of 11.78 lb/hr for GE 7FAs.
AECOM is also familiar with other existing/operational facilities with GE 7FAs. For instance, Elk Hills Power and Palomar Energy Center which have maximum PM10 limits of 15 lb/hr and 14 lb/hr, respectively (no separate limits for with or without duct burners). Elk Hills Power originally had PM10 limits of 16.2 lb/hr, but applied to EPA Region 9 in 2003 to reduce its PM10 limits to 15 lb/hr after a careful review of available source test data. It’s our understanding that a recent source test of this facility had average results in excess 12 lb/hr, which means that an individual test was even higher. We also obtained input from Florida Power & Light’s (FPL) on the Manatee facility; this facility does not have specific PM/PM10 limits, but FPL estimates that the PM10 emissions when duct buring are about 17 lb/hr. As noted above, the Warren County Power Station has a maximum PM10 limit of 14 lb/hr based on a manufacturer (Mitsubishi) guarantee. Lastly, the Chouteau facility has turbines from a different manufacturer (Siemens); since this power plant has only recently began operation, it is assumed to have the latest gas turbine technology, but had average
Since most facilities permitted thus far do not have separate emission limits when not duct firing, there is less stack test information available related to PM10 emissions when not duct burning. FPL estimates that the emissions for the Manatee facility when not duct firing are on the order of 11 lb/hr. Chouteau has test results of an average of up to 7.1 lb/hr, meaning individual tests were higher. Warren County Power Station has a Mitsubishi manufacturer’s guarantee of 8 lb/hr. The recently issued Avenal PSD permit has a PM10 limit of 8.91 lb/hr. We propose to base the PM/PM10/PM2.5 limit for PHPP without duct burning on Avenal, but with slight increase for greater assurance of compliance, and propose a PM limit of 9 lb/hr without duct buring for PHPP. If we are able to obtain additional information from GE or others that would support lower limits, in particular manufacturer’s guarantees, we will provide these data to EPA Region 9.
test results of up to13.3 lb/hr. Based on this information that AECOM has compiled in the last month since the issuance of the proposed PHPP PSD permit, and without yet having obtained updated guarantee information from GE, we propose PM/PM10/PM2.5 limits of 14 lb/hr with duct burning for PHPP.
As an additional issue, we do not see the need for both lb/hr and lb/MMBtu emission limits for PM10/PM2.5 for PHPP. Compliance with these limits is determined by averaging the results of 3 source tests conducted over one hour each. It is not possible to hold the units at exactly the same heat rate over a single hourly test, much less over 3 hourly tests. These gas-fired units are not required to be continuously monitored, and the test results will be targeted to be at as close to 100% load as possible. The vendor guarantee for the GE 7FA is given as a maximum lb/hr emission rate. The majority (if not all) of the combined-cycle projects previously permitted by EPA Region 9, including Avenal which was permitted only a couple of months before this proposed permit, have had only a lb/hr limit for PM/PM10/PM2.5. Given that: i) the test accuracy is not sufficient; ii) compliance will generally be determined near the maximum heat rate only; iii) there is nothing the operator can do to adjust the emissions for different heat rates; and iv) the vendor guarantee is in lb/hr, a lb/MMBtu limit is unnecessary and provides no additional air quality protection. Additional limits that provide no benefit should be deleted as they create additional regulatory burden and risk.

AECOM 7
4) Greenhouse Gas (GHG) Limits
Condition X.A.1 contains the facility wide GHG annual emission limits for GHG (in tons per year of CO2 equivalent (CO2e) emissions). Condition X.C.1 of the proposed PSD permit contains both a lb CO2/MMBtu and a lb CO2/MWh limit for GHG. We believe that the CO2 emission limit of 774 lb CO2/MWh listed in this condition is a redundant emission limit and provides no compliance benefit beyond that established by the emission limit of 117 lb CO2/MMBtu. The 117 lb CO2/MMBtu emission limit is essentially the EPA default emission factor for CO2 for natural gas combustion of 53.02 kg CO2/MMBtu with a units conversion applied, and rounded to three significant figures (40CFR 98 subpart C, Table C-1). This emission factor is based on the U.S. average high heating value (HHV) for natural gas of 1,028 Btu/scf. We agree that this emission factor constitutes a reasonable emission limitation for the PHPP. However, we fail to see the benefit of the emission limitation of 774 lb CO2/MWh. This MWh-based emission limitation is derived from the EPA emission factor of 117 lb/MMBtu, the expected annual output of 563 MW at the assumed heat rate and 8,760 hours of operation. The actual MW output will vary depending on the actual ambient (e.g., temperature and relative humidy) conditions under which operations occur over the year. Compliance tracking for the 774 lb CO2/MWh emission limit would be based on CEMS monitoring that is conducted on an hourly basis. But such monitoring will also be used to ensure compliance with the 117 lb CO2/MMBtu emission limit upon which the 774 lb CO2/MWh emission limit is based. If compliance with the 117 lb CO2/MMBtu is demonstrated on an ongoing basis through CEMS, then the annual 774 lb CO2/MWh emission limit will not be exceeded. Furthermore, condition X.A.1 already limits the annual GHG CO2e emissions. Compliance with the 117 lb CO2/MMBtu limit can be tracked since the heat rate will be monitored. However, the 774 lb CO2/MWh rate is dependant on other variables and is not a standardized measure. Therefore, we request that the 774 lb CO2/MWh limit be removed from the proposed PSD permit. Additional limits that provide no benefit should be deleted as they create additional regulatory burden and risk.
5) GasTurbine NOx and CO Limits – Startup and Shutdown
Startup limits for NOx and CO were proposed by the Applicant for the PHPP CTGs as lb/event emission rates as guaranteed by the manufacturer (GE). However, the proposed PHPP permit includes lb/hr emission limits that assume the lb/event emissions are spread equally over the duration of the startup event. These hourly emission limits are not achievable during startup. A typical emissions profile for a CTG is that most of the emissions during startup will occur in the first hour, as the unit is warming up and the load is increasing.
We assume that EPA has proposed hourly limits as well as lb/event limits to ensure compliance with the 1-hour NO2 NAAQS that became effective in April 2010. For its analysis of compliance with the 1-hour NO2 NAAQS, the Applicant analyzed a scenario that assumed that 65 lb/hr of NOx would be emitted during a shutdown event. Even though very conservative assumptions were made with respect to the stack parameters and emissions duing this time, the scenario was shown to be in compliance with the standard. Given that we did not perform analyses of other startup scenarios, we propose that the NOx limit of 52.4 lb/hr per CTG during a cold start be revised to be a limit of 130 lb/hr from both CTGs combined. This limit is expected to be sufficient, although further information has been requested from GE. Should GE’s information indicate that higher limits may be needed, then further analyses would be performed to demonstrate that compliance with the applicable NAAQS will be maintained.
While the modeling result for the shut down scenario with respect to the 1-hour NO2 NAAQS was close to the standard, the CO modeling results were all well below the Significant Impact Levels, and hence there is no possibility that compliance with the 1-hour CO NAAQS will not be maintained even if the entire lb/event emissions levels were emitted in the first hour. Therefore, the lb/hr limits for CO are unnecessary

AECOM 8
and should be deleted. Likewise, the lb/hr limits for the warm/hot startup and shutdown are unnecessary and should be deleted. The proposed changes to the permit are shown in Table 4.
The PHPP is proposing to include the RSP to significantly reduce the emissions during startup. For instance, the NOx and CO emissions for PHPP are less than half of the cold startup emission rates recently permitted for Avenal. It is unreasonable to include these additional limits on a project that will have significantly superior performance than other projects. Additional limits that provide no benefit or are unnecessary to ensure compliance should be deleted as they create additional regulatory burden and risk.
Table 4. Proposed Startup and Shutdown Limits
NOx CO
(per CTG) Duration
(per CTG)
Cold Startup 52.4 lb/hr
96 lb/event
224 lb/hr
410 lb/event 110 minutes
Warm and Hot Startup 30 lb/hr
40 lb/event
247 lb/hr
329 lb/event 80 minutes
Shutdown 114 lb/hr
57 lb/event
674 lb/hr
337 lb/event 30 minutes
Cold Startup (both CTGs combined)
-- -- 130 lb/hr
6) Cooling Tower Source Testing
Condition X.G.1.a.v. requires that PM, PM10, and PM2.5 emissions from the cooling tower be tested within 60 days after achieving normal operation, but not later than 180 days after the intitial startup of equipment, and, unless otherwise specified, annually thereafter. We believe source testing of the cooling tower is unreasonable and should not be required. PHPP is making the very conservative assumption that all total dissolved solids (TDS) emitted from the cooling tower are emitted as PM10 and PM2.5. Based on prior discussions with EPA Region 9, only towers that assume less than 100% of TDS is emitted as PM10 and PM2.5 might be subject to this requirement. We know of no other projects that have made this 100% assumption and have this testing requirement. There are many combined-cycle projects permitted which assume only 50%, 33% or even as low as 10% of the TDS will be emitted as PM10, and these projects are not required to test the cooling tower.
Cooling tower testing is very difficult and costly to perform, and does not provide very accurate data due to these difficulties. When we looked into this requirement in the past (for the Victorville 2 Hybrid Power Project), we were told that there is only one testing firm in the U.S. (located in Kansas) that is able to perform this testing. Testing of a full size cooling tower is quite challenging because of the probe size and the fact that the testing is done on the exhaust plume outside where the concentrations will be influenced by wind. The exhaust plume/stream is saturated which means that testing for PM10 and PM2.5 cannot be done to quantify each size range specifically. The PSD permit requires the use of Modified Method 306, which measures PM only. A method such as EPA Method 201A, which provides particulate size distribution, would not work since the cyclones on the head of the probe only work when moisture is in the vapor state.

AECOM 9
The PM data from this testing is expected to not be very accurate and will be difficult and costly to obtain. Since information on the size distribution will not be provided, and since the actual emissions are likely to be half or less of the levels assumed in the modeling analysis, the information will not be useful for verifying compliance. Therefore, we request that all requirements to test the cooling tower be deleted from the PSD permit.
7) Compliance Testing and Monitoring
We request that some of the compliance testing and monitoring proposed in the PSD permit be consistent with the AVAQMD Final Determination of Compliance (FDOC)/Authority to Construct (ATC) permit. The AVAQMD FDOC/ATC permit has been incorporated into the California Energy Commission (CEC) Final Decision, issued in August 2011. We request that the PSD permit be revised to be consistent with the CEC conditions of certification (COC) as follows:
• Condition X.G.3.a of the proposed PSD permit requires the Permittee to take monthly samples of the natural gas to be analyzed for the sulfur content. COC AQT-2 of the CEC Decision allows that the laboratory analysis from the fuel supplier that shows the sulfur content of the natural gas can be used in lieu of collecting monthly samples. We request that the proposed PSD permit include this option of using natural gas sulfur content data obtained from the fuel supplier for demonstration of compliance.
• Per AQAB-8 and AQHH-7 in the CEC Decision, the auxiliary boiler and HTF heater, are required to install hour meters to indicate elapsed operating time. Condition X.H.1 of the proposed PSD permit states the Permittee shall install flow meters for Unit D1 the auxiliary boiler and Unit D4 the auxiliary heater. Condition X.H.2 also requires an hour meter on Units D1 and D4. We do not believe that both a fuel meter and an hour meter are necessary for these equipment since the equipment will only be used for limited hours during the year and as support equipment. We request that for consistency with the AVAQMD and CEC permits, only hour meters be required.
We appreciate EPA Region 9’s consideration of these comments on the proposed PSD permit. Please contact Sara Head at 805-388-3775 if you have any questions about these comments or other items related to the PSD permit for the PHPP.
Sincerely
Sara J. Head, QEP Richard Hamel Project Manager Air Quality Specialist
Attachment: Revised CTG Performance Data Analysis
cc: Laurie Lile, City of Palmdale Tom Barnett, Inland Energy Mike Carroll, Latham & Watkins LLP

Table 1 Emissions from Gas Turbine at Different Loads
PHPP Appendix B, Emissions CalculationsPage 1 of 2
H2SO4 PM10
Case Name Case No. Ambient temp., F
Relative humidity
CT Operating
Combustion Turbine Load
Duct Burner Fired/Unfired Solar Evap. Cooling
CTG Heat Input (HHV) (total:
both turbines)
Duct Burner Heat Input (HHV) (total: both DBs)
NOx NOxNOx
Reduction Required
NOx CO CO CO permit limitCO
Reduction Required
CO
CO emissions at permit
limit
VOC VOCVOC
Reduction Required
VOC SO2 SO2 SO2 H2SO4PM10 (front
& back)
CTG Inlet Air Cooler MMBtu/h MMBtu/hppmvd@15%
O2
ppmvd@15% O2 % lb/h as NO2
ppmvd@15% O2
ppmvd@15% O2
ppmvd@15% O2 % lb/h lb/hr
ppmvd@15% O2
ppmvd@15% O2 % lb/h as CH4
ppmvd@15% O2
ppmvd@15% O2 lb/h lb/hr lb/h
Case PB-1 PB23UN 23 92% 2 100% Unfired No Solar Cooler Off 3,718.36 0.00 9.0 2.0 77.8% 13.47 7.5 3.0 2.0 59.9% 12.3 8.20 1.3 2.0 none 4.7 0.112 0.112 1.05 0.400 9.0Case PB-2 PB59UN 59 60% 2 100% Unfired No Solar Cooler On 3,530.74 0.00 9.0 2.0 77.8% 12.79 7.4 3.0 2.0 59.5% 11.7 7.78 1.3 2.0 none 4.5 0.112 0.112 0.99 0.380 9.0Case PB-3 PB64UN 64 40% 2 100% Unfired No Solar Cooler On 3,527.74 0.00 9.0 2.0 77.8% 12.77 7.4 3.0 2.0 59.5% 11.7 7.78 1.3 2.0 none 4.5 0.112 0.112 0.99 0.380 9.0Case PB-4 PB98UN 98 17% 2 100% Unfired No Solar Cooler On 3,394.04 0.00 9.0 2.0 77.8% 12.29 7.4 3.0 2.0 59.2% 11.2 7.48 1.3 2.0 none 4.3 0.112 0.112 0.95 0.365 9.0Case PB-5 PB108UN 108 13% 2 100% Unfired No Solar Cooler On 3,360.48 0.00 9.0 2.0 77.8% 12.17 7.3 3.0 2.0 59.1% 11.1 7.41 1.3 2.0 none 4.2 0.112 0.112 0.95 0.362 9.0Case PB-6 PB23US 23 92% 2 100% Unfired Max Solar Cooler Off 3,718.36 0.00 9.0 2.0 77.8% 13.47 7.5 3.0 2.0 59.9% 12.3 8.20 1.3 2.0 none 4.7 0.112 0.112 1.05 0.400 9.0Case PB-7 PB59US 59 60% 2 100% Unfired Max Solar Cooler On 3,530.74 0.00 9.0 2.0 77.8% 12.79 7.4 3.0 2.0 59.5% 11.7 7.78 1.3 2.0 none 4.5 0.112 0.112 0.99 0.380 9.0Case PB-8 PB64US 64 40% 2 100% Unfired Max Solar Cooler On 3,527.74 0.00 9.0 2.0 77.8% 12.77 7.4 3.0 2.0 59.5% 11.7 7.78 1.3 2.0 none 4.5 0.112 0.112 0.99 0.380 9.0Case PB-9 PB98US 98 17% 2 100% Unfired Max Solar Cooler On 3,394.04 0.00 9.0 2.0 77.8% 12.29 7.4 3.0 2.0 59.2% 11.2 7.48 1.3 2.0 none 4.3 0.112 0.112 0.95 0.365 9.0
Case PB-10 PB108US 108 13% 2 100% Unfired Max Solar Cooler On 3,360.48 0.00 9.0 2.0 77.8% 12.17 7.3 3.0 2.0 59.1% 11.1 7.41 1.3 2.0 none 4.2 0.112 0.112 0.95 0.362 9.0Case PB-11 PB23FS 23 92% 2 100% Fired Max Solar Cooler Off 3,718.36 244.39 9.8 2.0 79.6% 14.35 9.8 4.0 2.0 59.2% 17.5 8.73 1.7 2.0 none 5.0 0.105 0.112 1.11 0.427 14.0Case PB-12 PB59FS 59 60% 2 100% Fired Max Solar Cooler On 3,530.74 247.68 9.9 2.0 79.7% 13.68 9.9 4.0 2.0 59.6% 16.7 8.33 1.7 2.0 none 4.8 0.104 0.112 1.06 0.407 14.0Case PB-13 PB64FS 64 40% 2 100% Fired Max Solar Cooler On 3,527.74 248.29 9.9 2.0 79.7% 13.67 9.9 4.0 2.0 59.6% 16.6 8.32 1.7 2.0 none 4.8 0.104 0.112 1.06 0.406 14.0Case PB-14 PB98FS 98 17% 2 100% Fired Max Solar Cooler On 3,394.04 256.78 9.9 2.0 79.8% 13.21 10.0 4.0 2.0 60.1% 16.1 8.05 1.7 2.0 none 4.6 0.104 0.112 1.03 0.393 14.0Case PB-15 PB108FS 108 13% 2 100% Fired Max Solar Cooler On 3,360.48 258.69 9.9 2.0 79.9% 13.10 10.1 4.0 2.0 60.3% 16.0 7.98 1.7 2.0 none 4.6 0.104 0.112 1.02 0.390 14.0Case PB-16 PB23FN 23 92% 2 100% Fired No Solar Cooler Off 3,718.36 870.03 11.5 2.0 82.6% 16.60 14.7 4.0 2.0 72.7% 20.2 10.10 2.5 2.0 20.8% 5.8 0.091 0.112 1.29 0.494 14.0Case PB-17 PB59FN 59 60% 2 100% Fired No Solar Cooler On 3,530.74 901.38 11.7 2.0 82.9% 16.03 15.1 4.0 2.0 73.6% 19.5 9.76 2.6 2.0 23.6% 5.6 0.089 0.112 1.25 0.477 14.0Case PB-18 PB64FN 64 40% 2 100% Fired No Solar Cooler On 3,527.74 903.59 11.7 2.0 82.9% 16.03 15.2 4.0 2.0 73.6% 19.5 9.76 2.6 2.0 23.7% 5.6 0.089 0.112 1.25 0.477 14.0Case PB-19 PB98FN 98 17% 2 100% Fired No Solar Cooler On 3,394.04 953.83 11.9 2.0 83.2% 15.72 15.7 4.0 2.0 74.5% 19.1 9.57 2.7 2.0 26.6% 5.5 0.087 0.112 1.22 0.468 14.0Case PB-20 PB108FN 108 13% 2 100% Fired No Solar Cooler On 3,360.48 960.29 11.9 2.0 83.2% 15.62 15.8 4.0 2.0 74.7% 19.0 9.51 2.7 2.0 27.1% 5.4 0.087 0.112 1.22 0.465 14.0Case PB-21 PB23UN_1x100 23 92% 1 100% Unfired No Solar Cooler Off 1,859.18 0.00 9.0 2.0 77.8% 13.47 7.5 3.0 2.0 59.9% 12.3 8.20 1.3 2.0 none 4.7 0.112 0.112 1.05 0.400 9.0Case PB-22 PB59UN_1x100 59 60% 1 100% Unfired No Solar Cooler On 1,765.37 0.00 9.0 2.0 77.8% 12.79 7.4 3.0 2.0 59.5% 11.7 7.78 1.3 2.0 none 4.5 0.112 0.112 0.99 0.380 9.0Case PB-23 PB64UN_1x100 64 40% 1 100% Unfired No Solar Cooler On 1,763.87 0.00 9.0 2.0 77.8% 12.77 7.4 3.0 2.0 59.5% 11.7 7.78 1.3 2.0 none 4.5 0.112 0.112 0.99 0.380 9.0Case PB-24 PB98UN_1x100 98 17% 1 100% Unfired No Solar Cooler On 1,697.02 0.00 9.0 2.0 77.8% 12.29 7.4 3.0 2.0 59.2% 11.2 7.48 1.3 2.0 none 4.3 0.112 0.112 0.95 0.365 9.0Case PB-25 PB108UN_1x10
0108 13% 1 100% Unfired No Solar Cooler On 1,680.24 0.00 9.0 2.0 77.8% 12.17 7.3 3.0 2.0 59.1% 11.1 7.41 1.3 2.0 none 4.2 0.112 0.112 0.95 0.362 9.0
Case PB-26 PB23US_1x100 23 92% 1 100% Unfired Max Solar Cooler Off 1,859.18 0.00 9.0 2.0 77.8% 13.47 7.5 3.0 2.0 59.9% 12.3 8.20 1.3 2.0 none 4.7 0.112 0.112 1.05 0.400 9.0Case PB-27 PB59US_1x100 59 60% 1 100% Unfired Max Solar Cooler On 1,765.37 0.00 9.0 2.0 77.8% 12.79 7.4 3.0 2.0 59.5% 11.7 7.78 1.3 2.0 none 4.5 0.112 0.112 0.99 0.380 9.0Case PB-28 PB64US_1x100 64 40% 1 100% Unfired Max Solar Cooler On 1,763.87 0.00 9.0 2.0 77.8% 12.77 7.4 3.0 2.0 59.5% 11.7 7.78 1.3 2.0 none 4.5 0.112 0.112 0.99 0.380 9.0Case PB-29 PB98US_1x100 98 17% 1 100% Unfired Max Solar Cooler On 1,697.02 0.00 9.0 2.0 77.8% 12.29 7.4 3.0 2.0 59.2% 11.2 7.48 1.3 2.0 none 4.3 0.112 0.112 0.95 0.365 9.0Case PB-30 PB108US_1x10
0108 13% 1 100% Unfired Max Solar Cooler On 1,680.24 0.00 9.0 2.0 77.8% 12.17 7.3 3.0 2.0 59.1% 11.1 7.41 1.3 2.0 none 4.2 0.112 0.112 0.95 0.362 9.0
Case PB-31 PB23FS_1x100 23 92% 1 100% Fired Max Solar Cooler Off 1,859.18 277.25 10.7 2.0 81.3% 15.46 12.4 4.0 2.0 67.7% 18.8 9.41 2.1 2.0 5.9% 5.4 0.097 0.112 1.20 0.460 14.0Case PB-32 PB59FS_1x100 59 60% 1 100% Fired Max Solar Cooler On 1,765.37 277.25 10.8 2.0 81.5% 14.78 12.6 4.0 2.0 68.2% 18.0 9.00 2.2 2.0 7.6% 5.2 0.096 0.112 1.15 0.440 14.0Case PB-33 PB64FS_1x100 64 40% 1 100% Fired Max Solar Cooler On 1,763.87 277.25 10.8 2.0 81.5% 14.77 12.6 4.0 2.0 68.2% 18.0 8.99 2.2 2.0 7.6% 5.2 0.096 0.112 1.15 0.439 14.0Case PB-34 PB98FS_1x100 98 17% 1 100% Fired Max Solar Cooler On 1,697.02 277.25 10.8 2.0 81.6% 14.29 12.7 4.0 2.0 68.5% 17.4 8.70 2.2 2.0 9.0% 5.0 0.096 0.112 1.11 0.425 14.0Case PB-35 PB108FS_1x100 108 13% 1 100% Fired Max Solar Cooler On 1,680.24 277.25 10.9 2.0 81.6% 14.16 12.7 4.0 2.0 68.6% 17.2 8.62 2.2 2.0 9.3% 4.9 0.096 0.112 1.10 0.421 14.0Case PB-36 PB23FN_1x100 23 92% 1 100% Fired No Solar Cooler Off 1,859.18 521.23 11.9 2.0 83.2% 17.22 15.8 4.0 2.0 74.7% 21.0 10.48 2.7 2.0 26.5% 6.0 0.087 0.112 1.34 0.512 14.0Case PB-37 PB59FN_1x100 59 60% 1 100% Fired No Solar Cooler On 1,765.37 521.23 12.0 2.0 83.3% 16.54 16.1 4.0 2.0 75.1% 20.1 10.07 2.8 2.0 28.1% 5.8 0.086 0.112 1.29 0.492 14.0Case PB-38 PB64FN_1x100 64 40% 1 100% Fired No Solar Cooler On 1,763.87 521.23 12.0 2.0 83.3% 16.53 16.1 4.0 2.0 75.1% 20.1 10.06 2.8 2.0 28.1% 5.8 0.086 0.112 1.29 0.492 14.0Case PB-39 PB98FN_1x100 98 17% 1 100% Fired No Solar Cooler On 1,697.02 521.23 12.1 2.0 83.5% 16.04 16.3 4.0 2.0 75.5% 19.5 9.77 2.8 2.0 29.3% 5.6 0.085 0.112 1.25 0.478 14.0Case PB-40 PB108FN_1x100 108 13% 1 100% Fired No Solar Cooler On 1,680.24 521.23 12.1 2.0 83.5% 15.92 16.4 4.0 2.0 75.6% 19.4 9.69 2.8 2.0 29.6% 5.6 0.085 0.112 1.24 0.474 14.0Case PB-41 PB23UN_2x75 23 92% 2 75% Unfired No Solar Cooler Off 3,028.45 0.00 9.0 2.0 77.8% 10.97 7.3 3.0 2.0 58.7% 10.0 6.68 1.2 2.0 none 3.8 0.112 0.112 0.85 0.326 9.0Case PB-42 PB59UN_2x75 59 60% 2 75% Unfired No Solar Cooler Off 2,848.27 0.00 9.0 2.0 77.8% 10.31 7.3 3.0 2.0 59.0% 9.4 6.28 1.2 2.0 none 3.6 0.112 0.112 0.80 0.307 9.0Case PB-43 PB64UN_2x75 64 40% 2 75% Unfired No Solar Cooler Off 2,823.23 0.00 9.0 2.0 77.8% 10.22 7.3 3.0 2.0 59.1% 9.3 6.22 1.2 2.0 none 3.6 0.112 0.112 0.79 0.304 9.0Case PB-44 PB98UN_2x75 98 17% 2 75% Unfired No Solar Cooler Off 2,622.45 0.00 9.0 2.0 77.8% 9.50 7.3 3.0 2.0 59.2% 8.7 5.78 1.2 2.0 none 3.3 0.112 0.112 0.74 0.282 9.0Case PB-45 PB108UN_2x75 108 13% 2 75% Unfired No Solar Cooler Off 2,553.39 0.00 9.0 2.0 77.8% 9.25 7.4 3.0 2.0 59.5% 8.4 5.63 1.3 2.0 none 3.2 0.112 0.112 0.72 0.275 9.0Case PB-46 PB23US_2x75 23 92% 2 75% Unfired Max Solar Cooler Off 3,028.45 0.00 9.0 2.0 77.8% 10.97 7.3 3.0 2.0 58.7% 10.0 6.68 1.2 2.0 none 3.8 0.112 0.112 0.85 0.326 9.0Case PB-47 PB59US_2x75 59 60% 2 75% Unfired Max Solar Cooler Off 2,848.27 0.00 9.0 2.0 77.8% 10.31 7.3 3.0 2.0 59.0% 9.4 6.28 1.2 2.0 none 3.6 0.112 0.112 0.80 0.307 9.0Case PB-48 PB64US_2x75 64 40% 2 75% Unfired Max Solar Cooler Off 2,823.23 0.00 9.0 2.0 77.8% 10.22 7.3 3.0 2.0 59.1% 9.3 6.22 1.2 2.0 none 3.6 0.112 0.112 0.79 0.304 9.0Case PB-49 PB98US_2x75 98 17% 2 75% Unfired Max Solar Cooler Off 2,622.45 0.00 9.0 2.0 77.8% 9.50 7.3 3.0 2.0 59.2% 8.7 5.78 1.2 2.0 none 3.3 0.112 0.112 0.74 0.282 9.0Case PB-50 PB108US_2x75 108 13% 2 75% Unfired Max Solar Cooler Off 2,553.39 0.00 9.0 2.0 77.8% 9.25 7.4 3.0 2.0 59.5% 8.4 5.63 1.3 2.0 none 3.2 0.112 0.112 0.72 0.275 9.0Case PB-51 PB23UN_1x75 23 92% 1 75% Unfired No Solar Cooler Off 1,514.23 0.00 9.0 2.0 77.8% 10.97 7.3 3.0 2.0 58.7% 10.0 6.68 1.2 2.0 none 3.8 0.112 0.112 0.85 0.326 9.0Case PB-52 PB59UN_1x75 59 60% 1 75% Unfired No Solar Cooler Off 1,424.13 0.00 9.0 2.0 77.8% 10.31 7.3 3.0 2.0 59.0% 9.4 6.28 1.2 2.0 none 3.6 0.112 0.112 0.80 0.307 9.0Case PB-53 PB64UN_1x75 64 40% 1 75% Unfired No Solar Cooler Off 1,411.61 0.00 9.0 2.0 77.8% 10.22 7.3 3.0 2.0 59.1% 9.3 6.22 1.2 2.0 none 3.6 0.112 0.112 0.79 0.304 9.0Case PB-54 PB98UN_1x75 98 17% 1 75% Unfired No Solar Cooler Off 1,311.22 0.00 9.0 2.0 77.8% 9.50 7.3 3.0 2.0 59.2% 8.7 5.78 1.2 2.0 none 3.3 0.112 0.112 0.74 0.282 9.0Case PB-55 PB108UN_1x75 108 13% 1 75% Unfired No Solar Cooler Off 1,276.70 0.00 9.0 2.0 77.8% 9.25 7.4 3.0 2.0 59.5% 8.4 5.63 1.3 2.0 none 3.2 0.112 0.112 0.72 0.275 9.0Case PB-56 PB23US_1x75 23 92% 1 75% Unfired Max Solar Cooler Off 1,514.23 0.00 9.0 2.0 77.8% 10.97 7.3 3.0 2.0 58.7% 10.0 6.68 1.2 2.0 none 3.8 0.112 0.112 0.85 0.326 9.0Case PB-57 PB59US_1x75 59 60% 1 75% Unfired Max Solar Cooler Off 1,424.13 0.00 9.0 2.0 77.8% 10.31 7.3 3.0 2.0 59.0% 9.4 6.28 1.2 2.0 none 3.6 0.112 0.112 0.80 0.307 9.0Case PB-58 PB64US_1x75 64 40% 1 75% Unfired Max Solar Cooler Off 1,411.61 0.00 9.0 2.0 77.8% 10.22 7.3 3.0 2.0 59.1% 9.3 6.22 1.2 2.0 none 3.6 0.112 0.112 0.79 0.304 9.0Case PB-59 PB98US_1x75 98 17% 1 75% Unfired Max Solar Cooler Off 1,311.22 0.00 9.0 2.0 77.8% 9.50 7.3 3.0 2.0 59.2% 8.7 5.78 1.2 2.0 none 3.3 0.112 0.112 0.74 0.282 9.0
NOx (per turbine) SO2 (per turbine)VOC (per turbine)CO (per turbine)

Table 1 Emissions from Gas Turbine at Different Loads
PHPP Appendix B, Emissions CalculationsPage 2 of 2
H2SO4 PM10
Case Name Case No. Ambient temp., F
Relative humidity
CT Operating
Combustion Turbine Load
Duct Burner Fired/Unfired Solar Evap. Cooling
CTG Heat Input (HHV) (total:
both turbines)
Duct Burner Heat Input (HHV) (total: both DBs)
NOx NOxNOx
Reduction Required
NOx CO CO CO permit limitCO
Reduction Required
CO
CO emissions at permit
limit
VOC VOCVOC
Reduction Required
VOC SO2 SO2 SO2 H2SO4PM10 (front
& back)
CTG Inlet Air Cooler MMBtu/h MMBtu/hppmvd@15%
O2
ppmvd@15% O2 % lb/h as NO2
ppmvd@15% O2
ppmvd@15% O2
ppmvd@15% O2 % lb/h lb/hr
ppmvd@15% O2
ppmvd@15% O2 % lb/h as CH4
ppmvd@15% O2
ppmvd@15% O2 lb/h lb/hr lb/h
NOx (per turbine) SO2 (per turbine)VOC (per turbine)CO (per turbine)
Case PB-60 PB108US_1x75 108 13% 1 75% Unfired Max Solar Cooler Off 1,276.70 0.00 9.0 2.0 77.8% 9.25 7.4 3.0 2.0 59.5% 8.4 5.63 1.3 2.0 none 3.2 0.112 0.112 0.72 0.275 9.0Case PB-61 PB23UN_2x50 23 92% 2 50% Unfired No Solar Cooler Off 2,409.64 0.00 9.0 2.0 77.8% 8.73 7.4 3.0 2.0 59.7% 8.0 5.31 1.3 2.0 none 3.0 0.112 0.112 0.68 0.259 9.0Case PB-62 PB59UN_2x50 59 60% 2 50% Unfired No Solar Cooler Off 2,273.74 0.00 9.0 2.0 77.8% 8.24 7.6 3.0 2.0 60.6% 7.5 5.01 1.3 2.0 none 2.9 0.112 0.112 0.64 0.245 9.0Case PB-63 PB64UN_2x50 64 40% 2 50% Unfired No Solar Cooler Off 2,250.98 0.00 9.0 2.0 77.8% 8.15 7.7 3.0 2.0 60.9% 7.4 4.96 1.3 2.0 none 2.8 0.112 0.112 0.63 0.242 9.0Case PB-64 PB98UN_2x50 98 17% 2 50% Unfired No Solar Cooler Off 2,072.70 0.00 9.0 2.0 77.8% 7.51 8.0 3.0 2.0 62.5% 6.9 4.57 1.4 2.0 none 2.6 0.112 0.112 0.58 0.223 9.0Case PB-65 PB108UN_2x50 108 13% 2 50% Unfired No Solar Cooler Off 2,009.37 0.00 9.0 2.0 77.8% 7.28 8.1 3.0 2.0 63.1% 6.6 4.43 1.4 2.0 none 2.5 0.111 0.111 0.57 0.216 9.0Case PB-66 PB23US_2x50 23 92% 2 50% Unfired Max Solar Cooler Off 2,409.64 0.00 9.0 2.0 77.8% 8.73 7.4 3.0 2.0 59.7% 8.0 5.31 1.3 2.0 none 3.0 0.112 0.112 0.68 0.259 9.0Case PB-67 PB59US_2x50 59 60% 2 50% Unfired Max Solar Cooler Off 2,273.74 0.00 9.0 2.0 77.8% 8.24 7.6 3.0 2.0 60.6% 7.5 5.01 1.3 2.0 none 2.9 0.112 0.112 0.64 0.245 9.0Case PB-68 PB64US_2x50 64 40% 2 50% Unfired Max Solar Cooler Off 2,250.98 0.00 9.0 2.0 77.8% 8.15 7.7 3.0 2.0 60.9% 7.4 4.96 1.3 2.0 none 2.8 0.112 0.112 0.63 0.242 9.0Case PB-69 PB98US_2x50 98 17% 2 50% Unfired Max Solar Cooler Off 2,072.70 0.00 9.0 2.0 77.8% 7.51 8.0 3.0 2.0 62.5% 6.9 4.57 1.4 2.0 none 2.6 0.112 0.112 0.58 0.223 9.0Case PB-70 PB108US_2x50 108 13% 2 50% Unfired Max Solar Cooler Off 2,009.37 0.00 9.0 2.0 77.8% 7.28 8.1 3.0 2.0 63.1% 6.6 4.43 1.4 2.0 none 2.5 0.111 0.111 0.57 0.216 9.0Case PB-71 PB23UN_1x50 23 92% 1 50% Unfired No Solar Cooler Off 1,204.82 0.00 9.0 2.0 77.8% 8.73 7.4 3.0 2.0 59.7% 8.0 5.31 1.3 2.0 none 3.0 0.112 0.112 0.68 0.259 9.0Case PB-72 PB59UN_1x50 59 60% 1 50% Unfired No Solar Cooler Off 1,136.87 0.00 9.0 2.0 77.8% 8.24 7.6 3.0 2.0 60.6% 7.5 5.01 1.3 2.0 none 2.9 0.112 0.112 0.64 0.245 9.0Case PB-73 PB64UN_1x50 64 40% 1 50% Unfired No Solar Cooler Off 1,125.49 0.00 9.0 2.0 77.8% 8.15 7.7 3.0 2.0 60.9% 7.4 4.96 1.3 2.0 none 2.8 0.112 0.112 0.63 0.242 9.0Case PB-74 PB98UN_1x50 98 17% 1 50% Unfired No Solar Cooler Off 1,036.35 0.00 9.0 2.0 77.8% 7.51 8.0 3.0 2.0 62.5% 6.9 4.57 1.4 2.0 none 2.6 0.112 0.112 0.58 0.223 9.0Case PB-75 PB108UN_1x50 108 13% 1 50% Unfired No Solar Cooler Off 1,004.69 0.00 9.0 2.0 77.8% 7.28 8.1 3.0 2.0 63.1% 6.6 4.43 1.4 2.0 none 2.5 0.111 0.111 0.57 0.216 9.0Case PB-76 PB23US_1x50 23 92% 1 50% Unfired Max Solar Cooler Off 1,204.82 0.00 9.0 2.0 77.8% 8.73 7.4 3.0 2.0 59.7% 8.0 5.31 1.3 2.0 none 3.0 0.112 0.112 0.68 0.259 9.0Case PB-77 PB59US_1x50 59 60% 1 50% Unfired Max Solar Cooler Off 1,136.87 0.00 9.0 2.0 77.8% 8.24 7.6 3.0 2.0 60.6% 7.5 5.01 1.3 2.0 none 2.9 0.112 0.112 0.64 0.245 9.0Case PB-78 PB64US_1x50 64 40% 1 50% Unfired Max Solar Cooler Off 1,125.49 0.00 9.0 2.0 77.8% 8.15 7.7 3.0 2.0 60.9% 7.4 4.96 1.3 2.0 none 2.8 0.112 0.112 0.63 0.242 9.0Case PB-79 PB98US_1x50 98 17% 1 50% Unfired Max Solar Cooler Off 1,036.35 0.00 9.0 2.0 77.8% 7.51 8.0 3.0 2.0 62.5% 6.9 4.57 1.4 2.0 none 2.6 0.112 0.112 0.58 0.223 9.0Case PB-80 PB108US_1x50 108 13% 1 50% Unfired Max Solar Cooler Off 1,004.69 0.00 9.0 2.0 77.8% 7.28 8.1 3.0 2.0 63.1% 6.6 4.43 1.4 2.0 none 2.5 0.111 0.111 0.57 0.216 9.0

PHPP Appendix B, Emissions CalculationsPage 1 of 2
NOx CO VOChr/event hr/yr hr/event hr/yr lb/stack lb/stack lb/stack
hot / warm start 260 1.3 347 6 1,560 40 329 28cold start 50 1.8 92 48 2,400 96 410 31shutdown 310 0.5 155 n/a n/a 57 337 29
TOTALS 593 3,960
hr/yr lb/hr/turbine Both Turbines total lb/hr
Both Turbines total tpy
without duct burning 2,180 12.8 25.5 27.8with duct burning 2,000 13.7 27.3 27.3
events/yr lb/event total lb/eventhot / warm start 260 40.0 80.0 10.4cold start 50 96.0 192.0 4.8shutdown 310 57.0 114.0 17.7
TOTALS 88
hr/yr lb/hr/turbine Both Turbines total lb/hr
Both Turbines total tpy
without duct burning 2,180 7.78 15.6 17.0with duct burning 2,000 8.32 16.6 16.6
events/yr lb/event total lb/eventhot / warm start 260 329 658 85.5cold start 50 410 820 20.5shutdown 310 337 674 104.5
TOTALS 244
Table 2 Maximum Annual Emissions with Startups and Shutdowns
CO
Duration (SU/SD) Offline
NOx
Number of Events/yr
Operating Mode
Operating Mode
Operating Mode

PHPP Appendix B, Emissions CalculationsPage 2 of 2
Table 2 Maximum Annual Emissions with Startups and Shutdowns
hr/yr lb/hr/turbine Both Turbines total lb/hr
Both Turbines total tpy
without duct burning 2,180 4.5 8.9 9.7with duct burning 2,000 4.8 9.5 9.5
events/yr lb/event total lb/eventhot / warm start 260 28 56.0 7.3cold start 50 31 62.0 1.6shutdown 310 29 58.0 9.0
TOTALS 37.1
hr/yr lb/hr/turbine Both Turbines total lb/hr
Both Turbines total tpy
without duct burning 2,207 1.05E-03 2.09E-03 2.31E-03with duct burning 2,000 1.12E-03 2.24E-03 2.24E-03hot / warm start 347 0.0001 0.0002 0.0000cold start 92 0.0001 0.0002 0.0000shutdown 155 0.0001 0.0002 0.0000
TOTALS 4,800 0.00 0.00 0.00
Notes / AssumptionsCombustion Efficiency 99.98% Start-up and Shut downSulfur Content of fuel 0.2 gr/100scf
0.002 gr/scfMolecular Weight of Sulfur 32 lb/moleMolecular Weight of H2S 34 lb/moleHeat Rate 1,763.87 MMBtu/hr/turbinwithout duct firingHHV 1024 Btu/scfNOx, CO, and VOC lb/stack emission rates are based on GE guarantees
Operating Mode
Operating ModeH2S
VOC

PHPP Appendix B, Emissions CalculationsPage 1 of 1
NOx NOx CO CO VOC VOC PM10 PM10 PM2.5 PM2.5 SO2 SO2 H2SO4 H2SO4 H2S H2S
lb/hr tpy lb/hr tpy lb/hr tpy lb/hr tpy lb/hr tpy lb/hr tpy lb/hr tpy lb/hr tpy
Without duct burning 6,760 25.5 86.4 15.6 52.6 8.9 30.1 18.0 60.8 18.0 60.8 2.0 6.7 0.8 2.6 2.1E-03 7.1E-03
With duct burning 2,000 27.3 27.3 16.6 16.6 9.5 9.5 28.0 28.0 28.0 28.0 2.1 2.1 0.8 0.8 2.2E-03 2.2E-03
Total 8,760 113.7 69.2 39.6 88.8 88.8 8.8 3.4 0.01
88.1 244.1 37.1 n/a n/a n/a n/a 0.0
Maximum Annual Emissions 113.7 244.1 39.6 88.8 88.8 8.8 3.4 0.01
Notes / Assumptions
Combustion Efficiency 99.80%
Average Discharge (ug/L)
Sulfur Content of fuel 0.20.002
Molecular Weight of Sulfur 32Molecular Weight of H2S 34Heat Rate 3,527.74
3,776.03HHV 1024PM10 and PM2.5 assumed to be equal to PM
Table 3 Comparison of Emissions for Continuous Operation to Emissions with Startups and Shutdowns
Operating hours/yr per
turbine
Continuous Operation Emissions
(100% load, 64 F,8,760 hr/yr)
Emissions with Start-up/Shutdown (includes normal operations and offline period associated with SU/SD)
gr/100scfgr/scf
lb/mole
Btu/scf
without duct with duct firing
lb/moleMMBtu/hrMMBtu/hr

Excerpt
10

PREVENTION OF SIGNIFICANT DETERIORATION PERMIT ISSUED PURSUANT TO THE
REQUIREMENTS OF 40 CFR § 52.21
BAY AREA AIR QUALITY MANAGEMENT DISTRICT
PSD PERMIT NUMBER: Permit Application No. 15487
PERMITTEE: Russell City Energy Company, LLC 717 Texas Avenue, Suite 1000 Houston, TX 77002
FACILITY NAME: Russell City Energy Center
FACILITY LOCATION: 3862 Depot Road, near the corner of Depot Road and Cabot Boulevard, in the City of Hayward, Alameda County, California
Pursuant to the provisions of Subchapter I, Part C, of the Clean Air Act (42 U.S.C. Section 7470, et seq.), Title 40, Section 52.21, of the Code of Federal Regulations (CFR), and the Delegation Agreement between Region IX of the Environmental Protection Agency and the Bay Area Air Quality Management District (District), the District is issuing a Prevention of Significant Deterioration (PSD) air quality permit to the Russell City Energy Company, LLC. The Permit applies to the construction and operation of a new 600 megawatt natural gas fired combined cycle power plant called Russell City Energy Center in the City of Hayward, Alameda County, California.
Russell City Energy Company, LLC, is authorized to construct and operate the power plant as described herein, in accordance with the permit application (and plans submitted with the permit application), the federal PSD regulations at 40 CFR Section 52.21, and the terms and conditions set forth in this PSD Permit. Failure to comply with any condition or term set forth in this PSD Permit may be subject to enforcement action pursuant to Section 113 of the Clean Air Act. This PSD permit does not relieve Russell City Energy Company, LLC, of the obligation to comply with applicable federal, state, and District air pollution control rules and regulations.
Pursuant to 40 CFR Section 124.15(b), this PSD Permit becomes effective March 22, 2010, unless a Petition for Review (appeal) is filed with EPA’s Environmental Appeals Board (EAB) by that date period pursuant to 40 CFR Section 124.19. If a Petition for Review is filed, the PSD Permit does not become effective until the Petition for Review is resolved.
The District held two public comment periods on its proposal to issue this PSD Permit, including two public hearings. The Air District is publishing responses to all comments received during these comment periods concurrently with issuance of the permit. Pursuant to 40 CFR Section 124.19, any person who filed comments on the draft permit


3
Russell City Energy Center Equipment Description
S-1 Combustion Turbine Generator (CTG) #1, Siemens/Westinghouse 501F, 2,038.6 MMBtu/hr maximum rated capacity, natural gas fired only; abated by A-1 Selective Catalytic Reduction System (SCR) and A-2 Oxidation Catalyst
S-2 Heat Recovery Steam Generator (HRSG) #1, with Duct Burner Supplemental Firing System, 200 MMBtu/hr maximum rated capacity; Abated by A-1 Selective Catalytic Reduction (SCR) System and A-2 Oxidation Catalyst
S-3 Combustion Turbine Generator (CTG) #2, Siemens/Westinghouse 501F, 2,038.6 MMBtu/hr maximum rated capacity, natural gas fired only; abated by A-3 Selective Catalytic Reduction System (SCR) and A-4 Oxidation Catalyst
S-4 Heat Recovery Steam Generator (HRSG) #2, with Duct Burner Supplemental Firing System, 200 MMBtu/hr maximum rated capacity; Abated by A-3 Selective Catalytic Reduction (SCR) System and A-4 Oxidation Catalyst
S-5 Cooling Tower, 9-Cell, 141,352 gallons per minute
S-6 Fire Pump Diesel Engine, Clarke JW6H-UF40, 300 hp, 2.02 MMBtu/hr rated heat input.
S-7 Circuit Breaker, Alstom Type HGF
S-8 Circuit Breaker, Alstom Type HGF
S-9 Circuit Breaker, Alstom Type HGF
S-10 Circuit Breaker, Alstom Type HGF
S-11 Circuit Breaker, Alstom Type HGF