washington state patrol performance audit report 99-4
TRANSCRIPT
Washington State PatrolPerformance Audit
Report 99-4
February 16, 1999Upon request, this document is available in alternative
formats for persons with disabilities.
State of WashingtonJoint Legislative Audit andReview Committee

Members ofThe Joint Legislative Audit and Review Committee
SENATORS REPRESENTATIVES
Al Bauer, Vice Chair Tom HuffJim Horn Cathy McMorris, ChairValoria Loveland Val Ogden, SecretaryBob Oke Debbie RegalaHarriet Spanel Helen SommersVal Stevens Mike WensmanJames West, Asst. Secretary (2 Vacancies)R. Lorraine Wojahn
Thomas M. Sykes, Legislative Auditor
• • • • • • • • • • • • • • • • • • • • • • • • • • • • • • • •
Facts AboutThe Joint Legislative Audit and Review Committee
Established by Chapter 44.28 RCW, the Joint Legislative Audit and ReviewCommittee (formerly the Legislative Budget Committee) provides oversight of statefunded programs and activities. As a joint, bipartisan legislative committee,membership consists of eight senators and eight representatives equally dividedbetween the two major political parties.
Under the direction of the Legislative Auditor, committee staff conduct performanceaudits, program evaluations, sunset reviews, and other types of policy and fiscalstudies. Study reports typically focus on the efficiency and effectiveness of agencyoperations, impact of state programs, and compliance with legislative intent. Asappropriate, recommendations to correct identified problem areas are included. TheLegislative Auditor also has responsibility for facilitating implementation ofeffective performance measurement throughout state government.
The JLARC generally meets on a monthly basis during the interim betweenlegislative sessions. It adopts study reports, recommends action to the legislatureand the executive branch, sponsors legislation, and reviews the status ofimplementing recommendations.

Washington State PatrolPerformance Audit
Report 99-4
February 16, 1999Upon request, this document is available in alternative
formats for persons with disabilities.
State of WashingtonJoint Legislative Audit
and Review Committee506 16th Ave SE, Olympia, WA 98501-2323Campus Mail - PO Box 40910Phone (360) 786-5171 - Fax (360) 786-5180http://jlarc.leg.wa.gov

TABLE OF CONTENTS
Chapter Page
SUMMARY i
SUMMARY OF RECOMMENDATIONS xiii
1 PATROL STAFFING, ALLOCATION, ANDSCHEDULING 1
Summary 1Background 2Results of Validation Testing 4Model Elements 7Changes in WSP Inputs 10Model Implementation and Validation 11Performance Measures 14
2 COMPENSATION ISSUES 17
Summary 17Background 19Overtime Use 21Retirement Impact 22Findings 24Regular Call-out Overtime Policies 29Contract Overtime Policies 30Post-Retirement Employment with WSP 32
3 PATROL ACTIVITES ON COUNTY ROADS 35
Introduction 35Background 35Assessment of Current Service Levels 37

Page 2 Table of Contents
Chapter Page
3 Target Service Levels 38Discussion 40
4 COMMERCIAL VEHICLE DIVISION TRANSITION PLANNING 43
Background 43Current Environment and Impact of Transition Options 45Work Performed 49Findings 50State Survey of Commercial Vehicle Operations 53
5 TECHNOLOGY 55
Summary 55Overview 56Organizational Structure 58WSP Technology 60
6 TELECOMMUNICATIONS 77
Summary 77Microwave Network and Microwave Conversion 77
7 PATROL VEHICLE REPLACEMENT AND BUDGETING 89
Summary 89Introduction 90Structure of the Model and Methodology 91Results of the Model 91Alternative Scenarios and Sensitivity Analysis 93Applications for Replacement of Other Types of Vehicles 93Results from Survey of Other Jurisdictions 94Budgeting Fleet Replacement Costs 94
8 COLLOCATION 97
Summary 97
Washington State Patrol Performance Audit Page 3
Chapter Page
8 Introduction 98Projects Reviewed 99
9 INDIRECT COST RECOVERIES 103
Introduction 103Background 103Cost Recoveries and the Budgeting/Allotment Process 104Discussion 108Recommendation 110
Appendices Page
1 Scope and Objectives A1-1
2 Agency Responses A2-1
3 Washington State Patrol Actions Resulting From 1991 LTC Recommendations A3-1
4 Limitations of the Pam Model A4-1
5 PAM Outputs versus Data from the Computer Aided Dispatch System A5-1
6 Performance Outputs for Patrol A6-1
7 Summary of Most Common Purposes of Overtime Worked by Persons Approaching Retirement A7-1
8 Commercial Vehicle Division Survey A8-1
9 Washington Access To Criminal History (WATCH) A9-1
10 WSP Tower Survey Results A10-1
11 WSP Pursuit Vehicle Fleet Life-Cycle Cost Model A11-1
12 Summary of Collocation Projects Reviewed A12-1

WASHINGTON STATE PATROLPERFORMANCE AUDIT
Summary
OVERVIEW
This performance audit of the Washington State Patrol (WSP)responds to legislation passed in 1997 (ESSB 6061) that called forperformance audits of state transportation agencies. That samelegislation created a Temporary Advisory Committee1 thatprovided input to the Joint Legislative Audit and ReviewCommittee (JLARC) on the performance audit scope andobjectives.
This report focuses on selected subject areas and issues that areof interest to the legislature as reflected in advice from theTemporary Advisory Committee. In addressing these issues, theaudit assesses other aspects of performance, as appropriate,relating to efficiency, effectiveness and accountability of programoperations.
Throughout the audit process, we found the WSP to be a forwardlooking agency whose management and line staff put inconsiderable extra effort to assist in answering the auditquestions and in meeting an aggressive timeline for this report.Findings in this report highlight many achievements of thePatrol, and point to areas where additional changes can be ofassistance to the agency and the legislature.
The audit questions examined in this report have been groupedinto nine subject areas:
1 This committee is comprised of the members of the executive committees ofJLARC and the LTC. The state auditor and the director of the Office ofFinancial Management (OFM) serve as ex officio members.
Legislativeinput onauditquestions

Page ii Summary
• Patrol Staffing, Allocation, and Scheduling• Compensation Issues• Patrol Activities on County Roads• Commercial Vehicle Division Transition Planning• Technology• Telecommunications• Patrol Vehicle Replacement and Budgeting• Collocation• Indirect Cost Recoveries
Each of these areas comprises a separate chapter in the report.The findings and recommendations from each chapter aresummarized below.
PATROL STAFFING, ALLOCATION, ANDSCHEDULING
Approximately 700 troopers and sergeants are deployed amongpatrol areas throughout the state to respond to citizens’ calls forservice (CFS), detect law violations, and provide proactive lawenforcement services.
This chapter answers a question posed by the LegislativeTransportation Committee (LTC) and the Office of FinancialManagement (OFM): Is the patrol staffing and allocation model,as used by the Washington State Patrol, a valid means ofestablishing appropriate staffing levels for patrol and for thedeployment of troopers? Other aspects of patrol staffing,allocation, and scheduling are also examined in this chapter.
Based on an evaluation of this complex model, and how the Patrolhas used it, this audit finds that the outputs from the model havenot been valid indicators of performance and staffing needs. It isalso questionable whether they have provided reliableinformation for the deployment of troopers. New informationprovided by WSP, and the cooperation and advice of the Model’sauthor, assisted us in making this finding.
This finding does not mean that the model should be abandoned.The positive steps taken by the WSP and the LTC towardsperformance-based budgeting can still be continued and
Focus is onPatrol’sstaffing anddeploymentmodel…
…and stepsneeded toresolveproblems
Washington State Patrol Performance Audit Page iii
enhanced. Some changes to the Patrol’s use of the model, andsome structural changes to the model itself, should make it morereflective of the actual patrol environment in Washington State.What is not clear at this time is how much improved accuracywould result from these changes and whether it would besufficient.
These issues can be resolved by a more thorough follow-throughon the recommendations from the 1991 deployment model studysponsored by the LTC. A recommendation in this chapter callsfor modification of the model and more work on model validation.Another recommendation is that the WSP should establishperformance measures for Patrol that are related to outputs oroutcomes that can be affected by the agency itself, rather thanlimited to those influenced largely by external budget policydecisions.
COMPENSATION ISSUES
We reviewed compensation issues and practices at the WSP. Thisincluded reviewing the salary setting process, focusing on theprevalence of specialty, education, and incentive pay, andexamining what other states provide in this regard.
Another portion of the compensation analysis focused on the useof overtime, both its purpose and prevalence. We compared theuse of overtime by current commissioned staff and recentlyretired commissioned staff, and assessed the impact of theovertime on pensions, both in terms of added pension benefit tothe individual and the resulting cost to the state. We alsoreviewed the amount of overtime attributable to Department ofTransportation (DOT) contracts, and the policies and controlsrelating to contract overtime assignments.
During the course of this audit we engaged the office of the StateAuditor to review the agency’s practices of hiring WSPRetirement System retirees into PERS 1-eligible positions.Together with the State Auditor’s office we reviewed post-retirement hiring practices, retirement eligibility determination,and whether any additional costs to the state are associated withthe pension policy that allows the re-hiring of retirees.
The auditexaminesquestionsabout WSPcompensationpractices andretirementissues

Page iv Summary
We found that the Patrol is in compliance with statutes relatingto its compensation practices, and that post-retirement hiringpractices are proper. Other findings, which relate to specificquestions posed to the audit team, include:
• In comparison with other states, a higher proportion of WSPcommissioned staff receives some type of specialty oreducational pay.
• Paid overtime and compensatory time increase the averagecommissioned staff’s pension by 14 percent. This finding isbased on information for those commissioned staff who retiredfrom July 1995 through March 1998. For FY 99-01, the state’sportion of the pension liability associated with overtime andcompensatory time for these retirees is $80,000 to the generalfund and $1,230,000 to the State Patrol Highway account.
• The average commissioned retiree worked 42 percent moreovertime and compensatory time hours during their last 24months of employment prior to retirement than currentlyemployed troopers and sergeants who worked overtime duringthe same period. DOT contract overtime accounted for 35percent of the overtime worked by the retirees we reviewed.
• Agency policies and procedures relating to certain types ofovertime are inconsistent between districts and allowemployees to make individual choices about whether they willwork overtime. Combined with the magnitude of the impactthat overtime can have on an individual’s retirement benefit,this can create an additional incentive for working overtimefor those who are approaching retirement.
• WSP post-retirement hiring practices do not result inadditional salary costs to WSP, nor a material benefit costincrease to pension funds. However, the policy may provide adisincentive for individuals to remain employed as WSPcommissioned officers because of the additional income andbenefits they may receive from dual retirement.
We make two recommendations in this chapter concerningstrengthening agency controls on assignment of overtime anddeveloping district overtime rotation practices that addressoperational considerations such as how call-out policy affectsresponse time by priority of call.
Overtime cansignificantlyimpactretirementbenefits
Washington State Patrol Performance Audit Page v
PATROL ACTIVITIES ON COUNTYROADS
Although the Patrol’s primary responsibility is to provide traffic-related services on state and interstate highways, it does providesome services on county roads. In January 1998, feeling that thecurrent trooper response level was below acceptable levels, theLTC directed the Patrol to take certain actions to limit itsactivities on county roads, including discontinuing theinvestigation of non-injury accidents. This chapter quantifies thecurrent level of Patrol services on county roads, and explores theextent of reductions that could result from implementing theLTC’s directive.
We estimate that in FY 1998, 51 FTE troopers were devoted tocounty road activities at a cost of approximately $3.7 million.These 51 FTEs represent about 7 percent of all the troopers andsergeants assigned to patrol duties. We established two targetservice levels to reflect reductions that could potentially beachieved through implementing the LTC’s directive. Based onthese target service levels, we estimate the potential reductions inFTE troopers could range from 14.8 FTE to 22.6 FTE, and thepotential reduction in cost could range from $1.1 million to $1.6million.
COMMERCIAL VEHICLE DIVISIONTRANSITION PLANNING
In May 1995, the Department of Labor and Industries (L&I)issued a report to the WSP related to the Commercial VehicleDivision (CVD). The report cited four violations related toCommercial Vehicle Officer (CVO) safety. The report indicatedthe need for personal defensive devices and/or means of defense inthe event of assault or other criminal behavior encountered.
Based on these findings, the WSP and representatives of thethree bargaining units of the CVD entered into an agreement toaddress the safety concerns documented in the L&I report. Theagreement resulted in a plan to transition current CVO positionsinto fully commissioned state troopers. This transition would
Activities oncounty roadsequate to anestimated 51troopers
Labor &Industriescitations ledto transitionof CVD staffto armedofficers
Page vi Summary
entail significant changes in training, arming, authority, salarylevels, and vehicle requirements for CVOs. Subsequently, WSP,the collective bargaining units, and an LTC working groupsubmitted additional options for CVD transition to the LTC.These options are currently under consideration.
Our analysis focused on answering the following question: Is theCVD transition process an efficient and effective means of meetingthe division staff resource management objectives as well as theL&I audit report objectives?
Because the number of options being considered has changedduring the course of the audit (and may continue to change), thereport does not support any particular option. Rather, itidentifies the features that should be included in any option thatmay eventually be chosen. The report recommends that thelegislature and WSP should proceed with a CVD transition planthat results in transitioning to fully commissioned officers ininterior positions and that uses unarmed Commercial VehicleOfficers at ports of entry to the extent possible.
TECHNOLOGY
The major focus of this chapter is to address the legislature’squestions concerning the adequacy of the technology andtelecommunications systems deployed by the WSP:
• Are the systems currently in place cost-effective and are theyoperated efficiently?
• Do these systems adequately serve the needs of the patrol andother justice system and local law enforcement users?
This chapter contains two recommendations that support futureenhancements of the state Automated Fingerprint IdentificationSystem (AFIS) and strategic planning of the Patrol’s MobileComputer Network. The audit found that the Patrol hasgenerally applied proven technology in an efficient manner tomeet critical public safety needs. However, the state has notmade sufficient investments in WSP’s public safety computer andcommunications infrastructure, and several key systems havebecome outdated. State Patrol investments in technology are
Investmentsare neededto supportWSP’sefforts andto meetcriticalneeds
Transitionplanningshould goforward

Washington State Patrol Performance Audit Page vii
dependent on funding decisions made by the legislature. TheState Patrol has been directed by the legislature to improvepublic access to state criminal history records, and hassuccessfully implemented cutting-edge Internet technology tomeet this challenge.
TELECOMMUNICATIONS
This chapter contains an analysis of the telecommunicationssystems deployed by WSP. Two recommendations addressopportunities for collocation of telecommunications equipmentwith other public and private entities, and the need for bettercoordination of radio communications among state and localjurisdictions. We found that the Patrol has efficiently appliedproven technology to establish a reliable public safetycommunications system. However, to maintain the current highlevel of service, the Patrol should improve basic maintenance onits telecommunications towers. As recognized in the previouschapter on technology, the Patrol has been nationally recognizedfor implementing and deploying telecommunications systems.
PATROL VEHICLE REPLACEMENT ANDBUDGETING
We evaluated how decisions are made to replace WSP pursuitvehicles. Each new pursuit vehicle costs approximately $26,000to purchase and equip. WSP was authorized 828 pursuit vehiclesfor 1998.
To aid in this evaluation, we developed and relied upon a FleetLife-Cycle Cost Model, and received extensive cooperation andsupport from the WSP Fleet Section. This model is currentlybeing used by WSP for decision-making purposes.
Relevant financial and cost data indicate that the increase ofWSP pursuit vehicle mileage from the current target of 100,000miles to 110,000 miles has resulted in a small reduction (one centper mile, or $159,000 annually) in the total cost of ownership.Compared to the old target of 75,000 miles, replacing pursuitvehicles at 110,000 miles saves $660,000 annually. Existing datadid not permit an analysis of what total costs would be of
Increase inpursuit vehiclemileage hasproduced asmallreduction incosts

Page viii Summary
extending vehicle mileage beyond 110,000 miles. Exhibit 1 on thebelow shows how total costs per mile change based on differentreplacement cycles.
The increase in replacement mileage to 110,000 miles has beendue to the use of budgeted vehicle replacement funds for otherWSP operating purposes and a legislative budget decision toreduce funding for vehicle replacement by extending the mileagereplacement cycle.
So far, these decisions have not resulted in higher overall costs(i.e., capital and operating combined). However, more vehiclesthan intended must be replaced in subsequent budgets tomaintain even the current extended mileage level, and there arehigher than intended future operating and maintenance costs.These unplanned future liabilities could be avoided by restrictingvehicle replacement funds solely to that purpose.
Exhibit 1
Budgetingvehicle-related fundsseparatelywould bebeneficial
Annual Cost/Mile by Replacement Cycle
$0.000$0.050$0.100$0.150$0.200$0.250$0.300$0.350$0.400$0.450
75,000 85,000 90,000 100,000 110,000
Replacement Cycle Miles
Tot
al C
ost/
Mile
. Total Cost/Mile
Capital Cost/Mile
Operating Cost
Source: Fleet Life-Cycle Cost Model and cost data provided by WSP Fleet section.

Washington State Patrol Performance Audit Page ix
This report contains recommendations for WSP to continue to usethe Fleet Life-Cycle Cost Model for evaluating the mileagereplacement level for pursuit vehicles, and to extend the use ofthe model for review of other categories of fleet vehicles as well.Another recommendation is to budget funds for vehicle purchaseand operations in segregated accounts with restrictions on theability to transfer these funds for other purposes.
COLLOCATION
The focus of this chapter is the evaluation of efforts to collocateWSP facilities and programs with other state agencies andprograms. The LTC has actively encouraged transportation-related agencies to coordinate their capital activities whenpossible, to collocate their facilities to enhance or improve servicedelivery, and to save taxpayer money through efficiencies inacquiring and operating facilities and administering programs.
We evaluated the collocation effort to date, focusing on sixprojects. In addition, we reviewed the plans for communicationstower maintenance (a subject that is also discussed in theTelecommunications chapter).
Our conclusions from this evaluation are as follows:
• WSP is complying with RCW 46.01.330, adopted in the 1993-95 Biennium, that mandated coordination between WSP andthe Department of Licensing (DOL) for the siting of facilities.Siting criteria for WSP were met in collocation examples, butthis did not necessarily occur for DOL (the Parkland vehiclelicensing project breached the criterion related to proximity ofsubagents).
• Appropriate economic evaluations have been done on WSPprojects by use of the model developed as the outgrowth of theJLARC Performance Audit of Capital Planning and Budgeting(1995).
• Projects would benefit from retrospective analysis, since someeconomic benefits were overstated (e.g., collocation of DOLvehicle licensing services in the Vancouver facility).
WSP isfulfillingmandates forcollocation

Page x Summary
• Collocation opportunities may exist with public/privatepartnerships in the siting, construction, and maintenance ofcommunications towers similar to the successful WSPcollocation with local commercial cellular carriers in Everett.
INDIRECT COST RECOVERIES
This chapter explores the issue of indirect cost recoveries, byfocusing on the Patrol’s contract to provide troopers at DOTconstruction sites. We were asked to address this issue in theaudit over concerns that these funds can fall “outside” what mightbe considered the regular budget and allotment process; and as aresult, a complete picture of the Patrol’s budget can be difficult todiscern.
In the 1995-97 Biennium, the Patrol received $2.2 million inreimbursement for the DOT contract; of which, just under one-half million dollars was for indirect costs. These are funds thatare not required to be allotted (because the Patrol is the“receiving” agency), yet are available for disbursementthroughout the agency.
The amount of indirect costs recovered was likely greater thanthe costs actually incurred. This is because all work performedunder the contract is done on an overtime basis, and the indirectrate is imposed on the overtime salaries which are 50 percenthigher than straight time salaries. There is nothing to indicate,however, that the amount of indirect cost incurred actuallyincreases as a result of paying overtime versus straight time.
In the 1995-97 Biennium, the Patrol allocated the largest singleshare of its total indirect cost recoveries (not just those from theDOT contract) to a sub-program within its budget called“Revolving Accounts.” WSP staff indicated that some amount ofthe funds in this account, presumably those represented by theindirect cost recoveries, are available for use at the discretion ofagency management; meaning they can be allocated to areaswithin the agency that are deemed to be a priority. We asked fora specific accounting or breakdown of what the indirect costrecoveries in this fund were used for. Patrol staff indicated thatthe state’s accounting system is not set up to provide for that typeof specific breakdown.
Audit wasasked to lookat distributionof indirect costrecoveries
State’saccountingsystem notset up totrack howindirect costrecoveriesare spent

Washington State Patrol Performance Audit Page xi
The Patrol’s distribution of indirect cost recoveries does appear tofall outside what might be considered the typical budget process.This is not to suggest, however, the distribution is inconsistentwith applicable rules and regulations. Under the existing system,the Patrol has access to what are essentially additional funds,above and beyond those appropriated to it by the legislature. Aconcern is that there is limited outside oversight of these funds,and as such, limited accountability. The report recommends thatOFM and the Patrol jointly review and resolve the issues raisedin this chapter.
AGENCY RESPONSE
We shared this report with WSP and OFM and provided them anopportunity to submit written comments. Their responses, aswell as the Auditor’s comments, are provided in Appendix 2
ACKNOWLEDGEMENTS
We appreciate the extensive cooperation of the management andstaff of the WSP. In preparing for the audit work, we alsoreceived invaluable assistance from the members and staff of theLTC and OFM.
Bob Thomas, Robert Krell and Valerie Whitener, JLARC staff,conducted this audit with technical assistance and review ofselected areas by consultants Robert M. Williams (Robert M.Williams and Associates); Michael J Huddleston; and Michael D.Frankfurter and Andrea Wieland (Pacific Consulting Group, Inc.).Dan Contris and Chris Kennedy of the State Auditor’s Office(SAO) provided additional technical assistance and audit reviewunder an interagency agreement between JLARC and SAO. BobThomas was the team leader of the audit. Cheryle Broom andThomas M. Sykes were the project supervisors.
We very much appreciate the technical assistance in the analysisof the Police Allocation Model (PAM) provided by Dr. WilliamStenzel of the Traffic Institute at Northwestern University, andby Mr. Michael Markow of Cambridge Systematics Inc. Forassistance and information concerning retirement systems andactuarial information we are indebted to the Office of the StateActuary, and particularly to Steve Nelsen.

RECOMMENDATIONS
Summary
Recommendation 1
The Washington State Patrol should make corrections to its use ofthe Police Allocation Manual, and should seek expert assistancein making the kinds of modifications to the model that have beenidentified in this report. Following these changes, the modelshould be validated to ensure that it replicates reality. Any majordiscrepancies should be analyzed to determine which variablesare causing the differences. An independent review of thevalidation test should be provided to ensure model credibility.
Legislation Required: NoneFiscal Impact: Unknown. Use of outside expertise may require
additional funding; and additional training and/orstaff resources may be required to enhance theuse and accuracy of the staffing and deploymentmodel.
Completion Date: January 2000, depending on when funding isprovided
Recommendation 2
The Washington State Patrol should establish performancemeasures for Patrol that are related to outputs or outcomes thatcan be affected by the agency itself. Initial areas to focus onshould include response availability by priority of call andresponse time, taking into consideration the characteristics ofindividual autonomous patrol areas.
Legislation Required: NoneFiscal Impact: NoneCompletion Date: WSP is currently working on a pilot project with
OFM and LTC to develop and implementperformance measures as an integral part of itsbiennial budgeting process.

Page xiv Summary of Recommendations
Recommendation 3
The Washington State Patrol should pursue implementingdistrict policies relating to regular call-out overtime. Thesepolicies should provide controls in terms of rotation of call-outassignments, and address operational considerations such as howcall-out policy affects response time by priority of call.
Legislation Required: NoneFiscal Impact: NoneCompletion Date: January 2000
Recommendation 4
The Washington State Patrol should continue to pursueconsistency and compliance in its policies for operations ofcontract overtime. Controls prohibiting self-reassignment ofovertime should be present within policies of each district.
Legislation Required: NoneFiscal Impact: NoneCompletion Date: January 2000
Recommendation 5
The legislature and the Washington State Patrol should proceedwith a Commercial Vehicle Division transition plan that resultsin transitioning to fully commissioned officers in interior positionsand that uses unarmed Commercial Vehicle Officers (CVOs) atports of entry to the extent possible.
Legislation Required: NoneFiscal Impact: The number of port of entry positions that do not
require armed officers needs to be determinedbased on staffing schedules. Therefore, the costof our recommendation is not known at thisjuncture. Based on analyses prepared by WSP,the additional ongoing annual salary and benefitscost of upgrading to fully commissioned officersfrom CVEOs would be approximately $17,000 perposition. The salary and benefit savings fromusing unarmed CVOs rather than fullycommissioned CVEOs would be approximately$19,200 per position.
A comprehensive analysis of costs and benefitsshould recognize the potential improvements inquality of service in responding to calls for service

Washington State Patrol Performance Audit Page xv
and the savings which should result from fewercalls for assistance for commissioned troopers byCVEOs.
Completion Date: Unknown. According to the Office of FinancialManagement, successful implementation of atransition plan will require that all stakeholdersreach consensus on the transition period, trainingrequirements, and enforcement authority.
Recommendation 6
A comprehensive study should be funded to plan, schedule, andbudget the statewide implementation of live-scan technology.This study should reflect the overall strategy of the state’s JusticeInformation Network.
Legislation required NoneFiscal Impact: A preliminary estimate of the cost of such a study
is $75,000; after implementation of live-scantechnology, staff will be freed up for otherpurposes.
Completion Date: April 1, 2000, or depending on when funding isprovided
Recommendation 7
The Washington State Patrol should develop a detailedimplementation plan for the next phase of the Mobile ComputerNetwork (MCN) project to describe patrol coverage, radiocommunications and potential integration with city and countymobile computers.2 The implementation plan should also identifyand propose technical solutions to MCN integration challengesposed by the federal National Crime Information Center 2000project.
Legislation required: NoneFiscal Impact: $200,000 for studyCompletion Date: August 1, 2000, or depending on when funding is
provided
2 WSP review comment: “Any future MCN application or system changeswould require legislative support. This implementation plan should belegislatively sponsored as a WSP study project with a hired consultant forapproximately $200,000. Any plan or MCN project should support the agencysix-year strategic plan.”

Page xvi Summary of Recommendations
Recommendation 8
The Washington State Patrol (WSP) should ascertain which of itstelecommunications towers provide opportunities for collocationand partnership with other entities, and should attempt toduplicate the success of the WSP Everett tower project.
Legislation required: NoneFiscal Impact: Duplication of the Everett Tower project could
result in capital budget savings in the range of$200,000 to $500,000 for each tower partnered.
Completion Date: January 2000 for identification of projects
Recommendation 9
The legislature should consider funding a statewide lawenforcement communications interoperability plan. If thisplanning effort identifies a feasible interoperability solution, thelegislature should further consider funding the fix and shouldauthorize the Washington State Patrol to implement theprogram.
Legislation required: None for study; implementation may requirelegislative authorization
Fiscal Impact: King County conducted a study of similarcomplexity for $180,000
Completion Date: January, 2001, depending on when funding isprovided
Recommendation 10
The Washington State Patrol (WSP) should continue to use theFleet Life-Cycle Cost Model as the basis for evaluating themileage replacement level. Any replacement policy that differsfrom the lowest cost alternative identified by the model should besupported with cost-benefit considerations. WSP should alsoadapt the Fleet Life-Cycle Cost Model for use in the review ofother categories of fleet vehicles.
Legislation Required: NoneFiscal Impact: For pursuit vehicles, maintaining a vehicle
replacement cycle of 110,000 miles would saveapproximately $159,000 annually compared to100,000 miles and $660,000 annually whencompared to 75,000 miles.
Washington State Patrol Performance Audit Page xvii
Completion Date: Implementation of this recommendation iscurrently in progress
Recommendation 11
The Washington State Patrol should budget funds for vehiclepurchase and operation in dedicated accounts with restrictions onthe ability to transfer these funds to other purposes. Any suchtransfers should demonstrate that excess funds are theconsequence of fleet efficiencies and not the consequence of eitherrestricting mileage at the expense of mission availability ordeferring costs to subsequent budgets. Funds for emergencypurposes and contingent needs should be accommodated throughother budget strategies to avoid the use of required vehiclepurchase funds.
Legislation Required: NoneFiscal Impact: UnknownCompletion Date: In time for the next budget cycle
Recommendation 12
All parties to the collocation process should review the sitingcriteria of the various collocation participants.
Legislation Required: NoneFiscal Impact: Should help foster the most economically justified
decisionsCompletion Date: Can begin immediately
Recommendation 13
Collocation participants should routinely review past projects toenable prospective projects to benefit from improved assumptionsrelative to location, appropriate mix of collocation participants,and facility programming.
Legislation Required: NoneFiscal Impact: Should help foster the most economically justified
decisionsCompletion Date: Can begin immediately
Page xviii Summary of Recommendations
Recommendation 14
The Washington State Patrol and the Office of FinancialManagement should jointly review the basis for the Patrol'sindirect cost recovery plan used in the administration of thePatrol's "DOT Master Contract" to determine if there is any needfor modification.
Legislation Required: NoneFiscal Impact: Unknown until after the review is completedCompletion Date: January 2000

PATROL STAFFING, ALLOCATION, ANDSCHEDULING
Chapter One
SUMMARY
Approximately 700 troopers and sergeants are deployed amongpatrol areas throughout the state to respond to citizens’ calls forservice (CFS), detect law violations, and provide proactive lawenforcement services.
This chapter answers a question posed by the LegislativeTransportation Committee (LTC) and the Office of FinancialManagement (OFM): Is the patrol staffing and allocation model,as used by the Washington State Patrol (WSP), a valid means ofestablishing appropriate staffing levels for patrol and for thedeployment of troopers? Other aspects of patrol staffing,allocation and scheduling are also examined in this chapter.
Based on an evaluation of this complex model, and how the Patrolhas used it, this audit finds that the outputs from the model havenot been valid indicators of performance and staffing needs. It isalso questionable whether they have provided reliableinformation for the deployment of troopers. New informationprovided by WSP, and the cooperation and advice of the model’sauthor, assisted us in making this finding.
This finding does not mean that the model should be abandoned.Nor does it mean that the positive steps taken by the WSP andthe LTC towards performance-based budgeting cannot becontinued and even enhanced. Some changes to the Patrol’s useof the model, and some structural changes to the model itself,should make it more reflective of the actual patrol environment inWashington State. What is not clear at this time is how much
This chapterfocuses onPatrol’sstaffing anddeploymentmodel

Page 2 Chapter One: Patrol Staffing, Allocation, And Scheduling
improved accuracy would result from these changes and whetherit would be sufficient.
These issues can be resolved by a more exhaustive follow-throughon the recommendations from the 1991 deployment model studysponsored by the LTC. A recommendation in this chapter callsfor modification of the model and more work on model validationas was originally recommended in 1991. Anotherrecommendation is that the WSP should establish performancemeasures for the Patrol that are related to outputs or outcomesthat can be affected by the agency itself.
BACKGROUND
A decade ago the legislature and OFM had concerns about thedeployment techniques and models that had been used by theWSP. These models were based on numerous factors such asaverage traffic miles, number of vehicles registered inWashington, accident rates and CFS. The WSP was among manyother law enforcement agencies nationwide that were searchingfor a model that would meet their needs. In 1990, the LTCengaged Sterling Associates to help select a model for use by theWSP. Through a collaborative effort involving the LTC, OFM,and WSP, Sterling Associates identified the following criteria foran acceptable staffing and deployment model for WSP.
1. The model must recognize the full spectrum of the WSP’smission.
2. The model must determine how many troopers are needed.3. The model must address what levels of service the state is
buying.4. The model must determine where the troopers should be
deployed.5. The model must stratify personnel needs at district and
detachment levels.6. The model must be easy to understand and practical to use.7. The model’s assumptions must be reasonable and
technically sound.
The PAMmodel wasselected nineyears ago

Washington State Patrol Performance Audit Page 3
In a study published in January 1991, Sterling Associatesrecommended the use of the Police Allocation Manual (PAM),3developed at Northwestern University, as the most appropriatedeployment model for the Patrol. An important feature of PAM isthat it is both time-based and policy-based. It is time-based inthat it uses the actual time requirements for reactive, proactive,and administrative duties. It is policy-based in that it allows theuser to set service level targets for both the availability andvisibility of troopers assigned to patrol districts.
The consultant’s recommendation to adopt PAM was contingent,however, on WSP taking the following actions:
• The current activity reporting system should be modified toensure that PAM will use reliable historical data.
• PAM should be validated to ensure that it replicates reality.If the model can calculate staffing levels with reasonableaccuracy for past and/or current service levels, usingreliable historical data, it will have met its most criticaltest. Any major discrepancies should be analyzed todetermine which variables are causing the differences.
• An independent review of the validation test would ensuremodel credibility.
WSP made several efforts to follow-up on these recommendedactions (See Appendix 3). For example, beginning in 1991, theagency formed the Time and Activity System (TAS) EvaluationCommittee to begin extensive efforts to overhaul and improveTAS. At the time, however, WSP did not generate the kind ofhistorical data needed to validate the model. A study by WSP isnow in progress that is specifically designed to provide actualperformance data from the Computer Aided Dispatch (CAD)system that can be used in model validation.4 This performance
3 PAM Version 4.0 for statewide agencies, July 1991, prepared by The TrafficInstitute of Northwestern University for the National Highway Traffic SafetyAdministration, U.S. Department of Transportation.4 See “WSP Computer-Aided Dispatch System Improvement Feasibility StudyReport: Final Report, May 1998, KMPG Peat Marwick, LLP; and a WSPinternal working document entitled “WSP Analysis of CAD/PAM SystemImprovement Feasibility Study as of 8/11/98.
Adoption ofPAM wascontingentuponvalidation
Somevalidation isnow inprogress

Page 4 Chapter One: Patrol Staffing, Allocation, And Scheduling
audit has also provided various validation tests of the model.Together, these efforts constitute part of the validation testingand independent review that the consultant recommended in1991.
The extent of this current testing sets Washington somewhatapart from other states with regard to validating PAM. Out of 41states that responded to a JLARC survey, 17 indicated that theyuse PAM. None of these 17 states5 has conducted a validationtest to determine how well PAM estimates compare to reality.6
RESULTS OF VALIDATION TESTING
In the course of this performance audit, we evaluated PAMagainst the seven criteria (see above) that were established for astaffing and deployment model. Since there is a risk with anymodel that it might have conceptual, structural or computationalerrors, we made review of this risk a high priority.
Technical Soundness
We reconstructed PAM formulas and tables, checkedmathematical calculations, and worked through the steps andlogic of each part of the model. Based on these particular tests,we found the model to be technically sound.7 These tests did not,however, determine whether the queuing modeling assumptionsused in the model produce results that with reasonable accuracywill predict actual performance. Later in this chapter we willdiscuss our reasons for suggesting further testing of a modified ordifferent version of PAM for use by WSP.
5 One state no longer uses PAM.6 The author of the model received feedback from eight states that field-testedthe model in 1989 indicating that they felt the model outputs were indicative ofactual performance. These field tests apparently did not involve, however, thetype of validation process that is being described in this audit.7 One referencing problem in the instructions and one calculation problem wereidentified and were brought to the attention of the model’s author. Theseproblems were not located in the parts of the model being used by WSP.Coming across errors of this type is not unusual in a model of such complexityand does not reflect negatively on the overall model design. Our review of theconceptual design of the model did not extend to an evaluation of theunderlying queuing theory (the mathematics of waiting lines and systems).
PAM istechnicallysound butstill haslimitations
Washington State Patrol Performance Audit Page 5
The limitations of PAM (and this would likely apply to any model)stem from the difficulty of having general modeling assumptionsclosely match the actual operating environment of any particularuser jurisdiction.
Washington State Patrol’s Use of PAM
PAM is a tool that can be used to make allocations of troopersamong Autonomous Patrol Areas (APAs).8 We found that WSPpays very close attention to PAM results when making decisionsabout how staff should be deployed. PAM results are madeavailable to district commanders, and the commanders, in turn,use PAM results and other operational information andprofessional judgment in making their cases for their share ofstaffing resources.
PAM can also be used to determine staffing needs in relation topolicy-based performance objectives. The performance objectivethat has been chosen by WSP is to have sufficient troopers so that80 percent of the time a trooper will be available immediately torespond to a citizen’s CFS.
We found that due to an incomplete understanding about thecomplex design and the assumptions underlying PAM, the WSPhas consistently overestimated the percentage of time thattroopers are available to respond to citizens’ CFS. This findinghas been confirmed with both WSP and the model’s author.
Because PAM has also been used to determine trooper staffingrequests, these requests have consistently underestimatedstaffing needs based on the availability measure. As will bediscussed later in this chapter, more detailed performancemeasures should be considered instead of overall availability oftroopers to respond to CFS.
WSP’s use of the model has produced errors in both directions–some result in performance being overestimated and others inperformance being underestimated. The errors that have 8 There are the 39 WSP APAs (in eight districts). They are referred to as“autonomous patrol areas” (APAs) because virtually all the CFS that originatein the area are handled by troopers assigned to the area, and troopers assignedto the area are rarely assigned to CFS outside the area.
Problems inuse of PAMhaveoverestimatedperformance
Page 6 Chapter One: Patrol Staffing, Allocation, And Scheduling
overestimated performance (and underestimated staffing needs)have had, by far, the greatest impact.
The problems with WSP’s use of PAM are both technical andconceptual, as can be illustrated with the following threeexamples:
• Based on an incomplete understanding of the model design,the wrong statistical tables have been used for looking upthe number of staff needed to meet performance criteria.This has resulted in underestimating staffing needs andoverestimating performance.
• Although the time and activity data associated with shiftextensions and trooper call-outs has been entered intoPAM, the additional trooper time on duty that comes fromthese activities has not been entered. This has resulted inoverestimating staffing needs and underestimatingperformance.
• PAM can be used in a prescriptive or a descriptive manner.A prescriptive approach would set limits on certainactivities (such as administrative time or the time spent onself-initiated contacts) and then estimate what the trooperstaffing needs would be if these limits were actuallyachieved. A descriptive approach, in contrast, uses actualdata rather than policy limits to estimate staffing needsbased on current operations. Problems can arise when thetwo approaches are used simultaneously.
A practice of WSP has been to set an hourly limit withinPAM on the amount of time spent on self-initiated contacts(SICs). The limit has been 10 minutes, which is about one-half of the average time reported by troopers. A studycurrently being conducted by WSP further suggests thatself-initiated contacts may be underreported.9 If WSP wereactually able to achieve 10 minutes for self-initiatedcontacts, then the staffing needs described by PAM wouldbe more consistent with this prescriptive assumption.
9 Source: WSP audit technical review process comment: “A large number ofSICs are not counted in the CAD system. Therefore it is difficult to concludewith certainty what the real average is.”
Washington State Patrol Performance Audit Page 7
However, since this limit has not been achieved in practice,the outputs from PAM turn out to be estimates of whatmight be achieved rather that what is achieved. This hasresulted in underestimating staffing needs andoverestimating performance.
Based on WSP’s then-current use of PAM, the outputs for fiscalyear 1997 indicated an average availability for immediate trooperresponse in the range of 60 to 70 percent. When the correct tablesin PAM are used instead, and when overtime hours and reportedactual time for self-initiated contacts are entered, PAM outputssuggest that the percentage was actually under 50 percent. Datafrom the CAD system for the same period indicates thatperformance was in the range of 38 to 49 percent.
Other model limitations and user input problems have beenidentified, discussed, and confirmed with the model’s author.WSP acknowledges the concerns we have raised and agrees thatthe concerns need to be investigated further. The conclusion tothese findings is that PAM, as presently used, is not meeting theoriginal criteria established for a staffing and deployment model.
The next section of this chapter focuses on what can be done toensure that all of the criteria will be met. The discussion willcover the following topics:
• Identification of model elements that will be more reflective ofactual WSP patrol operations
• Needed changes in WSP inputs into the model
• Recommendations for model implementation and validation
• Performance measures appropriate for Patrol
MODEL ELEMENTS
A model developed for use by a variety of statewide patrolagencies cannot always reflect the different operatingenvironments of those agencies. The PAM user’s manualexplicitly recognizes such limitations:

Page 8 Chapter One: Patrol Staffing, Allocation, And Scheduling
The PAM model . . . should be viewed asa generic procedure which must beadapted to fit the mission, physicalenvironment, highway system, andoperational idiosyncrasies of each stateagency.10
In our evaluation of the version of PAM currently being used byWSP, we identified several limitations which, if addressed, shouldmake the model more reflective of the actual WSP operatingenvironment. Some of these limitations have already beenaddressed in a more recent version of PAM developed formunicipalities.11 Nevertheless, even with the municipal model,limitations that would still need to be addressed include:
• The model does not address the fact that calls-for-serviceworkload and staffing for each APA may vary significantly bytime of day. Nor does it sufficiently address the fact thattrooper staffing may not be well-matched to when calls-for-service workload occurs. Note: There are good reasons whycalls-for-service workload and staffing may not match. Forexample, rural APAs may require minimum staffing, whereasscheduling strictly to CFS might call for no staffing at times.Also, some efforts such as DUI (Driving Under the Influence)emphasis may be time- and place-related, but not necessarilyrelated to call volume. In short, WSP has operationalobjectives and challenges in addition to responding to CFSthat can and should influence when troopers are scheduled.
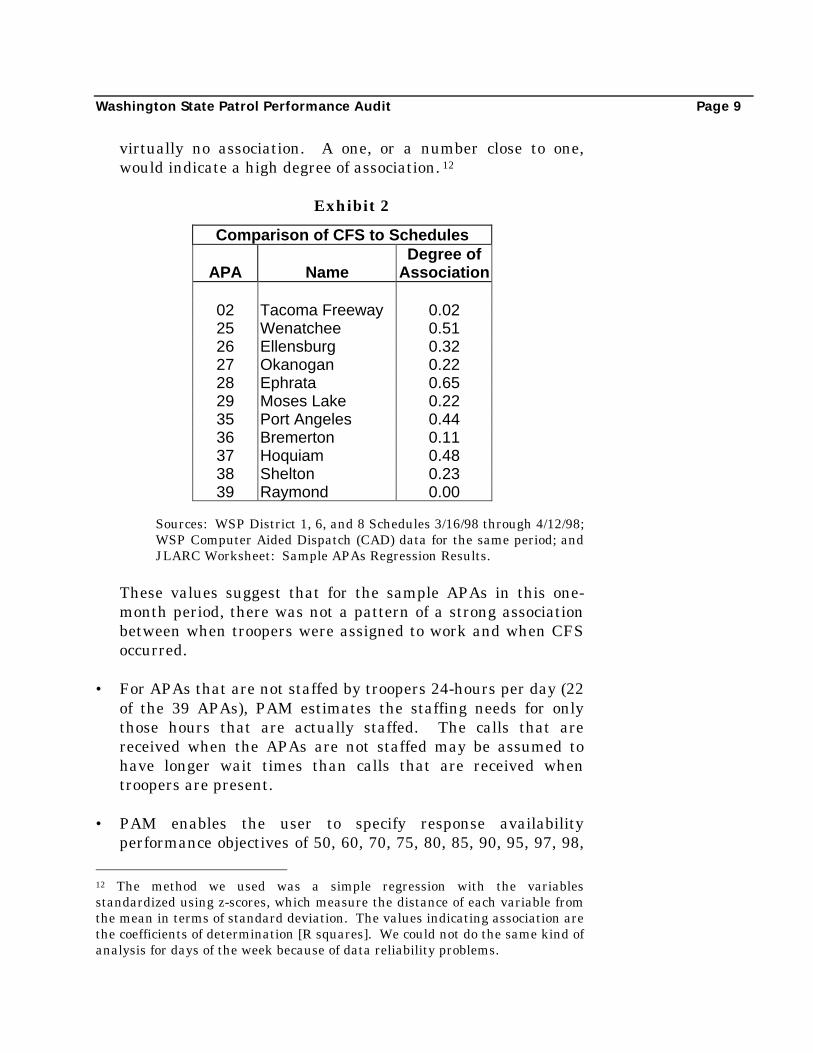
Exhibit 2 shows how trooper staffing by time of day comparedto calls-for-service workload. This is based on a comparison oftrooper schedules to calls-for-service workload for a sample ofAPAs for a one-month period in 1998. The values in theexhibit express the degree of association between whentroopers worked and when the workload occurred. Thepossible range is from zero to one, with zero indicating
10 Police Allocation Manual, Statewide Agencies, Version 4.0, July 1991, pages2-8.11 Police Allocation Manual, Municipal Police Departments, Version M3.0,October 1993.
Newerversion ofPAMaddressessomelimitations …
… but othersremain
Washington State Patrol Performance Audit Page 9
virtually no association. A one, or a number close to one,would indicate a high degree of association. 12
Exhibit 2
Sources: WSP District 1, 6, and 8 Schedules 3/16/98 through 4/12/98;WSP Computer Aided Dispatch (CAD) data for the same period; andJLARC Worksheet: Sample APAs Regression Results.
These values suggest that for the sample APAs in this one-month period, there was not a pattern of a strong associationbetween when troopers were assigned to work and when CFSoccurred.
• For APAs that are not staffed by troopers 24-hours per day (22of the 39 APAs), PAM estimates the staffing needs for onlythose hours that are actually staffed. The calls that arereceived when the APAs are not staffed may be assumed tohave longer wait times than calls that are received whentroopers are present.
• PAM enables the user to specify response availabilityperformance objectives of 50, 60, 70, 75, 80, 85, 90, 95, 97, 98,
12 The method we used was a simple regression with the variablesstandardized using z-scores, which measure the distance of each variable fromthe mean in terms of standard deviation. The values indicating association arethe coefficients of determination [R squares]. We could not do the same kind ofanalysis for days of the week because of data reliability problems.
Comparison of CFS to SchedulesDegree of
APA Name Association
02 Tacoma Freeway 0.0225 Wenatchee 0.5126 Ellensburg 0.3227 Okanogan 0.2228 Ephrata 0.6529 Moses Lake 0.2235 Port Angeles 0.4436 Bremerton 0.1137 Hoquiam 0.4838 Shelton 0.2339 Raymond 0.00

Page 10 Chapter One: Patrol Staffing, Allocation, And Scheduling
and 99 percent. As mentioned previously, performance ofWSP in this regard, as is indicated by our analysis and by datafrom the CAD system, is likely below 50 percent. PAM wouldneed to be modified with additional tables for lowerpercentages in order to “run the model backwards” to estimateactual performance based on current or reduced levels ofstaffing.
A more detailed discussion of model elements is contained inAppendix 4.
CHANGES IN WSP INPUTS
The following changes to how WSP inputs data into PAM wouldhave the result of making model outputs more accuratelydescriptive of the performance that would actually be achievedbased on alternative staffing levels.
• PAM instructions ask the user to enter the average numberof hours that a trooper works during a year. According tothe model instructions, “[t]his number should include bothregularly scheduled on-duty time and paid overtime.”13 Aspreviously indicated, WSP has not been entering the timespent on overtime related to patrol. The reason forincluding overtime is because the data reported for use inPAM reflects time and activities associated with theovertime.
• WSP policy is to set the ratio of sergeants to troopers inPAM at 1 to 8. PAM also provides for the input of thepercentage of field supervisor on-duty time spent on patrolactivities. In WSP’s use of PAM, the supervisorypercentage is not used, nor is the data concerning theiractivities. If the percentage and activities for sergeantswere used, the model outputs would reflect actual agencyperformance more accurately.
A similar situation to supervisory time exists with respect to CFShandled by troopers who are not regularly assigned to particularAPAs. Motorcycle officers are probably the best example. While
13 PAM Version 4.0, p. 3-4.
Changes toinputs wouldimprovemodelaccuracy

Washington State Patrol Performance Audit Page 11
not including their time and activities results in an incompletepicture of reality, including them in the model could beproblematic because the time and location of their activitiesvaries. We do not recommend including such time and activitiesas model inputs as long as the data from the CAD system that isused to validate the model similarly excludes them. Subsequentmodel validation efforts, however, may suggest a need to includethem.
MODEL IMPLEMENTATION ANDVALIDATION
Our review of PAM and WSP’s use of it shows that the outputsfrom the model have not been valid indicators of patrolperformance or patrol staffing needs.
In this audit we have made some of the major and obviouscorrections to WSP’s inputs and model usage (e.g., using thecorrect tables and counting overtime and all reported time relatedto SICs). When we compared the new outputs to data from theCAD system, showing trooper response availability for the sameperiod, we found very little association.
The statistical tests we used to reach this finding are discussed indetail in Appendix 5. Perhaps the best visual representation ofthe data comes from the comparison of the ranking of APAs byrelative staffing needs according to PAM, and relativeperformance (response availability) according to data from theCAD system. One would expect there to be a high degree ofassociation between these rankings. Exhibit 3 shows how far, interms of percentages, the two rankings for each APA diverge.
Littleassociationbetweenmodel outputsand historicaldata fromCAD

Page 12 Chapter One: Patrol Staffing, Allocation, And Scheduling
Exhibit 3
As an example of how to read this chart, for APA 37 there is anexact match between its ranking in terms of staffing needs andrelative performance, and therefore there is no bar on thedivergence scale. In contrast, for APA 32, the rankings are quitedifferent (82 percent toward being completely different), and thebar on the divergence scale is quite high.
For the model to be useful and reliable in answering questionsabout how performance by APA might vary given different levelsof trooper staffing, a high degree of association between modeloutputs and historical data would have to be present. Since thishas not been shown to be the case, there is clearly a need toconduct further validation of the model and to identify all thereasons why model outputs and data from the CAD system do nothave a stronger association.
The municipal version of PAM has features that could possiblymake it a more appropriate tool for WSP, especially if the agency
Percentage Differences between PAM and Historical Data by Patrol Area
0%
10%
20%
30%
40%
50%
60%
70%
80%
90%
APA 1 3 5 7 9 11 13 15 18 20 22 24 26 28 30 32 34 36 38 40
Source: WSP PAM and CAD data for FY 1997.

Washington State Patrol Performance Audit Page 13
refines performance measures by focusing on performance inrelation to call priority. If either version of PAM were to be usedin the future, however, the modifications and changes to modelusage explained in this chapter and in Appendix 5 would need tobe made.
Alternatives
We foresee two alternative courses of action that can be taken inorder to achieve the objectives set by WSP and the legislature fora staffing and deployment model:
1. Repeat the process followed in the 1991 LTC study where anindependent consultant would evaluate the various types ofavailable models and make a recommendation on one thatwould best meet the state’s needs.
2. Work with the existing model (or more particularly themunicipal version of it) and make necessary changes so thatmodel outputs regarding performance are closely matched toactual performance.
An advantage to the first approach is that WSP would learnabout the variety of models that may be available now, which isnine years after the last search for a model suitable forWashington State.
An advantage to the second approach is that WSP has experiencewith PAM and has set up systems and procedures to feedinformation into the model. Reworking the model and changinginputs may produce outputs that more closely match actualperformance. If this reworking is successful, it may not benecessary to evaluate a number of different models. For thisoption to work, however, WSP would need to seek outsideassistance. Consideration should be given to contracting with theauthor of the model or another professional with appropriateexpertise who is familiar with PAM.
Our opinion is that the second course of action—working withPAM—would be the most prudent, given WSP’s experience withthe model and the opportunity to begin reworking the modelalmost immediately. Whatever course of action is taken, we
Furtherwork withPAM wouldbe prudent

Page 14 Chapter One: Patrol Staffing, Allocation, And Scheduling
would stress the need for testing model validity. Ourrecommendation is essentially the same as that from the 1991consultant study sponsored by the LTC.
Recommendation 1
The Washington State Patrol should makecorrections to its use of the Police Allocation Manual,and should seek expert assistance in making thekinds of modifications to the model that have beenidentified in this report. Following these changes,the model should be validated to ensure that itreplicates reality. Any major discrepancies should beanalyzed to determine which variables are causingthe differences. An independent review of thevalidation test should be provided to ensure modelcredibility.
If the model can calculate staffing levels with reasonable accuracyfor past and/or current service levels, using reliable historicaldata, it will have met its most critical test.
PERFORMANCE MEASURES
In past years WSP listed “percent of CFS where trooper will beavailable to respond” as an outcome measure within itsperformance measurement system.14 WSP’s preference is toattain an average response availability of 80 percent. However,the agency has recognized that the effective policy with regard tothis objective is whatever estimated response availability wouldcorrespond to funded trooper staffing levels.
As a performance measure, average response availability isuseful, but also has some weaknesses:
14 See for example, the agency’s FY 1997-99 Budget Request Form B11,“Performance Measures.” OFM and LTC staff, as well as WSP, have describedPAM outputs as a cornerstone of performance-based budgeting for theWashington State Patrol. In the material WSP uses to provide an overview ofPAM, the model and its outputs are described as a means of justifying budgetrequests and measuring performance budgeting (“PAM” Police AllocationModel: Overview, 1998, WSP).
Currentperformancemeasure isuseful butalso hassomeweaknesses

Washington State Patrol Performance Audit Page 15
• It has been used as a means of tying performance outputs tofunding and staffing levels. In this respect it is a useful toolfor the legislature because it enables decision-makers to know(assuming the output information is reliable) what kind ofreturn the public can expect to receive from the investment oftheir tax dollars. (It is similar in this respect to theMaintenance Accountability Process used by the Departmentof Transportation.)
• However, response availability is an output rather than a trueoutcome measure. It has not been correlated to a final result,such as accident reduction, fewer fatalities or citizensatisfaction.
• Since this performance output is tied to funding and staffinglevels, which are ultimately determined by the legislature, itdoes not directly relate to WSP’s own performance.
• Finally, the current measure of availability to respond to CFSdoes not distinguish between priority of calls. Presumably,policy makers would want better performance for higherpriority calls.
To the extent an agency is to be held accountable for improvingits performance, the performance measures used should berelated to outputs or outcomes that can be affected by the agencyitself. In the case of response availability, WSP could be heldaccountable for improving its response availability for highpriority calls within any staffing level that is provided. Forexample, with information about priority calls, WSP might findways to change trooper schedules, to the extent that doing sowould not jeopardize other operational needs.
Linking performance measurement to outputs and outcomeswithin WSP’s purview would also serve to demonstrate and givecredit to the agency for the initiatives it takes to use technology toincrease productivity. The Patrol’s utilization of MobileComputer Technology (MCN) is just one example. With thistechnology, troopers can make data inquiries on driving records,warrants and car plates. It also allows for car-to-car computermessaging. A result is that troopers can spend more timepatrolling and less time performing administrative tasks.
Focus shouldalso be onperformancewithin WSP’spurview
Page 16 Chapter One: Patrol Staffing, Allocation, And Scheduling
Thanks to information now being generated by the CAD system,WSP has information on response availability by priority of callas well as response times, by priority, related to traveling toincidents. Although such measurements are still performanceoutputs, their richer detail may allow WSP in the future to tiethese outputs to measurable outcomes. This new informationmay also allow more flexibility in how performance is measured.For instance, an advantage of response time, which was notpreviously available, is that different time objectives can beestablished for different APAs in recognition of their individualcharacteristics. More rural APAs that have longer travelingdistances might be held to a different standard than urban APAs.
More information, and a discussion concerning WSP’sperformance in relation to these measures, are included inAppendix 6.
Recommendation 2
The Washington State Patrol should establishperformance measures for Patrol that are related tooutputs or outcomes that can be affected by theagency itself. Initial areas to focus on should includeresponse availability by priority of call and responsetime, taking into consideration the characteristics ofindividual autonomous patrol areas.
Richerperformanceinformationnowavailable
COMPENSATION ISSUES
Chapter Two
SUMMARY
This chapter reviews compensation issues and practices at theWashington State Patrol (WSP). We focused our review on salarysetting practices and overtime use in order to respond to specificquestions posed in these areas to the audit team.
We began our audit of compensation issues and practices bylooking at the WSP salary setting process for the 962commissioned full-time equivalent (FTE) staff budgeted for fiscalyear 1999. We reviewed the agency’s compliance with statutoryrequirements for its compensation practices and examined theprevalence of specialty, education, and incentive pay. We alsoconducted a survey of 41 state patrol organizations in otherstates. This included a review of specialty and educationalincentive pay practices and trooper turnover rates.
We found that the agency is complying with all statutoryrequirements in its compensation practices. In comparison withmost other states, a higher proportion of WSP commissioned staffreceive some type of specialty or educational incentive pay, andtrooper turnover was found to be lower.
This chapter also provides descriptive information concerning theuse of overtime and compensatory time by current and recentlyretired commissioned staff. This includes analysis of the impactof the use of overtime on pensions, both in terms of added pensionbenefit to the individual and the resulting cost to the state. Wedetermined the amount of overtime attributable to Department ofTransportation (DOT) contracts, and reviewed the policies andcontrols relating to contract and other overtime assignments.
This chapteranswersseveralquestionsabout WSPcompensationpractices
Page 18 Chapter Two: Compensation Issues
The audit found that paid overtime and compensatory time hoursworked by individuals approaching retirement were higher thanhours worked by other commissioned staff who worked overtimeduring the same period. Paid overtime and compensatory timeincrease the average commissioned staff’s pension by 14 percent.This finding is based on information for those commissioned staffwho retired from July 1995 through March 1998. DOT contractovertime accounted for 35 percent of that overtime. Agencypolicies and procedures relating to certain types of overtime werefound to be inconsistent between districts and allow employees tomake individual choices about whether they will work overtime.This situation, combined with the magnitude of the impactovertime can have on an individual’s retirement benefit, createsan additional incentive for working overtime for those who areapproaching retirement.
We make two recommendations concerning strengthening agencycontrols on assignment of overtime. This includes developingdistrict overtime rotation practices that address performanceconsiderations such as coverage and response times to highpriority CFS.
Finally, during the course of this audit we engaged the Office ofthe State Auditor to review the agency’s practices of hiring WSPRetirement System retirees into Public Employees RetirementSystem Plan 1 (PERS 1)-eligible positions. Together with theState Auditor’s office, we reviewed the controls relating to post-retirement hiring practices, retirement eligibility, and whetherthere are any additional costs to the state associated with thepension policy that allows the rehiring of retirees.
We found that WSP post-retirement hiring practices are properand do not result in additional salary costs to WSP, or in amaterial benefit cost increase to the pension funds. However, thepolicy may provide a disincentive for individuals to remainemployed as WSP commissioned officers because of the additionalincome and benefits that are received when compared toremaining as a commissioned officer. The agency did share theirperspective concerning the benefit of hiring experienced, trainedstaff into the non-commissioned positions.
Overtime cansignificantlyimpactretirementbenefits
Agencyovertimecontrolsshould bestrengthened

Washington State Patrol Performance Audit Page 19
BACKGROUND
The Chief of the State Patrol is the head of the civil servicesystem for the commissioned officers of the WSP. The Chief setsthe pay, rank, and advancement schedule for commissionedofficers. This authority is granted under RCW 43.43.020. WSPmerit system employees are covered under regular merit systemrules. Salary setting is also governed by RCW 41.06.167. Thisrequires that the WSP (in consultation with the Department ofPersonnel) conduct a comprehensive compensation survey forofficers and entry-level officer candidates. This is done once everytwo years. The results of the survey and supporting documentsare used by WSP in preparation of budget requests to support theChief’s compensation plan. A copy of the data and supportingdocumentation is provided to the LTC and legislative fiscalcommittees.
State Patrol commissioned staff receive a base salary. Over one-half of the FTEs also receive some combination of longevity,educational incentive, specialty, and shift differential pay. Forfiscal year 1999, the average budgeted salary and benefits forcommissioned officers is $60,176 and is broken out as follows inExhibit 4:
Exhibit 4
Source: JLARC.
Over one-halfofcommissionedFTEs receiveincentive pay
Budgeted Average Annual Compensation for Commissioned Staff
$50,222
$6,278
$1,930
$737
$1,010
Average Base SalBenefitsOvertimeShift DifferentialSpecialty/Incentive Pay
Page 20 Chapter Two: Compensation Issues
We reviewed fiscal year 1999 budgeted dollars for specialty pay.Specialty pay is provided for certain specialized assignments.Nearly 18 percent of the budgeted FTEs receive some type ofspecialty pay. These are for a variety of specialized duties withthe majority categorized as detectives or motorcycle officers.
Our survey of other states found that 85 percent15 provide sometype of specialty pay. Most provide specialty pay to between 1and 15 percent of their commissioned workforce.
WSP commissioned staff receive educational incentive pay of 2and 4 percent for Associate’s and Bachelor’s degrees. The payrollsystem does not differentiate incremental increases to salary dueto individual pay provisions. Therefore, we were not able todetermine the amount of educational incentive pay provided toWSP commissioned staff.16 Eighty-two percent17 of the statesthat responded to our survey reported that they do not provideeducational incentive pay.
During the pre-audit phase of this review, some concern wasexpressed that comparatively low salary levels could contribute tohigh turnover rates among troopers. Based on our review,however, trooper turnover rates were lower than those in otherstates and lower in all but one of the four local law enforcementagencies in Washington State we surveyed.
According to data provided by the Patrol, the total turnover rateamong troopers has averaged 4.4 percent over the past threefiscal years. (The rate due to resignations–as opposed toretirements or dismissals–has averaged only 0.9 percent.) Wechecked with four local law enforcement agencies in Washington,including the Seattle and Spokane Police Departments, and theKing and Pierce County Sheriff’s Offices, and all but the PierceCounty Sheriff reported a higher turnover rate than that of thePatrol. We also inquired about turnover rates in our survey of
15 Twenty-six states responded to our survey question regarding specialty pay.Six indicated they do not provide specialty pay to their staff. Of the remaining20, 17 provide specialty pay to between 1 and 15 percent of their workforce.16 Incentive pay records are maintained on an individual basis (individualsource records in personnel files).17 Thirty-nine states responded to our survey question regarding educationalincentive pay. Of those, 32 responded that educational incentive pay is notprovided to their staffs.
WSP trooperturnoverrate lowerthan that ofother states

Washington State Patrol Performance Audit Page 21
other state patrol-type agencies. Among the 31 states thatprovided a specific response, 23 reported a higher turnover ratewhile only 8 reported a lower turnover rate.
In summary, we found that compensation practices at the WSPare consistent with statutory requirements. Statutory authorityis provided to the Chief to set pay, rank, and advancementschedules for commissioned officers, and salary surveyinformation is gathered and used in developing compensationplans and budget requests. The results of those surveys areshared with legislative decision-makers. Finally, thecompensation system for WSP commissioned staff provides anumber of ways commissioned staff can enhance base salaries,and in comparison with other states and other Washington Statelaw enforcement entities, trooper turnover rates were not foundto be high.
OVERTIME USE
Questions were posed to the audit team concerning the use ofovertime at the WSP. We were asked to what extent overtimeincreases commissioned staff’s pensions, and how much of theovertime being worked is attributable to Department ofTransportation contract overtime.
We began our overtime analysis by reviewing the agency’sovertime expenditures in the Field Operations section, which isthe area of the Patrol where most commissioned staff overtime isworked. We then reviewed the pension policy, agency policies andprocedures, as well as collective bargaining agreement provisionsrelating to overtime. Next, we analyzed the type, purpose, andamount of overtime worked by persons who retired between July1, 1995, and March 31, 1998. The same analysis was thenconducted on overtime data for currently employed troopers andsergeants and compared to the overtime activity of the group ofretirees. For the retirees, we identified the impact of overtime onindividual pension benefits and the resulting cost impact to thestate.
The expenditures in fiscal year 1998 for Field Operationsovertime were over $3 million. A portion of those expenditureswere reimbursed by the Department of Transportation for
Compensationpracticesconsistentwith statutes

Page 22 Chapter Two: Compensation Issues
contracts it holds with the WSP to provide a variety of trafficcontrol services at construction sites and for special events. Alsoreimbursed are overtime expenses for specific federal grants. Theyear-end accounting system reports do not differentiate betweenall of the overtime expenditures attributable to each one of thecontracts, grants, and interagency agreements. However, thelarger-size contracts and grants can be identified in the fiscalyear 1998 expenditure information as follows in Exhibit 5:
Exhibit 5
Source: JLARC.
RETIREMENT IMPACT
WSP commissioned staff are in the WSP Retirement System(WSPRS). This system provides retirement at 25 years of servicewithout a minimum age provision, or at 55 years of age with nominimum amount of years of service. Monthly retirementbenefits are calculated as a percentage of the highest earnings ina 24-month period of employment. An average finalcompensation is calculated based on the regular earnings and
Field Operations Overtime
$1,561,084
1% 1% 2%
$1,824,409
$37,942 $29,101 $77,098
44%52%
Field ForceOT
Aviation DOT MasterContracts
BreathTesting
TrafficSafety
Contracts

Washington State Patrol Performance Audit Page 23
cash outs for annual, holiday18, and compensatory time.Overtime that is worked in the highest 24-month earnings periodof employment is included in calculating average finalcompensation. The monthly service retirement benefit iscalculated using the following formula:
Months of service ÷ 12 x 2 percent x average final salary
EXAMPLE: RETIREMENT WITH 25 YEARS OF SERVICE CREDITAn individual retires with 300 months (25 years) of service credit.Monthly average final salary is $4,000. The monthly retirementbenefit will be $2,000. Here is how it is calculated:
300 months ÷ 12 = 25 years25 years x 2% = .50.50 x $4,000 = $2,000
In our survey of other states, 35 percent19 of them indicated thatovertime paid by another agency on a reimbursement basisimpacted retirement benefits. We did not assess the impact ofovertime on those states’ pension systems.
WSP provided overtime, holiday credit, compensatory time, leave,and cash out data for commissioned staff who retired betweenJuly 1, 1995, and March 31, 1998. The Office of the State Actuaryprovided average final compensation, retirement effective date,and benefit data for those same retirees. There were 90individuals in our analysis group.
For each retiree we calculated the regular annual salary (that isthe salary excluding paid overtime and other cashouts) for the 24-month period prior to each person’s retirement effective date. We
18 Holiday credit is a form of compensatory time that can be taken at a latertime for time worked on a holiday. The holiday credit is recorded at time and ahalf. See WAC 356-15-030(a). Officers may accumulate a maximum of 80hours of holiday credits and shall be paid for all holiday credits whenseparating from the department. In the case of retirement, only those hoursaccrued for holidays actually worked during the 24 months on whichretirement benefits are based are used to compute average final compensation.19 Ten of 28 states responded to our survey question that retirement benefit isinfluenced by overtime paid by another agency.
WSP andState Actuaryprovided data

Page 24 Chapter Two: Compensation Issues
ran this data through a retirement model20 that calculated theretirement benefit each person would receive prior to all cashoutand overtime earnings. Then, each retiree’s actual average finalcompensation was put through the model. We then calculated thepresent value21 of the retirement benefit for the regular salary,and then for the average final compensation. For reportingpurposes we present our findings by weighted average for ouranalysis group.
FINDINGS
Are there incentives that may generate overtime use?
Retirement incentives may generate overtime use. The presentvalue of compensation received during the highest 24-monthearnings period of employment is worth more to an employeethan compensation earned in prior employment years. This isbecause of the retirement benefit an employee will receive basedon those earnings. If a WSPRS member employee actuallyreceived the present value of each overtime hour worked duringthat period, the present value to the recipient would be 8.14 timesthe regular hourly rate.
What is the impact of overtime on employee’s average finalcompensation and retirement benefit?
The average WSPRS retiree had an estimated regular salary of$46,977 and an average final compensation of $57,633, which was23 percent above the final two-year regular salary. An estimated61 percent of that 23 percent was attributable to overtimeearnings in the last two years of employment. Persons within theanalysis group raised their average final compensation from 3 to50 percent with cashouts and overtime earnings. The quartiledistribution of the analysis group is as follows in Exhibit 6:
20 This retirement model was developed by JLARC and validated by the Officeof the State Actuary.21 Present value is a way of calculating the time value of money. The presentvalue is determined by discounting future dollars by the rate that representsthe personal cost of capital or opportunity cost of an investment. We used adiscount rate of 7.5 percent (which is the same as that used by the StateActuary). Present value presented in this analysis is in 1998 dollars.
Overtimeincentivesidentified
Overtimeand cashoutsincreasedAFC by 23percent
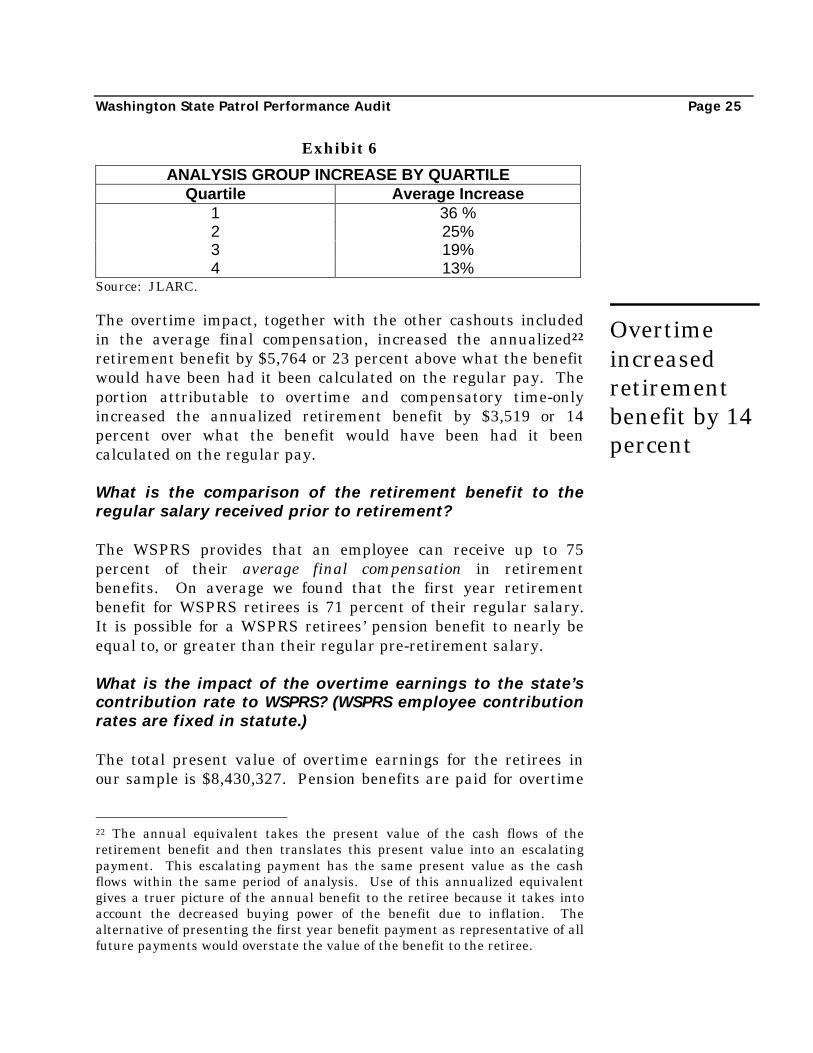
Washington State Patrol Performance Audit Page 25
Exhibit 6
ANALYSIS GROUP INCREASE BY QUARTILEQuartile Average Increase
1 36 %2 25%3 19%4 13%
Source: JLARC.
The overtime impact, together with the other cashouts includedin the average final compensation, increased the annualized22
retirement benefit by $5,764 or 23 percent above what the benefitwould have been had it been calculated on the regular pay. Theportion attributable to overtime and compensatory time-onlyincreased the annualized retirement benefit by $3,519 or 14percent over what the benefit would have been had it beencalculated on the regular pay.
What is the comparison of the retirement benefit to theregular salary received prior to retirement?
The WSPRS provides that an employee can receive up to 75percent of their average final compensation in retirementbenefits. On average we found that the first year retirementbenefit for WSPRS retirees is 71 percent of their regular salary.It is possible for a WSPRS retirees’ pension benefit to nearly beequal to, or greater than their regular pre-retirement salary.
What is the impact of the overtime earnings to the state’scontribution rate to WSPRS? (WSPRS employee contributionrates are fixed in statute.)
The total present value of overtime earnings for the retirees inour sample is $8,430,327. Pension benefits are paid for overtime
22 The annual equivalent takes the present value of the cash flows of theretirement benefit and then translates this present value into an escalatingpayment. This escalating payment has the same present value as the cashflows within the same period of analysis. Use of this annualized equivalentgives a truer picture of the annual benefit to the retiree because it takes intoaccount the decreased buying power of the benefit due to inflation. Thealternative of presenting the first year benefit payment as representative of allfuture payments would overstate the value of the benefit to the retiree.
Overtimeincreasedretirementbenefit by 14percent

Page 26 Chapter Two: Compensation Issues
as a percentage of current employee’s salaries. The Office of theState Actuary calculated 1.26 percent as the percentage of totalsalaries which equates to $8.4 million. The employer contributionfor State Patrol benefit payments come partially out of thegeneral fund and partially out of the Motor Vehicle Fund. Thisobligation represents FY 99-01 biennial costs to the state of:$80,000 to the general fund and $1,230,000 to the State PatrolHighway Account.
What is the type and purpose of overtime andcompensatory time worked, and what proportion isattributable to contracts?
Hours worked, including overtime and compensatory hours arerecorded in the agency’s Time and Activity System (TAS). Staffcode the type of overtime and compensatory time worked to fivecategories, with the highest proportion (41 percent) coded asattributable to call-outs. A call-out is an authorized overtimeactivity that occurs prior to the start of or after a regular shift. Itrequires the employee to return to work from an off-duty status.Collective bargaining agreements provide that some types of call-outs provide a minimum of two or four hours of compensation or,if in excess of the minimum, compensation at the overtime ratefor actual hours worked. The purpose of hours worked are codedto over 49 activity categories. We reviewed the purpose of theovertime worked for the 90 retirees in our sample and found thatmost were coded to ten activity categories with the highest threebeing: CFS (24.38 percent), general management (19.77 percent),and patrol (6.38 percent). Appendix 7 provides a summary of thetop ten purposes that overtime was coded to for the retirees in oursample.
WSP explained that coding to general management may be aresult of overtime worked by commissioned headquarters andacademy staff. The purpose of general management overtimecoded in the field could be attributable to activation of aheadquarters command post for reacting to a major event such asfire or floods, duty officer responsibilities, or possible miscodingby field staff.
Of the overtime worked by retirees in our sample, contractovertime (overtime primarily for DOT master contracts)represented 35 percent of the overtime worked.
$1.3 millionobligation tothe state
Call-out mostcommon typeof overtime
Washington State Patrol Performance Audit Page 27
How do the number of hours of overtime worked bypersons approaching retirement compare to hours workedby other commissioned staff?
During fiscal years 1997 and 1998, the average current trooperand sergeant worked 121 hours of overtime per year.23
Commissioned retirees who retired between July 1, 1996, andMarch 30, 1998, worked an estimated average of 172 hours ofovertime per year during the last 24 months of employment priorto retirement, or 42 percent higher than the average.
In order to make the comparison of overtime hours for theretirees with current troopers and sergeants, we had to calculatethe number of hours the average retiree worked each year duringtheir last 24 months of employment. To do this, we divided theaverage regular salary increase for the retirees that wasattributable to paid overtime and comp time ($6506) by 1.67. Weused 1.67 (rather than 1.5 for time and one-half)24 because, asexplained above, typically there is a portion of the overtimecompensation for which an individual receives a minimum of twoor four hours of pay.
Agency staff asked us to test the hypothesis that younger stafftend to work a higher amount of overtime than their more seniorcounterparts. We tested this observation by correlating themonthly salary with hours of overtime worked for the 66sergeants, and a random sample of 12225 of the 560 troopers whoworked overtime in both fiscal years 1997 and 1998. Although wedid not have date of birth/age information for the troopers andsergeants in our data, we did have monthly salary information.One could reasonably assume that a lower monthly salary islikely associated with an entry level, therefore younger, employee.
23 This data does not include all persons who were eligible to work overtime,but rather only those who worked overtime during this period, and maycontain individuals who are within their last 24 months of employment withthe WSP.24 If we were to use the standard 1.5 overtime multiplier that is used by theagency for budgeting purposes, the overtime hours worked for the averageretiree would equate to 192 hours per year during the last 24 months ofemployment prior to retirement.25 A random sample of 122 of 560 troopers has a 95 percent confidence levelwith possible error of 8 percent.
Personsapproachingretirementworked moreovertime …
... as comparedto othercommissionedstaff

Page 28 Chapter Two: Compensation Issues
To the extent that there is any association between salary andovertime hours for the current troopers and sergeants, it is veryslightly in the direction of more overtime hours associated withhigher salary.26
In conclusion, we found that the average current trooper andsergeant works less overtime per year than did the averageretiree in our sample in the two years prior to retirement.Further, we found lower paid troopers and sergeants are notworking more overtime than those in higher salaried positions.
What controls does the agency have in place for rotation ofovertime assignments?
The WSP Regulation Manual, Section 5.07.020 provides directivesregarding the use of overtime. It states that any commissionedofficer may receive overtime with the express approval of theChief or designee, and requires that officers shall get pre-approval from a supervisor prior to working overtime if asupervisor is on duty. The regulation also provides for situationswhere if an officer is unable to contact a supervisor for pre-approval of unanticipated overtime, the officer can still work theovertime and be paid for the necessary overtime.
We reviewed district policies and procedures relating to rotationpractices and assignment of call-out overtime. As explainedearlier in this chapter, call-out overtime accounts for the highestproportion of the type of overtime worked by commissionedstaff.27 Call-out overtime can be for a variety of purposesincluding responding to CFS and collisions. For descriptivepurposes we refer to this as “regular” call-out overtime. Call-outovertime is also the type of overtime DOT contract assignmentsare coded to. Officers voluntarily sign-up to be on a rotation listfor DOT contract overtime assignments. We reviewed districtpolicies and procedures relating to rotation and assignmentpractices for both regular call-out overtime and contract overtime.
26 Multiple R 0.1279; R Square of .0016, Total observations 188. Since thenumber of retirees within the sample for this correlation is zero, they had noeffect.27 Call-out overtime is overtime which requires an employee to return to workfrom an off-duty status.
Call-outovertimepoliciesreviewed
Washington State Patrol Performance Audit Page 29
REGULAR CALL-OUT OVERTIMEPOLICIES
Three of the eight districts have a written policy in place thatdirects on-duty supervisors in their decisions of calling out atrooper or sergeant. The policies have provisions that describe arotation process for selection of a trooper/sergeant based on shiftstart and end times, geographic location of the incident, priorityof the incident, and limiting response time. Provisions such asthese provide for controls in terms or rotation of call-outassignments based on criteria appropriate for the district. Theyalso address performance considerations such as coverage andresponse times relative to priority of the call.
Finding
The general overtime policy in the WSP Regulation Manual isbroad because it is written to be applicable for all districts. Itdoes not provide the level of specificity that would includerotation practices for call-out overtime. Due to variationsbetween the districts in staffing, geography, and types of servicesprovided based on client needs, it is appropriate that policies andprocedures addressing regular call-out rotation be created at thedistrict level. This is consistent with other district-specificmanagement practices, such as different approaches to courtovertime scheduling because of varying practices of the courtdistricts.
Controls in terms of rotation of the call-out assignments amongofficers, and performance considerations such as coverage andresponse times relative to priority of the call, presently are left toindividual on-duty supervisor discretion in five of the eight WSPdistricts.
Call-outrotationcontrols

Page 30 Chapter Two: Compensation Issues
Recommendation 3
The Washington State Patrol should pursueimplementing district policies relating to regularcall-out overtime. These policies should providecontrols in terms of rotation of call-out assignments,and address operational considerations such as howcall-out policy affects response time by priority ofcall.
CONTRACT OVERTIME POLICIES
We reviewed contract overtime policies and procedures for each ofthe eight districts. Districts have similar approaches thatindividuals follow to voluntarily sign up to be placed on a rotationlist to work contract overtime assignments. As expected, therewere some differences in rotation practices among districts thatrelated to staffing and geographic considerations. We found someinconsistencies in the policies. We brought these to WSP’sattention, and they indicated they would be following-up on themduring the course of the audit.
The first inconsistency relates to the break in service requiredbetween contract overtime shifts and regular shifts. Some of thedistrict policies required an eight-hour break in service betweenregular shifts and contract overtime shifts in order to addresssafety considerations (fatigue) of officers. It is reasonable toassume that an officer may be at safety risk or may not performto a normal standard if fatigued from working regular andcontract overtime shifts without a sufficient rest period beforereturning back to a regular shift. Other district policies requireonly a four-hour break in service between regular and contractovertime shifts. Collective bargaining provisions require a four-hour break in service. Consistent with that provision, the WSPRegulation Manual 5.02.22 limits the off-duty employment ofofficers to no more than 8 hours per work day, not to exceed 24hours during the work week (excluding days off), with theemployment ending at least four hours prior to the beginning of ashift. This means that an individual can work an eight-hourregular shift, work an eight-hour contract overtime shift, have arest period of 4 hours, then return to an eight-hour regular shift.
Breaks inservice vary
Inconsistencyin districtcontractovertimepolicies
Washington State Patrol Performance Audit Page 31
The second inconsistency relates to prohibition of self-reassignment of contract overtime. As discussed above, alldistricts have a similar approach for persons to voluntarily sign-up to be placed on a rotation list to be called-out for contractovertime assignments. Half of the districts have provisions intheir policies where if an individual accepts a contract overtimeassignment, then finds he or she cannot work the assignment, heor she must notify a contract overtime coordinator and thatcoordinator will reassign the contract overtime to the nextavailable person on the rotation list. These four district policiesprovide reference to a prohibition of “self-reassignment.” Theother four districts do not have provisions to prohibit, nor do theymake mention of self-reassignment of contract overtime. Thisissue was raised by a WSP internal audit conducted in fiscal year1997.
WSP acknowledges the discrepancies in the policies regardingself-reassignment and the requirements for either eight- or four-hour breaks between regular shifts and contract overtimeassignments. During the course of the audit, WSP stated theirintention to send an “Interoffice Communication” and discusswith district commanders “…expectations of district compliancewith the policy.” The WSP also stated that guidelines and policyregarding self-reassignment of contract overtime would bediscussed.
Recommendation 4
The Washington State Patrol should continue topursue consistency and compliance in its policies foroperations of contract overtime. Controls prohibitingself-reassignment of overtime should be presentwithin policies of each district.
Note: Although we are not making a recommendation concerningbreaks in service between regular shifts and contract overtimeshifts, if the department has identified safety or performanceissues associated with current agency regulations and collectivebargaining agreement provisions, we propose that this beaddressed with the collective bargaining unit.
WSPacknowledgesdiscrepancies
Inconsistentreassignmentpolicies
Page 32 Chapter Two: Compensation Issues
POST-RETIREMENT EMPLOYMENT WITHWSP
Is post-retirement employment being conducted for thebenefit of the state? And is there an added cost to the statefor this practice?
In the course of our review of overtime use by 90WSP RetirementSystem (WSPRS) retirees, we found that 40 percent of thoseindividuals had returned to employment with the State ofWashington in Public Employee Retirement System Plan 1(PERS 1)-eligible positions. Of the 90, 27 percent had returned toemployment with WSP. Most were rehired within six weeks ofretirement from WSP.
After making this observation, we engaged the Office of the StateAuditor to review the agency’s rehiring practices and retirementeligibility criteria. We reviewed whether there are any additionalcosts to the state associated with the pension policy and agencyhiring practices. As described earlier, we also quantified theincentive to the individual of retiring from the WSP in a WSPRetirement System-eligible position and then becoming rehiredinto positions with the WSP under the PERS 1 system.
WSPRS allows retirees to maintain their full retirement benefitand obtain employment with the state in a non-WSPRS position.WSPRS and the Law Enforcement Officers and Fire Fighterssystem (LEOFF1, which is now closed), are the only retirementsystems that permit this.
The State Auditor found that the rehired employees’ eligibility forPERS1 was appropriately determined and that the agency’s post-retirement employment practices were proper. The Auditor’stesting indicated that a vast majority of persons hired into aspecific unit were previously commissioned WSP officers, and that21 of the 25 rehired employees reviewed were hired into onespecific unit at the WSP.
We did not find that there is an additional salary or materialbenefit cost increase to the state of the pension policy andsubsequent WSP post-retirement employment practices. This isbecause the positions filled by the WSP were existing vacant
SomeWSPRSretireesreturn towork at WSPin PERS 1positions
WSPrehiringpracticesare proper
Washington State Patrol Performance Audit Page 33
positions. Therefore, the state would incur salary and benefitcosts for the positions regardless of whether they were filled byWSP retirees or individuals from outside the agency.
However, as explained below, there is a disincentive forindividuals to remain employed as WSP commissioned officers.The loss to the state then is a portion of its training investmentand staff experience in a particular field.
There is a disincentive for the average WSPRS retirement-eligibleemployee to remain in a commissioned position. This is becausethey can, on average, realize an additional $183,146 (presentvalue) or an additional $11,425 (annual equivalent) per year forthe remainder of their life for retiring from the WSP andbecoming rehired by the WSP in a PERS 1-eligible position.28
We provide the above information because prior to this, rehiringpractices had not been reviewed by the State Auditor, nor was theextent of rehiring fully known by the Office of the State Actuary.The agency does make note that from their perspective, there is abenefit to hiring experienced, trained staff into the positions.
28 Based on working 13 years in the PERS1-eligible position.
Disincentiveto remaincommissionedofficer
PATROL ACTIVITES ON COUNTY ROADS
Chapter Three
INTRODUCTION
The primary responsibility of the Washington State Patrol (WSP)is to provide traffic related enforcement services on state andinterstate highways. Even though it has no specific mandate todo so, the Patrol historically has also provided some services oncounty roads. In January 1998, feeling that the current trooperresponse level on state and interstate highways was belowacceptable levels, the Legislative Transportation Committee(LTC) directed the Chief of the State Patrol to take certainactions to limit county road activities.29
This chapter explores the extent of service level reductions oncounty roads that might be expected to result from implementingLTC’s directive, in order to help assess the impact it could haveon future Patrol operations.
BACKGROUND
The Patrol has characterized its provision of service on roadsother than state and interstate highways as follows:
“ . . . at the request of other local law enforcement agencies,troopers will respond to any collision or incident thatrequires specialized equipment and expertise. If there is nodeputy available to conduct a collision investigation, theState Patrol will also respond to collisions on county roads.”
29 This directive was communicated in a letter signed by the Chairs andRanking Minority Members of the House and Senate TransportationCommittees, as well as the Co-Chairs of the WSP Working Group.
LTC hasdirected thePatrol toreducecounty roadactivities

Page 36 Chapter Three: Patrol Activities on County Roads
The Patrol’s goal is to limit statewide calls-for-service on countyroadways to no more than “ten percent of all law enforcementactivities.” It measures this by calculating “county road contacts”as a percentage of all contacts. As recorded in its Time andActivity Reporting System, “contacts” are broken down into threemain types: collision investigations, other calls for service, andself-initiated contacts. According to the Patrol’s data, county roadcontacts as a proportion of all contacts has dropped fromapproximately 20 percent in 1990, to between 7 and 8 percentover the past four years.
In terms of total numbers, the Patrol recorded 90,215 county roadcontacts in FY 1998. To estimate the total equivalent number oftroopers devoted to county road activities, the Patrol uses anaverage of fifteen minutes per contact, and 2,088 hours pertrooper per year. On this basis, the Patrol estimates that 10.8troopers are devoted to county road activities.
As noted, the LTC has directed the Patrol to take certain actionsto reduce the Patrol’s activities on county roads, effective January1, 1999. Based upon our reading of the Committee’s directive, aswell as on conversations with LTC staff, our understanding isthat the LTC’s expectation is as follows:
Patrol activities on county roads are to be limited almostentirely to just the investigation of injury or fatalityaccidents. There will be no investigations of non-injuryaccidents, or routine patrolling of county roads. So-called“self-initiated contacts” are to occur only if a trooper “spotssomething” while traveling to or from another work-site.Other calls for service are to be similarly limited to whatmight be considered exceptional circumstances.
In correspondence dated November 2, 1998, the Chief reportedthat this was consistent with the Patrol’s understanding of theLTC’s expectations.
County roadcontactshave beendecreasing
Activities tobe limitedmainly toinjury andfatalityaccidents
Washington State Patrol Performance Audit Page 37
ASSESSMENT OF CURRENT SERVICELEVELS
To quantify the potential impact of implementing the LTCdirective, it was first necessary to ascertain the amount of troopertime currently spent on county roads (something more exact thanthat afforded through using the Patrol’s “fifteen-minute-per-contact average”).
Although the Patrol’s Time and Activity Reporting System (TAS)does maintain data on trooper time by type of activity, that datacannot be extracted separately for just those activities thatoccurred on county roads. Thus, it was necessary to mergeinformation from two separate data sources. For actual contacts(collision investigations, other calls for service (CFS), and self-initiated contacts), this involved calculating the average amountof time for each type of contact in a given area, and applying thataverage to the number of contacts of that type that wereseparately recorded as having occurred on county roads.30
“Patrol” hours were allocated based upon the number of self-initiated contacts on county roads as a percentage of all self-initiated contacts. “Administration” hours were limited to thesub-category activities of court time, equipment maintenance andevidence management. These hours were then allocated tocounty road activities based on the number of all county roadcontacts as a percentage of all contacts. For both patrol andadministration hours, all calculations were made separately foreach geographic area.
In total, we estimated that in FY 1998, troopers spent 92,399hours on county road activities. Based on a total of 1,817 hoursper trooper per year, which is the average amount actuallyworked by troopers in FY 1998, this is the equivalent of justunder 51 FTE troopers. At an average cost of $73,126 per trooperper year, which includes regular salary, overtime, benefits and
30 Because of some differences in geographic boundaries used in the twoseparate data sources, it was necessary to group certain counties together, as isshown in exhibits later in the chapter.
An estimated51 trooperFTEs used forcounty roadactivities

Page 38 Chapter Three: Patrol Activities on County Roads
patrol car expenses, we estimate the direct annual cost ofproviding these county road services to be $3.7 million.
Exhibit 8 shows how the total number of hours are distributed byactivity type. Exhibit 9 shows how they are distributed bycounty.
TARGET SERVICE LEVELS
To quantify the potential impact that might be expected to resultfrom implementing the LTC directive, some “target” level ofservice needed to be established.31 To do so, it was necessary tofirst establish a common denominator; that is, a measure thatwould account for differences in traffic volume and roadwaymiles. With data on vehicle miles traveled by roadway type,32 wetranslated current county contact numbers–for each contact typeand for each geographic area–into “rates per one million annualvehicle miles traveled.”
This allowed us to rank each geographic area in terms of itscurrent “service level” for each contact type. In doing so, it wasimmediately apparent that there was substantial variation incurrent contact rates. In particular, some areas had rates thatwere far in excess of what was typical. Exhibit 7 below providesan example of the high, median, and low rates for self-initiatedcontacts.
31 The term “target level” is used only as a matter of convenience for referringto potential future service levels. It is recognized that actual service levels willreflect legislative and executive policy decisions.32 “Approximate Daily Vehicle Miles Traveled,” from the 1997 HighwayPerformance Monitoring System, Department of Transportation.
Servicelevels basedon rates permilestraveled

Washington State Patrol Performance Audit Page 39
Exhibit 7
Source: JLARC, based on WSP and DOT data.
Establishing target levels can be done in a number of ways.Initially, we set the target level (for each contact type) at thelower of each area’s current number of contacts, or what itsnumber would be if its rate were equal to the median of allareas. Because that is the point at which half the areas are aboveand half are below, it is a level that should not be too difficult toachieve (since, indeed, half of the areas already operate at orbelow that level).33
To give a range of possible reductions, we elected to establish asecond target level based on the 25th percentile. This is thepoint at which three-quarters of all areas are above, and one-quarter are below.
By type of activity, Exhibit 8 shows the total hourly reductionswhich could be expected under each target level. As can be seen,no reductions are included for injury collisions. This is becausethe LTC directed the Patrol to continue to provide current levelsof service for fatal and injury accident investigations.
Exhibit 9 shows the reductions which could be expected by countyin terms of hours, FTE troopers, and cost. Based on the hour andcost figures noted earlier in this chapter (1,817 hours and $73,126 33 Using the information from Exhibit 7, the following illustrates how thetarget level setting process works (based on the “median” target level).Because current rates for self-initiated contacts in Thurston and WhitmanCounties are either equal to or less than the median rate, their target numberof contacts stay the same as their current numbers; 2,051 and 130,respectively. However, because Pacific County’s current rate is higher thanthe median rate, its target number is reduced from its current level of 708, to160, which is what it would be if its rate were equal to the median rate (5.60 x(28,610,525 / 1,000,000)).
County Annual Vehicle Number of SIC Rate PerMiles Traveled Self-Initiated One Million Vehicle
On County Roads Contacts (SIC) Miles Traveled
Pacific (highest) 28,610,525 708 24.75Thurston (median 366,086,605 2,051 5.60Whitman (lowest) 119,540,420 130 1.09
Example of Current Service Level Rates For Self-Initiated Contacts
Report offerstwoillustrationsof possibleservice levelreductions
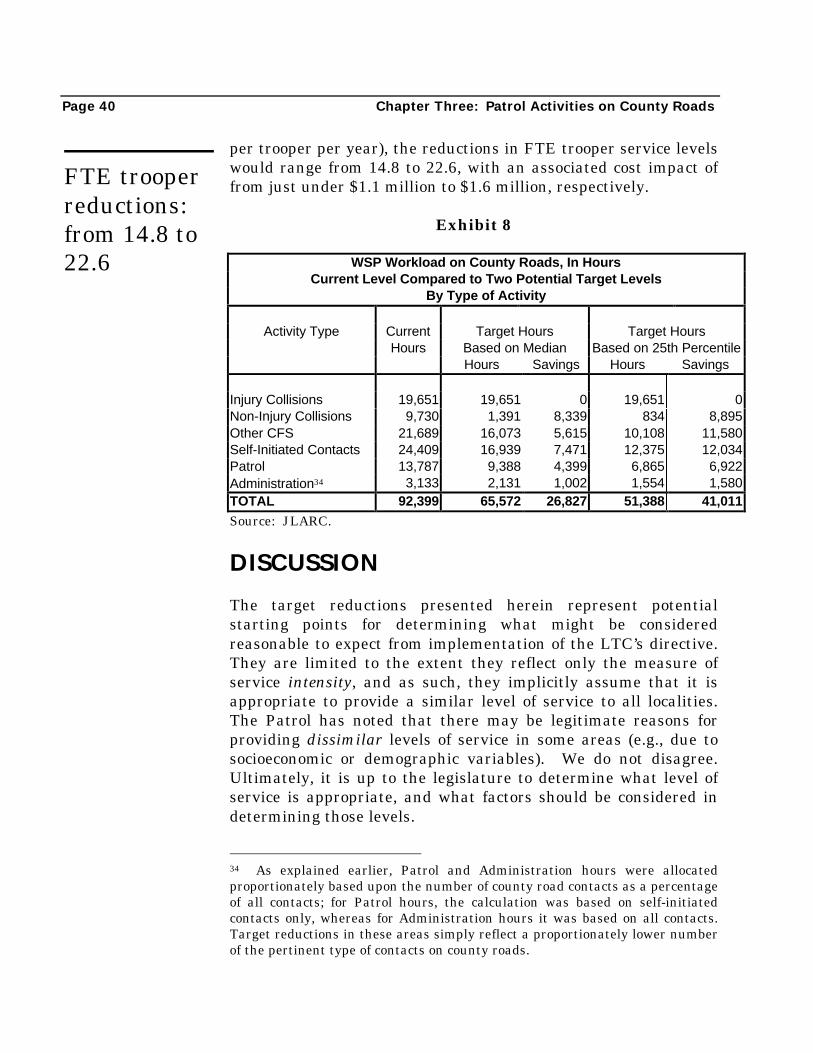
Page 40 Chapter Three: Patrol Activities on County Roads
per trooper per year), the reductions in FTE trooper service levelswould range from 14.8 to 22.6, with an associated cost impact offrom just under $1.1 million to $1.6 million, respectively.
Exhibit 8
WSP Workload on County Roads, In HoursCurrent Level Compared to Two Potential Target Levels
By Type of Activity
Activity Type Current Target Hours Target HoursHours Based on Median Based on 25th Percentile
Hours Savings Hours Savings
Injury Collisions 19,651 19,651 0 19,651 0Non-Injury Collisions 9,730 1,391 8,339 834 8,895Other CFS 21,689 16,073 5,615 10,108 11,580Self-Initiated Contacts 24,409 16,939 7,471 12,375 12,034Patrol 13,787 9,388 4,399 6,865 6,922Administration34 3,133 2,131 1,002 1,554 1,580TOTAL 92,399 65,572 26,827 51,388 41,011
Source: JLARC.
DISCUSSION
The target reductions presented herein represent potentialstarting points for determining what might be consideredreasonable to expect from implementation of the LTC’s directive.They are limited to the extent they reflect only the measure ofservice intensity, and as such, they implicitly assume that it isappropriate to provide a similar level of service to all localities.The Patrol has noted that there may be legitimate reasons forproviding dissimilar levels of service in some areas (e.g., due tosocioeconomic or demographic variables). We do not disagree.Ultimately, it is up to the legislature to determine what level ofservice is appropriate, and what factors should be considered indetermining those levels.
34 As explained earlier, Patrol and Administration hours were allocatedproportionately based upon the number of county road contacts as a percentageof all contacts; for Patrol hours, the calculation was based on self-initiatedcontacts only, whereas for Administration hours it was based on all contacts.Target reductions in these areas simply reflect a proportionately lower numberof the pertinent type of contacts on county roads.
FTE trooperreductions:from 14.8 to22.6

Washington State Patrol Performance Audit Page 41
To link to this exhibit, click here.

Page 42 Chapter Three: Patrol Activities on County Roads
The LTC indicated in its directive that it was to take effectJanuary 1, 1999. In correspondence, the Chief told us that thePatrol will not be able to fully implement it by that date, andfurther, that it does not have a “final date for full implementationdue to difficulties being encountered in some counties.”
We did not audit what impact implementation of the directivecould have on individual counties. We did, however, contact theSheriff’s Office in two counties that rely heavily on Patrolservices. In both cases, the individuals we spoke with indicatedthat implementation of the directive would cause a significanthardship for their counties. Officials in the Spokane CountySheriff’s Office reported seeking 15 additional deputies from theCounty to offset the expected reduction in WSP assistance, whilerepresentatives of the Snohomish County Sheriff’s Office reportedseeking 17 additional deputies for that purpose. It should benoted that these estimates are higher than our estimates of theFTEs currently being provided by WSP, and are substantiallyhigher than the savings in Patrol’s FTEs that would result ifeither of the two illustrative target service levels were achieved(see Exhibit 9).

COMMERCIAL VEHICLE DIVISIONTRANSITION PLANNING
Chapter Four
BACKGROUND
In May 1995, the Department of Labor and Industries (L&I)issued a Citation and Notice of Assessment to Washington StatePatrol (WSP) operations related to the Commercial VehicleDivision’s (CVD) operations. The citation identified safetyviolations related to the adequacy of personal defense devices andmeans of self-defense for CVD personnel in the event of assault orother criminal activities. The citation has led to suggestions thatCVD personnel be provided body armor, additional training, andprotective weapons as a means to improve self-defense.
In February 1996, the WSP and representatives of the threebargaining units of the CVD entered into an agreement totransition unarmed Commercial Vehicle Officers (CVOs) toarmed Commercial Vehicle Enforcement Officers (CVEOs). Thistransition agreement had a short-term component that providedfor additional academy training and field coaching. Under thisagreement CVEOs are not considered to be fully commissionedtroopers, and enforcement powers continue to be limitedprincipally to inspecting commercial vehicles as to compliancewith size, weight, and load regulations, and to checking for properpermits and licensing. It is our understanding that the CVDimplemented this short-term component of the agreement.
In addition, the agreement provided that over the long-term, fullycommissioned officers would fill all CVD position vacancies.Current CVEOs could apply for trooper equivalency training andwould be given priority in enrolling in new trooper academyclasses. CVD had begun the process of implementing the long-term component of the agreement.
Labor &Industriescitations ledto transitionto armedofficers in1996

Page 44 Chapter Four: Commercial Vehicle Division Transition
During the 1998 Legislative Session, a number of bills weredrafted proposing that CVEOs be given added powers and duties.While none of these bills passed, the WSP presented a comparisonof three transition plan options to the Legislative TransportationCommittee (LTC). In addition, a fourth option was developed bya WSP Working Group of the LTC near the completion of ourperformance audit.
The options are described below.
• Option 1 represents further implementation of the originaltransition agreement to transition unarmed CVOs to fullyarmed CVEOs. This option was developed by the WSP.
• Option 2 represents further implementation of the transitionagreement to include the opportunity for trooper equivalencycommissioning training of additional CVEOs and adding entrylevel CVO positions. This option was developed by the WSP.
• Option 3 would provide additional commercial vehicleauthority to CVEOs, but would provide substantially lessadditional training than the other options. This option wasdeveloped and proposed by the CVEO bargaining units.
• Option 4, developed in November 1998, proposes that the WSPabandon the original plan to transition to fully commissionedofficers and that CVEOs fill all open positions. CVEOs wouldbe given additional authority only as it relates to commercialvehicle traffic violations and would not be given additionalauthority for DUI, arrest, and criminal activities. This optionwas developed by a WSP Working Group of the LTC near thecompletion of our performance audit.
We are not aware that any final decision has been made at thistime to pursue any of these options as currently defined.
Options fortransitionwerepresented toLTC
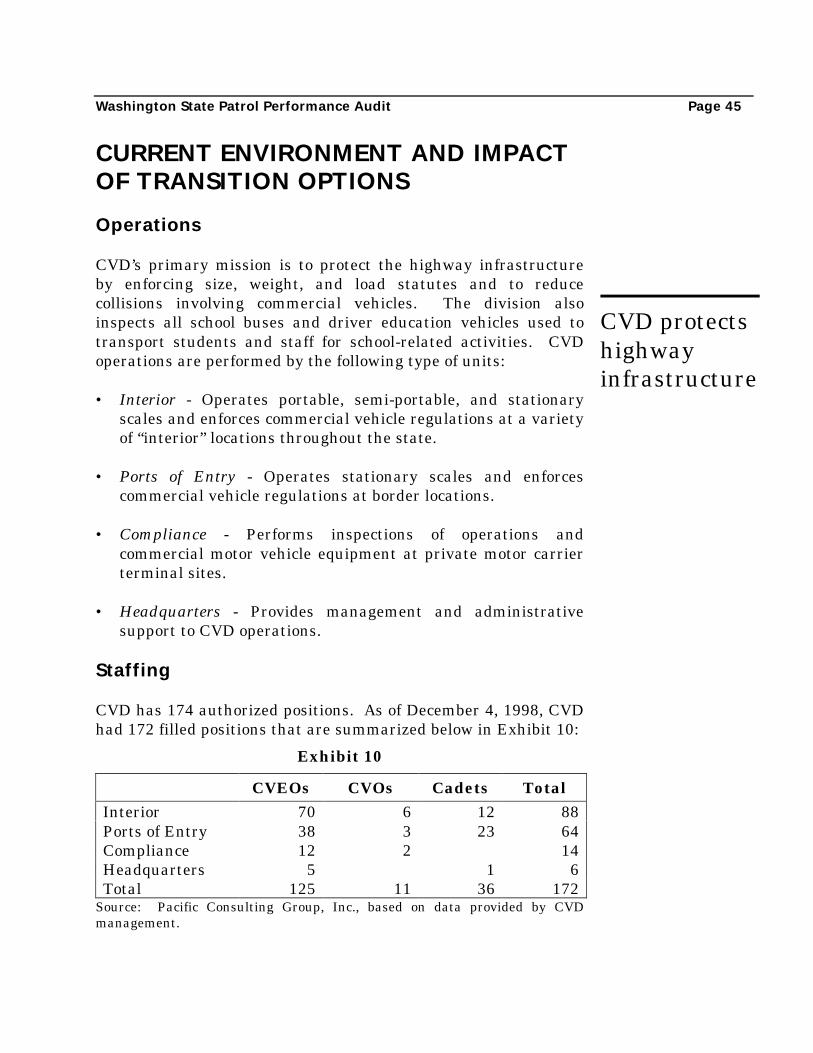
Washington State Patrol Performance Audit Page 45
CURRENT ENVIRONMENT AND IMPACTOF TRANSITION OPTIONS
Operations
CVD’s primary mission is to protect the highway infrastructureby enforcing size, weight, and load statutes and to reducecollisions involving commercial vehicles. The division alsoinspects all school buses and driver education vehicles used totransport students and staff for school-related activities. CVDoperations are performed by the following type of units:
• Interior - Operates portable, semi-portable, and stationaryscales and enforces commercial vehicle regulations at a varietyof “interior” locations throughout the state.
• Ports of Entry - Operates stationary scales and enforcescommercial vehicle regulations at border locations.
• Compliance - Performs inspections of operations andcommercial motor vehicle equipment at private motor carrierterminal sites.
• Headquarters - Provides management and administrativesupport to CVD operations.
Staffing
CVD has 174 authorized positions. As of December 4, 1998, CVDhad 172 filled positions that are summarized below in Exhibit 10:
Exhibit 10
CVEOs CVOs Cadets Total
Interior 70 6 12 88Ports of Entry 38 3 23 64Compliance 12 2 14Headquarters 5 1 6Total 125 11 36 172
Source: Pacific Consulting Group, Inc., based on data provided by CVDmanagement.
CVD protectshighwayinfrastructure
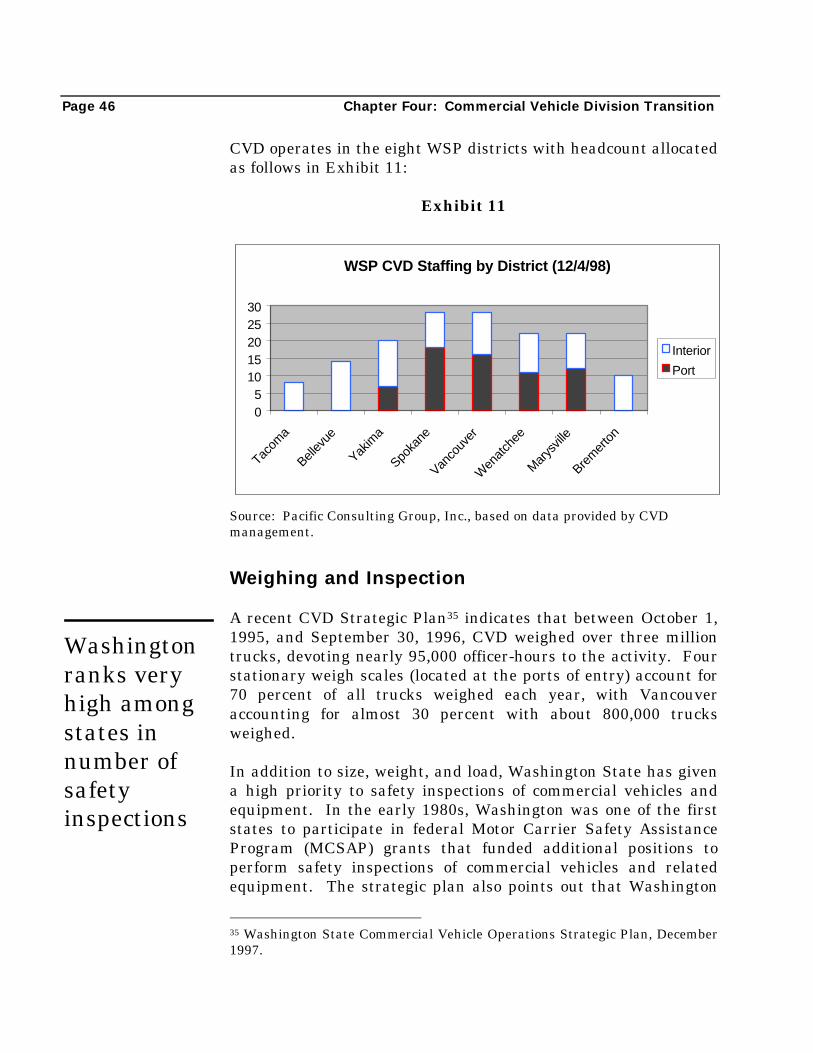
Page 46 Chapter Four: Commercial Vehicle Division Transition
CVD operates in the eight WSP districts with headcount allocatedas follows in Exhibit 11:
Exhibit 11
Source: Pacific Consulting Group, Inc., based on data provided by CVDmanagement.
Weighing and Inspection
A recent CVD Strategic Plan35 indicates that between October 1,1995, and September 30, 1996, CVD weighed over three milliontrucks, devoting nearly 95,000 officer-hours to the activity. Fourstationary weigh scales (located at the ports of entry) account for70 percent of all trucks weighed each year, with Vancouveraccounting for almost 30 percent with about 800,000 trucksweighed.
In addition to size, weight, and load, Washington State has givena high priority to safety inspections of commercial vehicles andequipment. In the early 1980s, Washington was one of the firststates to participate in federal Motor Carrier Safety AssistanceProgram (MCSAP) grants that funded additional positions toperform safety inspections of commercial vehicles and relatedequipment. The strategic plan also points out that Washington
35 Washington State Commercial Vehicle Operations Strategic Plan, December1997.
WSP CVD Staffing by District (12/4/98)
05
1015202530
Tacom
a
Bellev
ue
Yakim
a
Spoka
ne
Vanco
uver
Wen
atch
ee
Mar
ysvil
le
Brem
erto
n
Interior
Port
Washingtonranks veryhigh amongstates innumber ofsafetyinspections

Washington State Patrol Performance Audit Page 47
State ranked second behind only California in total number ofcommercial safety inspections performed. Such inspections areperformed at motor carrier terminals in addition to ports of entry,interior weigh stations, and by mobile patrol units.
Training
Until the transition process began, CVD training was basedprincipally on federal standards developed by the CommercialVehicle Safety Alliance (CVSA). Most of the training wasdesigned to make CVD officers CVSA certified. TransitioningCVOs to armed CVEOs required additional “arming” training.
The following summarizes approximate total classroom hours oftraining which were or are considered required for the currentenforcement authority and the various transition options.
Training Hours
Current CVEO training level:Basic CVO training 270CVEO arming training 130Total CVEO basic training 400
Option 1:Initial cadet arming training 352Subsequent trooper basic training 876Total for fully commissioned CVD troopers 1,228
Option 2:Initial cadet arming training 352Subsequent trooper basic training 796Total for fully commissioned CVD troopers 1,148
Option 3:Total CVEO current basic training 400Limited additional enforcement authority training 236Total for limited authority CVEOs 636
Transitioningresults insubstantialadditionaltraining
Page 48 Chapter Four: Commercial Vehicle Division Transition
Option 4:Additional training hours are not shown in the currentanalysis of Option 4, but the document shows total trainingcosts of $175,000.
The first trooper basic training class accepting CVD cadets whohave had the initial cadet arming training began on January 11,1999. We were informed that 5 CVEOs and 22 CVD cadets wereaccepted in the training program and transferred out of CVD atthat time.
Enforcement Authority
Currently, CVEO and CVO enforcement authority has beenlimited principally to size, weight, load, and equipmentmaintenance inspections for commercial vehicles. Even thoughCVOs who transitioned to CVEOs received additional armingtraining, they were not granted additional enforcement authority.In situations requiring additional enforcement action (e.g., DUI,speeding, outstanding warrant, etc.), a commissioned troopermust be called in for further action.
Both Options 1 and 2 provide sufficient training for officers tobecome fully commissioned troopers. They, therefore, would beempowered with full enforcement authority.
Option 3 provides for additional enforcement authority as itrelates to commercial vehicles in the areas of moving violations,DUI arrest, warrants, prisoner transport, accident response andassistance, officer assistance, and rendering aid and medicalassistance.
Option 4 provides additional authority only for moving violations,accident response (if required) and officer assistance.
Equipment
CVEOs in interior positions use vans that hold portable scales,certain emergency equipment, and other tools. These vehicles arenot considered appropriate as pursuit vehicles and are notdesigned for prisoner transport. Option 3 suggests initiallyretrofitting 60 vehicles with calibrated speedometers, prisoner
WSP’s Options1 and 2provide forfullenforcementauthority…
…whereasOption 3providesadditionalauthority,
and Option 4eliminatestransitioning

Washington State Patrol Performance Audit Page 49
transport equipment, and preliminary breath testers for a totalinitial cost of $41,440. Additional upgrades would occur in futureyears. Option 4 proposes retrofitting 60 vehicles with calibratedspeedometers for a total cost of $18,000.
Options 1 and 2 contemplate upgrading from vans to acceptablepursuit vehicles that would cost an additional $10,000 each (i.e.,$30,000 vs. $20,000).
Salary Costs
Each of the four options includes allowances for increases insalary costs to reflect upgrades to the new positions and/orincreases in levels of authority.
WORK PERFORMED
The focus of our review was to evaluate the efficiency andeffectiveness of the proposed CVD transition options in addressingthe WSP’s resource management requirements as well as theDepartment of Labor and Industries’ citation.
To conduct this element of the audit we:
• Interviewed key management of the following areas:
Ø Captain and support staff of the Commercial VehicleDivision
Ø Commander and support staff of Budget and FiscalServices
Ø Legal Officer, Office of the Chief
Ø Information Services Commander
Ø Captain and support staff of the WSP Academy TrainingDivision
• Interviewed the following outside of WSP:
Ø Department of Transportation CVISN Project Manager
Ø LTC staff

Page 50 Chapter Four: Commercial Vehicle Division Transition
Ø I.F.P.T.E. Local 17 Chapter President
Ø Local 17 Union Representative
Ø Department of Labor and Industries Field Supervisor
• Performed telephone surveys of the commercial vehicleenforcement agencies for Arizona, California, Colorado,Wisconsin, and Texas regarding enforcement classifications,staffing, and other related issues.
• Reviewed and analyzed a variety of documentation as detailedin this chapter’s bibliography.
• Visited the WSP Training Academy in Shelton and reviewedtraining operations and curriculum.
• Performed on-site visits and ride-a-longs with a CVEO;observed operations and interviewed staff at Kelso interiorweigh station and Vancouver port of entry scales; observed useof Weigh-in-Motion technology at the Vancouver scales;observed vehicle inspections performed at interior weighstations and Vancouver port of entry; and observed use ofportable scales at remote roadside locations.
FINDINGS
Based on the work performed, we present the followingobservations:
Department of Labor and Industries Compliance
It appears that L&I’s citation precipitated a level of arming andprotection beyond the minimum required to effectively addressthe violations reported. In particular, we believe it is notnecessary to require that all personnel be armed in locationsstaffed by multiple personnel. However, we believe that CVDpersonnel operating in mobile enforcement units do requireadequate training, arming and authority.
Response toL&I citationwas more thanminimumrequired
Washington State Patrol Performance Audit Page 51
Interior Locations versus Ports of Entry
There are significant differences in the environment for interiorlocations compared to ports of entry. In most instances portshave multiple personnel performing a number of functions atCVD fixed stations. CVD interior personnel operate individuallyor in small teams to perform enforcement activities.
When patrolling, the interior officers’ environment is similar tothat of a state trooper. The interior position duties, therefore,pose a much wider range of situations to be addressed whencompared to personnel at fixed locations.
Conversely, in the larger ports of entry, multiple personnel arepresent and they operate in a more controlled environment. Thisenvironment provides an opportunity for greater specializationand supervision. As we have stated before, not all personnel at aport of entry need be armed if at least one officer is armed.
Comparison of Transition Options
Based on our review of the training standards for various levels ofauthority, we believe that Option 3 does not provide sufficienttraining to effectively prepare CVEOs to address the range ofsituations that will accompany the greater enforcement authority.Therefore, we believe that Option 3, as currently defined, shouldnot be pursued.
The WSP prepared a detailed comparison of the three transitionoptions that were being considered as of September 1998.1 Theanalysis itself indicated little substantive difference betweenOptions 1 and 2 that were both proposed by the WSP. However,the analysis of Option 2 does not reflect the potentially significantsavings from using unarmed CVOs to the fullest extent possibleat ports of entry. Rather, it assumes full trooper salary costs forall open positions, as well as full trooper training for all newhires. Option 2 also provides credits to CVEOs for past trainingthus reducing overall training costs for those transitioning to fullcommission status.
1Commercial Vehicle Enforcement Staffing Study, Comparison of TransitionPlan Options, WSP Working Group, LTC, September 24, 1998.
Ports have amorecontrolledenvironment
Page 52 Chapter Four: Commercial Vehicle Division Transition
As previously mentioned, Option 4, which was not part of theWSP analysis, eliminates the use of fully commissioned officerswithin CVD and provides for additional authority only forcommercial vehicle moving violations.
Transition Planning Cost Analysis
As indicated above, WSP’s Budget and Fiscal Services preparedan analysis to assist in comparing the costs of the three transitionoptions. This document along with its supporting schedulesappears to represent the first comprehensive analysis comparingthe key differences in the three options.
The analysis of the comparative costs of the three options appearsto group together both one-time initial investment and ongoingannual operating costs. Although combining such costs forbudget purposes is necessary and appropriate, we believe thatseparately analyzing one-time and annual operating costs isnecessary to effectively evaluate alternatives.
In addition, the analysis of Options 1 and 2 do not reflect thepotential performance improvements and cost savings whichshould result by:
• Eliminating the need for CVEOs to request commissionedtrooper assistance for criminal violations.
• Providing fully commissioned troopers within CVD to respondto calls for assistance outside of normal CVD operations.
• Using less costly unarmed CVOs to the extent possible.
Technology Issues
Weigh-in-Motion technology is in place at some ports. It appearsto have a significant impact on the productivity of the stationsand, perhaps more importantly, to provide better and moreeffective service to the trucking industry. Due to the substantialgrowth in volume, it is questionable if this technology will reducecurrent staffing levels at the ports, but it most likely reduces theneed for increased staffing levels that might otherwise occur.
One-timeand annualcosts shouldbe separatedin evaluatingalternatives
Potentialperformanceimprovementsand costsavings arenot reflectedin Options 1and 2

Washington State Patrol Performance Audit Page 53
CVISN is a federally-initiated comprehensive information systemdesigned to transmit up-to-date data related to drivers, truckingcompanies and equipment. A pilot installation is planned at theVancouver port in early 1999. The combination of CVISN withweigh-in-motion appears to promise substantially greaterproductivity and performance for both CVD and truckers. CVISNshould enable CVD to quickly identify vehicles and drivers thatare more likely to be in noncompliance. This will significantlyreduce vehicle stoppages and inspections and therefore, improveproductivity of drivers and vehicles that tend to be in compliance.
STATE SURVEY OF COMMERCIALVEHICLE OPERATIONS
We performed a telephone survey of five states’ commercialvehicle operations to ascertain how their operations wereorganized and the type of staff used to perform commercialvehicle activities. The five states surveyed were Arizona,California, Colorado, Wisconsin, and Texas.
With the exception of California, the surveyed states use highlytrained individuals either classified as troopers/patrolmen orcommercial vehicle inspection officers to perform commercialvehicle inspections and other activities. California uses civiliansto perform inspections. Currently, Arizona has a specialty officerclass in their commercial vehicle operations. This classification ismandated by state law for commercial vehicle enforcementpurposes only. However, this classification will be phased outwithin three to five years, and patrolmen will perform allcommercial vehicle activities.
Full arrest authority is given to all troopers/patrolmen in thestates we surveyed. In Arizona, the commercial vehicle officershave arrest authority only as it pertains to commercial vehicleenforcement. In California, the commercial vehicle inspectionofficers also have full arrest authority.
The survey indicated that all troopers/patrolmen in all the statessurveyed as well as the Commercial Vehicle Officers in Arizona
Technologywillsignificantlystreamlineoperations
Mostsurveyedstatesprovide fullauthority

Page 54 Chapter Four: Commercial Vehicle Division Transition
and California are required to wear safety armor and are allowedto carry weapons.
In Arizona, the specialty officers do not go through the academy.They receive the federal commercial vehicle training as well ason-the-job training. In California, the civilians also do not gothrough the 22-week academy, but receive the federal commercialvehicle training and then on-the-job training. However, in theother states, all troopers/patrolmen go through the 22-weekacademy. In addition, all receive the federal commercial vehicletraining.
The complete survey results are shown in Appendix 8.
Recommendation 5
The legislature and the Washington State Patrolshould proceed with a Commercial Vehicle Divisiontransition plan that results in transitioning to fullycommissioned officers in interior positions and thatuses unarmed Commercial Vehicle Officers (CVOs) atports of entry to the extent possible.
TECHNOLOGY
Chapter Five
SUMMARY
The major focus of this chapter is to address the legislature’squestions concerning the adequacy of the technology systemsdeployed by the Washington State Patrol (WSP). Specificquestions include:
• Are the systems in place cost-effective and are they operatedefficiently?
• Do these systems adequately serve the needs of the patrol andother justice system and local law enforcement users?
This chapter contains two recommendations that support futureenhancements of the state Automated Fingerprint IdentificationSystem (AFIS) and strategic planning of the Patrol’s MobileComputer Network (MCN). The review found that the Patrol hasgenerally applied proven technology in an efficient manner tomeet critical public safety needs. However, in the past the statehas not made sufficient investments in public safety computerand communications infrastructure, and several key systemshave become outdated. State Patrol investments in technologyare dependent on funding decisions made by the legislature. ThePatrol has been directed by the legislature to improve publicaccess to state criminal history records, and has successfullyimplemented cutting-edge Internet technology to meet thischallenge.
Auditquestions

Page 56 Chapter Five: Patrol Technology
OVERVIEW
This review focuses on the support services of the State Patrol,also called the Technical Services Bureau. State Patrol supportservice operations that deal extensively with computers andtelecommunications include:
1. Accident Records Section, Criminal Records Division
2. Information Services Division
3. Property Management Division (radio tower maintenance)
4. Electronic Services Division
5. Criminal Records Division
WSP owns and operates computer systems to manage criminalhistories, traffic accident data, and suspect identification andfingerprint identification. The State Patrol also owns andoperates a statewide voice and data communications system thatis nearly as complex as many commercial cellular operations.
Exhibit 12 shows major State Patrol technology systems at thestate patrol.
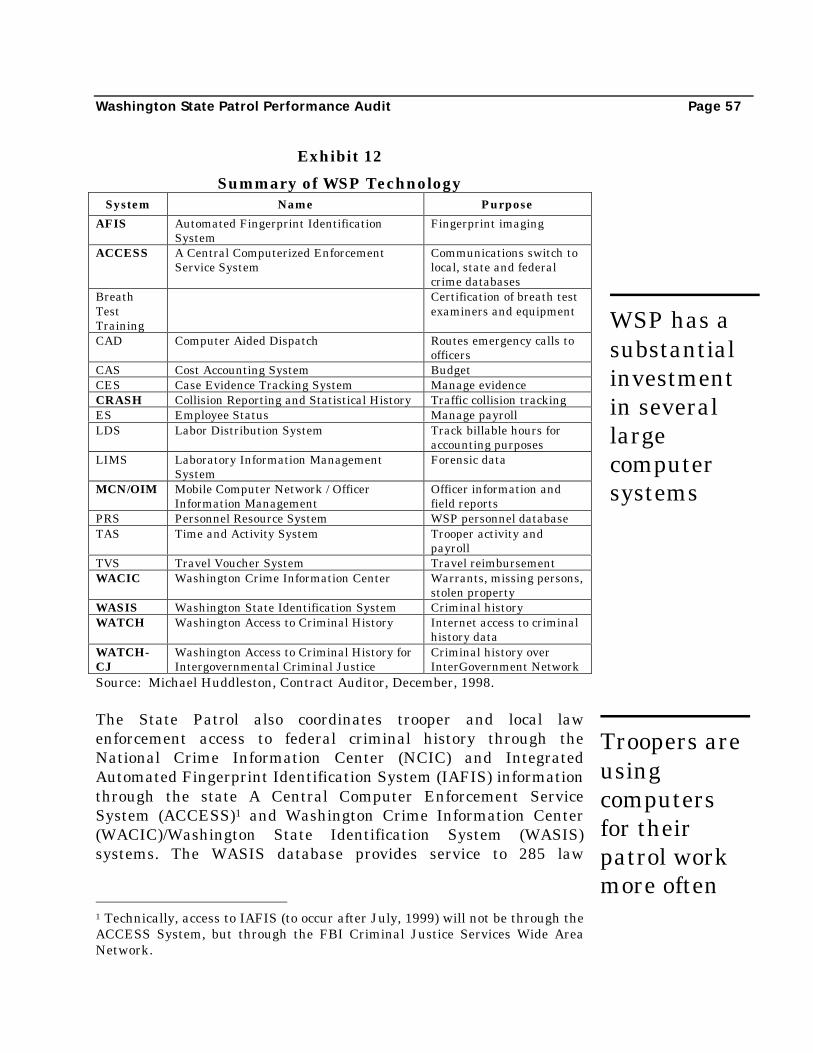
Washington State Patrol Performance Audit Page 57
Exhibit 12
Summary of WSP TechnologySystem Name Purpose
AFIS Automated Fingerprint IdentificationSystem
Fingerprint imaging
ACCESS A Central Computerized EnforcementService System
Communications switch tolocal, state and federalcrime databases
BreathTestTraining
Certification of breath testexaminers and equipment
CAD Computer Aided Dispatch Routes emergency calls toofficers
CAS Cost Accounting System BudgetCES Case Evidence Tracking System Manage evidenceCRASH Collision Reporting and Statistical History Traffic collision trackingES Employee Status Manage payrollLDS Labor Distribution System Track billable hours for
accounting purposesLIMS Laboratory Information Management
SystemForensic data
MCN/OIM Mobile Computer Network / OfficerInformation Management
Officer information andfield reports
PRS Personnel Resource System WSP personnel databaseTAS Time and Activity System Trooper activity and
payrollTVS Travel Voucher System Travel reimbursementWACIC Washington Crime Information Center Warrants, missing persons,
stolen propertyWASIS Washington State Identification System Criminal historyWATCH Washington Access to Criminal History Internet access to criminal
history dataWATCH-CJ
Washington Access to Criminal History forIntergovernmental Criminal Justice
Criminal history overInterGovernment Network
Source: Michael Huddleston, Contract Auditor, December, 1998.
The State Patrol also coordinates trooper and local lawenforcement access to federal criminal history through theNational Crime Information Center (NCIC) and IntegratedAutomated Fingerprint Identification System (IAFIS) informationthrough the state A Central Computer Enforcement ServiceSystem (ACCESS)1 and Washington Crime Information Center(WACIC)/Washington State Identification System (WASIS)systems. The WASIS database provides service to 285 law
1 Technically, access to IAFIS (to occur after July, 1999) will not be through theACCESS System, but through the FBI Criminal Justice Services Wide AreaNetwork.
WSP has asubstantialinvestmentin severallargecomputersystems
Troopers areusingcomputersfor theirpatrol workmore often

Page 58 Chapter Five: Patrol Technology
enforcement agencies, 234 courts, and hundreds of public andprivate organizations.
In addition, the State Patrol uses 1,28536 desktop personalcomputers, 194 laptop computers and 417 MCN computers(primarily assigned to troopers) which are largely inter-connectedover an agency “Wide Area Network” also known as WSPNet.
Systems shown in bold font in Exhibit 12 above are the primarysubject of this report. The other systems did not result in auditfindings.
ORGANIZATIONAL STRUCTURE
Among the organizational charts provided by the State Patrol forthis audit, the “Budget Structure” chart for the 1999-2001Biennium provides the most useful view of the Patrol’stechnology-related functions.
The State Patrol is heavily dependent on its computer and radiosystems. Mainframe computers are used as the repository ofcentralized statewide criminal data, while desktop and laptopcomputers are assigned to investigative staff and officers in thefield. The UHF radio system is used to provide datacommunications between line vehicles and WSP resources. Themicrowave systems are used to share data between computersystems throughout the state.
The “Budget Structure” organization chart is shown in Exhibit 13below. Note: the budget structure is not reflective of themanagement structure as found in the agency’s organizationalchart.
36 WSP Memo: “Feedback to JLARC – Patrol Technology and Communications”dated December 17, 1998.
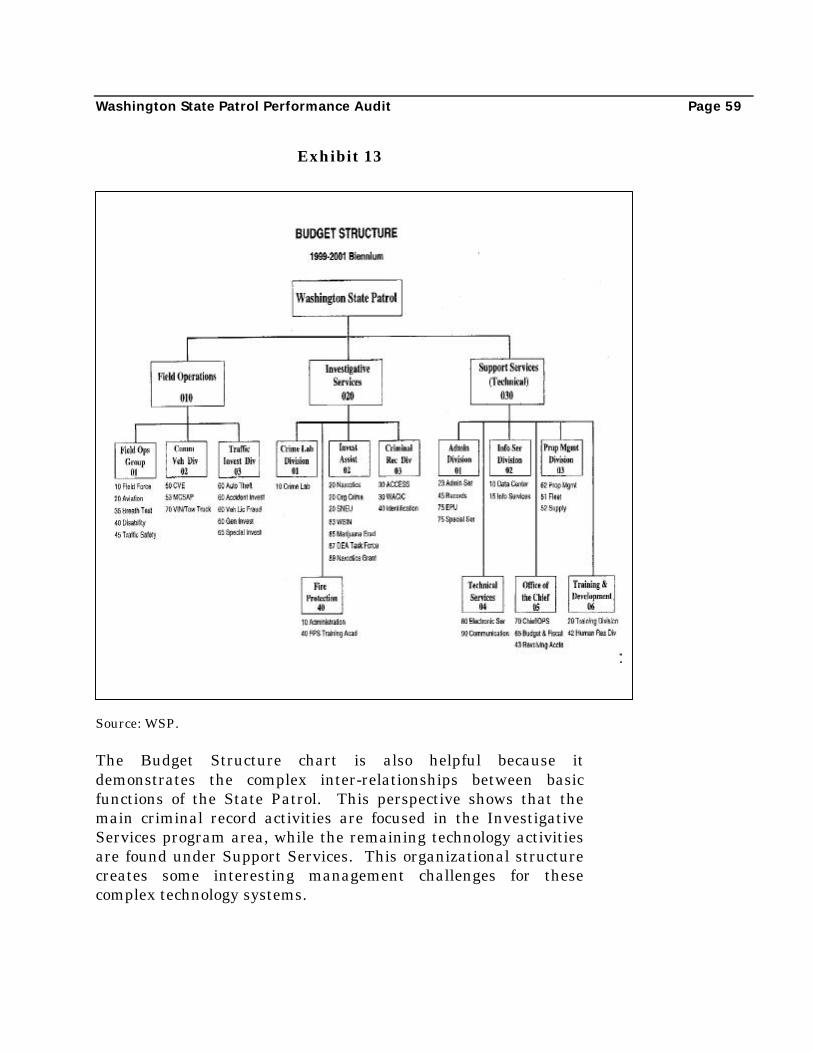
Washington State Patrol Performance Audit Page 59
Exhibit 13
Source: WSP.
The Budget Structure chart is also helpful because itdemonstrates the complex inter-relationships between basicfunctions of the State Patrol. This perspective shows that themain criminal record activities are focused in the InvestigativeServices program area, while the remaining technology activitiesare found under Support Services. This organizational structurecreates some interesting management challenges for thesecomplex technology systems.
Page 60 Chapter Five: Patrol Technology
The Electronic Services Division, Information Services Division,and Criminal Records Division help plan integrated parts of thecriminal history system. Another state agency, the Departmentof Information Services (DIS), has responsibility for monitoringsome technology programs. State Patrol functions involved intechnology include:
• The Support Services (Technical Services Bureau) is theumbrella agency for most the technology activities of the StatePatrol.
• Records Section, Criminal Records Division, handles all trafficcollision information for the state of Washington. InformationServices Division is the main computer support resource forWACIC and the Identification and Criminal History databasesmanaged by the Criminal Records Division.
• Property Management Division builds, buys, and developslarge capital facilities for the Patrol.
• Electronic Services Division installs and maintains thecoordinated statewide emergency communication system,WSPNet and the other communication equipment operated bythe State Patrol.
WSP TECHNOLOGY
The WSP has severalmulti-million dollarcommunications andinformation technologyinitiatives underway.Current projects includeworking with the FederalBureau of Investigation(FBI) and NCIC toimprove criminal historyinformation transferswith transmissionprotocols such asTransport ControlProtocol/Internet
WSP Technological Milestones:
• The first radio was installed on a motorcyclein the Vancouver area in 1933
• Patrol set up its own communicationsnetwork in 1943
• WACIC (Washington Crime InformationCenter) created in 1983
• AFIS System implemented in 1988 andupgraded in 1994
• DNA databank established at Seattle CrimeLab in 1989, staffed by specially trainedpersonnel
• Mobile Computer Network (MCN), linkingpatrol laptops established in 1991
Washington State Patrol Performance Audit Page 61
Protocol (TCP/IP) (networking Internet Protocol), and improvingaccess to NCIC, National Law Enforcement TelecommunicationSystem (NLETS), Department of Licensing (DOL), WACIC,WASIS, and Department of Corrections (DOC) by upgrading theACCESS messaging switch. The narrative below describes inmore detail significant WSP technology projects, and presentsfindings and recommendations for each audited initiative.
Automated Fingerprint Information System (AFIS)
The State Patrol’s Identification and Criminal History Sectionhouses the Criminal History Record Information (CHRI) records.This criminal history file is critical to the efforts of all law andjustice agencies throughout the state of Washington.
In order to make the CHRI system work, it is critical that someway of uniquely and positively identifying any person in custodyis established. Throughout the United States, the means ofmaking this positive and unique identification is throughfingerprints. AFIS provides positive identification and generatesa unique serial number for each fingerprint set. This serialnumber is then manually re-entered into to the state CHRIsystem along with other suspect history and case dispositioninformation submitted by local criminal justice agencies. Sinceits installation in 1988, the state AFIS computer has amassedfingerprint records for nearly 900,000 individuals screened by lawenforcement agencies across the state, and adds approximately55,000 new records each year.
The state AFIS network includes one central site and sixteenremote locations throughout the state. The Patrol’s AFIS staffincludes a Tenprint Unit and a Missing/Unidentified PersonsUnit (M/UPU) staffed by the Criminal Records Unit. TheTenprint Unit technicians use AFIS to determine the identity of asuspect in custody, and to determine whether crime suspects (orin some cases employees seeking jobs such as teaching or caringfor children) have a prior record by comparing fingerprints withthe CHRI data files. Crime suspects frequently use aliases toavoid detection.
The Patrol’s M/UPU assists local law enforcement agencies inidentifying human remains through fingerprint or dental

Page 62 Chapter Five: Patrol Technology
identification. In addition, the Patrol provides statewide serviceto many local law enforcement agencies by providing suspectidentification based on “latent” fingerprints with staffing providedby the Crime Laboratory Division. Latent prints are residualfingerprints or partial fingerprints that are often left at the crimescene and–if properly processed–can be recovered from a varietyof surfaces. The State Patrol and AFIS provide several services toprocess latent prints:
• Search latent (crime scene) fingerprints to produce possiblecandidates for comparison.
• Store unsolved latent prints–automatically searchingincoming new suspect fingerprint cards against these unsolvedfingerprints identifications.
• Search other AFIS databases (western states and FBI) toproduce possible candidates for comparison.
Larger police agencies have purchased sophisticated crime scenescreening equipment to find latent fingerprints and other residualevidence. These devices are called “Polilights,” and generate ahigh-intensity 500-Watt xenon light beam on the crime scene.The beam wavelengths can be adjusted to identify different clueson different surfaces. Officers using goggles can find evidencesuch as footprints left on smooth clean vinyl floors, and specialfilter devices can help find other trace evidence quickly (forexample, a violet filter is used to find tiny blood splatters; blue tofind clothing fibers or bone). The Polilights cost approximately$17,000, and are generally found only in the larger policeorganizations around the state. WSP uses similar “LumaLight”technology. Officers must be specially trained to use the devicesproperly. Although these types of devices are powerful tools, theyare seldom used because of the additional equipment cost. TheAFIS latent print identification features are generallyunderutilized in Washington State (outside of murder sceneinvestigations) due to high training and additional investigationexpense required of state and local law enforcement officers.37
37 WSP response to draft report stated: “Industry wide, AFIS is generallyunderutilized for latent print searching due to the resources required toprocess crime scenes for latent prints.” (December 17, 1998, WSP memo.)
Washington State Patrol Performance Audit Page 63
In November 1994, the state AFIS computer was expanded toincrease its storage capacity to 1,000,000 fingerprints and toprovide improved search capabilities. The system can nowprocess 1,500 fingerprint card searches per day. Unfortunately,the current Automated Fingerprint Identification System (AFIS)is not Year 2000 compliant, and the state AFIS computer mustnow be replaced (at an estimated cost of $850,000 for Year 2000solution). The current computer has non-compliant embeddedchips and hardware, and also has software that will not functionproperly on January 1, 2000. In cooperation with state DIS, theState Patrol is proposing to implement the timely replacement ofAFIS by June 1999.
Beyond the Year 2000 issue, the FBI has a national initiative toupgrade the federal AFIS system in a program called IntegratedAutomated Fingerprint Identification System (IAFIS).38 IAFISenvisions a more “paperless” justice system environment andincludes electronic arrest and disposition reporting, “live-scan”fingerprint equipment electronically linked to AFIS records, andon-line access by the public to obtain criminal history recordinformation.
The AFIS upgrade will allow the Patrol to eventually link thefingerprint and criminal history computers with the installationof an automated interface, as envisioned in the FBI IAFIS plan.Currently, AFIS and WASIS are two separate computer systemsrequiring some redundant data entry. The Patrol’s proposed newgeneration AFIS system would accommodate interfacing criminalhistory records, AFIS, and eventual installation of “live-scan”electronic fingerprint technology, which will allow county AFISsystems to electronically submit their records into the state AFISsystem.
The current state AFIS practices are inefficient–many localgovernment fingerprint records (already digitized and expertlyprocessed into local databases) are printed out on cards andmailed to the WSP's Identification Section on paper. These local
38 FBI IAFIS and federal IAFIS Image Quality Specifications includetechnology needed for communications, processing, connected Live-Scansystems, Fingerprint Card Scan Systems and Fingerprint Card Printers. TheFBI is developing standards; current federal standards are published regularlyon the IAFIS site at www.fbi.gov/iafis/.
New AFIStechnologywill betterlink federal,state, andlocal lawenforcementagencies
AFIS mustbe replacedquickly toavoid criticalservicedisruptions

Page 64 Chapter Five: Patrol Technology
government paper files are subsequently re-scanned by Patroltechnicians for entry into the state database. Some larger locallaw enforcement agencies (only Pierce County) have their ownAFIS systems for local identification, but these local systems arenot connected to the Patrol's AFIS system. Pierce County AFISuses different equipment vendors than WSP and the rest of thestate. This redundant AFIS data entry problem is not unique tothe Patrol–until 1996, technological limitations and the lack offederal standards necessitated the re-entry of state fingerprintdata into the FBI system. The State Patrol tries to re-entercounty ten-print fingerprint cards within 30 days of receipt; theFBI usually takes up to 45 days to manually re-enter staterecords into the federal database.
The legislature should be aware that the AFIS system is a criticalcomponent of the state criminal history system, and WSP’sproposed replacement project to make the system Year 2000compliant is essential.
The State Patrol hosts an annual Washington State AFIS User’sConference to provide training in system operation and to discusspotential AFIS system improvements. In the performance reviewprocess, the Patrol questioned whether it had authority toregulate local government AFIS systems. Statewideimplementation of new generation AFIS technology would beexpedited by standardization.
During the performance audit process, the Patrol’s authorityunder state law to establish statewide standards for AFIS andlive-scan technologies was reviewed. The Patrol’s legal counselhas advised that the WSP has sufficient authority to establishand implement statewide standards.
Recommendation 6
A comprehensive study should be funded to plan,schedule, and budget the statewide implementationof live-scan technology. This study should reflect theoverall strategy of the state’s Justice InformationNetwork.
The AFISsystem willrequireadditionalinvestments toallow forjustice systemefficiency andto remaintechnologicallycurrent

Washington State Patrol Performance Audit Page 65
The live-scan system will free up significant Patrol technicianlabor and improve service by eliminating the manual re-entry offingerprint records into the state system (live-scan automates thiscurrent manual practice). During the audit process, WSPexpressed its intent to develop a staff transition plan toaccommodate efficiencies gained by AFIS, live-scan technology,and electronic criminal history reporting. The Patrol furtherstated that staff would probably be reassigned to address thecurrent backlog of over 150,000 documents, training, recordsauditing, and data quality review.
Another issue is called to the attention of the legislature. Policy-makers may wish to revisit the decision to fund WSP’s AFIScomputer system from the state General Fund. The competitionfor these limited state resources may serve to inhibit necessaryand appropriate investments in the AFIS system, which is thecore of the state’s criminal history database. An alternativementioned by the WSP may be to deposit all revenue frombackground checks into the Fingerprint Identification Account sothe State Patrol can use revenue from Identification Sectionprograms to provide service to customers.
Year 2000 Compliance
Until recently, computers, software, and microprocessors wereconstructed with shortcuts to conserve digital “space.” These datamachines truncated “year” information by deleting the first twodigits–thus the year “1990” would be processed as “90” bycomputer equipment. This Year 2000 problem–ironicallyabbreviated itself as “Y2K”–impacts businesses and governmentsworldwide, and unless corrected might interpret year data “00” asthe year 1900 instead of 2000. Year 2000 problem solving is anexpensive and time-consuming effort and includes contingencyplanning, program conversion, hardware upgrades, new softwareand extensive machine and application testing.
The legislature and Governor have centralized monitoring thisextensive Year 2000 compliance effort under DIS. DIS hasinitiated an assessment of 39 state agencies, 99 projects, and 458“mission critical” computer systems. Current DIS status reportsare maintained on the state of Washington ACCESS web site atwww.wa.gov./dis/2000/y2000.htm. In all, the legislature has
“Year 2000”problems aremanageablefor WSPsystems;solving Y2Kwill requireinvestment

Page 66 Chapter Five: Patrol Technology
provided $83 million for Year 2000 compliance for all stateagencies through 1999.
Year 2000 issues apply particularly to the Patrol’s ACCESS, AFISand WACIC/WASIS systems. AFIS needs to be replaced to becompliant with Year 2000 requirements and is discussed above.The application re-engineering of the WACIC/WASIS system willbe completed by mid-1999.
The remaining area of greatest vulnerability for Year 2000compliance in the State Patrol is the desktop, laptop, andworkstation computer environment. The patrol has a substantialnumber of antiquated desktop computers which either need to beupgraded for Year 2000 purposes or to meet federal compatibilityrequirements for the National Crime Information Center (NCIC2000) project,39 as summarized below in Exhibit 14:
Exhibit 14
Microprocessor Class: # of WSPComputers
Upgrade Cost
586/PENTIUM 779 $0486 691 $3,946,700386 / 286/ 808X 482 $1,724,500
Total Upgrade Cost: 1,952 $5,671,200Source: WSP Memo: “Feedback to JLARC – Patrol Technology andCommunications,” December 17, 1998.
About 25 percent of the Patrol’s computers (386 and olderdesktops/laptops) have technology so outdated that–in addition toYear 2000 issues–they are not robust enough to run currentoperating systems, efficiently link to the WSP network, andproperly run Internet and mail functions.
In a budget initiative for the 1999 Legislative Session, the WSPproposes a technology business plan to regularly upgrade itscomputer equipment on a standard three-year cycle.
39 April-May 1998 NCIC 2000 Newsletter. Specifications for NCIC 2000compatible systems include Pentium processor, 16 MB memory, at least 1gigabyte storage, RS232 / 16550 UART port, 17” monitor, two-button mouse,SCSI board and one ISA slot for communications board. FBI also recommendsCD-ROM drive.
Washington State Patrol Performance Audit Page 67
According to the Patrol’s budget documents, the early Pentium-based machines will be outdated in the following biennium(2001-2003).
The State Patrol's Information Services Division will beresponsible for administering the computer modernizationprogram if it is funded by the legislature. If the program isfunded, the State Patrol intends to lease the replacement desktopand laptop computers. The lease will be structured so that at theend of a lease period, the Patrol may exchange a current upgrade(vintage 1999) for an even newer machine (vintage 2002).
Collision Report and Statistical History System (CRASH)
The Collision Reporting and Statistical History System (CRASH)project was initiated in July 1995 and was supposed to be inoperation early last year. Collision records are the responsibilityof the Patrol’s Criminal Records Division. By statute, the StatePatrol is responsible for receiving, tabulating, and analyzingcollision reports. The information is shared with state and localagencies, drivers, attorneys, and insurers. Traffic engineers alsouse collision information to improve roadway safety.
At the request of WSP and DOL, legislation was approved toimplement a collision reporting program:
• July 1996: HB 1964 establishing the WSP as the singlecollection point for collision reports.
• May 1997: SB 5539 made citizen submission of collisionreports optional for investigated collisions.
• June 1998: HB 1211 makes collision reports available to theWashington Traffic Safety Commission.
The legislature authorized $750,000 for implementation of theCRASH system in the 1995-1997 Biennial Budget. The originalproject completion date reported to the legislature was July 1996.
CRASH is intended to upgrade and replace an older text-basedreporting system that was technologically outdated with amodern system capable of imaging, intelligent characterrecognition, and workflow management in addition to handlingcollision report narrative. Collision reports prepared by state and
CRASH isbehindschedule –but should beoperationalsoon
Page 68 Chapter Five: Patrol Technology
local law enforcement are to be scanned into an image databaseand edited into a data and text database. One additionaladvantage of the system is that it integrates collision reportingfunctions needed by DOL, DOT, city, and county agencies, andhas a “routing” function to move an accident report along fromagency to agency. From the public perspective, the new systemoffers one standardized “Vehicle Collision Report” which must besubmitted only to the State Patrol, as compared to the multipletraffic accident report submittals required by both WSP and DOLunder the old system.
The project is described in a press release distributed early thisyear: “Under the old system, collision reports followed a serialprocess, going from agency to agency. For example, a reportreceived by WSP would need to stay there for several weeks priorto being sent to other agencies for their processing or collisioninformation. Reports were also microfilmed at both WSP andDOL, a duplication of effort. It could take up to six months for allthree agencies to receive the information from one collisionreport. With CRASH, the reports will be stored electronically inone central computer and each agency can access the reports andinformation as needed. This could reduce the time needed for theagencies to receive information on one collision report to as littleas two weeks.”
The new CRASH forms are now being used by law enforcement toreport accidents. The system is now anticipated by the Patrol tobe operational and processing 1999 collision reports on January 4,1999.40
With the best of intentions and optimism that the system wouldbe in service by the Summer of 1997–as scheduled, the WSPeliminated eight positions, and DOL reduced three FTE’s asCRASH “automation savings” effective in October 1997. Thesereductions represented about half of each agency’s assigned stafffor collision reporting. The delayed implementation has created asignificant backlog of collision reports. According to WSP,beginning in January 1999 the consultant and the Patrol willmonitor workloads and develop performance measures todetermine future staffing needs.41
40 WSP Memorandum: “Feedback to JLARC” dated December 17, 1998.41 Ibid.

Washington State Patrol Performance Audit Page 69
At the outset of the project, the CRASH system was poorly scopedand scheduled. The original CRASH feasibility study did notconsider some required functions and potentially overestimatedsavings in others when projecting FTE reductions. The projectdid not include adequate contingency planning in anticipation ofdelays, and management of the original project contractor was notadequate. The Patrol has acted to correct earlier projectmanagement problems by hiring an independent consultant toassess the CRASH program. The previous CRASH vendor hasbeen bought out by a worldwide vendor committed to providingresources and solutions to fully complete the system in early1999.
Mobile Computer Network (MCN)
MCN began in 1991 as a research project to study the feasibilityof data communications from the patrol car to the centralizedstate criminal justice databases. The pilot project lasted about 18months and included installation of 20 laptop computers in threeurban counties, plus the central processing and communicationsinfrastructure to support the test. Under the system, trooperscan make data inquiries on driving records, warrants and carplates. The system also allows car-to-car computer messaging,and access to state and federal criminal history databases.Communications is provided between the patrol car and theserver facilities in Bellevue via radio modem. In 1993 the systemwas given an “Award for Technology” at the InternationalAssociation of Chiefs of Police Conference.
The benefits of the MCN system were to include:
• Allow troopers to spend more time patrolling and less timeperforming administrative tasks
• Elimination of voice radio traffic gridlock
• More data queries for suspicious circumstances
• More arrests/quicker apprehension
• Increased recovery of stolen vehicles
Trooperlaptopcomputersimproveofficerefficiency
WSP hasearned nationalrecognition forimplementationof newtechnology
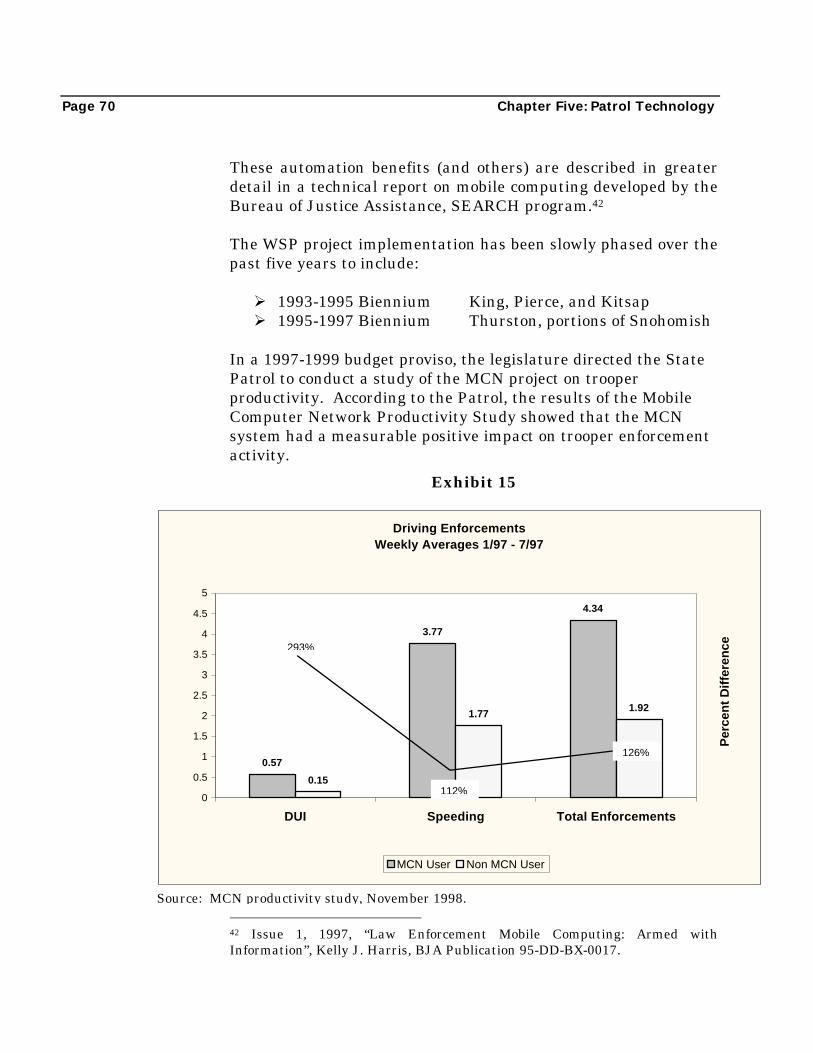
Page 70 Chapter Five: Patrol Technology
These automation benefits (and others) are described in greaterdetail in a technical report on mobile computing developed by theBureau of Justice Assistance, SEARCH program.42
The WSP project implementation has been slowly phased over thepast five years to include:
Ø 1993-1995 Biennium King, Pierce, and KitsapØ 1995-1997 Biennium Thurston, portions of Snohomish
In a 1997-1999 budget proviso, the legislature directed the StatePatrol to conduct a study of the MCN project on trooperproductivity. According to the Patrol, the results of the MobileComputer Network Productivity Study showed that the MCNsystem had a measurable positive impact on trooper enforcementactivity.
Exhibit 15
42 Issue 1, 1997, “Law Enforcement Mobile Computing: Armed withInformation”, Kelly J. Harris, BJA Publication 95-DD-BX-0017.
Driving EnforcementsWeekly Averages 1/97 - 7/97
0.57
3.77
4.34
0.15
1.771.92
0
0.5
1
1.5
2
2.5
3
3.5
4
4.5
5
DUI Speeding Total Enforcements
Per
cen
t D
iffe
ren
ce
MCN User Non MCN User
Source: MCN productivity study, November 1998.
293%
112%
126%

Washington State Patrol Performance Audit Page 71
This audit found similar results of 10 to 15 percent increases inofficer productivity as a result of laptop computer deploymentreported in other jurisdictions:
Agency: Project Scope:
Alexandria,43 Virginia PoliceDepartment
30 car pilot project
Charlotte44-Mecklenberg, NorthCarolina PD
464 car implementation
Lakewood,45 Colorado PD 210 car implementation
One problem with the current pilot program has been the limitedavailability of the installed radio system. The Patrol's ElectronicServices Division upgraded the radio system in June 1998 toimprove responsiveness of the MCN system in King, Pierce, andKitsap counties. This upgrade allows mobile modems to searchseveral frequencies for the best channel. The laptop applicationshave also been upgraded to run in the Windows operating systemenvironment.
Recommendation 7
The Washington State Patrol should develop adetailed implementation plan for the next phase ofthe Mobile Computer Network (MCN) project todescribe patrol coverage, radio communications andpotential integration with city and county mobilecomputers.46 The implementation plan should alsoidentify and propose technical solutions to MCN
43 February 1997, “Alexandria Police Go Wireless Remote,” Federal ComputerWeekly article by Barbara DePompa.44 October 1997, “North Carolina Police Going Wireless,” GovernmentTechnology News.45 August 1997, “Goin’ Mobile,” Government Technology News article by BlakeHarris.46 WSP review comment: “Any future MCN application or system changeswould require legislative support. This implementation plan should belegislatively sponsored as a WSP study project with a hired consultant forapproximately $200,000. Any plan or MCN project should support the agencysix-year strategic plan.”
Nationalstudiesdocumentthe benefitsof trooperlaptops

Page 72 Chapter Five: Patrol Technology
integration challenges posed by the federal NationalCrime Information Center 2000 project.
WSPNet
WSPNet is the Patrol’s Wide Area Network (WAN), connectingthe office computer networks of the State Patrol's crime labs,district offices, communications centers, detachmentsparticipating in the MCN project, Olympia headquarters, andother support offices. WSPNet allows each State Patrol districtand detachment office the ability to communicate with all otheroffices as well as with other state and federal law enforcementagencies.
The Electronic Services Division installs, maintains andconfigures the WSPNet. WSPNet is a mission critical applicationthat requires statewide on-site support 24-hours per day, sevendays per week.
The Washington Access to Criminal History(WATCH)
WATCH Internet application was implemented in January 1998in response to the large increase in requests for criminal historyinformation. This innovative program combines cutting-edge lawenforcement, modern database search engine, and the growingfield of Internet commerce, providing users criminal historyinformation from the state system and immediate credit cardbilling ($10 per search).
The Patrol’s WATCH page can be found at:http://watch.wsp.wa.gov/WATCHOPEN/default.asp. The primarycustomer group the WATCH system is designed to serve is thenon-profit organizations that get criminal history recordinformation at no charge. Through December 1998, over 143,800inquiries have been conducted by the non-profit organizations.47
In the interests of checking the ease of use of the system, theaudit team accessed the site and obtained the criminal historyrecords of the author. The entire process took less than eightminutes, using a credit card payment for the inquiry. This
47 WSP Memo “Feedback to JLARC” dated December 17, 1998.
WATCHprogramprovidespublic accessto statecriminalhistory data

Washington State Patrol Performance Audit Page 73
exercise in using the Patrol’s Internet WATCH systemdetermined that:
1. The system is easy to use, with adequate instructions tolead the inquirer through the criminal records access andcredit card billing process;
2. Appropriate notices48 are posted on the web pagesconcerning the state’s Privacy Act and appropriate use ofthe information provided; and
3. The process produces instant on-line reports, which can beviewed using a web browser and locally printed (seesample report print out pages in Appendix 9).
The Patrol dedicates one position to WATCH for technicalcustomer support and hires a contractor for computerprogramming support. Although the background check itself isautomated, the WATCH program requires staff support for billingaccounts (non-credit card customers), problem resolution,research, and other correspondence. Three customer servicespecialists handle this workload.
In accordance with federal and state law, the WATCH inquiryonly searches state criminal history databases; it does not searchNational Crime Information Center records. There is no cleardisclaimer on WSP’s web page regarding this statutory limitation:Uninformed Internet or non-profit customers may incorrectlyassume that a “negative result” from a WATCH criminal historysearch is substantially more comprehensive and meaningful than 48 CRIMINAL RECORDS PRIVACY ACT- RCW 10.97.050 allows theWashington State Patrol to provide conviction criminal history records toanyone. The records give information about criminal convictions and arrestsless than one year old that are pending formal conclusion of any criminaljustice proceeding in the state of Washington. The Washington State Patrolcharges a fee of $10 for each record. Redistributing a criminal history record isprohibited, except as described in RCW 10.97. CHILD AND ADULT ABUSE INFORMATION ACT- RCWs 43.43.830through 43.43.845 allow the Washington State Patrol to provide criminalhistory conviction information on prospective employees\volunteers who willhave unsupervised access to children and/or vulnerable adults. The convictioninformation is limited to crimes against persons. Businesses, non-profitorganizations, schools, state and other governmental agencies may make thisrequest.
WATCH is asuccessfulimplementationof newtechnologiesand has beenwarmlyreceived bynon-profitorganizationsand schooldistricts
Page 74 Chapter Five: Patrol Technology
what is actually provided. This issue was discussed with thePatrol,49 and can be remedied with the inclusion of writtendisclaimers explaining which criminal history records are and arenot accessed by WATCH on the Patrol’s WATCH web page.
The program has been well received by employers and volunteercoordinators. Prior to the implementation of the WATCH system,background checks required by law could take as long as 10 to 12weeks.50 The WATCH program has helped state school districtsquickly check criminal histories for employee applicants andpotential volunteers. Larger school districts such as Northshoreand Lake Washington have 400 to 600 volunteers helpingcoordinate educational activities, meals, tutoring, and outings atany given time.
The audit found that the State Patrol has successfullyimplemented the technologically-challenging WATCH applicationin a timely manner; and that the application (developed byprivate vendors under contract with the Patrol) is easy to use andsubstantially improves the delivery of criminal historyinformation to other state agencies, school districts, and otheremployers as required by state law.
49 Telephone conversations with Mary Neff and John Broome, December 21,1998.50 October 19, 1998, Eastside Journal; quote from Jan Graves, VolunteerCoordinator, Northshore School District. According to the Patrol, the currentbacklog is about five months.

Washington State Patrol Performance Audit Page 75
Washington State Crime Information Center(WACIC)Washington State Identification System (WASIS)
WACIC was established to provide a computerized criminalhistory file system for all criminal justice agencies throughout thestate. The companion WASIS computer is used for identificationpurposes. These combined criminal records are shared via theACCESS telecommunications network described earlier in thischapter. The WACIC/WASIS databank is the centralizedcriminal justice record system for all crimes and criminals ofstatewide interest. The database also includes locatorinformation for missing persons and stolen property.
The WACIC/WASIS application replacement effort is scheduledfor completion in September 1999, and will take advantage ofcurrent “relational database” technology to capture, store, anddisseminate state criminal history record information. The StatePatrol has hired a consultant to design the new criminal historysystem. The WASIS and WACIC systems have been redesignedto eventually allow access of on-line electronic fingerprints anddemographic data from jails at the time of arrest. In the future,the system could be further expanded to allow prosecutor andcourt interactive access to criminal identification, electronicwarrants, sex offender information, protective orders, and caserecord updates. The WACIC/WASIS rewrite has largely beenfunded with federal grant money.
DNA
WSP’s Crime Laboratory Division provides forensic services forlaw enforcement agencies across the state. The Crime Lab hasestablished a statewide database of nearly 15,000 preservedbiological specimens (i.e., blood) and 9,000 processed DNAidentifications for convicted sex offenders and felons. The DNAdatabase is an important criminal justice tool and has been usedto solve several homicide and rape cases in Washington State.
Through proviso, the legislature has required the State Patrol toimplement a statewide DNA database that is consistent with thenew FBI standards.
Page 76 Chapter Five: Patrol Technology
The WSP Crime Lab Division must convert its DNA typingoperations to the federal Short Tandem Repeat (STR) standardfor the convicted felon DNA databank. While morediscriminating, the STR process is also 27 percent more expensivethan the Restriction Fragment Length Polymorphism (RFLP) andPolymerase Chain Reaction (PCR) methods. The cost for suppliesand materials using this new DNA identification process areunavoidable. This new technology is currently being used to typeconvicted felons samples and is also being validated on criminalcasework. The Crime Lab will conduct between 140 to 150 DNAidentification cases over the 1999-2001 Biennium. ConvertingDNA typing to the new STR process will increase WSP Crime Labsupply and chemical costs by an estimated $475,000 forprocessing these DNA samples over the next two years.
Systems Documentation
As part of this audit various technical support and operatingmanuals for the WSP technology operations and computersystems were reviewed, including:
• National Crime Information Center Code Manual• WSP Security Document (June 1996)• Ready Reference Guide to ACCESS/WACIC• WSP Information Technology Strategic Plan• WSP Disaster Recovery/Business Resumption Plan• WSP ACCESS Manual• WSP WACIC Manual• WSP Latent Print Section Policy & Procedures Manual• Electronic Services Section Handbook• Electronic Services Section Manual
Tedious work such as adequate documentation of system code andsystem-operating manuals is sometimes overlooked in large datamanagement operations. The State Patrol maintains currenttechnical support documents and operating guides for trainingand operation of its technology systems. The documentation iscomprehensive and understandable and includes adequatedisaster planning, systems recovery, and emergency operatinginformation.
TELECOMMUNICATIONS
Chapter Six
SUMMARY
The major focus of this chapter is to analyze thetelecommunications systems deployed by the Washington StatePatrol (WSP). This chapter contains two recommendations whichaddress the opportunities for collocation of telecommunicationsequipment with other public and private entities and the need forbetter coordination of radio communications among state andlocal jurisdictions. The Patrol has efficiently applied proventechnology to establish a reliable public safety communicationssystem. However, to maintain the current high level of service,the Patrol should improve basic maintenance on itstelecommunications towers. As recognized in the previouschapter on technology, the Patrol has been nationally recognizedfor implementing and deploying telecommunications systems.
MICROWAVE NETWORK ANDMICROWAVE CONVERSION
The WSP’s communications network includes three basic servicecomponents:
• Mobile radio system–allows communications between troopersusing radios in their cars or portable radios.
• Data radio system–links laptop computers to vehicle anddrivers license records and criminal history information. Thissystem uses UHF so that it does not interfere with VHFmobile radios.
Componentsof WSP’snetwork

Page 78 Chapter Six: Patrol Telecommunications
• Microwave system–controls the mobile radio (troopercommunications) and data radio (trooper laptops)transmissions across the state which are broadcast from over90 radio relay stations and microwave tower facilities. Theserelay stations are in turn operated remotely from eight WSPcommunication centers. The microwave system serves as thestatewide communications system backbone for variousfederal, state and local agencies in addition to the StatePatrol.
The WSP microwave system started in the early 1950s. Themicrowave system is used for regular radio communication bythe WSP, but also handles the work of other agencies (such asDOT) and carries other voice and data traffic such as thestate’s emergency telephone system, Computer AidedDispatch, AFIS, and ACCESS. The WSP maintains andoperates the system for all users.
The WSP microwave system has been deployed in threeinterconnecting “loops” across the state. The loop isestablished by building many transmitters in a circle; signalsare sent from tower-to-tower around the loop. Carefulplacement of the towers and overlapping of the three loopsensures that the telecommunications link is not broken if atower is taken out of service for maintenance or damaged bynatural forces. In the WSP microwave system, up to threepaths may be lost–one in each loop–without loss of service.The WSP microwave system has provided uninterruptedservice (all day/every day) since 1975. The system has seentremendous growth in activity. Since 1987, there has been a70 percent increase in telephone activity and a 127 percentincrease in CFS.
Why Have a WSP System?
Most large public safety agencies own, operate, and maintain anindependent telecommunications system.51 These systems areusually justified by one or more of the following arguments:
51 Wireless Communications and Interoperability Among State and Local LawEnforcement Agencies; January 1998; National Institute of Justice Survey andAnalytical Study by Mary J. Taylor, Robert C. Epper, and Thomas K. Tolman.
WSPmicrowavesystem isreliable
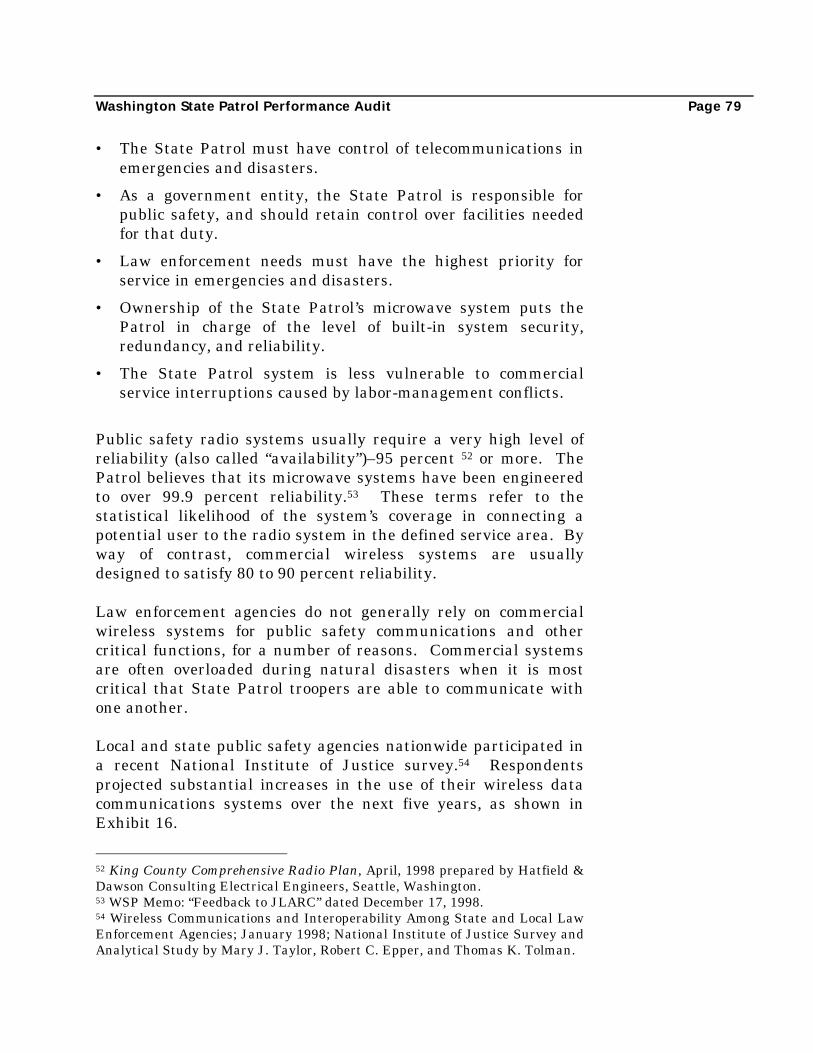
Washington State Patrol Performance Audit Page 79
• The State Patrol must have control of telecommunications inemergencies and disasters.
• As a government entity, the State Patrol is responsible forpublic safety, and should retain control over facilities neededfor that duty.
• Law enforcement needs must have the highest priority forservice in emergencies and disasters.
• Ownership of the State Patrol’s microwave system puts thePatrol in charge of the level of built-in system security,redundancy, and reliability.
• The State Patrol system is less vulnerable to commercialservice interruptions caused by labor-management conflicts.
Public safety radio systems usually require a very high level ofreliability (also called “availability”)–95 percent 52 or more. ThePatrol believes that its microwave systems have been engineeredto over 99.9 percent reliability.53 These terms refer to thestatistical likelihood of the system’s coverage in connecting apotential user to the radio system in the defined service area. Byway of contrast, commercial wireless systems are usuallydesigned to satisfy 80 to 90 percent reliability.
Law enforcement agencies do not generally rely on commercialwireless systems for public safety communications and othercritical functions, for a number of reasons. Commercial systemsare often overloaded during natural disasters when it is mostcritical that State Patrol troopers are able to communicate withone another.
Local and state public safety agencies nationwide participated ina recent National Institute of Justice survey.54 Respondentsprojected substantial increases in the use of their wireless datacommunications systems over the next five years, as shown inExhibit 16.
52 King County Comprehensive Radio Plan, April, 1998 prepared by Hatfield &Dawson Consulting Electrical Engineers, Seattle, Washington.53 WSP Memo: “Feedback to JLARC” dated December 17, 1998.54 Wireless Communications and Interoperability Among State and Local LawEnforcement Agencies; January 1998; National Institute of Justice Survey andAnalytical Study by Mary J. Taylor, Robert C. Epper, and Thomas K. Tolman.
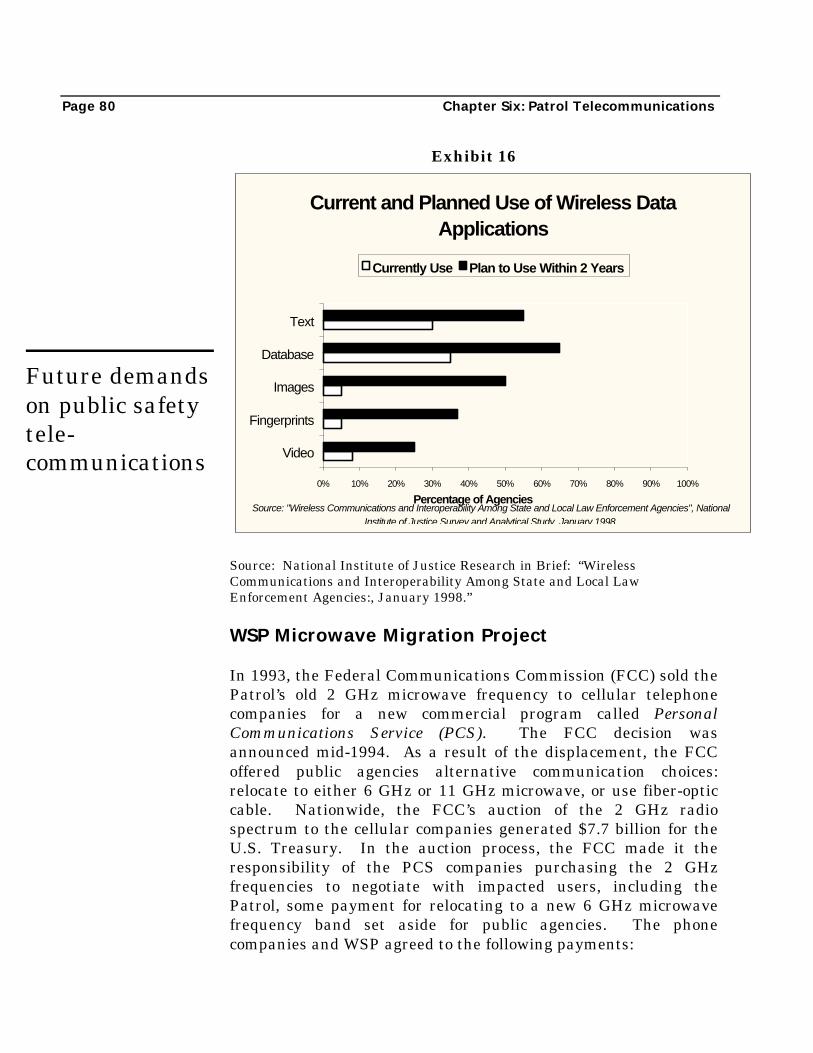
Page 80 Chapter Six: Patrol Telecommunications
Exhibit 16
Source: National Institute of Justice Research in Brief: “WirelessCommunications and Interoperability Among State and Local LawEnforcement Agencies:, January 1998.”
WSP Microwave Migration Project
In 1993, the Federal Communications Commission (FCC) sold thePatrol’s old 2 GHz microwave frequency to cellular telephonecompanies for a new commercial program called PersonalCommunications Service (PCS). The FCC decision wasannounced mid-1994. As a result of the displacement, the FCCoffered public agencies alternative communication choices:relocate to either 6 GHz or 11 GHz microwave, or use fiber-opticcable. Nationwide, the FCC’s auction of the 2 GHz radiospectrum to the cellular companies generated $7.7 billion for theU.S. Treasury. In the auction process, the FCC made it theresponsibility of the PCS companies purchasing the 2 GHzfrequencies to negotiate with impacted users, including thePatrol, some payment for relocating to a new 6 GHz microwavefrequency band set aside for public agencies. The phonecompanies and WSP agreed to the following payments:
Future demandson public safetytele-communications
Current and Planned Use of Wireless Data Applications
0% 10% 20% 30% 40% 50% 60% 70% 80% 90% 100%
Video
Fingerprints
Images
Database
Text
Currently Use Plan to Use Within 2 Years
Source: "Wireless Communications and Interoperability Among State and Local Law Enforcement Agencies", National Institute of Justice Survey and Analytical Study, January 1998.
Percentage of Agencies
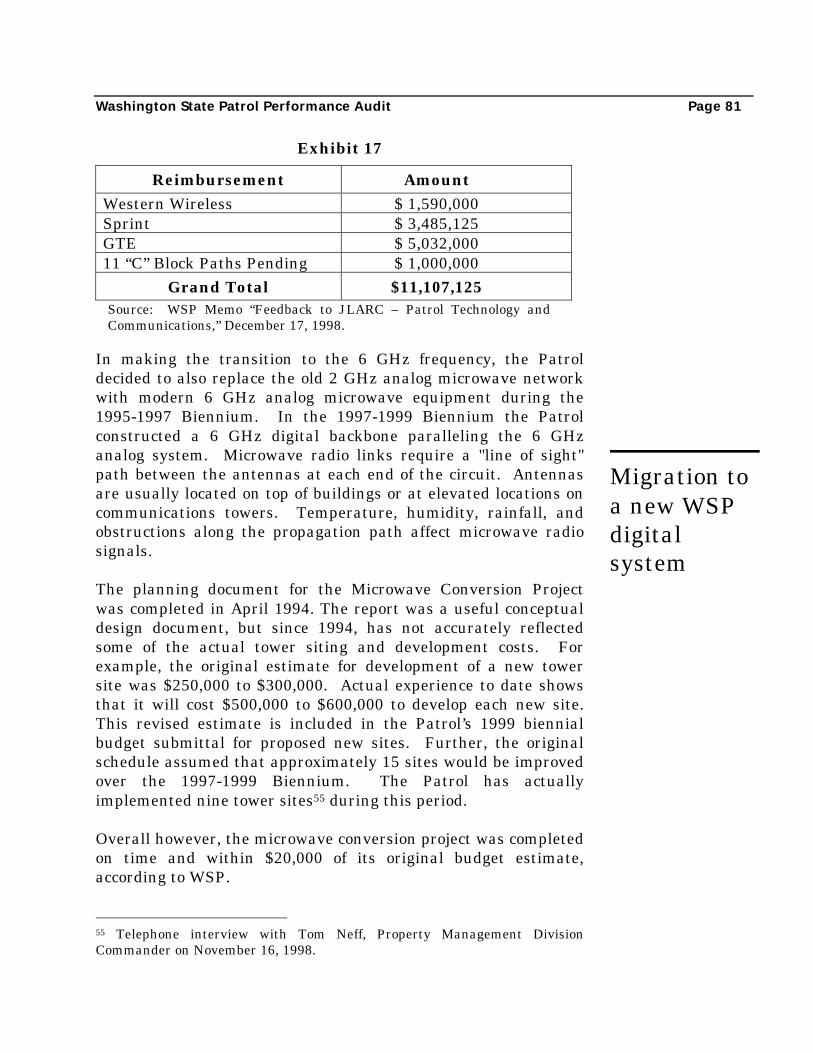
Washington State Patrol Performance Audit Page 81
Exhibit 17
Reimbursement Amount
Western Wireless $ 1,590,000Sprint $ 3,485,125GTE $ 5,032,00011 “C” Block Paths Pending $ 1,000,000
Grand Total $11,107,125Source: WSP Memo “Feedback to JLARC – Patrol Technology andCommunications,” December 17, 1998.
In making the transition to the 6 GHz frequency, the Patroldecided to also replace the old 2 GHz analog microwave networkwith modern 6 GHz analog microwave equipment during the1995-1997 Biennium. In the 1997-1999 Biennium the Patrolconstructed a 6 GHz digital backbone paralleling the 6 GHzanalog system. Microwave radio links require a "line of sight"path between the antennas at each end of the circuit. Antennasare usually located on top of buildings or at elevated locations oncommunications towers. Temperature, humidity, rainfall, andobstructions along the propagation path affect microwave radiosignals.
The planning document for the Microwave Conversion Projectwas completed in April 1994. The report was a useful conceptualdesign document, but since 1994, has not accurately reflectedsome of the actual tower siting and development costs. Forexample, the original estimate for development of a new towersite was $250,000 to $300,000. Actual experience to date showsthat it will cost $500,000 to $600,000 to develop each new site.This revised estimate is included in the Patrol’s 1999 biennialbudget submittal for proposed new sites. Further, the originalschedule assumed that approximately 15 sites would be improvedover the 1997-1999 Biennium. The Patrol has actuallyimplemented nine tower sites55 during this period.
Overall however, the microwave conversion project was completedon time and within $20,000 of its original budget estimate,according to WSP.
55 Telephone interview with Tom Neff, Property Management DivisionCommander on November 16, 1998.
Migration toa new WSPdigitalsystem

Page 82 Chapter Six: Patrol Telecommunications
Tower Maintenance
Last year, the Patrol commissioned an inventory of its currenttelecommunications towers in service around the state. Thestudy56 investigated 56 existing tower facilities to determinestructural, maintenance, paint, and other needs for the facilities.The study determined that the microwave towers hadaccumulated nearly $1.643 million in deferred maintenance, andidentified five tower sites (Everett, Joe Butte, RattlesnakeMountain, Skamania and Squak Mountain) that in the judgementof the registered engineer required complete replacement. Theneeded maintenance repairs included $641,000 in structuralwork; almost $690,000 for new paintwork; $247,000 in othermaintenance and nearly $65,000 for electrical grounding. Costestimates provided do not include state sales tax and potentiallyhigher mobilizations costs incurred by spreading the project outover several years.
As part of this audit review, the ten-year Capital ImprovementProgram submitted by the State Patrol was compared against therecommendations of the tower consultant. The results of thiscomparative review showed that although the patrol suggeststhat $4.25 million for tower maintenance will be sought over thenext 10 years (1999-2009), the priorities suggested by the towerconsultant are not completely addressed in the proposed ten-yearCapital Improvement Plan (CIP) submittal. Despite the fact thatthe Patrol will suggest a maintenance amount nearly $2.6 millionmore than the tower consultant’s recommendation, about$683,000 of tower work suggested by the independent consultantis not specifically addressed in the Patrol’s CIP. Exhibit 18 on thefollowing page identifies those tower maintenance projects notspecifically addressed:
56WSP Tower Survey, June 1997–Tower Engineering Consultants, Seattle WA.
Many radiotowers needsubstantialmaintenancework

Washington State Patrol Performance Audit Page 83
Exhibit 18
Tower Maintenance ProjectsUnfunded in WSP
Capital Budget Submittal(1999 through 2009)
Amount Recommended byTower Engineering
Consultants, Inc.(June 1997 Report)
Academy - $2,265Baw Faw - $895Bellevue - $22,937Bellingham - $38,890Bremerton - $62,950Calispell Creek - $4,231Capitol Peak - $15,965Chehalis - $2,017Cleman Mountain - $888Creston Butte - $8,702Ellensburg - $19,500Ephrat - $39,050Everett** - $116,778Gardiner - $7,980Goat Mountain - $975Kalama - $32,750Kelso - $575Lewiston Ridge - $3,225Lind - $15,430Marysville - $3,890Mica Peak - $735Mount Vernon - $7,555Octopus Mountain - $11,865Olympia Fleet & Supply - $57,155Rattlesnake Mountain** - $81,750Roosevelt - $6,842Scoggins Hill - $5,452Seattle South Office - $8,505Spokane - $3,937Stacker Butte - $16,527Tacoma - $1,645Vancouver - $30,670Walla Walla - $41,760Wenatchee - $735Yakima - $6,665Yakima Ridge - $1,540
Maintenance Not in WSP CIP: - $683,231
** Indicates towers recommended for replacement by consultants.Source: Tower Engineering Consultants, Inc. (June 1997 Report).

Page 84 Chapter Six: Patrol Telecommunications
Some of these maintenance activities (such as tower grounding)may be budgeted in the Patrol’s operating budgets over the nextseveral years. Other maintenance work might be eliminated bytotal replacement of certain towers. However, the independentconsultant suggested and priced the maintenance work as a“lump sum” capital initiative; and all of the maintenance workdescribed in the consulting report should be accounted for,budgeted, and completed. It might be useful for the Patrol todevelop a “crosswalk” to compare the consultant’s project list withthe Patrol’s operating and capital budgets to better track thesemaintenance tasks (see attached spreadsheet in Appendix 10).
Commissioning the independent assessment of the microwaveand radio communications towers was a very prudent businesspractice. However, the Patrol should implement therecommendations of the engineering consultant in their proposedcapital plan in a timely manner.
Recently, the Property Management Division devised aninnovative strategy to replace one of the WSP-managed towersthat had been recommended for replacement by the engineeringconsultant. The Everett tower had an estimated $233,556 worthof rehabilitation costs identified in the independent consultantsreport. By partnering with local commercial cellular carriers, theProperty Management Division was able to avoid this capitaloutlay and yet was able to replace the tower with a modern“monopole.” The new tower was constructed by a cellular carrieron the site of the old WSP tower. In this partnership, the cellularcarrier gave ownership of the tower to the Patrol in exchange forrights to collocate WSDOT equipment on the tower in the future.This creative strategy also addresses community concern thatfewer, shorter poles are desirable and more aesthetically pleasingto adjacent property owners. The Patrol’s property managementdivision is to be commended for this innovative approach, whichdemonstrates the best advantages of “public/private partnerships”and collocation of facilities with other state agencies.
A WSPsuccessstory:Collocationwith othertelecomproviderssaves money

Washington State Patrol Performance Audit Page 85
Recommendation 8
The Washington State Patrol (WSP) should ascertainwhich of its telecommunications towers provideopportunities for collocation and partnership withother entities, and should attempt to duplicate thesuccess of the WSP Everett tower project.
Communication with Other Agencies
Law enforcement relies on coordination and cooperation amongdifferent police agencies with overlapping or adjacent serviceboundaries. Radio communications are critically important tomulti-jurisdictional police work. According to the NationalInstitute of Justice survey on radio communications,57 63 percentof local police agencies coordinated law enforcement activity withstate police on a daily or weekly basis. However, a majority of allrespondents in this national survey felt that radio“interoperability” was a serious problem in the law enforcementcommunity. Interoperability is defined as the ability for usersoperating on different radio systems to communicate with eachother effectively.
Several large local jurisdictions in Washington State haveimplemented new radio systems that are not directly compatiblewith the State Patrol’s radio network. For example, King Countyvoters approved a new “trunked” 800 MHz radio system inSeptember 1992. Levy funds for the $57 million system werecollected in 1993, 1994, and 1995, and the system was recentlymade operational. The King County Regional Trunked RadioSystem has been designed to connect 15,000 mobile and portableradios for all city, county, fire and EMS agencies in that county.In a recent independent review of the King County 800 MHzsystem,58 local police agencies were surveyed to identify potentialimprovements to the new radio communications system. Whileconfident that the new regional network had successfullyintegrated local law enforcement agencies, city, and King County
57 Wireless Communications and Interoperability Among State and Local LawEnforcement Agencies; January 1998; National Institute of Justice Survey andAnalytical Study by Mary J. Taylor, Robert C. Epper, and Thomas K. Tolman.58 King County Comprehensive Radio Plan; April, 1998. Hatfield & DawsonConsulting Electrical Engineers.
Radiocommunica-tions betweenWSP andlocal agenciescould beimproved
Page 86 Chapter Six: Patrol Telecommunications
police stated59 that they experience some barriers in accessingother agencies. In particular, the report stated that “. . . theexisting interface with WSP is cumbersome and awkward”according to local law enforcement officers surveyed. Aninspector with the Spokane County Sheriff’s Office expressedsimilar concerns that radio interoperability among state and localagencies was a problem that had gone largely unresolved in his25-year public safety career.
It is not possible for WSP troopers and sheriff’ deputies on an 800MHz trunked system to talk directly to one another usingcommon "talkaround" features on modern handsets. Thesecommunications must go through a repeater or else both officersmust switch to a common conventional radio channel. Theinteroperability complaint was expressed in several jurisdictionsand by WSP officials as well; and as noted above, is a nationalpublic safety problem.60 Law enforcement officials expressedconcern that rescue or apprehension efforts might not be wellcoordinated in situations where a “repeater” facility wasunavailable to allow communication between troopers and localofficials. This observation is specifically not intended to implythat the State Patrol should create an easy radio communicationsinterface for King County “. . . while sacrificing communicationswith most of the other counties in the state–to the detriment ofstatewide public safety communications.”61 Likewise, the 59 Finding 3.2.4; King County Comprehensive Radio Plan; April 1998. Hatfield& Dawson Consulting Electrical Engineers. Full text of recommendation:“3.2.4 External Communication needs police activity does not stop at thecounty's boundaries. Cross-jurisdictional communication is essential for theregion's public safety, yet King County Police report that they experience somebarriers in accessing other agencies. For example, the existing interfacewith Washington State Patrol is cumbersome and awkward.Responders want to see communication linkages improved between federal lawenforcement agencies and the county s communication center. The link to thePort of Seattle through the Mutual Aid Radio System (MARS) is inadequate.Numerous ferries cross Puget Sound carrying passengers between King Countyand adjacent counties, but there is no satisfactory communication link withthese vessels. Some respondents cite an inability to communicate with otherpolice departments, but others believe that access is satisfactory. MARS usesstatewide VHF channels for intercommunication between public safetyagencies.”60 Wireless Communications and Interoperability Among State and Local LawEnforcement Agencies; January 1998; National Institute of Justice Survey andAnalytical Study by Mary J. Taylor, Robert C. Epper, and Thomas K. Tolman.61 WSP Memo: “Feedback to JLARC” dated December 17, 1998.
Washington State Patrol Performance Audit Page 87
observation is not intended to promote statewide migration to 800MHz systems, which would not be financially or technicallyfeasible. The finding does recognize the national problem ofpublic safety interoperability as clearly documented in the recentNational Institute of Justice survey and acknowledged by locallaw enforcement officers.
Recommendation 9
The legislature should consider funding a statewidelaw enforcement communications interoperabilityplan. If this planning effort identifies a feasibleinteroperability solution, the legislature shouldfurther consider funding the fix and shouldauthorize the Washington State Patrol to implementthe program.
Future Technology
Telecommunications technology has changed a great deal in thepast decade, and new services such as direct connections withorbiting satellites are literally on the horizon.
The State Patrol’s investment in its microwave system has beensuccessful and economical over the past 40 years. However, newdemands for “bandwidth” from pending state live-scan AFIStechnology and the new Justice Information Network system,federal NCIC 2000 and IAFIS services will require substantialimprovements to the state’s telecommunications system.
• Where feasible, the Patrol should consider supplementing themicrowave system by additional investments in WSPNet andthe InterGovernmental Network. Fiber optic cables offersubstantially higher capacity than all of the Patrol’s combinedradio resources are currently capable of providing. The type ofloop protection/redundant path schemes that are used inmicrowave radio systems can also be implemented in fiberoptic systems to avoid disruptions in service in the event of aline break. This does not suggest running fiber lines up to themountainous WSP microwave relay sites to parallel the WSP’smicrowave network route; it instead suggests rerouting
Newcommunicationstechnologiesoffer usefulsolutions toWSP needs, butwill requiremore study andinvestment

Page 88 Chapter Six: Patrol Telecommunications
current microwave traffic when possible and economicallyfeasible to conserve radio capacity.
• Many large county and state law enforcement agencies areexperimenting with “Cellular Digital Packet Data” (CDPD)technology. This evolving technology makes use of newwireless cellular PCS systems to efficiently transmit computerdata. This new commercial service is already available inmany urban areas including Seattle and King County. Thisservice could be used to enhance the data radio systemcurrently employed by the State Patrol. One concern with theuse of this type of commercial service is the response "latency"or delay in communicating with the laptop computer when thecommercial systems experience heavy usage. The Patrol maywish to consider a pilot project using CDPD technology tocompare it to the UHF data system now in place. Thisemerging technology is finding favor with several large policeagencies, including the Utah Highway Patrol.62
• Cellular telephones offer another communications link in areaswith high quality commercial service. The recent NationalInstitute of Justice survey showed that cellular phones havebeen widely deployed among larger urban county and statepolice as a supplemental communications system.
The WSP has already participated in limited trials of acommercial satellite-based mobile data system. Although theearly trial results did not offer the promise of satisfactory servicefor the Patrol, new satellite systems will debut over the next fiveyears that might offer better statewide coverage. The Patrolshould continue to monitor and test these cutting-edgetechnologies in anticipation of the next system update in 2010-2015.
62 Report prepared by Utah Highway Patrol, “Utah Highway Patrol MobileData Collection System (MDCS) & Cellular Digital Packet Data (C.D.P.D.)Statewide Implementation Plan” dated July 25, 1997.

PATROL VEHICLE REPLACEMENT ANDBUDGETING
Chapter Seven
SUMMARY
This chapter evaluates the mileage replacement decision forWashington State Patrol (WSP) pursuit vehicles. Each newpursuit vehicle costs approximately $26,000 to purchase andequip. WSP was authorized 828 pursuit vehicles for 1998.
In the process of reviewing the relevant costs that are appropriateto consider in support of the replacement decision, other aspectsof patrol vehicle budgeting were examined.
Our review of available relevant financial and cost data indicatesthat the increase of WSP pursuit vehicle mileage from the currenttarget of 100,000 miles to 110,000 miles has resulted in a smallreduction (one cent per mile, or 2 percent) in the total cost ofownership. Existing data did not permit an analysis of what totalcosts would be of extending vehicle mileage beyond 110,000 miles.The increase in replacement mileage to 110,000 miles has beendue to the use of budgeted vehicle replacement funds for otherWSP operating purposes and a legislative budget decision toreduce funding for vehicle replacement by extending the mileagereplacement cycle.
These decisions have so far not resulted in higher overall costs(i.e., capital and operating combined). However, more vehiclesthan intended must be replaced in subsequent budgets tomaintain even the current extended mileage level, and there arehigher than intended future operating and maintenance costs.These unplanned future liabilities could be avoided by restrictingvehicle replacement funds solely to that purpose.
Our economic evaluation of vehicle replacement relied on a FleetLife-Cycle Cost Model. In building this model we received
This chapterevaluatesbudgetingand optimumreplacementmileage forpursuitvehicles

Page 90 Chapter Eight: Collocation
extensive cooperation and support from the WSP Fleet Section.This chapter contains recommendations for WSP to use thismodel for evaluating the mileage replacement level for pursuitvehicles and to extend its use for review of other categories offleet vehicles as well. Another recommendation is to budgetfunds for vehicle purchase and operations in segregated accountswith restrictions on the ability to transfer these funds to otherpurposes.
INTRODUCTION
The WSP pursuit vehicle fleet mileage totals approximately 20.7million miles annually about 25,000 miles for each active vehicle.WSP vehicle replacement policy has increased during the pastseveral years from replacement at an average of 75,000 miles to100,000 miles. This increase has been the result not of anyanalysis indicating that a higher replacement cycle is less costly,but rather has been the result of using intended vehiclereplacement funds for other WSP operating needs and a consciousbudget decision by the legislature to reduce funding for vehicleacquisition. Subsequent to the increase to a 100,000 replacementpolicy, use of vehicle replacement funds for other purposes andcancellation of planned vehicle purchases has resulted in acurrent replacement level exceeding 112,500 miles.
WSP and the legislature desired to evaluate the mileagereplacement decision based on an evaluation of total cost. Tosatisfy this objective, we have developed a total Life-Cycle CostModel specific to the cost characteristics of the WSP pursuitvehicle fleet. Based on detailed cost information provided byWSP, this model has been used to calculate the total capital andoperating costs at various replacement cycles ranging from 50,000to 110,000 miles, with total costs expressed as a cost per mile in1998 dollars.
Replacementmileage hasincreasedfrom 75K toover 110K
Auditidentifiestotal cost ofreplacementcycles

Washington State Patrol Performance Audit Page 91
STRUCTURE OF THE MODEL ANDMETHODOLOGY
The model used to evaluate replacement cycle alternativesincludes all relevant costs. These include:
Capital Costs− Purchase cost− Cost to equip (equipment and labor)− Decommissioning costs (to prepare for
resale)− Resale value
Operating− Repairs− Maintenance− Fuel and oil
In addition, since these costs occur over time, we applied adiscount rate to calculate a present value equivalent, which canthen be translated into an annual cost per mile.
To create comparable replacement scenarios, we evaluated totalcosts for each alternative over an eight-year period at the averagemileage of 25,000 miles per year. For each replacement scenario,cars were purchased, equipped, operated, then decommissioned atthe period when the scenario mileage was reached and sold withthe corresponding projected resale value of a patrol car with thatmileage. See Appendix 11 for a more detailed discussion of themodel.
RESULTS OF THE MODEL
The results of the baseline model are summarized below inExhibit 19 and corresponding chart. The total life-cycle costsdecline with increases in the replacement cycle from 50,000 to110,000 miles. Decreases in cost/mile become quite small beyond100,000 miles with the difference between 110,000 and 100,000totaling about 2 percent, or about $159,000 annually for thepursuit vehicle fleet traveling an estimated 20.7 million miles. Itis important to note that the annual estimated savings of 110,000

Page 92 Chapter Eight: Collocation
mile replacement vs. the former WSP policy of 75,000 miles is$660,000 (or approximately 9 percent savings).
Exhibit 19
Annual Cost/Mile Based on Replacement Cycle
Source: Fleet Life-Cycle Cost Model and data provided by WSP Fleet Section.
The shaded area in Exhibit 19 shows the annual cost per milebased on the current replacement policy. Exhibit 20 shows thesame data as above, but in a bar chart format.
Exhibit 20
Source: Fleet Life cycle cost Model and data provided by WSP Fleet Section.
Costs declineand thenlevel offas mileageincreases
Replacement Cycle Annual Cost Cost/Mile Capital Operating Added Annual Cost% AboveMinimum
50,000 $10,941 $0.438 $0.312 $0.126 $1,508,701 20.0%75,000 $9,916 $0.397 $0.258 $0.139 $659,755 8.7%85,000 $9,505 $0.380 $0.237 $0.143 $319,906 4.2%90,000 $9,495 $0.380 $0.234 $0.146 $311,168 4.1%100,000 $9,311 $0.372 $0.221 $0.151 $158,980 2.1%110,000 $9,119 $0.365 $0.215 $0.150 $0 0.0%
Annual Cost/Mile by Replacement Cycle
$0.000
$0.050
$0.100
$0.150
$0.200
$0.250
$0.300
$0.350$0.400
$0.450
75,000 85,000 90,000 100,000 110,000
Replacement Cycle Miles
Tot
al C
ost/
Mile
.
Total Cost /Mile
Capital Cost /Mile
Operating Cost
Source: Fleet Life-Cycle Cost Model and data provided by WSP Fleet Section.

Washington State Patrol Performance Audit Page 93
ALTERNATIVE SCENARIOS ANDSENSITIVITY ANALYSIS
Values used in projecting scenario costs are based on availableWSP fleet historical costs including maintenance and operatingrecords, estimated commissioning and decommissioning costs,and projected salvage values. Because it is necessary to projectfuture costs that are subject to a range of values, the model wasconstructed to allow for variations in future costs and values aswell as for alternative schedules for key values such as salvageand commissioning costs.
We ran the model through a series of scenarios, each timeadjusting key variables within the range of likely values. Thesevalues were varied to determine the sensitivity of each of thesevalues to the order of results. For example, we evaluated whetherthe rank order of costs change with lower mileage having a lowercost than 110,000 miles. We found that the order of resultsremains unchanged through a wide range of values in each of thekey costs. Thus, 110,000 miles continued to be the lowest costalternative.
APPLICATIONS FOR REPLACEMENT OFOTHER TYPES OF VEHICLES
This model has been applied specifically to pursuit vehicles, but itcan be easily adapted to other types of vehicles where operatingand capital cost data is available. Specific historical cost data onmaintenance and operating costs as a function of mileage, costs tocommission (i.e., place in service) and decommission (i.e., cost toprepare used vehicle for sale) as well as likely salvage values willneed to be revised consistent with the types of vehicles underreview.

Page 94 Chapter Eight: Collocation
Recommendation 10
The Washington State Patrol (WSP) should continueto use the Fleet Life-Cycle Cost Model as the basis forevaluating the mileage replacement level. Anyreplacement policy that differs from the lowest costalternative identified by the model should besupported with cost-benefit considerations. WSPshould also adapt the Fleet Life-Cycle Cost Model foruse in the review of other categories of fleet vehicles.
RESULTS FROM SURVEY OF OTHERJURISDICTIONS
We surveyed other states to learn about their mileagereplacement policies.
Thirty-nine states responded to our questions concerning vehiclereplacement. Most states (26) responded that they replacepursuit vehicles on a regular schedule based on mileage and/orage. The remaining 13 states indicated that they have no setschedule.
The survey results do not clearly indicate the extent to whichother states have attempted to identify the optimum mileage atwhich vehicles should be replaced. Ten states indicate that theyperform some sort of evaluation (there may be more, but severalstates did not answer this question). From the limiteddescriptions of these evaluations, it would appear that only a fewstates are using the kind of rigorous, total-cost economic analysisthat WSP has been working toward, and is now employing withthe Fleet Life-Cycle Cost Analysis.
BUDGETING FLEET REPLACEMENTCOSTS
Currently, funds for the purchase and operation of WSP vehiclesare not segregated, but are incorporated in general patrolbudgets. Consequently, funds intended for purchase ofreplacement vehicles can be used for other purposes (e.g. floods,

Washington State Patrol Performance Audit Page 95
special events). This has resulted in an unplanned andunintended increase in the average age of the fleet.
This increase in average age has a demonstrable impact ofincreased operating costs. While it can be argued that to date(e.g., current pursuit vehicle mileage of 112,500) this practice ofusing vehicle replacement funds for other purposes has notresulted in higher overall total costs for vehicles. It does,however, have the impact of increasing future budgets formaintenance of older vehicles or for increasing the number ofvehicles that ultimately must be replaced.
Sufficient information is available to identify the total capital andoperating costs to operate a vehicle and to establish a budgetedcost per mile. Such information could be translated into adedicated vehicle budget available only for vehicle purchase andoperation. Spending for emergency purposes and contingentneeds could be accommodated through other budget strategies.Funds for vehicles would then be available for other patrolpurposes only if:
• Mileage were less than expected and not a consequence ofrestricting the mission availability of staff;
• Fleet management were to develop efficiencies in thepurchase, maintenance, and operation of the fleet that wouldresult in a reduced cost per mile.
Recommendation 11
The Washington State Patrol should budget funds forvehicle purchase and operation in dedicatedaccounts with restrictions on the ability to transferthese funds to other purposes. Any such transfersshould demonstrate that excess funds are theconsequence of fleet efficiencies and not theconsequence of either restricting mileage at theexpense of mission availability or deferring costs tosubsequent budgets. Funds for emergency purposesand contingent needs should be accommodatedthrough other budget strategies to avoid the use ofrequired vehicle purchase funds.
Budgetingvehicle costsseparatelywould haveseveraladvantages

COLLOCATION
Chapter Eight
SUMMARY
The focus of this chapter is the evaluation of efforts to collocateWashington State Patrol (WSP) facilities and programs withother state agencies and programs. The LegislativeTransportation Committee (LTC) has actively encouragedtransportation-related agencies to coordinate their capitalactivities when possible, collocate their facilities to enhance orimprove service delivery, and to save taxpayer money throughefficiencies in acquiring and operating facilities andadministering programs.
We evaluated the collocation effort to date, focusing on sixprojects. In addition, we reviewed the plans for communicationstower maintenance (a subject that is also discussed in theTelecommunications chapter).
Our conclusions from this evaluation are as follows:
• WSP is complying with RCW 46.01.330, adopted in the 1993-95 Biennium, that mandated coordination between WSP andthe Department of Licensing (DOL) for the siting of facilities.Siting criteria for WSP were met in collocation examples, butthis did not necessarily occur for DOL (the Parkland vehiclelicensing project breached the criterion related to proximity ofsubagents).
• Appropriate economic evaluations have been done on WSPprojects by use of the model developed as the outgrowth of theJLARC Performance Audit of Capital Planning and Budgeting(1995).
Page 98 Chapter Eight: Collocation
• Projects would benefit from retrospective analysis, since someeconomic benefits were overstated (e.g., collocation of DOLvehicle licensing services in the Vancouver facility).
• Collocation opportunities may exist with public/privatepartnerships in the siting, construction, and maintenance ofcommunications towers similar to the successful WSPcollocation with local commercial cellular carriers in Everett.
INTRODUCTION
As early as 1984, the State Patrol and the Department ofTransportation (DOT) initiated an enhanced effort to identifyareas where both agencies could share resources to improveservice delivery and reduce operating and capital costs.
Subsequent events, including legislative direction to reviewownership versus leasing, accelerated consideration of collocation.Legislative policy was to look at owning state facilities since somelocations were leased by transportation agencies for extendedperiods of time. Ownership enables the state to build equity inthe facilities as they appreciate, and affords the state the optionto sell them as the need arises. Additionally, the revenuegenerated from the sale of the facilities can be applied to thepurchase of future or replacement facilities.
In 1991, DOL became an active participant. The three capitalbudgets were jointly evaluated to identify potential collocationsites. To date, all capital requests are reviewed by programmanagers on an on-going basis for potential combination offacilities and services.
In 1993, a market-driven siting study of licensing officesidentified several collocation projects, which were authorized inthe 1995-97 Capital Budget. In the 1993-95 Biennium, thelegislature adopted RCW 46.01.330 mandating coordinationbetween WSP and DOL for the siting of facilities. At the end of1996, 113 separate collocation site efforts had been implementedor were under consideration involving transportation-relatedagencies and/or another state program (e.g., Wildlife), local (e.g.,
Transportationagencies havecoordinatedcollocationefforts
Washington State Patrol Performance Audit Page 99
county government) or private (e.g., Sprint Communications)program. In addition, 43 projects identified as collocationcandidates are identified in the 1997-2007 Transportation AgencyTen-Year Capital Improvement Plan. The goal for each of theseprojects has been to enhance service and increase operating andcapital efficiencies.
PROJECTS REVIEWED
We reviewed a representative sample of WSP collocation projects.The projects reviewed included:
• The Parkland Transportation Center• Vancouver DOL/WSP Service Center• Bellingham Regional Maintenance Center (DOT) and
Detachment (WSP)• Silver Lake Detachment• Union Gap Combined Transportation Center• Thurston County Light Industrial Project• Plans for tower maintenance including projects included in the
ten-year Transportation Capital Improvement Plan
The first six projects are summarized and described in Appendix12. The tower maintenance projects, and the Ten-Year CapitalImprovement Plan, are detailed in the Chapter Six,Telecommunications.
The collation participation for the first six projects is summarizedbelow:

Page 100 Chapter Eight: Collocation
Exhibit 21Summary of Sample Projects
Site DOL DOL WSP WSP DOT Other
Driverservices
VehicleServices
VINOther
(Specify)(Specify) (Specify)
Parkland yes yes yesDetachmentforensic lab
Emergencyresponse;
trafficmanagement
center
Union Gap yes yes yesOver legal
permits
Vancouver yes yes yes NoDOE-
vehicleemissions
ThurstonCountyIndustrial
Fleet, supply,property
management,room for
ElectronicServices
Potential
VariousincludingDNR and
GA
Silver LakePatrol
detachmentreststop
BellinghamRegionalMaintenanceCenter
YesPatrol
detachmentOver legal
permits
Dualagency
refueling
Source: Project summary data as provided by Property ManagementSection,WSP.
Siting – While collocation has the two-fold purpose of enhancingaccessibility to the public (e.g., multiple agencies at singlelocations) and creating opportunities for capital and operatingefficiencies, siting is of paramount importance to WSP programs.WSP has a long-standing policy of locating its facilities nearhighways and interstates that are easily accessible to the patrolstaff and the motoring public. Optimal site locations for WSPfunctions do not necessarily coincide with optimal locations forother functions including DOL. For example, the collocation atthe Parkland site required that DOL siting criteria be breached(e.g., vehicle licensing criteria include minimum distances toexisting subagent locations). This occurred due to lack ofinvolvement by DOL in selection of the site, already owned byWSP.
Review of the siting criteria of various collocation participantswould help to ensure that collocation criteria of individualprograms are sufficiently satisfied in any collocation scenario.
WSP andDOL sitingcriteria do notnecessarilymatch
Washington State Patrol Performance Audit Page 101
This would also help to avoid overstating the benefits of theproposed collocation and to ensure that operating requirements ofconstituent programs are adequately satisfied.
Recommendation 12
All parties to the collocation process should reviewthe siting criteria of the various collocationparticipants.
Economics – While service to the public is an importantconsideration, locations owned by an existing agency which canaccommodate shared siting of facilities and operating synergiesare significant factors supporting collocation of WSP facilities andprograms (i.e., economics and location are the primeconsiderations of importance to WSP). Each of the sampleprojects provided sufficient information prior to collocationdecision-making to evaluate the economics of the collocationproposal relative to WSP.
Since 1996, collocation proposals have been subject to a cost-benefit analysis in the framework of a lease vs. purchase modeldeveloped as the consequence of JLARC’s Performance Audit ofCapital Planning and Budgeting (1995). While the model isprospectively used, we found no subsequent analysis of completedprojects to ensure that collocation assumptions are reasonable.Such retrospective analyses would assist in identifyingcircumstances that might question the reasonableness of costassumptions. For example, the Vancouver project designed anarea for vehicle licensing services in the expectation that ClarkCounty would acquire that space as an agent or authorize asubagency; neither occurred. Similar circumstances occurred atthe Union Gap facility after facility financial commitments hadbeen made by the state.
Recommendation 13
Collocation participants should routinely review pastprojects to enable prospective projects to benefit fromimproved assumptions relative to location,appropriate mix of collocation participants, andfacility programming.
Futureprojects couldbenefit fromanalysis ofpast projects

Page 102 Chapter Eight: Collocation
Additional Collocation Opportunities (Private Sector) – Last year,the Patrol commissioned an inventory of its currenttelecommunications towers in service around the state. Thestudy investigated 56 existing tower facilities to determinestructural, maintenance, paint, and other needs for the facilities.The study determined that the microwave towers hadaccumulated nearly $1.6 million in deferred maintenance. Theten-year capital program submitted by the state suggests that$4.25 million for tower maintenance will be sought over the next10 years (1999-2009).
Recently, the Property Management Division devised aninnovative strategy to replace one of the WSP-managed towersthat had been recommended for replacement by the engineeringconsultant. By partnering with local commercial cellular carriers,the Property Management Division was able to avoid this capitalexpense. This strategy also addresses community concern thatfewer, shorter poles are desirable and more aesthetically pleasingto adjacent property owners.
Chapter Six, Telecommunications, contains a recommendation forthe State Patrol to ascertain which of its telecommunicationstowers provide opportunities for collocation and partnership withother entities, and to attempt to duplicate the success of the WSPEverett tower project. (See Recommendation 8, page 85).
INDIRECT COST RECOVERIES
Chapter Nine
INTRODUCTION
A concern brought to the attention of the Joint Legislative Auditand Review Committee (JLARC) during the pre-audit process wasas follows: Monitoring and review of the Washington State Patrol’s(WSP) budget is made more difficult because of the agency’srelatively high level of grants and interagency reimbursements,and its associated recovery of indirect costs. Specifically, becausethese recovered costs (or at least portions thereof) can fall“outside” what might be considered the regular budget andallotment process, a complete picture of the Patrol’s budget can bedifficult to discern. A related concern was that these moneyscould be used to fund items not explicitly authorized by thelegislature. This chapter explores these and related issues.
BACKGROUND
WSP receives reimbursement from other agencies for services itprovides to or on behalf of those agencies.63 Payments it receivesfrom the Department of Transportation (DOT) for providingtroopers at DOT construction sites are a prime example. ThePatrol also receives federal grant money for various activities,such as the Narcotics Task Force program.
When providing services for, or on behalf of another agency, bothstate and federal regulations allow for the recovery of all costsassociated with providing the service. This includes both thedirect costs, which typically include elements such as salaries,
63 In 1995-97, the Patrol received $17.5 million in interagency reimbursement.Among non-education agencies, this amount was second only to theDepartment of Social and Health Services.
Focus oninteragencyreimburse-ments andrecovery ofindirect costs

Page 104 Chapter Nine: Indirect Cost Recoveries
benefits, and travel, and also the indirect costs; costs which areless readily identifiable but which are incurred nonetheless. Forthe Patrol, these include such things as administration, trainingand supply services.
State regulations provide that, when possible, agencies are tobase their indirect cost charges on a set rate that each agencycalculates individually as part of an Indirect Cost Plan, developedin accordance with Circular A-87 published by the United StatesOffice of Management and Budget. The Patrol’s most recent “A-87 Indirect Cost Plan” is for FY 1997. Pursuant to that plan, thePatrol’s indirect cost rate is 30 percent of salaries and benefits.
The Patrol indicates it has been aggressive in pursuingreimbursement for the full costs of its contract and grant work.Doing so benefits the Patrol by maximizing the revenue itreceives from third-party users of its services. To the extent thatthese third-party users include the federal government, the stateas a whole also benefits through the recovery of additional federalfunds. In 1995-97, the total amount of indirect costs recovered bythe Patrol was approximately $4.2 million.
COST RECOVERIES AND THEBUDGETING/ALLOTMENT PROCESS
As noted in the introduction to this chapter, cost recoveries canfall outside what might be considered the regular budget orallotment process. To illustrate how this can occur, theinformation below focuses on the Patrol’s “Master Contract” withDOT (the one used primarily for providing troopers at DOTconstruction sites). This area represents one of the larger sourcesof indirect cost recovery for the Patrol, and it also constitutes aseparate “program index” within the Patrol’s budget; meaningfunds for this activity are accounted for separately.
Exhibit 22 shows the budget for the Patrol’s DOT MasterContract for the past two and one-half biennia, highlighting thedivision between direct and indirect costs, and how both are offset(or nearly so) through interagency reimbursement. As can beseen in Exhibit 22, although the final expenditure amounts arerelatively significant, WSP did not allot any of the funds up-front
$4.2 millionin indirectcostsrecovered in1995-1997
Reviewfocused onDOT MasterContract
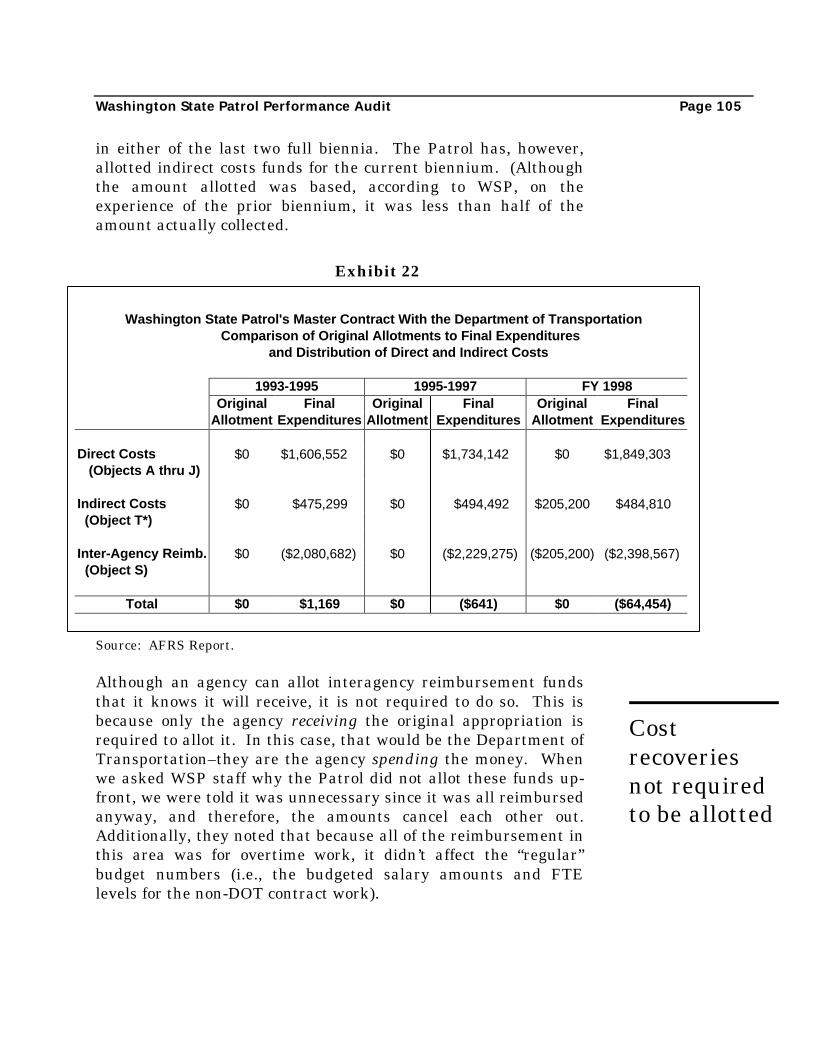
Washington State Patrol Performance Audit Page 105
in either of the last two full biennia. The Patrol has, however,allotted indirect costs funds for the current biennium. (Althoughthe amount allotted was based, according to WSP, on theexperience of the prior biennium, it was less than half of theamount actually collected.
Exhibit 22
Source: AFRS Report.
Although an agency can allot interagency reimbursement fundsthat it knows it will receive, it is not required to do so. This isbecause only the agency receiving the original appropriation isrequired to allot it. In this case, that would be the Department ofTransportation–they are the agency spending the money. Whenwe asked WSP staff why the Patrol did not allot these funds up-front, we were told it was unnecessary since it was all reimbursedanyway, and therefore, the amounts cancel each other out.Additionally, they noted that because all of the reimbursement inthis area was for overtime work, it didn’t affect the “regular”budget numbers (i.e., the budgeted salary amounts and FTElevels for the non-DOT contract work).
Costrecoveriesnot requiredto be allotted
Washington State Patrol's Master Contract With the Department of TransportationComparison of Original Allotments to Final Expenditures
and Distribution of Direct and Indirect Costs
1993-1995 1995-1997 FY 1998Original Final Original Final Original Final
Allotment Expenditures Allotment Expenditures Allotment Expenditures
Direct Costs $0 $1,606,552 $0 $1,734,142 $0 $1,849,303 (Objects A thru J)
Indirect Costs $0 $475,299 $0 $494,492 $205,200 $484,810 (Object T*)
Inter-Agency Reimb. $0 ($2,080,682) $0 ($2,229,275) ($205,200) ($2,398,567) (Object S)
Total $0 $1,169 $0 ($641) $0 ($64,454)
Page 106 Chapter Nine: Indirect Cost Recoveries
Because these funds are not allotted by the Patrol, they are farless visible than they otherwise would be. For the direct costs,that is likely not significant. From a budgetary perspective, thefunds remain within their own budget area, and are reimbursedon a readily identifiable one-for-one basis. The issue is much lessclear-cut when it comes to the indirect costs however. This isbecause the reimbursement basis for these funds is not as easilyidentifiable and because they are available for disbursementthroughout the agency.
Indirect costs are widely accepted as a standard and legitimatecomponent of full project costs. Theoretically, such funds shouldnot be an issue since they are intended to provide “for therecovery of only those costs that are actually incurred.”64 As such,it would seem reasonable to expect that the funds would beallocated back to the individual sub-programs which incurred theadditional expenses. Here, however, there is some question as towhether either of these is the case. Among the issues that comeinto play are the following:
• The amount of indirect costs collected for the DOTMaster Contract is likely higher than actual costsincurred. From the perspective of interagencyreimbursement and indirect costs, the DOT Master Contractmay be somewhat unusual in that all of the work performedby troopers under the contract is done on an overtime basis.This raises two issues. The first is that some of the indirectcost centers cited by the Patrol in it’s A-87 Indirect CostProposal, while fully appropriate for allocating costs for“straight time,” may not be applicable for work performed onovertime since additional costs are likely not incurred.Examples of such cost centers include “Human Resources” and“Property Management.”
The second and more significant issue is that the Patrolimposes the indirect rate on the overtime salaries, which are50 percent higher than straight-time salaries. The effect isthat the Patrol collects 50 percent more in indirect charges onsalaries (plus a somewhat lesser amount on benefits65) than it
64 See OFM Budgeting and Accounting Manual, Section 4.3.3.1.2 e.(1).65 The cost of benefits increases for overtime pay, but not proportionately tothe increase in salaries.
Question ofwhetherindirect rateshould becharged onovertimepremium
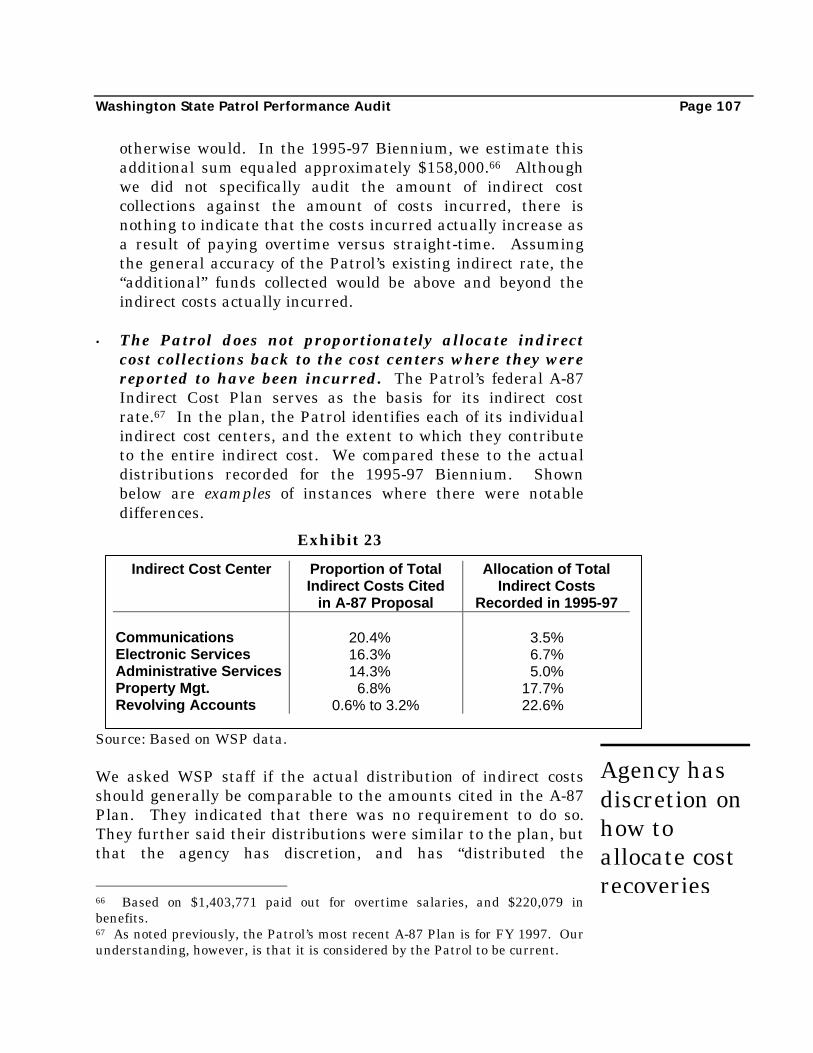
Washington State Patrol Performance Audit Page 107
otherwise would. In the 1995-97 Biennium, we estimate thisadditional sum equaled approximately $158,000.66 Althoughwe did not specifically audit the amount of indirect costcollections against the amount of costs incurred, there isnothing to indicate that the costs incurred actually increase asa result of paying overtime versus straight-time. Assumingthe general accuracy of the Patrol’s existing indirect rate, the“additional” funds collected would be above and beyond theindirect costs actually incurred.
• The Patrol does not proportionately allocate indirectcost collections back to the cost centers where they werereported to have been incurred. The Patrol’s federal A-87Indirect Cost Plan serves as the basis for its indirect costrate.67 In the plan, the Patrol identifies each of its individualindirect cost centers, and the extent to which they contributeto the entire indirect cost. We compared these to the actualdistributions recorded for the 1995-97 Biennium. Shownbelow are examples of instances where there were notabledifferences.
Exhibit 23
Source: Based on WSP data.
We asked WSP staff if the actual distribution of indirect costsshould generally be comparable to the amounts cited in the A-87Plan. They indicated that there was no requirement to do so.They further said their distributions were similar to the plan, butthat the agency has discretion, and has “distributed the
66 Based on $1,403,771 paid out for overtime salaries, and $220,079 inbenefits.67 As noted previously, the Patrol’s most recent A-87 Plan is for FY 1997. Ourunderstanding, however, is that it is considered by the Patrol to be current.
Agency hasdiscretion onhow toallocate costrecoveries
Indirect Cost Center Proportion of Total Allocation of TotalIndirect Costs Cited Indirect Costs
in A-87 Proposal Recorded in 1995-97
Communications 20.4% 3.5%Electronic Services 16.3% 6.7%Administrative Services 14.3% 5.0%Property Mgt. 6.8% 17.7%Revolving Accounts 0.6% to 3.2% 22.6%
Page 108 Chapter Nine: Indirect Cost Recoveries
allocations where it felt the additional resources were mostneeded.”
In 1995-97, the largest single share of the Patrol’s indirect costrecoveries–22.6 percent, totaling just under $1 million($946,803)–was allocated to “Revolving Accounts,” which is aseparate account within the Office of the Chief. According tothe Patrol this account:
“. . . is now used as the clearing-house for indirect costrecoveries. Any recoveries in excess of what was anticipatedin the base allotments are [directed into the account andare] available for use as an agency resource to addresscontingencies.”
• A specific accounting of what past indirect costrecoveries were used for could not be provided. We askedthe Patrol for an accounting or breakdown of what the$946,803 in indirect cost recoveries (Object T) in 1995-97 wereused for. WSP staff told us that the state’s accounting systemis not set up to provide for that type of specific breakdown.
Specifically, we were told that although there would bewarrants that would show, for example, that money that wentinto a particular program did come from the RevolvingAccounts fund, they would not indicate specifically what themoney was for. WSP staff did offer their recollection, however,that as much as a third of the Object T monies had been usedto cover over-spending that had occurred in the Patrol’sElectronic Services Division.
The Patrol’s position, as expressed by staff, is that thesemonies represent a necessary contingency fund, and that theyare used in a responsible manner to address legitimate needs,as identified by agency management.
DISCUSSION
In summary, the indirect cost recoveries received by the Patrol forits DOT Master Contract–totaling nearly one-half million dollarsduring the 1995-97 Biennium–were not allotted (nor did theyhave to be), even though they have constituted a generally on-
Spending ofindirect costrecoveriesdifficult totrack
Washington State Patrol Performance Audit Page 109
going source of funds for the agency over the past five years.68
Because all work performed under the contract is done on anovertime basis, and the indirect rate is imposed on the higherovertime salary level, the amount of funds recovered was likelygreater than the costs actually incurred; assuming the generalaccuracy of the Patrol’s current indirect rate. In essence, thisprovides the equivalent of additional revenue for the agency.Patrol staff acknowledge that some portion of these funds areused for discretionary purposes, yet because of the structure ofthe state’s accounting system, a specific breakdown of where thefunds went cannot be provided.
To our knowledge, the Patrol’s actions in this area have not beeninconsistent with applicable rules or regulations. Nonetheless, inthis instance, the agency’s collection and subsequent distributionof indirect cost recoveries could be seen as falling outside whatmight be considered the typical budget process. Specifically,under the existing system, the Patrol has access to what areessentially additional funds, above and beyond thoseappropriated to it by the legislature. There is limited outsideoversight of these funds, including by the legislature itself.
The Office of Financial Management (OFM) has responsibility fordeveloping accounting policies and procedures related tointeragency transactions. The preliminary report for this auditcontained two recommendations directed to OFM. Bothrecommendations would have had OFM establish appropriatepolicies and procedures concerning the identification of costrecoveries in budgets and allotments, and charging an indirectrate on overtime. OFM agreed that additional review of thePatrol's development and application of cost allocation plans isneeded, but expressed reservations about establishing statewidepolicies and procedures to address issues that were identified inan audit of a single agency. The concern was thatimplementation changes to address potential issues in one agencymight have unintended consequences for other state agencies.We concur with these concerns.
We have discussed with OFM and the Patrol several options forensuring that the issues raised in this chapter will be addressed. 68 The amount of reimbursement received from the DOT Contract wassubstantially lower in the 1991-1993 Biennium–($198,963).

Page 110 Chapter Nine: Indirect Cost Recoveries
As described above, these issues relate to questions of whetherindirect cost recoveries match actual costs, and whetherinformation on the expenditure of these recoveries is adequatelydetailed and visible. This latter issue is of particular importanceto the legislative members who asked that the audit include areview of indirect cost recoveries.
With the concurrence of OFM and the Patrol, we offer thefollowing recommendation.
RECOMMENDATION
Recommendation 14
The Washington State Patrol and the Office ofFinancial Management should jointly review thebasis for the Patrol's indirect cost recovery plan usedin the administration of the Patrol's "DOT MasterContract" to determine if there is any need formodification.

SCOPE AND OBJECTIVES
Appendix 1
SCOPE
As mandated in the 1997-99 Transportation Budget,* this auditwill examine the transportation-related activities of theWashington State Patrol, focusing on law enforcement operations,communications systems and technology requirements. Asappropriate, the audit will assess performance and review issuespertaining to the efficiency, effectiveness, and accountability ofprogram operations.
OBJECTIVES
• Assess the overall efficiency and effectiveness of the Patrol incarrying out its major transportation-related programs andfunctions. Included will be a review of its overallorganizational structure and administrative functioning, anexamination of its strategic planning and performancemeasurement activities, and an assessment of its patrolallocation and vehicle replacement practices.
• Review and assess the budgetary structure and practices ofthe Patrol.
• Examine compensation-related issues, including the salarysetting process, specialty pay provisions, and the Patrol’spractices with respect to overtime and contract work.
• Review the nature and extent of coordination between thePatrol and local jurisdictions with respect to such issues asaccident investigations and communication and data links.
* ESSB 6061.

Page 2 Appendix 1: Scope And Objectives
• Evaluate capital related issues pertaining to the Patrol,including its performance in securing necessary facilities forthe least possible cost, and the legislature’s policy decision toencourage collocation of transportation-related agencies.
• Review the adequacy of the Patrol’s existing communicationssystems, and assess its current plans for upgrading thosesystems.
• Review the Patrol’s overall data and technology needs, andassess the adequacy of its planning processes in this regard.

AGENCY RESPONSES AND AUDITOR'SCOMMENTS
Appendix 2
• WASHINGTON STATE PATROL
• OFFICE OF FINANCIAL MANAGEMENT
• AUDITOR’S COMMENTS
To link to this appendix, click here.

Page 2 Appendix 2: Agency Responses and Auditor’s Comments
AUDITOR’S COMMENTS REGARDING WSPCOMMENTS ON COUNTY ROADS SECTION
The Patrol’s response includes a number of statements concerningthe chapter on County Roads that require comment:
• Regarding the comment that “projected reductions are basedon an arbitrary association between the number of vehiclemiles traveled on county roads and the number of contacts:”
Contacts-per-vehicle-mile-traveled is a rate; a measure thatallows for direct comparison of service levels amongjurisdictions of different sizes and populations (e.g.,between highly urbanized King County and sparselypopulated Columbia County). It is used in the report toquantify both current service levels, and potentialreductions that could be achieved through meeting theLTC’s directive.
The target reductions in the report are not based on apresumed association between contacts and vehicle milestraveled. They are based on limiting the number ofcontacts in each geographical area to a rate that is nohigher than that which currently exists in either one-half(median) or one-quarter (25th percentile) of all thegeographical areas within the state.
• Regarding the comment that the report fails to consider otherimportant variables affecting county road activity:
As indicated in the report, we do not disagree withthe Patrol’s assertion that there may be legitimatereasons for providing dissimilar levels of service insome areas (such as those cited in the Patrol’sresponse). The report concludes, however that it is upto the legislature to determine what levels of serviceare appropriate, and what factors should beconsidered in determining those levels.
• Regarding the statement that the report “does not explain whytarget service level reductions are needed, when the agency

Washington State Patrol Performance Audit Page 3
has already made substantial progress in complying with theLTC directive as noted previously” (where previously thePatrol notes it has made progress in reducing its activities oncounty roads “over the last five years:”
The LTC’s directive was issued on January 30, 1998. It isevident that the LTC felt that reductions were necessary inthe county road service levels that were current at thattime. That is why all of our analyses use FY 1998 as thecurrent, or base year. While the report acknowledges thePatrol’s efforts to reduce its activity levels on county roadsprior to 1998, it is apparent that the LTC wanted andexpected reductions beyond those that had previously beenachieved.
• Regarding the comment “that in order to achieve the targetreductions, troopers would have to ignore all non-injury andproperty damage incidents observed on county roads”(emphasis by the Patrol):
This comment reflects a misunderstanding on the part ofthe Patrol as to what level of service would still be allowedwithin the confines of the target reductions. As shown inExhibit 8, the number of hours established as the target fornon-injury collisions is 834 for the 25th percentile target,and 1,391 for the median target. The actual number ofnon-injury collision contacts represented by these hourlytotals is 498 and 824, respectively. In other words, underthe median target level, the Patrol would still be expectedto investigate up to 824 non-injury collisions on countyroads annually.
See the following comment for numbers pertaining toother calls-for-service and self-initiated-contacts.
• Regarding the final comment which implies that the targetlevel reductions go “beyond” the LTC directive:
We disagree with this assertion. The “Background” sectionof Chapter 3 presents our understanding of what the LTC’sexpectations were regarding the level of county roadactivities that the Patrol should limit itself to under the

Page 4 Appendix 2: Agency Responses and Auditor’s CommentsLTC directive. As is also indicated in Chapter 3, the Chiefpreviously confirmed that our understanding wasconsistent with the Patrol’s. A comparison of LTC servicelevel expectations to the target levels presented in thereport is provided below. [Note: The figures belowrepresent the number of contacts allowed under the targetreductions, whereas the figures in the body of the reportrepresent the number of hours associated with thosecontacts.]
Non-Injury Collisions
• LTC Expectation: no investigations of non-injury accidents• Target Reduction: contacts reduced from 5,934 in FY 1998 to
either 824 (median) or 498 (25th percentile)annually
Other Calls-For Service
• LTC Expectation: limited to what might be consideredexceptional circumstances
• Target Reduction: contacts reduced from 18,559 in FY 1998 toeither 13,250 (median) or 8,407 (25th
percentile) annually
Self-Initiated Contacts
• LTC Expectation: Should occur only if a trooper “spotssomething” while traveling to or fromanother work-site
• Target Reduction: contacts reduced from 61,232 in FY 1998 toeither 43,201 (median) or 31,756 (25thpercentile) annually
WASHINGTON STATE PATROL ACTIONSRESULTING FROM 1991 LTCRECOMMENDATIONS
Appendix 3
To link to this appendix, click here.

Limitations of the PAM Model
Appendix 4
Chapter One of this report contains a summary discussion ofsome of the limitations of the staffing and deployment modelcurrently being used by the Washington State Patrol (WSP).Recommendations to address these limitations are also includedat the end of Chapter One.
This appendix expands on the discussion in Chapter One byproviding more detail concerning the limitations and the basis forthe conclusions drawn in the audit.
A discussion of the major limitations to the model is discussedbelow. Addressing these limitations may result in producingmodel outputs that are more closely associated with actualperformance data as reported from the Computer Aided Dispatch(CAD) system. We are unable to say, however, how muchimproved accuracy would result from these changes. As indicatedin Chapter One, and as reflected in our recommendations, furthervalidation efforts would have to be made before reaching aconclusion.
PRIORITIES OF CALLS FOR SERVICE
The version of the Police Allocation Manual (PAM) for statewideagencies (WSP’s current model) does not distinguish betweendifferent priorities of calls for service. If the legislature and WSPdecide to move in the direction of more refined performancemeasures as suggested in Recommendation 2, a model thatestimates service performance in terms of priority of calls will beneeded. A different version of PAM for municipal policedepartments allows the user to distinguish between high prioritycalls and other calls.69 Our review of immediate response data for
69 Another difference with the municipal version of PAM is that in incorporatespre-empted calls in determining the number of troopers needed for immediate

Page 2 Appendix 4: Limitations of the PAM Model
each priority of call suggests that calls can be reasonably dividedinto the two categories used in the municipal model. Generally,the highest priority calls, (1 and 2), are received and are handleddifferently than the lower priority calls (3 through 6). Datashowing patrol performance in relation to the first three prioritiesof calls are included in Appendix 6.
STAFFING AND WORKLOADVARIATIONS
Calls for service and trooper staffing can vary significantly bytime of day and day of week. For example, we looked at therelationships between staffing and calls for service by time of dayfor a sample of Autonomous Patrol Area (APA)s during fourweeks in 1998. We calculated the following values to determinethe degree of association between these two variables. Thepossible range is from zero to one, with zero indicating virtuallyno association. A one, or a number close to one, would indicate ahigh degree of association. 70
response. However, according to WSP, the CAD system currently does notprovide information on pre-empted calls.70 The method we used was a simple regression with the variablesstandardized using z-scores, which measure the distance of each variable fromthe mean in terms of standard deviation. The values indicating association arethe coefficients of determination [R squares]. We could not do the same kind ofanalysis for days of the week because of data reliability problems.

Washington State Patrol Performance Audit Page 3
APA NAME DEGREE OFASSOCIATION
02 Tacoma Freeway 0.0225 Wenatchee 0.5126 Ellensburg 0.3227 Okanogan 0.2228 Ephrata 0.6529 Moses Lake 0.2235 Port Angeles 0.4436 Bremerton 0.1137 Hoquiam 0.4838 Shelton 0.2339 Raymond 0.00
Sources: WSP District 1, 6 and 8 Schedules 3/16/98 through4/12/98, WPS CAD data for the same period, and JLARCworksheet: Sample APAs Regression Results.
These values suggest that for the sample APAs in this one-monthperiod, there was not a pattern of a strong association betweenwhen troopers were assigned to work and when calls for serviceoccurred. A comparison involving the same or different APAsover different time periods might show other patterns. These datashould not be interpreted as indicating that staffing patternsshould change. As discussed in Chapter One, there are a numberof factors that determine how troopers are scheduled. If,however, districts can manage to schedule troopers to bettermatch call-for-service workload by time of day without sacrificingother operational objectives, this might be one way to improveperformance in relation to response availability and responsetime.
There are two approaches that can be taken with the currentPAM model. The first is a simplified approach whereby the userenters data for time and activities into the model, and then themodel divided the data evenly into the number of effective shiftsper day.71 By treating the data this way, this approach implicitly 71 Effective shifts are calculated as follows: Hours of coverage per week/(7 daysper week X 8 hours per shift). For example, 24-hour coverage per week wouldtotal 168 hours. 168 hours divided by 56 is three – the number of effective

Page 4 Appendix 4: Limitations of the PAM Model
assumes that workload and staffing are proportionate and do notvary by time or day or by day of week. The second approachdivides the day into three shifts, but does not divide the week intodays. The user specifies how staffing is divided among the shiftsby indicating the percentage of staffing for each of the threeshifts. Although this approach recognizes that staffing levels mayvary by shift, it still implicitly assumes that workload andstaffing during these shifts are proportionate and do not vary.
The problem with these implicit assumptions can be stated asfollows:
• If staffing and workload do not actually match, the estimatesof staffing needs and performance information from PAM willbe different to some degree to real staffing needs and actualperformance.
• Assuming that there is a match, when in fact there is none oronly a weak one, will result in an overestimation ofperformance (or conversely an underestimation of staffingneeds).
Modeling WSP patrol operations by time of day and day of weekwould likely provide the most accurate model outputs. It is notclear at this time, however, how much improved accuracy wouldresult over using three shifts, or whether the improvement wouldjustify the additional effort that would be involved.
LESS THAN TWENTY-FOUR-HOURSTAFFING
As currently designed, PAM estimates staffing needs related toperformance objectives for APAs when they are staffed. Presently,22 of the 39 APAs have dedicated staffing for less than twenty-four hours per day.
For the 22 APAs that are not staffed for an entire day, PAMtreats the calls for service for those APAs as though the calls onlyoccur during the time the APAs are staffed. This workload can shifts per day. If less than 24-hour coverage is provided, the number ofeffective shifts will be less than three.

Washington State Patrol Performance Audit Page 5
actually occur at any time. In instances where calls are receivedwhen an APA is not staffed, troopers have to be drawn from otherAPAs or called out, or other provisions have to be made.
The staffing estimate derived by PAM is based on what staffingwould be needed only during the hours staffed to handle twenty-four hours worth of workload. Sensitivity analysis suggests thatthe impact of this model feature is to overestimate performanceand to underestimate staffing needs.
A way of dealing with this situation is to use a multi-shiftmodeling approach, or at a minimum the existing three-shiftoption within PAM with modifications to spread calls-for-serviceworkload data among the shifts. Again, it is not clear whetherthe more detailed approach would result in a substantially bettermatch between the model outputs and reality.
ESTIMATING ACTUAL PERFORMANCE
PAM enables the user to specify response availabilityperformance objectives of 50, 60, 70, 75, 80, 85, 90, 95, 97, 98 and99 percent. For the purpose of estimating staffing needs, thislimited number of objectives may be sufficient. As an example,WSP has used PAM to estimate its patrol staffing needs based onachieving an 80 percent target for trooper availability to respondimmediately to calls for service. Assuming no problems with themodel or WSP’s use of it, the resulting staffing needs estimatewould be directly associated with the 80 percent target.
But when WSP receives less than the estimated number oftroopers needed, it has been necessary to “run the modelbackward” to find what range of performance would be associatedwith the actual staffing. This is done by setting the performancetarget at lower and lower levels until the model shows a need ofno additional staff (or even fewer staff as the case may be). So, ifPAM shows a need for staff at a 70 percent target but a surplus ofstaff at 60 percent, the process has been to calculate an actualpercentage somewhere within the range permitted by PAM. Theprecision in running the model backward is therefore less thanwith approach for estimating staffing needs when theperformance objective is specified.
Page 6 Appendix 4: Limitations of the PAM Model
As indicated in Chapter One, actual performance of WSP (inrelation to availability for immediate response) is below 50percent. PAM would need to be modified with additional tablesfor lower percentages in order to “run the model backwards” toestimate actual performance based on current or reduced levels ofstaffing. Additional tables would also be of benefit in general forusing the model to estimate performance and staffing needs basedon different scenarios.

PAM Outputs versus Data from theComputer Aided Dispatch System
Appendix 5
We performed regression analyses in which the dependentvariable was the data from the Computer Aided Dispatch (CAD)system and the independent variable was relative staffingdeficiencies based on Police Allocation Manual (PAM) outputs.We used CAD data showing the percentage of time that trooperswere available to respond to citizens’ calls for service withindifferent time periods. Regardless of the time period used (e.g.,within 1, 2, 3, 5 or 10 minutes), the results were approximatelythe same. For purposes of illustration here, we are usingresponse availability within 5 minutes.
Before using PAM outputs relating to relative staffingdeficiencies, we first made several adjustments to the usage of themodel, as are explained in Chapter Two. This involved using thecorrect tables in PAM, and entering overtime hours and reportedactual time for self-initiated contacts. Since the relative staffingdeficiencies are based on the staffing needs related to trooperavailability, one would expect there to be a strong correlationbetween this variable and the CAD data.
The resulting coefficient of determination [R square] was only .17.The association improved somewhat when we added anotherindependent variable showing the relative staffing coverage foreach Autonomous Patrol Area (APA) (i.e., degree to which an APAis staffed for a full, 24-hour day). We did this because the modeltends to overestimate performance for those APAs that are notstaffed 24-hours per day. The resulting R square was still only.23. We standardized the variables used in the multipleregression by calculating z-scores.
In another set of tests, we looked at the nine APAs that werewithin 5 percent of having the appropriate number of staff neededto meet response availability objectives of 50 or 60 percent,according to PAM. In these tests, the R squares from the

Page 2 Appendix 5: PAM Outputs Versus CAD Data
regression were in the range of .29 to .33, depending on whethertwo or three minutes were used to account for call handling timein the communication centers. One would expect these values tobe higher if PAM were reasonably predicting actual performance.
As a final test, we used a method that calculates an R square for twovariables, but rather than using z-scores based on the actual data, it uses therank order of the variables. This method, called the Spearman RankCorrelation Coefficient, is simpler and less precise than regression.However, since ranks are used, it is somewhat easier to actually see thestrength of the association between the ranked variables.
The R square calculated by this method was .39. Using rankorder, we would have expected to see a stronger degree ofassociation. A visual inspection of the ranking data may help toexplain why the degree of association is not higher than wascalculated. In the following table, the ranks are shown for each ofthe two variables for each APA. Also shown are the absolutedifferences between the rankings for each APA. Although thereare many APAs where the rankings are the same or are very closeto one-another, there are many others where the rankings arequite different. For several APAs the rankings go in entirelydifferent directions.
The chart that appears on the last page of this appendix uses thesame data, but shows how the rankings of the APAs compare interms of percentages. As an example of how to read this chart,for APA 37 there is an exact match between its ranking in termsof staffing needs and relative performance; in contrast, for APA32, the rankings are quite different (82 percent toward beingcompletely different).

Washington State Patrol Performance Audit Page 3
Source: PAM outputs and CAD data for FY 1997.
Relative ResponseStaff Need Availability Absolute
APA Rank Rank Difference
1 7 9 22 28 20 83 32 10 224 18 21 35 22 11 116 23 8 157 29 12 178 8 6 29 3 7 4
10 38 16 2211 27 35 812 16 34 1813 30 37 714 35 36 115 31 23 816 2 2 018 33 29 419 19 31 1220 14 17 321 26 25 122 9 28 1923 15 18 324 17 26 925 11 4 726 13 5 827 39 19 2028 10 3 729 5 1 430 4 15 1131 20 14 632 1 32 3133 34 13 2134 21 22 135 25 27 236 37 39 237 24 24 038 6 30 2439 36 38 240 12 33 21
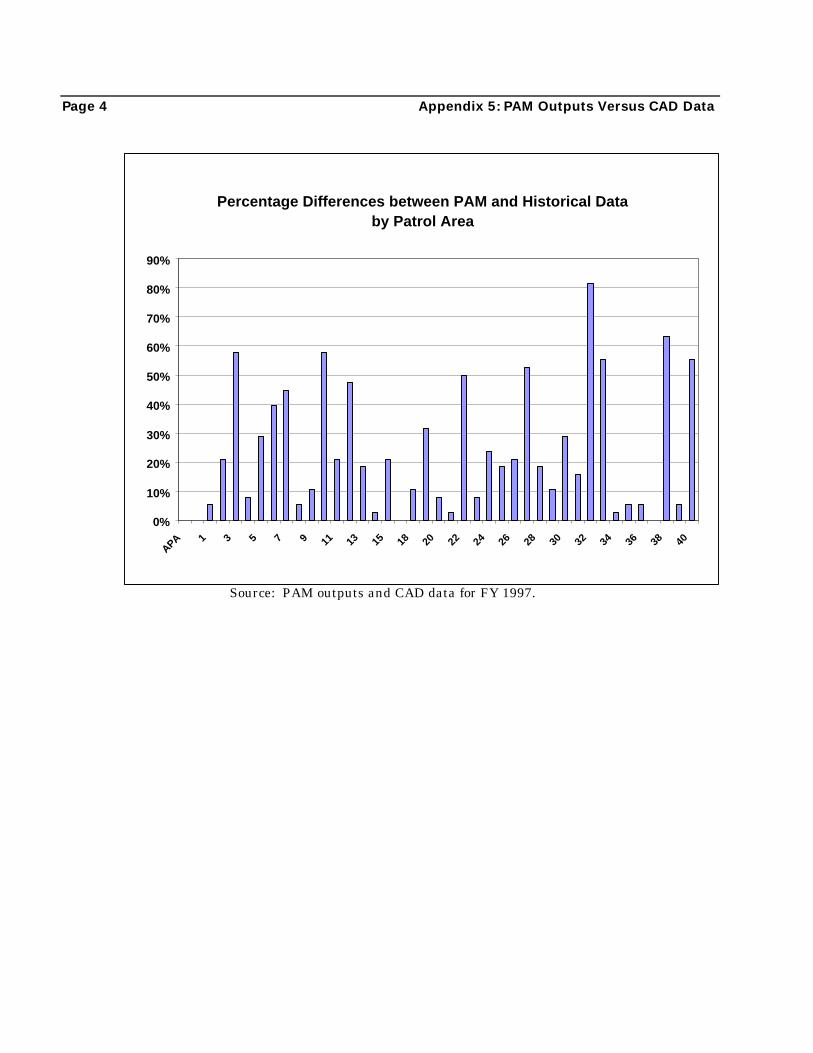
Page 4 Appendix 5: PAM Outputs Versus CAD Data
Source: PAM outputs and CAD data for FY 1997.
Percentage Differences between PAM and Historical Data by Patrol Area
0%
10%
20%
30%
40%
50%
60%
70%
80%
90%
APA 1 3 5 7 9 11 13 15 18 20 22 24 26 28 30 32 34 36 38 40

Performance Outputs for Patrol
Appendix 6
Until recently, the only performance outcome data for theWashington State Patrol (WSP) that was available to decision-makers was the percentage of time that troopers were available torespond immediately to citizens calls for service. Thisinformation, which came from the Police Allocation Model (PAM),did not distinguish performance outcomes among the priorities ofcalls. Another drawback of this data was that it could only be arough estimate at best. This is because PAM was not designed toprovide precise estimates of performance outcomes based on“running the model backward.”
Now, WSP has data from the Computer Aided Dispatch (CAD)system that shows patrol performance in a number of ways, andis no longer based on estimates.
Chart A shows the percentages of time that troopers are availableto respond to citizens’ calls for service within different timeperiods from the time when the calls are first received at thecommunications centers.
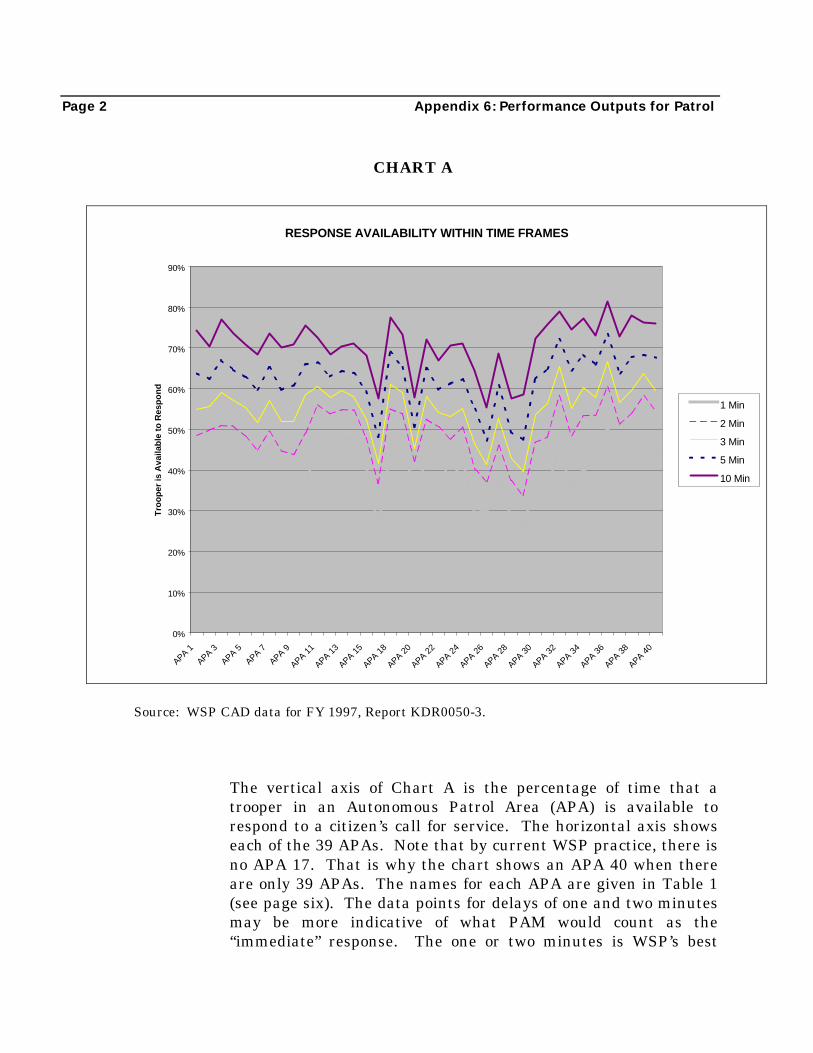
Page 2 Appendix 6: Performance Outputs for Patrol
CHART A
The vertical axis of Chart A is the percentage of time that atrooper in an Autonomous Patrol Area (APA) is available torespond to a citizen’s call for service. The horizontal axis showseach of the 39 APAs. Note that by current WSP practice, there isno APA 17. That is why the chart shows an APA 40 when thereare only 39 APAs. The names for each APA are given in Table 1(see page six). The data points for delays of one and two minutesmay be more indicative of what PAM would count as the“immediate” response. The one or two minutes is WSP’s best
RESPONSE AVAILABILITY WITHIN TIME FRAMES
0%
10%
20%
30%
40%
50%
60%
70%
80%
90%
APA 1
APA 3
APA 5
APA 7
APA 9
APA 11
APA 13
APA 15
APA 18
APA 20
APA 22
APA 24
APA 26
APA 28
APA 30
APA 32
APA 34
APA 36
APA 38
APA 40
Tro
op
er is
Ava
ilab
le t
o R
esp
on
d
1 Min
2 Min
3 Min
5 Min
10 Min
Source: WSP CAD data for FY 1997, Report KDR0050-3.

Washington State Patrol Performance Audit Page 3
estimate of the call handling time in the communicationscenters.72
Chart B shows the percentages of time within each APA thattroopers are available to respond to priority 1, 2 and 3 callswithin two minutes of the call being received. Priority 1 is themost severe type of call, and covers such incidents as fatal hit-and-run and other types of serious calls, emergencies and hotpursuits. Priority 2 is somewhat less serious and pertains to callsfor incidents such as non-injury accidents and hazards. Priority 3calls may be for such things as DUI reports, backup to otheragencies, and non-emergency investigations.
CHART B
Source: WSP CAD data for FY 1997, Report KDR0050-3
72 One minute was the estimate made by staff in Budget and Fiscal Services,and two minutes (or slightly more) was the estimate of staff in theCommunications Division.
RESPONSE AVAILABILITY Priorities 1, 2 and 3
0%
10%
20%
30%
40%
50%
60%
70%
80%
APA 1
APA 3
APA 5
APA 7
APA 9
APA 11
APA 13
APA 15
APA 18
APA 20
APA 22
APA 24
APA 26
APA 28
APA 30
APA 32
APA 34
APA 36
APA 38
APA 40
Priority 1
Priority 2
Priority 3

Page 4 Appendix 6: Performance Outputs for Patrol
The reason why the percentages for Priority 3 calls are in somecases higher than for Priority 2 calls is likely due to the fact thatsome of the Priority 3 calls can be scheduled, and that dispatchersmay delay dispatching these calls until troopers are available.Priority 4 and 5 calls are not shown here because they arerelatively few and show wide variations in relation to immediateresponse for the same reasons as Priority 3 calls.
Table 1 on page six shows response times by two categories:
Received-to-Arrive. This refers to the minutes elapsed from whenthe call is first received in the communications center to the timewhen the first trooper arrives at the scene.
Assigned-to-Arrive. This refers to the average minutes elapsedfrom when the call is first assigned to a patrol unit until the timewhen that unit arrives at the scene. This is an average for all theunits that are dispatched to a call. For instance, a call may beassigned to the first available trooper who is at a relatively fardistance from the scene. This trooper may take 20 minutes torespond. Meanwhile, another trooper who is closer to the scene isalso dispatched. This second trooper may take only 10 minutes torespond. The time from assignments to the call to the arrivals isthe average for the two units, which in this case would be 15minutes.
[Note that Assigned-to-Arrive cannot be subtracted from Received-to-Arrive to calculate a call handling time for two reasons: (1) it isnot necessarily the same units whose times are measured; and (2)call “assignment” means that a trooper has indicated that he orshe is taking the call. There can be lapses of time after a call isready to be assigned until a trooper takes the call.]
These data for the APAs combine the response times for allpriorities of calls. As previously indicated, the inclusion of thevery low priorities of calls (priorities 4 through 6) might tend togive a less useful picture of performance. Tables 2 and 3 show thebreakout of the Table 1 data for priorities 1, 2 and 3 for the twocategories of response time: Received-to-Arrive and Assigned-to-Arrive.

Washington State Patrol Performance Audit Page 5
Note that in all but one APA for each of the categories of responsetime, Priority 1 times are shorter than for Priority 2. For reasonspreviously indicated, there are several instances when Priority 3calls have shorter response times than higher priority calls.

Page 6 Appendix 6: Performance Outputs for Patrol
Received AssignedAPA Name to Arrival to Arrival
1 Gig Harbor 18 122 Tacoma Freeway 14 103 Tacoma East 19 134 Thurston County 19 135 Seattle North 16 106 Seattle South 17 117 Seattle East 17 118 Valley 28 139 North Bend 23 13
10 Enumclaw 27 2411 Yakima 21 1412 Sunnyside 22 1313 Kennewick 29 1714 Walla Walla 32 2515 Colville 38 2916 Ritzville 31 1818 North Spokane 22 1619 Spokane Valley 18 1220 Colfax 32 2021 Vancouver 16 1022 Goldendale 34 2323 Kelso 21 1324 Chehalis 21 1325 Wenatchee 32 2026 Ellensburg 38 1827 Okanogan 36 2428 Ephrata 37 2029 Moses Lake 34 1830 Bellingham 24 1431 Mount Vernon 22 1432 Oak Harbor 20 1633 Everett Central 18 1134 Everett East 23 1735 Port Angeles 27 1936 Bremerton 16 1137 Hoqiam 31 2138 Shelton 24 1739 Raymond 32 2240 Morton 29 18
Source: WSP CAD data for FY 97, Cadsum file.
TABLE 1RESPONSE TIMES IN MINUTES BY APA
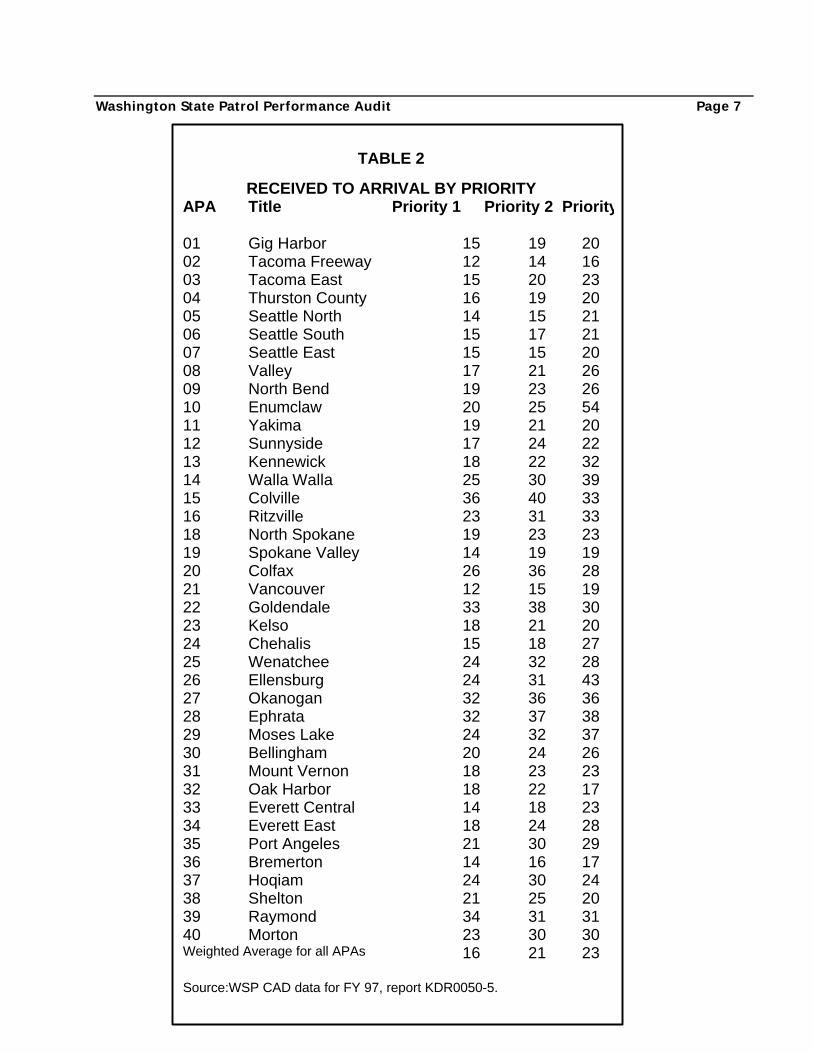
Washington State Patrol Performance Audit Page 7
TABLE 2
RECEIVED TO ARRIVAL BY PRIORITYAPA Title Priority 1 Priority 2 Priority 3
01 Gig Harbor 15 19 2002 Tacoma Freeway 12 14 1603 Tacoma East 15 20 2304 Thurston County 16 19 2005 Seattle North 14 15 2106 Seattle South 15 17 2107 Seattle East 15 15 2008 Valley 17 21 2609 North Bend 19 23 2610 Enumclaw 20 25 5411 Yakima 19 21 2012 Sunnyside 17 24 2213 Kennewick 18 22 3214 Walla Walla 25 30 3915 Colville 36 40 3316 Ritzville 23 31 3318 North Spokane 19 23 2319 Spokane Valley 14 19 1920 Colfax 26 36 2821 Vancouver 12 15 1922 Goldendale 33 38 3023 Kelso 18 21 2024 Chehalis 15 18 2725 Wenatchee 24 32 2826 Ellensburg 24 31 4327 Okanogan 32 36 3628 Ephrata 32 37 3829 Moses Lake 24 32 3730 Bellingham 20 24 2631 Mount Vernon 18 23 2332 Oak Harbor 18 22 1733 Everett Central 14 18 2334 Everett East 18 24 2835 Port Angeles 21 30 2936 Bremerton 14 16 1737 Hoqiam 24 30 2438 Shelton 21 25 2039 Raymond 34 31 3140 Morton 23 30 30Weighted Average for all APAs 16 21 23
Source:WSP CAD data for FY 97, report KDR0050-5.

Page 8 Appendix 6: Performance Outputs for Patrol
TABLE 3UNIT RESPONSE TIME BY PRIORITY
APA Title Priority 1 Priority 2 Priority 3
01 Gig Harbor 11 13 902 Tacoma Freeway 9 10 903 Tacoma East 12 14 1104 Thurston County 14 14 1105 Seattle North 10 10 1006 Seattle South 10 11 1207 Seattle East 11 11 1108 Valley 12 14 1609 North Bend 12 13 1510 Enumclaw 15 17 8811 Yakima 13 14 1312 Sunnyside 12 15 1313 Kennewick 14 16 2114 Walla Walla 22 22 3615 Colville 30 30 2216 Ritzville 15 18 1918 North Spokane 15 16 1419 Spokane Valley 11 13 1220 Colfax 19 21 1821 Vancouver 9 11 1022 Goldendale 22 25 2023 Kelso 14 13 1124 Chehalis 11 13 1425 Wenatchee 18 21 1726 Ellensburg 16 18 2027 Okanogan 23 25 2228 Ephrata 18 22 2029 Moses Lake 17 18 1830 Bellingham 13 16 1231 Mount Vernon 13 15 1232 Oak Harbor 16 17 1033 Everett Central 11 12 1134 Everett East 15 18 1635 Port Angeles 19 19 2136 Bremerton 11 12 1037 Hoqiam 19 22 1938 Shelton 15 19 1339 Raymond 23 23 2040 Morton 16 21 16Weighted Average for all APAs 12 14 13
Source:WSP CAD data for FY 97, report KDR0050-5

Summary of Most Common Purposes ofOvertime Worked by PersonsApproaching Retirement
Appendix 7
TYPE DEFINITION PERCENTAGE
Calls for Service Reactive activities related to providing assistance ondemand.
24.38%
GeneralManagement
Activities relating to management and administrativeactivities.
19.77%
Patrol Proactive activities relating to patrolling highways. 6.81%
Field Supervision Time spent supervising employees in the field. 6.73%
Self-InitiatedContacts
Proactive activities relating to policing the highway andassisting the public that are initiated by the officer.
6.03%
Case Investigation Activities relating to specific case investigations. 5.64%
Collisions Reactive activities relating to responding to andconducting investigations of traffic collisions.
4.25%
AdministrativeSupport
All activities related to administrative support. 3.78%
TrafficInvestigations
Traffic investigations and all related activities includingreports.
3.68%
Gathering andAnalyzingInformation
Gathering and analyzing intelligence information andrelated activities. (Criminal investigations only).
3.32%
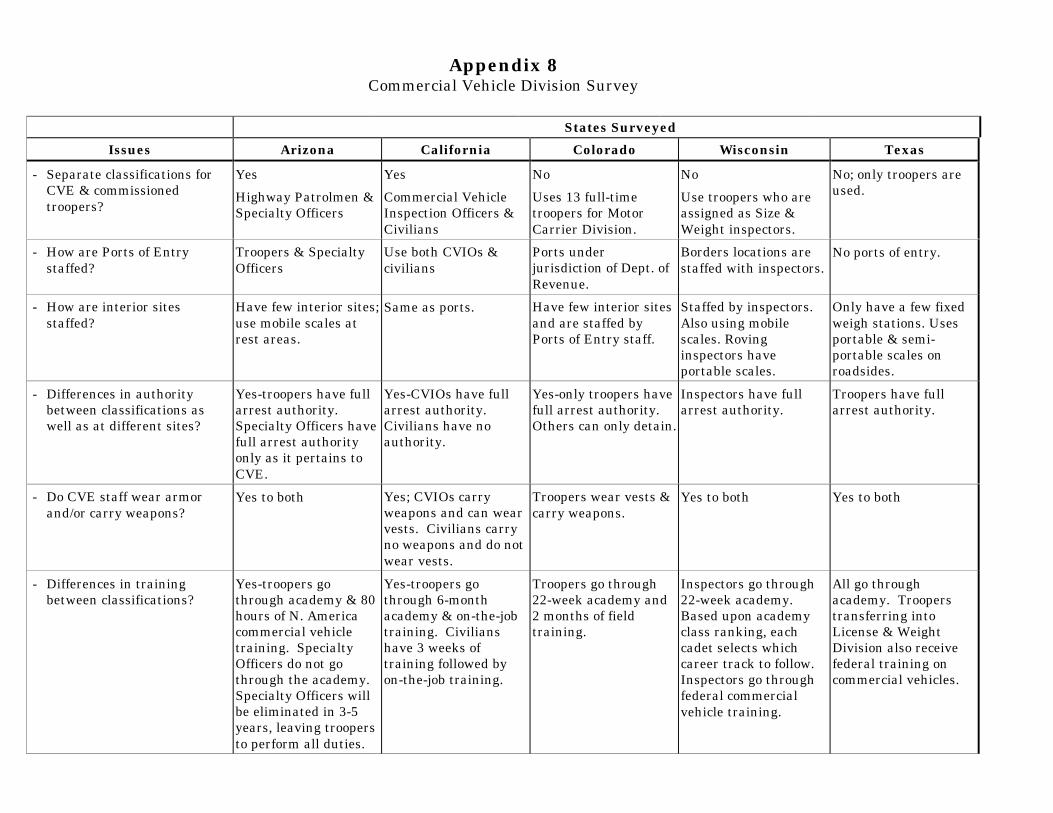
Appendix 8Commercial Vehicle Division Survey
States Surveyed
Issues Arizona California Colorado Wisconsin Texas
- Separate classifications forCVE & commissionedtroopers?
Yes
Highway Patrolmen &Specialty Officers
Yes
Commercial VehicleInspection Officers &Civilians
No
Uses 13 full-timetroopers for MotorCarrier Division.
No
Use troopers who areassigned as Size &Weight inspectors.
No; only troopers areused.
- How are Ports of Entrystaffed?
Troopers & SpecialtyOfficers
Use both CVIOs &civilians
Ports underjurisdiction of Dept. ofRevenue.
Borders locations arestaffed with inspectors.
No ports of entry.
- How are interior sitesstaffed?
Have few interior sites;use mobile scales atrest areas.
Same as ports. Have few interior sitesand are staffed byPorts of Entry staff.
Staffed by inspectors.Also using mobilescales. Rovinginspectors haveportable scales.
Only have a few fixedweigh stations. Usesportable & semi-portable scales onroadsides.
- Differences in authoritybetween classifications aswell as at different sites?
Yes-troopers have fullarrest authority.Specialty Officers havefull arrest authorityonly as it pertains toCVE.
Yes-CVIOs have fullarrest authority.Civilians have noauthority.
Yes-only troopers havefull arrest authority.Others can only detain.
Inspectors have fullarrest authority.
Troopers have fullarrest authority.
- Do CVE staff wear armorand/or carry weapons?
Yes to both Yes; CVIOs carryweapons and can wearvests. Civilians carryno weapons and do notwear vests.
Troopers wear vests &carry weapons.
Yes to both Yes to both
- Differences in trainingbetween classifications?
Yes-troopers gothrough academy & 80hours of N. Americacommercial vehicletraining. SpecialtyOfficers do not gothrough the academy.Specialty Officers willbe eliminated in 3-5years, leaving troopersto perform all duties.
Yes-troopers gothrough 6-monthacademy & on-the-jobtraining. Civilianshave 3 weeks oftraining followed byon-the-job training.
Troopers go through22-week academy and2 months of fieldtraining.
Inspectors go through22-week academy.Based upon academyclass ranking, eachcadet selects whichcareer track to follow.Inspectors go throughfederal commercialvehicle training.
All go throughacademy. Trooperstransferring intoLicense & WeightDivision also receivefederal training oncommercial vehicles.
WASHINGTON STATE PATROL"WATCH"
Appendix 9
To link to this appendix, click here.

WASHINGTON STATE PATROL TOWERSURVEY RESULTS - June 1997
Appendix 10
To link to this appendix, click here.
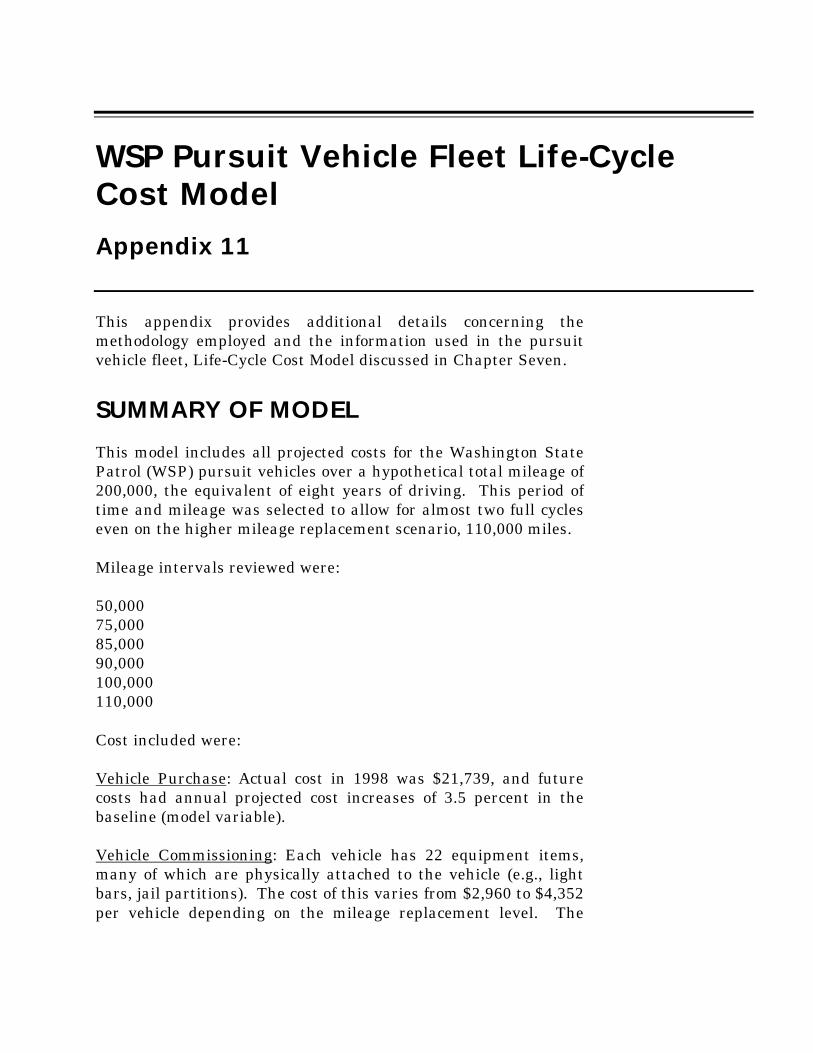
WSP Pursuit Vehicle Fleet Life-CycleCost Model
Appendix 11
This appendix provides additional details concerning themethodology employed and the information used in the pursuitvehicle fleet, Life-Cycle Cost Model discussed in Chapter Seven.
SUMMARY OF MODEL
This model includes all projected costs for the Washington StatePatrol (WSP) pursuit vehicles over a hypothetical total mileage of200,000, the equivalent of eight years of driving. This period oftime and mileage was selected to allow for almost two full cycleseven on the higher mileage replacement scenario, 110,000 miles.
Mileage intervals reviewed were:
50,00075,00085,00090,000100,000110,000
Cost included were:
Vehicle Purchase: Actual cost in 1998 was $21,739, and futurecosts had annual projected cost increases of 3.5 percent in thebaseline (model variable).
Vehicle Commissioning: Each vehicle has 22 equipment items,many of which are physically attached to the vehicle (e.g., lightbars, jail partitions). The cost of this varies from $2,960 to $4,352per vehicle depending on the mileage replacement level. The

Page 2 Appendix 11: WSP Pursuit Vehicle Fleet Life-Cycle Cost Model
model allows the user to extend the useful life of items as asensitivity test.
Vehicle Decommissioning: Each vehicle prior to sale must bestripped of patrol-specific equipment, which requires certaincosmetic repairs to allow for sale. This cost totals $950,including a $350 per vehicle sales charge.
Vehicle Salvage Value: Working with the Fleet Management, wedeveloped two alternative salvage schedules that are a function ofmileage. WSP has some historical experience with highermileage vehicles (100,000 miles plus) but they used wholesalevalues for lower mileage. The two alternatives were developed toallow for a sensitivity analysis relative to the replacement timing.The two schedules that will be further refined by WSP as themodel gets extended use:
Original NewMileage % of Purchase % of Purchase
50,000 47.7% 56.0%
75,000 35.9% 44.8%
85,000 30.9% 42.2%
90,000 28.3% 40.4%
100,000 23.2% 35.8%
110,000 18.5% 33.1%
Repair, Maintenance, and Gas and Oil. WSP has extensive repairand maintenance records as well as gas and oil consumption. Gasand oil cost per mile is currently about $.07 and does not show apattern of variation with respect to vehicle mileage. We revieweda large aggregate sample and a smaller but detailed sample ofhistorical repair and maintenance records. From these twosamples plus a previous review in 1997, we developed threealternative patterns of cost increases with respect to increasing

Washington State Patrol Performance Audit Page 3
vehicle mileage. The model was built to accept each data set asan alternative that could be tested in the sensitivity analysis.These costs in 10,000-mile increments are detailed below. Themodel allows for the selection of the data set to be used, andallows the user to adjust the historical data to reflect pastinflation with respect to the age of the vehicle (e.g., mileageexpenditures at the 100,000 miles + are as much as four yearslater, with commensurate inflation).
Timing of Expenditures. Expenditures and values are inflated tothe relevant time frames and discounted at the estimated cost ofcapital to allow for calculation of a present value for eachalternative. The baseline values used in the model (all variables)are:
Creation of Current-Dollar Equivalents. For the purpose oftranslating the present value costs of each alternative to acurrent-dollar annual equivalent and the resulting cost per mile
L e s s t h a n J u l - 9 7 A g g r e g a t e D e t a i l S a m p l e
1 0 , 0 0 0 $ 1 5 3 $ 5 0 5 $ 3 0 0
2 0 , 0 0 0 $ 5 6 0 $ 6 0 8 $ 3 6 6
3 0 , 0 0 0 $ 3 0 0 $ 9 6 8 $ 4 5 8
4 0 , 0 0 0 $ 3 1 7 $ 1 , 2 8 0 $ 6 7 3
5 0 , 0 0 0 $ 8 4 5 $ 1 , 5 9 7 $ 7 6 3
6 0 , 0 0 0 $ 2 3 1 $ 1 , 5 5 8 $ 9 7 4
7 0 , 0 0 0 $ 1 , 1 6 0 $ 1 , 5 7 4 $ 1 , 0 1 2
8 0 , 0 0 0 $ 5 6 6 $ 1 , 5 6 1 $ 1 , 1 4 1
9 0 , 0 0 0 $ 5 2 6 $ 1 , 4 8 7 $ 1 , 1 0 6
1 0 0 , 0 0 0 $ 1 , 4 9 3 $ 1 , 7 0 0 $ 9 1 4
1 1 0 , 0 0 0 $ 1 4 6 $ 1 , 6 8 3 $ 7 6 6
Interest Rate (discount rate) 6.00%Inflation on basic labor 3.000%Inflation in M,O, and repair 3.000%Historical inflation on data 2.500%Inflation in Replacement Costs 3.500%General COLA 3.000%

Page 4 Appendix 11: WSP Pursuit Vehicle Fleet Life-Cycle Cost Model
(25,000 miles per year assumption), a gradient table was createdusing the above assumptions for discount rate and generalinflation.

SUMMARY OF COLLOCATION PROJECTSREVIEWED
Appendix 12
THE PARKLAND TRANSPORTATIONCENTER
Constructed in 1995, this 50,000-square-foot facility houses fourseparate state functions within three state agencies: theWashington State Patrol (WSP) area district headquarters,vehicle inspections, and the regional crime laboratory; theDepartment of Licensing (DOL) regional service center; and theDepartment of Transportation (DOT) Emergency Response Unitand Traffic Management Center.
Available Services:
• Drivers and vehicle licenses (DOL)
• DOT permits (DOL)
• Vehicle identification number inspections (WSP)
• Accident reports (WSP)
• Emergency response (DOT)
• General information
• Full-service forensic laboratory
• Traffic Management Center (DOT)
Prior to the construction of this facility, the above services wereavailable at six separate geographic locations.

Page 2 Appendix 12: Summary Of Collocation Projects Reviewed
Benefits/Cost Savings:
• Economy of combined construction
• Shared common areas (lobby, lunch areas, restrooms, etc.)
• Customer convenience (one-stop shopping)
• Reduced operating expenses
• Employee and site security
• Available by public transportation
• Reduced individual maintenance costs (one facility as opposedto six)
• Centralized maintenance (one agency maintenance staffmaintains the entire facility as opposed to three)
VANCOUVER DOL/WSP SERVICECENTER
This project was initiated by legislative direction in 1995 tocollocate the services of drivers and vehicle licenses (DOL),vehicle inspection (WSP), and vehicle emissions testing(Department of Ecology). Prior to the initiation of this project,those individual services were available in four differentgeographic locations.
Available Services:
• Vehicle emissions testing (DOE)
• Drivers licenses (DOL)
• Vehicle inspections (WSP)
• Accident reports
• General information

Washington State Patrol Performance Audit Page 3
Benefit/Cost Savings:
• Economy of combined construction
• Customer convenience (one-stop shopping)
• Reduced individual operating expenses (phone and computersystems, facility maintenance, etc.)
• Employee and site security
• Available by public transportation
• State ownership as opposed to lease
BELLINGHAM REGIONAL MAINTENANCECENTER (DOT) AND DETACHMENT(WSP)
Constructed and occupied in mid-1997, this facility combines theregional functions of two transportation agencies. It combines theneeds of two facilities into one location, eliminating the need forduplication of public areas, communications towers, telephonesystems, auxiliary power, and refueling facilities.
Available Services:
• DOT over legal permits
• Accident reports (WSP)
• Vehicle identification number inspections (WSP)
• General information
• Dual agency vehicle refueling
Benefits/Cost Savings:
• Employee and site security
• Combined agency facility maintenance program (administeredby one agency)
• Economy of combined construction

Page 4 Appendix 12: Summary Of Collocation Projects Reviewed
• Shared common areas (restrooms, lobby, refueling,communications tower, auxiliary power, etc.)
• Reduced operating expenses (one facility as opposed to one)
SILVER LAKE DETACHMENT
Constructed in 1996, on land provided by The Department ofTransportation at the Silver Lake rest area south of Everett onInterstate 5, the facility is a 1,100-square-foot modular buildingproviding all necessary elements for two complete State Patrolline-enforcement detachments.
Available Services:
• Provide rest area security for the motoring public
• Accident reports
• General traveler information
Benefits/Cost Savings:
• No land acquisition required
• Minimal construction costs
• Places troopers in their direct area of assignment withouttravel
• Provides security for DOT rest area maintenance personnel
• Eliminates/reduces controlled substance sales/use at the site
• Eliminates/reduces unacceptable social behavior
UNION GAP COMBINEDTRANSPORTATION CENTER:
This project places all available transportation services at one siteto include WSP, DOT, and DOL. The project was made possibleby the transfer of ownership of approximately five acres fromDOT to DOL for the construction of a Regional Service Center.This construction was combined with the State Patrol’s
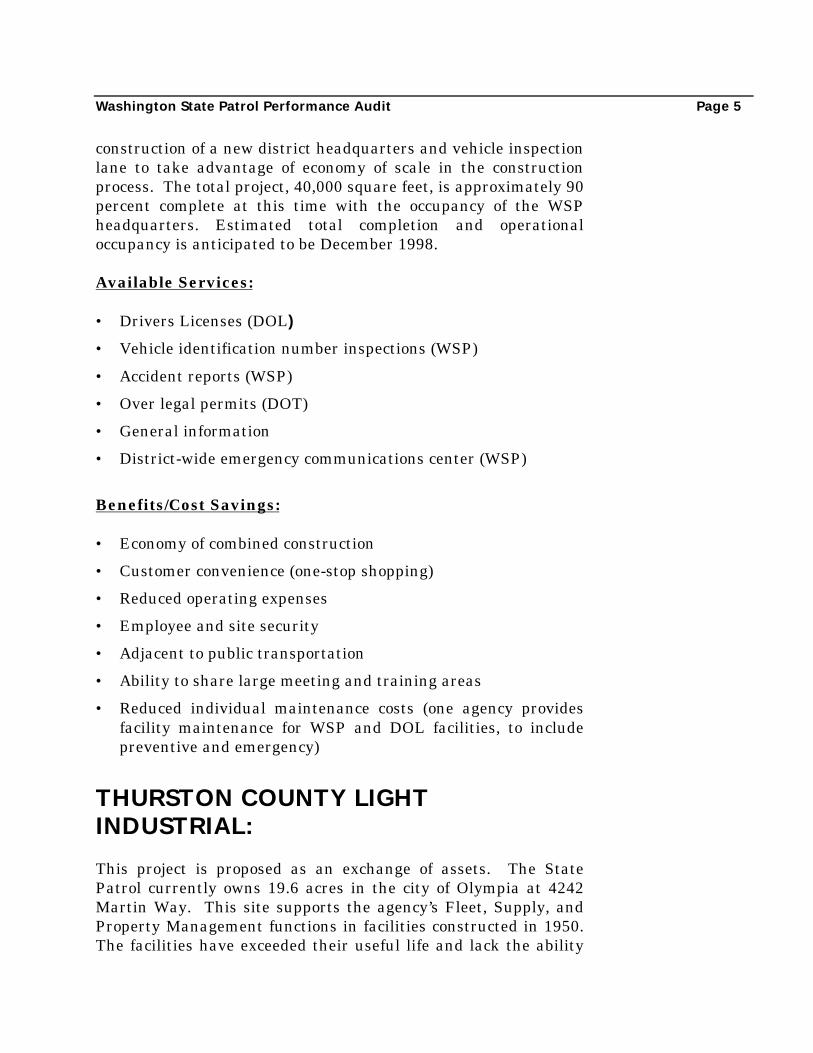
Washington State Patrol Performance Audit Page 5
construction of a new district headquarters and vehicle inspectionlane to take advantage of economy of scale in the constructionprocess. The total project, 40,000 square feet, is approximately 90percent complete at this time with the occupancy of the WSPheadquarters. Estimated total completion and operationaloccupancy is anticipated to be December 1998.
Available Services:
• Drivers Licenses (DOL)
• Vehicle identification number inspections (WSP)
• Accident reports (WSP)
• Over legal permits (DOT)
• General information
• District-wide emergency communications center (WSP)
Benefits/Cost Savings:
• Economy of combined construction
• Customer convenience (one-stop shopping)
• Reduced operating expenses
• Employee and site security
• Adjacent to public transportation
• Ability to share large meeting and training areas
• Reduced individual maintenance costs (one agency providesfacility maintenance for WSP and DOL facilities, to includepreventive and emergency)
THURSTON COUNTY LIGHTINDUSTRIAL:
This project is proposed as an exchange of assets. The StatePatrol currently owns 19.6 acres in the city of Olympia at 4242Martin Way. This site supports the agency’s Fleet, Supply, andProperty Management functions in facilities constructed in 1950.The facilities have exceeded their useful life and lack the ability

Page 6 Appendix 12: Summary Of Collocation Projects Reviewed
to be renovated or expanded to meet agency programs, current orfuture. A recent property appraisal placed the value at $4.9million dollars. Current buildings have a negative value of$200,000.
With legislative authorization, the property was offered to thedevelopment community as a direct exchange for a 20-acre parceland three replacement buildings of a specific design with a totalverified value of $10.1 million. The completed project will providenew facilities and adequate property for agency programs for thenext 50 years at no cost to the taxpayer. Additionally, theproposal includes an option for an adjacent 25 acres for the DOTlight industrial functions to collocate at a later date.
Since developing the collocated light-industrial concept, theDepartment of General Administration and the Department ofNatural Resources have developed capital requests to collocate onadjacent sites to benefit from combined facilities and services.
Currently, the project is in the final stages of contract review bythe Attorney General’s Office.
Available Services:
• Multi-agency vehicle service and equipping
• Multi-agency vehicle refueling
• Multi-agency communications equipment installation andmaintenance
• Light construction for facilities maintenance
• Warehousing and delivery of agency supplies (WSP andDepartment of Fish and Wildlife)
• Agency surplus vehicle auctions (150-250 per year)
Benefits/Cost Savings:
• Ability to consolidate multi-agency functions, i.e., vehiclerefueling, equipping and surplus, repairs, etc.

Washington State Patrol Performance Audit Page 7
• Agency (WSP) ability to move the Electronic Services Divisionto Olympia to avoid equipping patrol vehicles in two differentlocations, as is now done
• Reduced operating costs (ability to consolidate currentdecentralized services)
• Reduced facility costs (old vs. new buildings)
• Avoid/eliminate the $9 million request currently in the capitalbudget for light industrial