washington state patrol trooper recruitment and retention...
TRANSCRIPT
Washington State Patrol Trooper
Recruitment and Retention Study
FINAL REPORT (January 7, 2016)
Prepared for
Washington State Joint Transportation
Committee
Prepared by
Corporate Office San Francisco Office Seattle Office
Two Logan Square 50 California Street 1200 Fifth Avenue
Suite 1600 Suite 2300 Suite 1220
Philadelphia, PA 19103 San Francisco, CA 94111 Seattle, WA 98101
Phone 215-567-6100 Phone 415-982-5544 Phone 206-264-8900
Fax 215-567-4180 Fax 415-982-4513 Fax 206-264-9699
www.pfm.com

The PFM Group
Russ Branson
50 California Street
Suite 2300
San Francisco, CA 94111
(415) 982-5544
Rick Braziel
2055 Fort John Court
Gold River, CA 95670
(916) 996-0614
Karen Coffee
(916) 744-1231
Joint Transportation Committee P.O. Box 40937
Olympia, WA 98504-0937 Alyson Cummings
(360) 786-7398 [email protected]
Mary Fleckenstein (360) 786-7312
Table of Contents
1
List of Tables and Figures ............................................................................... 3
Executive Summary ......................................................................................... 7
Report Recommendations ................................................................................................ 17
Organization of Report and Study Methodology .......................................... 27
Chapter 1: Field Force Evaluation and Vacancy Projection ......................... 31
Introduction ....................................................................................................................... 31
Workforce Composition ..................................................................................................... 31
Vacancy Analysis and Projections .................................................................................... 34
Projected FOB Trooper Levels ......................................................................................... 39
Conclusion ........................................................................................................................ 45
Chapter 2: Trooper Compensation ................................................................ 46
Cash Compensation.......................................................................................................... 46
Non-Cash Benefits ............................................................................................................ 53
Comparison to Local Law Enforcement Agencies ............................................................ 56
Comparison to Other State Law Enforcement Agencies .................................................. 64
Conclusion ........................................................................................................................ 69
Chapter 3: Issues Affecting Retention of State Troopers .............................. 70
Introduction ....................................................................................................................... 70
Retention Experience and Expectations ........................................................................... 70
Drivers of Attrition .............................................................................................................. 80
Employee Satisfaction ...................................................................................................... 83
Compensation ................................................................................................................... 90
Retirement and Pension Issues ...................................................................................... 100
Impact of the Collective Bargaining Agreement .............................................................. 106
Conclusion ...................................................................................................................... 106
2
Chapter 4: Issues Affecting Recruitment of State Troopers ....................... 108
Introduction ..................................................................................................................... 108
Recruitment Overview ..................................................................................................... 108
Understanding Potential Applicants ................................................................................ 111
Outreach and Marketing ................................................................................................. 121
Selection Process ........................................................................................................... 128
Training Process ............................................................................................................. 138
Conclusion ...................................................................................................................... 145
Report Conclusion ........................................................................................ 147
Appendices ................................................................................................... 148
A: Complete Listing of Findings and Recommendations ................................................ 148
B: Detailed FOB Trooper Vacancy Projection ............................................................... 170
C: 30-Year Career Progression, Washington State Trooper .......................................... 171
D: Field Force Troopers and Sergeants by Year of Service ........................................... 172
E: Receiving Agencies of WSP Troopers Who Resigned for Other Law Enforcement . 173
F: Annual Leave for Washington Local Law Enforcement Agencies ............................. 174
G: Annual Leave for Washington State Law Enforcement Agencies ............................ 176
H: Washington Local Law Enforcement Agencies Employee Percent of Premium ....... 178
I: State Law Enforcement Agencies Employee Percent of Premium ............................. 180
J: Washington State Patrol Passage Rates, 25th-29th Arming Classes (2012-2015) ..... 182
K: Recruitment and Marketing Checklist ........................................................................ 183

List of Tables and Figures 3
List of Tables and Figures
Tables
Table 1: Local Law Enforcement Benchmark Agencies ............................................................. 28
Table 2: State Law Enforcement Benchmark Agencies ............................................................. 29
Table 3: Survey Response Rates .............................................................................................. 30
Table 4: Washington State Patrol Employees ........................................................................... 32
Table 5: Field Force Trooper Attrition by Tenure and Reason (1/1/2010-10/31/2015) ............... 35
Table 6: Criminal Justice Training Commission (CJTC) Graduates, 2010-2015 ........................ 36
Table 7: New Retirement-Eligible Commissioned Officers ........................................................ 42
Table 8: Washington State Patrol Trooper Salary by Year of Service, Effective July 1, 2015 –
June 30, 2016 ........................................................................................................................... 47
Table 9: Washington State Patrol Trooper Total Direct Cash Compensation, Effective July 1,
2015 – June 30, 2016 ............................................................................................................... 48
Table 10: Washington State Patrol Specialty Pays FOB Troopers ............................................ 49
Table 11: Washington State Patrol Additional Specialty and Certification Pays, FOB Troopers 50
Table 12: Washington State Patrol Geographic Assignment Pay, FOB Troopers ...................... 50
Table 13: Total Direct Cash Compensation with Educational Incentive and Specialty Pays,
7/1/2015 – 6/30/2016 ................................................................................................................ 51
Table 14: WSP Troopers Cash Compensation, Fiscal Year 2015 ............................................. 52
Table 15: Washington State Patrol Leave Allowances .............................................................. 53
Table 16: Washington State Patrol Employee Contribution to Health Care Coverage .............. 53
Table 17: Washington State Patrol Retirement System Benefits ............................................... 54
Table 18: Total Employer Cost of Compensation and Benefits for WSP Troopers, Actual Fiscal
Year 2015 Earnings .................................................................................................................. 55
Table 19: Washington Local Law Enforcement Agencies Total Direct Cash Compensation,
Effective June 30, 2016 ............................................................................................................. 56
Table 20: Total Direct Cash Compensation with 10% King County Geographic Pay, Effective
July 1, 2015 – June 30, 2016 .................................................................................................... 57
Table 21: Washington Local Law Enforcement Agencies Specialty Pays .................................. 59
Table 22: Washington State Patrol and Washington Local Law Enforcement Pension Benefits 60
Table 23: Washington Law Enforcement Agencies Employee Percent of Premium for Health
Insurance (New Hires), Effective 12/31/2015 ............................................................................ 61
Table 24: Washington Local Law Enforcement Agencies Vacation and Personal Leave Hours 62

4 List of Tables and Figures
Table 25: Washington Local Law Enforcement Agencies Take-Home Vehicles ........................ 63
Table 26: State Law Enforcement Agencies Base Salary + Longevity (effective 6/30/2016) ..... 64
Table 27: State Law Enforcement Agencies Specialty Pays ...................................................... 65
Table 28: State Law Enforcement Agencies Pension Benefits (Tier Available for Current Hires)
................................................................................................................................................. 66
Table 29: Employee Contribution Requirements as a Percent of Premium (New Hires), Effective
12/31/2015 ................................................................................................................................ 67
Table 30: Benchmark State Law Enforcement Agencies Take-Home Vehicles ........................ 68
Table 31: Washington State Patrol Field Force Trooper Attrition, 2010-10/31/2015 .................. 72
Table 32: Movement of Resigned Troopers Between WSP Districts with Compensation
Variance ................................................................................................................................... 77
Table 33: Employee Dissatisfaction Among Current and Separated Troopers .......................... 82
Table 34: “What were your primary reasons for leaving the Washington State Patrol?” ............ 84
Table 35: WSP Field Force Shift Rotation Schedule ................................................................ 86
Table 36: Washington Law Enforcement Shift Schedules and Determination .......................... 87
Table 37: Supervisory Rank Headcount (as of 10/31/2015) ...................................................... 92
Table 38: Field Force Trooper Specialty Assignments at Separation by Tenure, 2010-
10/31/2015 ................................................................................................................................ 94
Table 39: Trooper Compensation by Type and Bureau (2015 Actuals) ..................................... 95
Table 40: Specialty and Certification Pays by Type and Bureau (2015 Actuals) ........................ 99
Table 41: State of Ohio DROP Benefits .................................................................................. 105
Table 42: “How did you become interested in law enforcement?” (All Surveys)....................... 112
Table 43: “How did you learn about/become interested in the WSP?” (WSP Cadets and
Troopers) ................................................................................................................................ 113
Table 44: WSP Trooper and Cadet Survey Responses, “Reason I Chose the Washington State
Patrol” (WSP Cadets and Troopers) ........................................................................................ 114
Table 45: State Law Enforcement Agency Process for Determining Geographic Assignments
............................................................................................................................................... 116
Table 46: Academy Entry Level vs. Post-Academy Pay .......................................................... 117
Table 47: Recruitment Periods, 25th – 29th Arming Classes ................................................... 121
Table 48: Source of Interest in Washington State Patrol, 28th Arming Class .......................... 123
Table 49: Recruitment Results for 25th – 29th Arming Classes ............................................... 123
Table 50: Washington State vs. WSP Cadet Demographic Characteristics ............................. 124
Table 51: WSP Cadet vs. State Law Enforcement Demographic Characteristics .................... 125
Table 52: State Law Enforcement Agency Wait Times ............................................................ 129

List of Tables and Figures 5
Table 53: Comparative Selection Process Pass Rates Among State Law Enforcement Agencies
(Average Passage Rates 2010-2015) ..................................................................................... 132
Table 54: Comparative Selection Process Passage Rates for Local Law
Enforcement Agencies ............................................................................................................ 134
Table 55: State Law Enforcement Agency Academy Features ................................................ 140
Table 56: Graduation Rates for 70th through 104th Trooper Basic Academies (1990-2015) ... 140
Table 57: Comparative Academy Graduation Rates for State Law Enforcement Agencies
(Average 2010 through 2015) ................................................................................................. 141
Table 58: Average and Marginal Cost of Training ................................................................... 142
Figures
Figure 1: Projected Field Force Levels ........................................................................................ 9
Figure 2: Internal and External Factors Affecting Recruitment and Retention ............................ 10
Figure 3: Survey Results: “As a Trooper, I feel as though…”..................................................... 11
Figure 4: Washington Local Law Enforcement Agencies Total Direct Cash Compensation ....... 13
Figure 5: Current Troopers: “I encourage people to consider WSP as a career” ....................... 15
Figure 6: Field Force by Seniority ............................................................................................. 33
Figure 7: Vacancies by Year 2010 through November, 2015 .................................................... 34
Figure 8: Field Force Trooper Attrition by Tenure and Reason (1/1/2010-10/31/2015) .............. 35
Figure 9: Survey Results Local Law Enforcement Hiring ........................................................... 37
Figure 10: WSP Trooper Resignations (1999-October 31, 2015) .............................................. 38
Figure 11: Projected Field Force Levels Potential Scenarios (Based on Retirements &
Resignation Alternatives) .......................................................................................................... 39
Figure 11A: Projected Field Force Levels (Higher Academy Graduation Rates) ........................ 40
Figure 12: Projected Retirement of Current WSP Commissioned Personnel 2015-2025 ........... 41
Figure 13: Projected LEOFF Plan 2 Police Officer Retirements ................................................ 43
Figure 14: Expected Future Hiring from 37 Local Law Enforcement Agencies .......................... 43
Figure 15: Washington Local Law Enforcement Agencies Total Direct Cash Compensation ..... 57
Figure 16: Comparative Quit Rates Among State Patrol Agencies ............................................ 73
Figure 17: WSP Field Force Troopers Separations by Year of Service Under 5 YOS ............... 74
Figure 18: Field Force Trooper District Assignments at Time of Resignation (2010-2015) ........ 75
Figure 19: New Law Enforcement Agency Location for Resigned Field Force Troopers (2010-
2015) ........................................................................................................................................ 75

6 List of Tables and Figures
Figure 20: WSP Pay v. Comparable Agencies (Districts Where Resigning
Troopers are Going) .................................................................................................................. 78
Figure 21: Survey Results, 107 Current Troopers Plan to Leave for Other Law Enforcement
Agencies ................................................................................................................................... 79
Figure 22: Troopers Who Plan to Leave WSP by Age ............................................................... 80
Figure 23: Current Troopers’ Satisfaction with WSP Pay and Benefits ...................................... 91
Figure 24: Current Troopers’ Satisfaction with the Ability to Promote ........................................ 91
Figure 25: Current Trooper Satisfaction with the ability to Engage in Specialty Assignments .... 94
Figure 26: Phases of the Recruitment Process ....................................................................... 110
Figure 27: CJTC Cadet Survey Responses, “Reason I Chose Current Agency” ...................... 115
Figure 28: Median Days to Complete Cadet Selection Process .............................................. 129
Figure 29: Current WSP Selection Process Map (As of August 1, 2015) ................................. 131
Figure 30: Pre-August 2015 WSP Selection Process Map with 29th Arming Passage Rates .. 133
Figure 31: Comparative Psychological Exam Passage Rates ................................................. 137
Figure 32: Trooper Basic Academy Graduates........................................................................ 141
Executive Summary 7
Executive Summary
The Washington State Patrol (WSP) is at a crossroads. In a changing cultural environment, the
agency faces challenges involving both employee satisfaction and compensation
competitiveness, all while attempting to be an employer of choice for those seeking law
enforcement careers in Washington State. The WSP needs to take proactive steps in each of
these areas in order to continue to meet its mission of maintaining safety on the State’s highways
and ferries.
The alternatives and recommendations detailed throughout this report address these concerns
on an issue-by-issue basis, but the key requirement for the WSP and the Legislature is to take
action in a comprehensive manner. Investing in greater compensation without also addressing
employee satisfaction is unlikely to resolve the WSP’s current retention and recruitment issues.
At the same time, compensation issues are real and must also be addressed.
Recruitment and retention can both be improved through a comprehensive approach to address
the agency’s full range of opportunities. In turn, such actions can build on a proud set of
organizational traditions and capacities to ensure a strong Washington State Patrol for many
years to come.
Report Overview
In the years since the “Great Recession” ended1, the Washington State Patrol (WSP) has seen
an increased level of turnover among Troopers with less than ten years of service. In conjunction
with normal service retirements, this trend has contributed to rising vacancy rates. Further, over
the next decade, a growing number of commissioned personnel at all ranks will reach retirement
eligibility and this is projected to place additional strain on staffing for the Field Force workforce –
those 690 Troopers and Sergeants responsible for field operations on the State’s highways and
ferries.2
At the same time, recent WSP recruitment efforts have not yielded increased numbers of Cadets
to fully replace these current and projected vacancies and, in fact, the number of graduates of the
last several Academy classes has been below historical norms. Across the State of Washington,
competition for qualified law enforcement personnel has heightened, as local agencies have
ramped up hiring due to the end of recession-era freezes and cost containment. Often these local
agencies offer higher salaries and geographical certainty, compared to the WSP which places
Troopers statewide (based on location preference by seniority). Local agencies also actively
recruit for both newcomers to policing and more experienced, lateral hires from other law
1 The “Great Recession” refers to the US recession that lasted from December 2007 through June 2009. The recovery from this recession lasted several years beyond that, and is still impacting some government organizations. 2 Field operations work includes such things as patrolling the highways to enforce speed limits and other traffic laws, removing impaired drivers from the roadways, inspecting ferries and other vessels, and ensuring the general safety on all highways in the state.

8 Executive Summary
enforcement agencies. In contrast, the WSP does not accept lateral hires, further elevating the
importance of entry-level Trooper recruitment.
In this context, the Washington State Legislature requested an analysis of the recruitment and
retention practices and experience of the WSP to identify potential barriers to recruitment and
drivers of attrition, with the end goal of attracting and retaining the highest quality Trooper
workforce.
This Report encompasses the findings and recommendations resulting from approximately five
months of study, which includes extensive surveys of current and former Washington State
Troopers at varying career stages, benchmarking to other State Police agencies nationally and
local police departments across Washington, analysis of recruitment and retention data and other
documents, process mapping and evaluation, multiple field visits, and scores of interviews.
In addition, while this final Report solely reflects the independent conclusions of the PFM project
team, our evaluation benefited greatly from the review and feedback throughout our study period
of a working group that included experienced representatives of the Joint Transportation
Committee staff, House and Senate Transportation Committee and caucus staff, Governor’s
Office of Financial Management, Washington State Patrol, and the Washington State Patrol
Troopers Association. We appreciate their insights, and hope that this study helps to inform and
advance the important work ahead to strengthen the Washington State Patrol.
Projected Trooper Levels
Without corrective action, the current trends facing the Washington State Patrol give rise to
significant concern regarding future staffing levels:
Voluntary resignations among Field Force Troopers prior to retirement eligibility increased
from just 9 in 2010 to 17 in 2014 and 35 in 2015 (through the end of October alone).
Field Force Trooper retirements more than doubled from 8 in 2010 to 18 in 2015. In total,
49 commissioned personnel have retired in 2015 (through the end of October).
Looking forward, nearly 40 percent of commissioned staff are eligible to retire within the
next ten years
Academy classes are filling at lower than normal historical levels, with the most recent five
classes averaging 32 graduates, while the average for the prior 35 classes was 37
graduates. The latest class graduated just 25.

Executive Summary 9
As shown in Figure 1 below, these and other factors combine to produce three potential scenarios
showing future declines in overall Field Office Bureau (FOB) Trooper levels if change does not
occur. In the three scenarios shown below, the primary variable is the level of Trooper
resignations, assuming average Trooper Basic Academy graduating rates and the separation of
retirement-eligible commissioned staff.
Currently the WSP Field Force is authorized for 690 positions, of which 580 are filled. Figure 1
shows that under any of the three scenarios, within the next ten years, WSP will suffer an
unsustainable drop in the level of Field Force staffing, threatening their ability to complete their
mission.
The red line illustrates what will happen if the average resignation rate between 1999 and 2013
continues into the future. It shows that staffing drops from 580 to 460.
The green line illustrates what will happen if the resignation rate for the past 10 years continues
into the future. It shows that staffing drops from 580 to 450.
The purple line illustrates what will happen if this year’s extremely high resignation rates continue
into the future. It shows that staffing drops from 580 to 250.
200
250
300
350
400
450
500
550
600
650
700
Figure 1: Projected Field Force Levels Potential Scenarios(Based on Retirements & Resignation Alternatives)
Field Force Positions as of 10/31/2015 = 580
FOB Resignations 2006-2015 FOB Resignations 2015
Average Resignations 1999-2013

10 Executive Summary
Findings and Recommendations
For any organization, recruitment and retention experience are driven by a mix of internal and
external factors as outlined in Figure 2 below. Such organizational dynamics are complex, and
in the case of the WSP, that complexity is amplified by having a workforce that is dispersed across
the state, strong traditions that are often not aligned with a younger workforce, a changing
economic climate, and a demand by all workers for an increased work-life balance.
Figure 2: Internal and External Factors Affecting Recruitment and Retention
Recommendations in this report to address recruitment and retention issues should be viewed as
a whole. No single recommendation has been identified that, if made in isolation, will fully resolve
the WSP’s retention and recruitment issues. The key will be for the Legislature and the WSP to
take a comprehensive approach to addressing these issues.
Two major themes emerged from the analysis performed in this report in regards to Trooper
retention: the importance of strengthening both employee satisfaction and compensation
competitiveness. In addition, a number of important but secondary opportunities also emerged
from this study including elements of the recruitment process and impacts of the WSP culture on
recruitment efforts.

Executive Summary 11
Employee Satisfaction. Surveys and interviews conducted for this study identified significant
strain between WSP management and many Troopers and Sergeants in the field. This strain has
the effect of spurring some Troopers to look for work outside of the WSP and others to retire as
soon as eligible. For many who stay, there is a feeling of dissatisfaction and low morale that
impacts the overall operations of the organization. While part of this dissatisfaction is related to
compensation, as discussed below, much of the dissatisfaction is related to working conditions
and workload, along with communications across the organization.
A key indicator of this dissatisfaction is shown in responses to specific survey questions regarding
employee perspectives, as shown in Figure 3 below. Overall, high percentages of current
Troopers and Sergeants do not feel listened to or valued by the agency.
Dissatisfaction in an organization is often a driving force behind attrition issues, and part of the
survey design was aimed at measuring satisfaction levels in the WSP. Based on survey
responses and interviews from both current Troopers and Sergeants and separated Troopers,
high levels of employee dissatisfaction exist in the WSP Trooper workforce.
In the survey of current Troopers, 88 of 482 respondents indicated they plan to leave the WSP
for another law enforcement agency in the next two years, with another 24 indicating they plan to
leave in more than two years. If this ratio of respondents holds for the entire Trooper and Sergeant
workforce, WSP could be facing the loss of 225 more Troopers in the near future. WSP
management needs to act now to stop this unsustainable level of Trooper resignations.
Many of this Report’s recommendations addressing employee satisfaction are generally within
the ability of the Legislature and the WSP to implement in the near future with limited cost. Key
opportunities include the following:
9.9% 17.3% 21.8%
77.5%
32.6%37.0%
54.9%
20.5%
57.5%45.7%
23.3%
2.1%
0.0%
20.0%
40.0%
60.0%
80.0%
100.0%
120.0%
When I have anopinion it is taken into
account by myagency
I am valued by myagency
I am getting the righttools
I am respected by mycoworkers
Figure 3: "As a Trooper, I feel as though..."
True Somewhat True Not True

12 Executive Summary
Commission an organizational assessment to identify where communication between
management and staff has broken down, and make specific recommendations to improve
management engagement with line staff.
Conduct in-depth performance evaluations of all managers with the rank of Lieutenant and
above, including 360 degree reviews3 , in order to provide better feedback to managers
with a goal of improving leadership performance.
Change the metrics used to evaluate Trooper performance, to reflect public safety
outcomes (e.g., reducing the number of highway fatalities) rather than the current focus
on outputs (e.g., the number of tickets issued or traffic stops made).
Engage Troopers in selection of new uniforms, addressing current comfort and style
concerns (now underway)
Evaluate alternative shift schedules toward providing greater alignment with workload
demands. A pilot project is currently underway.
Implementation of these recommendations is essential in order to address the current employee
satisfaction issues, and is equally important to address both retention and recruitment problems.
Compensation Competitiveness. Compensation is also an important issue for the FOB
Troopers and Sergeants. Over the last several years, growth in compensation at many
competitive local law enforcement agencies has outpaced the WSP, leaving the WSP at the
bottom in terms of direct cash compensation, as illustrated in Figure 4. When factoring in the 10
percent geographic pay received by Troopers stationed in King County, the WSP’s total direct
cash compensation improves, but only to about the middle of the comparison group. While a
recent 7% Trooper pay increase helped to narrow this gap -- and some Troopers also earn up to
10% geographic pay in certain higher cost areas of the state – the WSP continues to lag in
salaries.
3 A 360 degree review solicits feedback from the manager, subordinates, superiors, and peers.

Executive Summary 13
On a total compensation basis, the WSP does offer a somewhat more generous pension, along
with a take-home vehicle for Troopers and Sergeants that a few local agencies provide.
Nonetheless, in the context of current recruitment and retention challenges, compensation
competiveness is of concern.
If viewed to be well below competitive law enforcement agencies, compensation can have a
compounding effect on employee dissatisfaction and if compensation differentials grow too large,
many employees will feel compelled to consider moving to a different agency. Additionally,
potential recruits to the WSP may also opt for higher paying local law enforcement jobs and not
consider a Trooper career.
To address these concerns, this Report outlines a set of options for the State to consider in the
context of a revised long-term compensation plan, as highlighted below.
All Troopers:
Increase geographic assignment pay in regions with high attrition, targeting dollars to
the regions with the greatest competition.
Roll selected premium and differential pays into base salary, thereby creating a more
attractive starting salary for recruitment purposes.
Provide future across-the-board wage increases to further improve overall pay
competitiveness, calibrating the size of such adjustments to take into account the impact
of the other compensation initiatives outlined above.
$50,000
$60,000
$70,000
$80,000
$90,000
$100,000
$110,000
Entry 5 YOS 10 YOS 15 YOS 20 YOS 25 YOS
Figure 4: Washington Local Law Enforcement AgenciesTotal Direct Cash Compensation
WSP Kennewick King Co Pasco
Pierce Co Seattle Snohomish Co Tacoma
Vancouver Yakima Spokane County WSP w/ 10% geo pay
WSP with
10% geo
pay
WSP

14 Executive Summary
Early-Career Troopers:
Increase pay for Cadets and early-career Troopers. To pay for this additional cost, offer
a new retirement plan for new hires, one that is more similar to the LEOFF retirement
plan for local law enforcement officers. This means new WSP hires will be eligible to
retire with 30 years of service, rather than the current 25 years of service in the WSPRS
Trooper retirement plan. Actual savings will need to be actuarially determined. Over
the long-term, the extended pension age will provide for longer careers more in line with
contemporary retirement practices. In the short-term, the savings generated would be
directed primarily to those experiencing the change in pension benefits.
Mid-Career Troopers:
Establish Senior and/or Master Trooper levels to provide more compensation and
additional opportunities for advancement linked to performance and professional
development goals.
Retirement-Eligible Troopers:
Provide a retention bonus, increased longevity pay, or targeted pension benefit
enhancements to encourage retirement-eligible Troopers to stay beyond retirement age.
This will particularly help address WSP’s near-term staffing pressures.
Any revised compensation plan will ultimately be refined to meet the State and Trooper’s needs
through the collective bargaining process. The WSP does not have the ability to unilaterally make
changes in compensation.
New Trooper Recruitment. Recruitment of Cadets for the Trooper Basic Academy is the sole
source of replenishment of Troopers in the WSP. In order to meet the replacement demands
projected from near-term attrition, the WSP needs to increase the number of Cadets who
complete the Trooper Basic Academy and are commissioned as Troopers.
The recruitment process spans four discrete areas: understanding who the ideal candidate is
and what they want from a law enforcement job, outreach and marketing to the target Cadet, the
process of selecting Cadets for the Trooper Basic Academy(e.g. exams, background checks,
etc.), and the training process itself. WSP’s hiring needs require that recruitment efforts work at
an optimal level and be responsive to the changing needs of the new workforce. Throughout the
course of this study, we have seen that the WSP staff has been actively improving the overall
recruitment process to make it shorter for recruits and more productive for the agency.
The most recent recruiting process for the 30th Arming Class (the class began November 23rd),
and has generated a total of 53 Cadets, who, over seven to eight weeks, will go through the
evaluation and training process in preparation for the Basic Trooper Academy.
Opportunities identified for improving the recruitment process are more related to fine tuning,
rather than redoing, processes. Addressing employee dissatisfaction and compensation will help

Executive Summary 15
strengthen recruitment as well. The following are some substantive recommendations to improve
the selection and training process:
Currently WSP rejects all candidates who have any misdemeanor convictions or past drug
use. This is too harsh. Change it to a case-by-case review of an individual’s
circumstances, in order to determine if the candidate is fit for a law enforcement career
Review the psychological testing portion of the selection process to bring the testing
protocols more in line with contemporary national standards; currently the WSP fail rate is
well above statewide and national norms.
Contract with outside psychologists to increase testing capacity during peak hiring times
Merge the Arming Class and Trooper Basic Academy into a single class to reduce total
Academy time.
Consider repurposing Cadets who are too young or otherwise not ready to be a Trooper
into District-level positions with duties now performed by Troopers but do not require
commissioning to perform enforcement activity.
Run two academies per year to fill current and projected vacancies in the field.
A majority of Troopers who come into the WSP are influenced to apply by someone they know
who works at WSP. This personal connection is common among law enforcement officers in all
agencies. A key question that was asked of current Troopers was about encouraging people to
consider the WSP as a career. As shown in Figure 5, over 63 percent of current Troopers
answered “no” – they would not encourage someone to consider a career at WSP. In a similar
question asked of Troopers who separated from the WSP, nearly two-thirds answered “no.” This
connection between recruitment and employee dissatisfaction also shows the connection
between retention and recruitment issues.
36.7%
63.3%
0.0%
10.0%
20.0%
30.0%
40.0%
50.0%
60.0%
70.0%
Yes No
Figure 5: Current Troopers: I encourage people to consider WSP as a career

16 Executive Summary
The WSP is at a crossroads. In a changing cultural environment, and facing the erosion of
employee satisfaction and compensation competitiveness, the WSP needs to make immediate
changes to ensure that is can continue to meet its targeted staffing and service levels.
The list of recommendations provided below, and detailed throughout this Report, address such
important concerns and opportunities on an issue-by-issue basis. However, it is important that
both WSP and the Legislature take action in a comprehensive manner. Neither compensation
increases alone nor improvements in employee satisfaction and communications -- without
compensation increases -- will fully resolve the agency’s current retention and recruitment
challenges.
By undertaking a comprehensive set of actions however, the WSP can build on its proud traditions
and incorporate new ways of doing business to better align with the current workforce.

Executive Summary 17
Report Recommendations
All recommendations included in the Report are provided below. Some recommendations are
shown in an abbreviated format. More detailed findings and recommendations are provided
throughout the report, and provided in whole in Appendix A.
Each recommendation also includes visual cues to help identify key implementation issues:
New Funding Required:
Legislative Approval Required:
Change to Existing Laws Required:
EMPLOYEE SATISFACTION
Finding #1 (Employee Satisfaction)
A majority of the Troopers and Sergeants surveyed indicated management and morale issues within the WSP. These perceptions have led to job dissatisfaction and have magnified pay issues.
Recommendation 1.1
The State should commission an organizational assessment to identify specific management strategies and recommendations that will improve overall engagement with line staff.
Cost The cost of an organization study will vary based on scope, but should be in the range of $75,000 to $150,000. Analysis and surveys from this JTC study should help to defray the cost of a future analysis more directly focused on improving Trooper engagement.
Implementation Hurdles
Funds need to be appropriated by the Legislature. The study will work best if WSP management actively works with the study consultant to implement changes.
Finding #2 (Employee Satisfaction)
Both separated and current Trooper surveys indicate a perceived disconnect from the realities of day-to-day field operations on the part of some supervisors and upper management. This disconnect appears to be contributing to the recent resignations of Troopers for other law enforcement agencies.
Recommendation 2.1
The WSP executive staff should work with its Human Resource Division and/or the State Human Resources Division within the Office of Financial Management to conduct performance evaluations,4 of all management staff with the rank of Lieutenant and above. This should include 360 degree reviews. The results of these evaluations should be used to identify opportunities to improve management performance.
Cost The cost of performing evaluations and 360 degree reviews should be minimal; however, such an undertaking can be time consuming and will create an expectation of change within the agency.
Implementation Hurdles
WSP executive leadership must be willing to undertake and act on this type of performance evaluation.
4 A 360 degree review solicits feedback from the manager, subordinates, superiors, and peers.

18 Executive Summary
Finding #3 (Employee Satisfaction)
A focus on outputs with FOB Troopers (e.g., specific goals for traffic stops) as a measure of Trooper performance is contributing to a disconnect between Troopers and management, as well as a perception that management does not understand the difficulties of the Field Force Trooper job.
Recommendation 3.1
Performance metrics provide important feedback, and their active use should be continued, but refined. As this occurs, and as specific measures are reevaluated, the WSP executive team should reinforce the focus of Trooper work activity around improving public safety outcomes (e.g., reduced traffic fatalities) rather than focusing on specific enforcement outputs (e.g. issuing tickets).
Cost No identified cost.
Implementation Hurdles
Must be embraced by WSP executive staff.
Finding #4 (Employee Satisfaction)
The WSP uniforms have not been updated since they were designed prior to the 1960s. The WSP is now reviewing options for modern wash-and-wear fabrics, and is planning a more comprehensive review of uniforms in the near future.
Recommendation 4.1
The WSP should engage commissioned employees across all ranks to review uniform options and recommend changes to style and fabric for executive management consideration. Engagement of Troopers in this evaluation can begin to address the communication problems identified in the survey responses of current Troopers.
Cost Moving to new uniforms will have a one-time cost of approximately $1.67 million to replace all components for the current 1,005 commissioned staff who wear a uniform (approximately $1,660 per employee).
Implementation Hurdles
The WSP executive team is currently reviewing uniform options. Funding will need to be appropriated by the Legislature.
Finding #5 (Employee Satisfaction)
The WSP Field Force schedule calls for rotating between night shift and day shift every 28 to 56 days. Alternative shifts are allowed in some Districts under provisions outlined in the collective bargaining agreement (CBA) with the WSPTA. Troopers do not gain more control over their schedule with greater seniority, and the current practice of shift rotation does not take into consideration staffing requirements based on call volume or other measures of workload activity.
Recommendation 5.1
WSP management should encourage the development of experimental shifts - designed by detachment personnel - to create more stability in and Trooper control over choosing their schedules.5
Cost Different schedules could result in more or less overtime depending on how they are implemented. No cost is projected at this time.
5 In accordance with section 12.11 of the collective bargaining agreement

Executive Summary 19
Implementation Hurdles
Requires support from WSP management at HQ, Districts and Detachments (group of Troopers assigned to a specific geographic location within a District).
COMPENSATION
Finding #7 (Compensation)
Certain District offices in the State have been losing more Troopers than others. This is due in part to Troopers leaving for higher-paying law enforcement positions in or near those same Districts.
Recommendation 7.1
The WSP should review its geographic pay practices to both expand counties they cover as well as to potentially increase the rates for geographic pay. Providing higher pay on a geographic basis could provide additional incentive to stay with the WSP for Troopers where pay is a primary issue. This will also help attract new recruits from more populated areas where there are many other law enforcement choices.
Cost Increasing geographic pay makes the most sense in King County where pay differentials to the Seattle Police Department and King County Sheriff’s Office are over 15 percent and in District 5 where pay differences to Vancouver are nearly 13 percent. Increasing geographic pay in King County (District 2) will cost approximately $103,000 per one percent increase (including 17% for pension and other payroll costs). A one percent geographic pay allowance for District 5 Troopers would cost approximately $63,000 per one percent per year (not all counties of the District will necessarily be included).
Implementation Hurdles
Requires negotiations over the CBA with the WSPTA, and approval by the Legislature.
Finding #6 (Compensation)
The WSP compensation package plays a role in the overall job satisfaction of WSP Troopers and is a major factor cited in recent separations from the WSP. Further, current Troopers also cite pay and benefits as an issue that could move them to leave the WSP (both retirements and resignations) in the near future.
Recommendation 6.1
Working with the Office of Financial Management, WSP should develop a long-term compensation plan to address issues of pay competiveness within the context of the State’s ability to pay. Creating such a compensation plan, even if it takes several years to fully fund and achieve, can help to address existing dissatisfaction and concerns.
Cost Based on the total budgeted Trooper and Sergeant positions, each one percent pay increase will cost approximately $925,000 per year on an ongoing basis inclusive of all pay categories (including a 17% allowance for pension and other payroll costs). Increases at the Trooper and Sergeant levels may cause compression issues at Lieutenant and above that if addressed, would lead to additional costs.
Implementation Hurdles
Increasing compensation levels may require the State to identify new funding for the WSP.

20 Executive Summary
Finding #8 (Compensation)
The WSP provides opportunities for specialty and certification pays. While these are ways to boost pay for employees who have special knowledge or provide special services, only a small percentage of Field Force employees actually receive these extra pays, and those that do are typically more senior Troopers that would benefit from implementation of various other compensation recommendations.
Recommendation 8.1
The WSP should consider merging specialty pays, certification pays, and shift differentials into base pay. This will serve to increase the base pay levels presented in pay comparisons, while limiting pay differences among Troopers.
Cost To the extent that some premiums are not now pensionable or included in the overtime base, shifting such elements of pay could marginally increase pension and overtime costs. If a cost neutral shift is intended, this factor should be accounted for when determining the size of the resulting base pay adjustment.
Implementation Hurdles
Requires negotiations over the CBA with the WSPTA, and approval by the State Legislature.
Recommendation 8.2
Institute a new promotional class of Trooper. The WSP could offer a promotional opportunity for Troopers to an advanced level (a Senior and/or Master Trooper, for example) with additional duties and expectations.
Cost The total cost of this recommendation would depend on how many Troopers would qualify into such levels, and whether or not any existing premiums would be folded into the new level (e.g. if points toward Master Trooper status for educational attainment and/or field training officer (FTO) duties were part of advancement under such a program, then existing, separate premiums might be eliminated).
Implementation Hurdles
Requires negotiations over the CBA with the WSPTA, and approval by the State Legislature.
RETIREMENT
Finding #9 (Retirement)
The issues motivating current early and mid-career Troopers to resign from the agency are also influencing retirement-eligible Troopers’ decisions regarding when to retire. Despite the fact that they likely have many years of employment opportunity before they want to fully retire, many current WSP Troopers nearing retirement indicated their plan is to stay with the WSP only until they reach normal service retirement requirements (25 years of service).
Recommendation 9.1
Evaluate and implement appropriate options to extend a career past retirement eligibility. Options include: increased pay for retirement-eligible Troopers (e.g., longevity steps); offer a retention bonus; increase retirement eligibility to 30 years of service (legislative change for future hires; must include offsetting new advantages and satisfy legal review for current employees); increase pension accrual after 25 years of service; evaluate a limited-duration DROP (deferred
Executive Summary 21
retirement option program); and/or create a Trooper Reserve program. More detailed descriptions start on page 101.
Cost Varies by option—see recommendations starting on page 101
Implementation Hurdles
Most options require negotiations over the CBA with the WSPTA, and approval by the State Legislature.
RECRUITMENT
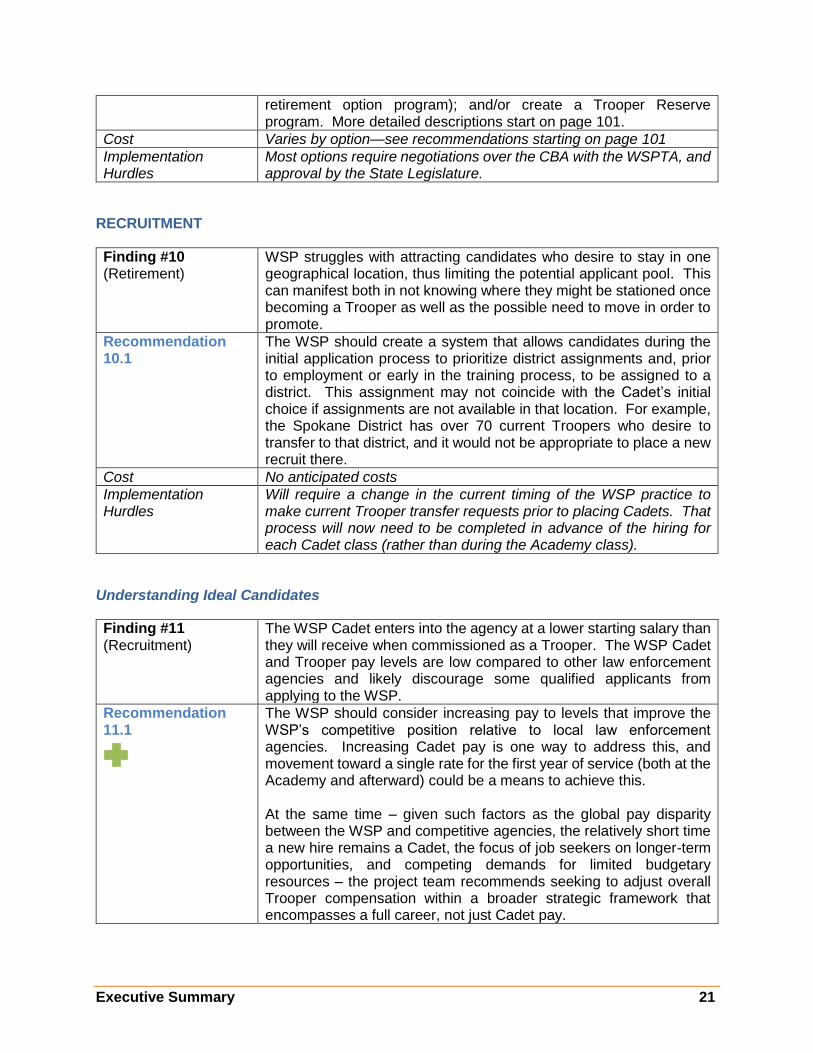
Finding #10 (Retirement)
WSP struggles with attracting candidates who desire to stay in one geographical location, thus limiting the potential applicant pool. This can manifest both in not knowing where they might be stationed once becoming a Trooper as well as the possible need to move in order to promote.
Recommendation 10.1
The WSP should create a system that allows candidates during the initial application process to prioritize district assignments and, prior to employment or early in the training process, to be assigned to a district. This assignment may not coincide with the Cadet’s initial choice if assignments are not available in that location. For example, the Spokane District has over 70 current Troopers who desire to transfer to that district, and it would not be appropriate to place a new recruit there.
Cost No anticipated costs
Implementation Hurdles
Will require a change in the current timing of the WSP practice to make current Trooper transfer requests prior to placing Cadets. That process will now need to be completed in advance of the hiring for each Cadet class (rather than during the Academy class).
Understanding Ideal Candidates
Finding #11 (Recruitment)
The WSP Cadet enters into the agency at a lower starting salary than they will receive when commissioned as a Trooper. The WSP Cadet and Trooper pay levels are low compared to other law enforcement agencies and likely discourage some qualified applicants from applying to the WSP.
Recommendation 11.1
The WSP should consider increasing pay to levels that improve the WSP’s competitive position relative to local law enforcement agencies. Increasing Cadet pay is one way to address this, and movement toward a single rate for the first year of service (both at the Academy and afterward) could be a means to achieve this. At the same time – given such factors as the global pay disparity between the WSP and competitive agencies, the relatively short time a new hire remains a Cadet, the focus of job seekers on longer-term opportunities, and competing demands for limited budgetary resources – the project team recommends seeking to adjust overall Trooper compensation within a broader strategic framework that encompasses a full career, not just Cadet pay.

22 Executive Summary
Cost Depends on overall change to Cadet and Trooper compensation. Moving Cadets to entry-level Trooper pay alone would cost approximately $350,000 - $400,000 per year depending on how many Cadets are hired into the WSP and how long they take to complete the training program.
Implementation Hurdles
The WSP Chief has the authority to set Cadet salaries within the total authorized budget of the agency.
Finding #12 (Recruitment)
The WSP has a carefully cultivated paramilitary culture that is reflected in recruitment outreach and reinforced in the Trooper Basic Academy. Current applicants to law enforcement agencies, however, are less likely to embrace this paramilitary style. Even the WSP’s current recruits are significantly less drawn by this factor than were current Troopers when they joined the Patrol.
Recommendation 12.1
The WSP needs to take a close look how it can align its culture to the contemporary approach favored by many current recruits while still maintaining its “service with humility” mission. The issue of cultural realignment impacts the entire recruitment process and is central to other recommendations provided in the Recruitment chapter of this Report.
Cost Unless the WSP utilizes outside resources to address cultural changes, there is no cost to this recommendation.
Implementation Hurdles
Culture is difficult to change and can take a concerted effort over many years. A culture change would need to be embraced by WSP’s executive management.
Outreach and Marketing
Finding #13 (Recruitment)
The WSP uses traditional law enforcement outreach and marketing strategies that rely on personal interaction between a potentially qualified candidate and WSP personnel. These strategies include job fairs, military installation visits, and general public appearances.
Recommendation 13.1
The WSP should develop a comprehensive outreach and marketing strategic plan that expands on the success of current strategies and looks for ways to tap into groups of individuals that do not currently show an interest in the WSP or law enforcement as a career, such as women and minorities. This will require the use of non-traditional marketing and outreach methods.
Cost Outside consultant support may be valuable in evaluating marketing successes in other locations. Expanded marketing and outreach efforts could need additional resource allocations.
Implementation Hurdles
Staff time is limited, and funding will need to be identified if an outside consultant is utilized.
Finding #14 (Recruitment)
The most successful recruitment tool is personal relationships with WSP Troopers. To improve on recruitment outside of traditional strategies, many agencies across the country have developed youth-

Executive Summary 23
oriented law enforcement academies or magnet schools to create a pipeline of potential candidates starting as early as grammar school.
Recommendation 14.1
The WSP should consider reinstating the Explorer program or a similar youth outreach program, in order to expose teens to the possibility of a career with the WSP. This may require the expansion of work currently done by recruiters in District offices.
Cost Trooper time to manage the program at the district level. Could also use retirees for non-benefit-qualified work. Pay for Administrative Assistant or Program Specialist job classes ranges from $15.00 to $22.00 per hour. Eight people working half-time on the Explorer program would cost up to $225,000 per year.
Implementation Hurdles
Limited staff resources due to recent attrition issues. Need to address employee satisfaction issues to make this most successful.
Finding #15 (Recruitment)
Survey results identify WSP personnel as influential in the recruitment process. The ability to expand recruitment relationships will require effort by more Troopers than are currently assigned recruiting duties in the Districts.
Recommendation 15.1
Identify staff who have the skills, ability, and desire to function as both formal and informal recruiters. Not everyone desires to be a recruiter nor does everyone have the skills to undertake that role. The pool of Troopers used for recruitment activities should be increased and the role enhanced to include higher levels of youth and community engagement.
Cost Minimal cost expected. Requires training time and material.
Implementation Hurdles
Need to address employee satisfaction issues to make this most successful.
Finding #16 (Recruitment)
Patrol recruitment staff currently poll applicants about how they found out about the WSP, but they do not keep statistics on the success of each outreach and marketing method as they relate to attracting applicants who eventually become Troopers.
Recommendation 16.1
Recruitment staff should continue tracking how applicants find the WSP as well as how successful each outreach method is in terms of yielding new Troopers
Cost No identified cost.
Implementation Hurdles
None identified.
Finding #17 (Recruitment)
Potential law enforcement candidates are researching potential employers online before applying for a position or accepting a conditional job offer. As identified in survey results, the primary research tool is the website.
Recommendation 17.1
The WSP should redesign its website to engage viewers with an emphasis on creating a positive and welcoming environment. The WSP should include videos that demonstrate the full range of duties performed by the Patrol.

24 Executive Summary
Cost Varies based on approach used and availability of existing staff. Engaging outside web-design help could be in the range of $25,000 or more.
Implementation Hurdles
Website changes need to be consistent for the agency, and must be approved, ultimately, by executive management.
Selection Process
Finding #18 (Recruitment)
Candidates have been removed from the selection process through the pre-polygraph interview for disqualifying conduct before the circumstances surrounding the conduct can be evaluated on an individual basis. Although it is not official policy, it appears that it has been WSP’s practice to reject candidates at the pre-polygraph interview when the candidate admits to ‘disqualifying conduct’ such as misdemeanor convictions or past drug use.
Recommendation 18.1
Except as required by law, the WSP should change their criteria from an absolute rejection of a candidate for any and all misdemeanor convictions and drug use to a case-by-case review of the individual’s circumstances. This allows for consideration of extenuating circumstances without lowering any ethical standard. The background check follows the polygraph exam, and issues raised in the polygraph can be followed up and addressed, if necessary.
Cost No expected cost
Implementation Hurdles
None identified.
Finding #19 (Recruitment)
Over the last five Arming Classes, the WSP has failed 38 percent of its recruits on the psychological exam -- a level well above the national and local law enforcement average of 5 percent6 and above the State Patrol benchmark agency failure rate of 18 percent. Also, the tests WSP uses for the psychological evaluation are not the current national standard tests, which are normalized for law enforcement personnel.
Recommendation 19.1
The WSP should review the psychological testing portion of the selection process to bring the testing protocols in line with contemporary national standards as well as to determine possible causes for the high failure rate.
Cost Potential small cost in changing psychological tests.
Implementation Hurdles
Testing methodology is determined by the WSP’s Psychologist
Finding #20 (Recruitment)
All psychological testing is done by the WSP’s Psychologist. Testing occurs during recruitment periods for the Arming Class, which can create a backlog for testing that results in a bottleneck in the selection process.
6 “Psychological Testing and the Selection of Police Officers: A National Survey”

Executive Summary 25
Recommendation 20.1
The WSP should contract with outside psychologists to assist the WSP’s Psychologist during peak hiring times and eliminate delays in the overall process.
Cost Additional cost for contract Psychologists range from $350 to $500 per applicant tested. Total cost will vary based on number of applicants assigned to contractors.
Implementation Hurdles
The testing process is currently the responsibility of the WSP’s Psychologist.
Training Process
Finding #21 (Recruitment)
The WSP’s practice of conducting an Arming Class separate from the Trooper Basic Academy is done primarily to fill 15 security positions (eleven in the Governor’s Mansion and Office, and four contractual positions). This can leave Cadets uncertain about timing to become a Trooper and extends their time at the lower-paying Cadet position for an additional nine months.
Recommendation 21.1
The WSP should merge the Arming Class and Trooper Basic Academy into a single class and move all Cadets through this program and into Trooper positions as soon as possible. Merging the Arming Class and Trooper Basic Academy into a single course will provide the WSP with more flexibility in terms of the number of training academies it can run, but will also require a different model to staff the contracted security positions, such as hiring retired Troopers.
Cost Merging the Arming Class and Trooper Basic will result in a shorter training period, by eliminating the week between the two classes. If the WSP increases the number of Academy classes and Cadets trained, there will be a corresponding increase in costs. The marginal cost of training a Cadet is approximately $56,600. The cost of increased Cadets in the Trooper Basic Academy was formerly offset by accrued vacancy savings in the current biennium. The Legislature has already reduced the WSP budget by the anticipated vacancy savings, when enacting the 2015-17 budget. As a result, the cost of additional hiring will require additional appropriations.
Implementation Hurdles
Operating two academies per year places more stress on the training Academy instructors.
Recommendation 21.2
The WSP should continue using the Cadet job classification to allow for entry level employment into the agency, but should consider repurposing Cadets who are too young (Troopers must be 21, Cadets can be hired at 19), or otherwise not ready to be a Trooper, into District-level positions that perform duties currently performed by Troopers that do not require law enforcement officer certification.
Cost Cadet positions will operate under the total full-time equivalent (FTE) authorization for the FOB. Funding for security positions filled by retired Troopers or a separate security class could be slightly less or more than the pay of a Cadet depending upon the service job class selected (Security Guard 1-3 or Campus Security Officer). Cadet positions would remain on the Cadet pay scale during the time in the field or could be provided an increase once training is completed.

26 Executive Summary
Implementation Hurdles
May require new model to staff the contracted security positions, such as hiring retired Troopers.
Finding #22 (Recruitment)
The WSP has a current vacancy problem that is exacerbated by record-level resignations and a retirement bubble starting in 2015. The only replacement for departing Troopers is graduates from Trooper Basic Training. In order to replace Troopers leaving the WSP and keep the number of Field Force Troopers at levels needed to fulfill their mission, the WSP must increase the number of training Academy graduates. Currently, the WSP runs one Academy every 9 months.
Recommendation 22.1
The WSP should run two academies per year for a period of time in order to replace current and projected vacancies in the field. The agency has run academies twice a year in the past, and this increase in capacity will improve the pipeline to replace retiring Troopers.
Cost The reason for running two academies is to fill vacancies in the field. The cost of increased Cadets in the Trooper Basic Academy was formerly offset by accrued vacancy savings in the current biennium. The Legislature reduced the WSP budget by the anticipated vacancy savings, when enacting the 2015-17 budget. As a result, the cost of additional hiring will require additional appropriations.
Implementation Hurdles
Running two academies per year impacts the scheduling related to the selection process and the use of the Academy facilities by both WSP and outside agencies
Finding #23 (Recruitment)
The WSP Trooper Basic Training is perceived by some potential applicants to be a warrior style of training. The WSP Academy emphasizes restraint in action, and focuses on a service model for Troopers; however, certain elements of the training Academy —early training protocols that focus on discipline, and housekeeping rules—have led to this perception which has caused some potential recruits to bypass the WSP.
Recommendation 23.1
The WSP should review elements of the training protocols that create a perception of the warrior-style of academy and deemphasized them. Guardian elements of the Academy and the job should be emphasized. This will serve to mitigate potentially negative perceptions of potential Cadets and better reflect the actual Academy training style.
Cost No direct costs associated with this transition.
Implementation Hurdles
None identified.

Organization of Report and Study Methodology 27
Organization of Report and Study Methodology
This report is organized into four chapters. Chapter 1 explores the drivers behind recent
vacancies and presents scenarios for vacancy projections in the next ten years. Chapter 2 details
WSP compensation, including cash, health and pension programs and other benefits, and
compares it to compensation and benefits at local and state law enforcement agencies. Chapter
3 explores the WSP’s recent attrition, the drivers of that attrition, and recommendations regarding
keeping WSP Troopers on the force longer. Chapter 4 gives an overview of the WSP recruitment
process from the outreach and marketing phase through the training process and provides
findings and recommendations related to how new WSP Troopers are recruited, selected, and
trained.
Study Methodology
Over the course of the study, the project team used a variety of tools to evaluate the WSP’s
recruitment process, and retention experience. This evaluation included a variety of analytical
and research techniques aimed at matching available data with current experience to arrive at
the underlying issues impacting the WSP in the Field Operations Bureau. These tools focused
on WSP as well as at outside agencies. The tools used in this study included:
Interviews with WSP staff
Review of data provided by the WSP Human Resources Division (HRD)
On-site visits and interviews at the WSP Basic Trooper Academy and the Criminal Justice
Training Commission (CJTC) where all other Washington police are trained
Benchmark surveys of both local Washington law enforcement and other State Patrol
agencies nationally
Surveys of Cadets, Troopers, CJTC recruits, separated Troopers, and municipal law
enforcement agencies in Washington (administered using Survey Monkey)
On-Site Visits
The project team met with over 40 key stakeholders inside and outside of the WSP during a three-
day period in August 2015, and following. Interviewees included:
WSP Non-WSP
• Command Staff o Chief Batiste o Deputy Chiefs
• Union leaders • Troopers and Sergeants • District commanders • Human Resources staff • Recruitment staff • Chief Financial Officer
• Office of Financial Management (OFM)—HR staff
• OFM budget staff
• Chief State labor negotiator • CJTC recruits, instructors and
Executive Director
28 Organization of Report and Study Methodology
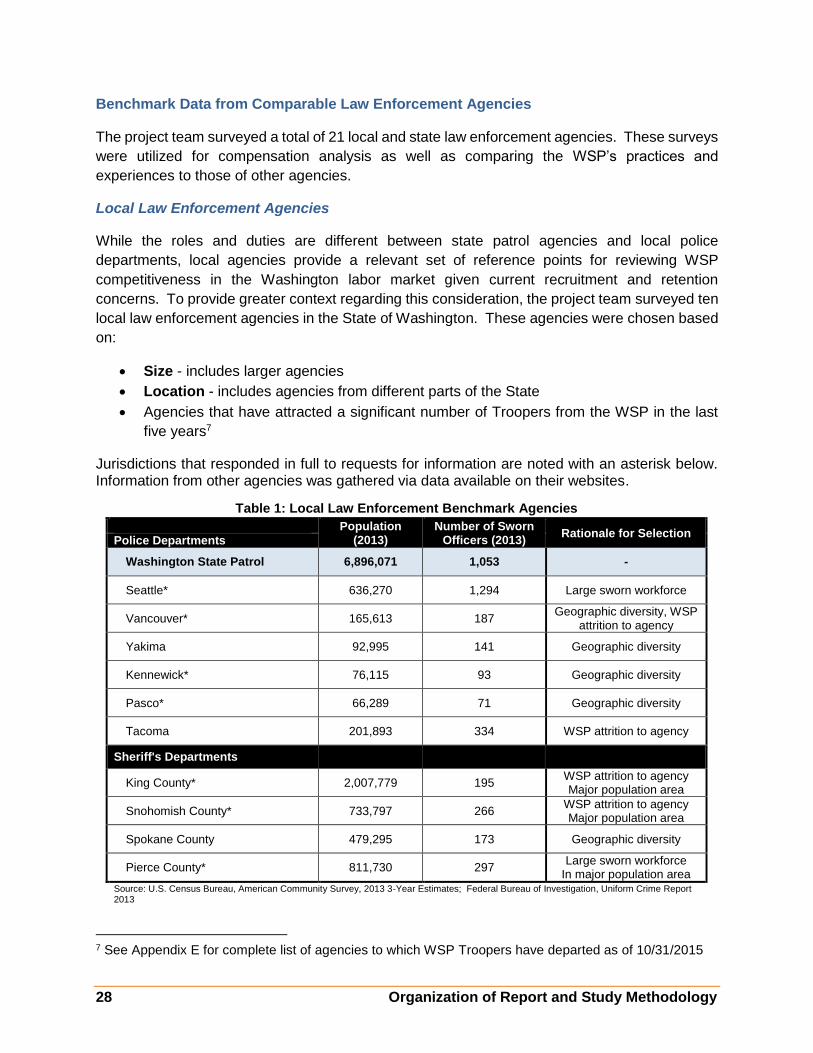
Benchmark Data from Comparable Law Enforcement Agencies
The project team surveyed a total of 21 local and state law enforcement agencies. These surveys
were utilized for compensation analysis as well as comparing the WSP’s practices and
experiences to those of other agencies.
Local Law Enforcement Agencies
While the roles and duties are different between state patrol agencies and local police
departments, local agencies provide a relevant set of reference points for reviewing WSP
competitiveness in the Washington labor market given current recruitment and retention
concerns. To provide greater context regarding this consideration, the project team surveyed ten
local law enforcement agencies in the State of Washington. These agencies were chosen based
on:
Size - includes larger agencies
Location - includes agencies from different parts of the State
Agencies that have attracted a significant number of Troopers from the WSP in the last
five years7
Jurisdictions that responded in full to requests for information are noted with an asterisk below. Information from other agencies was gathered via data available on their websites.
7 See Appendix E for complete list of agencies to which WSP Troopers have departed as of 10/31/2015
Table 1: Local Law Enforcement Benchmark Agencies
Population (2013)
Number of Sworn Officers (2013)
Rationale for Selection Police Departments
Washington State Patrol 6,896,071 1,053 -
Seattle* 636,270 1,294 Large sworn workforce
Vancouver* 165,613 187 Geographic diversity, WSP
attrition to agency
Yakima 92,995 141 Geographic diversity
Kennewick* 76,115 93 Geographic diversity
Pasco* 66,289 71 Geographic diversity
Tacoma 201,893 334 WSP attrition to agency
Sheriff's Departments
King County* 2,007,779 195 WSP attrition to agency Major population area
Snohomish County* 733,797 266 WSP attrition to agency Major population area
Spokane County 479,295 173 Geographic diversity
Pierce County* 811,730 297 Large sworn workforce
In major population area Source: U.S. Census Bureau, American Community Survey, 2013 3-Year Estimates; Federal Bureau of Investigation, Uniform Crime Report 2013

Organization of Report and Study Methodology 29
State Law Enforcement Agencies
The project team also surveyed 11 state patrol agencies nationally. While not providing reliable
compensation comparisons, as they are not in the competitive labor market with the WSP, these
agencies provide a comparison of practices, experience, and methods of recruitment and
retention that provide helpful context for the report.
Jurisdictions that responded in full to requests for information are noted with an asterisk below.
Information from other agencies was gathered via data available on their websites.
Table 2: State Law Enforcement Benchmark Agencies
Population
(2013)
Number of Sworn Officers
(2013) Rationale for Selection
Washington State Patrol 6,896,071 1,053 -
California Highway Patrol* 38,000,360 7,236 Best-practice agency
New York State Police 19,576,660 4,604 Compensation practices
Pennsylvania State Police* 12,759,859 4,168 Compensation practices
Michigan State Police* 9,884,242 1,686 Best-practice agency
Ohio Highway Patrol* 11,557,868 1,608 Best-practice agency
Arizona Highway Patrol* 6,548,856 1,096 Similar size agency
Colorado State Patrol 5,192,076 669 Best-practice agency
Oregon State Police 3,899,266 606 Contiguous state
Minnesota State Patrol* 5,382,376 537 Best-practice agency
Nevada Highway Patrol 2,754,148 445 Nearby state
Idaho State Police 1,597,222 260 Contiguous state
Source: U.S. Census Bureau, American Community Survey, 2013 3-Year Estimates; Federal Bureau of Investigation, Uniform Crime Report 2013
Survey Data
The project team developed five surveys that were administered to specific groups of respondents
in September 2015. The goal of the surveys was to solicit a broad spectrum of information and
opinions from diverse groups associated with the WSP or local law enforcement. The survey data
is a key data source utilized in this report.
Current WSP Cadets
Current WSP Troopers and Sergeants
Separated WSP Troopers

30 Organization of Report and Study Methodology
Criminal Justice Training Commission (CJTC) Recruits
Law enforcement agencies throughout the State
The total number of surveys administered and the responses received by category are provided
in Table 3 below.
Table 3: Survey Response Rates
Survey Group Number Surveyed Responses Received Response Rate (%)
WSP Cadets 64 64 100%
WSP Troopers & Sergeants 870 486 55.8%
WSP Separated Troopers [1] 49 20 40.8%
CJTC Recruits [2] 150 19 12.7%
CJTC law enforcement agencies
285 37 13.0%
[1] Those leaving the WSP to join other law enforcement agencies between 2009 and July 31, 2015 [2] Estimated number of recruits who received the survey
Data Provided by WSP
Washington State Patrol provided data regarding headcounts, deployment and vacancies,
payroll, and attrition. Data provided by WSP is as of 10/31/2015 unless noted otherwise.

Chapter 1: Field Force Evaluation and Vacancy Projection 31
Chapter 1: Field Force Evaluation and Vacancy Projection
INTRODUCTION
The Field Force evaluation provides context for this comprehensive study of WSP recruitment
and retention challenges and opportunities. This initial chapter provides:
An analysis of WSP vacancies and attrition, along with projections of potential staffing
levels going forward
An overview of the current Trooper workforce and compensation package
An assessment of how these issues are affected by, and relate to, the experience of both
local law enforcement agencies in Washington and other state patrol agencies nationally
WORKFORCE COMPOSITION
Field Operations Bureau (FOB) Troopers are essential to achieving the WSPs statewide
mission of keeping the roadways safe.
The Washington State Patrol is charged with “making people safe on Washington roadways and
ferries.” To meet this charge, the WSP is
divided into six bureaus:
FOB, subdivided into eight districts
Commercial Vehicle Enforcement
Fire Protection
Forensic Laboratory
Investigative Services
Technical Services
These bureaus are comprised of both
commissioned and civilian staff making up
the WSP’s approximately 2,178 total personnel (as of October 31, 2015). Commissioned law
enforcement officers comprise about 48 percent of the total workforce. Of those, Troopers and
Sergeants comprise nearly 94 percent of sworn workforce, and those Troopers and Sergeants
engaged in direct field operations comprise nearly 68 percent of total Troopers and Sergeants.

32 Chapter 1: Field Force Evaluation and Vacancy Projection
The FOB is responsible for the on-the-ground, direct enforcement of the WSP’s mission as it
related to make people safe on Washington roadways and ferries, and all newly commissioned
recruits in the WSP enter through the FOB. The functioning of the FOB unit is, therefore, key to
the overall ability of the WSP to meet its mandate and effectuate its mission.
Accordingly, this study is primarily focused on
recruitment and retention issues related to Troopers
and Sergeants in the FOB. Because staff often
moves between FOB and non-FOB assignments, the
analysis in this report sometimes addresses
Troopers and Sergeant positions across all bureaus.
The current FOB workforce includes 664 funded
Troopers and Sergeant positions. A majority of the Troopers (55 percent) have more than five
years of experience. Sergeants comprise nearly 13 percent of the total FOB.
Figure 6 shows the current FOB by seniority in five-year increments. This table shows that there
is a reasonable distribution of Trooper tenure across each five-year segment; with the largest
8 As of October 31, 2015, total employees excludes contract employees for the Fire Bureau categorized as “non-employees.”
Table 4: Washington State Patrol Employees
Filled
Positions Percent
Authorized Staff Level
Total Civilian and Sworn Employees8 2,178 100.0% 2,424
Sworn Employees 1,046 48.0% 1,127
Troopers and Sergeants 980 93.7% 1,054
FOB Troopers and Sergeants 664 67.8% 761
Cadets 63 100.0% 50
This study is focused on the
Troopers and Sergeants in the
Field Operations Bureau of the
WSP, and the recruitment and
retention issues facing the Field
Force.
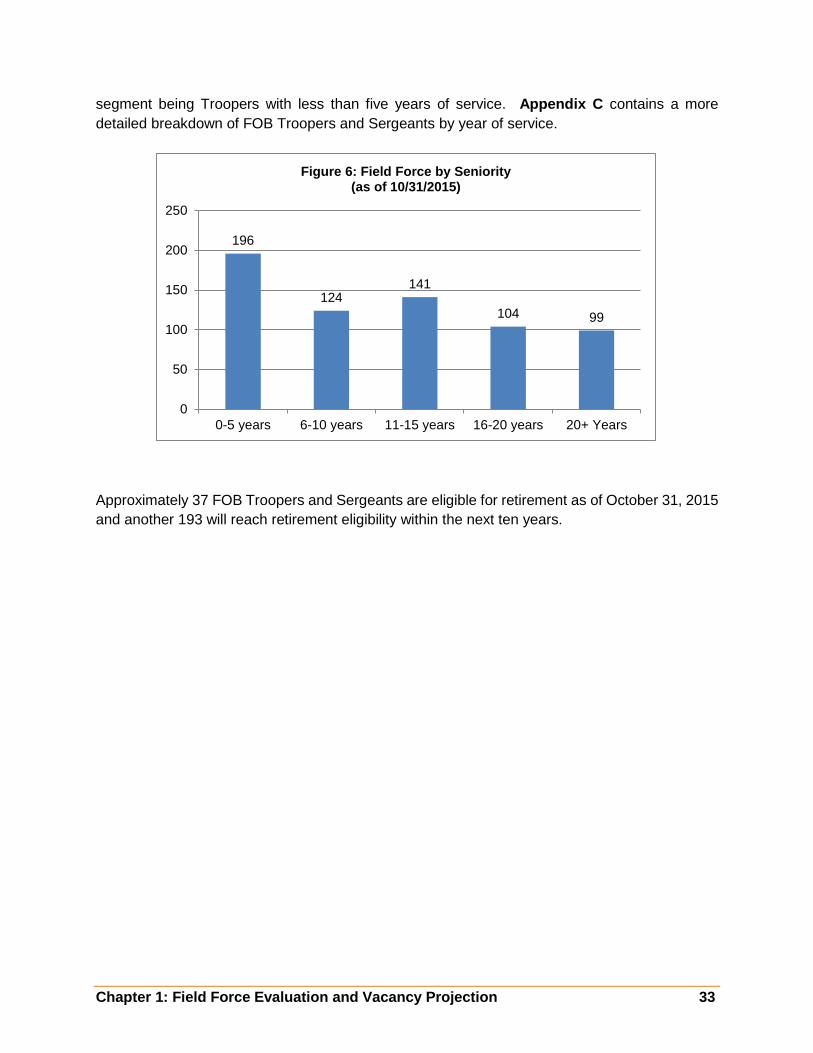
Chapter 1: Field Force Evaluation and Vacancy Projection 33
segment being Troopers with less than five years of service. Appendix C contains a more
detailed breakdown of FOB Troopers and Sergeants by year of service.
Approximately 37 FOB Troopers and Sergeants are eligible for retirement as of October 31, 2015
and another 193 will reach retirement eligibility within the next ten years.
196
124141
104 99
0
50
100
150
200
250
0-5 years 6-10 years 11-15 years 16-20 years 20+ Years
Figure 6: Field Force by Seniority(as of 10/31/2015)

34 Chapter 1: Field Force Evaluation and Vacancy Projection
VACANCY ANALYSIS AND PROJECTIONS
The WSP has been experiencing increasing vacancy rates in the Field Operations Bureau (FOB)
since the recession ended, that rate has dramatically spiked in 2015.
A major question examined in this study is how to address the recent growing vacancy rates in
the FOB workforce. This section will explore recent vacancy rates, the interrelationship between
attrition and attracting new Cadets, the coming retirement bubble, and indicative reasons for
attrition. Based on this analysis, the project team has developed 10-year vacancy projections
that show the impact of the retirement bubble and the effect of different resignation rates on
potential future vacancies.
Recent Field Force Vacancies
Vacancy rates increase when the level of attrition, through normal service retirement and mid-
career resignations or separations, exceeds the number of new Troopers added through the
WSP’s Trooper Basic Training
Academy.
As shown in Figure 7, the average
yearly vacancies have more than
doubled between 2010 and November
2015. The dotted line shows the yearly
average of vacancies and the solid line
shows the vacancies as of December
of each year. This includes an
alarming 29 new vacancies in just
August through October of 2014.
Replacements from the Basic Trooper
Academy have not kept pace with
attrition, with the most recent training Academy class graduating only 25 Troopers in November.
This steadily increasing attrition has had significant impacts on the Troopers that make up the
Field Force. It has directly contributed to:
Reduced ability for Troopers to take specialty assignments, such as detective, as many
specialty positions are being left vacant in order to fill FOB workforce needs.
Difficulty in scheduling days off due to staffing shortages
Loss of Troopers retiring who typically mentor new Troopers coming out of the Academy
Resignations typically occur during the early career of a Trooper. The highest rate of resignations
occurs within the first five years of commissioning. A majority of those leaving at this stage of
their career join other law enforcement agencies. As Troopers gain tenure, there generally is a
decrease in resignations and reduced attrition to other law enforcement agencies, as shown in
the Figure 8 and Table 5 on the following page. Once a Trooper attains 15 years of service, he
or she is no longer eligible to accrue pension benefits from another Washington State retirement
0
20
40
60
80
100
120
2010 2011 2012 2013 2014 2015
Figure 7: Vacancies by Year2010 through November, 2015
December Yearly Average
2015 reflects data through November

Chapter 1: Field Force Evaluation and Vacancy Projection 35
plan, such as LEOFF. As a result separations to other law enforcement agencies beyond 15
years of service are rare.
Note: “Other” includes dismissals and deaths; graph reflects Field Force Troopers only
Table 5: Field Force Trooper Attrition by Tenure and Reason (1/1/2010-10/31/2015)
Resigned Retired Other Total
0-5 years 50 0 1 51 (23.8%)
6-10 years 20 0 1 21 (11.7%)
11-15 years 10 3 1 14 (7.8%)
16-20 years 7 4 4 15 (8.3%)
20+ years 2 75 2 79 (43.9%)
Total 89 (49.4%) 82 (45.6%) 9 (5.0%) 180 (100%)
Note: “Other” includes dismissals and deaths; data reflects Field Force Troopers only
A significant number of Troopers who voluntary resigned reported in their exit interview or
resignation notice that they were leaving WSP to join another law enforcement agency.
50 Troopers (56.2 percent of voluntary resignations) left for other law enforcement
employment
0
10
20
30
40
50
60
70
80
90
0-5 years 6-10 years 11-15 years 16-20 years 20+ years
Figure 8: Field Force Trooper Attrition by Tenure and Reason(1/1/2010-10/31/2015)
Resigned Retired Other

36 Chapter 1: Field Force Evaluation and Vacancy Projection
6 Troopers (6.7 percent) specified that they were resigning because of family issues or
personal reasons, but specified no future career plans
6 Troopers (6.7 percent) indicated they planned to change careers. One of those six
Troopers indicated that they were going to work for the military and one indicated they
plan to stay home with children
Of the remaining 27 resignations (30.3 percent), reported reasons for separation varied in
detail and specificity, including relocation, leaving after prolonged disability, and as a result
of a settlement agreement between the Troopers and the office of Professional Standards.
Factors Leading to Increased Vacancies
There are several factors contributing to the increased vacancy rates in the WSP Field Force.
These include:
Increased hiring in local law-enforcement agencies, most of which pay better than the
WSP, and may offer advantages attractive to some individuals (e.g., type of work,
geographic location and/or stability)
Dissatisfaction with the WSP among separated Troopers
Below average size of recent Trooper Basic Academy graduating classes
Increased retirements
Local Law Enforcement Hiring. The primary reason for increased resignations in the WSP is
to take another job in a local Washington law enforcement agency. Since 2010, 50 Troopers
have left for other law enforcement agencies, with 25 of those separations occurring in 2015 alone
through October 31st.
This has followed a significant increase in hiring by local law enforcement over the last several
years. Local hiring is likely the result of improving economic conditions trickling down to local
agencies after years of austerity due to the Great Recession between 2007 and 2009, with
ongoing economic recovery for several years afterward. Many agencies experienced layoffs
and/or left positions vacant. With a better economic outlook, demand for hiring increased, which
may reflect some “catch up” from prior periods of less recruitment activity.
These local hiring trends are seen in the increasing size of recruit classes at the Criminal
Justice Training Commission (CJTC). Over the last two years, the total number of recruits
(hired by local law enforcement agencies and trained by the CJTC) has jumped significantly, as
shown below. This represents a major increase in local hiring of entry-level law enforcement
Table 6: Criminal Justice Training Commission (CJTC) Graduates, 2010-2015
2010 2011 2012 2013 2014 2015
CJTC Graduates 153 92 106 292 313 364
Source: CJTC annual reports for 2010-2012, and CJTC staff for current graduates.
Note: During this same time, Washington State population grew at a much lower rate than would account for these increases –- 5
percent from 2010 to 2015, or less than 1 percent per year.

Chapter 1: Field Force Evaluation and Vacancy Projection 37
Additionally, local law enforcement agencies have increased the number of lateral hires –
police officers from other agencies – to fill vacancies. This provides opportunities for highly-
trained Troopers to join these local agencies. The project team surveyed all local law enforcement
agencies in Washington through the CJTC. This survey, while less detailed than the
benchmarking analysis to come, still provides insights into recent hiring trends in local agencies.
Figure 9 below shows increased total hiring by agencies responding to the survey as well as
increased hiring of lateral hires. This is only a small portion of all agencies hiring, but underscores
the opportunity that has become available to WSP Troopers in the last several years post-
recession.
The majority of the FOB Troopers who take positions in other law enforcement agencies stay
close to their last WSP assignment area, as shown in the table below. Resignations for other law
enforcement agencies will be discussed in more detail in Chapter 3.
Dissatisfied Separated Troopers. In addition to opportunity, there must also be motivation for a
Trooper to change agencies. Of the 20 separated Troopers who responded to the survey, 100
percent identified WSP management as a reason for leaving the agency. Similarly, 90 percent
indicated that they did not feel valued by WSP, leading to their departure.
While this is a small sample, the responses to this survey of separated Troopers provide insight
into the perspectives from that those officers who left the WSP for other law enforcement
employment, and are similar to survey responses from active Troopers. Further discussion of
issues related to employee satisfaction will be provided in Chapter 2.
Training Academy Graduating Classes. Currently, the only source of new Troopers to fill
vacancies in the FOB is graduates of the WSP Trooper Basic Academy. The WSP operates its
own training Academy, and recent graduating classes have dropped below the long-term average
number of graduates. Reasons for this drop off, along with recommendations to improve
recruitment yields, will be addressed in Chapter 4.
0
20
40
60
80
100
120
140
2010 2011 2012 2013 2014 2015
Figure 9: Survey Results Local Law Enforcement Hiring
(37 agencies reporting)
Lateral Hires Recruits
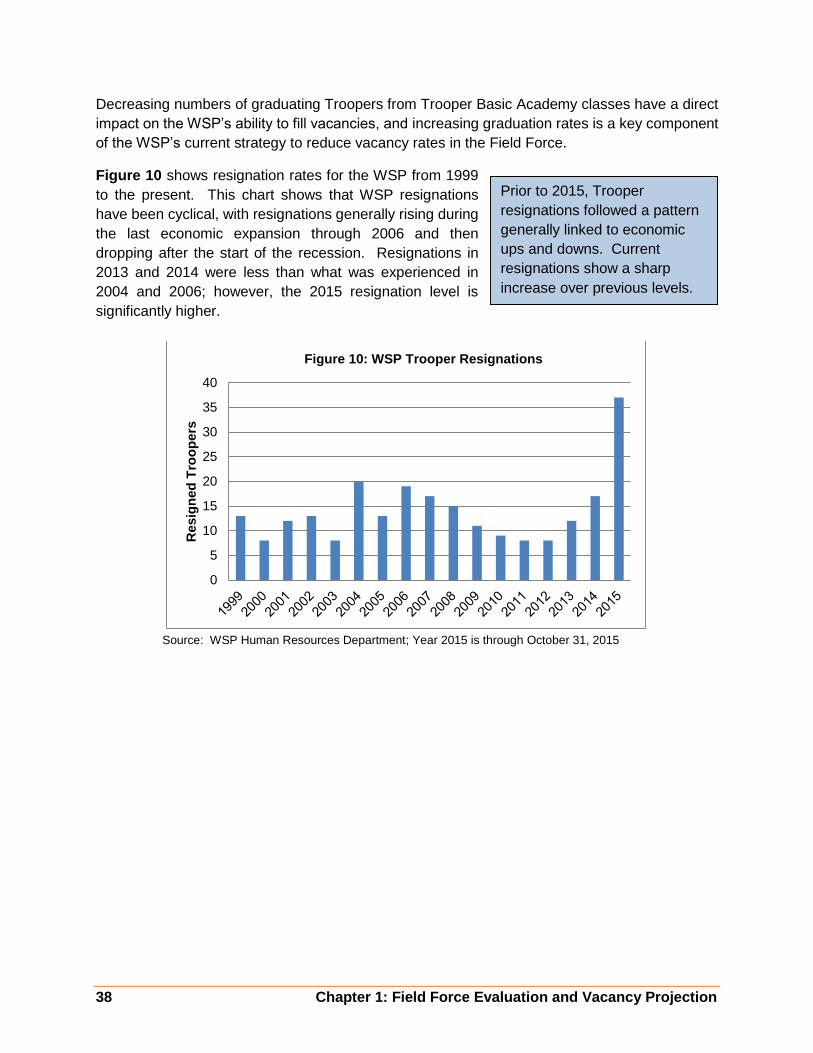
38 Chapter 1: Field Force Evaluation and Vacancy Projection
Decreasing numbers of graduating Troopers from Trooper Basic Academy classes have a direct
impact on the WSP’s ability to fill vacancies, and increasing graduation rates is a key component
of the WSP’s current strategy to reduce vacancy rates in the Field Force.
Figure 10 shows resignation rates for the WSP from 1999
to the present. This chart shows that WSP resignations
have been cyclical, with resignations generally rising during
the last economic expansion through 2006 and then
dropping after the start of the recession. Resignations in
2013 and 2014 were less than what was experienced in
2004 and 2006; however, the 2015 resignation level is
significantly higher.
Source: WSP Human Resources Department; Year 2015 is through October 31, 2015
0
5
10
15
20
25
30
35
40
Resig
ned
Tro
op
ers
Figure 10: WSP Trooper Resignations
Prior to 2015, Trooper
resignations followed a pattern
generally linked to economic
ups and downs. Current
resignations show a sharp
increase over previous levels.

Chapter 1: Field Force Evaluation and Vacancy Projection 39
PROJECTED FOB TROOPER LEVELS
It is important to WSP’s future to understand the impacts of continued high attrition and low
Academy graduation rates on Field Force Trooper levels. Figure 11 shows projected filled
Trooper positions under three retirement and resignation scenarios drawn from recent WSP
experience. The resulting range of projections illustrates the impact of continued high resignation
rates in conjunction with the coming retirement bubble.
Note: All projections assume the current practice of one Academy every nine months with a historical graduation rate
of 37 per academy, providing an average of 50 new Troopers per year.
The projection includes three scenarios. Consistent in all scenarios is the attrition of retirement-
eligible commissioned staff and the Academy graduation rate is held constant at 37 per academy
(50 per year based on one Academy every nine months). The primary variable in the projection
is the assumed resignation rate. The resignation rate alternatives include:
1. Average resignation experience from the fifteen year average between 1999 and 2013
(12 resignations per year—used in the top two lines in Figure 11)
2. Average resignations in the past ten years (15 resignations per year), and
3. Continuation of the current rate of attrition in 2015 (35 resignations per year)
Continuation of the 2015 resignation rates will put the WSP in a tenuous position and is not
sustainable. Even the lower historical resignation rates are not sustainable for the WSP. Efforts
must focus on increasing new Trooper levels and retaining Troopers already in the workforce.
Figure 11A shows the same projection assumptions with the exception of a higher Academy
graduation rate annualized to 63 per year. This can be achieved through increased class size
and/or more frequent Academy classes. With higher graduation rates, the WSP could keep
200250300350400450500550600650700
Figure 11: Projected Field Force Levels Potential Scenarios(Based on Retirements & Resignation Alternatives)
FOB Resignations 2006-2015 FOB Resignations 2015
Avg. Resignations 1999-2013
Filled Field Force Positions as of 10/31/2015 = 580

40 Chapter 1: Field Force Evaluation and Vacancy Projection
Trooper levels close to current levels, but below full staffing under historical resignation rates.
The projection is unsustainable if 2015 resignation rates continue.
Note: Assumes annualize Academy graduations of 63 per year. All other assumptions used in Figure 11
are held constant.
Projection Implications
The projection provides a sober picture of likely future WSP Trooper levels, without any changes
to current practices. Implications of the projection include:
Expected retirements will exacerbate the current vacancy problem.
Resignations must be reduced for the Field Force to have a sustainable workforce to
accomplish its mission. The WSP must address the issues that are driving resignations in
order slow current attrition rates.
Given expected retirements, WSP must at least reduce its Trooper resignations from the
current 2015 spike to the 15-year average of 12 per year. This would keep vacancies no
greater than today.
The WSP must increase the number of Cadets graduating from the Academy. They can
do this by increasing the average graduating class size, by increasing Academy
frequency, or both to meet the demands of future attrition, even under favorable
assumptions.
250
300
350
400
450
500
550
600
650
700
Figure 11A: Projected Field Force Levels(Higher Academy Graduation Rates)
FOB Resignations 2006-2015 FOB Resignations 2015
Avg. Resignations 1999-2013
Field Force Positions as of 10/31/15 = 580

Chapter 1: Field Force Evaluation and Vacancy Projection 41
Projection Assumptions
Retirements: As discussed above, retirement of commissioned personnel will continue to have
a significant impact on the WSP Field Force vacancies. Retirement projections are based on the
year in which a Trooper reaches 25 years of service. While not everyone retires at 25 years,
separation typically occurs within one to three years. Despite a WSP goal to keep Troopers
beyond 25 years, recent Trooper retirees have averaged just 25.8 years of service at retirement.
Looking forward, a retirement bubble is beginning to surface as commissioned staff hired 25 years
ago are now reaching retirement age. Figure 12 shows commissioned staff becoming eligible for
retirement over the next ten years, and Table 7 provides this information in tabular form. For FOB
Troopers, 230 of the 664 current Troopers and Sergeants will be eligible to retire in the next ten
years, and 210 of the 270 current non-FOB Troopers and Sergeants will retire over the next 10
years. Sixty-four commissioned staff with the rank of Lieutenant and above will be eligible to
retire.
WSP always promotes from within. So as these higher ranking officers retire, our projections
assume that promotions to replace such supervisory personnel will create an equivalent number
of openings at the Trooper rank, as this is current practice at WSP9
Figure 12 shows that 504 commissioned personnel will be eligible to retire in the next 10 years,
creating that number of vacancies in the Trooper workforce that will need to be filled through WSP
recruitment efforts.
9 The WSP does not have a program to recruit lateral hires from other police agencies. All potential Trooper candidates are hired as Cadets and must complete the entire training program to be commissioned.
0
20
40
60
80
100
2015 2016 2017 2018 2019 2020 2021 2022 2023 2024 2025
Figure 12: Projected Retirement of Current WSPCommissioned Personnel
2015-2025
FOB Troopers and Sergeants Non-FOB Troopers and Sergeants
Lieutenant and Above

42 Chapter 1: Field Force Evaluation and Vacancy Projection
Table 7: New Retirement-Eligible Commissioned Officers
2015 2016 2017 2018 2019 2020 2021 2022 2023 2024 2025 Total
FOB Troopers and Sergeants
37 25 17 2 9 9 31 21 27 23 29 230
Non-FOB Troopers and Sergeants
36 21 20 6 7 8 27 18 28 22 17 210
Lieutenants & Above
14 11 11 2 1 4 10 4 2 2 3 64
Total 87 57 48 10 17 21 68 43 57 47 49 504
Note: While this is a projection of the FOB Trooper vacancies, it includes all commissioned retirements, as each
retirement is likely to result in an FOB vacancy and must be filled by training Academy graduates.
Resignations: Resignations are the most difficult factor to project. As previously shown, recent
attrition to other law enforcement agencies has increased. Indications are that local hiring will
remain a factor in resignations.
Based on data gathered to date, there are two key pieces of information that provide some insight
into future local hiring needs.
Expected Future Local Hiring: Local law enforcement hiring will likely be driven by expected
retirements – similar to the situation at the WSP. According to the most recent (2014) actuarial
valuation for the LEOFF Plan 2 retirement system, around 2,100 local law enforcement officers
are currently eligible for early or normal service retirement. In the following five years, an additional
1,300 officers will meet age and service requirements for a normal retirement, with an additional
1,300 becoming eligible in six to ten years after that. The approximately 4,700 officers eligible to
retire in the next ten years will present local agencies with a need to fill those positions. It is likely
that hiring to replace future retirees will continue.
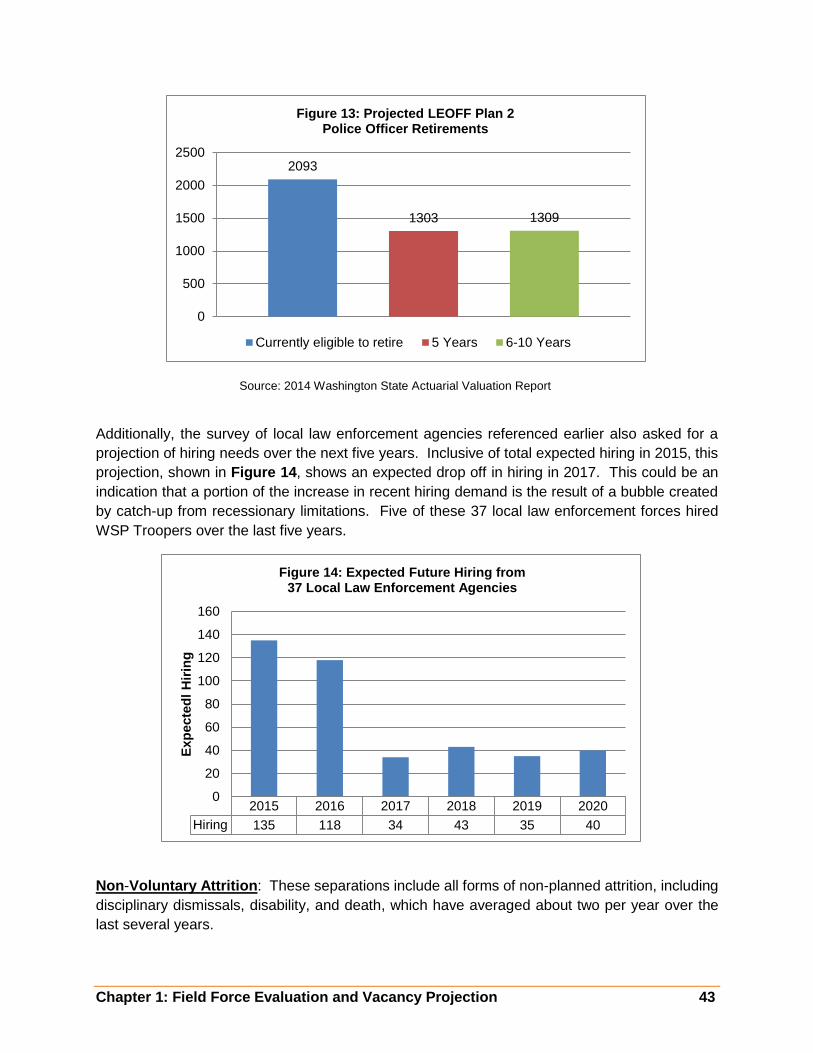
Chapter 1: Field Force Evaluation and Vacancy Projection 43
Source: 2014 Washington State Actuarial Valuation Report
Additionally, the survey of local law enforcement agencies referenced earlier also asked for a
projection of hiring needs over the next five years. Inclusive of total expected hiring in 2015, this
projection, shown in Figure 14, shows an expected drop off in hiring in 2017. This could be an
indication that a portion of the increase in recent hiring demand is the result of a bubble created
by catch-up from recessionary limitations. Five of these 37 local law enforcement forces hired
WSP Troopers over the last five years.
Non-Voluntary Attrition: These separations include all forms of non-planned attrition, including
disciplinary dismissals, disability, and death, which have averaged about two per year over the
last several years.
2093
1303 1309
0
500
1000
1500
2000
2500
Figure 13: Projected LEOFF Plan 2 Police Officer Retirements
Currently eligible to retire 5 Years 6-10 Years
2015 2016 2017 2018 2019 2020
Hiring 135 118 34 43 35 40
0
20
40
60
80
100
120
140
160
Exp
ecte
dl
Hir
ing
Figure 14: Expected Future Hiring from37 Local Law Enforcement Agencies

44 Chapter 1: Field Force Evaluation and Vacancy Projection
Academy graduating class sizes: The WSP does not accept lateral hires from other law
enforcement agencies, meaning that Academy graduates are the only means of replenishing
workforce vacancies. The ability to attract qualified candidates who can complete the Academy
and desire a career as a Trooper is a key factor in filling the gap left by future retirements and
resignations.
Since 1990, the WSP Academy has completed 35 training classes, graduating an average of 37
new Troopers per class. Over the past five years, this has dropped to an average of 32 Troopers
per class, potentially due to increased competitions from hiring at the local level. The stated
capacity for an Academy class is 54; however, there have been only nine classes of the last 35that
started with 50 or more Cadets, and only one of those classes graduated more than 50 Cadets.
For the vacancy projection, the project team used the longer-range average graduating class
number of 37, higher than recent graduating classes. Academy classes are held on a recurring
basis and last 6 months. On average it takes eighteen months to complete two full academies.
This translates into the Academy adding an average of 50 commissioned officers per calendar
year.
The alternative Academy graduating class scenario can be reached by increasing average
graduation rates to 47 per class on the current nine month schedule (yielding an annualized 63
Troopers per year) or increasing class frequency to twice a year with graduation rates at or near
recent averages.

Chapter 1: Field Force Evaluation and Vacancy Projection 45
Projection Methodology
The projection focuses on FOB Trooper levels using the following general methodology:
1. Start with filled FOB Trooper positions -- 580 as of October 31, 2015
2. SUBTRACT FOB Troopers and Sergeants eligible for retirement -- shown in the year of
eligibility
3. SUBTRACT non-FOB Troopers and Sergeants eligible for retirement
4. SUBTRACT Lieutenants and above eligible for retirement
5. SUBTRACT non-voluntary attrition (estimated at 2 per year)
6. SUBTRACT resignations (provided as three scenarios in the projection)
7. ADD training Academy graduates (based on long-term historical graduation rates)
8. The result is the expected increase or decrease in total Trooper workforce over the ten-
year projection period
Projections of future Trooper levels are based on analysis related to retirements, resignations,
involuntary attrition, and expected training Academy graduation rates, provided above.
A detailed vacancy projection table can be found in Appendix B.
CONCLUSION
The projections underscore the critical need to address employee satisfaction, compensation,
and recruitment in order to avoid declining Trooper levels, and creating an environment that
encourages long-term employment
.

46 Chapter 2: Trooper Compensation
Chapter 2: Trooper Compensation
While many factors impact recruitment and retention experience, compensation is an important
consideration. This section describes Trooper compensation through cash payments from base
pay, longevity pay, premium pays, mandatory and voluntary overtime, specialty pay, and incentive
pay, as well as non-cash compensation from health and pension benefits, paid leave and take-
home vehicles.
Actual total cash compensation for a Field Force Trooper in FY2015 averaged $74,903. This
figure does not include the additional cost of benefits. Because payroll figures shown in this
chapter are based on the 2015 fiscal year, data indicating the number of Troopers who receive
various pays may differ from any figures presented in Chapter 1 regarding filled Troopers
positions.
Compensation provided to Troopers – both in terms of direct cash compensation and benefits –
is not competitive with the local law enforcement agencies to which separated Troopers are going.
While WSP Trooper compensation is in line with compensation at other statewide law
enforcement agencies, WSP is not losing Troopers to these agencies. Chapter 3 will take a more
detailed look at how the WSP compensation package affects retention.
Cash Compensation
Base pay and pay progression
Base pay for Troopers is shown in Table 8 below. This salary schedule increases six percent per
year after a Trooper is commissioned for the first five years of service. Currently, a Trooper with
20 years of service has base pay that is 33.8 percent higher than an entry-level Trooper.
Cadets, also included in this table, begin at a lower salary than commissioned Troopers. Cadets
can take 8 to 15 months to become commissioned, depending on the timing of when they are
hired relative to when the next Academy starts. Cadets are placed into the higher Trooper salary
range upon being commissioned.
Base salary and base salary plus longevity figures shown below are based on the FY2016 pay
scale and do not reflect actual earnings.

Chapter 2 Trooper Compensation 47
Table 8: Washington State Patrol Trooper Salary by Year of Service Effective July 1, 2015 - June 30, 2016
Year of Service Monthly Salary Base Salary Base Salary + Longevity
Cadet (Academy) $3,859 $46,308 $46,308
0 - 0.5 $4,290 $51,480 $51,480
0.5 - 1.5 $4,548 $54,576 $54,576
1.5 - 2.5 $4,820 $57,840 $57,840
2.5 - 3.5 $5,109 $61,308 $61,308
3.5 - 4.5 $5,416 $64,992 $64,992
4.5 - 5.0 $5,742 $68,904 $68,904
5.0 - 10.0 $5,742 $68,904 $70,968
10.0 - 15.0 $5,742 $68,904 $72,396
15.0 - 20.0 $5,742 $68,904 $73,848
20.0+ $5,742 $68,904 $75,324
Longevity
Longevity pay is included in Table 8, but is approved as a separate pay category, and increase
base pay starting with a three percent increase once a Trooper reaches five years of service. By
twenty years of service, longevity pay increases the base pay by 11 percent, as shown in the
table below. It is included in the calculation of specialty pay and geographic assignment pay.
Shift Differential
Shift differential pay is provided to Troopers who work a shift other than the typical day shift. WSP
provides a shift differential of 5 percent of the base pay plus longevity, for qualifying Troopers, for
all hours worked between 6:00pm and 6:00am. Typical day shifts are 5:00am to 3:00pm and
8:00am to 6:00pm, and night shifts are 3:00pm to 1:00am and 7:00pm to 5:00am.
In Fiscal Year 2015, 99.6% percent of Field Force Troopers received shift differential (525
Troopers) at some point during the year.10 For those receiving this premium, such additional
compensation averaged $1,355 for a Field Force Trooper.
10 Because payroll figures shown in this chapter are based on the 2015 fiscal year, data indicating the
number of Troopers who receive various pays may differ from any figures presented in Chapter 1 regarding filled Troopers positions.
Longevity (cumulative)
5 - 9 YOS: 3.0% 10 - 14 YOS: 2.0% 15 - 19 YOS: 2.0%
20+ YOS: 2.0%

48 Chapter 2: Trooper Compensation
Total Direct Cash Compensation
Total direct cash compensation for WSP Troopers shown below includes:
base salary,
longevity pay, and
shift differential pay (assuming equally rotating shifts)
Total direct cash compensation figures shown below are based on the FY2016 pay scale and do
not reflect actual earnings.
Table 9: Washington State Patrol Trooper Total Direct Cash Compensation
Effective July 1, 2015 - June 30, 2016
Base Pay + Longevity Total Direct Cash
Compensation
Entry $53,028 $54,192
5 YOS $70,968 $72,505
10 YOS $72,396 $73,950
15 YOS $73,848 $75,398
20 YOS $75,324 $76,905
25 YOS $75,324 $76,905
Note: Entry wage does match entry wage in Table 8 because it is an average of cadet pay and the Trooper pay for the first six months of service.
As seen in Table 9, a WSP Trooper can earn up to $76,905 in total direct cash compensation at
25 years of service (YOS). This excludes any educational incentive pay, specialty pay, and
geographic assignment pay, as well as overtime, which present additional earning opportunities.
Excluding these non-universal and/or variable additional pays from total direct cash compensation
facilitates comparison of a “typical” officer’s experience to that of their counterparts employed by
other law enforcement agencies.
Overtime
The WSP provides time-and-a-half pay to Troopers and Sergeants for all work hours occurring
before or after a shift or on a regular day off. The base for calculating overtime rates includes
base pay, longevity pay, specialty pay, educational incentive pay, and geographic assignment
pay. Troopers can earn both mandatory and voluntary overtime. The project team did not collect
information on the availability of overtime pay or the quantity of that pay from benchmarked local
or state law enforcement agencies.

Chapter 2 Trooper Compensation 49
In Fiscal Year 2015, 97.5 percent of Field Force Troopers received overtime (514 Troopers).11
For those receiving this premium, combined mandatory and all voluntary overtime pay (including
that earned when working for agencies other than WSP) averaged $6,500.
Educational Incentive
The WSP provides additional compensation to Troopers and Sergeants who have earned
advanced degrees: 2 percent for Associate degrees and 4 percent for Bachelor degrees.
In Fiscal Year 2015, 267 FOB Troopers received educational incentive pay.10 For those FOB
Troopers receiving this premium, educational incentive pay averaged $1,545 in FY2015.
Specialty Pays
Troopers have the opportunity to receive pay for various specialties deemed operationally
important for the agency. Some of the specialty pays currently offered by the WSP are shown
below. WSP rules limit any individual Trooper from receiving more than two specialty pay
assignments at once, or more than 10 percent in total specialty pay. There are no set limits for
the number of Troopers who receive any given specialty pay assignment. Specialty pay is
calculated as a specific percentage of base salary plus longevity. Specialty pays are provided
during the time that the Trooper is performing the special duties (e.g., Detective or Field Training
Officer).
Table 10: Washington State Patrol Specialty Pays FOB Troopers
As of 6/30/15
Field Training Officer
Bomb Technician
Canine Handler/ Trainer
Detective (non-
FOB)12
Motorcycle Officer
SWAT Team
Additional Pay Rate
5.0% 5.0%
3.0% handler 5.0% trainer
3.0% 4.0% 3.0%
# Troopers Receiving
115 5 8 1 25 13
Average Additional
Pay If Received
$854 $2,553 $1,399/ $2,870
$1,583 $2,019 $1,272
11 Because payroll figures shown in this chapter are based on the 2015 fiscal year, data indicating the
number of Troopers who receive various pays may differ from any figures presented in Chapter 1 regarding filled Troopers positions. 12 Detective positions are not included in the Field Force

50 Chapter 2: Trooper Compensation
In addition to the above, the WSP has several other assignments and certifications for which
supplemental pay is granted. In Fiscal Year 2015, a total of 132 Field Force Troopers received at
least one specialty pay or certification pay (see Tables 10 and 11). Among those Field Force
Troopers receiving this specialty and/or certification pays, pay averaged $1,181.
Table 11: Washington State Patrol Additional Specialty and Certification Pays FOB Troopers
Amount # FOB Troopers Paid as of
6/30/2015
Armorer 2.0% 10
Command Pilot 15.0% 0
Multi-Engine Pilot 10.0% 0
Single Engine Pilot 5.0% 0
Executive Protection Unit 10.0% 1
Certified Technical Specialist $500 26
Certified Reconstructionist $750 17
Certified Drug Recognition Expert [1] $500 25
[1] Drug Recognition pay provided when employee completes a minimum of five (5) evaluations within a year
Geographic Pay
The WSP instituted geographic pay in 2004 to address relatively higher costs of living in the
regions surrounding certain District offices. As shown below, Troopers assigned to District offices
located in King, Pierce or Snohomish counties receive geographic pay ranging from three to ten
percent of base salary. Additionally, Troopers assigned to one of four remote outpost positions
receive a seven percent geographic pay differential.
Table 12: Washington State Patrol Geographic Assignment Pay FOB Troopers
# FOB Troopers Paid
as of 6/30/2015 Average Pay
as of 6/30/2015
King County (10%) 100 $4,461
Snohomish County (5%) 61 $2,293
Pierce County (3%) 66 $1,280
Remote Outposts (7%) 2 $3,867
Note: Due to changes in assignment locations mid-year, some FOB troopers received multiple geographic pays in Fiscal Year 2015. Thus, the total number paid above does not equal the figure in text below.
Such geographic pay is only provided while a Trooper is assigned to one of the Districts covering
these designated counties. In Fiscal Year 2015, 220 Field Force Troopers received some
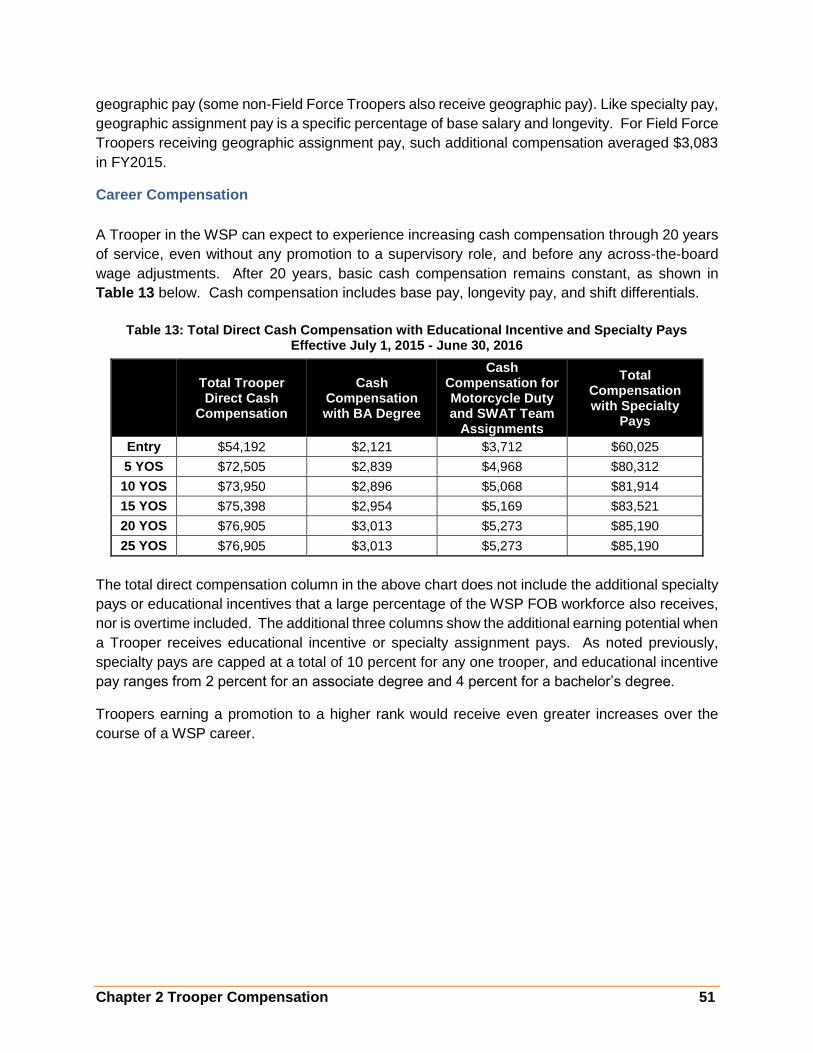
Chapter 2 Trooper Compensation 51
geographic pay (some non-Field Force Troopers also receive geographic pay). Like specialty pay,
geographic assignment pay is a specific percentage of base salary and longevity. For Field Force
Troopers receiving geographic assignment pay, such additional compensation averaged $3,083
in FY2015.
Career Compensation
A Trooper in the WSP can expect to experience increasing cash compensation through 20 years
of service, even without any promotion to a supervisory role, and before any across-the-board
wage adjustments. After 20 years, basic cash compensation remains constant, as shown in
Table 13 below. Cash compensation includes base pay, longevity pay, and shift differentials.
Table 13: Total Direct Cash Compensation with Educational Incentive and Specialty Pays Effective July 1, 2015 - June 30, 2016
Total Trooper Direct Cash
Compensation
Cash Compensation with BA Degree
Cash Compensation for Motorcycle Duty and SWAT Team
Assignments
Total Compensation with Specialty
Pays
Entry $54,192 $2,121 $3,712 $60,025
5 YOS $72,505 $2,839 $4,968 $80,312
10 YOS $73,950 $2,896 $5,068 $81,914
15 YOS $75,398 $2,954 $5,169 $83,521
20 YOS $76,905 $3,013 $5,273 $85,190
25 YOS $76,905 $3,013 $5,273 $85,190
The total direct compensation column in the above chart does not include the additional specialty
pays or educational incentives that a large percentage of the WSP FOB workforce also receives,
nor is overtime included. The additional three columns show the additional earning potential when
a Trooper receives educational incentive or specialty assignment pays. As noted previously,
specialty pays are capped at a total of 10 percent for any one trooper, and educational incentive
pay ranges from 2 percent for an associate degree and 4 percent for a bachelor’s degree.
Troopers earning a promotion to a higher rank would receive even greater increases over the
course of a WSP career.

52 Chapter 2: Trooper Compensation
Washington State Patrol Earnings in Context
Table 14 below illustrates actual Trooper total cash earnings for FY2015.
Table 14: WSP Troopers Cash Compensation Fiscal Year 2015
WSP Average If
Receiving % Receiving
WSP Weighted Average
Base Pay $64,321 - $64,321
Shift Differential $1,355 99.6% $1,350
Overtime $6,500 97.5% $6,340
Geographic Pay $3,083 41.8% $1,287
Educational Incentive Pay $1,545 50.3% $777
Specialty and Certification Pay $1,181 25.1% $296
Other Compensation $904 58.8% $532
Total $78,890 - $74,903
In comparison to the overall Washington State labor
market, a career as a WSP Trooper presents the
opportunity for strong overall wages. According to the
U.S. Census Bureau, the median household income in
Washington State for individuals age 25 and over with a
high school diploma was $30,509 as of 2013. Individuals
with some college or an associate degree had a median
household income of $35,904 and individuals with a
bachelor’s degree earned $52,128 per year.13
Even at entry, the Washington State Patrol Trooper’s total direct cash compensation exceeds the
median earnings for individuals of similar educational attainment statewide. Of course, law
enforcement is an extraordinary occupation, and it is not inappropriate for Troopers to earn more
than their counterparts in the general labor market who may not carry the same level of risk and
responsibility. In this regard, current WSP earnings do compare favorably across general
occupations in Washington State, and, as further detailed below, Trooper benefits are also quite
strong when compared to the overall State labor market.
Non-Cash Benefits
Leave
13 U.S. Census Bureau, American Community Survey, 2013, 3-Year Estimates
Because payroll figures shown in
this chapter are based on the 2015
fiscal year, data indicating the
number of Troopers who receive
various pays may differ from any
figures presented in Chapter 1
regarding filled Troopers positions.

Chapter 2 Trooper Compensation 53
In addition to cash compensation, WSP Troopers and Sergeants receive annual (vacation) leave
allowances based on years of service, as detailed in the chart below. Including personal leave,
Troopers receive between 104 and 184 hours of regular leave per year.
In addition, additional paid leave is available for non-job-related illness and injury (12 days per
year), work-related disability, military service, educational leaves of absence, and funeral
attendance.
Health Benefits
Washington State Patrol employees contribute 15 percent of premium toward health care
coverage while active. This percent contribution applies to all plans and all levels of coverage for
all state employees. More detail on employee contributions can be found in Appendices H and
I.
14 Personal leave is granted to all employees after four months of employment. It must be used in the year it is granted and cannot be carried over to the following year.
Table 15: Washington State Patrol Leave Allowances
Years of Service Hours of Leave
Annual Leave
0 YOS 96 hours
1 YOS 104 hours
2-3 YOS 112 hours
4-6 YOS 120 hours
7-9 YOS 128 hours
10+ YOS Additional 8 hours of leave for each
additional YOS, to a maximum of 176 hours
Personal Leave14 All years of service 8 hours
Table 16: Washington State Patrol Employee Contribution to Health Care Coverage
Highest-Enrolled HMO Highest-Enrolled PPO/POS
Individual Family Individual Family
Percent of Premium 15.0% 15.0% 15.0% 15.0%
Monthly Premium (2015) $107.00 $304.00 $84.00 $241.00

54 Chapter 2: Trooper Compensation
In comparison, the typical employee premium contribution for workers in Washington State private
industry (establishments of 50 or more employees) was 18.1 percent for individual coverage and
26.5 percent for family coverage in 2014.15
In addition, retired WSP Troopers who are not yet Medicare-eligible receive access to the same
medical plan offerings as active employees, but pay the full cost of coverage. Medicare-eligible
retirees have different plan options (including Medicare advantage and supplement options) and
are provided a subsidy of 50 percent of the plan premium up to $150 per month.
Pension Benefits
The WSP commissioned force participates in the Washington State Patrol Retirement System
(WSPRS). All other law enforcement and fire fighter personnel in the State, including local
departments and some other State agencies, are in the Law Enforcement Officers and Fire
Fighters (LEOFF) pension system. Members of both retirement systems do not participate in
Social Security.
The WSPRS system has two tiers, as shown in the table below. Both tiers allow for Troopers to
retire at age 55 or with 25 years of service at any age – the only pension plan in Washington State
that allows a 25-years-and-out retirement option. The other major change in Plan 2, in effect for
Troopers commissioned since January 2003, is that the final average salary (FAS) for determining
the retirement benefit is based on the highest consecutive 60 months of pay rather than 24 months
of pay under Plan 1.
Table 17: Washington State Patrol Retirement System Benefits
Membership Eligibility
Employee Contribution
Benefits Formula
FAS Period
WSP Retirement System (WSPRS) Plan 1
Commissioned before January
1, 2003
Age 55 or 25 YOS at any age
6.69%
2.0% x YOS x FAS (Includes
leave buyouts)
24 months
WSP Retirement System (WSPRS) Plan 2
Commissioned on or after January 1,
2003
Age 55 or 25 YOS at any age
6.69%
2.0% x YOS x FAS (Excludes
leave buyouts)
60 months
Total Cost to Employer
The major costs for employing a WSP Trooper, including all cash earnings and the largest benefit
categories, are shown in Table 18 below.
15 U.S. Department of Health and Human Service, Agency for Healthcare Research and Quality, Medical Expenditure Panel Survey, 2014

Chapter 2 Trooper Compensation 55
Total cash compensation is derived from actual Fiscal Year 2015 payroll data and is the average
of base compensation, overtime, shift differential, geographic pay, education incentive pay,
specialty and certification pays, and other compensation paid to WSP Troopers in that fiscal year.
Benefits include the employer contribution to WSPRS Plan 2 (8.09 percent through 6/30/3015),
the employer portion of the premium for family coverage under the highest-enrolled plan, and
payroll taxes (Medicare contributions; WSP members do not participate in Social Security).
Certain other benefits (e.g. workers’ compensation and take-home vehicles) are not included in
the table below.
Table 18: Total Employer Cost of Compensation and Benefits for WSP Troopers Actual Fiscal Year 2015 Earnings
Total Cash
Compensation
Pension Contribution
(8.09%)
Insurance Benefits
Cost
Social Security
Medicare Total
Employer Cost
0-5 YOS $64,251 $4,854 $7,944 $0 $932 $80,916
6-10 YOS $78,674 $5,871 $7,944 $0 $1,141 $97,164
11-15 YOS $79,186 $5,923 $7,944 $0 $1,148 $98,793
16-20 YOS $78,675 $5,938 $7,944 $0 $1,141 $98,009
21+ YOS $83,021 $6,170 $7,944 $0 $1,204 $104,612
Average $74,903 $5,615 $7,944 $0 $1,086 $95,899
Note: "Other Compensation" includes Field Training Officer pay and Acting pay; employer pension contribution based on base salary and mandatory overtime; pension contribution reflects employer contribution to WSPRS Plan 2 as of 6/30/2015; benefits cost reflects a funding rate of $662/month cost paid by each state agency to the state for each employee to cover medical, dental, and vision insurance, in addition to life insurance and long-term disability insurance. The actual cost to the State for health and dental coverage in CY2015 was $908.01, which is a weighted average across all levels of coverage. This figure does not include costs for life and long-term disability insurance, which are included in the $662 figure referenced above.
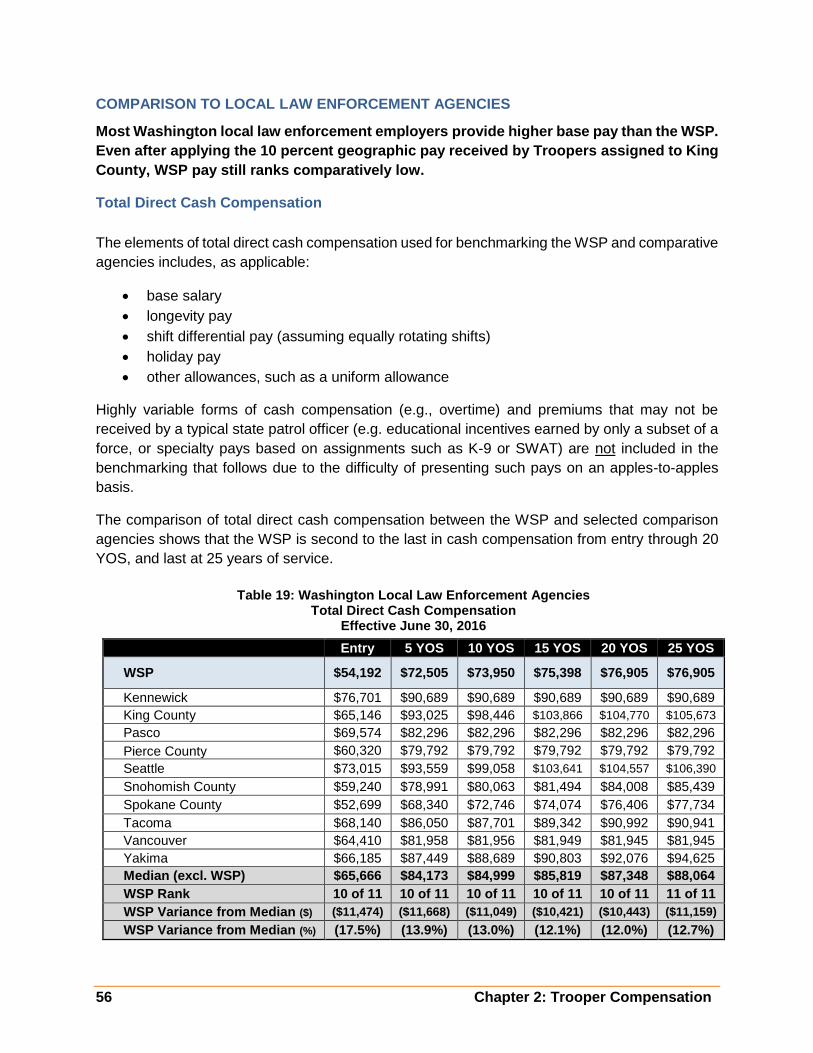
56 Chapter 2: Trooper Compensation
COMPARISON TO LOCAL LAW ENFORCEMENT AGENCIES
Most Washington local law enforcement employers provide higher base pay than the WSP.
Even after applying the 10 percent geographic pay received by Troopers assigned to King
County, WSP pay still ranks comparatively low.
Total Direct Cash Compensation
The elements of total direct cash compensation used for benchmarking the WSP and comparative
agencies includes, as applicable:
base salary
longevity pay
shift differential pay (assuming equally rotating shifts)
holiday pay
other allowances, such as a uniform allowance
Highly variable forms of cash compensation (e.g., overtime) and premiums that may not be
received by a typical state patrol officer (e.g. educational incentives earned by only a subset of a
force, or specialty pays based on assignments such as K-9 or SWAT) are not included in the
benchmarking that follows due to the difficulty of presenting such pays on an apples-to-apples
basis.
The comparison of total direct cash compensation between the WSP and selected comparison
agencies shows that the WSP is second to the last in cash compensation from entry through 20
YOS, and last at 25 years of service.
Table 19: Washington Local Law Enforcement Agencies Total Direct Cash Compensation
Effective June 30, 2016
Entry 5 YOS 10 YOS 15 YOS 20 YOS 25 YOS
WSP $54,192 $72,505 $73,950 $75,398 $76,905 $76,905
Kennewick $76,701 $90,689 $90,689 $90,689 $90,689 $90,689
King County $65,146 $93,025 $98,446 $103,866 $104,770 $105,673
Pasco $69,574 $82,296 $82,296 $82,296 $82,296 $82,296
Pierce County $60,320 $79,792 $79,792 $79,792 $79,792 $79,792
Seattle $73,015 $93,559 $99,058 $103,641 $104,557 $106,390
Snohomish County $59,240 $78,991 $80,063 $81,494 $84,008 $85,439
Spokane County $52,699 $68,340 $72,746 $74,074 $76,406 $77,734
Tacoma $68,140 $86,050 $87,701 $89,342 $90,992 $90,941
Vancouver $64,410 $81,958 $81,956 $81,949 $81,945 $81,945
Yakima $66,185 $87,449 $88,689 $90,803 $92,076 $94,625
Median (excl. WSP) $65,666 $84,173 $84,999 $85,819 $87,348 $88,064
WSP Rank 10 of 11 10 of 11 10 of 11 10 of 11 10 of 11 11 of 11
WSP Variance from Median ($) ($11,474) ($11,668) ($11,049) ($10,421) ($10,443) ($11,159)
WSP Variance from Median (%) (17.5%) (13.9%) (13.0%) (12.1%) (12.0%) (12.7%)

Chapter 2 Trooper Compensation 57
In every comparison, and at all but the 25 years of service tenure point in a Trooper’s career, the
WSP is second to last in cash compensation. Troopers are last at 25 years of service. Even if a
Trooper has a bachelor’s degree (4 percent additional pay) and receives a 5 percent specialty
pay incentive, the WSP cash compensation would still be below the median cash pay for the
majority of other agencies. The above figures for total direct cash compensation do not include
specialty pays or educational incentive pay.
When the 10 percent geographic assignment pay for Troopers assigned to King County is added
to total direct cash compensation, Washington State Patrol’s ranking relative to the surveyed local
law enforcement agencies in the King County area remains the same. WSP ranks 4th out of 4
agencies in the area in terms of total direct cash compensation
Table 20: Total Direct Cash Compensation with 10% King County Geographic Pay Effective July 1, 2015 - June 30, 2016
Entry 5 YOS 10 YOS 15 YOS 20 YOS 25 YOS
WSP Total Direct Cash Compensation with 10% King County geographic pay
$59,495 $79,602 $81,190 $82,783 $84,437 $84,437
King Co $65,146 $93,025 $98,446 $103,866 $104,770 $105,673
Seattle $73,015 $93,559 $99,058 $103,641 $104,557 $106,390
Tacoma $68,140 $86,050 $87,701 $89,342 $90,992 $90,941
Median (excluding WSP) $68,140 $93,025 $98,446 $103,641 $104,557 $105,673
WSP Variance from Median (12.7%) (14.4%) (17.5%) (20.1%) (19.2%) (20.1%)
WSP Rank 4 of 4 4 of 4 4 of 4 4 of 4 4 of 4 4 of 4
$50,000
$60,000
$70,000
$80,000
$90,000
$100,000
$110,000
Entry 5 YOS 10 YOS 15 YOS 20 YOS 25 YOS
Figure 15: Washington Local Law Enforcement AgenciesTotal Direct Cash Compensation
WSP Kennewick King Co Pasco
Pierce Co Seattle Snohomish Co Tacoma
Vancouver Yakima Spokane County

58 Chapter 2: Trooper Compensation
Less competitive wages put the WSP in a difficult position from a recruitment and retention
perspective, and places a much greater emphasis on the WSP’s attractiveness as an employer
of choice when it comes to non-compensation aspects of the job. This issue will be more
thoroughly address in Chapters 3 and 4.
Specialty Pays
Specialty pays vary by law enforcement agency; however, the WSP provides one of the broadest
ranges of specialty pay of the comparison agencies. Table 21 below provides a summary of the
areas and level of specialty pay by local benchmark agency. Currently, approximately 22 percent
of FOB Troopers receive at least one specialty pay.

Chapter 2 Trooper Compensation 59
Table 21: Washington Local Law Enforcement Agencies Specialty Pays
Field
Training Officer
Bomb Technician
Canine Handler/ Trainer
Detective Motorcycle
Officer SWAT Team
WSP [1] 5.0% 5.0%
3% handler
5% trainer
3.0% 4.0% 3.0%
# of WSP Troopers receiving in FY2015 (out of 580 total FOB)
115 5 8 1 25 13
Kennewick 2.0% - 2.0% 2.0% - 2.0%
King County [2] Add'l 1x pay or
comp time 10.0% 10.0% 6.0% 3.0% -
Pasco [3] 3.0% - Add'l 10 hours pay
2.0% - 2.0%
Pierce County [4] 5.0% 3.0% 6.0% - $35.00/
pay cycle 3.0%
Seattle - - 3.0% 4.0% 3.0% 3.0%
Snohomish County 3.0% 3.0% - 3.0% - 3.0%
Spokane County 3.0% 6.0% 4.5% - - 3.0%
Tacoma [5] 5.0% 5.0% 5.0% - 5.0% 5.0%
Vancouver [6] 5.0% - - - - -
Yakima [7] 5.0% - 2.0% 3.0% 2.0% -
[1] Washington State Patrol: Field Training Officer pay only received for hours actually worked as a Field Training Officer. [2] King County: Field Training Officer pay only received for hours worked in an FTO capacity. [3] Pasco: Field Training Officer pay only received for hours worked in an FTO capacity. [4] Pierce County: Field Training Officer pay only received for hours worked in an FTO capacity.; canine officer premium is 6% of top-step deputy pay [5] Tacoma: Field Training Officer pay only received for hours worked in an FTO capacity. [6] Vancouver: Field Training Officer pay only received for hours worked in an FTO capacity.
[7] Yakima: Field Training Officer pay only received if officer performed FTO duties for more than a week out of a month
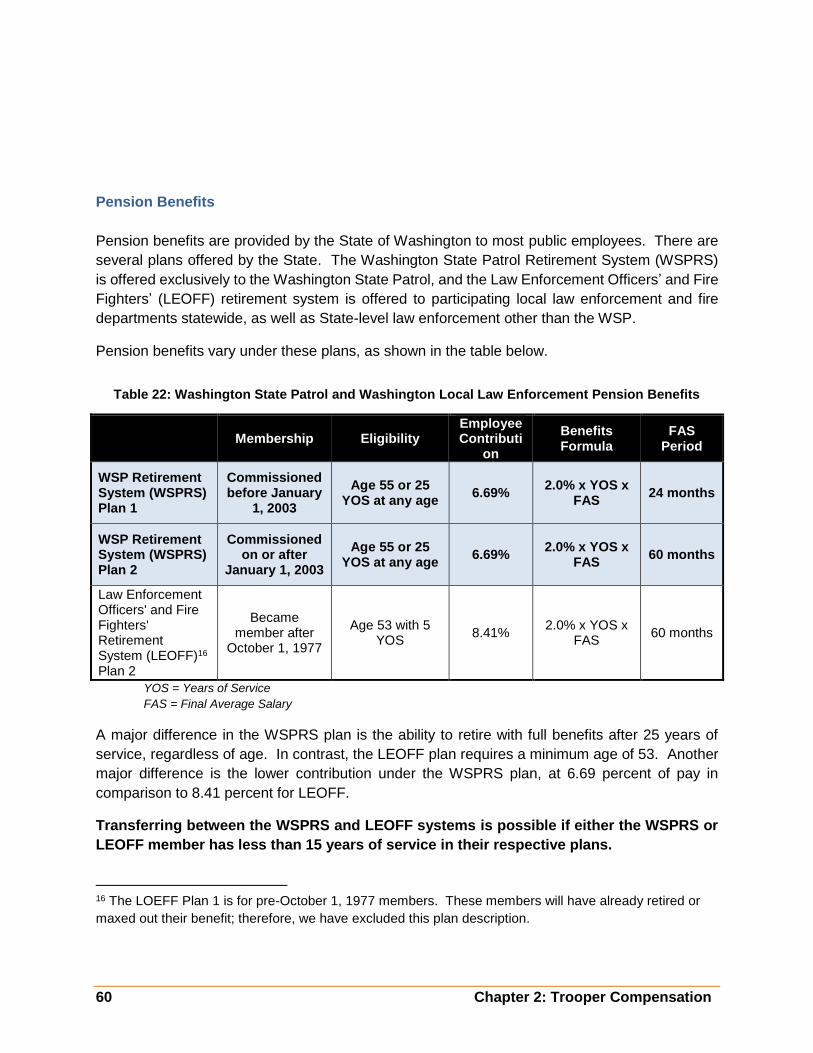
60 Chapter 2: Trooper Compensation
Pension Benefits
Pension benefits are provided by the State of Washington to most public employees. There are
several plans offered by the State. The Washington State Patrol Retirement System (WSPRS)
is offered exclusively to the Washington State Patrol, and the Law Enforcement Officers’ and Fire
Fighters’ (LEOFF) retirement system is offered to participating local law enforcement and fire
departments statewide, as well as State-level law enforcement other than the WSP.
Pension benefits vary under these plans, as shown in the table below.
Table 22: Washington State Patrol and Washington Local Law Enforcement Pension Benefits
Membership Eligibility
Employee Contributi
on
Benefits Formula
FAS Period
WSP Retirement System (WSPRS) Plan 1
Commissioned before January
1, 2003
Age 55 or 25 YOS at any age
6.69% 2.0% x YOS x
FAS 24 months
WSP Retirement System (WSPRS) Plan 2
Commissioned on or after
January 1, 2003
Age 55 or 25 YOS at any age
6.69% 2.0% x YOS x
FAS 60 months
Law Enforcement Officers' and Fire Fighters' Retirement System (LEOFF)16 Plan 2
Became member after
October 1, 1977
Age 53 with 5 YOS
8.41% 2.0% x YOS x
FAS 60 months
YOS = Years of Service
FAS = Final Average Salary
A major difference in the WSPRS plan is the ability to retire with full benefits after 25 years of
service, regardless of age. In contrast, the LEOFF plan requires a minimum age of 53. Another
major difference is the lower contribution under the WSPRS plan, at 6.69 percent of pay in
comparison to 8.41 percent for LEOFF.
Transferring between the WSPRS and LEOFF systems is possible if either the WSPRS or
LEOFF member has less than 15 years of service in their respective plans.
16 The LOEFF Plan 1 is for pre-October 1, 1977 members. These members will have already retired or
maxed out their benefit; therefore, we have excluded this plan description.

Chapter 2 Trooper Compensation 61
The LEOFF plan allows for full retirement at age 53 and an early retirement, with reduced benefits
at age 50 with 20 years of service. Employees leaving one system and joining another will receive
coordinated benefits from both systems upon retirement. Employees with more than 15 years of
service in either system are not eligible to receive benefits from both systems.
Health Benefits
The table below provides a summary of the percent of premium contributed by local police officers
and sheriffs in Washington. Based on this comparison, WSP Troopers contribute among the
highest percentages of premium toward health care coverage under both the highest-enrolled
HMO plan and PPO/POS plan offered to employees at each agency.
Table 23: Washington Law Enforcement Agencies Employee Percent of Premium for Health Insurance (New Hires)
Effective 12/31/2015 Highest-Enrolled HMO Highest-Enrolled PPO/POS
Individual Family Individual Family
Washington State Patrol [1] 15.0% 15.0% 15.0% 15.0%
Kennewick [2] 24.1% 9.3% 19.0% 7.5%
King County [3] 0.0% 0.0% 0.0% 0.0%
Pasco 12.0% 12.0% 12.0% 12.0%
Pierce County 6.6% 6.6% 6.6% 6.6%
Seattle 20.0% 20.0% 5.0% 5.0%
Snohomish County 0.0% 0.0% 2.1% 9.2%
Spokane County 5.0% 10.0% 5.0% 10.0%
Tacoma [4] - - 2.9% 5.7%
Vancouver 0.0% 6.7% 0.0% 6.6%
Yakima [5] - - 0.0% 8.5%
Median (excluding WSP) 5.8% 8.0% 3.9% 7.1%
WSP Rank 3 of 9 2 of 9 2 of 11 1 of 11
[1] WSP: The State of Washington assesses a surcharge of $50/month if an employee’s spouse of registered domestic partner enrolled on their State health care coverage do not elect to enroll in their employer-based group medical insurance that is comparable to the State’s Uniform Medical Plan Classic.
[2] Kennewick: Employees pay flat dollar amount towards medical coverage [3] King County: Spouses are assessed a $75 benefit access fee if they have access to coverage through another source but opt in to County coverage
[4] Tacoma: Police employees pay a flat $40 for employee only coverage and $80 for employee and dependent coverage regardless of plan choice
[5] Yakima: Percentage reflects percentage of top step patrol officer base wage. Employee only premiums paid for by the City under LEOFF
Leave
A significant non-cash benefit provided by law enforcement agencies is leave time. Typically,
agencies have a combination of vacation time and personal leave or floating holidays. Table 24
below provides an overview of combined leave times at various years of service for the WSP and
benchmark local agencies. Based on this comparison, the WSP ranks at the bottom of leave

62 Chapter 2: Trooper Compensation
allowances throughout a Trooper’s career. The difference between the WSP and median leave
amounts for benchmark local agencies increases substantially at 10 years of service and beyond,
as leave for WSP Troopers and Sergeants reaches maximum accrual at this point. All local
benchmark agencies have a higher maximum accrual amount than WSP.
Table 24: Washington Local Law Enforcement Agencies Vacation and Personal Leave Hours
Entry 5 YOS 10 YOS 15 YOS 20 YOS 25 YOS
WSP 104 128 144 184 184 184
Kennewick 204 204 252 276 300 324
King County 112 112 144 176 208 248
Pasco 104 128 152 168 200 200
Pierce County 116 148 180 204 228 260
Seattle 112 136 144 160 176 216
Snohomish County 104 168 192 216 224 248
Spokane County 188 224 260 296 332 368
Tacoma 112 136 152 176 192 232
Vancouver 168 246 258 306 330 330
Yakima 11 112 176 200 208 216
Median (excl. WSP) 112 142 178 202 216 248
WSP Rank 8 of 11 8 of 11 9 of 11 7 of 11 10 of 11 11 of 11
Note: Detailed annual leave information for each agency is provided in Appendix F
Sick, civil, educational, and parental, disability, bereavement (taken from accrued leave banks),
and military leave are also offered by WSP and benchmark local agencies. The usage of these
types of leave is more variable and only occurs when needed, so these leaves are not considered
in this analysis.
Take-Home Vehicles
Take-home vehicles are often provided to law enforcement officers to assist in fulfilling certain job
duties, and also provide a form of additional compensation. WSP Field Force Troopers must live
within 15 miles of the boundary of their assigned geographic area in order to be issued a take-
home vehicle, which is a more generous benefit than other agencies that limit the issuance of
take-home vehicles to upper ranks. With the exception of Kennewick and Tacoma (from which
information regarding take-home vehicles could not be obtained), all local law enforcement
agencies provide take-home vehicles to some rank-and-file officers. In most cases, however,
there are significant restrictions (residence, special assignment, etc.) that limit the number of
officers who may receive a vehicle.

Chapter 2 Trooper Compensation 63
Table 25: Washington Local Law Enforcement Agencies Take-Home Vehicles
Take-Home Vehicles Offered to Rank-and-File
Officers
Eligibility/Restrictions
Washington State Patrol
FOB Troopers must live within 15 miles of the boundary of their assigned geographic area in order to be issued a take-home vehicle. Non-FOB troopers and all Sergeants must live within 45 miles of their assigned duty station.
Kennewick - Must be command staff or detective sergeant
King County
Must reside within King County, the Sheriff may approve take-home vehicles for employees residing in Pierce and Snohomish Counties.
Pasco
Must be a detective, Area Resource Officer, School Resource Officer, Command Staff, SWAT member, or K9 Officer
Pierce County All commissioned staff receive take-home vehicles once they have completed field training
Seattle
Take-home vehicles are provided to all sworn officers at Captain rank or above. Rank-and-file officers in specific assignments (canine duty, DUI unit) are also eligible to receive take-home vehicles
Snohomish County
Deputies must live within Snohomish County (although waivers are granted to this requirement); all take-home vehicles are granted at the discretion of the Sheriff
Spokane County
Deputies must reside in Spokane County to be eligible for a take-home vehicle. Take-home vehicles are issued according to need.
Tacoma
All Officers are eligible to receive a take-home vehicle. Officers are assigned take-home vehicles (if available) during the 4 month training phase. If a vehicle is not available the Officer is placed on a waiting list and assigned the next available vehicle.
Vancouver
Rank-and-file officers in select specialty units are offered take-home vehicles. All supervisory ranks receive take-home vehicles
Yakima
All commissioned staff are eligible for take-home vehicles once off probation; must live within 10 miles of City limits

64 Chapter 2: Trooper Compensation
COMPARISON TO OTHER STATE LAW ENFORCEMENT AGENCIES
As part of this study, data was collected from other state patrol agencies to benchmark against
WSP. These benchmark agencies were selected because of their geographic location as well as
providing a comparison of practices, experience, and methods of recruitment and retention that
provide helpful context for the report.
These agencies generally are not direct competitors with WSP, and operate in labor markets that
may have very distinct wage pressures, costs of living, and other contextual factors. Accordingly,
the absolute dollar value of compensation provided across such out-of-state agencies may be
less relevant to the WSP from a recruitment and retention perspective than the type of pay
practices used – particularly with regard to recruitment and retention factors (i.e., incentives,
structure of the pay progression, benefits design). Even though these agencies have similar pay
practices as the WSP and operate in similar competitive local law enforcement markets in their
states, they do not (as shown in Chapter 1) have the same high quit rates as the WSP.
With that caveat, the WSP compares well overall with other state patrol agencies in terms of pay,
specialty pay offerings, pensions, and health benefits.
Base Compensation
Washington State Patrol base pay is generally in line with that of other statewide law
enforcement agencies. While the WSP has a below-median starting salary, by five years of
service, a Trooper makes above median pay of these benchmark agencies when considering
maximum base pay and longevity (if provided).
Table 26: State Law Enforcement Agencies Base Salary + Longevity
(effective 6/30/2016)
Minimum Base Maximum Base Maximum Base
+ Longevity
Washington State Patrol $51,480 $68,904 $75,324
Arizona Highway Patrol $45,620 $63,913 $63,913
California Highway Patrol $74,700 $108,324 $116,990
Colorado State Patrol $61,716 $89,040 $89,040
Idaho State Police $40,518 $72,363 $72,363
Michigan State Police $45,815 $68,386 $69,426
Minnesota State Patrol $52,158 $68,841 $68,841
Nevada Highway Patrol - - -
New York State Police $66,905 $84,739 $100,739
Ohio Highway Patrol $44,762 $56,930 $61,406
Oregon State Police $54,000 $72,360 $72,360
Pennsylvania State Police $63,002 $76,326 $97,697
Median (excluding WSP) $53,079 $72,362 $72,362
WSP Variance from Median (3.0%) (4.8%) 4.1%
WSP Rank 7 of 11 7 of 11 5 of 11
Specialty Pays

Chapter 2 Trooper Compensation 65
The WSP provides a broader range of specialty pays than agencies in other states surveyed.
Table 27: State Law Enforcement Agencies Specialty Pays
Field
Training Officer
Bomb Technician
Canine Handler
/ Trainer
Detective Motorcycle Officer
SWAT Team
Washington State Patrol [1] 5.0% 5.0%
3.0% handle
r 5.0%
trainer
3.0% 4.0% 3.0%
Arizona Highway Patrol - - - - - -
California Highway Patrol [1] 5.0% - - - 4.0% -
Colorado State Patrol
Idaho State Police
Michigan State Police [2] - 5.0% - - -
Minnesota State Patrol 6.0% - - - -
Nevada Highway Patrol
New York State Police - - - - - -
Ohio Highway Patrol [3]
$800/ 60 day training period
-
8 hours of comp time/2 weeks
- - -
Oregon State Police 5.0% 10.0% - - -
Pennsylvania State Police - - - - - -
[1] WSP and California Highway Patrol: Field Training Officer pay only granted for days when Field Training Officer duties are actually performed. WSP officers also receive 1 hour per day of paid time for care of their assigned service animal. [2] Michigan State Police: Dog handlers are granted an additional 42 minutes of compensation each day and 8 hours of compensatory leave per pay period. Compensatory leave is to be used for care of animal. WSP dog handlers receive an hour per day of “kennel care.”
[3] Ohio Highway Patrol: Compensatory leave is to be used for care of animal.

66 Chapter 2: Trooper Compensation
Pension Benefits
Retirement benefits vary widely from state to state, as shown in Table 28. Only the New York
State Police and the Ohio Highway Patrol pension systems also offer the opportunity to retire at
a specific number of years of service regardless of age, like WSPRS. Further, WSPRS has one
of the lower employee contribution levels, but also has a comparatively moderate benefit.
Table 28: State Law Enforcement Agencies Pension Benefits (Tier Available for Current Hires)
Eligibility
Employee Contribution
Benefits Formula FAS
Period
Washington State Patrol Age 55 or 25 YOS at
any age 6.69% 2.0% x YOS x FAS 60 months
Arizona Highway Patrol Age 52.5 with 25 YOS 11.65%
25+ YOS: 2.5% x FAS x YOS (1-32 years)
For each year of service under 25, subtract 4% from the
maximum allowable benefit (62.5%)
60 months
California Highway Patrol Age 50 and 5 YOS 11.50%
Age 50-56: 2.0% x YOS x FAS, increasing 0.1% for each year of
age up to maximum of: 2.7% x YOS x FAS at age 57
36 months
Colorado State Patrol
Any age with 30 YOS Age 50 with 25 YOS Age 55 with 20 YOS Age 65 with any YOS
10.00% 2.5% x YOS x FAS 12 months
Idaho State Police Age 60 and 5 YOS 8.36% 2.3% x YOS x FAS 42 months
Michigan State Police Age 55 with 25 YOS Age 60 with 10 YOS
4.00%
2.0% x YOS x FAS (1-25 YOS) 2.0% (declining 0.4% per
additional YOS) x YOS x FAS (26+)
60 months
Minnesota State Patrol Age 55 with 10 YOS 13.40% 3.0% x YOS x FAS 60 months
Nevada Highway Patrol
Age 65 with 5 YOS Age 60 with 10 YOS Age 50 with 20 YOS 30 YOS at any age
19.00% 2.5% x YOS x FAS 36 months
New York State Police 20 YOS at any age Age 63 with 10 YOS
Ranges from 3% (<$45K)
to 6% (>$100K)
2.5% x YOS x FAS (1-20 YOS) 1.66% x YOS x FAS (20-32
YOS) 60 months
Ohio Highway Patrol
Age 52 with 20 YOS Age 48 with 25 YOS Mandatory retirement at age 60 or 20 YOS, whichever occurs later
12.50%
2.5% x YOS x FAS (1-19 YOS) 2.25% x YOS x FAS (20-24
YOS) 2.0% x YOS x FAS (25+ YOS)
60 months
Oregon State Police [1] Age 53 with 25 YOS
Age 60 0.00% 1.8% x YOS x FAS 36 months
Pennsylvania State Police [2] Age 55 with 3 YOS
Any age if age + YOS (min of 35) > 92
6.25%
Less than 20 YOS: 2.0% x 1.0 x YOS x FAS
20-24 YOS: 50% of the highest year's earnings (20-24 YOS) 25+ YOS: 75% of the highest
year's earnings
36 months
[1] Oregon State Police: Members contribute nothing toward the pension portion of their retirement; however they contribute 6.0% to a 401(k)-style program. [2] Pennsylvania State Police: Contribution rate can increase based on investment rate of return.

Chapter 2 Trooper Compensation 67
Health Benefits
The WSP is consistent with most other State Patrol agencies in both provision of plans and
required employee funding of plans, hovering right around the median for employee contributions
toward family coverage in both HMO and PPO plans. For single coverage, WSP employee
contribution requirements are in the mainstream, but somewhat above the benchmark state
agency median.
Table 29: Employee Contribution Requirements as a Percent of Premium (New Hires) Effective 12/31/2015
Highest-Enrolled HMO Highest-Enrolled PPO/POS
Individual Family Individual Family
Washington State Patrol [1] 15.0% 15.0% 15.0% 15.0%
Arizona Highway Patrol 6.8% 13.6% 17.3% 20.1%
California Highway Patrol 12.0% 14.9% 10.3% 11.1%
Colorado State Patrol 16.1% 33.7% 22.5% 31.0%
Idaho State Police 6.0% 18.1% 4.9% 15.8%
Michigan State Police - - 20.0% 20.0%
Minnesota State Patrol 5.0% 15.0% - -
Nevada Highway Patrol 22.0% 33.5% 7.0% 17.5%
New York State Police 10.0% 16.0% 10.0% 16.0%
Ohio Highway Patrol - - 15.0% 15.0%
Oregon State Police [2] 5.0% 5.0% 3.0% 3.0%
Pennsylvania State Police 0.0% 0.0% 0.0% 0.0%
Median (excl. WSP) 6.8% 15.0% 10.1% 15.9%
WSP Rank 3 of 10 5 of 10 4 of 11 7 of 11
[1] WSP: The State of Washington assesses a surcharge of $50/month if an employee’s spouse of registered domestic partner enrolled on their State health care coverage do not elect to enroll in their employer-based group medical insurance that is comparable to the State’s Uniform Medical Plan Classic.
[2] Oregon State Police: For Plan Year 2015, employees pay 3% toward coverage if they elect the lowest cost plan in their area and 5% if they select any other plan. HMO contribution rates above reflect a State Police employee's cost if they resided in Portland in 2015, in which the Kaiser HMO plan was not the lowest cost. The PPO plan was the lowest cost in the area.

68 Chapter 2: Trooper Compensation
Take-Home Vehicles
Take-home vehicles are commonly provided to officers at State Patrol agencies as the geographic
areas covered by Troopers are often large and at times remote. With the exception of the three
states for which information on take-home vehicles could not be readily obtained, all other
comparable state law enforcement agencies surveyed reported providing take-home cars to all
or some Troopers and officers.
Table 30: Benchmark State Law Enforcement Agencies Take-Home Vehicles
Take-Home
Vehicles Offered
Eligibility/Restrictions
Washington State Patrol
FOB Troopers issued a vehicle must live within 15 miles of the boundary of their assigned geographic area. Non-FOB troopers and all Sergeants must live within 45 miles of their assigned duty station.
Arizona Highway Patrol All sworn Troopers receive take-home vehicles
California Highway Patrol
Take-home vehicles are granted based on the needs of the department. Commanders with take-home cars cannot live more than 70 miles from their assigned headquarters and non-commanders cannot live more than 50 miles from their assigned headquarters.
Colorado State Patrol
Take-home vehicles are provided to on-duty Troopers. When off-duty, vehicles remain at assigned office. Some rural troopers are granted the ability to take home their vehicle every day.
Idaho State Police Take-home vehicles are provided to all patrol officers.
Michigan State Police -
Minnesota State Patrol All sworn members receive take-home vehicles
Nevada Highway Patrol Data not available
New York State Police Data not available
Ohio Highway Patrol Troopers must live within 35.5 mile radius of assignment to receive a take-home vehicle
Oregon State Police - -
Pennsylvania State Police
Troopers and corporals assigned to certain specialized duties are granted a take-home vehicle. Ranks of Lieutenant through Colonel, members of the Special Emergency Response Team, and Sergeants who are station commanders also receive take-home vehicles.

Chapter 2 Trooper Compensation 69
CONCLUSION
Compensation provided to Troopers – both in terms of direct cash compensation and benefits –
is not competitive with the local law enforcement agencies to which separated Troopers are
going. While WSP Trooper compensation is in line with compensation at other statewide law
enforcement agencies, WSP is not losing Troopers to these agencies. Chapter 3 will take a more
detailed look at how the WSP compensation package affects retention.
The next two chapters explore the issues and opportunities with retention and recruitment and
make recommendations for the WSP to improve its experience in both of these areas.
70 Chapter 3: Issues Affecting Retention of State Troopers
Chapter 3: Issues Affecting Retention of State Troopers
INTRODUCTION
As outlined in Chapter 1 (Field Force Evaluation and Vacancy Projection), attrition issues within
the WSP broadly fall into two groups: 1) retirement from the WSP after 25 or more years of
service, and 2) resignation from the WSP prior to becoming retirement eligible. Most voluntary
resignations occur before 10 years of service. This chapter defines and explores current retention
issues at WSP, identifies the primary reasons for the increased attrition rates, and recommends
ways to improve retention through targeted, cost-effective strategies.
Overview
This chapter focuses on the ability of the WSP to retain both early- and mid-career Troopers, and
to keep retirement-eligible Troopers on the payroll past retirement-eligibility.
The WSP Field Force has seen increasing attrition rates in recent years, with a sharp spike in
voluntary resignations in 2015. In particular, resignations of Field Force Troopers going to other
local law enforcement agencies have increased at an alarming rate: there were just two in 2010
but 25 in 2015 (as of October 31, 2015). Additionally, through October 31st, 18 Troopers have
retired (with 49 retiring across all ranks). In total, 100 Troopers resigned and 142 retired between
2010 and October 31, 2015. Retirements of any commissioned staff member generally leads to
a vacancy in the Trooper ranks, because WSP promotes from within.
Through surveys of current and separated Troopers, along with survey and benchmarking data
from other law enforcement agencies, this chapter focuses on the motivations that impact
decisions to stay with or leave the WSP.
RETENTION EXPERIENCE AND EXPECTATIONS
As shown in the vacancy projection Chapter 1, retention of current Troopers is an issue that could
significantly affect the ability of the WSP to fulfill its primary mission over the next several years.
There are four general reasons why Troopers leave the WSP:
Retirements
Resignations by Troopers leaving for other law
enforcement agencies
Resignations by Troopers leaving law enforcement
Separations for individual reasons including termination for
cause, disability, or death
Over the last two years, the WSP has experienced increasing
attrition due to resignations of early and mid-career Troopers, especially to local law enforcement
agencies. Until 2015, this attrition was not significantly out of line with experience between 2004
Keeping Troopers who
are retirement-eligible
is important to
maintaining an effective
Field Force while
replacement Troopers
are being trained.
Chapter 3: Issues Affecting Retention of State Troopers 71
and 2006, a timeframe with economic growth similar to today. However, the 2015 rate of
resignations is higher than could be predicted by historical trends. This by itself is concerning;
still, it is important to determine the extent to which this could be an ongoing pattern or whether it
is more the result of increased opportunities in local law enforcement subject to economic ebbs
and flows.
Additionally, a retirement bubble is expected to move through the WSP over the next few years,
as more than a third of the Field Force becomes eligible to retire. Keeping Troopers who are
retirement-eligible is important to maintaining an effective Field Force while replacement Troopers
are being trained.
Turnover and Quit Rates
Through October 31, 2015, the WSP experienced a general 2015 turnover rate of 9 percent
among Field Force Troopers – already well above prior years with two months yet to go.
Historically, this general turnover rate has been driven primarily by normal service retirements. In
recent years however, voluntary resignations have become the primary driver of increases in the
turnover rate, with the majority of Troopers who resigned leaving for other law enforcement
agencies. This has increased both turnover and quit rates for the WSP, with the turnover rate
doubling in the last 5 years and quit rates rising over 400 percent during that same period. The
turnover rate is calculated by dividing the total number of separated Troopers, regardless of their
reason for leaving, by the total count of Troopers at the beginning of the year. The quit rate is
calculated by dividing the total numbers of Troopers who resigned by the total count of Troopers
at the beginning of the year.

72 Chapter 3: Issues Affecting Retention of State Troopers
Table 31: Washington State Patrol Field Force Trooper Attrition, 2010-10/31/2015
2010 2011 2012 2013 2014 2015
Total Separated Employees (Troopers) 19 21 21 33 32 54
Normal Service Retirement 8 13 12 18 13 18
Terminated for Cause/Disciplinary 0 0 0 2 2 0
Deceased 2 0 1 1 0 1
Resigned 7 6 4 6 6 10
Resigned for other law enforcement employment 2 2 4 6 11 25
Other 0 0 0 0 0 0
Turnover Rate 2.8% 3.2% 3.1% 4.8% 5.3% 9.0%
Quit Rate17 1.3% 1.2% 1.2% 1.8% 2.8% 5.8%
Quit Rate for Other Law Enforcement Employment
0.3% 0.3% 0.6% 0.9% 1.8% 4.2%
JOLTS State and Local Government Turnover Rate
16.1% 16.1% 16.3% 16.1% 16.4% 14.6%
JOLTS State and Local Government Quit Rate 6.0% 6.7% 7.4% 7.5% 8.1% 7.1%
Note: 2015 JOLTS data as of September 2015
According to the Bureau of Labor Statistics Job Openings and Labor Turnover Survey (JOLTS)18,
the WSP has trended well below total turnover and quit rates for state and local governments
nationally. Law enforcement turnover and quit rates typically trend below general government
turnover and quit rates.
Movement to Other Law Enforcement Agencies. As shown in Table 29, the majority (69
percent) of voluntary resignations in 2014 and so far in 2015 are from Troopers who went to other
law enforcement agencies. Of the 50 Troopers who left for other law enforcement agencies from
2010 through October 31, 2015, nearly 64 percent went to an agency less than one hour from
their WSP assignment location at the time of separation. A detailed listing of the receiving
agencies of Troopers who resigned for other law enforcement employment is provided in
Appendix E.
Comparison of WSP Quit Rates to Other State Patrol Agencies
Quit rates for the state patrol agencies included the benchmarking survey show trends similar to
the WSP during the period of 2010 to 2013, as shown in Figure 16, although WSP’s quit rates
are among the highest. The WSP starts to see separation from benchmark agencies in 2014,
with the 2015 quit rate well above the experience of other state patrol agencies. The WSP trend
17 The “quit rate” is the ratio of Troopers who resigned from the agency divided by the total Troopers in the Field Force at the beginning of that calendar year. 18 JOLTS data is collected monthly by the BLS from private and public sector establishments across the
United States. Data is collected on a voluntary basis, and the state and local data shown is not specific to law enforcement, which tends to experience less turnover than general government positions. In addition, JOLTS data includes temporary and seasonal workers, who also tend to experience higher turnover rates

Chapter 3: Issues Affecting Retention of State Troopers 73
is an anomaly: agencies in other states face similar challenges with changes in the economy and
competition from other local law enforcement agencies, yet have kept quit rates at steady levels.
Attrition by Tenure
Figure 8 shows the breakdown of reasons for separation by years of service at time of separation
from 2010 through October 31, 2015. Among Troopers with 20 or more years of service,
retirement is the primary reason for leaving the agency, as Troopers are able to retire with 25
years of service under WSPRS.
0.0%
1.0%
2.0%
3.0%
4.0%
5.0%
6.0%
7.0%
2010 2011 2012 2013 2014 2015
Figure 16: Comparative Quit RatesAmong State Patrol Agencies
WSP Arizona California Ohio
Michigan Minnesota Pennsylvania
WSP
0
10
20
30
40
50
60
70
80
90
0-5 years 6-10 years 11-15 years 16-20 years 20+ years
Figure 8: Field Force Trooper Attrition by Tenure and Reason(1/1/2010-10/31/2015)
Resigned Retired Other
Note: “Other” includes deaths and dismissals.

74 Chapter 3: Issues Affecting Retention of State Troopers
As discussed in the Chapter 1, the primary reason for separation of Troopers with less than 10
years of service (early- and mid-career) is voluntary resignation, with a large number of separating
Troopers resigning before achieving five years of service (Figure 17).
Of the 44 Field Force Troopers who left WSP before five YOS between 2010 and October 31,
2015, 29 left to take jobs with other law enforcement agencies.
Mapping this attrition, both where Troopers are leaving from and where they are going, provides
some insight into how retention issues vary by geographic region. Figure 18 shows the district
assignment at time of resignation for Troopers who left for other law enforcement employment
within the State. Figure 19 shows where these Troopers went within the confines of the WSP
districts. As shown in the maps, Troopers who resign for other law enforcement employment
generally stay in the area near where they were assigned prior to separation.
These maps show that much of the movement between the WSP and local law enforcement
agencies is happening on the west side of the State in the populated corridor covered by Districts
1, 2, 5, and 7. Also, separating Troopers assigned to those Districts with geographic pay (Districts
1, 2, and 7) still tended to move to local law enforcement within those districts, despite
supplemental WSP compensation. A similar pattern is seen in District 5.
0
2
4
6
8
10
12
14
16
<1 YOS 1-2 YOS 2-3 YOS 3-4 YOS 4-5 YOS
Figure 17: WSP Field Force TroopersSeparations by Year of Service Under 5 YOS
Other Reasons for Separation Other Law Enforcement Employment
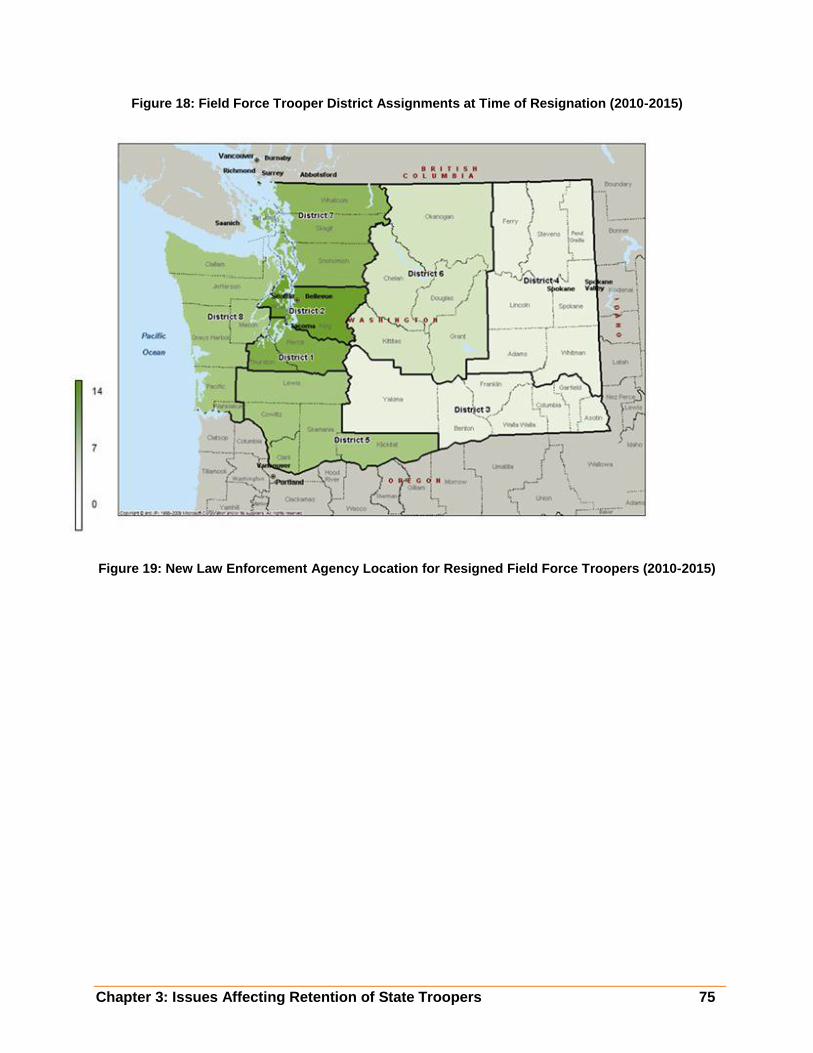
Chapter 3: Issues Affecting Retention of State Troopers 75
Figure 18: Field Force Trooper District Assignments at Time of Resignation (2010-2015)
Figure 19: New Law Enforcement Agency Location for Resigned Field Force Troopers (2010-2015)

76 Chapter 3: Issues Affecting Retention of State Troopers
This
movement is shown in tabular form on the next page (Table 30). Highlighted cells indicate higher
movement of Troopers. Cells highlighted more darkly indicate where 4 or more Troopers have
resigned (actual numbers include in parentheses). For example, seven Troopers left District 1 for
local law enforcement agencies in District 1.
This movement may be associated with higher compensation among local law enforcement
agencies in these districts, as well as the larger number of local agencies and positions in these
more highly populated regions. Table 32 also shows the movement of Troopers who resigned for
other law enforcement employment between districts, as well as the difference (in percentage
terms) between the total direct cash compensation at 5 years of service at benchmarked local law
enforcement agencies in that WSP district and WSP total direct cash compensation, including
geographic pay. Because many Troopers leave at 5 years of service or beyond, this point of
tenure was used to compare pay with other jurisdictions.
The variances show the earning potential at local enforcement agencies within that District.
Variances take into account any geographic pay offered by WSP in that District. For example:
Seven Troopers from District 1 (Thurston and Pierce Counties) took jobs with local law
enforcement agencies in District 1, where total direct cash compensation is 6.5 percent
(Pierce County Sheriff’s Office) to 13.3 percent higher (Tacoma Police Department) higher
at local benchmarked agencies
Seven Troopers from District 2 (King County) took jobs with local law enforcement
agencies located in that District, where total direct cash compensation is 14.4 percent
(King County Sheriff’s Office) to 14.9 percent higher (Seattle Police Department) at local
benchmarked agencies
Chapter 3: Issues Affecting Retention of State Troopers 77
Six Troopers left District 5 in southwest Washington and took jobs with local law
enforcement agencies located in that District, where pay at 5 years of service is nearly
12% higher than at WSP.
Four Troopers left District 7 (Snohomish, Skagit and Whatcom) and took jobs with local
law enforcement agencies in that District, which pay nearly 4% more at just 5 years of
service.
Geographic pay is factored into the total compensation for Districts 1, 2, and 7. The WSP paid a
total of $822,000 in geographic pay to FOB Troopers and Sergeants in 2015 ($1.3 million across
all bureaus). Troopers stationed in these Districts only receive geographic pay if they are
specifically assigned to the counties for which geographic pay is provided.

78 Chapter 3: Issues Affecting Retention of State Troopers
Table 32: Movement of Resigned Troopers Between WSP Districts with Compensation Variance
District Leaving
From
WSP Pay @ 5
YOS
District of New Law Enforcement Employer (Percent Variance from WSP Total Direct Cash Compensation at 5 YOS for Select
Agencies in Each District)
D1 D2 D3 D4 D5 D6 D7 D8
D1 $74,634
incl 3% geo pay
Tacoma: 13.3%
Pierce Co: 6.5% (7)
Seattle 20.2%
King Co: 19.8%
(3)
D2 $79,602
incl 10% geo pay
Tacoma: 7.5%
Pierce Co: 0.2% (1)
Seattle 14.9%
King Co: 14.4%
(7)
Kennewick: 12.2%
Yakima: 9.0%
Pasco: 3.3% (1)
Snohomish Co: 0.8%
(2)
D3 $72,505
Kennewick: 20.1%
Yakima: 17.1% Pasco: 11.9%
(1)
D4 $72,505
D5 $72,505 Vancouver:
11.5% (6)
D6 $72,505
Spokane Co:
-6.1% (2)
No comparable jurisdictions
(1)
D7 $76,053
incl 5% geo pay
Seattle 18.7%
King Co: 18.2%
(1)
Snohomish
Co: 3.7% (4)
D8 $72,505
Seattle 22.5%
King Co: 22.1%
(2)
Vancouver:
11.5% (1)
Snohomish Co: 8.2%
(1)
No comparable jurisdictions
(1)
Legend Note: Numbers in parentheses indicate actual attrition from District; numbers do not include 8 Troopers who left for out-of-state agencies and 1 Trooper who took a position in federal law enforcement (location unknown) 4-7 separations
1-3 separations
0 separations
Growing numbers of Troopers have resigned for law enforcement agencies with significantly
higher pay than WSP. As previously noted, Districts 1, 2, 5, and 7 have seen the largest number
of resignations. The pay disparities between WSP and agencies in these Districts are shown in
more detail in Figure 20.

Chapter 3: Issues Affecting Retention of State Troopers 79
Even when factoring in geographic pay in Districts 1, 2, and 7, pay disparities between WSP and
local law enforcement agencies range from 3.7 percent in Snohomish County to 14.9 percent in
Seattle. The additional earning opportunity at local agencies in these Districts likely serves as
strong motivation to leave WSP. Additionally, overall employee job satisfaction, discussed later,
can contribute to how pay differences drive attrition. Dissatisfied employees require a lower pay
increase to leave for another agency than do satisfied employees.
It is also important to consider that three of these four Districts (1, 2, and 7) are the most populous
both in terms of WSP Troopers assigned to these locations and the number of local law
enforcement agencies. Therefore, there are not only more Troopers in these areas for the WSP
to lose to other law enforcement agencies, but also more agencies to move to for Troopers
considering leaving the WSP.
Leaving Law Enforcement. All respondents to the survey of separated Troopers have taken
other positions within law enforcement. The project team did not receive survey data from
Troopers who left for employment outside of law enforcement. Based on data separately
collected by the WSP for separated Field Force Troopers, nearly half left due to medical,
disciplinary, or other reasons. The remainder left for a combination of:
Family (6)
Career Change (7)
$72,5
05
$72,5
05
$72,5
05
$74,6
34
$79,6
02
$72,5
05
$76,0
53
$79,7
92
$93,0
25
$81,9
58
$78,9
91
$80,8
17
$93,5
59
$0
$20,000
$40,000
$60,000
$80,000
$100,000
District 1 District 2 District 5 District 7
Figure 20: WSP Pay v. Comparable Agencies(Districts Where Resigning Troopers Are Going)
WSP WSP w/ geo pay
Pie
rce C
ou
nty
Sheriff
Tacom
a P
D
Seattle
PD
Kin
g C
ounty
Sheriff
Vanco
uver P
D
Sno
hom
ish C
ounty
Sh
eriff

80 Chapter 3: Issues Affecting Retention of State Troopers
Relocation (2)
Of current Troopers who plan to leave WSP, 26 percent indicated they intend to leave law
enforcement altogether. In general, it will likely be more difficult to improve retention of officers
leaving for personal reasons than those leaving for better compensation and/or as a result of job
dissatisfaction.
Expected Near-Term Attrition
Retirements. As outlined in the Chapter 1, a retirement bubble is projected as significant
numbers of Troopers hired in the 1990s are reaching eligibility for retirement, as shown in Figure
12 on page 41. Reaching retirement eligibility provides Troopers with an option to leave the WSP
and pursue other work while collecting a pension. Whether or not
individuals choose to exercise this option will hinge largely on the same
issues that motivate an early- and mid-career Trooper to leave the force
for other law enforcement agencies – financial considerations and/or
opportunity for greater job and personal satisfaction.
Extending a career beyond retirement eligibility tenure is one key for the
WSP to maintain a strong workforce.
Resignations. A key survey question asked of the current Troopers was “I expect to stay in the
Washington State Patrol for my entire law enforcement career (yes/no).” Of the 486 responses,
107, or 27.2 percent responded “no,” 8.5 percent indicated they have not thought about it, and
64.3 percent responded “yes.” For those who responded “‘no,” they were asked when they
planned to leave, and if they planned to leave law enforcement altogether or leave for another
law enforcement agency. The answers are represented in Figure 21 below for those who
responded that they plan to leave for another law enforcement agency.
(33)
(50)
(24)
0.0%
10.0%
20.0%
30.0%
40.0%
50.0%
60.0%
Next year Next Two Years After Two Years
Figure 21: Survey Results107 Current Troopers Plan to Leave for Other Law Enforcment
Agencies
Extending a career
beyond retirement
eligibility tenure is
one key for the WSP
to maintain a strong
workforce.

Chapter 3: Issues Affecting Retention of State Troopers 81
The age range for those planning to leave is weighted toward Troopers under 40 years of age: 87
of the 107 are age 40 or younger. If the percentage of Troopers planning on leaving is
representative of the entire Trooper population, this could mean WSP will lose 175 Troopers
under age 40 in the next two years.
This survey data provides an indication that attrition of Troopers through resignations and
retirement will continue at a concerning rate unless changes can be made to the underlying factors
motivating a Trooper’s desire to stay. The potential attrition of Troopers over the next two years
is alarming, and could reach over 200 if the survey trend holds across the entire Trooper
workforce.
DRIVERS OF ATTRITION
WSP Troopers are leaving the agency due to both external and internal factors. External factors
provide the opportunity to leave while internal factors provide the motivation. These factors
impact Troopers leaving in early- to mid-career as well as those facing retirement. There is also
evidence from survey comments that more Troopers would be resigning to take law enforcement
jobs elsewhere except for the fact they have too many years in at WSP. They are not yet eligible
to retire, but have too many years in to quit. The result indicates morale problems among even
those Troopers remaining at WSP.
External Factors
A primary external driver is the economy. As the economy has improved, outside employment
opportunities have increased. This has been the case among other Washington law enforcement
agencies, as hiring of new law enforcement recruits has tripled in recent years. At the same time,
pay in these agencies has exceeded that for the WSP, creating both opportunity and financial
30 orunder
31-40 41-50 > 50
Plan to leave 33 54 34 4
Stay for Career 63 102 136 43
0
20
40
60
80
100
120
140
160
180
No
. R
esp
on
din
g
Age Grouping
Figure 22: Troopers Who Plan to Leave WSP by Age
Note: Data only shown for survey respondents providing an age; 13 respondents did not provide an age.

82 Chapter 3: Issues Affecting Retention of State Troopers
benefit for Troopers to move to a different law enforcement agency. One local Washington
agency cited lateral hires as their most effective recruiting strategy over the last few years.
Opportunities at Other Local Agencies
Trooper dissatisfaction with compensation and/or working conditions may drive the desire to leave
the WSP, but increased hiring among local law enforcement agencies creates those opportunities
to leave.
As detailed in the Chapter 1, improving economic conditions have provided local governments
with additional funds for public safety. As a result, local agencies have returned to hiring, and
some have been seeking to “catch up” from prior recession-era periods of reduced recruitment
activity.
At the Criminal Justice Training Commission (CJTC), which trains recruits for positions in
Washington local law enforcement, the total number of recruits has increased from 153 in 2010
to 364 in 2015. As Figure 9 on page 37 shows, local agencies have also increased the number
of lateral hires to fill vacancies. The acceptance of larger numbers of lateral hires means that
there are additional opportunities for trained Troopers to join local agencies (Troopers hired by
local law enforcement agencies do not need to attend the CJTC training). WSP Troopers
comprised 24 of the 48 officers hired laterally by other agencies statewide in 2015.
Figure 14 on page 43 shows that local agencies plan to continue hiring at higher levels than
previous years in 2015 and 2016. However, reported hiring expectations drop markedly in 2017,
perhaps indicating the end of a hiring bubble. At the same time, a consistent level of LEOFF
retirements will sustain ongoing hiring levels at local law enforcement agencies.
Internal Factors
Opportunities at other agencies alone do not motivate a Trooper to resign. Based on the
separated Trooper surveys, the project team identified three primary factors affecting job
satisfaction that have led to Troopers leaving for another law enforcement agency –
compensation, workload, and working conditions. All three factors showed up strongly in the
surveys, but working conditions and workload were the most prominent. Compensation was last.

Chapter 3: Issues Affecting Retention of State Troopers 83
Factors Affecting Job Satisfaction
In the survey of separated Troopers who left for other law enforcement agencies, the project team
sought to understand the primary motivations for leaving the WSP,
and then to identify if those same underlying issues also reside in
the current workforce using the survey of current Troopers. Based
on our findings, current Troopers express very similar levels of job
dissatisfaction as separated Troopers across most categories.
This means the current level of dissatisfaction among current
Troopers may well lead to ongoing attrition problems at the WSP.
Overall, the opinions expressed in the survey paint a picture of an organization that has a
significant number of employees who are dissatisfied with current working conditions and pay.
Major themes that emerged from the surveys are identified below and show the percentage of
respondents who indicated that these are issues affecting their job satisfaction now and/or could
become a reason for separating from service.
Table 33: Employee Dissatisfaction Among Current and Separated Troopers
Major Themes Current Troopers Separated Troopers
Dissatisfaction with Management and General Working Conditions/Workload
90% 100%
Dissatisfaction with Pay/Benefits 90% 78%/70%
Not Feeling Valued 46% 80%
Would NOT encourage people to join the WSP 64% 79%
Of note for separated Troopers, unhappiness with management and working conditions ranked
higher than pay as a reason for leaving the WSP. Not feeling valued was also a strong motivator
Job Satisfaction
Compensation
Working Conditions
Workload
The surveys paint a
picture of an
organization with many
employees dissatisfied
with working conditions
and pay.
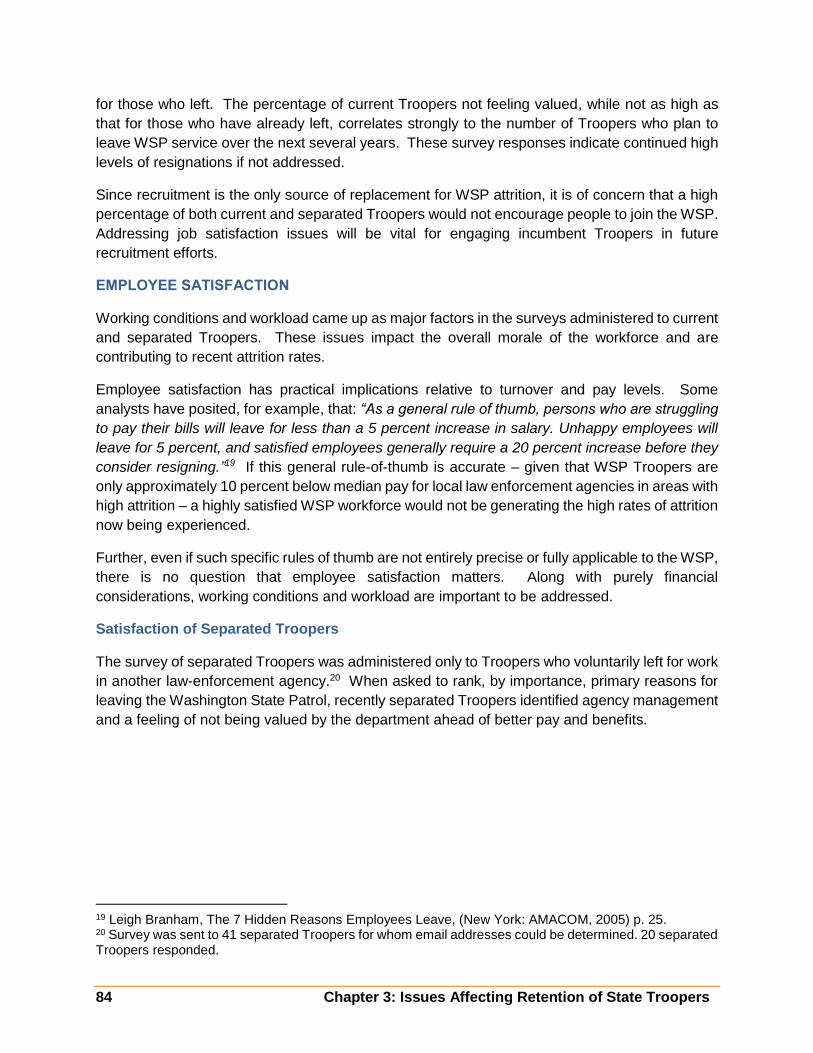
84 Chapter 3: Issues Affecting Retention of State Troopers
for those who left. The percentage of current Troopers not feeling valued, while not as high as
that for those who have already left, correlates strongly to the number of Troopers who plan to
leave WSP service over the next several years. These survey responses indicate continued high
levels of resignations if not addressed.
Since recruitment is the only source of replacement for WSP attrition, it is of concern that a high
percentage of both current and separated Troopers would not encourage people to join the WSP.
Addressing job satisfaction issues will be vital for engaging incumbent Troopers in future
recruitment efforts.
EMPLOYEE SATISFACTION
Working conditions and workload came up as major factors in the surveys administered to current
and separated Troopers. These issues impact the overall morale of the workforce and are
contributing to recent attrition rates.
Employee satisfaction has practical implications relative to turnover and pay levels. Some
analysts have posited, for example, that: “As a general rule of thumb, persons who are struggling
to pay their bills will leave for less than a 5 percent increase in salary. Unhappy employees will
leave for 5 percent, and satisfied employees generally require a 20 percent increase before they
consider resigning.”19 If this general rule-of-thumb is accurate – given that WSP Troopers are
only approximately 10 percent below median pay for local law enforcement agencies in areas with
high attrition – a highly satisfied WSP workforce would not be generating the high rates of attrition
now being experienced.
Further, even if such specific rules of thumb are not entirely precise or fully applicable to the WSP,
there is no question that employee satisfaction matters. Along with purely financial
considerations, working conditions and workload are important to be addressed.
Satisfaction of Separated Troopers
The survey of separated Troopers was administered only to Troopers who voluntarily left for work
in another law-enforcement agency.20 When asked to rank, by importance, primary reasons for
leaving the Washington State Patrol, recently separated Troopers identified agency management
and a feeling of not being valued by the department ahead of better pay and benefits.
19 Leigh Branham, The 7 Hidden Reasons Employees Leave, (New York: AMACOM, 2005) p. 25. 20 Survey was sent to 41 separated Troopers for whom email addresses could be determined. 20 separated Troopers responded.
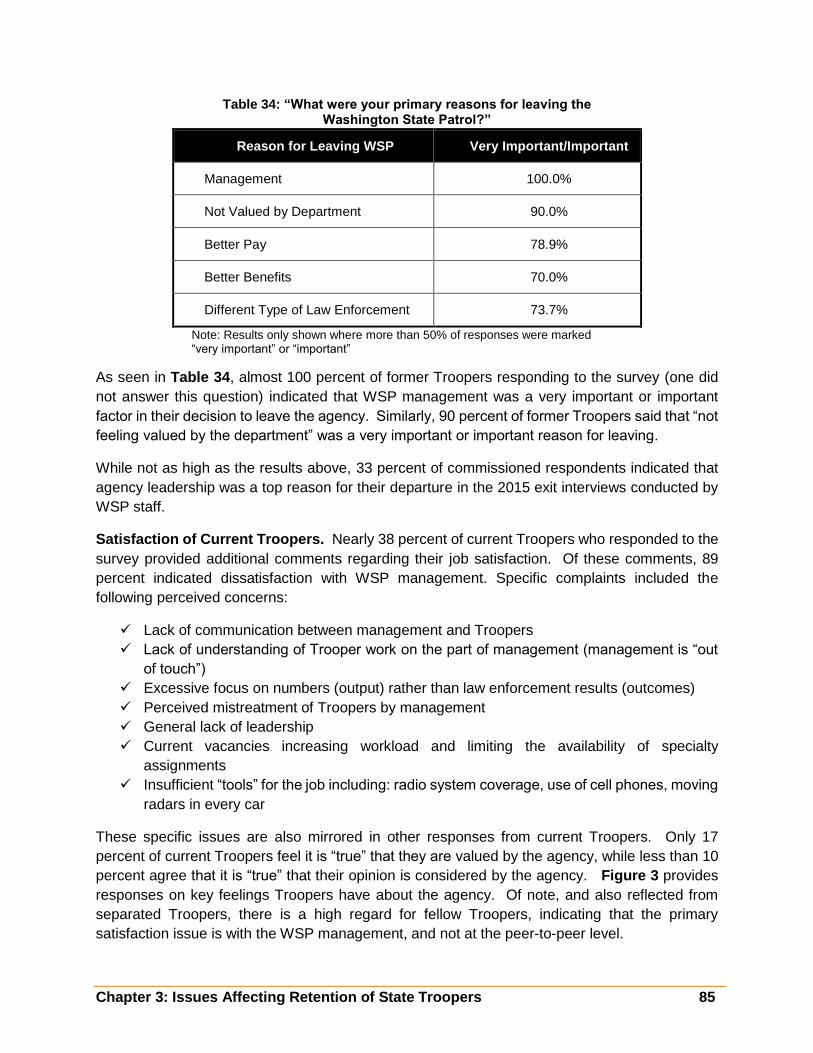
Chapter 3: Issues Affecting Retention of State Troopers 85
Table 34: “What were your primary reasons for leaving the Washington State Patrol?”
Reason for Leaving WSP Very Important/Important
Management 100.0%
Not Valued by Department 90.0%
Better Pay 78.9%
Better Benefits 70.0%
Different Type of Law Enforcement 73.7%
Note: Results only shown where more than 50% of responses were marked “very important” or “important”
As seen in Table 34, almost 100 percent of former Troopers responding to the survey (one did
not answer this question) indicated that WSP management was a very important or important
factor in their decision to leave the agency. Similarly, 90 percent of former Troopers said that “not
feeling valued by the department” was a very important or important reason for leaving.
While not as high as the results above, 33 percent of commissioned respondents indicated that
agency leadership was a top reason for their departure in the 2015 exit interviews conducted by
WSP staff.
Satisfaction of Current Troopers. Nearly 38 percent of current Troopers who responded to the
survey provided additional comments regarding their job satisfaction. Of these comments, 89
percent indicated dissatisfaction with WSP management. Specific complaints included the
following perceived concerns:
Lack of communication between management and Troopers
Lack of understanding of Trooper work on the part of management (management is “out
of touch”)
Excessive focus on numbers (output) rather than law enforcement results (outcomes)
Perceived mistreatment of Troopers by management
General lack of leadership
Current vacancies increasing workload and limiting the availability of specialty
assignments
Insufficient “tools” for the job including: radio system coverage, use of cell phones, moving
radars in every car
These specific issues are also mirrored in other responses from current Troopers. Only 17
percent of current Troopers feel it is “true” that they are valued by the agency, while less than 10
percent agree that it is “true” that their opinion is considered by the agency. Figure 3 provides
responses on key feelings Troopers have about the agency. Of note, and also reflected from
separated Troopers, there is a high regard for fellow Troopers, indicating that the primary
satisfaction issue is with the WSP management, and not at the peer-to-peer level.

86 Chapter 3: Issues Affecting Retention of State Troopers
Trooper work goals – output vs. outcome. Through both direct interviews and comments
provided in the surveys, many Troopers expressed the view that the current system of goal setting
used by the WSP is counterproductive and damages employee morale. The system currently
sets specific targets by District for tickets and stops across six primary areas: driving under the
influence (DUI), speeding, aggressive driving, suspended driver arrests, seatbelt use, and use of
a cell phone.
There is the perception that these goals have remained constant even as Trooper staffing levels
have fallen due to increasing vacancy rates. There is also a belief that this focus on output (e.g.,
tickets and arrests) is inappropriately used as a proxy for outcomes (e.g., reducing traffic deaths
or injury accidents). Some representative comments include:
The Patrol “is so numbers driven it has lost touch with what we are really to do.”
“The Patrol is a numbers based agency, which I understand, however it has gotten to the
point that I start my shift stressed out because I don't think I will get in the right number
of stops for the right reasons.”
We are a numbers driven agency that focuses on data rather than actual results.
This perceived focus has the effect of creating a distance between the Troopers and
management, contributing to overall morale issues within the WSP.
Schedule and Shift Determination. The WSP schedule calls for nearly all FOB Troopers to
rotate between night shift and day shift, and to rotate days off every 28 or 56 days, as shown in
Table 35 below. This mandatory rotation generally moves existing detachment staffing without
consideration of vacancies, workload impacts, or volume of calls for service. Additionally, the
standard work week, by collective bargaining agreement language, is five eight-hour days.
9.9% 17.3% 21.8%
77.5%
32.6%37.0%
54.9%
20.5%
57.5%45.7%
23.3%
2.1%
0.0%
20.0%
40.0%
60.0%
80.0%
100.0%
120.0%
When I have anopinion it is taken
into account by myagency
I am valued by myagency
I am getting theright tools
I am respected bymy coworkers
Figure 3: "As a Trooper, I feel as though..."
True Somewhat True Not True

Chapter 3: Issues Affecting Retention of State Troopers 87
Alternative shifts are allowed in some Districts under provisions outlined in the CBA with the
WSPTA, and most District offices have instituted four ten-hour day schedules.
Table 35: WSP Field Force Shift Rotation Schedule
Detachment
56 Day Rotation 56 Day Rotation
Cycle 1 (28 days)
Cycle 2 (28 days)
Cycle 3 (28 days)
Cycle 4 (28 days)
A Day Shift Tue-Fri
Day Shift Fri-Mon
Night Tue-Fri
Night Shift Fri-Mon
B Night Shift
Tue-Fri Night Shift
Fri-Mon Day Shift Tue-Fri
Day Shift Fri-Mon
C Day Shift Fri-Mon
Day Shift Tue-Fri
Night Shift Fri-Mon
Night Shift Tue-Fri
D Night Shift
Fri-Mon Night Shift
Tue-Fri Day Shift Fri-Mon
Day Shift Tue-Fri
Many current Troopers indicated that the current WSP work schedule and the way shifts are
determined are points of concern. This rotation is viewed to negatively affect Trooper sleep
patterns and to make it difficult to plan for family obligations and the schedules of working
spouses. This issue has also surfaced in several recent exit interviews with Troopers leaving for
other law-enforcement agencies. Most Troopers indicated that they would like to move to a shift
bidding schedule, in line with other local law enforcement agencies (Table 36).
Respondents indicated that they would prefer a 10-hour shift with four days on and three days off
(“4/10” schedule) with a fixed shift and days off schedule. Of the local agencies benchmarked,
only two – King and Pierce County Sheriff’s Offices – have a 4/10 schedule. While most other
benchmarked agencies have a longer shift than WSP, most have schedules that require officers
to work five days straight before receiving days off.
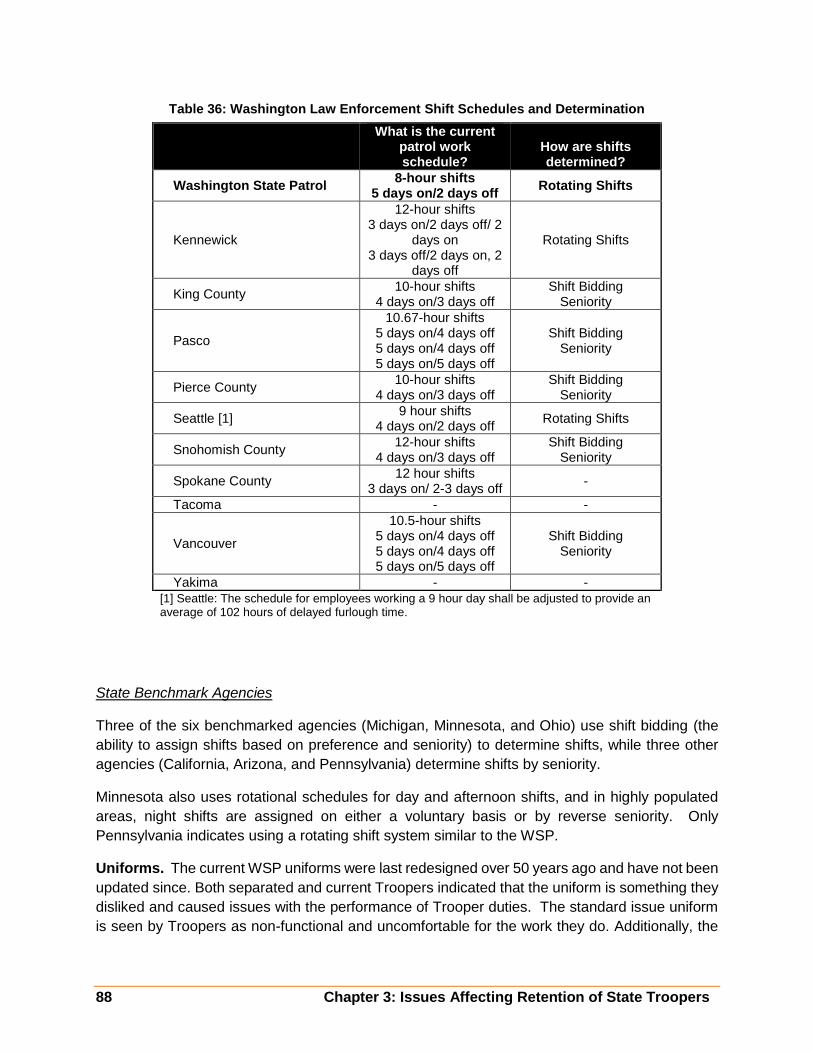
88 Chapter 3: Issues Affecting Retention of State Troopers
Table 36: Washington Law Enforcement Shift Schedules and Determination
What is the current
patrol work schedule?
How are shifts determined?
Washington State Patrol 8-hour shifts
5 days on/2 days off Rotating Shifts
Kennewick
12-hour shifts 3 days on/2 days off/ 2
days on 3 days off/2 days on, 2
days off
Rotating Shifts
King County 10-hour shifts
4 days on/3 days off Shift Bidding
Seniority
Pasco
10.67-hour shifts 5 days on/4 days off 5 days on/4 days off 5 days on/5 days off
Shift Bidding Seniority
Pierce County 10-hour shifts
4 days on/3 days off Shift Bidding
Seniority
Seattle [1] 9 hour shifts
4 days on/2 days off Rotating Shifts
Snohomish County 12-hour shifts
4 days on/3 days off Shift Bidding
Seniority
Spokane County 12 hour shifts
3 days on/ 2-3 days off -
Tacoma - -
Vancouver
10.5-hour shifts 5 days on/4 days off 5 days on/4 days off 5 days on/5 days off
Shift Bidding Seniority
Yakima - -
[1] Seattle: The schedule for employees working a 9 hour day shall be adjusted to provide an average of 102 hours of delayed furlough time.
State Benchmark Agencies
Three of the six benchmarked agencies (Michigan, Minnesota, and Ohio) use shift bidding (the
ability to assign shifts based on preference and seniority) to determine shifts, while three other
agencies (California, Arizona, and Pennsylvania) determine shifts by seniority.
Minnesota also uses rotational schedules for day and afternoon shifts, and in highly populated
areas, night shifts are assigned on either a voluntary basis or by reverse seniority. Only
Pennsylvania indicates using a rotating shift system similar to the WSP.
Uniforms. The current WSP uniforms were last redesigned over 50 years ago and have not been
updated since. Both separated and current Troopers indicated that the uniform is something they
disliked and caused issues with the performance of Trooper duties. The standard issue uniform
is seen by Troopers as non-functional and uncomfortable for the work they do. Additionally, the
Chapter 3: Issues Affecting Retention of State Troopers 89
wool uniform is difficult to maintain. Current Troopers indicated that they would prefer a
modernized uniform with an external vest.
To the extent that the uniform is out of touch with modern standards and tastes, it can also hinder
recruitment efforts in terms of being attractive to potential applicants.
Findings and Recommendations
Finding #1: A majority of the Troopers and Sergeants surveyed indicated management and
morale issues within the WSP. These perceptions have led to job dissatisfaction and have
magnified pay issues.
Recommendation 1.1 The State should commission an organizational assessment to identify
specific management strategies and recommendations that will improve overall engagement with
line staff.
Cost: The cost of an organization study will vary based on scope, but should be in the range of
$75,000 to $150,000. Analysis and surveys from this JTC study should help to defray the cost of
a future analysis more directly focused on improving Trooper engagement.
Implementation Hurdles: Funds needs to be appropriated by the Legislature. The study will work
best if WSP management actively works with the study consultant to implement changes.
Finding #2: Both separated and current Trooper surveys indicate a perceived disconnect from
the realities of day-to-day field operations on the part of some supervisors and upper
management. This disconnect appears to be contributing to the recent resignations of Troopers
for other law enforcement agencies.
Recommendation 2.1 The WSP executive staff should work with its Human Resource Division
and/or the State Human Resources Division within the Office of Financial Management to conduct
performance evaluations,21 of all management staff with the rank of Lieutenant and above. This
should include 360 degree reviews. The results of these evaluations should be used to identify
opportunities to improve management performance.
Cost: The cost of performing evaluations and 360 degree reviews should be minimal; however,
such an undertaking can be time consuming and will create an expectation of change within the
agency.
Implementation Hurdles: The WSP executive leadership must be willing to undertake and act on
this type of performance evaluation.
Finding #3: A focus on outputs with FOB Troopers (e.g., specific goals for traffic stops) as a
measure of Trooper performance is contributing to a disconnect between Troopers and
management, as well as a perception that management does not understand the difficulties of
the Field Force Trooper job.
21 A 360 degree review solicits feedback from the manager, subordinates, superiors, and peers.

90 Chapter 3: Issues Affecting Retention of State Troopers
Recommendation 3.1 Performance metrics provide important feedback, and their active use
should be continued, but refined. As this occurs, and as specific measures are reevaluated, the
WSP executive team should reinforce the focus of Trooper work activity around improving public
safety outcomes (e.g., reduced traffic fatalities) rather than focusing on specific enforcement
outputs (e.g. issuing tickets).
Cost: No identified cost.
Implementation Hurdles: Must be embraced by WSP executive staff.
Finding #4: Survey responses of current Troopers identified a significant concern regarding the
suitability of the current uniform design for field work. Advances in the characteristics and
performance of law enforcement uniforms have changed over time, but the WSP uniforms have
not been updated since they were designed prior to the 1960s. The WSP is now reviewing options
for modern wash-and-wear fabrics, and is planning a more comprehensive review of uniforms in
the near future.
Recommendation 4.1 The WSP should engage commissioned employees across all ranks to
review uniform options and recommend changes to style and fabric for executive management
consideration. Engagement of Troopers in this evaluation can begin to address the
communication problems identified in the survey responses of current Troopers.
Cost: Moving to new uniforms will have a one-time cost of approximately $1.67 million to replace
all components for the current 1,005 commissioned staff who wear a uniform (approximately
$1,660 per employee).
Implementation Hurdles: The WSP executive team is currently reviewing uniform options.
Funding will need to be appropriated by the Legislature.
Finding #5: The WSP Field Force schedule calls for rotating between night shift and day shift
every 28 to 56 days. Alternative shifts are allowed in some Districts under provisions outlined in
the collective bargaining agreement (CBA) with the WSPTA. Troopers do not gain more control
over their schedule with greater seniority, and the current practice of shift rotation does not take
into consideration staffing requirements based on call volume or other measures of workload
activity.
Recommendation 5.1 WSP management should encourage the development of experimental
shifts - designed by detachment personnel - to create more stability in and Trooper control over
choosing their schedules.22 Experimental shifts might include an annual shift bid by seniority with
fixed shifts and days off. This could potentially help to reduce fatigue and improve work week
efficiencies of a 4-10 schedule.23 This type of schedule may not fit all Districts, and remote areas
22 In accordance with section 12.11 of the collective bargaining agreement 23 Amendola, Karen L, David Weisburd, Edwin E. Hamilton, Greg Jones, and Meghan Slipka. The Shift Length Experiment: What we Know About 8-,10- and 12-Hour Shifts in Policing. The Police Foundation, 2011. Available at www.policefoundation.org

Chapter 3: Issues Affecting Retention of State Troopers 91
of the State may require alternative schedules. Most local and state benchmark agencies use
shift-bid schedules.
Cost: Different schedules could result in more or less overtime depending on how they are
implemented. No cost is projected at this time.
Implementation Hurdles: Requires support from WSP management at HQ, Districts and
Detachments (group of Troopers assigned to a specific geographic location within a District).
COMPENSATION
Among separated Troopers, compensation was also cited as a key reason for leaving the WSP.
Nearly 79 percent of separated Troopers indicated that better pay was “very important” or
“important” in their decision to leave the WSP.
This dissatisfaction with pay is also reflected in the results from WSP exit interviews conducted
January through August 2015. Of the 27 commissioned officers who were interviewed, 41 percent
indicated that their salary was a reason for their departure. Similarly, 63 percent indicated that
their salary was one of the top five things they liked least about working for WSP.
As detailed in Chapter 1, WSP does indeed lag other local law enforcement agencies in terms of
total direct cash compensation, inclusive of base salary, longevity pay, shift differential pay,
holiday pay, and other allowances such as for uniforms. In fact, the WSP ranks last among the
10 jurisdictions surveyed at 25 years of service. While the WSP offers additional opportunities
for cash compensation such as overtime, specialty pays, educational incentive pay, and
geographic assignment pay, the WSP still consistently ranks at or near the bottom of the
comparison group when such pays are included in compensation.
Comparative total direct cash compensation among local law enforcement agencies in WSP
Districts where Troopers are leaving in large numbers (Districts 1, 2, and 7) ranges from 3.9
percent (Snohomish County) to 17.3 percent (Seattle) above WSP pay, inclusive of geographic
pays provided to Troopers in those areas.24
Furthermore, current Troopers indicate even greater dissatisfaction with pay than separated
Troopers. Nearly 90 percent of incumbent Troopers indicated that they are “not very satisfied” or
“completely unsatisfied” with their pay in relation to other law enforcement agencies (Figure 23).
24 Compared to WSP total direct cash compensation at 5 YOS
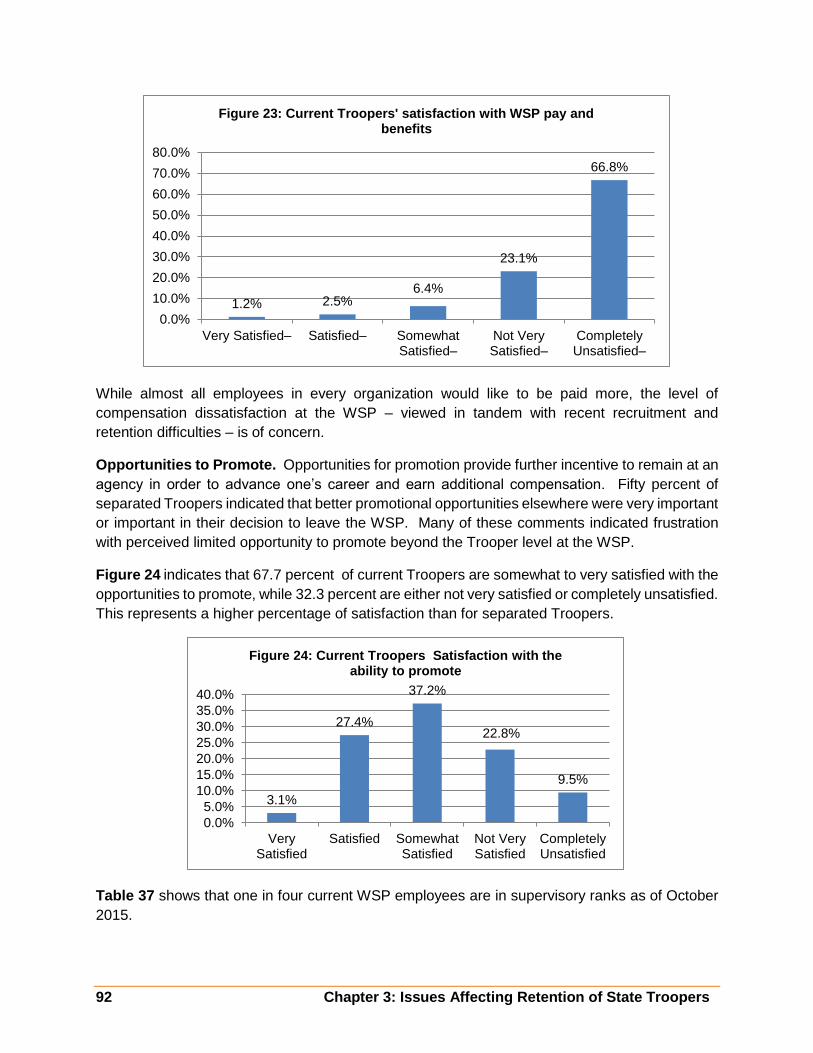
92 Chapter 3: Issues Affecting Retention of State Troopers
While almost all employees in every organization would like to be paid more, the level of
compensation dissatisfaction at the WSP – viewed in tandem with recent recruitment and
retention difficulties – is of concern.
Opportunities to Promote. Opportunities for promotion provide further incentive to remain at an
agency in order to advance one’s career and earn additional compensation. Fifty percent of
separated Troopers indicated that better promotional opportunities elsewhere were very important
or important in their decision to leave the WSP. Many of these comments indicated frustration
with perceived limited opportunity to promote beyond the Trooper level at the WSP.
Figure 24 indicates that 67.7 percent of current Troopers are somewhat to very satisfied with the
opportunities to promote, while 32.3 percent are either not very satisfied or completely unsatisfied.
This represents a higher percentage of satisfaction than for separated Troopers.
Table 37 shows that one in four current WSP employees are in supervisory ranks as of October
2015.
1.2% 2.5%6.4%
23.1%
66.8%
0.0%
10.0%
20.0%
30.0%
40.0%
50.0%
60.0%
70.0%
80.0%
Very Satisfied– Satisfied– Somewhat Satisfied–
Not Very Satisfied–
Completely Unsatisfied–
Figure 23: Current Troopers' satisfaction with WSP pay and benefits
3.1%
27.4%
37.2%
22.8%
9.5%
0.0%
5.0%
10.0%
15.0%
20.0%
25.0%
30.0%
35.0%
40.0%
VerySatisfied
Satisfied SomewhatSatisfied
Not VerySatisfied
CompletelyUnsatisfied
Figure 24: Current Troopers Satisfaction with the ability to promote

Chapter 3: Issues Affecting Retention of State Troopers 93
The promotion process used by the WSP is codified in the current collective bargaining
agreement. Greater weight is given to a 3-part personal assessment (detailed below)over the
written examination. When preparing a list of applicants eligible for promotion to Sergeant, WSP
management considers the following elements, weighted as indicated in parentheses:
Assessment Center – rapid fire questions (one minute responses), meeting with
subordinates with question and answer period, and a presentation on a directed topic
(65%)
Written Examination (15%)
Promotional Evaluations (12%)
Education (5%)
Seniority (3%)
The top seventy Troopers emerging from this process are deemed eligible for a Sergeant position
and are put on a list of promotion-eligible employees that is maintained for two years. WSP
reports 35 to 55 Troopers are promoted to Sergeant every two years.
If on a promotional list, WSP policy allows a Trooper to turn down a promotion that will cause him
or her to move, and retain his/her position on the promotional list. However, in actuality if a
Trooper does not want to move from a District location for a promotion, there is uncertainty about
whether or not a future promotional opportunity will materialize.
Promotions always create “winners” and “losers” and it is virtually impossible to avoid generating
some dissatisfaction. Two-thirds of the survey respondents are satisfied with the promotion
process, one-third is not. Of that one-third, seventeen provided comments regarding promotional
opportunities. Representative comments were:
“I have to move to promote”
“Promotional test procedures are a joke, no peer evaluations is ridiculous!”
Table 37: Supervisory Rank Headcount (as of 10/31/2015)
Rank Count
Sergeant 146
Lieutenant 41
Captain 21
Assistant Chief 2
Deputy Chief 1
Total Supervisory Employees 211

94 Chapter 3: Issues Affecting Retention of State Troopers
“I do not like the way WSP promotes. Seem [sic] like we weigh a lot of the promotion on
the written test and not the personality of the to be Sergeants.”
Overall, reported concerns regarding the promotions process covered a range of issues – from
perceived favoritism to moving – with no single issue emerging as a systemic problem.
Availability of Specialty Assignments. The ability to obtain a specialty assignment (detective,
SWAT, bomb squad, canine handler)25 provides Troopers with the ability to pursue variety in their
work, as well as additional compensation that might incentivize remaining with the agency.
Ninety-five percent of Troopers indicated that the ability to do a variety of specialty jobs was the
aspect of their position that they liked the most.
Current Troopers were split on the availability of specialty assignments, with about 39.5 percent
indicating that they were not very satisfied or completely unsatisfied with assignment availability
and 51.5 percent being somewhat to very satisfied (Figure 25). Comments indicate that staffing
shortfalls and the ability to hold a specialty assignment for an unlimited period of time limits the
ability of many Troopers to hold a specialty assignment.
Specific comments regarding the availability of specialty assignments included:
“The fact that command staff (Lt and above) believe specialty sergeant positions
should be on the west side of the state. They are missing out on great east side
troopers/sergeants!!!”
“Specialty positions (detectives) should not be allowed to hold a position for more than
5 years.”
“The ability to move around within the agency as far as different positions besides a
Trooper working the road. Due to the staffing shortfalls, many specialty positions such
as detectives which is one of the main reasons I joined the patrol, are going unfilled
due to the needs of the road.”
25 More detail regarding specialty pay can be found in the Chapter 2 (Trooper Compensation)

Chapter 3: Issues Affecting Retention of State Troopers 95
Among FOB Troopers who left the WSP from 2010 to 201526, only 27 held specialty assignments
at the time of separation (Table 38). The majority of these Troopers had 20 or more years of
service and 18 retired from WSP. That means more than 75 percent of Troopers who left for
other law enforcement agencies did not receive any specialty pay. Receiving such pay reduces
the difference in compensation between the WSP and other law enforcement agencies and can
be a deterrent to leaving the agency.
Table 38: Field Force Trooper Specialty Assignments at Separation by Tenure 2010-10/312015
Count Percent Total
0-5 YOS 1 3.7%
6-10 YOS 3 11.1%
11-15 YOS 4 14.8%
16-20 YOS 2 7.4%
20+ YOS 17 63.0%
Total 27 100.0%
Overall, specialty and certification pays are not a large part of the FOB-Trooper pay package, at
0.5 percent of overall base pay (Table 39). In fact these pays are more prominent in other WSP
Bureaus using Troopers. While the opportunity for these pays is present, the reality for the Field
Force Troopers of receiving these pays is limited. Pay for shift differential, geographic pay, and
overtime are much larger factors in overall cash compensation.
26 Includes retirements, resignations, deaths, and other reasons for separation
54
121 119 117
75
0.0%
5.0%
10.0%
15.0%
20.0%
25.0%
30.0%
VerySatisfied
Satisfied SomewhatSatisfied
Not VerySatisfied
CompletelyUnsatisfied
Figure 25: Current Trooper "Satisfaction with the ability to engage in specialty assignments"

96 Chapter 3: Issues Affecting Retention of State Troopers
Voluntary Overtime in FAS. Mandatory overtime for WSPRS members is counted in final
average salary (FAS) for purposes of calculating pension benefits. Voluntary overtime – any
overtime for which a Trooper must put their name on a list or “raise their hand for”, including
outside overtime – is not added into the FAS calculation. LEOFF members do not have this same
limitation in calculating FAS.27
This difference in what is included in FAS between WSPRS and LEOFF members has been raised
as a concern by the Washington State Patrol Troopers Association (WSPTA) leadership and was
mentioned by eleven Troopers in survey comments. Adding voluntary overtime to FAS, however,
goes against the national trend in calculating FAS for pensions. The issue of voluntary overtime
in FAS is an economic concern for those nearing retirement, but did not show up as an important
factor related to retention of current Troopers. Additionally, adding voluntary overtime to FAS
would not likely impact how long a Trooper stayed in the WSP after becoming retirement-eligible,
as any additional FAS from voluntary overtime could be included prior to reaching 25 years of
service.
Findings and Recommendations28
Any new WSP compensation strategy will need to balance goals for compensation
competitiveness with financial affordability and sustainability considerations, and also reflect
important employee and management concerns exchanged at the bargaining table. In this
context, the concepts below illustrate how a range of ideas and approaches might be applied on
a comprehensive and coordinated basis to help address WSP recruitment and retention:
27 Washington State Department of Retirement Systems, Law Enforcement Officers’ and Fire Fighters’ Plan 2 Member Handbook, August 2015. 28 All matters of compensation are subject to negotiations with the WSPTA and must be determined to be affordable for the State by the Office of Financial Management (OFM). If the State and WSPTA cannot agree on compensation levels, they can become a matter of interest arbitration. The findings of the arbitrator are then taken into consideration by the legislature in making final compensation decisions. An arbitrator’s findings are not binding on the State (local law enforcement agencies are covered by binding arbitration, which generally results in higher compensation levels, as final compensation decisions are made by the arbitrator and not the governing body.
Table 39: Trooper Compensation by Type and Bureau (2015 Actuals)
Compensation Item FOB % of Base
Pay All Other Bureaus
% of Base Pay
Base Pay $40,854,249 -- $21,076,575 --
Shift Differential $822,047 2.0% $122,709 0.6%
Other Comp (FTO/Acting Pay) $357,289 0.9% $130,399 0.6%
Overtime $4,079,195 10.0% $2,599,298 12.3%
Geographic Pay $811,050 2.0% $494,283 2.3%
Educational Incentive Pay $527,052 1.3% $269,877 1.3%
Specialty and Certification Pays $191,735 0.5% $437,302 2.1%
TOTAL $47,642,616 16.6% $25,130,442 19.2%
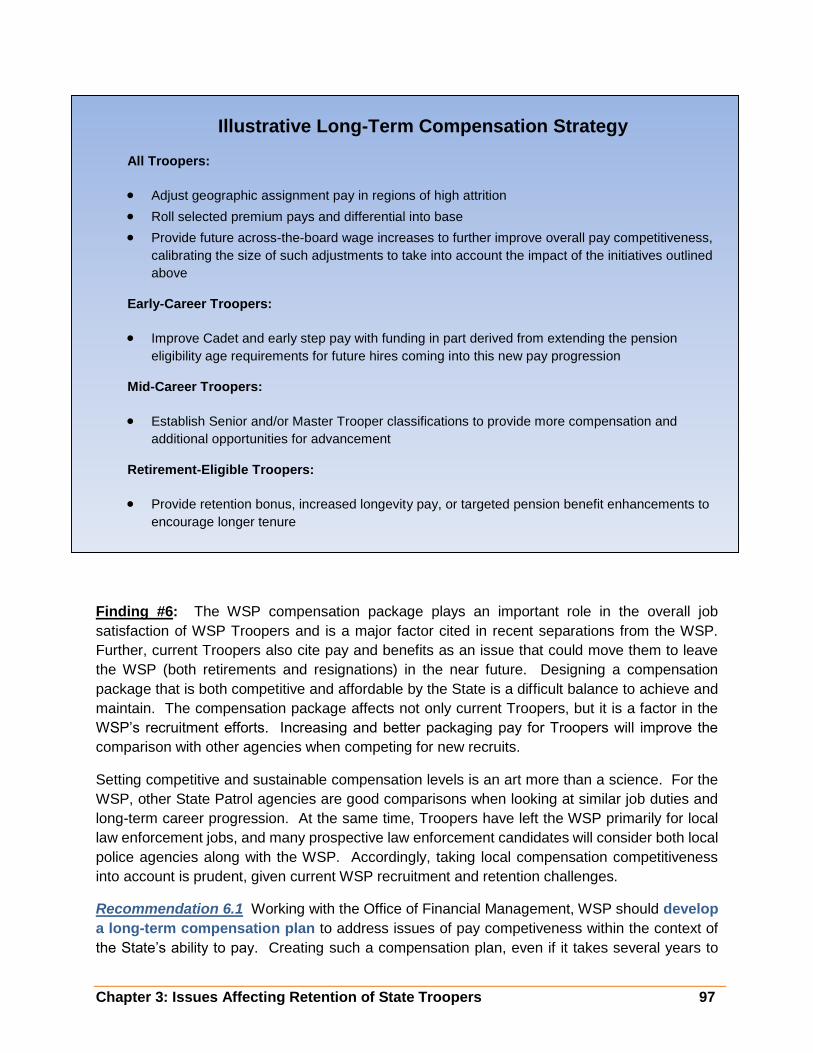
Chapter 3: Issues Affecting Retention of State Troopers 97
Finding #6: The WSP compensation package plays an important role in the overall job
satisfaction of WSP Troopers and is a major factor cited in recent separations from the WSP.
Further, current Troopers also cite pay and benefits as an issue that could move them to leave
the WSP (both retirements and resignations) in the near future. Designing a compensation
package that is both competitive and affordable by the State is a difficult balance to achieve and
maintain. The compensation package affects not only current Troopers, but it is a factor in the
WSP’s recruitment efforts. Increasing and better packaging pay for Troopers will improve the
comparison with other agencies when competing for new recruits.
Setting competitive and sustainable compensation levels is an art more than a science. For the
WSP, other State Patrol agencies are good comparisons when looking at similar job duties and
long-term career progression. At the same time, Troopers have left the WSP primarily for local
law enforcement jobs, and many prospective law enforcement candidates will consider both local
police agencies along with the WSP. Accordingly, taking local compensation competitiveness
into account is prudent, given current WSP recruitment and retention challenges.
Recommendation 6.1 Working with the Office of Financial Management, WSP should develop
a long-term compensation plan to address issues of pay competiveness within the context of
the State’s ability to pay. Creating such a compensation plan, even if it takes several years to
Illustrative Long-Term Compensation Strategy
All Troopers:
Adjust geographic assignment pay in regions of high attrition
Roll selected premium pays and differential into base
Provide future across-the-board wage increases to further improve overall pay competitiveness,
calibrating the size of such adjustments to take into account the impact of the initiatives outlined
above
Early-Career Troopers:
Improve Cadet and early step pay with funding in part derived from extending the pension
eligibility age requirements for future hires coming into this new pay progression
Mid-Career Troopers:
Establish Senior and/or Master Trooper classifications to provide more compensation and
additional opportunities for advancement
Retirement-Eligible Troopers:
Provide retention bonus, increased longevity pay, or targeted pension benefit enhancements to
encourage longer tenure

98 Chapter 3: Issues Affecting Retention of State Troopers
fully fund and achieve, can help to address existing dissatisfaction and concerns. While there will
be appropriate constraints on what can be included within such a longer-term compensation plan
(e.g., internal equity considerations across State agencies, the overall level of resources available
for the WSP, and the need to receive legislative approval for compensation increases), having a
plan will allow Troopers to know that they are moving in a competitive direction and can help to
initiate productive discussions on the compensation levels needed to sustain FOB Trooper levels.
Findings and recommendations #7 and 8 to follow provide specific ideas that could be included
in such a comprehensive compensation plan. Following these findings and recommendations is
a further illustration of how such ideas might be aggregated to create an overall competitive
compensation strategy.
Cost: Based on the total budgeted Trooper and Sergeant positions, each one percent pay
increase will cost approximately $925,000 per year on an ongoing basis inclusive of all pay
categories (including a 17% allowance for pension and other payroll costs). Increases at the
Trooper and Sergeant levels may cause compression issues at Lieutenant and above that if
addressed, would lead to additional costs.
Implementation Hurdles: Increasing compensation levels may require the State to identify new
funding for the WSP.
Finding #7: Some District offices have been losing more Troopers than others. This is due in
part to Troopers leaving for higher-paying law enforcement positions in or near those same
Districts. Currently, the WSP pays a 10 percent geographic differential to Troopers assigned to
an office in District 2 (King County), 5 percent in District 7 (Snohomish County) 3 percent in District
1 (Pierce County), and 7 percent at two remote outposts. Despite the increased pay, the WSP
continues losing Troopers in Districts 1, 2 and 7 at a high level. Additionally, recent attrition from
Districts 5 and 8 has also been high. Attrition from Districts on the eastern side of the state
(Districts 3, 4, and 6) is relatively low, both in terms of absolute number of separations and as a
percentage of total separations.
WSP is actually progressive when it comes to geographic pay. None of the six benchmarked state
patrol agencies provides geographic pay. Beyond this standard survey group, New York State
Police does provide geographic pay that ranges from an additional 3 to 5 percent of base pay,
similar to WSP’s pay for Pierce and Snohomish Counties, but far less than the 10 percent pay
provided to Troopers assigned to King County.
At the same time, Trooper base pay in King County with geographic pay factored in is still 16.8
percent to 17.2 percent below that of law enforcement agencies in that region, while WSP
compensation is less than 10 percent below comparable agencies (Pierce and Snohomish County
Deputy Sheriff’s Offices). District 5 Troopers are nearly 13 percent below Vancouver Police
Department in cash compensation. As shown in Figure 20 below, Districts 2 and 5 have the
largest difference in cash compensation relative to comparable local law enforcement agencies.
Increasing geographic pay in King County and instituting geographic pay in high-cost areas of
District 5 should be considered.

Chapter 3: Issues Affecting Retention of State Troopers 99
Recommendation 7.1 The WSP should review its geographic pay practices to both expand
counties they cover as well as to potentially increase the rates for geographic pay. Providing
higher pay on a geographic basis could provide additional incentive to stay with the WSP for
Troopers where pay is a primary issue. This will also help attract new recruits from more
populated areas where there are many other law enforcement choices.
Geographic pay should be used to normalize the differences in pay in nearby agencies and reduce
the impact of higher cost of living in those areas. Once this is done, general pay raises provide
improved compensation competitiveness for all Troopers.
Cost: Increasing geographic pay makes the most sense in King County where pay differentials
to the Seattle Police Department and King County Sheriff’s Office are over 15 percent and in
District 5 where pay differences to Vancouver are nearly 13 percent. Increasing geographic pay
in King County (District 2) will cost approximately $103,000 per one percent increase (including
17% for pension and other payroll costs). A one percent geographic pay allowance for District 5
Troopers would cost approximately $63,000 per one percent per year (not all counties of the
District will necessarily be included).
Implementation Hurdles: Requires negotiations over the CBA with the WSPTA, and approval by
the State Legislature.

100 Chapter 3: Issues Affecting Retention of State Troopers
Finding #8: The WSP provides opportunities for specialty and certification pays. While these
are ways to boost pay for employees who have special knowledge or provide special services,
only a small percentage of Field Force employees actually receive these extra pays, and those
that do are typically more senior Troopers that would benefit from implementation of various other
compensation recommendations. Additionally, the WSP pays a shift differential for Troopers
working between 6:00 PM and 6:00 AM. Based on a rotational schedule (described later in this
report), shift differentials are received by most, if not all, FOB Troopers and Sergeants. These
pays do not show up as base pay or in many pay comparisons with other agencies. The combined
cost of specialty pays and shift differential pay is nearly equal for FOB and non-FOB Troopers
and Sergeants (see Table 40 below).
Recommendation 8.1 The WSP should consider merging specialty pays, certification pays,
and shift differentials into base pay. This will serve to increase the base pay levels presented
in pay comparisons, while limiting pay differences among Troopers. This would increase base
pay by approximately 2.5 percent. In total, this percent of pay is nearly identical for Troopers and
Sergeants in the FOB and other bureaus. Taking pay out of the equation for specialty
assignments could also help to reduce issues with accessibility to specialty assignments.
Cost: To the extent that some premiums are not now pensionable or included in the overtime
base, shifting such elements of pay could marginally increase pension and overtime costs. If a
cost neutral shift is intended, this factor should be accounted for when determining the size of the
resulting base pay adjustment.
Implementation Hurdles: Requires negotiations over the CBA with the WSPTA, and approval by
the State Legislature.
Recommendation 8.2. Institute a new promotional class of Trooper. The WSP could offer a
promotional opportunity for Troopers to an advanced level (a Senior and/or Master Trooper, for
example) with additional duties and expectations. This will add a higher-paid, non-supervisory
level (or two, if both Intermediate and Advanced levels were established)) that could be reached
by accumulating points through various criteria such as education, certifications, tenure,
specialties, good record and commendations, and field training officer (FTO) status. Examples
of similar structures can be seen in the California Peace Officers Standards and Training (POST)
and Texas Commission on Law Enforcement (TCOLE) certification programs.
Table 40: Specialty and Certification Pays by Type and Bureau (2015 Actuals)
Compensation Item FOB % of Base
Pay All Other Bureaus
% of Base Pay
Base Pay $40,854,249 -- $21,076,575 --
Shift Differential $822,047 2.0% $122,709 0.6%
Specialty and Certification Pays $191,735 0.5% $437,302 2.1%

Chapter 3: Issues Affecting Retention of State Troopers 101
The result could create a positive track for non-supervisory Troopers to earn higher base salary
and advance professionally in the intermediate years of their career. This could also address
concerns about limited promotional opportunities and allow Troopers to progress in a single
geographic location if they do not want to relocate for a promotion. Such a structure would also
align additional compensation with areas of Trooper development that would benefit the WSP,
while increasing the overall, top salary range of pay for non-supervisory Troopers.
Cost: The total cost of this recommendation would depend on how many Troopers would qualify
into such levels, and whether or not any existing premiums would be folded into the new level
(e.g. if points toward Master Trooper status for educational attainment and/or FTO duties were
part of advancement under such a program, then existing, separate premiums might be
eliminated). For an individual Trooper with 20 years of service each 5 percent promotional step
to Senior or Master Trooper would cost approximately $4,500 per year (inclusive of benefits and
other payroll costs), prior to any offset from folding any existing premiums into such a new
structure.
Implementation Hurdles: Requires negotiations over the CBA with the WSPTA, and approval by
the State Legislature.
RETIREMENT AND PENSION ISSUES
Retirement benefits are an important component of total compensation costs, and changes to
pensions can impact the available funding to address other compensation goals. At the same
time, the structure of retirement benefits can significantly affect the timing of individual retirement
decisions.
The WSP has an interest in retaining Troopers beyond their retirement-eligibility tenure in order
to help smooth out the retirement bubble and provide more time to fill the ranks with Troopers
coming up through the Academy. Among surveyed current Troopers who plan to leave WSP
soon, 31 indicated that they plan to retire. The comments from these respondents indicate that
most are planning to retire as soon as they are eligible for reasons linked to both pay and working
conditions.
Below are representative comments provided by survey respondents with an expressed intention
to retire:
“Have only 3 years until I retire. Would be a waste to leave now. If I was younger I would
leave for another agency.”
“I have too much time on to leave…If I was new I would be looking at teh [sic] local
agencies in my area that start out paying around $1000 more a month”
“Only because the years I have vested. Otherwise I would leave for much better pay and
benefits from other agencies in my area”

102 Chapter 3: Issues Affecting Retention of State Troopers
“I am to [sic] far into my career to leave, but have looked at different options to make more
money by leaving the agency”
“If I had less than teen [sic] years on I would look to transfer due to pay and progression
of the department. WSP has not been forward thinking for a long time.”
For many retiring Troopers, pay is a primary issue in their mindset to leave. Current Troopers
close to retirement age are staying at WSP despite the fact that some are unhappy. A majority
indicate that once they reach the mandatory 25 years of service, they will retire. This is supported
by data from the State’s Department of Retirement Systems indicating that most recent retirees
have left almost immediately after reaching 25 years of service. Several respondents who
indicated the intention to retire as soon as they are eligible stated that they will likely look to
continue working at another law enforcement agency.
Retirement Findings and Recommendations
Many of the recommendations addressing overall pay, working conditions, and workload, if
implemented, will help to resolve issues with Troopers close to retirement. In addition to those
general workforce-related recommendations, the discussion below explores targeted options
related to pensions and pay after 25 years of service specifically associated with the retirement-
eligible workforce.
Finding #9: The issues motivating current early and mid-career Troopers to resign from the
agency are also influencing retirement-eligible Troopers’ decisions regarding when to retire.
Despite the fact that they likely have many years of employment opportunity before they want to
fully retire, many current WSP Troopers nearing retirement indicated their plan is to stay with the
WSP only until they reach normal service retirement requirements (25 years of service). Pay is a
major issue for Troopers on the cusp of becoming retirement eligible, and the WSP may need to
address this in order to incentivize Troopers to stay on rather than move to a post-retirement job
in a different agency.
Options to Consider for Addressing Retention of Retirees
Addressing retention issues related to retirement is complex. With a 25-and-out pension plan,
many WSP Troopers are able to leave the Field Force and join other law enforcement agencies
or pursue different careers prior to reaching an age where they can no longer effectively perform
their duties as a law enforcement officer.
The options provided below are meant to show a range of potential actions the WSP could take
to address the retirement bubble now being faced. If these actions are pursued, it will be important
to engage Troopers at or nearing retirement eligibility to determine what options would have the
most beneficial impact.
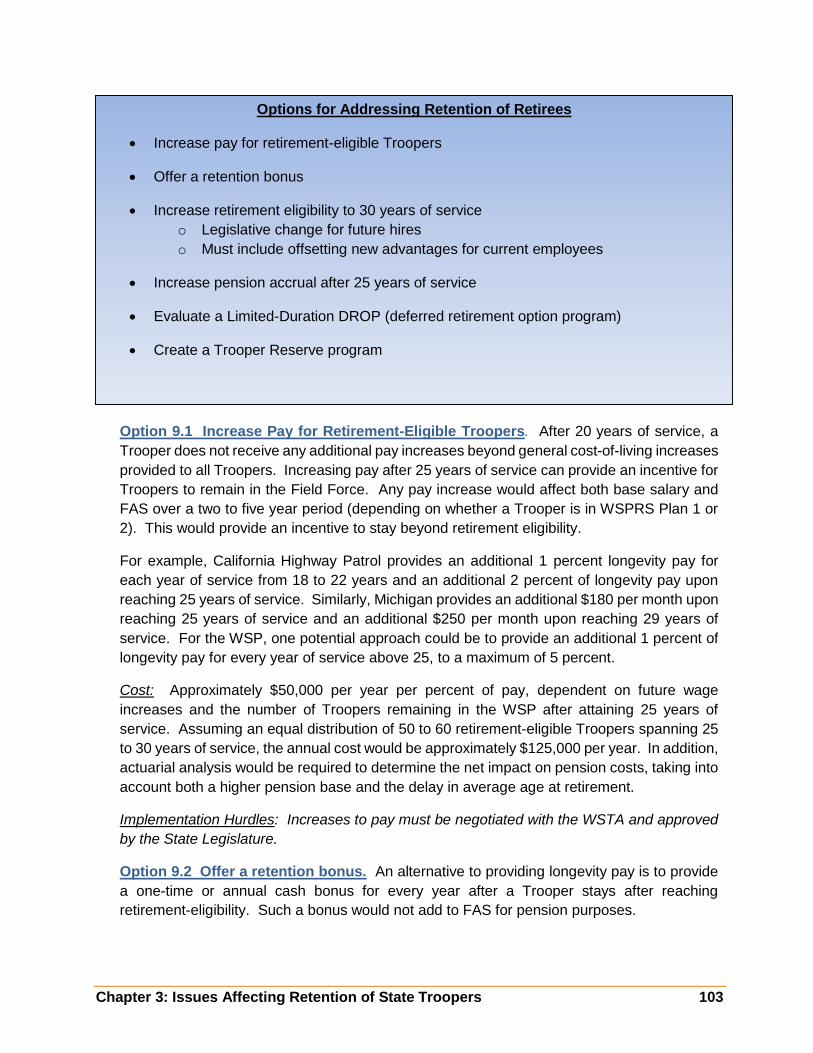
Chapter 3: Issues Affecting Retention of State Troopers 103
Option 9.1 Increase Pay for Retirement-Eligible Troopers. After 20 years of service, a
Trooper does not receive any additional pay increases beyond general cost-of-living increases
provided to all Troopers. Increasing pay after 25 years of service can provide an incentive for
Troopers to remain in the Field Force. Any pay increase would affect both base salary and
FAS over a two to five year period (depending on whether a Trooper is in WSPRS Plan 1 or
2). This would provide an incentive to stay beyond retirement eligibility.
For example, California Highway Patrol provides an additional 1 percent longevity pay for
each year of service from 18 to 22 years and an additional 2 percent of longevity pay upon
reaching 25 years of service. Similarly, Michigan provides an additional $180 per month upon
reaching 25 years of service and an additional $250 per month upon reaching 29 years of
service. For the WSP, one potential approach could be to provide an additional 1 percent of
longevity pay for every year of service above 25, to a maximum of 5 percent.
Cost: Approximately $50,000 per year per percent of pay, dependent on future wage
increases and the number of Troopers remaining in the WSP after attaining 25 years of
service. Assuming an equal distribution of 50 to 60 retirement-eligible Troopers spanning 25
to 30 years of service, the annual cost would be approximately $125,000 per year. In addition,
actuarial analysis would be required to determine the net impact on pension costs, taking into
account both a higher pension base and the delay in average age at retirement.
Implementation Hurdles: Increases to pay must be negotiated with the WSTA and approved
by the State Legislature.
Option 9.2 Offer a retention bonus. An alternative to providing longevity pay is to provide
a one-time or annual cash bonus for every year after a Trooper stays after reaching
retirement-eligibility. Such a bonus would not add to FAS for pension purposes.
Options for Addressing Retention of Retirees
Increase pay for retirement-eligible Troopers
Offer a retention bonus
Increase retirement eligibility to 30 years of service
o Legislative change for future hires
o Must include offsetting new advantages for current employees
Increase pension accrual after 25 years of service
Evaluate a Limited-Duration DROP (deferred retirement option program)
Create a Trooper Reserve program

104 Chapter 3: Issues Affecting Retention of State Troopers
Cost: Will vary based on amount of bonus and whether provided as a one-time or annual
amount.
Implementation Hurdles: Increases to pay must be negotiated with the WSPTA and approved
by the State Legislature.
Option 9.3 Increase retirement eligibility to 30 years of service. Changing the WSPRS
eligibility for full retirement from 25 years to 30 years of service (or to a plan similar to the
LEOFF eligibility) would more closely align with the pension benefits available to local
Washington State law enforcement, would be consistent with longer life spans and working
careers, and could generate long-term savings that could help to fund improved cash
compensation. At the same time, such a change would result in some future Troopers working
longer prior to retirement. Increasing the time required to reach retirement eligibility, thereby
increasing average tenure and the proportion of experienced Troopers in active service,
should bring more stability to the workforce.
New Employees. Such a change could be implemented by the Legislature for new
employees. Senate Bill 5982, introduced in the last legislative session, sought to change full
retirement age to 62 with an early retirement option at age 55 with a reduced benefit. If this
change were applied to new hires only, the Legislature could apply any current savings in
pension costs from the change in benefit, if they materialize, to improve the base pay of
Troopers at entry level and post-Academy levels – thereby targeting a key recruitment issue
and aligning additional cash compensation more closely with the source of offsetting benefits
savings.
Current Employees. Changing the benefit for current employees is more complex, and is
likely to require an offset of some sort to implement. The State Supreme Court has held that
“changes in a pension plan which result in disadvantage to employees should be
accompanied by comparable new advantages”29. Any change to the current retirement
eligibility threshold should be considered in conjunction with other possible solutions, such as
implementation of a DROP program, discussed below.
Cost: An actuarial analysis would be required to determine the relative costs or savings from
extending years of service requirements for WSPRS members. Applying this change in
benefits to all WSPRS members would result in the need for an offsetting comparable
advantage to the disadvantage of the change. That cost would also depend on the actuarial
analysis of the cost of the benefit change to an employee.
Implementation Hurdles: Any change would require a change in State retirement law by the
Legislature. Due to State Supreme Court decisions (see footnote below) a change in
retirement benefits would require an offsetting advantage for current employees and would
likely be subject to negotiations with the WSPTA. Applying this across the board could also
29 Bakenhus v. City of Seattle, April 19, 1956 and Washington Education Association v. Washington Department of Retirement Systems, August 14, 2014.

Chapter 3: Issues Affecting Retention of State Troopers 105
result in legal action if the parties disagree over the offsetting advantage for a change in
retirement benefit.
Option 9.4 Increase Pension Accrual after 25 years of service. Increasing the pension
accrual rate after reaching 25 years of service may be another way to incent retirement-eligible
Troopers to remain in the force for several more years. Increasing the accrual rate from the
current 2.0 percent to 2.2 percent per year say, would increase the total retirement formula by
1 percent of FAS for a Trooper opting to stay for an additional five years of service—retirement
amount increased by 11 percent of FAS vs. a 10 percent increase without this change.
Cost: Determining the cost of this option would require an actuarial analysis by the State
Retirement System.
Implementation Hurdles: Any change would require a change in State retirement law by the
Legislature, and would be subject to negotiations with the WSPTA.
Option 9.5 Evaluate a Limited-Duration DROP. A Deferred Retirement Option Program
(DROP) can be used to incentivize Troopers nearing retirement to stay a few years beyond
becoming retirement eligible. These programs also provide current employees close to
retirement some certainty regarding their retirement date and allow them to continue to accrue
retirement benefits after they have “maxed out” their benefit under their current pension plan.
A concern with DROPs, however, is that they have often not met actuarial assumptions and
have weakened pension plan health. Still, such an approach can potentially be structured as
cost neutral if actuarial assumptions are met, and could be considered as a tool in this specific
instance to address the particularly large retirement bubble projected for the WSP.
Under a DROP program, an employee eligible for retirement continues working, however
additional service time and compensation that would have been credited under their
retirement system’s benefit formula is credited to a DROP account separate from their
retirement plan account. The employee works for a specified period of time under the DROP
program, generally three to five years. At the end of this period, the balance of the DROP
account, including accrued interest, is paid to the employee in a lump sum. The employee
would then begin drawing their defined retirement benefits.
While DROP programs have become common among municipal police and fire retirement
systems nationally since their introduction in the 1980s, this approach is not widespread
among the other state law enforcement agencies benchmarked for this study. In this survey
group, only the Ohio Highway Patrol provides the DROP option to current employees and new
hires. Elsewhere, the Arizona Highway Patrol and the Michigan State Police also offer DROP
to employees hired before January 1, 2012, but not to current hires.
Table 41: State of Ohio DROP Benefits

106 Chapter 3: Issues Affecting Retention of State Troopers
DROP Offered? Eligibility DROP Period Guaranteed
Rate of Return
Ohio Highway Patrol
Age 48 with 25 YOS
Age 52 with 20 YOS
Enter before age 52: minimum 3
years Enter after age 52: minimum 2
years Maximum of 8
years
N/A (Market-based)
While not common among comparable state law enforcement agencies, the WSP might
consider implementing a DROP program to help retain some of the current Troopers who plan
to retire as soon as they are eligible. A point of concern with DROP programs is that actual
costs are sometimes substantially higher than anticipated at implementation. A potential
DROP program must be structured in such a way as to ensure actuarial cost-neutrality and
minimize exposure of the pension fund to additional actuarial risk. For example, any
provisions for interest earnings on a DROP account should be structured to avoid undue risk
of large state subsidies. When DROP earnings are tied to long-term actuarial return
assumptions, the pension plan may be required to pay out more than it earned during the two
to five years of the DROP.
The project team also recommends that, if a DROP program is considered, it should be
established as a short-term pilot that would sunset after a predetermined period (e.g. available
only to those within five years of retirement eligibility at the time of adoption). This would allow
for management of the currently projected retirement bubble while shielding the State from
permanent commitment to the cost risks that come with the program.
A DROP program is only one option among a range of alternatives for creating financial
incentives for current cohorts to defer retirement.
Cost: The DROP should be designed to be cost neutral to the agency by freezing defined
pension benefits when entering the DROP and then making the same pension contribution
amount to the DROP account. Cost risks can arise based on how interest in that account is
calculated, as well as changes in behavior among retirement-eligible participants relative to
existing actuarial assumptions.
Implementation Hurdles. Instituting a DROP program would likely involve input from the
WSPTA and a change in pension laws by the State Legislature.
Option 9.6 Create a Trooper Reserve Program. A Trooper Reserve program could be
designed to allow Troopers in good standing at the time of retirement to be reemployed by the
WSP in a part time, non-benefit, non-career status performing functions allowed by law and
required by the WSP. Unlike a DROP program, a Reserve Trooper would have retired from
the WSP and return in a limited status to assist with tasks as defined by the WSP such as
security at the Governor’s Mansion, assisting with investigations, additional staffing during
special events or enforcement efforts, or any other function that the WSP determines to be

Chapter 3: Issues Affecting Retention of State Troopers 107
appropriate, in compliance with the law, and not in conflict with collective bargaining
agreements. Hiring retired Troopers back to perform background checks and other time-
limited tasks is currently done by the WSP.
Cost: The cost is dependent on the number of retired Troopers hired through this program
and the number of hours worked. Currently, retired Troopers hired by the WSP are paid
$29.00 per hour.
Implementation Hurdles: No implied promise of employment can be made to any retiring
Trooper. A reserve program would need to be structured in such a way to avoid IRS or
WSPRS rules regarding post-retirement employment.
IMPACT OF THE COLLECTIVE BARGAINING AGREEMENT
Overall, the collective bargaining agreement has not come up directly as a major issue in the
retention of employees, beyond the overall compensation and schedule issues outlined above
and in the preceding chapters. Some areas encompassed by the CBA that arose in surveys
and/or face-to-face interviews include the following, as addressed elsewhere within this study:
Transfers
Vacation Accrual
Specialty Pays
Promotions
Alternative Work Schedules
Distance to Work
Field Force Troopers with who have a State vehicle must live within 15 miles of the boundary of
their assigned geographical boundary. As housing has become more expensive in the urban
core, Troopers in these areas are reporting that it is harder to meet this standard and still find
affordable housing.
CONCLUSION
Addressing attrition at the WSP is dependent on improving job satisfaction. Job satisfaction
includes adequate pay, a reasonable workload, and a supportive workplace. The WSP is
experiencing increasing retention pressure, as a retirement bubble and growing resignations to
other law enforcement agencies are contributing to rising vacancy rates. The WSP faces
challenges from both pay competitiveness with local law enforcement agencies and from morale
issues across a majority of Troopers and Sergeants.
To improve compensation competitiveness, development of a comprehensive plan will require
further input from State Legislature, the WSPTA, and the WSP itself. As such a strategy is forged,
multiple tools and approaches are available, as outlined throughout this chapter. Further,

108 Chapter 3: Issues Affecting Retention of State Troopers
although pay issues will almost inevitably result in some additional costs for the State, a portion
can be absorbed by savings from vacancies until workforce levels are regained – and well-
targeted investments can help to maximize the return on any incremental compensation dollars
made available.
In parallel, addressing employee morale issues should not carry the same level of fiscal impact,
but will still be no less challenging. Progress will require management’s willingness to clearly
identify and address difficult issues – real and perceived – now affecting the FOB workforce. The
WSP needs to actively work to redefine its forward-looking approach to key management
concerns, and to take proactive steps to improve Field Force relationships.
Overall, if no action is taken, the WSP will likely continue to see high attrition levels and growing
staffing challenges. By addressing both compensation and employee satisfaction
recommendations in tandem, however, the pride and traditions of the WSP provide a strong basis
for turning around the current trend in resignations and convincing more retirement-eligible
Troopers to remain in longer service to the public.
Chapter 4: Issues Affecting Recruitment of State Troopers 109
Chapter 4: Issues Affecting Recruitment of State Troopers
INTRODUCTION
Currently the sole source of new Troopers is the Cadets who graduate from the Trooper Basic
Academy. In order to meet the replacement demands projected from near-term attrition, the WSP
will need to increase the number of Trooper Basic Academy graduates.
This chapter reviews the WSP’s recruitment process and outcomes and provides
recommendations intended to generate increased interest in becoming a WSP Trooper, to
remove barriers from the selection process that weed out too many applicants, and to retool the
Academy structure to get more Cadets trained and commissioned as Troopers faster.
Academy Graduate Needs
As described in the Chapter 1, the coming retirement bubble and continued resignations (even at
longer-term historical levels without assuming continuation of a 2015 spike) will place an
increasing burden on attracting, training, and commissioning Troopers. As shown in the
projection, Field Force levels are expected to fall significantly over the next ten years without
corrective action.
Under current practice, the WSP would be expected to conduct 13 Trooper Basic Academies in
the next ten years (one per nine months). WSP would make significant improvements in reducing
their vacancies over those ten years if two major changes occurred: First, reduce resignations
from the spiked level experienced so far in 2015, to historical rates from 1999 – 2013; and second,
graduate 10 additional Cadets from each class, (increasing the average graduation rate from 37
to 47 per class). These two changes would bring total Field Force levels (inclusive of Sergeants)
to above where they are today, but still lower than the authorized level of 690 Field Force Troopers
and Sergeants. Even higher graduation rates and/or more frequent Academies would be needed
to fully reach authorized Field Force levels.
RECRUITMENT OVERVIEW
The term recruitment is used broadly in this study to mean the process stretching from outreach
to potential applicants to the commissioning of new Troopers after the Academy. As noted in the
graphic below, success involves a combination of environmental factors, in many ways beyond
the direct control of the WSP, and how the agency’s policies adapt and respond to such
conditions.

110 Chapter 4: Issues Affecting Recruitment of State Troopers
Source: Nelson Lim, Carl Matthies, Greg Ridgeway, and Brian Gifford, “To Protect and Serve: Enhancing the Efficiency of LAPD Recruiting.” RAND Center on Quality Policing (2009).
In turn, each step of this process will impact how successful the WSP can be in meeting its
ultimate goal of maintaining its authorized workforce with highly qualified, well-trained Troopers.
Recruitment Staffing
The WSP staffs its recruitment efforts with a combination of full-time Troopers at headquarters
and part-time Troopers at the District offices:
Headquarters: One Sergeant and two Trooper recruiters are assigned to the WSP
Human Resources Department (HRD). These personnel are responsible for the overall
recruitment strategy and process, and also serve as District 5 recruiters. Additionally, HRD
currently employs three polygraph examiners (with three additional on-call backups
working in other divisions) and the psychological testing is performed by a staff
Psychologist independent of the HRD. The WSP has also recently contracted out the
written exam and physical fitness testing. The Background Unit includes one Sergeant,
two full-time civil service personnel, five long-term limited duty Troopers (four full-time and
one part-time), and 17 part-time, on-call background investigators.
Districts: Recruitment duties at the District level are performed on a full-time basis by
Troopers in Districts, 1, 2, 3, 7, and 8. Recruiters in Districts 4 and 6 split their time between
recruitment duties and other duties. These recruiters coordinate and follow up on
recruitment efforts within the District boundaries, identify and attend events, make initial
contact with applicants, and schedule all selection-process appointments. The District
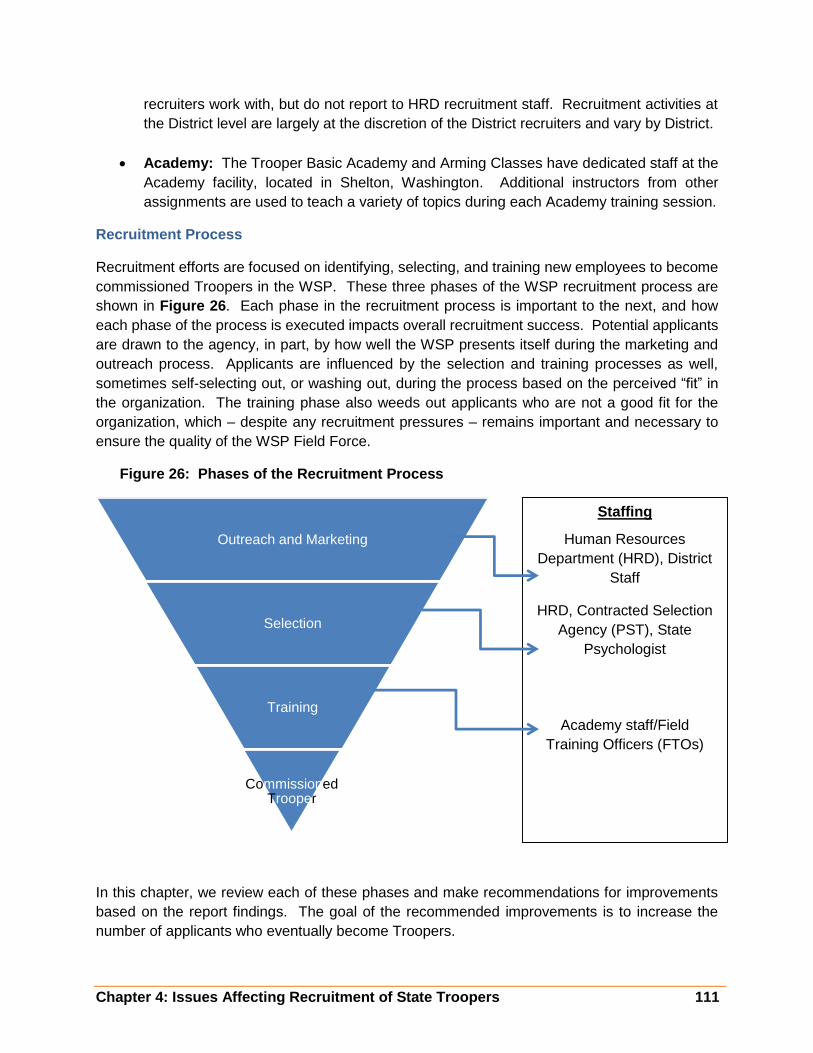
Chapter 4: Issues Affecting Recruitment of State Troopers 111
recruiters work with, but do not report to HRD recruitment staff. Recruitment activities at
the District level are largely at the discretion of the District recruiters and vary by District.
Academy: The Trooper Basic Academy and Arming Classes have dedicated staff at the
Academy facility, located in Shelton, Washington. Additional instructors from other
assignments are used to teach a variety of topics during each Academy training session.
Recruitment Process
Recruitment efforts are focused on identifying, selecting, and training new employees to become
commissioned Troopers in the WSP. These three phases of the WSP recruitment process are
shown in Figure 26. Each phase in the recruitment process is important to the next, and how
each phase of the process is executed impacts overall recruitment success. Potential applicants
are drawn to the agency, in part, by how well the WSP presents itself during the marketing and
outreach process. Applicants are influenced by the selection and training processes as well,
sometimes self-selecting out, or washing out, during the process based on the perceived “fit” in
the organization. The training phase also weeds out applicants who are not a good fit for the
organization, which – despite any recruitment pressures – remains important and necessary to
ensure the quality of the WSP Field Force.
Figure 26: Phases of the Recruitment Process
In this chapter, we review each of these phases and make recommendations for improvements
based on the report findings. The goal of the recommended improvements is to increase the
number of applicants who eventually become Troopers.
Outreach and Marketing
Selection
Training
Commissioned Trooper
Staffing
Human Resources
Department (HRD), District
Staff
HRD, Contracted Selection
Agency (PST), State
Psychologist
Academy staff/Field
Training Officers (FTOs)

112 Chapter 4: Issues Affecting Recruitment of State Troopers
UNDERSTANDING POTENTIAL APPLICANTS
Important considerations in the recruitment process include how potential applicants view the
WSP, and what they want from a law enforcement career. Survey data collected for this study
provides a window into the mindset of Cadets and Troopers who chose to join the WSP, including
why they joined and what is important to them about being a Trooper. At the same time, parallel
CJTC survey data also provides insights into what is important to law enforcement recruits who
chose local agencies instead of the WSP, as well as what they are looking for in a law enforcement
career.
Benchmark agency responses are also helpful in comparing WSP practices to similar agencies.
The project team received benchmarking data from six other State Patrol agencies nationally.
Survey Results: What Attracts Applicants to the WSP?
A key question in addressing recruitment practices is, what are the factors that draw potential
Troopers into law enforcement and then into the WSP? Knowing the answer to these questions
can assist in designing a more effective recruitment strategy.
The surveys asked current Cadets, Troopers, and law-enforcement recruits from the CJTC what
attracted them to law enforcement and why they chose their respective agency (WSP or local law
enforcement). The results (Table 42) show that consistently half of the law enforcement officers
surveyed became interested in this career from a family member or friend. Others come through
military service and high school classes. For most, entering law enforcement is a long-time
aspiration. Tapping into this aspiration early, with information about a WSP career, should be a
goal of the outreach process.

Chapter 4: Issues Affecting Recruitment of State Troopers 113
Table 42: “How did you become interested in law enforcement?” (All Surveys)
Survey Group Options Percent Count
WSP Troopers Family/Friend in law enforcement 50.1% 225
WSP Cadets Family/Friend in law enforcement 40.6% 26
CJTC Recruits Family/Friend in law enforcement 50.0% 9
WSP Troopers Long time aspiration 42.5% 191
WSP Cadets Long time aspiration 57.8% 37
CJTC Recruits Long time aspiration 77.8% 14
WSP Troopers Encouraged by family or friend 23.6% 106
WSP Cadets Encouraged by family or friend 29.7% 19
CJTC Recruits Encouraged by family or friend 11.1% 2
WSP Troopers Job fair 1.6% 7
WSP Cadets Job fair 7.8% 5
CJTC Recruits Job fair 0.0% 0
WSP Troopers School classes 9.1% 41
WSP Cadets School classes 14.1% 9
CJTC Recruits School classes 22.2% 4
WSP Troopers Military service 14.3% 64
WSP Cadets Military service - -
CJTC Recruits Military service - -
WSP Troopers and Cadets. Both WSP Cadets and Troopers report similar experiences when
asked how they became interested in the WSP (see Table 43). Family and friends in the WSP
are most influential, followed closely by unrelated Washington State Patrol employees. In the
interview process, several stories were related about how an encounter with a WSP Trooper led
to an interest in a career as a Trooper. The WSP website and advertisements had equal impact
(at around 15 percent) for current Troopers, with the WSP job fairs having the least impact. Of
note, a somewhat higher percentage of CJTC recruits became interested in law enforcement
through school classes than did WSP Troopers and Cadets.
The importance of the web site is also particularly significant to newer recruits, with nearly half of
current Cadets learning about the WSP through its website – well above the experience of
incumbent Troopers hired in earlier periods. The WSP’s website presence should continue to be
a focus of marketing and outreach efforts, with an emphasis toward what is attractive to a diverse
and contemporary pool of potential applicants.

114 Chapter 4: Issues Affecting Recruitment of State Troopers
Table 43: “How did you learn about/become interested in the WSP?” (WSP Cadets and Troopers)
Survey Group Options Percent Count
WSP Troopers Family/Friend is/was in the Washington State Patrol 50.6% 195
WSP Cadets Family/Friend is/was in the Washington State Patrol 46.8% 29
WSP Troopers Washington State Patrol employee 29.1% 112
WSP Cadets Washington State Patrol employee 24.2% 15
WSP Troopers Job fair 4.7% 18
WSP Cadets Job fair 8.1% 5
WSP Troopers Advertisement 14.8% 57
WSP Cadets Advertisement 16.1% 10
WSP Troopers Washington State Patrol web site 15.8% 61
WSP Cadets Washington State Patrol web site 48.4% 30
In a separate question, Troopers and Cadets were asked if they considered other law
enforcement agencies before choosing the WSP: 77 percent of current Troopers and about 69
percent of current Cadets did. The remainder only considered WSP for a law enforcement career.
When asked why they chose the WSP, the reasons provided are varied, as shown in Table 44
below. Some key factors identified among the responses include:
The take-home car is an important and influential benefit of the job
Being quick to hire yields better hiring results
Troopers who chose the WSP like the statewide nature of the job, but that appeal is less
important for the current Cadet class
Salary and benefits had a positive impact on hiring of current Troopers, but less of an
impact with current Cadets. Fifty-nine percent of Cadets said the starting salary at WSP
was not very important or not at all important in their choice to join the WSP
The paramilitary culture is an important component of the job to 44 percent of current
Troopers but to only 19.5 percent of Cadets
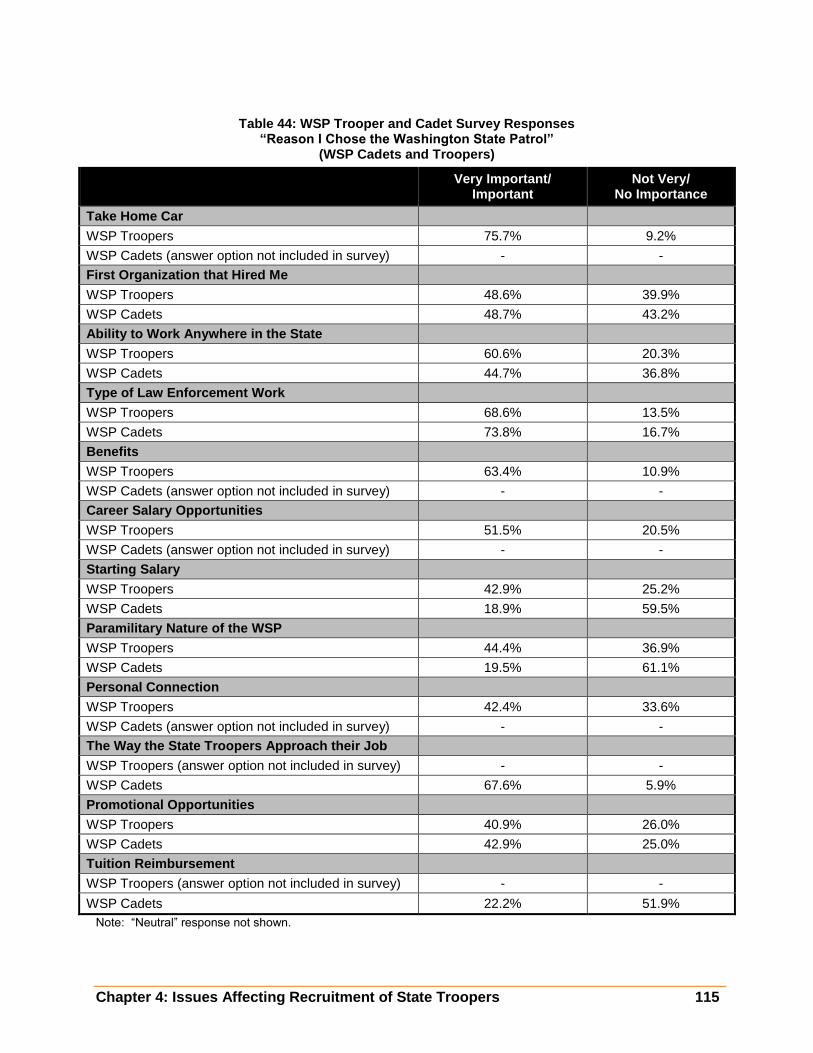
Chapter 4: Issues Affecting Recruitment of State Troopers 115
Table 44: WSP Trooper and Cadet Survey Responses “Reason I Chose the Washington State Patrol”
(WSP Cadets and Troopers)
Very Important/
Important Not Very/
No Importance
Take Home Car
WSP Troopers 75.7% 9.2%
WSP Cadets (answer option not included in survey) - -
First Organization that Hired Me
WSP Troopers 48.6% 39.9%
WSP Cadets 48.7% 43.2%
Ability to Work Anywhere in the State
WSP Troopers 60.6% 20.3%
WSP Cadets 44.7% 36.8%
Type of Law Enforcement Work
WSP Troopers 68.6% 13.5%
WSP Cadets 73.8% 16.7%
Benefits
WSP Troopers 63.4% 10.9%
WSP Cadets (answer option not included in survey) - -
Career Salary Opportunities
WSP Troopers 51.5% 20.5%
WSP Cadets (answer option not included in survey) - -
Starting Salary
WSP Troopers 42.9% 25.2%
WSP Cadets 18.9% 59.5%
Paramilitary Nature of the WSP
WSP Troopers 44.4% 36.9%
WSP Cadets 19.5% 61.1%
Personal Connection
WSP Troopers 42.4% 33.6%
WSP Cadets (answer option not included in survey) - -
The Way the State Troopers Approach their Job
WSP Troopers (answer option not included in survey) - -
WSP Cadets 67.6% 5.9%
Promotional Opportunities
WSP Troopers 40.9% 26.0%
WSP Cadets 42.9% 25.0%
Tuition Reimbursement
WSP Troopers (answer option not included in survey) - -
WSP Cadets 22.2% 51.9%
Note: “Neutral” response not shown.
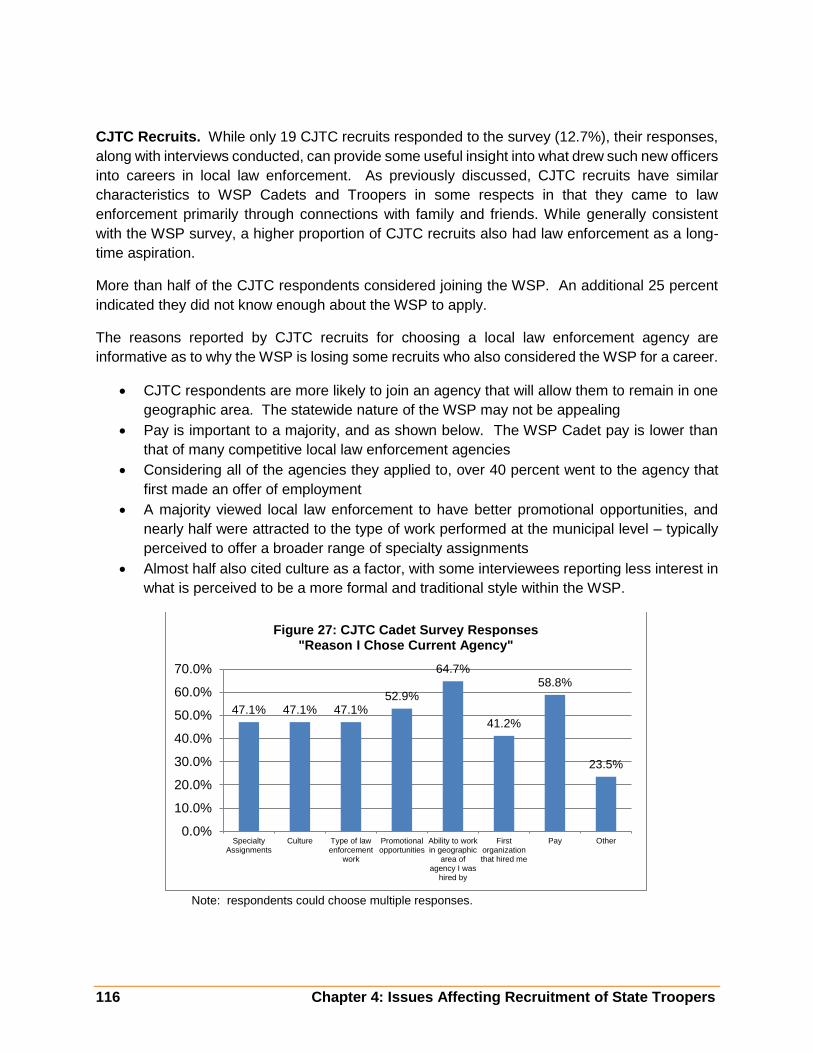
116 Chapter 4: Issues Affecting Recruitment of State Troopers
CJTC Recruits. While only 19 CJTC recruits responded to the survey (12.7%), their responses,
along with interviews conducted, can provide some useful insight into what drew such new officers
into careers in local law enforcement. As previously discussed, CJTC recruits have similar
characteristics to WSP Cadets and Troopers in some respects in that they came to law
enforcement primarily through connections with family and friends. While generally consistent
with the WSP survey, a higher proportion of CJTC recruits also had law enforcement as a long-
time aspiration.
More than half of the CJTC respondents considered joining the WSP. An additional 25 percent
indicated they did not know enough about the WSP to apply.
The reasons reported by CJTC recruits for choosing a local law enforcement agency are
informative as to why the WSP is losing some recruits who also considered the WSP for a career.
CJTC respondents are more likely to join an agency that will allow them to remain in one
geographic area. The statewide nature of the WSP may not be appealing
Pay is important to a majority, and as shown below. The WSP Cadet pay is lower than
that of many competitive local law enforcement agencies
Considering all of the agencies they applied to, over 40 percent went to the agency that
first made an offer of employment
A majority viewed local law enforcement to have better promotional opportunities, and
nearly half were attracted to the type of work performed at the municipal level – typically
perceived to offer a broader range of specialty assignments
Almost half also cited culture as a factor, with some interviewees reporting less interest in
what is perceived to be a more formal and traditional style within the WSP.
Note: respondents could choose multiple responses.
47.1% 47.1% 47.1%52.9%
64.7%
41.2%
58.8%
23.5%
0.0%
10.0%
20.0%
30.0%
40.0%
50.0%
60.0%
70.0%
SpecialtyAssignments
Culture Type of lawenforcement
work
Promotionalopportunities
Ability to workin geographic
area ofagency I was
hired by
Firstorganizationthat hired me
Pay Other
Figure 27: CJTC Cadet Survey Responses"Reason I Chose Current Agency"

Chapter 4: Issues Affecting Recruitment of State Troopers 117
The two considerations at the top of most CJTC Cadets list of importance – ability to work in same
geographic location and pay – are discussed below.
Geographic Assignments. The WSP assigns new Troopers to one of eight Districts statewide
for initial assignments. The WSP takes Cadet preferences into consideration when making post-
academy assignments, but does not guarantee assignments. All of the other State Patrol
agencies struggle with parallel challenges associated with responsibility for widespread
geographies, but address these issues in different ways, as summarized in Table 45.
Table 45: State Law Enforcement Agency Process for Determining Geographic Assignments
Process
Washington State Patrol
The Academy uses a ranking process to prioritize final assignment requests for Cadets in training. This ranking takes into account a Cadet’s overall performance and special circumstances such as owning a home, spouse’s occupation, current city of residence, and preference.
Arizona Highway Patrol Troopers are provided a possible list of assignments and they choose their top five preferences. The Lieutenant Colonel of the Highway Patrol division makes final assignments.
California Highway Patrol
Each Cadet is assigned one of four assignment criteria. They are first organized by criteria 1-3 and then criteria 4. Criteria are: 1) Needs of the Department, 2) Hardship: any hardship must have occurred after appointment to the Academy, 3) Home Ownership: Cadets who own their home and live within 60 minutes of desired assignment location, and 4) Seniority.
Michigan State Police
Initial assignments are determined in the 17th week of the Academy. Management and the Trooper’s mentor during the Academy make assignment decisions based on: 1) Recruit’s GPA during the Academy, 2) Recruit’s family situation (married recruits and recruits with children given priority), 3) Needs of the Department, and 4) Recruit’s preferences for assignment location
Minnesota State Patrol
After testing and background investigations, the highest-scoring 80% of applicants are allowed to choose from available assignments before the Academy begins. Those assignments are put into written agreements between the agency and the applicant and are upheld barring a critical agency need. The available assignments are determined by command staff, based on the needs of the agency at the time.
Ohio Highway Patrol
Cadets are asked which assignment they would like to accept based upon remaining selections at their time of choosing. Initial assignments are then made according to Academy class ranking, which is based on academics, firearms proficiency, physical fitness, and driving score.
Pennsylvania State Police
Cadets are notified which of the 20 groups of Troopers have vacancies. Cadets may select three Troops in order of preference. Assignment to a Trooper group is based on the needs of the Department. Cadets are generally notified of their assignment several weeks prior to graduation. Those assignments are made after all current Troopers are transferred throughout the State. New Troopers must complete one year at their initially assigned Troop before requesting a transfer to another Troop.

118 Chapter 4: Issues Affecting Recruitment of State Troopers
Pay. Recruits who consider pay in making an employment decision may find a significant
difference between the WSP and the agency they are interested in for entry-level pay. As shown
in the Table 46, the WSP’s starting salary for Cadets is lower than benchmarked local agencies.
WSP’s pay differential lags all other surveyed jurisdictions at the outset of a Trooper’s career, and
as described in the Field Force evaluation (Chapter 1), potentially throughout their career.
Table 46: Academy Entry Level vs. Post-Academy Pay
Academy Rate Post-Academy Rate
Washington State Patrol $46,308
$51,480 $56,628 (King County)
$53,024 (Pierce County) $54,054 (Snohomish County)
Kennewick $71,808 $71,808
King County $62,710 $62,710
Pasco $65,208 $65,208
Pierce County $59,817 $59,817
Seattle $55,224 $69,240
Snohomish County $54,891 $54,891
Spokane County $49,629 $49,629
Vancouver $59,136 $62,088
Note: Primary rate of pay applies for assignment locations other than King, Pierce, or Snohomish Counties. Rates of pay below primary rate include geographic assignment pay for that county.
Face-to-Face Interviews
In addition to the surveys, the project team conducted face-to-face interviews of both WSP
Academy Cadets and CJTC recruits about why they chose law enforcement, impressions of the
WSP, and why they applied or didn’t apply to be a Trooper. Several themes emerged in these
interviews that add additional perspective regarding how the WSP may be viewed by other
potential applicants.
CJTC Recruit Interview Themes
Cultural Differences. The WSP culture was an issue for a number of CJTC recruits,
particularly, the paramilitary nature of the WSP—both in its Academy and in the field. This
is related to a negative view of Troopers being “all business” and paramilitary to an
extreme. The example of being expected to make beds with “hospital corners” during
residence at the Academy was cited among many similar cultural issues as reflective of a
style that steered some recruits away from the WSP
Fitness Requirements. The physical fitness requirements of the WSP were raised as a
disincentive to applying to the WSP. As of August 1, 2015, the move to a common testing

Chapter 4: Issues Affecting Recruitment of State Troopers 119
company used by most local law enforcement agencies addresses this issue by putting
all agencies on equal footing with this test
Nature of the Work. Many recruits mentioned a perception that the work performed by
WSP Troopers is all about “writing tickets,” whereas the CJTC recruits were seeking a
more proactive, diversified, and community-oriented career in policing.
WSP Cadet Interview Themes
Nature of the Work. Many Cadets mentioned that they were drawn to the WSP due to
the nature of the work. This surfaced as related both to what they expected do (e.g.,
helping people on the highways), and to what they expected not to do (e.g., residential
domestic violence calls).
WSP Culture. Many Cadets are drawn to the “elite” professionalism of the WSP Troopers
and the paramilitary style of the agency and Academy. There is also a WSP “car culture”
that was mentioned (most likely due to the nature of the work) that is attractive to some
recruits, but not to others.
Based on these interviews, differences came to light between the CJTC recruits and the WSP
Cadets that are important component to consider when looking at the overall design of the
recruitment process.
Findings and Recommendations
Finding #10: WSP struggles with attracting candidates who desire to stay in one geographical
location, thus limiting the potential applicant pool. This can manifest both in not knowing where
they might be stationed once becoming a Trooper as well as the possible need to move in order
to promote.
Recommendation 10.1 The WSP should create a system that allows candidates during the initial
application process to prioritize district assignments and, prior to employment or early in the
training process, to be assigned to a district. This assignment may not coincide with the Cadet’s
initial choice if assignments are not available in that location. For example, the Spokane District
has over 70 current Troopers who desire to transfer to that district, and it would not be appropriate
to place a new recruit there.
Cost: No anticipated cost
Implementation Hurdles: Will require a change in the current timing of the WSP practice to make
current Trooper transfer requests prior to placing Cadets. That process will now need to be
completed in advance of the hiring for each Cadet class (rather than during the Academy class).
Finding #11: The WSP Cadet enters into the agency at a lower starting salary than he or she
will receive when commissioned as a Trooper. The WSP Cadet and Trooper pay levels are low
compared to other law enforcement agencies and likely discourage some qualified applicants
from applying to the WSP. Competitive agencies (King County, Pasco, Pierce County,
Snohomish County, and Spokane County) generally start recruits at the same salary that they will

120 Chapter 4: Issues Affecting Recruitment of State Troopers
receive post-Academy, creating a large difference in pay optics during the training period. This
puts the WSP at a disadvantage with applicants who weight pay heavily in choosing between job
opportunities.
Recommendation 11.1 The WSP should consider increasing pay to levels that improve the
WSP’s competitive position relative to local law enforcement agencies. Increasing Cadet pay is
one way to address this, and movement toward a single rate for the first year of service (both at
the Academy and afterward) could be a means to achieve this.
At the same time – given such factors as the global pay disparity between the WSP and
competitive agencies, the relatively short time a new hire remains a Cadet, the focus of job
seekers on longer-term opportunities, and competing demands for limited budgetary resources –
the project team recommends seeking to adjust overall Trooper compensation within a broader
strategic framework that encompasses a full career, not just Cadet pay. As addressed in the
Chapter 3, this may include concepts such as modifying pensions and other benefits to generate
savings for reinvestment into higher salaries, reevaluating the optimal level of geographic
differentials, and/or shifting of certain premium pays into base salary. In addition, WSP
recruitment efforts should consistently highlight any compensation advantages that now exist
relative to local law enforcement, such as superior pensions and take-home vehicle privileges
less prevalent at the municipal level.
Overall, the competitive position of the WSP pay scale will clearly be a factor in future recruiting
efforts.
Cost: Depends on overall change to Cadet and Trooper compensation. Moving Cadets to entry-
level Trooper pay alone would cost approximately $350,000 - $400,000 per year depending on
how many Cadets are hired into the WSP and how long they take to complete the training
program.
Implementation Hurdles: The WSP Chief has the authority to set Cadets salaries within the total
authorized budget of the agency.
Finding #12: The WSP has a carefully cultivated culture that is reflected in recruitment outreach
and reinforced in the Trooper Basic Academy. Current applicants to law enforcement agencies,
however, are less likely to embrace the paramilitary style of the WSP. Even the WSP’s current
recruits are significantly less drawn by this factor than were current Troopers when they joined
the Patrol. Furthermore, recruits to other local law enforcement agencies cited the WSP culture
as a reason that they did not apply to become a Trooper. Even among current Troopers, out-of-
date uniforms come up as an area that needs to be addressed.
Recommendation 12.1 The WSP needs to take a close look how it can align its culture to the
contemporary approach favored by many current recruits while still maintaining its “service with
humility” mission. The issue of cultural realignment impacts the entire recruitment process and is
central to other recommendations provided in the Recruitment chapter of this Report.
Cost: Unless the WSP utilizes outside resources to address cultural changes, there is no cost to
this recommendation.

Chapter 4: Issues Affecting Recruitment of State Troopers 121
Implementation Hurdles: Culture is difficult to change and can take a concerted effort over many
years. A culture change would need to be embraced by WSP’s executive management.

122 Chapter 4: Issues Affecting Recruitment of State Troopers
OUTREACH AND MARKETING
The outreach and marketing process encompasses the strategy and tactics employed by the
WSP to attract the attention of qualified applicants to the WSP. Once a potential recruit decides
to apply to the agency, he or she enter the selection process. The outreach and marketing
strategy used by the WSP includes the agency website, advertising in a variety of media, face-to-
face interactions through job fairs and specialized on-site recruitment (e.g., military installations
and schools), and participation in community events.
This section looks broadly at the WSP outreach and marketing strategy and identifies
opportunities to reach a broader group of potential applicants. The review includes looking at
strategies from the public sector, municipal law enforcement agencies, and state law
enforcement.
The WSP application process is open during a recruitment period that is tied to hiring for a coming
arming class, the first step in the training process for a newly-commissioned Trooper. Recruitment
periods vary from 4 to 8 months. As a result, the WSP’s outreach and marketing efforts must
begin well before a recruitment period opens. Currently, the practice of having differing
recruitment periods – rather than a consistent, annual timeline – may make it more difficult to get
into a rhythm with potential recruiting targets (e.g., schools and military bases).
Table 47: Recruitment Periods, 25th – 29th Arming Classes
25th
Arming 26th
Arming 27th
Arming 28th
Arming 29th
Arming
Time Period 4/1/2012-7/31/2012
8/1/2012-4/1/2013
4/1/2013-11/1/2013
11/1/2013-6/30/2014
7/1/2014- 1/30/2015
Recruitment Period 4 months 8 months 7 months 7 months 6 months
Outreach and Marketing Activities
A list of outreach and marketing practices in the recruitment process was developed by the
California Peace Officer Standards and Training (POST). Comparing this list to current WSP
practices provides some context into what the WSP is now doing and where there might be
opportunities to expand outreach efforts.
These practices, along with the WSP level of engagement in each of the practice areas, are
provided as Appendix K. The areas covered under these activities include:
Developing the Recruitment Team
Budgeting and Long-Term Planning
Marketing and Technology
Alternative Staffing and Employee-Participation
Overall, the WSP has a wide-ranging list of recruiting activities in which it is engaged, including
most of the best practices recommended in the California POST list. One area that the WSP has
Chapter 4: Issues Affecting Recruitment of State Troopers 123
not engaged in to any great extent is in “alternative staffing and employee participation” activities.
Specific areas where the WSP does not engage in these best practices include:
Youth Cadet or youth corps/explorer programs
Magnet school programs
Use of reserve officers
Use of non-commissioned employees for certain
Field Force job duties
Use of retired Troopers
Engagement in these types of programs can introduce high
school students to the WSP and law enforcement in general.
It is reported that the WSP ran an explorer program
approximately twenty years ago, and Troopers who went
through that program are still in the force. Additionally,
reaching out to retirees and non-commissioned employees
can provide needed support for overall enforcement activity
and allow Troopers to spend more time in active patrol on
the highways.
Marketing Success. The WSP tracks its recruitment process well and provides after-action
reports documenting recruiting efforts and statistics; however, there are no comprehensive
statistics kept on comparative effectiveness of different marketing and outreach methods used in
attracting qualified applicants. This makes it difficult to assess the return on investment of current
resources and adjust future investments in recruiting.
Based on the self-report of applicants, Table 48 shows how applicants for the 28th Arming Class
(recruitment held from 11/1/2013 – 6/30/2014) heard about the WSP. Consistent with survey
results from this study, the WSP website is the biggest source for drawing attention to the WSP.
It is also interesting to note, that while 14 percent of these applicants said their contact was a
WSP employee, the overall percentage of hired Cadets and Troopers identifying contact with a
WSP employee is much higher (24 percent for current Cadets and 29 percent for current
Troopers). This is likely to mean that applicants with a personal connection to the WSP are more
likely to be successful in the selection process.
Benchmark Agency Best
Practice: The State of
California operates an
explorer program in the
Highway Patrol. The CHP
lists this as a best recruiting
practice for the agency.
Over 17 percent of the
current CHP Academy
recruits are from the
explorer program, and
these recruits generally
have a higher graduation
rate than recruits from the
general population.

124 Chapter 4: Issues Affecting Recruitment of State Troopers
Table 48: Source of Interest in Washington State Patrol: 28th Arming Class
Resource # of Applicants % of Applicants
WSP Website 924 31%
WSP Employee 435 14%
Other Website 280 9% (non-WSP)
WSP Recruiter/Event 269 9%
Other media 181 6%
Television 145 5%
Job Fair 108 4%
Newspaper Ad 63 2%
Radio 54 2%
Recruiting Vehicle 16 1%
None of the Above 529 18%
Total 3,004 100%
Application Trends
WSP application trends reflect a high number of initial applicants, but a low percentage of
applicants who move successfully through the hiring process to become new Cadets.
Table 49 shows the recruiting results for the last five Arming Classes. The recruiting efforts, and
ease of on-line applications, increased the total number of applicants from 1,457 for the 25th
Arming Class to 3,423 in the 28th Arming Class, declining to a still-high 2,553 for a somewhat
shorter recruitment period that yielded the 29th Arming Class. The increased number of applicants
did not translate to proportional increases in the number of applicants hired, however, as the
percent of total applicants hired declined.
Table 49: Recruitment Results for 25th – 29th Arming Classes
25th
Arming 26th
Arming 27th
Arming 28th
Arming 29th
Arming
Time Period 4/1/2012-7/31/2012
8/1/2012-4/1/2013
4/1/2013-11/1/2013
11/1/2013-6/30/2014
7/1/2014 - 1/30/2015
Recruiting Period 4 months 8 months 7 months 7 months 6 months
Test Locations Olympia Statewide Statewide Statewide Statewide
# of Test Dates 17 19 25 30 38
# of Applicants 1,457 2,292 2,153 3,423 2,553
# Hired 38 49 52 50 40
% of Applicants Hired 2.6% 2.1% 2.4% 1.5% 1.6%
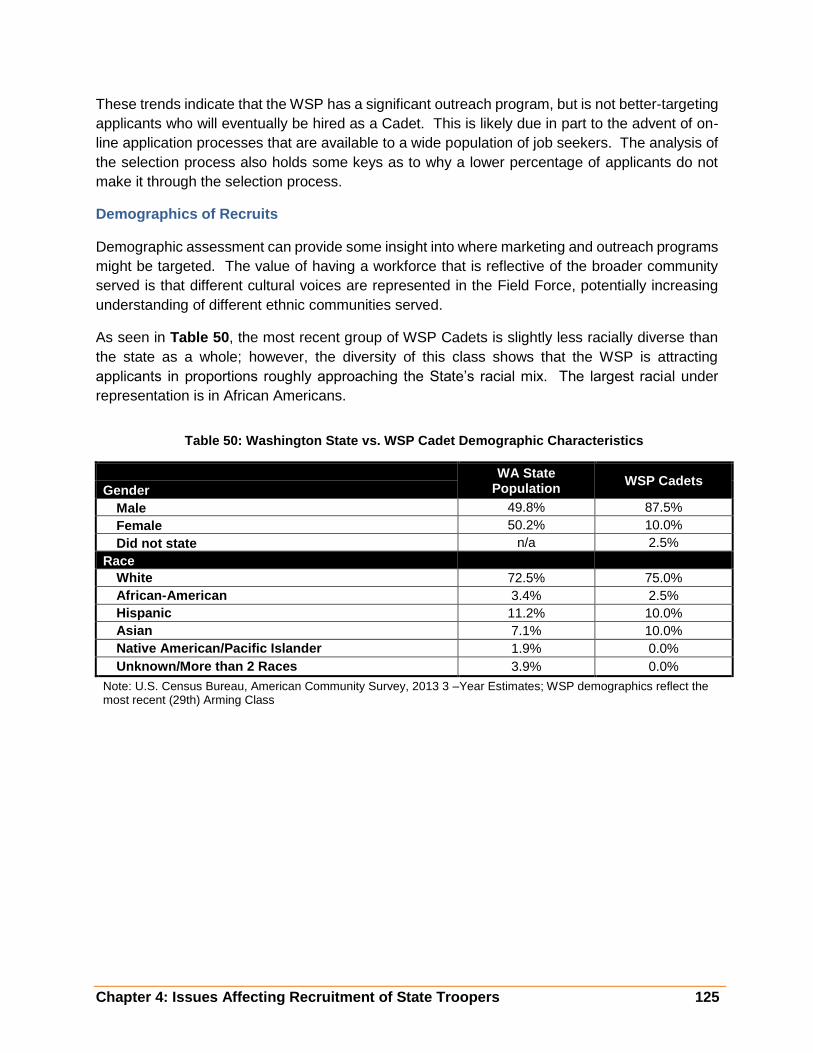
Chapter 4: Issues Affecting Recruitment of State Troopers 125
These trends indicate that the WSP has a significant outreach program, but is not better-targeting
applicants who will eventually be hired as a Cadet. This is likely due in part to the advent of on-
line application processes that are available to a wide population of job seekers. The analysis of
the selection process also holds some keys as to why a lower percentage of applicants do not
make it through the selection process.
Demographics of Recruits
Demographic assessment can provide some insight into where marketing and outreach programs
might be targeted. The value of having a workforce that is reflective of the broader community
served is that different cultural voices are represented in the Field Force, potentially increasing
understanding of different ethnic communities served.
As seen in Table 50, the most recent group of WSP Cadets is slightly less racially diverse than
the state as a whole; however, the diversity of this class shows that the WSP is attracting
applicants in proportions roughly approaching the State’s racial mix. The largest racial under
representation is in African Americans.
Table 50: Washington State vs. WSP Cadet Demographic Characteristics
WA State Population
WSP Cadets Gender
Male 49.8% 87.5%
Female 50.2% 10.0%
Did not state n/a 2.5%
Race
White 72.5% 75.0%
African-American 3.4% 2.5%
Hispanic 11.2% 10.0%
Asian 7.1% 10.0%
Native American/Pacific Islander 1.9% 0.0%
Unknown/More than 2 Races 3.9% 0.0%
Note: U.S. Census Bureau, American Community Survey, 2013 3 –Year Estimates; WSP demographics reflect the most recent (29th) Arming Class

126 Chapter 4: Issues Affecting Recruitment of State Troopers
Table 50 also illustrates that females are much less represented than males, a trend found in
most law enforcement agencies (Table 51). For example, Outreach programs to females and
ethnic minorities should be a focus of future marketing and outreach efforts. Additionally, the
WSP must identify unintended barriers
that limit the interest of candidates,
particularly women and ethnic
minorities. As an example, the project
team through interviews with CJTC
recruits identified a live-in Academy as a
barrier for potential candidates with
children, particularly females. This
concern was also shared by executives
from other agencies with live-in
academies.
Impact of Collective Bargaining Agreement
The project team was asked to evaluate the impact of the collective bargaining agreement (CBA)
on the recruitment process. Cadets are not a part of a CBA. Pay and working conditions for
Cadets are set by the WSP Chief, and are not subject to collective bargaining.
The project team has also reviewed the Washington State Patrol Troopers Association (WSPTA)
agreement, the group which represents Troopers and Sergeants, and did not identify any issues
that would impact the recruitment process beyond total compensation levels as will be separately
addressed. Other issues that could be related to the WSPTA agreement were not raised in any
of the surveys or in interviews with current Cadets.
Findings and Recommendations
Finding #13: The WSP uses traditional law enforcement outreach and marketing strategies that
rely on personal interaction between a potentially qualified candidate and WSP personnel. These
strategies include job fairs, military installation visits, and general public appearances. While these
efforts are worth continuing, the traditional methods generally appeal to those who have some
level of interest in law enforcement. Growth in qualified applicants may rely in reaching out to
youth, women, and ethnic minorities who may not now consider the WSP a career option. Further,
the benefits of the WSP (take-home car, ability to move to different parts of the state) should be
emphasized to help target applicants who will be successful.
Table 51: WSP Cadet v. State Law Enforcement Demographic Characteristics
Male Female
WSP Cadets 49.8% 50.2%
Arizona Highway Patrol 95.5% 4.5%
California Highway Patrol 93.6% 6.4%
Michigan State Police 90.7% 9.3%
Ohio Highway Patrol 91.7% 8.3%
Pennsylvania State Police 94.3% 5.7% Note: Demographic figures for state law enforcement agencies reflect the current force, not just Cadets. Data regarding the demographic breakdown of other agencies’ Cadet classes was not requested.
Benchmark Agency Best Practice: The State of Minnesota has instituted seminars
directed at women joining the State Patrol. Female enlistees speak about specific
experience as a woman in law enforcement along with a panel discussion and questions
from the audience. The first seminar attracted more than 300 women. Of those women,
14 were given conditional offers of employment. More than 500 women have attended
three women's seminars.

Chapter 4: Issues Affecting Recruitment of State Troopers 127
Recommendation 13.1 The WSP should develop a comprehensive outreach and marketing
strategic plan that expands on the success of current strategies and looks for ways to tap into
groups of individuals that do not currently show an interest in the WSP or law enforcement as a
career, such as women and minorities. This will require the use of non-traditional marketing and
outreach methods.
Cost: Outside consultant support may be valuable in evaluating marketing successes in other
locations. Expanded marketing and outreach efforts could need additional resource allocations.
Implementation Hurdles: Staff time is limited, and funding will need to be identified if an outside
consultant is utilized.
Finding #14: The most successful recruitment tool is personal relationships with WSP Troopers.
To improve on recruitment outside of traditional strategies, many agencies across the country
have developed youth-oriented law enforcement academies or magnet schools to create a
pipeline of potential candidates starting as early as grammar school. These programs can also
be feeders into an explorer program. The goal is to expand personal relationships between
department personnel and youth outside of normal channels and then translate those connections
into future careers with the WSP.30
Recommendation 14.1 The WSP should consider reinstating the Explorer program or a similar
youth outreach program, in order to expose teens to the possibility of a career with the WSP. This
may require the expansion of work currently done by recruiters in District offices.
The California Highway Patrol conducts a statewide explorer program
(https://www.chp.ca.gov/chp-careers/explorer) with programs run out of CHP offices throughout
the state. The breadth of the program in Washington would depend on staffing in a District and
the interest in championing the program at the District office level.
Cost: Trooper time to manage the program at the district level. Pay for state Administrative
Assistant or Program Specialist job classes range from $15.00 to $22.00 per hour. Eight people
working half-time on the Explorer program would cost up to $225,000 per year.
Implementation Hurdles: Limited staff resources due to recent attrition issues. Need to address
employee satisfaction issues to make this most successful.
Finding #15: Survey results identify WSP personnel as influential in the recruitment process.
The ability to expand recruitment relationships will require effort by more Troopers than are
currently assigned recruiting duties in the Districts.
Recommendation 15.1 Identify staff who have the skills, ability, and desire to function as both
formal and informal recruiters. Not everyone desires to be a recruiter nor does everyone have
the skills to undertake that role. The pool of Troopers used for recruitment activities should be
increased and the role enhanced to include higher levels of youth and community engagement.
30 At the time of high school graduation, students are generally not yet eligible to become Troopers because of the age requirement.
128 Chapter 4: Issues Affecting Recruitment of State Troopers
Additionally, Troopers should be trained, evaluated, and rewarded on recruitment techniques and
efforts. The job of recruiting should not be shouldered solely by the recruitment officers, but by all
who have the ability to role model, mentor, and coach.
Cost: Minimal cost expected. Requires training time and material.
Implementation Hurdles: Need to address employee satisfaction issues to make this most
successful.
Finding #16: Patrol recruitment staff currently poll applicants about how they found out about
the WSP, but they do not keep statistics on the success of each outreach and marketing method
as they relate to attracting applicants who eventually become Troopers.
Recommendation 16.1 Recruitment staff should continue tracking how applicants find the WSP
as well as how successful each outreach method is in terms of yielding new Troopers (for
example, a higher percentage of hired Cadets found out about the WSP from the website than
did the general applicant population). This feedback spanning the steps from applicant to
successful Cadet to Trooper should then be used to inform future outreach efforts and help direct
the limited resources of the agency.
Cost: No identified cost.
Implementation Hurdles: None identified.
Finding #17: Potential law enforcement candidates are researching potential employers before
applying for a position or accepting a conditional job offer. As identified in survey results, the
primary research tool is the website. The WSP website is linear in design and rigid in appearance.
The WSP home page showing nine troopers standing erect and not smiling presents an
unapproachable image of the WSP. In contrast, the website of the California Highway Patrol is
graphically appealing and focuses on the many social media links frequently used by potential
candidates. An example of a graphically stimulating—through large link buttons—is the U.S.
Secret Service web site.
Recommendation 17.1 The WSP should redesign its website to engage viewers with an
emphasis on creating a positive and welcoming environment. The WSP should include videos
that demonstrate the full range of duties performed by the Patrol.
Cost: Varies based on approach used and availability of existing staff. Engaging outside web-
design help could be in the range of $25,000 or more.
Implementations Hurdles: Website changes need to be consistent for the agency, and must be
approved, ultimately, by executive management.

Chapter 4: Issues Affecting Recruitment of State Troopers 129
SELECTION PROCESS
The selection process is critical in the overall course of recruitment. A selection process that is
too slow or too restrictive will result in fewer hires of qualified applicants.
The WSP uses a winnowing process that identifies applicants who do not meet minimum
requirements to be a Trooper. This process is similar to other agencies benchmarked for this
study, with many standards required by State statute (e.g., physical ability, polygraph, and
psychological assessments). The steps in the WSP process are followed by all six state
benchmark agencies, with the exception of Minnesota which is not allowed to use polygraph
exams by law. The current selection process is shown in Figure 29 on page 131.
Passage rates at each stage of the selection process vary year-to-year, but remain fairly
consistent within each selection category. The project team also obtained information on the
selection process and passage rates from the benchmarked State Patrol agencies. Most of the
comparator agencies have, for the most part, similar results through the process. One area that
stands out as distinct for the WSP, however, is psychological testing – where the WSP pass rate
is markedly low. The project team spent additional time researching the psychological testing
area, and provides an expanded discussion of this below.
Recent Changes in the Selection Process
WSP Human Resources staff has recently made changes to the selection process that are
expected to help expedite candidates through the selection process. These changes include:
Use of Public Safety Testing (PST), a private agency, for the written and physical ability
testing portion of the selection process. This is a service used by most law enforcement
agencies in Washington State and allows for more flexibility in evaluating candidates who
might also be testing in other agencies.
Use of NEOGOV application. This portal is used for all state job applications and is a
common application for use by any law enforcement agency in the State.
Changing the order of the oral interview until after the background check. This
allows staff to focus interviews on candidates who meet the minimum written, physical,
and background requirements and allows the ability to offer an immediate conditional offer
of employment after the interview.
Process Timing
In a majority of cases, applicants for the WSP are also applicants to other law enforcement
agencies. As previously shown, approximately 40 percent of all applicants chose their agency
based on where they were first offered a job. This means that the duration of time between
application and receipt of a conditional job offer can be critical in securing a Cadet.
The time to complete the selection process varies from applicant to applicant, but on the whole
the median time to hire is 130 days, or 18.5 weeks (see Figure 28); however, this can be

130 Chapter 4: Issues Affecting Recruitment of State Troopers
accelerated as needed and has been completed in as little as 31 days. The primary delays in the
process occur during the background check and the psychological testing phases. Overall, the
WSP selection process is efficient and moves candidates through at a faster-than-average pace
to a conditional hire than do most of the benchmarked State Patrol agencies, with reported times
from application to hire of eight to 12 months.
Note: Median days to complete process based on pre-August 1st data. Since then, the oral interview has moved to
after the background check.
Table 52 shows the wait times for other state law enforcement agencies.
Table 52: State Law Enforcement Agency Wait Times
Wait time between
application and acceptance to
Academy
Wait time between acceptance into Academy and commission
Washington State Patrol 4.5 months 8.5 to 18 months
Arizona Highway Patrol N/A 5.25 months
California Highway Patrol 12 months 18 months
Michigan State Police 8 months 5.5 months
Minnesota State Patrol 8 months 3 months
Ohio Highway Patrol 12 months 18 months
Pennsylvania State Police 9-12 months N/A
712
50.5
30
11
24
0
10
20
30
40
50
60
OralInterview
Polygraph Background Psych Exam Medical ConditionalHire
Days
Figure 28: Median Days to CompleteCadet Selection Process
Days to Complete
Median Days to Hire = 130

Chapter 4: Issues Affecting Recruitment of State Troopers 131
Communication with Applicants
Once a prospective recruit submits a written application, District recruitment staff follow up with a
phone call to schedule a polygraph test. Throughout the process, all scheduling is handled via
phone with District recruiters. Once an applicant is in the NEOGOV system, follow up is provided
by email through that system.
Process Steps. With the recent transition to Public Safety Testing (PST) for the written and
physical abilities portions of the selection process, pass rates shown in Tables 53 & 54 are
expected to improve. It is reasonable to anticipate that passing rates with the new PST selection
process for the written and physical ability tests should normalized with local law enforcement
agencies as illustrated in Table 53.
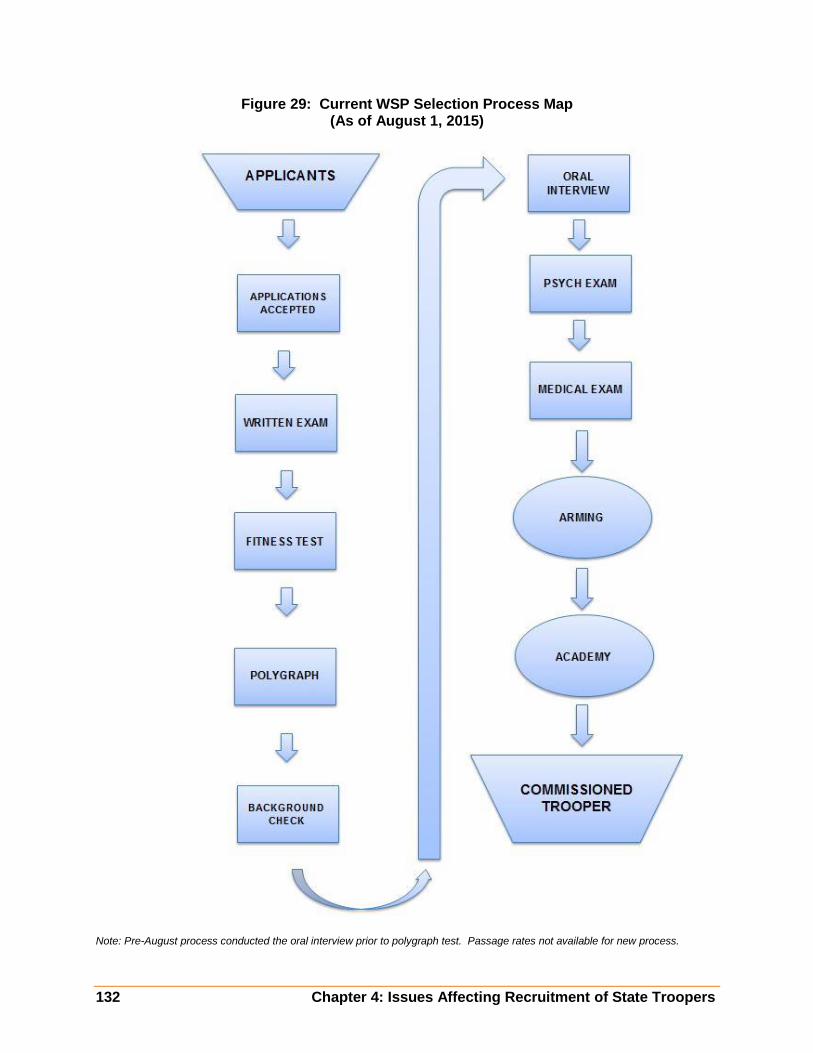
132 Chapter 4: Issues Affecting Recruitment of State Troopers
Figure 29: Current WSP Selection Process Map (As of August 1, 2015)
Note: Pre-August process conducted the oral interview prior to polygraph test. Passage rates not available for new process.
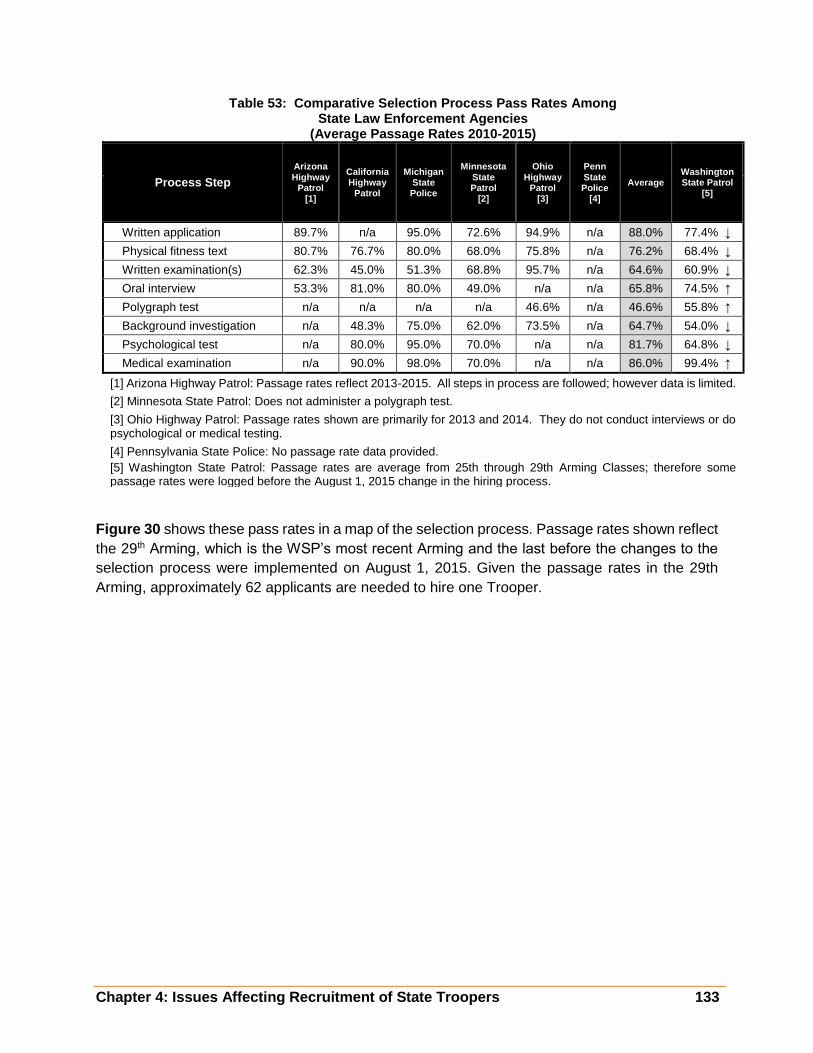
Chapter 4: Issues Affecting Recruitment of State Troopers 133
Table 53: Comparative Selection Process Pass Rates Among State Law Enforcement Agencies
(Average Passage Rates 2010-2015)
Process Step
Arizona Highway
Patrol [1]
California Highway
Patrol
Michigan State Police
Minnesota State Patrol
[2]
Ohio Highway
Patrol [3]
Penn State Police
[4]
Average Washington State Patrol
[5]
Written application 89.7% n/a 95.0% 72.6% 94.9% n/a 88.0% 77.4% ↓
Physical fitness text 80.7% 76.7% 80.0% 68.0% 75.8% n/a 76.2% 68.4% ↓
Written examination(s) 62.3% 45.0% 51.3% 68.8% 95.7% n/a 64.6% 60.9% ↓
Oral interview 53.3% 81.0% 80.0% 49.0% n/a n/a 65.8% 74.5% ↑
Polygraph test n/a n/a n/a n/a 46.6% n/a 46.6% 55.8% ↑
Background investigation n/a 48.3% 75.0% 62.0% 73.5% n/a 64.7% 54.0% ↓
Psychological test n/a 80.0% 95.0% 70.0% n/a n/a 81.7% 64.8% ↓
Medical examination n/a 90.0% 98.0% 70.0% n/a n/a 86.0% 99.4% ↑
[1] Arizona Highway Patrol: Passage rates reflect 2013-2015. All steps in process are followed; however data is limited.
[2] Minnesota State Patrol: Does not administer a polygraph test.
[3] Ohio Highway Patrol: Passage rates shown are primarily for 2013 and 2014. They do not conduct interviews or do psychological or medical testing.
[4] Pennsylvania State Police: No passage rate data provided.
[5] Washington State Patrol: Passage rates are average from 25th through 29th Arming Classes; therefore some passage rates were logged before the August 1, 2015 change in the hiring process.
Figure 30 shows these pass rates in a map of the selection process. Passage rates shown reflect
the 29th Arming, which is the WSP’s most recent Arming and the last before the changes to the
selection process were implemented on August 1, 2015. Given the passage rates in the 29th
Arming, approximately 62 applicants are needed to hire one Trooper.

134 Chapter 4: Issues Affecting Recruitment of State Troopers
Figure 30: Pre-August 2015 WSP Selection Process Map with 29th Arming Passage Rates
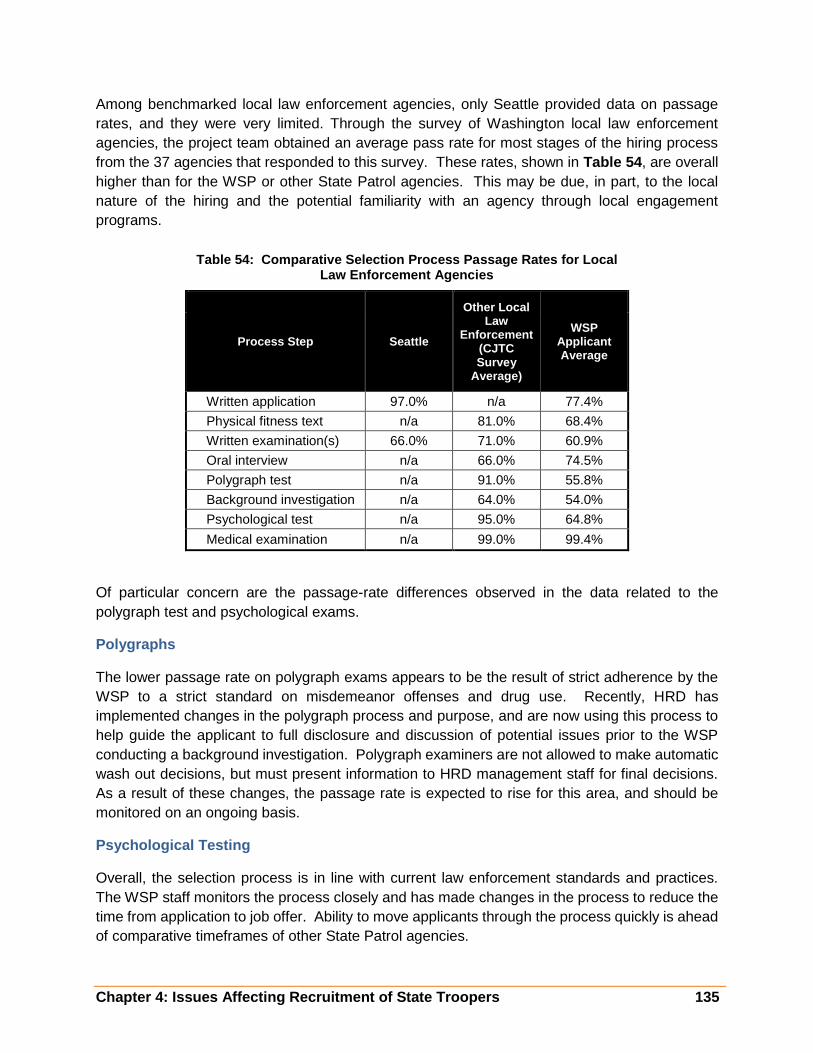
Chapter 4: Issues Affecting Recruitment of State Troopers 135
Among benchmarked local law enforcement agencies, only Seattle provided data on passage
rates, and they were very limited. Through the survey of Washington local law enforcement
agencies, the project team obtained an average pass rate for most stages of the hiring process
from the 37 agencies that responded to this survey. These rates, shown in Table 54, are overall
higher than for the WSP or other State Patrol agencies. This may be due, in part, to the local
nature of the hiring and the potential familiarity with an agency through local engagement
programs.
Table 54: Comparative Selection Process Passage Rates for Local Law Enforcement Agencies
Process Step Seattle
Other Local Law
Enforcement (CJTC Survey
Average)
WSP Applicant Average
Written application 97.0% n/a 77.4%
Physical fitness text n/a 81.0% 68.4%
Written examination(s) 66.0% 71.0% 60.9%
Oral interview n/a 66.0% 74.5%
Polygraph test n/a 91.0% 55.8%
Background investigation n/a 64.0% 54.0%
Psychological test n/a 95.0% 64.8%
Medical examination n/a 99.0% 99.4%
Of particular concern are the passage-rate differences observed in the data related to the
polygraph test and psychological exams.
Polygraphs
The lower passage rate on polygraph exams appears to be the result of strict adherence by the
WSP to a strict standard on misdemeanor offenses and drug use. Recently, HRD has
implemented changes in the polygraph process and purpose, and are now using this process to
help guide the applicant to full disclosure and discussion of potential issues prior to the WSP
conducting a background investigation. Polygraph examiners are not allowed to make automatic
wash out decisions, but must present information to HRD management staff for final decisions.
As a result of these changes, the passage rate is expected to rise for this area, and should be
monitored on an ongoing basis.
Psychological Testing
Overall, the selection process is in line with current law enforcement standards and practices.
The WSP staff monitors the process closely and has made changes in the process to reduce the
time from application to job offer. Ability to move applicants through the process quickly is ahead
of comparative timeframes of other State Patrol agencies.

136 Chapter 4: Issues Affecting Recruitment of State Troopers
As seen in Figure 28, however, the psychological exam has been a bottleneck in the process,
with a median of thirty days to complete. This is partly due to the fact that all testing is performed
by a single State Psychologist. Additionally, if the Psychologist is out sick or on vacation, testing
does not occur. Because the exam is performed at the end of the selection process, a prospective
candidate has already been through a series of hurdles, including an oral interview, polygraph,
and an extensive background check.
Most other agencies surveyed use contract Psychologists for the psychological exam. An
informal survey identified five contract Psychologists who perform pre-employment exams for
local law enforcement agencies.
Over the last five Arming Class recruitments, 38.4 percent of applicants referred for a
psychological exam failed the exam. On average, the comparative State Patrol agencies used in
this study reported an average passage rate of 81.7 percent compared to WSP’s 68.1 percent.
For every 100 candidates, an additional 13 candidates do not pass through WSP’s step in the
process in comparison to other State Patrol agencies. This difference is significant and results in
the disqualification of a number of otherwise-qualified candidates. Some of the failed applicants
have been successfully hired by local law enforcement after having passed these agencies’
psychological exam.
The purpose of the psychological examination is to determine a candidate’s suitability for law
enforcement. The professionally accepted process for determining the psychological suitability
of prospective law enforcement personnel consists of integrating information from five sources:
(1) job information, (2) written assessments, (3) personal history information, (4) psychological
interview, and (5) psychological records, if warranted. Professional standards and some states’
requirements, such as the State of California require that a minimum of two written assessment
instruments be used, one designed to identify patterns of abnormal behavior and the other
designed to assess normal behavior.
The WSP psychological exam process consists of all recommended elements. Applicants
complete a Personal History form, the MMPI-2 (Minnesota Multiphasic Personality Inventory-2),
the IS5-R (Inwald Survey 5-Version R), IS2 (Inwald Survey 2), IPI (Inwald Personality Inventory,
HPP/SQ (Hilson Personnel Profile/Success Quotient), and the PAR (Personality Assessment
Inventory); however, about 95% of the decision is based upon the MMPI-2. Following completion
of the paper process, there is an approximately one hour interview with the psychologist, after
which he makes a decision to list the applicant as recommended, marginal, or not recommended.
The project team reached out to several Psychologists to discuss best practices in this regard,
and most are now using the MMPI-2RF (Minnesota Multiphasic Personality Inventory-2
Restructured Form, an updated personality test that is normalized for law enforcement personnel.
Additionally, this test is shorter (338 items as compared to 567 items in the MMPI-2) thus allowing
for quicker administration time, and can be administered via computer in the Psychologist’s office
with immediate results available.

Chapter 4: Issues Affecting Recruitment of State Troopers 137
Local law enforcement agencies responding to a survey reported high pass rates, with 28 of 31
agencies having pass rates at 90 percent or higher. A nationwide study in 2003 found passage
rates of 95 percent31.
Findings and Recommendations
Finding #18: Candidates have been removed from the selection process through the pre-
polygraph interview for disqualifying conduct before the circumstances surrounding the conduct
can be evaluated on an individual basis. Although it is not official policy, it appears that it has
been WSP’s practice to reject candidates at the pre-polygraph interview when the candidate
admits to ‘disqualifying conduct’ such as misdemeanor convictions or past drug use.
Recommendation 18.1 Except as required by law, the WSP should change their criteria from
an absolute rejection of a candidate for any and all misdemeanor convictions and drug use to a
case-by-case review of the individual’s circumstances. This allows for consideration of
extenuating circumstances without lowering any ethical standard. The background check follows
the polygraph exam, and issues raised in the polygraph can be followed up and addressed, if
necessary.
Cost: No expected cost.
Implementation Hurdles: None identified.
Finding #19: Over the last five Arming Classes, the WSP has failed 38 percent of its recruits on
the psychological exam -- a level well above the national and local law enforcement average of 5
percent32 and above the State Patrol benchmark agency failure rate of 18 percent. Also, the tests
WSP uses for the psychological evaluation are not the current national standard tests, which are
normalized for law enforcement personnel.
Recommendation 19.1 The WSP should review the psychological testing portion of the selection
process to bring the testing protocols in line with contemporary national standards as well as to
determine possible causes for the high failure rate. The review should include possible trends in
applicant failures, the number of testing providers, the test administered, and the process as
compared to other jurisdictions33.
Cost: Potential small cost in changing psychological tests.
Implementation Hurdles: Testing methodology is determined by WSP’s Psychologist.
31 “Psychological Testing and the Selection of Police Officers: A National Survey” (Robert E. Cochrane, 2003) 32 “Psychological Testing and the Selection of Police Officers: A National Survey” 33 Commission on Peace Officer Standards and Training, “Peace Officer Psychological Screening Manual,” https://post.ca.gov/peace-officer-psychological-screening-manual.aspx

138 Chapter 4: Issues Affecting Recruitment of State Troopers
Finding #20: All psychological testing is done by the WSP’s Psychologist. Testing occurs during
recruitment periods for the Arming Class, which can create a backlog for testing that results in a
bottleneck in the selection process.
Recommendation 20.1 The WSP should contract with outside Psychologists to assist the WSP’s
Psychologist during peak hiring times and eliminate delays in the overall process. Additionally,
the WSP should consider transitioning away from an employee provider to a contract provider.
(Note: this recommendation is only related to the psychological testing portion of the selection
process which happens once or twice a year, and is not a recommendation to eliminate the State
Psychologist position).
Cost: Additional cost for contract Psychologists range from $350 to $500 per applicant tested.
Total cost will vary based on number of applicants assigned to contractors. At the high estimate,
testing of 20 applicants would cost approximately $10,000. With recent applicant levels,
eventually contracting out the entire psychological testing for the WSP should be $100,000 or less
per year.
Implementation Hurdles: The testing process is currently the responsibility of the WSP’s
Psychologist.
95.0% 95.0%
80.0%
64.8%
0.0%
10.0%
20.0%
30.0%
40.0%
50.0%
60.0%
70.0%
80.0%
90.0%
100.0%
CJTC SurveyRespondents
Michigan StatePolice
CaliforniaHighway Patrol
WSP
Figure 31: Comparative Psychological Exam Passage Rates (2010 - 2015)

Chapter 4: Issues Affecting Recruitment of State Troopers 139
TRAINING PROCESS
Once a candidate is selected for hire, they enter the WSP as Cadets. The process of moving
from a Cadet to a Trooper entails completing several training regimes, as described below:
1. Initial Hiring (up to 9 months):
Once a Cadet is hired, they work at various jobs within the WSP until the next Arming Class is scheduled. The time spent in these positions varies, but are not longer than the nine months between Arming Classes. Cadets working in the field participate in a ride-along program for 16 hours. During this time the Trooper Cadets ride with a veteran Trooper to familiarize themselves on the tasks Troopers have to face in the field and better prepare themselves for training.
2. Arming Class (7 – 8 weeks): Arming Class training is generally seven weeks long and this training prepares the Cadets to either go into the field filling one of 15 security assignments within the State’s Special Operations unit or to enter the Trooper Basic Academy one week later. Once through the Arming Class, a Cadet is not guaranteed a spot in Trooper Basic because of the contractual obligation to fill the 15 security positions. There is a one week break between the Arming Class and the Trooper Basic Academy.
3. Trooper Basic Academy (18 weeks):
The Trooper Basic Academy, conducted at the Washington State Patrol Academy in Shelton, takes approximately 18 weeks. During this period Cadets are trained on firearms, driving, self-defense, collision investigation, first aid, traffic and criminal law, water survival, and physical fitness. This is a live-in facility during the week.
4. Field Training (8 weeks):
The final portion of the Trooper Basic Academy consists of eight weeks of field training. During the training, the Cadets ride with a Field Training Officer (FTO). They are evaluated on the different aspects of the job that includes their judgment related to self-initiated enforcement activity, driving, report writing, and investigation. Following the field training, a Cadet is commissioned as a Trooper.
From the time a Cadet starts the Arming Class, the total training to become a Trooper can range
from 34 weeks—if a Cadet goes straight through— to approximately 73 weeks or more— if a
Cadet is one of the 15 Cadets deployed as security guards in the State’s Special Operations
Division. Because Cadets are not selected for security detail until the end of the Arming Class,
Up to 9 months
Applicant Hired
8
Weeks
ArmingClass
18
Weeks
Trooper Basic
Adacemy
8
Weeks
Field Training Commissioning
Security Assignment
From each Arming Class, 15 Cadets are
chosen to serve a security detail until the
following Trooper Basic Training 9 months
later.

140 Chapter 4: Issues Affecting Recruitment of State Troopers
the possibility of being assigned to a security detail creates a level of uncertainty for Cadets that
is not faced in local law enforcement agencies.
Separate Arming and Trooper Basic Academy Classes
The practice of offering an Arming Class separate from the basic Academy training class is not
one followed by any of the benchmark State Patrol agencies, and appears to be primarily
associated with the need to fill the 15 contractual security positions (formerly, this was a total of
39 contract positions), as these Cadets are required to carry a gun for those assignments.
Laterals. The WSP does not accept lateral peace officers. If law enforcement officers from
different agencies want to become WSP Troopers, they are be required to go through the entire
training program. This is a significant deterrent to attracting lateral hires. Additionally, a recruit
who has completed the CJTC Academy and wants to become a Trooper would also be required
to go through the WSP training Academy in its entirety.
Academy Style
There are two general philosophies of training Academy instruction that are used in law
enforcement: 1) the “warrior” model, which is a traditional military-style academy with strictly-
enforced rules of behavior and conduct, including physical punishment (e.g. forced exercise) to
enforce rules, and 2) The “guardian” model which focuses more on teaching and coaching than
strict discipline. The WSP Academy seeks to incorporate elements of both the warrior and
guardian models in their academy.
As shown in Table 55, the use of a mix of the two training models is most common among the
state patrol agencies surveyed. California, which has a warrior style academy, is reported to be
reviewing this practice.
As shown in Table 53, the use of a mix of the two training models is most common among the
state police agencies surveyed. California, which has a warrior style academy, is reported to be
reviewing this practice.
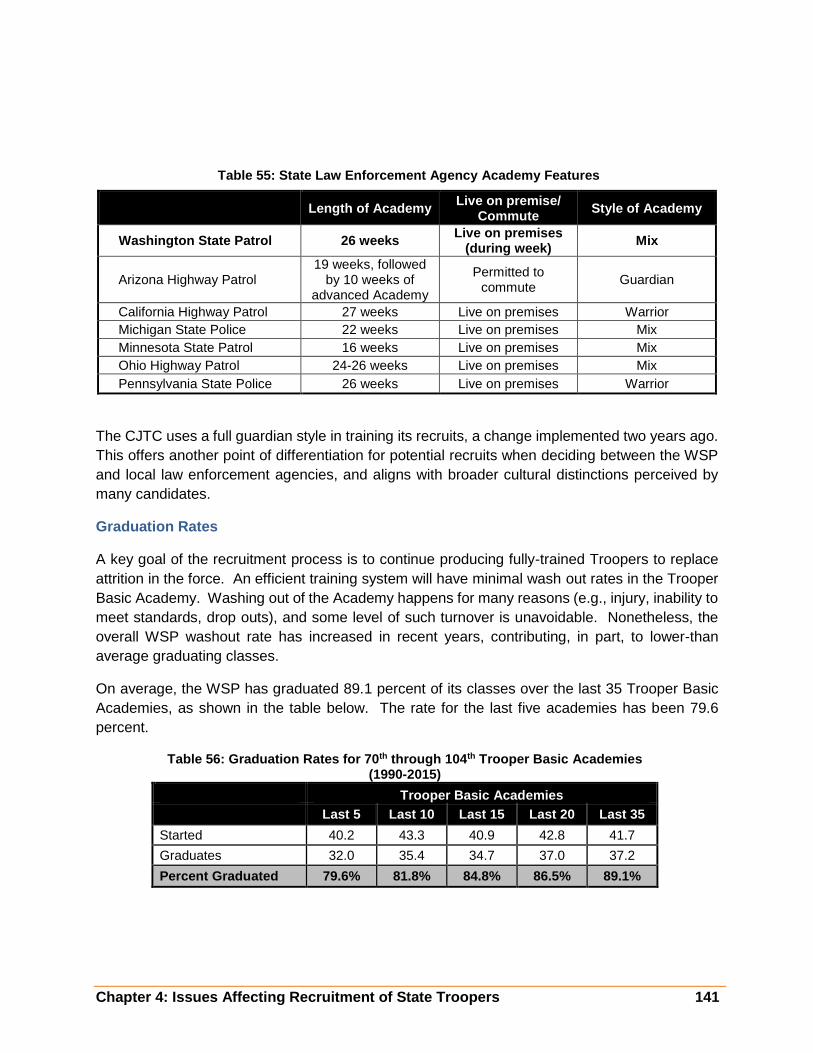
Chapter 4: Issues Affecting Recruitment of State Troopers 141
Table 55: State Law Enforcement Agency Academy Features
Length of Academy Live on premise/
Commute Style of Academy
Washington State Patrol 26 weeks Live on premises
(during week) Mix
Arizona Highway Patrol 19 weeks, followed
by 10 weeks of advanced Academy
Permitted to commute
Guardian
California Highway Patrol 27 weeks Live on premises Warrior
Michigan State Police 22 weeks Live on premises Mix
Minnesota State Patrol 16 weeks Live on premises Mix
Ohio Highway Patrol 24-26 weeks Live on premises Mix
Pennsylvania State Police 26 weeks Live on premises Warrior
The CJTC uses a full guardian style in training its recruits, a change implemented two years ago.
This offers another point of differentiation for potential recruits when deciding between the WSP
and local law enforcement agencies, and aligns with broader cultural distinctions perceived by
many candidates.
Graduation Rates
A key goal of the recruitment process is to continue producing fully-trained Troopers to replace
attrition in the force. An efficient training system will have minimal wash out rates in the Trooper
Basic Academy. Washing out of the Academy happens for many reasons (e.g., injury, inability to
meet standards, drop outs), and some level of such turnover is unavoidable. Nonetheless, the
overall WSP washout rate has increased in recent years, contributing, in part, to lower-than
average graduating classes.
On average, the WSP has graduated 89.1 percent of its classes over the last 35 Trooper Basic
Academies, as shown in the table below. The rate for the last five academies has been 79.6
percent.
Table 56: Graduation Rates for 70th through 104th Trooper Basic Academies (1990-2015)
Trooper Basic Academies
Last 5 Last 10 Last 15 Last 20 Last 35
Started 40.2 43.3 40.9 42.8 41.7
Graduates 32.0 35.4 34.7 37.0 37.2
Percent Graduated 79.6% 81.8% 84.8% 86.5% 89.1%

142 Chapter 4: Issues Affecting Recruitment of State Troopers
Table 57 shows the benchmark agencies’ graduation rates for 2010 through 2015. Graduation
rates vary considerably between states, with the Washington State Patrol at the higher end of the
range, with fairly consistent graduation rates.
Table 57: Comparative Academy Graduation Rates for State Law Enforcement Agencies (Average 2010 through 2015)
Arizona Highway
Patrol
California Highway Patrol [1]
Michigan State Police
Minnesota State
Patrol [2]
Ohio Highway
Patrol
Penn State Police
WSP [3]
2010 n/a 57.5% n/a 87.2% 72.7% 91.4% 90.0%
2011 n/a n/a n/a n/a 75.0% 87.1% 74.6%
2012 n/a 56.3% 44.9% 79.2% 68.5% 78.2% 78.7%
2013 93.8% 66.4% 89.0% 84.4% 48.5% 87.9% 91.2%
2014 78.8% 62.4% 68.5% 89.3% 54.2% 86.3% 86.7%
2015 73.6% 55.8% 61.3% n/a 84.8% 81.0% 78.0%
Average 82.1% 59.7% 65.9% 85.1% 67.3% 85.3% 83.2%
[1] California Highway Patrol: Because more than one Academy is held in a year, figures shown for 2010 and 2012-2014 reflect an average graduation rate for all academies held in that year.
[2] Minnesota State Patrol: Washout rates based on Academy capacity, rather than actual Academy class size. Academy class size was not provided.
[3] Washington State Patrol: Because Trooper Basic Academy classes often span calendar years, the washout rates for 2010 and 2013 are based on an average of two Trooper Basic classes that also took place in portions of 2009, 2011, 2012, and 2014.
Training Costs
The Trooper Basic Academy is located in Shelton, WA approximately 25 miles from Olympia. The
Academy is a live-in academy during the week, with Cadets free to go home on the weekends.
The overall cost of running the Academy in Fiscal Year 2016 is $6.2 million. That cost includes
in-service training, outside training, and costs associated with both the Arming Classes and
0
10
20
30
40
50
60
7070
th
71
st
72
nd
73
rd
74
th
75
th
76
th
77
th
78
th
79
th
80
th
81
st
82
nd
83
rd
84
th
85
th
86
th
87
th
88
th
89
th
90
th
91
st
92
nd
93
rd
94
th
95
th
96
th
97
th
98
th
99
th
10
0th
10
1st
10
2nd
10
3rd
10
4th
Cad
ets
Trooper Basic Academies
Figure 32: Trooper Basic AcademyGraduates
Graduated Failed to Graduate

Chapter 4: Issues Affecting Recruitment of State Troopers 143
Trooper Basic Academy. The cost of operating the Arming Classes and Trooper Basic is
approximately $4.8 million of the total.
The WSP budget office provides an annual calculation of cost per Trooper for training from the
Arming Class through field training. On average in 2016, the WSP’s cost of training per Cadet is
$153,100 for the 34 weeks of training – inclusive of vehicle, uniform, gun, allocated trainer and
facility costs, meals, and Cadet pay.
The cost of adding an additional Cadet to the Academy is known as the marginal cost and lower
than the average cost, as many of the costs of the Academy are fixed and do not fluctuate by the
number of Cadets in attendance. The cost of adding one more Cadet to a training class is the
sum of the additional cost to pay, feed, and outfit that Cadet.
Table 58 provides an estimate of the marginal cost based on the analysis provided by the WSP
budget office, separating out the direct costs incurred when adding one more Cadet. Based on
this analysis, the marginal cost of training a Cadet is $57,600.
Table 58: Average and Marginal Cost of Training
Total Marginal
Cadet Salary and Benefits:
Salary [1] $29,700 $29,700
Benefits $13,400 $13,400
Total Salary and Benefits $43,100 $43,100
Cadet Training Costs:
Instructor and Classroom $4,100 $0
Lodging $5,800 $0
Meals $5,100 $5,100
Training Vehicle Costs $1,000 $1,000
Field Training Vehicle Costs [2] $3,500 $0
Field Training Officer Salaries/Benefits $14,500 $0
Total Training Costs: $34,000 $6,100
Equipment, Uniforms, and Misc.
Outfitting (uniforms, guns, etc.) [3] $6,900 $6,400
Radios $12,900 $0
Vehicle $54,200 $0
Relocation Costs $2,000 $2,000
Total Equipment, Uniform, and Misc. costs
$76,000 $8,400
Total Per Cadet $153,100 $57,600
[1] Based on 34 weeks of salary
[2] Allocated cost of vehicle during field training. Uses existing vehicles.
[3] The $500 cost of the gun is excluded, as it can be reissued and is not “lost” is the Cadet does not
graduate from the Academy. Other costs of outfitting are not defined.

144 Chapter 4: Issues Affecting Recruitment of State Troopers
Impact of Attrition. As the sole method of replacing Troopers, training is a basic cost of doing
business for the agency. With current vacancies and the coming retirement bubble, the WSP
training needs will remain high due to projected retirements. Reducing attrition of early- and mid-
career Troopers will reduce the strain on the Field Force Troopers, but an increased number of
Cadets will still need to be trained in the Academy to reach authorized Field Force levels.
Findings and Recommendations
Finding #21: The WSP’s practice of conducting an Arming Class separate from the Trooper
Basic Academy is done primarily to fill 15 security positions (eleven in the Governor’s Mansion
and Office, and four contractual positions). This can leave Cadets uncertain about timing to
become a Trooper and extends their time at the lower-paying Cadet position for an additional nine
months. This practice places a higher priority on the contractual positions than on Trooper
positions in the field. An unintended consequence of this uncertainty could be the reluctance of
candidates with families or financial obligations to apply to the WSP.
Recommendation 21.1 The WSP should merge the Arming Class and Trooper Basic Academy
into a single class and move all Cadets through this program and into Trooper positions as soon
as possible. Merging the Arming Class and Trooper Basic Academy into a single course will
provide the WSP with more flexibility in terms of the number of training academies it can run, but
will also require a different model to staff the contracted security positions, such as hiring retired
Troopers.
With this approach, the WSP may have to fulfill its contractual security requirements under a
different model. Many states, for example, use a different classification from State Police for
similar security functions – such as the Capitol Police Officers employed by the Commonwealth
of Pennsylvania at lower compensation levels than Pennsylvania State Police.
Cost: Merging the Arming Class and Trooper Basic will result in a shorter training period, by
eliminating the week between the two classes. If the WSP increases the number of Academy
classes and Cadets trained, there will be a corresponding increase in costs. The marginal cost
of training a Cadet is approximately $56,600. The cost of increased Cadets in the Trooper Basic
Academy was formerly offset by accrued vacancy savings in the current biennium. The
Legislature has already reduced the WSP budget by the anticipated vacancy savings, when
enacting the 2015-17 budget. As a result, the cost of additional hiring will require additional
appropriations.
Implementation Hurdles: Operating two academies per year places more stress on the training
Academy instructors.
Recommendation 21.2 The WSP should continue using the Cadet job classification to allow for
entry level employment into the agency, but should consider repurposing Cadets who are too
young (Troopers must be 21), or otherwise not ready to be a Trooper, into District-level positions
that perform duties currently performed by Troopers that do not require law enforcement officer
certification. Similar to a Community Service Officer position in some municipal agencies, this
system will allow the WSP to increase the workforce in district offices, addressing current vacancy
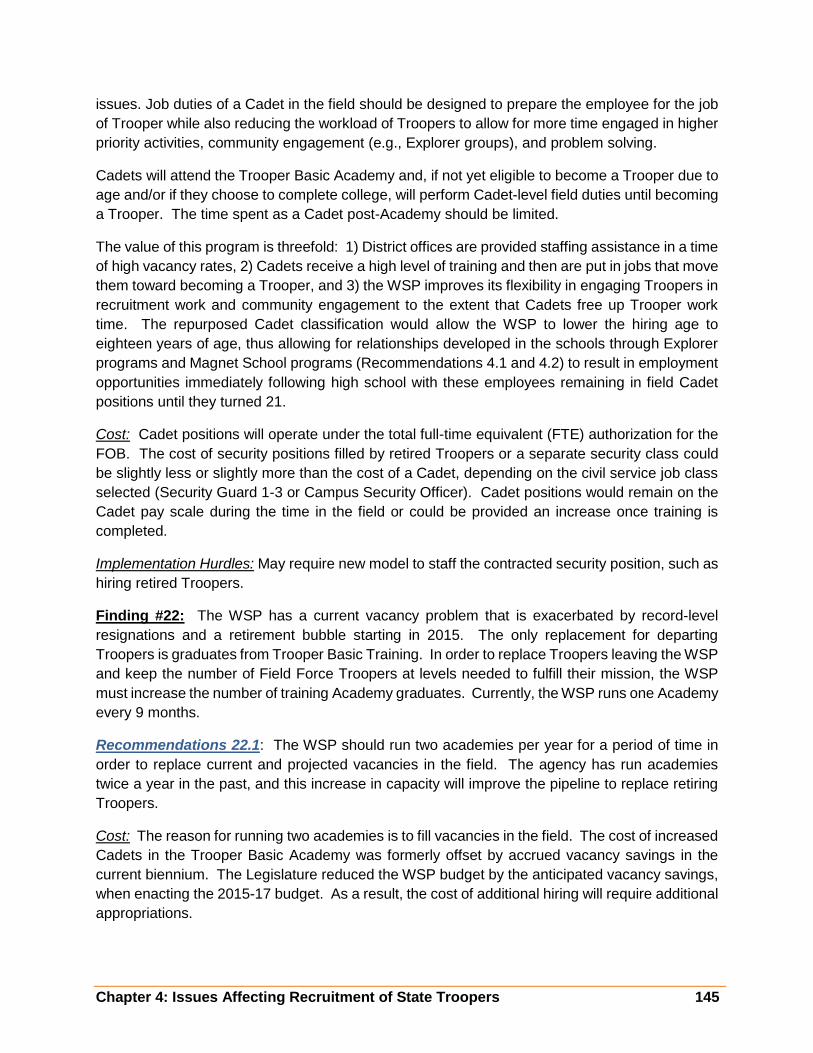
Chapter 4: Issues Affecting Recruitment of State Troopers 145
issues. Job duties of a Cadet in the field should be designed to prepare the employee for the job
of Trooper while also reducing the workload of Troopers to allow for more time engaged in higher
priority activities, community engagement (e.g., Explorer groups), and problem solving.
Cadets will attend the Trooper Basic Academy and, if not yet eligible to become a Trooper due to
age and/or if they choose to complete college, will perform Cadet-level field duties until becoming
a Trooper. The time spent as a Cadet post-Academy should be limited.
The value of this program is threefold: 1) District offices are provided staffing assistance in a time
of high vacancy rates, 2) Cadets receive a high level of training and then are put in jobs that move
them toward becoming a Trooper, and 3) the WSP improves its flexibility in engaging Troopers in
recruitment work and community engagement to the extent that Cadets free up Trooper work
time. The repurposed Cadet classification would allow the WSP to lower the hiring age to
eighteen years of age, thus allowing for relationships developed in the schools through Explorer
programs and Magnet School programs (Recommendations 4.1 and 4.2) to result in employment
opportunities immediately following high school with these employees remaining in field Cadet
positions until they turned 21.
Cost: Cadet positions will operate under the total full-time equivalent (FTE) authorization for the
FOB. The cost of security positions filled by retired Troopers or a separate security class could
be slightly less or slightly more than the cost of a Cadet, depending on the civil service job class
selected (Security Guard 1-3 or Campus Security Officer). Cadet positions would remain on the
Cadet pay scale during the time in the field or could be provided an increase once training is
completed.
Implementation Hurdles: May require new model to staff the contracted security position, such as
hiring retired Troopers.
Finding #22: The WSP has a current vacancy problem that is exacerbated by record-level
resignations and a retirement bubble starting in 2015. The only replacement for departing
Troopers is graduates from Trooper Basic Training. In order to replace Troopers leaving the WSP
and keep the number of Field Force Troopers at levels needed to fulfill their mission, the WSP
must increase the number of training Academy graduates. Currently, the WSP runs one Academy
every 9 months.
Recommendations 22.1: The WSP should run two academies per year for a period of time in
order to replace current and projected vacancies in the field. The agency has run academies
twice a year in the past, and this increase in capacity will improve the pipeline to replace retiring
Troopers.
Cost: The reason for running two academies is to fill vacancies in the field. The cost of increased
Cadets in the Trooper Basic Academy was formerly offset by accrued vacancy savings in the
current biennium. The Legislature reduced the WSP budget by the anticipated vacancy savings,
when enacting the 2015-17 budget. As a result, the cost of additional hiring will require additional
appropriations.

146 Chapter 4: Issues Affecting Recruitment of State Troopers
Implementation Hurdles: Running two academies per year impacts the scheduling related to the
selection process and the use of the Academy facilities by both WSP and outside agencies.
Finding #23: The WSP Trooper Basic Training is perceived by some potential applicants to be
a warrior style of training. The WSP Academy emphasizes restraint in action, and focuses on a
service model for Troopers; however, certain elements of the training Academy —early training
protocols that focus on discipline, and housekeeping rules—have led to this perception which has
caused some potential recruits to bypass the WSP.
Recommendation 23.1 The WSP should review elements of the training protocols that create a
perception of the warrior-style of academy and deemphasized them. Guardian elements of the
Academy and the job should be emphasized. This will serve to mitigate potentially negative
perceptions of potential Cadets and better reflect the actual Academy training style.
A primary way to do this is to review how the training Academy is represented on its website (see
Finding #17).
Cost: No direct costs associated with this transition.
Implementation Hurdles: None identified.
CONCLUSION
The recruitment program for the WSP is operating in a changing environment, and under
increasing pressure. As vacancy rates at District offices are growing, competition for potential
recruits with local law enforcement agencies has been high, and will likely continue.
Within this broader context, the WSP recruits at a disadvantage in many ways:
pay is lower
geographic certainty is not provided
the potential assignment of a Cadet to a contract position following graduation from the
Arming Class creates uncertainty for incoming Cadets
WSP does not effectively recruit nontraditional candidates
cultural norms for many newer entrants into the workforce are diverging from the traditional
WSP style, and
the WSP has limited outreach to youth in the community (youth oriented programs can
help build an affinity for the WSP early and create a better pipeline for future applicants).
Continued improvement in marketing and outreach, as well as the selection process itself, should
help both improve the number of women and men who apply and the number of applicants who
make it through to the Academy.
Larger changes are likely also needed in the training arena, with a consolidation of the Arming
Class and Trooper Basic Academy and consideration of repurposing Cadets to work in the field if
not becoming a Trooper straight away. These changes hold the potential both to add more

Chapter 4: Issues Affecting Recruitment of State Troopers 147
capacity to the Academy as well as to put additional Cadets in the field where they can help
reduce the impact of vacancies on the Trooper Field Force.

148 Chapter 4: Issues Affecting Recruitment of State Troopers
Report Conclusion
The WSP is at a crossroads. In a changing cultural environment, the agency faces challenges
involving both employee satisfaction and compensation competitiveness, all while attempting to
be an employer of choice for those seeking law enforcement careers in Washington State. The
WSP needs to take proactive steps in each of these areas in order to continue to meet its mission
of maintaining safety on the State’s highways and ferries.
The alternatives and recommendations detailed throughout this report address these concerns
on an issue-by-issue basis, but the key requirement for the WSP and the State is to take action
in a comprehensive manner. Investing in greater compensation without also addressing
employee satisfaction is unlikely to resolve the WSP’s current retention and recruitment issues.
At the same time, compensation issues are real and must also be addressed.
Through a comprehensive approach to address the agency’s full range of opportunities,
recruitment and retention can both be improved. In turn, such actions can build on a proud set of
organizational traditions and capacities to ensure a strong Washington State Patrol for many
years to come.

Appendix A 149
Appendices
Appendix A: Complete Listing of Findings and Recommendations
Retention
Employee Satisfaction
Finding #1: A majority of the Troopers and Sergeants surveyed indicated management and
morale issues within the WSP. These perceptions have led to job dissatisfaction and have
magnified pay issues.
Recommendation 1.1 The State should commission an organizational assessment to identify
specific management strategies and recommendations that will improve overall engagement with
line staff.
Cost: The cost of an organization study will vary based on scope, but should be in the range of
$75,000 to $150,000. Analysis and surveys from this JTC study should help to defray the cost of
a future analysis more directly focused on improving Trooper engagement.
Implementation Hurdles: Funds needs to be appropriated by the Legislature. The study will work
best if WSP management actively works with the study consultant to implement changes.
Finding #2: Both separated and current Trooper surveys indicate a perceived disconnect from
the realities of day-to-day field operations on the part of some supervisors and upper
management. This disconnect appears to be contributing to the recent resignations of Troopers
for other law enforcement agencies.
Recommendation 2.1 The WSP executive staff should work with its Human Resource Division
and/or the State Human Resources Division within the Office of Financial Management to conduct
performance evaluations,34 of all management staff with the rank of Lieutenant and above. This
should include 360 degree reviews. The results of these evaluations should be used to identify
opportunities to improve management performance.
Cost: The cost of performing evaluations and 360 degree reviews should be minimal; however,
such an undertaking can be time consuming and will create an expectation of change within the
agency.
Implementation Hurdles: The WSP executive leadership must be willing to undertake and act on
this type of performance evaluation.
Finding #3: A focus on outputs with FOB Troopers (e.g., specific goals for traffic stops) as a
measure of Trooper performance is contributing to a disconnect between Troopers and
management, as well as a perception that management does not understand the difficulties of
the Field Force Trooper job.
34 A 360 degree review solicits feedback from the manager, subordinates, superiors, and peers.
150 Appendix A
Recommendation 3.1 Performance metrics provide important feedback, and their active use
should be continued, but refined. As this occurs, and as specific measures are reevaluated, the
WSP executive team should reinforce the focus of Trooper work activity around improving public
safety outcomes (e.g., reduced traffic fatalities) rather than focusing on specific enforcement
outputs (e.g. issuing tickets).
Cost: No identified cost.
Implementation Hurdles: Must be embraced by WSP executive staff.
Finding #4: Survey responses of current Troopers identified a significant concern regarding the
suitability of the current uniform design for field work. Advances in the characteristics and
performance of law enforcement uniforms have changed over time, but the WSP uniforms have
not been updated since they were designed prior to the 1960s. The WSP is now reviewing options
for modern wash-and-wear fabrics, and is planning a more comprehensive review of uniforms in
the near future.
Recommendation 4.1 The WSP should engage commissioned employees across all ranks to
review uniform options and recommend changes to style and fabric for executive management
consideration. Engagement of Troopers in this evaluation can begin to address the
communication problems identified in the survey responses of current Troopers.
Cost: Moving to new uniforms will have a one-time cost of approximately $1.67 million to replace
all components for the current 1,005 commissioned staff who wear a uniform (approximately
$1,660 per employee).
Implementation Hurdles: The WSP executive team is currently reviewing uniform options.
Funding will need to be appropriated by the Legislature.
Finding #5: The WSP Field Force schedule calls for rotating between night shift and day shift
every 28 to 56 days. Alternative shifts are allowed in some Districts under provisions outlined in
the collective bargaining agreement (CBA) with the WSPTA. Troopers do not gain more control
over their schedule with greater seniority, and the current practice of shift rotation does not take
into consideration staffing requirements based on call volume or other measures of workload
activity.
Recommendation 5.1 WSP management should encourage the development of experimental
shifts - designed by detachment personnel - to create more stability in and Trooper control over
choosing their schedules.35 Experimental shifts might include an annual shift bid by seniority with
fixed shifts and days off. This could potentially help to reduce fatigue and improve work week
efficiencies of a 4-10 schedule.36 This type of schedule may not fit all Districts, and remote areas
35 In accordance with section 12.11 of the collective bargaining agreement 36 Amendola, Karen L, David Weisburd, Edwin E. Hamilton, Greg Jones, and Meghan Slipka. The Shift Length Experiment: What we Know About 8-10- and 12-Hour Shifts in Policing. The Police Foundation, 2011. Available at www.policefoundation.org

Appendix A 151
of the State may require alternative schedules. Most local and state benchmark agencies use
shift-bid schedules.
Cost: Different schedules could result in more or less overtime depending on how they are
implemented. No cost is projected at this time.
Implementation Hurdles: Requires support from WSP management at HQ, Districts and
Detachments (group of Troopers assigned to a specific geographic location within a District).

152 Appendix A
Compensation
Any new WSP compensation strategy will need to balance goals for compensation
competitiveness with financial affordability and sustainability considerations, and also reflect
important employee and management concerns exchanged at the bargaining table. In this
context, the concepts below illustrate how a range of ideas and approaches might be applied on
a comprehensive and coordinated basis to help address WSP recruitment and retention:
Finding #6: The WSP compensation package plays an important role in the overall job
satisfaction of WSP Troopers and is a major factor cited in recent separations from the WSP.
Further, current Troopers also cite pay and benefits as an issue that could move them to leave
the WSP (both retirements and resignations) in the near future. Designing a compensation
package that is both competitive and affordable by the State is a difficult balance to achieve and
maintain. The compensation package affects not only current Troopers, but it is a factor in the
WSP’s recruitment efforts. Increasing and better packaging pay for Troopers will improve the
comparison with other agencies when competing for new recruits.
Setting competitive and sustainable compensation levels is an art more than a science. For the
WSP, other State Patrol agencies are good comparisons when looking at similar job duties and
Illustrative Long-Term Compensation Strategy
All Troopers:
Adjust geographic assignment pay in regions of high attrition
Roll selected premium pays and differential into base
Provide future across-the-board wage increases to further improve overall pay competitiveness,
calibrating the size of such adjustments to take into account the impact of the initiatives outlined
above
Early-Career Troopers:
Improve Cadet and early step pay with funding in part derived from extending the pension eligibility
age requirements for future hires coming into this new pay progression
Mid-Career Troopers:
Establish Senior and/or Master Trooper classifications to provide more compensation and
additional opportunities for advancement
Retirement-Eligible Troopers:
Provide retention bonus, increased longevity pay, or targeted pension benefit enhancements to
encourage longer tenure
Appendix A 153
long-term career progression. At the same time, Troopers have left the WSP primarily for local
law enforcement jobs, and many prospective law enforcement candidates will consider both local
police agencies along with the WSP. Accordingly, taking local compensation competitiveness
into account is prudent, given current WSP recruitment and retention challenges.
Recommendation 6.1 Working with the Office of Financial Management, WSP should develop
a long-term compensation plan to address issues of pay competiveness within the context of
the State’s ability to pay. Creating such a compensation plan, even if it takes several years to
fully fund and achieve, can help to address existing dissatisfaction and concerns. While there will
be appropriate constraints on what can be included within such a longer-term compensation plan
(e.g., internal equity considerations across State agencies, the overall level of resources available
for the WSP, and the need to receive legislative approval for compensation increases), having a
plan will allow Troopers to know that they are moving in a competitive direction and can help to
initiate productive discussions on the compensation levels needed to sustain FOB Trooper levels.
Findings and recommendations #7 and 8 to follow provide specific ideas that could be included
in such a comprehensive compensation plan. Following these findings and recommendations is
a further illustration of how such ideas might be aggregated to create an overall competitive
compensation strategy.
Cost: Based on the total budgeted Trooper and Sergeant positions, each one percent pay
increase will cost approximately $925,000 per year on an ongoing basis inclusive of all pay
categories (including a 17% allowance for pension and other payroll costs). Increases at the
Trooper and Sergeant levels may cause compression issues at Lieutenant and above that if
addressed, would lead to additional costs.
Implementation Hurdles: Increasing compensation levels may require the State to identify new
funding for the WSP.
Finding #7: Some District offices have been losing more Troopers than others. This is due in
part to Troopers leaving for higher-paying law enforcement positions in or near those same
Districts. Currently, the WSP pays a 10 percent geographic differential to Troopers assigned to
an office in District 2 (King County), 5 percent in District 7 (Snohomish County) 3 percent in District
1 (Pierce County), and 7 percent at two remote outposts. Despite the increased pay, the WSP
continues losing Troopers in Districts 1, 2 and 7 at a high level. Additionally, recent attrition from
Districts 5 and 8 has also been high. Attrition from Districts on the eastern side of the State
(Districts 3, 4, and 6) is relatively low, both in terms of absolute number of separations and as a
percentage of total separations.
WSP is actually progressive when it comes to geographic pay. None of the six benchmarked state
patrol agencies provides geographic pay. Beyond this standard survey group, New York State
Police does provide geographic pay that ranges from an additional 3 to 5 percent of base pay,
similar to WSP’s pay for Pierce and Snohomish Counties, but far less than the 10 percent pay
provided to Troopers assigned to King County.

154 Appendix A
At the same time, Trooper base pay in King County with geographic pay factored in is still 16.8
percent to 17.2 percent below that of law enforcement agencies in that region, while Pierce and
Snohomish County Deputy Sheriff compensation is less than 10 percent below comparable
agencies. District 5 Troopers are nearly 13 percent below Vancouver Police Department in cash
compensation. As shown in Figure 20 below, Districts 2 and 5 have the largest difference in cash
compensation relative to comparable local law enforcement agencies. Increasing geographic pay
in King County and instituting geographic pay in high-cost areas of District 5 should be considered.
Recommendation 7.1 The WSP should review its geographic pay practices to both expand
counties they cover as well as to potentially increase the rates for geographic pay. Providing
higher pay on a geographic basis could provide additional incentive to stay with the WSP for
Troopers where pay is a primary issue. This will also help attract new recruits from more
populated areas where there are many other law enforcement choices.
Geographic pay should be used to normalize the differences in pay in nearby agencies and reduce
the impact of higher cost of living in those areas. Once this is done, general pay raises provide
improved compensation competitiveness for all Troopers.
Cost: Increasing geographic pay makes the most sense in King County where pay differentials
to the Seattle Police Department and King County Sheriff’s Office are over 15 percent and in
District 5 where pay differences to Vancouver are nearly 13 percent. Increasing geographic pay
in King County (District 2) will cost approximately $103,000 per one percent increase (including

Appendix A 155
17% for pension and other payroll costs). A one percent geographic pay allowance for District 5
Troopers would cost approximately $63,000 per one percent per year (not all counties of the
District will necessarily be included).
Implementation Hurdles: Requires negotiations over the CBA with the WSPTA, and approval by
the State Legislature.
Finding #8: The WSP provides opportunities for specialty and certification pays. While these
are ways to boost pay for employees who have special knowledge or provide special services,
only a small percentage of Field Force employees actually receive these extra pays, and those
that do are typically more senior Troopers that would benefit from implementation of various other
compensation recommendations. Additionally, the WSP pays a shift differential for Troopers
working between 6:00 PM and 6:00 AM. Based on a rotational schedule (described later in this
report), shift differentials are received by most, if not all, FOB Troopers and Sergeants. These
pays do not show up as base pay or in many pay comparisons with other agencies. The combined
cost of specialty pays and shift differential pay is nearly equal for FOB and non-FOB Troopers
and Sergeants (see Table 40 below).
Recommendation 8.1 The WSP should consider merging specialty pays, certification pays,
and shift differentials into base pay. This will serve to increase the base pay levels presented
in pay comparisons, while limiting pay differences among Troopers. This would increase base
pay by approximately 2.5 percent. In total, this percent of pay is nearly identical for Troopers and
Sergeants in the FOB and other bureaus. Taking pay out of the equation for specialty
assignments could also help to reduce issues with accessibility to specialty assignments.
Cost: To the extent that some premiums are not now pensionable or included in the overtime
base, shifting such elements of pay could marginally increase pension and overtime costs. If a
cost neutral shift is intended, this factor should be accounted for when determining the size of the
resulting base pay adjustment.
Implementation Hurdles: Requires negotiations over the CBA with the WSPTA, and approval by
the State Legislature.
Recommendation 8.2. Institute a new promotional class of Trooper. The WSP could offer a
promotional opportunity for Troopers to an advanced level (a Senior and/or Master Trooper, for
example) with additional duties and expectations. This will add a higher-paid, non-supervisory
level (or two, if both Intermediate and Advanced levels were established)) that could be reached
Table 40: Specialty and Certification Pays by Type and Bureau (2015 Actuals)
Compensation Item FOB % of Base
Pay All Other Bureaus
% of Base Pay
Base Pay $40,854,249 -- $21,076,575 --
Shift Differential $822,047 2.0% $122,709 0.6%
Specialty and Certification Pays $191,735 0.5% $437,302 2.1%

156 Appendix A
by accumulating points through various criteria such as education, certifications, tenure,
specialties, good record and commendations, and field training officer (FTO) status. Examples
of similar structures can be seen in the California Peace Officers Standards and Training (POST)
and Texas Commission on Law Enforcement (TCOLE) certification programs.
The result could create a positive track for non-supervisory Troopers to earn higher base salary
and advance professionally in the intermediate years of their career. This could also address
concerns about limited promotional opportunities and allow Troopers to progress in a single
geographic location if they do not want to relocate for a promotion. Such a structure would also
align additional compensation with areas of Trooper development that would benefit the WSP,
while increasing the overall, top salary range of pay for non-supervisory Troopers.
Cost: The total cost of this recommendation would depend on how many Troopers would qualify
into such levels, and whether or not any existing premiums would be folded into the new level
(e.g. if points toward Master Trooper status for educational attainment and/or FTO duties were
part of advancement under such a program, then existing, separate premiums might be
eliminated). For an individual Trooper with 20 years of service each 5 percent promotional step
to Senior or Master Trooper would cost approximately $4,500 per year (inclusive of benefits and
other payroll costs), prior to any offset from folding any existing premiums into such a new
structure.
Implementation Hurdles: Requires negotiations over the CBA with the WSPTA, and approval by
the State Legislature.

Appendix A 157
Retirement/Pension Issues
Many of the recommendations addressing overall pay, working conditions, and workload, if
implemented, will help to resolve issues with Troopers close to retirement. In addition to those
general workforce-related recommendations, the discussion below explores targeted options
related to pensions and pay after 25 years of service specifically associated with the retirement-
eligible workforce.
Finding #9: The issues motivating current early and mid-career Troopers to resign from the
agency are also influencing retirement-eligible Troopers’ decisions regarding when to retire.
Despite the fact that they likely have many years of employment opportunity before they want to
fully retire, many current WSP Troopers nearing retirement indicated their plan is to stay with the
WSP only until they reach normal service retirement requirements (25 years of service). Pay is a
major issue for Troopers on the cusp of becoming retirement eligible, and the WSP may need to
address this in order to incentivize Troopers to stay on rather than move to a post-retirement job
in a different agency.
Options to Consider for Addressing Retention of Retirees
Addressing retention issues related to retirement is complex. With a 25-and-out pension plan,
many WSP Troopers are able to leave the Field Force and join other law enforcement agencies
or pursue different careers prior to reaching an age where they can no longer effectively perform
their duties as a law enforcement officer.
The options provided below are meant to show a range of potential actions the WSP could take
to address the retirement bubble now being faced. If these actions are pursued, it will be important
to engage Troopers at or nearing retirement eligibility to determine what options would have the
most beneficial impact.
Options for Addressing Retention of Retirees
Increase pay for retirement-eligible Troopers
Offer a retention bonus
Increase retirement eligibility to 30 years of service
o Legislative change for future hires
o Must include offsetting new advantages for current employees
Increase pension accrual after 25 years of service
Evaluate a Limited-Duration DROP (deferred retirement option program)
Create a Trooper Reserve program

158 Appendix A
Option 9.1 Increase Pay for Retirement-Eligible Troopers. After 20 years of service, a
Trooper does not receive any additional pay increases beyond general cost-of-living increases
provided to all Troopers. Increasing pay after 25 years of service can provide an incentive for
Troopers to remain in the Field Force. Any pay increase would affect both base salary and
FAS over a two to five year period (depending on whether a Trooper is in WSPRS Plan 1 or
2). This would provide an incentive to stay beyond retirement eligibility.
For example, California Highway Patrol provides an additional 1 percent longevity pay for
each year of service from 18 to 22 years and an additional 2 percent of longevity pay upon
reaching 25 years of service. Similarly, Michigan provides an additional $180 per month upon
reaching 25 years of service and an additional $250 per month upon reaching 29 years of
service. For the WSP, one potential approach could be to provide an additional 1 percent of
longevity pay for every year of service above 25, to a maximum of 5 percent.
Cost: Approximately $50,000 per year per percent of pay, dependent on future wage
increases and the number of Troopers remaining in the WSP after attaining 25 years of
service. Assuming an equal distribution of 50 to 60 retirement-eligible Troopers spanning 25
to 30years of service, the annual cost would be approximately $125,000 per year. In addition,
actuarial analysis would be required to determine the net impact on pension costs, taking into
account both a higher pension base and the delay in average age at retirement.
Implementation Hurdles: Increases to pay must be negotiated with the WSTA and approved
by the State Legislature.
Option 9.2 Offer a retention bonus. An alternative to providing longevity pay is to provide
a one-time or annual cash bonus for every year after a Trooper stays after reaching
retirement-eligibility. Such a bonus would not add to FAS for pension purposes.
Cost: Will vary based on amount of bonus and whether provided as a one-time or annual
amount.
Implementation Hurdles: Increases to pay must be negotiated with the WSPTA and approved
by the State Legislature.
Option 9.3 Increase retirement eligibility to 30 years of service. Changing the WSPRS
eligibility for full retirement from 25 years to 30 years of service (or to a plan similar to the
LEOFF eligibility) would more closely align with the pension benefits available to local
Washington State law enforcement, would be consistent with longer life spans and working
careers, and could generate long-term savings that could help to fund improved cash
compensation. At the same time, such a change would result in some future Troopers working
longer prior to retirement. Increasing the time required to reach retirement eligibility, thereby
increasing average tenure and the proportion of experienced Troopers in active service,
should bring more stability to the workforce.
New Employees. Such a change could be implemented by the Legislature for new
employees. Senate Bill 5982, introduced in the last legislative session, sought to change full
retirement age to 62 with an early retirement option at age 55 with a reduced benefit. If this

Appendix A 159
change were applied to new hires only, the Legislature could apply any current savings in
pension costs from the change in benefit, if they materialize, to improve the base pay of
Troopers at entry level and post-Academy levels – thereby targeting a key recruitment issue
and aligning additional cash compensation more closely with the source of offsetting benefits
savings.
Current Employees. Changing the benefit for current employees is more complex, and is
likely to require an offset of some sort to implement. The State Supreme Court has held that
“changes in a pension plan which result in disadvantage to employees should be
accompanied by comparable new advantages”37. Any change to the current retirement
eligibility threshold should be considered in conjunction with other possible solutions, such as
implementation of a DROP program, discussed below.
Cost: An actuarial analysis would be required to determine the relative costs or savings from
extending years of service requirements for WSPRS members. Applying this change in
benefits to all WSPRS members would result in the need for an offsetting comparable
advantage to the disadvantage of the change. That cost would also depend on the actuarial
analysis of the cost of the benefit change to an employee.
Implementation Hurdles: Any change would require a change in State retirement law by the
Legislature. Due to State Supreme Court decisions (see footnote below) a change in
retirement benefits would require an offsetting advantage for current employees and would
likely be subject to negotiations with the WSPTA. Applying this across the board could also
result in legal action if the parties disagree over the offsetting advantage for a change in
retirement benefit.
Option 9.4 Increase Pension Accrual after 25 years of service. Increasing the pension
accrual rate after reaching 25 years of service may be another way to incent retirement-eligible
Troopers to remain in the force for several more years. Increasing the accrual rate from the
current 2.0 percent to 2.2 percent per year say, would increase the total retirement formula by
1 percent of FAS for a Trooper opting to stay for an additional five years of service—retirement
amount increased by 11 percent of FAS vs. a 10 percent increase without this change.
Cost: Determining the cost of this option would require an actuarial analysis by the State
Retirement System.
Implementation Hurdles: Any change would require a change in State retirement law by the
Legislature, and would be subject to negotiations with the WSPTA.
Option 9.5 Evaluate a Limited-Duration DROP. A Deferred Retirement Option Program
(DROP) can be used to incentivize Troopers nearing retirement to stay a few years beyond
becoming retirement eligible. These programs also provide current employees close to
37 Bakenhus v. City of Seattle, April 19, 1956 and Washington Education Association v. Washington Department of Retirement Systems, August 14, 2014.

160 Appendix A
retirement some certainty regarding their retirement date and allow them to continue to accrue
retirement benefits after they have “maxed out” their benefit under their current pension plan.
A concern with DROPs, however, is that they have often not met actuarial assumptions and
have weakened pension plan health. Still, such an approach can potentially be structured as
cost neutral if actuarial assumptions are met, and could be considered as a tool in this specific
instance to address the particularly large retirement bubble projected for the WSP.
Under a DROP program, an employee eligible for retirement continues working, however
additional service time and compensation that would have been credited under their
retirement system’s benefit formula is credited to a DROP account separate from their
retirement plan account. The employee works for a specified period of time under the DROP
program, generally three to five years. At the end of this period, the balance of the DROP
account, including accrued interest, is paid to the employee in a lump sum. The employee
would then begin drawing their defined retirement benefits.
While DROP programs have become common among municipal police and fire retirement
systems nationally since their introduction in the 1980s, this approach is not widespread
among the other state law enforcement agencies benchmarked for this study. In this survey
group, only the Ohio Highway Patrol provides the DROP option to current employees and new
hires. Elsewhere, the Arizona Highway Patrol and the Michigan State Police also offer DROP
to employees hired before January 1, 2012, but not to current hires.
Table 41: State of Ohio DROP Benefits
DROP
Offered? Eligibility DROP Period
Guaranteed Rate of Return
Ohio Highway Patrol
Age 48 with 25 YOS Age 52 with 20 YOS
Enter before age 52: minimum 3 years
Enter after age 52: minimum 2 years
Maximum of 8 years
N/A (Market-based)
While not common among comparable state law enforcement agencies, the WSP might
consider implementing a DROP program to help retain some of the current Troopers who plan
to retire as soon as they are eligible. A point of concern with DROP programs is that actual
costs are sometimes substantially higher than anticipated at implementation. A potential
DROP program must be structured in such a way as to ensure actuarial cost-neutrality and
minimize exposure of the pension fund to additional actuarial risk. For example, any
provisions for interest earnings on a DROP account should be structured to avoid undue risk
of large state subsidies. When DROP earnings are tied to long-term actuarial return
assumptions, the pension plan may be required to pay out more than it earned during the two
to five years of the DROP.
The project team also recommends that, if a DROP program is considered, it should be
established as a short-term pilot that would sunset after a predetermined period (e.g. available

Appendix A 161
only to those within five years of retirement eligibility at the time of adoption). This would allow
for management of the currently projected retirement bubble while shielding the State from
permanent commitment to the cost risks that come with the program.
A DROP program is only one option among a range of alternatives for creating financial
incentives for current cohorts to defer retirement.
Cost: The DROP should be designed to be cost neutral to the agency by freezing defined
pension benefits when entering the DROP and then making the same pension contribution
amount to the DROP account. Cost risks can arise based on how interest in that account is
calculated, as well as changes in behavior among retirement-eligible participants relative to
existing actuarial assumptions.
Implementation Hurdles. Instituting a DROP program would likely involve input from the
WSPTA and a change in pension laws by the State Legislature.
Option 9.6 Create a Trooper Reserve Program. A Trooper Reserve program could be
designed to allow Troopers in good standing at the time of retirement to be reemployed by the
WSP in a part time, non-benefit, non-career status performing functions allowed by law and
required by the WSP. Unlike a DROP program, a Reserve Trooper would have retired from
the WSP and return in a limited status to assist with tasks as defined by the WSP such as
security at the Governor’s Mansion, assisting with investigations, additional staffing during
special events or enforcement efforts, or any other function that the WSP determines to be
appropriate, in compliance with the law, and not in conflict with collective bargaining
agreements. Hiring retired Troopers back to perform background checks and other time-
limited tasks is currently done by the WSP.
Cost: The cost is dependent on the number of retired Troopers hired through this program
and the number of hours worked. Currently, retired Troopers hired by the WSP are paid
$29.00 per hour.
Implementation Hurdles: No implied promise of employment can be made to any retiring
Trooper. A reserve program would need to be structured in such a way to avoid IRS or
WSPRS rules regarding post-retirement employment.

162 Appendix A
Recruitment
Understanding Ideal Candidates
Finding #10: WSP struggles with attracting candidates who desire to stay in one geographical
location, thus limiting the potential applicant pool. This can manifest both in not knowing where
they might be stationed once becoming a Trooper as well as the possible need to move in order
to promote.
Recommendation 10.1 The WSP should create a system that allows candidates during the initial
application process to prioritize district assignments and, prior to employment or early in the
training process, to be assigned to a district. This assignment may not coincide with the Cadet’s
initial choice if assignments are not available in that location. For example, the Spokane District
has over 70 current Troopers who desire to transfer to that district, and it would not be appropriate
to place a new recruit there.
Cost: No anticipated cost
Implementation Hurdles: Will require a change in the current timing of the WSP practice to make
current Trooper transfer requests prior to placing Cadets. That process will now need to be
completed in advance of the hiring for each Cadet class (rather than during the Academy class).
Finding #11: The WSP Cadet enters into the agency at a lower starting salary than he or she
will receive when commissioned as a Trooper. The WSP Cadet and Trooper pay levels are low
compared to other law enforcement agencies and likely discourage some qualified applicants
from applying to the WSP. Competitive agencies (King County, Pasco, Pierce County,
Snohomish County, and Spokane County) generally start recruits at the same salary that they will
receive post-Academy, creating a large difference in pay optics during the training period. This
puts the WSP at a disadvantage with applicants who weight pay heavily in choosing between job
opportunities.
Recommendation 11.1 The WSP should consider increasing pay to levels that improve the
WSP’s competitive position relative to local law enforcement agencies. Increasing Cadet pay is
one way to address this, and movement toward a single rate for the first year of service (both at
the Academy and afterward) could be a means to achieve this.
At the same time – given such factors as the global pay disparity between the WSP and
competitive agencies, the relatively short time a new hire remains a Cadet, the focus of job
seekers on longer-term opportunities, and competing demands for limited budgetary resources –
the project team recommends seeking to adjust overall Trooper compensation within a broader
strategic framework that encompasses a full career, not just Cadet pay. As addressed in the
Chapter 3, this may include concepts such as modifying pensions and other benefits to generate
savings for reinvestment into higher salaries, reevaluating the optimal level of geographic
differentials, and/or shifting of certain premium pays into base salary. In addition, WSP
recruitment efforts should consistently highlight any compensation advantages that now exist
relative to local law enforcement, such as superior pensions and take-home vehicle privileges
less prevalent at the municipal level.

Appendix A 163
Overall, the competitive position of the WSP pay scale will clearly be a factor in future recruiting
efforts.
Cost: Depends on overall change to Cadet and Trooper compensation. Moving Cadets to entry-
level Trooper pay alone would cost approximately $350,000 - $400,000 per year depending on
how many Cadets are hired into the WSP and how long they take to complete the training
program.
Implementation Hurdles: The WSP Chief has the authority to set Cadets salaries within the total
authorized budget of the agency.
Finding #12: The WSP has a carefully cultivated culture that is reflected in recruitment outreach
and reinforced in the Trooper Basic Academy. Current applicants to law enforcement agencies,
however, are less likely to embrace the paramilitary style of the WSP. Even the WSP’s current
recruits are significantly less drawn by this factor than were current Troopers when they joined
the Patrol. Furthermore, recruits to other local law enforcement agencies cited the WSP culture
as a reason that they did not apply to become a Trooper. Even among current Troopers, out-of-
date uniforms come up as an area that needs to be addressed.
Recommendation 12.1 The WSP needs to take a close look how it can align its culture to the
contemporary approach favored by many current recruits while still maintaining its “service with
humility” mission. The issue of cultural realignment impacts the entire recruitment process and is
central to other recommendations provided in the Recruitment chapter of this Report.
Cost: Unless the WSP utilizes outside resources to address cultural changes, there is no cost to
this recommendation.
Implementation Hurdles: Culture is difficult to change and can take a concerted effort over many
years. A culture change would need to be embraced by WSP’s executive management.
Outreach and Marketing
Finding #13: The WSP uses traditional law enforcement outreach and marketing strategies that
rely on personal interaction between a potentially qualified candidate and WSP personnel. These
strategies include job fairs, military installation visits, and general public appearances. While these
efforts are worth continuing, the traditional methods generally appeal to those who have some
level of interest in law enforcement. Growth in qualified applicants may rely in reaching out to
youth, women, and ethnic minorities who may not now consider the WSP a career option. Further,
the benefits of the WSP (take-home car, ability to move to different parts of the state) should be
emphasized to help target applicants who will be successful.
Recommendation 13.1 The WSP should develop a comprehensive outreach and marketing
strategic plan that expands on the success of current strategies and looks for ways to tap into
groups of individuals that do not currently show an interest in the WSP or law enforcement as a

164 Appendix A
career, such as women and minorities. This will require the use of non-traditional marketing and
outreach methods.
Cost: Outside consultant support may be valuable in evaluating marketing successes in other
locations. Expanded marketing and outreach efforts could need additional resource allocations.
Implementation Hurdles: Staff time is limited, and funding will need to be identified if an outside
consultant is utilized.
Finding #14: The most successful recruitment tool is personal relationships with WSP Troopers.
To improve on recruitment outside of traditional strategies, many agencies across the country
have developed youth-oriented law enforcement academies or magnet schools to create a
pipeline of potential candidates starting as early as grammar school. These programs can also
be feeders into an explorer program. The goal is to expand personal relationships between
department personnel and youth outside of normal channels and then translate those connections
into future careers with the WSP.38
Recommendation 14.1 The WSP should consider reinstating the Explorer program or a similar
youth outreach program, in order to expose teens to the possibility of a career with the WSP. This
may require the expansion of work currently done by recruiters in District offices.
The California Highway Patrol conducts a statewide explorer program
(https://www.chp.ca.gov/chp-careers/explorer) with programs run out of CHP offices throughout
the state. The breadth of the program in Washington would depend on staffing in a District and
the interest in championing the program at the District office level.
Cost: Trooper time to manage the program at the district level. Pay for state Administrative
Assistant or Program Specialist job classes range from $15.00 to $22.00 per hour. Eight people
working half-time on the Explorer program would cost up to $225,000 per year.
Implementation Hurdles: Limited staff resources due to recent attrition issues. Need to address
employee satisfaction issues to make this most successful.
Finding #15: Survey results identify WSP personnel as influential in the recruitment process.
The ability to expand recruitment relationships will require effort by more Troopers than are
currently assigned recruiting duties in the Districts.
Recommendation 15.1 Identify staff who have the skills, ability, and desire to function as both
formal and informal recruiters. Not everyone desires to be a recruiter nor does everyone have
the skills to undertake that role. The pool of Troopers used for recruitment activities should be
increased and the role enhanced to include higher levels of youth and community engagement.
Additionally, Troopers should be trained, evaluated, and rewarded on recruitment techniques and
efforts. The job of recruiting should not be shouldered solely by the recruitment officers, but by all
who have the ability to role model, mentor, and coach.
38 At the time of high school graduation, students are generally not yet eligible to become Troopers because of the age requirement.

Appendix A 165
Cost: Minimal cost expected. Requires training time and material.
Implementation Hurdles: Need to address employee satisfaction issues to make this most
successful.
Finding #16: Patrol recruitment staff currently poll applicants about how they found out about
the WSP, but they do not keep statistics on the success of each outreach and marketing method
as they relate to attracting applicants who eventually become Troopers.
Recommendation 16.1 Recruitment staff should continue tracking how applicants find the WSP
as well as how successful each outreach method is in terms of yielding new Troopers (for
example, a higher percentage of hired Cadets found out about the WSP from the website than
did the general applicant population). This feedback spanning the steps from applicant to
successful Cadet to Trooper should then be used to inform future outreach efforts and help direct
the limited resources of the agency.
Cost: No identified cost.
Implementation Hurdles: None identified.
Finding #17: Potential law enforcement candidates are researching potential employers before
applying for a position or accepting a conditional job offer. As identified in survey results, the
primary research tool is the website. The WSP website is linear in design and rigid in appearance.
The WSP home page showing nine troopers standing erect and not smiling presents an
unapproachable image of the WSP. In contrast, the website of the California Highway Patrol is
graphically appealing and focuses on the many social media links frequently used by potential
candidates. An example of a graphically stimulating—through large link buttons—is the U.S.
Secret Service web site.
Recommendation 17.1
The WSP should redesign its website to engage viewers with an emphasis on creating a positive
and welcoming environment. The WSP should include videos that demonstrate the full range of
duties performed by the Patrol.
Cost: Varies based on approach used and availability of existing staff. Engaging outside web-
design help could be in the range of $25,000 or more.
Implementations Hurdles: Website changes need to be consistent for the agency, and must be
approved, ultimately, by executive management.
Selection Process

166 Appendix A
Finding #18: Candidates have been removed from the selection process through the pre-
polygraph interview for disqualifying conduct before the circumstances surrounding the conduct
can be evaluated on an individual basis. Although it is not official policy, it appears that it has
been WSP’s practice to reject candidates at the pre-polygraph interview when the candidate
admits to ‘disqualifying conduct’ such as misdemeanor convictions or past drug use.
Recommendation 18.1 Except as required by law, the WSP should change their criteria from
an absolute rejection of a candidate for any and all misdemeanor convictions and drug use to a
case-by-case review of the individual’s circumstances. This allows for consideration of
extenuating circumstances without lowering any ethical standard. The background check follows
the polygraph exam, and issues raised in the polygraph can be followed up and addressed, if
necessary.
Cost: No expected cost.
Implementation Hurdles: None identified.
Finding #19: Over the last five Arming Classes, the WSP has failed 38 percent of its recruits on
the psychological exam -- a level well above the national and local law enforcement average of 5
percent39 and above the State Patrol benchmark agency failure rate of 18 percent. Also, the tests
WSP uses for the psychological evaluation are not the current national standard tests, which are
normalized for law enforcement personnel.
Recommendation 19.1 The WSP should review the psychological testing portion of the selection
process to bring the testing protocols in line with contemporary national standards as well as to
determine possible causes for the high failure rate. The review should include possible trends in
applicant failures, the number of testing providers, the test administered, and the process as
compared to other jurisdictions40.
Cost: Potential small cost in changing psychological tests.
Implementation Hurdles: Testing methodology is determined by WSP’s Psychologist.
39 “Psychological Testing and the Selection of Police Officers: A National Survey” 40 Commission on Peace Officer Standards and Training, “Peace Officer Psychological Screening Manual,” https://post.ca.gov/peace-officer-psychological-screening-manual.aspx

Appendix A 167
Finding #20: All psychological testing is done by the WSP’s Psychologist. Testing occurs during
recruitment periods for the Arming Class, which can create a backlog for testing that results in a
bottleneck in the selection process.
Recommendation 20.1 The WSP should contract with outside Psychologists to assist the WSP’s
Psychologist during peak hiring times and eliminate delays in the overall process. Additionally,
the WSP should consider transitioning away from an employee provider to a contract provider.
(Note: this recommendation is only related to the psychological testing portion of the selection
process which happens once or twice a year, and is not a recommendation to eliminate the State
Psychologist position).
Cost: Additional cost for contract Psychologists range from $350 to $500 per applicant tested.
Total cost will vary based on number of applicants assigned to contractors. At the high estimate,
testing of 20 applicants would cost approximately $10,000. With recent applicant levels,
eventually contracting out the entire psychological testing for the WSP should be $100,000 or less
per year.
Implementation Hurdles: The testing process is currently the responsibility of the WSP’s
Psychologist.
Training Process
Finding #21: The WSP’s practice of conducting an Arming Class separate from the Trooper
Basic Academy is done primarily to fill 15 security positions (eleven in the Governor’s Mansion
and Office, and four contractual positions). This can leave Cadets uncertain about timing to
become a Trooper and extends their time at the lower-paying Cadet position for an additional nine
months. This practice places a higher priority on the contractual positions than on Trooper
positions in the field. An unintended consequence of this uncertainty could be the reluctance of
candidates with families or financial obligations to apply to the WSP.
95.0% 95.0%
80.0%
64.8%
0.0%
10.0%
20.0%
30.0%
40.0%
50.0%
60.0%
70.0%
80.0%
90.0%
100.0%
CJTC SurveyRespondents
Michigan StatePolice
CaliforniaHighway Patrol
WSP
Figure 31: Comparative Psychological Exam Passage Rates

168 Appendix A
Recommendation 21.1 The WSP should merge the Arming Class and Trooper Basic Academy
into a single class and move all Cadets through this program and into Trooper positions as soon
as possible. Merging the Arming Class and Trooper Basic Academy into a single course will
provide the WSP with more flexibility in terms of the number of training academies it can run, but
will also require a different model to staff the contracted security positions, such as hiring retired
Troopers.
With this approach, the WSP may have to fulfill its contractual security requirements under a
different model. Many states, for example, use a different classification from State Police for
similar security functions – such as the Capitol Police Officers employed by the Commonwealth
of Pennsylvania at lower compensation levels than Pennsylvania State Police.
Cost: Merging the Arming Class and Trooper Basic will result in a shorter training period, by
eliminating the week between the two classes. If the WSP increases the number of Academy
classes and Cadets trained, there will be a corresponding increase in costs. The marginal cost
of training a Cadet is approximately $56,600. The cost of increased Cadets in the Trooper Basic
Academy was formerly offset by accrued vacancy savings in the current biennium. The
Legislature has already reduced the WSP budget by the anticipated vacancy savings, when
enacting the 2015-17 budget. As a result, the cost of additional hiring will require additional
appropriations.
Implementation Hurdles: Operating two academies per year places more stress on the training
Academy instructors.
Recommendation 21.2 The WSP should continue using the Cadet job classification to allow for
entry level employment into the agency, but should consider repurposing Cadets who are too
young (Troopers must be 21), or otherwise not ready to be a Trooper, into District-level positions
that perform duties currently performed by Troopers that do not require law enforcement officer
certification. Similar to a Community Service Officer position in some municipal agencies, this
system will allow the WSP to increase the workforce in district offices, addressing current vacancy
issues. Job duties of a Cadet in the field should be designed to prepare the employee for the job
of Trooper while also reducing the workload of Troopers to allow for more time engaged in higher
priority activities, community engagement (e.g., Explorer groups), and problem solving.
Cadets will attend the Trooper Basic Academy and, if not yet eligible to become a Trooper due to
age and/or if they choose to complete college, will perform Cadet-level field duties until becoming
a Trooper. The time spent as a Cadet post-Academy should be limited.
The value of this program is threefold: 1) District offices are provided staffing assistance in a time
of high vacancy rates, 2) Cadets receive a high level of training and then are put in jobs that move
them toward becoming a Trooper, and 3) the WSP improves its flexibility in engaging Troopers in
recruitment work and community engagement to the extent that Cadets free up Trooper work
time. The repurposed Cadet classification would allow the WSP to lower the hiring age to
eighteen years of age, thus allowing for relationships developed in the schools through Explorer
programs and Magnet School programs (Recommendations 4.1 and 4.2) to result in employment

Appendix A 169
opportunities immediately following high school with these employees remaining in field Cadet
positions until they turned 21.
Cost: Cadet positions will operate under the total full-time equivalent (FTE) authorization for the
FOB. The cost of security positions filled by retired Troopers or a separate security class could
be slightly less or slightly more than the cost of a Cadet, depending on the civil service job class
selected (Security Guard 1-3 or Campus Security Officer). Cadet positions would remain on the
Cadet pay scale during the time in the field or could be provided an increase once training is
completed.
Implementation Hurdles: May require new model to staff the contracted security position, such as
hiring retired Troopers.
Finding #22: The WSP has a current vacancy problem that is exacerbated by record-level
resignations and a retirement bubble starting in 2015. The only replacement for departing
Troopers is graduates from Trooper Basic Training. In order to replace Troopers leaving the WSP
and keep the number of Field Force Troopers at levels needed to fulfill their mission, the WSP
must increase the number of training Academy graduates. Currently, the WSP runs one Academy
every 9 months.
Recommendations 22.1: The WSP should run two academies per year for a period of time in
order to replace current and projected vacancies in the field. The agency has run academies
twice a year in the past, and this increase in capacity will improve the pipeline to replace retiring
Troopers.
Cost: The reason for running two academies is to fill vacancies in the field. The cost of increased
Cadets in the Trooper Basic Academy was formerly offset by accrued vacancy savings in the
current biennium. The Legislature reduced the WSP budget by the anticipated vacancy savings,
when enacting the 2015-17 budget. As a result, the cost of additional hiring will require additional
appropriations.
Implementation Hurdles: Running two academies per year impacts the scheduling related to the
selection process and the use of the Academy facilities by both WSP and outside agencies.
Finding #23: The WSP Trooper Basic Training is perceived by some potential applicants to be
a warrior style of training. The WSP Academy emphasizes restraint in action, and focuses on a
service model for Troopers; however, certain elements of the training Academy —early training
protocols that focus on discipline, and housekeeping rules—have led to this perception which has
caused some potential recruits to bypass the WSP.
Recommendation 23.1 The WSP should review elements of the training protocols that create a
perception of the warrior-style of academy and deemphasized them. Guardian elements of the
Academy and the job should be emphasized. This will serve to mitigate potentially negative
perceptions of potential Cadets and better reflect the actual Academy training style.

170 Appendix A
A primary way to do this is to review how the training Academy is represented on its website (see
Finding #17).
Cost: No direct costs associated with this transition.
Implementation Hurdles: None identified.
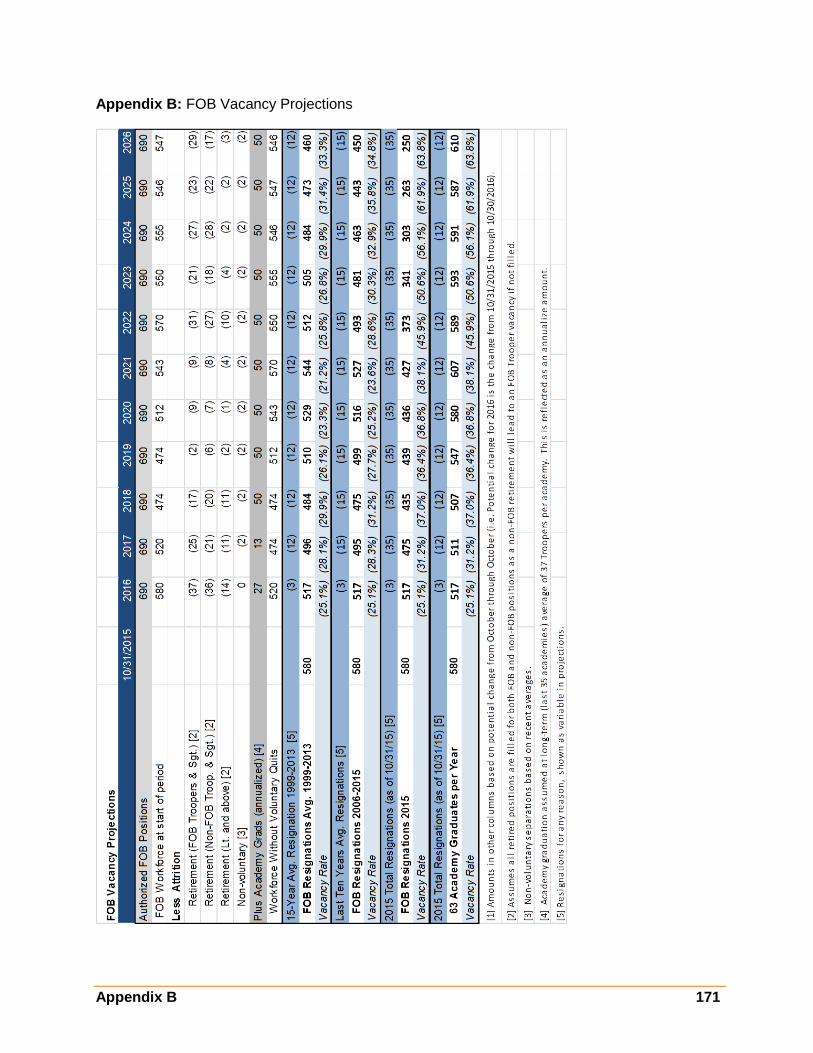
Appendix B 171
Appendix B: FOB Vacancy Projections

172 Appendix B
Appendix C: 30-Year Career Progression, Washington State Trooper
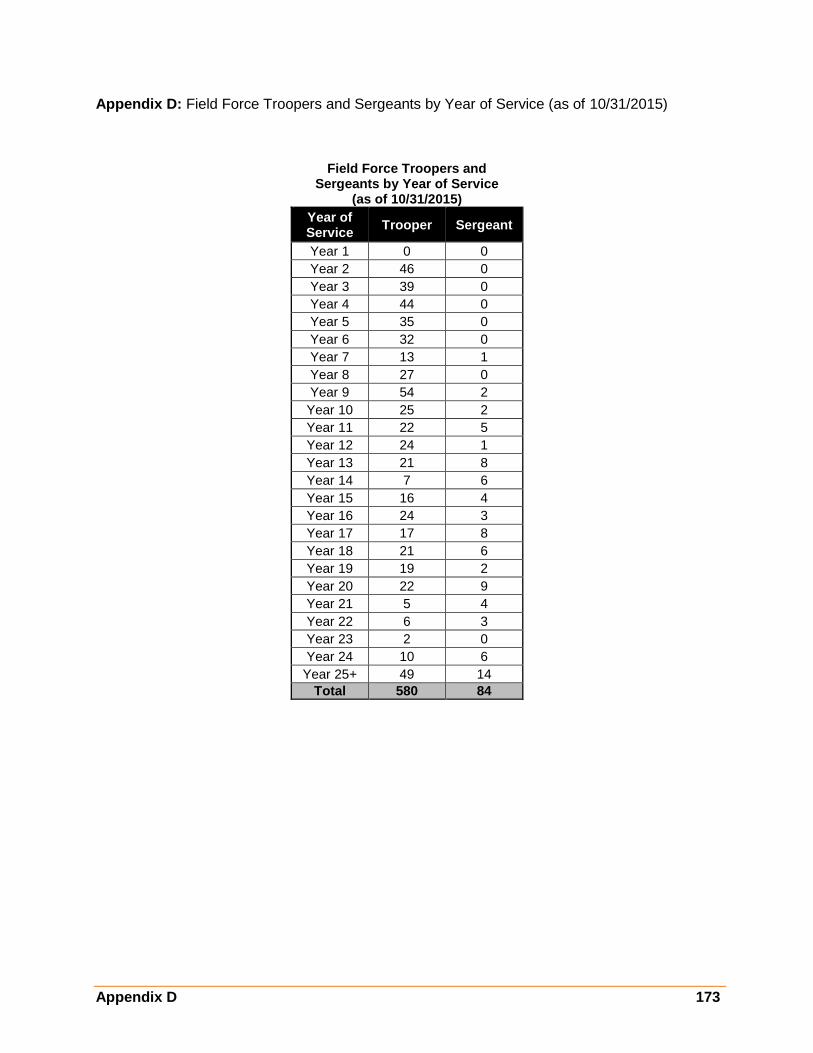
Appendix D 173
Appendix D: Field Force Troopers and Sergeants by Year of Service (as of 10/31/2015)
Field Force Troopers and Sergeants by Year of Service
(as of 10/31/2015)
Year of Service
Trooper Sergeant
Year 1 0 0
Year 2 46 0
Year 3 39 0
Year 4 44 0
Year 5 35 0
Year 6 32 0
Year 7 13 1
Year 8 27 0
Year 9 54 2
Year 10 25 2
Year 11 22 5
Year 12 24 1
Year 13 21 8
Year 14 7 6
Year 15 16 4
Year 16 24 3
Year 17 17 8
Year 18 21 6
Year 19 19 2
Year 20 22 9
Year 21 5 4
Year 22 6 3
Year 23 2 0
Year 24 10 6
Year 25+ 49 14
Total 580 84
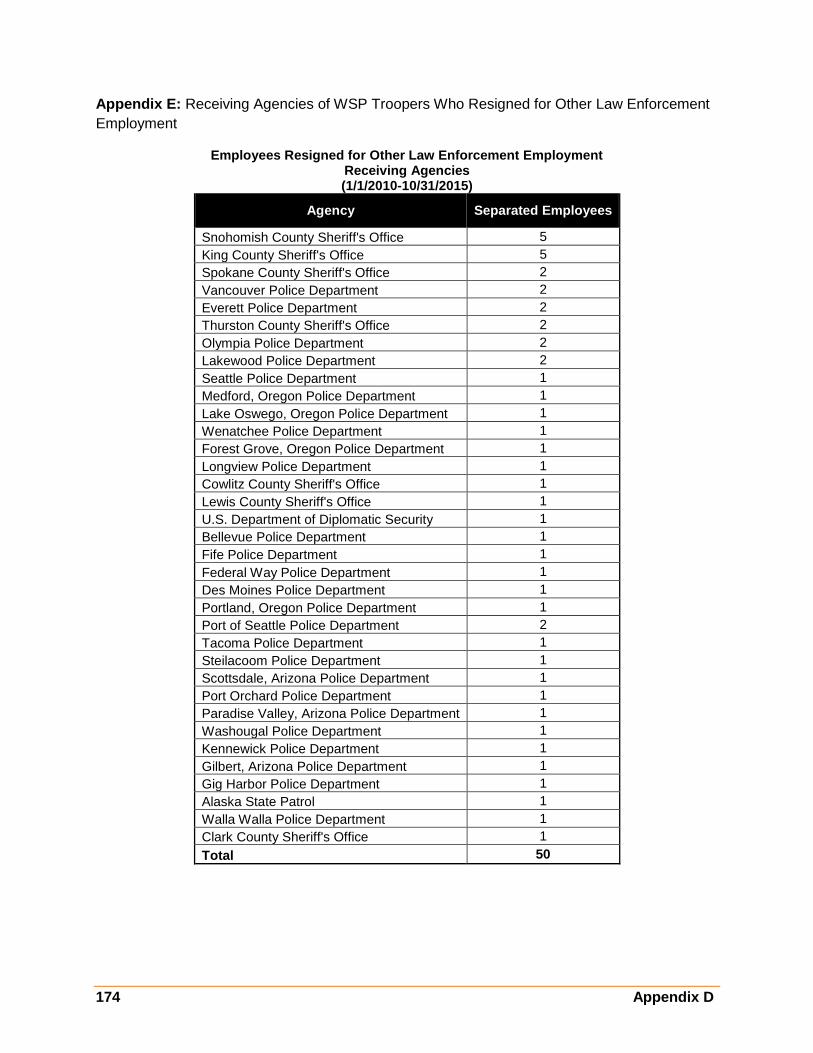
174 Appendix D
Appendix E: Receiving Agencies of WSP Troopers Who Resigned for Other Law Enforcement
Employment
Employees Resigned for Other Law Enforcement Employment Receiving Agencies (1/1/2010-10/31/2015)
Agency Separated Employees
Snohomish County Sheriff's Office 5
King County Sheriff's Office 5
Spokane County Sheriff's Office 2
Vancouver Police Department 2
Everett Police Department 2
Thurston County Sheriff's Office 2
Olympia Police Department 2
Lakewood Police Department 2
Seattle Police Department 1
Medford, Oregon Police Department 1
Lake Oswego, Oregon Police Department 1
Wenatchee Police Department 1
Forest Grove, Oregon Police Department 1
Longview Police Department 1
Cowlitz County Sheriff's Office 1
Lewis County Sheriff's Office 1
U.S. Department of Diplomatic Security 1
Bellevue Police Department 1
Fife Police Department 1
Federal Way Police Department 1
Des Moines Police Department 1
Portland, Oregon Police Department 1
Port of Seattle Police Department 2
Tacoma Police Department 1
Steilacoom Police Department 1
Scottsdale, Arizona Police Department 1
Port Orchard Police Department 1
Paradise Valley, Arizona Police Department 1
Washougal Police Department 1
Kennewick Police Department 1
Gilbert, Arizona Police Department 1
Gig Harbor Police Department 1
Alaska State Patrol 1
Walla Walla Police Department 1
Clark County Sheriff's Office 1
Total 50

Appendix F 175
Appendix F: Annual Leave for Washington Local Law Enforcement Agencies
Washington State Local Law Enforcement Annual Leave
Annual Leave
Washington State Patrol
0 YOS: 96 hours 1 YOS: 104 hours
2-3 YOS: 112 hours 4-6 hours: 120
7-9 YOS: 128 hours 10+ YOS: Additional 8 hours of leave for each additional YOS,
to a maximum of 176 hours
Kennewick
0-5 YOS: 180 hours 6-9 YOS: 204 hours
10-14 YOS: 228 hours 15-19 YOS: 252 hours 20-24 YOS: 276 hours 25+ YOS: 300 hours
King County
0-5 YOS: 96 hours 6-8 YOS: 120 hours 9-10 YOS: 128 hours 11-16 YOS: 240 hours
17+ YOS: additional 8 hours of leave for each additional YOS, to a maximum of 240 hours
Pasco
0-5 YOS: 96 hours 6-10 YOS: 120 hours 11-15 YOS: 144 hours 16-19 YOS: 160 hours 20+ YOS: 192 hours
Pierce County
0-2 YOS: 96 hours 3-6 YOS: 128 hours 7-12 YOS: 160 hours 13-17 YOS: 184 hours
18+ YOS: Additional 8 hours of leave for each additional YOS, to a maximum of 240 hours
Seattle
0-4 YOS: 96 hours 5-9 YOS: 120 hours
10-14 YOS: 128 hours 15-19 YOS: 144 hours
20+ YOS: Additional 8 hours of leave for each additional YOS, to a maximum of 240 hours

176 Appendix F
Annual Leave
Snohomish County
0 YOS: 80 hours 1 YOS: 96 hours
2-4 YOS: 120 hours 5-8 YOS: 144 hours 9-10 YOS: 168 hours 11-12 YOS: 176 hours 12-14 YOS: 184 hours 15-16 YOS: 192 hours 17-23 YOS: 200 hours 24+ YOS: 224 hours
Spokane County
0-4 YOS: 144 hours 5-9 YOS: 180 hours
10-14 YOS: 216 hours 15-19 YOS: 252 hours 20-24 YOS: 288 hours 25+ YOS: 324 hours
Tacoma
0-3 YOS: 96 hours 4-7 YOS: 120 hours 8-13 YOS: 136 hours 14-18 YOS: 160 hours
19+ YOS: Additional 8 hours of leave per YOS, to a maximum of 240 hours
Vancouver
0 YOS: 168 hours 1-4 YOS: 234 hours 5-7 YOS: 246 hours 8-11 YOS: 258 hours 12-14 YOS: 270 hours 15-19 YOS: 306 hours 20+ YOS: 330 hours
Yakima
1 YOS: 85 hours 2-4 YOS: 101 hours 5-9YOS: 125 hours
10-14 YOS: 165 hours 15-19 YOS: 189 hours 20-24 YOS: 197 hours 25+ YOS: 205 hours

Appendix G 177
Appendix G: Annual Leave for State Law Enforcement Agencies
Dashes indicate jurisdictions for which we could not determine leave amounts for publicly available data
State Law Enforcement Agencies Annual Leave
Annual Leave
Washington State Patrol
0 YOS: 96 hours 1 YOS: 104 hours
2-3 YOS: 112 hours 4-6 YOS: 120 hours 7-9 YOS: 128 hours
10+ YOS: Additional 8 hours of leave for each additional year of service, to a maximum of 176 hours
Arizona Highway Patrol
0-5 YOS: 120 hours 6-10 YOS: 144 hours 11-20 YOS: 168 hours 21+ YOS: 192 hours
California Highway Patrol
Vacation Leave: 7 months to 3 YOS: 96 hours + 48 hour "credit"
4-10 YOS: 132 hours 11-15 YOS: 156 hours 16-20 YOS: 168 hours 21+ YOS: 180 hours
Annual Leave (can be elected in lieu of vacation and sick
leave): 1 month to 3 YOS: 96 hours
4-10 YOS: 180 hours 11-15 YOS: 204 hours 16-20 YOS: 216 hours 21+ YOS: 228 hours
Colorado State Patrol -
Idaho State Police -
Michigan State Police
0 YOS: 104 hours 1-4 YOS: 122.2 hours 5-9 YOS: 137.8 hours
10-14 YOS: 153.4 hours 15-19 YOS:169 hours
20-24 YOS: 184.6 hours 25-29 YOS: 200.2 hours 30-34 YOS: 218.4 hours 35-39 YOS: 234 hours
40-44 YOS: 249.6 hours 45+ YOS: 265.2 hours
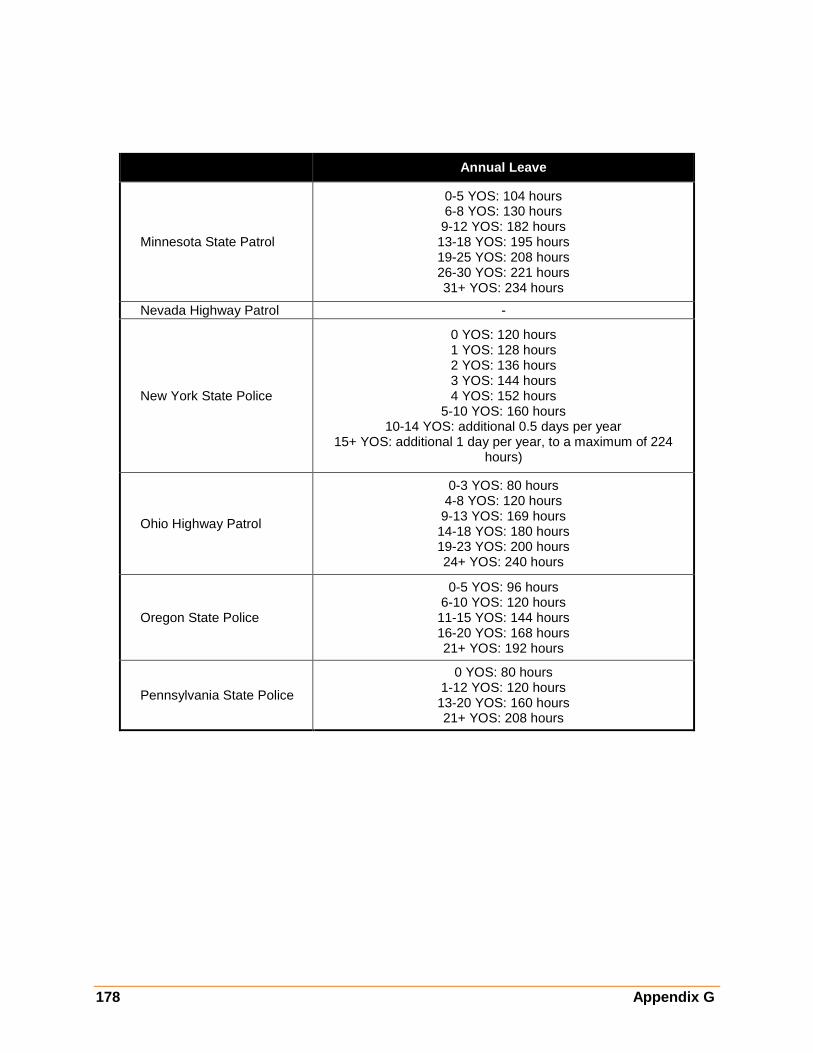
178 Appendix G
Annual Leave
Minnesota State Patrol
0-5 YOS: 104 hours 6-8 YOS: 130 hours
9-12 YOS: 182 hours 13-18 YOS: 195 hours 19-25 YOS: 208 hours 26-30 YOS: 221 hours 31+ YOS: 234 hours
Nevada Highway Patrol -
New York State Police
0 YOS: 120 hours 1 YOS: 128 hours 2 YOS: 136 hours 3 YOS: 144 hours 4 YOS: 152 hours
5-10 YOS: 160 hours 10-14 YOS: additional 0.5 days per year
15+ YOS: additional 1 day per year, to a maximum of 224 hours)
Ohio Highway Patrol
0-3 YOS: 80 hours 4-8 YOS: 120 hours
9-13 YOS: 169 hours 14-18 YOS: 180 hours 19-23 YOS: 200 hours 24+ YOS: 240 hours
Oregon State Police
0-5 YOS: 96 hours 6-10 YOS: 120 hours 11-15 YOS: 144 hours 16-20 YOS: 168 hours 21+ YOS: 192 hours
Pennsylvania State Police
0 YOS: 80 hours 1-12 YOS: 120 hours 13-20 YOS: 160 hours 21+ YOS: 208 hours

Appendix H 179
Appendix H: Washington Local Law Enforcement Agencies Employee Percent of Premium
Employee Percent of Premium (New Hires) Highest-Enrolled HMO Plan (effective 12/31/2015)
HMO Plan Individual Employee
+ Child Employee + Spouse
Family
WSP [1] Group Health Classic 15.0% 15.0% 15.0% 15.0%
Kennewick [2] Group Health Cooperative 24.1% 16.0% 13.1% 9.3%
King County [3] Deputy Sheriff's HMO Plan 0.0% 0.0% 0.0% 0.0%
Pasco Group Medical 12.0% 12.0% 12.0% 12.0%
Pierce County WTWT Plan A 6.6% 6.6% 6.6% 6.6%
Seattle Group Health Cooperative 20.0% 20.0% 20.0% 20.0%
Snohomish County Group Health Plan 0.0% 0.0% 0.0% 0.0%
Spokane County Group Health Plan 5.0% 10.0% 10.0% 10.0%
Tacoma No HMO plan offered - - - -
Vancouver Kaiser HMO Plan 0.0% 4.4% 5.0% 6.7%
Yakima No HMO plan offered - - - -
Median (excl. WSP) - 5.8% 8.3% 8.3% 8.0%
WSP Rank - 3 of 9 3 of 9 2 of 9 2 of 9
[1] WSP: The State of Washington assesses a surcharge of $50/month if an employee’s spouse of registered domestic partner enrolled on their State health care coverage do not elect to enroll in their employer-based group medical insurance that is comparable to the State’s Uniform Medical Plan Classic.
[2] Kennewick: Employees pay flat dollar amount towards medical coverage
[3] King County: Spouses are assessed a $75 benefit access fee if they have access to coverage through another source but opt in to County coverage

180 Appendix H
Employee Percent of Premium (New Hires) Highest-Enrolled PPO/POS Plan (effective 12/31/2015)
PPO/POS Plan Individual Employee
+ Child Employee + Spouse
Family
WSP [1] Uniform Medical Plan
Classic 15.0% 15.0% 15.0% 15.0%
Kennewick [2] Asuris Northwest Health 19.0% 12.7% 10.2% 7.5%
King County [3] Deputy Sheriff's PPO Plan 0.0% 0.0% 0.0% 0.0%
Pasco Group Medical 12.0% 12.0% 12.0% 12.0%
Pierce County WTWT Group Health 6.6% 6.6% 6.6% 6.6%
Seattle City of Seattle Aetna
Preventive Plan 5.0% 5.0% 5.0% 5.0%
Snohomish County Regence SC Select 2.1% 6.7% 7.6% 9.2%
Spokane County Premera 5.0% 10.0% 10.0% 10.0%
Tacoma [4] Regence Blue Shield PPO 2.9% 5.7% 5.7% 5.7%
Vancouver Blue Cross Blue Shield PPO
Plan 0.0% 4.4% 5.2% 6.6%
Yakima [5] City of Yakima Health
Insurance Plan 0.0% 2.8% 2.8% 8.5%
Median (excl. WSP) - 3.9% 6.2% 6.2% 7.1%
WSP Rank - 2 of 11 1 of 11 1 of 11 1 of 11
[1] WSP: The State of Washington assesses a surcharge of $50/month if an employee’s spouse of registered domestic partner enrolled on their State health care coverage do not elect to enroll in their employer-based group medical insurance that is comparable to the State’s Uniform Medical Plan Classic.
[2] Kennewick: Employees pay flat dollar amount towards medical coverage
[3] King County: Spouses are assessed a $75 benefit access fee if they have access to coverage through another source but opt in to County coverage
[4] Tacoma: Police employees pay a flat $40 for employee only coverage and $80 for employee and dependent coverage regardless of plan choice
[5] Yakima: Percentage reflects percentage of top step patrol officer base wage. Employee only premiums paid for by the City under LEOFF

Appendix I 181
Appendix I: State Law Enforcement Agencies Employee Percent of Premium
Employee Percent of Premium (New Hires) Highest-Enrolled PPO/POS Plan (effective 12/31/2015)
HMO Plan Individual Employee
+ Child Employee + Spouse
Family
Washington State Patrol [1] Group Health Classic 15.0% 15.0% 15.0% 15.0%
Arizona Highway Patrol United Healthcare EPO 7.0% 9.0% 10.0% 14.0%
California Highway Patrol Kaiser Permanente 12.0% 14.0% 14.0% 15.0%
Colorado State Patrol Kaiser Permanente
Copayment Plan 16.0% 18.0% 16.0% 34.0%
Idaho State Police Blue Cross Blue Shield
Business Blue 6.0% 10.0% 14.0% 18.0%
Michigan State Police No HMO plan offered - - - -
Minnesota State Patrol Minnesota Advantage
Plan 5.0% 15.0% 15.0% 15.0%
Nevada Highway Patrol Health Plan of Nevada 17.0% 18.0% 26.0% 24.0%
New York State Police Capital District
Physician's Health Plan 10.0% 16.0% 16.0% 16.0%
Ohio Highway Patrol No HMO plan offered - - - -
Oregon State Police [2] Kaiser Permanente
HMO 5.0% 5.0% 5.0% 5.0%
Pennsylvania State Police Aetna HMO 0.0% 0.0% 0.0% 0.0%
Median (excl. WSP) - 7.0% 14.0% 14.0% 15.0%
WSP Rank - 3 of 10 4 of 10 4 of 10 5 of 10
[1] WSP: The State of Washington assesses a surcharge of $50/month if an employee’s spouse of registered domestic partner enrolled on their State health care coverage do not elect to enroll in their employer-based group medical insurance that is comparable to the State’s Uniform Medical Plan Classic.
[2] Oregon State Police: For Plan Year 2015, employees pay 3% toward coverage if they elect the lowest cost plan in their area and 5% if they select any other plan. Contribution rates above reflect a State Police employee's cost if they resided in Portland in 2015, in which the Kaiser plan was not the lowest cost.

182 Appendix I
Employee Percent of Premium (New Hires)
Highest-Enrolled PPO/POS Plan (effective 12/31/2015)
PPO/POS Plan Individual Employee
+ Child Employee + Spouse
Family
Washington State Patrol [1] Uniform Medical
Plan Classic 15.0% 15% 15% 15%
Arizona Highway Patrol United Healthcare
PPO 17.0% 19.0% 19.0% 20.0%
California Highway Patrol
California Association of
Highway Patrolmen PPO Plan
10.0% 10.0% 10.0% 11.0%
Colorado State Patrol United Healthcare Copayment Plan
22.0% 24.0% 30.0% 31.0%
Idaho State Police Blue Cross Blue
Shield Large Group PPO
5.0% 8.0% 12.0% 16.0%
Michigan State Police State Health Plan
PPO 20.0% 20.0% 20.0% 20.0%
Minnesota State Patrol No PPO plan
offered - - - -
Nevada Highway Patrol Consumer Driven
Health Plan 5.0% 8.0% 11.0% 11.0%
New York State Police Empire Plan 10.0% 16.0% 16.0% 16.0%
Ohio Highway Patrol Ohio Med PPO 15.0% 15.0% 16.0% 16.0%
Oregon State Police [2] Providence Choice 3.0% 3.0% 3.0% 3.0%
Pennsylvania State Police Aetna PPO 0.0% 0.0% 0.0% 0.0%
Median (excl. WSP) - 10.0% 13.0% 14.0% 16.0%
WSP Rank - 5 of 11 6 of 11 6 of 11 7 of 11
[1] WSP: The State of Washington assesses a surcharge of $50/month if an employee’s spouse of registered domestic partner enrolled on their State health care coverage do not elect to enroll in their employer-based group medical insurance that is comparable to the State’s Uniform Medical Plan Classic. [2] Oregon State Police: For Plan Year 2015, employees pay 3% toward coverage if they elect the lowest cost plan in their area and 5% if they select any other plan. Contribution rates above reflect a State Police employee's cost if they resided in Portland in 2015, in which the Providence plan was the lowest cost.

Appendix J 183
Appendix J: Washington State Patrol Passage Rates, 25th – 29th Arming Classes (2012-2015)
Washington State Patrol Selection Process Passage Rates, 25th - 29th Arming Classes (2012-2015)
25th
Arming 26th
Arming 27th
Arming 28th
Arming 29th
Arming
Applications Accepted 76.0% 89.0% 83.0% 70.0% 69.1%
No Show for Phase I 23.0% 36.0% 43.0% 54.0% 29.8%
Written Test 59.0% 63.0% 67.0% 46.0% 69.3%
Physical Fitness Test 78.0% 65.0% 74.0% 67.0% 58.1%
Phase II (Oral Board Interview) 78.0% 72.0% 76.0% 79.0% 67.7%
Polygraph Test 69.0% 47.0% 55.0% 54.0% 54.1%
Background Examination 58.0% 64.0% 58.0% 47.0% 42.9%
Phase IV (employment offer accepted) 66.0% 67.0% 75.0% 43.0% 43.0%
Psychological Test/Exam 67.0% 76.0% 63.0% 51.0% 67.2%
Medical 100.0% 98.0% 100.0% 99.0% 100.0%
Hired 2.4% 1.9% 2.4% 1.5% 1.6%

184 Appendix J
Appendix K: Recruitment and Marketing Checklist
GENERAL RECRUITMENT ACTIVITY WSP ACTIVITY
DEVELOPING THE RECRUITMENT TEAM
Top level support and adequate fiscal
resources The Recruiting Unit has a $140K budget for the 2015-17 biennium to
conduct recruiting efforts and advertising. In addition a $200K media plan
for the 30th Arming Recruiting efforts.
Selection of an adequate number of recruiters
that reflect the diversity of community, model
community service, and understand the
agency organization, culture and policing
style
Recruitment staff consists of a Lieutenant who supervises the unit, one
Sergeant and two Trooper recruiters that are assigned to the WSP Human
Resources Department (HRD). These personnel are responsible for the
overall recruitment strategy and process, and also serve as District 5
recruiters. Additionally, HRD currently employs three polygraph
examiners (with three additional on-call backups working in other
divisions) and the psychological testing is performed by a staff
Psychologist independent of the HRD. The WSP has also recently
contracted out the written exam and physical fitness testing. The
Background Unit includes one Sergeant, two full-time civil service
personnel, five long-term limited duty Troopers (four full-time and one
part-time), and 17 part-time, on-call background investigators.
Additionally, each district has one trooper (except District 5) for a total of
10 staff. One headquarters staff member is African American and 1 is
female. One decentralized recruiter is female. Individuals apply to be
considered for these assignments as vacancies occur.
Partnering with the military Two Troopers are charged with working at Joint Base Lewis-McChord to
have contact with Camo2Commerce and other hiring endeavors. Two
Troopers have contacts with navy bases in Bremerton and Everett.
Partnering with academic institutions Recruiters have developed partnerships with local colleges to host
recruiting events. Many have used college facilities when conducting
WSP testing.
Inter-agency referral to find best fit law
enforcement job The WSP often works with partners at other state agencies to make
referrals as needed—i.e. Corrections, Fish and Wildlife.
Regional testing/inter-agency cooperation As of August 1, 2015, WSP participates in the Public Safety Testing
program for its written and physical ability tests. PST is the test provider
for virtually all law enforcement agencies in Washington State.
Participation in recruiters’ professional
association(s) There is an informal women’s recruiting group that has just started.
Otherwise, no professional organizations.
BUDGETING AND LONG TERM PLANNING
Identify attrition trends Yes-the agency has a trooper hiring forecast and regularly updated
attrition report that examines reasons for departure, tenure,
demographics, etc.
Assess your success/evaluate your progress The unit completes after action reports at the end of each class, as well
as biweekly updates of recruiting efforts and current status.

Appendix K 185
GENERAL RECRUITMENT ACTIVITY WSP ACTIVITY
Expedite testing WSP is constantly reviewing its testing procedures. After each Arming
Class, a report and analysis of recruitment, testing and hiring efforts is
created. Changes made during the past year include replacing the WSP
written and physical ability test with the PST testing system, utilizing the
NEOGOV application system (as of 9/1/13), moving the oral interview
from after the written test to after the background investigation.
Review of legal compliance, necessity of all
selection/hiring practices The WSP continually engages with peer agencies such as Seattle Police
Department and PST to ensure standards are in line with others and
compliant with legal mandates.
Awards or incentives for recruitment success In 2007, WSP offered a $50 incentive to employees who recruited an
individual who made it to a conditional offer; this was raised to $200 in
June of 2015. So far just over 10 awards have been granted.
Out of state recruitment and background
investigations During this past year, recruiting was conducted in Idaho at colleges and a
job fair, and recruiters have recently gone to Ft. Hood in Texas. Trips are
planned for BYU in Utah and also Boise State in Idaho.
Research and data analysis including
employment trends, generational differences None specific.
Development of an annual recruitment budget
and plan Due to the excessive number of vacancies, there has been no need for a
formal recruitment budget. Money has been available for all identified
activities and is redirected from salary savings for unfilled positions.
During each recruitment cycle (the 8 months preceding each of 2 Arming
classes per year) each local recruiter monitors and selects activities
specific to that District.
Promotional and media materials including
public service announcements and
promotional information and items
In April, 2014, WSP contracted with Cox Media Group (CMG) to survey
troopers and local citizens and create two commercials that rolled out in
February and June, 2015. The Agency is completing contracts with
Bigger Pictures and Geo and Associates for advertising in streaming
radio, traditional radio, social media, and outdoor billboards.
MARKETING AND TECHNOLOGY
Identify target audience The WSP has relied on information provided in the CMG survey of internal
and external participants.
Job fairs and special events Recruiters continually attend job fairs across the state as well as
surrounding states.
College campus recruiting Recruiters frequent community colleges and universities. A statewide
college career fair is being planned for March 2016 to target pending
graduates seeking employment.
Promotional materials The WSP uses materials targeted toward fitness centers. Recruiters have
business cards and specifically decorated patrol vehicles to advertise
openings. Large banners are in use to advertise openings around the
state.

186 Appendix J
GENERAL RECRUITMENT ACTIVITY WSP ACTIVITY
Mass media and regional campaigns See above.
Junior academies The agency runs a one week Kiwanis sponsored summer camp for youth
at the Shelton Academy in July each year.
Citizen academies Not conducted.
Sponsoring youth activities Not conducted—while the agency formerly had an Explorer program, it
has not been active for well over 15 years.
Use of Public Information Officer to
disseminate public interest stories The Recruiting unit works very closely with the office of Government and
Media Relations to facilitate news coverage. Some recruiters also serve
in a PIO capacity. The lieutenant has appeared in multiple TV and radio
interviews to discuss recruiting efforts. The lieutenant and lead HQ
recruiter also maintain active Twitter accounts.
Expedite candidate processing The entire process has been examined from beginning to end, with
several changes made since April of 2015. At the conclusion of this
recruiting period in November, the after action review will examine areas
of improvement.
Use of agency website for recruiting The WSP website has a wide variety of information about the job and its
entrance requirements and includes stories of work activities that make a
difference on peoples’ lives. According to available data between 7/1/14
to 1/30/15, the WSP website accounts for 31% of the WSP applicants, by
far the most effective recruitment tool in use.
Development of a candidate database to
track candidates progress and recruiter
contacts through the process
The WSP relies on NEOGOV to track and move applicants through
various stages of the process.
Use of email as a recruitment tool Recruiters rely primarily on email for scheduling and handling small
details. Additionally, the agency has a general mailbox for applicant
questions.
Use of voicemail or robo calling as a
recruitment tool WSP has not conducted automated calls.
Mentoring potential employees According to the After Action Report for the 29th Arming Class dated
6/3/15, recruiters spend quality time mentoring applicants and future
applicants including those that may be too young to apply but are
interested in a law enforcement career and those that have been
disqualified in the process but were given a short time to reapply (1-2
years). Additionally, recruiters can contact PST applicants who are near
the cut off scores to help them become more competitive.
ALTERNATIVE STAFFING AND EMPLOYEE PARTICIPATION
Law enforcement Cadets or youth corps None.
Reserve officers None.

Appendix K 187
GENERAL RECRUITMENT ACTIVITY WSP ACTIVITY
Volunteers WSP does have a volunteer program, most often staffed by retirees.
Non-sworn employees NA
Retired officers NA
Explorer scout programs No.
Interns/student workers The WSP has occasionally had interns, typically in the crime labs.
Police corps programs for college students
that include payment of student loans No.
Magnet school programs No.
Junior academies See Kiwanis summer camp above.
Testing orientation programs PST offers test orientation sessions throughout the state for individuals
who are interested in gaining knowledge about the testing process
Pre-Academy programs The pre-Academy Cadet program is designed to introduce new hires to
the agency and provide some orientation.
Formal mentoring new employees Probationary troopers have district specific mentoring and training, but
there is no formal program.
Source: Checklist developed by the California Police Officer and Training Standards; WSP practices provided by HRD staff.