washington state primary care physician survey … washington state primary care physician survey...
TRANSCRIPT

OFFICE OF FINANCIAL MANAGEMENT
2011 Washington State Primary Care Physician Survey Data Report
June 2012

OFM Forecasting Division Page i
Table of Contents
Introduction .......................................................................................................................................... 1
Select New Information on PCPs ....................................................................................................... 1
About the Survey .................................................................................................................................. 2
Results .................................................................................................................................................... 5
Section I – Practice Status and Specialty
Q01: Do you currently provide any direct care for ambulatory patients? ................................ 5 Q02: Do you currently provide direct patient care only in Washington,
both in and outside Washington, or only outside Washington? ...................................... 5 Q03 (1): Primary Specialty - Family Medicine ........................................................................... 5 Q03 (2): Primary Specialty - General Practice ........................................................................... 5 Q03 (4): Primary Specialty - General Pediatrics ........................................................................ 5 Q03 (5): Primary Specialty - General OB/GYN ........................................................................... 6 Q03 (6): Primary Specialty - General Geriatrics ......................................................................... 6
Section II – Practice Site in Washington
Q04: At how many sites in Washington do you provide direct patient care? .......................... 6 Q05 (1): Region of Main Practice............................................................................................... 6 Q05 (2): Region of Secondary Practice ...................................................................................... 6 Q06: Does your main practice site mostly provide primary care? ............................................ 7 Q07: Which best describes your main practice site in Washington? ........................................ 7 Q08 (1): # of providers at main practice - Family Medicine Physicians .................................... 7 Q08 (2): # of providers at main practice - General Practice Physicians .................................... 7 Q08 (3): # of providers at main practice - General Internal Med. Physicians ........................... 7 Q08 (4): # of providers at main practice - General Pediatricians .............................................. 8 Q08 (5): # of providers at main practice - General OB/GYNs .................................................... 8 Q08 (6): # of providers at main practice - General Geriatricians .............................................. 8 Q08 (7): # of providers at main practice - ARNPs (not CNM) .................................................... 8 Q08 (8): # of providers at main practice - Physician Assistants ................................................ 8 Q08 (9): # of providers at main practice - Licensed Midwives .................................................. 9 Q08 (10): # of providers at main practice - Cert. Nurse Midwives (CNM-
ARNP) ................................................................................................................................ 9 Q09: Do you refer patients to hospitals? .................................................................................. 9

OFM Forecasting Division Page ii
Q10: Is the hospital where you refer the largest number of your patients located in Washington? .................................................................................................... 9
Q11: Region of Referral Hospital ............................................................................................... 9
Section III – Practice Activities
Q12 (1): Work hours per typical week in WA - Direct Patient Care ..........................................10 Q12 (2): Work hours per typical week in WA - Administration of Clinical
Practice .............................................................................................................................10 Q12 (3): Work hours per typical week in WA - Other Physician Activities ................................10 Q12 (4): Work hours per typical week in WA - Computed Total Hours ....................................10 Q13: Thinking about the time you spent on direct patient care during your
last typical work week in Washington, how much of that time was spent on providing primary care? Would you say ............................................................11
Q14 (1): Work hours per typical week outside WA - Direct Patient Care .................................11 Q14 (2): Work hours per typical week outside WA - Administration of
Clinical Practice .................................................................................................................11 Q14 (3): Work hours per typical week outside WA - Other Physician
Activities ...........................................................................................................................11 Q14 (4): Work hours per typical week outside WA - - Computed Total
Hours.................................................................................................................................11 Q15: Approximately how many weeks did you work as a physician in 2010? ..........................12 Q16: Did you start practicing in Washington before 2010? ......................................................12 Q17: Please check the year you first started practicing in WA .................................................12
Section IV – Patient Service
Q18: At all sites in WA in 2010, how many patients did you provide care for? ....................................................................................................................................12
Q19: Percent of these patients (Q18n) were covered by Medicaid? ........................................12 Q20: Are you accepting new patients at main site in Washington? .........................................13 Q21: How many new patients do you yourself plan to accept at main site? ............................13 Q22: Of the new patients you plan to accept, how many are Medicaid
patients? ...........................................................................................................................13 Q23: Are you accepting new patients at other sites in Washington? .......................................13 Q24: Are you accepting Medicaid patients at other sites in Washington? ...............................13 Q25 (1): # of visits seen last typical week - in Office and Outpatient Clinics ............................13 Q25 (2): # of visits seen last typical week - on Hospital Rounds ...............................................14 Q25 (3): # of visits seen last typical week - in Nurse Homes and Patient
Homes ...............................................................................................................................14 Q25 (4): # of visits seen last typical week - in Telephone Consultation ....................................14

OFM Forecasting Division Page iii
Q25 (5): # of visits seen last typical week – via Email/Other Electronic Consultation ......................................................................................................................14
Q26: Do you normally see patients in early morning, evening, or weekend hours at your main WA practice site? ..............................................................................14
Q27: Do you have a need for interpreter services for your patients at your WA practice site? ..............................................................................................................14
Q28: Do you have adequate access to interpreter services at your WA practice site? .....................................................................................................................15
Q29 (A1): Medicaid - Time spent on paperwork ........................................................................15 Q29 (A2): Medicaid - Waiting time for reimbursement .............................................................15 Q29 (A3): Medicaid - Reimbursement rate ...............................................................................15 Q29 (A4): Medicaid - Patient acceptance of treatment options ................................................16 Q29 (A5): Medicaid - Length of patient visit ..............................................................................16 Q29 (A6): Medicaid - Acceptance of referrals by specialists ......................................................16 Q29 (A7): Medicaid - Complexity of patient needs ....................................................................16 Q29 (A8): Medicaid – Other factors ...........................................................................................17 Q29 (B1): Commercial – Time spent on paperwork ...................................................................17 Q29 (B2): Commercial – Waiting time for reimbursement ........................................................17 Q29 (B3): Commercial – Reimbursement rate ...........................................................................17 Q29 (B4): Commercial – Patient acceptance of treatment options ...........................................18 Q29 (B5): Commercial – Length of patient visit .........................................................................18 Q29 (B6): Commercial – Acceptance of referrals by specialists .................................................18 Q29 (B7): Commercial – Complexity of patient needs ...............................................................18 Q29 (B8): Commercial – Other factors .......................................................................................19
Section V – Practice History
Q30: How many years have you practiced as a licensed physician in the U.S.? ..................................................................................................................................19
Q31: How many years have you practiced as a licensed physician in WA? ..............................19 Q32: When do you plan to retire? .............................................................................................19
Section VI - Background
Q33 (1): Did you earn the degree in - Doctor of Medicine (M.D.) ............................................20 Q33 (2): Did you earn the degree in - Doctor of Osteopathic Medicine
(D.O.) .................................................................................................................................20 Q33 (3): Did you earn the degree in - Other Medical Degrees..................................................20 Q34: In which U.S. state or other country (if outside the U.S.) did you
obtain this medical degree? .............................................................................................20 Q35 (1): Were you ever in interships or residencies in - Washington State .............................20

OFM Forecasting Division Page iv
Q35 (2): Were you ever in interships or residencies in - a Rural Community ...........................20 Q35 (3): Were you ever in interships or residencies in - An inner-city
community ........................................................................................................................21 Q35 (4): Were you ever in interships or residencies in - A Predominantly
Minority Community ........................................................................................................21 Q35 (5): Were you ever in interships or residencies in - Were in none of
those interships or residences ..........................................................................................21 Q36: Age ...................................................................................................................................21 Q37: Sex ....................................................................................................................................21 Q38: Are you Hispanic, Spanish, or Latino? ...............................................................................21 Q39 (1): What race do you consider yourself to be - White? ...................................................21 Q39 (2): What race do you consider yourself to be - Black or African
American? .........................................................................................................................22 Q39 (3): What race do you consider yourself to be - Asian or Pacific
Islander? ...........................................................................................................................22 Q39 (4): What race do you consider yourself to be - American Indian or
Alaska Native? ..................................................................................................................22 Q39 (5): What race do you consider yourself to be - Other? ....................................................22 Q40: Languages you feel comfortable communicating in for most clinical
purposes? .........................................................................................................................22 Q41: Are you a participating provider of any provider networks (including
HMOs) in Washington? .....................................................................................................22 Q42: Region of Residence ..........................................................................................................23
Appendixes
A. 2011 Washington State Primary Care Physician Survey Questionnaire ........................ 24 B. Comparison of Responding Physicians and Total Physician Population ........................ 29

OFM Forecasting Division Page 1
2011 Washington State Primary Care Physician Survey
Data Report
Introduction
The Office of Financial Management (OFM) conducted, in the summer months of 2011, a survey of primary care physicians (PCP) practicing in Washington. The purpose of the survey was to gain knowledge of the characteristics and capacity of the PCP workforce, particularly in light of the much anticipated increase in demand for PCP services when a large number of currently uninsured persons are set to gain coverage in 2014 under the federal health reform law – the Affordable Care Act (ACA). The survey was funded through the U.S. Department of Health and Human Services (DHHS) through the State Health Access Program (SHAP). This report presents the distribution of the survey responses. More analyses of the survey data will be forthcoming.
Select New Information on PCPs
Some of the information in this survey was collected for the first time on Washington’s PCPs. Here are a few examples (also see chart on the next page):
· Approximately one in five (23 percent) of the PCPs practiced at 2 or more sites. · Seven in ten (70 percent) of the PCPs provided care to 1,000 or more patients in 2010. · Two in three (67 percent) of the PCPs had a patient mix in which Medicaid patients constituted less
than one third of the total patients. · Nearly eight in ten (79 percent) of the PCPs reported they are accepting new patients at the main
practice site. · Three in ten (30 percent) of PCPs accepting new patients reported that they are not accepting new
Medicaid patients. When combined with PCPs not accepting any new patients at all, a total of 45 percent of the PCPs are not currently accepting new Medicaid patients.
· Nearly two-thirds (64 percent) of the PCPs reported that they have a need for interpreter services for their patients at their main practice sites; however; about one in ten (12 percent) reported that their access to such services is inadequate.
See Results section for detailed responses to each question in the survey.

OFM Forecasting Division Page 2
About the Survey
The 2011 Washington State Primary Care Physician Survey1 was designed to be a census of all primary care physicians. Physicians with the following primary specialties are considered as PCPs in this survey: Family Medicine, General Medicine, Internal Medicine, Pediatrics, OB/GYN, and Geriatrics.2 The list of physicians in these specialties was obtained by the data collection contractor, the Gilmore Research Group, from a data vendor of the American Medical Association (AMA). AMA maintains a database called the Physician Masterfile, which includes current and historical data on virtually all doctors of Medicine (MD) and doctors of Osteopathic Medicine (DO).3 All records in the Physician Masterfile in the selected specialties and with a current Washington state mailing address and an “active” status were extracted to form the physician list for the survey.
The survey questionnaire was developed by the health care research group in OFM Forecasting Division in consultation with Susan Skillman, Deputy Director of the Center for Health Workforce Studies at the University of Washington. Several other experts were also consulted for the questionnaire development. A small-scale pretest of the questionnaire was conducted with physicians practicing in primary care. The primary mode for the survey was mail. The questionnaire was planned to be mailed first to all physicians on the list obtained from AMA and then in a second mailing to those who did not respond to 1 The full title of the survey is Washington State Survey of Physicians in Family Medicine, General Practice, Internal Medicine, Pediatrics, OB/GYN, and Geriatrics. 2 While all physicians in family medicine and general medicine are considered as PCPs, physicians in internal medicine, pediatrics, OB/GYN, and geriatrics may practice in a sub-specialty that does not deliver primary care. To separate the non-PCPs and PCS in those primary specialties, the survey used instead the descriptions of General Internal Medicine, General Pediatrics, General OB/GYN, and General Geriatrics. 3 See http://www.ama-assn.org/ama/pub/about-ama/physician-data-resources/physician-masterfile.page.
23%
70%
79%
45%
52%
12%
0%
10%
20%
30%
40%
50%
60%
70%
80%
90%
Practicing at 2 or more sites
Providing care to 1000 or more patients
Currently accepting new patients (main site)
Not accepting new Medicaid patients (main
site)
Interpreter services are needed
Selected Responses from 2011 Washington State Primary Care Physician Survey (N=5498)
64%
Adeq
uate
acc
ess t
o se
rvic
esIn
adeq
uate
acce
ss to
se
rvic
es
OFM Forecasting Division Page 3
the first mailing. In addition to mailing, the questionnaire was made available to be filled online. For those who did not respond to the second mailing and who had a contact phone number, a telephone follow-up was planned with phone interview when the situation allowed. In actual implementation, a third mailing was used in lieu of the telephone follow-up due to difficulties in reaching physicians, particular those at large practices, by phone.
At the end of the data collection, 3,471 physicians returned the survey, out of the total of 7,310 physicians identified by AMA. This yields a raw response rate of 47.5 percent. It was estimated that approximate 11 percent (or 420) of those who did not return the survey (3,839) were not licensed anymore or not engaged in any health care delivery in Washington and therefore were not eligible for the survey. A final and adjusted response rate was calculated to be 50.4 percent after subtracting 420 physicians from the denominator.
A comparison between the 3,471 physicians who returned the survey and the original sample of 7,310 physicians identified by AMA indicates the responding physicians are fairly similar to the original sample in sex, primary specialty, and region (based on mailing addresses), but the responding physicians tend to be older than physicians in the original sample (see Appendix B). As a result, appropriate weights were assigned to the 3,471 responding physicians so that they would represent the entire 7,310 physicians in the original sample.
The survey data was initially processed by the data collection contractor. OFM conducted additional processing that included consistency checks, error corrections, coding of text (open-ended) responses, imputation of missing values in key variables, and creating derived or composite variables.
Although 3,471 returned the survey, not all of them reported practicing in primary care as defined by the study or practicing at all in direct patient care. A final analysis file was created that contains 2,659 physicians who meet the definition of the study for currently practicing primary care physicians. These respondent physicians, when weighted, represent a total of 5,498 such PCPs. The survey results presented below are based on these 5,498 PCPs.
As with any surveys, this survey has its limitations. The following limitations should be considered when interpreting results from this survey.
· The AMA Physician Masterfile has been used widely by health workforce researchers. Despite its popularity, there have been criticisms about this data source. Some suggest that it does not include all physicians while others suggest that it overestimates practicing physicians. The analysis file for this survey excludes non-practicing physicians. So, the overestimate of practicing physicians is not an issue. However, if the AMA Physician Masterfile does indeed fail to include all practicing physicians, this survey may have inherited the undercount.
· Another potential undercount of practicing PCPs in Washington may come from how physicians in military services are counted. Physicians in military service may or may not be registered in the AMA Physician Masterfile. Since these physicians relocate frequently, their addresses in the AMA data may not be up to date if they are in the Masterfile at all.

OFM Forecasting Division Page 4
· The definition of a practicing PCP used in this survey differs slightly from those used by some other analysts. In order to differentiate subspecialties that are not in primary care, the survey prefixed the word “general” in all primary specialties selected for this study. Some other studies treated all physicians of the selected primary specialties as PCPs. Still some other studies collect subspecialty data and use it to exclude physicians in certain subspecialties. The definition used in this survey seems to fit in between the other two choices. It is likely that the definition used in this survey may result in a count that is between those two, smaller than the former but larger than the latter.
· Although this survey has achieved a response rate of 50 percent, a rate that is higher than those in many other similar surveys, there were still 50 percent of the targeted physicians that did not respond to the survey. Despite the use of weights to minimize the differences between the characteristics of the responding physicians and non-responding physicians, there still remains an uncertainty about whether the responding physicians might differ from the non-responding physicians regarding practicing status. That is, are the responding physicians more likely to be actively practicing compared with the non-responding physicians? If so, the survey may have overestimated the size of practicing PCPs. On the other hand, the survey may have under-estimated the size of practicing PCPs if the non-responding physicians are more likely to be actively practicing. OFM conducted post-survey research to investigate this issue. Using the snowballing technique that involves on-line search and phone calls on a random sample of 100 non-responding physicians, the research finds that the proportion of the physicians who are practicing is quite similar for the responding physicians (77 percent, unweighted) and 100 randomly sampled non-responding physicians (76 percent).

OFM Forecasting Division Page 5
Results
The survey results below are presented in the order of the questions appearing in the questionnaire (see Appendix A). While for most questions there is one table per question, some questions have more than one associated tables, such as questions that permit more than one answer. All results represent weighted responses. Note again that the results below are based on the final analysis file that includes only the PCPs who reported providing direct care for ambulatory patients and practicing in Washington.
Section I – Practice Status and Specialty
Question 01 - Do you currently provide any direct care for ambulatory patients? Q01 Frequency Percent Yes 5498 100.0 Question 02 - Do you currently provide direct patient care only in Washington, both in and outside Washington, or only outside Washington? Q02 Frequency Percent Only in Washington 5306 96.5 Both in and outside Washington 192 3.5 Question 03 (1) - Primary Specialty - Family Medicine Q03_1 Frequency Percent No 2762 50.2 Yes 2735 49.8 Question 03 (2) - Primary Specialty - General Practice Q03_2 Frequency Percent No 5361 97.5 Yes 137 2.5 Question 03 (3) - Primary Specialty - General Internal Medicine Q03_3 Frequency Percent No 4305 78.3 Yes 1193 21.7 Question 03 (4) - Primary Specialty - General Pediatrics Q03_4 Frequency Percent No 4667 84.9 Yes 830 15.1

OFM Forecasting Division Page 6
Question 03 (5) - Primary Specialty - General OB/GYN Q03_5 Frequency Percent No 4927 89.6 Yes 571 10.4 Question 03 (6) - Primary Specialty - General Geriatrics Q03_6 Frequency Percent No 5414 98.5 Yes 84 1.5 Section II – Practice Site in Washington Question 04 - At how many sites in Washington do you provide direct patient care? Q04n Frequency Percent One 4214 76.6 Two 912 16.6 Three or More 372 6.8 Question 05 (1) – Region of Main Practice SPS_10region_practice1 Frequency Percent CLARK 257 4.7 EAST BALANCE 355 6.5 KING 2181 39.7 NORTH SOUND 322 5.9 OTHER PUGET SOUND METRO 388 7.1 PIERCE 638 11.6 SNOHOMISH 365 6.6 SPOKANE 395 7.2 WEST BALANCE 258 4.7 YAKIMA - TRI CITIES 338 6.1 Question 05 (2) – Region of Secondary Practice SPS_10region_practice1 Frequency Percent _Skipped or missing 4221 . CLARK 88 6.9 EAST BALANCE 99 7.8 KING 532 41.7 NORTH SOUND 75 5.9 OTHER PUGET SOUND METRO 61 4.8 PIERCE 122 9.5 SNOHOMISH 72 5.6 SPOKANE 91 7.2 WEST BALANCE 50 3.9 YAKIMA - TRI CITIES 87 6.8

OFM Forecasting Division Page 7
Question 06 – Does your main practice site mostly provide primary care? Q06 Frequency Percent _ Missing 54 . Yes 4766 87.6 No 677 12.4 Question 07 – Which best describes your main practice site in Washington? 07 Frequency Percent _ Missing 65 . Private physician office/clinic 2617 48.2 Hospital outpatient clinic 1118 20.6 HMO medical center 459 8.5 Federally Qualified Health Center (FQHC) 430 7.9 Certified Rural Health Clinic (RHC) 164 3.0 Or some Other office or clinic (SPECIFY:) 645 11.9 Question 08 (1) – # of providers at main practice - Family Medicine Physicians Q08n01 Frequency Percent _Missing 205 . 0 1767 33.4 1-2 832 15.7 3-5 991 18.7 6-10 1051 19.9 More than 10 652 12.3 Question 08 (2) – # of providers at main practice - General Practice Physicians Q08n02 Frequency Percent _Missing 210 . 0 4947 93.6 1-2 208 3.9 3-5 59 1.1 6-10 46 0.9 More than 10 27 0.5 Question 08 (3) – # of providers at main practice - General Internal Med. Physicians Q08n03 Frequency Percent _Missing 205 . 0 3212 60.7 1-2 848 16.0 3-5 536 10.1 6-10 371 7.0 More than 10 327 6.2

OFM Forecasting Division Page 8
Question 08 (4) – # of providers at main practice - General Pediatricians Q08n04 Frequency Percent _Missing 211 . 0 3504 66.3 1-2 786 14.9 3-5 461 8.7 6-10 327 6.2 More than 10 209 4.0 Question 08 (5) – # of providers at main practice - General OB/GYNs Q08n05 Frequency Percent _Missing 206 . 0 4088 77.3 1-2 408 7.7 3-5 386 7.3 6-10 326 6.2 More than 10 83 1.6 Question 08 (6) – # of providers at main practice - General Geriatricians
Q08n06 Frequency Percent Missing/Skipped 208 . 0 4965 93.9 1-2 178 3.4 3-5 102 1.9 6-10 37 0.7 More than 10 7 0.1 Question 08 (7) – # of providers at main practice - ARNPs (not CNM) Q08n07 Frequency Percent _Missing 217 . 0 3049 57.7 1-2 1482 28.1 3-5 542 10.3 6-10 135 2.6 More than 10 71 1.3 Question 08 (8) – # of providers at main practice - Physician Assistants Q08n08 Frequency Percent _Missing 218 . 0 3357 63.6 1-2 1189 22.5 3-5 513 9.7 6-10 159 3.0 More than 10 62 1.2

OFM Forecasting Division Page 9
Question 08 (9) – # of providers at main practice - Licensed Midwives Q08n09 Frequency Percent Missing/Skipped 214 . 0 5160 97.7 1-2 59 1.1 3-5 44 0.8 6-10 19 0.4 More than 10 2 0.0 Question 08 (10) – # of providers at main practice - Cert. Nurse Midwives (CNM-ARNP) Q08n10 Frequency Percent _Missing 219 . 0 4918 93.2 1-2 206 3.9 3-5 84 1.6 6-10 69 1.3 More than 10 2 0.0 Question 09 – Do you refer patients to hospitals? Q09 Frequency Percent _Missing 45 . Yes 5252 96.3 No 200 3.7 Question 10 - Is the hospital where you refer the largest number of your patients located in Washington? Q10 Frequency Percent _Missing 256 . Yes 5190 99.0 No 51 1.0 Question 11 - Region of Referral Hospital SPS_10region_hospital Frequency Percent _ Missing 426 . CLARK 248 4.9 EAST BALANCE 360 7.1 KING 2192 43.2 NORTH SOUND 294 5.8 OTHER PUGET SOUND METRO 307 6.1 PIERCE 546 10.8 SNOHOMISH 216 4.3 SPOKANE 381 7.5 WEST BALANCE 233 4.6 YAKIMA - TRI CITIES 294 5.8

OFM Forecasting Division Page 10
Section III – Practice Activities Question 12 (1) - Work hours per typical week in WA - Direct Patient Care imp_Q12n1 Frequency Percent 0 146 2.6 1-19 hours 532 9.7 20-34 hours 1717 31.2 34-39 hours 590 10.7 40-49 hours 1441 26.2 50 or more hours 1072 19.5 Question 12 (2) - Work hours per typical week in WA - Administration of Clinical Practice imp_Q12n2 Frequency Percent 0 1797 32.7 1-19 hours 3376 61.4 20-34 hours 260 4.7 34-39 hours 10 0.2 40-49 hours 36 0.7 50 or more hours 20 0.4 Question 12 (3) - Work hours per typical week in WA - Other Physician Activities imp_Q12n3 Frequency Percent 0 2657 48.3 1-19 hours 2555 46.5 20-34 hours 217 4.0 34-39 hours 19 0.3 40-49 hours 27 0.5 50 or more hours 22 0.4 Question 12 (4) - Work hours per typical week in WA - Computed Total Hours imp_Q12sum Frequency Percent 0 133 2.4 1-19 hours 219 4.0 20-34 hours 919 16.7 34-39 hours 404 7.4 40-49 hours 1614 29.4 50 or more hours 2208 40.2

OFM Forecasting Division Page 11
Question 13 – Thinking about the time you spent on direct patient care during your last typical work week in Washington, how much of that time was spent on providing primary care? Would you say… Q13 Frequency Percent _Missing 81 . All 3554 65.6 Most 1047 19.3 About half 220 4.1 Less than half 424 7.8 Or none 172 3.2 Question 14 (1) - Work hours per typical week outside WA - Direct Patient Care imp_Q14n1 Frequency Percent _Skipped (did not work outside WA) 5306 . 0 115 60.2 1-19 hours 45 23.6 20-34 hours 15 8.0 34-39 hours 8 4.4 40-49 hours 5 2.8 50 or more hours 2 1.0 Question 14 (2) - Work hours per typical week outside WA - Administration of Clinical Practice imp_Q14n2 Frequency Percent _Skipped (did not work outside WA) 5306 . 0 163 85.1 1-19 hours 29 14.9 Question 14 (3) - Work hours per typical week outside WA - Other Physician Activities imp_Q14n3 Frequency Percent _Skipped (did not work outside WA) 5306 . 0 163 84.9 1-19 hours 29 15.1 Question 14 (4) - Work hours per typical week outside WA - - Computed Total Hours imp_Q14sum Frequency Percent _Skipped (did not work outside WA) 5306 . 0 101 52.9 1-19 hours 57 30.0 20-34 hours 15 7.7 34-39 hours 4 2.0 40-49 hours 9 4.6 50 or more hours 5 2.8

OFM Forecasting Division Page 12
Question 15 - Approximately how many weeks did you work as a physician in 2010? imp_Q15n Frequency Percent 0 19 0.3 1-13 88 1.6 14-26 163 3.0 27-39 211 3.8 40-52 5016 91.2 Question 16 - Did you start practicing in Washington before 2010? imp_Q16 Frequency Percent Yes 5101 92.8 No 397 7.2 Question 17 - Please check the year you first started practicing in WA imp_Q17 Frequency Percent _Skipped (started practicing in WA prior to 2010) 5101 . 2010 346 87.0 2011 52 12.9
Section IV – Patient Service
Question 18 - At all sites in WA in 2010, how many patients did you provide care for? imp_Q18n Frequency Percent _Skipped (started practicing in 2011) 52 . None 33 0.6 1-99 236 4.3 100-499 681 12.5 500-999 680 12.5 1000-1499 1023 18.8 1500-1999 819 15.0 2000 or more 1975 36.3 Question 19 - Percent of these patients (Q18n) were covered by Medicaid? imp_Q19n Frequency Percent _Skipped (Treated no patients in 2010) 33 . _Skipped (started practicing in 2011) 52 . 0 506 9.3 1-24 3131 57.8 25-49 1248 23.1 50-99 369 6.8 76-100 160 3.0

OFM Forecasting Division Page 13
Question 20 - Are you accepting new patients at main site in Washington? imp_Q20 Frequency Percent Yes 4318 78.5 No 1180 21.5 Question 21 - How many new patients do you yourself plan to accept at main site? imp_Q21n Frequency Percent _Skipped (not accepting new patients) 1180 . 1-99 834 19.3 100-499 1930 44.7 500-999 1050 24.3 1000-1499 394 9.1 1500-1999 56 1.3 2000 or more 53 1.2 Question 22 - Of the new patients you plan to accept, how many are Medicaid patients? imp_q22 Frequency Percent _Skipped (not accepting new patients) 1180 . All 905 20.9 Most 367 8.5 About half 342 7.9 Less than half 1397 32.4 Or none 1307 30.3 Question 23 - Are you accepting new patients at other sites in Washington? imp_q23 Frequency Percent _Skipped (only worked at one site in WA) 4233 . Yes 493 39.0 No 771 61.0 Question 24 - Are you accepting Medicaid patients at other sites in Washington? imp_q24 Frequency Percent _Skipped (only worked at one site in WA), or _Skipped (not accepting any new patients at other sites in WA)
5004 .
Yes 377 76.5 No 116 23.5 Question 25 (1) - # of visits seen last typical week - in Office and Outpatient Clinics imp_q25n1 Frequency Percent None 206 3.7 1-99 4150 75.5 100-499 1104 20.1 500-999 38 0.7

OFM Forecasting Division Page 14
Question 25 (2) - # of visits seen last typical week - on Hospital Rounds imp_q25n2 Frequency Percent None 3062 55.7 1-99 2395 43.6 100-499 35 0.6 500-999 6 0.1 Question 25 (3) - # of visits seen last typical week - in Nurse Homes and Patient Homes imp_q25n3 Frequency Percent None 4374 79.6 1-99 1115 20.3 100-499 6 0.1 500-999 3 0.1 Question 25 (4) - # of visits seen last typical week - in Telephone Consultation imp_q25n4 Frequency Percent None 2146 39.0 1-99 3310 60.2 100-499 38 0.7 500-999 5 0.1 Question 25 (5) - # of visits seen last typical week – via Email/Other Electronic Consultation imp_q25n5 Frequency Percent None 3411 62.0 1-99 2044 37.2 100-499 41 0.7 500-999 2 0.0 Question 26 - Do you normally see patients in early morning, evening, or weekend hours at your main WA practice site? Q26 Frequency Percent _Missing 120 . Yes 2625 48.8 No 2753 51.2 Question 27 - Do you have a need for interpreter services for your patients at your WA practice site? Q27 Frequency Percent _Missing 112 . Yes 3442 63.9 No 1944 36.1

OFM Forecasting Division Page 15
Question 28 - Do you have adequate access to interpreter services at your WA practice site? Q28 Frequency Percent _Skipped (did not have a need for interpreter services), or _Missing
2058 .
Yes 2819 82.0 No 620 18.0 Question 29 (A1) Medicaid - Time spent on paperwork Q29A1 Frequency Percent _Skipped (did not see Medicaid patients), or _Missing
1105 .
No problem 299 6.8 2 487 11.1 3 1138 25.9 4 1426 32.5 Major problem 1042 23.7 Question 29 (A2) Medicaid - Waiting time for reimbursement Q29A2 Frequency Percent _Skipped (did not see Medicaid patients), or _Missing
1901 .
No problem 544 15.1 2 506 14.1 3 1114 31.0 4 821 22.8 Major problem 612 17.0 Question 29 (A3) Medicaid - Reimbursement rate Q29A3 Frequency Percent _Skipped (did not see Medicaid patients), or _Missing
1617 .
No problem 302 7.8 2 203 5.2 3 514 13.2 4 807 20.8 Major problem 2055 53.0

OFM Forecasting Division Page 16
Question 29 (A4) Medicaid - Patient acceptance of treatment options Q29A4 Frequency Percent _Skipped (did not see Medicaid patients), or _Missing
1218 .
No problem 790 18.5 2 1146 26.8 3 1273 29.8 4 722 16.9 Major problem 349 8.1 Question 29 (A5) Medicaid - Length of patient visit Q29A5 Frequency Percent _Skipped (did not see Medicaid patients), or _Missing
1160 .
No problem 769 17.7 2 938 21.6 3 1198 27.6 4 982 22.6 Major problem 451 10.4 Question 29 (A6) Medicaid - Acceptance of referrals by specialists Q29A6 Frequency Percent _Skipped (did not see Medicaid patients), or _Missing
1187 .
No problem 489 11.3 2 427 9.9 3 725 16.8 4 1135 26.3 Major problem 1534 35.6 Question 29 (A7) Medicaid - Complexity of patient needs Q29A7 Frequency Percent _Skipped (did not see Medicaid patients), or _Missing
1131 .
No problem 251 5.8 2 382 8.7 3 986 22.6 4 1598 36.6 Major problem 1150 26.3

OFM Forecasting Division Page 17
Question 29 (A8) Medicaid – Other factors
Q29A8 Frequency Percent _Skipped (did not see Medicaid patients), or _Missing
5116 .
No problem 16 4.2 2 2 0.6 3 26 6.9 4 67 17.5 Major problem 271 70.8 Question 29 (B1) Commercial – Time spent on paperwork
Q29B1 Frequency Percent _Skipped (did not see commercial plan patients), or _Missing
861 .
No problem 380 8.2 2 984 21.2 3 1655 35.7 4 1050 22.7 Major problem 567 12.2 Question 29 (B2) Commercial – Waiting time for reimbursement
Q29B2 Frequency Percent _Skipped (did not see commercial plan patients), or _Missing
1610 .
No problem 736 18.9 2 1175 30.2 3 1456 37.4 4 367 9.5 Major problem 153 3.9 Question 29 (B3) Commercial – Reimbursement rate
Q29B3 Frequency Percent _Skipped (did not see commercial plan patients), or _Missing
1367 .
No problem 616 14.9 2 1173 28.4 3 1500 36.3 4 612 14.8 Major problem 230 5.6

OFM Forecasting Division Page 18
Question 29 (B4) Commercial – Patient acceptance of treatment options
Q29B4 Frequency Percent _Skipped (did not see commercial plan patients), or _Missing
948 .
No problem 1070 23.5 2 1939 42.6 3 1227 27.0 4 267 5.9 Major problem 47 1.0 Question 29 (B5) Commercial – Length of patient visit
Q29B5 Frequency Percent _Skipped (did not see commercial plan patients), or _Missing
914 .
No problem 1026 22.2 2 1601 34.9 3 1457 31.8 4 390 8.5 Major problem 110 2.4 Question 29 (B6) Commercial – Acceptance of referrals by specialists
Q29B6 Frequency Percent _Skipped (did not see commercial plan patients), or _Missing
975 .
No problem 1980 43.8 2 1626 35.9 3 663 14.7 4 186 4.1 Major problem 68 1.5 Question 29 (B7) Commercial – Complexity of patient needs
Q29B7 Frequency Percent _Skipped (did not see commercial plan patients), or _Missing
916 .
No problem 518 11.3 2 1580 34.5 3 1872 40.9 4 459 10.0 Major problem 153 3.3

OFM Forecasting Division Page 19
Question 29 (B8) Commercial – Other factors
Q29B8 Frequency Percent _Skipped (did not see commercial plan patients), or _Missing
5211 .
No problem 45 15.8 2 72 25.3 3 58 20.4 4 39 13.5 Major problem 72 25.1 Section V – Practice History Question 30 - How many years have you practiced as a licensed physician in the U.S.? Q30n Frequency Percent _Missing 75 . 0 3 0.1 Less than 5 years 714 13.2 5-9 years 726 13.4 10-14 years 811 14.9 15-19 years 622 11.5 20 or more years 2548 47.0 Question 31 - How many years have you practiced as a licensed physician in WA? Q31n Frequency Percent _Missing 77 . 0 11 0.2 Less than 5 years 1080 19.9 5-9 years 866 16.0 10-14 years 877 16.2 15-19 years 610 11.3 20 or more years 1976 36.5 Question 32 - When do you plan to retire? Q32n Frequency Percent _Missing 554 . Already retired 28 0.5 Within the next 6 months 64 1.3 More than 6 months from now but within the next 2 years 241 4.9 Within the next 3 to 5 years 686 13.9 Within the next 6 to 10 years 929 18.8 More than 10 years from now 2997 60.6

OFM Forecasting Division Page 20
Section VI – Background Question 33 (1) - Did you earn the degree in - Doctor of Medicine (M.D.) Q33_1 Frequency Percent _Missing 23 . No 385 7.0 Yes 5089 93.0 Question 33 (2) - Did you earn the degree in - Doctor of Osteopathic Medicine (D.O.) Q33_2 Frequency Percent _Missing 23 . No 5088 92.9 Yes 386 7.1 Question 33 (3) - Did you earn the degree in - Other Medical Degrees Q33_3 Frequency Percent _Missing 23 . No 5451 99.6 Yes 23 0.4 Question 34 - In which U.S. state or other country (if outside the U.S.) did you obtain this medical degree? Q34 Frequency Percent _Missing 541 . A Foreign Country 655 13.2 Another US State 3298 66.5 Washington 1004 20.3 Question 35 (1) - Were you ever in interships or residencies in - Washington State Q35_1 Frequency Percent _Missing 132 . No 3159 58.9 Yes 2206 41.1 Question 35 (2) - Were you ever in interships or residencies in - a Rural Community Q35_2 Frequency Percent _Missing 132 . No 4733 88.2 Yes 632 11.8

OFM Forecasting Division Page 21
Question 35 (3) - Were you ever in interships or residencies in - An inner-city community Q35_3 Frequency Percent _Missing 132 . No 3652 68.1 Yes 1713 31.9 Question 35 (4) - Were you ever in interships or residencies in - A Predominantly Minority Community Q35_4 Frequency Percent _Missing 132 . No 4564 85.1 Yes 801 14.9 Question 35 (5) - Were you ever in interships or residencies in - Were in none of those interships or residences Q35_5 Frequency Percent _Missing 133 . No 3859 71.9 Yes 1506 28.1 Question 36 – Age Age Frequency Percent Less than 35 585 10.6 35-49 2127 38.7 50-64 2394 43.5 65 plus 392 7.1 Question 37 – Sex Q37 Frequency Percent Male 2981 54.2 Female 2517 45.8 Question 38 - Are you Hispanic, Spanish, or Latino? Q38 Frequency Percent _Missing 72 . Yes 156 2.9 No 5270 97.1 Question 39 (1) - What race do you consider yourself to be - White? Q39_1 Frequency Percent _Missing 153 . No 902 16.9 Yes 4443 83.1

OFM Forecasting Division Page 22
Question 39 (2) - What race do you consider yourself to be - Black or African American? Q39_2 Frequency Percent _Missing 153 . No 5277 98.7 Yes 67 1.3 Question 39 (3) - What race do you consider yourself to be - Asian or Pacific Islander? Q39_3 Frequency Percent _Missing 153 . No 4482 83.9 Yes 863 16.1 Question 39 (4) - What race do you consider yourself to be - American Indian or Alaska Native? Q39_4 Frequency Percent _Missing 153 . No 5272 98.7 Yes 72 1.3 Question 39 (5) - What race do you consider yourself to be - Other? Q39_5 Frequency Percent _Missing 155 . No 5253 98.1 Yes 100 1.9 Question 40 - Languages you feel comfortable communicating in for most clinical purposes? Q40x Frequency Percent _Missing 66 . English Only 3523 64.9 English and Spanish 920 16.9 English and Spanish and Other(s) 187 3.4 English and non-Spanish Other(s) 801 14.8 Question 41 - Are you a participating provider of any provider networks (including HMOs) in Washington? Q41 Frequency Percent _Missing 319 . Yes 3766 72.7 No 1413 27.3

OFM Forecasting Division Page 23
Question 42 – Region of Residence SPS_10region_home Frequency Percent _ Missing 16 . CLARK 254 4.6 EAST BALANCE 346 6.3 KING 2277 41.5 NORTH SOUND 333 6.1 OTHER PUGET SOUND METRO 421 7.7 PIERCE 594 10.8 SNOHOMISH 284 5.2 SPOKANE 395 7.2 WEST BALANCE 247 4.5 YAKIMA - TRI CITIES 333 6.1

OFM Forecasting Division Page 24
Appendix A. Questionnaire for 2011 Washington State Primary Care Physician Survey
PRACTICE STATUS AND SPECIALTY
Q01. Do you currently provide any direct care for ambulatory patients? PLEASE CIRCLE ONE 1. Yes 2. No (IF “NO”, SKIP TO QUESTION Q30)
Q02. Do you currently provide direct patient care only in Washington, both in and outside Washington, or only outside Washington? PLEASE CIRCLE ONE
1. Only in Washington 2. Both in and outside Washington 3. Only outside Washington (IF “ONLY OUTSIDE
WASHINGTON”, SKIP TO QUESTION Q30)
Q03. What is your primary specialty? (PLEASE SELECT ONE) 1. Family Medicine 2. General Practice 3. General Internal Medicine 4. General Pediatrics 5. General OB/GYN 6. General Geriatrics 7. Other primary specialty (SPECIFY)
___________________________________________ (IF “OTHER PRIMARY SPECIALTY”, SKIP TO QUESTION Q30)
PRACTICE SITE IN WASHINGTON
In the following few questions, the term “main practice site in Washington” refers to (1) the practice site in Washington if you only work at one site in Washington, or (2) the practice site in Washington where you work the most hours if you work at more than one site in Washington.
Q04. At how many sites in Washington do you provide direct patient care?
Number of sites: __________
Q05. Where are your main practice site and secondary practice site (if applicable) in Washington located?
Main Site Secondary Site
1. City: ______________ _____________
2. ZIP code: ______________ _____________
Q06. Does your main practice site in Washington mostly provide primary care?
1. Yes 2. No
Q07. Which ONE of the following best describes your main practice site in Washington?
1. Private physician office/clinic 2. Hospital outpatient clinic 3. HMO medical center 4. Federally Qualified Health Center (FQHC) 5. Certified Rural Health Clinic (RHC) 6. Other office or clinic not listed above (DESCRIBE)
__________________________________________
Q08. How many providers, including yourself (where applicable), in each of the following categories provide care at your main practice site in Washington? (USE ZERO IF THERE IS NO ONE AT THIS SITE IN THAT CATEGORY.)
Number of
Providers 1. Family Medicine Physicians _______ 2. General Practice Physicians _______ 3. General Internal Medicine Physicians _______ 4. General Pediatricians _______ 5. General OB/GYNs _______ 6. General Geriatricians _______ 7. ARNPs (not CNM) _______ 8. Physician Assistants _______ 9. Licensed Midwives _______ 10. Certified Nurse Midwives (CNM-ARNP) _______
Q09. Do you refer patients to hospitals? 1. Yes 2. No (IN “NO”, SKIP TO QUESTION Q12)
Q10. Is the hospital where you refer the largest number of your patients located in Washington?
1. Yes 2. No
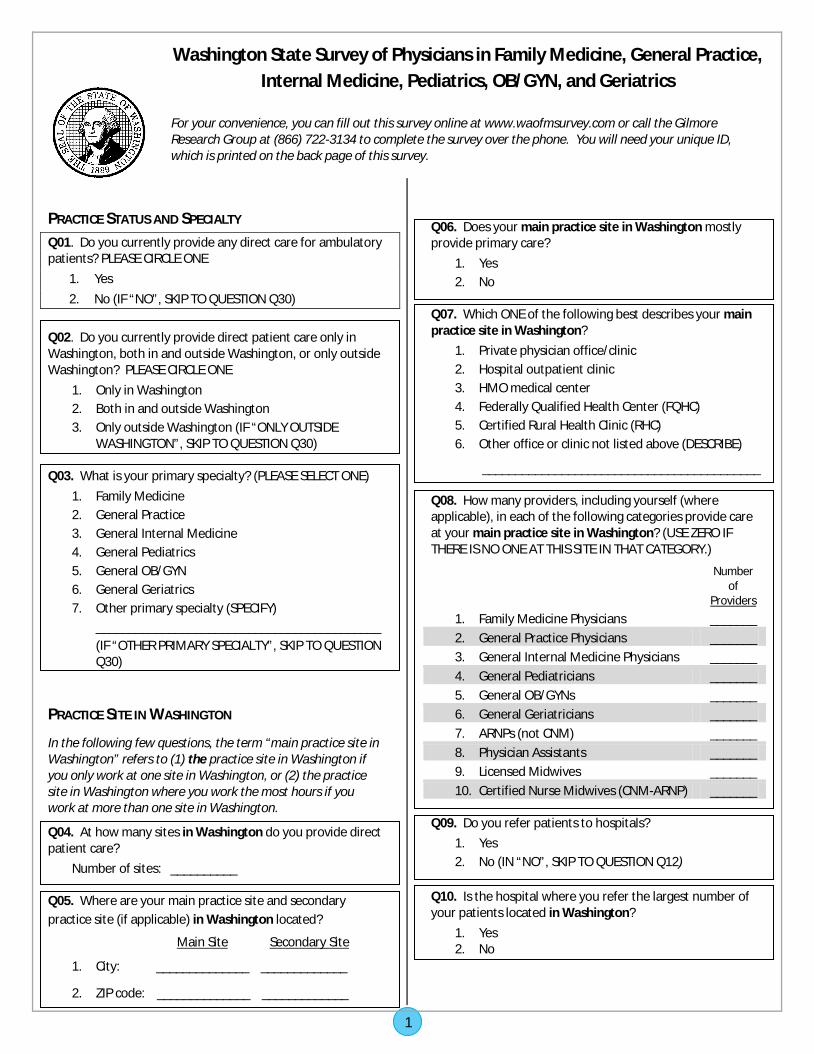
Washington State Survey of Physicians in Family Medicine, General Practice, Internal Medicine, Pediatrics, OB/GYN, and Geriatrics
For your convenience, you can fill out this survey online at www.waofmsurvey.com or call the Gilmore Research Group at (866) 722-3134 to complete the survey over the phone. You will need your unique ID, which is printed on the back page of this survey.
1

Q11. Thinking about hospitals in Washington, please provide the name and the city of the hospital where you refer the most patients. Check the “N/A” box if you refer all your patients out of Washington. Hospital Name: _______________________________
City: _______________________________ o N/A - I refer all my patients out of Washington.
PRACTICE ACTIVITIES Q12. During your last typical work week, approximately how many hours did you spend on the following physician activities at all your practice sites in Washington? Do not include on-call time.
Hours
1. Direct patient care Includes: seeing patients, reviewing tests, preparing for and performing surgery/procedures, providing other related patient care services
_______ 2. Administration of clinical practice _______ 3. Other physician activities _______ 4. Total hours (ADD ITEMS 1-3) _______
Q13. Thinking about the time you spent on direct patient care during your last typical work week in Washington, how much of that time was spent on providing primary care?
1. All 2. Most 3. About half 4. Less than half 5. None
Q14. During your last typical work week, approximately how many hours did you spend on the following physician activities at all your practice sites outside Washington? Do not include on-call time. Check the “N/A” box if you do not practice outside Washington. Hours
1. Direct patient care _______ 2. Administration of clinical practice _______ 3. Other physician activities _______ 4. Total hours (ADD ITEMS 1-3) _______ o N/A – I do not practice outside Washington.
Q15. Approximately how many weeks did you work as a physician in 2010? (Do not include time spent at professional conferences, military service, vacation, and other absences.)
Number of weeks: __________
Q16. Did you start practicing in Washington before 2010? 1. Yes (SKIP TO QUESTION Q18) 2. No
Q17. Please circle the year and month you first started practicing in Washington?
Year: 2010 2011
Month: Jan Feb Mar Apr May Jun Jul Aug Sep Oct Nov Dec
PATIENT SERVICE
Q18. During 2010 at all your practice sites in Washington, what was your patient panel size if you worked for an HMO or about how many unique patients did you provide care for if you worked in a non-HMO setting? Your best estimate is fine.
Number of patients: __________
Q19. Approximately what percent of these patients were covered by Medicaid only?
Percent Medicaid only: __________
Q20. Are you yourself currently accepting any new patients at your main practice site in Washington?
1. Yes 2. No (SKIP TO QUESTION Q23)
Q21. Currently, about how many more new patients do you yourself plan to accept at this site?
Number of new patients: __________
Q22. Of the total new patients you plan to accept, about how many Medicaid patients would you be willing to accept?
1. All 2. Most 3. About half 4. Less than half 5. None
Q23. Are you yourself accepting any new patients at any other practice sites in Washington? Check the box for “N/A” box if you practice at only one site in Washington.
1. Yes 2. No (SKIP TO QUESTION Q25) o N/A – I only practice at one site. (SKIP TO QUESTION Q25)
Q24. Are you yourself accepting any new Medicaid patients at any of the other practice sites in Washington?
1. Yes 2. No
2

Q25. Thinking about all your practice sites in Washington, during your last typical week of work, how many patient visits did you personally have in each of the following settings? Your best estimate is fine.
Please count as one visit each time you saw a patient or provided a telemedicine consultation (e.g. telephone and email in lieu of an office visit) to a patient. Circle “N/A” if the category does not apply to you (for instance, you don’t do hospital rounds).
1. Visits in the office and outpatient clinics _____Visits N/A 2. Visits on hospital rounds _____Visits N/A 3. Visits in nursing homes and patients’ homes _____Visits N/A 4. Telephone consultations _____Visits N/A 5. Email/Other electronic consultations _____Visits N/A
Q26. Do you normally see patients in early morning, evening, or weekend hours at your main practice site in Washington?
1. Yes 2. No
Q27. Do you have a need for interpreter services for your patients at your main practice site in Washington? 1. Yes 2. No (IF”NO”, SKIP TO QUESTION Q29)
Q28. Do you have adequate access to interpreter services at your main practice site in Washington? 1. Yes 2. No
Q29. On the scale of 1 to 5, where 1 means “No Problem” and 5 means “Major Problem,” please rate each factors listed on the left of the table below in terms of how they affect your practice for Medicaid patients and commercial plan patients. Check the “N/A” box under “Medicaid Patients” or “Commercial Plan Patients” if you do not see patients covered by that source.
Medicaid Patients N/A – I do not see patients covered by Medicaid.
Commercial Plan Patients N/A – I do not see patients covered by commercial plans.
CIRCLE A NUMBER FROM 1 THROUGH 5 IN EACH RECTANGLE WHERE 1 MEANS “NO PROBLEM” AND 5 MEANS “MAJOR PROBLEM”.
1. Time spent on paperwork 1 2 3 4 5 1 2 3 4 5
2. Waiting time for reimbursement 1 2 3 4 5 1 2 3 4 5
3. Reimbursement rate 1 2 3 4 5 1 2 3 4 5
4. Patient acceptance of treatment options 1 2 3 4 5 1 2 3 4 5
5. Length of patient visit 1 2 3 4 5 1 2 3 4 5 6. Acceptance of referrals by specialists 1 2 3 4 5 1 2 3 4 5
7. Complexity of patient needs 1 2 3 4 5 1 2 3 4 5
8. Other (DESCRIBE): _____________________
_____________________________________ 1 2 3 4 5 1 2 3 4 5
PRACTICE HISTORY Q30. How many total years have you practiced as a licensed physician in the U.S.?
Number of Years: __________
Q31. How many total years have you practiced as a licensed physician in Washington?
Number of Years: __________
Q32. When do you plan to retire? 1. Already retired 2. Within the next 6 months 3. More than 6 months from now but within the next 2
years 4. Within the next 3 to 5 years 5. Within the next 6 to 10 years 6. More than 10 years from now 7. Don’t know/Not sure
3

BACKGROUND
Q33. Which medical degree have you obtained? 1. Doctor of Medicine (M.D.) 2. Doctor of Osteopathic Medicine (D.O.) 3. Other medical degree (SPECIFY)
___________________________________________
Q34. In which U.S. state or other country (if outside the U.S.) did you obtain this medical degree?
1. U.S. State (USE STATE ABBREVIATION) __ __ 2. Other country (GIVE COUNTRY NAME)
___________________________________________
Q35. Were you ever in any internships or residencies in the following places? PLEASE CIRCLE ALL THAT APPLY
1. Washington State 2. A rural community 3. An inner-city community 4. A predominantly minority community 5. None of the above
Q36. What is your year of birth?
Year: __________
Q37. What is your sex? 1. Male 2. Female
Q38. Are you Hispanic, Spanish, or Latino? 1. Yes 2. No
Q39. What race do you consider yourself to be? PLEASE CIRCLE ALL THAT APPLY.
1. White 2. Black or African American 3. Asian or Pacific Islander 4. American Indian or Alaska Native 5. Other (DESCRIBE)
___________________________________________ 6. Don’t know
Q40. In addition to English, what languages do you feel comfortable communicating in for most clinical purposes? CIRCLE ALL THAT APPLY.
1. None (English only) 2. Spanish 3. Other language(s) (SPECIFY)
___________________________________________
Q41. Are you a participating provider of any provider networks (including HMOs) in Washington?
1. Yes 2. No
Q42. Do you currently reside in Washington State? 1. Yes Home ZIP Code: __________________
2. No Home State: __________________
Q43. Please select one from the following.
1. I am the addressed physician and I filled out the survey myself.
2. I am a staff member associated with the addressed physician who gave me permission to fill out this survey on his/her behalf.
3. The addressed physician and an associated staff member filled out the survey jointly.
Q44. Would you be interested in being on a focus group panel to provide in-depth input on your primary care practice experience and how the federal Affordable Care Act (ACA) may reshape it?
1. Yes Please provide your contact information Name: _________________________________
Phone: _________________________________
Email: _________________________________
2. No
If you are interested in receiving the final results from the survey or have any additional comments, please contact Washington State Office of Financial Management at [email protected]
Thank you for your participation.
Please return the completed survey in the pre-paid envelope to: Gilmore Research Group
2101 4th Avenue, 8th Floor Seattle, WA 98121 <insert pin>
4

OFM Forecasting Division Page 29
Appendix B. Comparison of Responding Physicians and Physician Sample From AMA
AMA/Population Unweighted Survey
REGION1 NORTH PUGET 5.4% 6.3%2 WEST BALANCE 4.2% 5.2%3 KING COUNTY 42.9% 41.1%4 OTHER PUGET METRO 7.1% 7.8%5 CLARK COUNTY 4.9% 4.4%6 EASTERN BALANCE 5.8% 6.9%7 SPOKANE COUNTY 7.3% 7.4%8 YAKIMA AND TRI-CITIES 5.9% 5.5%9 SNOHOMISH COUNTY 5.5% 5.6%10 PIERCE COUNTY 10.9% 10.0%
SPECIALTY1 Family medicine 41.7% 43.8%2 General practice 3.6% 3.6%3 General internal medicine 27.4% 24.7%4 General pediatrics 15.5% 16.3%5 General OB/GYN 10.6% 10.3%6 General Geriatrics 1.3% 1.4%
SEX1 Male 54.8% 56.4%2 Female 45.2% 43.6%
AGE CATEGORY1 Under 40 25.4% 18.4%2 40 to 64 years 65.7% 70.4%3 65+ years 8.9% 11.2%