washington state’s housing market
TRANSCRIPT

Washington State’s Housing Market2nd Quarter 2012
W A S H I N G T O N C E N T E R F O R R E A L E S T A T E R E S E A R C H | R U N S T A D C E N T E R F O R R E A L E S T A T E S T U D I E S C O L L E G E O F B U I L T E N V I R O N M E N T S | A U G U S T 2 0 1 2
Washington Market Highlights: Second Quarter 2012
u Existing home sales declined in the second quarter by 2.6 percent to a seasonally adjusted annual rate of 94,510 units, but remained 10.4 percent above a year earlier.
u Building permit activity increased 22.9 percent from a year earlier, totaling 7,041 new units authorized. Single-family permits increased 30.7 percent.
u The median price home sold in Washington during the second quarter was $236,000, 4.0 percent above a year earlier. First year-to-year increase since third quarter of 2007.
u Housing affordability for both all buyers and first-time buyers backed off record levels despite record low mortgage rates. Despite decline, homes remain very affordable for both all buyers and first-time buyers.
u Inventories of homes available for sale increased seasonally but remained well below recent years. There were 38,200 homes on the market at the end of June, enough to sustain the market for 6.1 months. Inventory was especially limited in greater Seattle.
u Seriously delinquent mortgages surprisingly increased by 1,200 to 80,000 problem loans throughout the state.
-20.0%
-15.0%
-10.0%
-5.0%
0.0%
5.0%
10.0%
15.0%
20.0%
2006:Q1 2007:Q1 2008:Q1 2009:Q1 2010:Q1 2011:Q1 2012:Q1
Percent Change in Median Home Price from Year Ago
-30.0%
-20.0%
-10.0%
0.0%
10.0%
20.0%
30.0%
2006:Q1 2007:Q1 2008:Q1 2009:Q1 2010:Q1 2011:Q1 2012:Q1
Change in Home Sales, SAAR

Washington State’s Housing Market is a quarterly report to the Washington Real Estate Commission and the Washington State Department of Licensing.
Prepared by:Washington Center for Real Estate ResearchRunstad Center for Real Estate StudiesCollege of Built EnvironmentsUniversity of Washington424 Gould Hall, Box 355740Seattle, WA 98195-5740Phone: (206) 685-9597Web: wcrer.be.washington.eduE-mail: [email protected]
Associate Director for Research: Glenn E. Crellin
© Copyright 2012 by the Runstad Center for Real Estate Studies. All rights reserved.
The WCRER / Runstad Center for Real Estate Studies will grant permission to use or reprint material from Washington State’s Housing Market under appropriate circumstances.
SUBSCRIPTION INFORMATIONWashington State’s Housing Market is published quarterly by the WCRER / Runstad Center for Real Estate Studies The annual subscription price is $60 plus tax. Phone us, or visit our Website for more information.
Second Quarter 2012 Issued August 2012
Survey DescriptionPublication: Washington State’s Housing Market is a publication of the Washington Center for Real Estate
Research / Runstad Center for Real Estate Studies at the University of Washington.
Coverage: At least quarterly, the WCRER receives data on single-family home sales from each multiple listing service located in, or providing market coverage to, Washington communities. In 2008, data on nearly 62,000 home transactions were received and processed.
Sales Volume: Estimated total sales value of single-family homes in each county is compiled using a scale factor to transform the MLS sales to market totals. This scaling is required since a significant number of transactions are always completed as “for sale by owner” or are assisted by real estate licensees who do not participate in a MLS. Scale factors were developed by analyzing the relationship between MLS sales and measures of total single-family sales derived from the 2000 Census of Housing.
Data in this report represents closed sales transactions.
Sales Price: Median sales prices represent that price at which half the sales in a county (or the state) took place at higher prices, and half at lower prices. Since WCRER does not receive sales data on individual transactions (only aggregated statistics), the median is determined by the proportion of sales in a given range of prices required to reach the midway point in the distribution. While average prices are not reported, they tend to be 15-20 percent above the median.
Movements in sales prices should not be interpreted as appreciation rates. Prices are influenced by changes in cost and changes in the characteristics of homes actually sold. The table on prices by number of bedrooms provides a better measure of appreciation of types of homes than the overall median, but it is still subject to composition issues (such as square footage of home, quality of finishes and size of lot, among others).
There is a degree of seasonal variation in reported selling prices. Prices tend to hit a seasonal peak in summer, then decline through the winter before turning upward again, but home sales prices are not seasonally adjusted. Users are encouraged to limit price comparisons to the same time period in previous years.
Seasonal Adjustment: Volume statistics are seasonally adjusted using the X-11 method of seasonal adjustment originally developed at the US Bureau of the Census and used for adjustment of most economic statistics by government agencies. The procedure includes adjusting for trading day variation—the number of Mondays, Tuesdays, etc., in a particular month or quarter. This type of variation in the data was found to be significant.
Sales in each county are first seasonally adjusted, then aggregated to yield the statewide statistics.
Seasonal indices are based on quarterly single-family home sales activity dating from first quarter 1994. New seasonal adjustment factors are constructed at the conclusion of each year. Data for the three preceding years are revised using these new seasonal factors.
Seasonally-adjusted annual rate values are based on single quarter sales and indicate the number of sales which would take place in a year if the relative sales pace were to continue. They are not a forecast of annual activity and do not include the sales observations of previous quarters.
Metropolitan/Micropolitan Areas: This report uses the definitions of metropolitan and micropolitan areas by the Federal Office of Management and Budget. Briefly, metropolitan areas are larger communities with at least 50,000 people in the urban core. Micropolitan areas are smaller cities, with 10,000-50,000 people in the urban core. Currently Washington has 17 metropolitan counties in 13 metropolitan areas (or divisions) and nine micropolitan areas.
Month’s Supply: Estimates of month’s supply of homes on the market compare the number of total MLS listings at the end of the quarter to the seasonally-adjusted annual rate sales for that county [(Listings/SAAR) x 12 = month’s supply]. It is interpreted as how long the current inventory available for sale would be able to meet current demand if no additional homes were listed for sale.
Housing Affordability: Two measures of housing affordability are presented. Each should be interpreted as the degree to which a median income family (or typical first-time buyer household) could afford to purchase the assumed home. The following table lays out the assumptions. In all cases it is assumed the lender would be willing to fund the loan so long as the principal and interest payments do not exceed 25 percent of gross income. Index values above 100 indicate housing is affordable to the specified income group.
UPDATE
All Buyers First Time
Home Price Median 85% Median
Downpayment 20% 10%
Mortgage Term 30 years 30 years
Income Median Family* 70% Median Household*
Mortgage Insurance No Yes (add 0.25% to mortgage rate)
Mortgage Rate FHFA estimate of effective rate loans closed, existing homes
* Family income is two or more individuals related by blood, marriage, or adoption. Household income includes single persons living alone.

Washington State’s Housing Market - Second Quarter 2012 3
90,000
110,000
130,000
150,000
170,000
Units, SAAR
Existing Home Sales
50,000
70,000
90,000
110,000
130,000
150,000
170,000
Units, SAAR
Existing Home Sales
50,000
70,000
Second Quarter 2012
Washington State’s Housing Market in the second quarter of 2012 was a bit confusing. Existing home sales were up…and down. Median home prices increased on a year-to-year basis for the first time since 2007. Building permits reached their highest level since the second quarter of 2008. Homes available for sale continued to decline. Seriously delinquent mortgages are still increasing while the pace of completed foreclosures is declining. Mortgage interest rates are at historic lows, but housing affordability actually declined a bit in the second quarter. Combined with an economic recovery which is having a difficult time gaining tractions, analyzing the current housing market is challenging.
Home ResalesThe real estate industry has been excitedly discussing increasing sales, stabilizing prices and limited inventories of homes available for sale. While these are all true, it is also true that the seasonally adjusted annual rate of home sales in the second quarter was lower than during the first quarter. How can the market be up and down simultaneously?
The answer lies in understanding seasonal adjustment. A seasonally adjusted annual rate describes the number of homes that would be sold in a full year IF the relative sales pace were to continue for an entire year. It is not a forecast. It does not include sales activity in previous periods. It merely compares current activity to established patterns in the past. Data on quarterly home sales in Washington for nearly 20 years has been analyzed for seasonal trends. That analysis indicates how much home sales usually increase from the doldrums of winter to the active markets of spring and early summer. The approach used here is identical to that of Federal statistical agencies as well as the National Association of Realtors®.
Since the housing recession began, only two quarters have seen higher levels of seasonally adjust home resales than this quarter, and that 94,510 was 10.4 percent above the rate a year ago, clearly reinforcing the conclusion that the housing market is beginning to improve. The quarter-to-quarter decline in the seasonally adjusted data is consistent with other economic data which has been demonstrating that the pace of the overall recovery has slowed after a robust first quarter, especially on the employment front.
There were a total of 26,320 homes sold throughout the state (not seasonally adjusted) during the April through June period this year, nearly 7,600 (10.8 percent) more sales than during the January through March period. Seasonally adjusted annual rates imply those sales would be equivalent to 94,510 homes sold in a year. This seasonally adjusted annual rate is actually 2.6 percent lower than the rate recorded for the first quarter of 2012. The decline means the market did not increase quite as much as usual, but the strong year-to-year increases make clear the state is in the midst of a housing recovery.
90,000
110,000
130,000
150,000
170,000
Units, SAAR
Existing Home Sales
50,000
70,000

Washington Center for Real Estate Research at Runstad Center / University of Washington4
Quarter-to-quarter sales increased in 10 of Washington’s 39 counties, led by an 11.7 percent jump in Kitsap County. In fact, among the eight counties in the Seattle-Tacoma-Olympia Combined Metropolitan area, only two recorded seasonally adjusted sales decline, meaning that half of the state’s stronger housing markets were in greater Seattle.
Smaller counties routinely have the greatest swings in housing market activity when expressed as percentages. The second quarter results again illustrated this very clearly, with the sales rate jumping 30.4 percent in San Juan County, while at the same time declining by 66.7 percent compared to the first quarter in Skamania County. While Skamania County is included in the Portland-Vancouver metropolitan area based on commuting patterns, it remains one of the smallest counties in terms of home sales, with an annual rate of only 50 homes recorded for the second quarter. Excluding all the rural counties from the analysis of extremes, sales ranged from the high in Kitsap County to a 30.4 percent drop in Grant County, which had led the list of positive performers three months ago. It was that exceptionally strong first quarter which could not be sustained that led to the second quarter comparative weakness. The state’s largest market, King County, reported a sales rate of 27,450 units, an increase of 3.2 percent compared to the opening months of 2012.
Home sales activity is always concentrated in the urban markets. During the second quarter, 57.8 percent of existing home sales in Washington took place in the five counties traditionally identified as the Seattle-Tacoma metropolitan area. Because of the relative strength of the Seattle area during the second quarter, it represented a larger share of the total market than three months ago. By contrast, the 13 rural counties collectively accounted for only 3.8 percent of sales activity, a number which is marginally higher than their 3.4 percent share of the state’s population.
Housing ConstructionBuilding permits for a total of 7,041 housing units were issued during the second quarter of 2012 in the 32 counties where some or all of the permit issuing jurisdictions provide monthly data to the Census Bureau. This represents an increase in permit activity of 22.9 percent compared to the construction rate in the April-June quarter of 2011.
While improving construction permits suggests employment gains in the important construction sector, it is important to examine the composition of the rebound. While the strength of multifamily construction has dominated recent headlines, single-family permits increased 30.7 percent compared to a year ago, while multifamily construction “only” increased 13.5 Percent over the same period. This marks the strongest single-family construction market in quite a while, but indicates that the recovery in apartment construction is also continuing.
Total value of residential building permits issued during the first quarter was $1,491.1 million, 35.3 percent above a year ago, while the single-family permit value was up 38.9 percent to $1,053.6 million. Since the value of single-family permits again
2 0004,0006,0008,000
10,00012,00014,000
Building Permits
02,000
SF Multi
Washington State’s Housing Market - Second Quarter 2012 5
increased more rapidly than the number of permits issued, it means that the average construction value per new home is increasing. This is consistent with the relatively strong single-family permit activity in King County, where construction costs are higher than most other parts of the state.
The greatest increase in the total number of building permits issued in percentage terms was 116.7 percent in Whatcom County (Bellingham), followed by a 63.3 percent jump in Clark County. Significantly, both of these urban markets also saw double-digit increases in single-family permits, but those jumps were smaller than the multifamily construction surge. The new construction housing market remains very mixed, however, with 10 of the 32 reporting counties registering reduced total permit activity. Looking solely at single-family construction, 22 counties saw increased permitting. Roughly three-quarters of the building permits reported to the Census bureau were issued in the eight-county greater Seattle area.
Total permit value increased compared to a year ago in 21 counties, led by a doubling in Island County. The dollar value of single-family permits also increased in 21 counties. Three counties (King, Pierce and Snohomish) each recorded more than $100 million in permit activity during the second quarter, collectively representing 67.6 percent of the statewide construction value. Ten additional counties had at least $10 million in building permits issued
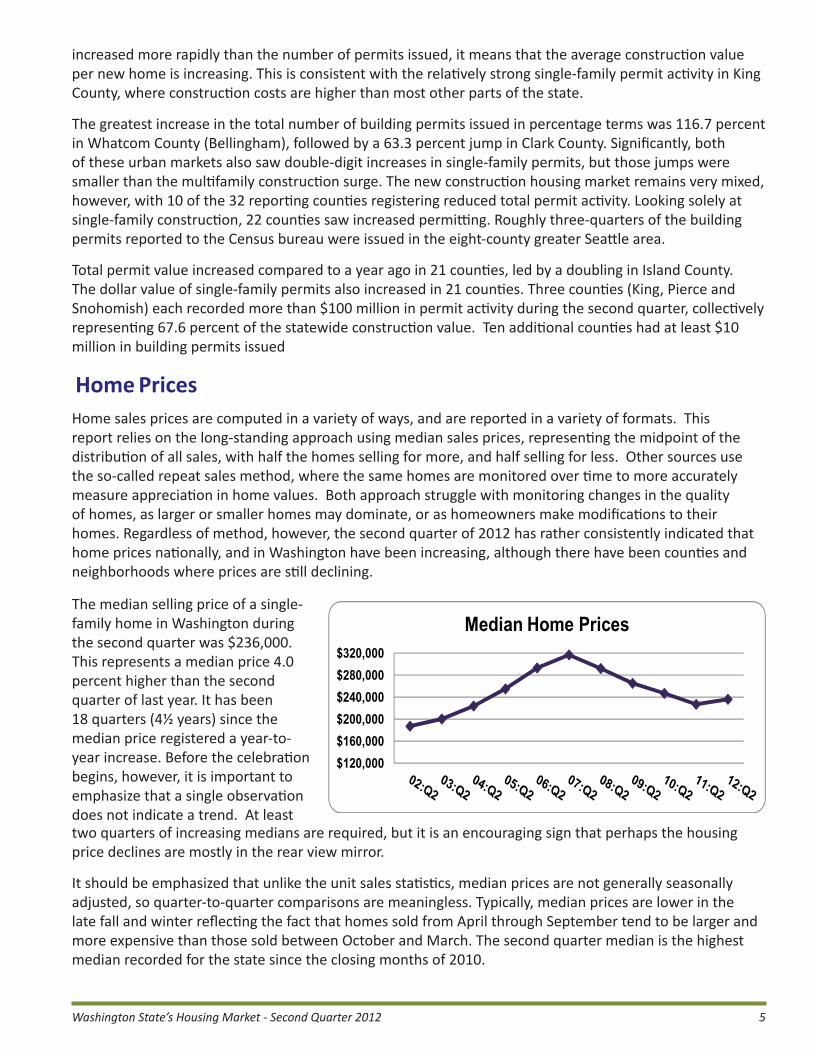
Home PricesHome sales prices are computed in a variety of ways, and are reported in a variety of formats. This report relies on the long-standing approach using median sales prices, representing the midpoint of the distribution of all sales, with half the homes selling for more, and half selling for less. Other sources use the so-called repeat sales method, where the same homes are monitored over time to more accurately measure appreciation in home values. Both approach struggle with monitoring changes in the quality of homes, as larger or smaller homes may dominate, or as homeowners make modifications to their homes. Regardless of method, however, the second quarter of 2012 has rather consistently indicated that home prices nationally, and in Washington have been increasing, although there have been counties and neighborhoods where prices are still declining.
$$200,000$240,000$280,000$320,000
Median Home Prices
$120,000$160,000
The median selling price of a single-family home in Washington during the second quarter was $236,000. This represents a median price 4.0 percent higher than the second quarter of last year. It has been 18 quarters (4½ years) since the median price registered a year-to-year increase. Before the celebration begins, however, it is important to emphasize that a single observation does not indicate a trend. At least two quarters of increasing medians are required, but it is an encouraging sign that perhaps the housing price declines are mostly in the rear view mirror.
It should be emphasized that unlike the unit sales statistics, median prices are not generally seasonally adjusted, so quarter-to-quarter comparisons are meaningless. Typically, median prices are lower in the late fall and winter reflecting the fact that homes sold from April through September tend to be larger and more expensive than those sold between October and March. The second quarter median is the highest median recorded for the state since the closing months of 2010.

Washington Center for Real Estate Research at Runstad Center / University of Washington6
The only other home price measure available statewide is produced by the Federal Housing Finance Agency (FHFA). As mentioned previously, there is a bigger delay in releasing this statistic, so the first quarter of 2012 is the most recent available. This measure is a “repeat sales” measure, meaning that it focuses on price changes of properties that have sold more than once, measuring changes in prices. Like most of the repeat sales statistics, the data is released as an index, not a meaningful price, so the change from a year ago is the only meaningful measure. Prices in Washington using this measure declined 5.6 percent in the first quarter compared to a year earlier. Significantly, this was the third poorest price performance in the nation. It is worth noting, however, that many states saw more prolonged and steeper price declines than Washington using the FHFA data.
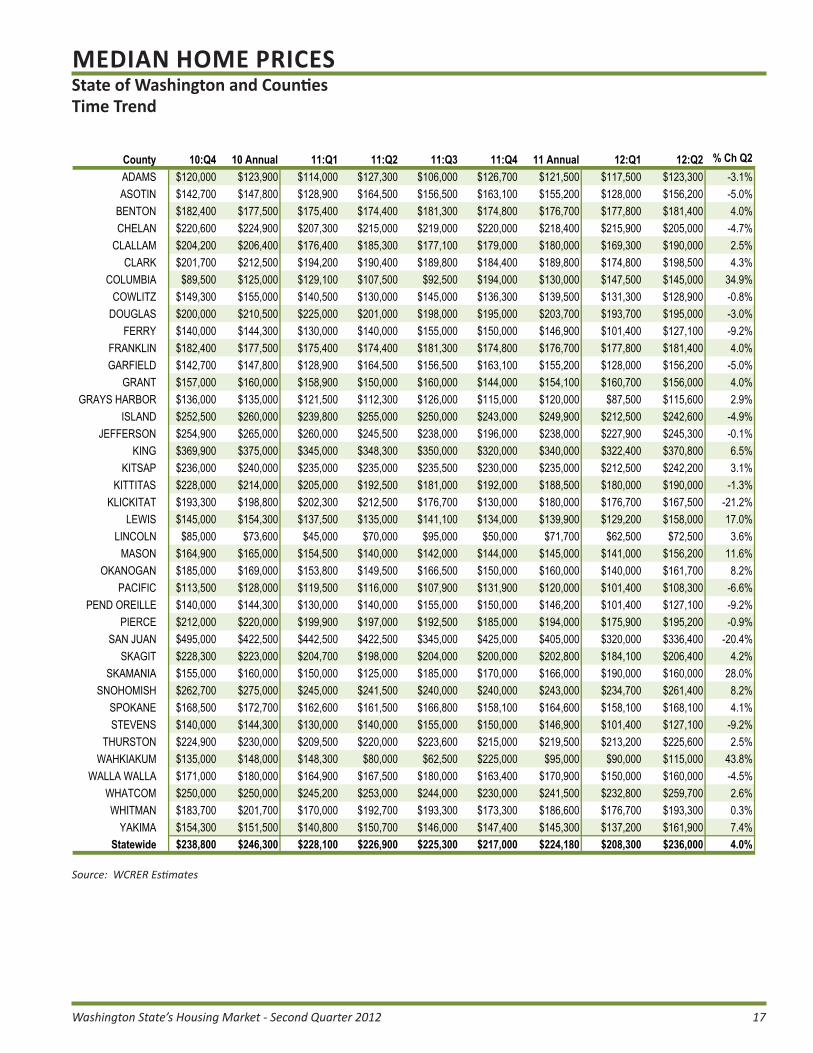
Median prices ranged from a high of $370,800 in King to a low of $72,500 in rural Lincoln County, which reported the only median less than $100,000. Among the remaining metropolitan population centers, the range was from $261,400 in Snohomish County to $128,900 in Cowlitz County (Longview), less than half the median in metro Seattle. The micropolitan areas exhibited variations from a low median of $115,600 in Grays Harbor County (Aberdeen) to a high of $242,600 in Island County (Oak Harbor). While these counties are in the same relative positions as last quarter, in both cases the reported median is significantly higher.
Price changes also varied widely. Median prices were lower than a year ago in 17 of Washington’s 39 counties (compared to 29 three months ago). Two small counties (Klickitat and San Juan) registered median price declines of at least 20 percent in the last year. Another small, rural county, Wahkiakum, had the largest jump in median price, 43.8 percent.
Among the metropolitan counties the range of price changes was a high of an 8.2 percent increase in Snohomish County to a decline of 5.0 percent in Asotin County (Lewiston, ID-WA). Among the nine micropolitan areas, six reported higher median prices, with the Lewis County (Centralia) seeing the greatest increase in the group, 17.0 percent. The micropolitan area with the greatest price decline in the last year was Oak Harbor (Island County), where the median price dropped 4.9 percent from the second quarter of last year.
Prices by BedroomWhile median prices are more reflective of the typical home available in the market, they are somewhat influenced by changes in the composition of homes sold. A reflection of what is happening in the market is illustrated by looking at price behavior by types of homes, here represented by the number of bedrooms, the most consistently reported physical characteristic. Accordingly, this report includes the median price home by number of bedrooms in an attempt to standardize quality somewhat.
The median price 2-bedroom single-family home (remember, these statistics do not include condominium apartments) sold statewide during the second quarter was $151,600, 4.6 percent higher than a year ago. Moving to the much more typical 3-bedroom homes, the median increased 2.9 percent between the second quarters of 2011 and 2012, to $210,000. Among the homes with four or more bedrooms the median sales price was $300,600, a jump of 3.6 percent over the last year. These statistics reinforce the impression that housing prices are stabilizing across the board.
2 BR, 14%
4+ BR, 37%
2nd Quarter 2012 Washington Home Sales by Number of Bedrooms
3 BR, 49%

Washington State’s Housing Market - Second Quarter 2012 7
Small samples often cause county-level detail on prices by number of bedrooms to exhibit unusual patterns, but larger communities generally have enough sales activity to offset the problems. Accordingly, Washington State’s Housing Market limits analysis of the bedroom detail to metropolitan counties only. The median price of a 2-bedroom home in Skagit County declined by 16.1 percent between the second quarters of 2011 and 2012. Meanwhile in Thurston County smaller home prices increased by 23.0 percent. In the 3-bedroom category Skagit County showed the biggest increase (8.5 percent) while Asotin County sustained a 25.0 percent slide. Larger homes experienced a price decline of 28.6 percent in Chelan County with the other extreme an increase of 41.5 percent in Pierce County. The least costly 2-bedroom homes were located in Yakima County. For 3-bedroom homes that distinction passed to Asotin County, which also had the lowest median for larger homes. Regardless of number of bedrooms the most expensive urban homes were found in King County, as usual.
Housing AffordabilityHouseholds and families generally focus on the relationship between their potential mortgage payment and their income when deciding on home purchases. Of course, those relationships are tempered by lending standards, access to down payments, other recurring financial obligations and their confidence in the overall economy. Investors, meanwhile focus on their ability to lease the property as a variable rent, or the realistic ability to invest relatively small sums in improving the property, then selling it for a profit. It must be emphasized that this is different from the motivation of the flippers in 2005 who thought they could resell nearly any property at a substantial profit with virtually no risk of either lower prices or slow marketing time. While investors are active in the current market (as evidenced by the large proportion of cash sales), the assessment of affordability focuses on households and families desiring homes for their own residences.
Low mortgage rates have historically driven consumers to purchase homes, especially when those low rates are combined with prices which are lower than have recently prevailed. Prices and mortgage rates combine with income to determine the affordability of housing. Income for the majority of households has continued to increase slowly during the recession and the early stages of the fragile recovery. Thus all three legs of the affordability stool worked to make the affordability of homeownership achieve record highs in recent quarters. However, the overall price increases offset continued declines in mortgage interest rates, resulting in affordability backing off from recent record highs across the state. Many buyers waited for prices to “hit bottom” or for total mortgage payments to stabilize at a low level. Others are waiting for the recovery to take hold and result in significant employment and wage increases. Perhaps the slight decline in affordability will convince hesitant buyers that they need to begin their home search soon, rather than continuing to wait for further declines.
WCRER/Runstad calculates two measures of affordability. The all-buyer index measures the degree to which a median income family (two or more individuals related by blood, marriage or adoption) can afford mortgage payments on a median price home, assuming a 20 percent downpayment and a 30-year mortgage at prevailing mortgage interest rates. The calculation assumes the family can spend 25 percent of their gross income on principal and interest payments. While there may be some mortgages available in the marketplace with less restrictive terms, these assumptions fairly represent the current home purchase market and can compare affordability to other time periods. This is the same analysis approach which has been used by the National Association of Realtors® since 1982.
The second measure is the first-time buyer index. It is computed in the same general way, but it assumes a less expensive home (85 percent of median), a lower downpayment (10 percent), lower income (70 percent of median household income, including single persons) and a requirement that mortgage insurance be included. While many buyers are still opting for FHA loans which allow lower downpayments or VA or USDA no money down mortgages, those proportions have declined in recent months and the

Washington Center for Real Estate Research at Runstad Center / University of Washington8
general affordability assumptions are still appropriate for many, if not most, households looking to purchase their first home.
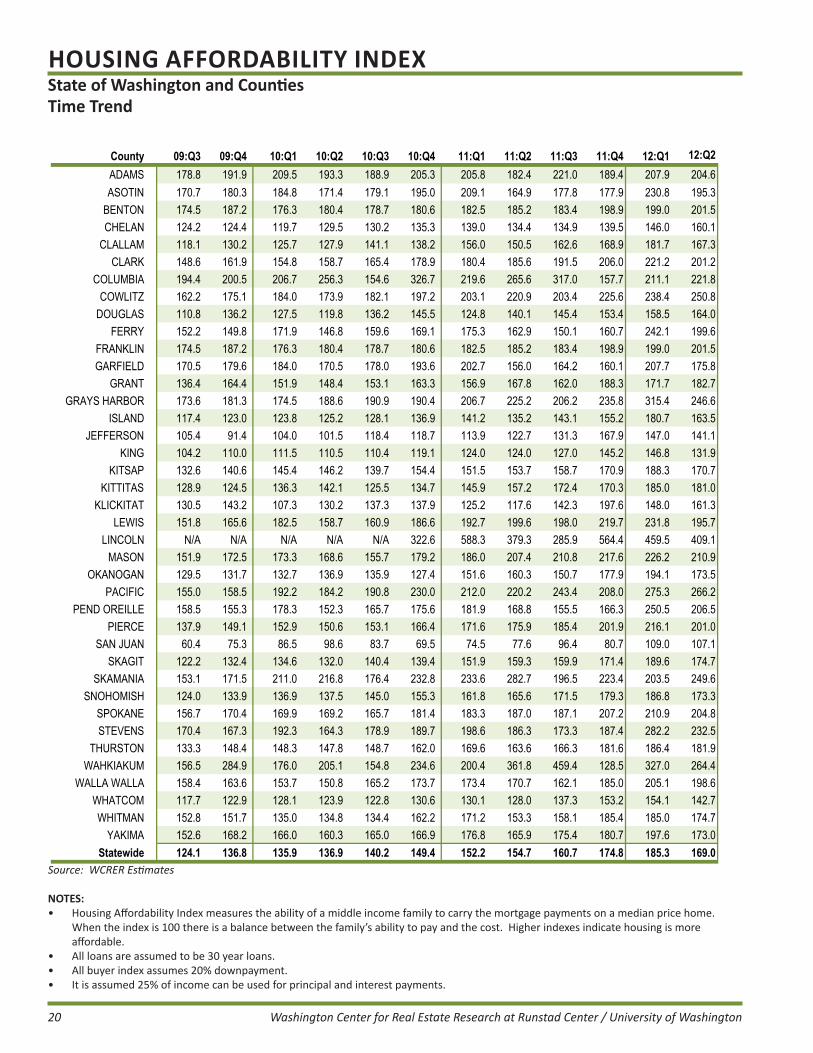
In the second quarter the statewide all-buyer index was 169.0, meaning the median income family in Washington had 69 percent more income than the minimum required to afford the median price home—a major improvement from the 154.7 recorded a year ago, but significantly lower than the 185.3 registered only three months ago.
The county-level all-buyer affordability measures in the second quarter ranged from a high of 409.1 in Lincoln County to a low of 107.1 in ever-costly San Juan County. This quarter is the second consecutive period when the index has stood above 100 in all 39 counties, reinforcing the finding that housing is consistently affordable throughout the state. Among the metropolitan counties the range was from a low affordability of 131.9 in King County to a high of 250.8 in Cowlitz County. For the micropolitan areas the greatest affordability was in Grays Harbor County (246.6) and the least was in Island County (163.5).
The housing affordability index for first-time buyers statewide in the second quarter was 95.5, up from 84.5 in the second quarter of 2011. Like the all buyer index, the first-time buyer measure backed off from the record high 103.2 achieved in the first quarter. Since an index value of 80 is generally considered to offer meaningful choice and access to ownership housing for first-time buyers, this current market presents a great opportunity for well qualified first-time buyers to enter the ranks of homeowners.
The first-time buyer affordability index exceeded 100 in 23 counties during the first quarter (nine more than a year ago). However, achieving homeownership is still a challenge in many areas, especially as rents are rising in many communities, making it more difficult to accumulate the downpayment. The counties which present the biggest challenges do not change much. San Juan and King’s high prices, Jefferson’s resource-based employment, and Whitman’s student population keep those counties especially challenging. Among the metropolitan counties, the greatest affordability for first-time buyers was in Benton County (127.9) and was least in King County (74.2). For the micropolitan areas, the most affordable for current renters to move to home ownership was Grays Harbor County, while Whitman County presented the greatest hurdle.
Availability of Affordable HousingRather than rely on a single measure of housing affordability, it is helpful to examine home affordability for several income levels and compare this with the available housing inventory. Moreover, higher-income households typically make larger downpayments (perhaps assisted from equity acquired from sale of an
100.0
120.0
140.0
160.0
180.0
200.0
Housing Affordability Index
40.0
60.0
80.0
First-time All Buyers
100.0
120.0
140.0
160.0
180.0
200.0
Housing Affordability Index
40.0
60.0
80.0
First-time All Buyers
Washington State’s Housing Market - Second Quarter 2012 9
existing home), while lower income households (including our hypothetical first-time buyer) may only be able to make a minimal downpayment. The four income/asset groups considered are:
• $30,000 income, 5% downpayment• $60,000 income, 10% downpayment• $90,000 income, 20% downpayment• $150,000 income, 35% downpayment.
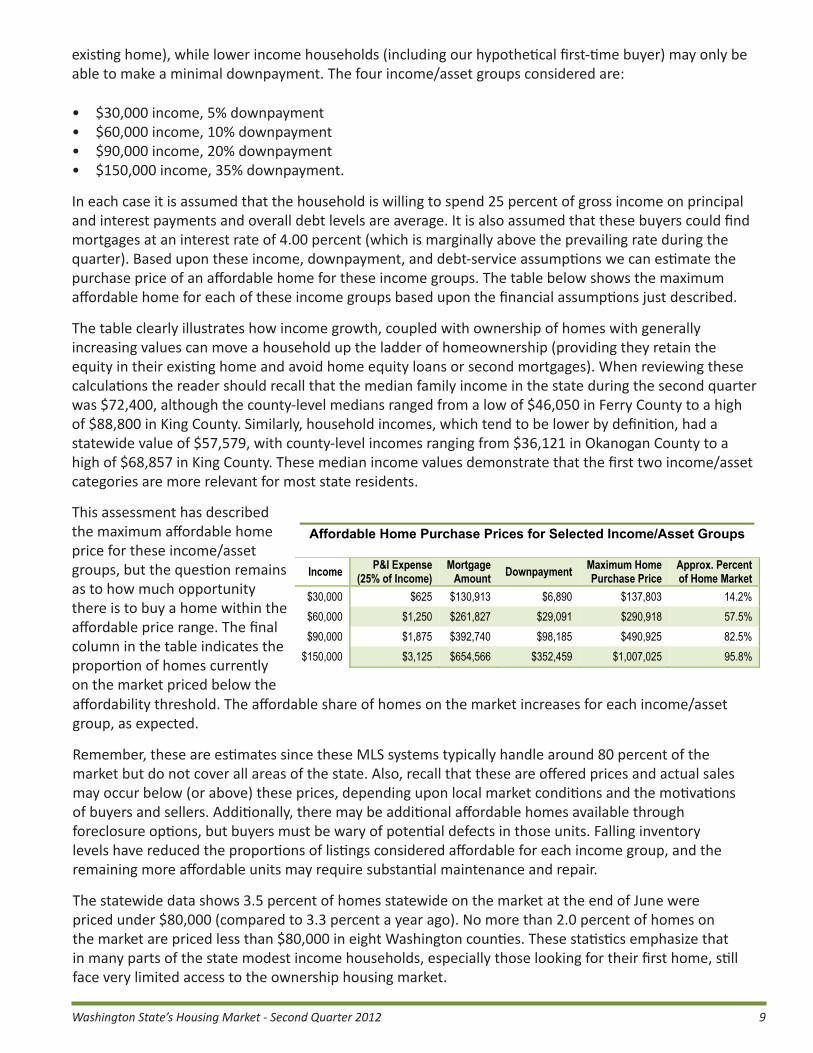
In each case it is assumed that the household is willing to spend 25 percent of gross income on principal and interest payments and overall debt levels are average. It is also assumed that these buyers could find mortgages at an interest rate of 4.00 percent (which is marginally above the prevailing rate during the quarter). Based upon these income, downpayment, and debt-service assumptions we can estimate the purchase price of an affordable home for these income groups. The table below shows the maximum affordable home for each of these income groups based upon the financial assumptions just described.
The table clearly illustrates how income growth, coupled with ownership of homes with generally increasing values can move a household up the ladder of homeownership (providing they retain the equity in their existing home and avoid home equity loans or second mortgages). When reviewing these calculations the reader should recall that the median family income in the state during the second quarter was $72,400, although the county-level medians ranged from a low of $46,050 in Ferry County to a high of $88,800 in King County. Similarly, household incomes, which tend to be lower by definition, had a statewide value of $57,579, with county-level incomes ranging from $36,121 in Okanogan County to a high of $68,857 in King County. These median income values demonstrate that the first two income/asset categories are more relevant for most state residents.
This assessment has described the maximum affordable home price for these income/asset groups, but the question remains as to how much opportunity there is to buy a home within the affordable price range. The final column in the table indicates the proportion of homes currently on the market priced below the affordability threshold. The affordable share of homes on the market increases for each income/asset group, as expected.
Remember, these are estimates since these MLS systems typically handle around 80 percent of the market but do not cover all areas of the state. Also, recall that these are offered prices and actual sales may occur below (or above) these prices, depending upon local market conditions and the motivations of buyers and sellers. Additionally, there may be additional affordable homes available through foreclosure options, but buyers must be wary of potential defects in those units. Falling inventory levels have reduced the proportions of listings considered affordable for each income group, and the remaining more affordable units may require substantial maintenance and repair.
The statewide data shows 3.5 percent of homes statewide on the market at the end of June were priced under $80,000 (compared to 3.3 percent a year ago). No more than 2.0 percent of homes on the market are priced less than $80,000 in eight Washington counties. These statistics emphasize that in many parts of the state modest income households, especially those looking for their first home, still face very limited access to the ownership housing market.
$60,000 income, 10% downpayment $90,000 income, 20% downpayment $150,000 income, 35% downpayment.
In each case it is assumed that the household is willing to spend 25 percent of gross income on principal and interest paymentsand overall debt levels are average. It is also assumed that these buyers could find mortgages at an interest rate of 4.00 percent(which is marginally above the prevailing rate during the quarter). Based upon these income, downpayment, and debt-service assumptions we can estimate the purchase price of an affordable home for these income groups. The table below shows the maximum affordable home for each of these income groups based upon the financial assumptions just described.
[Move Affordable Home Purchase Table to here]
The table clearly illustrates how income growth, coupled with ownership of homes with generally increasing values can move a household up the ladder of homeownership (providing they retain the equity in their existing
home and avoid home equity loans or second mortgages). When reviewing these calculations the reader should recall that the median family income in the state during the second quarter was $72,400, although the county-level medians ranged from a low of$46,050 in Ferry County to a high of $88,800 in King County. Similarly, household incomes, which tend to be lower by definition, had a statewide value of $57,579, with county-level incomes ranging from $36,121 in Okanogan County to a high of $68,857 in King County. These median income values demonstrate that the first two income/asset categories are more relevant for most stateresidents.
This assessment has described the maximum affordable home price for these income/asset groups, but the question remains as to how much opportunity there is to buy a home within the affordable price range. The final column in the table indicates the proportion of homes currently on the market priced below the affordability threshold. The affordable share of homes on the marketincreases for each income/asset group, as expected.
Remember, these are estimates since these MLS systems typically handle around 80 percent of the market but do not cover all areas of the state. Also, recall that these are offered prices and actual sales may occur below (or above) these prices, depending upon local market conditions and the motivations of buyers and sellers. Additionally, there may be additional affordable homes availablethrough foreclosure options, but buyers must be wary of potential defects in those units. Falling inventory levels have reduced the proportions of listings considered affordable for each income group, and the remaining more affordable units may require substantial maintenance and repair.
The statewide data shows 3.5 percent of homes statewide on the market at the end of June were priced under $80,000 (compared to 3.3 percent a year ago). No more than 2.0 percent of homes on the market are priced less than $80,000 in eight Washington counties. These statistics emphasize that in many parts of the state modest income households, especially those lookingfor their first home, still face very limited access to the ownership housing market.
Including homes priced at or below $160,000 raises the affordable percentage statewide to 20.4 percent. Among the metropolitan counties the proportion of homes priced less than $160,000 ranged from a low of 4.3 percent in King County to a highof 40.1 percent in Cowlitz County. Both represent a significant decline in lower priced homes compared to three months ago.
Available InventoryEconomics analyzes demand and supply looking for equilibrium or balance. Existing home sales, discussed earlier, is the measureof demand. Inventory available for sale represents the supply side of the equation. During the period of rapid home sales and escalating prices there was excess demand and very limited supply. During 2008 while sales plummeted, inventories available forsale surged. During the depths of the recession inventories surged. Now inventory available for sale appears somewhat limited again, but potential upward pressure on prices may be tempered by the continuing problem with distressed properties, as will bediscussed in more detail shortly.
Affordable Home Purchase Prices for Selected Income/Asset Groups
Income P&I Expense (25% of Income)
MortgageAmount Downpayment Maximum Home
Purchase Price Approx. Percentof Home Market
$30,000 $625 $130,913 $6,890 $137,803 14.2% $60,000 $1,250 $261,827 $29,091 $290,918 57.5% $90,000 $1,875 $392,740 $98,185 $490,925 82.5%
$150,000 $3,125 $654,566 $352,459 $1,007,025 95.8%

Washington Center for Real Estate Research at Runstad Center / University of Washington10
Including homes priced at or below $160,000 raises the affordable percentage statewide to 20.4 percent. Among the metropolitan counties the proportion of homes priced less than $160,000 ranged from a low of 4.3 percent in King County to a high of 40.1 percent in Cowlitz County. Both represent a significant decline in lower priced homes compared to three months ago.
Available InventoryEconomics analyzes demand and supply looking for equilibrium or balance. Existing home sales, discussed earlier, is the measure of demand. Inventory available for sale represents the supply side of the equation. During the period of rapid home sales and escalating prices there was excess demand and very limited supply. During 2008 while sales plummeted, inventories available for sale surged. During the depths of the recession inventories surged. Now inventory available for sale appears somewhat limited again, but potential upward pressure on prices may be tempered by the continuing problem with distressed properties, as will be discussed in more detail shortly.
Listings available for sale throughout Washington, at the end of the June 2012, stood 20.2 percent below the listing inventory a year earlier. There were 38,163 homes listed on the various Multiple Listing Services, a reduction of 9,655 homes compared to last year. It must be emphasized that these counts do not include any homes being offered for sale directly by the owners, without the assistance of real estate licensees, or those marketed by real estate licensees who are not members of a multiple listing service, and may not include homes marketed by financial institutions after foreclosure. This so-called shadow inventory remains one of the real mysteries of the current housing market.
King County alone represents 5,091 active listings, 37.7 percent fewer than a year earlier. Active listings increased compared to the prior year in only three of the 35 counties for which listing data is available. The most rapid growth of listing inventory was 2.3 percent in Benton/Franklin counties, while the largest reduction in homes available for sale was 45.3 percent in Snohomish County.
One additional comment about listings is important. It appears that would-be sellers who have any flexibility in their need to sell have withdrawn properties from the market rather than compete against the distressed properties, whether they are short sales or lender-owned properties. Three months ago this report asked if the scant inventory would speed the pace of clearing distressed inventory from the market. So far it has not. Stories of multiple offer situations are often heard, especially in greater Seattle. They typically involve homes in desirable neighborhoods which are in move-in condition. So far, those storied have not drawn many potential sellers back to the market.
Listings alone, however, only tell part of the story. They need to be linked to prevailing sales rates to determine how the current availability might influence aggregate housing markets in the months ahead. WCRER/Runstad computes estimates of the month’s supply of housing by price range. A month’s supply
4
6
8
10
12
14
20,000
30,000
40,000
50,000
60,000
Mo
nth
s
Un
its
Listing Inventory and Month's Supply
0
2
4
0
10,000
,
05:Q1 06:Q1 07:Q1 08:Q1 09:Q1 10:Q1 11:Q1 12:Q1
Listings Mo Supply

Washington State’s Housing Market - Second Quarter 2012 11
statistic measures how long it would take to sell all the homes currently available for sale if no new listings were added to the inventory. The seasonally adjusted annual rate of sales for the quarter is compared to the end-of-quarter listing inventory to determine the month’s supply. This prevents higher sales rates in previous quarters from producing unrealistically optimistic estimates of market activity. Similarly, it prevents exceptionally low inventories and actual sales during the slow winter months from making inventories seem exceptionally large relative to sales.
The quarter-end month’s supply for Washington was 6.1 months, compared to 8.3 months a year ago. A 5-7 month inventory is considered normal or balanced, consistent with changes in median prices which are similar to overall inflation rates. Accordingly, the current market would usually be characterized as balanced. The assessment of balance in the current market, however, needs to be tempered by the understanding that foreclosure properties may not adequately represented in the listing statistics, and that distressed properties may still dominate some neighborhoods, so the month’s supply of homes is not likely to be a good barometer of likely price performance in the short term. While price declines should be anticipated in neighborhoods with a significant level of distressed properties, short inventories will probably lead to price increases in other neighborhoods. The impact on the aggregate market remains difficult to predict.
While the statewide market is “balanced”, the same cannot be said for individual local markets or price ranges. Both King and Snohomish counties have extremely limited inventories of homes available for sale, with month’s supplies of only 2.9. Accordingly, it is no surprise that stories of bidding wars and rapidly increasing prices are often heard in greater Seattle. Meanwhile, 16 Washington counties still have inventory levels capable of sustaining the current sales rate for at least a year even if no new listings come on the market. These are places which clearly have an excess supply of homes on the market today, where price declines will likely continue throughout the second half, even if they were not dealing with distressed properties. The inventory imbalance was especially clear in several small counties, with Northeast Washington (Stevens/Ferry/Pend Oreille counties) leading the list with a 3-year supply of homes.
As expected, the least expensive homes have the most limited supply compared to sales rates, but a broad range of prices have very similar supply conditions. Homes priced above $500,000 statewide have the greatest month’s supply of 8.5 months, only a modest oversupply, but outside the greater Seattle market the expensive properties generally recorded significant levels of oversupply. Of course, even during active real estate markets those properties typically take longer to sell because they can be afforded by a much more limited clientele.
Market RisksThis report has already made clear that the path ahead for housing in Washington remains unclear. In some urban markets the improvement is undeniable, and those communities are large enough to drive overall statewide statistics. However, as an observer looks beyond the immediate Seattle area, the recovery is tenuous at best. Unemployment remains an issue in most communities, and the national statistics continue to show very limited job creation as workers return to the labor force, resulting in higher unemployment rates despite the additional jobs. As governments at all levels continue to shed jobs, communities with high levels of public sector employment continue to face challenging housing markets.
With a strong rental market, rents are rising. Rapid jumps in rents might further tip the balance toward homeownership. WCRER/Runstad data for the first quarter indicated average rents in Washington increased 3.7 percent in the last year. Real estate brokers report that first-time buyers are very active in the market, suggesting the rent/buy decision favors purchasing. The rapid increase in multifamily construction reported in this and previous issues could bring enough additional apartments to the market within a year to change that balance, however.

Washington Center for Real Estate Research at Runstad Center / University of Washington12
Mortgage interest rates have not been a risk factor for quite a while, and are expected to remain exceptionally low for another year. At the same time, weekly reports suggest the lowest rates are now in the rear view mirror with gradually increasing finance costs in the future. Buyers who were waiting for prices to hit bottom may now be faced with the prospect that both prices and mortgage rates are making their payments higher than they would have been six months ago. This may create a sense of urgency to be a buyer soon, increasing demand before most sellers can prepare their homes for market. The price implications are obvious.
Distressed properties remain the biggest source of risk to the market in the short term, and fall in a couple of categories. Seriously delinquent properties (those where the mortgages are at least 90 days past due or in foreclosure) continued to increase in Washington, despite the increasing sales which could have cleared some of the problem loans as short sales. At the end of June there were approximately 80,000 mortgages in the state which were at least 90 days past due or at some stage of the foreclosure process. This represents an increase of about 1,200 mortgages in the last three months. While fewer mortgages are joining the ranks of the seriously delinquent, foreclosure processing remains lengthy. Completed foreclosures so far in 2012 have averaged 888 per month, roughly half the rate seen during 2011.
In summary, it is often said that all real estate is local, and that is abundantly clear in this report. Sheer numbers of people and home sales mean that greater Seattle drives the state. Today, the strong Seattle market counterbalances weaknesses in the remainder of the state, producing unclear trends. These mixed messages are likely to continue for some time, unless a flood of foreclosures swamps the market, but that currently appears unlikely. The remainder of the year promises to be interesting.
Source: RealtyTrac (www.realtytrac.com/)
4.0
6.0
8.0
10.0
12.0
% o
f M
ort
gag
es
Serious Delinquency and Foreclosure
0.0
2.0
%
US WA
3,0004,0005,0006,0007,0008,000
Quarterly Foreclosures Completed in Washington
01,0002,000

Washington State’s Housing Market - Second Quarter 2012 13
Month's Supply of Homes on Market
Skagit
Adams
Columbia
Lincoln
Wahkiakum
2.9Snohomish
2.9King
5.2Pierce5.9
Thurston
6.6Clark
6.6Kittitas
6.8Kitsap
7.5Benton
7.5Franklin
7.6Douglas
8.6Whatcom
8.6Spokane
8.6Yakima
10.1Asotin
10.1Garfield
11.2Whitman
11.3Chelan
11.9Clallam
12.4Island
12.5Walla Walla12.7
Cowlitz
15.1Lewis
15.2Grays Harbor
16.0Grant
16.3Mason
16.5Jefferson
19.5Klickitat
21.1Pacific
29.5Okanogan
29.8San Juan
32.7Skamania
68.7Ferry
68.7Pend Oreille
68.7Stevens
Months2.0 to 6.06.1 to 10.010.1 to 15.015.1 to 23.924.0 to 70.0No data

Washington Center for Real Estate Research at Runstad Center / University of Washington14
HOUSING MARKET SNAPSHOTState of Washington and CountiesSecond Quarter 2012
NOTES:• Home Resales are WCRER estimates based on MLS reports or deed recording (Real Market Data LLC).• SAAR means data presented at Seasonally Adjusted Annual Rates allowing quarter-to-quarter comparison.• Building permits (total) are from the U.S. Department of Commerce, Bureau of the Census.• Median prices are WCRER estimates. Half the homes sold at higher prices, half lower.• Affordability index measures the ability of a typical family to make payments on median price resale home. It assumes 20% downpayment
and 30-year amortizing mortgage. First-time buyer affordability index assumes a less expensive home, lower downpayment and lower income.
SAAR % Change # % Change $ % ChangeCounty (last qtr) (year ago) (year ago) (year ago)ADAMS 110 -35.3% -47.6% $123,300 -3.1% 204.6 135.0ASOTIN 300 -28.6% 7.1% $156,200 -5.0% 195.3 103.2
BENTON 3,040 -3.2% 1.7% 360 7.5% $181,400 4.0% 201.5 127.9CHELAN 1,160 -20.0% 41.5% 39 14.7% $205,000 -4.7% 160.1 95.1
CLALLAM 880 -9.3% 7.3% 25 -16.7% $190,000 2.5% 167.3 82.9CLARK 6,100 -5.0% 0.7% 356 63.3% $198,500 4.3% 201.2 109.2
COLUMBIA 80 -11.1% -27.3% 0 N/A $145,000 34.9% 221.8 113.5COWLITZ 1,140 -15.6% -27.4% 37 42.3% $128,900 -0.8% 250.8 127.6
DOUGLAS 430 4.9% 16.2% 19 -64.2% $195,000 -3.0% 164.0 96.3FERRY 100 -23.1% -9.1% 0 N/A $127,100 -9.2% 199.6 122.2
FRANKLIN 630 -3.1% 3.3% 226 6.1% $181,400 4.0% 201.5 102.1GARFIELD 30 -40.0% 0.0% 1 N/A $156,200 -5.0% 175.8 121.8
GRANT 1,170 -30.4% -13.3% $156,000 4.0% 182.7 102.8GRAYS HARBOR 1,470 -4.5% 12.2% 17 41.7% $115,600 2.9% 246.6 139.8
ISLAND 2,770 10.4% 18.4% 34 47.8% $242,600 -4.9% 163.5 91.9JEFFERSON 480 -2.0% 4.3% 14 -26.3% $245,300 -0.1% 141.1 75.8
KING 27,450 3.2% 17.2% 3,426 51.5% $370,800 6.5% 131.9 72.7KITSAP 3,450 11.7% 19.8% 119 33.7% $242,200 3.1% 170.7 96.4
KITTITAS 1,310 8.3% 28.4% 47 23.7% $190,000 -1.3% 181.0 87.8KLICKITAT 340 -17.1% 25.9% $167,500 -21.2% 161.3 96.3
LEWIS 810 9.5% 5.2% 31 -50.8% $158,000 17.0% 195.7 99.6LINCOLN 220 -31.3% -18.5% $72,500 3.6% 409.1 244.8
MASON 990 -18.2% 6.5% 41 17.1% $156,200 11.6% 210.9 124.1OKANOGAN 720 -2.7% 67.4% 30 7.1% $161,700 8.2% 173.5 87.4
PACIFIC 230 0.0% 27.8% $108,300 -6.6% 266.2 144.2PEND OREILLE 170 -22.7% -10.5% 0 -100.0% $127,100 -9.2% 206.5 118.2
PIERCE 10,510 -7.9% -1.7% 750 30.2% $195,200 -0.9% 201.0 117.9SAN JUAN 300 30.4% 76.5% 27 50.0% $336,400 -20.4% 107.1 68.4
SKAGIT 1,650 0.6% 10.7% 60 27.7% $206,400 4.2% 174.7 110.2SKAMANIA 50 -66.7% 25.0% 11 -31.3% $160,000 28.0% 249.6 133.6
SNOHOMISH 9,390 1.7% 23.1% 646 -24.7% $261,400 8.2% 173.3 98.6SPOKANE 5,860 -15.9% 6.7% 333 -20.1% $168,100 4.1% 204.8 113.8STEVENS 670 -20.2% -10.7% 1 -50.0% $127,100 -9.2% 232.5 133.1
THURSTON 3,830 9.4% 6.7% 197 -1.0% $225,600 2.5% 181.9 109.6WAHKIAKUM 100 0.0% 66.7% $115,000 43.8% 264.4 159.3
WALLA WALLA 980 -1.0% 18.1% 17 30.8% $160,000 -4.5% 198.6 112.0WHATCOM 2,150 -5.3% 11.4% 130 116.7% $259,700 2.6% 142.7 77.5WHITMAN 400 -23.1% 14.3% 12 20.0% $193,300 0.3% 174.7 67.9
YAKIMA 3,040 4.1% 10.5% 35 0.0% $161,900 7.4% 173.0 97.7 Statewide 94,510 -2.6% 10.4% 7,041 22.9% $236,000 4.0% 169.0 95.5
HousingAffordability
Index (HAI)First-Time
HAI
Home Resales (units) Building Permits Median Resale Price
Source: Washington Center for Real Estate Research at Runstad Center/University of Washington

Washington State’s Housing Market - Second Quarter 2012 15
EXISTING HOME SALESState of Washington and CountiesSeasonally Adjusted Annual Rate
NOTES:• Number of single-family units sold, excluding new construction.
County 10:Q1 10:Q2 10:Q3 10:Q4 11:Q1 11:Q2 11:Q3 11:Q4 12:Q1 12:Q2 Last qtr Year agoADAMS 160 130 260 130 340 210 170 130 170 110 -35.3% -47.6%ASOTIN 370 540 380 410 360 280 290 320 420 300 -28.6% 7.1%
BENTON 3,640 4,340 2,850 3,100 3,160 2,990 3,010 3,090 3,140 3,040 -3.2% 1.7%CHELAN 1,000 1,200 930 970 1,220 820 1,090 1,090 1,450 1,160 -20.0% 41.5%
CLALLAM 900 1,080 830 860 970 820 900 960 970 880 -9.3% 7.3%CLARK 6,280 7,200 4,510 5,270 5,770 6,060 6,130 6,120 6,420 6,100 -5.0% 0.7%
COLUMBIA 140 120 50 110 130 110 80 20 90 80 -11.1% -27.3%COWLITZ 1,530 1,390 1,200 1,220 1,350 1,570 1,460 1,350 1,350 1,140 -15.6% -27.4%
DOUGLAS 390 410 360 390 380 370 470 440 410 430 4.9% 16.2%FERRY 120 120 100 80 100 110 100 120 130 100 -23.1% -9.1%
FRANKLIN 750 890 590 640 650 610 620 630 650 630 -3.1% 3.3%GARFIELD 40 60 40 40 40 30 30 30 50 30 -40.0% 0.0%
GRANT 1,730 1,870 1,240 1,270 1,330 1,350 1,190 1,200 1,680 1,170 -30.4% -13.3%GRAYS HARBOR 1,600 1,600 1,320 1,290 1,510 1,310 1,550 1,590 1,540 1,470 -4.5% 12.2%
ISLAND 2,860 2,760 2,350 2,490 2,290 2,340 2,960 2,630 2,510 2,770 10.4% 18.4%JEFFERSON 410 320 460 390 390 460 370 390 490 480 -2.0% 4.3%
KING 23,680 24,390 17,780 20,460 23,740 23,420 22,760 23,700 26,610 27,450 3.2% 17.2%KITSAP 3,380 3,580 2,650 2,950 3,010 2,880 2,950 3,020 3,090 3,450 11.7% 19.8%
KITTITAS 1,480 1,320 1,030 1,290 1,150 1,020 1,290 1,460 1,210 1,310 8.3% 28.4%KLICKITAT 210 270 230 170 430 270 320 320 410 340 -17.1% 25.9%
LEWIS 800 790 500 710 800 770 770 810 740 810 9.5% 5.2%LINCOLN 310 310 260 220 300 270 240 240 320 220 -31.3% -18.5%
MASON 1,190 920 730 800 880 930 990 880 1,210 990 -18.2% 6.5%OKANOGAN 640 590 370 670 450 430 430 420 740 720 -2.7% 67.4%
PACIFIC 210 240 170 210 220 180 200 240 230 230 0.0% 27.8%PEND OREILLE 200 200 180 150 170 190 170 210 220 170 -22.7% -10.5%
PIERCE 10,030 10,490 8,220 9,550 10,290 10,690 10,990 10,910 11,410 10,510 -7.9% -1.7%SAN JUAN 180 150 120 160 190 170 130 170 230 300 30.4% 76.5%
SKAGIT 1,470 1,770 1,340 1,460 1,620 1,490 1,600 1,620 1,640 1,650 0.6% 10.7%SKAMANIA 120 140 80 80 130 40 120 100 150 50 -66.7% 25.0%
SNOHOMISH 8,100 8,400 6,600 7,020 7,790 7,630 8,410 9,090 9,230 9,390 1.7% 23.1%SPOKANE 6,820 7,110 4,710 5,060 5,730 5,490 5,290 5,580 6,970 5,860 -15.9% 6.7%STEVENS 780 780 680 560 670 750 650 800 840 670 -20.2% -10.7%
THURSTON 4,070 3,980 3,440 3,630 3,520 3,590 3,450 3,710 3,500 3,830 9.4% 6.7%WAHKIAKUM 60 100 60 60 80 60 50 90 100 100 0.0% 66.7%
WALLA WALLA 1,100 1,080 690 930 960 830 900 790 990 980 -1.0% 18.1%WHATCOM 2,310 2,130 1,810 1,980 1,930 1,930 2,120 2,120 2,270 2,150 -5.3% 11.4%WHITMAN 290 380 270 350 350 350 430 450 520 400 -23.1% 14.3%
YAKIMA 3,290 3,920 2,600 2,550 2,750 2,750 2,750 3,020 2,920 3,040 4.1% 10.5%Statewide 92,640 97,070 71,990 79,680 87,150 85,570 87,430 89,860 97,020 94,510 -2.6% 10.4%
Percent change
Source: Washington Center for Real Estate Research/Washington State University

Washington Center for Real Estate Research at Runstad Center / University of Washington16
EXISTING HOME SALESState of Washington and CountiesNot Seasonally Adjusted
NOTES:• Revised for consistency with 2000 Census of Housing• Number of units sold, excluding new construction
County 10:Q4Year Total
2010 11:Q1 11:Q2 11:Q3 11:Q4Year Total
2011 12:Q1 12:Q2
Percentchange
(Year ago)
ADAMS 40 180 60 50 50 40 200 30 30 -40.0%ASOTIN 100 430 70 80 90 70 310 80 80 0.0%
BENTON 750 3,500 650 830 830 750 3,060 640 850 2.4%CHELAN 230 1,030 220 250 300 270 1,040 260 350 40.0%
CLALLAM 220 910 190 210 260 250 910 190 230 9.5%CLARK 1,230 5,810 1,190 1,680 1,730 1,440 6,040 1,320 1,690 0.6%
COLUMBIA 20 100 30 30 20 0 80 20 20 -33.3%COWLITZ 290 1,330 280 450 400 320 1,450 280 330 -26.7%
DOUGLAS 110 380 70 90 140 120 420 80 100 11.1%FERRY 20 100 20 30 30 30 110 20 30 0.0%
FRANKLIN 150 710 130 170 170 150 620 130 170 0.0%GARFIELD 10 50 10 10 10 10 40 10 10 0.0%
GRANT 330 1,510 230 380 340 310 1,260 290 330 -13.2%GRAYS HARBOR 330 1,440 290 370 410 410 1,480 290 420 13.5%
ISLAND 610 2,600 440 630 860 650 2,580 480 750 19.0%JEFFERSON 110 390 100 100 110 130 440 100 140 40.0%
KING 4,970 21,430 4,570 6,530 6,490 5,790 23,380 5,110 7,650 17.2%KITSAP 730 3,130 600 770 840 750 2,960 620 920 19.5%
KITTITAS 320 1,250 210 280 370 370 1,230 230 360 28.6%KLICKITAT 40 230 90 80 90 70 330 90 100 25.0%
LEWIS 180 700 170 200 220 200 790 160 210 5.0%LINCOLN 60 280 50 70 70 60 250 50 60 -14.3%
MASON 190 880 160 260 300 210 930 210 280 7.7%OKANOGAN 130 550 60 180 120 80 440 90 300 66.7%
PACIFIC 50 210 50 40 60 60 210 50 60 50.0%PEND OREILLE 40 170 30 50 50 50 180 40 50 0.0%
PIERCE 2,360 9,550 2,090 2,900 3,060 2,710 10,760 2,310 2,840 -2.1%SAN JUAN 50 160 40 40 40 50 170 50 70 75.0%
SKAGIT 350 1,510 330 410 450 390 1,580 340 460 12.2%SKAMANIA 20 100 30 10 30 20 90 30 20 100.0%
SNOHOMISH 1,690 7,520 1,600 2,130 2,310 2,210 8,250 1,900 2,610 22.5%SPOKANE 1,270 5,830 920 1,590 1,580 1,390 5,480 1,120 1,700 6.9%STEVENS 140 690 110 200 200 200 710 140 180 -10.0%
THURSTON 890 3,760 700 980 970 920 3,570 690 1,040 6.1%WAHKIAKUM 10 70 20 20 10 20 70 20 30 50.0%
WALLA WALLA 260 940 170 210 250 220 850 170 250 19.0%WHATCOM 470 2,030 360 540 620 510 2,030 420 600 11.1%WHITMAN 60 330 50 140 120 80 390 80 150 7.1%
YAKIMA 630 3,100 560 770 750 750 2,830 590 850 10.4%Statewide 19,460 84,890 16,950 23,760 24,750 22,060 87,520 18,730 26,320 10.8%
Source: Washington Center for Real Estate Research/Washington State University
Washington State’s Housing Market - Second Quarter 2012 17
MEDIAN HOME PRICESState of Washington and CountiesTime Trend
Source: WCRER Estimates
County 10:Q4 10 Annual 11:Q1 11:Q2 11:Q3 11:Q4 11 Annual 12:Q1 12:Q2 % Ch Q2ADAMS $120,000 $123,900 $114,000 $127,300 $106,000 $126,700 $121,500 $117,500 $123,300 -3.1%ASOTIN $142,700 $147,800 $128,900 $164,500 $156,500 $163,100 $155,200 $128,000 $156,200 -5.0%
BENTON $182,400 $177,500 $175,400 $174,400 $181,300 $174,800 $176,700 $177,800 $181,400 4.0%CHELAN $220,600 $224,900 $207,300 $215,000 $219,000 $220,000 $218,400 $215,900 $205,000 -4.7%
CLALLAM $204,200 $206,400 $176,400 $185,300 $177,100 $179,000 $180,000 $169,300 $190,000 2.5%CLARK $201,700 $212,500 $194,200 $190,400 $189,800 $184,400 $189,800 $174,800 $198,500 4.3%
COLUMBIA $89,500 $125,000 $129,100 $107,500 $92,500 $194,000 $130,000 $147,500 $145,000 34.9%COWLITZ $149,300 $155,000 $140,500 $130,000 $145,000 $136,300 $139,500 $131,300 $128,900 -0.8%
DOUGLAS $200,000 $210,500 $225,000 $201,000 $198,000 $195,000 $203,700 $193,700 $195,000 -3.0%FERRY $140,000 $144,300 $130,000 $140,000 $155,000 $150,000 $146,900 $101,400 $127,100 -9.2%
FRANKLIN $182,400 $177,500 $175,400 $174,400 $181,300 $174,800 $176,700 $177,800 $181,400 4.0%GARFIELD $142,700 $147,800 $128,900 $164,500 $156,500 $163,100 $155,200 $128,000 $156,200 -5.0%
GRANT $157,000 $160,000 $158,900 $150,000 $160,000 $144,000 $154,100 $160,700 $156,000 4.0%GRAYS HARBOR $136,000 $135,000 $121,500 $112,300 $126,000 $115,000 $120,000 $87,500 $115,600 2.9%
ISLAND $252,500 $260,000 $239,800 $255,000 $250,000 $243,000 $249,900 $212,500 $242,600 -4.9%JEFFERSON $254,900 $265,000 $260,000 $245,500 $238,000 $196,000 $238,000 $227,900 $245,300 -0.1%
KING $369,900 $375,000 $345,000 $348,300 $350,000 $320,000 $340,000 $322,400 $370,800 6.5%KITSAP $236,000 $240,000 $235,000 $235,000 $235,500 $230,000 $235,000 $212,500 $242,200 3.1%
KITTITAS $228,000 $214,000 $205,000 $192,500 $181,000 $192,000 $188,500 $180,000 $190,000 -1.3%KLICKITAT $193,300 $198,800 $202,300 $212,500 $176,700 $130,000 $180,000 $176,700 $167,500 -21.2%
LEWIS $145,000 $154,300 $137,500 $135,000 $141,100 $134,000 $139,900 $129,200 $158,000 17.0%LINCOLN $85,000 $73,600 $45,000 $70,000 $95,000 $50,000 $71,700 $62,500 $72,500 3.6%
MASON $164,900 $165,000 $154,500 $140,000 $142,000 $144,000 $145,000 $141,000 $156,200 11.6%OKANOGAN $185,000 $169,000 $153,800 $149,500 $166,500 $150,000 $160,000 $140,000 $161,700 8.2%
PACIFIC $113,500 $128,000 $119,500 $116,000 $107,900 $131,900 $120,000 $101,400 $108,300 -6.6%PEND OREILLE $140,000 $144,300 $130,000 $140,000 $155,000 $150,000 $146,200 $101,400 $127,100 -9.2%
PIERCE $212,000 $220,000 $199,900 $197,000 $192,500 $185,000 $194,000 $175,900 $195,200 -0.9%SAN JUAN $495,000 $422,500 $442,500 $422,500 $345,000 $425,000 $405,000 $320,000 $336,400 -20.4%
SKAGIT $228,300 $223,000 $204,700 $198,000 $204,000 $200,000 $202,800 $184,100 $206,400 4.2%SKAMANIA $155,000 $160,000 $150,000 $125,000 $185,000 $170,000 $166,000 $190,000 $160,000 28.0%
SNOHOMISH $262,700 $275,000 $245,000 $241,500 $240,000 $240,000 $243,000 $234,700 $261,400 8.2%SPOKANE $168,500 $172,700 $162,600 $161,500 $166,800 $158,100 $164,600 $158,100 $168,100 4.1%STEVENS $140,000 $144,300 $130,000 $140,000 $155,000 $150,000 $146,900 $101,400 $127,100 -9.2%
THURSTON $224,900 $230,000 $209,500 $220,000 $223,600 $215,000 $219,500 $213,200 $225,600 2.5%WAHKIAKUM $135,000 $148,000 $148,300 $80,000 $62,500 $225,000 $95,000 $90,000 $115,000 43.8%
WALLA WALLA $171,000 $180,000 $164,900 $167,500 $180,000 $163,400 $170,900 $150,000 $160,000 -4.5%WHATCOM $250,000 $250,000 $245,200 $253,000 $244,000 $230,000 $241,500 $232,800 $259,700 2.6%WHITMAN $183,700 $201,700 $170,000 $192,700 $193,300 $173,300 $186,600 $176,700 $193,300 0.3%
YAKIMA $154,300 $151,500 $140,800 $150,700 $146,000 $147,400 $145,300 $137,200 $161,900 7.4%Statewide $238,800 $246,300 $228,100 $226,900 $225,300 $217,000 $224,180 $208,300 $236,000 4.0%
Source: Washington Center for Real Estate Research/Washington State University

Washington Center for Real Estate Research at Runstad Center / University of Washington18
HOME PRICES BY NUMBER OF BEDROOMSState of Washington and CountiesSecond Quarters
Source: WCRER Estimates
County 2011 2012 % ch 2011 2012 % ch 2011 2012 % chADAMS $35,000 N/A N/A $135,500 $95,000 -29.9% $120,000 $0 -100.0%ASOTIN $103,300 $105,000 1.6% $160,000 $120,000 -25.0% $183,300 $165,000 -10.0%
BENTON $104,300 $105,400 1.1% $165,300 $167,500 1.3% $228,800 $229,000 0.1%CHELAN $143,300 $146,000 1.9% $225,000 $184,000 -18.2% $342,900 $245,000 -28.6%
CLALLAM $168,300 $165,000 -2.0% $193,600 $200,000 3.3% $190,000 $237,500 25.0%CLARK $118,000 $99,400 -15.8% $163,000 $175,000 7.4% $252,600 $262,900 4.1%
COLUMBIA N/A N/A N/A N/A $146,700 N/A N/A $140,000 N/ACOWLITZ $77,500 $47,500 -38.7% $130,000 $133,300 2.5% $175,000 $182,500 4.3%
DOUGLAS $95,000 $95,000 0.0% $204,200 $190,000 -7.0% $240,000 $225,000 -6.3%FERRY $95,000 $110,000 15.8% $156,000 $262,500 68.3% $166,700 $95,000 -43.0%
FRANKLIN $104,300 $105,400 1.1% $165,300 $167,500 1.3% $228,800 $229,000 0.1%GARFIELD $103,300 $105,000 1.6% $160,000 $120,000 -25.0% $183,300 $165,000 -10.0%
GRANT $102,000 $107,500 5.4% $148,000 $150,900 2.0% $197,500 $202,300 2.4%GRAYS HARBOR $86,200 $80,000 -7.2% $110,000 $126,400 14.9% $153,800 $130,000 -15.5%
ISLAND $238,300 $230,400 -3.3% $242,500 $241,700 -0.3% $300,000 $270,800 -9.7%JEFFERSON $180,700 $245,000 35.6% $254,500 $229,500 -9.8% $281,000 $350,000 24.6%
KING $260,000 $278,800 7.2% $310,000 $321,900 3.8% $445,000 $458,000 2.9%KITSAP $156,800 $165,600 5.6% $238,000 $243,700 2.4% $300,800 $293,700 -2.4%
KITTITAS $125,000 $136,000 8.8% $193,000 $192,000 -0.5% $330,000 $318,700 -3.4%KLICKITAT $190,000 $126,700 -33.3% $216,700 $180,000 -16.9% $316,700 $225,000 -29.0%
LEWIS $67,500 $95,000 40.7% $142,000 $165,000 16.2% $195,000 $212,500 9.0%LINCOLN N/A N/A N/A N/A N/A N/A N/A N/A N/A
MASON $120,200 $120,000 -0.2% $146,000 $150,000 2.7% $140,000 $186,700 33.4%OKANOGAN $120,000 $136,700 13.9% $147,300 $142,500 -3.3% $210,000 $241,700 15.1%
PACIFIC $114,000 $91,700 -19.6% $127,500 $135,000 5.9% $121,000 $180,000 48.8%PEND OREILLE $95,000 $110,000 15.8% $156,000 $262,500 68.3% $166,700 $95,000 -43.0%
PIERCE $117,500 $106,500 -9.4% $182,000 $178,200 -2.1% $166,700 $235,800 41.5%SAN JUAN $380,000 $275,000 -27.6% $460,000 $350,000 -23.9% $231,500 $750,000 224.0%
SKAGIT $137,000 $115,000 -16.1% $189,500 $205,600 8.5% $985,000 $256,800 -73.9%SKAMANIA $65,000 $150,000 130.8% $140,000 $160,000 14.3% N/A N/A N/A
SNOHOMISH $150,000 $151,200 0.8% $219,900 $231,200 5.1% $305,000 $318,600 4.5%SPOKANE $96,400 $85,600 -11.2% $152,400 $150,400 -1.3% $200,300 $190,300 -5.0%STEVENS $95,000 $110,000 15.8% $156,000 $262,500 68.3% $166,700 $95,000 -43.0%
THURSTON $153,300 $188,600 23.0% $204,000 $207,200 1.6% $270,500 $266,900 -1.3%WAHKIAKUM N/A N/A N/A N/A N/A N/A N/A N/A N/A
WALLA WALLA N/A $99,000 N/A N/A $160,000 N/A N/A $240,600 N/AWHATCOM $170,000 $180,000 5.9% $250,000 $252,600 1.0% $315,000 $315,700 0.2%WHITMAN $103,300 $95,000 -8.0% $185,700 $180,000 -3.1% $219,600 $275,000 25.2%
YAKIMA $76,200 $83,300 9.3% $156,200 $144,400 -7.6% $232,100 $229,200 -1.2%Statewide $144,900 $151,600 4.6% $204,100 $210,000 2.9% $290,200 $300,600 3.6%
2 Bedroom 3 Bedroom 4 or More Bedrooms
Source: Washington Center for Real Estate Research/Washington State University

Washington State’s Housing Market - Second Quarter 2012 19
CountyMedian
PriceMortgage
RateMonthly
Payment
MedianFamily
Income HAI
StarterMonthly
Payment
MedianHousehold
IncomeFirst Time
HAI
ADAMS $123,300 3.92% $466 $45,800 204.6 $460 $42,561 135.0ASOTIN $156,200 3.92% $591 $55,400 195.3 $582 $41,196 103.2
BENTON $181,400 3.92% $686 $66,350 201.5 $676 $59,323 127.9CHELAN $205,000 3.92% $775 $59,600 160.1 $764 $49,822 95.1
CLALLAM $190,000 3.92% $719 $57,700 167.3 $708 $40,239 82.9CLARK $198,500 3.92% $751 $72,500 201.2 $740 $55,405 109.2
COLUMBIA $145,000 3.92% $548 $58,400 221.8 $541 $42,056 113.5COWLITZ $128,900 3.92% $488 $58,700 250.8 $480 $42,042 127.6
DOUGLAS $195,000 3.92% $738 $58,050 164.0 $727 $48,016 96.3FERRY $127,100 3.92% $481 $46,050 199.6 $474 $39,697 122.2
FRANKLIN $181,400 3.92% $686 $66,350 201.5 $676 $47,321 102.1GARFIELD $156,200 3.92% $591 $49,850 175.8 $582 $48,630 121.8
GRANT $156,000 3.92% $590 $51,750 182.7 $582 $40,978 102.8GRAYS HARBOR $115,600 3.92% $437 $51,750 246.6 $431 $41,317 139.8
ISLAND $242,600 3.92% $918 $72,000 163.5 $904 $57,003 91.9JEFFERSON $245,300 3.92% $928 $62,850 141.1 $914 $47,533 75.8
KING $370,800 3.92% $1,403 $88,800 131.9 $1,382 $68,857 72.7KITSAP $242,200 3.92% $916 $75,050 170.7 $903 $59,681 96.4
KITTITAS $190,000 3.92% $719 $62,450 181.0 $708 $42,623 87.8KLICKITAT $167,500 3.92% $634 $49,050 161.3 $624 $41,233 96.3
LEWIS $158,000 3.92% $598 $56,150 195.7 $589 $40,212 99.6LINCOLN $72,500 3.92% $274 $53,850 409.1 $270 $45,366 244.8
MASON $156,200 3.92% $591 $59,800 210.9 $582 $49,564 124.1OKANOGAN $161,700 3.92% $612 $50,950 173.5 $603 $36,121 87.4
PACIFIC $108,300 3.92% $410 $52,350 266.2 $404 $39,908 144.2PEND OREILLE $127,100 3.92% $481 $47,650 206.5 $474 $38,385 118.2
PIERCE $195,200 3.92% $738 $71,250 201.0 $728 $58,816 117.9SAN JUAN $336,400 3.92% $1,272 $65,400 107.1 $1,254 $58,804 68.4
SKAGIT $206,400 3.92% $781 $65,450 174.7 $769 $58,122 110.2SKAMANIA $160,000 3.92% $605 $72,500 249.6 $596 $54,644 133.6
SNOHOMISH $261,400 3.92% $989 $82,250 173.3 $974 $65,888 98.6SPOKANE $168,100 3.92% $636 $62,500 204.8 $627 $48,893 113.8STEVENS $127,100 3.92% $481 $53,650 232.5 $474 $43,247 133.1
THURSTON $225,600 3.92% $853 $74,500 181.9 $841 $63,197 109.6WAHKIAKUM $115,000 3.92% $435 $55,200 264.4 $429 $46,828 159.3
WALLA WALLA $160,000 3.92% $605 $57,700 198.6 $596 $45,809 112.0WHATCOM $259,700 3.92% $982 $67,300 142.7 $968 $51,438 77.5WHITMAN $193,300 3.92% $731 $61,300 174.7 $721 $33,527 67.9
YAKIMA $161,900 3.92% $612 $50,850 173.0 $603 $40,439 97.7Statewide $236,000 3.92% $893 $72,400 169.0 $880 $57,579 95.5
Source: Washington Center for Real Estate Research/Washington State University
HOUSING AFFORDABILITY INDEXState of Washington and CountiesSecond Quarter 2012
Source: WCRER Estimates
NOTES:• Housing Affordability Index measures the ability of a middle income family to carry the mortgage payments on a median price home. When
the index is 100 there is a balance between the family’s ability to pay and the cost. Higher indexes indicate housing is more affordable. • First-time buyer index assumes the purchaser’s income is 70% of the median household income.• Home purchased by first-time buyers is 85% of area’s median price.• All loans are assumed to be 30 year loans.• All buyer index assumes 20% downpayment. First-time buyer index assumes 10% down.• It is assumed 25% of income can be used for principal and interest payments.
Washington Center for Real Estate Research at Runstad Center / University of Washington20
HOUSING AFFORDABILITY INDEXState of Washington and CountiesTime Trend
Source: WCRER Estimates
NOTES:• Housing Affordability Index measures the ability of a middle income family to carry the mortgage payments on a median price home.
When the index is 100 there is a balance between the family’s ability to pay and the cost. Higher indexes indicate housing is more affordable.
• All loans are assumed to be 30 year loans.• All buyer index assumes 20% downpayment. • It is assumed 25% of income can be used for principal and interest payments.
County 09:Q3 09:Q4 10:Q1 10:Q2 10:Q3 10:Q4 11:Q1 11:Q2 11:Q3 11:Q4 12:Q1 12:Q2ADAMS 178.8 191.9 209.5 193.3 188.9 205.3 205.8 182.4 221.0 189.4 207.9 204.6ASOTIN 170.7 180.3 184.8 171.4 179.1 195.0 209.1 164.9 177.8 177.9 230.8 195.3
BENTON 174.5 187.2 176.3 180.4 178.7 180.6 182.5 185.2 183.4 198.9 199.0 201.5CHELAN 124.2 124.4 119.7 129.5 130.2 135.3 139.0 134.4 134.9 139.5 146.0 160.1
CLALLAM 118.1 130.2 125.7 127.9 141.1 138.2 156.0 150.5 162.6 168.9 181.7 167.3CLARK 148.6 161.9 154.8 158.7 165.4 178.9 180.4 185.6 191.5 206.0 221.2 201.2
COLUMBIA 194.4 200.5 206.7 256.3 154.6 326.7 219.6 265.6 317.0 157.7 211.1 221.8COWLITZ 162.2 175.1 184.0 173.9 182.1 197.2 203.1 220.9 203.4 225.6 238.4 250.8
DOUGLAS 110.8 136.2 127.5 119.8 136.2 145.5 124.8 140.1 145.4 153.4 158.5 164.0FERRY 152.2 149.8 171.9 146.8 159.6 169.1 175.3 162.9 150.1 160.7 242.1 199.6
FRANKLIN 174.5 187.2 176.3 180.4 178.7 180.6 182.5 185.2 183.4 198.9 199.0 201.5GARFIELD 170.5 179.6 184.0 170.5 178.0 193.6 202.7 156.0 164.2 160.1 207.7 175.8
GRANT 136.4 164.4 151.9 148.4 153.1 163.3 156.9 167.8 162.0 188.3 171.7 182.7GRAYS HARBOR 173.6 181.3 174.5 188.6 190.9 190.4 206.7 225.2 206.2 235.8 315.4 246.6
ISLAND 117.4 123.0 123.8 125.2 128.1 136.9 141.2 135.2 143.1 155.2 180.7 163.5JEFFERSON 105.4 91.4 104.0 101.5 118.4 118.7 113.9 122.7 131.3 167.9 147.0 141.1
KING 104.2 110.0 111.5 110.5 110.4 119.1 124.0 124.0 127.0 145.2 146.8 131.9KITSAP 132.6 140.6 145.4 146.2 139.7 154.4 151.5 153.7 158.7 170.9 188.3 170.7
KITTITAS 128.9 124.5 136.3 142.1 125.5 134.7 145.9 157.2 172.4 170.3 185.0 181.0KLICKITAT 130.5 143.2 107.3 130.2 137.3 137.9 125.2 117.6 142.3 197.6 148.0 161.3
LEWIS 151.8 165.6 182.5 158.7 160.9 186.6 192.7 199.6 198.0 219.7 231.8 195.7LINCOLN N/A N/A N/A N/A N/A 322.6 588.3 379.3 285.9 564.4 459.5 409.1
MASON 151.9 172.5 173.3 168.6 155.7 179.2 186.0 207.4 210.8 217.6 226.2 210.9OKANOGAN 129.5 131.7 132.7 136.9 135.9 127.4 151.6 160.3 150.7 177.9 194.1 173.5
PACIFIC 155.0 158.5 192.2 184.2 190.8 230.0 212.0 220.2 243.4 208.0 275.3 266.2PEND OREILLE 158.5 155.3 178.3 152.3 165.7 175.6 181.9 168.8 155.5 166.3 250.5 206.5
PIERCE 137.9 149.1 152.9 150.6 153.1 166.4 171.6 175.9 185.4 201.9 216.1 201.0SAN JUAN 60.4 75.3 86.5 98.6 83.7 69.5 74.5 77.6 96.4 80.7 109.0 107.1
SKAGIT 122.2 132.4 134.6 132.0 140.4 139.4 151.9 159.3 159.9 171.4 189.6 174.7SKAMANIA 153.1 171.5 211.0 216.8 176.4 232.8 233.6 282.7 196.5 223.4 203.5 249.6
SNOHOMISH 124.0 133.9 136.9 137.5 145.0 155.3 161.8 165.6 171.5 179.3 186.8 173.3SPOKANE 156.7 170.4 169.9 169.2 165.7 181.4 183.3 187.0 187.1 207.2 210.9 204.8STEVENS 170.4 167.3 192.3 164.3 178.9 189.7 198.6 186.3 173.3 187.4 282.2 232.5
THURSTON 133.3 148.4 148.3 147.8 148.7 162.0 169.6 163.6 166.3 181.6 186.4 181.9WAHKIAKUM 156.5 284.9 176.0 205.1 154.8 234.6 200.4 361.8 459.4 128.5 327.0 264.4
WALLA WALLA 158.4 163.6 153.7 150.8 165.2 173.7 173.4 170.7 162.1 185.0 205.1 198.6WHATCOM 117.7 122.9 128.1 123.9 122.8 130.6 130.1 128.0 137.3 153.2 154.1 142.7WHITMAN 152.8 151.7 135.0 134.8 134.4 162.2 171.2 153.3 158.1 185.4 185.0 174.7
YAKIMA 152.6 168.2 166.0 160.3 165.0 166.9 176.8 165.9 175.4 180.7 197.6 173.0Statewide 124.1 136.8 135.9 136.9 140.2 149.4 152.2 154.7 160.7 174.8 185.3 169.0
Source: Washington Center for Real Estate Research/Washington State University

Washington State’s Housing Market - Second Quarter 2012 21
HOUSING AFFORDABILITYState of Washington and CountiesFirst Time Buyers, Time Trend
Source: WCRER Estimates
NOTES:• Housing Affordability Index measures the ability of a middle income family to carry the mortgage payments on a median price home.
When the index is 100 there is a balance between the family’s ability to pay and the cost. Higher indexes indicate housing is more affordable.
• All loans are assumed to be 30 year loans.• All buyer index assumes 20% downpayment. • It is assumed 25% of income can be used for principal and interest payments.
County 09:Q3 09:Q4 10:Q1 10:Q2 10:Q3 10:Q4 11:Q1 11:Q2 11:Q3 11:Q4 12:Q1 12:Q2ADAMS 108.3 117.5 127.4 116.7 113.2 122.1 124.2 111.5 136.9 121.5 135.3 135.0ASOTIN 90.6 95.5 97.3 89.6 93.0 100.6 107.7 84.8 91.2 92.3 120.9 103.2
BENTON 112.9 120.3 114.0 117.3 116.8 118.7 120.3 122.5 121.6 130.0 128.2 127.9CHELAN 73.8 72.9 69.0 73.5 72.7 74.3 76.0 73.2 73.2 78.9 84.6 95.1
CLALLAM 60.3 64.2 61.9 62.9 69.3 67.8 75.9 72.5 77.7 81.4 88.9 82.9CLARK 83.8 89.5 85.3 87.2 90.5 97.5 98.2 100.8 103.8 111.7 120.0 109.2
COLUMBIA 97.4 100.4 102.1 125.0 74.3 154.9 103.0 123.2 145.4 75.2 104.4 113.5COWLITZ 84.5 87.5 92.0 87.0 91.1 98.7 101.7 110.8 102.0 113.9 120.8 127.6
DOUGLAS 64.8 80.9 75.1 69.9 78.7 83.2 71.6 80.5 83.8 89.8 93.0 96.3FERRY 88.4 88.7 100.4 84.5 90.6 94.5 97.5 90.1 82.5 92.3 143.7 122.2
FRANKLIN 94.3 100.2 96.6 101.0 102.2 105.4 108.5 112.0 112.8 115.1 108.0 102.1GARFIELD 101.9 108.9 110.0 100.5 103.5 110.9 117.8 91.9 98.0 102.5 138.5 121.8
GRANT 84.5 96.4 89.7 88.2 91.5 98.3 94.9 102.1 99.0 111.9 99.3 102.8GRAYS HARBOR 97.0 101.4 97.2 104.6 105.3 104.6 113.0 122.6 111.7 129.9 176.3 139.8
ISLAND 68.6 70.4 70.5 71.0 72.2 76.7 77.8 73.1 76.0 83.6 99.5 91.9JEFFERSON 57.4 50.0 56.3 54.3 62.5 62.0 58.4 61.7 64.7 84.8 76.6 75.8
KING 58.1 60.2 60.7 59.9 59.4 63.7 66.0 65.7 66.9 77.7 79.7 72.7KITSAP 77.4 80.2 81.9 81.4 76.7 83.7 80.7 80.3 81.4 90.3 103.0 96.4
KITTITAS 63.9 62.2 67.6 70.0 61.3 65.3 70.2 75.1 81.7 81.2 89.0 87.8KLICKITAT 72.2 80.5 60.8 74.3 78.9 79.8 74.6 72.1 89.7 124.3 90.7 96.3
LEWIS 81.3 85.9 94.1 81.3 81.8 94.3 95.9 97.7 95.4 107.2 115.6 99.6LINCOLN N/A N/A N/A N/A N/A 185.0 337.6 217.6 163.9 329.6 271.7 244.8
MASON 89.8 102.7 102.3 98.8 90.5 103.3 106.5 117.8 118.7 124.3 131.2 124.1OKANOGAN 72.9 73.2 73.0 74.6 73.3 68.0 79.1 81.6 75.0 87.9 96.8 87.4
PACIFIC 80.9 83.7 100.6 95.6 98.1 117.2 107.1 110.2 120.7 106.4 145.0 144.2PEND OREILLE 87.6 86.8 99.0 83.9 90.6 95.3 99.1 92.2 85.1 93.1 141.8 118.2
PIERCE 82.2 88.2 89.5 87.3 87.7 94.4 96.5 98.1 102.4 113.7 124.2 117.9SAN JUAN 35.5 44.2 50.1 56.3 47.2 38.6 41.4 43.2 53.7 47.6 67.0 68.4
SKAGIT 79.2 85.5 85.9 83.2 87.5 85.9 92.3 95.5 94.5 103.3 116.9 110.2SKAMANIA 80.1 91.1 110.8 112.5 90.4 117.9 117.1 140.2 96.4 113.0 105.9 133.6
SNOHOMISH 71.8 76.2 77.1 76.8 80.2 85.1 87.9 89.3 91.6 97.9 104.2 98.6SPOKANE 87.3 94.7 94.0 93.2 90.9 99.1 99.1 100.0 98.9 111.1 115.1 113.8STEVENS 97.7 96.4 109.2 92.0 98.6 103.0 106.4 98.3 90.1 100.7 156.6 133.1
THURSTON 83.0 92.0 91.0 89.7 89.3 96.2 99.7 95.1 95.5 105.7 110.4 109.6WAHKIAKUM 82.1 147.9 90.8 105.2 78.9 118.8 104.5 194.4 254.7 75.1 194.2 159.3
WALLA WALLA 87.6 89.9 84.0 81.8 89.0 93.0 93.3 92.3 88.0 102.3 114.6 112.0WHATCOM 64.0 67.6 70.3 67.8 67.0 71.1 70.0 68.1 72.2 81.1 82.7 77.5WHITMAN 62.0 59.9 52.7 52.0 51.1 60.9 63.3 55.7 56.5 67.9 69.9 67.9
YAKIMA 87.1 93.7 93.1 90.4 93.7 95.3 101.8 96.2 102.4 104.7 113.1 97.7 Statewide 71.8 77.9 76.9 77.0 78.2 82.8 83.8 84.5 87.0 95.9 103.2 95.5
Source: Washington Center for Real Estate Research/Washington State University

Washington Center for Real Estate Research at Runstad Center / University of Washington22
PERCENTAGE OF HOMES ON MARKET BELOW SPECIFIED PRICEState of Washington and CountiesEnd of Second Quarter 2012
Source: WCRER Estimates
County $80,000 $160,000 $250,000 $500,000ADAMS N/A N/A N/A N/AASOTIN 4.6% 39.1% 72.0% 96.6%
BENTON 3.2% 25.7% 64.7% 95.1%CHELAN 2.2% 12.2% 37.2% 81.3%
CLALLAM 1.6% 15.0% 46.9% 85.6%CLARK 1.9% 17.4% 47.9% 87.5%
COLUMBIA N/A N/A N/A N/ACOWLITZ 8.2% 40.1% 68.0% 94.6%
DOUGLAS 4.0% 14.4% 51.2% 89.6%FERRY 7.1% 36.1% 64.4% 92.9%
FRANKLIN 3.2% 25.7% 64.7% 95.1%GARFIELD 4.6% 39.1% 72.0% 96.6%
GRANT 4.8% 33.6% 66.1% 95.2%GRAYS HARBOR 14.6% 47.5% 77.1% 96.3%
ISLAND 0.9% 6.8% 28.0% 73.8%JEFFERSON 1.9% 11.3% 29.0% 78.7%
KING 0.2% 4.3% 17.2% 57.7%KITSAP 1.2% 13.6% 43.6% 83.0%
KITTITAS 2.3% 18.1% 47.4% 80.0%KLICKITAT 5.4% 23.6% 50.0% 88.4%
LEWIS 7.9% 38.1% 71.2% 96.5%LINCOLN N/A N/A N/A N/A
MASON 6.3% 32.7% 62.8% 92.8%OKANOGAN 6.4% 29.5% 57.7% 89.2%
PACIFIC 12.0% 48.8% 75.3% 94.8%PEND OREILLE 7.1% 36.1% 64.4% 92.9%
PIERCE 2.8% 19.2% 49.5% 86.2%SAN JUAN 0.0% 1.3% 6.8% 40.0%
SKAGIT 2.5% 15.5% 43.3% 81.8%SKAMANIA 5.9% 32.7% 52.5% 84.2%
SNOHOMISH 1.8% 11.5% 31.2% 80.7%SPOKANE 4.8% 32.6% 66.4% 93.1%STEVENS 7.1% 36.1% 64.4% 92.9%
THURSTON 2.6% 14.5% 50.4% 91.8%WAHKIAKUM N/A N/A N/A N/A
WALLA WALLA 7.3% 33.5% 67.1% 93.4%WHATCOM 3.1% 10.5% 34.6% 79.7%WHITMAN 7.9% 36.6% 68.1% 95.4%
YAKIMA 8.0% 38.3% 68.9% 94.2%Statewide 3.5% 20.4% 47.5% 83.2%
Source: Washington Center for Real Estate Research/Washington State University
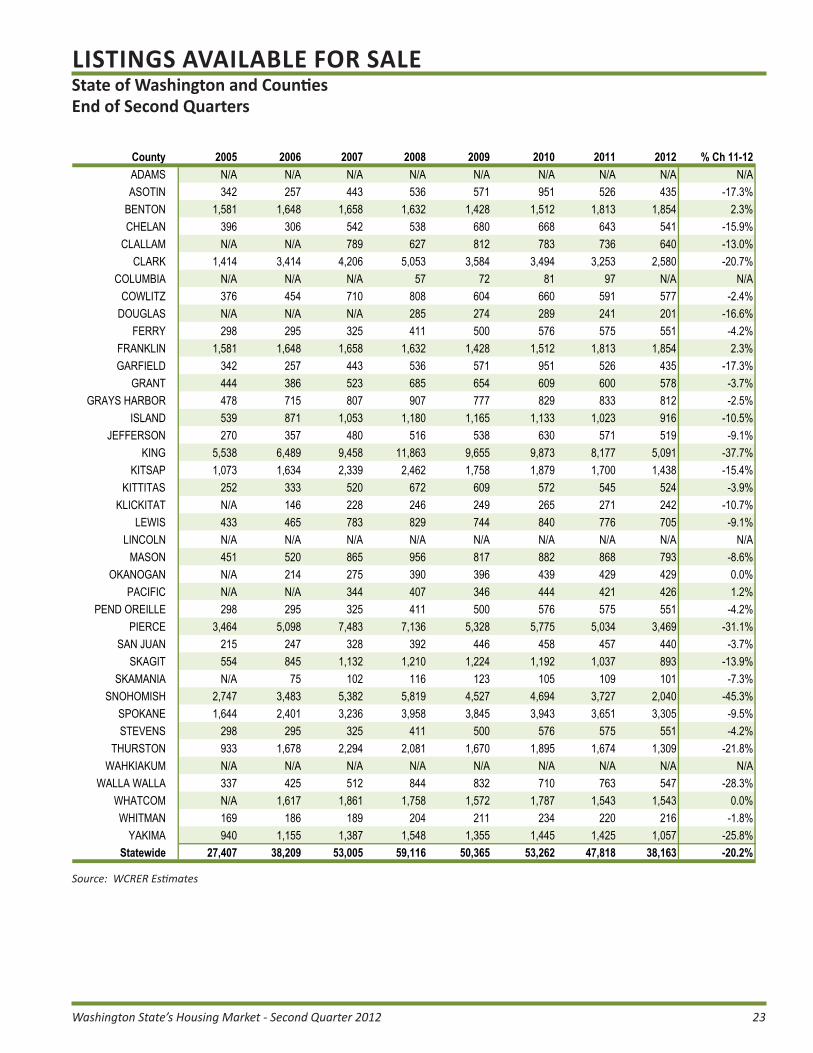
Washington State’s Housing Market - Second Quarter 2012 23
LISTINGS AVAILABLE FOR SALEState of Washington and CountiesEnd of Second Quarters
Source: WCRER Estimates
County 2005 2006 2007 2008 2009 2010 2011 2012 % Ch 11-12ADAMS N/A N/A N/A N/A N/A N/A N/A N/A N/AASOTIN 342 257 443 536 571 951 526 435 -17.3%
BENTON 1,581 1,648 1,658 1,632 1,428 1,512 1,813 1,854 2.3%CHELAN 396 306 542 538 680 668 643 541 -15.9%
CLALLAM N/A N/A 789 627 812 783 736 640 -13.0%CLARK 1,414 3,414 4,206 5,053 3,584 3,494 3,253 2,580 -20.7%
COLUMBIA N/A N/A N/A 57 72 81 97 N/A N/ACOWLITZ 376 454 710 808 604 660 591 577 -2.4%
DOUGLAS N/A N/A N/A 285 274 289 241 201 -16.6%FERRY 298 295 325 411 500 576 575 551 -4.2%
FRANKLIN 1,581 1,648 1,658 1,632 1,428 1,512 1,813 1,854 2.3%GARFIELD 342 257 443 536 571 951 526 435 -17.3%
GRANT 444 386 523 685 654 609 600 578 -3.7%GRAYS HARBOR 478 715 807 907 777 829 833 812 -2.5%
ISLAND 539 871 1,053 1,180 1,165 1,133 1,023 916 -10.5%JEFFERSON 270 357 480 516 538 630 571 519 -9.1%
KING 5,538 6,489 9,458 11,863 9,655 9,873 8,177 5,091 -37.7%KITSAP 1,073 1,634 2,339 2,462 1,758 1,879 1,700 1,438 -15.4%
KITTITAS 252 333 520 672 609 572 545 524 -3.9%KLICKITAT N/A 146 228 246 249 265 271 242 -10.7%
LEWIS 433 465 783 829 744 840 776 705 -9.1%LINCOLN N/A N/A N/A N/A N/A N/A N/A N/A N/A
MASON 451 520 865 956 817 882 868 793 -8.6%OKANOGAN N/A 214 275 390 396 439 429 429 0.0%
PACIFIC N/A N/A 344 407 346 444 421 426 1.2%PEND OREILLE 298 295 325 411 500 576 575 551 -4.2%
PIERCE 3,464 5,098 7,483 7,136 5,328 5,775 5,034 3,469 -31.1%SAN JUAN 215 247 328 392 446 458 457 440 -3.7%
SKAGIT 554 845 1,132 1,210 1,224 1,192 1,037 893 -13.9%SKAMANIA N/A 75 102 116 123 105 109 101 -7.3%
SNOHOMISH 2,747 3,483 5,382 5,819 4,527 4,694 3,727 2,040 -45.3%SPOKANE 1,644 2,401 3,236 3,958 3,845 3,943 3,651 3,305 -9.5%STEVENS 298 295 325 411 500 576 575 551 -4.2%
THURSTON 933 1,678 2,294 2,081 1,670 1,895 1,674 1,309 -21.8%WAHKIAKUM N/A N/A N/A N/A N/A N/A N/A N/A N/A
WALLA WALLA 337 425 512 844 832 710 763 547 -28.3%WHATCOM N/A 1,617 1,861 1,758 1,572 1,787 1,543 1,543 0.0%WHITMAN 169 186 189 204 211 234 220 216 -1.8%
YAKIMA 940 1,155 1,387 1,548 1,355 1,445 1,425 1,057 -25.8% Statewide 27,407 38,209 53,005 59,116 50,365 53,262 47,818 38,163 -20.2%
Source: Washington Center for Real Estate Research/Washington State University

Washington Center for Real Estate Research at Runstad Center / University of Washington24
MONTH’S SUPPLY OF HOUSING BY PRICE RANGEState of Washington and CountiesJune 2012
Source: WCRER Estimates
Under $80,000- $160,000 $250,000- $500,000 Total Market MarketCounty $80,000 159,999 $249,999 $499,999 and above Market 2011 2010ADAMS N/A N/A N/A N/A N/A N/A N/A N/AASOTIN 5.4 8.0 8.8 29.1 N/A 10.1 13.1 12.5
BENTON 3.8 5.5 7.3 10.6 30.0 7.5 7.3 4.8CHELAN 5.4 4.7 8.3 17.0 28.1 11.3 19.1 13.5
CLALLAM 3.1 4.8 13.0 17.2 40.9 11.9 14.7 11.9CLARK 3.1 4.0 5.2 9.3 23.8 6.6 8.4 7.6
COLUMBIA N/A N/A N/A N/A N/A N/A N/A N/ACOWLITZ 4.1 9.5 16.5 35.7 N/A 12.7 9.0 11.1
DOUGLAS 11.4 3.1 6.2 13.7 N/A 7.6 11.7 11.8FERRY 25.3 57.6 63.2 127.3 N/A 68.7 21.1 20.2
FRANKLIN 3.8 5.5 7.3 10.6 30.0 7.5 7.3 4.8GARFIELD 5.4 8.0 8.8 29.1 N/A 10.1 13.1 12.5
GRANT 7.2 11.0 14.2 47.5 N/A 16.0 14.1 10.7GRAYS HARBOR 6.6 13.1 20.9 44.9 N/A 15.2 16.9 14.2
ISLAND 2.4 5.7 7.4 14.0 52.2 12.4 16.4 8.5JEFFERSON 3.4 9.0 11.5 20.8 N/A 16.5 27.6 24.5
KING 0.7 1.6 2.1 2.7 4.2 2.9 5.4 6.4KITSAP 1.3 5.3 6.6 7.3 10.4 6.8 9.5 8.0
KITTITAS 1.7 4.1 5.7 9.1 18.3 6.6 20.1 16.1KLICKITAT 4.5 15.3 17.1 46.1 N/A 19.5 27.5 26.5
LEWIS 6.9 13.7 13.7 31.9 N/A 15.1 16.7 17.2LINCOLN N/A N/A N/A N/A N/A N/A N/A N/A
MASON 4.4 15.6 15.9 4.9 40.2 16.3 18.3 26.1OKANOGAN 12.6 19.9 32.0 48.7 N/A 29.5 48.5 36.5
PACIFIC 7.4 20.5 28.4 50.1 N/A 21.1 25.0 21.0PEND OREILLE 25.3 57.6 63.2 127.3 N/A 68.7 21.1 20.2
PIERCE 1.8 3.2 4.3 7.2 23.9 5.2 7.0 8.3SAN JUAN N/A N/A 9.9 25.3 53.6 29.8 53.6 62.1
SKAGIT 3.6 5.9 7.5 13.5 33.9 10.0 12.6 12.6SKAMANIA N/A 17.5 25.9 10.4 N/A 32.7 N/A N/A
SNOHOMISH 2.2 2.0 1.9 3.1 8.0 2.9 6.1 7.2SPOKANE 3.8 7.0 9.1 11.7 19.8 8.6 10.2 8.5STEVENS 25.3 57.6 63.2 127.3 N/A 68.7 21.1 20.2
THURSTON 5.0 4.7 4.7 6.8 25.4 5.9 4.4 8.1WAHKIAKUM N/A N/A N/A N/A N/A N/A N/A N/A
WALLA WALLA 12.2 7.7 15.6 16.9 22.0 12.5 20.5 14.7WHATCOM 7.8 5.8 6.4 8.5 20.6 8.6 11.0 11.5WHITMAN 11.3 16.0 7.5 11.9 N/A 11.2 12.8 12.8
YAKIMA 5.9 8.1 6.7 15.1 24.4 8.6 13.4 9.0 Statewide 3.9 5.4 5.7 6.5 8.5 6.1 8.3 8.5
Source: Washington Center for Real Estate Research/Washington State University

Washington State’s Housing Market - Second Quarter 2012 25
RESIDENTIAL BUILDING PERMITSState of Washington and CountiesUnits Authorized, Monthly
Source: U.S. Department of Commerce
NOTES:• Percentage change is based on equivalent reports.• TOT refers to total building permits, both single-family and multifamily.• ONE refers to building permits for single-family homes only.
COUNTY TOT ONE TOT ONE TOT ONE TOT ONE TOT ONE TOT ONE TOT ONEADAMSASOTIN
BENTON 102 70 116 74 117 67 94 68 129 88 137 88 7.5% 15.6%CHELAN 8 8 13 13 13 13 13 13 12 12 14 14 14.7% 14.7%
CLALLAM 7 7 10 10 13 13 8 8 9 9 8 8 -16.7% -16.7%CLARK 80 80 59 59 79 72 112 98 129 123 115 115 63.3% 59.2%
COLUMBIA 0 0 0 0 0 0 0 0 0 0 0 0 N/A N/ACOWLITZ 5 5 10 10 11 9 16 16 14 14 7 7 42.3% 54.2%
DOUGLAS 11 11 7 7 35 2 4 4 7 7 8 8 -64.2% -5.0%FERRY 0 0 0 0 0 0 0 0 0 0 0 0 N/A N/A
FRANKLIN 66 52 70 53 77 57 67 62 77 77 82 77 6.1% 33.3%GARFIELD 0 0 0 0 0 0 1 1 0 0 0 0 N/A N/A
GRANTGRAYS HARBOR 3 3 1 1 8 8 8 8 4 4 5 5 41.7% 41.7%
ISLAND 9 9 11 11 3 3 13 13 8 8 13 13 47.8% 47.8%JEFFERSON 5 5 6 6 8 8 5 5 3 3 6 6 -26.3% -26.3%
KING 731 272 1,222 230 309 248 814 334 1,074 377 1,538 357 51.5% 42.4%KITSAP 32 32 28 26 29 29 31 31 49 49 39 39 33.7% 36.8%
KITTITAS 14 14 10 10 14 14 15 15 18 18 14 14 23.7% 23.7%KLICKITAT
LEWIS 14 7 20 9 29 14 5 5 12 12 14 14 -50.8% 3.3%LINCOLN
MASON 14 14 11 11 10 10 12 12 13 13 16 16 17.1% 17.1%OKANOGAN 7 7 9 9 12 12 5 5 15 15 10 10 7.1% 7.1%
PACIFICPEND OREILLE 0 0 0 0 1 1 0 0 0 0 0 0 -100.0% -100.0%
PIERCE 129 129 156 144 291 129 155 155 325 221 270 146 30.2% 29.9%SAN JUAN 9 9 4 4 5 5 10 10 6 6 11 11 50.0% 50.0%
SKAGIT 16 16 14 14 17 17 17 17 23 23 20 20 27.7% 27.7%SKAMANIA 5 5 9 9 2 2 3 3 4 4 4 4 -31.3% -31.3%
SNOHOMISH 515 150 148 144 195 170 227 189 185 181 234 220 -24.7% 27.2%SPOKANE 56 56 286 54 75 67 115 78 116 65 102 76 -20.1% 23.7%STEVENS 1 1 0 0 1 1 1 1 0 0 0 0 -50.0% -50.0%
THURSTON 96 68 50 50 53 53 69 69 63 63 65 63 -1.0% 14.0%WAHKIAKUM
WALLA WALLA 4 4 5 5 4 4 6 6 8 8 3 3 30.8% 30.8%WHATCOM 20 20 16 16 24 24 34 26 65 27 31 31 116.7% 40.0%WHITMAN 4 4 1 1 5 5 4 4 2 2 6 6 20.0% 20.0%
YAKIMA 12 12 8 8 15 15 12 12 17 17 6 6 0.0% 0.0% Statewide 1,975 1,070 2,300 988 1,455 1,072 1,876 1,268 2,387 1,446 2,778 1,377 22.9% 30.7%
% ChangeAPR 11 MAY 11 JUN 11 APR 12 MAY 12 JUN 12
Provided by: Washington Center for Real Estate Research/Washington State University

Washington Center for Real Estate Research at Runstad Center / University of Washington26
RESIDENTIAL BUILDING PERMITSState of Washington and CountiesValue Authorized, Quarterly Totals
Source: U.S. Department of Commerce
NOTES:• $ Amounts in Millions.• Total refers to all residential units, regardless of size of structure.• SF refers to Single-Family homes, both detached and attached.
COUNTY Total Value SF Value Total Value SF Value Total Value SF Value Total Value SF ValueADAMSASOTIN
BENTON $65.3 $52.2 $63.9 $50.7 $73.7 $63.1 12.8% 20.8%CHELAN $6.3 $6.3 $1.3 $1.3 $7.6 $7.6 20.1% 20.1%
CLALLAM $6.4 $6.4 $2.8 $2.8 $5.4 $5.4 -15.1% -15.1%CLARK $61.1 $60.4 $54.8 $54.8 $83.0 $81.2 35.9% 34.5%
COLUMBIA $0.0 $0.0 $0.0 $0.0 $0.0 $0.0 N/A N/ACOWLITZ $5.7 $5.3 $3.6 $3.6 $6.9 $6.9 21.9% 30.6%
DOUGLAS $4.7 $4.1 $1.8 $1.8 $3.5 $3.5 -25.9% -14.4%FERRY
FRANKLIN $41.3 $35.6 $40.4 $34.8 $50.1 $49.0 21.3% 37.8%GARFIELD $0.0 $0.0 $0.0 $0.0 $0.2 $0.2 N/A N/A
GRANTGRAYS HARBOR $1.8 $1.8 $1.9 $1.9 $3.5 $3.5 90.6% 90.6%
ISLAND $3.6 $3.6 $6.1 $6.1 $8.4 $8.4 133.8% 133.8%JEFFERSON $4.5 $4.5 $3.8 $3.8 $3.0 $3.0 -33.4% -33.4%
KING $440.2 $209.0 $362.2 $213.9 $693.3 $315.6 57.5% 51.0%KITSAP $19.0 $18.7 $16.6 $15.3 $25.8 $25.8 35.8% 37.8%
KITTITAS $8.4 $8.4 $2.8 $2.8 $10.2 $10.2 21.3% 21.3%KLICKITAT
LEWIS $8.1 $4.4 $1.6 $1.6 $3.9 $3.9 -52.2% -11.9%LINCOLN
MASON $7.0 $7.0 $5.8 $5.8 $9.2 $9.2 31.8% 31.8%OKANOGAN $4.4 $4.4 $0.8 $0.8 $4.3 $4.3 -3.8% -3.8%
PACIFICPEND OREILLE $0.2 $0.2 $0.5 $0.5 $0.0 $0.0 -100.0% -100.0%
PIERCE $114.3 $94.9 $110.1 $107.8 $158.3 $134.2 38.6% 41.5%SAN JUAN $6.1 $6.1 $5.8 $5.8 $9.8 $9.8 61.9% 61.9%
SKAGIT $9.8 $9.8 $6.4 $6.4 $11.1 $11.1 13.9% 13.9%SKAMANIA $3.6 $3.6 $0.1 $0.1 $2.6 $2.6 -28.1% -28.1%
SNOHOMISH $151.0 $107.2 $179.0 $120.0 $156.0 $148.5 3.3% 38.5%SPOKANE $59.3 $38.7 $20.9 $18.5 $73.4 $62.9 23.7% 62.7%STEVENS $0.3 $0.3 $0.0 $0.0 $0.2 $0.2 -37.1% -37.1%
THURSTON $42.9 $38.7 $42.3 $41.5 $47.6 $47.2 10.9% 21.9%WAHKIAKUM
WALLA WALLA $2.6 $2.6 $2.5 $2.5 $4.1 $4.1 58.4% 58.4%WHATCOM $13.6 $13.6 $7.3 $7.3 $22.8 $18.8 67.5% 38.7%WHITMAN $2.3 $2.3 $2.5 $2.2 $2.7 $2.7 20.6% 20.6%
YAKIMA $8.9 $8.9 $4.0 $4.0 $10.7 $10.7 20.6% 20.6% Statewide $1,102.4 $758.8 $951.7 $718.7 $1,491.1 $1,053.6 35.3% 38.9%
% change year ago2nd Qtr 20121st Qtr 20122nd Qtr 2011


Washington Center for Real Estate ResearchCollege of BusinessPO Box 644844Pullman, WA 99164-4844
Washington Center for Real Estate ResearchRunstad Center for Real Estate StudiesCollege of Built Environments424 Gould Hall, Box 355740Seattle WA 98195-5740
Home Price Change 2011Q2-2012Q2
-21.2%Klickitat
-20.4%San Juan
-9.2%Ferry
-9.2%Pend Oreille
-9.2%Stevens
-6.6%Pacific
-5.0%Asotin
-5.0%Garfield
-4.9%Island
-4.7%Chelan
-4.5%Walla Walla
-3.1%Adams
-3.0%Douglas
-1.3%Kittitas-0.9%
Pierce
-0.8%Cowlitz
-0.1%Jefferson
0.3%Whitman
2.5%Clallam
2.5%Thurston
2.6%Whatcom
2.9%Grays Harbor
3.1%Kitsap
3.6%Lincoln
4.0%Grant
4.0%Benton
4.0%Franklin
4.1%Spokane
4.2%Skagit
4.3%Clark
6.5%King
7.4%Yakima
8.2%Okanogan
8.2%Snohomish
11.6%Mason
17.0%Lewis
28.0%Skamania
34.9%Columbia
43.8%Wahkiakum
Percent-30.0% to -7.5%-7.5% to -2.5%-2.5% to 2.5%2.5% to 5.0%5.1% to 45.0%