waste and opportunity - as you sow
TRANSCRIPT

Nishita Bakshi, As You SowOctober 2006
U.S. Beverage Container RecyclingScorecard and Report
R E C YC L I N G S c o r e c a rd
R E C YC L I N G S c o r e c a rd
Recycled
Content
Recycled
content
Source
Reduction
DD-
D-
c-F
F
BC
Waste and Opportunity:
As You Sow
Through capital markets, shareholder leverage and innovative legal strategies, As You Sow is transforming corporate behavior and creating a more socially and environmentally just society.
As You Sow is a non-profi t social change organization dedicated to promoting corporate accountability, social justice, and environmental protection. The Corporate Social Responsibility Program is one of the nation’s leading proponents of shareholder advocacy. As You Sow represents institutional shareholders in dialogues with corporations to promote more responsible policies. As You Sow is based in San Francisco, California. http:/www.asyousow.org
Container Recycling Institute
The Container Recycling Institute (CRI) is a nonprofi t organization that studies and promotes policies and programs that increase recovery and recycling of beverage containers, and shift the social and environmental costs associated with manufacturing, recycling, and disposal of container and packaging waste from government and taxpayers to producers and consumers. CRI is located in Washington D.C. http://www.container-recycling.org
This study has been endorsed by the Environmental Working Group, Friends of the Earth, and the Sierra Club.
AcknowledgementsThis report was authored primarily by Nishita Bakshi, Research Director, Corporate Social Responsibility Program, As You Sow. It was conceptualized by Kenneth Scott of socially responsive investment fi rm Walden Asset Management and Conrad MacKerron of As You Sow. Signifi cant content and editing contributions were provided by Pat Franklin of Container Recycling Institute and Conrad MacKerron.
Thanks to Bill Walker of the Environmental Working Group; Chris Weiss of Friends of the Earth, and Bruce Hamilton, Virginia Cramer and Roger Diedrich of the Sierra Club for reviewing the report and providing comments, and their endorsement. The survey upon which the report was partly based was endorsed by the Environmental Working Group, Friends of the Earth, Natural Resources Defense Council (NRDC) and Sierra Club.
This publication was also reviewed by Helen Spiegelman of the Product Policy Institute, Lloyd Hicks of Inform Inc., Eric Lombardi of Eco-Cycle Inc, Darby Hoover of NRDC, and Mark Murray of Californians Against Waste. We are grateful for their insightful comments and suggestions.
Finally, thanks are due to Jenny Gitlitz of Container Recycling Institute for research and modeling expertise, Sara Feldmann of As You Sow for research and editing assistance, Larry Fahn and Rafael Reyes of As You Sow for editing assistance, John Lind and Karen O’Brien for providing weighing equipment, Divya Mankikar for research assistance, and Michael John Parker for graphics and layout.

U.S. Beverage Container Recycling Scorecard and Report
Executive Summary ................................................................................................................. 11. Why Recycle and Use Recycled Content? ............................................................................. 3
1.1 Greenhouse Gas Emissions and Energy Savings ..............................................................................42. Beverage Container Recycling Score Card .......................................................................... 5
2.1 Grading Methodology of Beverage Companies ................................................................................52.2 Overall Ranking..............................................................................................................................72.3 Use of Recycled Content .................................................................................................................82.4 Beverage Container Recovery and Recycling ...................................................................................92.5 Source Reduction of Plastics, Aluminum and Glass ........................................................................11
3. Beverage Containers: The Challenge ................................................................................. 153.1 A Brief History of Beverage Containers, Materials and Types ..........................................................163.2 Sales Growth of Beverages ...........................................................................................................183.3 Recycling Rates for all Beverage Containers ..................................................................................193.4 Industry Engagement ...................................................................................................................193.5 Beverage Industry Overview .........................................................................................................213.6 Zero Waste ...................................................................................................................................24
4. Recommendations for the Beverage Industry ................................................................... 255. References ......................................................................................................................... 26
Appendix 1: Beverage Container Environmental Survey .......................................................................28Appendix 2: Grading Criteria ..............................................................................................................32Appendix 3: Comparison of Weights of Beverage Containers for Major Brands ....................................34Appendix 4: Types of Plastic ...............................................................................................................35
List of Figures: Figure 1: Components of U.S. Municipal Solid Waste in 2003 by Product ...............................................4Figure 2: U.S. Beverage Container Recycling Rates, 1990-2005 ...........................................................18Figure 3: Carbonated Soft Drink Sales in PET bottles 1992 - 2004 .......................................................20Figure 4: PET Bottled Water Sales in the U.S. (billions of units) .............................................................20Figure 5: Beverage Container Redemption Rates in Selected Deposit States vs. the U.S. Average ..........21
List of Tables:Table 1: Overall U.S. Ranking for Beverage Companies ..........................................................................7Table 2: Evaluation of Recycled Content in U.S. Beverage Containers .....................................................8Table 3: Evaluation of Beverage Container Recovery and Recycling in the U.S. .......................................9Table 4: Evaluation of U.S. Source Reduction Related Issues ................................................................11Table 5: Beverage Container Sales 1973-2003 (in billions) ..................................................................20Table 6: Top 10 Carbonated Soft Drink (CSD) Companies, 2005 ..........................................................22Table 7: Top 10 Brands in the Carbonated Soft Drink Industry, 2005 ....................................................22Table 8: Top 10 PET Bottled Water Brands ..........................................................................................23Table 9: Major Beer Companies’ Market Shares and Volumes in 04-05 ................................................23Table 10: Top 10 Beers of 2005 ..........................................................................................................24

U.S. Beverage Container Recycling Scorecard and Report
1
Executive Summary
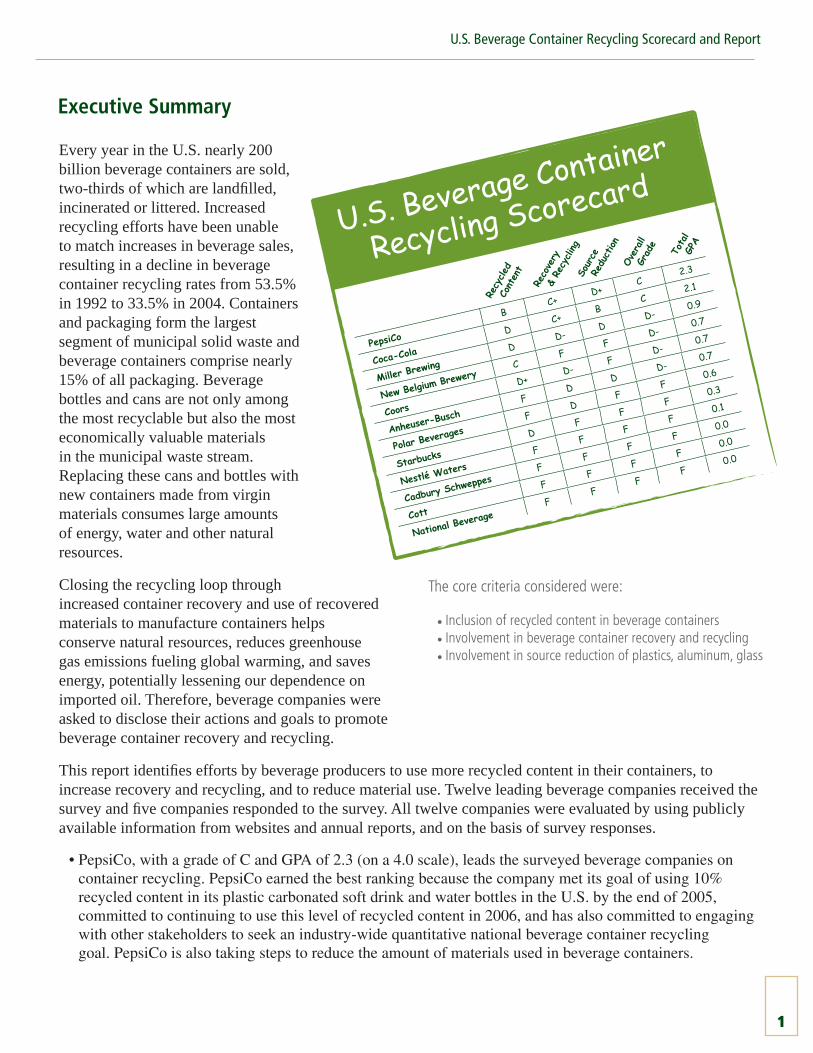
Every year in the U.S. nearly 200 billion beverage containers are sold, two-thirds of which are landfi lled, incinerated or littered. Increased recycling efforts have been unable to match increases in beverage sales, resulting in a decline in beverage container recycling rates from 53.5% in 1992 to 33.5% in 2004. Containers and packaging form the largest segment of municipal solid waste and beverage containers comprise nearly 15% of all packaging. Beverage bottles and cans are not only among the most recyclable but also the most economically valuable materials in the municipal waste stream. Replacing these cans and bottles with new containers made from virgin materials consumes large amounts of energy, water and other natural resources.
Closing the recycling loop through increased container recovery and use of recovered materials to manufacture containers helps conserve natural resources, reduces greenhouse gas emissions fueling global warming, and saves energy, potentially lessening our dependence on imported oil. Therefore, beverage companies were asked to disclose their actions and goals to promote beverage container recovery and recycling.
This report identifi es efforts by beverage producers to use more recycled content in their containers, to increase recovery and recycling, and to reduce material use. Twelve leading beverage companies received the survey and fi ve companies responded to the survey. All twelve companies were evaluated by using publicly available information from websites and annual reports, and on the basis of survey responses.
PepsiCo, with a grade of C and GPA of 2.3 (on a 4.0 scale), leads the surveyed beverage companies on container recycling. PepsiCo earned the best ranking because the company met its goal of using 10% recycled content in its plastic carbonated soft drink and water bottles in the U.S. by the end of 2005, committed to continuing to use this level of recycled content in 2006, and has also committed to engaging with other stakeholders to seek an industry-wide quantitative national beverage container recycling goal. PepsiCo is also taking steps to reduce the amount of materials used in beverage containers.
•
The core criteria considered were:
• Inclusion of recycled content in beverage containers• Involvement in beverage container recovery and recycling• Involvement in source reduction of plastics, aluminum, glass
Waste and Opportunity
2
The Coca-Cola Company (hereafter Coca-Cola) earned a C with a GPA of 2.1. It is on par with PepsiCo on most recycling issues, except that it has not committed to continue using 10% recycled content in its PET plastic bottles in North America in 2006. Coca-Cola scores best in reducing use of packaging and material in beverage containers. It has also committed to work toward an industry-wide quantitative national beverage container recycling goal with other stakeholders.
Miller comes in third with a GPA of 0.9 and a grade of D-, followed by New Belgium Brewery, Coors and Anheuser Busch all scoring 0.7 (D-). Miller, New Belgium and Coors use some amount of recycled content in their beverage containers. Miller and Anheuser-Busch provide information on source reduction. Anheuser-Busch participates in clean-up activities at large concert and sports venues.
Polar Beverages, Starbucks and Nestlé Waters obtain an F with scores respectively of 0.6, 0.3 and 0.1. Polar Beverages uses some refi llable containers while Starbucks uses 10% post consumer recycled paper in their hot beverage cups. Cadbury Schweppes, Cott and National Beverage did not reply to the survey and did not have any information pertaining to the issues covered by the survey on their websites or annual reports.
Conclusions: While there has been some progress by beverage companies on recycled content (PepsiCo, Coca-Cola and New Belgium Brewery), increased source reduction (Coca-Cola and PepsiCo) and improved recyclability, there has been virtually no action taken to signifi cantly increase beverage container recovery. Much more can still be done to incorporate higher levels of recycled content in beverage containers. Considerable strides have been made in reducing the weight of materials used in containers but some improvement in source reduction can still be made. Coca-Cola and PepsiCo have shown some leadership in their use of recycled content and recent commitments to work with their competitors to establish beverage container recovery goals. An industry coalition called Beverage Packaging Environmental Council (BPEC) with Coca-Cola, PepsiCo, Nestlé Waters, Coors, Miller and Anheuser Busch as members, is committed to increasing recycling but most members did not return the survey. All beverage companies need to strive to match and exceed the standards set by Coca-Cola and PepsiCo in order to increase recycling rates, increase demand for recovered containers and to reduce consumption and pollution of natural resources. In order to increase recycled content, and recycling rates, all beverage companies should:
1. Commit to using the highest possible levels of post consumer recycled content in beverage containers; 2. Commit to a measurable, sustainable national recovery goal for beverage containers; 3. Support public policies that increase recycling of beverage containers; 4. Commit to source reduction and improved recyclability of beverage containers; and 5. Publicly report on their progress each year.
•
•
•

U.S. Beverage Container Recycling Scorecard and Report
3
1| Why Recycle and Use Recycled Content?
American consumers purchase over 500 million beverage bottles and cans, on average, every day. Only about one in three are recycled while two out of three beverage containers sold are landfi lled, incinerated or littered. Each year we are producing more beverages and recycling a smaller portion of the containers. According to the Container Recycling Institute (CRI), beverage sales have increased over fi ve-fold in the last 30 years while U.S. container recycling rates have declined from 53.5% in 1992 to 33.5% in 2004.
In 20031, containers and packaging, at 32%, comprised the largest segment of U.S. municipal solid waste2, and beverage containers made up approximately 15% of all packaging and nearly 5% by weight of total waste (estimated from EPA data, 2005; see Figure 1). Beverage bottles and cans are not only a large portion of packaging, but are also some of the most easily recycled and most economically valuable materials in our waste stream. Replacing these cans and bottles with new containers made from virgin materials consumes substantive amounts of energy, water and other natural resources, creates greenhouse gas emissions fueling global warming and other pollutants and increases dependence on foreign oil. In a study of energy and emissions profi le of the materials in the 1997 U.S. municipal waste, Valiente (2000) estimated that aluminum cans contributed 14% of emissions embodied in a ton of divertible waste that was landfi lled, even though they comprised only 1.4% of the entire waste stream by weight. Using recovered materials in container manufacture, especially post consumer materials, saves energy, water, and natural resources, and reduces waste and global warming pollution.
On recycled content, a few encouraging steps have been taken, but much more could be done. Coca-Cola3 and Pepsi both announced plans on the same day in December 1990 to introduce plastic soda bottles made with 25% recycled plastic. That commitment was never realized, and a campaign was launched in the mid-1990s by environmental groups, to urge the major soft drink companies to increase their overall recycling commitments. In 2000, socially concerned shareholders began to petition the companies to incorporate recycled content into beverage containers and to set goals for container recovery. In 2001, partly as a result of activist pressure and shareholder dialogue, Coca-Cola and Pepsi pledged to incorporate 10% recycled content in their plastic beverage containers by the end of 2005, and both companies achieved that goal.
Until recently, beverage companies have been generally unwilling to work together to set container recovery goals or to determine how to increase container recycling as an industry. Most beverage companies oppose the proven legislative solution of mandatory container deposit programs (or “bottle bills”) but have failed to provide signifi cant and sustainable alternatives for keeping tens of billions of beverage containers each year out of landfi lls and incinerators.
1 Latest year for which EPA data has been made available. 2 Household trash or garbage that is commonly thrown away amounted to 236.2 million tons.3 For the purpose of this report, Coca-Cola refers to the Coca-Cola Co. and the brand Coca-Cola and not all Coca-Cola entities. Similarly, Pepsi refers to Pepsi-Cola North America or the brand Pepsi and not any other entity of a similar name.

Waste and Opportunity
4
Figure 1: Components of U.S. Municipal Solid Waste in 2003 by product
Total Weight = 236.2 million tonsSource: U.S. Environmental Protection Agency, 2005
1.1 Greenhouse Gas Emissions and Energy Savings
Using calculations based on the U.S. Environmental Protection Agency’s (EPA’s) WAste Reduction Model (WARM)4, an estimated 3 million metric tons of carbon equivalent (MTCE) of greenhouse gas emissions are being avoided annually at the current (2004) rate of overall beverage container recycling (about 33.5%).5 If the current level of beverage container sales were to remain constant (nearly 200 billion units sold per year) but the overall recycling rate were to reach 80%, then approximately an additional 3 million tons of greenhouse gas emissions (double current avoided emissions) would be avoided. These additional avoided emissions are equivalent to taking nearly 2.4 million cars off the road for one year.
If all beverage companies had utilized 10% post consumer recycled content in their plastic soft drink and water bottles in 2004, they would have saved the energy equivalent of almost 1.6 million barrels of crude oil or 72 million gallons of gasoline. This would have been enough to electrify over 270,000 U.S. homes for one year.6 If the percentage of recycled content were 25% (in 2004) for all beverage companies across all their plastic bottles, they would have saved the energy equivalent of nearly 4 million barrels of crude oil, enough to supply electricity to more than 680,000 U.S. homes for a year.
4 Information at http://yosemite.epa.gov/oar/globalwarming.nsf/content/ActionsWasteWARM.html5 Generation, recycling and landfi lled data used in the model is 2003 data obtained from EPA (EPA, 2005).6 Using resin weight numbers from American Plastics Council for 2004.
If the recycling rate
were to reach 80%
at the current level of
beverage container
sales, nearly 3 million
tons of greenhouse
gas emissions would
be avoided. This is
equivalent to taking
nearly 2.4 million
cars off the road for
a full year.

U.S. Beverage Container Recycling Scorecard and Report
5
2| Beverage Container Recycling Score Card
This survey was developed as a tool by which investors and other stakeholders can measure and compare the steps taken by individual companies to reduce beverage container packaging and increase container recycling. Beverage companies were evaluated on three core criteria in this survey, including:
Commitment and actions to include recycled content in their beverage containers;
Commitment, actions taken, and policies supported to improve beverage container recovery and recycling; and,
Commitment and actions taken to reduce amount of packaging material (“source reduction”).
Increasing recycling rates requires a multi-pronged approach. Efforts by all beverage companies on just one of these approaches are unlikely to result in a signifi cant improvement in the environmental impact of beverage container packaging. Individual beverage producers can reduce the environmental impact of their containers by using signifi cantly greater amounts of post consumer recycled content, supporting legislative policies that increase beverage container recovery and recycling or developing their own national goals and programs to increase recycling, and reducing the quantity of virgin material used in manufacturing new containers. Moreover, transparency and making their commitments, goals, policies, and actions public is crucial so that companies can be held accountable, and their progress in reducing their environmental footprint can be compared to that of their peers.
Twelve beverage companies received the survey, of which fi ve responded, including the two largest beverage producers, Coca-Cola and Pepsi. Polar Beverages, Starbucks, and New Belgium Brewery were the other respondents.
The top fi ve leading carbonated soft drinks manufacturers, the top three bottled water producers, and the top three beer companies were evaluated based on their responses to the survey, and on information reported on their websites and in publicly available materials such as annual reports. Thus, the score card evaluates over 95% of the carbonated soft drink market, over 60% of the bottled water market and over 70% of the beer industry.
The three major beer companies Anheuser-Busch, Miller and Coors declined to complete the survey, citing company policies. Despite repeated calls and attempts at communication, no replies were received from the other beverage producers.
Nestlé Waters, Coors, Anheuser-Busch and Miller did not return the survey, despite their membership in the Beverage Packaging Environment Council (BPEC), a coalition of beverage manufacturers with a mission to advance responsible waste management practices for beverage containers through a stated commitment of “engagement with the recycling community.”
2.1 Grading Methodology of Beverage Companies
Seven indicators were used to evaluate and grade each beverage company in three core areas:
• Use of recycled content in beverage containers • Beverage container recovery and recycling • Source reduction of packaging material
•
•
•

Waste and Opportunity
6
Each beverage company was evaluated on these indicators based on the information provided through the survey and their public websites and reports. The data were compiled and used to determine grades and GPAs, based on a 4.0 scale, for the beverage companies under consideration. Appendix 2 contains a detailed explanation of the grading criteria.
For the purpose of this report, only information provided about efforts in the U.S. has been taken into account. International goals and actions have been drawn on for comparisons in the narrative portion of the report, but were not considered in the grading. Further, only information related to the core criteria mentioned above was considered in this scorecard, even though a company may have taken commendable steps in other environmental areas such as renewable energy (New Belgium Brewery) or following the Global Reporting Initiative reporting format (Pepsi, Anheuser-Busch).
The three core criteria measured and the seven indicators used were as follows:
Recycled Content:
1. Adoption of goals on use of recycled content 2. Use of recycled content in containers
Recovery and Recycling:
3. Support of industry-wide container recovery and recovery goals 4. Direct involvement in voluntary schemes to increase beverage container recycling 5. Support for public policies that increase recovery and recycling rates
Source Reduction:
6. Adoption of goals to reduce the use of materials in container production 7. Disclosure of information and steps taken for source reduction
The scores of each company for the three main criteria were tallied to obtain a fi nal ranking. The three sections were weighted accordingly:
30% - Use of recycled content in beverage containers 40% - Beverage container recovery and recycling 30% - Source reduction
Use of recycled content and source reduction of materials used in production of beverage containers are important positive steps toward resource conservation, but the biggest factor in increasing recycling rates is attributable to efforts in improved beverage container recovery and recycling. As a result, in this scorecard, beverage container recovery and recycling is given a greater weight than the other sections.
The GPA used in this scorecard was calculated on a 4 point scale where a 4 signifi es best efforts and a 0 signifi es an absence of effort.

U.S. Beverage Container Recycling Scorecard and Report
7
2.2 Overall Ranking
Table 1: Overall U.S. Ranking for Beverage Companies
CompanyRecycled Content
Beverage Container Recycling
Source Reduction
TotalGPA
Grade
PepsiCo* 3.00 2.33 1.50 2.28 C
Coca-Cola* 1.00 2.33 3.00 2.13 C
Miller Brewing Company 1.00 0.67 1.00 0.87 D-
New Belgium Brewery* 2.00 0.33 0.00 0.73 D-
Coors 1.50 0.67 0.00 0.72 D-
Anheuser-Busch 0.00 1.00 1.00 0.70 D-
Polar Beverages* 0.00 1.00 0.50 0.55 F
Starbucks* 1.00 0.00 0.00 0.30 F
Nestlé Waters 0.00 0.33 0.00 0.13 F
Cadbury Schweppes 0.00 0.00 0.00 0.00 F
Cott 0.00 0.00 0.00 0.00 F
National Beverage 0.00 0.00 0.00 0.00 F
*Companies that responded to the survey. Note: Factor weights were 30% for recycled content, 40% for beverage container recycling and 30% for source reduction.
Pepsi with a grade of C and GPA of 2.3, is leading the surveyed beverage companies in recycling and reduction efforts, while Coca-Cola is second, with a grade of C and GPA of 2.1. All other companies scored below 1.0 with grades of D- or lower. Pepsi obtained a top ranking in this survey because it met its goal of using 10% recycled content in its carbonated soft drink and water PET bottles in the U.S. by the end of 2005 and has committed to continuing to use this level of recycled content in 2006. Pepsi has also committed to engagement with other stakeholders to seek quantitative and national goals that encourage the most effective means for increasing container recovery and recycling.
Coca-Cola with a C is on par with Pepsi on most issues, except that it has not committed to continue using 10% recycled PET in its plastic bottles in North America in 2006. It achieves the highest rank in source reduction goals and actions. Miller Brewing, Anheuser-Busch, Coors and New Belgium Brewery all scored a D-. Miller, Coors and Anheuser-Busch did not did not return the survey. They have been graded on the basis of information that was made publicly available on their websites. Polar Beverages, Starbucks and Nestlé Waters all earn an F as they provided little information on steps they might be taking in recycling and source reduction activities. Cadbury Schweppes, Cott and National Beverage all get a zero score and a grade of F, as they do not provide any information about their efforts in areas considered in the core criteria.
Waste and Opportunity
8
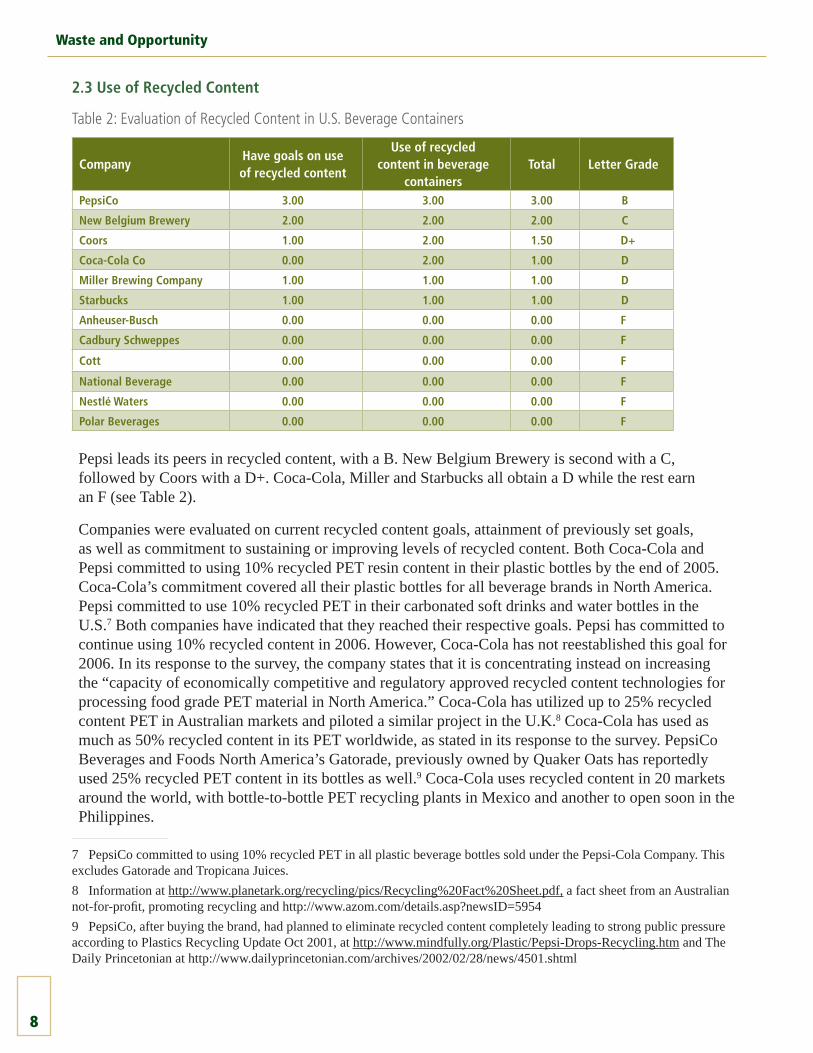
2.3 Use of Recycled Content
Table 2: Evaluation of Recycled Content in U.S. Beverage Containers
CompanyHave goals on use of recycled content
Use of recycled content in beverage
containersTotal Letter Grade
PepsiCo 3.00 3.00 3.00 B
New Belgium Brewery 2.00 2.00 2.00 C
Coors 1.00 2.00 1.50 D+
Coca-Cola Co 0.00 2.00 1.00 D
Miller Brewing Company 1.00 1.00 1.00 D
Starbucks 1.00 1.00 1.00 D
Anheuser-Busch 0.00 0.00 0.00 F
Cadbury Schweppes 0.00 0.00 0.00 F
Cott 0.00 0.00 0.00 F
National Beverage 0.00 0.00 0.00 F
Nestlé Waters 0.00 0.00 0.00 F
Polar Beverages 0.00 0.00 0.00 F
Pepsi leads its peers in recycled content, with a B. New Belgium Brewery is second with a C,followed by Coors with a D+. Coca-Cola, Miller and Starbucks all obtain a D while the rest earn an F (see Table 2).
Companies were evaluated on current recycled content goals, attainment of previously set goals, as well as commitment to sustaining or improving levels of recycled content. Both Coca-Cola and Pepsi committed to using 10% recycled PET resin content in their plastic bottles by the end of 2005. Coca-Cola’s commitment covered all their plastic bottles for all beverage brands in North America. Pepsi committed to use 10% recycled PET in their carbonated soft drinks and water bottles in the U.S.7 Both companies have indicated that they reached their respective goals. Pepsi has committed to continue using 10% recycled content in 2006. However, Coca-Cola has not reestablished this goal for 2006. In its response to the survey, the company states that it is concentrating instead on increasing the “capacity of economically competitive and regulatory approved recycled content technologies for processing food grade PET material in North America.” Coca-Cola has utilized up to 25% recycled content PET in Australian markets and piloted a similar project in the U.K.8 Coca-Cola has used as much as 50% recycled content in its PET worldwide, as stated in its response to the survey. PepsiCo Beverages and Foods North America’s Gatorade, previously owned by Quaker Oats has reportedly used 25% recycled PET content in its bottles as well.9 Coca-Cola uses recycled content in 20 markets around the world, with bottle-to-bottle PET recycling plants in Mexico and another to open soon in the Philippines.
7 PepsiCo committed to using 10% recycled PET in all plastic beverage bottles sold under the Pepsi-Cola Company. This excludes Gatorade and Tropicana Juices. 8 Information at http://www.planetark.org/recycling/pics/Recycling%20Fact%20Sheet.pdf, a fact sheet from an Australian not-for-profi t, promoting recycling and http://www.azom.com/details.asp?newsID=59549 PepsiCo, after buying the brand, had planned to eliminate recycled content completely leading to strong public pressure according to Plastics Recycling Update Oct 2001, at http://www.mindfully.org/Plastic/Pepsi-Drops-Recycling.htm and The Daily Princetonian at http://www.dailyprincetonian.com/archives/2002/02/28/news/4501.shtml

U.S. Beverage Container Recycling Scorecard and Report
9
New Belgium Brewery stated its commitment to use “as much recycled content as it can” in glass bottles. However the company did not provide a quantitative goal, and stated that it had a diffi cult time fi nding enough recycled glass for its needs. Coors states on its website that it is using 42% recycled content in its aluminum cans and 30% in glass bottles. Miller Brewing Company states it is committed to purchasing glass with up to 50% recycled content, but provides no details on use of recycled aluminum. Starbucks has a goal of incorporating 10% post consumer waste paper in its hot paper cups in stores and began implementing this in 2006. However, it does not use any recycled content in its Ethos brand PET water bottles. Both Cadbury Schweppes and Nestlé Waters report on their websites that they will soon begin to incorporate recycled content into their PET bottles, but do not provide implementation dates or goals.
2.4 Beverage Container Recovery and Recycling
Table 3: Evaluation of Beverage Container Recovery and Recycling in the U.S.
Company
Support for industry-wide container recovery and
recycling goals
Direct involvement in voluntary schemes to
increase beveragecontainer recycling
Support for public policy that
will increase recovery and
recycling rates
TotalLetter Grade
Coca-Cola Co 3.00 2.00 2.00 2.33 C+
PepsiCo 3.00 2.00 2.00 2.33 C+
Anheuser-Busch 1.00 2.00 0.00 1.00 D
Polar Beverages 1.00 1.00 1.00 1.00 D
Coors 1.00 1.00 0.00 0.67 D-
Miller Brewing Co. 1.00 1.00 0.00 0.67 D-
Nestlé Waters 1.00 0.00 0.00 0.33 F
New Belgium Brewery 0.00 1.00 0.00 0.33 F
Cadbury Schweppes 0.00 0.00 0.00 0.00 F
Cott 0.00 0.00 0.00 0.00 F
National Beverage 0.00 0.00 0.00 0.00 F
Starbucks 0.00 0.00 0.00 0.00 F
Pepsi and Coca-Cola lead their peers in beverage container recovery and recycling section with a C+, followed by Anheuser-Busch and Polar, both with a D. Coors and Miller, each with a D-, are next. All other companies received an F.
In early 2006, in response to shareholder proposals fi led by As You Sow and Walden Asset Management, both Coca-Cola and Pepsi committed to working toward setting a quantitative, national industry goal for beverage container recycling. Coca-Cola provided this statement in February 2006: “The Coca-Cola Co. confi rms our commitment to work with stakeholders and devote resources to increase recycling of beverage containers. We agree to communicate the results of our efforts to advance sustainable recovery systems for beverage packaging on an annual basis and will collaborate with others to seek quantitative and national goals that encourage the most effective means for increasing recycling.” Pepsi similarly will work with other beverage companies to set an industry-wide container recycling goal. Pepsi has an environmental policy on their website, which states, “We will work with our licensed bottlers, suppliers and customers to reduce the environmental impacts of
Waste and Opportunity
10
our products throughout their life cycle.” Similarly, Coca-Cola on its website commits to “engagement programs with bottling partners, business partners and external stakeholders.”
A group of beverage manufacturers, including Coca-Cola, Pepsi, Nestlé Waters, Anheuser-Busch, Miller Brewing, Coors and Heineken comprise the Beverage Packaging Environment Council, working under the auspices of the National Recycling Coalition to promote responsible waste management practices for beverage containers. Polar Beverages says it also supports an industry-wide container recycling goal.
Polar Beverages states that it supports and participates in voluntary programs such as special events at stadiums and sporting events, campus take-back programs and so on. Both Coca-Cola and Pepsi note their participation in industry initiatives such as the American Beverage Association’s “Recycle it Now!,” a pilot program in four cities and Ohio, that resulted in an estimated 20% increase in containers collected, as reported by Coca-Cola. Materials and campaign kits are available for use by other communities across the country. Coca-Cola and PepsiCo have also sponsored various community partnerships. Coors reports that it supports a recycling drop-off center and participates in the America Recycles Day. Anheuser-Busch states it helps event organizers provide a litter free environment at concerts, festivals and sporting events, such as the 2002 Olympics in Salt Lake City, 2004 Bud Bowl in Houston, and Bonnaroo Music Festival in Tennessee, among others. According to its website, the Anheuser Busch Recycling Corporation, an Anheuser Busch Company recycles 125% of the cans that Anheuser Busch breweries produce in a year. Miller mentions winning a “Recycler of the Year” award in Irwindale, California but does not provide details. New Belgium Brewery says it supports a Brown Bottle Recycling Program that recycles 500-800 pounds of glass from bars and restaurants per week.
In response to the survey, both Coca-Cola and PepsiCo state that they support a litter tax10 and curbside recycling. Polar Beverages also states that it supports curbside recycling. None of the companies that responded to the survey support container deposit programs.
Advocates of container deposit laws (also known as “bottle bills”)11 maintain that current publicly funded curbside recycling systems are not suffi cient to manage increasing amounts of container waste being generated both because an increasing number (currently one third or more) of beverage containers sold are consumed away from home, and because nearly one-half of the U.S. population does not have access to curbside recycling. Container deposit programs have resulted in recycling rates of 70% and above in the 11 states with “bottle bills.” In addition to the higher recycling rates achieved by bottle bills and the resultant energy and resource savings, advocates also highlight other benefi ts such as litter reduction and providing a guaranteed supply of high quality recyclables to recycling businesses. These laws also shift the costs of recycling from taxpayers and local governments to
10 A tax on manufacturers, as well as wholesalers and retailers of certain products, which contribute to the litter problem, including soft drink and beer manufacturers. The tax revenue usually funds litter control of public places, and for public education and awareness programs relating to litter control and recycling.11 Bottle bill or container deposit law requires a minimum refundable deposit on beer, soft drink and other beverage containers providing an incentive to consumers to return bottles for recycling or reuse. Eleven U.S. states and nine Canadian provinces have container deposit legislation. No state deposit law has ever been repealed. In fact, several states and provinces have expanded their laws to cover new beverages such as juice and sports drinks, teas and bottled water.

U.S. Beverage Container Recycling Scorecard and Report
11
producers and consumers, a policy that employs Extended Producer Responsibility (EPR).12
Coca-Cola is the only beverage company studied that has a section on its website discussing the soft-drink industry’s efforts to discourage container deposit legislation. It contends that the deposit/refund system leads to high operating costs, increased labor and investments in capital equipment, and runs counter to established community programs such as curbside recycling. It is important to note here that curbside recycling programs are publicly funded programs while deposit refund systems are funded by producers and consumers of the beverages. Coca-Cola says it does not “support policies that single out beverage containers from other packaging through taxes or legislative mandates, which typically distort the market and undermine the economics of effective multi-material collection systems.”
2.5 Source Reduction of Plastics, Aluminum and Glass
Table 4: Evaluation of U.S. Source Reduction Related Issues
CompanyHave source
reduction goalsDisclosure of information on, and
impact of source reductionTotal
Letter Grade
Coca-Cola Co. 3.00 3.00 3.00 B
PepsiCo 1.00 2.00 1.50 D+
Anheuser-Busch 1.00 1.00 1.00 D
Miller Brewing Co. 1.00 1.00 1.00 D
Polar Beverages 0.00 1.00 0.50 F
Cadbury Schweppes 0.00 0.00 0.00 F
Coors 0.00 0.00 0.00 F
Cott 0.00 0.00 0.00 F
National Beverage 0.00 0.00 0.00 F
Nestlé Waters 0.00 0.00 0.00 F
New Belgium Brewery 0.00 0.00 0.00 F
Starbucks 0.00 0.00 0.00 F
Coca-Cola leads its peers in source reduction activities with a B. Pepsi earns a D+, with Anheuser-Busch and Miller following with a D each. All other companies receive an F.
Companies were evaluated on their source reduction goals, and disclosure of information and the impact of their efforts.
All companies that responded to the survey stated that they have source reduction goals but Coca-Cola was the only respondent to disclose clear measurable goals for 2006, and details of actions taken in 2005.
Polar Beverages, Starbucks and New Belgium Brewery all stated that they had source reduction goals but did not disclose them. Without public disclosure of source reduction goals and accompanying
12 EPR is defi ned by Thomas Lindhqvist, a Swedish environmental economist who fi rst coined the term, as “… making the manufacturer of the product responsible for the entire life-cycle of the product and especially for the take-back, recycling and fi nal disposal…” EPR has been effectively adopted by some computer companies that have established electronic waste take-back programs to prevent obsolete computers from ending up in landfi lls or being exported to underdeveloped countries for disposal. Economic instruments such as container deposits or refund systems are policy instruments used by governments to encourage producer responsibility.

Waste and Opportunity
12
measures showing progress to meet the goals, stakeholders, especially investors, have no way to gauge progress by companies. Over the last few years, most beverage companies say they have reduced the volume and weight of packaging material and light weighted containers.
Miller Brewing Company states on its website13 that it has eliminated 50% of the aluminum in its cans, saving 50,000 tons of aluminum per year, and also reduced the amount of glass in its bottles, saving over 100,000 tons of glass per year. It does not disclose further information on when these changes were implemented. According to CRI, over the last 30 years, aluminum cans on average have become lighter by over 35%. It is not evident whether Miller is taking this into account when reporting its numbers. Anheuser-Busch maintains that it has saved over 12 million pounds of aluminum through light-weighting efforts including lid reduction in 2005. Anheuser-Busch does not provide details about glass usage.
Nestlé Waters provides information on its move in 1992 away from PolyVinyl Chloride (PVC) bottles and the resulting reduction in bottle weight as an effort toward source reduction. No information on efforts thereafter is provided. The recycling rate for PVC bottles is less than 1% in the U.S. and several health issues have been raised about its use.14
Cadbury Schweppes mentions in its 2004 Corporate Social Responsibility report (Pg. 11.12) that the “weight of many soft drink cans, PET plastic and glass bottles has been signifi cantly reduced over the past decade” but does not provide any details.
Coca-Cola provided a sampling of its source reduction goals for 2006 as well as actions taken in 2005. In 2005, the company reported it reduced overall PET use by 2% by changing the shape and weight of its various bottles. It states it has reduced the weight of its glass bottles and thus glass use by 25% in 2005.
13 Information at http://www.millerbrewing.com/aboutMiller/aboutEnvironment/wasterecycle.asp)14 Concerns have been raised about use of PVC because its manufacturing process reportedly leads to creation of dioxin, ethylene dichloride and vinyl chloride and can cause severe health problems including cancer, endocrine disruptions, endometriosis and neurological damage. PVC, during its use and disposal in landfi lls or incineration, causes human exposure to phthalates, lead, cadmium, dioxins and other toxins, leading to ground water contamination among other issues (Center for Health Environment and Justice, and Environmental Health Strategy Center, 2004).
How do different containers measure up?In order to evaluate source reduction efforts employed by various beverage companies, an informal weight check on some popular beverages was carried out. All empty containers were washed and dried and then weighed along with their caps. The results are listed in Appendix 3. Pepsi’s plastic PET soda bottle weighed at least 1 gram less than a similarly sized Coca-Cola soda bottle. Sprite, the other Coca-Cola drink tested, was approximately 0.7 grams heavier than 7Up, its counterpart from Cadbury Schweppes. Coca-Cola’s Dasani bottle was nearly 4 grams heavier than Pepsi’s Aquafi na bottle.
On the other hand, the Coca-Cola Classic and Diet brand aluminum cans were lighter than Pepsi’s cans by approximately 0.3 grams. Among the beer cans, Anheuser-Busch’s Budweiser brand had the lightest weight as compared to Coors and Miller brands, a difference of approximately 0.6 grams at most. Crystal Geyser has the lightest plastic bottles at 17.5 grams for a 17 fl uid ounce bottle, roughly a gram an ounce.
Given that annual U.S. sales of packaged beverages is nearly 200 billion containers, a reduction of 1 gram in the weight of each single container can amount to savings of approximately 220,000 tons of material a year. This source reduction would amount to green house gas emissions avoidance equivalent to taking nearly 250,000 cars off the road for a whole year (Based on the EPA’s WARM Model- http://yosemite.epa.gov/oar/globalwarming.nsf/content/ActionsWasteWARM.html).
U.S. Beverage Container Recycling Scorecard and Report
13
For 2006, its goals include reducing the weight of the 20 ounce PET water bottle by 3.5 grams, and that of the carbonated soft drink bottle of the same size by 2 grams through redesign. Coca-Cola says it has reduced the weight of the 20-ounce PET bottle by 5% since 1993.
Pepsi too states that its goal is to reduce the amount of material used in its containers. It says that it reduced the amount of resin in plastic bottles by 10% since 1994. It reportedly uses 60% less packaging now than in 1990 to deliver the same amount of soft drinks, without specifying if the reduction in packaging use is because of switching from heavier glass bottles to lighter PET bottles or other practices. It did not disclose any specifi c goals for the future.
Coca- Cola states that refi llable plastic and glass bottles comprise 22% of its total sales globally, but less than 1% in the U.S.15 Polar Beverages disclosed that 5% of its sales in the U.S. are in refi llable bottles but the company does not specify if these are glass or PET containers. From Cadbury’s annual report it appears that it introduced refi llable plastic bottles in Germany, its largest European market, even before legislation made it mandatory, but does not offer this option in the U.S.
Another factor to consider is recyclability of materials used. Certain materials, colors especially dark tints and other additives, can negatively impact recyclability of materials and their use should be curtailed. For example, the original design of Coca-Cola’s Dasani required a dark blue bottle that could have led to contamination of the PET recycling stream. Coca-Cola’s design team worked with recyclers to arrive at the color presently in use that no longer presents a risk of contamination.
15 In September 2005, a Coca-Cola bottler in Costa Rica announced it was switching from refi llable glass bottles to PET bottles, reportedly to the alarm of local residents, environmentalists, and local businesses, who started a protest and boycott of Coca-Cola products (Tico Times Online, 2005).

Waste and Opportunity
14

U.S. Beverage Container Recycling Scorecard and Report
15
3| Beverage Containers: The Challenge
Recycling beverage containers provides a formidable challenge not just in the U.S. but worldwide, and several jurisdictions have responded with legislative actions. In 1994, for instance, the European Union passed the Packaging and Packaging Waste Directive dictating that all member nations had an obligation to recycle a proportion of their packaging waste and allowing each member state to determine its own legislation for complying with this directive. This directive requires member states to establish systems in order to achieve a minimum 60% recycling rate (by weight) by 2008.16 However, different European states have adopted different legislative approaches and some have been more effective than others. In the U.K., the government passed the Producer Responsibility (Packaging Waste) Regulations to meet the aims of the directive.17 Under these regulations, companies must invest in recycling a certain obligation, determined by a company’s share in the total packaging, though not necessarily recycle their own packaging.
Aluminum cans and plastic beverage bottle recycling rates in Sweden, which requires refundable deposits on beverage containers, are over 85% and 80% respectively.18 Finland, Norway and South Australia also have container deposit laws. Since 2003, Germany has required a refundable deposit on non-refi llable beer, water and carbonated soft drink containers. Denmark has had similar legislation in place since 2002 (Europen, 2000). Certain countries have mandated use of refi llables such as Germany that requires that the market share of refi llables not fall below 72%. In Sweden breweries and bottlers agreed to make most 33 centiliters (cl) refi llable bottles a standard size and shape, so that no additional sorting by brand would be required.
In 1991, a non-profi t in Germany started the Green Dot trademark; a system where packaging manufacturers, bottlers and distributors can pay a license fee to acquire the use of the “Green Dot” on packages. This trademarked sign identifi es companies that make a fi nancial contribution toward recycling of their packages, but absolves them of doing it themselves. Today 26 countries, including Canada, use the Green Dot to fi nance their packaging waste collection systems and reprocessing facilities, though programs and license fees might vary according to the legislative system in place in the countries.19
With the growth of single-use (throwaway) beverage cans and bottles in the 1970s, mandatory deposits on these containers were imposed by legislators in several U.S. states and Canadian provinces. Currently eleven U.S. states and nine Canadian provinces have container deposit laws.
At the other end of the spectrum, a pilot program called RecycleBank in Philadelphia provides incentives to consumers to increase curbside recycling. Based on the weight of trash that people put out, they are provided coupons and discounts with community stores/restaurants. Programs like these put the onus of recycling on consumers, and municipalities rather than beverage producers.
In the following sections a brief history of the beverage industry and beverage container recycling in North America is discussed.
16 Information about directive at http://europa.eu/scadplus/leg/en/lvb/l21207.htm17 Information at https://www.valpak.co.uk/nav/page1022.aspx18 Information at http://www.container-recycling.org/allrate/se-alumPET.htm19 Information at http://www.gruener-punkt.de/en/dsd-gmbh/the-company/portrait.html and http://www.greendot.ca/background/greendot_history.htm

Waste and Opportunity
16
3.1 A Brief History of Beverage Containers, Materials and Types
Glass Bottles: Glass bottles have been used to package wine and liquor for centuries. Coca-Cola fi rst packaged its product in refi llable glass bottles in 1894. In the 1940s one-way, non- returnable glass bottles and metal cans were introduced. By 1980 refi llable glass bottles had declined to 12% of the beer market and 31% of the soft drink market, and today they make up less than 2% of the beverage market (Beer Institute and American Beverage Association).20 One-way glass bottles have lost market share to plastic bottles, which are lighter and unbreakable.
Glass, a silica based compound, can be recycled virtually indefi nitely as the recycling process does not cause any deterioration in its molecular structure. Recycled glass is used for making new bottles, as well as kitchen tiles, counter tops, and even as a road fi lling material. There are economic and environmental benefi ts to using crushed recovered glass (cullet) as compared to virgin materials for making new bottles, such as reduction in the use of energy and of greenhouse gas emissions of carbon dioxide and conserving natural resources (Glass Packaging Institute).21
After reaching a recycling rate of 31.2% in 1992 the glass beverage container22 recycling rate dropped steadily to 20.2% in 2003 (EPA 2005, CRI 2006, Figure 2). Contamination from commingled curbside recycling and single-stream recycling23 has reduced the quality and quantity of recovered glass or cullet available to glass manufacturers, who benefi t economically from using cullet.
Aluminum Cans: Aluminum cans were introduced by Coors Brewing Company in 1959. Soon thereafter, Coors began offering a penny for every can that was brought back to their recycling center.24
Scrap aluminum cans have the largest economic value of any beverage container, due to the high energy costs of manufacturing new cans from virgin materials. Recycling aluminum cans saves 95% of the energy needed to produce aluminum from bauxite ore, as well as conserving natural resources, according to the Aluminum Association.25 In addition to saving energy, the social and environmental costs of making new cans from bauxite (e.g. damming of rivers, air and water pollution, displacement of indigenous peoples, and destruction of wildlife habitat) are also reduced. Despite the high scrap value of aluminum cans, the aluminum can recycling rate has declined from a peak of 65% in 1992 to 45% in 2005 (CRI, 2006; see Figure 2).26 As is the case with glass, recovered aluminum cans are in high demand by can manufacturers, but the collection infrastructure is inadequate.
Plastic Containers: Plastic soda bottles were fi rst used to package beverages in 1970, but it was not until the 1980s that the Polyethylene Terephthalate (PET ) bottle began to grab soft drink container
20 Information at http://container-recycling.org/glassfact/decline.htm21 Information at http://gpi.org/recycling/environment/22 This data refers to recycling rates of glass beverage bottles and not bottles used for food and other jars.23 Recyclables of all categories and materials when commingled in one receptacle or bin is called single-stream. Various recycling systems might have different requirements of materials in the single stream mix.24 Information on Coors website: http://coors.com/part_environment.asp25 Information on EPA site: http://www.epa.gov/msw/alum.htm26 These fi gures differ from Aluminum Association fi gures as Container Recycling Institute does not include aluminum scrap imports in the calculation of recycling rate, while Aluminum Association does.
Bottled water sales have grown nearly 700% in the last eight years with the number of units of PET water bottles sold exceeding PET soda bottles. A gallon of bottled water in 20 fl uid ounces single serving bottles can cost nearly three times as much as a gallon of gasoline.

U.S. Beverage Container Recycling Scorecard and Report
17
market share. The plastic soda bottle appealed to a public that was increasingly on the go because it was unbreakable, lightweight, transparent, and resealable. PET is made from polyester, and is a strong but lightweight man-made plastic resin. Initially used only for carbonated soft drinks, PET bottles are now used for water, juice, beer, liquor, and other beverages as well.
PET bottle recycling rates dropped from a high of 39.7% in 1995 to 19.6% in 2003 (American Plastics Council, 2005; see Figure 2). In 2004, the U.S. recycling rate rose slightly to 21.6%, an increase attributable in part to New York City restarting full service plastic recycling collection, and also to an increase in the redemption value of containers under California’s container deposit law (National Association for PET Container Resources- [NAPCOR], 2005). On the other hand, the market for scrap PET bottles in recent years has been strong, and the Association of Postconsumer Plastic Recyclers (APR) estimates that only one-half to one-third of the demand for PET bottles is met by current supply (APR, 2005). Although the U.S. Food and Drug Administration has approved the use of post consumer recycled content in food and beverage containers, only 14.3% of recycled PET was used to produce food and beverage containers in 2004 (NAPCOR, 2005). This total amount of recycled PET used in food and beverage containers was just 2.7% of all PET containers by weight, sold in 2004 (Estimated from data from NAPCOR, 2005 and American Plastics Council, 2005). The majority of recycled PET bottles are used instead for fi ber — (mainly carpet), strapping, and fi lm.
High Density Polyethylene (HDPE), a polyethylene thermoplastic, is used for making milk and other beverage bottles as well as non-food bottles. HDPE products are primarily used at home, and are recycled at a higher rate than PET. According to the American Plastics Council the recycling rate for HDPE was 25.9% in 2004, compared to PET, which had a recycling rate of 21.6% (American Plastics Council, 2005). Primary recycled HDPE uses include non-food bottles, polyethylene pipes, lawn and garden products such as fl ower and shrub pots and lumber.
Bioplastics: Bioplastics developed from corn, soy, sugarcane and other crops are gaining in importance because of the rising price and limitations of supply of petroleum, as well as the environmental impacts of non renewable consumption. Of its many uses, bioplastics are currenty used in manufacturing carpets by Interface Inc., containers for bottled water by Biota, deli and food packages by Wild Oats, Newman’s Own and Del Monte, and Wal-Mart is now using a corn-based packaging for marketing cut fruit and vegetables.
Biodegradable or compostable27 bioplastics, as identifi ed by the Biodegradable Products Institute28 could lead to a smaller environmental footprint than conventional plastics. They are an effective substitute for petroleum-based plastics except for carbonated or hot beverages, as they are permeable to gases and also tend to degrade at high temperatures.
27 Biodegradable materials are those that can be broken down by microbes in the environment under the right condition. This process can take place in soils, compost sites, water treatment facilities, marine environment and even the human body. Compostable bioplastics degrade under composting conditions. 28 Information at http://bpiworld.org/BPI-Public
The 2004 recycling rate for all beverage containers was just 33.5%, 20 percentage points lower than it was in 1992. Recycling rates declined steadily throughout the 1990s, despite the fact that the population served by curbside recycling grew from 37 million in 1990 to 140 million in 2000.
- Container Recycling Institute

Waste and Opportunity
18
However, there are some concerns regarding the use of bioplastics. These concerns include the use of genetically engineered corn and other crops in its production process, recyclability, lack of adequate infrastructure for collecting and composting the bottles, and disruption of the PET bottle recycling process.
Figure 2: U.S. Beverage Container Recycling Rates, 1990-2005
Source: Data derived from Aluminum Association, U.S. Commerce Dept., U.S. EPA Offi ce of Solid Waste, AmericanPlastics Council, National Association of PET Container Resources, and Beverage Marketing Corporation.
Compostable bioplastics degrade only under specifi c heat and light conditions that are optimum in industrial or commercial composters, and to which relatively few U.S. communities or households have access. When increasing volumes are mixed with PET recycling streams, they can damage equipment, or increase sorting costs. The high risk of contamination in established PET recycling systems has resulted in reservations about use of bioplastics for the beverage industry. For these reasons, bottlers and beverage producers should take these issues into concern before adopting this new material for their containers.
Coca-Cola and Starbucks are both considering use of bioplastic polymers as a partial alternative to PET.
3.2 Sales Growth of Beverages
In the 30 years from 1973 to 2003, beverage container sales increased over fi ve fold (see Table 5). The beverage packaging industry comprises 18% of the global packaging industry and is worth $28 billion in the U.S. alone (Packaging Gateway, 2006). Between 1992 and 2004, PET carbonated soft drink bottle sales more than doubled from 12 billion units to over 28 billion (see Figure 3) and PET bottled water sales have experienced enormous growth from 3.3 billion units in 1997 to an estimated 26 billion in 2005 (see Figure 4).
While PET carbonated soft drinks (CSD) bottle sales grew 46% between 1994 and 1996, CSD sales
U.S. Beverage Container Recycling Scorecard and Report
19
have been fl at in recent years (Figure 3). Aluminum beverage can sales grew by 8% from 92.4 billion in 1992 to 100 billion units in 2004. Glass bottle sales increased 12.5%, from 32 billion units in 1993 to 36 billion units in 2003.
3.3 Recycling Rates for all Beverage Containers
Recycling rates for beverage containers are far below levels reached 15 years ago. The 2004 recycling rate for all beverage containers was just 33.5%, 20 percentage points lower than it was in 1992. Recycling rates declined steadily throughout the 1990s, despite the fact that the population served by curbside recycling grew from 37 million in 1990 to 140 million in 2000.
Beverage bottles and cans are recycled at far higher rates in states with container deposit laws (see Figure 5). A study in Canada estimated that deposit return systems for beverage containers are over twice as effective as municipal curbside and voluntary depot programs (CM Consulting, 2004). A U.S. study by a multi-stakeholder group came to the same conclusion in 2001. In the early 1990s, container deposit legislation sponsored by 120 members of Congress was blocked by the politically powerful beverage industry. A 1996 report from U.S. Public Interest Research Group (U.S. PIRG) revealed that the beverage industry spent over $14 million to defeat the National Bottle Bill between 1989 and 1994.
3.4 Industry Engagement
In 2001, Businesses and Environmentalists Allied for Recycling (BEAR) successfully encouraged Coca-Cola to participate in a study called the Multi-Stakeholder Recovery Project. The study grew out of a stated desire by both environmental groups and Coca-Cola to advance the issue of container recovery. BEAR was a unique alliance of businesses, recyclers and environmentalists working to maximize the recycling of beverage containers. BEAR’s goal was to double the then national recycling rate of beverage containers to 80%. In January 2002, the group released an analysis of the economics of beverage container recycling. One of the conclusions presented in the analysis was that container deposit systems were the most effective collection infrastructure currently in operation. Coca-Cola was committed to participating in a second phase of the project that would have involved setting container recovery goals, but it withdrew from the project in February 2002.
The most recent effort to address this issue was development of a beverage industry consortium called the Beverage Packaging Environment Council (BPEC) in 2003. Council members include Coca-Cola, Pepsi, Nestlé Waters North America, Anheuser-Busch, Miller Brewing, Coors Brewing, and Heineken North America. BPEC has stated that it is committed to “work extensively with all stakeholders to research the issue; devise and implement policies, programs and strategies to increase food and beverage container recycling; and set measurable and verifi able targets to track progress.” However, since its inception, the member beverage producers have failed to announce any specifi c programs to increase beverage container recycling. The group delivered a presentation at the National Recycling Coalition (NRC) Congress in August 2005. The presentation, based on research of mainly proprietary information conducted by hired consultants, concluded that 66% of beverage containers are consumed at home (NRC, 2005). There is no indication when this closed-door group will interact with all stakeholders, including environmentalists and socially concerned investors.
The 11 states with container deposit laws recycle an average of 490 containers per capita compared to an average of 190 containers per capita recycled in the 39 non-deposit states, according to a 2001 study conducted by a multi-stakeholder group - Businesses and Environmentalists Allied for Recycling (BEAR)

Waste and Opportunity
20
Table 5: Beverage Container Sales 1973-2003 (in billions)
Container Type 1973 1983 1993 2003 2005
Aluminum cans 10 56 94 99 98
Glass Bottles 25 32 32 36* 36*
PET Plastic Bottles -- 4* 9 48 56*
HDPE Plastic Bottles 3* 5 7 9*
Total 35 95 140 190 199
* estimatesSource: Compiled by Container Recycling Institute, 2005. Data from Aluminum Association, Glass Packaging Institute, U.S.EPA, U.S. Department of Com-merce, American Plastics Council, and Beverage Marketing Corporation.
Figure 3: Carbonated Soft Drink Sales in PET Bottles 1992 - 2004Source: Data from American Plastics Council – compiled by Container Recycling Institute
Figure 4: PET Bottled Water Sales in the U.S. (billions of units)Includes domestic and imported sparkling and non-sparkling water in plastic bottles of 1.5 liters or less. Data derived from the Beverage Marketing Corporation. Note: CRI estimated 1997 and 1998 imports.Source: Container Research Institute, 2006

U.S. Beverage Container Recycling Scorecard and Report
21
3.5 Beverage Industry Overview
Consumption of packaged beverages has changed dramatically over the past fi fteen years, not only in terms of the types of packaging used, but also beverages sold.
Carbonated Soft Drinks: The Carbonated Soft Drink (CSD) industry recorded a fi rst time overall decline in sales, of 0.2% in 2005 since tracking of information by BD/Maxwell fi rst began in 1985. Per capita consumption for 2005 also fell by 1% to 828 eight-ounce servings. (Beverage Digest, 2006). This decrease would have been greater, were it not for the strong increase in sales of energy drinks. In spite of the decrease in volume sold, retail value of CSD sales grew to $68.1 billion in 2005, an increase of 3.3% over 2004. This is attributed to both an increase in retail prices of regular/diet CSD as well as the strong growth of more expensive energy drinks.
Figure 5: Beverage Container Redemption Rates in Selected Deposit States vs. the U.S. Average
State data based on reported deposit system “redemption rates;” actual recycling rates (including deposit containers collected at curbside) is higher, but data are unavailable. All state rates include carbonated soft drinks and beer in glass, aluminum and PET plastic. The CA rate also includes non-carbon-ated beverages and plastic bottles with resins #1-7, and estimates for “CRV” (deposit) containers recycled at curbside. The U.S recycling rate is for glass, PET, HDPE, and aluminum cans was calculated by CRI. State sources: Michigan Dept. of Environmental Quality, California Dept. of Conservation/Division of Recycling, Oregon Dept. of Environmental Quality, New York State Department of Environmental Conservation, Hawaii State Department of Health.Source: Container Recycling Institute, 2006

Waste and Opportunity
22
The top two CSD companies, Coca-Cola and Pepsi, both showed declines in volume sold. Cadbury Schweppes, the third-ranking company, introduced some new fl avors of its primary brand, Dr. Pepper, resulting in a slight increase in market share (Table 6, Table 7).
Table 6: Top 10 Carbonated Soft Drink (CSD) Companies, 2005
2005 Rank
Companies2005 Market
Share (%)2004 Market
Share (%)Share Change
(%)Volume
Change (%)1 Coca-Cola Co. 43.1 43.1 Flat -0.1
2 Pepsi-Cola Co. 31.4 31.7 -0.3 -1.2
3 Cadbury Schweppes 14.6 14.5 +0.1 +0.6
4 Cott Corp. 5.4 5.5 -0.1 -2.0
5 National Beverage 2.4 2.4 Flat -1.0
6 Red Bull 0.4 0.3 +0.1 +41.0
7 Big Red 0.4 0.4 Flat +0.3
8 Hansen Natural 0.3 0.2 +0.1 +72.8
9 Rockstar 0.2 0.1 +0.1 +96.5
10 Monarch Co. 0.1 0.1 Flat +0.1
Source: Beverage Digest, 2006
Table 7: Top 10 Brands in the Carbonated Soft Drink Industry, 2005
2005 Rank
Brands2005 Market
Share (%)2004 Market
Share (%)Share Change
(%)Volume
Change (%)
1 Coke Classic (Coke) 17.6 17.9 -0.3 -2.0
2 Pepsi-Cola (Pepsi) 11.2 11.5 -0.3 -3.2
3 Diet Coke (Coke) 9.8 9.7 +0.1 +0.1
4 Mt. Dew (Pepsi) 6.5 6.3 +0.2 +1.8
5 Diet Pepsi (Pepsi) 6.0 6.1 -0.1 -1.9
6 Sprite (Coke) 5.7 5.7 Flat +0.1
7 Dr. Pepper (Cadbury) 5.7 5.6 +0.1 +0.8
8 Fanta (Coke) 1.6 1.3 +0.3 +29.0
9 CF Diet Coke (Coke) 1.5 1.7 -0.2 -7.0
10 Sierra Mist (Pepsi) 1.4 1.4 Flat +1.2
10 Diet Mt. Dew (Pepsi) 1.4 1.3 +0.1 +7.9
Source: Beverage Marketing Corporation
Bottled Water: According to the Beverage Marketing Corporation, bottled water sales grew by nearly 700% from 1997 to 2005 (Figure 4). The brand with the highest dollar market share was Aquafi na, a Pepsi brand, followed by private label bottled water (an aggregate of all private labels), and Dasani owned by Coca-Cola in third place. Nestlé Waters’ Poland Spring was in fourth position (Beverage World, 2006, see Table 8). Nestlé Waters North America was the largest bottled water company with over 31% of total sales spread over all its labels (Beverage Marketing Corporation, 2006).

U.S. Beverage Container Recycling Scorecard and Report
23
Table 8: Top 10 PET Bottled Water Brands
Rank BrandMarket Share
2005 (% of revenue)
Market Share 2004
(% of revenue)
Market Share Point Change
’05 Revenue Growth
(%)
1 Aquafi na (PepsiCo) 14.5 15.8 -1.3 15.1
2 Private Label 13.2 13.2 Flat 25.4
3 Dasani (Coca-Cola) 11.8 11.8 Flat 24.7
4 Poland Spring (Nestlé) 6.8 7.0 -0.2 22.2
5 Propel (PepsiCo) 6.3 5.5 0.8 42.7
6 Danone 5.4 5.1 0.3 32.1
7 Arrowhead (Nestlé) 4.9 5.3 -0.4 15.9
8 Deer Park (Nestlé) 3.7 3.9 -0.2 18.6
9 Crystal Geyser 2.8 3.4 -0.6 2.1
10 Ozarka (Nestlé) 2.7 2.5 0.2 34.4
Total food, drug and mass merchandise outlets only (excluding Wal-Mart)Source: Beverage World, 2006 – Information Resources, Inc.
Beer: In 2005, the U.S. beer industry domestic shipments showed a slight decline over 2004 shipments. Because of increased imports, and increase in sales of premium beers as a whole, the industry showed a slight increase (Beer Insights, 2006; see Table 9). On the other hand, the craft beer29 industry, comprising 3.4% of the total beer industry, showed a remarkable growth of over 9%. The three best-selling beer brands were Bud Light, Budweiser and Miller Lite (Beverage World, see Table 10).
Table 9: Major Beer Companies’ Market Shares and Volumes in 04-05
Rank Company2005 Market
Share2004 Market
ShareShare Change
(%)Volume Change
(%)
1 Anheuser-Busch 48.5 49.4 -0.9 -1.8
2 Miller 18.3 18.5 -0.2 -1.2
3 Coors 10.9 11 -0.1 -0.9
4 Heineken USA 3.5 2.6 0.9 33.7
5 Pabst 3.2 3.6 -0.4 -9.3
6 Gambrinus 2.8 2.5 0.3 14.1
7 Barton 2.4 2.2 0.2 11.5
8 Guinness 1.5 1.5 Flat 2.9
9 Yuengling 0.8 0.7 0.1 14.1
10 Boston 0.6 0.6 Flat 7.6
11 Others 5.5 4.7 0.8 15.3
U.S. Market -0.2
Imports 7.1
Heineken USA included in 2005. Molson USA included with Coors 2004-05.Source: Beer Marketers’ Insight, 2006
29 All-malt beer made by small, regional, pub- or micro-breweries

Waste and Opportunity
24
Table 10: Top 10 Beers of 2005
Rank BrandMarket Share
(%)’05 Growth
(%)Share Point Change
(%)1 Bud Light (Anheuser-Busch) 20.1 Flat Flat
2 Budweiser (Anheuser-Busch) 13.3 -8.8 -1.4
3 Miller Lite (Miller) 9.1 3.4 0.2
4 Coors Light (Coors) 7.2 0.7 Flat
5 Natural Light (Anheuser-Busch) 4.2 1.2 Flat
6 Corona Extra (Modelo)* 3.7 6.8 0.2
7 Busch (Anheuser-Busch) 3.5 -2.7 -0.2
8 Busch Light Draft (Anheuser-Busch) 2.7 Flat Flat
9 Heineken (Heineken) 2.4 2.8 0.1
10 Miller High Life (Miller) 2.3 -4.1 -0.2
* Share of Barton/Gambrinus’ combined import volumeSource: Beverage World, 2006 – Beverage Marketing Corporation & Beverage Marketing Annual Industry Survey, BATF, Department of Commerce.
3.6 Zero Waste
The concept of Zero Waste, aims to maximize recycling and minimize municipal waste by reducing consumption and ensuring that marketed products are reusable, recyclable, or compostable. Reducing waste leads to cost savings, sustainability and improved fl ow of materials.30 Around the world, a number of communities have adopted the Zero Waste goal and policies including communities in New Zealand, Australia, UK, the Philippines and India as well as several cities in the U.S. such as San Francisco, Oakland, Boulder, and Seattle. Many of these international and domestic communities want to reach Zero Waste by 2020. As beverage containers form a signifi cant portion of municipal waste, and are also readily recyclable, long term waste reduction and recycling goals need to be established, in order to move towards achieving Zero Waste by 2020, making beverage consumption more sustainable. To attain Zero Waste by 2020, interim goals of 25% reduction in waste by 2008, 50% reduction by 2012, 75% reduction by 2016 and fi nally zero waste by 2020 have been suggested by CRI. This implies achieving a 50% national container recovery rate for beverages by 2008, 67% by 2012, 84% by 2016 and fi nally 100% or close to it by 2020.
30 Information at http://www.zerowaste.org/case.htm#benefi ts
U.S. Beverage Container Recycling Scorecard and Report
25
4. Recommendations for the Beverage Industry
Pepsi and Coca-Cola have shown some leadership in beverage container recycling issues, such as use of recycled content, source reduction and indicating support for a quantitative, national goal for container recovery and recycling. Signifi cantly higher levels of recycled content in beverage containers are technologically feasible. Recycling rates close to 100%, leading to zero waste and zero landfi ll are also theoretically possible. To attain a steadily increasing recycling rate, all beverage companies should:
1. Commit to using higher level of post consumer recycled content in beverage containers: Pepsi is committed to using 10% recycled PET content in plastic containers; Coors uses 42% recycled content in aluminum containers, Miller uses up to 50% recycled content in glass; Starbucks uses 10% post consumer waste paper in cups for hot beverages. More companies need to match and exceed commitments by these companies.
2. Commit to a measurable national recovery goal for beverage containers: Coca-Cola and Pepsi have committed to engage with various stakeholders to set a national measurable and sustainable quantitative goal for recovery and recycling of beverage containers, and other companies need to work toward the same objective. Developing a national recovery goal will help companies choose and support measures that will be effective in increasing recycling signifi cantly.
3. Support public policies and voluntary measures that increase recycling: Publicly funded programs such as curbside recycling are largely successful in communities where these programs are being implemented. Voluntary large-scale measures by companies such as Recycle it Now! or similar initiatives, collection at stadiums and concerts, and more advertising to raise awareness among consumers about recycling also contributes in some part. So far, container deposit laws are the only programs that have resulted in recycling rates of 70% and above in the 11 states where the legislation exists. If most beverage companies are going to continue to oppose container deposit laws, they should propose a quantitatively substantive and sustainable national option in their place.
4. Commit to source reduction and recyclability: All companies need to commit to design innovations leading to use of less packaging material and improved recyclability. Certain materials, dark tints and colors, and additives, can affect the recyclability of materials and their use should be curtailed.
5. Report on progress and provide information on web: All companies need to make their recycling goals public and make information about the actions taken to achieve the goals public. As a result, beverage companies can be held accountable and best practices can be rewarded and serve as examples for other companies. Information on progress should be measurable and quantitative so comparisons to peers and to previous years can be made.

Waste and Opportunity
26
5. References
American Plastics Council, 2005. “2004 National Post-Consumer Plastics Recycling Report.” See http://www.plasticsresource.com/s_plasticsresource/docs/1700/1646.pdf
Association of Post-Consumer Plastics Recyclers. 2005. APR Position on Collection of More Post-Consumer Bottles. Press Release. September 2. See http://www.plasticsrecycling.org/#
Beer Marketers’ Insight, 2006. Major Supplier Shipments and Share: 2005 vs. 2004. See www.beerinsights.com/docs/majorshipments.html
Beverage Digest, 2006. “Special Issue: All-Channel Carbonated Soft drink Performance in 2005,” Volume 48, No.7, March 8. See http://www.beverage-digest.com/pdf/top-10_2006.pdf
Beverage Marketing Corporation, 2006. Bottled Water Continues Tradition Of Strong Growth In 2005, Beverage Marketing Corporation Reports. News Release, April. See http://www.beveragemarketing.com/
Beverage World, 2006. State of the Industry, April.
Center for Health, Environment and Justice, Environmental Health Strategy Center, 2004. Bad News Comes in Threes: The Poison Plastic, Health Hazards and the Looming Waste Crisis.
CM Consulting, 2004. An Overview of Plastic Bottle Recycling in Canada, Prepared for Environment and Plastics Industrial Council (EPIC), See http://www.solidwastemag.com/PostedDocuments/PDFs/OctNov04/PlasticBottle.pdf#search=%22canada%20recycling%20rates%22
Europen, 2000. Mandatory Deposits for Non-Refi llable Beverage Containers. See http://www.europen.be/issues/mandatorydeposits.doc
NAPCOR, 2005. 2004 Report on Post Consumer PET Container Recycling Activity, Final Report.
National Recycling Coalition (NRC), 2005. Focusing on Beverage Container Recovery –New Research, Challenges, and Opportunities, 24th Annual Congress, August 29.
Tico Times Online, 2005. “Southern Zone Boycotts Plastic”, by María Gabriela Díaz, Tico Times Staff, September 8. See http://www.ticotimes.net/dailyarchive/2005_09/daily_09_08_05.htm#story1
U.S. Environmental Protection Agency, 2005. Municipal Solid Waste Generation, Recycling, and Disposal in the United States: Facts and Figures for 2003. USEPA, Solid Waste and Emergency Response. See http://www.epa.gov/msw/pubs/msw05rpt.pdf
Valiente, Usman, 2000. “Energy to Waste”, Solid Waste & Recycling, April/May, Cover story, pp. 8-14.
U.S. Beverage Container Recycling Scorecard and Report
27
Company Websites:
Anheuser-Busch: http://www.anheuser-busch.com/. Environmental Health & Safety Report can be accessed at http://www.abehsreport.com/
Cadbury Schweppes: http://www.cadburyschweppes.com/EN Corporate Responsibility Report at http://www.cadburyschweppes.com/NR/rdonlyres/8E1AF189-9CC6-4CF8-8FEC-5CAF93CF10B6/0/00_2004CorporateSocialResponsibilityReport.pdf
The Coca-Cola Co.: http://www2.coca-cola.com/ Environmental Report at http://www2.coca-cola.com/citizenship/environmental_report2005.pdf
Coors Brewing Company: http://www.coors.com/main.asp Environmental Report at http://www.coors.com/factsheets/EHSInterimReport.pdf
Cott Corporation: http://www.cott.com/
Miller Brewing Company: http://www.millerbrewing.com/home.asp About Environment: http://www.millerbrewing.com/aboutMiller/aboutEnvironment/default.asp
National Beverage Corp.: http://www.nationalbeverage.com/home.htm
Nestlé Waters North America: http://www.nestle-watersna.com/
New Belgium Brewery: http://www.newbelgium.com/
Pepsi-Cola North America: http://www.pepsico.com/ Sustainability Report at http://www.pepsico.com/Pep_Citizenship/sustainability/index.cfm
Polar Beverages: http://www.polarbev.com/
Starbucks: http://www.starbucks.com/default.asp?cookie%5Ftest=1 Ethos Water website: http://www.ethoswater.com/

Waste and Opportunity
28
Appendices
Appendix 1: Beverage Container Environmental Survey
BEVERAGE CONTAINER RECYCLING PROJECT
A project of As You Sow and Container Recycling Institute in partnership with Environmental Working Group, Natural Resources Defense Council, Friends of the Earth
and Sierra Club
First Annual Beverage Container Environmental Survey
Please complete and return survey by June 10, 2005
American consumers discard over 500 million beverage bottles and cans, on average, every day. Nearly two out of every three of those containers end up landfi lled, incinerated or littered. Replacing them with new containers made from virgin materials consumes substantive amounts of energy, water and other natural resources and creates greenhouse gases and other pollutants. On the other hand, the national recycling rate for beverage containers has signifi cantly declined from 54% to 35% between 1992 and 2003.
This survey has been designed to identify and recognize initiatives taken by beverage companies to reduce the use of natural resources in beverage containers and to counter declining recycling rates. Information provided will be used to evaluate company performance relative to industry peers, and to establish baseline data for future evaluation of historical trends. We appreciate your efforts in completing this survey. Contact information is provided at the end of the survey. Thank you!
General
Company: _____________________________________________
Name, email address and phone number of responding offi cial: _____________________________________________ Name(s) of major brand(s): _____________________________________________
Please attach additional sheet if required.
1. Does your company have environmental information relating to your beverage products, company policies and/or company practices on your website? Please provide web page url and details.
Yes ________No ________

U.S. Beverage Container Recycling Scorecard and Report
29
2. What is your company’s beverage packaging mix? Please provide percentage amounts below for following material type:
Material PercentageAluminum Cans _________
Glass Bottles _________ PET Plastic Bottles _________ HDPE Plastic Bottles _________
Other _________
Beverage Container Source Reduction: Achievements and Goals
According to the U.S. Environmental Protection Agency (USEPA) “source reduction” refers to “any change in the design, manufacture, purchase, or use of materials or products (including packaging) to reduce their amount or toxicity before they become municipal solid waste.” For the purpose of this survey, source reduction refers to reduction of virgin material used in beverage packaging.
3. What is the current weight of your empty beverage containers for the following sizes and materials?
Container Type Weight (grams)12 oz. Aluminum Can _________
12 oz. Glass Bottle _________ 20 oz. PET Plastic Bottle _________ 12 oz. HDPE Plastic Bottle _________
Other _________
4. Does your company have source reduction goals for its beverage containers?
Yes _________No _________
Please use an additional sheet of paper to describe the goals for source reduction and dates by which they are to be met.
5. What percentage of your company’s beverage containers are refi llable glass or plastic bottles?
United States _________
Worldwide _________
Beverage Container Recycled Content: Achievements and Goals
Beverage containers composed of a percentage of post-consumer material reduce the amount of virgin material consumed. Aluminum and glass beverage containers have generally used recycled content, and some companies now use recycled content resin in their PET plastic beverage containers.

Waste and Opportunity
30
6. What is the percentage of recycled content in your company’s beverage containers, by type?
Material U.S. Worldwide (%) (%)
Aluminum Cans _________ _________ Glass Bottles _________ _________PET Bottles _________ _________HDPE Bottles _________ _________Other _________ _________
7. What are your company’s goals for use of recycled content in your beverage containers in 2005 or beyond, by type?
Material U.S. Goal Target Worldwide Target (%) (Year) Goal (%) (Year)Aluminum Cans _________ _________ _________ _________Glass Bottles _________ _________ _________ _________PET Bottles _________ _________ _________ _________HDPE Bottle s _________ _________ _________ _________Other _________ _________ _________ _________
Beverage Container Recyclability: Achievements and Goals
A number of contaminants are known to impede the recycling process. For example, according to the report prepared for the State of California’s Integrated Waste Management Board (IWMB) one PVC container mixed with 100,000 PET containers can contaminate a bale of PET and make recycling uneconomical given that at PET’s melt temperature in the recycling process, PVC burns, thus destroying the surrounding PET and damaging the processing equipment.
8. Do any of your company’s beverage containers, labels or transport packaging material contain any potential contaminants to the recycling process? Please answer yes or no.
Contaminants Containers Labels Transport
PackagingPVC __________ _________ _________Color tinting/dyes __________ _________ Barrier coating __________ _________ _________
Other __________ _________ _________
If you answered yes to any of the above questions, please estimate percentage of your beverage containers containing the contaminant as compared to your entire stock. Please also identify brand and beverage containers on an additional sheet of paper if necessary.
Beverage Container Recycling: Achievements and Goals
The recovery rate for plastic PET soft drink containers has dropped from 46% in 1995 to 30% in 2003, the most recent year for which data is available as per the American Plastics Council. Also PET custom bottle recycling rate (water bottles, non-carbonated beverages and other products) was 10.3% in 1995 and rose to 12.1% in 2003 according to the American Plastics Council. The aluminum can recycling rate declined from 65% in 1994 to 44% in 2003, according to the Container Recycling Institute. Glass bottle recycling rate dropped as well from 32.6% in 1995 to 21.2% in 2001 according to the USEPA. A number of efforts have been undertaken by companies, local governments and other entities to address this problem.

U.S. Beverage Container Recycling Scorecard and Report
31
9. Please provide the estimated container recycling rate for your company’s beverages, by container type if it is signifi cantly (±1%) different from that of the average recycling rates published by respective trade associations as mentioned above.
Material Recycling rate (%)
Aluminum Cans _________ Glass Bottles _________ PET Bottles _________ HDPE Bottles _________ Other _________
10. What programs and/or policies does your company support /or participate in that could lead to increased recovery and recycling of beverage containers?
Support ParticipateRecycling at stadium and sporting events __________ __________ College campus take-back programs __________ __________Convenience store take-back programs __________ __________ Point of sale non-deposit take-back programs __________ __________Voluntary container deposits __________ __________Container Deposit legislation __________ __________Curbside recycling __________ __________Company specifi c container recycling goals __________ __________ Industry wide container recycling goals __________ __________Litter tax __________ __________Other __________ __________
Please provide details of the programs that your company supports or participates in. Please estimate the percentage increase in beverage container recovery and recycling that the company expects to be achieved from the programs that your company supports or participates in and provide these details on an additional sheet of paper.
Please add any additional information that you would like to share with us about your company’s source reduction, reuse or recycling efforts with regard to beverage container recycling that may not have been covered in the survey above.

Waste and Opportunity
32
Appendix 2: Grading Criteria
All companies were graded on the following criteria
Indicator 1- Adoption of goals on use of recycled content
A (4.0): Quantitative and measurable recycled content goals that are clearly defi ned, demonstrate industry leadership and progress, and indicate a commitment to higher level of performanceB (3.0): Quantitative and measurable recycled content goals that meet a high level of performanceC (2.0): Any quantitative and measurable recycled content goalD (1.0): Any commitment or general goal on recycled contentF (0.0): No statement on recycled content goals
Indicator 2- Use of recycled content in their containers
A (4.0): Uses recycled content in all packaging that approaches highest achievable levels of performance, clearly exceeding industry standardsB (3.0): Uses recycled content in most packaging that meets a high level of performanceC (2.0): Uses recycled content in most packaging that is somewhat better than industry peersD (1.0): Uses recycled content in most packaging that is similar to industry peers or some packaging that is better than industry peersF (0): No statement on recycled content
Indicator 3- Support of industry wide container recycling and recovery goals
A (4.0): Drives initiatives to promote an industry-wide container recovery goal and works proactively with industry coalitions and other groups to achieve thisB (3.0): Supports an industry-wide container recovery goal and is committed to working with industry coalitions and other groups to achieve thisC (2.0): Supports an industry wide container recovery goal and is part of an industry coalition or other group that promotes increased recoveryD (1.0): Supports an industry wide container recovery goal or is part of an industry coalition or other group that promotes increased recoveryF (0.0): No statement on industry wide container recovery goal.
Indicator 4- Direct involvement in voluntary programs to increase beverage container recycling
A (4.0): Supports and participates in voluntary programs that increase national recovery and recycling rates by a higher level, clearly exceeding industry standardsB (3.0): Supports and participates in voluntary programs that increase national and/or regional recovery and recycling rates by a high standardC (2.0): Supports and participates in voluntary programs that increase regional and local recovery and recycling ratesD (1.0): Supports and participates in voluntary programs but there is no public statement about impact on recovery and recycling ratesF (0.0): No statement on involvement in voluntary programs

U.S. Beverage Container Recycling Scorecard and Report
33
Indicator 5- Support for public policies that will increase recovery and recycling rates
A (4.0): Actively supports and participates in public policy leading to a net result of highest recycling rates for example, container deposit bill, litter tax, and curbside recycling B (3.0): Actively supports and participates in public policy leading to a net result of high recycling rates for example, container deposit bill, litter tax, and curbside recyclingC (2.0): Actively supports and participates in public policy leading to a net result of increasing recycling rates related to at least two out of the three- container deposit bill, litter tax, and curbside recycling D (1.0): Actively supports and participates in public policy leading to a net result of increasing recycling rates related to at least one out of the three- container deposit bill, litter tax, and curbside recyclingF (0.0): No statement on public policy
Indicator 6- Adoption of source reduction goals
A (4.0): Quantitative and measurable source reduction goals that are clearly defi ned, demonstrate industry leadership and reveal a commitment to higher level of performanceB (3.0): Quantitative and measurable source reduction goals that meet a high level.C (2.0): Any quantitative and measurable source reduction goalD (1.0): Any statement on commitment or goal on source reductionF (0.0): No disclosure or statement on source reduction goals
Indicator 7- Disclosure of information and steps taken for source reduction
A (4.0): Full disclosure of current quantitative and measurable data on source reduction including use of refi llable containers, the impact of which meets a higher level of performance, clearly exceeding industry standardsB (3.0): Full disclosure of current quantitative and measurable data on source reduction, including use of refi llable containers, the impact of which meets a high level of performanceC (2.0): Disclosure of any recent source reduction achievements and their impacts, including use of refi llable containersD (1.0): Disclosure of any relevant source reduction information including use of refi llable containersF (0): No statement on source reduction
The grading scale used for the report card is the same as used in most schools, based on a 4.0 scale and is listed here:
Grading Scale: Points Grade
4.00 A
3.67 A-
3.33 B+
3.00 B
2.67 B-
2.33 C+
2.00 C
1.67 C-
1.33 D+
1.00 D
0.67 D-
0.00 F

Waste and Opportunity
34
Appendix 3: Comparison of Weights of Beverage Containers for Major Brands
Weight of 20 oz. PET Bottles and 12 oz. Cans for Major Brands (Unscientifi c experiment)
Brand (Company)San Francisco Area
Measurement(grams)
Boston Area Measurement
(grams)
Average(grams)
Bottles (20 fl oz.)
1. Coke (Coca-Cola)
28.7 28.9 28.8
2. Pepsi (PepsiCo)
28.1 27.3 27.7
3. Sprite (Coca-Cola)
28.8 28.9 28.9
4. Dr. Pepper (Cadbury Schweppes)
28.1 28.0 28.1
5. 7 Up (PepsiCo)
28.4 27.9 28.2
6. Dasani (Coca-Cola)
28.1 27.7 27.9
7. Aquafi na (PepsiCo)
23.7 24.3 24.0
8. Crystal Geyser -17 fl oz. (Crystal Geyser)
17.5 17.5
Cans (12 fl oz. )
9.Coke (Coca-Cola)
13.5 13.2 13.4
10. Pepsi (PepsiCo)
13.8 13.5 13.7
11. Dr. Pepper (Cadbury Schweppes)
13.9 13.4 13.7
12. 7 Up (PepsiCo)
13.9 13.1 13.5
13. Sprite (Coca-Cola)
13.5 13.4 13.5
14. Miller Lite (Miller Brewing Company)
13.6 13.9 13.8
15. Coors Lite (Coors)
13.8 13.5 13.7
16. Bud Lite (Anheuser-Busch)
13.1 13.2 13.2
17. Budweiser(Anheuser-Busch)
13.3 13.6 13.5

U.S. Beverage Container Recycling Scorecard and Report
35
Appendix 4: Types of Plastic
#1, PETE or PET (Polyethylene Terephthalate) — Used for clear beverage bottles. Widely recyclable; generally considered safe, with some precautions.
#2, HDPE (High-Density Polyethylene) — Used for colored or cloudy bottles and jugs, yogurt containers, and other tubs. Widely recyclable, but consumers need to verify with local recyclers whether tubs and bottles (which are made differently and can’t be recycled together) need to be separated. Generally considered safe, with some precautions.
#3, PVC (Polyvinyl Chloride) — Used in some cling wrap and bottles, as well as pipes and other construction materials. Not widely recyclable; recommended to avoid because it can leach toxins into food and is an environmental problem throughout its lifecycle.
#4, LDPE (Low-Density Polyethylene) — Used for garbage bags, food storage bags, and some cling wrap and bottles. Not widely recyclable; generally considered safe, with some precautions.
#5, PP (Polypropylene) — Used in butter tubs, some baby bottles, and other rigid containers. Not widely recycled; generally considered safe.
#6, PS (Polystyrene) — Used in foam trays, takeout containers, coolers, egg cartons, and packing peanuts. Not widely recyclable, although many packing and shipping stores accept packing peanuts for reuse. Recommended to avoid because styrene may leach into food and beverages.
#7, Other (Includes Polycarbonate and mixed materials) — Used in fi ve-gallon water bottles, some baby bottles, and some liners of metal cans. Not widely recyclable; recommended to avoid because bisphenol-A can leach from polycarbonate into food and beverages
Source: Co-op America – Greener Paths for Plastics http://www.coopamerica.org/tools/print.cfm?page=/pubs/realmoney/articles/plastics.cfm

As You Sow311 California Street, Suite 510
San Francisco, CA 94404Telephone: [email protected]
Container Recycling Institute 1776 Massachusetts Avenue, NW, Suite 800
Washington, D.C. 20036-1904 Telephone: (202) 263-0999
Printed on 100% post consumer, chlorine free recycled paper
“As investment managers for clients with
fi nancial and environmental objectives,
Walden believes it is important for beverage
companies to provide stakeholders
with timely and relevant environmental
information, including specifi c data on
recycling programs. This report contains
a wealth of information on beverage
companies’ progress in reducing the use
of container packaging, using recycled
content, and improving container recovery
and recycling rates. Such information helps
Walden and other stakeholders measure
company performance over time and relative
to peers.”Kenneth P. Scott, CFA
Portfolio ManagerWalden Asset Management
“Let’s hope this report is a wake up call
and encourages the beverage industry
players to do much more. The Sierra Club
along with many of its chapters and local
groups has been working for years to
fi nd constructive solutions to this vexing
problem of beverage container waste.
We join As You Sow and the Container
Recycling Institute in calling for beverage
companies to step up and improve their
recycling efforts as well as to support public
policies and programs to boost collection
and recycling rates”Carl Pope
Executive DirectorSierra Club