waste management facilities cost information for hazardous
TRANSCRIPT

INEL-95/0016 (Formerly EGG-WM-11432)
Revision 1
Waste Management Facilities Cost Information for Hazardous Waste
David Shropshire Michael Sherick
Chuck Biagi
Published June 1995
Idaho National Engineering Laboratory Lockheed Martin Idaho Technologies
Radioactive Waste Technical Support Program Idaho Falls, Idaho 83415
Prepared for the U.S. Department of Energy
Office of Environmental Management Under DOE Idaho Operations Office
Contract DE-AC07-94ID13223
DiSTRI&TO Qf THIS DOCUMENT IS Ufi 6\

DISCLAIMER
Portions of this document may be illegible in electronic image products. Images are produced from the best available original document.

Waste Management Facilities Cost Information
for Hazardous Waste
INEL-95/0016
Prepared by:
David Shropshire Economic and Systems Analysis Lockheed Martin Idaho Technologies
6/ate
~7 Michael Sherick Economic and Systems Analysis Lockheed Martin Idaho Technologies
y^f/frr Date
CLcJL % ^Y^> Chuck Biagi Environmental Services Division Morrison Knudsen Corporation
6-tt-fr Date
Reviewed by:
si?
Derek Bolton Environmental Services Division Morrison Knudsen Corporation
6-IL-IS Date
Reviewed and approved by:
R. Eric Williams, Manager Radioactive Waste Technical Support Program Lockheed Martin Idaho Technologies
*-cr-tr Date


ABSTRACT
This report contains preconceptual designs and planning level hfe-cycle cost estimates for managing hazardous waste. The report's information on treatment, storage, and disposal modules can be integrated to develop total life-cycle costs for various waste management options. A procedure to guide the U.S. Department of Energy and its contractor personnel in the use of cost estimation data is also summarized in this report.
DISCLAIMER
This report was prepared as an account of work sponsored by an agency of the United States Government. Neither the United States Government nor any agency thereof, nor any of their employees, makes any warranty, express or implied, or assumes any legal liability or responsibility for the accuracy, completeness, or usefulness of any information, apparatus, product, or process disclosed, or represents that its use would not infringe privately owned rights. Reference herein to any specific commercial product, process, or service by trade name, trademark, manufacturer, or otherwise does not necessarily constitute or imply its endorsement, recommendation, or favoring by the United States Government or any agency thereof. The views and opinions of authors expressed herein do not necessarily state or reflect those of the United States Government or any agency thereof.
i i i


CONTENTS
ABSTRACT Hi
ACRONYMS xiii
PREFACE xv
1. INTRODUCTION AND SUMMARY 1-1
1.1 Background 1-1
1.2 Waste Management Facilities Cost Information Task Participants 1-1
1.3 Modules and Unit Operations 1-1
1.4 Technical and Cost Estimate Bases and Assumptions 1-2
1.4.1 General Assumptions 1-2 1.4.2 Facility Operation Assumptions 1-3 1.4.3 Mass Flow Rate Calculations 1-3 1.4.4 Cost Bases 1-3
1.5 Cost Estimation Procedure 1-6
1.6 Limitations 1-6
2. TREATMENT ADMINISTRATION (MODULE TADMN) . 2-1
2.1 Basic Information , 2-1
2.2 Technical Bases and Assumptions 2-1
2.2.1 Function and Operation of Module 2-1
2.2.2 Integration of Module 2-1
2.3 Cost Bases, Assumptions, and Results 2-1
3. RECEIVING AND INSPECTION (MODULE RCINS) 3-1
3.1 Basic Information 3-1
3.2 Technical Bases and Assumptions 3-1
3.2.1 Function and Operation of Module 3-1 3.2.2 Integration of Module 3-1
v

3.3 Cost Bases, Assumptions, and Results 3-2
4. ASSAY, SORT, AND PACKAGE (MODULE ASPAK) 4-1
4.1 Basic Information 4-1
4.2 Technical Bases and Assumptions 4-1
4.2.1 Function and Operation of Module 4-1
4.2.2 Integration of Module 4-2
4.3 Cost Bases, Assumptions, and Results 4-2
5. AQUEOUS WASTE TREATMENT (MODULE AQWTR) 5-1
5.1 Basic Information 5-1
5.2 Technical Bases and Assumptions 5-1
5.2.1 Function and Operation of Module 5-1 5.2.2 Integration of Module 5-2
5.3 Cost Bases, Assumptions, and Results 5-3
6. INCINERATION (MODULE INCIN) 6-1
6.1 Basic Information 6-1 6.2 Technical Bases and Assumptions 6-2
6.2.1 Function and Operation of Module 6-2
6.2.2 Integration of Module 6-4
6.3 Cost Bases, Assumptions, and Results 6-4
7. ORGANIC REMOVAL (MODULE H-ORGRM) 7-1
7.1 Basic Information 7-1
7.2 Technical Bases and Assumptions 7-1
7.2.1 Function and Operation of Module 7-1 7.2.2 Integration of the Module 7-2
7.3 Cost Bases, Assumptions, and Results 7-2
vi

8. RECYCLING (MODULE RECYC) 8-1
8.1 Basic Information 8-1
8.2 Technical Bases and Assumptions 8-1
8.2.1 Function and Operation of Module 8-2
8.2.2 Integration of Module 8-2
8.3 Cost Bases, Assumptions, and Results 8-2
9. DEACTIVATION (MODULE DEACT) 9-1
9.1 Basic Information 9-1
9.2 Technical Bases and Assumptions 9-1
9.2.1 Function and Operation of Module 9-1
9.2.2 Integration of Module 9-2
9.3 Cost Bases, Assumptions, and Results 9-2
10. MERCURY SEPARATION (MODULE RMERC) 10-1
10.1 Basic Information 10-1
10.2 Technical Bases and Assumptions 10-1
10.2.1 Function and Operation of Module 10-1
10.2.2 Integration of Module 10-2
10.3 Cost Bases, Assumptions, and Results 10-3
11. GROUT STABILIZATION (MODULE GROUT) 11-1
11.1 Basic Information 11-1
11.2 Technical Bases and Assumptions 11-2
11.2.1 Function and Operation of Module 11-2
11.2.2 Integration of Module 11-2
11.3 Cost Bases, Assumptions, and Results 11-2
12. CERTIFICATION AND SHIPPING (MODULE CSHIP) 12-1
12.1 Basic Information 12-1
vii

12.2 Technical Bases and Assumptions 12-1
12.2.1 Function and Operation of Module 12-1
12.2.2 Integration of Module 12-1
12.3 Cost Bases, Assumptions, and Results 12-2
13. SHALLOW LAND DISPOSAL (MODULE SLDSP) 13-1
13.1 Basic Information 13-1
13.2 Technical Bases and Assumptions 13-1
13.2.1 Function and Operation of Module 13-1
13.2.2 Integration of Module 13-1
13.3 Cost Bases, Assumptions, and Assessments 13-1
14. COST ESTIMATION PROCEDURE 14-1
14.1 Overview 14-1
14.2 Definition of Waste Loads 14-1
14.2.1 Facility Treatment Waste Loads 14-2
14.2.2 Disposal Waste Loads 14-2
14.3 Estimating TSD Facility Cost and FTEs 14-3
14.4 Transportation Costs 14-3
15. REFERENCES 15-1
FIGURES
1-1. Integrated waste management facility 1-9
1-2. PLCC estimating steps 1-10
2-1. FTE workers versus capacity for the treatment administration (H-TADMN) module . . . . 2-3
2-2. PLCC versus capacity for the treatment ao^riinistration (H-TADMN) module 2-4
2-3. PLCC versus capacity including unit rates for the treatment ao!ministration (H-TADMN) module 2-5
3-1. Equipment layout for the receiving and inspection (H-RCINS) module 3-3 viii

3-2. Process flow diagram for the receiving and inspection (H-RCINS) module 3-4
3-3. FTE workers versus capacity for the receiving and inspection
(H-RCINS) module 3-5
3-4. PLCC versus capacity for the receiving and inspection (H-RCINS) module 3-6
3-5. PLCC versus capacity including unit rates for the receiving and inspection
(H-RCINS) module 3-7
4-1. Equipment layout for the assay, sort, and package (H-ASPAK) module 4-4
4-2. Process flow diagram for the assay, sort, and package (H-ASPAK) module 4-5
4-3. FTE workers versus capacity for the assay, sort, and package
(H-ASPAK) module 4-6
4-4. PLCC versus capacity for the assay, sort, and package (H-ASPAK) module 4-7
4-5. PLCC versus capacity including unit rates for the assay, sort, and package (H-ASPAK) module 4-8
5-1. Equipment layout for the aqueous waste treatment (H-AQWTR) module 5-5 5-2. Process flow diagram for the aqueous waste treatment (H-AQWTR) module 5-7 5-3. FTE workers versus capacity for the aqueous waste treatment
(H-AQWTR) module 5-11
5-4. PLCC versus capacity for the aqueous waste treatment (H-AQWTR) module 5-13
5-5. PLCC versus capacity including unit rates for the aqueous waste treatment
(H-AQWTR) module 5-15
6-1. Equipment layout for the incineration (H-INCIN) module 6-7
6-2. Process flow diagram for the incineration (H-INCIN) module 6-9
6-3. FTE workers versus capacity for the incineration (H-INCIN) module 6-11
6-4. PLCC versus capacity for the incineration (H-INCIN) module 6-13
6-5. PLCC versus capacity including unit rates for the incineration
(H-INCIN) module 6-15
7-1. Equipment layout for the organic removal (H-ORGRM) module 7-3
ix

7-2. Process flow diagram for the organic removal (H-ORGRM) module 7-4
7-3. FTE workers versus capacity for the orgamc removal (H-ORGRM) module 7-5
7-4. PLCC versus capacity for the organic removal (H-ORGRM) module . 7-6
7-5. PLCC versus capacity including unit rates for the organic removal
(H-ORGRM) module 7-7
8-1. Process flow diagram for the recycling (H-RECYC) module 8-3
8-2. FTE workers versus capacity for the recycling (H-RECYC) module 8-4
8-3. PLCC versus capacity for the recycling (H-RECYC) module 8-5
8-4. PLCC versus capacity including unit rates for the recycling (H-RECYC) module 8-6
9-1. Equipment layout for the deactivation (H-DEACT) module 9-3
9-2. Process flow diagram for the deactivation (H-DEACT) module 9-4
9-3. FTE workers versus capacity for the deactivation (H-DEACT) module 9-5
9-4. PLCC versus capacity for the deactivation (H-DEACT) module 9-6
9-5. PLCC versus capacity including unit rates for the deactivation
(H-DEACT) module 9-7
10-1. Equipment layout for the mercury separation (H-RMERC) module 10-5
10-2. Process flow diagram for the mercury separation (H-RMERC) module 10-7
10-3. FTE workers versus capacity for the mercury separation (H-RMERC) module 10-9
10-4. PLCC versus capacity for the mercury separation (H-RMERC) module 10-10
10-5. PLCC versus capacity including unit rates for the mercury separation
(H-RMERC) module 10-11
11-1. Equipment layout for the grout stabilization (H-GROUT) module 11-4
11-2. Process flow diagram for the grout stabilization (H-GROUT) module 11-5
11-3. FTE workers versus capacity for the grout stabilization (H-GROUT) module 11-6
11-4. PLCC versus capacity for the grout stabilization (H-GROUT) module 11-7
x

11-5. PLCC versus capacity including unit rates for the grout stabilization (H-GROUT) module 11-8
12-1. Equipment layout for the certification and shipping (H-CSHIP) module 12-3
12-2. Process flow diagram for the certification and shipping (H-CSHIP) module 12-4
12-3. FTE workers versus capacity for the certification and shipping
(H-CSHIP) module 12-5
12-4. PLCC versus capacity for the certification and shipping (H-CSHIP) module 12-6
12-5. PLCC versus capacity including unit rates for the certification and shipping
(H-CSHIP) module 12-7
13-1. FTE workers versus capacity for the shallow land disposal (H-SLDSP) module 13-2
13-2. PLCC versus capacity for the shallow land disposal (H-SLDSP) 13-3
13-3. PLCC versus capacity including unit rates for the shallow land disposal (H-SLDSP) module 13-4
14-1. Treatment and disposal waste load data sheet 14-4
TABLES
1-1. Capacity ranges of modules developed for hazardous waste 1-7
1-2. Sample PLCC estimate summary for the incineration (INCIN) module 1-8
2-1. Plan dimensions of the treatment administration (H-TADMN) module 2-2
XI


ACRONYMS
D&D decontamination and decommissioning
DOE U.S. Department of Energy
FTE full-time equivalent
HEPA high-efficiency particulate air
INEL Idaho National Engineering Laboratory
LLW low-level waste
MK Morrison Knudsen Corporation, Environmental Services Division
MLLW mixed low-level waste
O&M operations and maintenance
PEIS Programmatic Environmental Impact Statement
PFD process flow diagram
PLCC planning level life-cycle cost
RCRA Resource Conservation and Recovery Act
S&M surveillance and monitoring
TSCA Toxic Substances Control Act
TSD treatment, storage, and disposal
WMFCI Waste Management Facilities Cost Information
xiii


PREFACE
This report was prepared for use in the U.S. Department of Energy's Programmatic Environmental Impact Statement Project. The report provides a readily useable catalog of developed cost information.
This version of the report (INEL-95/0016, Rev. 1) replaces the interim report (Feizollahi and Shropshire 1994). Some of the cost information contained in the report has been updated to reflect more current estimating data. Also, the cost and full-time equivalent curves have been standardized to a format that is consistent with the Waste Management Facilities Cost Information Reports for Transuranic Waste (Shropshire et al. 1995a), Low-Level Waste (Shropshire et al. 1995b), and Mixed Low-Level Waste (Shropshire et al. 1995c).
The method presented in the report is for planning level life-cycle cost estimates (accuracy of plus or minus 30%). Estimates based on this report are useful for comparative evaluation of alternatives. The cost information is not site-specific, and any alternative selection based on die estimates derived from this method would warrant further study. Therefore, these estimates should not be used to determine funding requirements.
This report is organized according to distinct modules that can be assembled in various ways to create different types of treatment, storage, and disposal facilities. Each module is represented by an abbreviation that is repeated throughout discussion of the module. For the reader's convenience, these abbreviations are printed on the section tabs.
xv

Waste Management Facilities Cost Information for Hazardous Waste
1. INTRODUCTION AND SUMMARY
1.1 Background
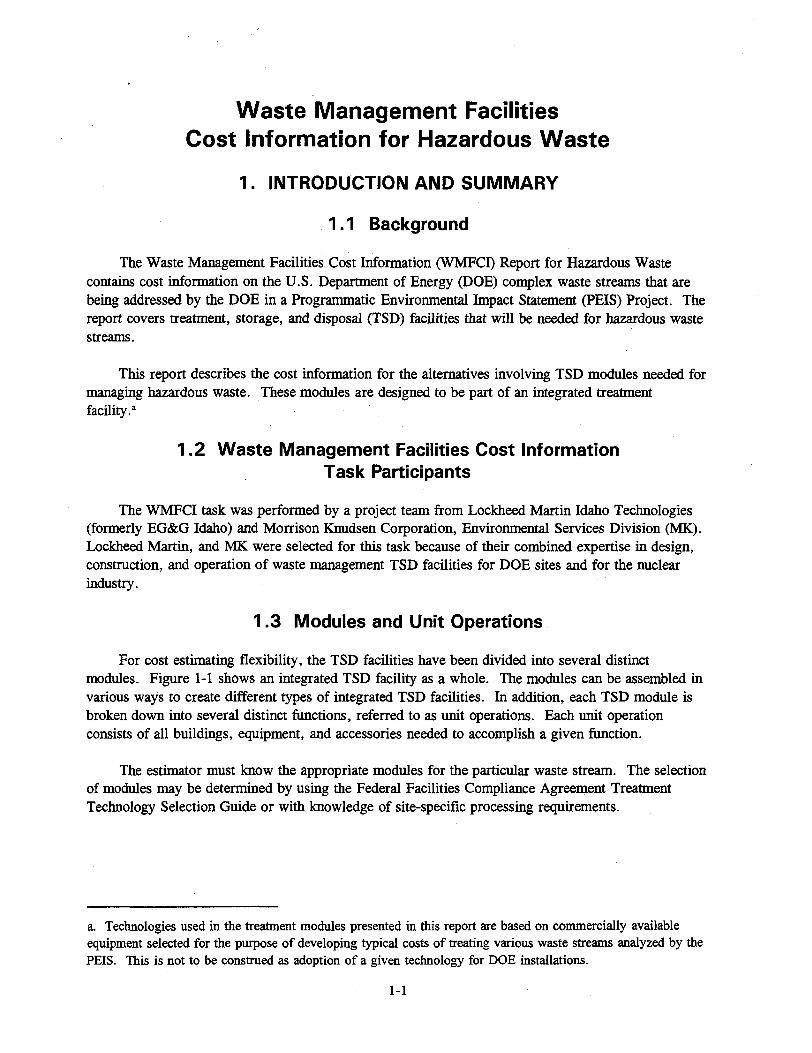
The Waste Management Facilities Cost Information (WMFCI) Report for Hazardous Waste contains cost information on the U.S. Department of Energy (DOE) complex waste streams that are being addressed by the DOE in a Programmatic Environmental Impact Statement (PEIS) Project. The report covers treatment, storage, and disposal (TSD) facilities that will be needed for hazardous waste streams.
This report describes the cost information for the alternatives involving TSD modules needed for managing hazardous waste. These modules are designed to be part of an integrated treatment facility.3
1.2 Waste Management Facilities Cost Information Task Participants
The WMFCI task was performed by a project team from Lockheed Martin Idaho Technologies (formerly EG&G Idaho) and Morrison Knudsen Corporation, Environmental Services Division (MK). Lockheed Martin, and MK were selected for this task because of their combined expertise in design, construction, and operation of waste management TSD facilities for DOE sites and for the nuclear industry.
1.3 Modules and Unit Operations
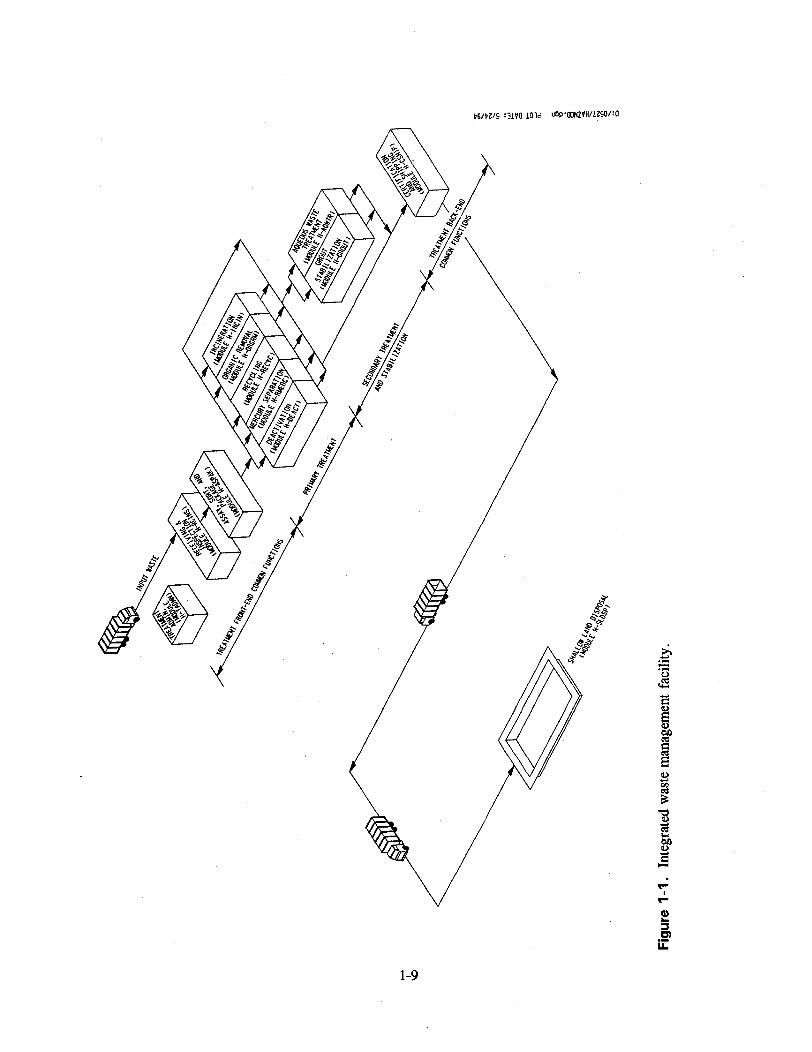
For cost estimating flexibility, the TSD facilities have been divided into several distinct modules. Figure 1-1 shows an integrated TSD facility as a whole. The modules can be assembled in various ways to create different types of integrated TSD facilities. In addition, each TSD module is broken down into several distinct functions, referred to as unit operations. Each unit operation consists of all buildings, equipment, and accessories needed to accomplish a given function.
The estimator must know the appropriate modules for the particular waste stream. The selection of modules may be determined by using the Federal Facilities Compliance Agreement Treatment Technology Selection Guide or with knowledge of site-specific processing requirements.
a. Technologies used in the treatment modules presented in this report are based on commercially available equipment selected for the purpose of developing typical costs of treating various waste streams analyzed by the PEIS. This is not to be construed as adoption of a given technology for DOE installations.
1-1

1.4 Technical and Cost Estimate Bases and Assumptions
At least three different capacities were cost estimated for each module to generate a cost versus capacity curve (included in the sections for each respective module). Table 1-1 shows the capacity ranges that span these data sets.
1.4.1 General Assumptions
Facility construction and ownership. It is assumed that all facility equipment will be new and placed within either totally new structures or modified existing structures. Modified structures will be upgraded to house equipment required for processing waste. The upgrades will include construction of interior walls, roof modifications, secondary containment, and other improvements that are necessary to meet all technical and regulatory standards applicable to each treatment facility. Site development costs such as utilities and road work are included within 30 m (100 ft) of the facility only. Site infrastructure costs are not included. All facilities are assumed to be government owned and contractor operated.
Throughput. A broad capacity range is selected to cover the requirements of the PEIS alternatives.
Modular facility. The planning level life-cycle cost (PLCC) estimates in the WMFCI reports are based on a set of facility modules; each of which may be used alone or in combination with others.
Technology availability. Cost information in this report is based on available technologies. The basic rule employed in using the technologies is that at least one vendor must commercially offer the given technology without incurring upfront basic research and developmental costs. Information and data used in this report are based on the best available knowledge about waste processing requirements, technology availability, and cost data. The information in this report may require updating when additional information is obtained.
Cost bases. Estimates for new facility construction are based on the conditions for Idaho National Engineering Laboratory (INEL), including utility, labor, and related design, construction, operation, and management factors. INEL costs are considered to represent the mid-range costs within the DOE Complex. Site-specific evaluations should be performed to improve the cost estimating accuracy.
Escalation rates. The PLCC estimates are expressed in 1994 dollars. The time value of money or escalation for expenditures occurring at different times has not been considered in the estimates. The costs have been summarized by major program elements [i.e., preoperation, construction, operations and maintenance (O&M), and decontamination and decommissioning (D&D)] so the user can apply appropriate escalation rates to represent the specific schedule requirements.
1-2
1.4.2 Facility Operation Assumptions
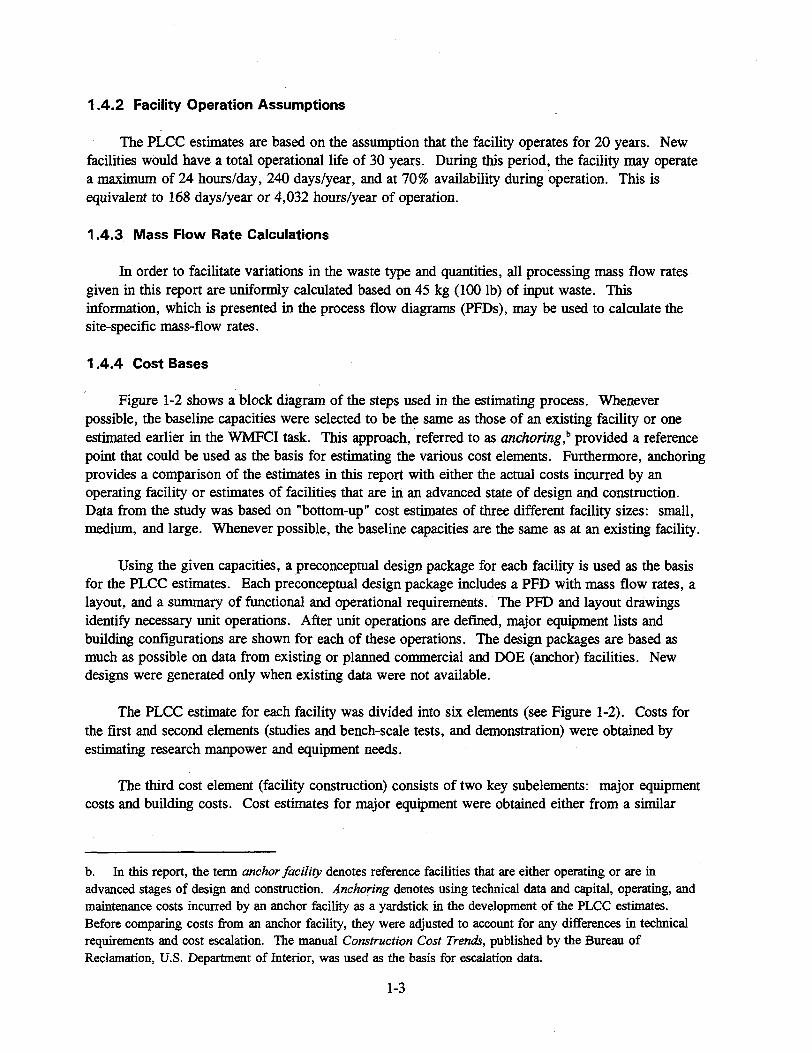
The PLCC estimates are based on the assumption that the facility operates for 20 years. New facilities would have a total operational life of 30 years. During this period, the facility may operate a maximum of 24 hours/day, 240 days/year, and at 70% availability during operation. This is equivalent to 168 days/year or 4,032 hours/year of operation.
1.4.3 Mass Flow Rate Calculations
In order to facilitate variations in the waste type and quantities, all processing mass flow rates given in this report are uniformly calculated based on 45 kg (100 lb) of input waste. This information, which is presented in the process flow diagrams (PFDs), may be used to calculate the site-specific mass-flow rates.
1.4.4 Cost Bases
Figure 1-2 shows a block diagram of the steps used in the estimating process. Whenever possible, the baseline capacities were selected to be the same as those of an existing facility or one estimated earlier in the WMFCI task. This approach, referred to as anchoring?' provided a reference point that could be used as the basis for estimating the various cost elements. Furthermore, anchoring provides a comparison of the estimates in this report with either the actual costs incurred by an operating facility or estimates of facilities that are in an advanced state of design and construction. Data from the study was based on "bottom-up" cost estimates of three different facility sizes: small, medium, and large. Whenever possible, the baseline capacities are the same as at an existing facility.
Using the given capacities, a preconceptual design package for each facility is used as the basis for the PLCC estimates. Each preconceptual design package includes a PFD with mass flow rates, a layout, and a summary of functional and operational requirements. The PFD and layout drawings identify necessary unit operations. After unit operations are defined, major equipment lists and building configurations are shown for each of these operations. The design packages are based as much as possible on data from existing or planned commercial and DOE (anchor) facilities. New designs were generated only when existing data were not available.
The PLCC estimate for each facility was divided into six elements (see Figure 1-2). Costs for the first and second elements (studies and bench-scale tests, and demonstration) were obtained by estimating research manpower and equipment needs.
The third cost element (facility construction) consists of two key subelements: major equipment costs and building costs. Cost estimates for major equipment were obtained either from a similar
b. In this report, the term anchor facility denotes reference facilities that are either operating or are in advanced stages of design and construction. Anchoring denotes using technical data and capital, operating, and maintenance costs incurred by an anchor facility as a yardstick in the development of the PLCC estimates. Before comparing costs from an anchor facility, they were adjusted to account for any differences in technical requirements and cost escalation. The manual Construction Cost Trends, published by the Bureau of Reclamation, U.S. Department of Interior, was used as the basis for escalation data.
1-3

facility, from an anchor facility, by soliciting costs from the suppliers, or by making engineering judgments. Building costs were estimated either by multiplying building unit costs by the square footage allocated to each unit operation in the layouts, or by developing building material and labor requirements and multiplying them by the appropriate unit rates. Building costs for modifications to existing structures were estimated by developing material and labor requirements for building cost elements. It is assumed that modifying an existing facility will not require site preparation and superstructure construction necessary for a new facility. All other building cost elements will be identical to that of a new facility.
Once the equipment and building costs were estimated for each facility, they were totalled and multiplied by a factor to allow for the construction contractor's indirect costs. The sum of the equipment, building, and indirect costs were then multiplied by applicable factors to allow for design, inspection, construction management, and project management costs. Allowances were also included for management reserve and contingencies.
The fourth cost element (operations-budget-funded activities) includes conceptual design, safety assurance, National Environmental Policy Act compliance efforts, permitting, preparation for operation, and project management costs. All other subelements of the cost of operations-budget-funded activities were estimated as a percentage of the construction cost.
The fifth cost element, O&M, consists of four subelements: operating labor, utilities, consumable material, and maintenance (parts, equipment, and labor). The first three subelements were estimated by analyzing the requirements of each facility at the unit operations level. The maintenance costs were estimated as a percentage of the original equipment installed at the facility. Allowances were also included for management reserve and contingencies.
The sixth cost element (D&D at facility closure) was estimated by multiplying a D&D unit rate by the facility square footage.
The total facility PLCC estimates were obtained by taking the sum of the six cost elements.
The PLCC cost estimates for hazardous waste have been compared to similar mixed low-level waste/low-level waste (MLLW/LLW) facility cost modules (Feizollahi and Shropshire 1994). A discussion of the cost differences is provided in the "Cost Bases, Assumptions, and Results" section of each module. Commercial quotations for hazardous waste have also been provided for some modules. The commercial costs are used on PEIS alternatives requiring commercial hazardous waste treatment and disposal.
Cost estimating backup data for the modules are presented in a supplemental estimating data report.0
c. Shropshire, D., M. Sherick, andC. Biagi, 1995, Waste Management Facilities Cost Information Estimating Data for Hazardous Waste, INEL-95/0296, in preparation.
1-4

7.4.4.7 Cost Curve Development Approach. Unique parametric cost equations were developed for the preoperations, facility construction, O&M, and D&D cost elements of each module. These equations were developed based on the baseline WMFCI bottom-up estimates regressed over a range of facility capacities for each cost module. There are over 150 equations that describe costs and full-time equivalent workers (FTEs) for hazardous wastes.
Linear and nonlinear approaches were used to provide the best fit cost curves. The curves were developed to represent the full range of facility costs over the estimated capacity range. Costs should not be extrapolated for facilities outside the defined range of capacities.
1.4.4.2 Cost Curve Applications. Cost curves have been provided for most modules to describe the major manpower (FTE) components, cost elements, total life-cycle costs, and total life-cycle unit costs. In each respective module section, three figures (following any layouts and PFDs) are presented for each module: (a) FTE workers versus capacity, (b) PLCC versus capacity, and (c) PLCC versus capacity including unit rates. Curves in the first and second figures were developed to represent only major FTE and cost elements. These two figures can be used to derive the four primary costs required to estimate the individual module costs. The four primary costs (listed below) were derived from the six cost estimate elements in Section 1.4.4.
1. Preoperations. Preoperations costs include the first (studies and bench-scale test), second (demonstration), and fourth (operation-budget-funded activities) cost elements. These costs were combined because the first and second cost elements are relatively small and would be completed on or about the same schedule as the fourth cost element. Graphically, the small FTE and cost values for the first and second cost elements do not fall on a common scale with the other cost elements.
2. Facility construction. Facility construction costs would be identical to the third cost element (facility construction). This cost element would require capital equipment and line-item funding.
3. Operations and maintenance. O&M. would be equivalent to the fifth cost element. The estimated FTE figures are based on one year of O&M, and the estimated cost figures have been based on one year of O&M. This was done to keep the numbers on a common scale on the figure. The estimator might need to multiply the number of FTEs or costs from the curves by the appropriate number of years of O&M for the specific estimate.
4. Decontamination and decommissioning. D&D costs would be identical to the sixth cost element. For disposal modules, these costs include surveillance and monitoring (S&M).
These four cost elements should be used to determine the required module costs. Existing facility costs would require only the O&M and D&D costs. New facilities will include all costs for preoperation, facility construction and equipment, O&M, and D&D. The
1-5

O&M costs can be factored from the cost curves to obtain operating costs for periods other than one year.
The third cost figure (i.e., PLCC versus capacity including unit rates) provides the total life-cycle cost curve, including preoperation, facility construction, O&M, and D&D. The total life-cycle cost curve is also provided in Metric ($/kg, $/m3) and English units ($/lb, S/ft3) for maximum utility. These summary level curves should only be used when the O&M period of 20 years is required.
The capacity units of measure for the WMFCI modules have been provided in terms of processing rates (kg/hour, m3/hour) for administration, treatment, and certification and shipping modules. The capacity units of measure for the disposal module has been provided in terms of total capacity (total m3). Table 1-2 shows an example of a module cost estimate data sheet and top-level elements of a typical estimate. This table illustrates the four major Work Breakdown Structure cost elements.
1.5 Cost Estimation Procedure
A detailed cost estimation procedure and waste load data sheets are presented in Section 14. Applying estimates in this report requires the following basic steps:
1. Define the treatment process selection based on the waste stream requirements (waste type), TSD requirements, final waste form, and operating parameters. Use integrated flow sheets containing the modules. Define the required support module requirements.
2. Define the total capacity requirements for each module.
3. Prepare cost estimates for each module required to provide TSD for the waste stream, using the module cost curves.
4. Add the individual module costs to obtain a total waste stream cost.
5. Add transportation costs for off site shipments to obtain the total option cost.
1.6 Limitations
Appendix A of the WMFCI report (Feizollahi and Shropshire 1992) can be consulted regarding limitations and qualifications that apply to development of PLCC estimates. To apply cost data from this report, the reader must ensure that the front-end and back-end support modules and any linked treatment modules (e.g., stabilization and aqueous waste treatment modules required for secondary waste) are currently available at the installation. If not available, the PLCC estimates for a new module, as presented in this report, must be incorporated in the overall facility estimates. When using existing facilities, the appropriate operating and maintenance costs must be added to the overall facility costs.
1-6

Table 1-1. Capacity ranges of modules developed for hazardous waste.
Module Module abbreviation Capacity range
Treatment front-end common functions
Treatment administration TADMN 454 to 1,134 kg/hr
Receiving and inspection RCINS 454 to 1,134 kg/hr
Assay, sort, and package ASPAK 209 to 1,243 kg/hr
Primary treatment
Aqueous waste treatment AQWTR 454 to 3,400 kg/hr
Incineration INCIN 227 to 907 kg/hr
Organic removal ORGRM 45.4 to 454 kg/hr
Recycling RECYC 2 to 23 kg/hr
Deactivation DEACT 22.7 to 227 kg/hr
Mercury separation RMERC 45 to 113 kg/hr
Secondary treatment and stabilization
Grout stabilization GROUT 45 to 454 kg/hr
Treatment back-end common functions
Certification and shipping CSHIP 204 to 8,255 kg/hr
Disposal
Shallow land disposal SLDSP 2,217 to 66,520 m3 SLDSP
1-7

Table 1 -2. Sample PLCC estimate summary for incineration module.
Module Name: Incin Option Name: Example
Waste Type: • MLLW D HLW D M-TRU n LLW • Hazardous
D alpha D non-alpha • contact handled • remote handled
Module Location: Example
Module Status: D Existing • New • Small generator • Large generator • On-Site • Off-Site D Portable D Commercial • R&D
Reference Capacity Requirement: 907 (kg/hr. m3/hr. m 3)
WBS Element (S x 1000)
SubS (S x 1000) Element $
1.0 Pre-Operations 1.1 Studies and Bench Scale Test Costs 1.2 Demonstration Costs 13 Operations Budget Funded Activities
13.1 Conceptual Design 13.2 Safety Assurance Documentation 1 3 3 Permitting 13.4 Preparation for Operations 1.3.5 Project Management
TOTAL PRE-OPERATIONS
2.0 Facility Construction Costs Z l Design (Title I and II) 2.2 Inspection 2.3 Project Management 2.4 Building Construction (includes indirect) 2.5 Equipment (includes indirect) 2.6 Construction Management 2.7 Other (includes reserve and contingency)
TOTAL FACILITY CONSTRUCTION COSTS
3.0 Operations and Maintenance 3.1 Annual Operating Labor 3.2 Annual Utilities 3.3 Annual Materials 3.4 Annual Maintenance 3.5 Annual Other (includes reserve and contingency)
TOTAL ANNUAL O&M x NUMBER OF YEARS OF OPERATION TOTAL OPERATIONS AND MAINTENANCE
$ 0 $ 0
S 331 S 221 S 0 S 4,865 $ 542
S 1.177 S 589 S 1.177 $ 959 $10,814 $2,013 $5359
S 2.660 S 88 $ 270 $ 874 $ 973 $4,865
x 10 years
$ 5.959
$22,088
$48,650
4.0 Decontamination and Decommissioning 4.1 Facility D&D 4.2 Closure, Post-Closure, Monitoring
TOTAL DECONTAMINATION AND DECOMMISSIONING
TOTAL COST FOR: Incin MODULE
$ 313 $ 209
(1994 Dollars)
$ 522
$77,219
1-8
HM/S :31VQ 101d uSp-Q0H2»H/1250/:0
im
o < 4 - l
U CO
§ s 09
1 >
60 O
1 1-9

Process flow
diagram
Spreadsheet 2 -Development, testing j
and evaluation costs
Functional and operational description
mmmmmMmB mmumm
Equipment list
I Spreadsheet 1 -
Equipment purchase| and installation cost estimates
Spreadsheet 3 -Building and
equipment cost estimate summary
I Percentage of facility
construction and operating and
maintenance costs
Spreadsheet 4 -Annual operating and maintenance
costs
Spreadsheet 6 -PLCC estimate summary
1.0 - Studies and bench scale tests
2.0 - Demonstration
3.0 - Facility construction costs
4.0 - Operations-budget-funded activities
5.0 - Operating and maintenance costs
6.0 - Decontamination and decommissioning
• Cost estimating spreadsheets
Pre-conceptual design document
Spreadsheet 5 -Decontamination and
decommissioning costs
RED KB 0018
Figure 1-2. PLCC estimating steps.
1-10

2. TREATMENT ADMINISTRATION (MODULE TADMN)
2.1 Basic Information
The treatment administration module includes all administrative and laboratory buildings required for waste management support functions. The treatment adrninistration module is essentially the same for all treatment facilities regardless of their capacity. Treatment administration should be used whenever a new facility is planned.
2.2 Technical Bases and Assumptions
2.2.1 Function and Operation of Module
The treatment administration module incorporates all technical and administrative support functions needed to manage the operation of a waste management facility. These functions include security, access control including personnel decontamination, maintenance of uncontaminated areas and equipment, health physics and radiation badges, facility access control, sanitary facilities, work control and personnel support, internal and external (public relations) communications, spill or emergency response provisions, analytical laboratory, environmental field sampling, environmental regulatory reporting, and records management.
2.2.2 Integration of Module
The treatment administration module maintains general interfaces with all treatment modules. O&M consumables include analytical supplies, office supplies, sanitary supplies, and personal protective equipment, which must all be purchased.
2.3 Cost Bases, Assumptions, and Results
Major equipment capital cost items are laboratory analytical equipment. A $750,000 allowance is made for instruments and components needed for an analytical laboratory. The overall cost for this module is approximately one-third the cost for the MLLW/LLW module because of lower equipment costs, the use of industry standard metal-sided buildings, less administrative personnel because of fewer regulatory requirements, and because it is more in line with private sector manning and D&D requirements. The laboratory has been sized to support a 10% sampling and analysis capability. These costs should be modified if less or more sampling is expected. Table 2-1 lists the plan dimensions of the module. Figure 2-1 shows the relationship between estimated FTE workers and capacity of the module. Figures 2-2 and 2-3 show the relationship between PLCC and capacity.
2-1

Table 2-1. Plan dimensions of the treatment administration (H-TADMN) module.
Dimensions Dimensions (ft) (m)
Module size A B A B
Small 100 92.5 30.5 28.2
Medium 100 172.5 30.5 52.6
Large 100 265.0 30.5 80.8
2-2

30
25
20
111
*- 15 re E 35 V> 111
10
400
TREATMENT ADMINISTRATION FTE by Work Breakdown Structure Element Module: TADMN Waste Type: Hazardous
600 800 1,000 Input Capacity (kg/hr)
Pre-Operations Construction O&M (1year) D&D
1,200
Figure 2-1. FTE workers versus capacity for the treatment administration (H-TADMN) module.
2-3

•4-t (0 o
© (0
.1 +3 (0 ,
TREATMENT ADMINISTRATION Cost by Work Breakdown Structure Element Module: TADMN Waste Type: Hazardous
i _ __
1 • . - !• - * *
G9 • , *
i-^ • • • • • • • *
|
i
— • - ! • - — '
400 600 800 1,000 input Capacity (kg/hr)
Pre-Operations Construction O&M (1year) D&D
1,200
Figure 2-2. PLCC versus capacity for the treatment administration (H-TADMN) module.
2-4

70
60
«» 50
(0
o 40 o •o JS 30 CO U
lj ?0 CO UJ
10
400
TREATMENT ADMINISTRATION Total Life Cycle Costs
Module: TADMN Waste Type: Hazardous
• " " " '
i
1
l
l i
i
l
i*. 4 5 4 ! ! > ^ 1 1 3 4
600 800 1,000
Input Capacity (kg/hr)
Hazardous
NOTE: Basis includes 20 years O&M Triangles indicate capacities where detailed cost estimates were developed.
1,200
1.4
J£ 1.2
(0 o O 1 •o £ a E '•s °-8
0.6 400
TREATMENT ADMINISTRATION Total Life Cycle Unit Costs
Module: TADMN Waste Type: Hazardous
J W - -1- j '
' ^ k ^ i — 1 i :
600 800 1,000
Input Capacity (kg/hr)
Hazardous
— 0.6
- 0.5 (0 o o •o
0.4 5
* 5 CO UJ
- 0.3
1,200
NOTE: Basis includes 20 years O&M
Figure 2-3. PLCC versus capacity including unit rates for the treatment administration (H-TADMN) module.
2-5

3. RECEIVING AND INSPECTION (MODULE RCINS)
3.1 Basic Information
The equipment layout for the receiving and inspection module, shown in Figure 3-1, is intended to be contiguous with the assay, sort, and package module and the waste treatment modules. This module is capable of receiving hazardous waste by rail or by truck. It consists of three unit operations: (a) railcar receiving, (b) truck receiving, and (c) storage. The containers of waste (in drums, boxes, and metal bins) arrive at the facility on a wheeled vehicle. Containers are removed from the vehicle and placed in a staging or storage area. The containers are visually examined, labeled, logged, and recorded in a database system. Unit operations are shown in the PFD in Figure 3-2.
The receiving and unloading area is equipped with a bridge crane and a forklift truck. It is designed to receive and unload containers from flat-bed trailers or van trucks. Containers brought in large overpacks can also be unloaded.
3.2 Technical Bases and Assumptions
3.2.1 Function and Operation of Module
Wheeled vehicles are used to ship the containers (in overpacks, if necessary) from the generators to the receiving and inspection module. These vehicles are not included in the module. In the unloading and staging area, the vehicles are unloaded, and containers are placed in the staging area. Surge storage is also provided.
Containers are unloaded in an enclosed truck bay and placed in an indoor staging area. The area is large enough to maneuver the containers and provide sufficient surge storage capacity to meet the desired operational reliability.
After the containers are labeled, the contents, if known, are logged. They are then weighed and measured to determine waste density. Data gathered are then recorded in a material tracking database system. To allow year-round operations and to minimize the effects of a potential spill, it is assumed that the unloading and staging operations will take place indoors.
3.2.2 Integration of Module
In addition to general interfaces typical for all modules, waste from generator facilities becomes input to the receiving and inspection module. O&M consumables, including personal protective equipment, must be purchased. Module output consists of containers of hazardous waste that are moved to the assay, sort, and package module or to treatment modules.
3-1

3.3 Cost Bases, Assumptions, and Results
Cost bases and assumptions were derived from a variety of sources. Major equipment capital cost items for this module include a 20-ton bridge crane. The crane cost is based on vendor quotations.
The overall cost for this module is 20-25% of a similar module for MLLW/LLW. This is principally a result of not having to handle radioactive waste. The necessary equipment is approximately 50% of that required for MLLW/LLW, the use of industry standard metal-sided buildings results in a building cost of 30-50% of that needed for MLLW/LLW, operating/maintenance is 25% of MLLW/LLW, and D&D is approximately 10-20% of MLLW/LLW because of the lack of radioactive waste.
Figure 3-3 shows the relationships between estimated FTE workers and capacity of the module. Figures 3-4 and 3-5 show the relationship between PLCC and capacity.
3-2

TRUCK LOADINC BAY
FACILITY SIZE DIMENSION
IN FEET DIMENSION IN METERS FACILITY SIZE
A B A B SMALL - - - -
MEDIUM 50 117 15.3 35.7
LARGE 60 100 18.3 30.5
WASTE STORAGE AREA-
NOTE. WALLS NOT SHOWN FOR CLARITY
Figure 3-1 . Equipment layout for the receiving and inspection (H-RCINS) module.
EQUIPMENT LIST
0 INSPECTION AND ASSAY 0 BRIDGE CRANE AND LOAD GRAPPLER ® FORK LIFT
FILENAME: H-RCINS.DGN PLOT OATEs 5/26/94

INPUT PROCESS OUTPUT
<Tl
—^- (^)
<Tl
—^- (^)
OTHER UNIT OPERATIONS:
4 ELECTRICAL DISTRIBUTION «. MCC 5 HEATING, VENTILATION & EXHAUST 6 OTHER EQUIPMENT
<Tl
—^- (^)
<Tl
—^- RAILCAR RECEIVING
( 1 ) (^)
<Tl
(Tl
—^- RAILCAR RECEIVING
( 1 )
<Tl
(Tl
—^-
V
<Tl
(Tl
—^-
STORAGE ( 3 )
(7) HAZARDOUS \ <Tl
(Tl
—^-
STORAGE ( 3 )
(7) HAZARDOUS \ WASTE / yV
(Tl
—^-
STORAGE ( 3 ) w WASTE /
F ROM GENERATOR yV
(Tl
—^-
STORAGE ( 3 ) w
1 TO ASSAY. SORT. [ AND PACKAGING
ROM GENERATOR yV
(Tl
—^-
M
ROM GENERATOR yV
(Tl
—^-
TRUCK RECEIVING
( 2 ) 3-4
ROM GENERATOR yV
\U TRUCK
RECEIVING ( 2 ) \D 3-4
ROM GENERATOR yV
\U \D
NODE 1 2 3 4
DESCRIPTION INCOMING WASTE
RAILCAR WASTE
TRUCK WASTE
TOTAL WASTE
LB 100 30 70 too
Figure 3-2. Process flow diagram for the receiving and inspection (H-RCINS) module.

14
12
10
HI 1 - 8 u. "D 0)
•*•> CO E
sti
6 HI
RECEIVING AND INSPECTION FTE by Work Breakdown Structure Element
Module: RCINS Waste Type: Hazardous
. . — , - 2 . » f 8 '
_a«J?Y
,.„,...-<-"••' » "̂«» •
i,;̂ ***** T
400 600 800 1,000
Input Capacity (kg/hr)
Pre-Operations Construction O&M (1year) D&D
1,200
Figure 3-3. FTE workers versus capacity for the receiving and inspection (H-RCINS) module.
3-5

i f*
(0 o o S S <0
IXJ
RECEIVING AND INSPECTION Cost by Work Breakdown Structure Element
Module: RCINS Waste Type: Hazardous
i
. . . . . . mrrvrmmn-9-mm'%-9 ~mm * • -wm «- w mar ww mrm
! i
wmm-*-*-mm-*-* -*» * • -man
400 600 800 1,000
Input Capacity (kg/hr)
Pre-Operations Construction O&M (1year) D&D
1,200
Figure 3-4. PLCC versus capacity for the receiving and inspection (H-RCINS) module.
3-6

V*
16
14
12
(0 10 o o .
re 6
UJ
400
RECEIVING AND INSPECTION Total Life Cycle Costs
Module: RCINS Waste Type: Hazardous
i
j*>«* : i , T ^ « 3 4 600 800 1,000
Input Capacity (kg/hr)
Hazardous
NOTE: Basis includes 20 years O&M Triangles indicate capacities where detailed cost estimates were developed.
1,200
0.35
!
I 1
0.3
0.25
I 3 ° 2
0.15
RECEIVING AND INSPECTION Total Life Cycle Unit Costs
Module: RCINS Waste Type: Hazardous
^ ^ ^ + i - • i " +•
_ T , .. , _ -^^^^^^ -^- . r
600 800 1,000
Input Capacity (kg/hr)
Hazardous
NOTE: Basis includes 20 years O&M
- 0.14"
(0 - 0.12 O
0>
0.1 re
111 - 0.08
1,200
Figure 3-5. PLCC versus capacity including unit rates for the receiving and inspection (H-RCINS) module.
3-7

4. ASSAY, SORT, AND PACKAGE (MODULE ASPAK)
4.1 Basic Information
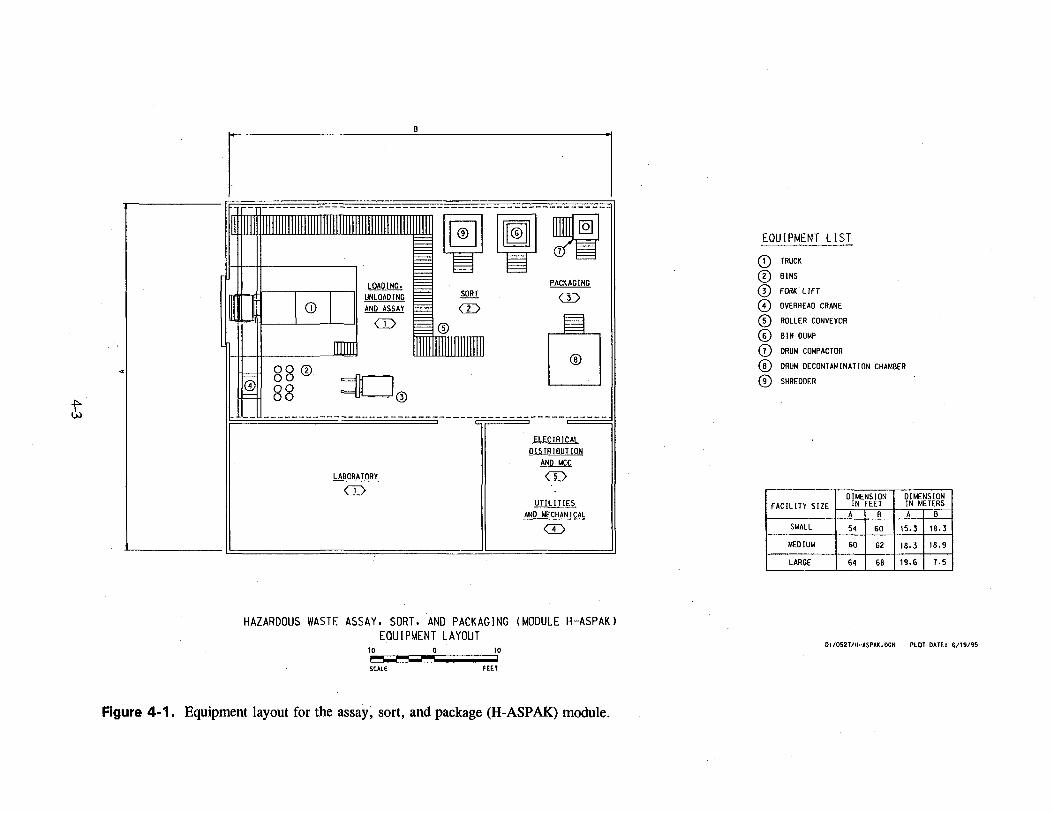
The equipment layout for the assay, sort, and package module, shown in Figure 4-1, is designed to be contiguous with the treatment facilities and is ideal for use with an integrated waste management facility that handles multiple waste streams. The module opens the incoming waste containers and segregates the waste so it can be fed to a combination of treatment processes. The module handles the waste in drums, boxes, or metal bins that are assumed to be properly characterized by the generator prior to shipment. The module is equipped with a small laboratory designed to perform confirmation sampling and analysis, and has the capability to reduce the size of empty containers. This module is not needed if the waste arrives presorted. Unit operations are given in the PFD in Figure 4-2.
4.2 Technical Bases and Assumptions
4.2.1 Function and Operation of Module
At the assay, sort, and package module the waste containers may be opened and sampled to characterize the waste and to ensure that the incoming waste meets the waste acceptance criterion of its designated treatment facility. This characterization will not be necessary if the waste arrives already characterized.
Containers of hazardous waste are opened manually. If necessary, contents may be sampled. If a receiving container is damaged, its content may be transferred to another container. Empty containers are size reduced and added to a compatible waste stream. An onsite laboratory provides characterization capability. This laboratory is designed primarily to perform quality control and quality assurance functions. Adequate hoods and supporting ventilation are provided to minimize the spread of dust and contamination where necessary. Equipment maintenance is accomplished manually.
After the waste containers are received they are sorted into nine categories. Two of these categories are homogenous waste and heterogenous waste. Containers of homogeneous waste are sent to treatment modules, without further sorting. Containers of heterogeneous waste are opened, dumped, manually sorted, and sent to treatment modules.
The waste in containers that are designated for segregation is dumped onto a sorting area, which removes bulk metal, noncombustibles, semicombustibles, combustibles, special waste,d
and gas cylinders. Sorting is done manually and with the use of equipment such as backhoes and front-end loaders. Spilled liquid is collected and sent to other unit operations for treatment. The sorted waste material is placed in transfer bins and moved to the treatment modules. Nonmetallic containers are cut into smaller pieces as required for processing.
d. Special wastes are those materials that are incompatible with the treatment techniques provided in the facility (e.g., mercury). After identification and segregation, special wastes are treated by mobile units provided on a case-by-case basis.
4-1

4.2.2 Integration of Module
In addition to general interfaces for all modules, input interfaces to the assay, sort, and package module are waste containers from the receiving and inspection module. O&M consumables, including personal protective equipment, are purchased. Output interfaces include sending solid sorted waste to treatment. Reusable empty metal drums and boxes are cleaned and recycled. Empty wood and fiberglass boxes are shredded and sent to treatment modules.
4.3 Cost Bases, Assumptions, and Results
Major equipment capital cost items for this module are overhead crane, analytical equipment, and forklift truck. The costs for these items are developed based on vendor quotes. Figure 4-3 shows the relationship between estimated FTE workers and capacity of the module. Figures 4-4 and 4-5 show the relationship between PLCC and capacity.
Input capacities for the assay, sort, and package module should be based on the amount of uncharacterized waste to be treated. Presorted and newly generated waste might already be sufficiently characterized to go directly to treatment. Uncharacterized and new "unknown" waste would require the assay, sort, and package module.
This sorting module cannot be directly compared to the MLLW/LLW OSORT module because of the major differences in the wastes sorted, segregated, and transferred to treatment and because wastes with potentially high TRU characteristics are not involved.
4-2
w ©
®
_M
LOADING. UNLOADING AND ASSAY CD
© =
© .——-
SORT CO
88© 88 ® =1 c:
LABORATORY CD
CD
ELECTRICAL DISTRIBUTION
AND MCC CD
UTILITIES AND MECHANICAL
CD
HAZARDOUS WASTE ASSAY. SORT. AND PACKAGING (MODULE H-ASPAK EQUIPMENT LAYOUT
10
SCALE
Figure 4-1. Equipment layout for the assay, sort, and package (H-ASPAK) module.
EQUIPMENT LIST 0 TRUCK 0 BINS (5) FORK LIFT @ OVERHEAD CRANE (?) ROLLER CONVEYOR 0 BIN DUMP 0 DRUM COMPACTOR 0 DRUM DECONTAMINATION CHAMBER 0 SHREDDER
FACILITY SIZE DIMENSION IN FEET
DIMENSION IN METERS FACILITY SIZE
A B A B SMALL 54 60 15.3 18.3 MEDIUM 60 62 18.3 18.9
LARGE 64 6B 19.6 7.5
D;/0527/H-ASPAK.DCN PLOT DATE: 6/19/95

INPUT PROCESS OUTPUT
• ^
^
HAZARDOUS WASTE >
FROM RECEIVING AND INSPECTION
OTHER UNIT OPERATIONS: 4 UTILITIES & MECHANICAL 5 ELECTRICAL DISTRIBUTION A MCC 6 HEATING. VENTILATION & EXHAUST 7 OTHER EQUIPMENT
-o- INSPECT AND ASSAY
(1) SORT (2)
PACKAGE AND SHIP
(3) - &
NODE 1 2 3 4 5 6 7
DESCRIPTION INCOMING WASTE
ASSAYED WASTE
PACKAGED WASTE
ASSAYED/ PACKAGED WASTE
UNSTABILIZED WASTE
AOUEOUS WASTE DEBRIS
L8 100 100 100 100 15.5 2.1 1.2
NODE a 9 10 11 12 13
DESCRIPTION INCINERATION WASTE METAL
WASTE MERCURY WASTE
ORGANIC WASTE
DEACTIVATION WASTE
RECYCLE WASTE
LB 40.3 0.7 0.5 33.1 6.1 0.5
<5>4-
<&
•**1 T y~*"i ^
<*>
^0>-
• < & - +
-©-
UNSTABILIZED WASTE
TO STABILIZATION
AOUEOUS WASTE
TO AQUEOUS WASTE TREATMENT
DEBRIS
TO LANDFILL
INCINERATOR WASTE
TO INCINERATION
AQUEOUS METAL WASTE. TO AOUEOUS
WASTE TREATMENT MERCURY WASTE
TO MERCURY SEPARATION ORGANIC WASTE
TO ORGANICS REMOVAL
DEACTIVATION WASTE
TO DEACTIVATION
RECYCLE WASTE
TO RECYCLING
Figure 4-2. Process flow diagram for the assay, sort, and package (H-ASPAK) module. D:/0527/HAZARD.DGN PLOT DATE: 5/31/94

20
18
16
UJ 14 I -U.
•D
CO
£ 12
(0 LU
10
4
ASSAY, SORT, AND PACKAGE FTE by Work Breakdown Structure Element
Module: ASPAK Waste Type: Hazardous
! d
• 1
/ •
• /
! /
•
1 «
_ A < ___
.' / • i
i-& ^ js j " " 1 •
. - • t ^ ^r /
- . 1 d^ - - _'..-• *
. - ; • "
, . . - " ••*
1 ' ' i '
200 400 600 800 1,000 1,200 1,400 Input Capacity (kg/hr)
Pre-Operations Construction O&M (1year) D&D
Figure 4-3. FTE workers versus capacity for the assay, sort, and package (H-ASPAK) module.
4-5

ASSAY, SORT, AND PACKAGE Cost by Work Breakdown Structure Element
Module: ASPAK Waste Type: Hazardous
; ; ; ; ; ; / ;
— . i . i 4 i I i L / _ . . . _ . i
! i . : ; : 1/ i U-A i x I i • • ' • » ' •
\ ; : : : / : / :
....L..4...1 .J..J...J **—-^? 1 I I I ! I • I | I I I I » I # I I
j j . \ ^ ^ - ~ - J ' ! i T
; : jr* / • i i i 1 1 3 ^ — r * *—i 1 1 1 1 r
X s • < X *< * i — • • • i
. X ' * . - » « *
i / - ' . / H i ! i i . r # , 1 1 . 1 . 1 1 ,_
* , # i
: / / : : : : • 0i i i i i i I 0 I I I ! I I ! # I I I . I I i r - # _ _ i 1 i | I X I 0 I I I I I I
0 200 400 600 800 1,000 1,200 1,400 Input Capacity (kg/hr)
Pre-Operations Construction O&M (1year) D&D
-4. PLCC versus capacity for the assay, sort, and package (H-ASPAK) module.
4-6

CO
o o •o 0)
(0 UJ
80
60
40
20
ASSAY, SORT, AND PACKAGE Total Life Cycle Costs
Module: ASPAK Waste Type: Hazardous
V
/ •
208 i 1243:
200 400 600 600
Input Capacity (kg/hr)
Hazardous
1,000 1,200 1,400
NOTE: Basis includes 20 years O&M Triangles indicate capacities where detailed cost estimates were developed.
1.8
- ^ 1.6 TO
Hi O U 1.2 "O <u
UJ 0.8
0.6
ASSAY, SORT, AND PACKAGE Total Life Cycle Unit Costs
Module: ASPAK Waste Type: Hazardous i i i i ! i I
I
I I
" ; I
i
\ i i
i i
i ; i — — m m |
, , T " " : i - - - ; - -200 400 600 800 1,000 1,200
Input Capacity (kg/hr)
Hazardous
0.7 .O
0.6 I** o o •o
05 a>
E 0.4 "»
111
0.3
1,400
NOTE: Basis includes 20 years O&M
Figure 4-5. PLCC versus capacity including unit rates for the assay, sort, and package (H-ASPAK) module.
4-7

5. AQUEOUS WASTE TREATMENT (MODULE AQWTR)
5.1 Basic Information
The equipment layout for the aqueous waste treatment module, shown in Figure 5-1, must be either used in conjunction with the receiving and inspection (RCINS) module and grout stabilization (GROUT) module or installed at a location where similar functions are available in existing facilities.
The aqueous waste treatment module collects and treats input aqueous waste, which is generally assumed to contain less than 1 % total organic carbon. The aqueous waste may be received at the module in cans, drums, special transport containers having several different capacities, or by pipeline. In addition to the input waste, the aqueous waste treatment module treats the secondary waste (floor drains, equipment drains, and chemical wastes) from the waste treatment facilities. This module consists of eight treatment and five support unit operations. Treatment unit operations include: metal waste pretreatment, wet air oxidation, biological treatment, chemical redox, metal precipitation, sludge preparation, concentration, and water purification. These unit operations are shown in the PFD in Figure 5-2.
5.2 Technical Bases and Assumptions
5.2.1 Function and Operation of Module
The aqueous waste treatment module has all the unit operations needed for treating an incoming liquid waste having a broad range of toxic, heavy-metal, and organic contaminants that are regulated under the Resource Conservation and Recovery Act (RCRA) or Toxic Substances Control Act (TSCA). Toxic metal contaminants can include mercury, cadmium, chromium, and lead. Organic contaminants can include volatile organic compounds, such as carbon tetrachloride, chloroform, methylene chloride, tetrachloroethylene, trichlorethylene, and trichloroethane; aromatics, such as benzene, toluene, and xylene; alcohols; glycols; ketones, such as methyl ethyl ketone and methyl isobutyl ketone; phenols; and petroleum compounds. The unit operations also have the capability to treat secondary liquid waste generated by the waste treatment facility, such as distillate from air pollution control system, rinse water from container washdown operations, and liquid collected from the module equipment and floor drains.
It is assumed that streams containing gross organics are first processed through the organic removal module prior to reaching the aqueous waste treatment module. The organics from the organic removal unit are collected and sent to the incineration module. The aqueous waste containing dissolved organics is sent to the aqueous waste treatment module.
The incoming liquid waste is separated into four streams. Liquid streams requiring oxidation or reduction, such as streams containing hexavalent chromium, are sent to the chemical redox unit operation. Streams containing hydrocarbons such as ketones are sent to the biological treatment unit operation. Streams containing lower boiling point hydrocarbons are sent to the wet-air oxidation unit operation. Waste streams high in dissolved metals are
5-1

sent through the metal pretreatment unit operation then to the metal precipitation unit operation, where chemicals are added to neutralize, precipitate, and enhance settling of solids as sludge. The sludge is sent to the sludge settler unit, where the water is removed and the resulting concentrated sludge is sent to the grout stabilization module. Supernate from the settling unit is sent to the ion exchange unit operation for final polishing prior to being discharged from the facility.
The aqueous waste treatment unit operations have maximum flexibility and can be used in series, in parallel, or as stand-alone units. Flexible piping connectors are provided at the inlet and outlet of each treatment device. The waste is transferred from the transport containers to appropriate batch tanks or directly to a desired treatment unit operation.
5.2.2 Integration of Module
Input waste to the aqueous waste treatment module comes from the receiving and inspection module or from onsite waste generators which have been precharacterized. Other input includes secondary aqueous waste from other treatment modules such as the incineration or grout stabilization modules. Output from the aqueous waste treatment module to the grout stabilization module includes spent resins, spent carbon, and concentrated sludge. Treated water output is sent to various modules for reuse. Materials purchased for O&M, such as personal protective equipment, ion-exchange resins, activated carbon, chemicals, and containers, are assumed to be consumable supplies, and their costs are estimated accordingly.
5.3 Cost Bases, Assumptions, and Results
Major equipment includes the precipitation and neutralization unit, backflushable filters, ion exchanger, wet-air oxidation unit, charcoal filter, and concentrator unit. Their costs are based on costs submitted by various vendors.
Over a similar range of processing rates, the cost for this module is 25-40% of the cost for the MLLW/LLW aqueous waste treatment module. The differences are because of less stringent equipment requirements, the buildings are constructed as industry standard metal-sided prefabricated units, and O&M costs at approximately 30-40% of an MLLW/LLW operation because radioactive wastes are not being handled and D&D costs are greatly reduced because of the lack of radionuclides.
FTEs versus capacity for the aqueous waste treatment module are shown in Figure 5-3. Cost versus capacity is shown in Figures 5-4 and 5-5.
5-2

I
ELECTRICAL DISTRIBUTION
AND MCC <I>
(35) (li WET AIR OXIDATION
UTILITIES AND MECHANICAL CD
CHEMICAL REDOX
^®) BIOLOGICAL TREATMENT <J>
©
Figure 5-1 . Equipment layout for the aqueous waste treatment (H-AQWTR) module.
EQUIPMENT LIST 0 INCINERATOR WASTE STORAGE TANK (?) Hg WASTE STORAGE TANK (?) WET AIR OXIDATION STORAGE TANK (7) MIX TANK (?) PUMP (?) BIOLOGICAL TREATMENT STORAGE TANK (7) PHOSPHOROUS 4 NITROGEN STORAGE TANK (?) TREATMENT TANK WITH AGITATOR ??? (?) CLARIFIER © SLUDGE STORAGE TANK (n) HIGH PRESSURE PUMP @ CHEMICAL REDOX STORAGE TANK (U) CHEMICAL STORAGE TANK @ BATCH TANK WITH AGITATOR © MIX TANK @ PROCESS AIR COMPRESSOR @ EFFLUENT PUMP (LB) HOT OIL HEAT EXCHANGER
(jj) FEED AND EFFLUENT HEAT EXCHANGER @ PROCESS COOLER (2j) PROCESS REACTORS (22) HOT OIL SYSTEM @ SEPARATOR @ PRESSURE CONTROL VALVES @ CONTROL PANEL @ WASTE WATER FEED PUMP (27) VAPOR PHASE ACTIVATED CARBON (26) BLOWER (29) CHEMICAL STORAGE TANK @ CHEMICAL PUMP (Sj) CHEMICAL BLENDING TANK @ CHEMICAL PUMP (33) STACK (34) CONCENTRATOR AND CONDENSER @ DILUTION WATER FEED
FACILITY SIZE DIMENSION IN FEET DIMENSION IN METERS FACILITY SIZE A B A B
SMALL 66 66 20.1 20.1 MEDIUM 71 71 21.7 21.7 LARGE 75 75 22.9 22.9
HAZARDOUS WASTE AQUEOUS WASTE TREATMENT (MODULE H-AQWTR) s EQUIPMENT LAYOUT |
10 SCALE

INPUT PROCESS OUTPUT
HAZARDOUS WASTE
FROM GENERATORS OR TREATMENT MODULES
METALS CONTAMINATED HAZARDOUS WASTE FROM GENERATOR
< ! >
.22}
•®~
rWATER>|—(T5>-»- OFFGAS TREATMENT
-<3H (5)
WET AIR OXIDATION
( 2 ) -©- CONCENTRATOR (5)
H2M CHEMICALS ,~v BIOLOGICAL
-\2) »• TREATMENT 13) <2>
-©T-<*>
CHEMICAL REDOX
8)—(CHEMICALS
CHEMICAL REDOX UNIT (A)
! METALS TREATMENT SUBSYSTEM OF AQUEOUS WASTE TREATMENT MODULE (SEE SHEET 2 OF 2)
M-
<&
^ >
•<g>-
_̂ , TREATED ~^ OFFGAS TO ATMOSPHERE
SLUDGE TO STABILIZATION
TREATED MATERIAL
TO STABILIZATION
NODE 1 2 3 4 5 6 7 S 9 10 11 12 13 11 15
DESCRIPTION INCOMING WASTE WASTES WASTES CHEMICALS WATER
BIO-TREATED MATERIAL
BIO-SEMI TREATED MATERIAL
CHEMICALS REDOX TREATED MATERIAL
BASE WATER AIR OFFGAS SLUDGE WATER
LB/HR 100 20.0 76 0.1 1.9 11.0 11.0 0.5 76.5 1.6 2.0 33 33 25.6 4.4
NODE 16 17 18 19 20 21 22
DESCRIPTION BLOWDOWN TREATED OFFGAS
SEMI-TREATED MATERIAL SLUDGE WASTES METAL
WASTE METAL
WASTE FROM GENERATOR
LB/HR 4.4 33 27 3 4 114.5 100
Figure 5-2. Process flow diagram for the aqueous waste treatment (H-AQWTR) module.

INPUT PROCESS OUTPUT
METALS \ BEARING V . AOUEOUS / WASTE / FROM GENERATOR FROM AOUEOUS WASTE! TREATMENT MODULE
<!>
ACID>-REDOX CHEMICALS
,~ METAL WASTE -(2)—•" PRETREATMENT w (1)
<D-
UL1>-0-
[WER>—(?)—+•
SULFIDE PREPARATION (10)
7) (17)
METAL PRECIPITATION (5) SLUDGE -/7JY-*. SETTLER
v-^ (7)
LIME PREPARATION (6)
-®-WATER PURIFICATION (9) -©-
TREATED OFFGAS TO ATMOSPHERE
TREATED WATER TO RECYCLE
SPENT RESIN
TO STABILIZATION METAL
SLUDGE
TO STABILIZATION
NODE 1 2 3 4 5 6 7 8 9 10
DESCRIPTION INCOMING WASTE
UNTREATED HEAVY METAL
HEAVY METAL OFFGAS REDOX
CHEMICALS ACID TREATED METAL LIME WATER LIME
SLURRY LB/HR 100 50.0 50 0.1 1.2 0.6 51.7 1.1 53.9 55.0
NODE 11 12 13 14 15 16 17 18
DESCRIPTION METAL SLURRY
CLARIfiLO WATER
UM.ML'D WAILR
METAL SLUDGE WAFER BISULFIDE BISULFIDE
SOLUTION SPENT RESIN
LB/HR 157.T 152.1 151.3 5.6 0.9 0.1 1.0 0.8
Figure 5-2. (continued).

40
30
UJ t-u_ •a 2 20
w LU
10
AQUEOUS WASTE TREATMENT FTE by Work Breakdown Structure Element Module: AQWTR Waste Type: Hazardous
+- 4 . > . , j { ^ ^ ^ 1
T • • - ^ ^ ^ : i l 1 1
I i j : : i i L . i- •
\ \ \. J -•!""".; r * f ' . • • • • * '
i 1 j -r—^ L . - ? " ' j i 1 i—
: -.:.r- : :
500 1,000 1,500 2,000 2,500
Input Capacity (kg/hr)
Pre-Operations Construction O&M (1year) D&D
3,000 3,500
Figure 5-3. FTE workers versus capacity for the aqueous waste treatment (H-AQWTR) module.
5-6

12
10
•4-t tn O O •a S (0 E tn UJ
AQUEOUS WASTE TREATMENT Cost by Work Breakdown Structure Element Module: AQWTR Waste Type: Hazardous
"""": " "j ;---:----p~----£T^----j-
1 -• 1 ! - - a ^ t 1 -• r 1
] r j ] 1 j j _ _
500 1,000 1,500 2,000 2,500 Input Capacity (kg/hr)
Pre-Operations Construction O&M (1year) D&D
3,000 3,500
Figure 5-4. PLCC versus capacity for the aqueous waste treatment (H-AQWTR) module.
5-7

AQUEOUS WASTE TREATMENT Total Life Cycle Costs
Module : A Q W T R Waste Type : Hazardous
2
CO o o o (0 E CO
UJ
70
60
50
40
30
20
10
' i 1 i i
! __ , ~~ __ , ~~
~
! ^ 45 ' 1 , ^ 500 1,000 1,500 2,000 2,500
Input Capacity (kg/hr)
Hazardous
NOTE: Basis includes 20 years O&M Triangles indicate capacities where detailed cost estimates were developed.
AQUEOUS WASTE TREATMENT Total Life Cycle Unit Costs
Module: AQWTR Waste Type: Hazardous 0.9
0.8
iC 0.7
<*>• 0.6 CO o o 0.5
re 0.4
E 0.3
UJ 0.2
0.1 500 1,000 1,500 2,000
Input Capacity (kg/hr)
Hazardous
2,500
3,000
3,000
3,500
- 4 ; i
X ' -r-
- -
-i | -
, 1 ^^^ •
r i ~ r " " -
i .
- i
;
0.4
0.3 « •
O
o - 0.2 O
re E CO
UJ 0.1
3,500
NOTE: Basis includes 20 years O&M
Figure 5-5. PLCC versus capacity including unit rates for the aqueous waste treatment (H-AQWTR) module.
5-8

6. INCINERATION (MODULE INCIN)
6.1 Basic Information
The equipment layout for the incineration module is a thermal (flame) organic destruction unit. The incineration module, shown in Figure 6-1, must be either used in conjunction with the receiving and inspection (RCINS) module and grout stabilization (GROUT) module or installed at a location where similar functions are available in existing facilities.
The incinerator module receives and treats input organic solid waste, including process solid residues and organic and heterogeneous (i.e., combustibles comingled with noncombustibles) debris. Other material, such as organic liquids, may also be processed by the incinerator. Extensive sorting of the organic and inorganic material is not necessary, as the incinerator can tolerate a high percentage of inorganic material in the feed. It is assumed that the input organic solids may contain up to 15% inorganic material. The Aptus incinerator facility (located in Utah) has been used as a basis for the module.
The waste is sorted at the receiving and inspection (RCINS) module and transferred to the incineration module. The input waste may include organic liquids, discarded paper, plastics, clothing (textile fabrics), wood, organic sludges, spent ion-exchange resins, spent activated carbon, and other hazardous waste substances produced by typical operations at DOE production or research and development installations.
Treatment units are provided assuming that the incoming waste contains constituents regulated under RCRA or TSCA. In addition to the input waste, the incinerator module treats the secondary organic solid waste from other modules of the waste treatment facility. The module has a number of unit operations that accomplish the required functions. These unit operations are shown in the PFD in Figure 6-2.
6.2 Technical Bases and Assumptions
6.2.1 Function and Operation of Module
The incinerator module has all the unit operations needed for treating the incoming organic liquid and solid waste, which has a broad range of RCRA- and TSCA-regulated organic contaminants. Organic contaminants can include volatile organic compounds, aromatics, alcohols, ketones, glycols, and petroleum compounds. The unit operations also have the capability to treat secondary waste, which consists of organic solids and organic liquids. The incoming solid waste is presorted before it is brought to the incineration module.
The incoming waste is brought to the module in drums, transfer bins, cardboard boxes, or by liquid transport tanks. It is assumed that the incoming solid or liquid waste is sorted, and characterized. Therefore, the incoming liquid waste is sent directly to the incineration chamber. Solid waste that requires size reduction is sent to the feed preparation module prior to incineration.
6-1

The incinerator oxidizes the organic and other combustible material contained in the feed. When sufficient solid waste is accumulated, the incinerator temperature is raised from the idle temperature (about 700-900°F) to the combustion temperature (about 1,600-1,800°F). The process begins by gradually charging the incinerator chamber with input waste in solid form. Concentrated organic liquids are injected to the chamber as a fuel supplement, when needed. Low concentration organic liquids are added to cool the incinerator, when needed.
After oxidizing the organic liquids and solids, the resulting ash is discharged from the incinerator and placed in containers, which are sent to the grout stabilization module. The incinerator is designed to completely burn the feed and minimize the amount of carbon in the ash.
Gas generated during the incineration process is the module's first secondary waste stream. To ensure complete destruction of organic material, the gas is first heated in a secondary combustion chamber to a temperature of 2,000°F with a residence time of at least 2 seconds. This gas is then sent to an offgas treatment unit operation (or air pollution control unit) that cools and treats the gas to remove particulates, toxic metals, acidic gases, and other regulated elements and compounds before it is released to the atmosphere. This unit operation ensures that the offgas discharged to the atmosphere meets emission standards.
The offgas treatment unit operation has three major phases: dry filtration, wet scrubbing, and monitoring and discharge.
The dry filtration phase removes as much of the particulates (e.g., flyash, and particulates of vaporized toxic metal compounds) as possible to minimize the quantity of toxic metal particles that passes to the wet scrubbing phase. This is done by first cooling the gas in the heat recovery unit operations and then dry filtering the gas using a bag or ceramic candle filters. The filtered gas is then sent to a filter of sulfur-impregnated activated carbon to remove mercury, lead, and other compounds. The final step in the dry phase consists of polishing the gas using a high-efficiency particulate air (HEPA) filter unit. Solid waste from this phase (flyash, spent activated carbon, and spent HEPA filters) is sent to the grout stabilization module. If the incinerator input waste has a high mercury content, the spent activated carbon may be sent to a retort unit operation (to be included in the special waste processing module) for mercury recovery and amalgamation.6
The wet scrubbing phase further removes toxic metal, vapor, and acidic and alkaline gases (including hydrogen chloride and sulfur dioxide) and their salts. A series of wet scrubbing devices using caustic (or lime) solutions accomplishes this function. After scrubbing, the gas is sent to a moisture remover, a reheater, and to the emissions monitoring
e. The overall fate of mercury in the system is as follows. Mercury vaporized during the incineration process is partially removed from the flue gas by the dry offgas filters and by carbon adsorption. The remainder is removed in the wet-gas primary scrubber using an aqueous acidic scrubbing medium. The mercury removed in the dry-gas filters accumulates in the ash and beds of activated carbon. This waste is eventually solidified by the stabilization module. The mercury removed during the wet scrubbing accumulates in the concentrated bottom sludge. This waste is also solidified by the stabilization module.
6-2

and discharge unit. Secondary waste from the scrubbing process, which consists of spent slurry, is neutralized and sent to a concentrator unit. The concentrator uses low-temperature evaporation to avoid revaporizing the captured mercury salts. Bottom sludge from the concentrator is sent to the grout stabilization module. The concentrator distillate is treated and reused.
The monitoring and discharge phase continuously samples the gas and measures the concentration of the elements and compounds as specified by the facility emission control standards. The treated offgas meets the emissions standards as specified by the permit. The module minimizes as much as possible the volume of waste requiring disposal.
6.2.2 Integration of Module
Input waste to the incineration module comes from the container assay, sort, and package module, receiving and inspection module, and aqueous waste treatment module. Incinerator output consists of bottom ash and flyash, spent activated carbon, spent HEPA filters, and wet scrubber sludge, which are sent to the grout stabilization module. Treated water is reused. Materials purchased for O&M include such consumables as personal protective equipment, fuel, activated carbon, chemicals, and containers.
6.3 Cost Bases, Assumptions, and Results
The feed preparation, incinerator, secondary combustion chamber, dry offgas filtration, wet scrubber, stack monitors, and concentrator constitute the major equipment capital cost items. The cost estimate for the incineration package is based on quotations by Joy Energy Systems of Charlotte, North Carolina and ABB Raymond, Inc. of Lisle, Illinois. The cost estimate for the dry offgas filters is based on the use of a ceramic candle unit as quoted by Pali Advances Separation Systems of Cortland, New York. The cost estimate for the wet scrubbing unit is based on the use of a quencher and scrubbing unit as quoted by Croll-Reynolds Company of Westfield, New Jersey. The cost estimate for the concentrator unit is based on the use of a thin-film evaporator unit as quoted by LCI Corporation of Charlotte, North Carolina.
The life-cycle cost of this module is approximately 50% of the cost for an MLLW/LLW incinerator module. This difference is because of the lower cost for equipment, greatly reduced cost of process buildings, operating costs that are 80% of the operating costs for an MLLW/LLW incinerator, and D&D costs that are only 10% of those associated with MLLW/LLW.
A commercial quote of $.80/lb for incineration of hazardous waste was obtained from Ross Incineration Services, Inc. of Grafton, Ohio, and is comparable to approximately $0.90/lb shown for this module at the higher processing rates.
Figure 6-3 shows the relationship between estimated FTE workers and capacity of the module. Cost versus capacity for the incineration module is shown in Figures 6-4 and 6-5.
6-3

NOTE: WALLS NOT SHOWN FOR CLARITY
FACILITY SIZE DIMENSION IN FEET
DIMENSION IN METERS FACILITY SIZE
A B A B SMALL 40 145 12.2 44.2 MEDIUM 50 18T 15.2 57.1 LARCE 60 232 18.3 70.7
EQUIPMENT L I S T
PORTABLE WASTE HOPPERS
SHREDDER
WASTE STREAM SAMPLER WASTE FEEDER INTAKE HOPPER
© © © © © © © © © ©
SOIL FEED CONVEYOR ROTARY KILN INCINERATOR ASH COOL INC CHAMBER PORTABLE ASH HOPPER (HIDDEN) SECONDARY COMBUSTION CHAMBER OUENCH CHAMBER DRY FILTER BAGHOUSE CARBON FILTERS HEPA FILTERS HYDROSONIC SCRUBBER PACKED TOWER MIST ELIMINATOR HEAT EXCHANGERS OENOX CATALYTIC REACTOR FAN AND STACK OVERHEAD CRANE
WASTE CONTAINER HOIST
DUST COLLECTOR
FILEHAWt TT1-20.DCN PLOT DATES 5/24/94
Figure 6-1. Equipment layout for the incineration (H-INCIN) module.

INPUT PROCESS OUTPUT
HAZARDOUS WASTE
FROM ASSAY, SORT AND PACKAGING
0\ TREATMENT WASTE FROM DEACTIVATION
LIME y
|WATER>-
PREPARE AND FEED LIME (5) -<&
AIR y
FUEL>
-G> FEED PREPARATION (1)
STACK MONITOR (4) KS>-
INCINERATOR (2)
O-I AIR POLLUTION CONTROL I (4)
^-v WASTE HEAT -(TV"-*--(i)""*" RECOVERY w ]
|WATER>
DRY OFFGAS FILTER 14) WET OFFGAS SCRUBBING (4)
TREATMENT CHEMICALS >
-®-
NODE 1 2 3 4 5 6 7 8
DESCRIPTION INCOMING HASTE FUEL AIR HOT
OFFGAS ASH BOILER WATER
TREATMENT CHEMICALS
BOILER BLOWDOWN
LB 100 18 990 1105.6 11 510.5 0.1 0.1
TREATED AIR TO ATMOSPHERE
STEAM
TO TREATMENT MODULES UTILITIES
AOUEOUS WASTE TO AOUEOUS WASTE
TREATMENT
INCINERATOR ASH TO STABILIZATION
NODE 9 10 11 12 13 14 15 16 17
DESCRIPTION FILTERED OFFGAS ASH WATER LIME LIME
SLURRY TREATED OFFGAS
SCRUBBER BLOWDOWN
DEACTIVATION WASTE STEAM
LB 1104.6 1.0 655.2 27.3 682.5 1113.4 673.7 8.6 500.5
Figure 6-2. Process flow diagram for the incineration (H-INCIN) module.

INCINERATION FTE by Work Breakdown Structure Element
Module: INCIN Waste Type: Hazardous
80
60
UJ u.
3 4 ° (0 E % UJ
20 — B -»«»*T = ; 1 r
i I ! i
200 400 600 800 Input Capacity (kg/hr)
Pre-Operations Construction O&M (lyear) D&D
1,000
Figure 6-3. FTE workers versus capacity for the incineration (H-INCIN) module.
6-6

25
20
^ 15 0) o O •o o (0 E s 10
UJ
INCINERATION Cost by Work Breakdown Structure Element
Module: INCIN Waste Type: Hazardous
J. i i _ ^
r 1 1 1
^ * 1 j 1 1 ^—«—\^e. ; 1
200 400 600 800
Input Capacity (kg/hr)
Pre-Operations Construction O&M (1year) D&D
1,000
Figure 6-4. PLCC versus capacity for the incineration (H-INCIN) module.
6-7

140
120
s e 100 ** (0 o m o •o © fin ** (0 UJI 40 • * *
(0 Ul
20
200
INCINERATION Total Life Cycle Costs
Module: INCIN Waste Type: Hazardous
! i
A , ..! - ^ * * : X 9 0 7 "• 400 600
Input Capacity (kg/hr)
Hazardous
NOTE: Basis includes 20 years O&M Triangles indicate capacities where detailed cost estimates were developed.
800 1,000
o> 3.5 JC —, « « •
CO 3 o O
• 0 S 2.5
B ;
^̂ i) LU 2
1.5
INCINERATION Total Life Cycle Unit Costs
Module: INCIN Waste Type: Hazardous
^^^ A f '
I ^ ^ ^ ^ ^ | I _ I _
_ _- -̂ ^̂ _ . . _ —
200
NOTE: Basis includes 20 years O&M
400 600 800
Input Capacity (kg/hr) Hazardous
1.8
1fi ^m*
•a •ss <&
t' ** M o o
1.2 "B *«• « £ ** (0 Ui
0.8
1,000
Figure 6-5. PLCC versus capacity including unit rates for the incineration (H-INCIN) module.
6-8

7. ORGANIC REMOVAL (MODULE H-ORGRM)
7.1 Basic Information
The equipment layout for the organic removal module, shown in Figure 7-1, must be either used in conjunction with die incineration module (INCIN), the receiving and inspection module (RCINS), the assay, sort, and package module (ASPAK), and aqueous waste treatment module (AQWTR), or installed at a location where similar functions are available in existing facilities.
The organic removal module collects and treats input organic-based compounds present as solids or as liquid solutions. The organic-based waste is shipped to me module in cans, drums, tankers and special transport containers having several different capacities. Treatment units are provided based on the assumption that the incoming waste contains toxic organic constituents regulated under RCRA Subtitle C. The module has a number of unit operations that accomplish the required functions. These unit operations are shown in the PFD in Figure 7-2.
7.2 Technical Bases and Assumptions
7.2.1 Function and Operation of Module
The organic removal module has all the unit operations needed for treating incoming liquid waste having a broad range of RCRA-controlled toxic organic contaminants. Toxic organic contaminants can include (but is not limited to) purgeable compounds such as xylene, toluene, benzene, and chloroform.
The incoming organic waste is initially segregated into aqueous and nonaqueous fractions in the organic removal unit operation. This is an oil/water separation operation. The recovered solids/sludges from the bottom of the oil/water separator are sent to the incineration module for destruction. The oil/free phase organic layer is also sent to the incineration module. The aqueous liquids are sent to the distillation unit operation where dissolved volatile organic compounds are removed from the water. Additional water treatment takes place in the water treatment unit operation, which has a ultra violet/peroxide unit where trace amounts of organic compounds are destroyed or removed by using liquid phase-activated carbon. Treated water recovered from tiiese processes is recycled for use in other modules after final filtration to remove suspended solids. The spent carbon is sent to either the incineration unit, a carbon regenerator, or the stabilization module. Metal wastes separated during the process will be concentrated in the aqueous phase and sent to the deactivation module or the aqueous waste treatment module. Offgas from the distillation is condensed, and the condensate is sent to the incineration module for destruction. Uncondensed offgas is passed through activated carbon for a final polishing before being released to the atmosphere.
The organic removal unit operations have flexibility for batch operation. The waste is transferred from the incoming containers to the appropriate treatment operation.
7-1

7.2.2 Integration of the Module
Input waste to the organic removal module comes from the receiving and inspection module. Output includes aqueous waste containing dissolved metal and inorganic salts which is sent to the deactivation or aqueous waste treatment module; spent carbon which is sent to regeneration or stabilization; recovered organic sludge which is sent to incineration; and treated water which is recycled within the facility. Materials purchased for O&M, such as personal protective equipment, activated carbon filter material, chemicals, and containers, are assumed to be consumable supplies, and tfieir costs are estimated accordingly.
7.3 Cost Bases, Assumptions, and Results
The major capital cost items are the organic removal unit, the distillation unit, the UV peroxide unit, and activated carbon beds. Their costs are based on prices submitted by various vendors. The cost estimate for the organic removal unit is based on a quotation from McTighe Industries, Inc. of Mitchell, South Dakota. The cost estimate for the organic stripper unit is based on a quotation from APV Crepaco, Inc. of Tonawanda, New York. The cost estimate for the chemical oxidation using a combination of hydrogen peroxide and ultraviolet light is based on a quotation from Peroxidation System, Inc. of Tucson, Arizona.
A commercial quote of $0.15/lb for organic removal was obtained from Rhone Poulone of Shelton, Connecticut.
Figures 7-3 shows the relationship between estimated FTE workers and capacity of the module. Cost versus capacity for the incineration module is shown in Figures 7-4 and 7-5.
7-2

CROSS ORGANIC REMOVAL
w
©
TREATED < «
WATER >
cf *b o o o o
• 0 ^ -©
DISTILLATION CO
CK9
i© ©
LK®
WATER TREATMENT
©
o o V
©
ELECTRICAL DISTRIBUTION
& MCC
CO .=i
UTILITIES 4 MECHANICAL <_L_>
HAZARDOUS WASTE ORGANICS REMOVAL (MODULE H-ORGRM) EQUIPMENT LAYOUT
10 0 tO
SCALE FEET
Figure 7-1. Equipment layout for the organic removal (H-ORGRM) module.
EQUIPMENT LIST (T) WASTE STORAGE TANK (?) OIL/WATER SEPARATOR (?) DISTILLATION UNIT (T) DISTILLATION PUMP © DISTILLED LIOUIDS STORAGE TANK © DISTILLED BOTTOMS STORAGE TANK 0 CONDENSER (?) CONDENSER PUMP (?) VAPOR PHASE CARBON © VACUUM PUMP © LI0U1D PHASE CARBON
© UV/PEROXIDE UNIT
© PEROXIDE STORAGE TANK
© STRIPPING TOWER
© AIR PUMP
© WATER PUMP
© TREATED WATER STORAGE TANK
© TREATEO WATER PUMP
© SEPARATED ORGANICS STORAGE TANK
@ 10 TON OVERHEAD CRANE
FACILITY SIZE DIMENSION IN FEET DIMENSION IN METERS FACILITY SIZE A B A B
SMALL 40 50 12.2 15.3 MEDIUM 40 60 12.2 16.3 LARGE 40 76 12.2 23.2
D:/05Z7/H-OflCRM.DCN PLOT DATE: 6/12/95

INPUT PROCESS OUTPUT
HAZARDOUS \_ WASTE / FROM ASSAY. SORT AND PACKAGING OR -J GENERATOR
-0-GROSS ORGANIC REMOVAL (1)
VAPOR PHASE CARBON 06)
•®-
CONDENSER
STILL
DISTILLATION (2)
<i>
I
0)T*\ LIQUID PHASE CARBON
WATER TREATMENT ( 3 )
KD> OTHER UNIT OPERATIONS:
5 UTILITIES & MECHANICAL 6 ELECTRICAL DISTRIBUTION 6. MCC T HEATING. VENTILATION & EXHAUST 8 OTHER EQUIPMENT
UV/PEROXIDE -r^O>
PEROXIDE
• & •
TREATED WATER (4) -®" @ @
TREATED OFFGAS TO ATMOSPHERE
RECOVERED ORGANIC TO INCINERATION
SPENT CARBON
TO STABILIZATION
RECYCLED WATER TO TREATMENT MODULES
AOUEOUS WASTE > TO AOUEOIJS WASTE
TREATMENT
NODE 1 2 3 4 5 6 7 8
DESCRIPTION INCOMING WASTE
RECOVERED ORGANIC
ORGANIC AOUEOUS LIOUOR
STRIPPED ORGANIC
AOUEOUS PHASE
AOUEOUS PHASE OFFGAS RECOVERED
ORGANIC
LB 100 1.0 99.0 9.9 80.2 8.9 0.4 9.5
NODE 9 10 11 12 13 14 15 16 17
DESCRIPTION PEROXIDE TREATED WATER
SPENT CARBON
TREATED WATER
RECYCLED WATER
METAL BEARING AOUEOUS WASTE
METAL BEARING AOUEOUS WASTE
TREATED OFFGAS
SPENT CARBON
LB 0.1 6.8 0.2 60 66.8 2.2 20.0 0.3 0.1
Figure 7-2. Process flow diagram for the organic removal (H-ORGRM) module.

ORGANIC REMOVAL FTE by Work Breakdown Structure Element Module: ORGRM Waste Type: Hazardous
. . - * : : ' -
^ . J *
~' "T
~ - : - r ' ;
• • * * ;
• • •
100 200 300 Input Capacity (kg/hr)
400 500
Pre-Operations Construction O&M (1year) D&D
-3 . FTE workers versus capacity for the organic removal (H-ORGRM) module.
7-5

ORGANIC REMOVAL Cost by Work Breakdown Structure Element Module: ORGRM Waste Type: Hazardous
(
I ; f 1 : :
100 200 300 Input Capacity (kg/hr)
400
Pre-Operations Construction O&M (1year) D&D
500
-4. PLCC versus capacity for the organic removal (H-ORGRM) module.
7-6

W o o •o
ffi S to UJ
20
15
10
ORGANIC REMOVAL Total Life Cycle Costs
Module: ORGRM Waste Type: Hazardous
;
^ 1 1 3 : A.
100 200 300
Input Capacity (kg/hr) Hazardous
400
NOTE: Basis includes 20 years O&M Triangles indicate capacities where detailed cost estimates were developed.
500
2.5
en *
"S 15 o o
re £ S3 | j j 0.5
ORGANIC REMOVAL Total Life Cycle Unit Costs
Module: ORGRM Waste Type: Hazardous
1 1 1 1 1
, , ! ^ k I I I I
_ r ^ ! , , ,
I _ l - ^ ^ ^ ^ ^ I I I
1 1 1 1 ^ ^ ^ ^ ^ ^ ^ * -
100 400
0.6 S -•** W O
0.6 O •a
0.4 re
0.2 CO Ui
500 200 300
Input Capacity (kg/hr) Hazardous
NOTE: Basis includes 20 years O&M
Rgure 7-5. PLCC versus capacity including unit rates for the organic removal (H-ORGRM) module.
7-7

8. RECYCLING (MODULE RECYC)
8.1 Basic Information
The recycling module must be either used in conjunction with the assay, sort, and package (ASPAK) module, receiving and inspection (RCINS) module, administration (TADMN) module, and deactivation (DEACT) module, or installed at a location where similar functions are available in existing facilities.
The recycling module removes and collects the recyclable portion of the input debris. The debris waste is received by the module in cans, drums, and special transport containers having several different capacities. The type of expected waste consists mainly of metal, concrete, timber, and plastic. The module conducts simple sorting and decontamination operations. These operations are shown in the PFD in Figure 8-1.
8.2 Technical Bases and Assumptions
8.2.1 Function and Operation of Module
The incoming debris is manually sorted and decommissioned into different constituent material categories. Debris that can be reused is decontaminated and transferred to a staging area. Cleaned recyclable debris is then sent to a recycler. Debris that cannot be reused is sent either to a treatment module, a stabilization module, or directly to a landfill.
8.2.2 Integration of Module
Input waste to the recycling module comes from the receiving and inspection module. Output includes sorted metal, plastic, timber, and concrete debris, which can be recycled, requires further treatment, or is sent directly to a landfill. Materials purchased for O&M, such as personal protective equipment, decontamination grit, and containers, are assumed to be consumable supplies. Their costs are estimated accordingly.
8.3 Cost Bases, Assumptions, and Results
The major capital cost items are the decontamination unit and sorting and decommissioning machinery. It is assumed that a building for recycling will either not be necessary or will exist for such use. Figure 8-2 shows the relationship between estimated FTE workers and capacity of the module. Cost versus capacity for the recycling module is shown in Figures 8-3 and 8-4.
8-1

INPUT PROCESS OUTPUT
(T>
)
R\ (T>
RECYCLE \ WATER / }
)
R\ (T> 1 )
R\ HA7ARnnu<;\ (T> SORT. (1 ) ©-* DECONTAMINATION/
STORAGE (2 )
R\ RECYCLED \ WASTE / \V
SORT. (1 ) ©-* DECONTAMINATION/
STORAGE (2 ) MATERIALS/
FR DM ASSAY. SORT ND PACKAGING
\V
'
1
TO COMMERCIAL USERS
\V
'
' 1 DECON \
\V
'
WASH /
\V
' 1
TO DEACTIVATION
\V
' 1
SOLIDS \
\V
KLJ SOLIDS \
8-2
\V
KLJ TO STABILIZATION
NOTE: 8.33 LBS (1 GAL) OF WASH WATER PER LB OF RECYCLE MATERIAL
NODE 1 2 , 3 4 5 6
DESCRIPTION INCOMING WA5TE
RECYCLE MATERIALS SOLIDS WASH
WASTE RECYCLE
MATERIALS DECON WASH
LB 100 85 15 200 85 200
Figure 8-1. Process flow diagram for the recycling (H-RECYC) module.

RECYCLING FTE by Work Breakdown Structure Element Module: RECYC Waste Type: Hazardous
1 j . J 1 ( . . |_
1 r j ^ ^ . . r
: . r.i-?" 1 •— - M • • wm • % » • t • • • • — • • » • • » • • i i i — • • • • > • M • • — • • tm
10 15
Input Capacity (kg/hr) 20
Pre-Operations Construction O&M (1year) D&D
25
FTE workers versus capacity for the recycling (H-RECYC) module.
8-3

•+•< CO o O
2 (0 E To m
RECYCLING Cost by Work Breakdown Structure Element
Module: RECYC Waste Type: Hazardous
i - - 1 ^ • • i i
- - i 1 r j f " i r
M i l — • • i l l • • • • — • • • H •»-•——^ • • — • • i l • i <» • • ' CM • • » '•
10 15 Input Capacity (kg/hr)
20 25
Pre-Operations Construction O&M (1year) D&D
ure 8-3. PLCC versus capacity for the recycling (H-RECYC) module.
8-4

s ££ <-> o> o
O •a a «
s (0 UJ
20
15
10
RECYCLING Total Life Cycle Costs
Module: RECYC Waste Type: Hazardous
_ J _
i 22.7 /Ay
10 15 20
input Capacity (kg/hr)
Hazardous
NOTE: Basis includes 20 years O&M Triangles indicate capacities where detailed cost estimates were developed.
RECYCLING Total Life Cycle Unit Costs
Module: RECYC Waste Type: Hazardous
25
en
CO o O •a a
E (0 ui
1
15
14
15
14 i
15
14 | \
13
12
11
10
9
13
12
11
10
9
' \ 13
12
11
10
9
13
12
11
10
9
13
12
11
10
9 ;
13
12
11
10
9 , l"-r- | ; -r
- 7
10 15
Input Capacity (kg/hr)
Hazardous
20
6 * . 09 O
o •a o» .. • * 5 ro
CO ULI
- 4
25
NOTE: Basis includes 20 years O&M
Figure 8-4. PLCC versus capacity including unit rates for the recycling (H-RECYC) module.
8-5


9. DEACTIVATION (MODULE DEACT)
9.1 Basic Information
The equipment layout for the deactivation module, shown in Figure 9-1, must be either used in conjunction with the assay, sort, and package (ASPAK) module, or grout stabilization (GROUT) and aqueous waste treatment (AQWTR) modules, or installed at a location where similar functions are available in existing facilities.
The deactivation module collects and treats input reactive metal present as liquid solutions. The reactive metal waste is shipped to the module in cans, drums, and special transport containers having several different capacities. Treatment units are provided based on the assumption that the incoming waste contains toxic metals regulated under RCRA. The module has a number of unit operations that accomplish the required functions. These unit operations are shown in the PFD in Figure 9-2.
9.2 Technical Bases and Assumptions
9.2.1 Function and Operation of Module
The deactivation module has all the unit operations needed for treating incoming solid and liquid waste having a broad range of RCRA-controlled toxic, heavy-metal contaminants. Toxic metal contaminants can include arsenic, barium, beryllium, cadmium, chromium, cyanide, selenium, and sodium. The deactivation unit operations have maximum flexibility for batch operation. The waste is transferred from the incoming containers to the appropriate treatment operation.
Waste solution is sent to the deactivation unit operation where waste is pretreated with hydrogen peroxide and sodium hypochlorite to oxidize the metals. This is followed by treatment with ferric sulfate, lime, and a polymer to coprecipitate metal in a hydroxide floe. The floe settles in a settler which is part of the same unit operation. Sludge is sent through the evaporator unit operation to the grout stabilization (GROUT) module. Vapors recovered are sent to the vapor phase-activated carbon filters that are used to remove mercury from the vapor stream.
Liquids from the settler are sent to the filtration unit operation where larger suspended solids are filtered. Filtered liquids are sent through the ion exchange polishing units located in the dissolved-solids removal unit operation. Ion exchange removes trace dissolved metals.
The unit operations remove RCRA-regulated metal to a level such that the treated water can be either recycled for use in the operation or discharged. Before discharge, the treated water is sampled and analyzed to ensure compliance with waste discharge requirements. If requirements are not met, additional treatment in the aqueous waste treatment module will be necessary.
9-1

9.2.2 Integration of Module
Input waste to the deactivation module comes from the assay, sort, and package module. Output includes spent resin, spent filter material, and concentrated sludge, which are sent to the grout stabilization module. Secondary aqueous waste is sent to the aqueous waste treatment module. Materials purchased for O&M, such as personal protective equipment, ion-exchange resin, filter material, chemicals, and containers, are assumed to be consumable supplies, and their costs are estimated accordingly.
9.3 Cost Bases, Assumptions, and Results
The pretreatment and precipitation unit, evaporator, filter press and pressure filter, ion-exchange system, activated carbon filtration system, chemical and holding tanks and pumps, and offgas treatment equipment constitute the major equipment capital cost items. Their costs are based on costs submitted by various vendors.
The cost differences between this module for hazardous waste and similar modules for MLLW/LLW are because of higher equipment costs and higher O&M costs for the MLLW/LLW module. These cost differences result from the handling of radioactive wastes, lower building costs for the hazardous wastes resulting from the use of industry standard prefabricated metal-sided units, and considerably lower D&D costs for hazardous wastes because of the lack of radioactive wastes.
Estimated FTE workers and PLCC versus capacity are shown in Figures 9-3 to 9-5.
9-2

M3
+ , — —...
(V) @ © e ••-••• . - • — • - - »
•A,
••-••• . - • — • - - »
o<>ro) DEACTIVATION^"^
PREPARATION AREA
DISSOLVED SOLIDS REMOVAL CE>
F1LTRAII0N
%® °> ©
©
CONCENTRATION CO
©
TREATED WATER SAMPLING
©
© ©
ELECTRICAL DISTRIBUTION
i. MCC CE>
UTILITIES & MECHANICAL OD
HAZARDOUS WASTE DEACTIVATION (MODULE H-DEACT) EQUIPMENT LAYOUT
Figure 9-1. Equipment layout for the deactivation (H-DEACT) module.
EQUIPMENT LIST 0 HAZARDOUS WASTE RECEIVING TANK 0 MERCURY WASTE RECEIVING TANK 0 RECYCLE LIOUID WASTE RECEIVING TANK 0 HAZAROOUS WASTE LIOUID PUMPS 0 ACID STORAGE TANK AND PUMP 0 LIME STORAGE BIN 0 LIME FEED CONVEYOR 0 CHEMICAL PREPARATION TABLES 0 LIME SLURRY MIX TANK AND AGITATOR/PUMP © ACID MIX TANK AND PUMP (ft) CHEMICAL SURGE TANK © NEUTRALIZATION TANK AND PUMP ® PH CONTROLLERS © PH CONTROLLER © SETTLING TANK © SLUDGE PUMP © AOUEOUS WASTE PUMP © ION EXCHANGE UNIT © 10 TON OVERHEAD CRANE @ BIN RACKS @ EVAPORATOR/CONCENTRATOR @ BLOWER @ CARBON CANNISTERS @ EMERGENCY SHOWER @ FILTRATION LIOUIDS HOLD TANK AND PUMP @ FILTRATION UNIT AND PUMP @ AOUEOUS LIQUIDS TANK AND PUMP @ AOUEOUS WASTE TANK AND PUMP @ TREATEO WATER HOLOING TANK AND PUMP
FACILITY SIZE DIMENSION IN FEET DIMENSION IN METERS FACILITY SIZE A B A B
SMALL 40 60 12.2 18.3 MEDIUM 40 70 12.2 21.4 LARGE 40 BO 12.2 24.4
DI/052T/H-OEACT.DCN PLOT OATE: 6/12/95

INPUT PROCESS OUTPUT
SALTS & SPENT RESINS TO STABILIZATION
HAZARDOUS WASTE
FROM ASSAY. SORT AND PACKAGING OR TREATMENT MODULES
| AC1D>-BASE>
M^>
FILTRATION (2) DISSOLVED SOLIDS REMOVAL 13)
TREATED WATER SAMPLING (5) -®" RECYCLED WATER TO TREATMENT MODULES
TREATED OFFGAS > TO ATMOSPHERE
SOLIDS
TO STABILIZATION
NODE t 2 3 4 5 6 7 8
DESCRIPTION INCOMING WASTE ACID LIME
SLURRY NEUTRAL WASTE OVERFLOW
LIOUOR SLUDGE FILTERED LIOUOR
SPENT RESINS
LB 100 13.1 107.5 222.9 199.7 23.2 199.7 4.1
NODE 9 10 11 12 13 14 15
DESCRIPTION TREATEO WATER
RECYCLE WATER VAPORS WET
SOLIDS CONOENSEO
WATER OFFGAS TREATED OFFGAS
LB 195.6 87-1.9 13.9 9.3 12.9 1 1
Figure 9-2. Process flow diagram for the deactivation (H-DEACT) module.

DEACTIVATION FTE by Work Breakdown Structure Element Module: DEACT Waste Type: Hazardous
12
10
1 .f 1 1 , . k
• i i t i * > i i i i _
50 100 150 Input Capacity (kg/hr)
200
Pre-Operations Construction O&M (1year) D&D
250
-3. FTE workers versus capacity for the deactivation (H-DEACT) module.
9-5

3.5
2.5
4/3-•*•« 2 tn O O "D CD
+-i CO E 1.5
• * > »
0) UJ
0.5
DEACTIVATION Cost by Work Breakdown Structure Element
Module: DEACT Waste Type: Hazardous
i J i J • _ j r B ^ ^ « ^ ^ ^ ^
I : , j , I # , v f
- . r ' I i f ' ..., I i 1 r
1 +. 1 i 1 _
I J. . 1 J 1 _
50 100 150
Input Capacity (kg/hr) 200 250
Pre-Operations Construction O&M (1year) D&D
Figure 9-4. PLCC versus capacity for the deactivation (H-DEACT) module.
9-6

35
30
*fr CO o o
25
20
0} 15 CO
~ 10 CO UJ
DEACTIVATION Total Life Cycle Costs
Module: DEACT Waste Type: Hazardous
<
. ^ L . . . ^ L . .
j&n A " » : I A .
50 100 150
Input Capacity (kg/hr)
Hazardous
NOTE: Basis includes 20 years O&M Triangles indicate capacities where detailed cost estimates were developed.
200 250
12
—. 10
J*
e 8 co O O 6
•a o
CO i l l
DEACTIVATION Total Life Cycle Unit Costs
Module: DEACT Waste Type: Hazardous
._ , , T r — — ,
1 ^ L 1 i .. J- . 1
, . .̂ ^̂ _; , T . ,
50 100 150
input Capacity (kg/hr)
Hazardous
200
4 S CO
3 ° •o 0
2 CO
CO 1 U J
250
NOTE: Basis includes 20 years O&M
Figure 9-5. PLCC versus capacity including unit rates for the deactivation (H-DEACT) module.
9-7

10. MERCURY SEPARATION (MODULE RMERC)
10.1 Basic Information
The equipment layout for the mercury separation module, shown in Figure 10-1, is used for the removal of mercury from sludges as well as solids.f The module can also accept elemental (liquid) mercury. Aqueous waste contaminated with mercury and its salts would be processed by the aqueous waste treatment (AQWTR) module.
The module must be used in conjunction with the assay, sort, and package (ASPAK) module, the aqueous waste treatment (AQWTR) module, and the grout stabilization (GROUT) module. Alternatively it can be installed in a facility with similar functions available.
The input waste is sorted at the assay, sort, and package (ASPAK) module, where waste containing mercury is segregated from other incoming waste. Treatment units are provided assuming that the incoming waste contains toxic metal and organics regulated under RCRA. In addition to the input waste, the mercury separation module could treat mercury-contaminated ash or solids generated by other modules of the treatment facility. The module has a number of unit operations that accomplish the required functions. These unit operations are shown in the PFD in Figure 10-2.
10.2 Technical Bases and Assumptions
10.2.1 Function and Operation of Module
The mercury separation module has all the operations needed for treating sludge and solids containing or contaminated with elemental mercury or mercury compounds.
mcorning waste is brought to the module in transfer bins. Elemental mercury is separated from other mercury-contaminated waste. The elemental mercury is transferred to a liquid-mercury storage bottle, and other mercury waste is transferred to a waste preparation and feed bin. From the feed bin, the solid material is shredded, combined with sludges requiring no feed preparation, and transferred to an electrically heated vacuum retort. The retort thermally volatilizes (at approximately 1,000°F) the low boiling point constituents, including mercury and mercury compounds under high vacuum conditions. A small amount of nitrogen is admitted to the retort as an inert sweep gas. The retort is maintained at operating temperature for a predetermined heat soak period and then cooled. The solid residue, essentially inorganics and char, are removed from the retort, assayed, and delivered to a thermal treatment or to the grout stabilization module.
f. Detailed composition of the input waste is not available. Hence, it is assumed that organic sludges may include cutting and lubrication oils and mercuric acetates. Inorganic sludges may include those generated from acid leaching, thermal treatment, and mercury sulfide precipitates. Solids may include mercury-specific ion-exchange resin (e.g., Ionac SR-5), rags, wipes, and personal protective equipment.
10-1

Vapors from the retort pass through a heat exchanger, which reduces the vapor temperature enough to condense the mercury while allowing the other low-boiling-point constituents to remain volatilized. These remaining volatilized vapors (mainly water and organics) are burned in a secondary combustion chamber at a temperature of approximately 2,000°F. This gas is then sent to an offgas treatment unit operation that cools and treats the gas by quenching, dry filtration, carbon adsorption, and high efficiency filtration to remove regulated elements and compounds before the treated gas is released to the atmosphere. The unit operation ensures that the offgas discharged to the atmosphere meets the given emission standards.
The condensed mercury is separated from the uncondensed offgas and sent to the elemental mercury storage bottle. The liquid mercury is transferred to an amalgamation operation where the mercury is combined with copper (or zinc) powder, steel shot (for proper mixing), and nitric acid. This combination is mixed to form a copper-mercury amalgam, eliminating free mercury. The amalgam is packaged for assay and inspection to ensure that the amalgam meets toxicity characteristic leaching procedure standards.
10.2.2 Integration of Module
Input waste comes from the assay, sort, and package module. Secondary waste received from other modules could include offgas mercury separation adsorption media from the incinerator module and mercury separation sludges from the aqueous waste treatment module.
Output from mercury separation consists of copper-mercury amalgam, spent HEPA filters, spent activated carbon, and solid debris, which are sent either to the incineration or grout stabilization modules, or wet scrubber sludges, which are sent to the aqueous waste treatment module. Materials purchased for O&M include such consumables as personal protective equipment, fuel, activated carbon, copper powder, steel shot, and nitric acid.
10.3 Cost Bases, Assumptions, and Results
It is assumed that the module feed stream contains 5% elemental mercury and 95% other mercury waste. Liquid elemental mercury can be readily segregated from the incoming waste. Mercury-contaminated solid waste composition is approximately 5% mercury, 32% inorganics, 42% volatile organics, 4% nonvolatile organics, and 17% moisture.
One retort batch can be completed per 8-hour shift. Cost estimates are based on prices submitted by various vendors. The cost estimate for the feeder/shredder is based on a quote from System Service Solutions of Wilsonville, Ohio. The cost estimate for the retort is based on a quote from Denver Mineral Engineers, Inc. of Littleton, Colorado. The cost estimate for the amalgam mixer is based on a quote from Miracle Paint Rejuvenator of St. Paul, Minnesota. The cost estimate for the offgas treatment is based on the use of a dry filter as quoted by Pall Advanced Separation Systems of Cortland, New York, and a quencher and scrubbing unit as quoted by Croll-Reynolds Company of Westland, New Jersey.
The cost differences for this module between the hazardous and MLLW/LLW versions results from lower equipment costs for hazardous wastes and the fact that there is no need to
10-2

handle radioactive wastes. Commercial rates quoted range from $9.67/lb for small quantities (40-lb lots) to $3.51/lb for larger quantities (1,000-lb lots).
FTE and cost versus capacity for the module are shown in Figures 10-3 to 10-5.
10-3

NOTE: WALLS NOT SHOWN FOR CLARITY EQUIPMENT L I S T
© © © © © © © © ©
FEED HOPPER AND SHREODER ELECTRIC RETORT CONDENSER SEPARATOR VACUUM PUMP OFFGAS COMBUSTION CHAMBER OUENCH COLUMN FILTER BAGHOUSE ACTIVATED CARBON ADSORBERS
© HEPA FILTERS © FAN AND STACK
© LIQUID MERCURY TANK © SOLIDS MIXER (PEBBLE MILL) © NITRIC ACID TANK © STEEL SHOT BIN © COPPER BIN © SCREW FEEDER
FACILITY SIZE DIMENSION IN FEET DIMENSION
IN METERS FACILITY SIZE A B A B
SMALL 40 55 12.2 1G.T MEDIUM SO 71 15.2 21.7 LARGE - .- - -
FILENAME: H-RMERC.DGN PLOT DATE: 5/24/94
Figure 10-1. Equipment layout for the mercury separation (H-RMERC) module.

INPUT PROCESS OUTPUT
Ol
NITROGEN
HAZARDOUS WASTE FROM ASSAY, SORT AND PACKAGING
FEED STORAGE AND PREPARATION (1) -dH-
OTHER UNIT OPERATIONS: 5 UTILITIES & MECHANICAL 6 ELECTRICAL DISTRIBUTION & MCC 7 HEATING. VENTILATION & EXHAUST 8 OTHER EQUIPMENT
': ©-
MERCURY AMALGAMATION (4)
| COPPER > (H -(B)—<STEEL SHOT |
* ®-- &
TREATED OFFGAS TO ATMOSPHERE
AOUEOUS WASTE TO AOUEOUS WASTE TREATMENT
MERCURY AMALGAM > TO STABILIZATION
DEBRIS TO STABILIZATION
CORROSIVE WASTE TO DEACTIVATION
RECYCLE MERCURY TO COMMERCIAL USERS
NODE 1 2 3 4 5 6 7 8 9 10 It 12
DESCRIPTION INCOMING WASTE
MERCURY WASTES
ELEMENTAL MERCURY
MERCURY VAPORS DEBRIS OFFGAS RECOVERED
MERCURY WATER TREATED OFFGAS
AOUEOUS WASTE
MERCURY AMALGAM
CORROSIVE WASTE
LB too 97.0 0.5 64.0 33.0 79.0 5.0 53.0 79.0 2.0 2.1 2.0
NODE 13 14 15 16 17 18 19 20
DESCRIPTION NITRIC ACID COPPER STEEL
SHOT NITROGEN AIR ELEMENTAL MERCURY
RECOVERED MERCURY
RECYCLE MERCURY
LB 0.1 0.8 0.2 22.0 66.0 2.5 4.5 7.0
Figure 10-2. Process flow diagram for the mercury separation (H-RMERC) module.

20
15
LU U_ •o & 10 (0 E (0 LU
40
MERCURY SEPARATION FTE by Work Breakdown Structure Element Module: RMERC Waste Type: Hazardous
I
J
» •
«*.i—-*•• . * . « - « ^ .fc.^fc-• : • ! • " . • - » •
-
, • » • • « • . . • • • « > • •
60 80 100
Input Capacity (kg/hr)
Pre-Operations Construction O&M (1year) D&D
120
Figure 10-3. FTE workers versus capacity for the mercury separation (H-RMERC) module.
10-6

O O •u a>
• * - •
(0
E in
40
MERCURY SEPARATION Cost by Work Breakdown Structure Element Module: RMERC Waste Type: Hazardous
_ _ J ^ ^
1
1 - -
• » < - . - i - • -
_ * * w » » W * * w « ~
60 80 100 Input Capacity (kg/hr)
Pre-Operations Construction O&M (1year) D&D
120
Rgure 10-4. PLCC versus capacity for the mercury separation (H-RMERC) module.
10-7

MERCURY SEPARATION Total Life Cycle Costs
Module: RMERC Waste Type: Hazardous 30
25
s 20
15
10 o o s E 1 0
(0 W 5
*« : 1 w 1 1 3
40 60 80 100
input Capacity (kg/hr)
Hazardous
NOTE: Basis includes 20 years O&M Triangles indicate capacities where detailed cost estimates were developed.
MERCURY SEPARATION Total Life Cycle Unit Costs
Module: RMERC Waste Type: Hazardous
input Capacity (kg/hr)
Hazardous
NOTE: Basis includes 20 years O&M
Figure 10-5. PLCC versus capacity including unit rates for the mercury separation (H-RMERC) module.
120
1.5 » m
10-8

11. GROUT STABILIZATION (MODULE GROUT)
11.1 Basic Information
The equipment layout for the grout stabilization module, shown in Figure 11-1, provides secondary waste treatment capability and is used at the end of the treatment modules. The module output is sent to the certification and shipping (CSHIP) module. The primary purpose of this module is to solidify solid and liquid waste and sludge that arrive from treatment modules, storage facilities, or the generators. Unit operations are shown in the PFD in Figure 11-2.
The module consists of five main process unit operations that incorporate all buildings, systems, processes, equipment, devices, controls, and accessories required to prepare the incoming waste and stabilize it either by macroencapsulation or microencapsulation techniques.
11.2 Technical Bases and Assumptions
11.2.1 Function and Operation of Module
The module receives concentrated liquid waste and sludge via a pipeline. A chemical addition unit is used to adjust the chemistry of the feed before it is fed to the solidification unit operation. It is assumed that incoming waste does not require any feed preparation except for some drying that is provided for in the water reduction unit operation. Dried materials are forwarded to the grout mixing unit operation. Liquids removed are sent to ion-exchange filtration unit operation prior to being discharge from the module.
The microsolidification unit operation solidifies concentrated liquid waste, sludge, or a combination of the two. The unit has an in-drum solidification assembly equipped with intake tanks and hoppers for sludge, liquid waste and grout. To accomplish the solidification process, a drum is moved through various fill stations where feeders place sludge and liquid waste and binder in the drum. Next, at the mixing station, the drum is capped and tumbled to achieve the required mixture. It is then returned for a repeat of the filling and mixing steps to maximize the fill efficiency.
The macroencapsulation unit operation solidifies bulkier solids, such as spent filters, shredded solids and pelletized debris. This waste material and these objects are placed in a drum, and binding agents are added. Macroencapsulation operation is accomplished by placing the solids in a drum, adding grout and mixing the two components. In large generator modules, a pugmill accomplishes this function.
After encapsulation, the filled container is moved to a capping and washing unit. This unit operation provides for sample collection, capping of the container, and removal of loose contamination from the container surface by high-pressure spray water jets. The containerized waste is ready for processing through radioassay and final certification, which are included in the certification and shipping (CSHIP) module.
11-1

11.2.2 Integration of Module
Input to the module consists of the following: concentrator bottom from the aqueous waste treatment (AQWTR) module; process residues from the assay, sort, and package (ASPAK) module; ash from the incinerator (INCIN) module; filtration solids from the deactivation (DEACT) module; spent filters from the treatment modules; drums; and containers. Major O&M purchased materials, such as personal protective equipment, laboratory material, binder, and containers, are assumed to be consumable supplies, and their costs are estimated accordingly.
Output consists mainly of drummed, solidified hazardous waste, which is moved to the certification and shipping (CSHIP) module. Waste water from drum washing is sent to the aqueous waste treatment (AQWTR) module. Treated offgas is discharged to the atmosphere.
11.3 Cost Bases, Assumptions, and Results
Incoming waste size reduction and preparation units (shredders) and solidification mixers are the major equipment capital cost items. Costs for the preparation and feed unit are based on vendor quotes for shredders, conveyors, and dust collection equipment. Solidification module assembly prices are based on quotes by Stock Equipment Company of Chagrin Falls, Ohio.
The differences in cost for the hazardous version of this module and the MLLW/LLW version are because of the need to handle radioactive waste, greater D&D costs, and lower O&M productivity when handling radioactive wastes in the MLLW/LLW version and lower building and equipment requirements for the hazardous waste version. A commercial quote of $0.67/lb for grouting was obtained from Envirosafe of Valley Forge, Pennsylvania.
Estimated FTEs and PLCC versus capacity for the large module are shown in Figures 11-3 to 11-5.
11-2

r-©
DRYING CO ©
UTILITIES A MECHANICAL
DRUM CAPPING ELECTRICAL DISTRIBUTION
A MCC
®-o ®
© ION EXCHANGE
GROUT STABILIZATION (MODULE H-GROUT) HAZARDOUS EQUIPMENT LAYOUT
10 SCALE
Figure 11-1. Equipment layout for the grout stabilization (H-GROUT) module.
EQUIPMENT LIST 0 DRYER @ CONVEYOR 0 SOLIDIFICATION UNIT 0 DRUM CAPPING A WASHING UNIT 0 PUMP ® ION EXCHANGE COLUMN 0 FILTRATION UNIT 0 10 TON OVERHEAD CRANE
FACILITY SIZE DIMENSION IN FEET
DIMENSION IN METERS FACILITY SIZE
A B A 8 SMALL 40 SO 12.2 15.3 MEDIUM 40 56 12.2 17.1 LARGE 40 56 12.2 17.1

INPUT PROCESS OUTPUT
LU < _i a. ID O Z 3 <
ce •< i— 10
O ce cr. u. o
METAL SLUDGE
MERCURY SLUDGE
>
> ORGANIC REMOVAL SLUDGE
DEACTIVATION SLUDGE
RECYCLING WASTE
>
> AOUEOUS TREATMENT SLUDGE
RESINS >
<D-*i
-©— -0-*
<?>
SAND (10.
[CEMENT)—(n)
WATER
WATER REDUCTION
(1)
GROUT MIXING (2)
- &
• &
I (J6)—< WATER
DRUM WASHING
(3)
ION EXCHANGE
(4)
~-0- STABILIZED WASTE
TO LANDFILL
TO AOUEOUS WASTE TREATMENT
NODE 1 2 3 4 5 6 7 8 9
DESCRIPTION INCOMING WASTE
INCINERATOR ASH
METAL SLUDGE
MERCURY SLUDGE
ORGANIC REMOVAL SLUDGE
DEACTIVATION SLUDGE
RECYCLING WASTE
AOUEOUS TREATMENT SLUDGE
RESINS
LB 37 4.4 2.4 13 0.1 20.7 5.5 15 1.9
NODE to 11 12 13 14 15 16 17
DESCRIPTION SAND CEMENT WATER REDUCED SLUDGE
GROUTED WASTE DISTILLATE RINSE
WATER TREATED WATER
LB 27.8 65.4 37.6 29.5 201.7 29.1 6.3 35.4
Figure 11-2. Process flow diagram for the grout stabilization (H-GROUT) module.

20
GROUT STABILIZATION FTE by Work Breakdown Structure Element Module: GROUT Waste Type: Hazardous
; ; ; : .^.i i i i i • i
i i • I • i < i • i i i • '
! ^_ I [_/ \
I i i / f Jr I : I I 0 I 1 ! I • t * I
0 ^ ^ ^ ^ ^
I ^ ^ ^ 0 0 0 ^ ^ I 0 I i
- ^ 0 0 * ^ ^ ^ 0 —• • ' I 0
\ \ ' f i ! - - : : y - . ^ - i - :.-.... r._...:._...
. : / ; 0* • *
i ' .•' ! i i ; ^ - ^ ; ! , !
i ' > i : : : : • • * ; : : A* ; # 1 1 1 1
I I I ! ! ! I I I I
mm » * — • • mm • • » • • wi • < M • • M • • M i • i i i • • • • » • * M • • mt ••—• -•—
100 200 300 Input Capacity (kg/hr)
400 500
Pre-Operations Construction O&M (1year) D&D
-3. FTE workers versus capacity for the grout stabilization (H-GROUT) module.
11-5

(0 o o TJ
(0
s (0
LU
GROUT STABILIZATION Cost by Work Breakdown Structure Element Module: GROUT Waste Type: Hazardous
•
m 0*
0
I •
• ! 0*
0' 0
#
4r • 1 i
0 0*
• ! • •
> 0 0
0 • i *
0 0 9
1 •
• * 1 • 0
r 0*> 0 0 0 0
•
, i ! ; , 100 200 300
Input Capacity (kg/hr) 400
Pre-Operations Construction O&M (1year) D&D
500
Figure 11-4. PLCC versus capacity for the grout stabilization (H-GROUT) module.
11-6

GROUT STABILIZATION Total Life Cycle Costs
Module: GROUT Waste Type: Hazardous 70
60
S 50 CO o 40 o •o 0) sn CO E ?n
<frri 0) HI
10
I [
A 4 5 , J!* , X*» 100 200 300
Input Capacity (kg/hr)
Hazardous
400
NOTE: Basis includes 20 years O&M Triangles indicate capacities where detailed cost estimates were developed.
GROUT STABILIZATION Total Life Cycle Unit Costs
Module: GROUT Waste Type: Hazardous
100
NOTE: Basis includes 20 years O&M
200 300
input Capacity (kg/hr)
Hazardous
400
Figure 11-5. PLCC versus capacity including unit rates for the grout stabilization (H-GROUT) module.
500
500
11-7

12. CERTIFICATION AND SHIPPING (MODULE CSHIP)
12.1 Basic Information
The equipment layout for the certification and shipping module, shown in Figure 12-1, consists of equipment for three unit operations: incoming material storage, inspection, and truck loading. This module receives packaged waste containers from treatment modules and provides temporary storage, and physical characterization of the waste, and facilitates shipment of the containers. The module is used in conjunction with treatment modules when the required functions are not available at existing facilities. The module includes all equipment needed for certification of the waste in compliance with the transportation, storage, and disposal regulations and requirements. Unit operations are shown in the PFD in Figure 12-2.
12.2 Technical Bases and Assumptions
12.2.1 Function and Operation of Module
Packaged waste containers arrive from treatment modules on conveyors, carts, or other transport devices. Containers are removed from the transport devices and placed in a staging area. The containers are then visually examined, tagged, logged, recorded, and sent to inspect and assay unit operation. In this unit operation, the contents of the containers are sampled and analyzed to ensure package quality and to verify accuracy of prior waste characterization. Next, the containers are weighed and measured to determine waste density.
After examination, each container is labeled and its properties are logged and recorded into a computerized database. After inspection, the container is moved to a temporary storage area until readied for shipment to an interim storage or disposal facility. Containers that do not meet the transportation dose criteria are placed in transportation overpacks.
The certification and shipping module is equipped with a bridge crane and a forklift. Containers can be loaded onto flat-bed trailer or van trucks. This module is designed to be installed contiguous to a treatment module. To allow year-round operations and minimize the effects of a potential spill, it is assumed that the certification and shipping operations will take place indoors.
12.2.2 integration of Module
Module input includes packaged waste from treatment modules. Input from the site includes utilities, service water, normal and emergency power, and communications. All O&M consumables including personal protective equipment must be purchased. Module output includes truck shipments of containerized waste which are sent to storage and disposal modules.
12-1

12.3 Cost Bases, Assumptions, and Results
Major equipment capital cost items for this module are a bridge crane, forklift truck, and analytical and physical testing equipment. The equipment estimates were obtained as discussed in the receiving and inspection (RCINS) module.
The lower costs for the hazardous waste version of this module mainly result from equipment and D&D costs.
Estimated FTE workers versus capacity is shown in Figure 12-3. Cost versus capacity for the certification and shipping module is shown in Figures 12-4 and 12-5.
12-2

A 2
CERTIFIED WASTE STORAGE AREA
NOTE: WALLS NOT SHOWN FOR CLARITY
Figure 12-1. Equipment layout for the certification and shipping (H-CSHIP) module.
FKILITY SIZE DIMENSION
IN FEET DIMENSION IN METERS FKILITY SIZE
A B A B SMALL too 64 30.5 19.5
MEDIUM 140 140 42. T 42. T
LARGE 200 236 61 72
EQUIPMENT LIST 0 ASSAY AND INSPECT STATION © BRIDGE CRANE AND LOAD GRAPPLER (£) FORK LIFT
FILENAME; H-CSHIP.DGN PLOT DATE! 5/26/94

INPUT PROCESS OUTPUT
PACKAGED WASTE
CONTAINERS <D-~ INCOMING MATERIAL STORAGE
(D
INSPECT (2)
TRUCK LOADING
(3) ^ >
WASTE CONTAINERS
to TO DISPOSAL OR STORAGE
Figure 12-2. Process flow diagram for the certification and shipping (H-CSHIP) module.

120
100
80
LU
2 60 OS E W m
40
20
CERTIFICATION AND SHIPPING FTE by Work Breakdown Structure Element
Module: CSHIP Waste Type: Hazardous
i
_ i , ** r
***
_ , • * !
f ' ..» , . - • -
> • •
' -
> 2,000 4,000 6,000
Input Capacity (kg/hr)
Pre-Operations Construction O&M (1year) D&D
8,000
Rgure 12-3. FTE workers versus capacity for the certification and shipping (H-CSHIP) module.
12-5

30
25
20
•+•* 0) O o •o (0 E w UJ
15
10
CERTIFICATION AND SHIPPING Cost by Work Breakdown Structure Element
Module: CSHIP Waste Type: Hazardous
- - t K H | . -
1 -r • 1 i ~^r~ " ~ '
1 r r - ~Jr 1 '
- _ 1 - . J?- i I J ^' A J - -
. . : f-'-T
2,000 4,000 6,000
Input Capacity (kg/hr)
Pre-Operations Construction O&M (1year) D&D
8,000
Figure 12-4. PLCC versus capacity for the certification and shipping (H-CSHIP) module.
12-6

(0 o o •o
CO
E (0
UJ
200
150
100
50
CERTIFICATION AND SHIPPING Total Life Cycle Costs
Module: CSHIP Waste Type: Hazardous
'
. 2 0 4 ' . 12828 . 8 2 5 5
2,000 4,000 6,000
Input Capacity (kg/hr)
Hazardous
NOTE: Basis includes 20 years O&M Triangles indicate capacities where detailed cost estimates were developed.
8,000
J—, Z5 O) .ac •— 1»
I •*•>
w o O 1.5 ^ o (o £ I
CD UJ n«;
CERTIFICATION AND SHIPPING Total Life Cycle Unit Costs
Module: CSHIP Waste Type: Hazardous
I -
•
J . . . . . . . 1
1 1 . ^̂ 1
^ ^ ^ -1 1
: 1 2,000
NOTE: Basis includes 20 years O&M
4,000 6,000
Input Capacity (kg/hr)
Hazardous
8,000
- 1.2
- 1
0.6
— 0.4
= 0.2
Figure 12-5. PLCC versus capacity including unit rates for the certification and shipping (H-CSHIP) module.
12-7

13. SHALLOW LAND DISPOSAL (MODULE SLDSP)
13.1 Basic Information
The shallow land disposal module essentially consists of trench disposal designed to meet RCRA requirements. The cost for a shallow land disposal consists of three components: treatment administration capital cost, disposal O&M cost, and site closure cost. Treatment administration capital cost is discussed in the TADMN module and should be added only if a new disposal module is under consideration.
13.2 Technical Bases and Assumptions
13.2.1 Function and Operation of Module
Waste received from the disposal administration module are transported to a disposal unit. Each disposal unit consists of an excavated and lined trench. The waste is placed in the bottom of die trench. Then, a layer of fill is placed on top of the waste. The final cap layer consists of at least 1.5 m (5 ft) of engineered fill dirt and clay. The disposal site includes all of the appropriate leachate collection and treatment equipment. Site monitoring includes both groundwater and air sampling systems.
13.2.2 Integration of Module
Input includes waste received from the treatment modules. All O&M consumables, including personal protective equipment, must be purchased from outside suppliers. No module output is anticipated after closure.
13.3 Cost Bases, Assumptions, and Assessments
The lower costs associated with the hazardous waste version of this module (compared to the radioactive waste versions) result from less stringent present-time monitoring and equipment requirements, lower O&M costs, and closure costs over a 30-year period rather than over a 300-year period.
FTE and cost versus capacity for the shallow land disposal module are shown in Figures 13-1 through 13-3.
13-1

SHALLOW LAND DISPOSAL FTE by Work Breakdown Structure Element
Module: SLDP Waste Type: Hazardous
i .. (. 1 , H t ,_.
i i i i i i i 0
! ' , ! ! ! ! * I ! I I I 1 * 1
— ; . _. ' ; ' ; 1 /---!-. i *
i ; ; ! .. ! ; • ; i i i i ' i * i , , , , , $_, 1 . : i ; ; : ' ; : i I I i i * i i I I I ! 1 * 1 I , 1 , p I T - m - -J. , r_ . i 1 I I I * I [
i i i i * t : i t i i • i i i , . 1 . j Y 1 1 !— 1 I I I m I I I
\ \ \ 'f \ \ \ I J 1 • \ I I ! - -. . 1 »-,- -y " j j ~i ; ; ; / ; ; ; ;
[ I I ̂ , I 1 , ,_ — | j — | ^ t (
i # i i i i ; /1 ! ', ; : I 1 * 1 I I I ! t t • I I I 1 I 7--- + ------V , , 7 1 1"" ' ' • ' ' ' ' '
— i ^ 1 — • — i — i — : — b ^ ^ S ^ ^
/ . Jtfs^rnT^. 1. -• -T- -• -• -r 0 10,000 20,000 30,000 40,000 50,000 60,000 70,000
Total Capacity (cubic meters)
Pre-Operations Construction O&M (1year) S&M
3-1. FTE workers versus capacity for the shallow land disposal (H-SLDSP) module.
13-2

SHALLOW LAND DISPOSAL Cost by Work Breakdown Structure Element
Module: SLDP Waste Type: Hazardous
• ! • 1
*
•
' < * 1
1 • 1 • *
\ 4
•
• i •
• /
1 ,
\ • 1 •
*
• | /
1 *
• ! 1 ^ ~
• *CT; - •
> - » • • • • • • • . . L . -. . - : . - . - ; . - • • •
0 10,000 20,000 30,000 40,000 50,000 60,000 70,000 Total Capacity (cubic meters)
Pre-Operations Construction O&M (1year) S&M
-2. PLCC versus capacity for the shallow land disposal (H-SLDSP) module.
13-3

s
25
20
O 1 S
o •a a> •e 10 to
E til s
SHALLOW LAND DISPOSAL Total Life Cycle Costs
Module: SLDSP Waste Type: Hazardous
X^F ' ^•V3 1 6 6 - « ° A 10,000 20,000 30,000 40,000 50,000
Total Capacity (cubic meters)
Hazardous
€0,000 70,000
NOTE: Basis includes 20 years O&M Triangles indicate capacities where detailed cost estimates were developed.
800
.—. 700 t o E
12. 600 (A O
O 500 •o o S 400
CO UJ 300
200
SHALLOW LAND DISPOSAL Total Life Cycle Unit Costs
Module: SLDSP Waste Type: Hazardous
i •• 1 i 1 - r 1 l T
% i i i i i i i
% i i i i i : i
10,000 20,000 30,000 40,000 50,000 Total Capacity (cubic meters)
Hazardous
60,000
- 22
2 0 ?? 18 ZZ.
- 16
15 -\ 14*5
IB E
H 12 ~ UJ
10
70,000
NOTE: Basis includes 20 years O&M
Figure 13-3. PLCC versus capacity including unit rates for the shallow land disposal (H-SLDSP) module.
13-4

14. COST ESTIMATION PROCEDURE
14.1 Overview
The report up to this point describes how the costs and FTEs of the various TSD modules were estimated. These costs and FTEs were estimated over a wide range of input capacities. These data were used to define cost and FTE versus capacity relationships for large generator modules, represented by curves on a graph. From a curve one can estimate the costs and FTEs of a module, given its capacity. From a group of such curves, one can estimate the FTEs and cost for treating, storing, and disposing of a given inventory of any combination of hazardous waste. A combination of modules that treats, stores, and disposes of a given inventory of such waste is referred to as a treatment scenario.
The cost estimation procedure in this section has been developed to allow the reader to estimate the total cost for a scenario for treating, storing, and disposing of this waste. The scenario estimation procedure essentially consists of three major steps, which are discussed in the following subsections.
14.2 Definition of Waste Loads
In the waste loads definition step, the capacity requirement for each module is defined. To use the WMFCI cost and FTE data, the total capacity requirements need to be converted into the appropriate processing rate (e.g., kg/hour, m3/hour) or disposal capacities (e.g., m3) by developing operating assumptions. There are three basic calculations that an estimator may need to use. These calculations are required to establish treatment processing rates, storage and disposal input and throughput rates, and total disposal volumetric requirements. The basic calculations and examples are provided as follow:
1. Front-end and treatment modules. The total unprocessed waste volume (m3) can be converted to a treatment input capacity processing rate (kg/hour) by the following calculations. The total volume in cubic meters (m3) is multiplied by the unprocessed waste density (kg/m3) to obtain the total mass in kilograms (kg). This mass is divided by the total hours of facility (module) operations. An example is as follows: [1,000 m3 x 1,242 kg/m3 (density of soil)]/(4,032 hours/year x 20 years of operation) = 15.4 kg/hour processing rate for 20 years.
2. Disposal module. The disposal throughput rate (nrVhour) can be converted into total volumes (m3) for disposal by multiplying the disposal input capacity by the total hours of facility (module) operations. An example is as follows: (0.50 nrVhour x 4,032 hours/year x 20 years of operation = 40,320 m3 total volume for disposal.
These calculations would need to be completed for existing or new facilities. The existing facility capacities are used for estimating O&M and D&D costs and FTEs only. New facility capacities are used to define preoperations, facility construction, O&M, and D&D costs, and FTEs.
14-1

There are two types of modules in the WMFCI report: treatment and disposal. Processing rates for each type of module may be defined as described in the following sections.
14.2.1 Facility Treatment Waste Loads
Facility treatment waste loads may be documented in a data sheet similar to that shown in Figure 14-1. As shown, the treatment modules are separated into the following four categories:
• Treatment front-end modules. To estimate cost and FTEs for the front-end modules, the total processing rate of the treatment facility must be defined. The processing rate of the treatment facility is used to size the treatment front-end modules even though some of the modules do not process the input waste per se. For hazardous waste facilities, there are three front-end modules: treatment administration (analytical laboratory and administration building); receiving and inspection; and assay, sort, and package. The user must define both the existing and new module loads for each of the three modules.
• Primary treatment modules. The total treatment processing rate must be subdivided according to the processing needs. The treatment modules in this report are designed to satisfy the processing needs of the 32 waste categories defined in Kirkpatrick 1995.
• Grout stabilization module. The processing rate for the grout stabilization module is defined by the input of unprocessed waste that bypasses the primary treatment modules and secondary wastes from primary treatment modules. For example, the grout stabilization module will receive both the ash from the incinerator and the inorganic solids that do not need primary treatment.
• Treatment back-end module. The waste load for the back-end module is equal to the sum of the output waste from the grout stabilization module and any waste that does not require secondary treatment (e.g., amalgamated waste from the mercury separation module).
14.2.2 Disposal Waste Loads
Unlike the treatment modules, which use mass feed rates as waste loads, disposal capacities are expressed in volumetric feed rates or as total volumes. One disposal module, shallow land disposal, is provided for hazardous waste treatment. As with treatment, the existing and new capacities must be defined for this category.
14.3 Estimating TSD Facility Cost and FTEs
Estimates of FTEs and PLCC for TSD facilities are prepared based on the processing requirements developed in the waste load definition step. The corresponding FTEs and cost
14-2

for each module are developed by referring to the FTEs and cost-versus-capacity curves and tables given in this report. For existing capacities, operating costs (which consists of O&M and D&D costs) will need to be defined. For new capacity needs, the facility construction and preoperation estimates must be added to the facility O&M and D&D costs. To obtain a total TSD facility cost, a sum of the cost or FTEs from all TSD modules must be obtained.
14.4 Transportation Costs
Transportation costs can be estimated by defining the total volume of waste to be transported and the distance in each of the potential transport segments (e.g., from generator to treatment facility, from treatment facility to storage facility, or from storage facility to disposal facility). Once the volumes and mileage are defined for each transportation segment, the cost data presented in Feizollahi et al. 1995 can be used to calculate the number of shipments and the associated transportation costs.
14-3

MODULES UNIT TOTAL CAPACITY
EXISTING CAPACITY
NEW CAPACITY
1. TREATMENT FRONT-END COMMON FUNCTIONS
© TREATMENT ADMINISTRATION
® RECEIVING AND INSPECTION
© ASSAY. SORT. AM) PACKAGING
kg/hr © TREATMENT ADMINISTRATION
® RECEIVING AND INSPECTION
© ASSAY. SORT. AM) PACKAGING
kg/hr _. © TREATMENT ADMINISTRATION
® RECEIVING AND INSPECTION
© ASSAY. SORT. AM) PACKAGING kg/hr _.
© TREATMENT ADMINISTRATION
® RECEIVING AND INSPECTION
© ASSAY. SORT. AM) PACKAGING kg/hr
I I . PRIMARY TREATMENT
© DEACTIVATION
® MERCURY SEPARATION
© RECYCLING
© ORGANIC S REMOVAl
0 INCINERATJON
© BYPASS PRIMARY (NOT A MODULE)
kg/hr
kg/hr
kg/hr
© DEACTIVATION
® MERCURY SEPARATION
© RECYCLING
© ORGANIC S REMOVAl
0 INCINERATJON
© BYPASS PRIMARY (NOT A MODULE)
kg/hr
© DEACTIVATION
® MERCURY SEPARATION
© RECYCLING
© ORGANIC S REMOVAl
0 INCINERATJON
© BYPASS PRIMARY (NOT A MODULE)
kg/hr
© DEACTIVATION
® MERCURY SEPARATION
© RECYCLING
© ORGANIC S REMOVAl
0 INCINERATJON
© BYPASS PRIMARY (NOT A MODULE) kg/hr
© DEACTIVATION
® MERCURY SEPARATION
© RECYCLING
© ORGANIC S REMOVAl
0 INCINERATJON
© BYPASS PRIMARY (NOT A MODULE)
I I I . SECONDARY TREATMENT AND STABILIZATION
® AOUEOUS »ASTE TREATMENT
©GROUT STABILIZATION
kg/hr
kg/hr -@ BYPASS SECONDARY INOT A MODULE) kg/hr
-@ BYPASS SECONDARY INOT A MODULE) kg/hr
-
IV. TREATMENT BACK-END COMMON FUNCTIONS ( f i ) CERTIFICATION AND SHIPPING | kg/hr |
V. DISPOSAL @ SHALLOW LAND DISPOSAL n.3 ._..
a
Figure 14-1. Treatment and disposal waste load data sheet. f
14-4

15. REFERENCES
Feizollahi, F. and D. Shropshire, 1994, Interim Report: Waste Management Facilities Cost Information for Hazardous Waste, EGG-WM-11432, August.
Feizollahi, F. and D. Shropshire, 1992, Waste Management Facilities Cost Information Report Data, EGG-WTD-10443, October.
Feizollahi, F., D. Shropshire, and D. Burton, 1995, Waste Management Facilities Cost Information for Transportation of Radioactive and Hazardous Materials, INEL-95/0300, Rev. 1, (formerly EGG-WM-10877, Rev. 1), June.
Kirkpatrick, T. D., 1995, DOE Waste Treatability Group Guidance, DOE/LLW-217, Rev. 0, January.
Shropshire, D., M. Sherick, and C. Biagi, 1995a, Waste Management Facilities Cost Information for Transuranic Waste, INEL-95/0015, Rev. 1, (formerly EGG-WM-11274), June.
Shropshire, D., M. Sherick, and C. Biagi, 1995b, Waste Management Facilities Cost Information for Low-Level Waste, INEL-95/0013, Rev. 0, June.
Shropshire, D., M. Sherick, and C. Biagi, 1995c, Waste Management Facilities Cost Information for Mixed Low-Level Waste, INEL-95/0014, Rev. 1, (formerly EGG-WM-10962), June.
15-1