waste management: overview of issues and regulation in...
TRANSCRIPT

Waste Management: Overview of issues and regulation in India
Suneel Pandey4th August 2015

Present status
• Municipal - 62 million tonnes/annum
• Construction & Demolition – 10-12 million tonnes/annum
• Industrial
– Hazardous – 7.90 million tonnes/annum
– Non Hazardous – 200 million tonnes/annum
• Biomedical – 1.5 lakh tonnes/annum
• Electronic – 8 lakh tonnes/annum

Key issues
• Municipal solid waste– Lack of waste segregation at source
– In efficient collection – efficiencies range from 50 to 90% in major metros; smaller cities, it is around 50%
– Inadequate transportation facilities in more than 70% of the cities
– Inadequate disposal – very few sanitary landfills– Landfill gas emission and contamination of water and
soil due to leachate – Biomedical waste, slaughter house waste, industrial
waste often reaching the MSW dumpsites posing potential hazard to sanitary workers and ragpickers

MSW characteristics in Indian cities
Parameter Unit Range
Compostable % 30 – 55
Recyclable (Plastics, Paper,
Metal, Glass etc)
% 5 – 15
Inter including construction &
demolition waste
% 40 - 55
Carbon/Nitrogen (C/N) Ratio 14 – 53
Moisture % 17 – 65
Calorific Value kcal/kg 520 – 3766
Source: CPCB

Door step collection of waste

Land requirement
• As per the CPCB report 2012-13– If all the waste is disposed, it will need 3,40,000 m3 of
landfill space every day
– In the present situation the municipal areas generate 1,33,760 TPD waste, of which only 25,884 TPD is treated and 1,07,876 TPD is disposed on land requiring around 2,12,752 m3 of land fill space
– Requirement of land for next 20 years could be as high as 66,000 ha (1240 ha per year)

Contamination due to leachate

Fire due to LFG
Key issues
• Construction and demolition debris
– No recycling/reuse though potentially almost everything can be recycled
– Waste still going to landfills or in abandoned areas in city landscape thus occupying valuable space

Key issues
• Non-hazardous solid waste
– No policy for effective management, recycling, reuse
• Hazardous waste
– Legacy contaminated sites
– Lack of incentive for recycling/reuse
– Illegal disposal for small industries
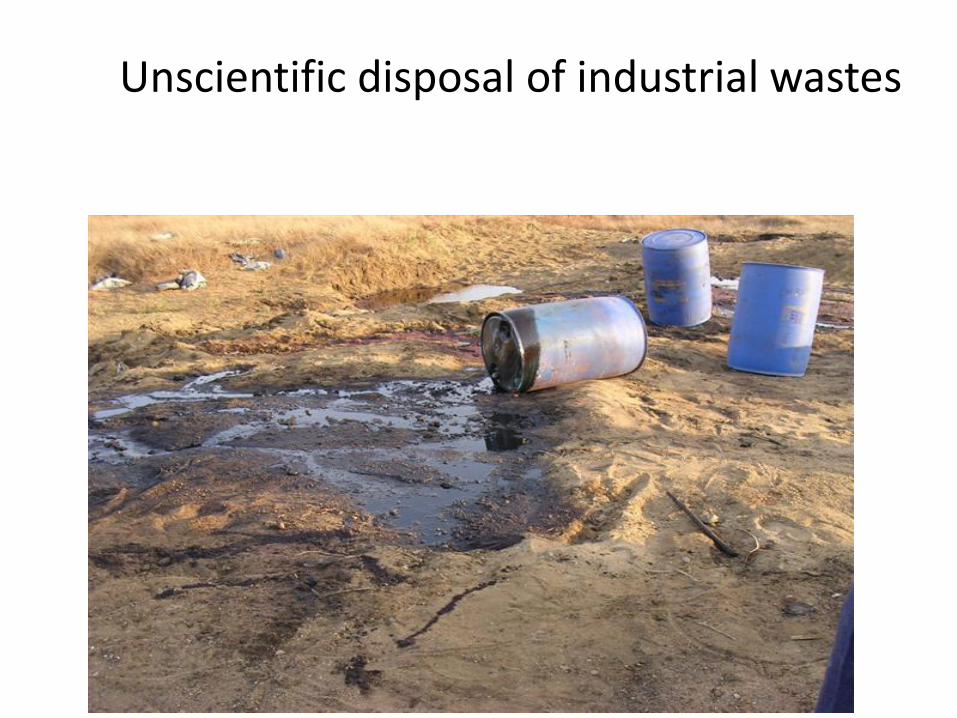
Unscientific disposal of industrial wastes

Unscientific disposal of industrial wastes…

Groundwater in Rajasthan

Key issues
• Biomedical waste
– Risk of injury/disease due to exposure
– High level of segregation and treatment required
– Waste often mixed and seen dumped to MSW sites
Key issues
• E-waste
– Transboundary movement
– Improper recycling in informal sector still rampant
– Soil and groundwater contamination
– Human health issues

Destination

Open burning of e-waste

Acid striping of chips and PCBs

Pollution of water bodies

Burning of waste

Pollution of soil

Distribution of Pb and Cu in soil

Air pollution

Air concentration

Water bodies

PCB levels

Regulation
• Municipal Solid Waste (Management and Handling) Rules 2000; Rules for 2013 awaiting notification – Mandates local body for primary collection,
storage, transportation, processing and disposal
– Emphasizes on need for segregation
– Bans organic waste to be disposed in landfills
– Promotes recycling and organic waste processing
– Prescribes standards for landfills and incineration facilities

Regulation
• Plastic Waste (Management and Handling) Rules 2011– Carry bags to be either transparent or with permitted
colourants (IS:9833:1981)
– Storage of food items not permitted in recycled plastic bags
– Ban on manufacturing of less than 40 micron bags
– Not to be used for pan masala, gutka or tobacco
– Recycled carry bags to conform to IS:14534:1998
– Carry bags from compostable plastics to conform to IS:17088:2008
– Guidelines for recycling
– EPR based

Regulation
• Hazardous Waste (Management, Handling and Transboundary Movement) Rules 2008– Provides broader definition of hazardous waste
• Characteristics based
• Process based
• Quantity based
– Harmonizes the definition with provisions of Basel Convention
– Restriction on waste import and export
– Manifest system for waste tracking

Regulation
• Biomedical Waste (Management and Handling) Rules 1998 and amendments thereof; draft rules 2011 awaiting notification
– Simplification of colour coding
– Mandatory authorization
– District level committees for monitoring
– Precautionary principle for ensuring safety of workers
Regulation
• E-waste (Management and Handling) Rules 2011 which became operational in May 2012– The rules empower the concerned state agencies to
control, supervise and regulate relevant activities connected with e-waste management such as collection, segregation, dismantling and recycling
– EPR central theme for the Rule– Provision of registered dismantlers and recyclers – Targets for reduction in hazardous components in
different products – Hazardous component of waste to disposed in
secured landfills

Future rules
• MSW Rules are being revised as MSW Rules 2015
• E-waste Rules are similarly revised
• Separate Rules for C&D waste being formulated
• Need assessment is being done for packaging waste
• Another critical issues is management of end-of-life lamps

Treatment facilities
• Hazardous waste – 30 common TSDFs spread across 16 states, 6 under construction
• Biomedical waste – presently 205 CBWTFs (188 operational and rest under commissioning); 688 incinerators, 2,710 autoclaves, 179 microwaves, 13 hydroclaves and 4,250 shredders as captive treatment equipment
• E-waste – 77 registered e-waste recycling facilities

Various options for managing solid wastes
• Alternative packaging, i.e., use of fabric or jute packaging instead of traditionally used polythene bags which are difficult to collect and recycle
• Lesser packaging without sacrificing product quality
• Designing products for disassembly so that majority of their components can be recycled at the end-of-life
• Utilization of waste packaging as fuel in cement kilns
• Recycling of e-waste to recover useful precious and semi-precious metals.

Excessive packaging

Design for disassembly
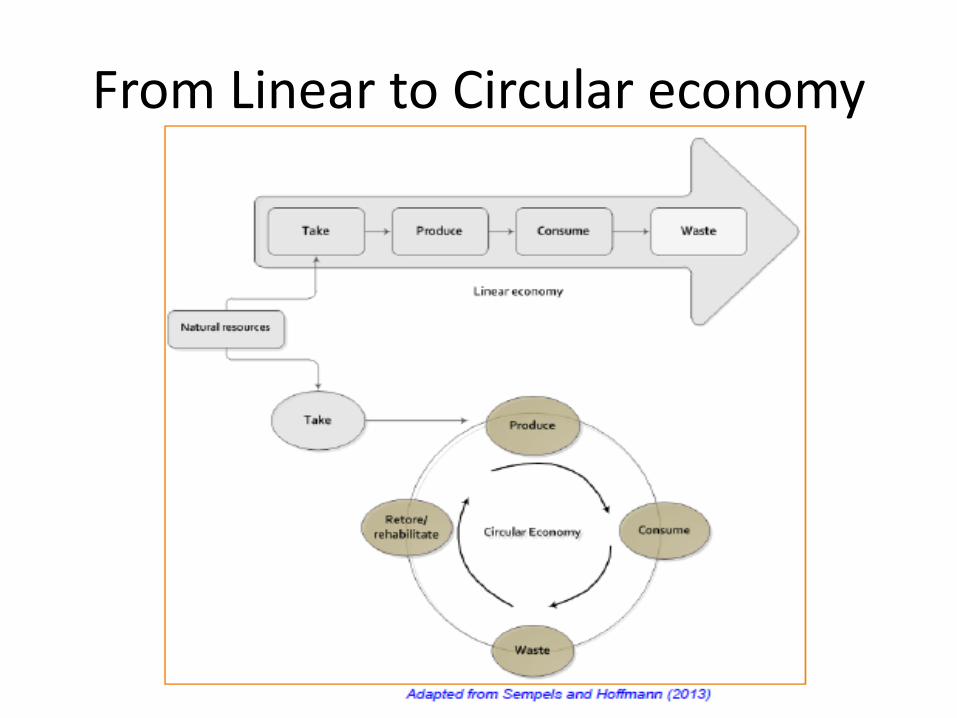
From Linear to Circular economy
Thank you
Suneel Pandey
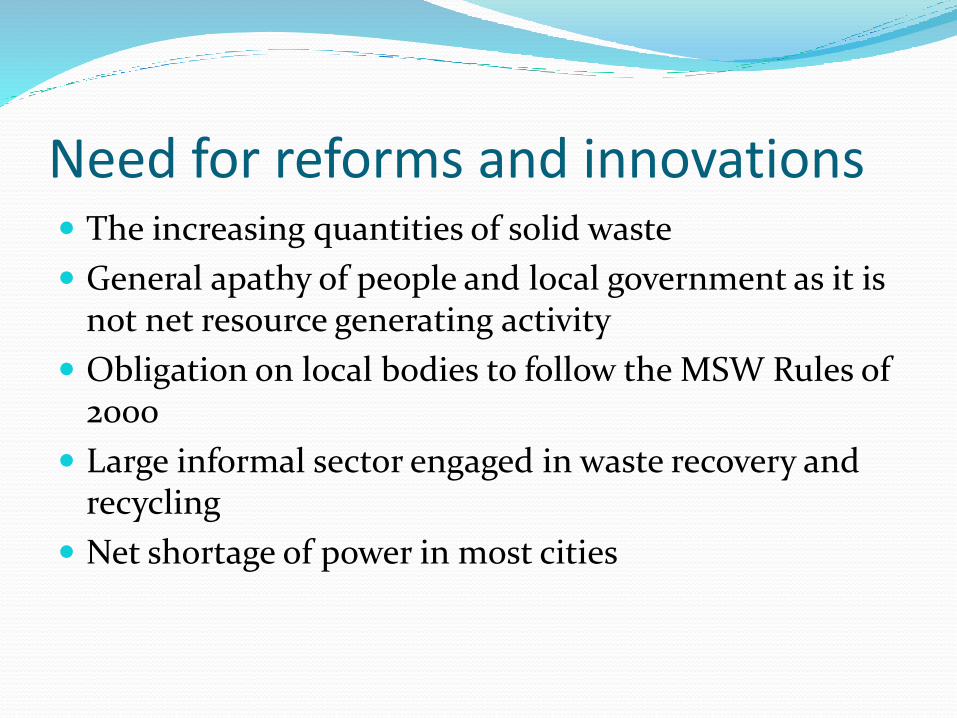
Need for reforms and innovations The increasing quantities of solid waste
General apathy of people and local government as it is not net resource generating activity
Obligation on local bodies to follow the MSW Rules of 2000
Large informal sector engaged in waste recovery and recycling
Net shortage of power in most cities

Sustainability goal in SWM Efficient waste management with a focus on:
Minimising wastes;
Maximising environmentally sound reuse and recycling;
Promoting environmentally sound waste treatment and disposal; and
Extending waste service coverage
Guiding factors would be Requirements of agenda 21
MSW Rules of 2000

Sustainability in solid waste service delivery Parameters to define sustainability with respect to
solid waste management would mean Process appropriate to local conditions from technical,
environmental, financial and social perspectives Capable of maintaining itself over period of time
without exhausting the resources it needs Important pre-requisite to improvement of
performance would be Availability of reliable data regarding waste
management practices on a continual basis Ability to measure performance through use of key
indicators


C&D waste scenario in India
Presence of C&D waste and drain silt, dust and grit from road sweeping) is significant – about a third of the total municipal solid waste generated
C&D waste recycling needs to be focus on (i) the potential to save natural resources (stone, river sand, soil etc.), (ii) its bulk which is carried over long distances for just dumping, (iii) its occupying significant space at landfill sites and (iv) its presence spoils processing of bio-degradable as well recyclable waste
C&D waste has potential use after processing and grading Utilization of C&D waste is quite common in industrialized
countries but in India so far only one organized facility has been set up (in Delhi)


Illegal Dumping
CPCB
Sarai Kale KhanSaket
Near CPCB
Near LNJP
What is required to be done for sustainability of SWM system and proper management of C&D waste
Plan a separate line of collection and transportation of C&D waste
Separate storage of C&D waste for different categories of generators (household, institutional, infrastructure)
Processing for better utilization (even fine material can be used as inert daily cover for landfill)
Disposal of only the portion which can not be gainfully used and
A mechanism to identify and locate generators of C&D waste

Relevant rules and guidelinesC&D is briefly included in the ‘Municipal
Solid Waste (Management and Handling) Rules, 2000’ for its separate collection
There is a need for examining (a) the various possibilities for optimal use of C&D waste (b) interventions by State and Local Governments and (c) incorporation of necessary directions in the ‘MSW Rules

What is happening internationallySelected international experience relevant for the Indian situation:
Scotland – About 63% was recycled, remaining 37% being disposed in landfills
Specifications and code of practice for recycled products
Planning system to facilitate use, computerizing transfer note system to facilitate data analysis and facilitating dialogue between agencies for adoption of secondary aggregates by contractors

What is happening internationally
USA – C&D waste accounts for about 22% of the total waste generated in the USA
Reuse and recycling of C&D waste is one component of a larger holistic practice called sustainable or green building practice
Promoting ‘deconstruction’ in place of ‘demolition’
Deconstruction means planned breaking of a building with reuse being the main motive

What is happening internationally
Japan – Much of the R&D in Japan is focussed on materials which can withstand earthquake and pre-fabrication
Concrete and composite materials constitute the main construction materials
95% of concrete is crushed and reused as road bed and backfilling material, 98% of asphalt + concrete and 35% sludge is recycled
Singapore – C&D waste is separately collected
A private company (Sembwaste) has built an automated facility with 3,00,000 ton per annum capacity

Possibilities of C&D waste management in India Experiments by CRRI has shown that it is possible to use
C&D waste for road and embankment construction –embankment and sub-base, stabilized base course, rigid pavement etc.
CPWD already has recommendations for salvage value (salvage content)
Recycling of black-top road has already been tried successfully (e.g., Mehrauli – Badarpur Road and DeshBandhu Gupta Road in Delhi)
Systematic collection is crucial for success of the C&D waste management system
The Pilot project by IL&FS
• Land Size -7 Acres in Burari, Jahangirpuri
• Capacity- 500 TPD, Greenfield project
• Land Ownership- Municipal Corporation of Delhi
• Leased for a period of 10 Years to IL&FS on Develop, Build, Operate and Transfer (DBOT) basis

Before

After

As per our concession agreement about 500 tonnesper day of C&D waste is lifted from different places in city
Approx. 2,00,000 tons of Construction and Demolition waste was lifted from entire Delhi during Common Wealth Games.
Collection of C&D WASTE

Test Road
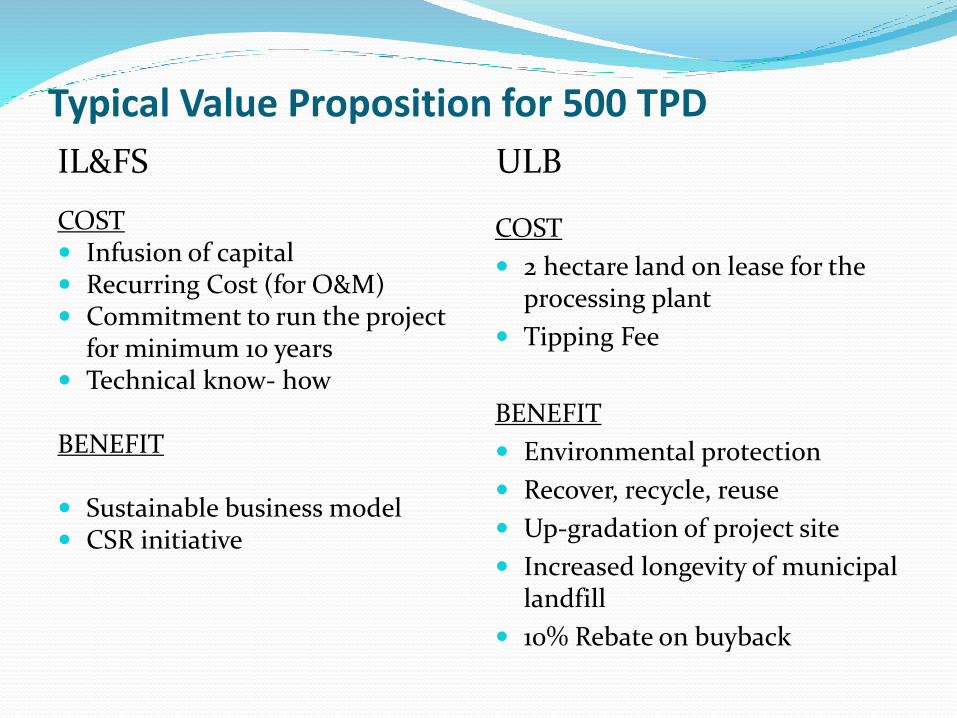
Typical Value Proposition for 500 TPD
IL&FS
COST Infusion of capital Recurring Cost (for O&M) Commitment to run the project
for minimum 10 years Technical know- how
BENEFIT
Sustainable business model CSR initiative
ULB
COST
2 hectare land on lease for the processing plant
Tipping Fee
BENEFIT
Environmental protection
Recover, recycle, reuse
Up-gradation of project site
Increased longevity of municipal landfill
10% Rebate on buyback

Problem description Uncontrolled methane emission from MSW disposal sites
are potential source of GHG emission
There are close to 5100 cities and towns in the country each having atleast one (mostly two) such sites which are such source of such emissions
Such landfill once they reach their capacities will have to be closed and redeveloped into alternative post closure land use
Efforts worldwide to tackle the problem have focused on gainful recovery of methane as potential energy source
In India, as on date, no pilot has been demonstrated in field conditions based on actual site data

Schematic of secured landfill
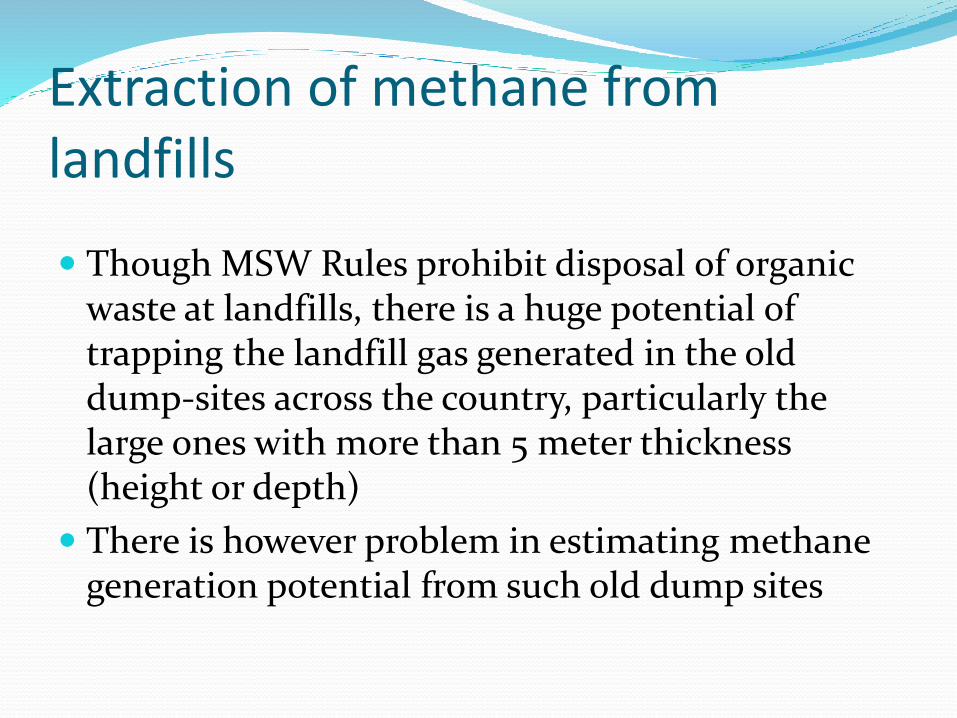
Extraction of methane from landfills
Though MSW Rules prohibit disposal of organic waste at landfills, there is a huge potential of trapping the landfill gas generated in the old dump-sites across the country, particularly the large ones with more than 5 meter thickness (height or depth)
There is however problem in estimating methane generation potential from such old dump sites

Problems in estimation of methane from old dumps
Reliable records of waste deposition is rarely available
The deposited waste is often put on fire, so the organic waste gets burnt, losing its potential of generating methane
Since these dumpsites are without a bottom liner or an impervious top cover, the gas escapes through convenient routs (apart from issues of water and air pollution)
A properly designed system would not only trap maximum gas but also contain pollution
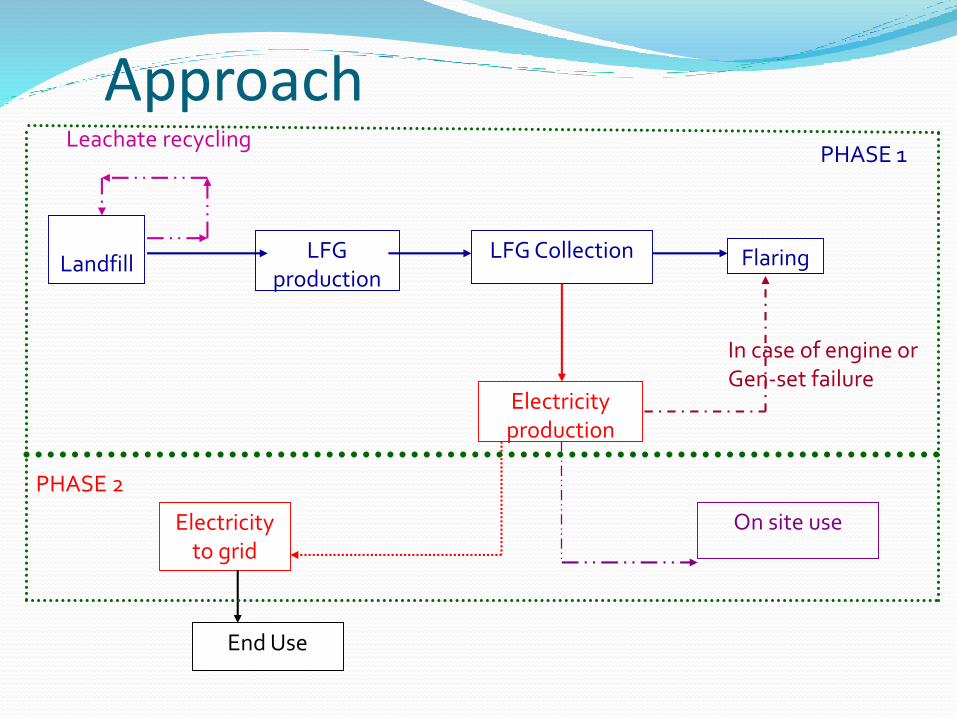
LandfillLFG
productionLFG Collection
Electricity production
Electricity to grid
End Use
On site use
Flaring
PHASE 1
PHASE 2
Leachate recycling
In case of engine or Gen-set failure
Approach

Proposed disposal site for pilot Disposal site at Okhla
Started in 1994, area: 16.89 ha; operated by MCD
Present waste received is around 1200 TPD
Presently has around 5.6 million tonnes of waste in place to a depth of 20-30 m
At present, there is no LFG recovery or flaring system at the disposal site
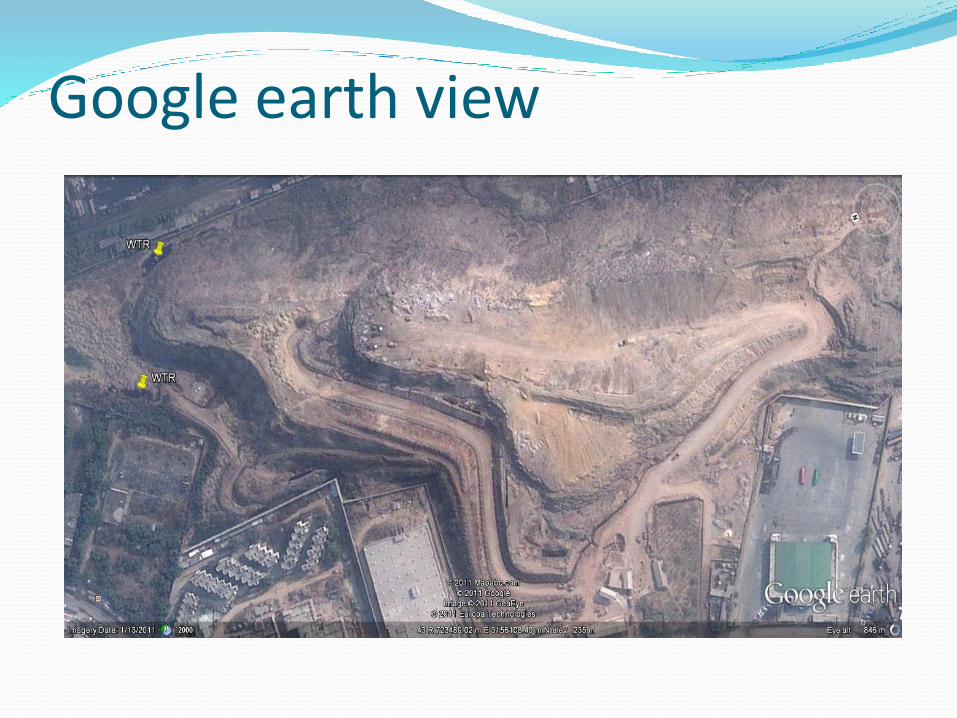
Google earth view

Cross-section for LFG well and extraction network
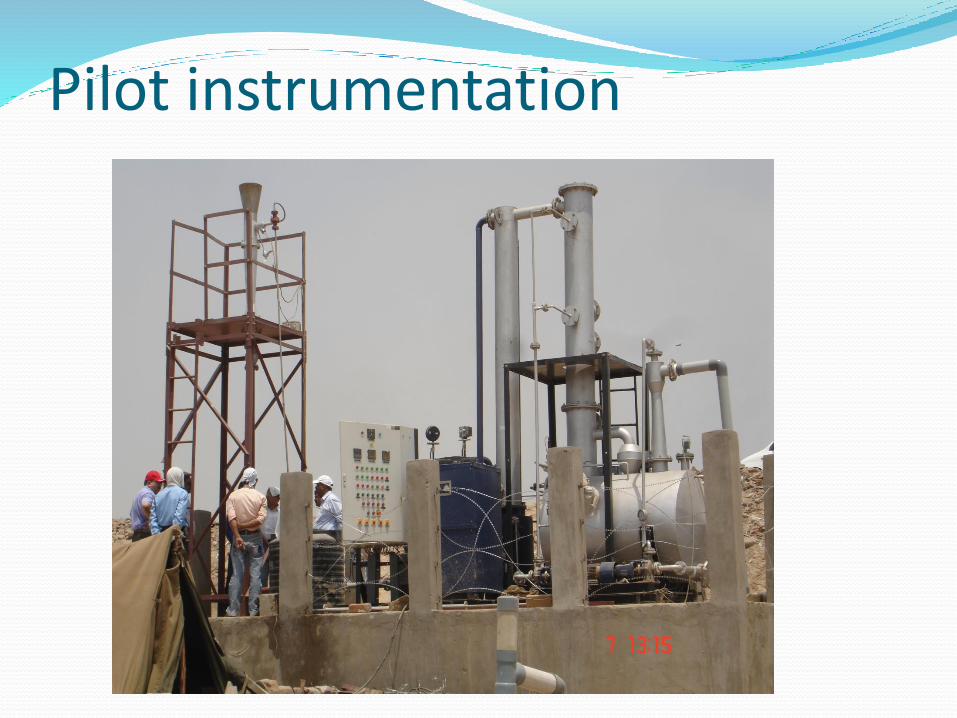
Pilot instrumentation

Instrument for measurement
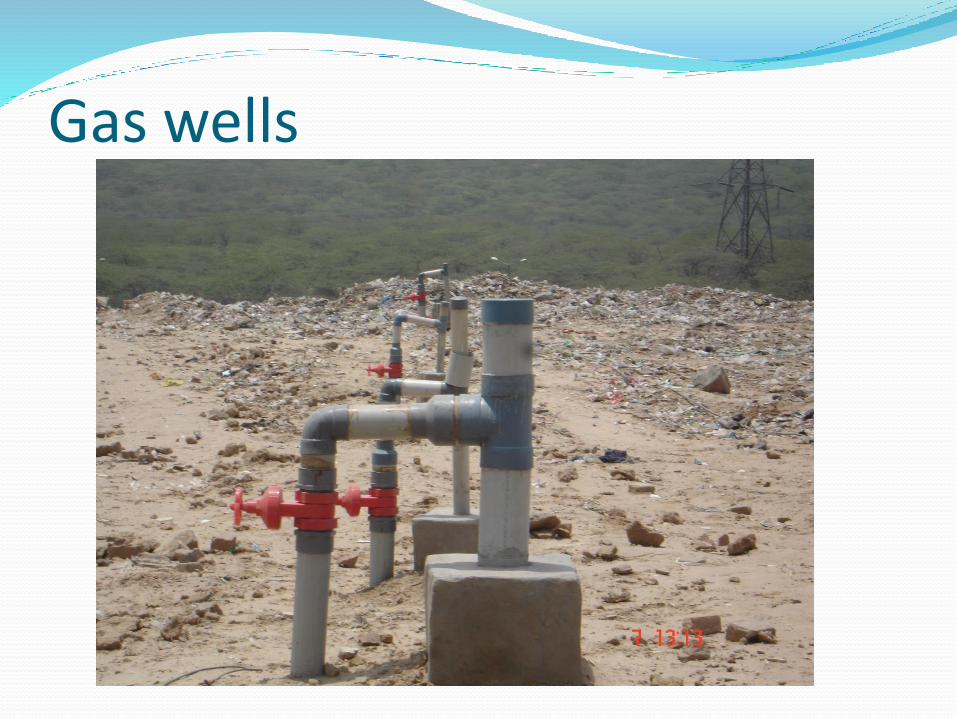
Gas wells

Potential users

Problem with waste pickers

Results (1)
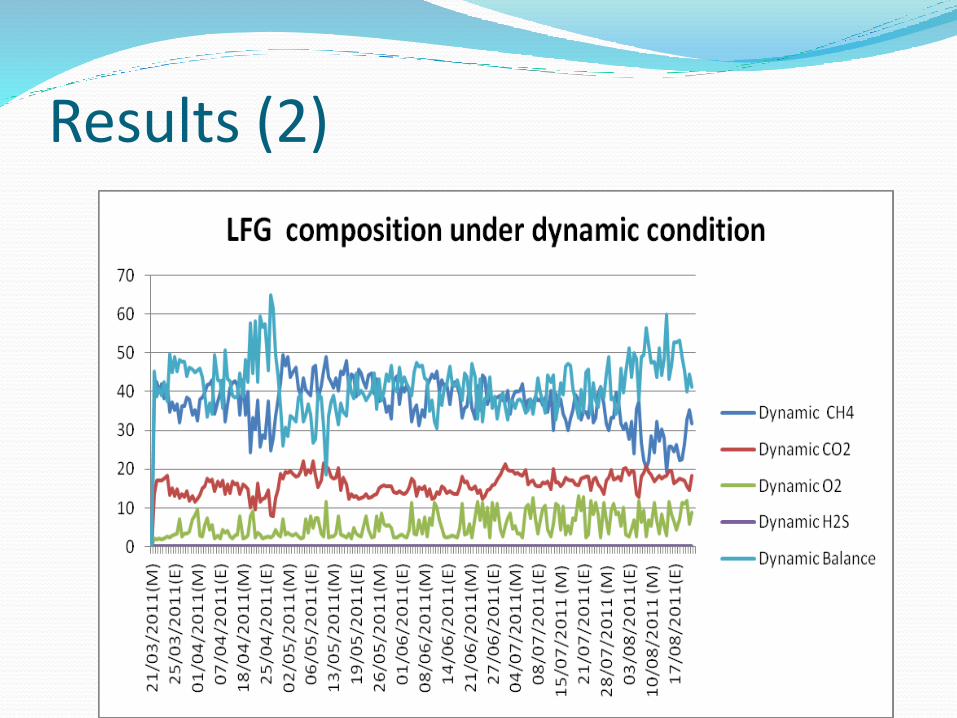
Results (2)

Results (3)

Results (4)
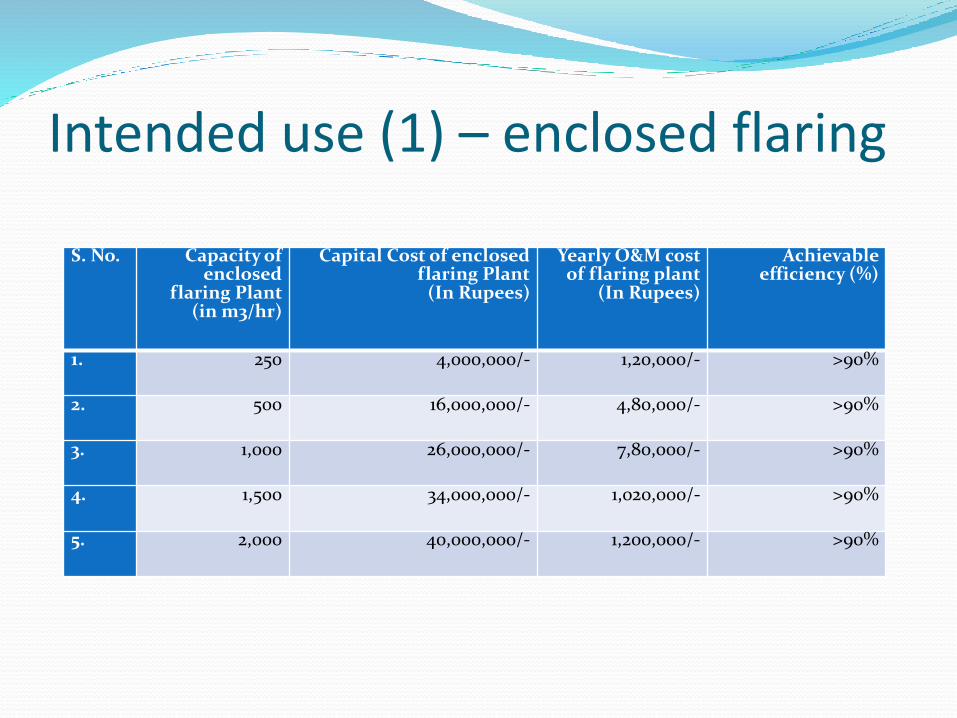
Intended use (1) – enclosed flaring
S. No. Capacity of enclosed
flaring Plant (in m3/hr)
Capital Cost of enclosed flaring Plant
(In Rupees)
Yearly O&M cost of flaring plant
(In Rupees)
Achievable efficiency (%)
1. 250 4,000,000/- 1,20,000/- >90%
2. 500 16,000,000/- 4,80,000/- >90%
3. 1,000 26,000,000/- 7,80,000/- >90%
4. 1,500 34,000,000/- 1,020,000/- >90%
5. 2,000 40,000,000/- 1,200,000/- >90%
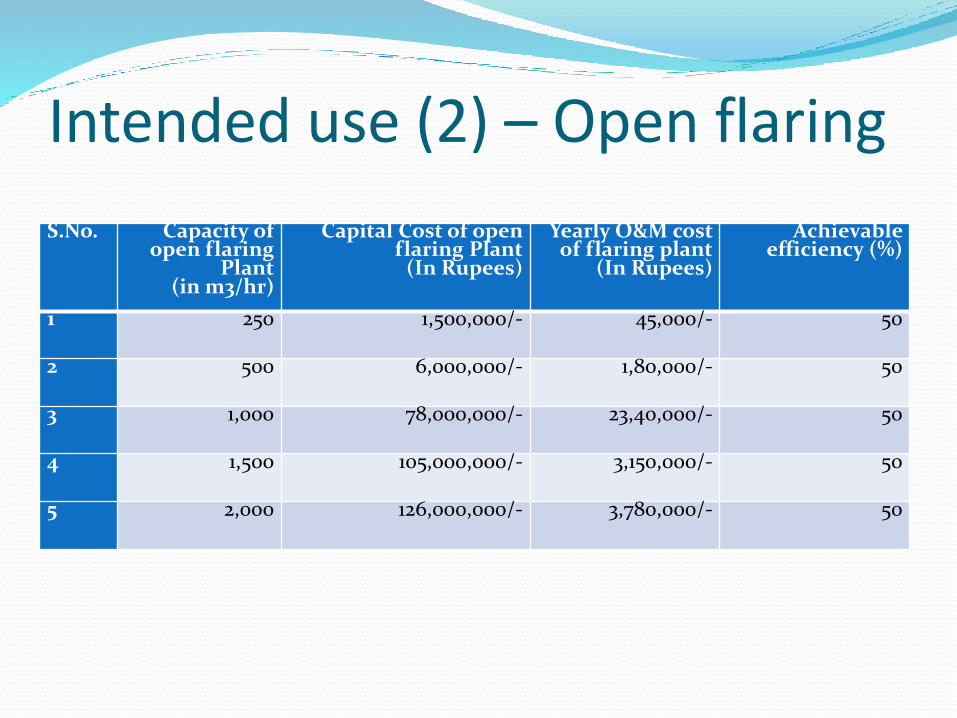
Intended use (2) – Open flaring
S.No. Capacity of open flaring
Plant(in m3/hr)
Capital Cost of open flaring Plant
(In Rupees)
Yearly O&M cost of flaring plant
(In Rupees)
Achievable efficiency (%)
1 250 1,500,000/- 45,000/- 50
2 500 6,000,000/- 1,80,000/- 50
3 1,000 78,000,000/- 23,40,000/- 50
4 1,500 105,000,000/- 3,150,000/- 50
5 2,000 126,000,000/- 3,780,000/- 50

Intended use (3) – as a fuel in boiler
S. No.
Capacity of LFG Plant (in m3/hr)
Capital Cost of
LFG Plant(In
Rupees)
Yearly O&M cost
of plant (In
Rupees)
Payback period
(In Years)
Per unit cost of
fuel (In Rupees)
Achievable
efficiency(%)
1 250 500,000/- 15,000/- 4-5 4.0 70
2 500 2,000,000/-
60,000/- 4-5 4.0 70
3 1,000 28,000,000/-
8,40,000/- 4-5 4.0 70
4 1,500 35,000,000/-
1,050,000/- 4-5 4.0 70
5 2,000 38,000,000/-
1,140,000/- 4-5 4.0 70
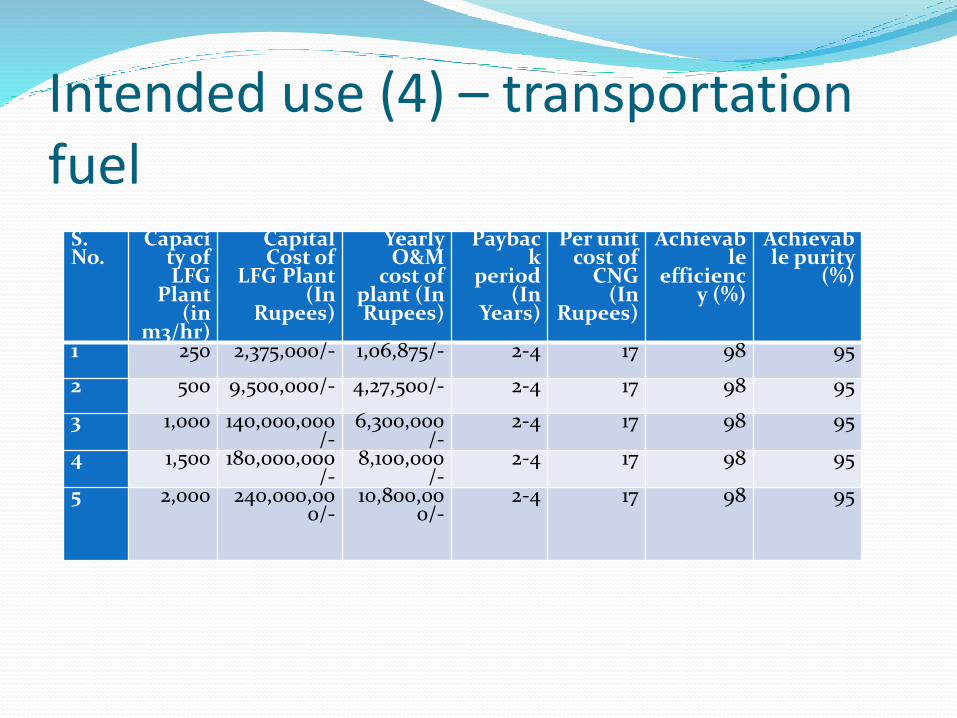
Intended use (4) – transportation fuel
S. No.
Capacity of LFG
Plant (in
m3/hr)
Capital Cost of
LFG Plant (In
Rupees)
Yearly O&M
cost of plant (In Rupees)
Payback
period (In
Years)
Per unit cost of
CNG (In
Rupees)
Achievable
efficiency (%)
Achievable purity
(%)
1 250 2,375,000/- 1,06,875/- 2-4 17 98 95
2 500 9,500,000/- 4,27,500/- 2-4 17 98 95
3 1,000 140,000,000/-
6,300,000/-
2-4 17 98 95
4 1,500 180,000,000/-
8,100,000/-
2-4 17 98 95
5 2,000 240,000,000/-
10,800,000/-
2-4 17 98 95

Intended use (5) – cooking fuel
S.No
Capacity of LFG
Plant (in m3/hr)
Capital Cost of LFG
Plant(In Rupees)
Yearly O&M cost
of plant(In
Rupees)
Payback period
(In Years)
Per unit cost of
NG (In
Rupees)
Achievable
efficiency (%)
Achievable purity
(%)
1 250 21,750,000/- 9,78,750/- 2-4 35 98 95
2 500 87,000,000/-
3,915,000/- 2-4 35 98 95
3 1,000 1,25,000,000/-
5,625,000/-
2-4 35 98 95
4 1,500 1,60,000,000/-
7,200,000/-
2-4 35 98 95
5 2,000 2,15,000,000/-
9,675,000/-
2-4 35 98 95
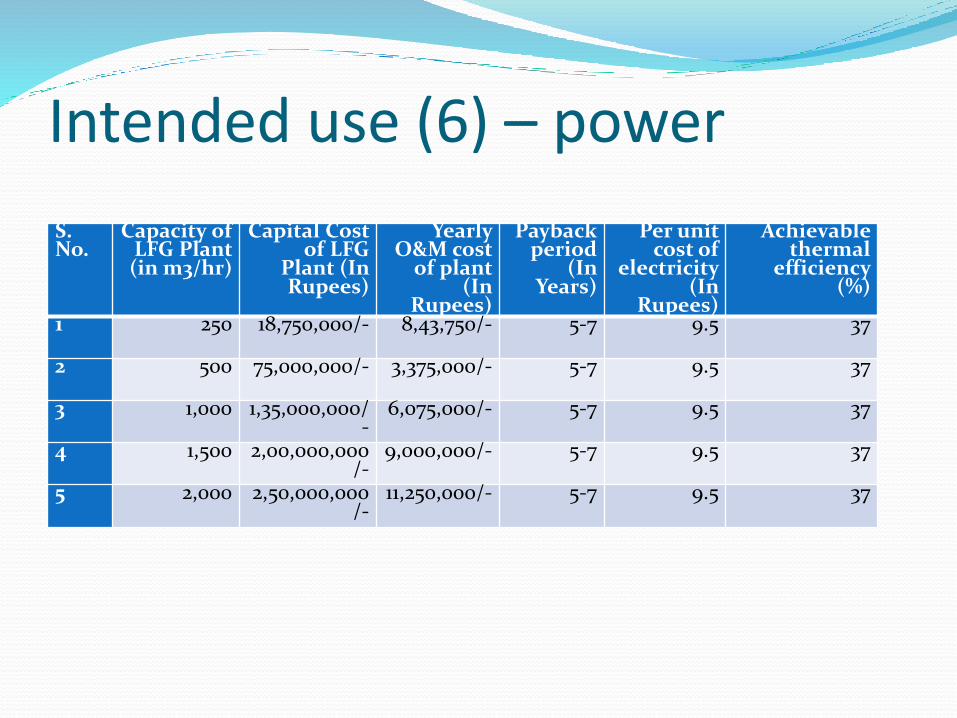
Intended use (6) – power
S. No.
Capacity of LFG Plant (in m3/hr)
Capital Cost of LFG
Plant (In Rupees)
Yearly O&M cost
of plant (In
Rupees)
Payback period
(In Years)
Per unit cost of
electricity (In
Rupees)
Achievable thermal
efficiency (%)
1 250 18,750,000/- 8,43,750/- 5-7 9.5 37
2 500 75,000,000/- 3,375,000/- 5-7 9.5 37
3 1,000 1,35,000,000/-
6,075,000/- 5-7 9.5 37
4 1,500 2,00,000,000/-
9,000,000/- 5-7 9.5 37
5 2,000 2,50,000,000/-
11,250,000/- 5-7 9.5 37
