waste treatment - upgrading poultry-processing …infohouse.p2ric.org/ref/14/13098.pdf · waste...
TRANSCRIPT
Waste Treatment
Upgrading Poultry-Processin1 Facilities to Reduce Pollutio

POLLUTION PREVENTION PAYS PROGRAM Department of Natural Resources & Community Development
P. 0. BOX 27687 RALEIGH. N. C. 27611-7687
E PA-62513-73-001
WASTE TREATMENT
Upgrading Existing Poultry-Processing Facilities
to Reduce Pollution
ENVIRONMENTAL PROTECTION AGENCY 0 Technology Transfer
July 1973
ACKNOWLEDGMENT
This seminar publication contains materials prepared for the U.S. Environmental Protection Agency Technology Transfer Program and presented at industrial pollution-control seminars for the poultry-processing industry.
Giffels Associates, Inc., Architects-Engineers-Planners, Detroit, Mich., prepared this publication.
NOTICE c
The mention of trade names or commercial products in this publication is for illustration purposes, and does not constitute endorsement or recommenda- tion for use by the U.S. Environmental Protection Agency.
CONTENTS
Page
Introduction . . . . . . . . . . . . . . . . . . . . . . . . . . . . . . . . . . . . . . . . . . 1 Why Is Wastewater Treatment Needed? . . . . . . . . . . . . . . . . . . . . . . . 1 Probable Wastewater Quantities and Properties . . . . . . . . . . . . . . . . . . . 1 Wastewater-Treatment Processes . . . . . . . . . . . . . . . . . . . . . . . . . . 3
Chapter I . Planning for Wastewater Treatment . . . . . . . . . . . . . . . . . . . . . . . . 5 Wastewater Surveys . . . . . . . . . . . . . . . . . . . . . . . . . . . . . . . . . 5 Initial Planning for a Wastewater-Treatment System . . . . . . . . . . . . . . . . 5 Selection of a Poultry Wastewater-Treatment Process . . . . . . . . . . . . . . . . 6 Upgrading Existing Lagoons . . . . . . . . . . . . . . . . . . . . . . . . . . . . . 10
Chapter I1 . Operating a Wastewater-Treatment System . . . . . . . . . . . . . . . . . . . . 13
Chapter I11 . Case History-the Original Gold Kist Wastewater Facilities 17 Site Selection . . . . . . . . . . . . . . . . . . . . . . . . . . . . . . . . . . . . 17 Wastewater Survey and Criteria . . . . . . . . . . . . . . . . . . . . . . . . . . . 17 Selection of the Treatment Process . . . . . . . . . . . . . . . . . . . . . . . . . 19 The Flow Diagram . . . . . . . . . . . . . . . . . . . . . . . . . . . . . . . . . . 20
. Design Criteria Used . . . . . . . . . . . . . . . . . . . . . . . . . . . . . . . . . . Future Expansion Provisions . . . . . . . . . . . . . . . . . . . . . . . . . . . . 23 Waste-Treatment System Costs . . . . . . . . . . . . . . . . . . . . . . . . . . . 24 Operating Arrangments . . . . . . . . . . . . . . . . . . . . . . . . . . . . . . . 25
Project History . . . . . . . . . . . . . . . . . . . . . . . . . . . . . . . . . . . 27 Current Wastewater Loads . . . . . . . . . . . . . . . . . . . . . . . . . . . . . . 27 Current Operating Difficulties . . . . . . . . . . . . . . . . . . . . . . . . . . . . 28 Proposed Wastewater-Treatment System Loads . . . . . . . . . . . . . . . . . . . 30 Review of Component Adequacy . . . . . . . . . . . . . . . . . . . . . . . . . . 31 Proposed Modifications . . . . . . . . . . . . . . . . . . . . . . . . . . . . . . . 35
".
. . . . . . . . . . . .
20
Chapter IV . Case Historyxurrent Expansion at Gold Kist . . . . . . . . . . . . . . . . . . 27
iii
c
I NTROD UCTl 0 N
WHY IS WASTEWATER TREATMENT NEEDED?
The discharge of waterborne wastes into a stream may impart turbidity, reduce dissolved oxy- gen, form sludge deposits, alter salinity, pH, and temperature, produce nutrients that result in undesirable growths, and impart toxicity to that stream. The introduction of any one of these factors in a natural body of water may adversely affect the flora and reduce the value of that water to subsequent users. Increased turbidity in a stream may kill fish, affect the growth of green plants by scattering light, and result in settleable solids. Settleable solids may fill a body of water and cover aquatic vegetation so that it will not grow. Where the settleable solids are organic in nature, they may cause sludge blankets at the stream bottom that degrade anaerobically (in the absence of oxygen) with the production of gases that buoy up noxious matter causing odors and scum at the water’s surface. A reduction in dissolved oxygen concentration in a stream results from the intro- duction of oxygen-demanding substances that may be either organic or inorganic in nature. The organic material reduces dissolved oxygen as a consequence of aerobic (in the presence of dissolved oxygen) decomposition and inorganic substances may react chemically with the dissolved oxygen of the stream. Fish require a dissolved oxygen concentration of 5 milligrams per liter (mg/l) for a wholesome life. The pH must be maintained in the range of 6.5 to 8.5 for a well-balanced biological system in the water course. Acids and alkalis may make the fish susceptible to fungus attack. Increasing the salinity of a stream may result in alteration of the osmotic pressure in fish. Sub- stances that produce nutrients will increase plant growth. Rapid growth of algae is a common result of the excessive discharge of nutrients such as nitrogen and phosphorus. Excessive algae growth causes tastes and odors in the water supply and also may result in the clogging of water-treatment plant intake screens. Large concentrations of algae may result in extreme variations in dissolved oxygen concentration from daytime high dissolved oxygen levels to nighttime low levels. Increased water course temperature results in accelerated oxygen depletion and a disruption of aquatic life. The discharge of toxic substances to a stream may destroy aquatic life and render a stream of no value as a water supply for downstream water users.
-
Wastewater treatment or processing for removal of those adverse constituents described pre- viously is required to protect the quality of existing water resources. Nearly every lake or stream in this country today is regulated in terms of the quality and quantity of effluents that may be dis- charged into it. Either Federal, State, or local agencies have the authority to establish water-quality standards for the effluents and to enforce those standards. Consequently, one of the best sources of guidance in terms of the wastewater-treatment needs of a poultry plant is the authority having juris- diction over discharge into the receiving stream. The authority having jurisdiction shall determine the quality of the effluent discharged and can offer experienced guidance on this subject.
PROBABLE WASTEWATER QUANTlTl ES AND PROPERTIES
The quantity of wastewater discharged from processing operations in a poultry plant may range from 5 to 10 gallons per bird with 7 gallons being a typical value. Poultry-processing wastewater is typically organic in character, higher than domestic sewage in biochemical oxygen demand (BOD),
1
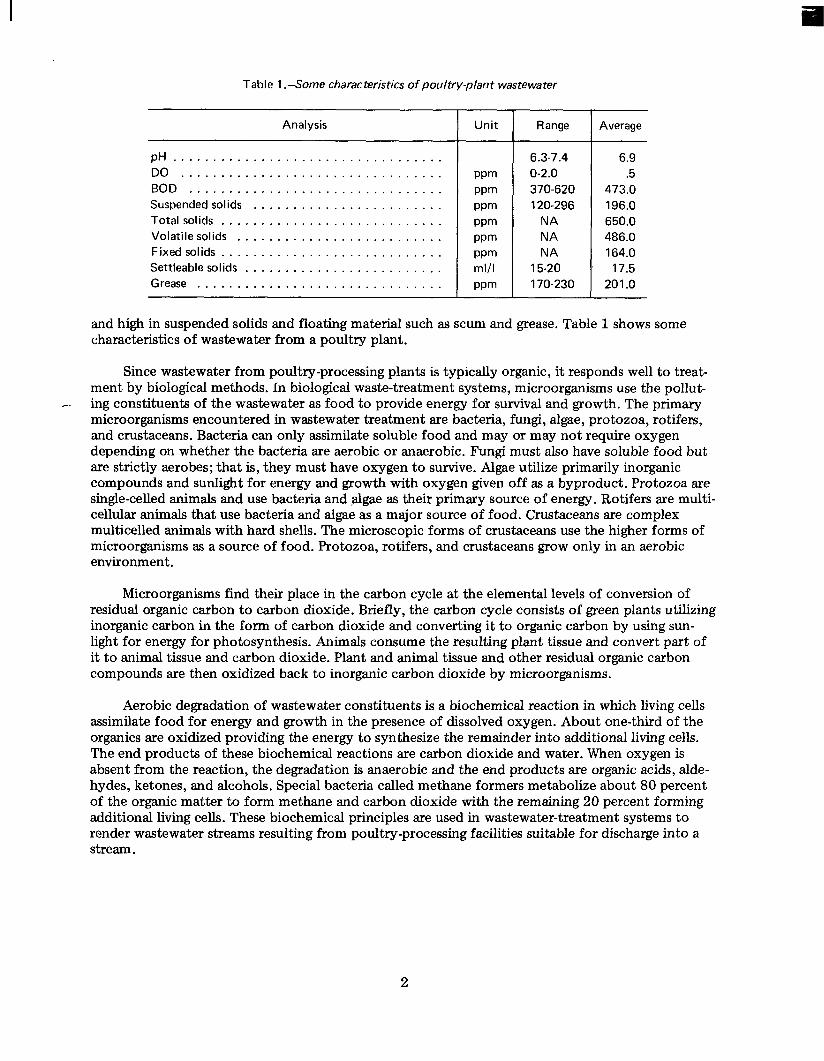
Table 1 .-Some characteristics of poultry-plant wastewater
Analysis 1 Unit I Range 1 Average
pH . . . . . . . . . . . . . . . . . . . . . . . . . . . . . . . . . . DO . . . . . . . . . . . . . . . . . . . . . . . . . . . . . . . . . BOD . . . . . . . . . . . . . . . . . . . . . . . . . . . . . . . . Suspended solids . . . . . . . . . . . . . . . . . . . . . . . . Total solids . . . . . . . . . . . . . . . . . . . . . . . . . . . . Volatile solids . . . . . . . . . . . . . . . . . . . . . . . . . . Fixed solids . . . . . . . . . . . . . . . . . . . . . . . . . . . . Settleable solids . . . . . . . . . . . . . . . . . . . . . . . . . Grease . . . . . . . . . . . . . . . . . . . . . . . . . . . . . . .
PPm PPm PPm PPm PPm PPm ml/l PPm
~~ ~
6.3-7.4 0-2.0 370-620 120-296
NA NA NA
15-20 170-230
6.9 .5
473.0 196.0 650.0 486.0 164.0 17.5
201 .o
and high in suspended solids and floating material such as scum and grease. Table 1 shows some characteristics of wastewater from a poultry plant.
Since wastewater from poultry-processing plants is typically organic, it responds well to treat- ment by biological methods. In biological waste-treatment systems, microorganisms use the pollut- ing constituents of the wastewater as food to provide energy for survival and growth. The primary microorganisms encountered in wastewater treatment are bacteria, fungi, algae, protozoa, rotifers, and crustaceans. Bacteria can only assimilate soluble food and may or may not require oxygen depending on whether the bacteria are aerobic or anaerobic. Fungi must also have soluble food but are strictly aerobes; that is, they must have oxygen to survive. Algae utilize primarily inorganic compounds and sunlight for energy and growth with oxygen given off as a byproduct. Protozoa are single-celled animals and use bacteria and ,algae as their primary source of energy. Rotifers are multi- cellular animals that use bacteria and algae as a major source of food. Crustaceans are complex multicelled animals with hard shells. The microscopic forms of crustaceans use the higher forms of microorganisms as a source of food. Protozoa, rotifers, and crustaceans grow only in an aerobic environment.
-.
Microorganisms find their place in the carbon cycle at the elemental levels of conversion of residual organic carbon to carbon dioxide. Briefly, the carbon cycle consists of green plants utilizing inorganic carbon in the form of carbon dioxide and converting it to organic carbon by using sun- light for energy for photosynthesis. Animals consume the resulting plant tissue and convert part of it to animal tissue and carbon dioxide. Plant and animal tissue and other residual organic carbon compounds are then oxidized back to inorganic carbon dioxide by microorganisms.
Aerobic degradation of wastewater constituents is a biochemical reaction in which living cells assimilate food for energy and growth in the presence of dissolved oxygen. About one-third of the organics are oxidized providing the energy to synthesize the remainder into additional living cells. The end products of these biochemical reactions are carbon dioxide and water. When oxygen is absent from the reaction, the degradation is anaerobic and the end products are organic acids, alde- hydes, ketones, and alcohols. Special bacteria called methane formers metabolize about 80 percent of the organic matter to form methane and carbon dioxide with the remaining 20 percent forming additional living cells. These biochemical principles are used in wastewater-treatment systems to render wastewater streams resulting from poultry-processing facilities suitable for discharge into a stream.
2
WASTEWATER-TREATMENT PROCESSES
Wastewater-treatment systems in the poultry-processing industry usually provide primary and secondary treatment and may or may not include tertiary treatment. Primary treatment consists of screening, comminutor and primary sedimentation, or flotation for removal of solid and particu- late mat,ter. Primary treatment is discussed in more detail in the second paper of this seminar, “Pretreatment of Poultry-Processing Wastes.”
The secondary treatment required for discharge to a stream may be in the form of an activated sludge or trickling filter system, a system of lagoons, or an irrigation system. Each of these methods of biological treatment has been tried with varying degrees of success. Activated sludge systems that may be applied to poultry plant wastes include conventional activated sludge, activated sludge using step aeration, high-rate activated sludge, extended aeration activated sludge, and the contact- stabilization process. Anaerobic lagoons, aerobic lagoons, and a combination of an anaerobic lagoon followed by an aerobic lagoon may be used for secondary treatment of poultry wastes. All poultry wastewater effluents should be chlorinated before discharge to the receiving stream.
All of the above processes are described in chapter I and represent the commonly used waste- treatment processes. The use of other systems, such as microfiltration and certain chemical proc- esses, while possible, is generally not prevalent due to high first and operating costs. -
3

Chapter I
PLANNING FOR WASTEWATER TREATMENT
WASTEWATER SURVEYS
Planning for a wastewater-treatment facility for a poultry plant begins with a survey of the wastewater sources within the plant. An industrial wastewater survey in an existing poultry- processing facility would consist of determining the volume and characteristics of the composite wastewater discharge. The survey may be as simple as measuring flow and taking a composite sample at a single point or may be as complex as measuring flows and sampling each source of wastewater discharged. The latter has the advantage that each point within the plant may be studied to determine the possibilities available for reducing the volume of wastewater and pollution at the source. A discussion of reducing the waste volume within the poultry-processing plant is given in the first paper of this seminar, “In-Process Pollution Abatement.”
-.
For a new poultry-processing facility where wastewater flow streams do not exist, the waste- water for the proposed plant must be synthesized based on the experiences of similar existing processing plants. Using this method for determining wastewater quantity and character requires great care to insure that all waste constituents are included in the synthetic wastewater sample and that the constituents are included in proportions that will be truly representative of the waste from the proposed facility. It is suggested that an experienced engineer be retained to prepare a study that will determine the properties of the design influent.
The volume of wastewater, in general, will vary with the bird production, increasing with in- creased bird production and decreasing with low production. Figure 22 shows how the volume of waste discharged varies with time at one poultry plant. Some of the characteristics of wastewater that should be determined include suspended solids, biochemical oxygen demand (BOD, ), toxic substances, grease and fats, dissolved solids, solid matter, temperature, pH, color, and septicity.
INITIAL PLANNING FOR A WASTEWATER-TREATMENT SYSTEM
Criteria for the design of the treatment plant are available from the authority having jurisdic- tion for control of discharge to the receiving stream and must be evaluated by an engineer experi- enced in the design and engineering of wastewater-treatment plants for poultry-processing facilities.
The type of treatment and the type, number, and size of components may be selected when the required treatment efficiency, in terms of removal of contaminants, has been established.
Costs, both capital costs and operating costs, must be determined in the preliminary planning phase of the project. This phase should result in a report describing the location of the waste- treatment plant, the nature of the wastes, all the components of the proposed wastewater-treatment system, the provisions proposed for future expansion, the anticipated removal efficiency, the character of effluent, and the estimated capital and operating costs. The preliminary report per- forms three primary functions.
5
It may be used in discussions with the authorities early in the project.
0 It provides the cost data essential to establish the economic feasibility of the project.
0 It serves as a basis for the preparation of working drawings and construction contract documents.
SELECTION OF A POULTRY WASTEWATER-TREATMENT PROCESS
The secondary treatment processes commonly used in the biological treatment of poultry wastes are: various forms of the activated-sludge process, standard and high-rate trickling filters, and aerobic and anaerobic lagoons. In the past, aerobic and anaerobic lagoons have been employed in the majority of private installations with activated-sludge plants as a second choice. Trickling filters have been used mainly in plants treating both municipal and poultry wastes. With the exception of anaerobic lagoons, all of the processes provide complete treatment and achieve about a 70- to 90- percent reduction in the influent BOD and an estimated 80 to 95 percent removal of suspended solids. Each of the systems to be discussed has its advantages and disadvantages, and in general, the treatment requirements will dictate, to some degree, the particular system selected. The main differ- ences between the systems are construction and land costs. The major costs for activated-sludge and trickling-filter plants are construction and operating costs; whereas, the major expense for lagoons is land-utilization costs. The following discussion will limit itself to the unit operations and treatment-plant equipment associated with each process.
--
Activated-Sludge Processes
There are four general types of activated-sludge processes.
Conventional
0 High-rate
Extended-aeration
0 Contact-stabilization
All of the above use the activated-sludge theory, previously discussed, whereby aerobic bacteria assimilate the organic matter present in the waste stream for cellular growth and in that way provide for the waste-stream purification. The common elements of all activated-sludge processes are: an activated sludge floc, a mixing and aeration chamber, and a clarification or separation tank.
Conventional Activated Sludge. In the conventional activated-sludge process, the waste stream, following primary treatment, is mixed with a proportional amount of the returned settled sludge from the final clarifier and enters the head of the aeration basin. In general, the aeration basin is designed to provide a detention time of 6 to 8 hours. Mixing and aeration are uniform along the tank and are provided for by mechanical mixers and/or pressurized air diffusers. Following aeration, the mixed liquor is settled in a clarifier, the clear supernatant being discharged to the receiving water and the concentrated sludge being proportionately returned and wasted (see fig. 1). One modification of the conventional process is step aeration, where the waste stream and/or retum sludge enters through a number of inlets along the aeration basin rather than at a common inlet. A
6
second modification is tapered aeration, where aeration along the tank is varied. The advantages of the conventional activated-sludge process are
0 Lower capital costs than for equivalent trackling-filter plants
Low hydraulic head losses
0 The attainment of high-quality effluent
The disadvantages are
0 There are higher mechanical operating costs than for equivalent trickling-filter plants.
It requires skilled operators.
0 It does not respond well to shock loads.
0 It generates a large volume of sludge to be disposed of.
0 Problems in sludge settling are sometimes encountered.
High-Rate Activated Sludge. The main differences between the high-rate process and the con- ventional process are the smaller detention period in the aeration basin and a smaller return-sludge rate (see fig. 2). The advantages of this system are
-.
0 The capital costs are lower than for the conventional process.
0 The sludge generated is much denser resulting in a less-voluminous sludge to be dispensed with.
0 The operating costs are less because of the shorter detention time.
The main disadvantage is the lower quality of the effluent.
Extended Aeration. In the extended-aeration process, the aeration basin provides for 24 to 30 hours of detention time (see fig. 3). The advantages of this process are
0 The very high quality of the effluent
0 That less manpower time is required to operate the process
0 That smaller volumes of sludge are generated
The main disadvantages of this process are the high capital investment required and the possibility of sludge-settling problems.
Contact Stabilization. In the contact-stabilization process, the waste stream does not undergo primary clarification but is mixed with the return sludge and enters the aeration basin directly (see fig. 4). Since the mode of treatment is by adsorption and absorption, a detention period of only 30 minutes is provided. After settling, the concentrated sludge is stabilized by separate aeration before being proportionately retumed to the waste stream. The main advantages of this process are
7
0 Low capital investment
Low operating costs
0 The ability to handle shock loads and variations in flow
BOD reductions of plus or minus 90 percent and suspended solids removals of plus or minus 90 percent have been reported.
Trickling Filters
As mentioned previously, the biological mechanism involved in treating waste water by perco- lation through trickling filters assimilates organic matter into cellular growth by aerobic bacteria. Unlike the activated-sludge process, where the biological process takes place in a “fluid bed,’’ the biological activity in a trickling filter is conducted on the filter medium by a surface fauna. Portions of the bacterial fauna are continually sloughing off into the wastewater stream and are removed in the final clarifier. Trickling filters can achieve upwards of plus or minus 90 percent in both reduc- tion of BOD and removal of suspended solids. There are two types of trickling filtersstandard-rate and high-rate. The number of filters in series determines the “stage” of the filter system. The pri- mary elements of a trickling filter are the covered or uncovered containing structure, the filter medium, the waste-flow distribution system, and the subdrain collection system. The typical mediums used are rocks, slag, and recently, honeycombed cellular modules of synthetic construc- tion. Distribution systems are spray nozzles attached to fixed or rotating manifolds. The sub- drainage system may consist of tile, concrete, or synthetic drainage tile.
c
Standard-Rate Trickling Filters. The main distinction of the standard-rate trickling filter is the low BOD loading rate (see fig. 5). Its main advantages are
0 The production of a high-quality effluent
0 Low operating costs
0 That operating personnel need not be highly skilled
0 That it is resistant to shock loadings and variations in flow
The main disadvantages are high capital costs and that considerable land space is required. Flies and insects are sometimes a problem but are usually controllable.
High-Rate Trickling Filters. The main distinction of the high-rate trickling filter is the high BOD loadings (see fig. 6). These loadings may be as much as twice as great as those of a standard- rate filter. Although, for a single pass, BOD reductions are only about 60 to 70 percent, recircula- tion increases the total reduction. The advantages are
0 Its versatility of treating high-strength wastes
0 Its resistance to shock loads and variations in flow
That highly trained personnel are not required
0 That the area required is considerably reduced
0 That problems with flies and insects are usually eliminated
8
The main disadvantage is the high power requirements caused by recirculation.
Lagoons
As was mentioned previously, lagoons are presently the most common method of treating poultry waste at private waste-treatment installations. This prevalence is primarily due to the availa- bility of low-cost land when most of the poultry-processing facilities were constructed, since both aerobic and anaerobic lagoons require very large allocations of land. Successful operation of these lagoons depends to a high degree on favorable climatic conditions-warm, clear, and sunny. Depend- ing on the geological site conditions, the lagoon may require lining of the bottom. In general, the waste stream is pretreated by mechanical screens to remove offal and feathers. The biological mechanisms responsible for the purification process have been discussed previously. Mechanical aerators and diffused-air systems are used in the aerobic lagoons. A properly designed aerobic lagoon can be expected to achieve about a 90-percent reduction in BOD and suspended solids removal. When anaerobic lagoons are used, expected removals are only about 70 to 80 percent. Odor problems are frequently associated with anaerobic lagoons, although chemical additives can usually control the problem. In the past, flies, insects, and excessive growth of bordering vegetation have been a problem. Figure 7 contains some common-flow schematics of lagoon systems.
As an example of the variety of schemes that may be incorporated into the design of poultry waste-treatment systems, one such plant has combined, as a single-treatment system, the extended aeration and aerobic lagoon concepts to effect considerable cost savings plus a reduction in land requirements. This system, which could appropriately be called an “aerated lagoon,” has been in use for about 6 years and reportedly achieves upwards of a 90-percent reduction in influent BOD and suspended solids removal of better than 80 percent. Since the waste-treatment system has been such a success and water shortage is also a problem at this plant, the Environmental Protection Agency (EPA) has supported a pilot plant investigation to determine the feasibility of recycling the treatment-plant effluent for use as process water.
-
costs
The costs for waste treatment are difficult to project due, in large part, to their dependency upon local conditions. Some of the local conditions include design codes, and climatic and geologi- cal considerations. Table 2 provides a rough approximation of the costs of waste treatment as applied to the poultry-processing industry. The table was constructed by adjusting average costs of similar municipal waste-treatment facilities to fit poultry-processing requirements. The treatment costs presented do not reflect land-acquisition costs. The values tabulated are 1967 prices and are based on the present-value method of calculating costs. The selected interest rate is 5 percent and the expected life of the structure is 25 years. Considering that the actual useful life of the facility probably will be 40 to 50 years and that the costs are based on equivalent municipal facilities, this approach can be considered conservative and the resultant values considered “high.” Municipal plants often are required to have parallel facilities and expensive sludgedisposal equipment. Parallel facilities sometimes increase the costs as much as 100 to 300 percent and sludgedisposal equipment such as sludge digesters, vacuum filters, and/or sludge incinerators can amount to 30 to 50 percent of the capital costs. For these reasons, the capital costs shown in table 2 can be reduced as much as 50 percent or more for poultry-processing waste treatment. The table, therefore, only truly indi- cates relative costs for the various processes; for example, the “Gold Kist’’ waste-treatment plant cost less to construct than shown in the table. This reduction in capital costs was the result of
0 Climatic conditions which did not require the facility to house air-supply equipment
The availability of land and the recycling of byproducts, which minimized sludgedisposal costs
9
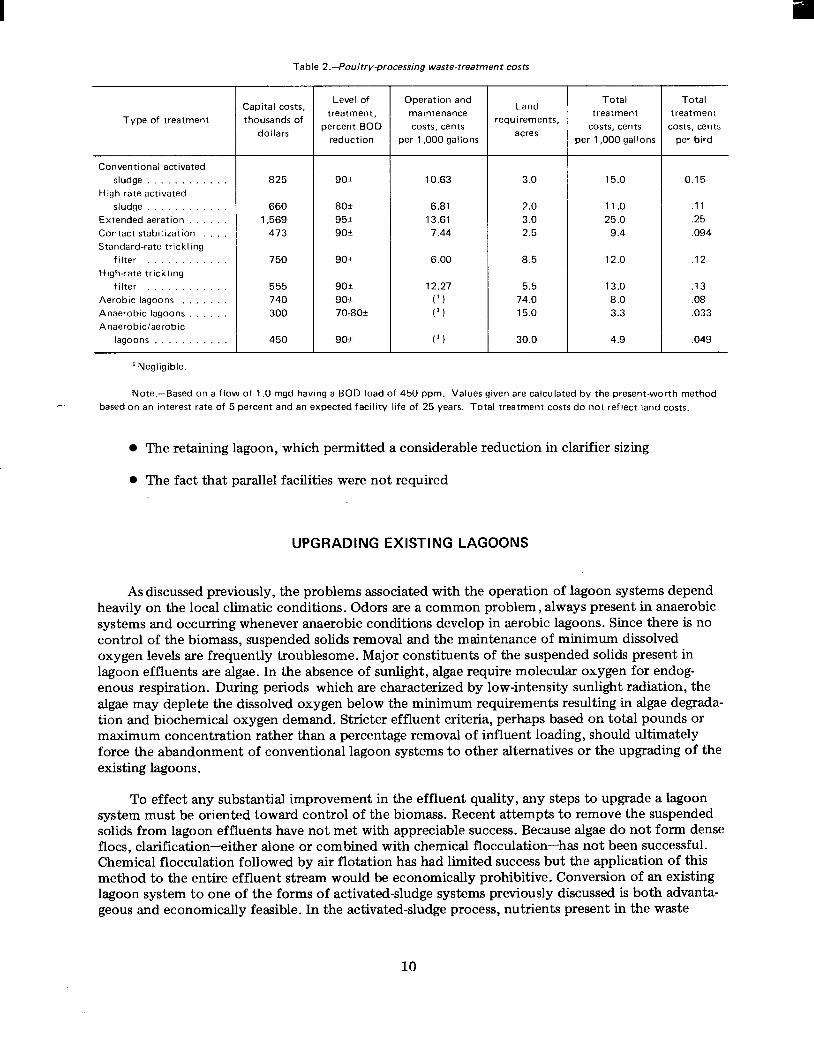
Tab le 2.-Poultry-processing waste-treatmen t costs
3.0
2.0 3.0 2.5
Type of treatment
15.0
1 1 .o 25.0 9.4
Convent io nal act ivated sludge . . . . . . . . . . . .
High-rate activated sludge . . . . . . . . . . . .
Extended aeration . . . . . . Contact stabilization . . . . Standard-rate tr ickl ing
f i l ter . . . . . . . . . . . . H igh-rate tr ickl ing
f i l ter . . . . . . . . . . . . Aerobic lagoons . . . . . . . Anaerobic lagoons . . . . . . Anaerobidaerobic
lagoons . . . . . . . . . . .
8.5
5.5 74.0 15.0
30.0
Capital costs, thousands o f
dollars
12.0
13.0 8 .O 3.3
4.9
825
660 1,569 473
750
555 740 300
450
Level of treatment,
percent BOD reduction
go+
80+ 95t go+
9oi-
90t 9ot 70-8Oi-
go+
Operation and maintenance costs, cents
per 1,000 gallons
10.63
6.81 13.61 7.44
6.00
12.27 ( ' 1
)
)
Tota l treatment
costs, cents per 1,000 gallons
Land requirements,
acres
I
Tota l treatment
costs, cents per b i rd
0.15
.1 1
.25 ,094
.I2
.13
.08 ,033
.049
' Negligible.
Note.-Based o n a f l o w o f 1 .O mgd having a BOD load o f 450 ppm. Values given are calculated b y the present-worth method c based o n an interest rate o f 5 percent and an expected faci l i ty life of 25 years. Tota l treatment costs do n o t reflect land costs.
The retaining lagoon, which permitted a considerable reduction in clarifier sizing
0 The fact that parallel facilities were not required
UPGRADING EXISTING LAGOONS
As discussed previously, the problems associated with the operation of lagoon systems depend heavily on the local climatic conditions. Odors are a common problem, always present in anaerobic systems and occurring whenever anaerobic conditions develop in aerobic lagoons. Since there is no control of the biomass, suspended solids removal and the maintenance of minimum dissolved oxygen levels are frequently troublesome. Major constituents of the suspended solids present in lagoon effluents are algae. In the absence of sunlight, algae require molecular oxygen for endog- enous respiration. During periods which are characterized by low-intensity sunlight radiation, the algae may deplete the dissolved oxygen below the minimum requirements resulting in algae degrada- tion and biochemical oxygen demand. Stricter effluent criteria, perhaps based on total pounds or maximum concentration rather than a percentage removal of influent loading, should ultimately force the abandonment of conventional lagoon systems to other alternatives or the upgrading of the existing lagoons.
To effect any substantial improvement in the effluent quality, any steps to upgrade a lagoon system must be oriented toward control of the biomass. Recent attempts to remove the suspended solids from lagoon effluents have not met with appreciable success. Because algae do not form dense flocs, clarification-either alone or combined with chemical flocculation-has not been successful. Chemical flocculation followed by air flotation has had limited success but the application of this method to the entire effluent stream would be economically prohibitive. Conversion of an existing lagoon system to one of the forms of activated-sludge systems previously discussed is both advanta- geous and economically feasible. In the activated-sludge process, nutrients present in the waste
10
stream are used in the synthesis of the biomass. Since the biomass is ultimately separated and removed from the waste stream, the degree of algae synthesis in the effluent stream is limited.
In order to provide sufficient control of the biomass in converting to an activated-sludge system, air-supply and solids-removal equipment must be provided. Generally, these will require the installation of blowers, air-distribution systems, floating aerators, clarifiers, concentrators, and strainers. As in all of the biological systems, some solids will have to be disposed of and considerable attention should be given to reclaiming the solids as feed meal or fertilizer. Maximum effort should be exerted to use existing lagoons as much as possible. In some cases, portions of the lagoons can be converted to serve as multipurpose units such as clarifiers or aerobic digesters, as well as aeration basins. Lagoons can also be used as “polishing” ponds capable of supporting fish life and providing the capability for recycling the treated wastewater.
Generally, once poultry-processing operations have commenced, more reliable information is made available-on flows, loadings, temperatures, and waste characteristics-which can be used to establish good design criteria for the upgrading of lagoon systems. Similarly, it is often found that changes in existing process procedures can result in reduced flows and loadings, thereby reducing the need to size equipment.
Construction for the upgrading of lagoon systems is best accomplished by a “staged” sequence. New construction should be scheduled when plant production and the wastewater flow are at a minimum. In this way the staged concept may allow plant personnel to perform much of the re- quired construction. Also, present effluent criteria can be satisfied while a future water-use and waste-treatment program is established. Staged construction allows for distributing the capital costs for treatment facilities over a period of time resulting in minimization of upgrading costs. Staged construction could consist of initial installation of improved aeration systems, then later installation of a clarification device, followed by final installation of a system for recirculation of process water from a polishing pond.
p -
The costs for upgrading existing lagoon systems are often significantly less than those which would be required for equivalent new wastewater-treatment systems. In short, to minimize both present and future treatment costs, the design for upgrading an existing lagoon system should incor- porate, wherever possible, the existing facilities, process-water conservation, and the flexibility to provide for present or future solids reclamation and treated wastewater recycling. Included are some typical flow schematics (figs. 8-10) showing various methods of upgrading existing lagoons.
11

Chapter II
OPERATING A WASTE WATER-TREATMENT SYSTEM
When the waste-treatment plant is designed, constructed, and finally placed on stream, it is the responsibility of the waste-treatment plant operator to insure that the equipment performs as intended. The intent of the waste-treatment plant is to reduce the pollutional potential of the wastewater discharge to below specified limits. The operator must control the flow streams within the plant to achieve optimum efficiency; this may require, as in the case of activated-sludge systems, that the rate at which sludge is wasted and air and chlorine are applied be adjusted to assimilate the contaminants emanating from the processing plant. The pollution load or contaminants emanating from the plant depend upon the particular processes used within the plant, the bird production, and the plant personnel. The waste-treatment plant operator must learn to anticipate and recognize when the influent has changed in character and make the necessary adjustments in the waste-treatment plant flow streams before the quality of the effluent has declined sufficiently to constitute aviolation or affect the quality of the receiving stream. Good indicators from which to judge the operation of the waste-treatment plant are the appearance, color, and smell of sludge and wastewater in the various components, and the general odor at the plant. A successfully operating waste-treatment plant has little or no unpleasant odor.
-
Maintaining good records of the results of tests and plant operation cannot be overemphasized. Results of record tests, as well as operating tests, indicate how well the plant is functioning. The authorityhaving jurisdiction over the discharge to the receiving stream is responsible to the public for the proper functioning of the waste-treatment plant. Where good records are maintained, the authorities, engineers, and others may have ready access to the history of plant operation. This history is valuable in providing assistance in evaluating plant performance and analyzing problems that may occur.
The successful waste-treatment plant is also a well-maintained waste-treatment plant. Routine inspection and maintenance procedures must be developed for each waste-treatment plant; however, a few basic guidelines may be set forth. A manufacturer’s instruction manual and shop drawings should be furnished for each piece of equipment in the plant. The operator should be intimately familiar with these manuals and their contents. These manuals give complete information on lubri- cation, adjustments, and other equipment maintenance. The waste-treatment plant should be visited at least once each day. Daily, weekly, monthly, and yearly checklists for inspection and mainte- nance should be developed and followed to assure proper waste-treatment plant operation and maintenance. The following checklists were suggested for an activated-sludge waste-treatment plant treating wastewater from a poultry-processing plant. These checklists are not intended to be com- plete but to serve as aids for an operator developing his own checklists.
Daily Checklist
1. Check the air compressors.
a. Check lubrication.
b. Check motor, bearings, and compressors for overheating.
13

c. Check air filter for fouling.
d. Change the compressors “in service.” (Set up a rotation schedule to use all of the compressors, including the standby, on a daily switchover schedule so that all compressors are operated the same amount of time.)
e. Check the “cold” compressor to be put into service for lubrication, free rotation, clean inlet filter, and so forth.
f. Start the cold compressor and put it on the line before shutting down the one(s) in service (start-up procedure, lubrication, operation, etc.), so that you can satisfy yourself that it is being started and operated properly and is performing satisfactorily.
g. Allow the cold compressor t o operate while you are at the plant and recheck it before leaving.
2. Check the chlorinator.
a. For operation, setting
b. Chlorine supply
3. Observe the air pattern in all tanks. Adjust it if necessary.
4. Check the final clarifier tank for operation and flow.
5. - Check return sludge airlift pump for operation.
6. Check skimmer and scum remover at final clarifier and byproducts collector for operation.
7. Check byproducts collector for operation and flow.
8. Check telescoping valve for proper sludge and grease removal.
9. Observe sludge appearance in all tanks. Investigate and correct any deficiencies.
10. Observe find clarification and byproducts collector tanks. Correct any deficiencies.
11. Observe the condition of raw sewage entering the plant.
12. Observe the operation of the froth spray system (if used). Clean it if necessary.
13. Check the operation of the comminutor, motor, and bearing for overheating.
14. Rake screenings from bypass bar screen and remove in covered receptacle for burial on the site.
15. Skim floating solids from final clarifier, byproducts collector, and digester supernatant decant chamber; place in covered receptacle; bury. (A “bug screen’’ on a long handle, such as is used for removing bugs, wrappers, etc., from swimming pools, is suggested.)
14
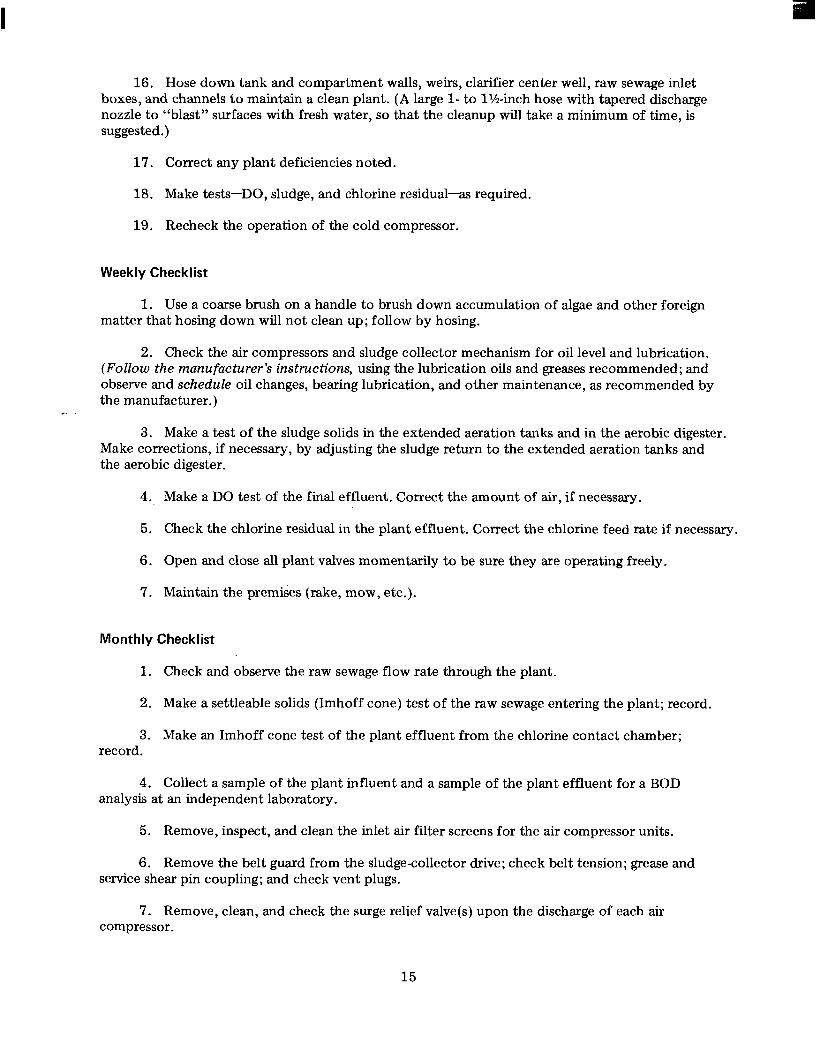
16. Hose down tank and compartment walls, weirs, clarifier center well, raw sewage inlet boxes, and channels t o maintain a clean plant. (A large 1- to lx-inch hose with tapered discharge nozzle to “blast” surfaces with fresh water, so that the cleanup will take a minimum of time, is suggested. )
17. Correct any plant deficiencies noted.
18. Make tests-DO, sludge, and chlorine residual- required.
19. Recheck the operation of the cold compressor.
Weekly Checklist
1. Use a coarse brush on a handle to brush down accumulation of algae and other foreign matter that hosing down will not clean up; follow by hosing.
2. Check the air compressors and sludge collector mechanism for oil level and lubrication. (Follow the manufacturer’s instructions, using the lubrication oils and greases recommended; and observe and schedule oil changes, bearing lubrication, and other maintenance, as recommended by the manufacturer.)
c
3. Make a test of the sludge solids in the extended aeration tanks and in the aerobic digester. Make corrections, if necessary, by adjusting the sludge return to the extended aeration tanks and the aerobic digester.
4. Make a DO test of the final effluent. Correct the amount of air, if necessary.
5. Check the chlorine residual in the plant effluent. Correct the chlorine feed rate if necessary.
6. Open and close all plant valves momentarily to be sure they are operating freely.
7. Maintain the premises (rake, mow, etc.).
Monthly C heck1 ist
1. Check and observe the raw sewage flow rate through the plant.
2. Make a settleable solids (Imhoff cone) test of the raw sewage entering the plant; record.
3. Make an Imhoff cone test of the plant effluent from the chlorine contact chamber; record.
4. Collect a sample of the plant influent and a sample of the plant effluent for a BOD analysis at an independent laboratory.
5. Remove, inspect, and clean the inlet air filter screens for the air compressor units.
6. Remove the belt guard from the sludge-collector drive; check belt tension; grease and service shear pin coupling; and check vent plugs.
7. Remove, clean, and check the surge relief valve(s) upon the discharge of each air compressor.
15
Yearly Checklist
1. Clean, touch up, and paint all items requiring attention.
2. Inspect, flush, and clean bearings; lubricate and overhaul all items of equipment.
3. Proceed with any plant modemization or improvement that needs attention.
Keep ahead of the waste-treatment plant. Attend it daily. Good housekeeping and maintenance are a sign of good plant toperation. A dirty, unkempt plant is a poorly operated one. Ninety percent of plant odors are caused from poor housekeeping.
c
16
Chapter 111
CASE HISTORY-THE ORIGINAL GOLD KIST WASTEWATER FACILITIES
SITE SELECTION
In 1966, Giffels Associates was retained by the Gold Kist Poultry Processing people, then known as the Cotton Producers Association, to undertake a study of waste-treatment problems in connection with a proposed new plant to be built in Suwannee County, Fla. The location was predi- cated by the fact that the cooperative farm members were experiencing declining returns on tobacco farming and the Cotton Producers Association elected to bring new agricultural business into the area for the benefit of its farmer members.
Poultry was considered the most logical choice since the firm wished to expand its poultry- .. processing facilities in any event and the area was suited to the rearing, hatching, and dispatching of a large quantity of broilers.
The site finally selected was adjacent to the Suwannee River, which offered some degree of diluting water for the treated industrial waste and also offered a sandy site, on which facilities could be readily built, located over a very adequate ground water supply to furnish the water for poultry processing.
A site of 100 acres was selected for the project giving sufficient room for construction of the poultry-processing plant, the hatchery, and the required waste-treatment facilities, while providing a buffer zone between the plant and adjoining property owners. In addition, the proximity to the interstate highway system offered a ready means for shipment of dressed poultry and nearby rail access at the town of Live Oak assured adequate facilities for the receipt of grain and other feed materials.
WASTEWATER SURVEY AND CRITERIA
The plant was designed originally to process 50,000 birds per day on one shift. It is currently being expanded to a two-shift operation with a capacity of up to 130,000 birds per day, which will be described later.
The original wastewater-treatment system required facilities to treat poultry-processing wastes from 50,000 birds, processed over a period of 8 hours, plus wastewaters originating from a second- shift cleanup operation. In addition, all facilities had to be designed to accommodate future expan- sion up to, or exceeding, twice the then anticipated production rate. In addition to the normal poultry-processing wastes, the sanitary wastes from a plant population of about 225 persons and wastewater from the condensers on the feed meal cookers had to be included in the total waste- waters to be treated.
17
An investigation was made at the existing Canton, Ga., poultry-processing operation operated at that time by Gold Kist, and the wastes were examined with respect to what loads could be expected in the new Florida facility. Flow quantities were measured at Canton and found to be approximately 12 to 13 gallons per bird; however, operations at that time were considered lax with respect to water conservation and it was decided that the flow from the new plant would probably be about 10 gallons per bird. Subsequent operations proved this figure to be correct; however, dili- gence is always required to maintain water use at that level, with water-consumption practices in the plant being constantly monitored.
An analysis of the wastewater being discharged at Canton indicated the following characteristics:
pH ranged from 6.3 to 7.4.
0 Dissolved oxygen ranged from 0 to 2 ppm.
0 BOD ranged from 370 to 620 ppm.
0 Suspended solids ranged from 120 to 296 ppm.
0 Settleable solids ranged from 15 to 20 ppm.
Grease content ranged from 170 to 230 ppm.
Average values for these parameters were:
pH,6.9
Dissolved oxygen, 0.5 ppm
0 BOD,473ppm
0 Suspended solids, 196 ppm
0 Total solids, 650 ppm
0 Volable solids, 486 ppm
Fixed solids, 164 ppm
Settleable solids, 17.5 ppm
Grease, 201 ppm
Since this total load was contained in approximately 20 percent more water than it was assumed would be used at Live Oak, the figures were increased by one-third for design purposes because of the expected higher concentration of contaminants in the wastewaters.
In addition to the poultry-processing loads, about 200 gpm of water was to be run through the jet condensers on the byproduct cookers. This water collected the grease and vapors from the feed meal cooking operations and also had to be treated in the industrial waste-treatment facilities.
When summarized, the daily load on the plant was expected to be, and later proved to be, about 700,000 gallons per day with a BOD loading of about 2,620 pounds per day. It should be
18
recognized that this waste-treatment plant, therefore, was equivalent to a sewage plant for a town of approximately 7,000 persons with respect to its hydraulic flow, and to a town of approximately 15,000 to 16,000 persons with respect to its biological load.
Since the wastewater flow from the plant personnel was so small compared to the process waste flow, it was completely ignored in the original design, with the only consideration being given to proper disinfection of the effluent prior to discharge to the Suwannee River.
Flow variations throughout the day were also measured at Canton with considerable variations being measured, but a no-flow condition never existed, even during periods of no operations, such as weekends. In other words, with the plant idle, some flow was experienced due to water consump- tion that could not be shut off.
It was determined that the minimum flow rate for the new wastewater stream would be approximately 150 gpm with a maximum flow rate of about 730 gpm and an average flow rate of about 490 gpm.
An important consideration was the fact that a 20-mesh vibrating screen in the processing plant ahead of the process sewer retained the bird entrails, offal, feathers, heads, flushing;, and other material, so that those byproducts were sent directly to the feed meal recovery cookers and the wastewater sent to the process sewer did not contain significant large solids and was relatively free of feathers.
-’
SELECTION OF THE TREATMENT PROCESS
Once the wastewater treatment criteria had been established, the decision had to be made as to what type of waste-treatment process was suitable. The Florida State regulatory agencies said that lagoons, if built in the area, would have to be fully lined because of earlier problems with ground water contamination in the area. They would not accept anything except expensively lined lagoons. Furthermore, the criteria that they set with respect to the discharge to the Suwannee River were such that a complete lagoon treatment system would be taxed to achieve the desired results unless the lagoons were made almost ridiculously large. Consideration was therefore given to using a lagoon merely as a tertiary polishing device. The front end of the system and the primary and secondary waste-treatment facilities would have to be biological-treatment facilities capable of achieving pollutant reduction to a point where the subsequent tertiary pond would be minimum in size and would also assure meeting the strict effluent requirements of the State of Florida. Those requirements were not over 10 ppm BOD and zero settleable or suspended solids with rather strict requirements with respect to turbidity and color.
It cannot be overemphasized, as can be seen from these very strict requirements, that in con- sidering any industrial waste-treatment process, working closely with State and regulatory agencies is essential before any design work actually begins.
Consideration was given to trickling filters and to various modifications of the activated-sludge process. In the end, considering costs, reliability, and other matters, the extended aeration modifica- tion of the activated-sludge process was considered the only possible solution. While this process is often frowned upon in large municipal work because of its high costs, it must be remembered that in an industrial waste-treatment facility, the operating expenses are written off for tax purposes, whereas capitalization costs cannot be.
19
The extended aeration process, as it evolved, offered the following advantages: The initial capitalization cost, although high, was not appreciably higher than the cost of other processes con- sidered when sized to meet the strict effluent criteria. Again, although operating costs were higher, due to the increased amount of compressed air required for the process, highly skilled operating techniques are not always required to keep the system operating near peak efficiency. In other words, exact lab control is not required.
In addition, the usual 24-hour aeration period required for extended aeration processes was not conducive to smoothing out the variations in flow and biological loading that were going to be experienced in this waste-treatment facility. Furthermore, occasional overloads, either hydraulic or biological, would not cause alarming reduction in waste-treatment efficiencies. The process itself, when properly sized, is almost foolproof compared to what happens to overloaded trickling filters in a conventional activated-sludge system with short detention periods. Certain waste-treatment processes, when overloaded 10 percent, result in waste-treatment efficiency dropping off substan- tially, maybe as much as 50 percent. A 10-percent overload on an extended aeration system would cause little reduction in waste-treatment efficiency.
As a further consideration, the sludge resulting from this process, being thoroughly degraded, is easy to dispose of on drying beds, is seldom inclined to cause odor problems, and is small in volume compared to what you might expect from a trickling filter or activated-sludge plant designed and operated by conventional methods.
THE FLOW DIAGRAM
Accordingly, the system was set up somewhat conservatively consisting of an initial clarifier and skimming device, which was used as a byproducts collector mechanism, followed by aeration tanks, a final clarifier, and the tertiary pond. Sludge collected from the final clarifier was pumped by an airlift and recirculated to the head of the extended aeration tank or to the parallel aerobic digester. This digester is used €or long-term aeration of grease and excess solids returned from the final clarifier. This aerobic digester should offer the key to successful biological degradation of any grease remaining from the poultry processing since it aerates its contents for a period of approxi- mately 10 days prior to discharge to the clarifier and thence to the final pond.
Plant sanitary wastes were added downstream from the byproducts collector and were intro- duced directly into the head end of the aeration tanks, thereby eliminating any possibility of human wastes contaminating feed meal which is fed to the birds later.
During subsequent expansion considerations this factor was felt not to be of significant importance and secondary sludge also was considered for reclaim.
DESIGN CRITERIA USED
The primary settling tank was originally sized by somewhat conventional means, with a surface settling rate of 1,000 gallons per square foot per day being used as criteria for this work. For the final design we reduced this rate to about 800 gallons per square foot per day by increasing the byproducts collector size to 40 feet to permit slightly better grease and solids removal.
20
The criteria for the extended aeration tanks were based on two factors. First, it was believed necessary to maintain the conventionally accepted basis of 1,000 cubic feet of capacity per 20 pounds of applied BOD per day, and also it was believed necessary to maintain at least the 24-hour minimum detention period normally used in extended aeration systems. As it tumed out, the 24- hour criterion govemed and, in effect, tumed out to be somewhat longer than 24 hours because the hour flow was considered to be the process waste flow plus the recirculated sludge, which was returned at 50 percent of the total flow rate to the plant. Normally, the 24-hour period is computed using only the total wastewater flow and it does not include the recirculated sludge. It was neces- sary to begin, therefore, with a total of 36 hours of detention based on process flow only. This period may be considered almost excessive by some authorities; however, since we were dealing with the problem of slow biological grease degradation and a need to achieve plus or minus 98 per- cent of BOD removal, and since we were also looking to expand the plant some time in the future, it was felt that this was not an unreasonable criterion to use for the original plant design. Total aeration-tank capacity, as determined by this method, was 140,000 cubic feet. It was elected to split this required capacity into two tanks so that one could be operated with a responsible degree of treatment while the other was being maintained or cleaned.
Compressed air was fumished to the tank on the basis of 15,000 cubic feet of air per day, per pound of applied BOD. The job was not unique in that the equipment selected for air diffusion consisted of conventional swing-out diffusers used with air headers in Y walls between the tanks. Since the tank was designed based on hydraulic loading rather than BOD loading, it actually turned out that we had only 13 pounds of BOD applied per 1,000 cubic feet of tank capacity. Again, this was quite conservative but, as it tumed out, quite successful. As a general philosophy in the design of industrial waste-treatment facilities, it is necessary to be conservative because there is no assured means of determining that process loads will not increase once successful production lines are put into operation. This proved to be the case at Gold Kist.
r
Subsequent to the extended aeration tanks, a final clarifier was provided, which was also designed somewhat conservatively, although not to the extent used on the aeration tanks because of the lack of a polishing pond to follow this unit. The final clarifier was designed on the basis of a surface settling rate of 730 gallons per square foot per day and a weir overflow rate of 360 gallons per foot per day. Sludge collected by the final clarifier, which was equipped with a skimming arm as well as scraping mechanism, was returned by an airlift to the head of the system.
This minimized maintenance and operation problems because at this point the only motors needed for the system were those on the blowers and the drive mechanisms for the byproducts collector and final clarifiers. Additional sludge pumps were not required.
Again, when it came down to the final design this tank diameter was increased slightly so these criteria were even less. There was a constant effort to create a system that could be somewhat over- loaded without causing a significant reduction in waste-treatment efficiency.
It was strongly suspected that it might be possible to process up to 10,000 birds per hour on occasion which indicated that a one-shift operation could run as high as 70,000 to 80,000 birds per shift if the processing plant were run at a maximum rate. This actually did happen with production rates approaching 10,000 birds per hour and the single-shift operation extending to 9 or 10 hours per day.
The aerobic digester, which was provided adjacent to the aeration tank, had a volume of 46,500 cubic feet. Air was supplied in exactly the same fashion as to the aeration tanks on the basis of 20 cubic feet per minute of air per 1,000 feet of digester capacity. A supematant decant well was provided as the end of the digester with clarified liquor rising slowly and very quiescently since the overflow rate can be controlled by the operator based on the amount of sludge he retums to the
21
aerobic digester, with the remaining amount of retum sludge being sent to the aeration tanks. This supematant decant well was actually nothing but a timber baffle with a hopper bottom built into the end of the aerobic digester.
Sludge from the aerobic digester was directed to the sludgedrying beds by the simple means of a fire hose, using the head on the aerobic digester to force the sludge to the drying beds. As a general rule of thumb, the amount of solids generated by the extended aeration system is about one-half pound per day per pound of BOD treated in the tanks.
The sludge-drying beds were perhaps the weak spot in the system. Although north Florida seems to be entirely made up of deep sand beds, somehow, unwittingly, the only spot of clay in Suwannee County was picked on which to build the drying beds. Therefore, although subdrainage systems were provided to dry the sludge, it did not dry as readily as hoped for. Further complications were involved in the fact that, at least initially, the outlet from the underdrains in the sludge-drying beds was completely filled over by some incidental grading operations done by a contractor. The old rule-if anything can go wrong on a project it willseemed to apply here.
Even though difficulties were experienced with the sludge-drying beds, it was not serious because the nature of the sludge produced by this waste-treatment process is such that it is inoffen- sive, dries readily, and in a pinch can just be spread out on the ground. It is not troublesome with respect to odors, and can always be scraped up and hauled away from almost anyplace to store it temporarily, as long as it is allowed to dry. The warm Florida weather helped in this matter. --
Sealing the final tertiary pond subsequent to the clarifier was accomplished rather inexpensive- ly. Asphalt liners, rubber linings, and other membranes were considered and the cost always proved to be somewhat shocking so the designers ended up with a rather simple system. A thin layer of Visqueen was placed over the entire bottom of the lagoon in small overlapping sections and trucks full of simd dumped directly on the Visqueen. The sand was spread by hand, making a 1-foot layer of earth and sand on top of the Visqueen to protect it. The system may not have been 100 percent watertight but the designers were pleased to note that before any water was added by the waste- treatment process to the lagoon, it did collect and store rainwater and was ready to go at the time the poultry-processing facility went onstream.
The inlet to the square 4-acre pond was located in its geometric center. This was done so that any inadvertent solids carryover from the final clarifier would settle out in the central area of the pond and if there were an odor problem resulting from this, it would be at least 200 feet from any point on the shore. The best way to control an odor is to keep it as far away from people’s noses as possible.
Effluent from the pond was subjected to 20 minutes of detention in a chlorination pond. A chlorinator was provided capable of handling from 20 to 100 pounds of gaseous chlorine per day. The expected required rate was approximately 42 pounds per day which left a 0.5-ppm residual in the effluent.
New developments in chlorination of effluent by means of electrolytic cells generating sodium hypochloride have come into use since that time and in retrospect it would appear wise to install such a system in a facility such as this to eliminate the hazards involved in using gaseous chlorine.
The air compressor facility for the initial waste-treatment plant consisted of three, 3,000-cubic feet-per-minute per Spencer turbocompressors, each with a 75-hp motor delivering air against 96 ounces of pressure (fig. 11). Actually, two compressors were required to run full time to furnish air to the aeration tanks and airlift. The third compressor was merely a standby.
22
In summary, the wastewater-treatment plant components consisted of the following devices, which are detailed in figure 12.
The system used a byproducts collector tank (fig. 13), a conventional circular settling tank with motor-driven sludge collection and skimming mechanisms, 40 feet in diameter with a 7 - f O O t side water depth and a detention time of approximately one and one-half.
Extended aeration tanks (fig. 14) consisted of two concrete tanks each 170 feet long and 26 feet wide with a water depth of 15 feet and a freeboard of 2 feet. Each tank contained 95 air diffusers and piping to supply 150 cubic feet per minute of air to the mixed liquor. A valve port between the two tanks permitted equalizing loading on each tank if required. The detention time was 24 hours based on process flow plus a 50-percent allowance for sludge recirculation.
The aerobic digester was constructed next to the aeration tanks; therefore, it had an equal length of 170 feet but it was only 21 feet wide, again with a water depth of 15 feet. The supernatant decant well at the end of the tank, which was used to contain the solids in the tank, had a surface settling rate of less than 800 gallons per square foot per day and an over- flow rate of 240 gallons per minute to the clarifier.
The final settling tank was again a conventional collection mechanism with a motor-driven scraper and skimming mechanism. It was made 44 feet in diameter with an 8-foot side water depth and a 9-foot center depth. Detention time in this tank was about 2 hours, which is the maximum that could probably be used without running into septicity problems in the stored sludge.
The final stabilization pond or tertiary device was 4 acres in size and had a detention time of approximately 10 days. The depth was 5 feet, which is about the maximum that can be used in an aerobic pond, simply because depths in excess of 5 feet tend to become septic at the bottom due to lack of sunlight and poor oxygen transfer.
The chlorination facility was simply a small building with a wall-mounted chlorinator, scales, and ancillary devices. It was placed at the far end of the ponds, convenient to the chlorine detention pond.
The air facility used three Spencer turbocompressors rather than positive displacement rotary compressors for the simple reason that they were believed less expensive and more reliable, and certainly less noisy. Judgment has proved this fact, and turbocompressors, as opposed to positive displacement air compressor devices, have been made standard waste- treatment equipment wherever possible. Their one drawback is that the pressure they can develop is somewhat limited and they cannot be discharged into really deep aeration tanks. About the best that can be done is to operate with about 13 feet of water pressure and the aeration diffuser devices.
FUTURE EXPANSION PROVISIONS
The entire facility was arranged to permit future expansion if necessary, and piping was valved and placed so that another byproduct collection tank could be added if needed. Another final settling tank also could be added, if required, as well as more air compressors. All of this was done for the expansion that took place in 1970.
23
a In addition, there was space onsite to double the stabilization pond and add additional chlori-
nation detention ponds if necessary. It cannot be overemphasized that one must have a site that is big enough for the waste-treatment facilities and 100 percent of expansion if necessary. It was possible to accomplish 100 percent of expansion without doubling up on these facilities, as will be discussed later. At the time, however, doubling of the facilities seemed to be the practical way to handle the problem.
No expansion provisions were provided in the original aeration-tank installation since, in effect, it had been overdesigned and it was felt that in a pinch a conventional activated-sludge opera- tion could be adopted, which would require less tank volume but more sophisticated control. In such a case, only 6 or 8 hours of aeration time would be necessary.
The facility was originally designed to achieve BOD reduction in the following fashion. Of the 2,600 pounds of BOD applied per day, 780 pounds would be removed in the byproducts collec- t o r 3 0 percent of the applied load. This is a conventional criterion for devices of this type. It was expected that the subsequent extended-aeration tanks would be able to remove 90 percent of the remaining 1,820 pounds of applied BOD. Again, this seems to have been a reasonable assumption since 90-percent removal using long-term aeration is quite feasible.
The stabilization pond also was capable of removing another 200 pounds of BOD per day. The rate of 50 pounds per acre per day is allowed in the State of Florida. As one goes farther north colder temperatures inhibit biological actions in lagoons; therefore, in the Northern States 20 to 30 pounds of BOD loading per acre per day is all that is allowed.
-*
This consulting firm has encountered instances on other Florida jobs where it has been proven to have removed as much as 100 pounds of BOD per acre per day, which indicates the State cri- terion is probably somewhat conservative.
Totaling up the removal of BOD in all components, it was possible to indicate, in theory at least, that 100 percent of BOD would be removed. Although it was known that this was impossible, 97 to 98 percent BOD removal was expected, which is very good efficiency. After the plant went into operation these results were achieved and perhaps even a little better, which justified the selec- tion of the process and the conservative design approach.
WASTE-TREATMENT SYSTEM COSTS
The total cost of the wastewater-treatment facility built in 1967 was estimated to be $252,000. It may have cost somewhat more, however, since the construction costs for the waste- treatment facilities were lumped in with the construction costs for the onsite hatchery and poultry- processing plant. The exact cost could not be determined, but in any event, the cost was less than $300,000.
Amortizing the costs over a 10-year life expectancy of the facilities, it was found that the orig- inal investment of $252,000, plus an allowance for interest on that investment, made the total cost of the facility $327,000. Based on processing 250,000 birds per week at a dressed-out weight of 2% pounds per bird, it turned out that the capitalization cost for waste treatment for this plant was approximately one-tenth of a cent per pound of finished dressed poultry.
Operating costs were estimated to be approximately 7 man-hours per week of labor, 7 days of power for the two blowers running continuously, and 7 days’ worth of chlorine which was estimated
24
to cost about $6 per day. Total weekly operating costs came out to be about $370, which indicated an operating cost of about 0.06 cent per pound of finished product. Therefore, the total waste- treatment costs per pound of dressed poultry appeared to be in the neighborhood of 162 mils per pound of finished dressed poultry.
OPERATING ARRANGEMENTS
In addition to an adequate design for wastewater-treatment facilities, another important matter must be mentioned. The true success of any waste-treatment operation is based as much on operating skill as on the design and capacity of the system. As engineers responsible for the design of this system, the consultants were most fortunate to have an owner who elected to go out and hire a skilled, competent man to run these facilities. He was also assigned the job of running the byproduct reclaim system and cookers. He was assigned a job in which if he reclaimed his byprod- ucts effectively, his wastewater loads were less and he was, therefore, in complete control of his own destiny. If he messed up on one job, he would not be able to straighten it out on the other.
A licensed certified wastewater treatment plant operator in the State of Florida, Mr. Ronald c-
Lanier, was hired to operate these facilities and their success is due to, in a great part, to his careful attention to facilities operations.
To help him in his job, an operating manual was prepared which described the plant, its flow stream and theory, its initial startup procedures, and its normal operating procedures. It also con- tained a checklist for maintenance and a checklist for equipment operation. The importance of an operating manual prepared by the design engineer cannot be minimized.
Before describing the waste-treatment plant modifications now being made to accommodate increased poultry processing, figures 11 and 13-21 have been included to illustrate the components in detail.
25

Chapter IV
CASE HISTORY-CURRENT EXPANSION AT GOLD KIST
PROJECT HISTORY
The original facility was designed to treat waste waters resulting from the processing of 50,000 birds per day plus a nearly insignificant sanitary wastewater flow from the plant personnel facilities. The rationale by which hydraulic, biological, and solids loadings were determined has been described previously.
Also described are the basic criteria used for determining facility component sizes and the pro- visions for future expansion as foreseen a t that time. During final design, however, the sedimenta- tion facilities were increased in size.
a This somewhat arbitrary increase in the size of the byproducts-collector tank (primary settling) to 40 feet in diameter and the final clarifier (secondary settling) to 44 feet in diameter is the princi- pal reason, along with a conservative original design, why the system has continued to function well under recent substantial overloads. For these same reasons, the modifications now required are minimal.
CURRENT WASTEWATER LOADS
to in
Once poultry-processing startup difficulties had been overcome, it was economically practical l increase hourly production rates and the one-shift processing time to 9 or 10 hours. This resulted daily processing rates of 72,000 to 80,000 birds and measured hydraulic loads of about 1 mgd.
This roughly 50-percent increase in production caused flow rates ranging from 1.7 mgd to 0.4 mgd on processing days. During weekends (supposedly no-flow conditions) 0.2-mgd flows were recorded (see figs. 22-24).
Original flows were expected to be 10 gallons per bird (processing and cleanup) plus 4 gallons per bird for byproducts cooker-condenser cooling waters, for a total flow of 700,000 gallons per day.
Actual measured wastewater flows have averaged 13 gallons per bird and totaled over 1 million gallons per day.
In addition, laboratory tests showed the properties of the wastewaters to be above average during processing hours (see table 3).
27
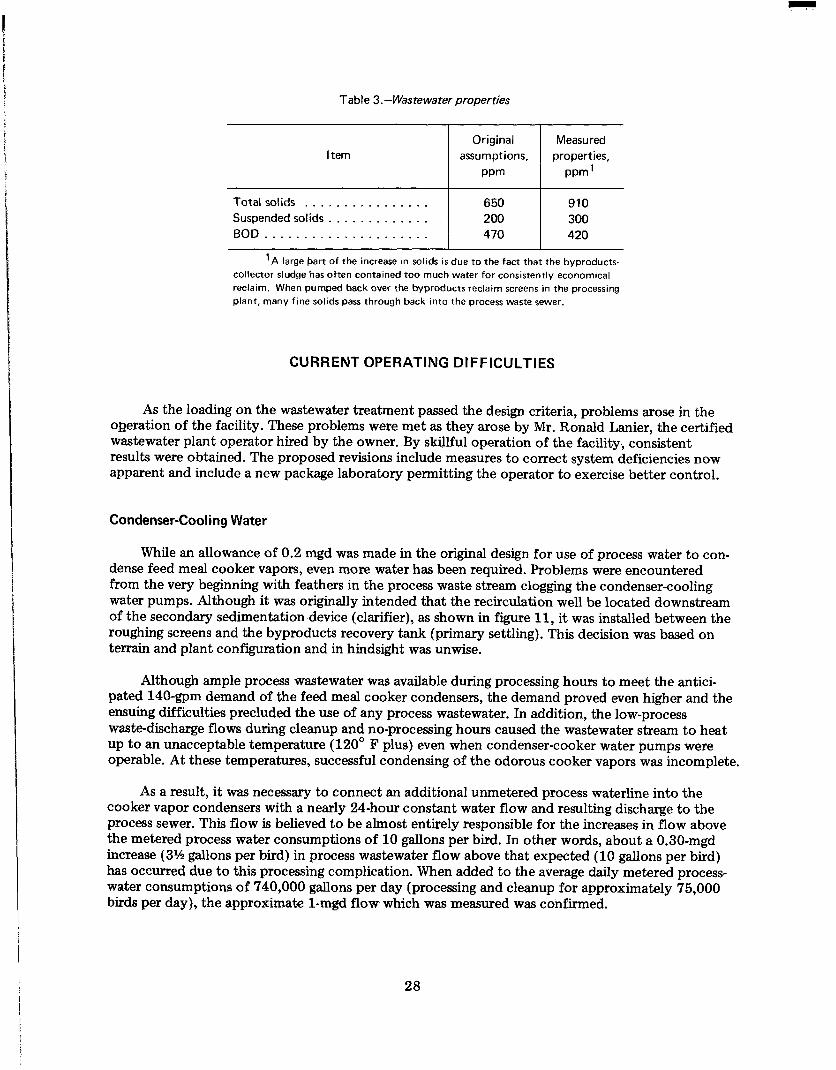
Table 3.-Wastewater properties
Item
Total solids . . . . . . . . . . . . . . . . Suspended solids . . . . . . . . . . . . . BOD . . . . . . . . . . . . . . . . . . . . .
Original Measured assumptions, properties,
PPm ppm’
650 910 200 300 470 420
’A large bart of the increase in solids i s due to the fact that the byproducts- collector sludge has often contained too much water for consistently economical reclaim. When pumped back over the byproducts reclaim screens in the processing plant, many fine solids pass through back into the process waste sewer.
CURRENT OPERATING DI F F ICULTI ES
As the loading on the wastewater treatment passed the design criteria, problems arose in the ogeration of the facility. These problems were met as they arose by Mr. Ronald b i e r , the certified wastewater plant operator hired by the owner. By skillful operation of the facility., consistent results were obtained. The proposed revisions include measures to correct system deficiencies now apparent and include a new package laboratory permitting the operator to exercise better control.
Condenser-Cooling Water
While an allowance of 0.2 mgd was made in the original design for use of process water to con- dense feed meal cooker vapors, even more water has been required. Problems were encountered from the very beginning with feathers in the process waste stream clogging the condenser-cooling water pumps. Although it was originally intended that the recirculation well be located downstream of the secondary sedimentation device (clarifier), as shown in figure 11, it was installed between the roughing screens and the byproducts recovery tank (primary settling). This decision was based on terrain and plant configuration and in hindsight was unwise.
Although ample process wastewater was available during processing hours to meet the antici- pated 140-gpm demand of the feed meal cooker condensers, the demand proved even higher and the ensuing difficulties precluded the use of any process wastewater. In addition, the low-process waste-discharge flows during cleanup and no-processing hours caused the wastewater stream to heat up to an unacceptable temperature (120° F plus) even when condenser-cooker water pumps were operable. A t these temperatures, successful condensing of the odorous cooker vapors was incomplete.
As a result, it was necessary to connect an additional unmetered process waterline into the cooker vapor condensers with a nearly 24-hour constant water flow and resulting discharge to the process sewer. This flow is believed to be almost entirely responsible for the increases in flow above the metered process water consumptions of 10 gallons per bird. In other words, about a 0.30-mgd increase (3% gallons per bird) in process wastewater flow above that expected (10 gallons per bird) has occurred due to this processing complication. When added to the average daily metered process- water consumptions of 740,000 gallons per day (processing and cleanup for approximately 75,000 birds per day), the approximate 1-mgd flow which was measured was confirmed.
28
During late May 1970, condenser water pumps were successfully relocated from their original location to the process waste sump in the waste-treatment facility. Several days of clog-free opera- tion were then possible. During these periods, metered process water demands dropped by 0.1 mgd to 640,000 gallons per day, or only an average of 8% gallons per bird.
Such examples prove that a wastewater estimate of 10-gallons per bird processed is ample pro- viding all byproduct cooker-condenser cooling water can be taken from the process wastewater stream. The successful operation of the wastewater-treatment facilities under the proposed two- shift, 115,000-bird load is predicated on this assumption and will be discussed further herein.
Hydraulic Overflows
At times of peak processing, slight overflows have spilled onto the ground from the aeration tank effluent troughs, and aeration-tank weirs have flooded out.
The original anticipated design flow rate between the aeration tanks and final clarifier was 0.7 mgd (490 gpm), plus 50 percent (peak flow allowance), plus 0.5 mgd (350 gpm) sludge recircula- tion, or approximately 1.55 mgd (980 gpm).
A system head curve for the gravity flow line (C = 100) between the aeration tanks and the final. clarifier revealed only 1.2 feet of the elevation differential required. Effluent trough overflow was considered, at that time (original design), to be unlikely.
However, recent peak flow rates of nearly 1.7 mgd plus sludge recirculation have caused a flow rate of over 2 mgd in the aeration-tank discharge line. At this flow, about 2.5 feet of elevation differential is required. Since the design provided for 3.5 feet of elevation between the aeration-tank water surface and the final clarifier water surface, recent overflows seemed unexplainable.
Recent checking of “as built” elevations, however, reveal only about a 2.5-foot difference in elevation; apparently a construction error was made. Later discussion contained herein will describe the corrective work required.
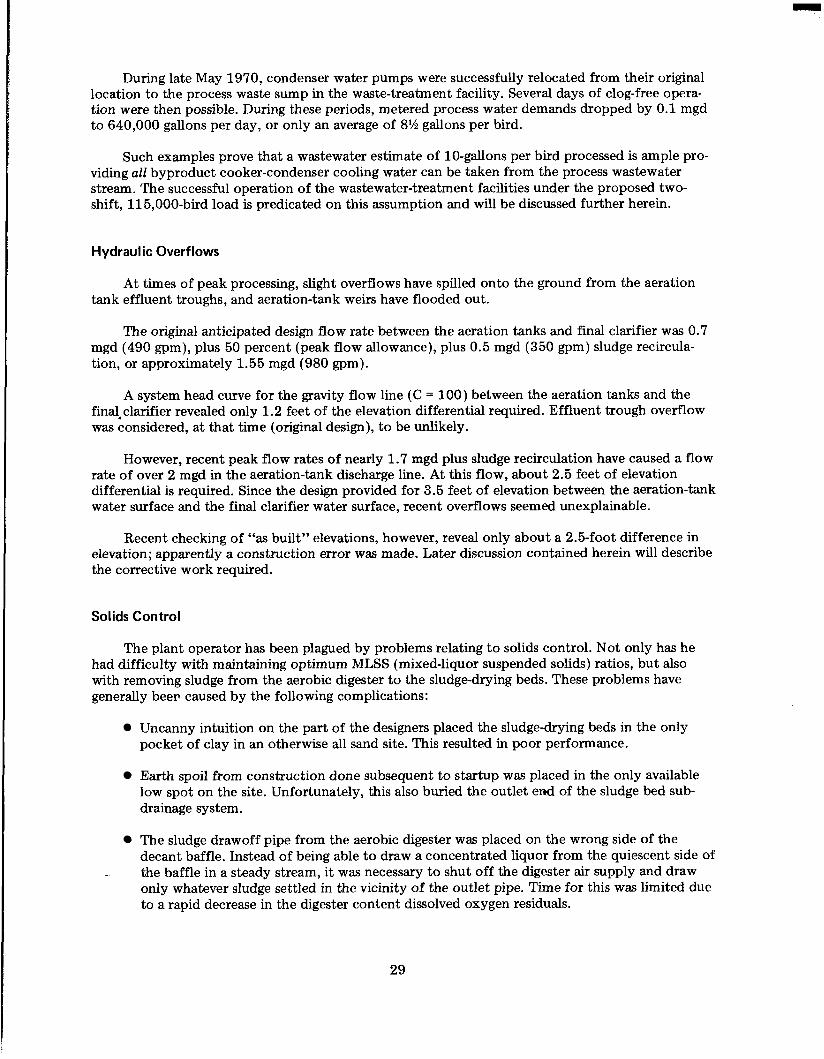
Solids Control
The plant operator has been plagued by problems relating to solids control. Not only has he had difficulty with maintaining optimum MLSS (mixed-liquor suspended solids) ratios, but also with removing sludge from the aerobic digester to the sludge-drying beds. These problems have generally beer caused by the following complications:
Uncanny intuition on the part of the designers placed the sludge-drying beds in the only pocket of clay in an otherwise all sand site. This resulted in poor performance.
Earth spoil from construction done subsequent to startup was placed in the only available low spot on the site. Unfortunately, this also buried the outlet end of the sludge bed sub- drainage system.
The sludge drawoff pipe from the aerobic digester was placed on the wrong side of the decant baffle. Instead of being able to draw a concentrated liquor from the quiescent side of the baffle in a steady stream, it was necessary to shut off the digester air supply and draw only whatever sludge settled in the vicinity of the outlet pipe. Time for this was limited due to a rapid decrease in the digester content dissolved oxygen residuals.
-
29
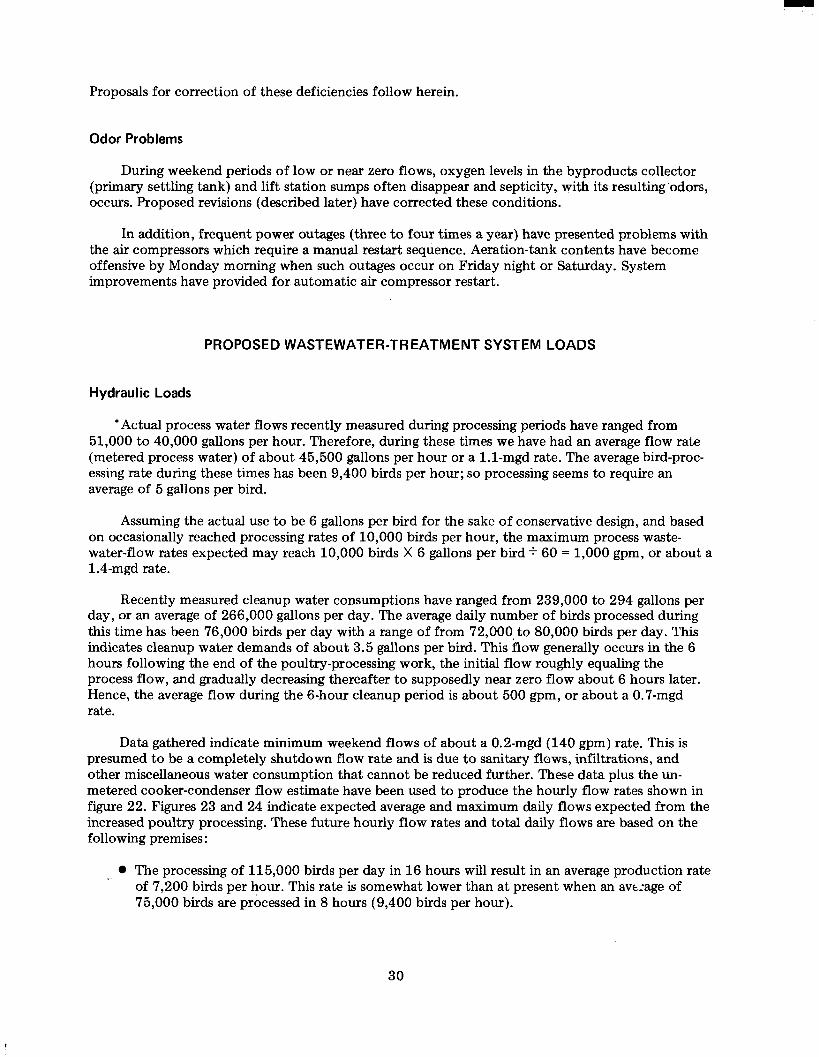
Proposals for correction of these deficiencies follow herein.
Odor Problems
During weekend periods of low or near zero flows, oxygen levels in the byproducts collector (primary settling tank) and lift station sumps often disappear and septicity, with its resulting odors, occurs. Proposed revisions (described later) have corrected these conditions.
In addition, frequent power outages (three to four times a year) have presented problems with the air compressors which require a manual restart sequence. Aeration-tank contents have become offensive by Monday morning when such outages occur on Friday night or Saturday. System improvements have provided for automatic air compressor restart.
PROPOSED WASTEWATER-TREATMENT SYSTEM LOADS
Hydraulic Loads
Actual process water flows recently measured during processing periods have ranged from 51,000 to 40,000 gallons per hour. Therefore, during these times we have had an average flow rate (metered process water) of about 45,500 gallons per hour or a 1.1-mgd rate. The average bird-proc- essing rate during these times has been 9,400 birds per hour; so processing seems to require an average of 5 gallons per bird.
Assuming the actual use to be 6 gallons per bird for the sake of conservative design, and based on occasionally reached processing rates of 10,000 birds per hour, the maximum process waste- water-flow rates expected may reach 10,000 birds X 6 gallons per bird + 60 = 1,000 gpm, or about a 1.4-mgd rate.
Recently measured cleanup water consumptions have ranged from 239,000 to 294 gallons per day, or an average of 266,000 gallons per day. The average daily number of birds processed during this time has been 76,000 birds per day with a range of from 72,000 to 80,000 birds per day. This indicates cleanup water demands of about 3.5 gallons per bird. This flow generally occurs in the 6 hours following the end of the poultry-processing work, the initial flow roughly equaling the process flow, and gradually decreasing thereafter to supposedly near zero flow about 6 hours later. Hence, the average flow during the 6-hour cleanup period is about 500 gpm, or about a 0.7-mgd rate.
Data gathered indicate minimum weekend flows of about a 0.2-mgd (140 gpm) rate. This is presumed to be a completely shutdown flow rate and is due to sanitary flows, infiltrations, and other miscellaneous water consumption that cannot be reduced further. These data plus the un- metered cooker-condenser flow estimate have been used to produce the hourly flow rates shown in figure 22. Figures 23 and 24 indicate expected average and maximum daily flows expected from the increased poultry processing. These future hourly flow rates and total daily flows are based on the following premises:
The processing of 115,000 birds per day in 16 hours will result in an average production rate of 7,200 birds per hour. This rate is somewhat lower than at present when an avcage of 75,000 birds are processed in 8 hours (9,400 birds per hour).
30

0 Peak hourly processing rates of 10,000 birds per hour will again be possible and will occur on days when production reaches the proposed maximum of 130,000 birds per day; peak flow rates of 1,000 gpm of process wastewater will be generated at such times.
0 Process water demands will not exceed 6 gallons per bird and cleanup demands will not exceed 4 gallons per bird. This rate seems readily obtained based on present operating experience.
0 Wastewater flows will be minimized by discontinuing the use of unmetered process water for byproducts cooker vapor condensing. All condenser water demands will be met by using untreated process waste supplemented when required by recirculation of byproducts collector-tank (primary settling) contents and aeration-tank contents. At these times, those waste-treatment system components will be, in effect, heat exchanger devices. Anticipated maximum water temperatures in those components will not exceed 120" F and should not, therefore, be detrimental to biological processes.
It was demonstrated by figures 22 through 24 that although total wastewater flows will increase by 5 to 12 percent, peak flow rates will actually be reduced by 16 percent.
Biological Loads
The original design anticipated a BOD load of 2,600 pounds per day while processing 50,000 birds per day, or 0.052 pound of BOD per bird.
If cooker-condenser water recirculation had been continuously practiced instead of using fresh unmetered water, this BOD load should have been contained in 50,000 gallons (4,170,000 pounds) of water per day, which would then have had an average BOD concentration of 624 ppm. With addi- tional water for cooker vapor condensation, the flow was estimated to be 700,000 gallons per day. At this time, the average BOD concentration in the raw waste would have been 446 ppm.
Laboratory tests made on wastewater flows found an average influent BOD of 350 ppm and 397 ppm. These tests indicate that the originally anticipated BOD assumptions were quite adequate.
Influent grab samples during processing hours (Apr. 22,1969) had a peak influent BOD of 550 ppm. This increased to 650 ppm during those hours when wastage of byproducts collector sludge through byproducts area screens was practiced instead of being sent to the cookers for reclaim. These figures are similar to those BOD concentrations assumed during the original design work.
The monthly operating reports for the year 1966 indicate gradually increasing loads on the waste-treatment facilities as production increased. Near the end of 1969, it became necessary to run the third standby blower continuously to satisfy oxygen demands.
REVIEW OF COMPONENT ADEQUACY
Lift Station
~
The existing lift station contains three separate sumps, e.g., process water, sanitary sewage, and byproducts. Although total flows are expected to increase slightly, maximum flow rates should decrease so that no changes are required in this facility. However, to insure an ample cooker vapor
31
I
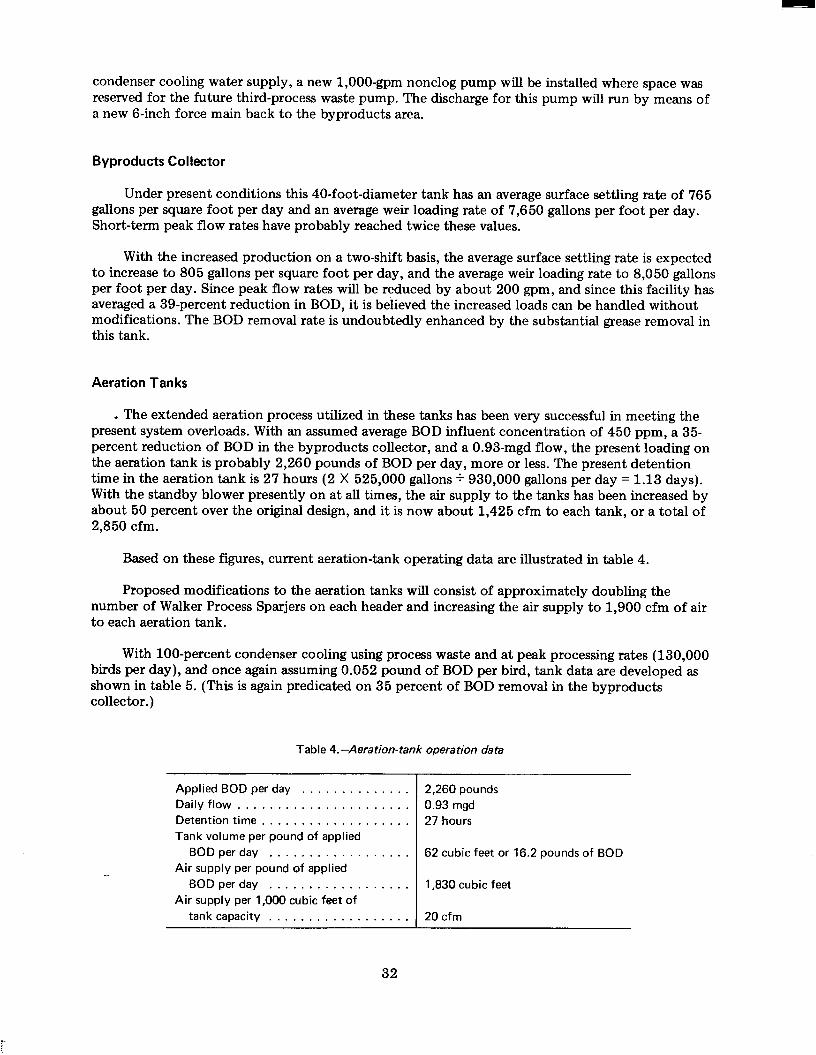
condenser cooling water supply, a new 1,000-gpm nonclog pump will be installed where space was reserved for the future third-process waste pump. The discharge for this pump will run by means of a new 6-inch force main back to the byproducts area.
Byproducts Collector
Under present conditions this 40-foot-diameter tank has an average surface settling rate of 765 gallons per square foot per day and an average weir loading rate of 7,650 gallons per foot per day. Short-term peak flow rates have probably reached twice these values.
With the increased production on a two-shift basis, the average surface settling rate is expected to increase to 805 gallons per square foot per day, and the average weir loading rate to 8,050 gallons per foot per day. Since peak flow rates will be reduced by about 200 gpm, and since this facility has averaged a 39-percent reduction in BOD, it is believed the increased loads can be handled without modifications. The BOD removal rate is undoubtedly enhanced by the substantial grease removal in this tank.
Aeration Tanks
. The extended aeration process utilized in these tanks has been very successful in meeting the present system overloads. With an assumed average BOD influent concentration of 450 ppm, a 35- percent reduction of BOD in the byproducts collector, and a 0.93-mgd flow, the present loading on the aeration tank is probably 2,260 pounds of BOD per day, more or less. The present detention time in the aeration tank is 27 hours (2 X 525,000 gallons f 930,000 gallons per day = 1.13 days). With the standby blower presently on at all times, the air supply to the tanks has been increased by about 50 percent over the original design, and it is now about 1,425 cfm to each tank, or a total of 2,850 cfm.
Based on these figures, current aeration-tank operating data are illustrated in table 4.
Proposed modifications to the aeration tanks will consist of approximately doubling the number of Walker Process Sparjers on each header and increasing the air supply to 1,900 cfm of air to each aeration tank.
With 100-percent condenser cooling using process waste and at peak processing rates (130,000 birds per day), and once again assuming 0.052 pound of BOD per bird, tank data are developed as shown in table 5. (This is again predicated on 35 percent of BOD removal in the byproducts collector. )
Table 4.-Aeration-tank operation data
Applied BOD per day . . . . . . . . . . . . . . Daily flow . . . . . . . . . . . . . . . . . . . . . . Detention time . . . . . . . . . . . . . . . . . . . Tank volume per pound of applied
BOD per day . . . . . . . . . . . . . . . . . . Air supply per pound of applied
Air supply per 1,000 cubic feet of BOD per day . . . . . . . . . . . . . . . . . .
tank capacity . . . . . . . . . . . . . . . . . .
2,260 pounds 0.93 mgd 27 hours
62 cubic feet or 16.2 pounds of BOD
1,830 cubic feet
20 cfm
32
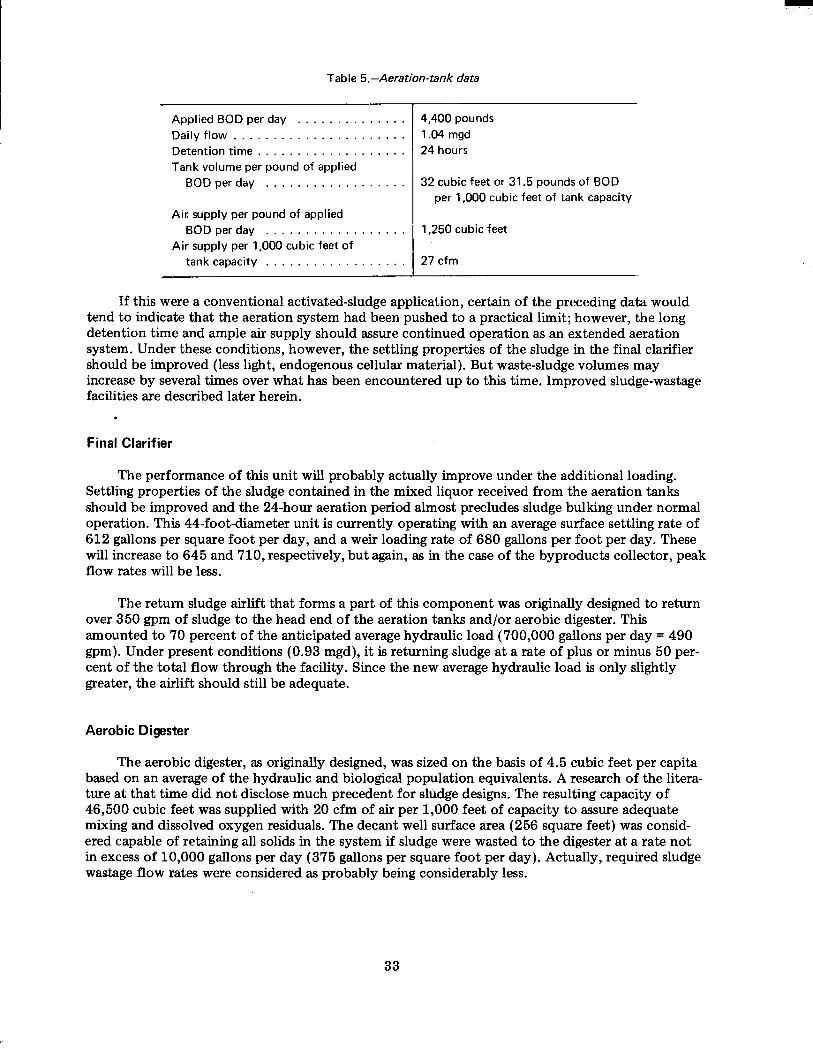
Table 5.-Aeration-tank data
Applied BOD per day . . . . . . . . . . . . . . Daily flow . . . . . . . . . . . . . . . . . . . . . . Detention time . . . . . . . . . . . . . . . . . . . Tank volume per pound of applied
BOD per day . . . . . . . . . . . . . . . . . .
Ail; supply per pound of applied
Air supply per 1,000 cubic feet of BOD per day . . . . . . . . . . . . . . . . . .
tank capacity . . . . . . . . . . . . . . . . . .
4,400 pounds 1.04 mgd 24 hours
32 cubic feet or 31.5 pounds of BOD per 1,000 cubic feet of tank capacity
1,250 cubic feet
27 cfm
If this were a conventional activated-sludge application, certain of the preceding data would tend to indicate that the aeration system had been pushed to a practical limit; however, the long detention time and ample air supply should assure continued operation as an extended aeration system. Under these conditions, however, the settling properties of the sludge in the final clarifier should be improved (less light, endogenous cellular material). But waste-sludge volumes may increase by several times over what has been encountered up to this time. Improved sludge-wastage facilities are described later herein.
Final Clarifier
The performance of this unit will probably actually improve under the additional loading. Settling properties of the sludge contained in the mixed liquor received from the aeration tanks should be improved and the 24-hour aeration period almost precludes sludge bulking under normal operation. This 44-foot-diameter unit is currently operating with an average surface settling rate of 612 gallons per square foot per day, and a weir loading rate of 680 gallons per foot per day. These will increase to 645 and 710, respectively, but again, as in the case of the byproducts collector, peak flow rates will be less.
The return sludge airlift that forms a part of this component was originally designed to return over 350 gpm of sludge to the head end of the aeration tanks and/or aerobic digester. This amounted to 70 percent of the anticipated average hydraulic load (700,000 gallons per day = 490 gpm). Under present conditions (0.93 mgd), it is returning sludge at a rate of plus or minus 50 per- cent of the total flow through the facility. Since the new average hydraulic load is only slightly greater, the airlift should still be adequate.
Aerobic Digester
The aerobic digester, as originally designed, was sized on the basis of 4.5 cubic feet per capita based on an average of the hydraulic and biological population equivalents. A research of the litera- ture at that time did not disclose much precedent for sludge designs. The resulting capacity of 46,500 cubic feet was supplied with 20 cfm of air per 1,000 feet of capacity to assure adequate mixing and dissolved oxygen residuals. The decant well surface area (256 square feet) was consid- ered capable of retaining all solids in the system if sludge were wasted to the digester at a rate not in excess of 10,000 gallons per day (375 gallons per square foot per day). Actually, required sludge wastage flow rates were considered as probably being considerably less.
33
Furthermore, recent research on this matter had disclosed that the extended aeration system generates about 0.5 pound of solids for every pound of applied BOD. These data are developed and set forth in the paper “Design Criteria for Extended Aeration” by John T. Pfeffer, Assistant Profes- sor of Civil Engineering, University of Kansas (published in the Transactions o f the 13th Annual Conference on Sanitary Engineering, at that university).
With the future applied load of 4,400 pounds of BOD per day on the aeration facilities, about 2,200 pounds per day of solids may be generated. If these were contained in a sludge having a water content of 99.8 percent, about 1.1 million pounds or 132,000 gallons per day would have to be wasted to the aerobic digester. Under these flow conditions (92 gpm), the surface settling rate on the decant well of the aerobic digester would be only 515 gallons per square foot per day; the weir loading rate would be 8,200 gallons per foot per day; and the digester detention time would be approximately 3 days. With a regular daily sludge drawoff, the aerobic digester is still believed to be quite adequate.
Sludge-Drying Beds
The original sludge-drying beds provided had a total area of approximately 20,000 square feet. On the basis of the original biological population equivalent, this area amounted to 1.33 square feet per capita.
Although the plant has been operating under a plus or minus 50-percent overload condition, the area has still proved ample; however, the method by which digester sludge is conveyed to the beds has been less than satisfactory.
The fact that the sludge is the end product of an extended aeration process and has been further subjected to several days of additional aerobic digestion has resulted in small quantities of a readily dried product with no offensive odors.
One additional 10,000-square-foot drying bed with underdrains will be constructed, and the existing beds and underdrainage system improved to provide more capacity and eliminate previously discussed operating problems.
Stabilization Pond
The stabilization or polishing pond has an area of 193,000 square feet, or 4.4 acres. A high dissolved oxygen content in the pond has enabled bass and bream to flourish and the pond has been the site of company fishing contests. When power failures have occurred and septic conditions have arisen in the aeration tanks, the pond has prevented such conditions from reaching the Suwannee River until the treatment processes were again in order.
Although, at this time, no change is contemplated in the pond, aeration may have to be added to the pond if the increased wastewater load caused anaerobic conditions to develop. This could be accomplished by means of submerged perforated polyethylene air headers or floating surface aerators placed near the central inlet.
Outfall Sewer and CI, Facilities
Since total flows are only expected to increase by 9-12 percent and peak flows will actually be reduced, the existing facilities should still be adequate.
34
PROPOSED MODIFICATIONS
Air Supply
The number of aeration sparjers in the aeration tanks will be approximately doubled. To furnish the additional air required, two more 75-hp Spencer turbocompressors will be added. During operations, four will be running and one will be kept as a standby. The motor control center near the lift station was originally designed to accommodate two more future blowers, so only power connections from the motor control center to the blower motors are needed. The motor control center will also have a “Motor Minder” added to it, which will provide automatic sequential blower restarts in the event of a power failure. This device will also protect the 75-hp motors against low voltage and single phasing.
Plant Hydraulics
Although peak flow rates will be reduced, the possibility of aeration-tank effluent trough over- flows may still exist. A new head box and an increase in the aeration-tank discharge line size to 18 inches from 14 inches should prevent any further problem.
Byproducts Reclaim System
The original system consisted of a collection sump in the facility lift station and a pump which returned the sludge and grease collected by the primary-settling (byproducts) tank to the cookers in the plant. Considerable sand and grit in the sludge caused clogging in the return line, which was sized for future flows but in which present velocities failed to keep the grit and sand in suspension. In addition, the byproducts reclaimed often contained too much water for economical recovery. Some system improvements follow.
0 Replace the present byproducts pump with a 200-gpm, 3 5-foot head-float-actuated nonclog centrifugal pump. This will return byproducts to the cookers with sufficient velocity to prevent clogging of the return line.
0 Install a secondary grease tank in the byproducts area of the plant. This tank will receive grease from the byproducts tank skimmer box. This tank will permit reutilization of the Moyno pump to draw grease from the bottom of the tank and discharge to a separate grease cooker for separate rendering.
0 As an alternative to this scheme, possible use of a centrifuge to thicken the sludge (20 percent solids) before discharge to the cookers is being considered. If it proves practical to reclaim secondary as well as primary sludge, this alternative will appear to be more attractive.
Sludge-D ry ing Facilities
A modification to the sludge-withdrawal system in the decant well of the aerobic digester is required. An adjustable sludge drawoff pipe should permit the operator to withdraw sludge from that level in the decant well which contains the thickest sludge.
35
A new 100-gpm sludge drawoff pump on brackets secured to the side of the aerobic digester will discharge to either one of the existing drying beds or to the new third sludgedrying bed. As an alternative, the discharge can be sent to the byproducts sump. Should the secondary sludge be amenable for reuse as poultry food, there will be no need for sludge-drying beds. Since secondary sludge is low in protein compared to primary sludge, its reclaim value is not yet proven.
Condenser Cooling Water
The success of the waste-treatment facility operation under the increased loading anticipated is dependent on 1 OO-percent reuse of process wastewater for byproduct cooker vapor condenser cool- ing. To assure an ample water supply, an 800- to 1,000-gpm, 5O-psi, 75-hp pump will be installed in the facility lift station. Taking its suction from the process sump, it will discharge back through a new force main to the byproducts cooker vapor condensers.
During periods of low process waste flow, the drain valves from the aeration tanks and aerobic digesters will be opened sufficiently to maintain an adequate water supply to the condenser cool- ing water pump. This will, in effect, convert the primary settling tank (byproducts collector) and aeration tanks to heat exchangers. Since some process waste (200-gpm minimum) always flows, it is felt that the over 1 million gallons of aerated mixed liquor in the aeration tanks will not become heated to a point detrimental to biological processes. Calculations indicate cooling water tempera- tures will remain below 120' F for successful cooker vapor condensation and such temperatures are not ixpected to injure biological process.
Grease Removal
Byproducts handling is, on occasion, hampered by excessive grease in the reclaimed feed meal (conveyor fouling, clogging, etc.). At the option of the poultry processor, a grease-receiving tank will be installed next to the byproducts collector. Scum and grease from this tank will be collected separately and pumped to a separate cooker.
36
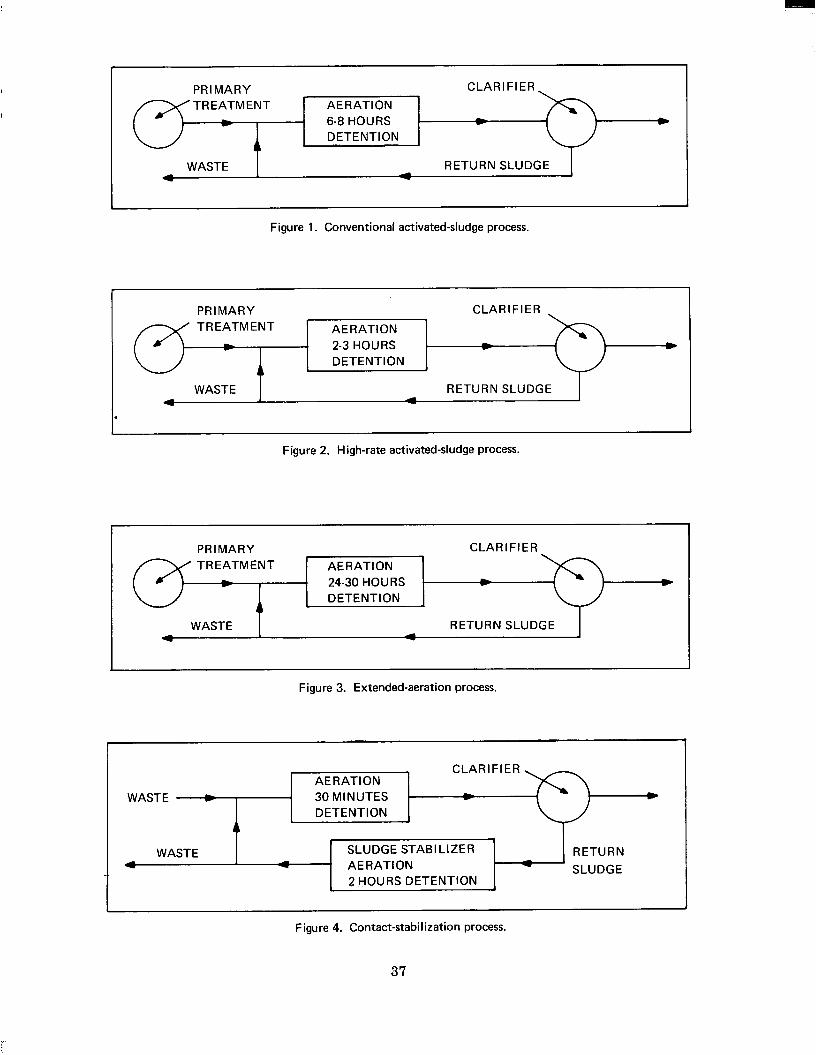
TREATMENT AE RAT1 ON I 6-8 HOURS
DETENTION
Figure 1. Conventional activated-sludge process.
- v -
TREATMENT AERATION - 2-3 HOURS L
DETENTION
Figure 2. High-rate activated-sludge process.
- r m
TREATMENT AE RAT1 ON - r 24-30 HOURS
DETENTION
L v *
1 I Figure 3. Extended-aeration process.
WASTE
1 CLARl FI ER I AERATION
RETURN SLUDGE 4
- WASTE -
Figure 4. Contact-stabilization process.
30 MINUTES r + DETENTION
37
WASTE
Ir
SLUDGE STABILIZER RETURN A A 4 1 * 1 SLUDGE AERATION
2 HOURS DETENTION
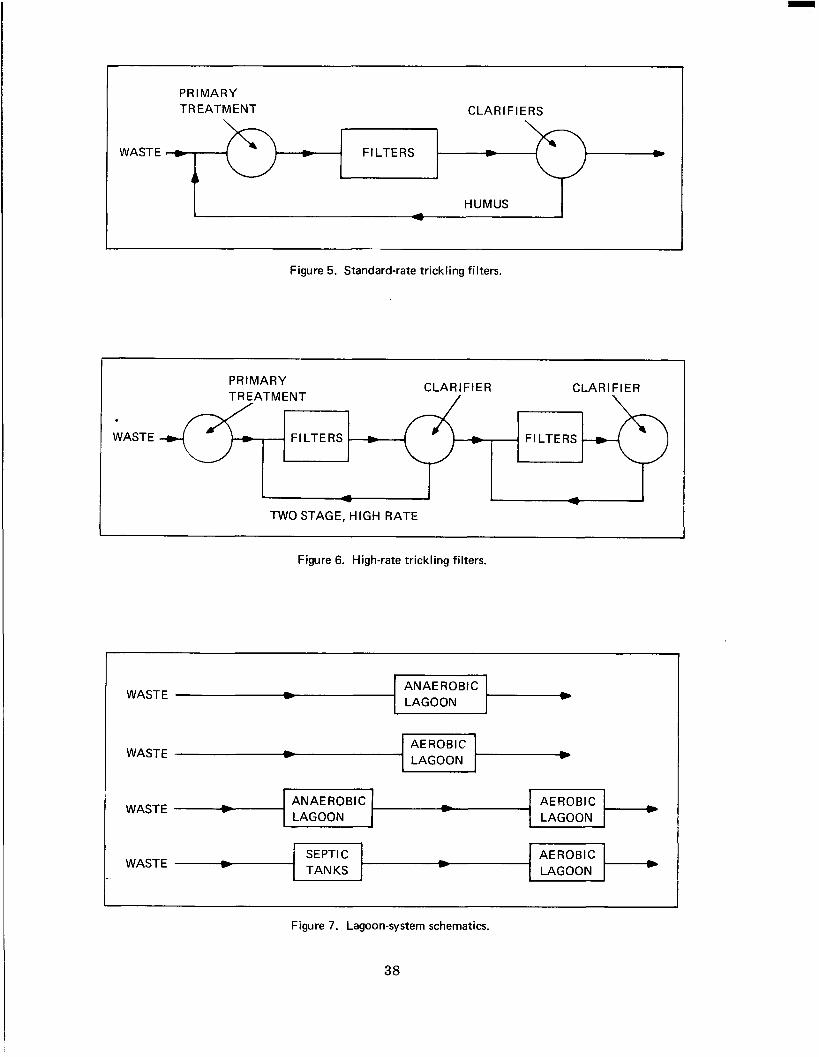
PRIMARY T R E ATM EN T
- WASTE rt - CLARIFIERS
+
FILTERS v e L
WASTE
Figure 5. Standard-rate trickling filters.
ANAEROBIC LAGOON *
CLARIFIER CLAR I F I ER PRIMARY TR E ATM E NT
WASTE FILTERS FILTERS
1 - - TWO STAGE, HIGH RATE
- ANAEROBIC AEROBIC LAGOON LAGOON
WASTE
Figure 6. High-rate trickling filters.
*
I
SEPTl C TANKS WASTE .- AEROBIC - LAGOON *
c
I
Figure 7. Lagoon-system schematics.
38
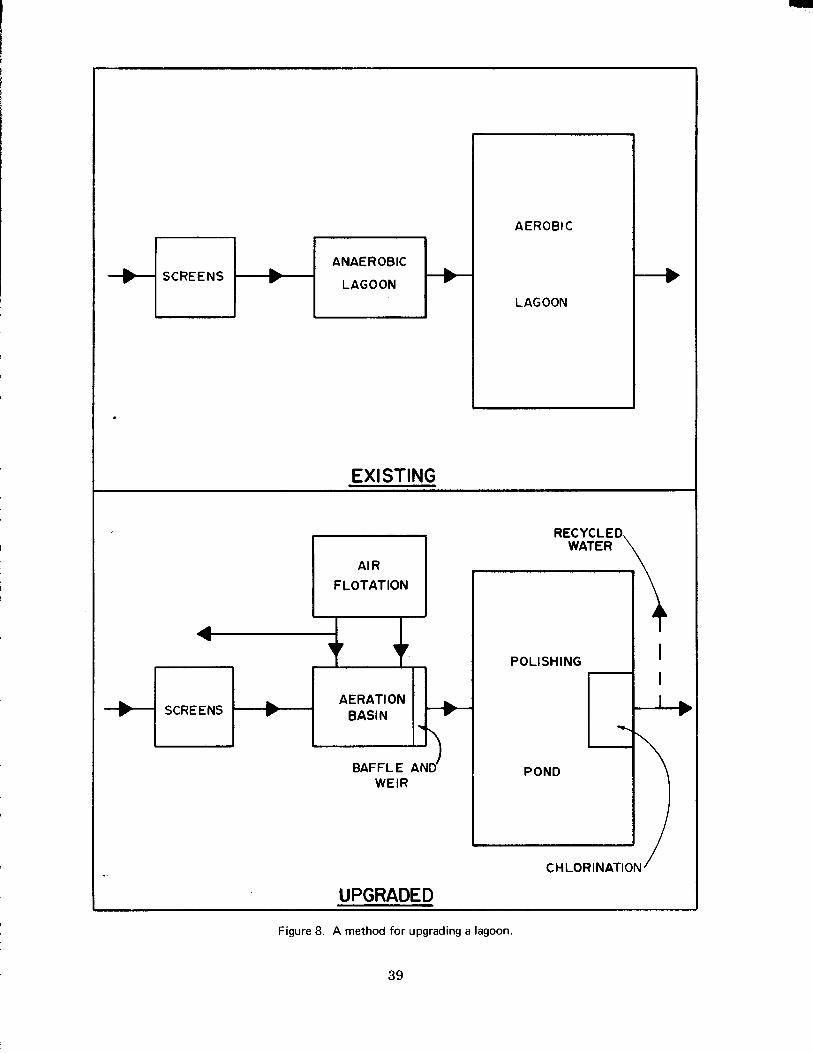
ANAEROBIC
LAGOON SCREENS
AEROBIC
LAGOON
EX1 STING
I AIR
FLOTATION
I
AERATION BAS1 N SCREENS
BAFFLE AND WEIR
POLISHING
L POND
i I I -+
UPGRADED
Figure 8. A method for upgrading a lagoon.
39

L v SCREENS
EX I ST I NG
ANAE R OR BIC LAGOON
RECIRCULATION m RECIRCULATION WET
WELL L F v CLARl FlER
L
AERATION I BAS1 N SCREENS
AERATION BAS1 N SCREENS
SOLIDS
OR DISPOSAL u
UPGRADED Figure 9. A method for upgrading a lagoon.
40
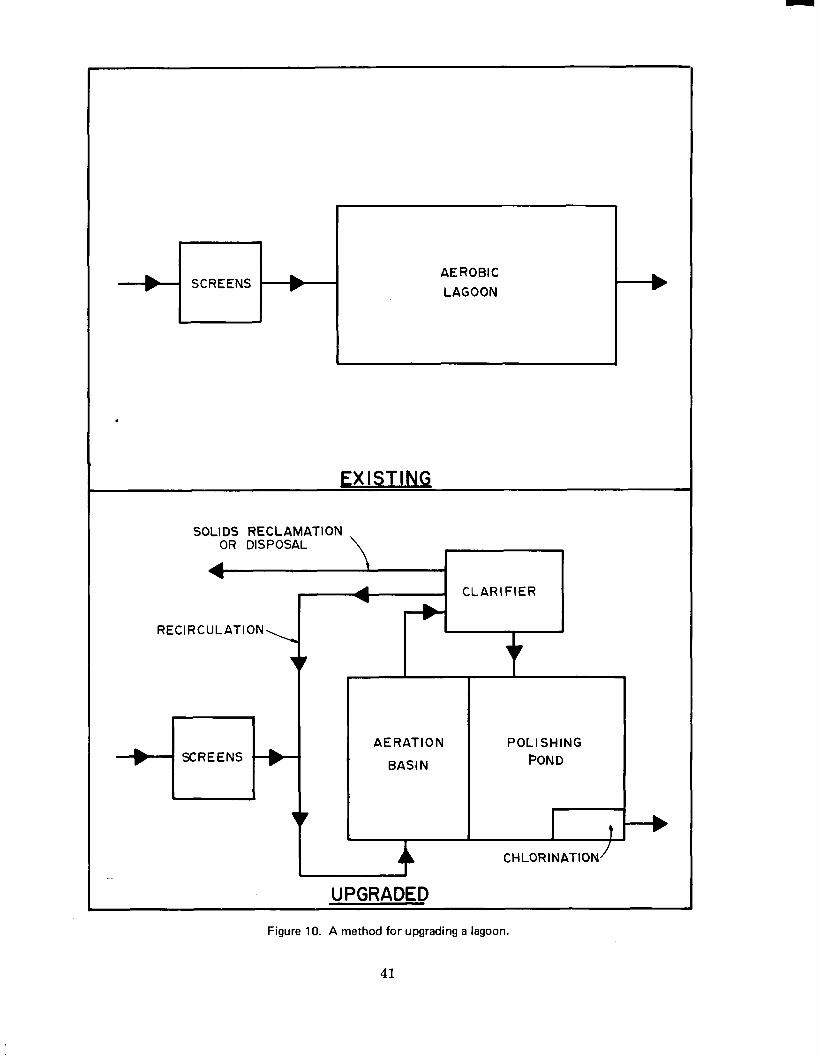
I
SCREENS AEROBIC LAGOON
I L r
EXISTING
i
\-I RECIRCULATION
t
CLARIFIER - 1
A E RAT I 0 N BASIN
-7-
POLISHING POND
I CHLORINATION’
UPGRADED
Figure 10. A method for upgrading a lagoon.
41
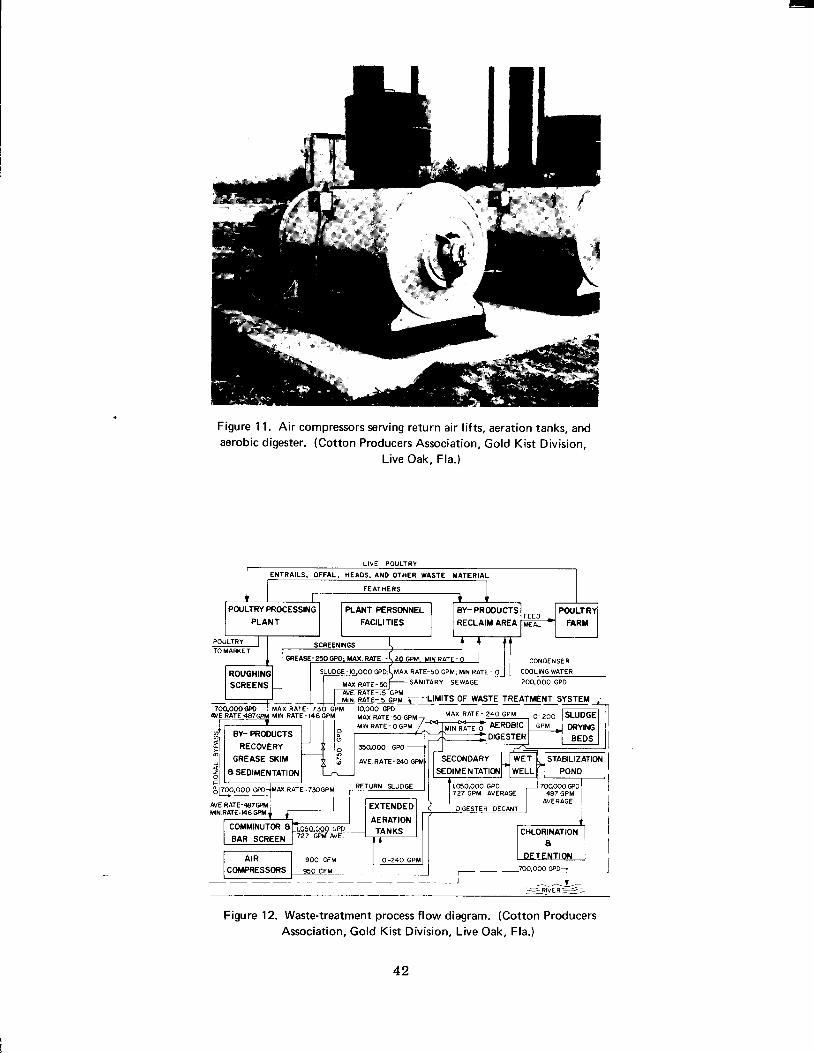
Figure 11. Air compressors serving return air lifts, aeration tanks, and aerobic digester. (Cotton Producers Association, Gold Kist Division,
Live Oak, Fla.)
LIVE POULTRY
- - RIVER=^-
Figure 12. Waste-treatment process flow diagram. (Cotton Producers Association, Gold Kist Division, Live Oak, Fla.)
42
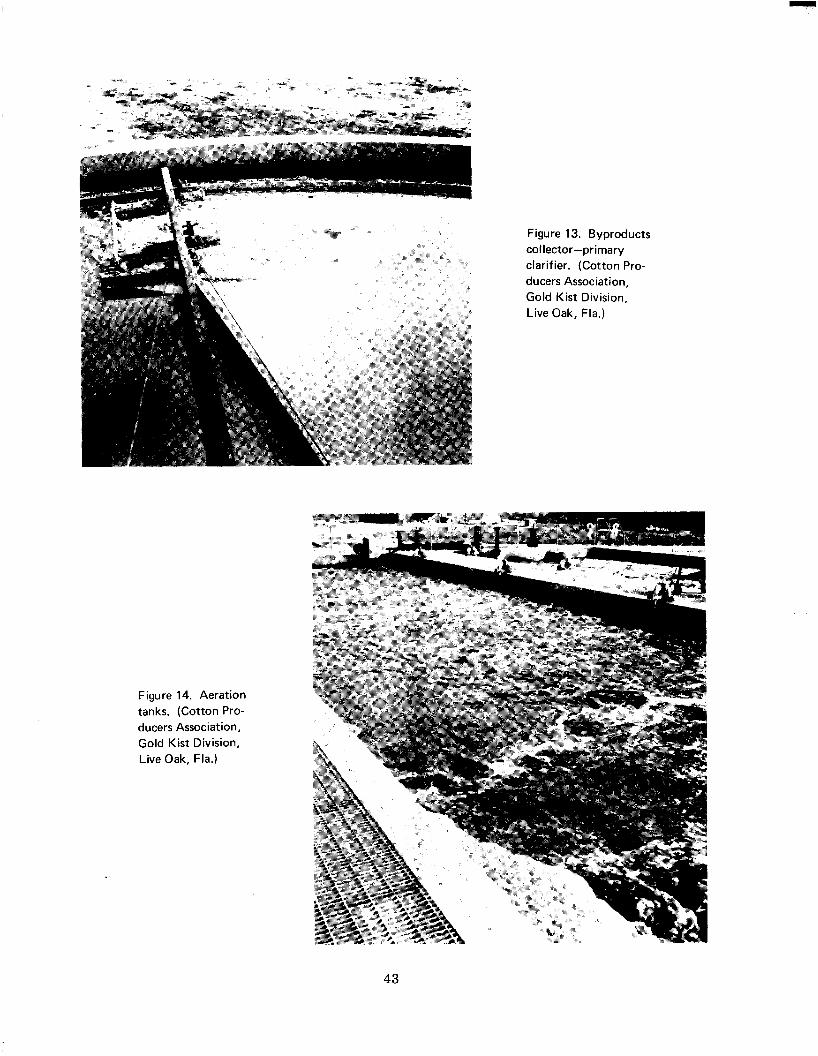
Figure 13. Byproducts collector-primary clarifier. (Cotton Pro- ducers Association, Gold Kist Division, Live Oak, Fla.)
Figure 14. Aeration tanks. (Cotton Pro- ducers Association, Gold Kist Division, Live Oak, Fla.)
43
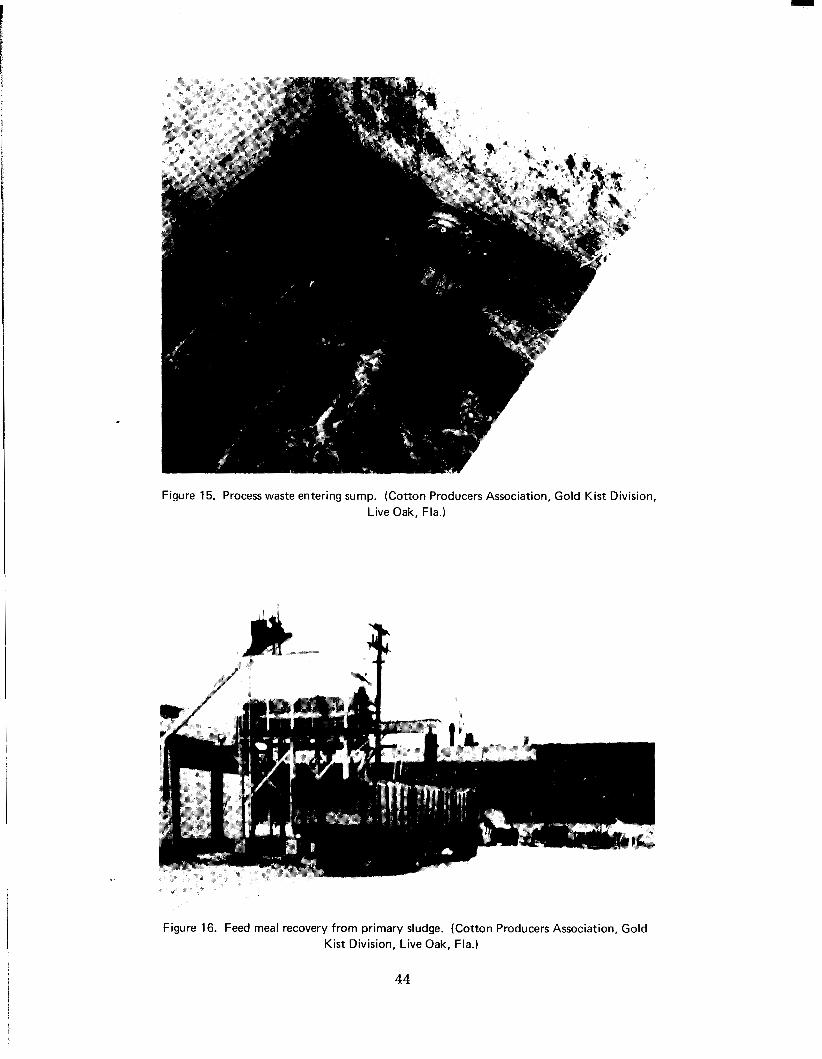
Figure 15. Process waste entering sump. (Cotton Producers Association, Gold Kist Division, Live Oak, Fla.)
Figure 16. Feed meal recovery from primary sludge. (Cotton Producers Association, Gold Kist Division, Live Oak, Fla.)
44
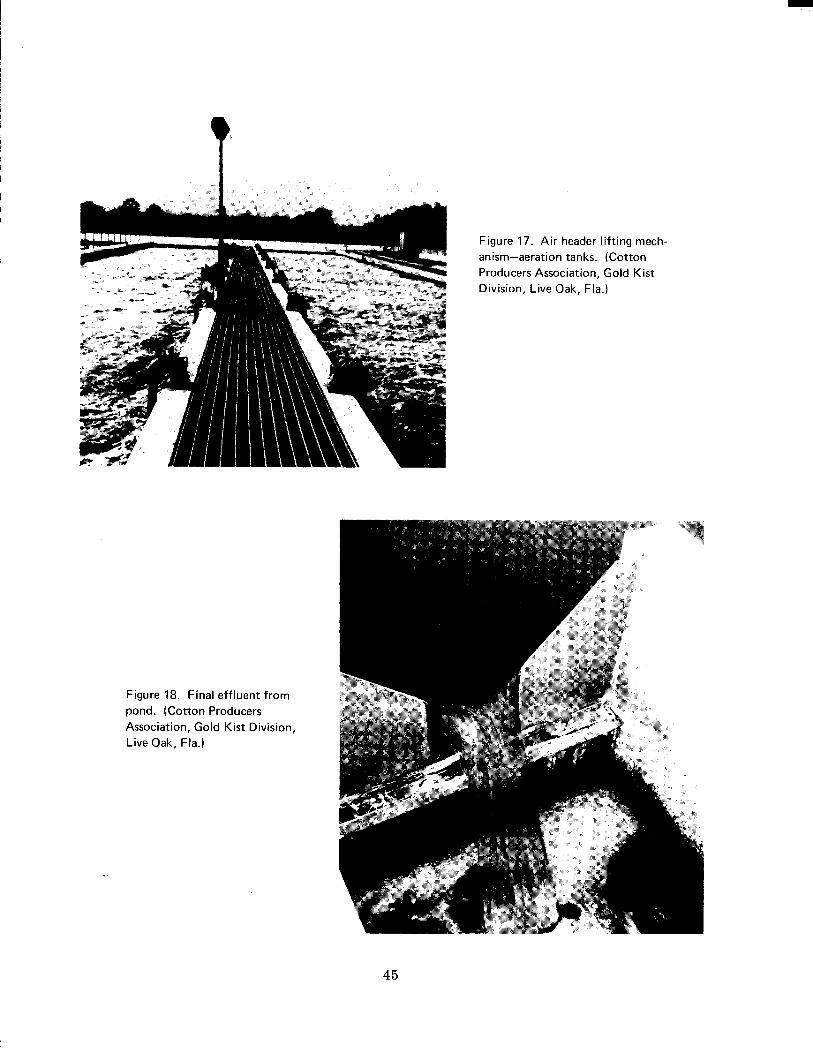
t Figure 17. Air header lifting rnech- anism-aeration tanks. (Cotton Producers Association, Gold Kist Division, Live Oak, Fla.)
Figure 18. Final effluent from pond. (Cotton Producers Association, Gold Kist Division, Live Oak, Fla.)
45
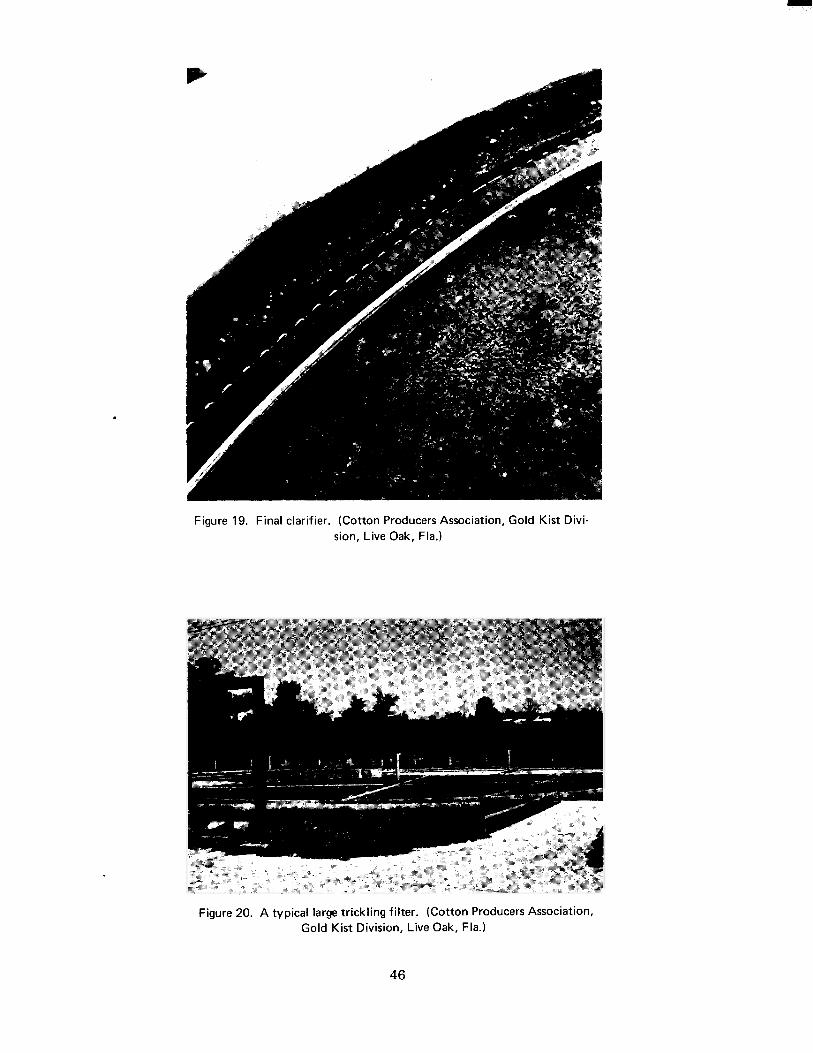
Figure 19. Final clarifier. (Cotton Producers Association, Gold Kist Divi- sion, Live Oak, Fla.)
Figure 20. A typical large trickling filter. (Cotton Producers Association, Gold Kist Division, Live Oak, Fla.)
46
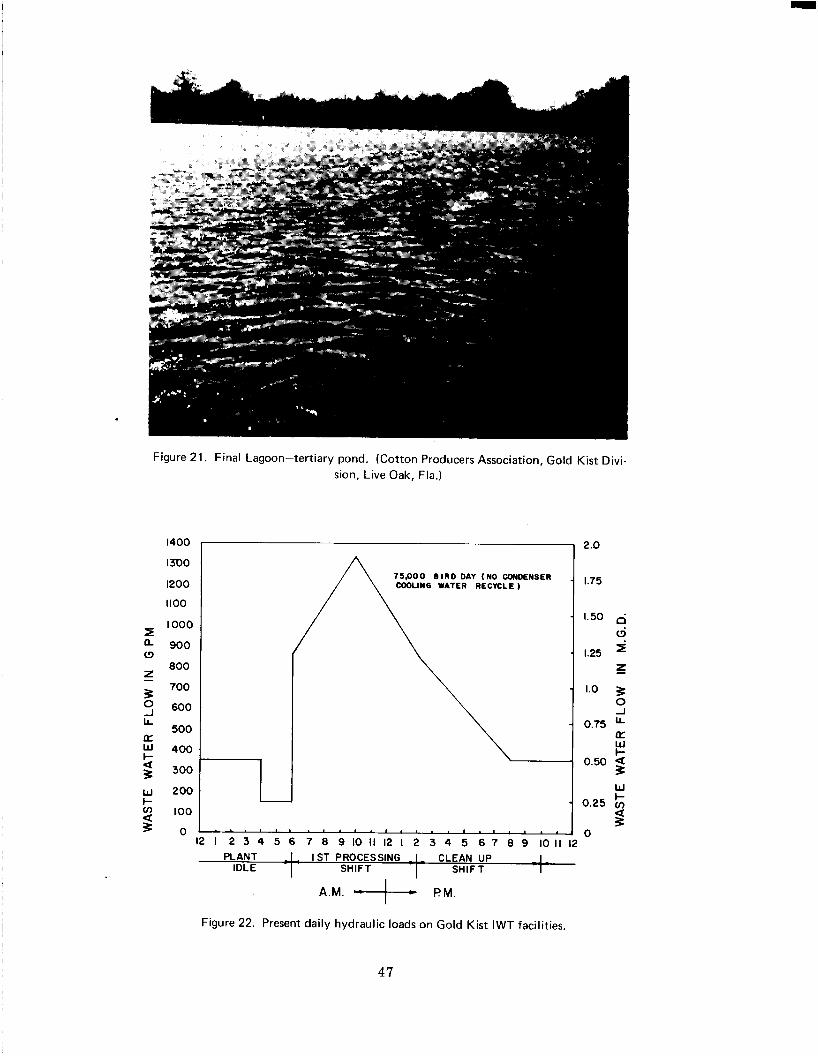
Figure 21. Final Lagoon-tertiary pond. (Cotton Producers Association, Gold Kist Divi- sion, Live Oak, Fla.)
1400
1300
1200
1100
I O 0 0 I a 900 (3
800 z 700 ? 2 600
LL 500 a
w 400 I- 2 300
w 200 L 2 100
75,000 B I R D DAY (NO CONDENSER COOLING WATER RECYCLE)
“‘i
2 .o
1.75
1.50
f z
1.0 3
1.25
0 -I
0.75 LL
W I-
a
0.50 a 3 W I- 0.25 v) U P
I . . . . , . , . , . . 0 1 2 1 2 3 4 5 6 7 8 9 1 0 1 1 1 2 1 2 3 4 5 6 7 8 9 101112
5 0 PLANT -I_ I S T PROCESSING I CLEAN UP I
IDLE SHIFT SHIFT
A.M. 4- PM.
Figure 22. Present daily hydraulic loads on Gold Kist IWT facilities.
47
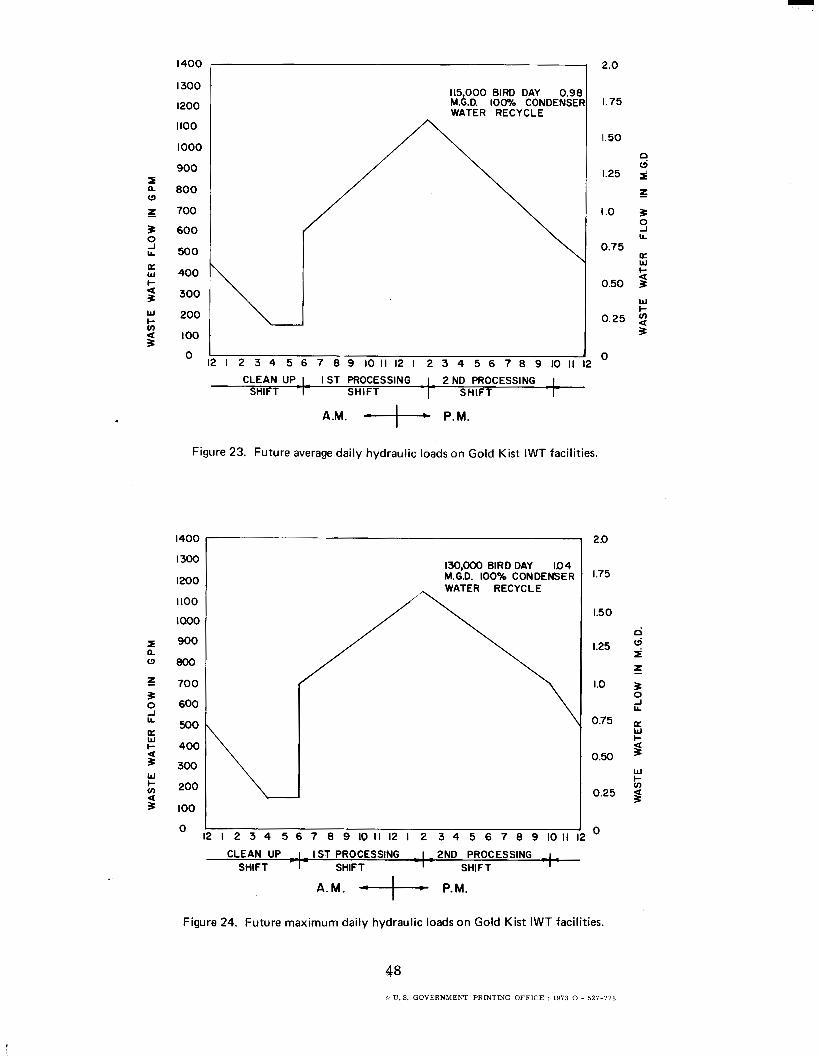
I 2.0 I4O0 I
I- 4 3 W
k _ _ a 3
I300
1200
1100
1000
900
800
700
600
500
400
300
200
IO0
115,000 BIRD DAY 0.98 M.G.D. 1000/0 CONDENSER WATER RECYCLE
1.75
1.50
1.25
I .o
0.75
0.50
0.25
A.M. -4 P.M.
Figure 23. Future average daily hydraulic loads on Gold Kist IWT facilities.
1400
I300
1200
I100
1000
I 900 n 0 8 0 0
z 700 3 o 600
500
I- 400 a 300
-J LL
U W
W & 200
O I
a 3 100
130,000 BIRD DAY 104 M.G.D. IOOX CONDENSER
1 2 3 4 5 6 7 8 9 1 0 1 1 1 2 1 2 3 4 5 6 7 8 9 1 0 1 1
CLEAN UP - I - I ST PROCESSING - I ~ 2ND PROCESSING - I .
SHIFT SHIFT SHIFT 1 - I -
A.M. .+, P.M.
2 .o
1.75
1.50
1.25 z i z
1.0 3 0 -I LL
0.75 W I-
0.50 I W I- cn
0.25 I
0
3 0 -I LL
oc W I-
I W I- cn a 3
Figure 24. Future maximum daily hydraulic loads on Gold Kist IWT facilities.
48 a U.S . GOVERNMENT PRINTING OFFICE : 1 9 7 3 0 - 527-778