wastewater collection system master plan€¦ · wastewater master plan update wastewater...
TRANSCRIPT
CITY OF CLOVIS
WASTEWATER MASTER PLAN UPDATE
WASTEWATER COLLECTION SYSTEM
Blair, Church & Flynn
CITY OF CLOVIS, CALIFORNIA
WASTEWATER MASTER PLAN UPDATEPHASE 3
WASTEWATER COLLECTION SYSTEMMASTER PLAN
DRAFT FINAL REPORTAPRIL 5, 2017
Prepared Under the Direction of:
Mr. Michael J. Harrison, PE, RLSCity EngineerCity of Clovis
Prepared by:
Blair, Church & Flynn Consulting Engineers451 Clovis Avenue, Suite 200
Clovis, CA 93612(559) 326-1400
www.bcf-engr.com
WASTEWATER MASTER PLAN UPDATE
WASTEWATER COLLECTION SYSTEM
Wastewater Master Plan Update, Phase 3
i2140139-report-3.docx
TABLE OF CONTENTS
SECTION 1. EXECUTIVE SUMMARY ............................................................. 1-1
1.1 GENERAL .......................................................................................... 1-11.2 SERVICE AREAS ................................................................................ 1-11.3 WASTEWATER FLOW PROJECTIONS AND CAPACITIES .......................... 1-31.4 COLLECTION SYSTEM ANALYSIS AND DESIGN ..................................... 1-61.5 MASTER PLAN PLATS ........................................................................ 1-61.6 REGIONAL TRUNK SEWER SYSTEM ISSUES .......................................... 1-71.7 FLOW METERING OF CLOVIS TRUNK SEWERS ....................................... 1-71.8 MAJOR ELEMENTS OF CLOVIS’
WASTEWATER SYSTEM INFRASTRUCTURE .......................................... 1-7
SECTION 2. BACKGROUND ......................................................................... 2-1
2.1 GENERAL .......................................................................................... 2-12.2 PHASES OF THE WASTEWATER MASTER PLAN .................................... 2-1
SECTION 3. BASE MAPS ............................................................................ 3-1
3.1 GENERAL .......................................................................................... 3-13.2 BASE MAP AUGMENTATION ............................................................... 3-1
SECTION 4. DEVELOPMENT OF WASTEWATER FLOW PROJECTIONS .............. 4-1
4.1 GENERAL .......................................................................................... 4-14.2 MAJOR SERVICE AREAS ..................................................................... 4-14.3 NODES AND ASSOCIATED TRIBUTARY AREAS ...................................... 4-44.4 SUBAREAS OF DIFFERING PLANNED LAND USE ..................................... 4-74.5 PLATS DEPICTING FLOW GENERATION PARAMETERS ............................ 4-74.6 FLOW GENERATION COMPUTER MODELING SOFTWARE ........................ 4-74.7 AVERAGE DAY ANNUAL FLOW BASIS
FOR FLOW GENERATION PROJECTIONS ............................................... 4-84.8 PLANNED LAND USE CHARACTERISTICS .............................................. 4-94.9 DEVELOPMENT OF WASTEWATER FLOW GENERATION RATES ............. 4-10
4.9.1 HYDRAULIC MODEL CALIBRATION FOR EXISTING CONDITIONS ...... 4-104.9.2 WASTEWATER FLOW GENERATION RATES ................................... 4-11
SECTION 5. SEWER PIPELINE ANALYSIS AND DESIGN ................................... 5-1
5.1 GENERAL .......................................................................................... 5-15.2 CRITERIA FOR PIPELINE ANALYSIS AND DESIGN ................................... 5-1
5.2.1 ROUGHNESS COEFFICIENT ............................................................ 5-15.2.2 MAXIMUM DEPTH OF FLOW .......................................................... 5-15.2.3 PIPELINE SLOPE ........................................................................... 5-15.2.4 PIPELINE DEPTH ........................................................................... 5-2
5.3 PIPELINE ANALYSIS ............................................................................ 5-2
SECTION 6. WASTEWATER FLOW SUMMARIES ............................................ 6-1
6.1 GENERAL .......................................................................................... 6-16.2 FLOW SUMMARIES ............................................................................ 6-1
Wastewater Master Plan Update, Phase 3
ii2140139-report-3.docx
SECTION 7. REGIONAL SYSTEM TRUNK SEWER ISSUES ................................ 7-1
7.1 GENERAL .......................................................................................... 7-17.2 FOWLER AVENUE TRUNK SEWER AND NORTH AVENUE TRUNK SEWER ... 7-17.3 LEONARD AVENUE TRUNK SEWER ....................................................... 7-4
SECTION 8. FLOW METERING OF CLOVIS TRUNK SEWERS ............................. 8-1
8.1 GENERAL .......................................................................................... 8-18.2 TRUNK SEWER FLOW METERS ............................................................ 8-18.3 FLOW METERING DATA OVER TIME ..................................................... 8-1
SECTION 9. HYDRAULIC MODELING RESULTS AND CAPITALIMPROVEMENT PROJECT RECOMMENDATIONS .......................... 9-1
9.1 GENERAL .......................................................................................... 9-19.2 HYDRAULIC MODELING ...................................................................... 9-19.3 SERVICE AREA WASTEWATER FLOWS ................................................. 9-29.4 CAPITAL IMPROVEMENT PROJECT RECOMMENDATIONS ....................... 9-39.5 EXISTING MAJOR PUMP STATIONS AND FORCE MAINS ......................... 9-4
9.5.1 PUMP STATION E ......................................................................... 9-49.5.2 PUMP STATION B ........................................................................ 9-5
9.6 REHABILITATION AND REPAIR RECOMMENDATIONS ............................. 9-5
LIST OF FIGURES
FIGURE 1-1 WASTEWATER SERVICE AREAS .................................................... 1-2FIGURE 1-2 REGIONAL PERSPECTIVE .............................................................. 1-4FIGURE 1-3 MAJOR CLOVIS WASTEWATER INFRASTRUCTURE .......................... 1-8FIGURE 4-1 WASTEWATER SERVICE AREAS .................................................... 4-2FIGURE 4-2 MODELING NODES ....................................................................... 4-5FIGURE 4-3 TRIBUTARY BOUNDARIES FOR MODELING NODES ........................... 4-6FIGURE 4-4 DIURNAL CURVES ...................................................................... 4-12FIGURE 5-1 MODELING SEWERS, NODES AND TRIBUTARY BOUNDARIES ............ 5-3FIGURE 7-1 REGIONAL SYSTEM FACILITIES ..................................................... 7-2FIGURE 7-2 LEONARD AVENUE CONNECTOR SEWER ........................................ 7-5FIGURE 8-1 CLOVIS ANNUAL AVERAGE METERED FLOW .................................. 8-3
LIST OF TABLES
TABLE 1-1 MAJOR CLOVIS SERVICE AREAS .................................................... 1-3TABLE 1-2 FLOW AND TREATMENT CAPACITY SUMMARY................................ 1-5TABLE 4-1 MAJOR SERVICE AREA IDENTIFIERS ............................................... 4-4TABLE 4-2 RESIDENTIAL LAND USE DENSITIES ................................................ 4-9TABLE 4-3 MIXED USE PROJECTED USE PROFILE ........................................... 4-10TABLE 4-4 DESIGN WASTEWATER FLOW GENERATION RATES ........................ 4-13TABLE 5-1 DESIGN PIPELINE SLOPE ................................................................ 5-2TABLE 6-1 FLOW AND CAPACITY SUMMARY .................................................. 6-1TABLE 6-2 EXPLANATION OF CAPACITY BALANCE .......................................... 6-2
Wastewater Master Plan Update, Phase 3
iii2140139-report-3.docx
TABLE 7-1 CAPACITY SUMMARY FOWLER TRUNK SEWER /NORTH AVENUE TRUNK SEWER ..................................................... 7-3
TABLE 8-1 CLOVIS TRUNK SEWER FLOW METERS ............................................ 8-1TABLE 8-2 CLOVIS AVERAGE ANNUAL METERED FLOW AND POPULATION ........ 8-2TABLE 9-1 REHABILITATION AND REPAIR RECOMMENDATIONS......................... 9-6
LIST OF APPENDICES
APPENDIX A: WASTEWATER MASTER PLAN PLATSAPPENDIX B: CAPITAL IMPROVEMENT PROJECT EXHIBITSAPPENDIX C: CAPITAL IMPROVEMENT PROJECT LIST
AND IMPLEMENTATION SCHEDULEAPPENDIX D: CAPITAL IMPROVEMENT PROJECT COST ESTIMATES
FOR WASTEWATER CONVEYANCE PROJECTSAPPENDIX E: SEWERS INCLUDED IN HYDRAULIC MODELAPPENDIX F: REHABILITATION / REPAIR PROJECTS
AND COST ESTIMATES

Wastewater Master Plan Update, Phase 3
1-12140139-report-3.docx
SECTION 1. EXECUTIVE SUMMARY
1.1 GENERAL
The Wastewater Master Plan Update, Phase 3, (2017 Master Plan) is the latest phaseof an effort begun in 1995 to update the City’s Wastewater Master Plan. Thepreceding phase, referred to as the Wastewater Master Plan Update, Phase 2, (2008Master Plan) was documented in a final report dated June 30, 2008. The 2008 MasterPlan addressed planned urban growth in the context of the 1993 Clovis General Plan.Wastewater flow generation and sewer flow calculations for the Phase 2 Update weredone using a spreadsheet-based hydraulic model. The Wastewater Master Plan Update,Phase 3 addresses planned urban growth in the context of the 2014 Clovis GeneralPlan. Wastewater flow generation and sewer flow calculations for the Master PlanPhase 3 Update were done using a Geographic Information System (GIS) basedhydraulic modeling software package. This report documents the Phase 3 Updateefforts.
Further Wastewater Master Plan Update efforts will be necessary in the future, inresponse to ongoing community planning and development activity, to the extent thatthose activities may result in planning and development activity that differs from the2014 Clovis General Plan, and in response to future general plan updates.
The wastewater master plan update process consisted generally of developing designcriteria, defining wastewater service areas, developing wastewater flow projections,analyzing and designing collection system pipelines, and summarizing results.
1.2 SERVICE AREAS
The Clovis Wastewater Master Plan area contains seven major service areasencompassing a planning area of just over 27,120 acres (see Figure 1-1). Under the2017 Master Plan, the core of the city is planned to discharge to regional trunk sewersand on to the Fresno-Clovis Regional Wastewater Reclamation Facility (RWRF) insouthwest Fresno. By agreement with the City of Fresno, additional treatment capacitycan be purchased in the RWRF, as needed. The future growth areas of the city areplanned to discharge to the Clovis Sewage Treatment – Water Reuse Facility (ST/WRF)in southeast Clovis.

Wastewater Master Plan Update, Phase 3
1-22140139-report-3.docx
FIGURE 1-1 WASTEWATER SERVICE AREAS

Wastewater Master Plan Update, Phase 3
1-32140139-report-3.docx
The Clovis service areas are identified in Table 1-1, together with the planneddisposition of their wastewater flows.
TABLE 1-1MAJOR CLOVIS SERVICE AREAS
SERVICE AREA DISCHARGES TO
HerndonRegional Herndon Trunk Sewer system leading to RegionalWastewater Treatment Plant
FowlerRegional Fowler Trunk Sewer and North Avenue Trunk Sewerleading to Regional Wastewater Treatment Plant
SierraRegional sewer system leading to Regional WastewaterTreatment Plant
PeachRegional Chestnut Trunk Sewer and North Avenue TrunkSewer leading to Regional Wastewater Treatment Plant
NorthwestClovis major sewers leading to Clovis Sewage Treatment –Water Reuse Facility
NortheastClovis major sewers leading to Clovis Sewage Treatment –Water Reuse Facility
SoutheastClovis major sewers leading to Clovis Sewage Treatment –Water Reuse Facility
Figure 1-2 depicts the Clovis service areas in a regional perspective, with the mainexisting regional trunk sewers leading to the RWRF graphically indicated.
1.3 WASTEWATER FLOW PROJECTIONS AND CAPACITIES
Wastewater flow projections, which are necessary to analyze the existing sewercollection system and plan new facilities to service planned growth, were determinedfor all areas within the boundaries of the Clovis Sphere of Influence, with the generalexceptions of those areas planned for rural residential development or agricultural uses.Wastewater flow generation rates for various land uses were initially carried forwardbased on the rates employed for the 2008 Master Plan. The rates were then adjustedthrough a calibration effort that was based on wastewater flow meter data and actualresidential development densities for areas of existing residential development.
Planned land uses were determined by an examination of the 2014 Clovis General Plan,existing zoning, and existing development. For each service area discharging to theregional trunk sewer system, calculated flow from properties currently developed wascalibrated to reasonably correspond with metered flow at the trunk sewer dischargepoint. Calibration efforts considered overall average daily wastewater flow generation,as well as daily, or diurnal, patterns of wastewater flow variation.
Table 1-2 indicates the projected flow, currently acquired capacity and plannedcapacity for each major service area. The first phase of the Clovis ST/WRF, with Phase1 average flow capacity of 2.80 million gallons per day (MGD), is included in thecalculation of “Currently Acquired Capacity” along with previously acquired capacity inthe regional system.

Wastewater Master Plan Update, Phase 3
1-42140139-report-3.docx
Figure 1-2FIGURE 1-2 REGIONAL PERSPECTIVE

Wastewater Master Plan Update, Phase 3
1-52140139-report-3.docx
TABLE 1-2FLOW AND TREATMENT CAPACITY SUMMARY
(ALL FLOW AND CAPACITY VALUES ARE AVERAGE DAILY FLOW)(2)SEWERSERVICE
AREA
PROJECTED FLOW TREATMENT CAPACITYDEVELOPED
FLOW
(MGD)
UN-DEVELOPED
FLOW(MGD)
TOTALFLOW
(MGD)
CURRENTLYACQUIREDAMOUNT
(MGD)
TOTALPLANNEDAMOUNT
(MGD)HERNDON 1.821 0.430 2.251 2.800 2.800FOWLER 2.812 1.166 3.978 3.000 (1) 3.881SIERRA 0.195 0.020 0.215 0.500 0.500PEACH 1.791 0.132 1.923 3.000 3.000NW 0.089 2.791 2.880
2.800 8.400NE 0.000 5.109 5.109SE 0.310 1.915 2.225TOTALS 7.018 11.563 18.581 12.100 18.581
1. Flow in excess of 8.400 MGD from the NW, NE and SE Service Areas is planned to beredirected to the Fowler Trunk Sewer.
2. There is also a minor service area, the Clovis/Dakota Service Area, that is part of a flowtransfer agreement with the City of Fresno.
The Northwest, Northeast, and Southeast Service Areas are projected to exceed thebuild-out capacity of the Clovis ST/WRF, based upon the 2014 General Plan land uses.The 2017 Master Plan proposes diversion of a portion of the flow from these serviceareas to the Fowler Service Area. The Fowler Service Area is capable of acquiringadditional capacity in the regional system for both its originally planned service areaand the diversion areas. Such additional capacity, available by prior agreement withFresno, is sufficient based upon current Clovis land use planning per the 2014 GeneralPlan.
The additional capacity required to make up the difference between the City of Clovis’currently acquired capacity and total planned capacity is as follows:
Additional treatment capacity to beacquired in regional system 0.881 MGD
Additional treatment capacity to beacquired in future phases ofconstruction of the Clovis ST/WRF 5.600 MGD
Total additional treatment capacity 6.481 MGD
Additional treatment capacity at the RWRF can be acquired in increments of about 1.0MGD as needed by Clovis.
Additionally, Clovis has agreed to participate in the cost of construction of up to 3MGD of additional capacity in the North Avenue Trunk Sewer, which receives flowfrom the Fowler Trunk Sewer and discharges into the RWRF. Agreement provisionsspecify that the Clovis share of related project costs shall reflect Clovis’ proportionalshare of flow capacity in any new capacity enhancing project.

Wastewater Master Plan Update, Phase 3
1-62140139-report-3.docx
Clovis currently owns capacity in all other regional trunk sewers for Clovis’ projectedbuildout flow per the Master Plan.
1.4 COLLECTION SYSTEM ANALYSIS AND DESIGN
Criteria for pipeline analysis and design were established, including hydraulic elementsand pipeline depth limitations. All existing sewers 10-inches and larger in diameterwere analyzed, together with some 8-inch diameter sewers where necessary to extendwastewater service to all tributary areas. All proposed new major sewers were alsoanalyzed and sized.
A hydraulic modeling computer software package was utilized to analyze the hydraulicsof individual segments of the sewers, utilizing the established hydraulic criteria. Theprevious method of analyzing the wastewater system for the 2008 Master Plan wasMicrosoft Excel spreadsheet based system. The software used for the 2017 MasterPlan is H2OMAP Sewer Suite 10.5, Update No. 10, by Innovyze, which has manyfeatures not available using the spreadsheet-based model, including the ability toincorporate geographic information system (GIS) data. The Innovyze software wasutilized to analyze flows throughout the current and proposed service areas. Flowswere generated at predetermined loading manholes, from adjacent land use areas, usingthe loading parameters specific to each land use.
1.5 MASTER PLAN PLATS
The basic graphic element of the Master Plan consists of a set of Master Plan plats.These plats extend over the entire area of the 2014 Clovis General Plan designated forurban development. The Master Plan plats include layers from the Clovis GeographicInformation System (GIS), and were created on the identical coordinate system.
The plats were developed in two distinct visibility formats, as follows:
· Flow Generation Parameters. These sheets depict service area boundaries, andwithin each sub-area boundary, planned land use, area in acres, and estimatesof percentage developed. These drawings were rectified to be consistent with,and form a supporting background for, the Wastewater Collection SystemFacility Element plats.
· System Facility Elements. These sheets depict the physical elements of thewastewater collection system, including: all existing sewers and manholes; allplanned sewers that are necessary to extend sewer service to the location ofthe node from which sewer service is provided for every sewer service sub-area;analysis nodes; service area boundaries and other information.
The plats are produced in a 24-inch high by 36-inch wide sheet format for ease ofhandling. The scale of the mapping is 1-inch equals 600 feet, which provides acompromise between readability and number of sheets to handle.

Wastewater Master Plan Update, Phase 3
1-72140139-report-3.docx
Reduced copies of the Master Plan plats are appended to this report as Appendix A,and full size copies accompany the report as a separate package.
1.6 REGIONAL TRUNK SEWER SYSTEM ISSUES
The regional Fowler Avenue Trunk Sewer and downstream interconnected NorthAvenue Trunk Sewer, which carry flow discharging from the Fowler Service Area, haveoutstanding issues yet to be finally resolved with the City of Fresno. Complicatingthese issues is another recently planned regional trunk sewer, the Leonard TrunkSewer, which may also discharge to the regional North Avenue Trunk Sewer.
Section 7 examines these issues, including the effects of the 2002 joint powersagreement between the Cities of Clovis and Fresno “For Temporary Exchange of SewerCapacity in the North Avenue and Fowler Avenue Trunk Sewer Mains”. Thisagreement also affects Clovis’ master planned connection to the regional Leonard TrunkSewer, which would provide the benefits of backup capability, operational alternativesand redundancy to a major portion of Clovis’ wastewater system.
1.7 FLOW METERING OF CLOVIS TRUNK SEWERS
The Herndon, Peach, Sierra, and Fowler trunk sewers are metered by Fresno wherethey enter the regional system. The metering data over the past twenty one yearsindicates that the sum total flow of the four trunk sewers has not increased in directproportion to the population increase in Clovis. Other flow meter data has beenobtained from points within the Clovis wastewater collection system, and that dataalso supports the flow quantity trends indicated by the meters at the discharge pointsto the regional system. This is believed to be the result of an overall trend towardwater conservation by Clovis users, together with the result of the utilization of waterconserving fixtures in new construction and remodels. Other potential reasons mayinclude changes in average household size over time.
Wastewater flow generation rates historically utilized for Clovis wastewater masterplanning efforts were initially established in 1995. However, actual wastewater flowgeneration rates have decreased significantly since then, based on flow meter data andthe apparent variation from population growth.
Wastewater flow generation rate calibration was done to adjust wastewater flowgeneration rates as indicated by flow meter data. Reasons and methods for adjustmentof wastewater flow generation rates for the master plan update are outlined in Section8.
1.8 CAPITAL IMPROVEMENT PROJECT RECOMMENDATIO
Although there are minor exceptions, major elements of the Wastewater Master Plangenerally are considered to be existing trunk sewers 24 inches in diameter and larger,planned trunk sewers 15 inches in diameter and larger, existing pump stations andforce mains that are necessary for the diversion of flow between service areas, and allplanned pump stations and force mains. These are depicted on Figure 1-3.

Wastewater Master Plan Update, Phase 3
1-82140139-report-3.docx
FIGURE 1-4 MAJOR CLOVIS WASTEWATER INFRASTRUCTURE
Wastewater Master Plan Update, Phase 3
1-92140139-report-3.docx
Section 9 includes discussion of these facilities, including the specific planned functionof major existing pump stations, and all planned pump stations and force mains.
Although much of the major Clovis wastewater infrastructure is in place, a number ofkey elements remain to be constructed in advance of new development, particularly inthe outlying future growth areas. Section 9 provides recommendations and costestimates for related Capital Improvement Projects and Rehabilitation and RepairProjects.
Wastewater Master Plan Update, Phase 3
2-12140139-report-3.docx
SECTION 2. BACKGROUND
2.1 GENERAL
The Wastewater Master Plan Update, Phase 3, (2017 Master Plan) is the latest phaseof an effort begun in 1995 to update the City’s Wastewater Master Plan. Thepreceding phase, referred to as the Wastewater Master Plan Update, Phase 2, (2008Master Plan) was documented in a final report dated June 30, 2008. The 2008 MasterPlan addressed planned urban growth in the context of the 1993 Clovis General Plan.Wastewater flow generation and sewer flow calculations for the Phase 2 Update weredone using a spreadsheet-based hydraulic model. The Wastewater Master Plan Update,Phase 3 addresses planned urban growth in the context of the 2014 Clovis GeneralPlan. Wastewater flow generation and sewer flow calculations for the Master PlanPhase 3 Update were done using a Geographic Information System (GIS) basedhydraulic modeling software package. This report documents the Phase 3 Updateefforts.
The wastewater master plan update process consisted generally of developing designcriteria, defining wastewater service areas, developing wastewater flow projections,analyzing and designing collection system pipelines, and summarizing results.
The Clovis Wastewater Master Plan Update has been a process designed to provide acourse of action for the City of Clovis with respect to wastewater service needs, inconformance with the 2014 Clovis General Plan and its planning horizon.
2.2 PHASES OF THE WASTEWATER MASTER PLAN
Phases of the Wastewater Master Plan efforts have included the following:
· Phase 1-APresent Wastewater Flows, Projected Flows and Trunk SewerCapacities for Existing Trunk Sewer Service AreasDate of Report: June, 1995
· Phase 1-BWastewater Master Plan UpdateDate of Report: November, 1996
· Phase 2Wastewater Collection System Master PlanDate of Report: June 30, 2008
· Phase 3Wastewater Master Plan Update, Phase 3Date of Report: March 31, 2017
Phase 1-A concentrated on analyzing wastewater flow generation from various landuses within Clovis, together with preliminarily assessing then-current wastewater
Wastewater Master Plan Update, Phase 3
2-22140139-report-3.docx
flows, existing trunk sewer capacities, projected buildout flow from existing trunksewer service areas, and the general relationship of the quantity of flow to begenerated by future growth areas to existing trunk sewer capacity.
Phase 1-B analyzed, evaluated and presented conceptual alternatives for wastewaterservice to Clovis, for the entire 1993 Clovis General Plan area. This included optionsfor acquisition of new wastewater system treatment capacity, including potential Clovissatellite wastewater treatment facilities with associated water reclamation elements.Wastewater collection systems were incorporated into the Phase 1-B study only to theextent of concept level analysis of the various alternatives presented.
Phase 2 provided a more detailed analysis of existing and proposed elements of theClovis wastewater collection system. It provided a wastewater collection systemmaster plan for all areas which were proposed for urban growth in the 1993 ClovisGeneral Plan. The collection system master plan presented was based upon ModifiedAlternate 5 of the Phase 1-B study. The plan was designed to provide for the potentialof interim temporary service to some areas where ultimate service may be infeasible fora number of years.
Phase 3 provides an analysis of existing and proposed elements of the Cloviswastewater collection system for the 2014 General Plan. It provides a collectionsystem master plan for all areas which are proposed for urbanization in the 2014 ClovisGeneral Plan. The plan is designed to provide sewer service planning in conformancewith the 2014 Clovis General Plan and its planning horizon.
Further Wastewater Master Plan Update efforts will be necessary in the future, inresponse to ongoing community planning and development activity, to the extent thatthose activities may result in planning and development activity that differs from the2014 Clovis General Plan, and in response to future general plan updates.
Wastewater Master Plan Update, Phase 3
3-12140139-report-3.docx
SECTION 3. BASE MAPS
3.1 GENERAL
A series of AutoCAD base maps produced for the 2008 Master Plan were updated toextend over the entire area of the 2014 Clovis General Plan designated for urbandevelopment. Base information for the master digital model was imported from theClovis Geographic Information System (GIS) into AutoCAD. Imported layers includedthose for parcel, street, sewer main, sewer manhole, and general plan elements of theGIS.
The base maps, or plats, are at a scale of 1-inch equals 600 feet, which provide acompromise between readability and number of sheets to handle. A cover sheet indexmap was created from the same digital model, displayed at a scale of one-inch equals2,000 feet.
3.2 BASE MAP AUGMENTATION
The base mapping created by the Clovis GIS data was augmented to create useful platsfor the master planning process.
The Fresno County GIS was utilized to provide parcel information in certain areasoutside the limits of the Clovis GIS. The County GIS information was graphicallyadjusted, by rotating and stretching, to fit the Clovis GIS at the interface between thetwo mapping areas. The graphically rectified County information is not considered beat the level of accuracy of the Clovis GIS data, and only serves as a guide toparcelization outside the Clovis GIS.
For all existing sewers, the pipeline diameter and direction of flow were extracted fromthe GIS. This information was reflected on the base maps by flow direction arrow andtext. This allows the use and interpretation of the maps in most cases withoutaccessing the computer modeling software.
Text was added to designate major street names and major landmarks, such asfreeways and schools. Text size was selected to be readable on both the plat mapsand the cover sheet index map.
Information from Fresno Metropolitan Flood Control District was used to developground contours using topographic mapping and future design gutter grades. Contourlines on existing hard copy topographic maps were digitized and rectified into the basemapping, allowing approximations of depth to be made for the design of proposedsewers.
Wastewater Master Plan Update, Phase 3
4-12140139-report-3.docx
SECTION 4. DEVELOPMENT OF WASTEWATER FLOW PROJECTIONS
4.1 GENERAL
Wastewater flow projections, which are necessary to analyze the existing sewercollection system and plan new facilities to service planned growth, were determinedfor all areas of the 2014 Clovis General Plan designated for urban development.
Major wastewater collection system service area boundaries were established anddocumented. Within each major service area, nodes were established at key locationson existing and proposed sewers, and boundaries of areas tributary to each node weredetermined. Within each node tributary area, boundaries of differing planned land useswere determined. The percentage of development within each subarea of differingplanned land use was estimated. The information so developed was documented andplotted on plats.
Criteria for flow generation projections were developed, utilizing unit wastewater flowgeneration rates for the basic major land use categories that were modified from the1995 Phase 1-A study. Single family residential units flow generation rates wererevised in this update based upon residential flow monitoring investigations and build-out flow projections versus population projections.
4.2 MAJOR SERVICE AREAS
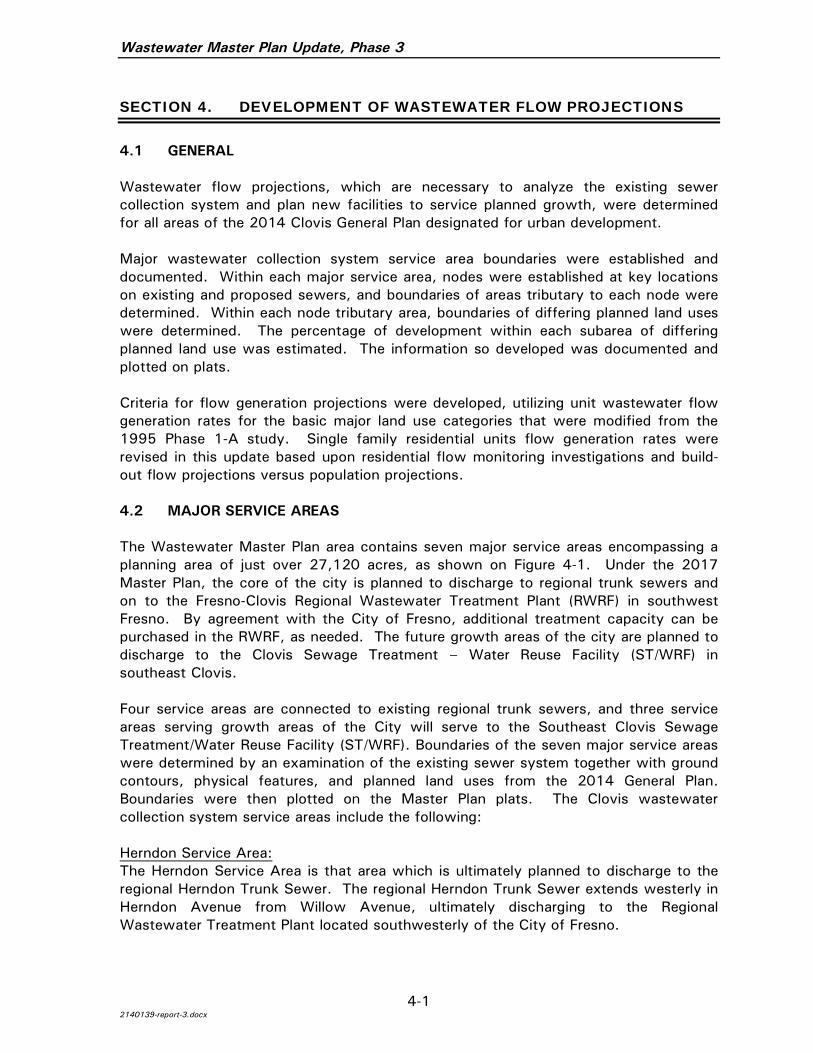
The Wastewater Master Plan area contains seven major service areas encompassing aplanning area of just over 27,120 acres, as shown on Figure 4-1. Under the 2017Master Plan, the core of the city is planned to discharge to regional trunk sewers andon to the Fresno-Clovis Regional Wastewater Treatment Plant (RWRF) in southwestFresno. By agreement with the City of Fresno, additional treatment capacity can bepurchased in the RWRF, as needed. The future growth areas of the city are planned todischarge to the Clovis Sewage Treatment – Water Reuse Facility (ST/WRF) insoutheast Clovis.
Four service areas are connected to existing regional trunk sewers, and three serviceareas serving growth areas of the City will serve to the Southeast Clovis SewageTreatment/Water Reuse Facility (ST/WRF). Boundaries of the seven major service areaswere determined by an examination of the existing sewer system together with groundcontours, physical features, and planned land uses from the 2014 General Plan.Boundaries were then plotted on the Master Plan plats. The Clovis wastewatercollection system service areas include the following:
Herndon Service Area:The Herndon Service Area is that area which is ultimately planned to discharge to theregional Herndon Trunk Sewer. The regional Herndon Trunk Sewer extends westerly inHerndon Avenue from Willow Avenue, ultimately discharging to the RegionalWastewater Treatment Plant located southwesterly of the City of Fresno.

Wastewater Master Plan Update, Phase 3
4-22140139-report-3.docx
FIGURE 4-1 WASTEWATER SERVICE AREAS

Wastewater Master Plan Update, Phase 3
4-32140139-report-3.docx
Fowler Service Area:The Fowler Service Area is that area which is ultimately planned to discharge to theregional Fowler Trunk Sewer. The regional Fowler Trunk Sewer extends southerly inFowler Avenue from an existing monitoring station located between Sussex and GriffithAvenue (about ¼ mile south of Ashlan Avenue), ultimately discharging to the RegionalWastewater Treatment Plant located southwesterly of the City of Fresno.
Sierra Service Area:The Sierra Service Area is that area which is ultimately planned to discharge to theregional Sierra Trunk Sewer. The regional Sierra Trunk Sewer extends westerly inSierra Avenue from Willow Avenue, ultimately discharging to the Regional WastewaterTreatment Plant located southwesterly of the City of Fresno.
Peach Service Area:The Peach Service Area is that area which is ultimately planned to discharge to theregional Peach Trunk Sewer. The regional Peach Trunk Sewer extends westerly inDakota Avenue from Peach Avenue, ultimately discharging to the Regional WastewaterTreatment Plant located southwesterly of the City of Fresno.
Northwest Service Area:The Northwest Service Area is bounded generally by Willow Avenue on the west,Copper Avenue on the north, Sunnyside Avenue alignment on the east, and by thenortherly boundary of the Herndon Service Area on the south. There is also included inthe master plan for the Northwest Service Area a trapezoidal shaped portion of theplanned Northeast Urban Village lying north of Shepherd Avenue and westerly of theBig Dry Creek Reservoir. Under the Master Plan, wastewater from the NorthwestService Area will flow by gravity to a proposed pump station near the intersection ofWillow and Shepherd Avenues, which will discharge to a force main leading east inShepherd Avenue to the DeWolf Avenue Alignment. At this point flow will enter agravity system discharging south into the Southeast Service Area system andultimately to the Clovis Sewage Treatment/Water Reuse Facility (ST/WRF) located onthe north side of Ashlan Avenue, between Thompson and McCall Avenues.
Southeast Service Area:The Southeast Service Area is bounded generally by the current Clovis Sphere ofInfluence line on the north, east, and south, and by the easterly boundary of the FowlerService Area on the west. Under the Master Plan, wastewater flow from the SoutheastService Area, together with flow from the Northwest Service Area and NortheastService Area, will discharge to the Clovis ST/WRF.
Northeast Service Area:The Northeast Service Area is bounded generally by Herndon Avenue on the south,Copper Avenue on the north, Thompson Avenue and SR-168 on the west, and theFriant-Kern Canal and approximate Bethel Avenue Alignment on the east. Under theMaster Plan, flow from this service area will discharge west and then ultimately southto the Clovis ST/WRF.
Wastewater Master Plan Update, Phase 3
4-42140139-report-3.docx
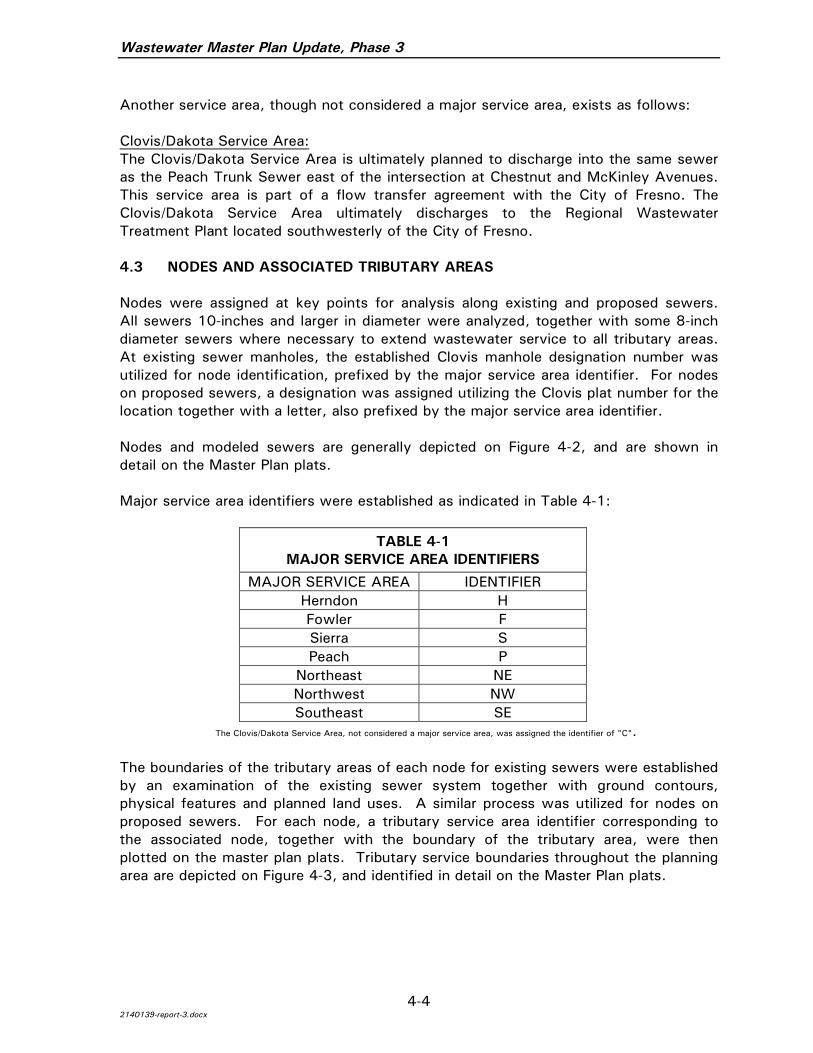
Another service area, though not considered a major service area, exists as follows:
Clovis/Dakota Service Area:The Clovis/Dakota Service Area is ultimately planned to discharge into the same seweras the Peach Trunk Sewer east of the intersection at Chestnut and McKinley Avenues.This service area is part of a flow transfer agreement with the City of Fresno. TheClovis/Dakota Service Area ultimately discharges to the Regional WastewaterTreatment Plant located southwesterly of the City of Fresno.
4.3 NODES AND ASSOCIATED TRIBUTARY AREAS
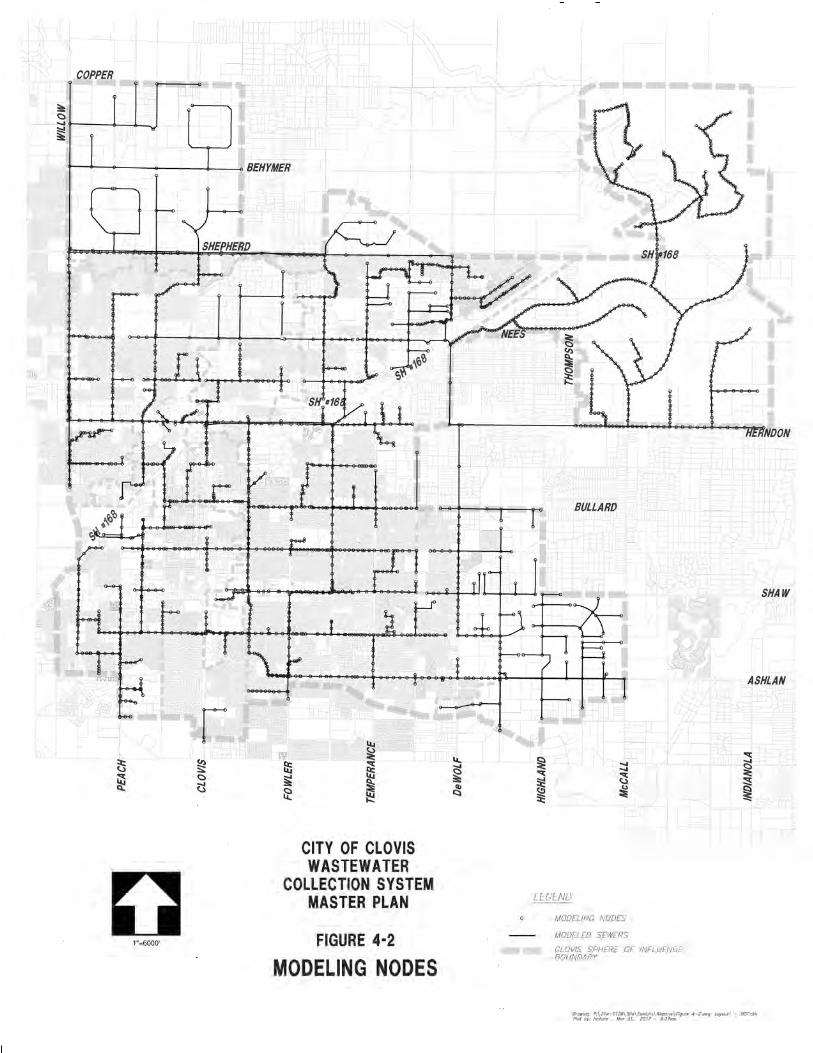
Nodes were assigned at key points for analysis along existing and proposed sewers.All sewers 10-inches and larger in diameter were analyzed, together with some 8-inchdiameter sewers where necessary to extend wastewater service to all tributary areas.At existing sewer manholes, the established Clovis manhole designation number wasutilized for node identification, prefixed by the major service area identifier. For nodeson proposed sewers, a designation was assigned utilizing the Clovis plat number for thelocation together with a letter, also prefixed by the major service area identifier.
Nodes and modeled sewers are generally depicted on Figure 4-2, and are shown indetail on the Master Plan plats.
Major service area identifiers were established as indicated in Table 4-1:
TABLE 4-1MAJOR SERVICE AREA IDENTIFIERS
MAJOR SERVICE AREA IDENTIFIERHerndon HFowler FSierra SPeach P
Northeast NENorthwest NWSoutheast SE
The Clovis/Dakota Service Area, not considered a major service area, was assigned the identifier of "C".
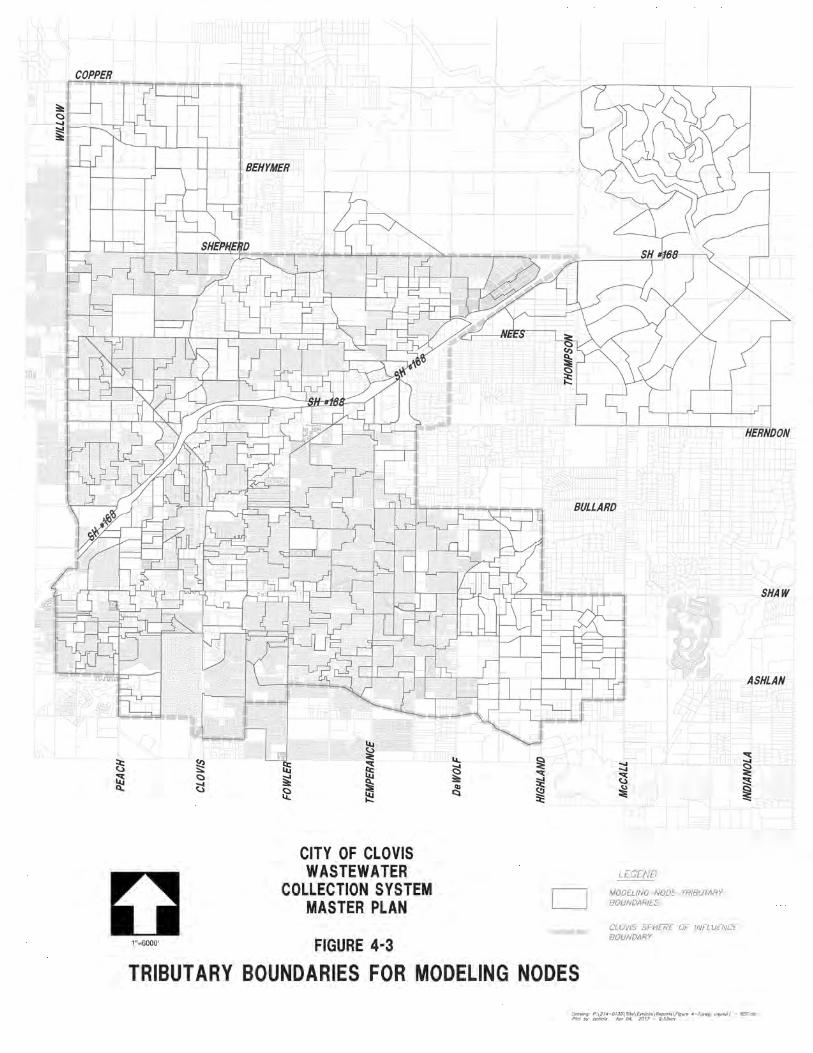
The boundaries of the tributary areas of each node for existing sewers were establishedby an examination of the existing sewer system together with ground contours,physical features and planned land uses. A similar process was utilized for nodes onproposed sewers. For each node, a tributary service area identifier corresponding tothe associated node, together with the boundary of the tributary area, were thenplotted on the master plan plats. Tributary service boundaries throughout the planningarea are depicted on Figure 4-3, and identified in detail on the Master Plan plats.
Wastewater Master Plan Update, Phase 3
4-52140139-report-3.docx
FIGURE 4-2 MODELING NODES
Wastewater Master Plan Update, Phase 3
4-62140139-report-3.docx
FIGURE 4-3FIGURE 4-3 TRIBUTARY BOUNDARIES FOR MODELING NODES
Wastewater Master Plan Update, Phase 3
4-72140139-report-3.docx
4.4 SUBAREAS OF DIFFERING PLANNED LAND USE
Within the boundary of each node’s tributary area, subareas were established for eachdiffering planned land use. For the purposes of estimating wastewater flow generation,planned land uses were determined by an examination of the 2014 Clovis General Plan,existing zoning, and existing development. The boundaries of differing land usesubareas so determined were plotted on a specific mapping layer for display and for usein hydraulic modeling.
The percentage of currently developed land (as opposed to undeveloped land) withinthe boundary of each subarea of differing planned land use was estimated andrecorded. This was accomplished by examination of aerial photography furnished byGoogle Earth images dated March 2015, augmented by visual field reconnaissance.
4.5 PLATS DEPICTING FLOW GENERATION PARAMETERS
Flow generation parameters including planned land use subarea boundaries, plannedland use, area in acres, and estimates of percentage developed, were plotted anddeveloped into a set of plats. The plats were rectified to be consistent with, and forma supporting background for, the Wastewater Master Plan System Facility Elementsplats.
4.6 FLOW GENERATION COMPUTER MODELING SOFTWARE
The software used for the hydraulic modeling of the City's wastewater collectionsystem for the 2017 Master Plan is H2OMAP Sewer Suite 10.5, Update No. 10(H2OMAP Sewer), a software product of the firm Innovyze. An evaluation of hydraulicmodeling software packages was documented in the July 23, 2014 technicalmemorandum "City of Clovis Wastewater Master Plan Update Phase 3, HydraulicModeling Software Evaluation". H2OMAP Sewer was recommended as the preferredhydraulic modeling platform, and the City has since selected and acquired H2OMAPSewer.
H2OMAP Sewer replaced the custom Microsoft® Excel spreadsheet model developed inthe Phase 2 Master Plan. The Phase 3 and Phase 2 models were run side by sidewhere feasible, to verify the general validity of results from the replacement software.
H20MAP Sewer utilizes the Manning and Hazen-Williams equations to calculate flow ingravity mains and force mains respectively. Sewer analysis for extended periodsimulations (EPS) is conducted by the modeling software using a simplified method ofthe Saint-Venant equations, along with the Muskingum-Cunge equation. The EPSsimulation utilizes diurnal curves that have been calibrated to reflect actual conditionsas represented by flow meter data for the Clovis wastewater collection system.
During sewer modeling activities, it was discovered that the Innovyze load allocatorwas not distributing wastewater loads properly. Innovyze was unable to develop asolution for the problem, but was able to provide a workaround using Microsoft Excel.The workaround performs the function of the load allocator and transfers the correct

Wastewater Master Plan Update, Phase 3
4-82140139-report-3.docx
loading values by copying a column in an Excel spreadsheet and pasting it into theInnovyze software input data. Innovyze has indicated that further efforts by their staffwill not be undertaken to produce a solution to this issue since a workaround isavailable, but that forthcoming software updates will correct the issue.
4.7 AVERAGE DAY ANNUAL FLOW BASIS FOR FLOW GENERATION PROJECTIONS
In the Phase 1-B Wastewater Master Plan Update of November, 1996, the followingparameters of wastewater flow were identified:
· Average Day Annual Flow. This is the average daily flow based on the calendaryear.
· Average Dry Weather Flow. This is the average flow occurring over the threeconsecutive lowest flow months of the year. The Average Dry Weather Flowfor Clovis typically occurs in April, May and June.
· Average Day Maximum Month Flow. This is the average daily flow occurringduring the maximum flow month of the year. The Average Day MaximumMonth Flow for Clovis has historically occurred during the month of Septemberduring the fruit processing season. The timing of this may change if operationsat fruit processing facilities change over time.
· Peak Hour Wet Weather Flow. This is the peak hour flow resulting from thedesign rainfall event. The Peak Hour Wet Weather Flow typically occurs duringthe wet weather period of December through March, and is ultimately limited bythe hydraulic capacity of the trunk sewer system.
All flow projections for the 2017 Master Plan reflect the Average Day Annual Flow,also referred to as the Average Daily Flow. This is used in the master plan designbecause it is most representative of the Clovis sewer system. Following are some ofthe factors which influence this:
· The average day maximum month flow is accounted for in the master plan,inasmuch as the calculations for flow projections for the Clovis system include ayear-round allocation for the major fruit processing facility.
· Calibration of current flow in the model for each major service area was basedupon selection of metered flow considering the higher value metered months forcomparison with projected flow, which largely compensates for the typicallyminimal inflow and infiltration (I&I) rates experienced in the Clovis wastewatercollection system.
· Groundwater levels in Clovis are well below sewer depths, so groundwaterinfiltration is not a design factor that was included.
Use of the Average Day Annual Flow for all average daily flow projections for the 2017Master Plan is expected to produce slightly conservative results that are reasonably
Wastewater Master Plan Update, Phase 3
4-92140139-report-3.docx
reflective of actual conditions in the collection system. Since actual wastewater flowgeneration rates appear to be declining somewhat over time, as the result ofimplementation of water conservation measures and the trend for use of modernreduced water use fixtures for new and remodeled construction, conservatism canprobably be expected to increase over time as actual wastewater flow generationcontinues to decrease.
4.8 PLANNED LAND USE CHARACTERISTICS
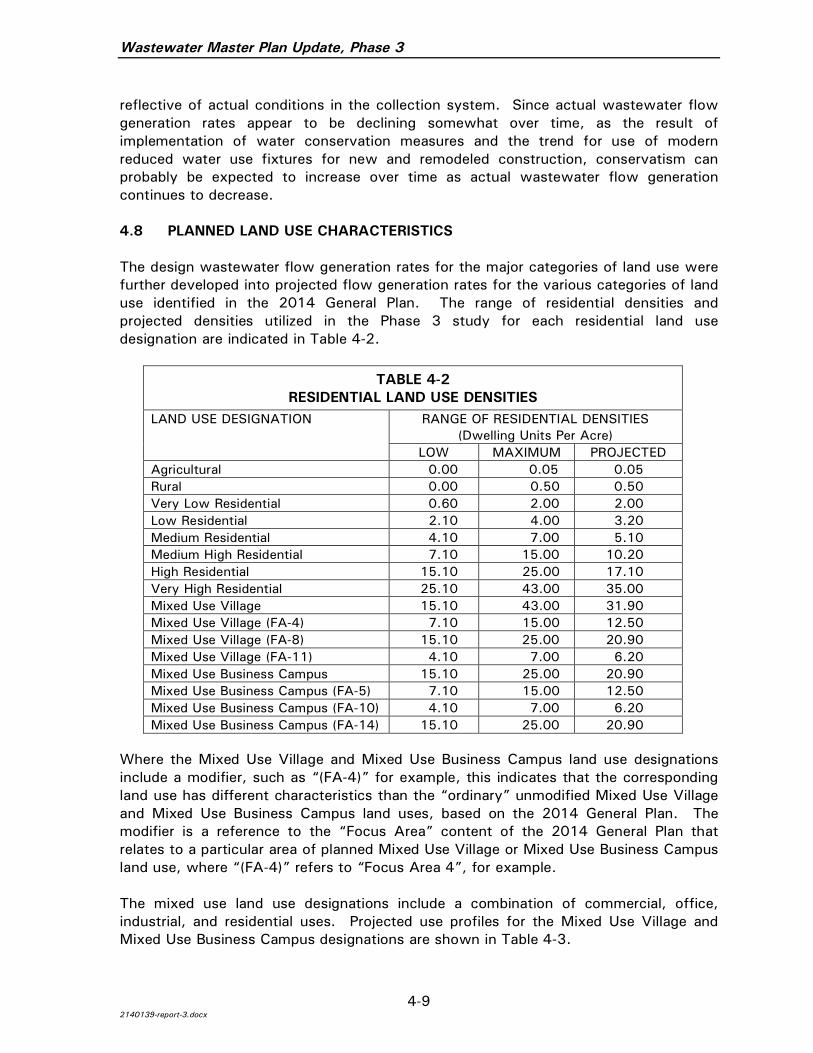
The design wastewater flow generation rates for the major categories of land use werefurther developed into projected flow generation rates for the various categories of landuse identified in the 2014 General Plan. The range of residential densities andprojected densities utilized in the Phase 3 study for each residential land usedesignation are indicated in Table 4-2.
TABLE 4-2RESIDENTIAL LAND USE DENSITIES
LAND USE DESIGNATION RANGE OF RESIDENTIAL DENSITIES(Dwelling Units Per Acre)
LOW MAXIMUM PROJECTEDAgricultural 0.00 0.05 0.05Rural 0.00 0.50 0.50Very Low Residential 0.60 2.00 2.00Low Residential 2.10 4.00 3.20Medium Residential 4.10 7.00 5.10Medium High Residential 7.10 15.00 10.20High Residential 15.10 25.00 17.10Very High Residential 25.10 43.00 35.00Mixed Use Village 15.10 43.00 31.90Mixed Use Village (FA-4) 7.10 15.00 12.50Mixed Use Village (FA-8) 15.10 25.00 20.90Mixed Use Village (FA-11) 4.10 7.00 6.20Mixed Use Business Campus 15.10 25.00 20.90Mixed Use Business Campus (FA-5) 7.10 15.00 12.50Mixed Use Business Campus (FA-10) 4.10 7.00 6.20Mixed Use Business Campus (FA-14) 15.10 25.00 20.90
Where the Mixed Use Village and Mixed Use Business Campus land use designationsinclude a modifier, such as “(FA-4)” for example, this indicates that the correspondingland use has different characteristics than the “ordinary” unmodified Mixed Use Villageand Mixed Use Business Campus land uses, based on the 2014 General Plan. Themodifier is a reference to the “Focus Area” content of the 2014 General Plan thatrelates to a particular area of planned Mixed Use Village or Mixed Use Business Campusland use, where “(FA-4)” refers to “Focus Area 4”, for example.
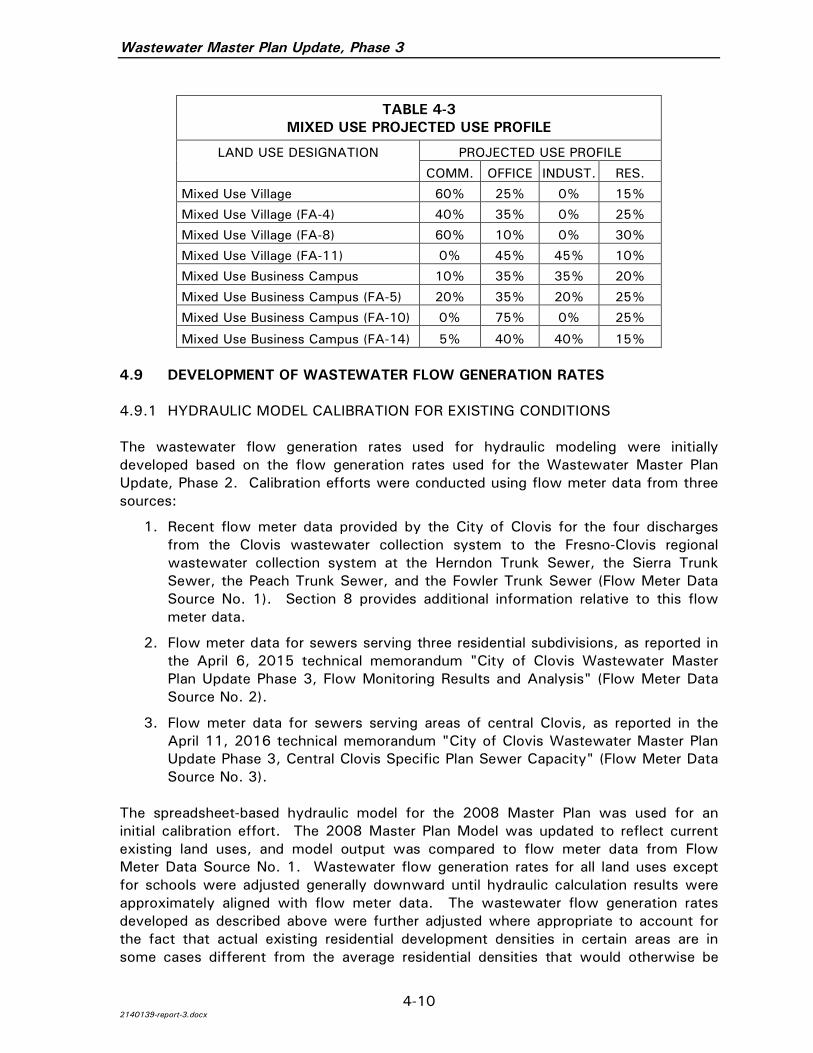
The mixed use land use designations include a combination of commercial, office,industrial, and residential uses. Projected use profiles for the Mixed Use Village andMixed Use Business Campus designations are shown in Table 4-3.
Wastewater Master Plan Update, Phase 3
4-102140139-report-3.docx
TABLE 4-3MIXED USE PROJECTED USE PROFILE
LAND USE DESIGNATION PROJECTED USE PROFILE
COMM. OFFICE INDUST. RES.
Mixed Use Village 60% 25% 0% 15%
Mixed Use Village (FA-4) 40% 35% 0% 25%
Mixed Use Village (FA-8) 60% 10% 0% 30%
Mixed Use Village (FA-11) 0% 45% 45% 10%
Mixed Use Business Campus 10% 35% 35% 20%
Mixed Use Business Campus (FA-5) 20% 35% 20% 25%
Mixed Use Business Campus (FA-10) 0% 75% 0% 25%
Mixed Use Business Campus (FA-14) 5% 40% 40% 15%
4.9 DEVELOPMENT OF WASTEWATER FLOW GENERATION RATES
4.9.1 HYDRAULIC MODEL CALIBRATION FOR EXISTING CONDITIONS
The wastewater flow generation rates used for hydraulic modeling were initiallydeveloped based on the flow generation rates used for the Wastewater Master PlanUpdate, Phase 2. Calibration efforts were conducted using flow meter data from threesources:
1. Recent flow meter data provided by the City of Clovis for the four dischargesfrom the Clovis wastewater collection system to the Fresno-Clovis regionalwastewater collection system at the Herndon Trunk Sewer, the Sierra TrunkSewer, the Peach Trunk Sewer, and the Fowler Trunk Sewer (Flow Meter DataSource No. 1). Section 8 provides additional information relative to this flowmeter data.
2. Flow meter data for sewers serving three residential subdivisions, as reported inthe April 6, 2015 technical memorandum "City of Clovis Wastewater MasterPlan Update Phase 3, Flow Monitoring Results and Analysis" (Flow Meter DataSource No. 2).
3. Flow meter data for sewers serving areas of central Clovis, as reported in theApril 11, 2016 technical memorandum "City of Clovis Wastewater Master PlanUpdate Phase 3, Central Clovis Specific Plan Sewer Capacity" (Flow Meter DataSource No. 3).
The spreadsheet-based hydraulic model for the 2008 Master Plan was used for aninitial calibration effort. The 2008 Master Plan Model was updated to reflect currentexisting land uses, and model output was compared to flow meter data from FlowMeter Data Source No. 1. Wastewater flow generation rates for all land uses exceptfor schools were adjusted generally downward until hydraulic calculation results wereapproximately aligned with flow meter data. The wastewater flow generation ratesdeveloped as described above were further adjusted where appropriate to account forthe fact that actual existing residential development densities in certain areas are insome cases different from the average residential densities that would otherwise be
Wastewater Master Plan Update, Phase 3
4-112140139-report-3.docx
expected for the same land uses. These calibration efforts resulted in wastewater flowgeneration rates generally 35 percent lower than those used for the 2008 Master PlanModel, and up to 50 percent lower for the central Clovis area.
A final calibration was done with the hydraulic modeling software used for the 2017Master Plan using flow meter data from the same sources. Final calibration was a two-step process, with the first step being calibration for a steady state analysis based onaverage daily flow. The second step involved diurnal curve calibration to result inmodeled flow rate variations throughout the course of a day that closely match theactual flow rate variations derived from flow meter data, for both weekday andweekend conditions, for each service area.
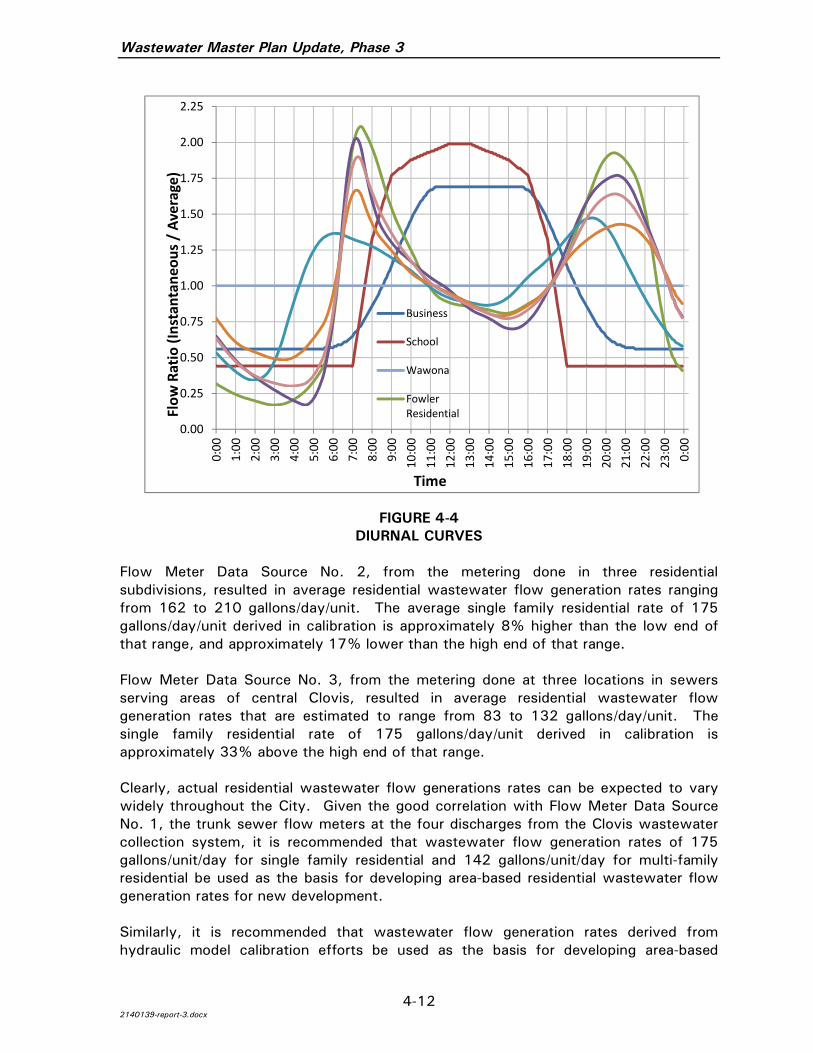
Diurnal curves represent the variation in wastewater flow generation rates over thecourse of a typical day. Diurnal curves for residential areas were developed based onFlow Metering Data Source No. 2. Each service area has a residential diurnal patternthat resembles the pattern derived from the residential metering, although it has beenmodified through calibration using 2015 flow meter data. Figure 4-4 shows residentialwastewater flow generation diurnal curves developed on the basis of the flowmonitoring data and calibration efforts.
Typical diurnal curves were developed for businesses, schools, and the Wawona frozenfood facility as shown in Figure 4-4. The business and school diurnal curves weredeveloped based largely on engineering reference literature for wastewater flowanalysis for business and school land uses, and were used for Phase 3 Modeldevelopment.
Wastewater flow generation rates for school land uses were not adjusted duringcalibration, because the rates used for schools for the 2008 Master Plan were based onan engineering study done to determine flow generation rates for Clovis schools, and itwas felt that an adjustment should only be made if it is supported by another suchstudy.
4.9.2 WASTEWATER FLOW GENERATION RATES
Residential wastewater flow generation rates used for the 2008 Master Plan werebased on a value of 270 gallons/day/unit for single family residential land uses, and220 gallons/day/unit for multi-family residential land uses. The calibration effortdescribed above resulted in a determination that existing residential land uses overallare currently generating average wastewater flows that are approximately 35% lower,based on Flow Meter Data Source No. 1, from the trunk sewer flow meters at the fourdischarges from the Clovis wastewater collection system. This corresponds to lowerrates of approximately 175 gallons/day/unit for single family residential land uses, and142 gallons/day/unit for multi-family land uses. Based on corresponding estimatedaverage occupancies of 3.16 people/unit and 2.30 people/unit, respectively, these ratescorrespond to approximately 55 gallons per capita per day (gpcd) and 62 gpcd,respectively, for these two categories of residential land uses.
Wastewater Master Plan Update, Phase 3
4-122140139-report-3.docx
FIGURE 4-4DIURNAL CURVES
Flow Meter Data Source No. 2, from the metering done in three residentialsubdivisions, resulted in average residential wastewater flow generation rates rangingfrom 162 to 210 gallons/day/unit. The average single family residential rate of 175gallons/day/unit derived in calibration is approximately 8% higher than the low end ofthat range, and approximately 17% lower than the high end of that range.
Flow Meter Data Source No. 3, from the metering done at three locations in sewersserving areas of central Clovis, resulted in average residential wastewater flowgeneration rates that are estimated to range from 83 to 132 gallons/day/unit. Thesingle family residential rate of 175 gallons/day/unit derived in calibration isapproximately 33% above the high end of that range.
Clearly, actual residential wastewater flow generations rates can be expected to varywidely throughout the City. Given the good correlation with Flow Meter Data SourceNo. 1, the trunk sewer flow meters at the four discharges from the Clovis wastewatercollection system, it is recommended that wastewater flow generation rates of 175gallons/unit/day for single family residential and 142 gallons/unit/day for multi-familyresidential be used as the basis for developing area-based residential wastewater flowgeneration rates for new development.
Similarly, it is recommended that wastewater flow generation rates derived fromhydraulic model calibration efforts be used as the basis for developing area-based
0.00
0.25
0.50
0.75
1.00
1.25
1.50
1.75
2.00
2.25
0:00
1:00
2:00
3:00
4:00
5:00
6:00
7:00
8:00
9:00
10:0
011
:00
12:0
013
:00
14:0
015
:00
16:0
017
:00
18:0
019
:00
20:0
021
:00
22:0
023
:00
0:00
Flow
Ratio
(Inst
anta
neou
s/Av
erag
e)
Time
Business
School
Wawona
FowlerResidential

Wastewater Master Plan Update, Phase 3
4-132140139-report-3.docx
wastewater flow generation rates for non-residential land uses.
The foregoing recommendations result in the area-based wastewater flow generationrates shown in Table 4-4, which are recommended for wastewater collection systemplanning and design efforts for new development in the Clovis wastewater collectionsystem service areas.
TABLE 4-4DESIGN WASTEWATER FLOW GENERATION RATES
LAND USE DESIGNATION PROJECTED FLOW GENERATION RATE(MGD=MILLION GALLONS PER DAY)ALL AREAS ARE IN GROSS ACRES
Agricultural 0.000009 MGD/ACREGeneral Commercial 0.000910 MGD/ACREHigh Density Residential 0.002445 MGD/ACREIndustrial 0.000650 MGD/ACRELow Density Residential (Unclassified) 0.000562 MGD/ACRE Fowler Service Area 0.000580 MGD/ACRE Herndon I Service Area 0.000523 MGD/ACRE Herndon II Service Area 0.000567 MGD/ACRE Sierra Service Area 0.000516 MGD/ACREMedium Density Residential (Unclassified) 0.000895 MGD/ACRE Clovis Service Area 0.000545 MGD/ACRE Fowler Service Area 0.000697 MGD/ACRE Herndon I Service Area 0.000701 MGD/ACRE Herndon II Service Area 0.000846 MGD/ACRE Peach I Service Area 0.000797 MGD/ACRE Peach II Service Area 0.000835 MGD/ACRE Sierra Service Area 0.000619 MGD/ACREMedium High Density Residential 0.001459 MGD/ACREMixed Use Business Campus 0.001189 MGD/ACREMixed Use Business Campus (FA-5) 0.001031 MGD/ACREMixed Use Business Campus (FA-10) 0.000859 MGD/ACREMixed Use Business Campus (FA-14) 0.001066 MGD/ACREMixed Use Village 0.001425 MGD/ACREMixed Use Village (FA-4) 0.001083 MGD/ACREMixed Use Village (FA-8) 0.001520 MGD/ACREMixed Use Village (FA-11) 0.000753 MGD/ACRENeighborhood Commercial 0.000910 MGD/ACREOffice 0.000780 MGD/ACREOpen Space 0.000000 MGD/ACREPublic/Quasi-Public Facilities 0.000780 MGD/ACREPark 0.000000 MGD/ACRERural Residential 0.000088 MGD/ACREElementary School 0.000006 MGD/STUDENTIntermediate School 0.000014 MGD/STUDENTHigh School 0.000016 MGD/STUDENTVery High Density Residential 0.005005 MGD/ACREVery Low Density Residential 0.000351 MGD/ACREWater 0.000000 MGD/ACREMGD = Million Gallons Per Day, AC = Acre, STU = Student
Wastewater Master Plan Update, Phase 3
5-12140139-report-3.docx
SECTION 5. SEWER PIPELINE ANALYSIS AND DESIGN
5.1 GENERAL
All sewers 10-inches and larger in diameter were analyzed, together with some 8-inchdiameter sewers where necessary to extend wastewater service to all tributary areas.Criteria for pipeline analysis and design were established, including hydraulic elementsand pipeline depth limitations.
Information relative to existing sewers to be analyzed was extracted from the City ofClovis’ Geographic Information System (GIS). The computer modeling softwareanalyzed the hydraulics of individual segments of these sewers, utilizing linkedinformation from the flow generation model for the associated sewershed. Similarly,design data for proposed sewers were entered into the hydraulic model, and alsoanalyzed.
5.2 CRITERIA FOR PIPELINE ANALYSIS AND DESIGN
Design criteria utilized for the analysis of existing sewers and for the design ofproposed sewers were established, as outlined below.
5.2.1 ROUGHNESS COEFFICIENT
All gravity flow pipeline hydraulic design is to be based upon Manning’s equation, usinga roughness coefficient of 0.013. All force main flow calculations are based on aHazen-Williams roughness coefficient "C" value of 130.
5.2.2 MAXIMUM DEPTH OF FLOW
For the analysis of existing sewers, the maximum allowable relative depth ratio,calculated as the depth of flow divided by pipe diameter (d/D), was taken to be 0.82.For the sizing design of planned sewers, the maximum allowable d/D ratio was taken tobe 0.65.
5.2.3 PIPELINE SLOPE
For design purposes, gravity flow pipeline slope shall be as indicated in Table 5-1.Steeper pipeline slopes shall be used wherever feasible, subject to pipeline depthconsiderations. The maximum pipe slope for all diameters should be such that thewastewater flow velocity does not exceed 10 feet per second.

Wastewater Master Plan Update, Phase 3
5-22140139-report-3.docx
TABLE 5-1DESIGN PIPELINE SLOPE
DIAMETEROF SEWER
STANDARDSLOPE
MINIMUMSLOPE
DIAMETEROF SEWER
STANDARDSLOPE
MINIMUMSLOPE
6 0.0050 0.0040 24 0.0010 0.0010
8 0.0034 0.0024 27 0.0010 0.0010
10 0.0024 0.0020 30 0.0010 0.0010
12 0.0020 0.0014 33 0.0010 0.0010
15 0.0015 0.0012 36 0.0010 0.0010
18 0.0011 0.0010 39 0.0010 0.0010
21 0.0010 0.0010 42 0.0010 0.0010
5.2.4 PIPELINE DEPTH
The target minimum depth from existing ground surface to invert elevation of gravitysewers at shallowest locations shall be no less than 6 feet. This may not be possible insome locations where the depth of existing sewers, or the local topography, do notallow this minimum depth.
The target maximum depth from existing ground surface to invert elevation of gravitysewers shall be no greater than 20 feet, except where unavoidable because of servicearea topography. In no case shall sewers be designed for depths greater than 30 feet.It was necessary to design sewers up to 30 feet deep in the Northeast Service Areadue to irregular terrain conditions in order to ensure service to all areas in the proposedgrowth area.
5.3 PIPELINE ANALYSIS
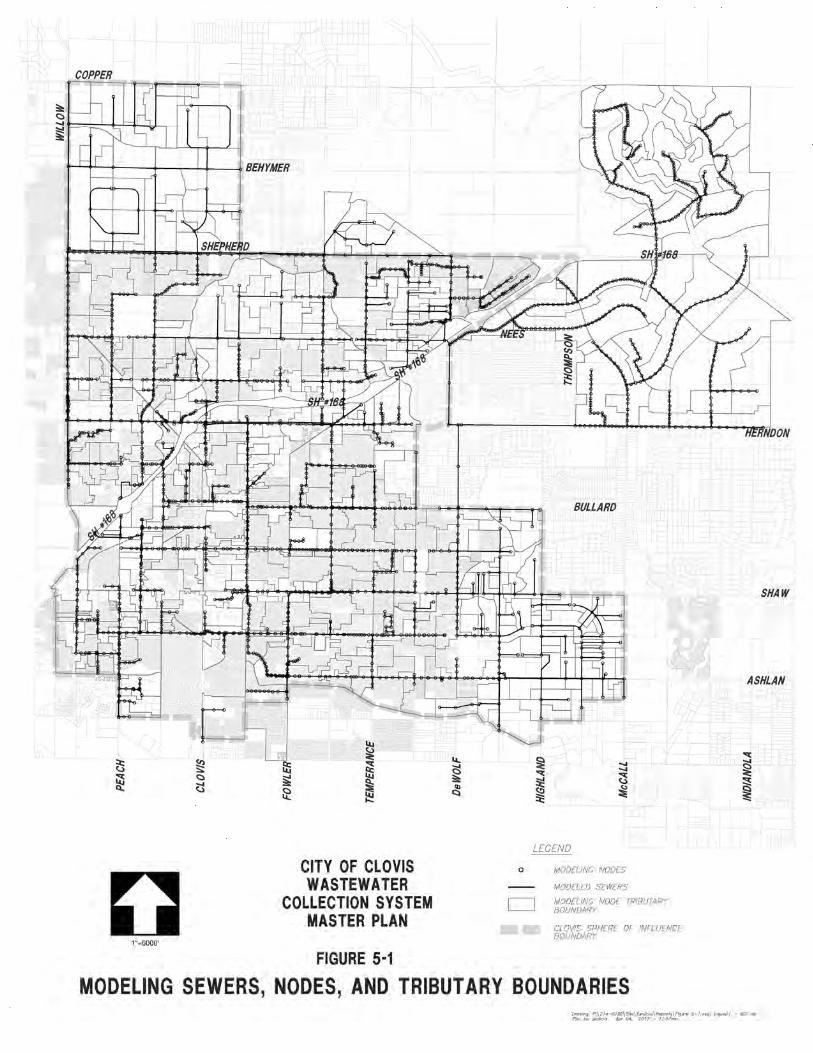
All sewers 10-inches and larger in diameter were analyzed, together with some 8-inchdiameter sewers where necessary to extend wastewater service to all tributary areas.Pipeline segments between existing and proposed manholes were individually analyzed.Modeling nodes, modeled pipelines and tributary boundaries over the planning area areshown schematically on Figure 5-1, and in greater detail on the Master Plan plats. Allflow generated by a sub-service area is assumed to enter the analyzed segment at theupstream-most node in the sub-service area.
Information relative to existing sewers to be analyzed was extracted from GeographicInformation System (GIS) data provided by the City. This information included pipelinesegment diameter, slope, and length. It was originally anticipated that the City's GISdata for the entire existing wastewater collection system would be used for thehydraulic model, with minor adjustments where necessary, and that every City sewerregardless of size would be represented in the model. However, in attempting to usethe City's data, a number of problems were encountered that prohibited direct use ofthe data as planned. One of the most significant problems is the use of two differentelevation datums that have been used for the entry of the GIS data, with no reliableway to consistently determine which datum was used for a particular entity.
Wastewater Master Plan Update, Phase 3
5-32140139-report-3.docx
Figure 5-1FIGURE 5-1 MODELING SEWERS, NODES AND TRIBUTARY BOUNDARIES

Wastewater Master Plan Update, Phase 3
5-42140139-report-3.docx
Blair, Church & Flynn attempted to develop several solutions that could analyze, findand repair affected entities in the GIS data, but largely without success. In order to beable to move forward with hydraulic model development, a decision was made toeliminate all sewers smaller than 10 inches in diameter from the GIS data used for themodel, which significantly reduced the number of sewer segments included in the data.Exceptions were made for a limited number of smaller sewers where they wereconsidered essential for the accurate modeling of particular parts of the system. Theremaining GIS data was then evaluated manually, segment by segment, to locate andrepair data faults so that the GIS data could be used with H2OMAP Sewer.
The elevation datum for the GIS data used for hydraulic modeling is the NationalGeodetic Vertical Datum of 1929 (NGVD29), rather than North American VerticalDatum of 1988 (NAVD88) which is currently the standard elevation datum for the City.This was done for several reasons:
· Most of the sewers represented by the GIS data were designed and constructedbased on NGVD29.
· Most of the City's GIS data for those sewers contains elevations that are basedon NGVD29.
· The spreadsheet-based hydraulic model used for the 2008 Master Plan wasbased on NGVD29, and that model was used as an important aid for thecalibration and validation of the H2OMAP Sewer model for the 2017 MasterPlan.
· Conversion between NGVD29 and NAVD88 elevations cannot be doneaccurately by the application of a single global adjustment factor, because theconversion is dependent on the horizontal location of the point in question.

Wastewater Master Plan Update, Phase 3
6-12140139-report-3.docx
SECTION 6. WASTEWATER FLOW SUMMARIES
6.1 GENERAL
Summaries of projected flow utilizing the wastewater flow generation rates indicated inSection 4.9.1 were prepared for the major service areas, after calibration of the modelfor the four service areas which are metered where they exit Clovis and enter theRegional System.
6.2 FLOW SUMMARIES
Table 6-1 contains flow summaries for all of the major sewer service areas. The flowsummaries include estimates of flow from properties currently developed, fromproperties currently undeveloped, and for total projected flow at buildout. All flowsreported are average daily flows in millions of gallons per day (MGD).
Table 6-1 also contains flow capacity summaries for all of the major sewer serviceareas. Capacity is presented both as currently acquired, and as total planned.
Table 6-1 provides flow and capacity data as the sewer system would be configuredafter flow diversions proposed in the Master Plan, and includes capacity that will beprovided by the Clovis Sewage Treatment/Water Reuse Facility.
TABLE 6-1FLOW AND CAPACITY SUMMARY
SEWERSERVICEAREA
PROJECTED FLOW TOTAL CAPACITYDEVELOPED UNDEVELOPED TOTAL CURRENTLY ACQUIRED TOTAL PLANNED
FLOW(MGD)
FLOW(MGD)
FLOW(MGD)
AMOUNT(MGD)
BALANCE(MGD)
AMOUNT(MGD)
BALANCE(MGD)
HERNDON (1) 1.821 0.430 2.251 2.800 0.549 2.800 0.549FOWLER 2.812 1.166 3.978 3.000 -0.978 3.881 -0.097SIERRA 0.195 0.020 0.215 0.500 0.285 0.500 0.285PEACH 1.791 0.132 1.923 3.000 1.077 3.000 1.077NW 0.089 2.791 2.880
2.800 -7.414 8.400(2)
-1.814NE 0.000 5.109 5.109SE 0.310 1.915 2.225TOTALS 7.018 11.563 18.581 12.100 -6.481 18.581 0.000
1. In addition to the average daily flow capacity of 2.80 mgd, the Herndon Service Area is limited to a maximumpeak flow of 4.00 MGD.
2. Excess flow over the 8.400 MGD planned capacity of the Clovis ST/WRF is planned to be diverted to theFowler Trunk Sewer.
Table 6-1 compares projected flow in each major service area with both currentlyacquired capacity and planned capacity. Table 6-2 provides a brief explanation for thebalance of capacity shown in the "Balance" capacity columns of Table 6-1.

Wastewater Master Plan Update, Phase 3
6-22140139-report-3.docx
TABLE 6-2EXPLANATION OF CAPACITY BALANCE
SEWERSERVICE AREA
EXPLANATION (References to acquired capacity include the combination of trunksewer capacity and treatment capacity)
HERNDON Clovis previously acquired 2.800 MGD of capacity in the Regional System (that byagreement cannot exceed a peak flow of 4.000 MGD). The 2.800 MGD capacity ismore than adequate for the projected 2.250 MGD buildout flow from the HerndonService Area. Per City staff, unused treatment capacity obtained for the HerndonService Area can be utilized by other areas of the City.
FOWLER Clovis previously acquired 3.000 MGD of capacity in the Regional System. Flow to theClovis ST/WRF in excess of its planned capacity of 8.400 MGD will be diverted to theFowler Trunk Sewer, which when combined with buildout flow from the Fowler ServiceArea will total 5.793 MGD. The indicated current shortage of 2.793 MGD in acquiredcapacity at buildout must be augmented by the planned purchase of 0.881 MGD ofadditional treatment capacity at the RWRF. The remainder of the shortfall is availablefrom unused capacity in the Herndon, Sierra, and Peach Service Areas. Clovis mustalso share with the City of Fresno in the cost of a future second barrel of the NorthAvenue Trunk Sewer, to the extent of 3.000 MGD capacity exchanged with Fresno(Addendum No. 6 to Joint Powers Agreement).
SIERRA Clovis previously acquired 0.500 MGD of capacity in the Regional System, which ismore than adequate for the projected 0.215 MGD buildout flow from the Sierra ServiceArea. Per City staff, unused treatment capacity obtained for the Sierra Service Areacan be utilized by other areas of the City.
PEACH Clovis previously acquired 3.000 MGD of capacity in the Regional System, which ismore than adequate for the projected 1.923 MGD buildout flow from the Peach ServiceArea. Per City staff, unused treatment capacity obtained for the Peach Service Areacan be utilized by other areas of the City.
NW All of the flow from the NW, NE and SE Service Areas is to be directed to the ClovisST/WRF, although any excess flow over the 8.400 MGD planned capacity of the ClovisST/WRF is to be diverted to the Fowler Trunk Sewer (using current infrastructure thatcan operate in the opposite direction of its current use), where capacity can beobtained. Projected flow from the NW Service Area is based upon land uses indicatedin the 2014 Clovis General Plan, augmented by actual development which has occurredsouth of Shepherd Avenue.
NE All of the flow from the NE, NW and SE Service Areas is to be directed to the ClovisST/WRF, although any excess flow over the 8.400 MGD planned capacity of the ClovisST/WRF is to be diverted to the Fowler Trunk Sewer (using current infrastructure thatcan operate in the opposite direction of its current use), where capacity can beobtained. Projected flow from the NE Service Area is based upon land uses indicatedin the 2014 Clovis General Plan.
SE All of the flow from the SE, NW and NE Service Areas is to be directed to the ClovisST/WRF, although any excess flow over the 8.400 MGD planned capacity of the ClovisST/WRF is to be diverted to the Fowler Trunk Sewer (using current infrastructure thatcan operate in the opposite direction of its current use), where capacity can beobtained. Projected flow from the SE Service Area is based upon land uses indicated inthe 2014 Clovis General Plan.
TOTAL Clovis’ capacity needs will be met by the construction of ST/WRF Phases 2 and 3 torealize the full planned ST/WRF capacity of 8.400 MGD, and acquiring 0.881 MGDadditional treatment capacity at the RWRF which Clovis is entitled to based upon aprevious agreement with the City of Fresno.
Wastewater Master Plan Update, Phase 3
7-12140139-report-3.docx
SECTION 7. REGIONAL SYSTEM TRUNK SEWER ISSUES
7.1 GENERAL
Regional trunk sewer issues downstream of Clovis have been resolved and capacityacquired for the Herndon, Sierra and Peach Service Areas. Associated treatmentcapacity at the RWRF has also been acquired for these three service areas.
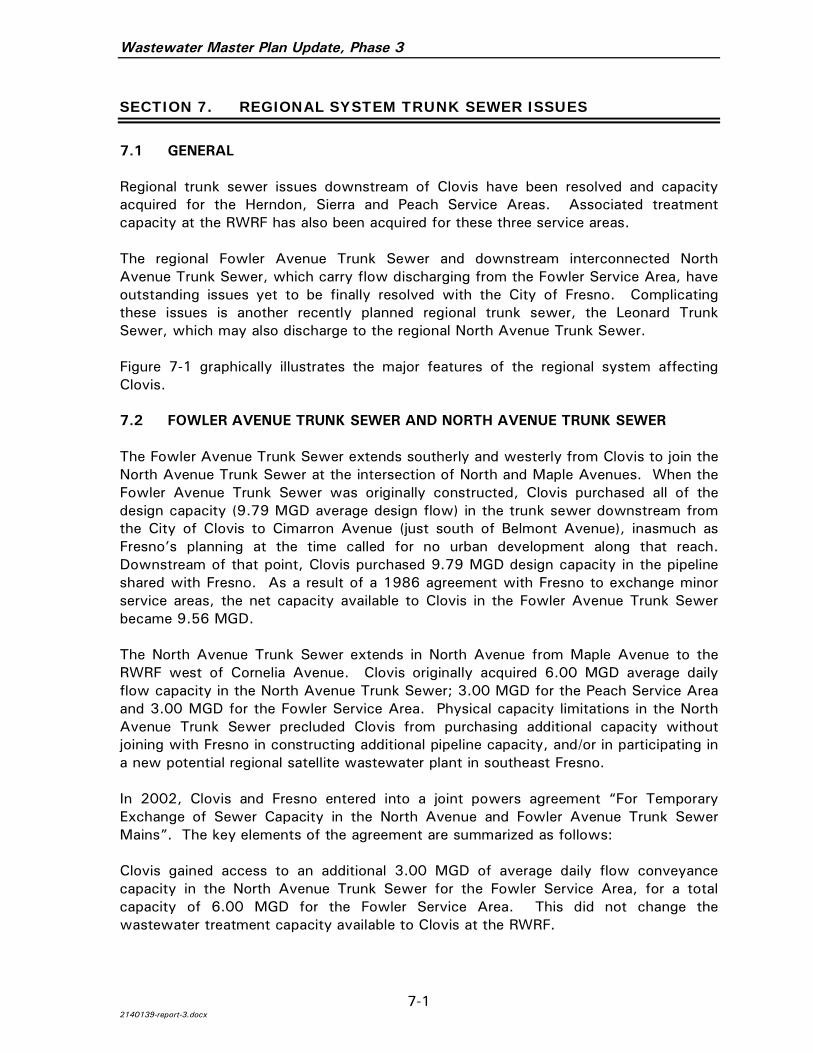
The regional Fowler Avenue Trunk Sewer and downstream interconnected NorthAvenue Trunk Sewer, which carry flow discharging from the Fowler Service Area, haveoutstanding issues yet to be finally resolved with the City of Fresno. Complicatingthese issues is another recently planned regional trunk sewer, the Leonard TrunkSewer, which may also discharge to the regional North Avenue Trunk Sewer.
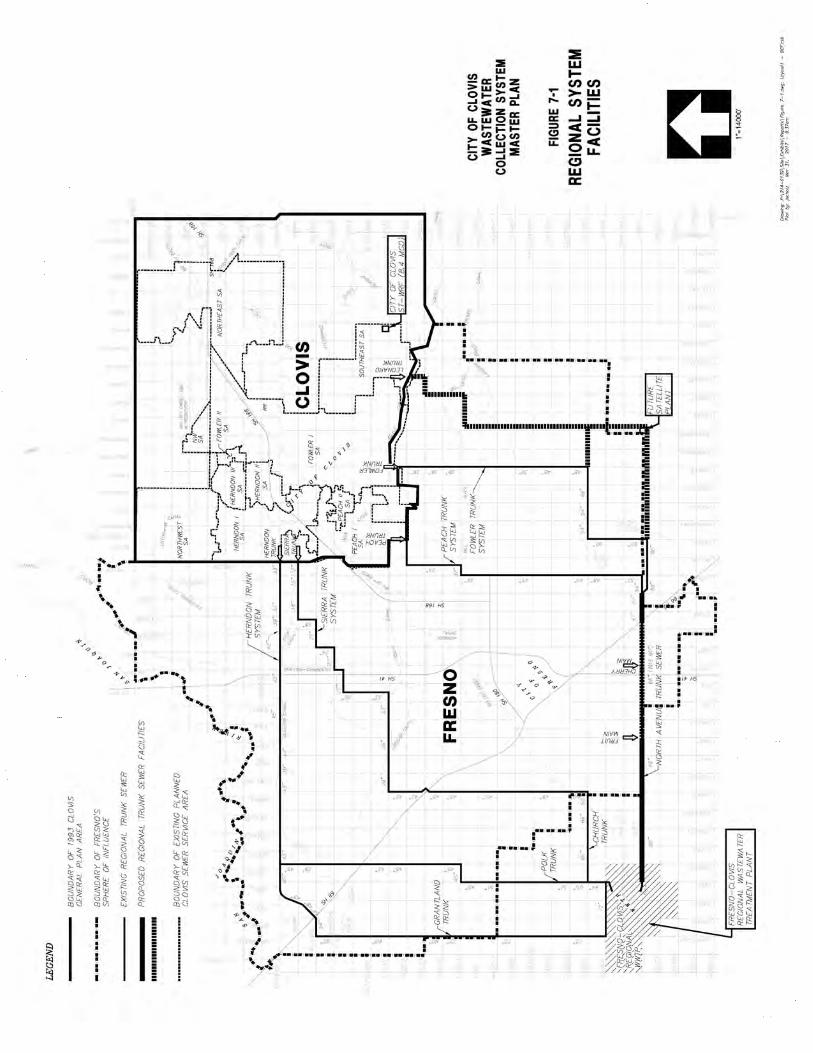
Figure 7-1 graphically illustrates the major features of the regional system affectingClovis.
7.2 FOWLER AVENUE TRUNK SEWER AND NORTH AVENUE TRUNK SEWER
The Fowler Avenue Trunk Sewer extends southerly and westerly from Clovis to join theNorth Avenue Trunk Sewer at the intersection of North and Maple Avenues. When theFowler Avenue Trunk Sewer was originally constructed, Clovis purchased all of thedesign capacity (9.79 MGD average design flow) in the trunk sewer downstream fromthe City of Clovis to Cimarron Avenue (just south of Belmont Avenue), inasmuch asFresno’s planning at the time called for no urban development along that reach.Downstream of that point, Clovis purchased 9.79 MGD design capacity in the pipelineshared with Fresno. As a result of a 1986 agreement with Fresno to exchange minorservice areas, the net capacity available to Clovis in the Fowler Avenue Trunk Sewerbecame 9.56 MGD.
The North Avenue Trunk Sewer extends in North Avenue from Maple Avenue to theRWRF west of Cornelia Avenue. Clovis originally acquired 6.00 MGD average dailyflow capacity in the North Avenue Trunk Sewer; 3.00 MGD for the Peach Service Areaand 3.00 MGD for the Fowler Service Area. Physical capacity limitations in the NorthAvenue Trunk Sewer precluded Clovis from purchasing additional capacity withoutjoining with Fresno in constructing additional pipeline capacity, and/or in participating ina new potential regional satellite wastewater plant in southeast Fresno.
In 2002, Clovis and Fresno entered into a joint powers agreement “For TemporaryExchange of Sewer Capacity in the North Avenue and Fowler Avenue Trunk SewerMains”. The key elements of the agreement are summarized as follows:
Clovis gained access to an additional 3.00 MGD of average daily flow conveyancecapacity in the North Avenue Trunk Sewer for the Fowler Service Area, for a totalcapacity of 6.00 MGD for the Fowler Service Area. This did not change thewastewater treatment capacity available to Clovis at the RWRF.
Wastewater Master Plan Update, Phase 3
7-22140139-report-3.docx
Figure 7-1FIGURE 7-1 REGIONAL SYSTEM FACILITIES

Wastewater Master Plan Update, Phase 3
7-32140139-report-3.docx
Fresno gained access to 3.00 MGD of average daily flow capacity in the FowlerAvenue Trunk Sewer north of Cimarron Avenue. Fresno needed this capacity toservice an area newly planned for urbanization.
· Clovis agreed to participate in future project(s) that would replace the additional3.00 MGD of flow capacity in the North Avenue Trunk Sewer with flowcapacity in a future second barrel in North Avenue, or other suitable project.Potential elements of capacity enhancing projects (based upon very preliminaryanalysis) are indicated on Figure 7-1.
· Fresno agreed to participate in future project(s) that would replace the additional3.00 MGD of flow capacity in the Fowler Avenue Trunk Sewer with flowcapacity in a future Leonard Avenue Trunk Sewer, or other suitable replacementproject. It appears that Fresno plans to provide the replacement capacity in thefuture Leonard Avenue Trunk Sewer.
· Fresno agreed that by virtue of previous joint powers agreements, Clovis will beallowed to purchase an additional 3.00 MGD of treatment capacity at the RWRFto accommodate additional flows from the Fowler Trunk Sewer, and that saidadditional capacity may be purchased as needed in about 1 MGD increments, asClovis deems advisable.
· Both agencies agreed that inasmuch as the agreement may be terminated after5 years by either party, both parties must then actively participate inreplacement capacity projects which must be commissioned before terminationof the exchanged flow capacity.
Considering the provisions of the above agreement, Clovis’ resulting capacity in theregional system for discharge to the Fowler Avenue Trunk Sewer, together with Clovis’projected capacity needs within it, are as tabulated in Table 7-1.
TABLE 7-1CAPACITY SUMMARY
FOWLER TRUNK SEWER / NORTH AVENUE TRUNK SEWERCONVEYANCE CAPACITY
Fowler Trunk Sewer (9.56 MGD – 3.00 MGD exchanged) 6.560 MGDNorth Avenue Trunk Sewer (3.00 MGD + 3.00 MGD exchanged) 6.000 MGDClovis’ Projected Required Capacity at Buildout 5.731 MGD
TREATMENT CAPACITYPreviously Acquired Treatment Capacity For Fowler Trunk Sewer 3.000 MGDAdditional Treatment Capacity Available for Purchase byAgreement
3.000 MGD
Unused Treatment Capacity in Herndon, Sierra and Peach ServiceAreas
1.911 MGD
Clovis’ Total Available Potential Capacity (3.00 MGD + 3.00MGD + 1.911 MGD)
7.911 MGD
Clovis’ Projected Required Capacity at Buildout 5.731 MGD

Wastewater Master Plan Update, Phase 3
7-42140139-report-3.docx
It is not likely that the 2002 agreement will be terminated, inasmuch as replacementprojects would be very difficult to execute.
7.3 LEONARD AVENUE TRUNK SEWER
With the updating of the City of Fresno’s General Plan in December, 2014, areassoutheasterly of Fresno were re-planned for urbanization. In order to providewastewater service to this new area, Fresno planned a new Leonard Avenue TrunkSewer as shown on Figure 7-2). This trunk sewer would discharge to either:
· an enlarged North Avenue Trunk Sewer (which discharges to the existingRegional Wastewater Treatment Plant), or
· a new Regional Satellite Wastewater Treatment Plant in southeast Fresno.
Fresno plans to provide capacity for Clovis in the Leonard Avenue Trunk Sewer toreplace the 3.00 MGD of capacity exchanged in the Fowler Avenue Trunk Sewer perthe 2002 agreement. Although this replacement capacity is not needed for theprojected buildout flows in the Fowler Service Area together with flow in excess of thecapacity of the Clovis ST/WRF diverted to the Fowler Trunk Sewer (and is also notphysically located where it can service the Fowler Service Area by gravity), it is locatedin a strategic location with respect to other Clovis wastewater infrastructure.
Figure 7-2 graphically indicates the proposed regional Leonard Avenue Trunk Sewer atits proposed connection point to Clovis, together with its geographical relationship withClovis’ major wastewater infrastructure. With the future construction of minor pipingin the Ashlan-Leonard Avenue intersection and a proposed connector sewer in LeonardAvenue between Ashlan Avenue and the terminus of the Clovis system just south ofthe Gould Canal, Clovis gains another major connection point to the regional system.This connection would provide the following options if needed because of unanticipatedoccurrences or planned maintenance operations:
· Up to 3.0 MGD of flow entering Pump Station E from its gravity fed tributaryservice areas could be diverted from discharging to the Clovis ST/WRF, andinstead be pumped to the regional system via the Leonard Avenue Trunk Sewer.
· If operation of Pump Station E were interrupted for some reason, upstreamgravity flow from its tributary areas would eventually build to a below-ground-surface emergency spillover gravity connection point and into the regionalsystem via the Leonard Avenue Trunk Sewer.
· Up to 3.0 MGD of flow from the Fowler Service Area could be diverted throughPump Station B at Fowler Avenue just south of Ashlan Avenue by force main tothe Ashlan-Leonard Avenue intersection for discharge to the Leonard AvenueTrunk Sewer and thus to the regional system.
These options provide the benefits of backup capability, operational alternatives andredundancy to a major portion of Clovis’ wastewater system.

Wastewater Master Plan Update, Phase 3
7-52140139-report-3.docx
Figure 7-2FIGURE 7-2 LEONARD AVENUE CONNECTOR SEWER

Wastewater Master Plan Update, Phase 3
8-12140139-report-3.docx
SECTION 8. FLOW METERING OF CLOVIS TRUNK SEWERS
8.1 GENERAL
Four existing Clovis trunk sewers are metered by Fresno where they enter the regionalsystem. The metering data indicate that the sum total flow of the four trunk sewershas not increased in direct proportion to the population increase in Clovis.
8.2 TRUNK SEWER FLOW METERS
The types of meters which measure the flow from Clovis’ trunk sewers, and thelocation of the meters, are indicated in Table 8-1.
TABLE 8-1CLOVIS TRUNK SEWER FLOW METERS
TRUNKSEWER
TYPE OFFLOW METER
LOCATION OF FLOW METER
Herndon Ultrasonic FlowMonitor
Herndon Avenue just west of Willow Avenue
Fowler Ultrasonic FlowMonitor
Fowler Avenue just south of Bellaire Avenue
Sierra Ultrasonic FlowMonitor
Intersection of Sierra and Willow Avenues
Peach Ultrasonic FlowMonitor
Peach Avenue 280’± north of Pontiac Way
There are generally three different types of ultrasonic flow meters, namely time transitflow meters, Doppler shift flow meters, and open channel flow meters. The flowmeters identified in Table 8-1 are open channel flow meters, which measure flow depthand flow velocity, over time, from which flow rate is determined through calculationsusing the Manning equation, or continuity equation.
8.3 FLOW METERING DATA OVER TIME
Table 8-2 contains Clovis trunk sewer metering data for the period 1995 through 2015.The total average annual flow for the sum of all four existing trunk sewers is indicated,as well as the average Clovis population over each corresponding year. The averagepopulation was determined by averaging the January 1 annual population estimates forClovis for succeeding years, as reported by the State of California. The averagepopulation values were then rounded to the nearest hundred persons.

Wastewater Master Plan Update, Phase 3
8-22140139-report-3.docx
TABLE 8-2CLOVIS AVERAGE ANNUAL METERED
FLOW AND POPULATION
YEAR AVERAGEDAILY FLOW
(MGD)
AVERAGEPOPULATION
1995 6.203 63,1001996 6.526 64,3001997 6.418 65,1001998 6.326 65,9001999 6.045 67,2002000 6.456 69,3002001 6.404 71,9002002 6.553 74,9002003 6.845 78,9002004 6.976 83,5002005 6.973 87,8002006 7.318 90,8002007 7.345 93,1002008 7.356 94,6002009 7.349 95,2002010 7.310 96,3002011 6.919 97,9002012 6.864 99,3002013 6.953 101,1002014 6.788 103,3002015 6.435 106,200
Figure 8-1 is a graph of the data from Table 8-2.
The flow trend for the sum total flow, as determined by flow metering, has notincreased in direct proportion to the population increase. This is likely largely the resultof water conservation efforts and the utilization of water conserving fixtures in newconstruction and remodels. Other potential reasons may include changes in averagehousehold size over time.
Unit design wastewater flow generation rates for Clovis were originally established inthe Phase 1-A Report, “Present Wastewater Flows, Projected Flows and Trunk SewerCapacities for Existing Trunk Sewer Service Areas”, dated June 1995, and werereaffirmed and implemented in the 2008 Master Plan. For this 2017 Master Plan,updated wastewater flow generation rates were developed based largely on flow meterdata, as described in Section 4.
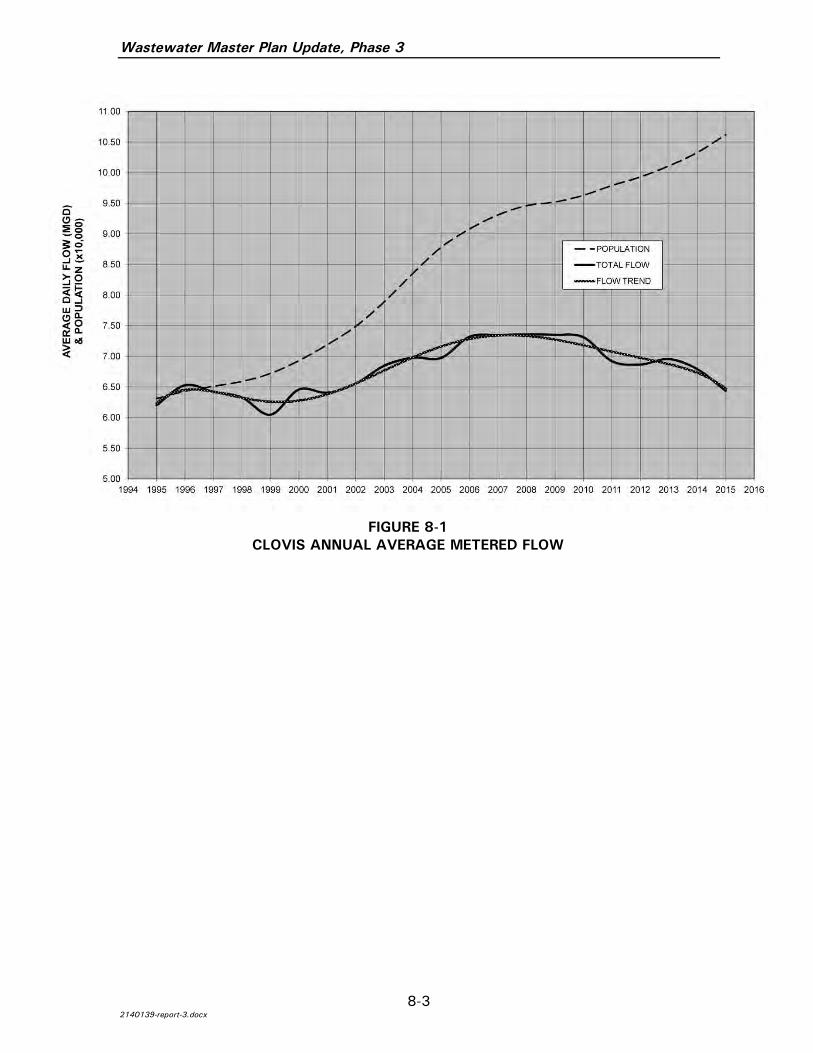
Wastewater Master Plan Update, Phase 3
8-32140139-report-3.docx
Figure 8-1
FIGURE 8-1CLOVIS ANNUAL AVERAGE METERED FLOW
Wastewater Master Plan Update, Phase 3
9-12140139-report-3.docx
SECTION 9. HYDRAULIC MODELING RESULTS AND CAPITALIMPROVEMENT PROJECT RECOMMENDATIONS
9.1 GENERAL
The 2014 General Plan includes the development of three Urban Centers as part of theCity's plan for urban growth. These three areas are referred to as the Northwest UrbanCenter, Northeast Urban Center, and Loma Vista Urban Center. The Loma Vista UrbanCenter is located generally southeast of the City, and the other two urban center areasare generally located as their names indicate. The 2014 General Plan provides for urbangrowth in the three urban center areas, and in other areas within and near the City.This section documents an evaluation of the wastewater collection and treatmentsystem infrastructure that will be necessary to provide wastewater service as the Citygrows, and provides recommendations for Capital Improvement Projects (CIP) that canbe implemented to provide that service.
9.2 HYDRAULIC MODELING
The software used for the hydraulic modeling of the City's wastewater collectionsystem is H2OMAP Sewer Suite 10.5, Update No. 10 (H2OMAP Sewer), a softwareproduct of the firm Innovyze. Sections 4 and 5 of this report provide informationrelative to the selection of the hydraulic modeling software, and the development andcalibration of the hydraulic model, and the design criteria employed for sewer pipelineanalysis and design.
Hydraulic modeling for a buildout conditions scenario was initially done using twodifferent simulation styles. The first simulation style was a steady state analysis,which provides output as average daily flows throughout the entire modeled system.The second type of simulation conducted was an extended period simulation (EPS),which employs diurnal curves to calculate variable wastewater flows throughout atypical day. The EPS modeling results were used to evaluate capacity adequacy of theexisting system, and to develop sizing for planned facilities by analyzing modeled flowconditions in light of the prescribed hydraulic design criteria. Appendix E provides anexhibit showing the existing and planned sewers and pump stations included in thehydraulic model.
A problem was encountered with the hydraulic model when it was discovered thatsome tributary areas were being ignored by the Demand Allocation Module of thesoftware. This resulted in underestimation of wastewater flows for certain areas.Innovyze, the producer of the H2OMAP Sewer modeling software, confirmed that theproblem was due to the Demand Allocation Module. Innovyze was unable to develop asolution for the problem, but provided a workaround using Microsoft Excel. Theworkaround performs the function of the load allocator and transfers the correctloading values by copying a column in an Excel spreadsheet and pasting it into theInnovyze software input data. Innovyze has indicated that further efforts by their staffwill not be undertaken to produce a solution to this issue since a workaround isavailable, but that forthcoming software updates will correct the issue.

Wastewater Master Plan Update, Phase 3
9-22140139-report-3.docx
Hydraulic modeling results indicate that for 2014 General Plan buildout conditions thereare no significant wastewater flow capacity limitations in the existing gravity flowsewer mains and pressure force mains of the existing City of Clovis wastewatercollection system. Therefore, no capital improvement projects are recommendedstrictly to remedy capacity deficiencies in the existing wastewater collection systemsewer mains.
As expected, hydraulic modeling results indicate that a number of new wastewaterconveyance and wastewater treatment infrastructure projects will be necessary toserve planned growth areas under the 2014 General Plan. The City provided directionthat all new wastewater conveyance infrastructure projects involving gravity flowsewers 15 inches in diameter and larger, together with any pump stations and forcemains that serve those sewers, and all wastewater treatment projects, are to bedesignated as capital improvement projects. Sewers smaller than 15 inches indiameter, together with pump stations and force mains that serve those smallersewers, are to be designated developer constructed projects, and as such are not to beaccounted for as capital improvement projects. One exception exists, however, wherea 10-inch sewer is proposed for construction as a capital improvement project inWillow Avenue north of International Avenue, where the City desires to have the sewerconstructed in conjunction with a planned roadway improvement project.
9.3 SERVICE AREA WASTEWATER FLOWS
Table 6-1, in Section 6 of this report, provides a summary of estimated wastewaterflows at 2014 General Plan buildout for the Herndon, Sierra, Peach, Fowler andST/WRF service areas.
As the tabulated data indicates, the estimated wastewater flow of 10.214 MGD for theST/WRF exceeds the ultimate planned capacity for the ST/WRF, which is 8.4 MGD.The difference of 1.814 MGD must be diverted by means such as pumping from PumpStation E to the Fowler Trunk Sewer, using the existing Ashlan Avenue force mains "inreverse", which is the condition illustrated in Table 6-1. Alternatively, the excesswastewater flow could be pumped from Pump Station E to the planned Leonard TrunkSewer, after the regional Leonard Trunk Sewer is constructed by the City of Fresno inthe 2030-2035 timeframe. Both the existing Fowler Trunk Sewer and the plannedLeonard Trunk Sewer have or will have sufficient wastewater flow capacity to conveythe excess flow diverted by Pump Station E, providing a degree of flexibility for systemoperation and unforeseen circumstances.
The total estimated average wastewater flow generation at General Plan buildout is18.581 MGD. For the total projected population of 294,300 at buildout, thiscorresponds to a per capita average daily flow of approximately 63.14 gallons percapita per day (gpcd).
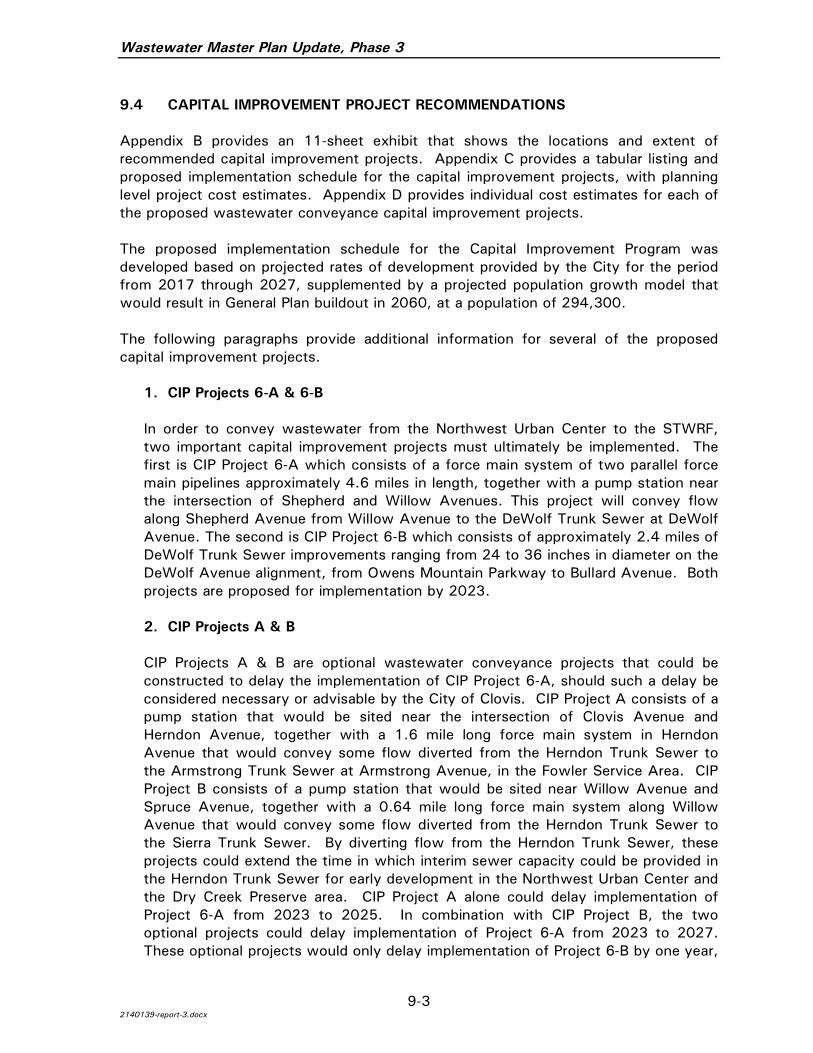
Wastewater Master Plan Update, Phase 3
9-32140139-report-3.docx
9.4 CAPITAL IMPROVEMENT PROJECT RECOMMENDATIONS
Appendix B provides an 11-sheet exhibit that shows the locations and extent ofrecommended capital improvement projects. Appendix C provides a tabular listing andproposed implementation schedule for the capital improvement projects, with planninglevel project cost estimates. Appendix D provides individual cost estimates for each ofthe proposed wastewater conveyance capital improvement projects.
The proposed implementation schedule for the Capital Improvement Program wasdeveloped based on projected rates of development provided by the City for the periodfrom 2017 through 2027, supplemented by a projected population growth model thatwould result in General Plan buildout in 2060, at a population of 294,300.
The following paragraphs provide additional information for several of the proposedcapital improvement projects.
1. CIP Projects 6-A & 6-B
In order to convey wastewater from the Northwest Urban Center to the STWRF,two important capital improvement projects must ultimately be implemented. Thefirst is CIP Project 6-A which consists of a force main system of two parallel forcemain pipelines approximately 4.6 miles in length, together with a pump station nearthe intersection of Shepherd and Willow Avenues. This project will convey flowalong Shepherd Avenue from Willow Avenue to the DeWolf Trunk Sewer at DeWolfAvenue. The second is CIP Project 6-B which consists of approximately 2.4 miles ofDeWolf Trunk Sewer improvements ranging from 24 to 36 inches in diameter on theDeWolf Avenue alignment, from Owens Mountain Parkway to Bullard Avenue. Bothprojects are proposed for implementation by 2023.
2. CIP Projects A & B
CIP Projects A & B are optional wastewater conveyance projects that could beconstructed to delay the implementation of CIP Project 6-A, should such a delay beconsidered necessary or advisable by the City of Clovis. CIP Project A consists of apump station that would be sited near the intersection of Clovis Avenue andHerndon Avenue, together with a 1.6 mile long force main system in HerndonAvenue that would convey some flow diverted from the Herndon Trunk Sewer tothe Armstrong Trunk Sewer at Armstrong Avenue, in the Fowler Service Area. CIPProject B consists of a pump station that would be sited near Willow Avenue andSpruce Avenue, together with a 0.64 mile long force main system along WillowAvenue that would convey some flow diverted from the Herndon Trunk Sewer tothe Sierra Trunk Sewer. By diverting flow from the Herndon Trunk Sewer, theseprojects could extend the time in which interim sewer capacity could be provided inthe Herndon Trunk Sewer for early development in the Northwest Urban Center andthe Dry Creek Preserve area. CIP Project A alone could delay implementation ofProject 6-A from 2023 to 2025. In combination with CIP Project B, the twooptional projects could delay implementation of Project 6-A from 2023 to 2027.These optional projects would only delay implementation of Project 6-B by one year,
Wastewater Master Plan Update, Phase 3
9-42140139-report-3.docx
until 2024, because it would then be necessary to support early development in thesouthwest area of the Northeast Urban Center. Barring extenuating circumstances,it appears that the implementation of these optional projects for the purpose ofdelaying implementation of Project 6-A would not be a cost-effective projectimplementation approach.
3. CIP Projects AA through EE
CIP Projects AA through EE are wastewater treatment projects including the Phase2 and Phase 3 expansion of the ST/WRF, and the previously agreed-upon purchaseof wastewater treatment capacity at the Fresno / Clovis Regional WastewaterReclamation Facility (RWRF) from the City of Fresno. The cost estimates providedwith this technical memorandum are based on limited information taken from City ofClovis working documents dating back to 2006 for the ST/WRF expansions, andback to 2013 for the treatment capacity purchases. Those costs were updated to2016 by the application of historical Engineering News Record (ENR) ConstructionCost Index data. Discussion between the Cities of Clovis and Fresno relative to thepurchase of treatment capacity could result in more accurate cost estimateinformation for the capacity purchases. Similarly, a current evaluation of ST/WRFtreatment plant expansion options and costs, perhaps in concert with the contractoperator of the ST/WRF, could result in more accurate cost estimate information forthe ST/WRF expansion projects.
9.5 EXISTING MAJOR PUMP STATIONS AND FORCE MAINS
Although they are not the subject of a recommended Capital Improvement Project,there are two existing major Clovis wastewater pump stations with associated forcemain systems that are essential to the operation of the existing and plannedwastewater collection system.
9.5.1 PUMP STATION E
Pump Station E is an existing pump station located at the northeast corner of theintersection of Ashlan and Leonard Avenues. The ultimate primary function of PumpStation E is to receive the combined wastewater from the Northwest, Northeast andSoutheast Service Areas and discharge it through an associated force main system tothe Clovis ST/WRF on the north side of Ashlan Avenue between Thompson and McCallAvenues.
In the early years, when Pump Station E received only minor flow from earlydevelopment in the Southeast Service Area, the discharge was directed to a gravitysewer main in Ashlan Avenue leading to the Fowler Trunk Sewer system.
Although the primary purpose of Pump Station E is to discharge wastewater to theClovis ST/WRF, Pump Station E is capable of discharging large quantities of flow eitherto the Clovis ST/WRF or to the Fowler Trunk Sewer. Discharge to the Fowler TrunkSewer of flows greater than can be safely handled by the gravity sewer in AshlanAvenue between Leonard Avenue and Fowler Avenue can be transmitted through an
Wastewater Master Plan Update, Phase 3
9-52140139-report-3.docx
existing force main system. This system is located within Ashlan Avenue and FowlerAvenue south of Ashlan Avenue and is plumbed to connect to the Fowler Trunk Sewerat an existing diversion structure south of Ashlan Avenue.
This 2017 Master Plan also provides for the future construction of the proposedconnector sewer in Leonard Avenue between Ashlan Avenue and the terminus of theClovis system just south of the Gould Canal, as described in Section 7.3.
Together, these options provide the benefits of backup capability, operationalalternatives and redundancy to the Pump Station E system.
9.5.2 PUMP STATION B
Pump Station B is an existing major pump station located on the east side of FowlerAvenue south of Ashlan Avenue and just north of the Gould Canal. The primaryfunction of Pump Station B is to divert wastewater from the Fowler Trunk Sewer to theClovis ST/WRF in the early years of the ST/WRF when direct flows emanating from theservice areas of the ST/WRF are minimal.
Flows enter Pump Station B by way of a diversion structure on the Fowler TrunkSewer. Pump Station B discharges the diverted flow through the existing force mainsystem between Pump Station E and Pump Station B. The diverted flows are thenrelayed by Pump Station E to the ST/WRF.
In later years when makeup wastewater flow from the Fowler Trunk Sewer is no longerneeded at the ST/WRF, Pump Station B will remain available to provide backupcapability, operational alternatives and redundancy for the Fowler Service Area.
9.6 REHABILITATION AND REPAIR RECOMMENDATIONS
As part of the Wastewater Master Plan Update, Phase 3 effort, an effort wasundertaken to identify wastewater collection system facilities that pose a current orpotential threat to regular system operations, and to present recommendations forpreventative or remedial measures.
City-owned and operated closed circuit television (CCTV) sewer inspection equipmentis used to collect video imagery for condition evaluation of the City’s wastewatercollection system pipelines. The City manages the data using CUES Granite XPsoftware, and queries the database on an annual basis to determine candidates forremedial efforts. According to City of Clovis personnel, sewers that are found to havesignificant defects during CCTV inspections are ordinarily cleaned, rehabilitated,repaired or replaced without delay as a matter of practice. The City reports that thispractice ordinarily results in a very low or non-existent inventory of wastewatercollection system pipelines that require rehabilitation, repair or replacement.
The existing wastewater collection system includes six active wastewater pumpstations and lift stations. A seventh existing pump station is not currently in use, andwould require significant work in the event it becomes necessary to place it in service
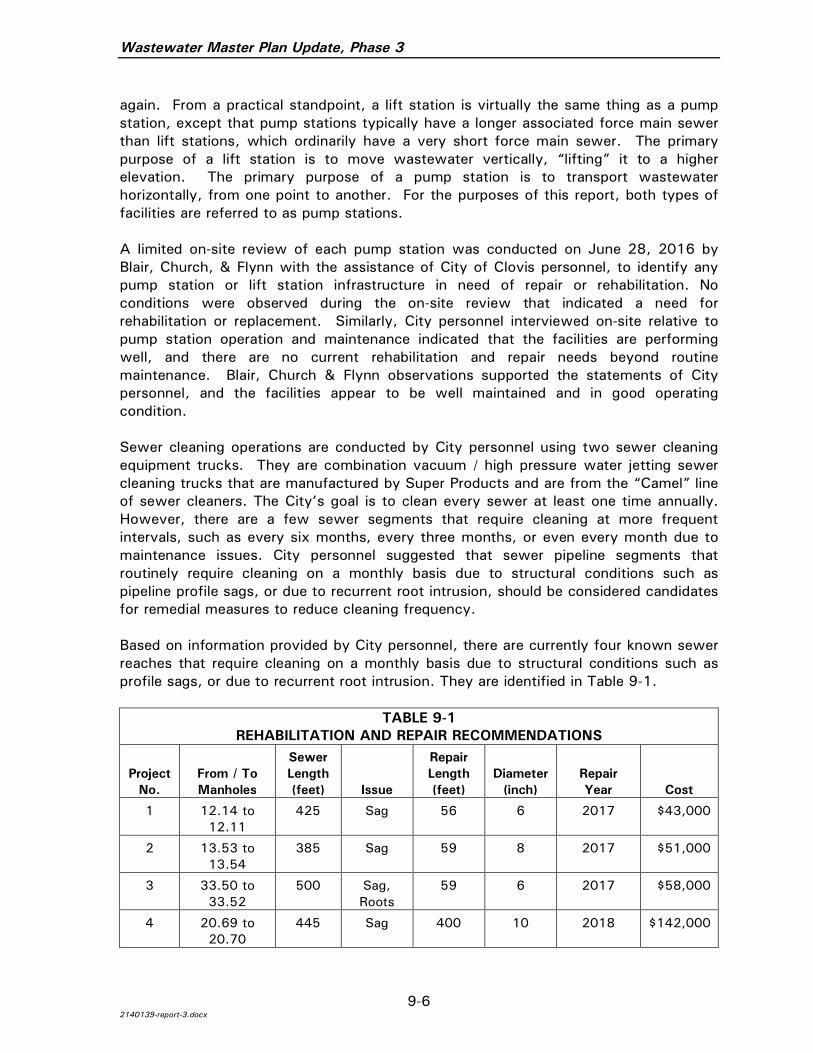
Wastewater Master Plan Update, Phase 3
9-62140139-report-3.docx
again. From a practical standpoint, a lift station is virtually the same thing as a pumpstation, except that pump stations typically have a longer associated force main sewerthan lift stations, which ordinarily have a very short force main sewer. The primarypurpose of a lift station is to move wastewater vertically, “lifting” it to a higherelevation. The primary purpose of a pump station is to transport wastewaterhorizontally, from one point to another. For the purposes of this report, both types offacilities are referred to as pump stations.
A limited on-site review of each pump station was conducted on June 28, 2016 byBlair, Church, & Flynn with the assistance of City of Clovis personnel, to identify anypump station or lift station infrastructure in need of repair or rehabilitation. Noconditions were observed during the on-site review that indicated a need forrehabilitation or replacement. Similarly, City personnel interviewed on-site relative topump station operation and maintenance indicated that the facilities are performingwell, and there are no current rehabilitation and repair needs beyond routinemaintenance. Blair, Church & Flynn observations supported the statements of Citypersonnel, and the facilities appear to be well maintained and in good operatingcondition.
Sewer cleaning operations are conducted by City personnel using two sewer cleaningequipment trucks. They are combination vacuum / high pressure water jetting sewercleaning trucks that are manufactured by Super Products and are from the “Camel” lineof sewer cleaners. The City’s goal is to clean every sewer at least one time annually.However, there are a few sewer segments that require cleaning at more frequentintervals, such as every six months, every three months, or even every month due tomaintenance issues. City personnel suggested that sewer pipeline segments thatroutinely require cleaning on a monthly basis due to structural conditions such aspipeline profile sags, or due to recurrent root intrusion, should be considered candidatesfor remedial measures to reduce cleaning frequency.
Based on information provided by City personnel, there are currently four known sewerreaches that require cleaning on a monthly basis due to structural conditions such asprofile sags, or due to recurrent root intrusion. They are identified in Table 9-1.
TABLE 9-1REHABILITATION AND REPAIR RECOMMENDATIONS
ProjectNo.
From / ToManholes
SewerLength(feet) Issue
RepairLength(feet)
Diameter(inch)
RepairYear Cost
1 12.14 to12.11
425 Sag 56 6 2017 $43,000
2 13.53 to13.54
385 Sag 59 8 2017 $51,000
3 33.50 to33.52
500 Sag,Roots
59 6 2017 $58,000
4 20.69 to20.70
445 Sag 400 10 2018 $142,000
Wastewater Master Plan Update, Phase 3
9-72140139-report-3.docx
An exhibit showing the locations of the recommended rehabilitation and repairrecommendation projects, together with construction cost estimates, is provided inAppendix F.