wastewater re-use stormwater management · wastewater re-use, stormwater management, and the...
TRANSCRIPT
Wastewater Re-useStormwater Managementand theNational Water Reform Agenda
J.F. Thomas / J. Gomboso / J.E. Oliver / V.A. Ritchie
CSIRO Land and WaterResearch Position Paper 1
Wastewater Re-use,Stormwater Management,and the
National Water Reform Agenda
Report to the
Sustainable Land and Water ResourcesManagement Committeeand to the
Council of Australian GovernmentsNational Water Reform Task Force
J.F. Thomas, J. Gomboso, J.E. Oliver, and V.A. Ritchie
CSIRO Land and WaterResearch Position Paper 11997

National Library of Australia Cataloguing-in-Publication Entry
Wastewater re-use, stormwater management, and the nationalwater reform agenda : report to the Sustainable Land and WaterResources Management Committee and to the Council ofAustralian Governments National Water Reform Task Force.
Bibliography.
ISBN 0 643 06050 2.
1. Wastewater re-use – Australia. 2. Water resources development– Australia. 3. Storm sewers – Australia. I. Thomas, John F. II.CSIRO. Land and water. III. Sustainable Land and WaterResources Management Committee. IV. Council of AustralianGovernments. National Water Reform Task Force. (Series :Research position paper ; 1).
628.162
Cover photograph by Bill van Aken, CSIRO Land and Water
Publication enquiries to:Communication OfficerCSIRO Land and WaterCanberra LaboratoryBlack Mountain, ACT 2601Australiaemail: [email protected] ISSN 1329-5713

Preface
N June 1993, the Council of Australian Governments (COAG)requested that a Working Group of officials, under an independent
chair, prepare a strategic framework for efficient and sustainable reformof the water industry, having regard for the technical and policydiversity existing across the States and Territories of Australia. InFebruary 1994, COAG participants committed their governments to theWorking Group’s recommendations with minor detailed modificationsand, in September 1996, ARMCANZ (Agriculture and ResourcesManagement Council of Australia and New Zealand) published GenericNational Milestones for Actions to Implement the Strategic Framework forWater Reform.
As well as highlighting the need for reforms directed at improving theeconomic efficiency of the water industry, the Working Group drewattention to widespread natural resource degradation resulting fromcurrent water allocation and management, and urged all jurisdictions toarrest this process. The Working Group recommended that the strategicframework for reform should include environmentally sustainablemanagement of wastewater and stormwater from metropolitan andtown water services.
This is one of a series of studies coordinated by the Sub-committee onWater Resources of ARMCANZ as a response to the issues raised by theStrategic Framework for Water Reform, 1994.
The Terms of Reference are to:• Examine the ramifications of making greater use of wastewater in urban areas, and strategies
for handling stormwater, including its use, and• Review current approaches to town wastewater and sewage disposal to sensitive environ-
ments, noting that action is underway to reduce accessions to watercourses from key centreson the Darling River system.
The first part of the Terms of Reference was undertaken in conjunctionwith the Australian and New Zealand Environment and ConservationCouncil (ANZECC). The second part was considered as a part of thedevelopment of the National Water Quality Management Strategy, alsoin conjunction with ANZECC. In developing the report, reference hasalso been made to the Ministerial Council for Planning, Housing andLocal Government (MCPHLG).
I

The Study was undertaken under the supervision of a SteeringCommittee comprising:
David Mittelheuser, Department of Land and Water Conservation,New South Wales (Chairman)
Terry Scott, Melbourne WaterAlan Thomas, Commonwealth Environment Protection AgencyVolker Aeukens, Commonwealth Department of Primary Industry
and EnergyJonathan Thomas (Project Leader)
The CSIRO team was:Jonathon F. Thomas (Project Leader)Jeanette GombosoJanice E. OliverVeronica A. Ritchie.
A description of the work program is given in Appendix A. Terry Scottof Melbourne Water coordinated the National Effluent Re-use Surveyreported in the study.
This report addresses issues raised by the policy principles of theCOAG Water Reform Agenda in relation to the re-use of wastewater,improved urban stormwater management, and adoption of superiorpractices regarding disposal to sensitive environments. It is particularlyconcerned with the development of recommendations regarding:• current and potential practices• technical obstacles and opportunities• environmental and public health constraints• economic and incentive structures• the regulatory environment• the role of community involvement• catchment-based resource management, and• development of institutional roles and responsibilities.
The layout of the report follows the three topics which were addressedin meeting the terms of reference:• Part 1 outlines a number of strategic issues for the water sector that
follow from the National Water Reform Agenda, and outlines theproblems encountered with discharges to sensitive environments
• Part II considers re-use of wastewaters• Part III deals with stormwater management.

Following submission of this report as a draft in February 1996, a PolicyDiscussion Paper was coordinated by the Commonwealth Departmentof Primary Industries and Energy for consideration by ARMCANZ.However, the contents and conclusions of this report, are theresponsibility of CSIRO, and are not necessarily endorsed byARMCANZ, or the Department of Primary Industries and Energy.
Jonathon F. ThomasDecember 1996

Acknowledgements
The Project Leader thanks all members of the Study Steering Committee: DavidMittelheuser, the Chairman, for his unstinting support and enthusiasm; Volker Aeukens,for his masterly guidance through ARMCANZ processes; Dr Alan Thomas, for his adviceon ANZECC and MCPHLG linkages; and Terry Scott, who was responsible for theconduct of the National Effluent Re-use Survey.
Many others contributed essential information and constructive ideas, including JeffBrown, Richard Clark, Pat Condina, Wally Fink, Don Gardiner, Peter Hoey, Fred King,Ian lawrence, Cary Reynolds, Des Semple, and Ivan Unkovitch.
The assistance of Phillipa Wittenoom with literature review is gratefully acknowledged.
Finally the authors thank the external referees for their efforts in reviewing the final draftof this report. Nevertheless, CSIRO assumes all responsibility for the contents of thereport.
Jonathon F. Thomas

CONTENTS
EXECUTIVE SUMMARY
A. OVERVIEW OF THE REPORT i
B. ENVIRONMENTAL BACKGROUND iWastewater and Stormwater in the Urban Water Cycle iImpacts of Wastewater and Stormwater Discharges on Receiving Waters iii
C. RE-USE OF WASTEWATERS viPotential for Re-Use viPlanned Re-Use viiiImplications for the COAG National Water Reform Agenda ix
D. IMPROVING STORMWATER MANAGEMENT xiManagement Objectives xiManagement Practices xiiImplications for the COAG National Water Reform Agenda xii
E. RESEARCH NEEDS xv
PART I: BACKGROUND 1
1. COAG’S STRATEGIC FRAMEWORK 3
2. ECONOMIC AND TECHNICAL BACKGROUND 32.1 Demand of Urban Areas on the Water Resource Error! Bookmark not defined. 32.2 Costs 42.3 Externalities 52.4 Technical Change 5
3. DISCHARGE OF WASTEWATERS TO THE MARINE ENVIRONMENT 73.1 Sensitive Marine Environments – Definition 73.2 Overview of Issues 73.3 Projected Discharges of Wastewaters to Marine Environments 83.4 Coastal Water Quality Protection Policies 10
4. DISCHARGE OF WASTEWATERS TO INLAND/FRESH WATERS 124.1 Overview 124.2 Murray-Darling Basin 134.3 Hawkesbury-Nepean River Basin 134.4 Projected Discharges 14
5. INSTITUTIONAL AND REGULATORY FRAMEWORK 165.1 Overview 165.2 Institutional Roles and Responsibilities for Stormwater Management 165.3 The National Water Quality Management Strategy 17

PART II: RE-USE OF WASTEWATERS 19
6. REASONS FOR RE-USE 216.1 Supplementary Supply 216.2 Resource Management 226.3 Cost Minimisation 226.4 Environmental Protection 226.5 Political/Institutional Constraints 22
7. TREATMENT METHODS 24
8. USES FOR RECLAIMED WATER 298.1 Irrigation of Woodlots, Crops and Pastures 308.2 Irrigation of Landscape and Recreational Areas 318.3 Non-Potable Residential Re-use 328.4 Potable Re-use 358.5 Industrial/Commercial Re-use 368.6 Re-use In Groundwater Systems 378.7 Stormwater Re-use 388.8 Sludge Re-use 398.9 Conclusions 40
9. PUBLIC ACCEPTABILITY AND HEALTH ISSUES 409.1 Public Acceptability of Re-use 409.2 Known Public Health Impacts of Re-use Projects 419.3 Role of Re-use Guidelines and of the Regulator 439.4 Conclusions on Public Health and Acceptability 44
10. ECONOMICS OF WASTEWATER RE-USE 4510.1 Engineering Costs 4510.2 Environmental Economic Analysis of Wastewater Re-use Projects 4810.3 Cost of Nutrient Removal 5410.4 Conclusion 55
11. CURRENT AND PLANNED RE-USE OF TREATED SEWAGE IN AUSTRALIA 5711.1 Sources Of Data 5711.2 Australian Capital Territory 5811.3 New South Wales 5911.4 Northern Territory 6211.5 Queensland 6311.6 South Australia 6511.7 Tasmania 6811.8 Victoria 7011.9 Western Australia 7211.10 National Outlook For Re-use 75
12. WASTEWATER RE-USE AND THE NATIONAL WATER REFORM AGENDA 8612.1 Initiation of Re-use Projects 8612.2 Re-use and Contestable Markets 8712.3 Pricing of Reclaimed Water and its Alternatives 8812.4 Pricing of Water Utility Inputs 8812.5 Regulation 8912.6 Public Acceptability 9012.7 Re-use Guidelines 91
PART III: STORMWATER MANAGEMENT 93
13. OVERVIEW 9513.1 Definitions 9513.2 Institutional Context 9513.3 Stormwater Quantity and Quality 9513.4 Stormwater Systems in Australia and Overseas 96
14. ENVIRONMENTAL IMPACTS OF STORMWATER DISCHARGES 9714.1 International Experience 9714.2 Environmental Impacts of Urban Stormwater Discharges in Australia 98
15. CHANGING OBJECTIVES OF STORMWATER MANAGEMENT 101
16. STORMWATER MANAGEMENT PRACTICES 10216.1 Overview of Practices 10216.2 Structural In-line Controls 10316.3 Structural Source Controls 10516.4 Non-structural Source Controls 10816.5 Combined Sewer Overflows 10916.6 Summary: Management Approaches 112
17. PUBLIC INVOLVEMENT IN STORMWATER MANAGEMENT 11317.1 International Experience 11317.2 CSIRO Study 114
18. ECONOMICS OF STORMWATER MANAGEMENT 11618.1 Magnitude of Stormwater Pollution Abatement Costs 11618.2 Applying Economic Principles to the Problem of Stormwater Management 11918.3 Financing Stormwater Management Programs 12218.4 Conclusions 123
19. INSTITUTIONAL ARRANGEMENTS FOR STORMWATER MANAGEMENT 12319.1 COAG’s Institutional Principles for Water Resources Management 12419.2 Institutional Responses in Other Countries 12519.3 Institutional Arrangements in Australia 12919.4 Conclusion 136
20. RESEARCH NEEDS 138
21. BIBLIOGRAPHY 141
APPENDICES
A. STUDY WORK PROGRAM
B. WASTEWATER DISPOSAL PRACTICES IN AUSTRALIA
C. WASTEWATER RE-USE PRACTICES IN AUSTRALIA, WITH SOMEINTERNATIONAL EXAMPLES
D. NATIONAL EFFLUENT RE-USE SURVEY, 1994 QUESTIONNAIRE
LIST OF TABLES
LIST OF FIGURES
GLOSSARY OF TERMS
ACRONYMS

executive summary (i)
EXECUTIVE SUMMARY
This Executive Summary comprises five sections:
A. Overview of the ReportB. Environmental BackgroundC. Re-use of wastewatersD. Improved management of stormwatersE. Research needs.
A. OVERVIEW OF THE REPORT
A.1 This report presents possible policy directions for wastewater re-use and improv-ed stormwater management, given the emerging water sector framework set out in theCOAG National Water Reform Agenda.
A.2 The strategic framework for reform of the Australian water sector involvesenvironmentally sustainable management of wastewater and stormwater from metro-politan and town water services.Specifically, an improved quality of natural environ-ment needs to be sustained in urban regions, including the marine and estuarineenvironments of coastal cities, and the riverine or lacustrine environments of inlandcities and towns.
A.3 In general, more intensive management of water supply systems is recommended,including:
• the use of reclaimed water within municipal and industrial systems• the capture, storage, distribution and use of hitherto ‘uneconomic’ near-urban
sources, such as local stormwater either of high initial quality or with treatment• introduction of a quality-differentiated water supply: i.e., matching the quality
and reliability of water supplied to each market segment to that actually neededby the user.
A.4 Improved management of the urban water cycle is needed to address growingproblems of pollution, and to enhance the amenity values of urban waters.
B. ENVIRONMENTAL BACKGROUND
Wastewater and Stormwater in the Urban Water Cycle
B.1 The volumes of treated sewage and stormwater runoff are very large componentsof the urban water cycle. The amount of stormwater runoff varies with rainfall andland surface properties.

executive summary (ii)
B.2 The following table, taken from the 1985 Review of Australia’s Water Resourcesand Water Use (Department of Primary Industries and Energy, 1987), illustrates thisfor the principal metropolitan regions.
Table i. Mean annual runoff, developed surface and groundwater resources, grosswater consumption and wastewater flow in Australia’s metropolitan regions(GL)
WaterRegion
MeanAnnualRunoff
Average Yieldof DevelopedSurface Sources
GroundwaterProduction
Gross WaterConsumption
WastewaterFlow
Brisbane 1860 555 60 331 116Sydney 3900 581 11 620 424Melbourne 1650 548 19 479 340Adelaide 441 109 44 251 183Perth 1260 213 226 369 76Notes: (i) All data are representative at 1985, except wastewater flow, taken from the National Effluent Re-
use Survey, 1994 (this report) (ii) The mean annual runoff data includes the Brisbane, Hawkesbury-Nepean, Yarra and Swan Rivers.
B.3 Stormwater and treated wastewater thus offer a large potential resource for econ-omic and environmental benefits. The main factors which have limited their use havebeen the temporal variability of flow, limitations on available storage, and the qualityof wastewater and stormwater.
B.4 Expected growth in Australian wastewater flows for 1994, 2000 and 2020(derived from the National Effluent Reuse Survey 1994), is shown below.
0
500000
1000000
1500000
2000000
2500000
3000000
1994 2000 2020
Year
ML/yr
FIGURE i. Australia-wide Volume of Wastewater
executive summary (iii)
Impacts of Wastewater and Stormwater Discharges on Receiving Waters
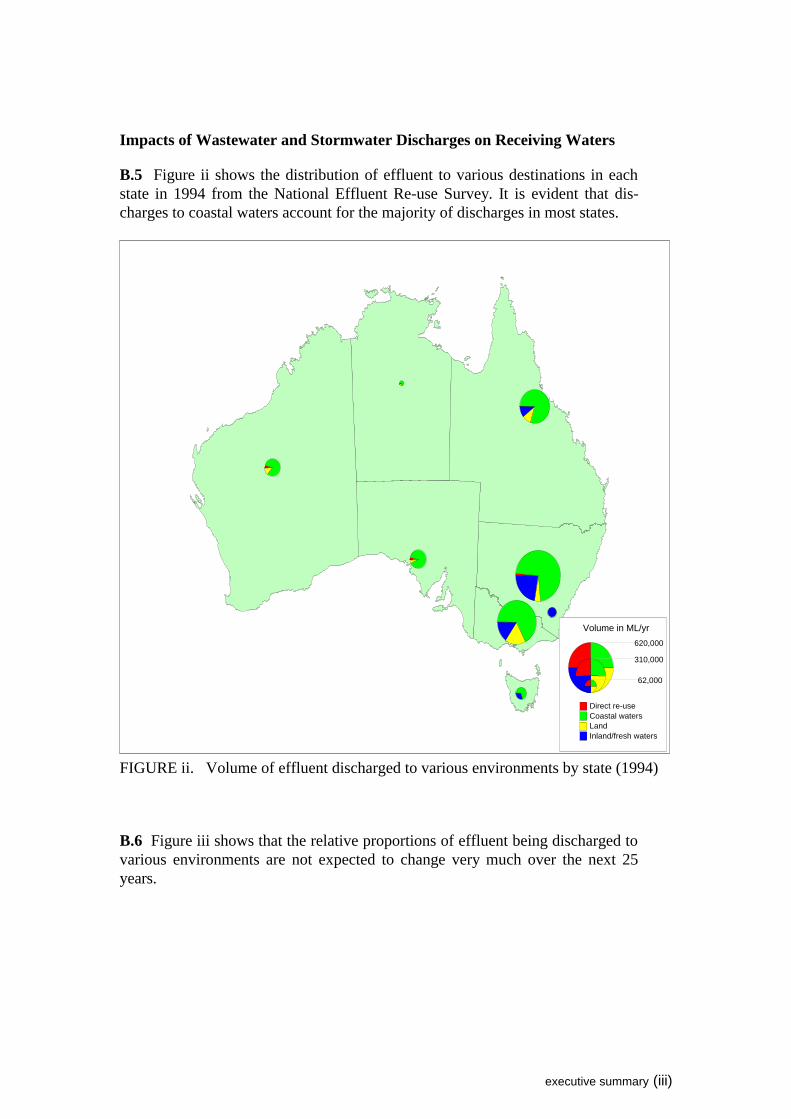
B.5 Figure ii shows the distribution of effluent to various destinations in eachstate in 1994 from the National Effluent Re-use Survey. It is evident that dis-charges to coastal waters account for the majority of discharges in most states.
Volume in ML/yr
620,000
310,000
62,000
Direct re-useCoastal watersLandInland/fresh waters
FIGURE ii. Volume of effluent discharged to various environments by state (1994)
B.6 Figure iii shows that the relative proportions of effluent being discharged tovarious environments are not expected to change very much over the next 25years.

executive summary (iv)
1994Land13%
Inland/fresh w aters
19%
Coastal w aters67%
Direct re-use1%
2000
Inland/fresh w aters
13%
Coastal w aters73%
Land11% Direct re-use
3%
2020Land13%
Inland/fresh w aters
12%
Coastal w aters72%
Direct re-use3%
FIGURE iii. Per cent of effluent discharged, by category (1994–2020)
executive summary (v)
Coastal waters
B.7 Although controls on discharges of wastewater and stormwater to sensitiveenvironments are showing signs of improvement, coastal waters near urban con-centrations are still suffering from declining water and sediment quality; loss ofmarine and coastal habitat; unsustainable use of marine and coastal resources;and the lack of strategic, integrated planning. Key problem areas are:
• elevated levels of nutrients and sedimentation in coastal water bodies nearurban areas, which are largely the result of inappropriate catchment landuse practices, sewage discharges and urban runoff
• algal blooms, including blue-green algae which are now common in manyestuaries and bays. Eutrophication is a serious threat to estuaries, temperatesea grass and tropical corals
• increased litter, reducing the recreational and scenic value of many coastalareas, and affecting wildlife
• heavy metals including mercury, cadmium and lead present in urbanwastewaters and
• organochlorines or chlorinated compounds used as herbicides and insecti-cides in agriculture and industry which are toxic to marine life and are bio-accumulated in marine food chains.
B.8 Coastal lakes, which have limited ocean water exchange, have been partic-ularly affected by terrestrial runoff. Significant losses of saltmarsh and man-groves around urban areas, caused by reclamations, drainage, and other develop-ments, are affecting fish and other sea life which use the mangrove areas asnurseries and feeding grounds.
B.9 The need to provide enhanced protection of coastal environments has beenrecognised by the Commonwealth, States and Territories. The Resource Assess-ment Commission (1993), for example, made many recommendations includinga National Coastal Action Program to be implemented by all three levels of gov-ernment in consultation with industry and community groups. Existing coastalwater quality protection policies include:
• catchment management programs to reduce soil erosion and discharge ofnutrients to receiving waters
• systems of water quality protection for specific uses• the National Water Quality Management Strategy (NWQMS), which will
provide a general framework of guidelines for water quality managementin the coastal zone
• National State of the Environment Reporting Program, under which a setof environmental indicators is proposed to be developed for future quan-titative reporting.
B.10 Results of the National Effluent Re-use Survey, 1994 conducted in thisstudy indicate that discharges of town wastewater to coastal waters could in-crease by 50% between 1994 and the year 2020.
executive summary (vi)
B.11 Improved wastewater and stormwater management can help in addressing:
• declining quality of marine and coastal water and sediments, particularly as aresult of inappropriate catchment land use practices
• loss of marine and coastal habitat• unsustainable use of marine and coastal resources and• lack of strategic, integrated planning in the marine and coastal environments.
Inland waters
B.12 Australia’s inland rivers are subject to many environmental problems. Mostrelevant to wastewater re-use are increased nutrient levels and altered flow regimes.
B.13 The National Effluent Re-use Survey, 1994 indicates that discharges of townwastewaters to Australian inland/fresh waters will increase in volume by 30%, be-tween 1994 and the year 2020. However, in NSW and Queensland the increases willbe 70% and 55% respectively unless there is a reduction in wastewater flow or anincrease in projected reuse, including land disposal.
B.14 In response to rising concern at the level of nutrients and eutrophication, theMurray-Darling Basin Commission has established a nutrient management strategy. In1992 a Blue-Green Algae Taskforce considered control actions, including the reducednutrient discharges from sewage treatment plants. The Commonwealth has sinceprovided $60 million for upgrades of town sewage treatment plants in the Darlingsystem.
B.15 In line with recommendations in the 1994 Algal Management Strategy for theMurray-Darling Basin, discharges to all inland waters should be managed to controlnutrient concentrations in receiving waters, and to improve flow regimes. Further:
• wastewater re-use and land application systems should be implemented whereappropriate and cost effective
• water quality monitoring programs should be enforced where discharge to waterbodies will continue in the future, and
• new urban developments should be monitored to ensure that pollutants are notaccumulating in local waters.
C. RE-USE OF WASTEWATERS
Potential for Re-Use
C.1 All Australian jurisdictions should recognise that re-use of wastewaters presentsa viable and attractive alternative source of water supply, which may contribute to theabatement of environmental problems.
Specifically, there is potential for wastewater re-use schemes to:
• augment limited primary water sources• help prevent excessive diversion of water from alternative uses, including the
natural environment• manage in-situ surface and groundwater resources

executive summary (vii)
• minimise infrastructure costs, including total treatment and discharge costs• reduce or eliminate discharges of treated sewage to receiving waters, and• satisfy political, community and institutional constraints.
C.2 In general, sewage offers a better source for reclamation and re-use than storm-water runoff from developed areas. This is because its flow is regular, the collectionsystem is in place, treatment facilities already exist, and the contaminants present inindividual sewage streams are known and temporally relatively invariate. However,there is also considerable scope for improved management of stormwater runoff fromless-developed parts of urban regions so as to achieve some re-use, improved land-scape features, better flow regulation and improved pollution outcomes for receivingwaters.
C.3 New treatment technologies and methods of hydraulic, hydrological and geo-hydrological management are increasing the scope for wastewater re-use and im-proved management of stormwater, and reducing the relative costs.
C.4 The relative costs of continuing to employ traditional approaches are increasingin both economic and environmental terms.
C.5 Internationally, there is increasing adoption of the new approaches. In OECDcountries, some cities now provide up to 30% of their total water needs from re-claimed wastewater.
C.6 A more sophisticated water market in urban areas would provide quality-differentiated supplies for appropriate market segments. The study has concluded thata variety of urban water demands could be effectively supplied by reclaimed water,either to potable or non-potable standard.
• The potential residential market for reclaimed water is large. New develop-ments, where dual reticulation can be incorporated into the design and costing,offer the best opportunities.
• As the cost of treating water to potable standards decline, this option maybecome more attractive over time.
• Without adequate levels of treatment, greywater is probably only acceptable forsub-surface garden irrigation. In this case, capital costs of setting up theseschemes may be the major limitation.
• The market for urban irrigation depends on the amount of public open space andthe level of irrigation required. Although small in overall terms, the urbanirrigation market can be significant in reducing discharges to sensitive environ-ments.
• Industrial use of reclaimed water is an important market. Industry and commerceuse approximately a third of urban water in Australia and the demand pattern isrelatively constant throughout the year. Due to the variations in water qualityrequirements of different markets, adequate treatment levels must be ensured toavoid problems such as corrosion, staining, scale deposition and foaming.
• Irrigated agriculture and woodlots on the fringes of urban areas is an importantmarket
executive summary (viii)
• In country towns, there is also considerable scope both for re-use in irrigation,and for land disposal.
C.7 In the longer term there is the opportunity to re-configure the water supply andwastewater systems even in established areas. The present water infrastructure is quiteold in parts, and has been developed over a period when management objectives werevery different. Hence, the retrofitting of existing areas with dual reticulation systems,possibly from treatment plants built on existing trunk sewers, is becoming a feasibleoption, both technically and economically. Advances in trenchless technology are re-ducing the costs of retrofitting with dual reticulation. As the number of technicaloptions increases there is increasing need to evaluate decentralised systems against themore traditional centralised systems. Finally, redevelopment provides an opportunityfor a re-assessment of the storm drainage system, and integrating it with total watercycle management.
Planned Re-Use
C.8 The population of Australian states and territories is increasing. Wastewaterflows have also been increasing, with resultant demands for new disposal facilities.Results of the National Effluent Re-use Survey, 1994 suggest that total wastewaterflows into treatment plants may increase by nearly 50% between 1994 and 2020.
C.9 The combined effects of these trends is that a greater amount of wastewater willhave to be disposed of, or re-used in the future. While the implementation of waterdemand management programs including economic pricing will tend to reduce totalwastewater flows, these policies will not influence the pollutant loads in wastewaterwhich are likely to continue to increase on a per capita basis.
C.10 Table ii gives the reported wastewater flows in each state and territory in 1994,and summarises current expectations of future volumes and the distribution of dis-charges to land and water.
C.11 While total re-use nationally is expected to increase from 18 GL in 1994 to 64GL by the year 2020, this falls far short of the total estimated increase in wastewaterflow of 800 GL over the same period. Consequently, wastewater utilities are generallyprojecting continued increases in discharge to coastal and inland waters.
C.12 However, the above projections of direct re-use and discharge to land should beregarded as minima, based on confirmed schemes or adopted targets at the State/Territory level. In future it is likely that utilities will seriously examine re-use optionsand that the actual outcome will be for more re-use than appears from these pro-jections, especially if the recommendations in this report are implemented.

executive summary (ix)
Table ii. Current and future discharge volumes, 1994 to 2020 (GL/yr)
Disposed to: ACT NSW NT QLD SA TAS VIC WA TOTALIn 1994Land – 28 1 31 7 – 82 13 162Direct re-use – 9 – 1 3 1 1 3 18Inland/freshwaters 33 138 1 32 2 14 74 1 295Coastal waters – 443 9 240 93 35 326 77 1225Total 33 618 11 304 105 50 483 94 1700
By 2020Land 2 47 2 48 7 – 135 29 270Direct re-use – 29 – 2 3 1 13 15838 64Inland/freshwaters 48 234 1 49 1 17 30 – 382Coastal waters – 661 12 372 101 42 461 154 1803Total 50 971 15 471 112 60 639 198 2519Source: National Effluent Re-use Survey, 1994 (this report)
Implications for the COAG National Water Reform Agenda
C.13 Key elements of the COAG framework deal with pricing, contestable markets,water allocation and entitlements, institutional arrangements, consultation and edu-cation needs. These categories have been used to structure the recommendations,given below.
Pricing and contestibility in water markets
C.14 In relation to costs, which directly govern price levels, it is recommended that:
• urban water demands need to be satisfied at acceptable social costs (includingdirect and indirect costs of disposal) by means which reduce the aggregatevolume diverted from ‘non-urban’ uses
• emerging cost pressures associated with augmenting water supplies throughtraditional water sources need to be alleviated
• the emerging escalation of maintenance and replacement costs, needs to beaddressed through more efficient infrastructure concepts
• the volume of sewage required to be transported long distances across cities fortreatment must be reduced
• the environmental costs of disposal need to be minimised.
C.15 Water industry regulators in each jurisdiction should ensure that inefficientinstitutional impediments and cost or pricing distortions affecting potential re-useprojects are removed. In particular, the pricing of reclaimed water should reflect itssystem-wide costs, including cost savings achieved at the source and sink ends of thewater cycle through the introduction of re-use projects. Alternatively the pricing ofconventional water-sewage systems should reflect environmental damage and

executive summary (x)
abatement costs. In some situations compensation may need to be paid to waterutilities under the community service obligations framework for this to occur.
C.16 Water industry regulators should examine the full range of opportunity costs ofraw water diversion by industries, agriculture, commerce, local authorities, the publicsector and private households; and impose cost recovery and resource rental chargeswhere appropriate.
C.17 Corporatised water utilities should not be allowed to pre-empt fair competitivewater supply activities including re-use projects by other groups. Specifically, thefollowing should be discouraged:
• charging non-users of utility infrastructure (for example, charging sewage ratesirrespective of whether a household is connected)
• denying third party access to wastewater flows for legitimate re-use purposes• cross-subsidising particular high-cost conventional water supplies and contrac-
tual arrangements with related organisations such as suppliers, water retailers,and build-own operators or water users, which exclude competitive supplyactivities involving re-use.
C.18 Governments and water industry regulators should promote contestability inwater markets by actively supporting requests for access to water infrastructure andwater resources, including wastewater, by third parties such as households, industry,commerce, local government, universities and the public sector generally; and bypermitting such entities to engage in water production including reclamation, subjectto the normal public interest conditions.
Water allocation and entitlements
C.19 It is not always clear whether a corporatised or privatised wastewater utilityactually owns the sewage that it transports and treats. A clearer definition ofownership of wastewaters, and more clearly defined allocation rights andresponsibilities for wastewater is required.
Regulatory framework
C.20 Three regulatory structures are essential for successful wastewater reclamationprojects:
• an economic regulator: to ensure contestable markets and pricing• an environmental/water resources regulator: to ensure that target quality of
receiving waters is set appropriately, and is met by the industry• a quality control regulator for the reclamation process.
C.21 While the first two are generally present in Australian jurisdiction, more atten-tion needs to be paid to the third if there is to be an active water re-use industry. Stateand Territory governments should establish independent regulatory jurisdictions gov-erning the operations of re-use projects. These should require weekly plant perform-

executive summary (xi)
ance data and exception reports from wastewater agencies, plus some monitoring ofthe distribution system for reclaimed water.
C.22 In all States and Territories throughout Australia, the approval of both theHealth Department and the Department of Environmental Protection should be re-quired before re-use schemes can proceed.
C.23 The NWQMS Draft Guidelines on wastewater re-use should be adopted as thebasic standard for wastewater re-use in Australia. The Draft Guidelines should beexpanded in order to relate reclaimed water quality guidelines more closely to thetechnologies to be employed in applying the product water. Editor’s Note: thisrecommendation was adopted and influenced the final Guidelines.
C.24 An additional set of NWQMS Guidelines should be promulgated for artificialinjection of urban wastewaters into groundwater aquifers for subsequent re-use, basedon research recently conducted on behalf of Urban Water Research Association ofAustralia (UWRAA) by the CSIRO Centre for Groundwater Studies (CGS).
Consultation and education
C.25 Communities currently express mixed views on the acceptability of re-useschemes. There is public resistance to current disposal methods, which have been seenas both environmentally damaging and the waste of a potentially valuable resource.On the other hand, the community needs assurance about public health implicationsassociated with wastewater re-use.
C.26 Community education and pilot demonstrations of re-use projects should beencouraged. Public education and public involvement programs should includeschools programs, visitor programs to treatment facilities, general public informationprovisions and community involvement in decision making about new re-useschemes. Water utilities and governments should ensure that the public is wellinformed about re-use schemes and involved in decisions to undertake them.Treatment schemes should include the necessary precautions to ensure that thepotential risk of disease transmission is within acceptable limits.
D. IMPROVING STORMWATER MANAGEMENT
Management Objectives
D.1 Internationally, a revolution is taking place in the way the water cycle of urbanareas is planned and managed. In Australia this is related to increasing evidence of theenvironmental impacts of stormwater discharges.
D.2 More attention is being given to water issues in urban planning, landscapemanagement and environmental management, so as to naturalise urban water coursesand water bodies, and to harvest and store treated wastewater and stormwater,including the artificial recharge of aquifers near towns and cities. Stormwatermanagement objectives are thus being widened so that re-use, pollution control, envi-ronmental amenity and ecological integrity are being set alongside traditional flood

executive summary (xii)
control objectives for drainage systems. These additional objectives are not generallyin conflict with flood control objectives, but they do imply a considerable broadeningof design considerations, and the extension of responsibility for stormwater pollutionmanagement to all sections of society.
D.3 For new urban developments, the concept of integrated water cycle managementand the related development of water-sensitive urban design guidelines, are replacingtraditional drainage design principles. In older urban areas, large costs are being facedfor upgrading old and degraded systems, particularly where sewer overflows contrib-ute to stormwater pollution.
D.4 Water-quality parameters were not a design criterion for many existing drainagesystems during their planning. Stormwater systems in Australian cities are eitherunder-designed or under-performing due to deterioration, inadequate attention to satis-fying all management objectives, insufficient capital and operational expenditure, in-adequate technical implementation, lack of public commitment and inappropriateinstitutional structures.
Management Practices
D.5 A wider set of stormwater management practices needs to be applied. Thesegenerally require action by numerous agents in society, as well as drainage utilities.
D.6 Stormwater management practices may be usefully categorised as:
• structural verses non-structural and• source control verses in-line controls verses end-of-pipe treatments.
D.7 New technical developments will make the achievement of multi-objectivemanagement of stormwater systems easier in the future, given an institutional struc-ture that encourages innovation.
D.8 While Australian cities generally have separate storm drainage and sewersystems, internationally there is a growing consensus that a mixture of combined (san-itary and storm sewers) and separate systems is likely to be optimal for many urbanregions. The dangers of illicit discharges to storm drains and sewers, and the diffi-culties of preventing cross-connections in separate systems are strongly emphasised.
Implications for the COAG National Water Reform Agenda
Pricing
D.9 There should be reform of existing drainage rating systems, which should bereplaced by charges on households and organisations which more accurately reflectthe costs of planned stormwater management programs.
D.10 More attention should be given to the design of polluter-pays systems underwhich the owners of urban stormwater systems should pay state governments

executive summary (xiii)
according to the level of pollution discharged to receiving waters. However, thisrecommendation is unlikely to be acted upon in the absence of institutional reform(see below).
Institutional reform
D.11 Within most jurisdictions there is a need for extensive reform of the institutionalstructures for stormwater management, to complement the corporatisation of waterutilities and to create explicit roles for state and local governments. While the appli-cation of the principles for institutional development so far enunciated and acceptedby COAG is necessary, the principles are not in themselves sufficient for improvedstormwater management. In all jurisdictions, the responsibilities defined at state levelfor setting the broad water resource and environmental policies need to be separatedfrom those of detailed stormwater catchment planning and management undertaken byurban catchment management bodies.
D.12 The principle of separation of powers and responsibilities, and the historical andpotential future roles of local governments, imply that bodies established for the pur-pose of urban catchment management should preferably be owned by local govern-ments and be accountable to environmental regulators at state/territory level for theachievement of agreed targets within a polluter pays framework.
D.13 In all jurisdictions the statutory objectives of urban catchment managementbodies should include flood management, water quality, environmental amenity andecological integrity. Stormwater management targets should be set with reference tothe National State of the Environment Reporting System.
D.14 Urban catchment management bodies should have the power to obtain revenueeither from local government or through direct charges on households and organi-sations in the private and public sectors, to employ relevant staff and to commissionworks. Catchment bodies should be empowered to set up contractual undertakings byother organisations in the public or private sectors to carry out the catchment manage-ment program. They should also have the power to institute stormwater managementby-laws, including those related to the introduction of economic instruments. Theyshould publish annual reports of their operations and planning activity. D.15 The roles and responsibilities of catchment management bodies should includethe preparation of catchment management plans which:
• identify catchment conditions requiring attention and articulate existing priori-ties of the managing agency
• satisfy specific water quality objectives, particularly regarding conservation ofscarce resources and provision of a range of environmental needs
• list possible management responses, including both structural and non-structuraloptions, and considering source control as well as pollution interception
• specify a stormwater management program which identifies costs, timelines, andthe agencies which are to be responsible for carrying out each required action
• put in place a consultation process that improves the coordination of policies,and
• provides a framework for multi-functional planning.

executive summary (xiv)
D.16 Deciding on the appropriate level of investment in stormwater managementprograms requires some judgement about whether the projected flood control andpollution abatement expenditures needed to attain various target levels of outcome,are justified in economic terms. In general, the amount of economic resources allo-cated to urban stormwater management should be increased in line with requiredabatement expenditures.
D.17 Best Management Practices (BMPs) must be selected carefully to provide thehighest value for money spent. Economic analysis must consider operational andmaintenance costs as well as capital expenditures, as these constitute the greater partof total costs at all treatment levels considered.
D.18 Managers of stormwater programs need to ensure that account is taken ofongoing maintenance and performance-monitoring requirements.
D.19 Technical innovation and multi-objective management of stormwater systemsshould be encouraged. The potential for a mixture of combined (sanitary and stormsewers) rather than the separate storm drainage and sewer systems which currentlyexists in Australia should be evaluated.
Urban planning
D.20 The approach of water-sensitive urban design should be strongly supported asone method of dealing with urban change, via the:
• recognition of stormwater and wastewater as a resource• increased treatment of stormwater and wastewater for re-use, in order to reduce
demand on the drinkable water resource, and• use of integrated catchment management as the primary water management tool.
D.21 Principles and guidelines are needed for the development and implementation ofintegrated design approaches to achieve sustainable levels of environmental enhance-ment in urban floodways and corridors. Stormwater management design approachesrequire sensitivity to ecological aspects, planning, landscape design and local cultural/historical needs, and should be done in the context of master plans describing landuse, drainage requirements in terms of flow paths, flow detention devices, and poll-ution control.
D.22 For new urban developments, integrated water cycle management and the rel-ated development of water-sensitive urban design guidelines, need to replace tradit-ional drainage design principles.
D.23 Given the complexity of any stormwater management plan, some overall assess-ment framework encompassing bio-physical, economic, equity and other issues isneeded. Multi-objective analysis, that takes account of expected biophysical out-comes, projected abatement expenditure levels, specific damage costs, and otherfeatures of the plan that are not measured in monetary terms is one such framework.

executive summary (xv)
Consultation and education
D.24 Public education and public involvement are important elements of anystormwater management program, and should be encouraged. The total catchmentmanagement movement so evident in rural Australia needs adaptation if it is to besuccessful in urban areas. There needs to be better general understanding of how thebehaviour of individuals can really help to address stormwater objectives, particularlyin the area of a number of gross pollutants. Individual initiative need to be accom-panied by clearer definitions of institutional roles, required public investment, techni-cal advice and environmental policies that deal with systemic inadequacies.
D.25 The Commonwealth should support a new Urban Water Care Movement. Initialcomponents could include:
• a public awareness campaign ($2 million/yr for 3 years)• educational materials ($2 million/yr for 3 years)• support for community groups in urban catchments ($2 million/yr for 3 years)• loan scheme for local authorities engaging in urban catchment management
programs ($5 million /yr for 10 years) and• capital grants for minor capital works which demonstrate pilot schemes, and
management methods for water reclamation and integrated stormwater manage-ment ($20 million/yr for 5 years).
D.26 Although public information is an important component for raising communityawareness, based on international experiences, more efforts should be devoted toencouraging the community to provide comment and feedback on stormwater man-agement practices.
D.27 Compliance should be recognised as the key to the success of various storm-water control policies (such as pet control), and this may be achieved by both enforce-ment and community education/cooperation.
D.28 Drain labelling is a means of increasing public awareness of stormwater sys-tems. Community stormwater groups may take on the drain labelling program as aspecific task. The dumping of paints, oils, solvents and garden cuttings into drainagesystems are particular target activities that might be modified by increased awareness.
D.29 The general promotion of recycling is recommended as an important part ofproduct controls, and particularly the re-cycling of packaging materials which consti-tute a significant portion of litter in stormwater.
E. RESEARCH NEEDS
E.1 The Commonwealth should set up a new Research and Development Corporationfor the Urban Environment, including the urban water environment. It should dealwith issues of urban water cycle management, water pollution, air pollution, energyuse and waste management. The budget should be similar in size to that of the Landand Water Resources Research and Development Corporation, which is focussed onnon-urban resource management issues.

executive summary (xvi)
E.2 There is an urgent need for a national research project to examine options forimproved urban water cycle management and infrastructure cost reduction. Thisshould be supported by the Commonwealth in association with the Water ServicesAssociation of Australia.
E.3 It is recommended that a national study of the direct and external costs andbenefits of conventional versus re-use water systems be undertaken under the auspicesof UWRAA (Sections 12.3 and 14.4). There is a growing need for environmentaleconomic studies that:
• demonstrate the community’s willingness to pay for improved water quality inurban regions
• provide estimates of environmental damages associated with the degradation ofsensitive environments, and
• develop indicative estimates of the cost schedule for ascending levels ofabatement.
E.4 A national survey of community attitudes and knowledge of issues relating towater re-use is needed as a basis for planning further community involvement in waterre-use planning and implementation.
E.5 Further research is needed into the hydrological and ecological implications ofeffluent and stormwater discharges in sensitive environments.
E.6 Research into Australian microbial species that may be associated with re-usedwastewaters should be encouraged.
E.7 Research into methods of storage and of seasonal demand equalisation forreclaimed water should be supported.
E.8 A case study in a newly-developing urban region should be supported by theCommonwealth in which concepts and prototype designs for integrated urban waterresources management are demonstrated. This could be a world-first.

PART I:
BACKGROUND

2

3
PART I: BACKGROUND
1. COAG’S STRATEGIC FRAMEWORK
The COAG Working Group on Water Reform, 1994, advocated that a strategicframework for the water sector be adopted throughout Australia based on eight policyprinciples, as follows:
• water policy should deliver on the agenda for ecologically sustainabledevelopment
• pricing should reflect supply costs, including environmental costs, with allcross-subsidies and community service obligations being made transparent
• there should be consistency in pricing, property rights, water trading andenvironmental allocations
• water should be employed in higher value uses within the social, physical andecological constraints of catchments
• institutional arrangements and responsibilities should be clearly defined• an integrated catchment management approach should be used in water resource
management• measures to address structural and social impact of reform should be
implemented• there should be community involvement in the reform process.
The COAG framework thus raises new questions for the managers of sewage andstormwater. This part of the report provides an overview of strategic developmentswhich are likely to affect future opportunities and constraints for the planning andmanagement of wastewater and stormwater systems. Economic and technical issuesare considered first. Sections 3 and 4 provide an overview of issues, policies andpractices related to the discharge of wastewaters to sensitive environments. Themarine environment, including coastal rivers, lakes and estuaries is presented insection 3, and the inland river basins in Section 4. In this report both sewage effluentsand stormwater runoff are considered as wastewaters. Finally, Section 5 introduces theissue of changing institutional roles and responsibilities.
2. ECONOMIC AND TECHNICAL BACKGROUND
2.1 Demand of Urban Areas on the Water Resource
Urban areas use only 21% of Australia’s diverted water resources (Department ofPrimary Industries and Energy, 1987). However the water that is diverted for urbanuse, which is mainly drawn from areas close to the towns and cities, is of very highvalue, both in its current use, and in alternative uses. These alternative uses are often

4
derived from the proximity of the city itself, and include high-value crop irrigation,recreation and maintenance of the natural environment.
The diversion of water to urban uses, including residential, commercial, social andindustrial applications thus involves a transfer from lower to higher-value uses. Suchtransfers are often economically optimal. But it is also true that if urban demands canbe satisfied at an acceptable cost by means which reduce the aggregate volume divert-ed from the alternative ‘non-urban’ uses, then society as a whole will be better off.The re-use of wastewater and harvesting of stormwater are clearly of interest aspossible method of achieving this aim.
2.2 Costs
For some Australian towns and cities the future costs of augmenting water supplieswill be high if development continues to rely on conventional sources. For example,when water demand reaches the current capacities of pipelines that supply Adelaideand the Northern Spencer Gulf from the Murray River, further conventional sourcedevelopment will be costly, requiring new long-distance pipelines. Problems of highcost for additional water supplies are encountered in remote towns of arid Australiawhich exist to service the mineral and processing industries. More intensive use andrecycling of locally-available water may contribute to the avoidance of such highcosts.
Within some metropolitan areas the costs of water supply and sewerage are highsimply because the upgrading of cross-city trunk capacity is expensive. For example,augmentation of Melbourne Water’s capacity to supply developments in its westernregion involves long-distance trunk mains. More intensive urban water cycle manage-ment offers hope of alleviating some of these emerging cost pressures, by reducing thecapacity requirements for such cross-metropolitan transfers. The same applies withsewerage. For example, any urban development on the northern periphery of Mel-bourne would require increased trunk sewer capacity to the two main sewage treat-ment plants located in the south east and south west of the metropolitan area. Anymeans of reducing the volume of sewage required to be transported long distancesacross the city for treatment is likely to have a high benefit.
Another cost pressure is coming from society’s insistence that a higher quality ofnatural environment should be sustained in urban regions, including the estuarine andmarine environments of coastal cities, and the riverine or lacustrine environments ofinland towns and cities. The costs of end-of-pipe abatement facilities required to reachtarget environmental quality can be very high. Water utilities have no alternative butto pass these costs on to consumers.
Finally, the Australian water sector is facing an emerging cost escalation through theneed to maintain or replace ageing infrastructure. The works that were undertaken inthe period of rapid urban growth dating from the middle of this century are nowbeginning to require refurbishment. The full impact of this will be felt in the early

5
decades of the 21st century. Replacement infrastructure could include re-use featuresand higher performance standards for sewer overflows.
In terms of urban water-related costs, it is recommended that: • urban water demands should be satisfied at an acceptable cost by means which reduce the aggregate
volume diverted from the alternative ‘non-urban’ uses, thereby making society as a whole better off• emerging cost pressures associated with augmenting water supplies through traditional water sources
need to be alleviated• the emerging escalation of maintenance and replacement costs, needs to be addressed by more
efficient infrastructure concepts, and• the volume of sewage required to be transported across cities for treatment must be reduced.
2.3 Externalities
Following the corporatisation or privatisation of water utilities, any environmentalbenefits or costs resulting from fresh water diversion or wastewater dischargesbecome externalities that are not reflected in the utilities’ financial accounts, unlesssome other institution imposes charges on (or payments to) the utility reflecting thesesocial costs (or benefits). The external impacts could not, therefore, be expected to betaken into account in the unfettered decisions of the utilities. From the point of viewof society as a whole this would lead to a misallocation of resources. Or, in engin-eering terms, the wrong choice of system design. Whether this danger is to be avertedby direct regulation or by some other form of institutional intervention is discussedlater in the report.
2.4 Technical Change
Technical change is opening up a greater range of supply-side possibilities. These in-clude opportunities for more intensive management of the urban water cycle (that is:the water that falls on, is stored within, and moves through the natural and built envi-ronment of the cities). More intensive management may take numerous forms,including:
• the use of reclaimed water within municipal and industrial systems• the capture, storage, distribution and use of hitherto uneconomic near-urban
sources, for example, local stormwater either of high initial quality or withtreatment
• introduction of a quality-differentiated water supply: (that is: matching thequality and reliability of water supplied to each market segment to that actuallyneeded, rather than delivering a standard product to everyone at the quality andreliability levels required by the most stringent user), and
• basing new urban developments on the principles of water-sensitive urbandesign, which are conservative in their water use characteristics and which offermore scope for re-use in many forms.
The approach of water-sensitive urban design has been strongly supported by theCommonwealth through the Better Cities Program (BCP), which was established to
6
demonstrate new approaches to problems of dealing with urban change in the 1990s.The principles enunciated by the BCP (Phillips and Goffman, 1993) were:
• recognition of stormwater and wastewater as a resource• increased treatment of stormwater and wastewater for re-use, in order to reduce
demand on the drinkable water resource• the use of integrated catchment management as the primary water management
tool, and• adoption of a water-sensitive approach to urban design.
Modern treatment methods, such as micro-filtration, vortex clarification or reverseosmosis, are economical, and moderate in their use of land, at relatively low designcapacities. This, and the increasing availability of good engineering advice, makes twothings possible. Firstly, managers may find that more decentralised configurations ofthe sewerage system involving local re-use become optimal, because it becomes lessimportant to transport sewage over long distances for treatment at a central plant.Secondly, it becomes feasible for both utilities and other organisations to developoptions for water supply based on reclaimed sewage, other process water, or locally-captured stormwater. Non-utilities that could compete in water supply might includelocal governments, universities, private sector developers and industries.
The future technical evolution of the urban water system thus intersects very stronglywith the theme of competition policy. Should, for example, a water utility be obligedto give a local authority access to a source of treated sewage for reclamation purposes,under the Trade Practices Act, thus increasing the degree of contestability of supply?Will the new corporate structures encourage technical innovation, or will monopolisticor oligopolistic structures prevail which will be able to minimise commercial risk byperpetuating older technologies and passing costs on to consumers? It is difficult, forexample, for utility regulators to insist that specific technological choices be made bythe water industry.
More intensive management of water supply systems is recommended, including:
• the use of reclaimed water within municipal and industrial systems• the capture, storage, distribution and use of hitherto ‘uneconomic’ near-urban sources, e.g. local
stormwater either of high initial quality or with treatment, and• introduction of a quality-differentiated water supply: that is, matching the quality and reliability of
water supplied to each market segment to that actually needed by the user.
The approach of water-sensitive urban design should be strongly supported as one method of dealingwith urban change, via the:
• recognition of stormwater and wastewater as a resource• increased treatment of stormwater and wastewater for re-use, in order to reduce demand on
drinkable water resource and• use of integrated catchment management as the primary water management tool.
7
3. DISCHARGE OF WASTEWATERS TO THE MARINE ENVIRONMENT
This and the following section, presents an overview of issues concerning the dis-charge of wastewaters to sensitive environments. Appendix B gives examples ofmarine disposal issues.
3.1 Sensitive Marine Environments – Definition
In this report we have adopted the definition for ‘sensitive marine environment’ putforward by an ANZECC Working Group on Pollution and Shipping Incidents (1994)Their definition of ‘environmentally sensitive area’ is:
Marine and estuarine areas with high conservation, cultural (educational,recreational, historic, aesthetic) or economic values, and/or high vulnerabilityto environmental degradation as a result of natural disasters, pollution or over-exploitation of their resources.
3.2 Overview of Issues
The State of the Marine Environment Report (Zann, 1995, p. 90) highlighted anumber of concerns about the condition of Australia’s coastal waters, inparticular:
• declining quality of marine and coastal water and sediments, as a resultof inappropriate catchment land use practices
• loss of marine and coastal habitat• unsustainable use of marine and coastal resources• lack of a marine science policy, and• lack of strategic, integrated planning in the marine and coastal
environments.
Their report pointed out that while the state of Australia’s marine environment ison average ‘good’, this was often not the case in the vicinity of urbanised areas.Their Report stated:
Estuaries and coastal waters near the State capitals are generally the mostdisturbed parts of the marine environment. Some parts of Sydney Harbour,Port Phillip Bay and the Derwent Estuary are so polluted by sewage,urban runoff, and industrial discharges that they are frequently closed forbathing and fishing. Zann (1995, p. 95)
The report did note, however, that:
Controls on discharges are showing signs of improvement. Zann (1995,p. 95)
Elevated levels of nutrients and sedimentation in coastal water bodies near urbanareas are largely the result of inappropriate catchment land use practices, sewagedischarges and urban runoff. Sediments alter estuaries and shores, and smother
8
sedentary marine life. Elevated nutrients cause eutrophication and the harmfulgrowth of algae. Blooms of blue-green algae are now common in many estuariesand bays. Eutrophication is a serious threat to estuaries, temperate sea grass andtropical corals. About a half of the sea grass in the estuaries of New South Walesand the majority of seagrass in Westernport Bay in Victoria have been lost.Tasmania, the South Australian Gulfs and south-western Western Australia haveall been locally affected. The loss of sub-tropical sea grass in Hervey Bay,Queensland, has caused a serious decline in the dugong population.
Since European settlement, four times as much sediment, nitrogen and phos-phorus now enter the Great Barrier Reef lagoon which extends from Cape Yorkto Bundaberg (Brodie, 1994). Sewage discharges contribute sediments andnutrients to the Great Barrier Reef, causing localised problems, particularlywhere there is no effective dilution of the treated effluent (Moss et al., 1992;Steven and Brodie, 1994; van Woesik et al., 1990; Brodie, 1991). Sewagedischarges constitute a chronic stress. The Great Barrier Reef Marine Park’sboundaries do not extend to the coastline along the western perimeter. Conse-quently, some of the coastal cities’ ocean outfalls are outside the jurisdiction ofthe Great Barrier Reef Marine Park Act (1975).
Marine pollution from heavy metals including mercury, cadmium and lead,which are present in urban wastewaters, is a localised problem. ‘Hot spots’include Lake Macquarie (NSW), Corio Bay (Vic), Derwent and MacquarieEstuaries (Tas), and Port Pirie (SA).
Organochlorines or chlorinated compounds used as herbicides and insecticides inagriculture and industry are toxic to marine life and are bioaccumulated in mar-ine food chains. Local ‘hotspots’ include Sydney’s sewage outfalls, HomebushBay, Melbourne’s Port Phillip Bay sewage outfalls and Corio Bay.
Litter is a growing and conspicuous problem on some Australian beaches, in thevicinity of urbanised areas. Litter reduces recreational and scenic values, andmay affect wildlife. Turtles and whales may die from eating plastic bags.
South eastern and south western coastal lakes, which have limited ocean waterexchange have been affected by terrestrial runoff. Significant losses of saltmarshand mangroves have occurred near urban areas through reclamations, drainage,and other developments. This has affected fish and other sea life which use themangrove areas as nurseries and feeding grounds.
3.3 Projected Discharges of Wastewaters to Marine Environments
It is estimated from the National Effluent Re-use Survey, 1994 reported in this study,that, in 1994, 1224 GL of treated sewage was discharged from town sewage treatmentplants to coastal waters in Australia. This includes discharges from all the larger sew-age treatment plants in the coastal cities (Perth, Adelaide, Melbourne, Hobart, Darwin,Sydney, Newcastle, Wollongong and Brisbane).
9
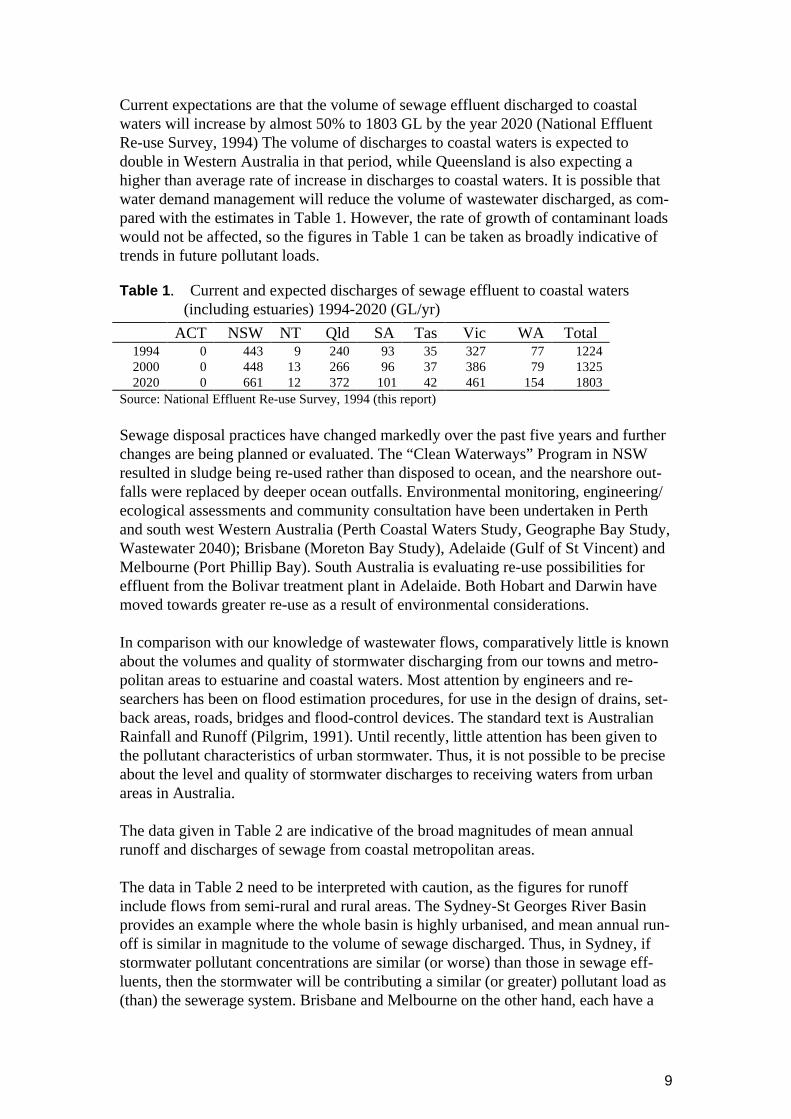
Current expectations are that the volume of sewage effluent discharged to coastalwaters will increase by almost 50% to 1803 GL by the year 2020 (National EffluentRe-use Survey, 1994) The volume of discharges to coastal waters is expected todouble in Western Australia in that period, while Queensland is also expecting ahigher than average rate of increase in discharges to coastal waters. It is possible thatwater demand management will reduce the volume of wastewater discharged, as com-pared with the estimates in Table 1. However, the rate of growth of contaminant loadswould not be affected, so the figures in Table 1 can be taken as broadly indicative oftrends in future pollutant loads.
Table 1 . Current and expected discharges of sewage effluent to coastal waters(including estuaries) 1994-2020 (GL/yr)
ACT NSW NT Qld SA Tas Vic WA Total1994 0 443 9 240 93 35 327 77 12242000 0 448 13 266 96 37 386 79 13252020 0 661 12 372 101 42 461 154 1803
Source: National Effluent Re-use Survey, 1994 (this report)
Sewage disposal practices have changed markedly over the past five years and furtherchanges are being planned or evaluated. The “Clean Waterways” Program in NSWresulted in sludge being re-used rather than disposed to ocean, and the nearshore out-falls were replaced by deeper ocean outfalls. Environmental monitoring, engineering/ecological assessments and community consultation have been undertaken in Perthand south west Western Australia (Perth Coastal Waters Study, Geographe Bay Study,Wastewater 2040); Brisbane (Moreton Bay Study), Adelaide (Gulf of St Vincent) andMelbourne (Port Phillip Bay). South Australia is evaluating re-use possibilities foreffluent from the Bolivar treatment plant in Adelaide. Both Hobart and Darwin havemoved towards greater re-use as a result of environmental considerations.
In comparison with our knowledge of wastewater flows, comparatively little is knownabout the volumes and quality of stormwater discharging from our towns and metro-politan areas to estuarine and coastal waters. Most attention by engineers and re-searchers has been on flood estimation procedures, for use in the design of drains, set-back areas, roads, bridges and flood-control devices. The standard text is AustralianRainfall and Runoff (Pilgrim, 1991). Until recently, little attention has been given tothe pollutant characteristics of urban stormwater. Thus, it is not possible to be preciseabout the level and quality of stormwater discharges to receiving waters from urbanareas in Australia.
The data given in Table 2 are indicative of the broad magnitudes of mean annualrunoff and discharges of sewage from coastal metropolitan areas.
The data in Table 2 need to be interpreted with caution, as the figures for runoffinclude flows from semi-rural and rural areas. The Sydney-St Georges River Basinprovides an example where the whole basin is highly urbanised, and mean annual run-off is similar in magnitude to the volume of sewage discharged. Thus, in Sydney, ifstormwater pollutant concentrations are similar (or worse) than those in sewage eff-luents, then the stormwater will be contributing a similar (or greater) pollutant load as(than) the sewerage system. Brisbane and Melbourne on the other hand, each have a

10
Table 2. Comparison of stormwater runoff volumes with sewage discharges:selected coastal cities (GL)
City Water Basins (1)
(and basin codes)Mean Annual
Runoff (1)Sewage
Discharges (2)
Brisbane Brisbane (143) and Pine Rivers(142)
1860 113
Sydney Sydney/St Georges River (213) 500 424Melbourne Bunyip (228), Yarra (229),
Maribyrnong (230) and Werribee(231) Rivers
1650 340
Adelaide Myponga (502), Onkaparinga(503),Torrens (504) and Gawler(505) Rivers
306 183
(1) Water basins and mean annual runoff are taken from the 1985 Review of Australia’s WaterResources and Water Use (Department of Primary Industries and Energy, 1987). The numbers inbrackets are the basin codes.(2) Sewage discharges are taken from the National Effluent Re-use Survey, 1994 (this report).
large river flowing through the city, with catchments that go well into their hinter-lands. For these rivers, while urban pollution loads will be similar to other cities,pollutant concentrations in local rivers and streams may differ considerably from thosetypical of urban stormwater. The pollutants generated in the rural parts of the catch-ment, need to be taken into account in assessing strategies for the abatement ofimpacts on receiving waters.
As urban development proceeds, and the average permeability of the land surface isdiminished by the construction of roads, paved areas and buildings, urban runoffincreases. The growth of population, industrial activity and consumption per head alsoincreases the amount of wastes generated. Thus both total stormwater flows and totalpollutant loads increase. Data from South Australia, given in Part IV, Table 38 suggestthat stormwater may be as badly contaminated as primary-treated sewage effluent interms of biochemical oxygen demand, oils and greases, bacteria, phosphorus, totalnitrogen and heavy metals; and distinctly worse in quality than the secondary-treatedeffluent which is the general standard in most Australian metropolitan sewagetreatment plants. Given that coastal aquatic ecosystems in Australia are commonlynitrogen-limited it is relevant to note that total nitrogen concentration of urban storm-waters may be equivalent to, or may well exceed, that of secondary-treated sewageeffluent. Data for Port Phillip Bay suggest that discharges of toxic metals such ascadmium, copper, chromium, lead, mercury, nickel and zinc from rivers and drainsexceed the loads generated by the Werribee Treatment Plant by a factor of 2–10.
3.4 Coastal Water Quality Protection Policies
Responsibility for protection of coastal environments is shared between theCommonwealth and the States and Territories. A number of steps have beentaken:
• A recommendation of the Coastal Zone Inquiry (1993) was the adoption ofa National Coastal Action Program (NCAP) by COAG, to be implemented

11
by all three levels of government in consultation with industry and com-munity groups. This is currently being discussed within the COAG frame-work.
• The principal aims of the NCAP are:– reduced degradation from urban sprawl and related activities– more effective and rational land use in coastal catchments– improved water quality in streams, estuaries and coastal seas– improved recreational facilities in the coastal zone– better management of natural processes, and– improved fisheries management.
• Marine parks have been proclaimed: these incorporate zones which permitactivities appropriate to the conservation value and sensitivity of each area.This model is used, with local variations, by the Commonwealth (GreatBarrier Reef Marine Park), NT, NSW, Vic, and WA.
• Systems of water quality protection for specific uses are used in SA, Vic,and NSW. WA uses a system based on a draft modification of NationalWater Quality Management Strategy (1992) guidelines on water quality.
• The Ocean Rescue 2000 Program announced by the CommonwealthGovernment in 1991 is developing a system of marine protected areasbased on the draft classification of the International Union for the Conser-vation of Nature (IUCN).
• Catchment management programs are underway in some parts of Australiato reduce soil erosion and discharge of nutrients. However, these are main-ly focussed on rural catchments, and progress in implementing urbancatchment management reforms has so far been slow and patchy.
• Most states have reviewed the impacts of sewage effluent discharges andin some cases this has led to modification of practices. In New SouthWales and Queensland, policies have been implemented to upgrade thequality of treated sewage effluents being discharged to coastal receivingwaters. South Australia has been investigating, and is about to implement,options for land disposal of Adelaide effluent. Victoria has been examiningthe impacts of the Werribee STP on Port Phillip Bay. New studies areunderway to review methods for alleviating potential impacts of effluentdischarged to Bass Strait from the South East Purification Plant. Thestudies will include potential wastewater re-use. Western Australia hascompleted the Perth Coastal Waters Study (Simpson et al., (1993), and hasadopted a policy of monitoring coastal waters, while continuing with itsmarine disposal strategy. The Northern Territory government is proceedingwith some re-use of treated effluent in Darwin.
• The National Water Quality Management Strategy will provide a generalframework of guidelines for water quality management in the coastal zone.
• The Commonwealth Government has recently commenced a NationalState of the Environment Reporting Program based on a pressure-state-response model. It is intended that a national set of environmentalindicators be developed for future quantitative reporting (CEPA, 1993).
12
It is suggested that improved wastewater and stormwater management can help in addressing:
• declining quality of marine and coastal water and sediments, particularly as a result of inappropriatecatchment land use practices
• loss of marine and coastal habitat• unsustainable use of marine and coastal resources, and• lack of strategic, integrated planning in the marine and coastal environments.
4. DISCHARGE OF WASTEWATERS TO INLAND/FRESH WATERS
4.1 Overview
Australia’s rivers are subject to many environmental problems, including increasednutrient levels and changed flow regimes. Concerns about the state of our inlandwaterways have been exacerbated since the world’s largest outbreak of toxic blue-green algae in the Murray Darling System in 1990-1991. Appendix B gives cases ofdisposal of wastewaters to inland waters in Australia.
Due to their temporal distribution, wastewater flows may have an influence which isdisproportionate to their volume. Wastewater flows are relatively constant within andacross years while flow rates in inland rivers vary significantly with the season andfrom year to year. Nutrients from wastewater may not be a major part of the overallnutrient load in a river whose normal flow is dominated by agricultural runoff, exceptduring low flow periods. It is during these low flow periods, when nutrient concen-trations are highest, that algal problems are most likely to occur. Re-use systems forwater that is currently discharged to inland rivers must be sensitive to these issues. Re-use schemes will typically lead to a reduction both in nutrient levels and total watervolume discharged to the river. While the reduction in nutrient levels would generallybe environmentally beneficial, the reduction in flow may be detrimental.
Settlements within the Murray-Darling Basin in Queensland, New South Wales,Canberra, Victoria and South Australia have either been upgrading treatment levels toreduce nutrient loads entering the river (for example: Toowoomba which was thebiggest contributor of nutrients to the river systems in Queensland), disposing to landor to woodlots (many SA country towns have taken this approach), or storing treatedeffluent on land and discharging at peak flow times. Prolonged drought conditionshave also forced water authorities, consumers and local councils to consider re-use asa supplementary supply source.
Programs addressing nutrient inputs have also been established for other basins.Sydney Water Corporation has been working on reducing nutrient inputs into theHawkesbury-Nepean through infill sewerage programs and the upgrading of treatmentlevels. The New South Wales EPA now requires environmental impact assessment ofall sewage treatment plants in the Hawkesbury-Nepean System.
13
4.2 Murray-Darling Basin
Many of the inland waterways of Australia that receive town wastewaterdischarges fall within the Murray-Darling Basin.
In response to rising concern at the level of nutrients and eutrophication, theMurray-Darling Basin Commission has established a nutrient managementstrategy. A study conducted in 1991 (Gutteridge, Haskins and Davey, 1992)concluded that over 70% of dry weather nutrient loads from point sourcesoriginated from effluent discharges. The study estimated that approximately 500tonnes of total phosphorus were discharged annually to main stream rivers fromsewage treatment plants in the Basin, and an estimated 2800 tonnes of totalnitrogen. These discharges were considerably greater than the estimated dryweather discharges of total phosphorus and total nitrogen from irrigation drains,and from urban stormwater.
The above estimates exclude the nutrients supplied to the Basin’s river systemsby intensive rural industries (feedlots, abattoirs, dairy processors, fruit andvegetable processors and wineries). They also exclude the effects of redistri-bution of nutrients within watercourses. Aeolian sources and direct animalcontributions may also be significant, particularly in dry years.
In wet years the mass of nutrients discharged from town sewage treatment plantsremains the same, but the discharges from irrigation drainage and urban storm-waters increases. Nevertheless, even in wet years, sewage treatment plantsaccount for about a half of the estimated nutrient flow from point sources.
In 1992, a Blue-Green Algae Taskforce considered control actions, including thereduced nutrient discharges from sewage treatment plants. These recommend-ations were implemented in the Algal Management Strategy, 1994. In 1994–5 abroad-ranging study was commissioned to:
• determine exactly where nutrients and sediments are generated within alarge sub-catchment containing natural and agricultural land uses
• identify processes of nutrient and sediment loss, and• develop a model and management practices that can be applied at
catchment scale.
The Algal Management Strategy seeks to:
• reduce nutrient concentrations in the streams and storages of the basin• improve stream-flow regimes and flow management• increase the community’s awareness of the blue-green algal problem, and• obtain better information and scientific knowledge of blue-green algae.
4.3 Hawkesbury-Nepean River Basin
The amount of phosphorus and other nutrients has become a serious problem inthe Hawkesbury-Nepean River Basin. The problem is due largely to the di-

14
version of natural streamflows in order to supply water to Sydney, Illawarra andBlue Mountains regions, and irrigation. Discharges of sewage effluent andnutrients from other sources have been a concern. Managing water quality willbecome more difficult in future with increasing urbanisation and other develop-ment.
Effluent discharges from sewage treatment plants dominate the flow during dryweather. In wet weather, diffuse nutrient sources, including agriculture, andrunoff from urban areas dominate. While Sydney Water has invested in up-grading the treatment plants, the incremental costs are very high. Treatment plantupgrades in themselves may not be sufficient to deal with nutrient pollution. Astudy commissioned by the NSW EPA (James et al., 1994) has indicated that tohave a significant impact on cost savings and economic efficiency in controllingnutrient inputs, non-point sources would have to be brought into any institutionalsolution.
4.4 Projected Discharges
Currently, 295 GL of sewage is discharged annually to Australia’s inland and freshwaterways after varying degrees of treatment. Generally, the metropolitan waterutilities apply higher levels of treatment in those plants discharging to inland waters,but the degree of treatment varies substantially among the smaller towns.
The volume of treated sewage expected to be discharged to inland/fresh waters bywastewater utilities is expected to increase by 30% to 381 GL in the year 2020.However results of the National Effluent Re-use Survey indicate that the ACT, NewSouth Wales and Queensland would have higher than average rates of growth involumes discharged to inland/fresh waters (45, 70 and 55% growth, respectively). TheNorthern Territory, South Australia, Victoria and Western Australia expect to havestatic or declining discharges to inland/fresh waters. Victoria is aiming for asignificant reduction.
Table 3. Current and expected discharges of sewage effluent to inland/fresh waters(including estuaries) 1994–2020 (GL/yr)
ACT NSW NT Qld SA Tas Vic WA Total1994 33 138 1 32 2 14 74 1 2952000 38 158 1 35 2 15 46 0 2952020 48 234 1 49 2 17 30 0 381Source: National Effluent Re-use Survey, 1994 (this report).
Little is known about the volumes or quality of town stormwater discharges to inlandwaterways, though urbanisation in the Murray-Darling and Hawkesbury-Nepean RiverBasins and in South-east Queensland is expected to increase both flows and pollutantloads.
Table 4 shows that the inland waters into which sewage is discharged, currentlysupport a wide variety of environmental values (identified as ‘beneficial uses’ in theNational Effluent Re-use Survey). In Victoria and New South Wales, in particular, the

15
Table 4. Beneficial uses of waters receiving discharges of sewage effluent, (by state)
Beneficial Use ACT NSW NT Qld SA Tas Vic WA Total % rounded
At PresentIrrigated agriculture 1 1 1 1 1 1 6 20
Urban water supply 1 1 1 1 1 5 16
Recreation, fishing,boating etc 1 1 1 1 1 1 6 20Commerce, tourism 1 1 1 1 1 5 16
Protection of aquaticenvironments 1 1 1 3 10Other conservation 1 1 2 6
Industrial purposes 1 1 2 6
Other 1 1 2 6
TOTAL 5 8 2 4 2 0 8 2 31 100Future Purposes
Irrigated agriculture 1 1 1 1 1 5 16
Urban water supply 1 1 1 1 1 5 16
Recreation, boating,fishing etc 1 1 1 1 1 5 16Commerce, tourism 1 1 1 1 1 5 16
Protection of aquaticenvironment 1 1 1 1 4 14Other conservation 1 1 2 6
Industrial purposes 1 1 2 6
Other 1 1 2 6
TOTAL 5 8 3 4 2 0 8 0 30 100Source: National Effluent Re-use Survey, 1994 (this report).
1 denotes the existence of the particular use
full range of beneficial uses listed in the Table is active within the waterwaysreceiving sewage discharges.
In some cases it is not appropriate (from an environmental viewpoint) to dispose ofeffluent on land if:
• groundwater is close to the surface and land disposal may result in water logging• the practice may result in contamination of groundwater, and• land disposal may lead to problems with soil salinity or sodicity.
In other cases climate or land area requirements (both for storage and disposal pur-poses) may limit the potential for land disposal. Therefore, cost should not be the onlyfactor influencing decisions on the management of effluent.
In line with recommendations in the 1994 Algal Management Strategy for the Murray-Darling Basin,discharges to inland waters should be managed to:• control nutrient concentrations in receiving waters, and• improve stream-flow regimes and flow management.

16
Re-use and land application systems should be implemented where appropriate and cost effective.• Where cost-effective, practical and environmentally sustainable land-based disposal systems should
be adopted ahead of enhanced nutrient removal processes or the continued discharge to sensitivewater environments. Where land-based treatment is not economically viable, plants need to beupgraded. Water quality monitoring programs should be enforced where discharge to water bodieswill continue in the future.
• Increasing urbanisation and other developments should be monitored to ensure that the amount ofphosphorus and other nutrients, which has become a serious problem in many urban areas, is notexacerbated.
To summarise, aquatic environmental considerations generally favour increasedtreatment levels and reduced discharge of nutrients, pathogens and toxics. If treatmentand management are upgraded, the wastewater will be more suitable for re-use insome form. The twin objectives of using wastewaters as a resource and improving theenvironment are generally complementary.
In some situations, environmental considerations may favour conventional approachesand continued discharge. In many cases the environmental desirability of improveddischarge practices may be agreed but re-use of treated sewage or increased expen-diture on stormwater management may be considered to be economically not feasible.
5. INSTITUTIONAL AND REGULATORY FRAMEWORK
5.1 Overview
Throughout Australia there have been rapid changes in institutional arrangements forwater resources and environmental management. These have generally tended toseparate the powers and responsibilities of water utilities from those of governmentdepartments dealing with planning, resource management and environmental pro-tection.
Changing institutional demarcations and roles raises a number of issues about theownership and transferability of wastewater. For example, it is not always clearwhether a corporatised or privatised wastewater utility actually owns the sewage that ittransports and treats. Generally, however, corporatisation or privatisation of utilities isconsistent with the development of re-use projects. Most re-use projects in the USAare operated by such utilities within a framework of government regulation. Thesituation is more complicated, however, with respect to stormwater.
5.2 Institutional Roles and Responsibilities for Stormwater Management
As implementation of the National Water Reform Agenda proceeds, new institutionalroles and responsibilities will be required to take care of urban stormwatermanagement. The water utilities increasingly concentrate on their core business ofwater supply and sewerage, relying on ‘whole of government’ or communityapproaches to deal with stormwater issues. What form the institutional responseshould take is a matter for individual governments. Several jurisdictions are changingtheir water legislation to redefine institutional powers and responsibilities in the

17
stormwater area, including catchment management. Part III of this report addressesthese issues.
5.3 The National Water Quality Management Strategy
The basic regulatory framework for control of discharges is at state level, withinguidelines established by the National Water Quality Management Strategy(NWQMS). This has been developed jointly by the Agriculture and Resource Manage-ment Council of Australia and New Zealand (ARMCANZ) and the Australian andNew Zealand Environment and Conservation Council (ANZECC). The NationalHealth and Medical Research Council (NHMRC) is involved in aspects of theNWQMS which affect public health. The philosophies and policies of the NWQMSare set out in the paper titled Water Quality Management – An Outline of the Policies,and an accompanying document, Policies and principles – A Reference Document,(National Water Quality Management Strategy 1994).
Management of water resources is recognised as a State and Territory responsibility,and it is proposed that the NWQMS would be implemented after considering Stateand Territory water policies, as well as the National Guidelines. The NWQMS usesthe concept of environmental values to set local water quality targets established inpartnership with the community and government. Environmental values may be dis-tinguished from the concept of beneficial use in that the former is derived explicitly byreference to community input, rather than being assigned directly by a planning orregulatory authority based on current uses.
The NWQMS is expressed in 20 documents. The following are of special relevancefor this study:
• Sewerage Systems: Use of Reclaimed Water (National Water QualityManagement Strategy, 1996a)
• Urban Stormwater Management (National Water Quality Management Strategy,1996b)
• Sewerage Systems: Sewerage System Overflows (National Water QualityManagement Strategy, 1996c)
• Groundwater Protection (National Water Quality Management Strategy, 1995)• Sewerage Systems: Acceptance of Trade Wastes (National Water Quality
Management Strategy, 1994)• Receiving Waters (National Water Quality Management Strategy, 1992)
In contrast to the National Water Quality Management Strategy Guideline documents,which are essentially manuals for practitioners, this report focuses on the ramificationsof the COAG Water Reform Agenda. This report makes references to the Guidelinedocuments, and recommendations about their content are made in places.

18
The strategic framework for reform of the Australian wastewater sector should involve environmentallysustainable management of wastewater and stormwater from metropolitan and town water services.Specifically, an improved quality of natural environment needs to be sustained in urban regions, includ-ing the marine environment of coastal cities, and the riverine or lacustrine environments of inland citiesand towns.
Future wastewater re-use systems should satisfy environmental objectives, including: the need for cleanbeaches, rivers and streams; improved sewage treatment to ensure safe, beneficial or environmentallyacceptable disposal of effluent; cost-effective protection from sewage overflows, improved sewagetreatment plant reliability; safe beneficial use or environmentally acceptable disposal of treated resid-uals; stormwater pollution source control, waste minimisation and recycling sewage by-products.

19
PART II:
RE-USE OF WASTEWATERS

20

21
PART II:RE-USE OF WASTEWATERS
This part of the report considers the current and future status of wastewater re-useprojects in Australia and overseas. The first section below cites the principal reasonsfor undertaking re-use projects. Section 9 provides a review of public acceptabilityand health issues. Section 10 discusses the economics of wastewater re-use and givesexamples of re-use projects in Australia and internationally (outlining in each case thenature of benefits, the problems encountered and issues to be resolved).
Section 11 discusses the current and planned re-use of treated sewage in Australia andpresents the results of the National Effluent Re-use Survey, 1994. This survey wasconducted by Melbourne Water on behalf of the Water Technology Committee in late1994 and evaluated by CSIRO. Included in this section is a discussion on national re-use trends and predictions between 1994 and the year 2020.
Finally, Section 12 considers whether special consideration needs to be given to waterreclamation and re-use in the context of economic, institutional, market, regulatoryand pricing reforms instigated by the COAG National Water Reform Agenda.
6. REASONS FOR RE-USEThe main motivations for wastewater re-use schemes are:
• to supplement limited primary water sources and to help prevent excessivediversion of water from alternative uses, including the natural environment
• as a method of managing in-situ water resources• to minimise costs, including total treatment and discharge costs• to reduce or eliminate discharges of treated sewage to receiving waters, and• because of political or institutional constraints.
6.1 Supplementary Supply
Internationally, most large-scale re-use schemes are in arid/dry climatic locations - e.g.Israel, South Africa and arid areas of the USA, where alternative sources of water arelimited. Even if rainfall is adequate it may not be available at the correct place or time.For example Florida, while it is not a dry area in general, has limited options for waterstorage, and suffers from water shortages during dry spells. For this reason water re-use schemes form an important part of the water supply system. In 1992 Florida had308 wastewater treatment plants producing reclaimed water. They delivered a total of481 ML/yr) of reclaimed water to 295 re-use systems. The output of reclaimed wateris expected to double in the near future (Florida Department of EnvironmentalProtection, 1991).

22
6.2 Resource Management
Re-use can be a method of water resources management. For example, depletedaquifers may be ‘topped up’ by injection of reclaimed water, in order to restore aquiferyields or prevent seawater intrusion, as is done in California and Florida.
6.3 Cost Minimisation
High costs associated with conventional water supply or wastewater disposal maymake re-use attractive. For example, many high-rise buildings in Japan contain waterrecycling systems. These buildings are served by sewers which were originally de-signed for a lower level of wastewater flow and one of the major advantages of re-useis in postponing the cost of sewerage upgrades (Kiya and Aya, 1991). Other possiblecost influences on re-use are increasing pollution of alternative sources (leading toincreased treatment costs) and potential reductions of the costs of headworks anddistribution systems where re-use is practiced.
6.4 Environmental Protection
The discharge of inadequately treated wastewater may lead to environmental prob-lems, as discussed in Part I, and this may encourage re-use. While the nutrients inwastewater can assist plant growth, they can be detrimental to ecosystems and con-tribute to algal blooms in rivers and estuaries. In addition there may be concern aboutthe level of heavy metals in wastewater. The volume of wastewater flow may haveenvironmental consequences, both in raising watertables and increasing flow rates inrivers. This may be more significant in low periods. As already noted, wastewaterdischarge may be beneficial if low flows are due to upstream diversions.
6.5 Political/Institutional Constraints
Concerns about water supply or environmental pollution may emerge as political or asinstitutional constraints. Community concern about the quality of wastewater disposedto sensitive environments may lead to political pressures to treat wastewater to a high-er level. The regulatory framework applying to wastewater disposal and re-use reflectsthese concerns and includes: wastewater discharge licensing by the Federal and StateEnvironmental Protection Agency/Authorities; health legislation to protect peoplefrom waterborne diseases; water legislation; and standards, criteria and guidelines forwastewater disposal and re-use categories (at a national level via the National WaterQuality Management Strategy, and on a State/Municipal level for local conditions). Inthe USA, a major reason why utilities have chosen wastewater reclamation was thatthe alternative course, of seeking a discharge permit under the National PollutionDischarge Elimination Scheme (NPDES), was seen as being more risky to the utilityand/or more costly.
Institutional structures may also provide incentives for re-use. As responsibility fordifferent parts of the water use and disposal system may rest with different organi-sations, a water utility may also be faced with standards of service set in agreements

23
with other industry bodies. The restructuring currently taking place in the waterindustry in Australia increases the importance of clearly defining institutionalresponsibility for particular non-utility aspects of service delivery (for example.stormwater and drainage), performance monitoring, environmental policy, waterresource management and community participation.
It is usually a combination of these factors which causes a re-use scheme to get off theground. An example is the St Petersburg re-use scheme in Florida, USA. The schemeis claimed to be the largest in the world, with reclaimed water output of 26 Mgal/d(118 ML/d). Key features of this scheme are as follows:
• Motives for the scheme were two-fold: (i) a shortage of cost-efficient, divertiblewater sources in the region of St Petersburg, and (ii) determination to undertakea clean-up of the polluted waters of Tampa Sound, on the Gulf of Mexico.
• Influent comes from a separate sewer system, dominated by residential sewageinputs.
• The treatment train is (i) grit removal, (ii) aeration, (iii) clarification, (iv) multi-media filtration, chlorine contact basin, and (v) effluent storage. No attempt ismade to remove nutrients. However the advanced treatment can handle allexpected hydraulic and organic loadings, with both chemical treatment andfiltration.
• There is continuous, remote monitoring of the treatment processes, includingboth hydraulics and water quality, with 24 hrs/day, 7 days/week effluentsampling, and continuous surveillance by qualified operators.
• The reclaimed water is supplied to (i) spray irrigation sites, all of which overlaya brackish non-potable aquifer; and (ii) deep injection wells, which have beeninstalled to deal with saline intrusion problems. A distribution network for thereclaimed water has some 300 km of pipes, extending over most of the metro-politan region of St Petersburg. However, there was relatively little retro-fitting,as the city’s population has been growing rapidly, and mainly new developmentswere supplied by the reclaimed water system.
• Approximately 40% of the total public water supply in 1994 came from the re-use system.
• Unit production costs are not available, but benefits of the reclaimed waterscheme are said to include: avoidance of more expensive long-distance pipedsupplies or desalination plants; avoidance of a capacity expansion for a limesoftening plant; and avoidance of a third trunk transmission line for potablewater
• While epidemiological studies have been inconclusive, considerable attentionhas been paid to public health aspects.
All Australian jurisdictions should recognise that water re-use is a viable and attractive alternativesource of water supply, which may contribute to the abatement of environmental problems associatedwith fresh water diversions or the discharge of polluted effluents to receiving waters.

24
The potential for re-use schemes should be assessed
• to augment limited primary water sources• to help prevent excessive diversion of water from alternative uses, including the natural environment• as a method of managing in-situ water resources• to minimise infrastructure costs, including total treatment and discharge costs• to reduce or eliminate discharges of treated sewage to receiving waters• to satisfy political, community and institutional constraints, and• to reduce stormwater pollutant loads to receiving waters.
7. TREATMENT METHODS
The methods and degree of treatment required for water re-use differ according to thehydraulic and bio-chemical characteristics of the wastewater, and the potential enduses. James et al., (1994), lists four additional levels of treatment required in a con-ventional municipal activated sludge plant corresponding to reclamation for varioususes. The end uses considered were:
A: agricultural irrigation, dust suppression and quenchingB: urban irrigation and cooling towersC: residential non-potable, boiler feed and cooling towers; andD: indirect potable.
The critical treatment processes for each of the above, which are very common in re-use schemes throughout the world, are in ascending level of treatment:
• A = primary biological reactor, secondary clarifiers, and disinfection• B = A + biological nutrient removal and filtration• C = B + flocculation/coagulation• D = C + tertiary clarifiers, pre-chlorination, microfiltration, and reverse osmosis.
Microfiltration is often considered as an alternative to reverse osmosis as a finalpolishing treatment, but there are also small-scale micro-filtration package plantswhich offer a complete treatment train.
A number of different treatment and disposal or reuse alternatives are usuallyavailable, depending on the degree of treatment required. Contaminants in wastewaterare removed by physical, chemical and biological means. Treatment systems used toremove major contaminants found in wastewater are summarised in Table 5. A moredetailed discussion of these operations and processes are presented in Tchobanoglousand Burton (1991). More advanced wastewater treatment operations and processes areshown in Table 6.
Some industrial markets for reclaimed water require specific water quality, inparticular low total dissolved solids content. The trading arm of Sydney Water,Australian Water Technologies, is refining its product mix to match desired quality invarious re-use markets. In particular, a compact ‘sewer mining’ system allows rawsewage to be extracted directly from pipes for processing (the Aqua Re-use System).

25
A large variety of household-level treatment devices is available. These have beenapproved by public health authorities, especially for use in areas without sewerage,and where the on-site treatment and re-use of household wastewater may be preferableto disposal via septic tanks. A Perth Seminar on Urban Wastewater Re-use (AustralianInstitute of Urban Studies, 1993) provides an account of alternative small-scalesystems. The proceedings of a symposium held at Murdoch University in 1995 goesinto greater technical detail on the performance of small-scale systems (Jeppesen,1994).
The NWQMS Guidelines for Sewerage Systems: Use of Reclaimed Water (NationalWater Quality Management Strategy, 1996a) is the most up-to-date document onrecommended water quality for re-use water in Australia. The United States Environ-mental Protection Agency (US EPA) document “Guidelines for Wastewater Re-use”(Camp, Dresser and McKee, 1992) provides a wide-ranging review of the subjectfrom an international perspective.
Much has been said (but little has been written) on the relationship between re-usepotential and the size of the water supply-sewerage network. Judging from inter-national experience there is potential for re-use at all system scales, from the house-hold level to the large integrated metropolitan systems. For example, California has anactive re-use program which is being grafted onto an ever more integrated state-widepipe network. Re-use has advantages and disadvantages at each level. The choice isconventionally a technical and economic one, though some view it as important thatthe community as a whole should become more involved in the working of the systemand they favour more decentralised approaches.

26
Table 5 . Treatment systems used to remove major contaminants found inwastewater
Contaminant Unit operation, unit process, treatment systemSuspended solids Screening and comminution
Grit removalSedimentationFiltrationFlotationChemical polymer additionCoagulation/sedimentationNatural systems (land treatment)
Biodegradable organics Activated-sludge variationsFixed-film reactor: trickling filtersFixed-film reactor: rotating biological contactorsLagoon variationsIntermittent sand filtrationPhysical-chemical systemsNatural systems
Volatile organics Air strippingOff gas treatmentcarbon adsorption
Pathogens ChlorinationHypochlorinationBromine chlorideOzonationUV radiationNatural systems
Nutrients:Nitrogen
Phosphorus
Nitrogen and Phosphorus
Suspended-growth nitrification and denitrification variationsFixed-film nitrification and denitrification variationsAmmonia strippingIon exchangeBreakpoint chlorinationNatural systemsMetal-salt additionLime coagulation/sedimentationBiological phosphorus removalBiological-chemical phosphorus removalNatural systemsBiological nutrient removal
Refractory organics Carbon adsorptionTertiary ozonationNatural systems
Heavy metals Chemical precipitationIon exchangeNatural systems
Dissolved organic solids Ion exchangeReverse osmosisElectrodialysis
Source: Tchobanoglous and Burton (1991). p. 127.

27
Table 6 . Constituent removal by advanced wastewater treatment operations andprocesses
Principal removal function Description of operation or process
Suspended-solids removal FiltrationMicrostrainers
Ammonia oxidation Biological nitrification
Nitrogen removal Biological nitrification/denitrification
Nitrate removal Separate-stage biological denitrification
Biological phosphorus removal Mainstream phosphorus removalSidestream phosphorus removal
Combined nitrogen andphosphorus removal bybiological methods
Biological nitrification/denitrification andphosphorus removal
Nitrogen removal by physicalor chemical methods
Air strippingBreakpoint chlorinationIon exchange
Phosphorus removal bychemical addition
Chemical precipitation with metal saltsChemical precipitation with lime
Toxic compounds and refractoryorganics removal
Carbon adsorptionActivated sludge/powdered activated carbonChemical oxidation
Dissolved inorganic solidsremoval
Chemical precipitationIon exchangeUltrafiltrationReverse osmosisElectrodialysis
Volatile organic compounds Volatilisation and gas stripping
Source: Tchobanoglous, G and Burton, F.L, (1991). p. 667.
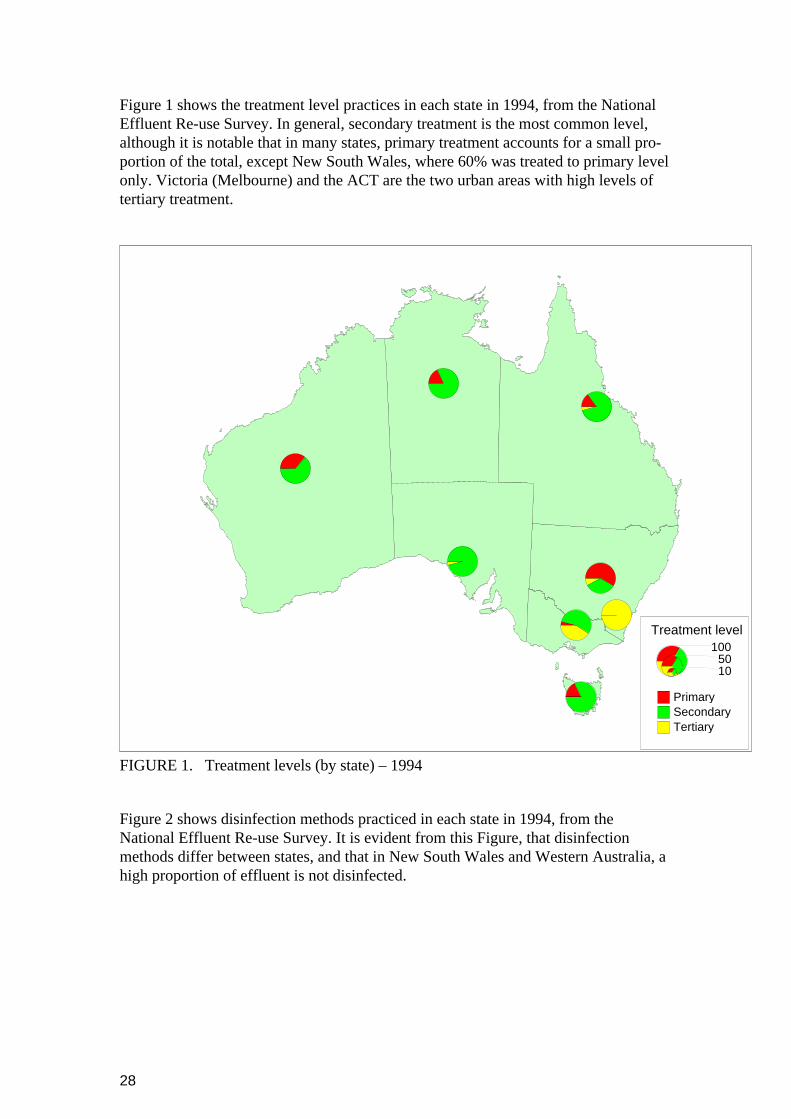
28
Figure 1 shows the treatment level practices in each state in 1994, from the NationalEffluent Re-use Survey. In general, secondary treatment is the most common level,although it is notable that in many states, primary treatment accounts for a small pro-portion of the total, except New South Wales, where 60% was treated to primary levelonly. Victoria (Melbourne) and the ACT are the two urban areas with high levels oftertiary treatment.
Treatment level100
5010
PrimarySecondaryTertiary
FIGURE 1. Treatment levels (by state) – 1994
Figure 2 shows disinfection methods practiced in each state in 1994, from theNational Effluent Re-use Survey. It is evident from this Figure, that disinfectionmethods differ between states, and that in New South Wales and Western Australia, ahigh proportion of effluent is not disinfected.
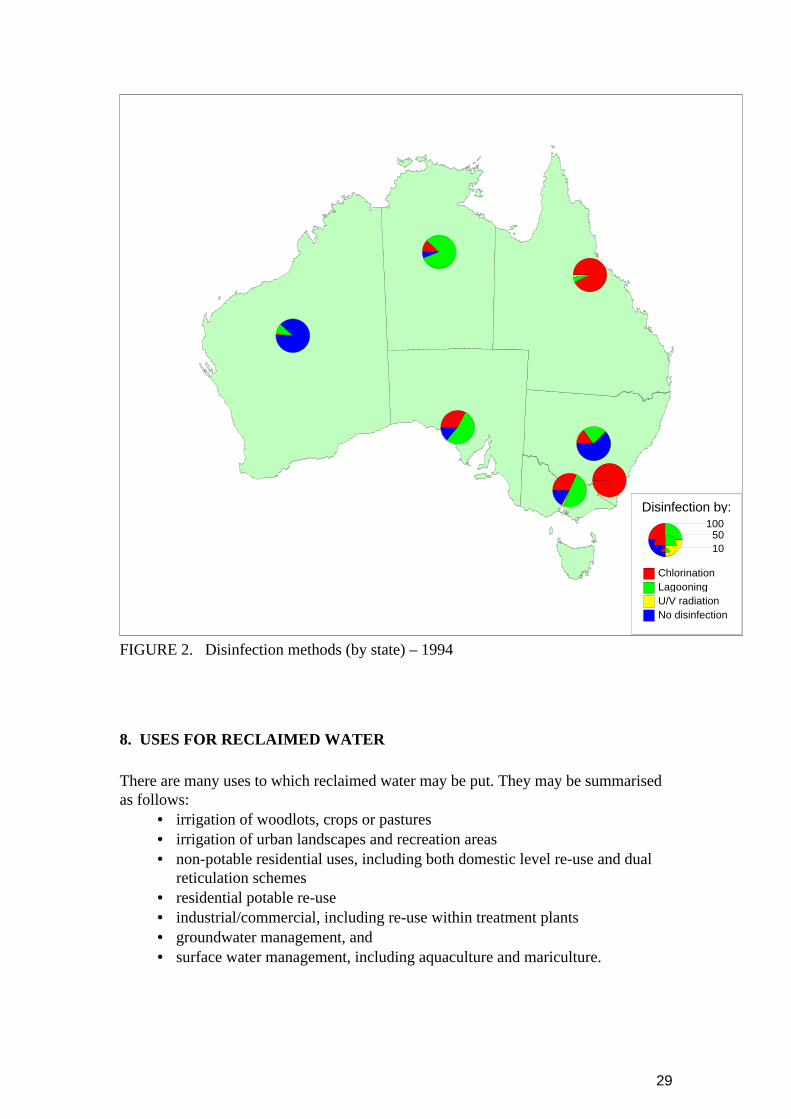
29
Disinfection by:100
5010
ChlorinationLagooningU/V radiationNo disinfection
FIGURE 2. Disinfection methods (by state) – 1994
8. USES FOR RECLAIMED WATER
There are many uses to which reclaimed water may be put. They may be summarisedas follows:
• irrigation of woodlots, crops or pastures• irrigation of urban landscapes and recreation areas• non-potable residential uses, including both domestic level re-use and dual
reticulation schemes• residential potable re-use• industrial/commercial, including re-use within treatment plants• groundwater management, and• surface water management, including aquaculture and mariculture.

30
The following sections provide an overview and examples of each of the above.Appendix C gives a listing of re-use schemes derived from the literature survey andindustry consultation process.
8.1 Irrigation of Woodlots, Crops and Pastures
The potential exists for wastewater to be used as a source of irrigation water forwoodlots, crops and pastures. Eden (1994) has identified seven agricultural orsilvicultural activities where reclaimed water can be applied, namely: woodlots, turffarms, vineyards, vegetables (restricted), hydroponics, cut-flowers and ornamentaltrees, and plant nurseries.
Myers et al., (1995) provide an overview of planning, design and monitoringrequirements for forestry plantations irrigated with effluent, based on trials nearWagga Wagga, NSW.
Wastewater may be a preferred option for irrigation of agricultural crops because thenutrients in it may reduce the need for other fertilisation. However, this may noteliminate the need for specific treatment. If the nutrient level is too high then it may benecessary to limit the amount of re-used water applied in order to avoid fungal prob-lems. Contamination by heavy metal or other pollutants may be detrimental to crops.The creation of anaerobic conditions in the soil following sustained application ofreclaimed water with significant biological oxygen demand (BOD) content can causeproblems with odour and plant function. High levels of chlorine in treated water mayalso make water unsuitable for irrigation.
If the salinity level of the effluent is too high then it becomes unsuitable for manycrops. Treatment processes such as stabilisation lagoons, where total salinity of theeffluent is likely to increase, may need to be replaced by settlement, sand filtration andultra-violet disinfection prior to irrigation onto crops.
Health requirements affect the required water treatment levels for various crop types,based on the likelihood of human contact with the wastewater. For example, Victorianregulations divide wastewater into different grades, depending on the treatment theyhave received. Category One wastewater (primary treatment only) can be used on fibreor seed crops, fodder crops for animals other than pigs, beef cattle and milkinganimals, and forestry areas or tree nurseries with no public access. Category Twowastewater (secondary treatment) may be used to irrigate food crops that are cooked,peeled or processed before eaten, pasture and fodder crops for animals excluding pigs,cattle and milking animals, as well as orchard and vineyard crops (Eden, 1994).
Health requirements also affect what kind of irrigation techniques may be used. Dripor underground irrigation schemes have a reduced risk of human contact or ingestionas compared to spray or sprinkler based systems, and so can be used with water of alower quality.
Potential health and environmental effects may result from impurities in effluentincluding nutrients, pathogens (bacteria and viruses) and toxic substances. After

31
disposal, a number of outcomes may result, with respect to these impurities (WaterAuthority of Western Australia, 1994):
• they may be destroyed (for example, bacteria and viruses may die over time)• impurities such as salts, phosphorus and heavy metals may be retained in the
soil and may cause future salinisation, land degradation or the need for soilreplacement strategies
• they may be taken up by vegetation;• they may remain in water run-off, leading to nutrient build-up in lakes and
rivers, and• they may infiltrate groundwater, also leading to nutrient and salt build-up and
other potential problems. The response time for groundwater contaminationwill depend on the depth of the water table and transmissivity of the unsatur-ated zone. Groundwater discharge is often a source of flow in rivers, particu-larly during dry seasons.
The effects of land disposal differ across sites, depending on climate, topography, soilcharacteristics (type, drainage, depth), geological formations, hydrogeology, land useand proximity to dwellings and watercourses.
In common with other re-use schemes, agricultural re-use schemes reduce the volumeof wastewater discharged directly to the aquatic environment. Because the irrigatedcrops will take up some of the nutrient in the water, the levels of nutrient reachingnatural waterways may also be reduced.
8.2 Irrigation of Landscape and Recreational Areas
Irrigation of urban landscape and recreational areas is one of the most commonapplications of wastewater world-wide, with examples being found in the USA,Mexico, Japan and Arabia. Municipal authorities throughout Australia have usedtreated wastewater for irrigation of recreational areas for decades.
The wastewater may be used to irrigate public parks, golf courses, ovals and othersporting facilities or to create recreational water bodies in parks. The creation ofsurface water bodies may be a way to cope with excess flows during periods of re-duced demand for reclaimed water. However, because the water is used in areas thatare open to the public, there is potential for human contact; consequently re-use watermust be treated to a high level to avoid risk of spreading disease. Schemes must bemanaged effectively to avoid problems with community health, aesthetics, odour,insect infestation and the build up of nutrients, including eutrophication and algalblooms.
The demand for irrigation water is seasonal, and limited by the amount of land to beirrigated. Parks and recreation areas tend to be scattered and, individually, are rela-tively small water users. The difficulty and expense of providing reticulation may be abarrier to many of these schemes. Nevertheless, such schemes have the potential toimprove the amenity of the urban environment and reduce the demand for new sourcedevelopments. They also reduce the total wastewater flows to the environment and,
32
because there is some nutrient uptake by the plants, reduce the release of nutrients intothe aquatic environment.
8.3 Non-Potable Residential Re-use
Non-potable, residential re-use schemes comprise local systems, (that is: systemsoperating in a single house or building complex), and dual reticulation systems.
8.3.1 Local SystemsDomestic wastewater can be separated into two flows: ‘greywater’ and ‘blackwater’(ACT Electricity and Water, 1994a). Greywater is all liquid waste originating from adomestic dwelling with the exception of toilet and bidet waste, which is known asblackwater (ACT Electricity and Water, 1994a, 1994b). While greywater does nothave the level of faecal contamination of blackwater, the levels of faecal coliformsand other bacteria in some sources of greywater means that it is generally not suitablefor uses where human contact is possible.
Non-potable greywater re-use schemes may treat the water to a primary level, or ahigher level, including some filtration and disinfection. Water quality studies suggestthat untreated and primary treated greywater frequently contains levels of faecalcoliforms and other bacteria which make it unsuitable for use as contact water. Thisincludes uses such as toilet flushing where, although there is no intended humancontact, the spray created by a flushing toilet leads to a contact risk (Jeppesen, 1994;Lechte et al., 1995).
There are many systems for reusing greywater at the household level. In California,systems which use greywater treated to a primary level for subsurface irrigation ofgardens, have been in use for many years and studies have shown no health problemsassociated with their use.
In some cases garden irrigation schemes may not be suitable. There are concerns thatchemicals in greywater may damage clay soils, and nutrient-rich greywater may notsuit all plants, particularly natives that often require nutrient depleted conditions forgrowth (Jeppesen and Solley, 1994; Beavers, 1995).
In non-sewered areas of Australia there is a trend towards small scale, single house-hold sewage treatment plants. While the emphasis has been on the disposal of sewagethe output from these plants, when properly operated, is generally suitable for sub-surface irrigation. These systems require care and maintenance and there is concernthat poor quality water might be discharged due to failure to properly maintain them.
In Japan, the most common in-house greywater re-use system is the hand basin toilet.A hand basin is set into the top of the cistern, so water from hand washing forms partof the refill volume. Hand basin toilets are reportedly installed in most new houses inJapan. Japan also has many instances of greywater re-use in high rise buildings. Kiyaand Aya (1991) identify 844 buildings in Japan containing wastewater recycling
33
systems. In these systems, treated greywater is used within a high-rise building fornon-contact purposes, especially toilet flushing.
In view of the above discussion, it can be concluded that:
• Greywater should never be re-used where direct ingestion is possible.• Untreated greywater re-use should be discouraged due to high bacterial, BOD
and suspended solids (SS) content.• Greywater should only be used for subsurface irrigation of non-edible plants
following filtering to prevent blockages and soil clogging.• Undisinfected treated greywater can be used for sub-surface irrigation provided
there is no contact with humans except during system maintenance.• Where human contact is inevitable, only disinfected treated greywater should be
re-used (for example, surface irrigation, toilet flushing, car washing,laundering).
Greywater used for garden irrigation may contaminate groundwater. Excess irrigationmay also lead to greywater runoff. The storage of greywater for more than 24 hourscan result in offensive odours (Water Authority of Western Australia, 1994e).
In the Western Australian Wastewater 2040 studies, domestic greywater re-use wasseen as an acceptable option, again with cost as a possible barrier, particularly ifapplied to existing housing. Some concerns were raised about possible human contactwith greywater in dual reticulation systems.
It seems possible that the public may be more willing to accept greywater re-use thanmany health authorities or water utilities. Many residential households re-use grey-water, particularly from washing machines, for garden watering despite the diseaserisk involved.
Social surveys conducted in Melbourne indicate that people support the recycling ofbathroom and laundry wastewater, although the preferred pay-back period for theinstallation of a domestic recycling unit is limited at two to four years (Christova-Boalet al., 1994).
8.3.2 Dual Reticulation SystemsDual reticulation systems supply treated wastewater for use in non-contact uses,primarily toilet flushing, and for irrigation purposes (Beavers, 1995).
There are many such schemes in operation in the USA. A review undertaken as part ofthis study is given in Thomas (1995a). The City of Altamonte Springs, near Orlandoin Florida, may be considered typical. The scheme is for non-potable residential uses,and has an output of 10 Mg/d (45 ML/d) of reclaimed water. Its key features are asfollows:
• The scheme serves a population of 45 000 people, and the reclaimed water isused for residential garden irrigation, industrial, commercial and public build-ings irrigation (including the grounds of the regional hospital), as well as openspace irrigation. Some of the reclaimed water is being supplied to office and

34
apartment buildings for toilet flushing and once-through cooling purposes. Thewater is also used for lake level control, automobile washing, fountains andwaterfalls. Around 30% of the total supply is provided from the reclaimed waterscheme.
• The decision to build the re-use scheme came from concerns about the effect ofeffluent from the previous treatment plant on quality in the receiving water, awetland, and the need to limit withdrawals of potable water from the CentralFlorida aquifer.
• Influent comes from a separate sewer system dominated by residentialdischarges. It is low in salinity.
• The treatment train is (i) primary sedimentation tanks (ii) biological secondaryphase which includes anoxic tanks, nitrification tanks, recycle pumps and secon-dary clarifiers (iii) tertiary phase which includes chemical addition (methanoland alum), coagulation, filtration, re-aeration and high-level disinfection (iv)polishing for de-chlorination and pH control and (v) sludges from the primaryand secondary processes being thickened, aerobically digested and de-wateredon belt filter presses, for disposal by contract hauling.
• There is comprehensive and continuous process control and a well-equippedanalytical chemistry laboratory, which provides frequent quality control reportsto the regulator, plus reports of any exceptional events and actions taken as aresult of these.
• The scheme provided reclaimed water at an incremental cost of around $0.4/kL(in A$ 1995). Incremental cost covers the treatment plant upgrade and reticu-lation network for delivery of reclaimed water, but not the sunk cost of the pre-existing sewer network. Trenchless technology was used to retrofit the city withsmall-diameter pipes for delivery of the reclaimed water. This meant that therewas no need to dig up streets, driveways or access paths. The city sits on a sandysoil.
• In introducing the scheme, there seems to have been a mixture of forceful advo-cacy on the part of the water utility, combined with extensive public consult-ation, resulting in general acceptance. The city ordinances were amended toenforce compulsory connection to the reclaimed water distribution network.
• No public health impacts were detected in the six years of operation from 1989to 1995.
Only small scale pilot level non-potable re-use schemes have been operating withinAustralia. These have involved strict environmental and health monitoring; the retro-fitting of households at no cost to the household; and investigation of consumeracceptability. Commercial scale domestic re-use schemes have not yet been devel-oped. However, a large scheme is being planned for Rouse Hill, New South Wales,and a small experimental project has been built at New Haven in South Australia.Planning strategies for the township of Cockatoo, which is not connected to theMelbourne Water sewerage network and the Caroline Springs (Melton East) estate, inVictoria, have investigated the potential for domestic re-use and dual reticulationschemes for households. Domestic re-use and non-potable reclamation has also beeninvestigated as an option in the Plenty Valley area in Victoria (Melbourne Water,1992b).

35
Environmental monitoring should be an integral part of any development of domesticre-use schemes. Monitoring of the Shoalhaven Heads (New South Wales) pilot projectresulted in the following recommendations for re-use schemes:
• Monitoring is needed to assess environmental impacts.• Tests for heavy metals, toxins etc should be carried out every six months,
depending on site characteristics.• Soil and groundwater should be monitored every six months to assess changes
due to reusing effluent.• Biophysical characteristics and suitability should be taken into account when
selecting a potential re-use site.• Vegetation should be inspected regularly, as well as recording drainage flows,
water-logging, obvious diseases, deaths, abnormal growths and proliferation ofweed species.
• Odour problems should be attended to quickly.• Nearby waterways should be monitored, to determine any water quality changes.
Guidelines developed in 1992, and introduced into NSW for the “Urban and Resident-ial Use of Reclaimed Water” (New South Wales Recycled Water Coordination Com-mittee, 1993), specify the required water quality and the technology needed for avariety of non-potable uses. The strict microbiological standards of the water used indual water systems are similar to those that would be required for the potable re-use ofwastewater. Further similarities are noted, with the basics of a potable reclamationplant already provided within a dual water supply treatment plant.
Non-potable re-use leads to both a reduction in water consumption from other sourcesand a reduction in wastewater flow rate. So re-use schemes may thus avoid the ad-verse environmental consequences associated with conventional water sources andwastewater disposal systems.
8.4 Potable Re-use
8.4.1 Direct Potable Re-useDirect potable re-use involves adding treated wastewater directly into the normaldrinking water supply system. Direct potable re-use has been technologically feasiblefor many years. A potable re-use plant has operated successfully in Windhoek,Namibia, for example, since 1969 (although not continuously). This was followed bya larger demonstration plant at the Daspoort Sewerage Treatment Works in Pretoria.However water from the Daspoort plant has not been used to supplement drinkingsupplies. In the United States, the Denver Potable Re-use Demonstration Projectoperating since 1984, has recently ceased operation.
While treating effluent to potable standards is technically possible it has generallybeen too expensive to be taken seriously as a supply option. However, in evaluatingthe re-use scheme at Rouse Hill in New South Wales, the cost of a dual non-potablewater supply was estimated at $32.5 million. The cost of reclamation to potablestandards was higher at $34.7 million. The difference is small enough for potable re-

36
use to be competitive with the alternative. It is expected that operating costs would besimilarly competitive. A potable re-use system also has the advantage that a separatereticulation system is not required, a definite advantage in established residentialareas.
Direct potable re-use reduces the volume of wastewater discharged to the environmentand reduces the demand on water supply sources. Because potable re-use replaces analternative supply source, it avoids any environmental penalties associated with theuse of that alternative source.
8.4.2 Indirect Potable Re-useIndirect potable re-use consists of discharging wastewater to receiving waters that feeda downstream source for a potable water supply system. Undesirable qualities of thewastewater may be diluted to acceptable levels. A pilot scheme based on this principlewas constructed at the Cerro del la Estrella sewage treatment plant in Mexico city,where treated wastewater, which meets the criteria for potable re-use (except for totaldissolved solids (TDS)), is diluted by water from other sources.
A typical form of indirect re-use occurs where wastewater is disposed to a river thatforms all or part of a downstream township’s drinking water supply. One example isthe Thames catchment. It is often said that a water consumer in east London maydrink water that has been recycled through seven or more sewage treatment plants.Inter-town distances along U.K. rivers are short. Thus a large proportion of watersupplies in the U.K. are from indirect potable re-use. Similar situations prevail inmany countries, including Australia.
8.5 Industrial/Commercial Re-use
The most common industry use of reclaimed water is non-contact cooling. Examplesinclude the Curtis Stanton Energy Centre and McKay Bay Refuse-to-Energy Facility,both in Florida. Reclaimed water may also be re-used as industrial process water orboiler feed water. For example, the Xerox Corporation in the USA uses approximately4ML/day of reclaimed water in paper manufacturing.
Quality requirements for industrial water vary with the use. Boiler feed water musttypically be of very high quality, to avoid corrosion and scale problems. Cooling watergenerally has lower quality requirements, however even in this application, reclaimedwater may be less desirable because evaporation in cooling towers concentratesimpurities in the water. Cooling water must be discharged as waste (blowdown) oncea certain concentration is reached. The impurities in wastewater implies that it must bedischarged more frequently, resulting in increased total water use and volume of waterdischarged from the industrial site.
Health issues associated with the industrial re-use of wastewater include the microbialcontamination of wastewater; growths in the cooling tower; and pathogens released inthe blowdown of concentrated wastes after evaporative cooling. However, the effect

37
of micro-organisms under these circumstances would be well below typical occu-pational exposure limits (Hartley et al., 1991).
In view of the positive attitude that the public holds towards wastewater re-use, therecan be little doubt about the acceptability of industrial re-use. However there are po-tential problems if the wastewater increases odour or has perceived health problems.
The benefits of industrial re-use include a reduction in the volume of waste dischargedto the sewerage system and the avoidance of environmental effects associated withequivalent augmentation of scheme water headworks. The disadvantages include theincreased discharge to the environment of cooling tower chemicals, and the environ-mental effects associated with the cooling water treatment plant (Hartley et al., 1991).
8.6 Re-use In Groundwater Systems
Treated sewage or stormwater may be deliberately recharged to aquifers in order toachieve one or more of the following aims:
• It may provide a means of storage during periods of low water demand.• The aquifer may be used as a method of water distribution and additionally
provide a stage of water treatment.• Wastewater of particular qualities may be used to improve the overall water
quality of the aquifer. For example wastewater with low salinity may be addedto a brackish aquifer to make the water drinkable.
Wastewater may also be used to deliberately recharge groundwater systems for otherpurposes, for example, to prevent saltwater intrusions into an aquifer. The Water 21Factory in Orange County, California, accepts sewage from a large part of southernLos Angeles. Following tertiary treatment, the effluent is used for injection to ground-water in order to create a mound which will prevent ingress of salt water across thecoastal aquifer which itself has been depleted by past withdrawals. It is also planned topump the treated effluent inland and inject it within a recharge area for an aquiferwhich is used for potable supply purposes.
Dillon et al., (1994) undertook an extensive review of the international literatureregarding injecting water for storage and re-use. Pilot trials using treated sewageeffluent are now in progress in Basos-Riera D’Horta (Spain), and Bay Park, CedarCreek, and El Paso (in the USA).
To date in Australia, artificial aquifer recharge using sewage effluent has only beenpiloted in Carrum, Victoria in the 1970s (Lakey, 1978). However pilot studies areunderway to investigate the use of stormwater runoff for aquifer storage and recoveryat Andrews Farm, South Australia. Waters from the Bremer Creek and BrownhillCreeks respectively are being used to control a saltwater intrusion and enhanceirrigation supply elsewhere in Australia.
Water quality criteria for recharge relate to the beneficial uses of the reclaimed water.Throughout the USA, effluent must be tertiary treated if used for aquifer recharge inorder to comply with the US EPA Drinking Water Standards. Recharged water has
38
been used for drinking, irrigation and industry. Hydrogeological factors are important,and aquifers with high transmissivity are preferred. Most aquifer types used for re-charge are sedimentary formations. Clogging can result from physical, chemical andbiological processes (Dillon et al., 1994).
With the exception of increases in viruses, bacteria and ozonation products ground-water quality usually improves following injection. Lake water (not treated effluent) inIsrael that was used for recharge resulted in bacterial growth around the well, limitinga potential use for the water as a potable supply. Further studies are required related toattenuation processes within aquifers to treat the injected water to an acceptablestandard for pre-defined beneficial uses (Dillon et al., 1994).
A study has been undertaken to determine Australian guidelines for the quality ofwater injected into aquifers (Dillon and Pavelic, 1995). The major issues addressed inthis study include water quality requirements for groundwater protection; operationalproblems such as clogging and how to resolve these issues. International experiencesuggests that with appropriate management, water quality and technical problems maybe overcome.
8.7 Stormwater Re-use
The runoff from Australian cities equals or exceeds the amount of potable watersupplied to homes each year (Dowsett et al., 1995). About 50% of water supplied isused for purposes where less highly treated water would suffice (such as for wateringgardens, toilet flushing). Stormwater re-use would be an effective alternative watersource in cities such as Adelaide and Perth, for example, where rainfall typicallyoccurs during the winter months with very little occurring during summer. Aneffective means of storing winter stormwater locally could provide a useful alternativesupply for summer (Engineering and Water Supply Department, 1993).
A range of potential stormwater reuse techniques are available. In New South Wales,for example, Dowsett et al., (1995) recommend that state and local government shouldprovide financial incentives for the implementation of on-site detention, reuse and/orunderground retention of stormwater. On-site detention, when used on unpaved orgrassed surfaces, may be used to trap and remove contaminants from stormwater andincrease infiltration into the ground (CEPA, 1993). Constructed (or artificial) wetlandsmay be used to collect rainfall runoff and help transform stormwater from a probleminto a viable resource (Dowsett et al., 1995) . According to Clark (1992), it isestimated that artificial recharge using urban stormwater has the potential to provide asource of water for irrigating an Adelaide college ground at less than half the currentcost of mains water. Dowsett et al., (1995) recommend that the potential for recharg-ing the Botany aquifer with treated stormwater as a means of augmenting Sydney’swater supply for non-potable purposes should be investigated. A more detaileddiscussion of stormwater management is presented in Part III.
39
8.8 Sludge Re-use
Sludge re-use is beyond the scope of this paper, but it should be noted that an increasein the level of treatment of sewage, which would be implied by many of the re-useschemes considered here, would lead to an increase in the amount of sludge to bedisposed of. There is already an upward trend in sludge production, which is largelydue to improved sewage treatment practices and increased sewage flow (Gibbs et al.,1993). If re-use is to increase substantially then it must be possible to safely andeconomically dispose of the sludge produced.
Disposal methods once used for sludge management, such as ocean disposal, are nowconsidered environmentally inappropriate. Two trends in sludge management havedeveloped overseas. In Europe, there is a push towards dual management of sludge,both for environmentally correct incineration and landfills. America is pursuing landapplication/re-use options. Australia is also considering this as a possible alternativeto existing sludge management techniques (Waste Management and Environment,1994b).
New South Wales leads Australia in the adoption of sludge re-use options. In 1989,over 60% of the sludge handled by the Water Board was disposed of primarily into theocean. By 1993, nearly 70% of the sludge generated was being re-used and disposal tothe ocean had ceased. The Bolivar Sewage Treatment Plant in South Australia andsome regional centres have also developed sludge handling facilities.
The development of appropriate regulatory guidelines and health issues are majorissues relating to sludge re-use. As with most effluent and wastes, the regulationsgoverning sludge disposal and re-use are implemented within states, involvinggovernment departments of health, agriculture, environment and waste management(Gobbie, 1991). The NSW Environmental Protection Authority’s “EnvironmentalGuidelines for the Use and Disposal of Biosolids” is the first of its kind in Australiaand provides a framework for the sustainable use and disposal of biosolids. Studiesare also being undertaken by NSW Agriculture and NSW State Forests. Nationalguidelines for sludge management are being developed by a working party ofARMCANZ (Waste Management and Environment, 1994b).
There are some health concerns linked to the re-use of wastewater sludge. Sludgegenerated at metropolitan plants contain heavy metals, pesticides and other con-taminants (Kayaalp, 1994). While often in low concentrations within the sludge,contaminants may build up in fatty tissue when ingested via the food chain (Gobbie,1991). Concerns also arise when people come in direct contact with the waste(Kayaalp, 1994). These contaminants are thought to enter the sewerage systemthrough illegal discharges and from industrial sources. Therefore action to reduce thelevel of contaminants in sludge can focus on physically removing them, or controllingthem through a more cost-effective, strict trade waste policy (Gobbie, 1991).
Queensland sludge management will be based on guidelines developed by theDepartment of Primary Industry. Biosolid supply will be divided into three classesbased on their heavy metal and organochlorine compound concentrations. Class Abiosolids will be suitable for unrestricted public sale; class B will have a slightly

40
higher level of contamination, for land application and site management practices;class C biosolids will have still higher contamination concentrations (still withinguidelines) and remain under the control of the local council (Waste Management andEnvironment, 1994b).
8.9 Conclusions
The study has concluded that a variety of potential markets exists for reclaimed water:
• It appears highly likely that some urban water demands could be effectively supplied by reclaimedwater, either to potable or non-potable standard.
• As the cost of treating water to potable standards decline, this option may become more attractiveover time especially if wastewater treatment standards increase.
• Assessment of the retrofit market can only be done on a plant-by-plant basis taking account of urbanlayout, topography, soils, demand and costs. Retrofitting dual reticulation is probably not an econ-omically viable option for many existing housing or infill developments, though advances in trench-less technology are cutting the costs of retrofitting. A potential market exists in new developmentswhere dual reticulation can be incorporated into the initial design and costing
• The potential market for greywater for domestic non-contact uses is large. Without adequate levelsof treatment, however, the greywater is probably only acceptable for sub-surface garden irrigation.In this case, capital costs of setting up these schemes may be the major limitation.
• The market for urban irrigation will depend on the amount of public open space and the level of irri-gation required. Although small in overall terms, the urban irrigation market can be significant inreducing discharges to sensitive environments.
• Industrial use of reclaimed water is an important market. Industry and commerce use approximatelya third of urban water in Australia and the demand pattern is relatively constant throughout the year.Due to the variations in water quality requirements of different markets, adequate treatment levelsmust be ensured to avoid problems such as corrosion, staining, scale deposition and foaming.
• Irrigated agriculture and woodlots on the fringes of urban areas is an important market.• In country towns there is considerable scope for both re-use in irrigation and for land disposal.
9. PUBLIC ACCEPTABILITY AND HEALTH ISSUES
9.1 Public Acceptability of Re-use
Several Australian water agencies have studied the acceptability of wastewater re-use,including Brisbane City Council, Melbourne Water, Sydney Water, ACT Electricityand Water, SA Water and the Water Authority of WA. In these studies, often invol-ving workshops, the community has been found to be generally in favour of re-use. Infact there has been strong resistance to current disposal methods, which have beenseen as both environmentally damaging and the waste of a potentially valuableresource.
In 1988, the Brisbane City Council carried out a survey of 1508 community members,in which potable re-use of wastewater was one of the issues raised (Hamilton andGreenfield, 1991). The results stated that 13.3% of respondents agreed that wastewatershould be recycled for drinking. Of the remainder, 57.4% disagreed but did notstrongly disagree, indicating that respondents were not as critical as they might havebeen (Hamilton and Greenfield, 1991). Results of a survey conducted by theUniversity of Queensland in 1991 concluded that:
41
those who are already convinced of the value of potable re-use account forapproximately 20 per cent of the population while those that would never acceptthe idea no matter how good it was account for less than 5 per cent. (Hamiltonand Greenfield, 1991, p. 505)
The vast majority of the population therefore needs to be convinced of the viabilityand reliability of the potable re-use option. This could be achieved through communityeducation and pilot demonstrations (Hamilton and Greenfield, 1991).
A review of community opinions in Victoria showed a clear distrust of the potable re-use option (Melbourne Water, 1992a).
Potable re-use was raised as an option at the Perth Wastewater 2040 Communityworkshops. Participants felt that, while it was a technically acceptable option, its costwas excessive. Health issues were not perceived to be a problem by this group.
At the same time, health concerns are frequently raised by the public, particularly inrelation to residential re-use schemes and the irrigation of urban recreational areas andcrops for human consumption.
9.2 Known Public Health Impacts of Re-use Projects
There are many texts which vividly describe the potential health effects of drinkingcontaminated water. These include typhoid, cholera, hepatitis A and E, euteric fever,gastroenteritis, giardiasis, amoebisis, and cryptosporidiosis. Skin diseases may alsoarise from contact with contaminated water or from aerosols. Forsyth (1993) providesa summary of Australian experience.
However, the literature only serves to emphasise that all stages of water supply andwastewater treatment must be carefully controlled and monitored. Reclaimed watersystems are just one technical variant.
As the longest period of experience with large-scale re-use projects is in the USA,particular attention was paid to the availability of documented public health investi-gations in that country. The most general statement of the public health effects of re-use schemes in the USA is given in the US EPA Guidelines for Water Re-use, (p. 25):
Epidemiological investigations directed at wastewater-contaminated drinkingwater supplies, use of raw or minimally-treated wastewater for food cropirrigation, health effects to farm workers who routinely contact poorly treatedwastewater used for irrigation, and the health effects of aerosols or wind-blownspray emanating from irrigation sites using undisinfected wastewater, have allprovided evidence of infectious disease transmission from such practices.
However, epidemiological studies of the exposed population at water re-usesites receiving disinfected reclaimed water treated to relatively high levels areof limited value, because of the mobility of the population, the small size ofstudy population, the difficulty of determining the actual level of exposure of

42
each individual, the low illness rate – if any – resulting from the re-use practice,insufficient sensitivity of current epidemiological techniques to detect low-leveldisease transmission, and other confounding factors. It is particularly difficultto detect low-level transmission of viral disease, because many enteric virusescause such a broad spectrum of disease syndromes that scattered cases of acuteillness would probably be too varied in symptomology to be attributed to asingle etiological agent.
The limitations of epidemiological investigations notwithstanding, water re-usein the U.S. has not been implicated as the cause of any infectious disease out-breaks.
Kindzierski and Gabos (1994) reviewed health effects associated with wastewatertreatment, disposal and re-use. While they point to well-known health problems withoverflows of untreated sewage, particularly Hepatitis A illness, and problems with rawwastewater irrigation, they reported no public health impacts form the use or reclaim-ed (that is treated) wastewater. They did, however highlight the importance of applica-tion technologies for edible crop irrigation using reclaimed water, and the importanceof monitoring of groundwater recharge schemes using reclaimed water.
At a more specific level, the City of St Petersburg, Florida, Public Utilities Depart-ment commissioned a panel of experts covering environmental engineering, viralepidemiology, and environmental microbiology to undertake an assessment of healthrisks from the city’s re-use scheme, which is one of the largest and longest running inthe world. In conducting their investigation the consultants emphasised that treatmentschemes must always be designed to eliminate, or at least minimise, the potential riskof disease transmission.
To estimate the potential risk it is necessary to examine clinical and epidemiologicalinformation related to the infectious agents of concern. It is not necessary to repeatthese factors here. They are well documented in the US EPA Guidelines (Camp,Dresser and McKee, 1992) and the Australian Draft Guidelines for Wastewater Re-use, (1995) (National Water Quality Management Strategy, 1996a). The consultants tothe City of St Petersburg found:
• no evidence of increased enteric diseases in urban areas irrigated with treatedreclaimed wastewater using coagulation, filtration and disinfection, and
• no evidence of significant risks of viral or microbial diseases as a result ofexposure to effluent aerosols from spray irrigation with reclaimed water (CampDresser and McKee Inc, 1987).
The consultants provided recommendations about design, construction, operation,monitoring and turbidity/faecal coliform standards. They recommended against theintroduction of virus standards, because of the adequacy, as they perceived it, ofsurrogate measures. However, they did recommend that the distribution system shouldbe checked for bacterial growth, as well as the treatment plant. These aspects havebeen considered in the Australian Draft Guidelines for Wastewater Re-use, (1995)(National Water Quality Management Strategy, 1996a).
43
Because of the limited extent of urban re-use schemes in Australia, there is littleaccumulated evidence of their public health impacts. However, one case of infectiousdisease outbreak was reported in the Australian Medical Journal (Flood et al., 1994).The article reported that, while not proven, there was strong circumstantial evidencethat an outbreak of Mycobacterium ulcerans in a community on Phillip Island,Victoria was associated with spray irrigation of a golf course (using treated reclaimedwastewater). Both golfers and nearby residents were affected. (Mycobacteriumulcerans produces deep skin lesions that must be surgically removed. The disease iscommonly known as Barnsdale Disease, and the bacterium is endemic in the soils ofthe Mitchell River floodplain in Queensland.) The outbreak ceased after modificationof the storage and irrigation regime. The Infectious Diseases Unit at Fairfield Hospitalin Melbourne is examining the case and is trying to develop methods to detect thebacterium in the environment. It should be noted that the Victorian Department ofHealth and Community Services believes that the environment of north east PhillipIsland probably became contaminated with bacteria sometime in the early 1990s, butthat it is unlikely that the treated wastewater was the source of the bacteria. However,it has not ruled out the possibility that increased soil wetness caused by the golf courseirrigation system may have increased the risk of infection. It is thought that the treatedwastewater may have been contaminated by contact with infected soil or groundwaterin the golf course dam and became an infection pathway. Further to this, the majorityof cases occurred during winter, when there was little use of treated wastewaters.
Recently, the performance of the Rouse Hill, NSW coagulation/floculation treatmentprocess with respect to the control of Cryptosporidium and other pathogens has beenreviewed. The report indicated a preference for microfiltration or reverse osmosis fordisinfection purposes. Such quality control issues are encountered in most watersupply schemes: for example a treatment plant was installed for Sydney water suppliesbecause of emerging problems with Giardia and Cryptosporidium in surface watercatchments.
9.3 Role of Re-use Guidelines and of the Regulator
In most States and Territories throughout Australia, the approval of both the HealthDepartment and the Department of Environmental Protection would be needed for re-use schemes to proceed.
In the USA, State Governments provide detailed re-use regulations which require theactive oversighting of the quality control aspects of treatment plant operation by aregulatory agency external to the water utility. This comprised weekly laboratoryreports and a system of exception reporting which obligates the utility to report anysituation where the treatment plant goes out of normal bounds, the reasons for this,and the remedial actions taken. This arrangement was particularly valuable to the re-use industry, as it provided both visible public endorsement of the treatment plantoperations, and consumer protection.
In discussions with Australian water managers who are investigating further re-useprojects, there was some dissatisfaction with the National Water Quality ManagementStrategy (1996a) on Use of Reclaimed Water. It was felt that insufficient
44
differentiation of the target quality for reclaimed water had been made with respect tothe particular irrigation system being used. For example, imposing a water qualitystandard suitable for spray irrigation on a well-controlled micro-irrigation schememight be considered to be over-cautious. (This observation was noted by the authorsof the Draft Guidelines, which were subsequently modified: editor).
9.4 Conclusions on Public Health and Acceptability
The Phillip Island case described above is consistent with the statements of the USEPA and of the City of St Petersburg public health consultants. It serves to emphasisethe importance of correct design, construction, operation and maintenance of re-useprojects. Re-use in Australia may encounter problems specific to our environment; forexample through the prevalence and ambient conditions for particular bacterial andviral species. It is desirable that research be encouraged on Australian pathogenic,viral and bacterial species in wastewater, and the ambient conditions for their propa-gation and transmittal. Adequate risk assessment methodologies are needed forAustralian re-use projects.
Strong public education and public involvement programs are essential to the planningand operation of re-use schemes. These activities should include schools programs,visitor programs to treatment facilities, general public information provisions andcommunity involvement in decision-making about new re-use schemes.
The dominant impression gained from USA practices, is that the encouragement ofwastewater re-use is now an established policy and accepted at national level. It seemslikely that there will be a tripling in the volume of reclaimed water re-used in the USAby the year 2000. Wastewater reclamation and re-use has been an established practicein several states, notably Florida and California, for over 20 years. Florida andCalifornia together reclaimed more wastewater in 1994 than the total wastewater flowin New South Wales. There is no evidence that infectious disease outbreaks in theUSA have been associated with the use of reclaimed water that has been treated torelatively high levels. Wastewater re-use has become an accepted part of the watersupply system in California and Florida. However this was not achieved withouteffort. All re-use programs were accompanied by public involvement campaigns.Public involvement took the form of school programs, visitor programs to reclamationfacilities and active communications activities. The importance of strong publiceducation programs and public involvement in decisions about the development of re-use projects was emphasised.
In Australia, several water authorities have studied the public acceptability of waste-water re-use. The community was generally found to be in favour of re-use. In fact,there was considerable community resistance to disposal schemes, which were seen aswasting a potentially valuable resource and having potential environmental problems.Marine disposal, particularly was not favoured by the community, being seen as notonly wasteful but potentially polluting.
Health concerns are frequently raised by the public, particularly in relation toresidential re-use schemes, but also about irrigation of urban parkland and crops for
45
human consumption. However this should not detract from the generally favourableresponse to these schemes.
Recommendations on the appropriate methods and degree of treatment required for specific water re-use projects must be assessed not only from a technical and economic perspective, but should also takeinto account community concerns, and address the National Guidelines for Wastewater Re-use.
10. ECONOMICS OF WASTEWATER RE-USE
10.1 Engineering Costs
The engineering assessment of re-use or land application projects requires anevaluation of average and peak demand characteristics, level of service in terms ofreliability and water quality, treatment plant influent quantity and quality, requiredtreatment train, hydraulic flows, pipe and pump station requirements and servicereservoir storages, distances to re-use/land application site, and conditions at the re-use/land application site. These factors will obviously vary between locations.
The literature survey did not yield any recent published engineering cost evaluationsof re-use projects, though the United States Environmental Protection Agency (1978a,b, and c) has published indicative data. Pound et al., (1975) provided cost compari-sons for land application versus advanced wastewater treatment. While their originaldata, in US dollars, are now of little interest in Australia, some of their conclusions arestill relevant:
• In general, land application systems exhibit less economies of scale thanadvanced treatment and thus tend to be more cost effective at lower flowcapacities.
• If conditions (including sale value of the crop) favour irrigation, then re-useschemes exhibit greater economies of scale.
• Land application systems remain cost-effective at higher flow capacities if theonly alternatives are higher-level advanced treatments such as biologicalnutrient removal, lime addition, or ion exchange.
• Infiltration/percolation are the lowest cost land application system under suitableconditions.
• Land price is critical in determining the viability of land disposal. In general, thelower the flow capacity of the land application system, the higher the price thatcan be paid for the land while remaining cost-competitive with advancedtreatment.
• If transport distances are small, then irrigation and overland flow systems arecost-competitive with moderately advanced treatment.
Assessing economic viability is more complicated in urban retrofit situations. Theconceptualisation of re-use schemes is of necessity opportunistic, involving the match-ing of design and construction options to available demands in a cost-effective man-ner. The rapidly increasing use of trenchless technologies for pipe installation in avariety of terrains is changing the relative cost of retrofits. For example, the availa-bility of trenchless technology was a key factor in the cost-effectiveness of the retro-

46
fitted reticulation system for supply of reclaimed water to the 45 000 population of theCity of Altamonte Springs, in Florida in the late 1980s. The improving performance ofpackage treatment plants for use in sewer interception schemes creates opportunitiesfor grafting re-use facilities onto existing dendritic sewage collection systems, thusavoiding the need for expensive pump-back from a large plant situated at the bottomof the collection system.
As the number of technical options increases, there is increasingly a need to evaluatedecentralised systems against the more traditional centralised systems. Clark (1995)has shown that the scale economies of large treatment plants in centralised systems isvirtually offset by the scale diseconomy of the trunk mains needed to transport sewageto the central treatment plant. As a result, average costs of the sewage handling systemare relatively invariate over different scales of collection system.
The engineering assessment of re-use projects requires careful evaluation of average and peak demandcharacteristics, level of service required in terms of reliability and water quality, treatment plant influentquantity and quality, required treatment train, hydraulic flows, pipe and pump station requirements andservice reservoir storages. These factors will obviously vary between locations.
As the number of technical options increases there is increasing need to evaluate decentralised systemsagainst the more traditional centralised systems.
Although limited in extent, several wastewater re-use facilities have been trialed inAustralia. The Southwell Park wastewater recycling plant in Canberra, and the RouseHill Development Project in Sydney demonstrate costs of introducing water re-use andrecycling in established and new urban developments, respectively. The Power andWater Authority in Darwin is evaluating a re-use plan which provides a simple ex-ample of infrastructure cost saving from re-use.
Southwell Park, Canberra: The Southwell Park water mining plant (believed to bethe first of its kind in the world) is a custom-designed and manufactured three-stagesewage treatment facility located in the suburb of Lyneham, North Canberra. Recycledwater from the plant is used to irrigate the surrounding playing field and park area ofnine hectares, with future plans to include the irrigation of the nearby Yowani GolfCourse, Canberra Racecourse and Canberra Showgrounds. The facility is capable ofproducing an initial output of 300 kL of treated water per day. The plant was jointlyfunded by ACT Electricity and Water(ACTEW) and the Commonwealth GovernmentBetter Cities Program, at a cost of approximately $2.4 million, including $850 000 forcivil construction.
Amortising the capital costs (over a 20 year period, using a discount rate of 8%),annualised capital costs are $240 000. The plant is in its first year of operation, so nofirm operating and maintenance (O&M) costs estimates are available. Since no labouris required to maintain the plant on a regular basis, O&M cost are estimated to beapproximately $60 000 p.a. Total annual costs are therefore, estimated to be $300 000.Based on an output of 300m3/day, the costs of supplying reclaimed water areestimated to be $2.74/m3. It is considered that throughput could be approximatelydoubled with little additional cost, virtually halving the unit cost. Also, as a prototype,the capital costs were higher than would be achieved in a larger production run of

47
similar plants. As primary water supplies become limited, as economies of scale arerealised (in either up-sizing the plant or by having multiple plants), and as thedischarge of treated wastewater to receiving waters becomes less socially acceptable(from an environmental perspective), treatment plants such as this may become econ-omically efficient.
Rouse Hill, Sydney: The Rouse Hill urban development project is by far the largestre-use scheme so far considered in Australia. In an attempt to integrate urban planningwith environmental management, an integrated water cycle management system hasbeen developed, which features water recycling, a drainage system that makes full useof existing landforms, and a state-of-the-art wastewater treatment train, incorporatinga constructed wetland (Environment, 1994).
The following equation may be used to calculate the unit cost of the Rouse Hillscheme:
U = C + Pwhere:
U = unit cost (in $/m3)C = operating and administrative cost ($/m3)P = the constant annual charge (per m3) for reclaimed water required to recover
capital costs over the life of the project (assumed 30 years)
P was calculated from:
K =P* QT
(1+ R)TT =1
30
∑ ie: P = K QT (1+ R)T
T=1
30
∑
where:
K = discounted capital costs ($)R = discount rate expressed as a proportionT = number of years elapsed since project startedQ = annual demand for reclaimed water as a function of T, time.
Assuming discounted capital costs (K) of $32.5 million; a discount rate (r) of 0.05, Tfrom 1 to 30 years, and a Q value of 0.73m3 x 106 (based on the data in project designreports), a constant annual charge of $ 0.24/m3 of reclaimed water delivered to con-sumers would recover capital outlays of the re-use scheme. It is evident that, evenwith the addition of operating and administrative overheads, this scheme appears cost-competitive. The calculation takes no account of distribution system losses, but nordoes it consider cost savings in other parts of the sewage system, in particular any costsavings for higher treatment prior to discharge, if re-use is not undertaken. However,according to the above calculations capital recovery rates, shown below, would befairly slow:

48
Table 7 . Estimated capital recovery rates under the Rouse Hill Re-use Scheme
Elapsed Years % Capital Outlay Recovered10 2120 6030 100
Darwin Re-use Project: In Darwin the re-use of effluent could potentially take up to20% of the wastewater flow, or approximately 1 million m3/yr. This could delay theconstruction of a new dam by two to three years, thus delaying capital expenditure ofaround $200 million. The cost of treated effluent is thought to be approximately $1.50per m3/yr. The benefits (cost savings) of a delayed dam construction may be esti-\mated at approximately $30 million (that is the changed net present value of the $200million expenditure), which expressed as an annual value equates with a benefit of$3.0 per m3 of the reclaimed wastewater flow.
10.2 Environmental Economic Analysis of Wastewater Re-use Projects
The engineering cost estimates of the kind discussed in the proceeding section mayneed to be supplemented by a full cost-benefit analysis (CBA) if a correct decisionabout whether to proceed with re-use is to be reached. The aim of this section is toprovide an overview of the use of CBA to assess the economic feasibility of altern-ative wastewater re-use programs.
Associated with the problem of water management are potentially conflicting econ-omic and environmental objectives which, on one hand, aim to maximise privateeconomic returns from water use, and on the other from a society viewpoint, aim toconserve the ecological standards of both land and aquatic environments. Environ-mental economic analysis provides a general framework to help manage resource usesin a way that takes account of society-wide effects. As such, it:
• provides a framework for management of the environment• indicates the relative net benefits of competing resource uses• assesses the impacts of different policies and programs on externalities, and• provides information on gains and losses to different groups in society.
(Commonwealth of Australia, 1995)
Decisions concerning the environment always involve benefits and costs, some withmonetary value and some without. Environmental CBA provides an effective methodfor judging the economic efficiency of proposed wastewater re-use strategies. CBA ofrecycling and reusing water is discussed extensively by Spulber and Sabbaghi (1994).
In order to assess the costs and benefits of planning and investment in water re-use,the analysis of policy should include:
• holistic supply side analysis• an extensive analysis of water demand of individual user segments (households,
industry, public utilities, agriculture), and• externalities, especially changes in the state of the environment.

49
Water re-use projects both complement and compete with programs of conventionalwater-supply protection, water resource development and water quality improvement(pollution abatement programs) because re-use entails potential reductions in fresh-water withdrawals or groundwater depletion as well as improved surface and ground-water quality.
10.2.1 Supply-Side AnalysisWater recycling and re-use can be viewed as a viable option within a broader frame-work of supply augmentation. In the case of both primary and re-use water supplies,the optimum level of water use will occur where the marginal system-wide cost ofextracting and treating a unit of water is just equal to the benefits obtained from theuse of that unit of water. This represents the level at which marginal net benefits(benefits minus costs) are at a maximum. Primary and re-use water, however, do nothave identical marginal benefit and marginal cost curves. Consequently, the optimumcombination of primary versus re-use water will vary according to local circum-stances.
Comparable planning and evaluation techniques can be applied to manage re-use atthe regional level and to determine efficient recycling at the plant level. The economicefficiency of re-use will depend on a number of factors, including: the costs of the al-ternative sources of water, locational advantage, the costs of the treatment levelneeded to provide effluents of suitable quality, and on potential external dis-economies.
10.2.2 Water DemandLittle is known about how the demand function for water in Australia varies as watersupply quality varies. Yet it is clear that quality requirements change radically, depen-ding on the use of water, and that the price that users would be prepared to pay forwater supply quality improvements would depend on the use. The value that usersplace on water of high quality may be estimated by calculating any costs that the usersmay face if their water supply quality declines (for example: obtaining alternativewater sources, decreased production).
10.2.3 ExternalitiesWater supply developments (including programs of supply, resource development,quality control and re-use) that improve the quality of water bodies, will affect boththe instream uses of water bodies (for swimming, fishing and boating) and withdrawaluses (by industry and public utilities). The costs incurred for these programs yield thebenefits of increased water quantity and quality for these instream and withdrawaluses. For households, this results in aesthetic and recreational amenities from instreamuses, indirect benefits from lower product prices, and direct benefits from better waterand sewerage at lower charges. In addition to these household benefits, any reductionin water production costs from increased water quality and availability, and fromreduced disposal costs not passed on to households in the form of lower prices mustalso be counted as an increase in total social benefits.

50
10.2.4 A simple economic modelPollution abatement can be achieved through changes in: inputs, production, outputs,various pollution-abatement facilities and technologies, and through regulation. Foreach individual firm (water utility), the optimal level of pollution control is obtainedby equating marginal social benefits of pollution control with the marginal costs as-sociated with abatement expenditure. Again the marginal costs and benefits of thepollution control will differ from case to case as input, outputs, technologies and ex-ternalities differ. A simple model of the re-use problem from these perspectives ispresented below.
The cost of a town water supply and its associated wastewater scheme is made up ofseveral components:
• the cost of obtaining the water, which includes: the cost of treatment to requiredlevels; the provision of adequate storage; and the costs of any economic, socialor environmental impacts that arise from development of the source
• the cost of distributing the water, including: the costs of pipelines, servicereservoirs and pumping facilities. In some cases, a major advantage of re-use isthat the reclaimed water supply is located near the water use
• the cost of disposing of wastewater after use, including the cost of townsewerage systems. It also includes the environmental abatement costs associatedwith disposal, such as higher treatment levels or larger ocean outfalls, as well asany environmental damage costs (for example to recreation and tourism, orfishing operators).
A simplified flow network of water and wastewater in an urban area under a con-ventional system and a simple recycling system is shown in Figure 3 and Figure 4,respectively. From Figure 3(a), an external catchment supplies water to the citythrough a conventional distribution system. Approximately 50% of the waterdelivered to consumers is assumed to be used outdoors, and this escapes to the urbanenvironment following use, through evapotranspiration, infiltration to the ground orby surface runoff. The rest is delivered by sewers via a sewage treatment plant to areceiving waterbody, which might be a river, lake, estuary, evaporation pond embay-ment or coastal water.
There are simplifying assumptions in these diagrams, including the following:
• There is just one source of water supply.• There is no exchange between the urban environment and the water supply or
sewerage pipes, for example, by the use of local stormwaters, sewer overflows,or by exfiltration or infiltration.
• All the water that enters the sewage treatment plant is assumed to be passed tothe receiving water body, implying that all sludge is solid.
Nevertheless, Figure 3 summarises the principal features of a conventional city watersupply.
Figure 4(a) elaborates Figure 3(a) by introducing a sewage reclamation project. Con-sumers now receive 30% of their water from the re-use scheme and 70% from theexternal catchment. Wastewater flow in sewers remains the same as in Figure 3(a), as
51
does the loss to the urban environment following use by consumers. In practice, a re-use project is likely to be phased in according to the requirement for additional waterfor a growing city. In this example, total consumption, including the re-usecomponent, has been kept constant, at 100%.
The network segment-specific average costs (capital and operating) for the conven-tional and recycling systems are shown in Figures 3(b) and 4(b), respectively. It isassumed that the costs of water supply from the external catchment are $1/m3, and thecost of transporting wastewater from consumers to the sewage treatment plant is also$1/m3 of sewage transported. The sewage treatment plant costs $0.5/m3 of throughput,and the system of delivering treated wastewater to the receiving water body through anoutfall costs $0.3/m3. The costs of the re-use segments (sewage treatment plant up-grade plus costs of re-distribution) have been set at $1.30/m3. These unit costs, whilenotional, are not unrealistic for an Australian water utility.
Finally, the bracketed $ figures in Figures 3(c) and 4(c) are the flow-weighted unitcosts for each segment for the two systems. By adding these flow-weighted costsacross the whole system we obtain an average price per m3 of water delivered to con-sumers which would recover the costs of the entire water supply and wastewaterservice.
Leaving aside issues of tariff structure, the mix of access and volumetric charges etc,this average price then represents the total revenue of the water utility, divided by thevolume of water delivered to consumers. Thus all costs are recovered through a uni-form flat rate charge on water delivered, as in the Hunter Water Board. While this mayseem unrealistic for other Australian water utilities, which separate water and waste-water charges on consumers, it is not unrealistic in comparison to the airline industry,for example, which covers all aspects of an integrated service including booking, air-ports, air traffic control, noise pollution tax and the aeroplane flight in a single chargefor the flight ticket.
The surprising result is that the costs of the conventional system in Figure 3(c) and there-use system in Figure 4(c) are the same: namely $1.90/m3. Why are average costsidentical under the two systems, when it is clear that the recycled water is more expen-sive to treat and transport than raw water in the conventional system? For equal totalcost in the two systems, the cost of the reclaimed water in 4(c) must be equal to theopportunity cost of water supply PLUS the cost of discharging to the receiving waterbody in 3(c). In assessing whether a re-use project is worthwhile, a bald comparison ofthe cost of a conventional water supply with the incremental cost of a re-use schemeleaves out the benefit in 4(c) of a reduced discharge cost as compared with that in theconventional system in 3(c).
To summarise, it is a common error, when comparing conventional and re-use sys-tems, to look only at wastewater treatment and transportation costs. This fails to takeinto account changes that are occurring at the source and sink end of the system. Atthe source, the total cost of transporting primary water to the consumer will be reduc-ed by the amount that has been replaced by recycled water. At the sink end of thesystem, wastewater that is recycled no longer requires special arrangements for dis-charge, such as ocean outfalls, and does not need to be released to receiving waters.

52
Therefore, as long as the costs of treating and transporting wastewater to consumersfor re-use are less than the above-mentioned source and sink costs, wastewater re-cycling may be considered an economically viable option.
A further implication is that for the socially ‘correct’ decision to be made aboutwhether to implement the re-use option, the prices of all inputs faced by the waterutility must reflect true opportunity costs, including any externalities associated withthe diversion of water or discharge of wastewaters. While re-use schemes are fre-quently evaluated by considering only the financial cost to the water authority, thismay not reflect the full economic impact of the scheme. Thus the cost of a water-supply option must be considered in relation to the alternative schemes available andmay include costs and benefits not usually included as direct costs to the waterauthority.
Water industry regulators and utilities should undertake system-wide environmental benefit-costanalyses to determine whether re-use schemes are efficient. These analyses should identify the oppor-tunity costs of water abstraction and wastewater discharge options, as well as the appropriate infra-structure costs, and lead to appropriate institutional responses.
ET, recharge+ runoff
100% 50% 50% 50%
source ➨ customer ➨ sewer ➨ STP ➨ receiving water
FIGURE 3a. Water flow volumes under conventional water supply and wastewatersystem (percent of total supply)
ET, recharge+ runoff
$1 $1 $0.50 $0.30
source ➨ customer ➨ sewer ➨ STP ➨ receiving water
FIGURE 3b. Segment-specific unit costs for a conventional water supply andwastewater system ($/m3 of throughput in each segment)

53
ET, recharge+ runoff
$1 $0.50 $0.25 $0.15
source ➨ customer ➨ sewer ➨ STP ➨ receiving water
Σ flow-weighted segment costs = av. costs to consumer = $1.90
FIGURE 3c. Flow-weighted unit costs for conventional water supply and wastewater
system ($/m3 of water supply)
ET, recharge+ runoff
70% 50% 50% 20%
source ➨ customer ➨ sewer ➨ STP ➨ receiving water (100%)
30%STP upgrade
FIGURE 4a. Water flow volumes under a simple wastewater recycling system(percent of total supply)
ET, recharge+ runoff
$1 $1 $0.50 $0.30
source ➨ customer ➨ sewer ➨ STP ➨ receiving water
(100%) $0.70
$0.60STP upgrade
FIGURE 4b. Segment-specific unit costs for a simple wastewater recycling system($/m3 of throughput in each segment)
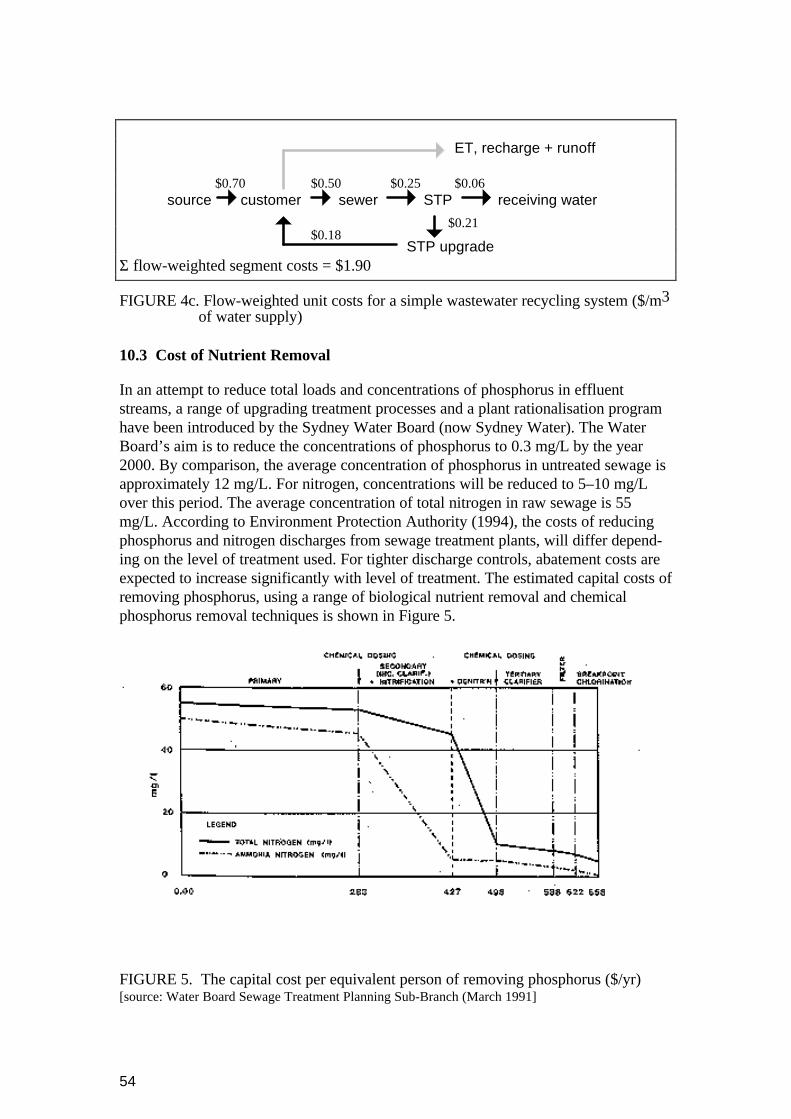
54
ET, recharge + runoff
$0.70 $0.50 $0.25 $0.06source customer sewer STP receiving water
$0.21$0.18
STP upgradeΣ flow-weighted segment costs = $1.90
FIGURE 4c. Flow-weighted unit costs for a simple wastewater recycling system ($/m3of water supply)
10.3 Cost of Nutrient Removal
In an attempt to reduce total loads and concentrations of phosphorus in effluentstreams, a range of upgrading treatment processes and a plant rationalisation programhave been introduced by the Sydney Water Board (now Sydney Water). The WaterBoard’s aim is to reduce the concentrations of phosphorus to 0.3 mg/L by the year2000. By comparison, the average concentration of phosphorus in untreated sewage isapproximately 12 mg/L. For nitrogen, concentrations will be reduced to 5–10 mg/Lover this period. The average concentration of total nitrogen in raw sewage is 55mg/L. According to Environment Protection Authority (1994), the costs of reducingphosphorus and nitrogen discharges from sewage treatment plants, will differ depend-ing on the level of treatment used. For tighter discharge controls, abatement costs areexpected to increase significantly with level of treatment. The estimated capital costs ofremoving phosphorus, using a range of biological nutrient removal and chemicalphosphorus removal techniques is shown in Figure 5.
FIGURE 5. The capital cost per equivalent person of removing phosphorus ($/yr)[source: Water Board Sewage Treatment Planning Sub-Branch (March 1991]

55
Table 8 shows the capital and operating costs of reducing phosphorus in sewage treat-ment plant discharges, based on cost estimates from a Water Board submission to thePricing Tribunal, and Public Works estimates for Albury City Council (EnvironmentProtection Authority, 1994). Reductions of phosphorus may be achieved by discharg-ing effluent from sewage treatment plants to wetland systems, removing septic tanksand replacing them with reticulated sewers, minimising the use of phosphorus byhouseholds and industries that discharge waste to the sewerage system and by effluentre-use programs. It needs to be stated, though, that phosphate substitutes in detergentscan also provide long term detrimental effects on the environment.
The aggregate costs for a range of options to protect the oceans, estuaries and beachesin Sydney, taking into account the various levels of treatment, with and without out-fall, and effluent re-use for potable and non-potable purposes, is shown in Table 9.The present value costs range from $0.3 bn to $8.0 bn, depending on the type of treat-ment used. ‘Costs’ here represents the ‘present worth’ costs that are indicative ofconstruction costs plus 20 years of operating costs in 1994 dollars. They are costs inaddition to today’s wastewater service.
Table 8 . The costs of reducing phosphorous in sewage treatment plant discharges
Concentration ofPhosphorus (P)
Capital($/EP)
Operating($/EP)
Capital($/kg P removed)
Operating($/kg P removed)
P < 2 mg/L 374 60 – –P < 1 mg/L 592 66 2390 66P < 0.3 mg/L 930 85 5290 285P < 0.1 mg/L 1087 115 8600 990Source: Environment Protection Authority (1994).
EP = equivalent person
Today’s level of treatment at the major outfall plants is less than primary treatment.The cost of installing full secondary treatment at the coast needs to include upgradingthe major plants to full primary treatment, bringing total cost of secondary treatmentin the range of $3.5 to 4.0 bn. The high costs for non-potable re-use reflect the highcosts of retrofitting existing developed areas of Sydney with a dual water supply. Con-sequently it is likely that non-potable effluent re-use will be limited to areas with largeindustrial users or recreational sites requiring irrigation such as parks, golf courses andplaying fields, (Sydney Water, 1994).
By contrast, the cost data for Rouse Hill considered above (refer section 10.1)suggests that in new urban areas (or ‘greenfield’ sites), the cost of non-potable orpotable re-use would be lower than the cost of treating sewage to very high qualityprior to discharge.
10.4 Conclusion
Water re-use can be an economically attractive alternative source of water supply.While the implementation of wastewater re-use projects may be restricted due toquality considerations and tenuous public acceptance, it is possible to use wastewater

56
for appropriate purposes (irrigation, industry, flushing), and thereby release higher-quality water for other more exacting purposes. Furthermore, properly planned re-useof wastewater can be a cost-effective method of reducing environmental and healthhazards which have been observed with traditional wastewater disposal practices.
Table 9 . Options and present value costs for major and small coastal wastewatertreatment plants
Method Treatment Present valuecost ($1994)
Major coastal plants:
Small coastal plants:
• Current treatment +• improved grease removal
• Current treatment
Included withincurrently plannedWater Boardexpenditures
Major coastal plants:
Small coastal plants:
• Current treatment +• improved grease removal
• Full primary treatment with high dilution outfall or secondary treatment $0.3 billion
All coastal plants: • Full primary treatment +• effluent discharged through high dilution outfalls +• source control on toxicants and floatables $2.0 billion
All coastal plants: • Full primary treatment +• secondary treatment +• disinfection +• shore discharge at small coastal plants +• source control on toxicants and floatables $3.5 billion
All coastal plants: • Full primary treatment +• secondary treatment +• disinfection +• high dilution outfall +• source control on toxicants and floatables $4.0 billion
Re-use(non potable):
• Full primary treatment +• secondary treatment +• disinfection +• source control on toxicants and floatables +• distribution to users $4.0–8.0 billion
Re-use all planteffluent (potableuses):
• Full primary treatment +• secondary treatment +• tertiary treatment +• disinfection +• membrane filtration +• distribution to users $6.0–8.0 billion
Source: Sydney Water (1994a)

57
As competition for available resources increases and regulatory limits onaqueous discharges tighten, integrated water management which embraces allpotential water-supply sources, primary and reclaimed, and which producesmultiple quality waters for various uses, will gain greater economic acceptance.However, any successful re-use of wastewater for water supply development mustconsider the overall perception of, and attitudes to, such projects. (Spulber andSabbaghi, 1994 p. 171)
Implementation of effective wastewater strategies is complex. Each strategy must beassessed not only in terms of cost and pricing, but also ecological responses, environ-mental impacts, social consequences, technical feasibility and flexibility.
11. CURRENT AND PLANNED RE-USE OF TREATED SEWAGE INAUSTRALIA
11.1 Sources Of Data
Information on current and planned re-use of treated sewage in Australia, presented inthis section, is based on three main sources of data:
• the National Effluent Re-use Survey, a questionnaire-based survey of sewagetreatment practices in all States and Territories in 1994
• a literature search through both electronic and paper based indexes, and• interviews undertaken with water utility and state government representatives
across Australia.
The National Effluent Re-use survey was undertaken by Melbourne Water on behalfof the former Water Technology Committee of AWRC. Responses were provided byState/Territory contact officers. Part 1 of the questionnaire provided a State/Territorysummary. Part 2 provided information on individual treatment plants with throughputof 3 ML/day or greater. A copy of the questionnaire is given in Appendix D. Infor-mation was requested on existing and future sewage treatment practices, includingpercentage of water re-used. While this survey is a very valuable compilation, the datawas in places incomplete and needed to be supplemented by assumptions in order todescribe and predict trends at the state and nation-wide levels. Nevertheless theauthors are satisfied that acceptably accurate data are given for the base year, 1994.
Published sources were searched through electronic indexes, including:
• Streamline (Australian; UWRAA database accessed online via the Internet)• Water Resource Abstracts and Waterlit (International Databases accessed via
CD-ROM)• Infoseek and CARL Uncover (Internet Databases; attracting a fee for service)• university library and special library catalogues (Australian and international;
accessed via the Internet or by personal visits), and• World Wide Web and Internet Listserv Lists, for example, Aquifer and
electronic conferences (such as Ecotechnics '95).
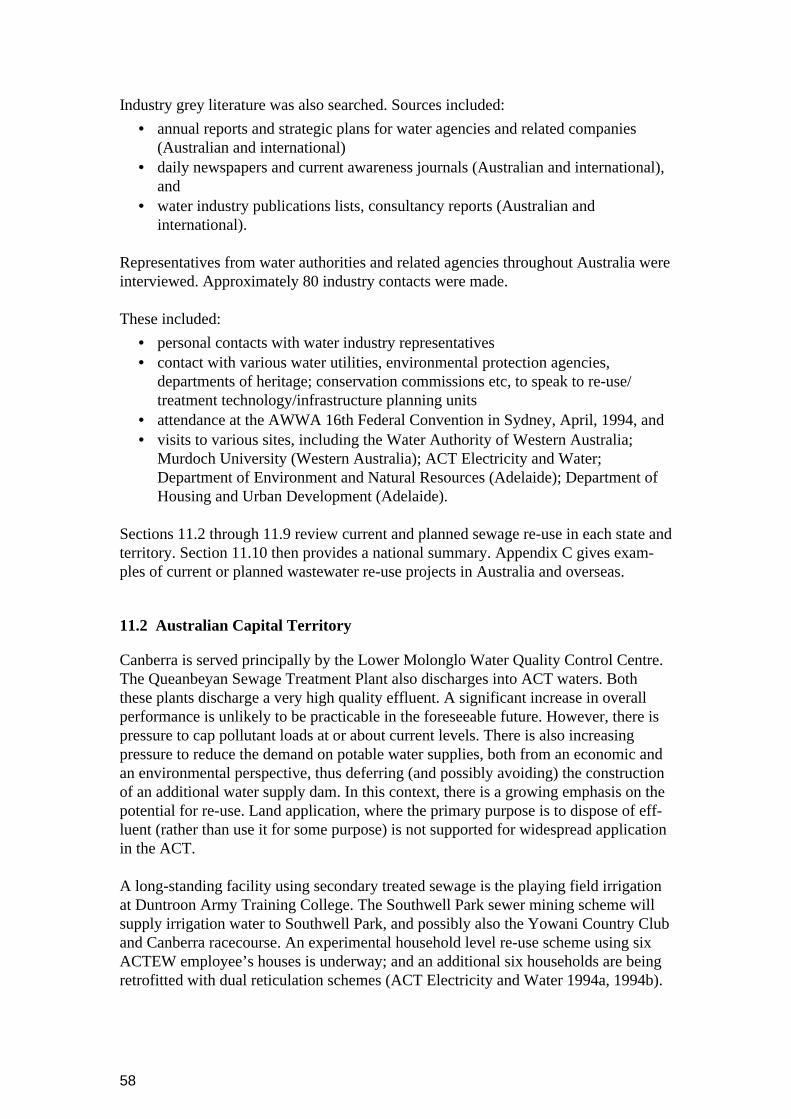
58
Industry grey literature was also searched. Sources included:
• annual reports and strategic plans for water agencies and related companies(Australian and international)
• daily newspapers and current awareness journals (Australian and international),and
• water industry publications lists, consultancy reports (Australian andinternational).
Representatives from water authorities and related agencies throughout Australia wereinterviewed. Approximately 80 industry contacts were made.
These included:
• personal contacts with water industry representatives• contact with various water utilities, environmental protection agencies,
departments of heritage; conservation commissions etc, to speak to re-use/treatment technology/infrastructure planning units
• attendance at the AWWA 16th Federal Convention in Sydney, April, 1994, and• visits to various sites, including the Water Authority of Western Australia;
Murdoch University (Western Australia); ACT Electricity and Water;Department of Environment and Natural Resources (Adelaide); Department ofHousing and Urban Development (Adelaide).
Sections 11.2 through 11.9 review current and planned sewage re-use in each state andterritory. Section 11.10 then provides a national summary. Appendix C gives exam-ples of current or planned wastewater re-use projects in Australia and overseas.
11.2 Australian Capital Territory
Canberra is served principally by the Lower Molonglo Water Quality Control Centre.The Queanbeyan Sewage Treatment Plant also discharges into ACT waters. Boththese plants discharge a very high quality effluent. A significant increase in overallperformance is unlikely to be practicable in the foreseeable future. However, there ispressure to cap pollutant loads at or about current levels. There is also increasingpressure to reduce the demand on potable water supplies, both from an economic andan environmental perspective, thus deferring (and possibly avoiding) the constructionof an additional water supply dam. In this context, there is a growing emphasis on thepotential for re-use. Land application, where the primary purpose is to dispose of eff-luent (rather than use it for some purpose) is not supported for widespread applicationin the ACT.
A long-standing facility using secondary treated sewage is the playing field irrigationat Duntroon Army Training College. The Southwell Park sewer mining scheme willsupply irrigation water to Southwell Park, and possibly also the Yowani Country Cluband Canberra racecourse. An experimental household level re-use scheme using sixACTEW employee’s houses is underway; and an additional six households are beingretrofitted with dual reticulation schemes (ACT Electricity and Water 1994a, 1994b).
59
While re-use, particularly through local irrigation schemes is expected to increase, theoverwhelming majority of ACT wastewater will continue to be discharged into theMolonglo River as highly treated effluent. This effluent contributes significantly toenvironmental flow in the Murrumbidgee River and is used for irrigated agriculture,urban water supply and recreation downstream of the ACT.
Current and expected future wastewater discharges within ACT for 1994, 2000 and2020 are shown in Table 10. This table summarises the current expectations of futurevolumes, and the distribution of wastewater discharges to land and water, recorded inthe National Effluent Re-use Survey, 1994.
Table 10 . ACT: current and expected future wastewater discharges (ML)
Water Discharged/Received: 1994 2000 2020
Volume of water received: 33 000 40 000 50 000
Discharge to:Land 30 2 050 2 050Direct Re-use 1 5 5Inland Waters 32 969 37 945 47 945Coastal Waters – – –
Total volume discharge: 33 000 40 000 50 000Source: National Effluent Re-use Survey, 1994 (this report).
11.3 New South Wales
Municipal sewerage service construction and operation is the responsibility of theSydney Water Corporation in Sydney, Illawarra and Blue Mountains areas, HunterWater Corporation in the Newcastle and the lower Hunter Valley, and local councilselsewhere. Householders or companies in private developments own and operateseptic systems package treatment plants or bio-recycle systems. The Sydney WaterBoard provides sewerage facilities to 98% of the 1 295 000 properties in their servicearea (Environmental Protection Authority, New South Wales, 1993a).
Wastewater disposal in NSW can be divided into two main drainage divisions: theMurray-Darling Basin, and the coastal region. In both areas the increased treatmentlevels that would be necessary to maintain the ecological integrity of the aquaticenvironment, may make re-use options attractive in future.
In the Murray-Darling Basin health issues are a priority and the acceptability andvalue of re-use schemes is at least partly determined by their effect on the river. Theenvironmental priority is to reduce nutrient loads during low-flow periods. Waterdischarged to inland waterways is primarily treated to secondary level.
Nutrient levels in the Nepean-Hawkesbury system are also a concern since extensivenew urban developments are foreseen and the river water is used for urban watersupply downstream. Sydney Water already treats much of the discharge to theHawkesbury-Nepean catchment to advanced tertiary level. Options within this basininclude:

60
• upgrading treatment levels and continued discharge of effluent to local receivingwaters
• treatment and transfer to catchments west of the Blue Mountains• re-use of sewage effluent for non-potable and potable re-use, and• local small scale treatment.
Many of these options either directly or indirectly encourage re-use.
In the coastal region, discharge is frequently to coastal waters or rivers leading quicklyto the ocean. There is less downstream use of these waters and less demand for waterfrom irrigated agriculture. The coastal zone is more developed and industrialised sothe main re-use markets lie in industry and residential areas.
Wastewater treatment levels (as a percentage of flow) for Sydney Water, HunterWater, Public Works Department (PWD) country areas, and NSW total is shown inTable 11.
Recent changes in sewage treatment in NSW have been driven by environmentalconcerns about ocean discharge and pollution of rivers. For example, concerns aboutpollution of Sydney beaches has led to changes in the ocean outfall standards.
Table 11 . NSW wastewater treatment levels 1994 (% of flow treated at levelspecified)
Treatment Level SydneyWater
HunterWater
PWDcountry areas
TotalNSW
No-Treatment 0.5 1 0 1Pre-Treatment 0 0 0 0Primary 85 0 0 58Secondary 4.5 98 96 33Tertiary/Advanced 10 1 4 8Source: National Effluent Re-use Survey, 1994 (this report).
The ‘Clean Waterways’ Program, which extended from 1989–94, was aimed atimproving sewage treatment to ensure safe, beneficial or environmentally acceptabledisposal of effluent; improved sewage treatment plant reliability; safe beneficial use orenvironmentally acceptable disposal of treated residuals; encouragement of sewagesource control and waste minimisation; and clearing of the backlog of unseweredproperties (Sydney Water Board, 1994b).
The Clean Waterways Program resulted in substantial improvements, including:cleaner beaches, rivers and streams; cost-effective protection from sewage overflows;extending sewerage services; advances in source control; and advances in recyclingsewage by-products (Sydney Water Board, 1994c). The Source Control Program ofClean Waterways was aimed at reducing the volume and variety of hard-to-treatsubstances such as heavy metals, organochlorines pesticides and phosphorus byimposing tighter requirements for on-site treatment. Industrial and commercialeffluent makes up approximately 30% of the wastewater stream produced in Sydney(Philip, 1995). Industry now captures 300 wet tonnes/day of pollutants on site.

61
Companies have reduced discharges of licensed harmful substances to less than 20%of the 1991 standards (Sydney Water Board, 1994b).
Sydney beaches are now far less polluted by sewage, compared to the late 1980s.Treatment plant odours have been reduced and treatment plant reliability has increas-ed. Sludge incineration and ocean disposal has ceased and 70% of sludge is recycledas a soil conditioner. Treated effluent is now disposed of 4km out to sea and is cleanerthan when the Clean Waterways Program commenced (Sydney Water Board, 1994b).All four of Sydney’s ocean outfalls at North Head, Bondi, Malabar and Cronulla havebeen upgraded (Sydney Water Board, 1994b).
Options to further improve water quality and the environment in the coastal zoneinclude:
• priority to upgrading smaller coastal treatment plants with primary treatmentlevels and nearshore discharges
• wastewater source control programs, with priority to improve the quality ofdomestic wastewater
• further treatment upgrades at the major coastal wastewater treatment plants• ‘up-stream capture’ in the larger sewerage systems that discharge at the coast• other non-discharge or flow reduction options (for example, placement of
sewage treatment plants on the upper branches of the major coastal systemswhich would reduce the loading to downstream plants, provide opportunities formore localised non-potable re-use and reduce transportation costs of by-productssuch as sludge), and
• further re-use of water and water conservation strategies such as compostingtoilets in greenfield developments.
Estimated current and expected future wastewater discharges within NSW (derivedfrom the 1994 Effluent Re-use Survey) for 1994, 2000 and 2020 are provided inTable 12. Discharges from Sydney Water alone are shown in Table 13.
Table 12 . NSW: current and expected future wastewater discharges (ML)
Water Discharged/Received: 1994 2000 2020
Volume of water received: 618 338 662 959 823 123
Discharge to:Land 28 198 33 427 46 970Direct Re-use 8 710 23 851 29 178Inland Waters 138 293 157 593 234 147Coastal Waters 443 137 448 088 512 828
Total volume discharge: 618 338 662 959 823 123Source: National Effluent Re-use Survey, 1994 (this report).Note: Predicted future discharge rates from areas administered by the NSW Public Works
Department were not available and have been estimated.
The National Effluent Re-use Survey, 1994 figures indicates that disposal to coastalwaters is expected to become a smaller fraction of total discharge. The largest part offuture increase in flows is expected to be disposed to inland rivers, especially theHawkesbury-Nepean.

62
Non-potable residential re-use has been studied intensively in NSW. The ShoalhavenPilot Study, for example, operated for 16 months, supplying 17 houses. The schemehas now concluded. The knowledge gained from the study led to a set of guidelinesfor residential re-use of wastewater (New South Wales Recycled Water CoordinationCommittee, 1993).
Table 13. Sydney Water: current and expected future wastewater discharges (ML)
Water Discharged/Received: 1994 2000 2020
Volume of water received: 424 138 449 959 532 223
Discharge to:Land 1 098 2 741 3 470Direct Re-use 5 110 18 251 23 178Inland Waters 50 025 61 322 103 577Coastal Waters 367 905 367 645 401 998
Total volume discharge: 424 138 449 959 532 223Source: National Effluent Re-use Survey, 1994 (this report).Note: These projections do not incorporate the expected effects of demand management programs on
wastewater flow.
The Rouse Hill Development Area is to the north-west of Sydney. It falls within theHawkesbury-Nepean catchment, which has already suffered algal problems due to theeffects of urban wastewater and stormwater. The water supply for the area is ProspectReservoir, which supplies a large area of western Sydney. Reducing overall demandon this reservoir is a priority. The Rouse Hill Sewage Treatment Plant will supplynon-potable water through a dual reticulation system to residential users. These usersare charged for this water at 20 c/kL compared with 65 c/kL for potable water, al-though the production cost of the recycled water is higher. Sydney Water expected touse 2920 ML/yr of treated wastewater in dual reticulation systems, in the Sydney areaby the year 2020.
The National Effluent Re-use Survey, 1994 predicts significant industrial re-use inNew South Wales, primarily in Wollongong and Newcastle. Re-use water is used forslag quenching at the Port Kembla steelworks. There are other potential re-use pro-jects in the Port Kembla area and more than 50% of wastewater from the Wollongongtreatment plant is predicted to go to industrial re-use by 2020. Reclaimed water is usedfor dust suppression at the Newcastle Coal Loader. Up to 5 ML/day of reclaimedwater is used for coal washing, dust suppression and general washdown at theStockton Borehole Colliery.
11.4 Northern Territory
Most of the Northern Territory’s coastal waters are in pristine condition, except thewaters off Darwin, where there are localised pollution effects from the ocean outfallsfrom the sewage treatment plant. There are plans to upgrade the mechanical process atthis plant and to re-use water for irrigation of ovals and other recreational areas on theDarwin Esplanade. Wastewater re-use for parks, gardens and recreation is already
63
practised Darwin, Katherine and Alice Springs. Non-potable re-use is being trialed atBlack Point at ranger’s homes within the National Park. There is also interest amongremote aboriginal communities in re-using treated greywater.
The NERS, 1994 results on wastewater flows for the NT were incomplete, as data wasrecorded for 1994 only. Wastewater flows in 2000 and 2020 were therefore assumedto increase in line with the expected population growth rate over this period (refer toTable 32). Estimated wastewater discharge within the Northern Territory for 1994(derived from the NERS, 1994) 2000 and 2020 are shown in Table 14. Wastewatertreatment levels (as a percentage of flow) for this state, are shown in Table 15.
Table 14 . NT: current and expected future wastewater discharges (ML)
Water Discharged/Received: 1994 2000 2020
Volume of water received: 15 030 16 000 20 000
Discharge to:Land 1 250 1 600 2 400Direct Re-use 0 0 0Inland Waters 1 100 1 100 1 100Coastal Waters 9 090 13 300 11 723
Total volume discharge: 11 440 16 000 15 523Source: National Effluent Re-use Survey, 1994 (this report).Note: Total volume of received water differs from total volume discharged due to high evaporative
losses during treatment. This is particularly the case in open (versus closed) treatment facilities.A similar outcome is evident in Table 16 and Table 23 (following).
Table 15 . NT: wastewater treatment levels in 1994 (%)
Treatment Level: %
No treatment 6Pre-treatment 0Primary 12Secondary 82Tertiary/Advanced 0Source: National Effluent Re-use Survey, 1994 (this report).
11.5 Queensland
Wastewater volumes in Queensland are increasing as the population is growing rap-idly, particularly in the South-East.
The South-Eastern Region bounded by the New South Wales Border to the NoosaRiver and west to the Great Dividing Range comprises only 1.3% of the land area ofQueensland, but contains 63% of Queensland’s population. By 1993, 304 000 ML/yrof wastewater was produced at the 213 treatment plants within this area. The waste-water treatment plants are at or near capacity in South-East Queensland (Gardner

64
et al., 1993). In recent times, some 90% of effluent has been disposed to inland ormarine waters (Bryan et al., 1994).
Established wastewater discharges within Queensland for 1994 (derived from theNERS, 1994) are provided in Table 16. Wastewater treatment levels (as a percentageof flow) for Queensland are shown in Table 17.
Table 16 . Queensland: current and expected future wastewater discharges (ML)
Water Discharged/Received: 1994 2000 2020
Volume of water received: 305 000 337 635 472 689
Discharge to:Land 30 660 33 941 47 517Direct Re-use 1 220 1 351 1 891Inland Waters 31 810 35 214 49 299Coastal Waters 240 320 266 034 372 446
Total volume discharge: 304 010 336 540 471 153Source: National Effluent Re-use Survey, 1994 (this report).
In the South-Eastern Region, land disposal amounted to 32 000 ML. in 1993. Landavailability dictates the total volumes that can be disposed of in this way. An esti-mated 100 000 ML/yr is the uppermost estimate of possible disposal to land. Mostland disposal schemes currently in operation are hydraulically and nutritionally over-loaded. Land disposal is expected to increase markedly during the remaining part ofthe decade. However, the wastewater will need to be re-used on land, rather than‘disposed to land’ due to the areas required for disposal.
Table 17 . Queensland: wastewater treatment levels in 1994 (%)
Treatment Level: %
No treatment 0Pre-treatment 0Primary 15Secondary 81Tertiary/Advanced 4Source: National Effluent Re-use Survey, 1994 (this report).
There is the potential for up to 30% of Queensland’s total effluent to be re-used onland. The problems encountered by Queensland operators of land disposal systemsinclude: climatic conditions (such as extended wet season), pipe blockages, pumpbreakdowns and lack of available land. Land availability can be tackled by land useplanning, re-zoning and promoting effluent re-use for agricultural irrigation (Gardneret al., 1993).
Research to date has shown that climatic and site conditions favour the utilisation ofartificial wetlands in Queensland (Simpson, 1994). A review of the QueenslandGuidelines for Planning and Design of Sewerage Schemes (1991/2) called for the
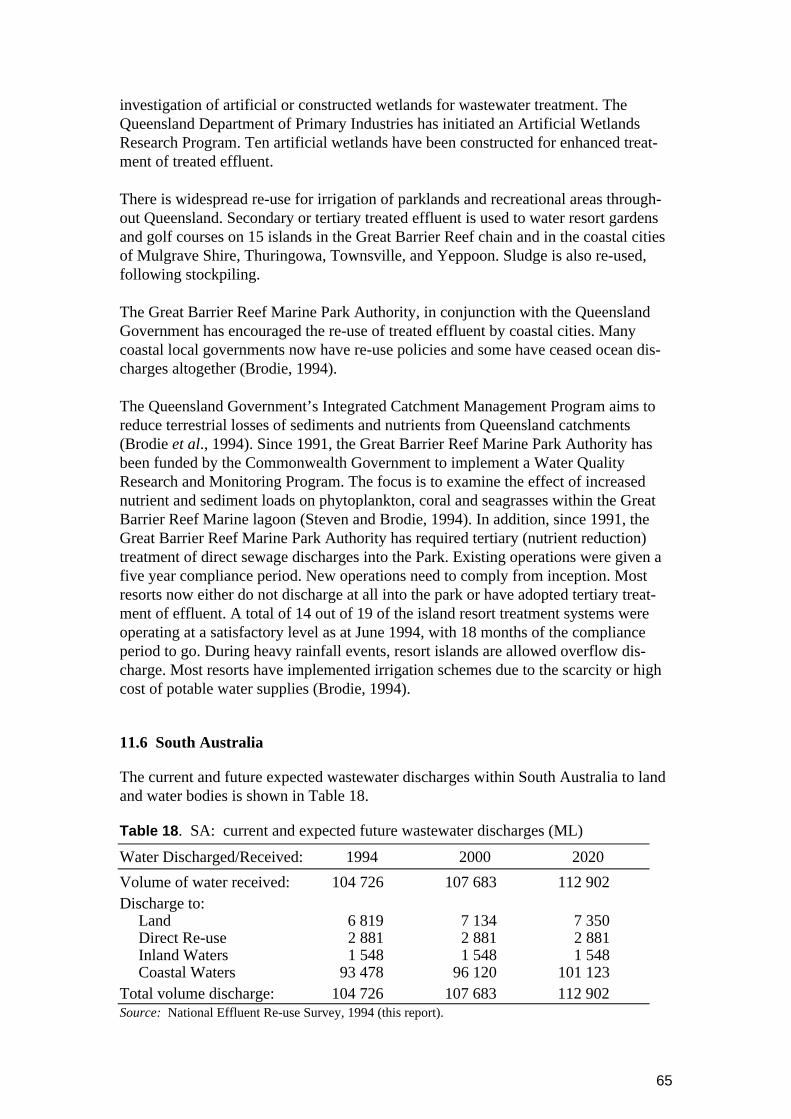
65
investigation of artificial or constructed wetlands for wastewater treatment. TheQueensland Department of Primary Industries has initiated an Artificial WetlandsResearch Program. Ten artificial wetlands have been constructed for enhanced treat-ment of treated effluent.
There is widespread re-use for irrigation of parklands and recreational areas through-out Queensland. Secondary or tertiary treated effluent is used to water resort gardensand golf courses on 15 islands in the Great Barrier Reef chain and in the coastal citiesof Mulgrave Shire, Thuringowa, Townsville, and Yeppoon. Sludge is also re-used,following stockpiling.
The Great Barrier Reef Marine Park Authority, in conjunction with the QueenslandGovernment has encouraged the re-use of treated effluent by coastal cities. Manycoastal local governments now have re-use policies and some have ceased ocean dis-charges altogether (Brodie, 1994).
The Queensland Government’s Integrated Catchment Management Program aims toreduce terrestrial losses of sediments and nutrients from Queensland catchments(Brodie et al., 1994). Since 1991, the Great Barrier Reef Marine Park Authority hasbeen funded by the Commonwealth Government to implement a Water QualityResearch and Monitoring Program. The focus is to examine the effect of increasednutrient and sediment loads on phytoplankton, coral and seagrasses within the GreatBarrier Reef Marine lagoon (Steven and Brodie, 1994). In addition, since 1991, theGreat Barrier Reef Marine Park Authority has required tertiary (nutrient reduction)treatment of direct sewage discharges into the Park. Existing operations were given afive year compliance period. New operations need to comply from inception. Mostresorts now either do not discharge at all into the park or have adopted tertiary treat-ment of effluent. A total of 14 out of 19 of the island resort treatment systems wereoperating at a satisfactory level as at June 1994, with 18 months of the complianceperiod to go. During heavy rainfall events, resort islands are allowed overflow dis-charge. Most resorts have implemented irrigation schemes due to the scarcity or highcost of potable water supplies (Brodie, 1994).
11.6 South Australia
The current and future expected wastewater discharges within South Australia to landand water bodies is shown in Table 18.
Table 18 . SA: current and expected future wastewater discharges (ML)
Water Discharged/Received: 1994 2000 2020
Volume of water received: 104 726 107 683 112 902Discharge to:
Land 6 819 7 134 7 350Direct Re-use 2 881 2 881 2 881Inland Waters 1 548 1 548 1 548Coastal Waters 93 478 96 120 101 123
Total volume discharge: 104 726 107 683 112 902Source: National Effluent Re-use Survey, 1994 (this report).

66
Wastewater treatment levels (as a percentage of flow treated to specific levels) isreported in Table 19.
Table 19 . SA: wastewater treatment levels in 1994 (%)
Treatment Level: %
No treatment 0Pre-treatment 0Primary 0Secondary 96Tertiary/Advanced 4Source: National Effluent Re-use Survey, 1994 (this report).
In the Adelaide region four wastewater treatment plants at Bolivar, Christies Beach,Glenelg and Port Adelaide discharge treated wastewater to the Gulf of St Vincent andthe Port River. Discharges from these areas currently exceed the National WaterQuality Management Strategy (1992) water quality guidelines. Consequently, theEngineering and Water Supply Department (E&WS) (1994c) developed a DraftEnvironmental Improvement Program to reduce or eliminate impacts of wastewaterdisposal on the marine environment. The four principles identified were:
• summer re-use of treated effluent• improved dilution and dispersion of treated effluent disposed to the marine
environment during winter• nutrient reduction processes and expansion of summer re-use schemes, and• 100% re-use where practical and economical.
The total capital cost for full land-based disposal for the Adelaide region was esti-mated at $477m. Due to the high total cost for full re-use, the program was dividedinto two stages for each plant. The highest benefit to the environment per dollar spentis the “Nutrient Reduction” option whereby $85m would be invested to reduce thenutrient loads discharged to the Gulf of St Vincent by 80% (Engineering and WaterSupply, 1994c).
Most of South Australia’s inland waters have little or no flow in summer, and there-fore no capacity to dilute discharges during these months. Water quality objectivesand classifications have been created bearing this in mind. Sewage effluent wasidentified in 1992 along with irrigation drainage and stormwater as a major source ofpollution in the South Australian section of the Murray River. Land disposal, irri-gation of golf courses and discharge of septic tank effluent at peak levels of river flowhave reduced the nutrient flow into the Murray within South Australian borders,especially during low-flow periods. Funding for the schemes was provided by theCommonwealth Government Healthy Catchments Program (Department of Environ-ment and Land Management, 1993).
Wastewater disposal practices in South Australia are summarised in Engineering andWater Supply Department (1994) and Department of Environment and Land Manage-ment (1993). The goal of the “Country Wastewater Treatment Plants Reclaimed WaterManagement Plan” (Engineering and Water Supply Department, 1994b), is to mini-mise the impact of discharge on the environment. A summary of preferred wastewater

67
treatment options for 15 country sites is provided in Table 20. The estimated capitaland operating costs of implementing these options are also provided.
Table 20 . Country wastewater treatment options for South Australia
Plant DesignPopulation
Preferred Option Capital
Cost*Operating
Cost+
Alinga 5000 Total land-based disposal $5 000 000 $75 000(plant only)
Angaston 2300 Use reclaimed water for irrigation $600 000 $24 000Bird in Hand 16000 Summer reuse/winter discharge $325 000 $12 360Gumeracha 2500 Continuous discharge to pine
plantation$200 000 $5 000
Hahndorf 4600 Enhanced treatment and continueddischarge
($3 150 000) ($180 000)
Heathfield 10000 Enhanced treatment and continueddischarge
$1 172 000 $155 000
Mannum 3600 Total reuse for irrigation ($458 000) ($14 000)Millicent 7500 Chemical phosphorus removal and
continued discharge$60 000 $80 000
Mount Burr 1250 Continuous discharge to pineplantation
$75 700 $6 100
MountGambier
41000 Continued discharge to ocean ($6 000 000) ($250 000)
MurrayBridge
16000 Land-based disposal ($2 100 000) ($12 000)
Myponga 250 Total reuse for irrigation $190 000 $1 060Nangwarry 1250 Continuous disposal to pine
plantation$103 400 $8 700
Port Lincoln 20000 Intermittent activated sludge withnitrogen reduction. Dischargeunchlorinated reclaimed water toBay
($5 000 000) ($80 000)
VictorHarbour
8000 Summer reuse for irrigation/winterdischarge to river plus upgrade foradditional capacity and nutrientreduction
$5 271 000 $130 000
Source: Engineering and Water Supply Department (1994)*Based on projected population growth over 20 years (generally)+Indicative values only. Bracketed values indicate that plant has been constructed.
Cost-effective land-based disposal systems will be adopted, rather than encouragingenhanced nutrient removal processes, and continued discharge to sensitive waterenvironments (which still occurs from the Murray Bridge and Mannum). Land-baseddisposal schemes have are being implemented at the Murray Bridge and Mannumplants. Where land-based treatment is not economically viable, plants are being up-graded (for example, Hahndorf and Heathfield). The Hahndorf plant discharges to theOnkaparinga River. The Heathfield plant is located in an area where land based dis-posal is impractical.
Water-quality monitoring programs are in place where discharge to water bodies willcontinue in the future, or where discharge to water bodies is continuing while alternat-
68
ive disposal options are being explored (for example, Millicent and Bird in Hand).The Millicent treatment plant discharges into a drain flowing into Lake Bonney whichalso receives wastewater from a local pulp mill. A water-quality monitoring programhas been implemented to assess the impact of the current discharge on the Sturt Riverand treatment level required. Reclaimed water from the Bird in Hand wastewatertreatment plant is discharged into the headwaters of Dawesley Creek. An economicassessment of future operating strategies, has compared the continued discharge intothe Creek with a range of land based disposal options. Total land based disposalappeared to be considerably more expensive than upgrading the treatment process.The most effective option appeared to be the option to discharge to the creek duringthe non-irrigation period and to use the remainder of the reclaimed water for irrigationof a woodlot. The present value cost of this wastewater treatment option was esti-mated to be $325 000 (refer Table 20).
At Alinga, sewage used to be tankered to the Christies Beach sewerage system fortreatment as this was a cheaper alternative than construction of a local treatment plant.As the population grew, tankering became too expensive. A new treatment plant isbeing constructed at Alinga with an initial design capacity of 5000 EP. The cost of thetreatment plant and storage and reticulation facilities for a land-based disposal schemebased upon the irrigation of vineyards is estimated to be approximately $5.5 million,which includes the cost to buy the land for irrigation and establish and equip avineyard (Engineering and Water Supply Department, 1994).
Woodlots are irrigated with treated effluent at the Berri Winery, at Glossop, SouthAustralia. The use of treated wastewater to irrigate sports fields and golf courses is awidespread practice in rural towns.
Vegetable production and irrigation of pastures in the Virginia Triangle represents thebest opportunity for use of treated effluent for agricultural irrigation in SouthAustralia. The abstraction of water for irrigation in this area is above the sustainableyield of the aquifer which is the main current source of water supply. There is aproposal to build a pipeline from the Bolivar Treatment Plant to the area. This couldboth supply water directly to agricultural users and be used to recharge the aquiferduring periods of low water demand. The advantages of the scheme include thereduction in nutrient discharge from the Bolivar Plant to the Gulf of St Vincent, areduction in withdrawals from the aquifer to a sustainable level, and the maintenanceof the horticultural activity in the Virginia Triangle. Economic evaluation suggeststhat the project is viable (Kinhill, 1993).
New Haven is a development of 67 houses currently under construction by the MultiFunction Polis (MFP) Adelaide. The housing will feature a dual reticulation scheme,where greywater will be re-used by householders on their gardens. The scheme alsoincorporates stormwater re-use. Sludge is used for fertiliser by vegetable farmers inthe Virginia Triangle.
11.7 Tasmania
Wastewater re-use in Tasmania has been limited because there are generally adequatesupplies of water. Responses to the National Effluent Re-use Survey, 1994 suggested

69
that the major obstacle to increased re-use has been the lack of markets for reclaimedwater. However, emerging concern for coastal water quality has led to the productionof a State Water Quality Policy including wastewater re-use guidelines. Elevatednutrients from sewage and urban and agricultural run-off affects water quality in theDerwent estuary (Zann, 1995).
Effluent is now re-used to irrigate golf courses and municipal gardens in Riverside.Brighton Council has a 3300 m³/d licensed flow of which 200 m³/d is re-used in dryperiods. Sorrel Council is proposing to re-use effluent for irrigation. Clarence CityCouncil is examining total re-use for irrigation by the year 2010. The town of NewNorfolk has developed a recreational wetland between its sewage treatment plant andthe nearby Derwent River.
Estimated current and expected future wastewater discharges within Hobart are shownin Table 21. NERS results on wastewater flows for Tasmania were incomplete, asestimates were recorded for Hobart only. The estimated wastewater flows forTasmania (in total) were consequently extrapolated from the Hobart data set. Theseestimates are shown in Table 22.
Table 21 . Hobart: current and expected future wastewater discharges (ML)
Water Discharged/Received: 1994 2000
Volume of water received: 8 200 10 250
Discharge to:Land 0 0Direct Re-use 0 1 500Inland Waters 0 0Coastal Waters 0 8 750
Total volume discharge: 8 200 10 250Source: National Effluent Re-use Survey, 1994 (this report).
Hobart City Council is examining re-use for an industrial supply and for irrigation ofplaying fields and a botanical garden.
Table 22 . Tasmania: current and expected future wastewater discharges (ML)
Water Discharged/Received: 1994 2000 2020
Volume of water received: 50 300 52 552 60 435
Discharge to:Land 0 0 0Direct Re-use 910 955 1 093Inland Waters 14 390 15 031 17 290Coastal Waters 35 000 36 566 42 052
Total volume discharge: 50 300 52 552 60 435Source: National Effluent Re-use Survey, 1994 (this report).Note: The breakdown of wastewater flow data into the direct re-use, inland waters and coastalwaters categories, has been estimated from survey results on total discharge and follow-updiscussions with relevant Tasmanian departments.

70
11.8 Victoria
Wastewater services in Victoria are provided by Melbourne Water, Regional WaterAuthorities, Water Boards, Municipal Councils, the Commonwealth, and other bodies.The total volume of wastewater treated is 518 000 ML (1993). Effluent is dischargedto ocean outfalls, streams or lakes and by evaporation. Sixty-eight per cent of treatedwastewater is discharged to coastal waters; 15% is discharged to inland waterwaysand 17% is applied to land. Water is re-used on racetracks and golf courses, andwithin the Werribee Treatment Plant.
Estimated current and expected future wastewater discharges within Victoria areshown in Table 23. Wastewater treatment levels, for Victoria, as a percentage of floware given in Table 24.
Table 23 . Victoria: current and expected future wastewater discharges (ML)
Water Discharged/Received: 1994 2000 2020
Volume of water received: 507 173 556 625 664 300
Discharge to:Land 82 191 99 748 135 302Direct Re-use 958 1 345 12 905Inland Waters 74 071 46 306 30 000Coastal Waters 326 580 385 901 460 793
Total volume discharge: 483 800 533 300 639 000Source: National Effluent Re-use Survey, 1994 (this report).
Most of the coastal discharges are from the Melbourne, Geelong, and LaTrobe Valleyareas. Approximately 90% of the secondary treated effluent generated in Melbourne(330 GL/yr) is from the Western Treatment Plant at Werribee, which is dischargedinto Port Phillip Bay, and the South-Eastern Purification Plant at Carrum which isdischarged into the Bass Strait. The remaining 10% is treated by 27 local treatmentplants throughout Melbourne (Skinner and Vass, 1995).
Eight per cent of total wastewater disposal to ocean, and the bulk of non-metropolitaneffluent disposal, is contributed by Geelong’s Black Rock plant (approximately18 800 ML) and the LaTrobe Valley Ocean Outfall (14 000 ML).
Table 24 . Victoria: wastewater treatment levels in 1994 (%)
Treatment Level: %
No treatment 0.2Pre-treatment 3.8Primary 0Secondary 55.0Tertiary/Advanced 41.0Source: National Effluent Re-use Survey, 1994 (this report).
Table 25 gives details on the treatment levels according to the type of discharge.

71
Table 25 . Wastewater treatment processes and disposal in Victoria
Disposal to: Level of Treatment:Trade Primary Secondary Tertiary Untreated TOTAL
Ocean and Coastal 1 1 13 1 5 21Inland Waters 1 – 33 9 – 43Land 37 4 41Land – 65 – – 65Total 2 1 148 14 5 170
Note: The two Commonwealth Government treatment plants (at Puckapunyal and Bandianna) areincluded in the above figures (Environmental Protection Authority and Department ofConservation and Natural Resources Victoria.
There is concern that current wastewater disposal systems are not sustainable. Forexample, Port Phillip Bay is almost enclosed, being surrounded on its northern andeastern shores by city and suburban Melbourne (population 2.6m). Exchange time ofthe bay waters with the ocean is approximately one year. Restricted flushing hasimplications for management of water quality and the ecology of the waters, whichreceive stormwater runoff and treated sewage effluent. The contribution of stormwaterto pollution loads is considerable. Most metal and organic toxicants are precipitatedclose to the entry of the freshwater discharges into the saline bay. The sedimentationof toxicants and tidal flushing reduces toxicant levels in the water to low, if notundetectable levels (Murray, 1994). The Port Phillip Bay Environmental Study hasconcluded that the ecology of the Bay has adapted to the increased nutrient loadingssince European settlement. Ongoing monitoring of nutrients in the bay will determineif this is sustainable. The capital costs of changing effluent disposal practices wouldbe considerable.
The Nutrient Management Strategy for Victorian Inland Waters (State Government ofVictoria, 1995) indicated that most waterways, excluding those in East Gippsland,carry excessive nutrient loads. Consequently, 74 treatment plants which are discharg-ing to inland streams should be upgraded to tertiary treatment or full re-use schemes.
The Victorian Government aims to encourage the re-use of treated effluent on landwhere practical, and to promote treatment options which provide the best potential forre-use and ecological sustainability. If wastewater disposal onto land is not practical,wastewater management plans will need to be submitted by water authorities, indicat-ing options which maximise wastewater re-use and minimise adverse nutrient impactson inland waterways. The Environment Protection Authority (Victoria) will work withwater authorities where necessary, to revise discharge licenses to incorporate perform-ance improvement programs over seven years, to ensure state environment protectionpolicy objectives are fulfilled (State Government of Victoria, 1995). Over the next 5years projected changes in disposal practices throughout Victoria are expected toinclude:
• increase in disposal to land from 82 200 to 99 800 ML/yr• decrease in discharge to inland waterways from 70 500 to 43 900 ML/yr, and• an additional disposal to Bass Strait of 12 800 ML/yr. This increase is expected
to be the result of Dandenong South Treatment Plant being redirected fromDandenong Creek to Bass Strait via the South Eastern Purification Plant.

72
A significant volume of water from the Western Treatment Plant at Werribee is usedfor irrigated pastures and overflow systems, with 59 000 ML/yr going to these uses.Despite expected increases in the total volume of effluent disposed from this plant bythe year 2020 (from 159 000 to 259 150 ML/yr), the volume of water going toirrigation is not expected to increase over this period.
Poor management practices within some re-use irrigation schemes, particularly in thehigh rainfall areas, resulted in the Victorian EPA issuing 20 towns with emergencydischarge approval in 1993. Consequently, an extra 100 ML of wastewater was dis-charged to waterways These problems can be avoided in future through upgradeddesign and operational procedures. The Shepparton Regional Water Authority oper-ates such a scheme.
Many country towns in Victoria already re-use their wastewater. Wastewater is eitherre-used directly, for irrigation or indirectly before disposal to streams or lakes. Thereare 70 towns which currently re-use all of their treated effluent and another 38 that re-use some of their effluent. Treated wastewater is used to irrigate pastures atShepparton, Tatura, and Melton. Woodlots, irrigated with treated wastewater, havebeen established at Mildura, Portarlington, and Winchelsea. Irrigation of recreationalareas using treated effluent is practised in Craigieburn and Melbourne. CommercialPolymers Pty Ltd uses treated wastewater to supplement water supply for use in thecooling tower basin in its polyethylene resin production process. A pilot groundwaterrecharge project, using treated effluent was conducted in 1978 at Carrum.
Considerable scope exists throughout Victoria for additional use of treated wastewaterfor both agricultural and non-agricultural activities. It is expected that 19 towns willimplement total re-use over the next 5 years (Environmental Protection Authority andDepartment of Conservation and Natural Resources, 1994). Research conducted atWerribee has investigated the potential for growing Jerusalem artichokes with treatedwastewater. Four households in Melbourne have participated in a trial non-potablewastewater re-use scheme (Lechte et al., 1995).
11.9 Western Australia
Approximately 84% of Western Australia’s wastewater flow is within the PerthRegion. Wastewater flows from the South West Region account for a further 6% oftotal flows. The remaining 10% originates from country areas, and from minor sources(Water Authority of Western Australia, 1992, 1994e, 1994f).
Estimated current and expected future wastewater discharge volumes for WesternAustralia are shown in Table 26. These estimates are consistent with state-wideextrapolations of the data provided in the Wastewater 2040 Study for Perth and thesouth west region of Western Australia (Water Authority of Western Australia,1994e). Wastewater treatment levels, for Western Australia, as a percentage of flow,are shown in Table 27. Treatment levels and disposal outlets or Perth and WesternAustralian country areas is discussed below.

73
Table 26 . WA: current and expected future wastewater discharges (ML/yr)
Water Discharged/Received: 1994 2000 2020
Volume of water received: 93 812 112 014 198 422
Discharge to:Land 12 790 16 317 28 903Direct Re-use 3 382 17 046 15 838Inland Waters 875 0 0Coastal Waters 76 765 78 651 153 681
Total volume discharge: 93 812 112 016 198 422Source: National Effluent Re-use Survey, 1994 (this report).
Perth’s wastewater flow is discharged to ocean. Forty nine per cent is treated to secon-dary level and 35 per cent is primary treated. Only 0.9% of the wastewater is disposedto land in the Perth metropolitan area. This contrasts with the country areas where68% of the wastewater is disposed to land and 13% is re-used (Water Authority ofWestern Australia 1994e; 1994f).
In terms of health standards, swimming beaches in Perth and Bunbury are monitoredfor faecal coliform levels by the Western Australian Health Department (fortnightly insummer and monthly in winter). The results of monitoring are generally within theprimary contact Guidelines for Fresh and Marine Waters (ANZECC, 1992). Oceanoutfalls are licensed by the WA Environmental Protection Authority.
Table 27 . WA: wastewater treatment levels in 1994 (%)
Treatment Level: %
No treatment 0Pre-treatment 0Primary 36Secondary 64Tertiary/Advanced 0Source: National Effluent Re-use Survey, 1994 (this report).
The Perth and South-West Region are undergoing a large sewerage infill program.Only 60% of urban, commercial and industrial developments currently have a treat-ment and disposal service. Most unsewered areas use septic tanks which come underthe control of the Western Australian Health Department.
Alternatives for disposal of Perth wastewater have been investigated as part of theWastewater 2040 initiative conducted by the Water Authority of Western Australia inconsultation with the communities of Perth and the South West region. The altern-atives investigated included: discharge to rivers and water courses, wetlands, landapplication and agro-forestry, groundwater recharge, injection into coastal dunes toreduce salt water intrusions, and direct and indirect potable re-use. Each option wasinvestigated from the standpoint of health standards, social, environmental, technicaland economic perspectives (Water Authority of Western Australia 1994b, 1994d,1994e, 1994f).
74
On the Swan Coastal Plain, abundant fresh groundwater is available, which is ex-tracted free of charge for use in residential gardens and on municipal recreationalareas. (Water Authority of Western Australia, 1994f). There is concern about nutrientflows to unconfined superficial aquifers. This means that urban irrigation and landdisposal is not considered advisable in many locations. For example, while woodlotsestablished within the Gnangara Mound area could conceivably utilise treated waste-water from Perth’s northern suburbs treatment plants, this is not desirable since theaquifer supplies substantial amounts of Perth’s potable water supply. The sandy soilson Perth’s Swan Coastal Plain do not hold phosphorus well, and woodlots usuallyonly account for 20% phosphorus removal from the soil, where treated effluent hasbeen applied (Water Authority of Western Australia, 1994f). Lack of suitable soilsclose to the existing sewage treatment plants preclude the establishment of some re-use schemes. Conversely, pipeline and pumping costs may be excessive, for example ascheme examined for re-using Perth wastewater for woodlots or agricultural pro-duction 260 km away near Merredin (Water Authority of Western Australia, 1994e).
Re-use for irrigation is not allowed in the vicinity of Perth (Water Authority ofWestern Australia, 1994e). However, in the developed urban areas, groundwater isalready both nutrient-rich, and otherwise contaminated. Fertiliser applications andother activities generating groundwater pollution continue. At Palmyra in Perth, aretirement village has been the basis of a household level non-potable wastewater re-use project.
The Wastewater 2040 Discussion Paper identified industrial demand as a major re-usemarket. There is potential for expansion of industrial re-use schemes in the KwinanaIndustrial Area as most of the groundwater is already utilised and scheme water isrelatively expensive. The Water Authority of Western Australia, funded by the FederalGovernment’s “Building Better Cities Programme” has established a $1.85m projectto demonstrate the feasibility of treating primary effluent to produce water for indust-rial use. Some of the technologies demonstrated include chemically assisted sedimen-tation and activated sludge followed by lime softening or microfiltration (WaterAuthority of Western Australia, 1994d).
The proposed Compact Steel Plant would be a potentially large user of reclaimedwastewater. The effluent would be supplied from the Cape Peron Pipeline and used ascooling water. Two thirds of the water would evaporate during the cooling process,and the remaining third, with a high concentration of suspended elements and heavymetals, would be delivered back into the pipeline (Water Authority of WesternAustralia, 1994f). If the project is approved, it is expected to increase the State’s re-use of treated municipal wastewater from an average of 8 ML/d (2.1%) to 41.6 ML/d(about 10%) (Water Authority of Western Australia, 1994f). The effects on the dis-charge of contaminants to the ocean would, however, be minimal, though these wouldremain within the Australian Guidelines.
Hartley et al., (1991) compared the use of primary sewage effluent from theWoodmans Point Wastewater Treatment Plant in industrial cooling towers at Kwinanawith that of municipal scheme water. The cost of supplying potable scheme water, at63.6c/kL, was 6.5% lower than supplying treated wastewater. However this difference
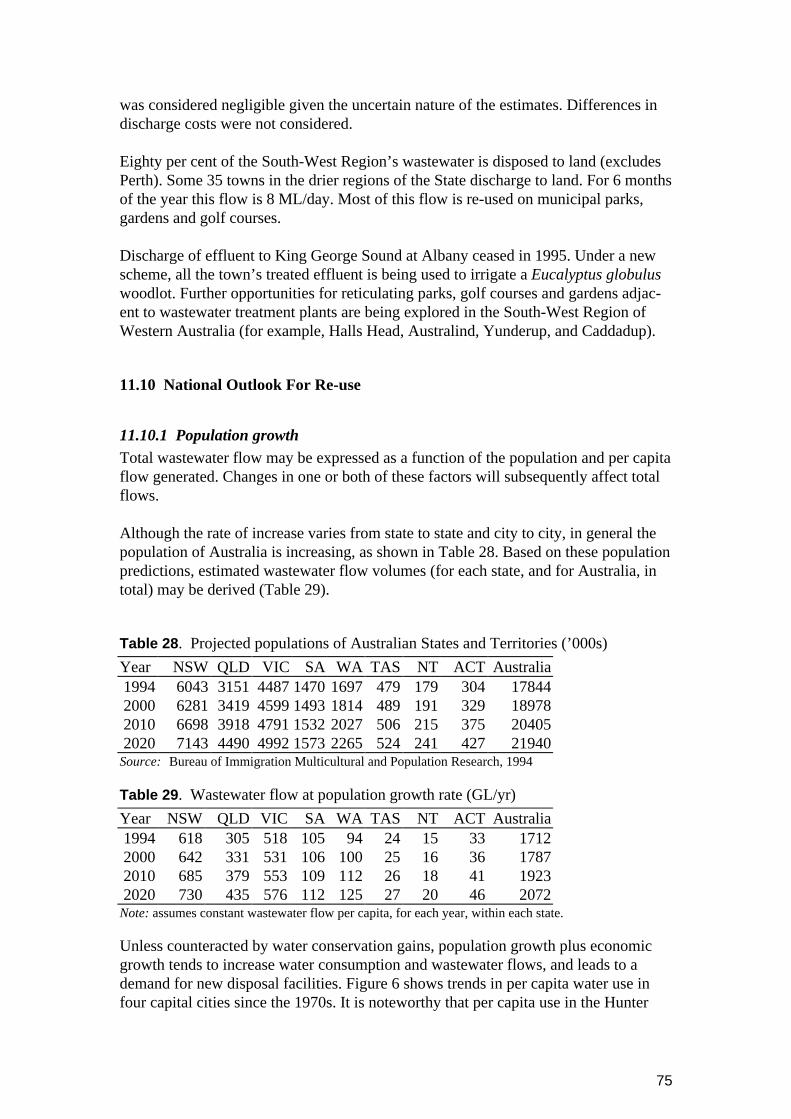
75
was considered negligible given the uncertain nature of the estimates. Differences indischarge costs were not considered.
Eighty per cent of the South-West Region’s wastewater is disposed to land (excludesPerth). Some 35 towns in the drier regions of the State discharge to land. For 6 monthsof the year this flow is 8 ML/day. Most of this flow is re-used on municipal parks,gardens and golf courses.
Discharge of effluent to King George Sound at Albany ceased in 1995. Under a newscheme, all the town’s treated effluent is being used to irrigate a Eucalyptus globuluswoodlot. Further opportunities for reticulating parks, golf courses and gardens adjac-ent to wastewater treatment plants are being explored in the South-West Region ofWestern Australia (for example, Halls Head, Australind, Yunderup, and Caddadup).
11.10 National Outlook For Re-use
11.10.1 Population growthTotal wastewater flow may be expressed as a function of the population and per capitaflow generated. Changes in one or both of these factors will subsequently affect totalflows.
Although the rate of increase varies from state to state and city to city, in general thepopulation of Australia is increasing, as shown in Table 28. Based on these populationpredictions, estimated wastewater flow volumes (for each state, and for Australia, intotal) may be derived (Table 29).
Table 28 . Projected populations of Australian States and Territories (’000s)
Year NSW QLD VIC SA WA TAS NT ACT Australia1994 6043 3151 4487 1470 1697 479 179 304 178442000 6281 3419 4599 1493 1814 489 191 329 189782010 6698 3918 4791 1532 2027 506 215 375 204052020 7143 4490 4992 1573 2265 524 241 427 21940
Source: Bureau of Immigration Multicultural and Population Research, 1994
Table 29 . Wastewater flow at population growth rate (GL/yr)
Year NSW QLD VIC SA WA TAS NT ACT Australia1994 618 305 518 105 94 24 15 33 17122000 642 331 531 106 100 25 16 36 17872010 685 379 553 109 112 26 18 41 19232020 730 435 576 112 125 27 20 46 2072
Note: assumes constant wastewater flow per capita, for each year, within each state.
Unless counteracted by water conservation gains, population growth plus economicgrowth tends to increase water consumption and wastewater flows, and leads to ademand for new disposal facilities. Figure 6 shows trends in per capita water use infour capital cities since the 1970s. It is noteworthy that per capita use in the Hunter

76
Region has been virtually static since the mid 1980s, despite well known demandmanagement initiatives, while per capita use from the WA Water Authority scheme hasincreased in Perth, from the low levels of the early 1980s. These were the two citieswith the longest record of active pricing reforms. In the capital cities, the trend ofhousehold water consumption has generally been a slow, but perceptible increase in percapita water use. In Sydney the trend in per capita water consumption shown in Figure6 was 0.6% per year. In Perth it has been approximately 2% per year. If the trendcontinues it will place additional strain on existing disposal systems. Sewage authoritypredictions suggest that total wastewater flows into treatment plants may increase bynearly 50% between 1994 and 2020.
Perth residential kl/capitaMelbourne kl/capita
Sydney residential kl/capitaHunter residential kl/capita
FIGURE 6. Trends in per capita water use in Melbourne, Sydney, Hunter District,and Perth
11.10.2 National survey resultsTable 30 summarises the current and future wastewater flows to the year 2020, thatare anticipated by wastewater utilities, from the NERS, 1994. Figure 7 shows thewastewater volumes by state for 1994. Table 31 expresses these projections as annualgrowth rates, while Table 32 provides predicted population growth rates for compari-son. Figure 8 shows per capita wastewater flows by state in 1994 from the NationalEffluent Re-use Survey. It is notable that Western Australia, South Australia and theNorthern Territory have lower per capita flows. This is generally due to the compara-tive level of sewerage provision.

77
Table 30 . Total volumes of wastewater received and anticipated (ML/yr)
Year ACT NSW NT Qld SA Tas Vic WA Total1994 33000 618338 15030 305000 104726 50300 507173 93812 17273792000 40000 662959 16000 337635 107683 52552 556625 112016 18854702020 50000 823123 20000 472689 112902 60435 664300 198422 2401871Source: National Effluent Re-use Survey, 1994 (this report).
94
50
105
15
507
305
618
33
Volume in GL/yr
FIGURE 7. Wastewater volume by state (GL) – 1994
Table 31 . Expected rate of growth in wastewater flow(%/yr)
Years ACT NSW NT Qld SA Tas Vic WA Total1994-2000 3.26 1.17 1.05 1.71 0.47 0.73 1.56 3.00 1.472000-2020 1.12 1.09 1.12 1.70 0.24 0.70 0.89 2.90 1.22
Source: National Effluent Re-use Survey, 1994 (this report).
Table 32 . Expected population growth rates (%/yr)
Years ACT NSW NT Qld SA Tas Vic WA Total1994-2000 1.33 0.64 1.09 1.36 0.26 0.34 0.41 1.12 1.032000-2020 1.32 0.64 1.19 1.37 0.26 0.34 0.41 1.12 0.73Source: National Effluent Re-use Survey, 1994 (this report).
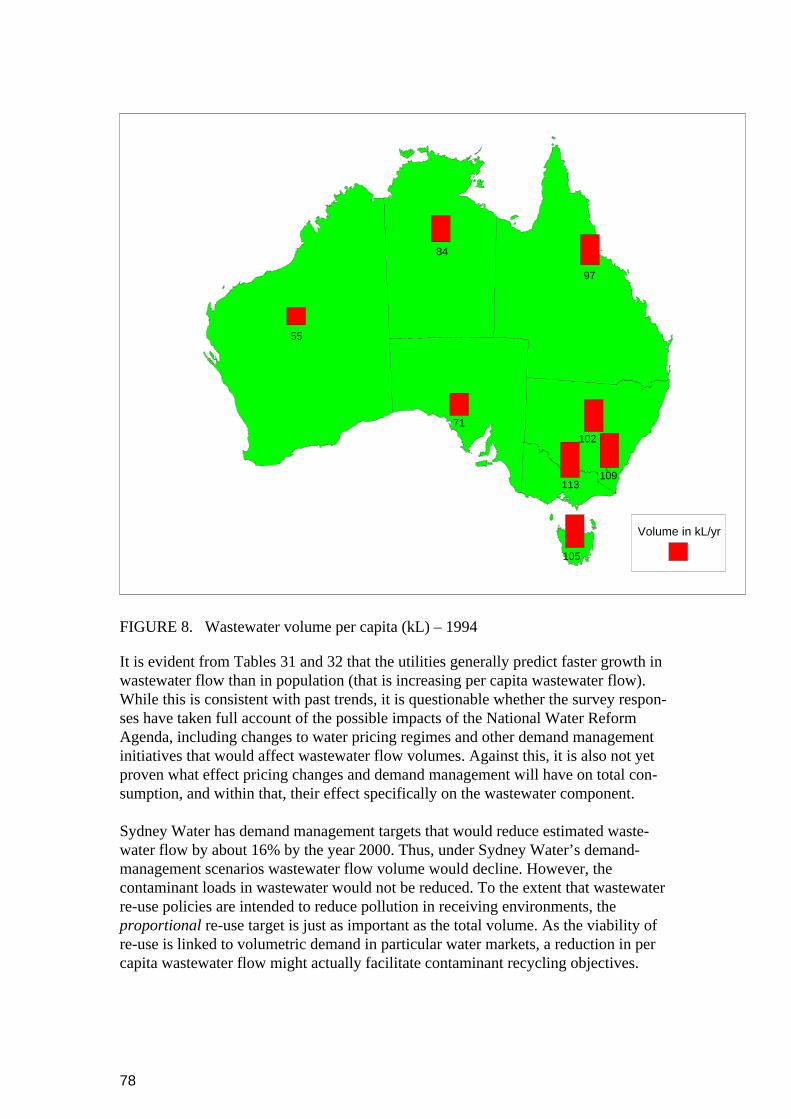
78
109
71
102
105
113
97
84
55
Volume in kL/yr
FIGURE 8. Wastewater volume per capita (kL) – 1994
It is evident from Tables 31 and 32 that the utilities generally predict faster growth inwastewater flow than in population (that is increasing per capita wastewater flow).While this is consistent with past trends, it is questionable whether the survey respon-ses have taken full account of the possible impacts of the National Water ReformAgenda, including changes to water pricing regimes and other demand managementinitiatives that would affect wastewater flow volumes. Against this, it is also not yetproven what effect pricing changes and demand management will have on total con-sumption, and within that, their effect specifically on the wastewater component.
Sydney Water has demand management targets that would reduce estimated waste-water flow by about 16% by the year 2000. Thus, under Sydney Water’s demand-management scenarios wastewater flow volume would decline. However, thecontaminant loads in wastewater would not be reduced. To the extent that wastewaterre-use policies are intended to reduce pollution in receiving environments, theproportional re-use target is just as important as the total volume. As the viability ofre-use is linked to volumetric demand in particular water markets, a reduction in percapita wastewater flow might actually facilitate contaminant recycling objectives.

79
Table 33 summarises the individual State and Territory projections of discharges bytype. It is seen that the total expected increase in wastewater flow is some 670 GLbetween 1994 and 2020. Against this, re-use nationally is expected to increase from18 GL in 1994 to some 64 GL by the year 2020. Thus, wastewater utilities are gener-ally projecting continued increases in discharge to coastal and inland waters.
Table 33 . Current and future discharge volumes, 1994 to 2020 (ML/yr)
Disposed to: ACT NSW NT QLD SA TAS VIC WA TOTALIn 1994Land 30 28198 1250 30660 6819 82191 12790 161938Direct re-use 1 8710 0 1220 2881 910 958 3382 18062Inland/freshwaters
32969 138293 1100 31810 1548 14390 74071 875 295056
Coastal waters 0 443137 9090 240320 93478 35000 326580 76765 1224370Total 33000 618338 11440 304010 104726 50300 483800 93812 1699426
By 2000Land 2050 33427 1600 33941 7134 0 99748 16317 194217Direct re-use 5 23851 0 1351 2881 955 1345 17046 47434Inland/freshwaters
37945 157593 1100 35214 1548 15031 46306 0 294737
Coastal waters 0 448088 13300 266034 96120 36566 385901 78651 1324660Total 40000 662959 16000 336540 107683 52552 533300 112014 1861048
By 2020Land 2050 46970 2400 47517 7350 0 135302 28903 270492Direct re-use 5 29178 0 1891 2881 1000 12905 15838 63791Inland/freshwaters
47945 234147 1100 49299 1548 17348 30000 0 381329
Coastal waters 0 512828 11723 372446 101123 42051 460793 153681 1654646Total 50000 823123 15223 471153 112902 60435 639000 198422 2370258Note: Figures for NT, Tas, and country NSW have been estimated by CSIRO. Figures for other States
and the ACT have been provided by the relevant wastewater authority through the NationalEffluent Re-use Survey.
The projections of future direct re-use given in Table 33 should be regarded as mini-mums, based on confirmed schemes or adopted targets at the State/Territory level. Infuture it is likely that other utilities will seriously examine re-use options and that theactual outcome will be for more re-use than appears from these water utility pro-jections, especially if the suggestions given in Section 12 are taken up.
11.10.3 Direct re-use marketsTable 34 shows the types of direct re-use currently envisaged, derived from the NERS,1994. In 1994 just over a half of direct re-use was for on-site use in treatment plants.In future, larger amounts of effluent will be re-used for industry. Third-pipe urbanschemes are expected to grow in number and extent, but are not expected to be a sig-nificant part of direct re-use until at least the year 2020, when they are expected toaccount for about 15% of the total. One of the more attractive aspects of the industrialmarket, as compared to the residential market, is that its water demand is relativelyconstant throughout the year. It is notable that, currently, no water authority considers
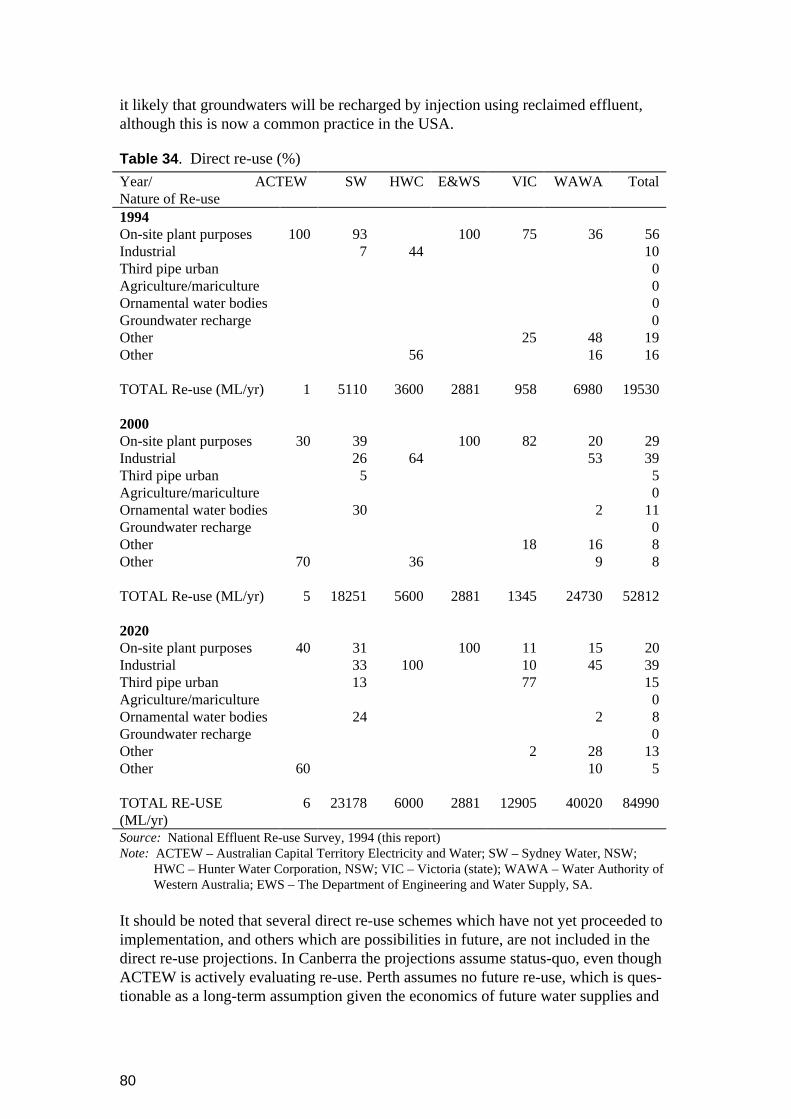
80
it likely that groundwaters will be recharged by injection using reclaimed effluent,although this is now a common practice in the USA.
Table 34 . Direct re-use (%)
Year/ ACTEWNature of Re-use
SW HWC E&WS VIC WAWA Total
1994On-site plant purposes 100 93 100 75 36 56Industrial 7 44 10Third pipe urban 0Agriculture/mariculture 0Ornamental water bodies 0Groundwater recharge 0Other 25 48 19Other 56 16 16
TOTAL Re-use (ML/yr) 1 5110 3600 2881 958 6980 19530
2000On-site plant purposes 30 39 100 82 20 29Industrial 26 64 53 39Third pipe urban 5 5Agriculture/mariculture 0Ornamental water bodies 30 2 11Groundwater recharge 0Other 18 16 8Other 70 36 9 8
TOTAL Re-use (ML/yr) 5 18251 5600 2881 1345 24730 52812
2020On-site plant purposes 40 31 100 11 15 20Industrial 33 100 10 45 39Third pipe urban 13 77 15Agriculture/mariculture 0Ornamental water bodies 24 2 8Groundwater recharge 0Other 2 28 13Other 60 10 5
TOTAL RE-USE(ML/yr)
6 23178 6000 2881 12905 40020 84990
Source: National Effluent Re-use Survey, 1994 (this report)Note: ACTEW – Australian Capital Territory Electricity and Water; SW – Sydney Water, NSW;
HWC – Hunter Water Corporation, NSW; VIC – Victoria (state); WAWA – Water Authority ofWestern Australia; EWS – The Department of Engineering and Water Supply, SA.
It should be noted that several direct re-use schemes which have not yet proceeded toimplementation, and others which are possibilities in future, are not included in thedirect re-use projections. In Canberra the projections assume status-quo, even thoughACTEW is actively evaluating re-use. Perth assumes no future re-use, which is ques-tionable as a long-term assumption given the economics of future water supplies and
81
long-term environmental factors. The projection for country NSW assumes zero directre-use in the absence of any firm projections from the Department of Land and WaterConservation. For Queensland the forecasts assume the same percentage distributionof effluent discharges as existed in 1994.
Urban Residential Market
A large potential market exists for the provision of urban residential water, since thelargest part of urban water demand is in the residential market. Two-thirds of thewater used for urban and industrial purposes in Australia is in the residential (or dom-estic) sector (Department of Primary Industries and Energy, 1987). Since most of thesewage treatment plants in metropolitan areas are surrounded by urban populationsand infrastructure, the residential sector must be considered as a prime market forreclaimed water. Australia’s first dual reticulated housing estates for non-potable re-use are under construction in Rouse Hill, Sydney and New Haven, Adelaide. House-hold level re-use schemes have been trailed by 6 to 12 houses in Canberra; Shoal-haven Heads, Wagga Wagga, NSW (100 houses); Black Point, Northern Territory;Melbourne, Vic; and Palmyra, WA.
Notable exceptions to this occur in Adelaide (Bolivar Treatment Plant) and Melbourne(Werribee and South East Treatment Plants), where the treatment plants are accessibleto rural water users.
There are at least three different re-use markets within the urban residential area:
• potable re-use• non-potable re-use, and• household greywater re-use.
Each of these may be considered in terms of new developments or retrofit situations.
Firstly if wastewater can be treated to potable standard, it can be used to replace orsupplement existing domestic supply. The potential market is large and well under-stood. As discussed in Section 10, the direct production cost of reclaimed water isgenerally higher than that for conventional surface or groundwater sources. However,this cost comparison ignores externalities and the difference made to discharge andwater system costs. It seems highly likely that some urban water demands could beeffectively supplied by reclaimed water, either to potable or non-potable standard.
While no planned re-use of wastewater for potable purposes occurs in Australia at thistime, indirect re-use is occurring, often without the knowledge of the community. In asurvey by Hamilton and Greenfield (1991) the water supply from the CondamineRiver in Queensland, was found to contain 8.6% sewage effluent at Dalby and 7.3%sewage effluent at Chinchilla. The highest concentration of effluent in New SouthWales was 5% and 2% in the Namoi River at Walgett and Dunedah, respectively. To alesser extent, contamination occurs in all of the rivers examined, including the Ballonein Queensland; the Darling, Murrumbidgee and Nepean in New South Wales and theMurray and Yarra in Victoria (Hamilton and Greenfield, 1991). Indirect potable re-useoccurs in South Australia where treated effluent from Hahndorf via the Onkaparinga

82
River enters the Mt Bold Reservoir and in Myponga where treated effluent isdischarged into a small creek which flows into the Myponga Water Supply Reservoir(E&WS, 1994b).
Secondly, non-potable treated wastewater can be piped to houses through a dualreticulation system. If the re-use water is to be used for outdoor purposes and toiletflushing, then it could supply more than half the urban residential water use. Themarket is limited by the fact that existing houses do not have the required dual reticu-lation systems. The cost of retrofitting is often quoted as a factor against reclamationschemes. Here again, careful cost-benefit analysis of system operations is needed totest whether this is the case. The experience of Altamonte Springs near Orlando,Florida is salutary. A suburb of 45 000 people was retrofitted using trenchlesstechnology, which lowered both costs and public inconvenience during the installationphase. For Altamonte Springs the retrofit was the cheapest option. Assessment of theretrofit market can only be done on a plant-by-plant basis taking account of urbanlayout, topography, soils, demand, and costs. Sometimes retrofit might be combinedwith dual reticulation for new areas. Western Melbourne could be a case in point.Nevertheless, the main potential market is in new fringe developments where dualreticulation can be incorporated into infrastructure design and construction.
Country towns are a likely market for re-use especially where existing water suppliesare at or near full capacity and the cost of piping water from other places would beexcessive (for example, small towns in rural South Australia) (van der Wel andMcIntosh, 1995).
Finally greywater can be re-used domestically for non-contact uses. The potentialmarket is large. However without adequate levels of treatment the greywater isprobably only acceptable for sub-surface garden irrigation. In this case the capitalcosts of setting up these schemes may be the major limitation.
Nevertheless, as can be seen from Table 34 utilities are projecting relatively smallvolumes of reclaimed water for the residential sectors according to the NationalEffluent Re-use Survey, 1994.
Industry
The primary market for re-use water in industry is to supplant the use of scheme waterin applications where lower quality water may be used. At present applications oftreated wastewater in industry have been prototype applications and the industrialdemand for water at different treatment levels is not well known. The industrial mar-ket is quite fragmented, with different industries and uses having particular waterquality requirements. Poor water quality may lead to problems such as corrosion,staining, scale deposition and foaming. Costs to industry resulting from potentialdamage to equipment or disruption of production may be high, so the market is sensi-tive to the quality of water supplied.
The Clean Waterways study estimated that about 50% of the water used by SydneyWater’s 147 largest consumers could be replaced by treated wastewater. Thirteen percent of Sydney Water supply went to industrial consumers. To date, the major

83
industrial wastewater re-use schemes in operation include: the Eraring Power Stationin the Hunter Region and Australian Steel Mills at Port Kembla, NSW; and Com-mercial Polymers Pty Ltd, Vic. At Woodman Point, Kwinana, WA, a demonstrationproject is underway indicating how effluent can be treated for use in industrial coolingtowers. A review of current and planned industrial wastewater re-use is under way byAustralian Steel Mill Services Pty Ltd (NSW) and Commercial Polymers Pty Ltd(Vic). Feasibility studies have also been undertaken by the Sydney Water Corporationand the Water Authority of Western Australia, to investigate further industrial re-useoptions. The Sydney Water Board has identified potential projects for the re-use oftreated effluent. These included a planned BHP Steel Mills at Rooty Hill, Paper Millsin Western Sydney and other industries around the Port Kembla Steel Works (SydneyWater Board, 1992).
11.10.4 Land disposal markets
Tables 35 to 37 show types of land disposal in 1994 and expected volumes in theyears 2000 and 2020, respectively. A national picture is not available due to the lackof data for several states/territories. For the authorities that provided estimates, 83% ofland disposal within urban areas in 1994 was to parks and recreational areas, in-cluding, in particular, golf courses. For rural areas, the main types of disposal wereeither to land treatment schemes or through land disposal without any re-use value. Arelatively small part of the total (27%) was used for productive purposes includingagriculture, forestry, horticulture and irrigated pastures. In future, the proportion ofeffluent disposed to these uses is expected to increase to 36% of the total in the year2020.
Irrigation of Urban Landscapes and Recreation Areas
Direct re-use is most widely practised in Australia for irrigation of golf courses andrecreational grounds. There is scope for more wide scale re-use for irrigation of parks,gardens and golf courses. In arid areas of Western Australia, Northern Territory andSouth Australia small country towns have been reusing treated wastewater success-fully for up to 50 years on parks, gardens and golf courses.
The market for general urban irrigation depends on the amount of public open spaceand the level of irrigation required by these spaces. The urban irrigation market isrelatively small and, in line with other irrigation schemes, demand is seasonal. InSydney, for example it is estimated to be approximately 2000 ML/yr, and this com-pares with Sydney Water’s total wastewater flow of 424 000 ML/yr: less than 0.5%.The market is often also scattered over long distances thus causing distribution coststo be high. However, in greenfield sites the potential exists for urban irrigation to formpart of a system including non-potable residential re-use.

84
Table 35 . Land discharges by type in 1994 (%)Discharge Outlet ACT SW HWC SA VIC WAWA Total
TO URBAN ENVIRONMENT:Parks, Recreation areas 40 76 15 35Golf courses 60 86 100 12 85 48Market gardens, orchids etc 0Wetlands/environmental flows 13 5Groundwater recharge by flooding 0Disposal (no re-use value) 100 11Land treatment 0Other 14 1
TOTAL VOLUME (ML/yr) 30 1098 1400 4152 2238 1053 9971
TO RURAL ENVIRONMENT:Market gardens, orchards etc 4 3Agriculture 94 100 3 6Forestry 6 8 7Irrigated pastures 13 11Wetlands/environmental flows 0Groundwater recharge by flooding 0Disposal (no re-use value) 8 100 19Land treatment 64 54Other 1 1
TOTAL VOLUME (ML/yr) 0 0 700 2667 79953 11737 95057Source: National Effluent Re-use Survey, 1994 (this report). Note: Abbreviations are defined in Table 34.
Table 36 . Expected land discharges by type by the year 2000 (%)Discharge outlet ACT SW HWC E&WS VIC WAWA Total
TO URBAN ENVIRONMENT:Parks, Recreation areas 89 6 76 26 43Golf courses 1 86 94 12 74 39Market gardens, orchids etc 0Wetlands/environmental flows 13 4Groundwater recharge by flooding 0Disposal(no re-use value) 100 11Land treatment 0Other 10 14 3
TOTAL VOLUME 2050 1098 1800 4152 2936 1507 13543
TO RURAL ENVIRONMENT:Market gardens, orchards etc 7 6Agriculture 92 100 4 7Forestry 8 13 11Irrigated pastures 100 17 15Wetlands/environmental flows 0Groundwater recharge by flooding 0Disposal (no re-use value) 5 100 18Land treatment 53 43Other 1 1
TOTAL VOLUME 0 1643 1300 2982 96817 16796 119538Source: National Effluent Re-use Survey, 1994 (this report). Note: Abbreviations are defined in Table 34.
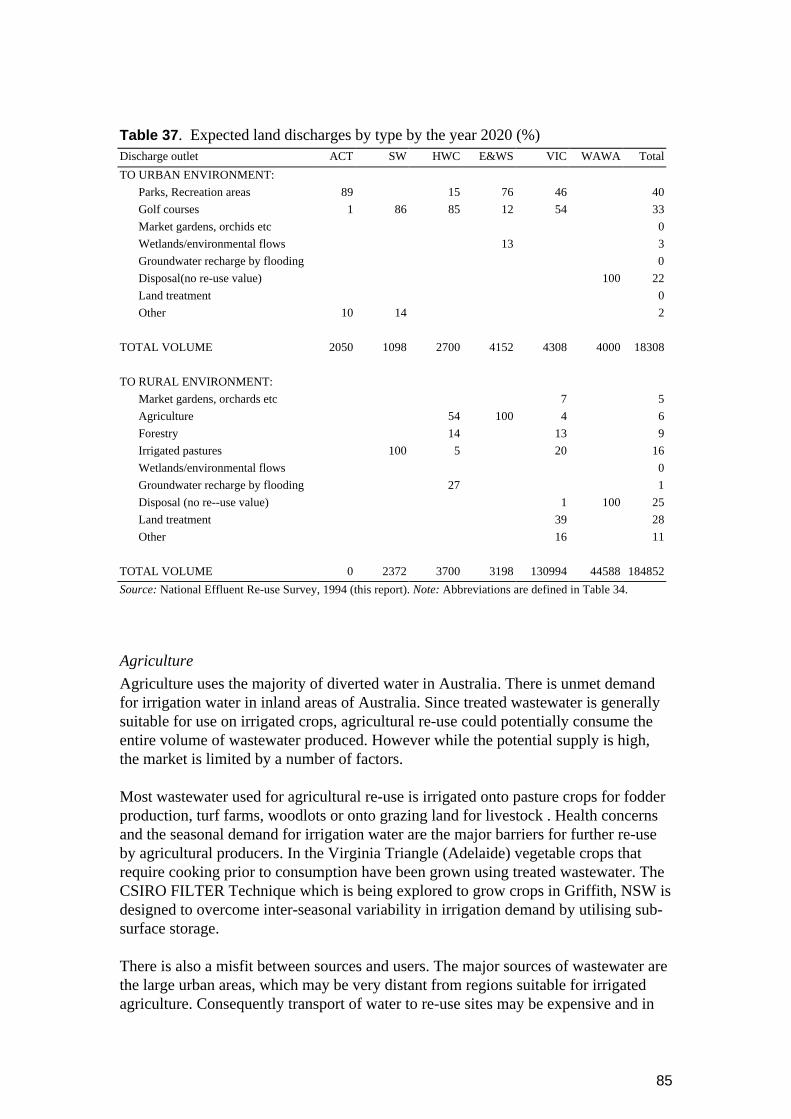
85
Table 37 . Expected land discharges by type by the year 2020 (%)Discharge outlet ACT SW HWC E&WS VIC WAWA Total
TO URBAN ENVIRONMENT:
Parks, Recreation areas 89 15 76 46 40
Golf courses 1 86 85 12 54 33
Market gardens, orchids etc 0
Wetlands/environmental flows 13 3
Groundwater recharge by flooding 0
Disposal(no re-use value) 100 22
Land treatment 0
Other 10 14 2
TOTAL VOLUME 2050 1098 2700 4152 4308 4000 18308
TO RURAL ENVIRONMENT:
Market gardens, orchards etc 7 5
Agriculture 54 100 4 6
Forestry 14 13 9
Irrigated pastures 100 5 20 16
Wetlands/environmental flows 0
Groundwater recharge by flooding 27 1
Disposal (no re--use value) 1 100 25
Land treatment 39 28
Other 16 11
TOTAL VOLUME 0 2372 3700 3198 130994 44588 184852
Source: National Effluent Re-use Survey, 1994 (this report). Note: Abbreviations are defined in Table 34.
Agriculture
Agriculture uses the majority of diverted water in Australia. There is unmet demandfor irrigation water in inland areas of Australia. Since treated wastewater is generallysuitable for use on irrigated crops, agricultural re-use could potentially consume theentire volume of wastewater produced. However while the potential supply is high,the market is limited by a number of factors.
Most wastewater used for agricultural re-use is irrigated onto pasture crops for fodderproduction, turf farms, woodlots or onto grazing land for livestock . Health concernsand the seasonal demand for irrigation water are the major barriers for further re-useby agricultural producers. In the Virginia Triangle (Adelaide) vegetable crops thatrequire cooking prior to consumption have been grown using treated wastewater. TheCSIRO FILTER Technique which is being explored to grow crops in Griffith, NSW isdesigned to overcome inter-seasonal variability in irrigation demand by utilising sub-surface storage.
There is also a misfit between sources and users. The major sources of wastewater arethe large urban areas, which may be very distant from regions suitable for irrigatedagriculture. Consequently transport of water to re-use sites may be expensive and in

86
many cases impractical. Conversely, in country areas, townships are often close toagricultural areas and hence re-use by the agricultural industry is feasible andpractical.
Demand for effluent is seasonal, with demand rising in the dry seasons (Read, 1994).As a result it may be necessary to have an alternative disposal system for wet seasons.
Finally, the agricultural market is price sensitive, so the treatment and transport costsof wastewater may make it uneconomic compared to alternative sources of supply. Insuch cases it may be necessary to attract subsidies or other forms of government assis-tance before being considered feasible. It should be recognised that alternative sourcesof supply are more affordable where the agricultural industry has not been made topay the true price of supply and hence there is a false sense of security that traditionalwater sources are not costly. If the true costs of supply were charged, farmers mightchange irrigation practices and manage and harvest runoff from their properties.
Many rural sewage treatment plants discharge into rivers that have downstream usesincluding irrigated agriculture. Thus there is an indirect re-use. However the re-usesystem is generally not operating as a market. Consequently, when considering themarket for planned agricultural re-use schemes it is important to consider the existinguses that downstream water may be put to.
12. WASTEWATER RE-USE AND THE NATIONAL WATER REFORMAGENDA
12.1 Initiation of Re-use Projects
As outlined in Section 10, there is good reason to suppose that cost-minimising waterutilities will choose a system of supply which tends to equalise marginal and averagecosts across system components. The best examples of this behaviour in the Aust-ralian water industry are the mixed surface and groundwater supply schemes in Perthand Newcastle. Water re-use projects typically come into play alongside conventionalsurface or groundwater-based schemes when the installed system has tracked up thelong-run marginal cost curve, including situations where environmental costs havebeen internalised.
This pattern of resource development agrees with the theory of the firm which saysthat enterprises will equate the marginal productivity of resource inputs to production.Governments simply need to ensure that water utilities have institutional and financialincentives to become as efficient as possible and are not inefficiently biased in theirdecisions by externally imposed signals. Thus, attention needs to be placed on theremoval of inappropriate institutional impediments and cost distortions which in-efficiently bias utilities away from socially optimal choices.
Water industry regulators in each jurisdiction should ensure that inefficient institutional impedimentsand cost or pricing distortions affecting potential re-use projects are removed.

87
12.2 Re-use and Contestable Markets
Earlier discussion has demonstrated that water reclamation projects may tap into diff-erent points in the urban water cycle. For example:
• by harvesting local stormwaters• at the point of discharge by water consumers, whether they are households,
industries, commercial centres, or other organisations• by sewer interception• by upgraded sewage treatment plants; or• by direct or indirect return of reclaimed water to consumers.
Also, a range of technologies now exists for water reclamation, including:
• package plants from household to local community scale• standard treatment processes used in municipal treatment plants• purpose-built wastewater treatment and re-use systems for industry, and• purpose-designed wetland systems for treatment of surface runoff or effluent
Furthermore, a range of organisations may become suppliers in the re-use market,including:
• water utilities• individual households or organisations, supplied with equipment and installation
skills by a competitive contracting industry• urban land developers• local authorities, and• private industrial and commercial organisations.
It follows that if there is to be contestability in water supply, then restraints on any ofthese organisations, technologies and points of access to water for re-use purposesneed to be minimised within the normal bounds of public interest conditions.
Corporatised water utilities should not be allowed to pre-empt fair competitive water supply activitiesby other groups. Specifically, the following should be discouraged:
• charging non-users of utility infrastructure (for example: charging sewage rates irrespective ofwhether a household is connected)
• denying third-party access to wastewater flows for legitimate re-use purposes• cross-subsidising particular high-cost conventional water supplies, and• contractual arrangements with related organisations such as suppliers, water retailers, build-own
operators or water users, which exclude competitive supply activities involving re-use.
Governments and water industry regulators should promote contestability in water markets by activelysupporting requests for access to water infrastructure and water resources, including wastewater, bythird parties such as households, industry, commerce, local government universities and the publicsector generally, and by permitting such entities to engage in water production including reclamation,subject to the normal public-interest conditions.

88
12.3 Pricing of Reclaimed Water and its Alternatives
The price of reclaimed water should reflect its system-wide costs. In most situationsthese will be less than the direct capital and operating costs of treatment upgrades andre-distribution networks, because of cost savings in other parts of the system, whichare attributable to the re-use project.
12.4 Pricing of Water Utility Inputs
There should be economic pricing of competitive water sources. Most water utilitiesare rapidly moving towards, or already have implemented, economic pricing. How-ever, large water consumers often self-extract without paying any economic resourcerental or management costs. There are numerous examples of this. In Perth, privatebores account for almost 50% of total water use including household, industrial, horti-cultural, commercial and other uses (Department of Primary Industries and Energy,1987). There is no resource rental payment for any of this water, not even to coveractual groundwater management costs. In the Hawkesbury-Nepean catchment areaindustry, agriculture, golf courses and local councils can pump water from the riversunder license which allows unlimited extraction for 5 years for a minimum fee of$113.
Unless efficient prices, which reflect social opportunity costs of supply, are beingposted for all sources of water, re-use projects are unlikely to appear attractive tousers.
The pricing of reclaimed water should reflect its system-wide costs, including cost savings achieved atthe source and sink ends of the water cycle through the introduction of re-use projects. In some situ-ations compensation may need to be paid to water utilities under the community service obligationsframework for this to occur.
It is clear from Section 10 that, traditionally, water utilities have not had to pay com-pensation for any external costs that the water/wastewater operation imposes on therest of society. In its report on the water and wastewater industry the Industry Com-mission recommended against such charges, on the basis that it was impractical toestimate the magnitude of the costs (Industry Commission, 1994). But these costswould have a significant influence in any benefit-cost comparison of re-use versusconventional water supply schemes.
It is therefore recommended that water industry regulators examine the full range ofopportunity costs of raw water diversion, including management costs and extern-alities, and impose resource rental charges where appropriate. By ignoring externalcosts there is also the danger of inefficient choices arising because the external costshave been implicitly over-estimated. This can easily happen if a water quality standardfor a receiving water is set at a level which imposes higher treatment costs on waste-water utilities than are justified in terms of the environmental damage costs. Thisexplains the large amount of effort in the UK that has recently been put into a questfor agreed methodologies for estimating the benefits of water quality improvement,

89
following differences of view between the environmental regulator and the economicregulator about the appropriate level of investment in treatment plant upgrades.
It is recommended that a national study of the direct and external costs and benefits of conventionalversus re-use water systems be undertaken under the auspices of the Urban Water Research Associationof Australia.
All opportunity costs of water supply and wastewater discharge practices, including externalities,should be signalled to water utilities through their input prices.
Water industry regulators should examine the full range of opportunity costs of raw water diversion byindustries, agriculture, commerce, local authorities, the public sector and private households, andimpose cost recovery and resource rental charges where appropriate.
12.5 Regulation
There are three regulatory structures which are essential for successful wastewaterreclamation projects:
• an economic regulator to ensure contestable markets and pricing• an environmental/water resources regulator to ensure that target quality of
receiving waters is set appropriately, and is met by the industry , and• a quality control regulator to ensure day-to-day operations of reclamation plants are
satisfactory.
Most jurisdictions are moving towards new arrangements which provide the first twoof these.
However, there is at present insufficient attention in Australia to the provision ofcontinuous quality control regulation in re-use schemes. The provision of guidelinesfalls short of this requirement. It was apparent from the visits of the project leader tore-use projects in the USA, that quality control data submitted regularly to an externalregulator, which might be a State EPA or Public Health Department. The qualitycontrol data includes weekly chemistry laboratory reports from treatment plants andexception reports. If any aspect of the treatment plant went out of normal bounds anexception report was required, detailing the aberration and what remedial actions weretaken. Provided they complied with this quality control regulation, the operators ofreclamation schemes were generally protected from legal action. This arrangementgave social legitimacy to the re-use scheme, rather than its being the initiative of theutility alone.
It is recommended that all jurisdictions undertaking re-use projects create anindependent, continuous quality control regulatory institution.

90
Three regulatory structures are essential for successful wastewater reclamation projects:
• an economic regulator: to ensure contestable markets and pricing• an environmental/water resources regulator: to ensure that target quality of receiving waters is set
appropriately, and is met by the industry, and• a quality control regulator.
While the first two are generally present in Australian jurisdiction, more attention is needed to the thirdif there is to be an active water re-use industry.
State and Territory governments should establish independent regulatory jurisdictions governing theoperations of re-use projects. These should require weekly plant performance data and exceptionreports from wastewater agencies, plus some monitoring of the distribution system for reclaimed water.
The NWQMS Draft Guidelines on wastewater re-use should be adopted as the basic standard for waste-water re-use in Australia.
An additional set of Guidelines should be promulgated for artificial injection of urban wastewaters intogroundwater aquifers for subsequent re-use, based on research recently conducted on behalf ofUWRAA by CSIRO Centre for Groundwater Studies (Dillon and Pavelic, 1995).
In all States and Territories throughout Australia, the approval of both the Health Department and theDepartment of Environmental Protection should be required before re-use schemes can proceed.
12.6 Public Acceptability
As indicated in Section 9, the community is generally in favour of water conservation,including re-use, but needs assurance specifically about the public health implications.The public does not support the potable re-use option at present. There is still a hugedifference between scientific opinion (of the practicality of potable effluent re-use)and public opinion (of effluent as a resource worth drinking). It is generally true thatthe public regard ‘treated’ water with a great suspicion, while ‘fresh water’ from a‘natural’ steam is generally accepted. Water utilities and governments should ensurethat the public is well informed about re-use schemes and involved in decisions toundertake them.
Communities currently express mixed views on the acceptability of re-use schemes. There is publicresistance to current disposal methods, which have been seen as both environmentally damaging and thewaste of a potentially valuable resource. Community education and pilot demonstrations of re-useprojects should be encouraged. Public education and public involvement programs should includeschools programs, visitor programs to treatment facilities, general public information provisions andcommunity involvement in decision making about new re-use schemes.
The community needs assurance about public health implications associated with wastewater re-use.Water utilities and governments should also ensure that the public is well informed about re-useschemes and involved in decisions to undertake them. Treatment schemes should include the necessaryprecautions to ensure that the potential risk of disease transmission is within acceptable limits.

91
12.7 Re-use Guidelines
The recent broadening of the Australian National Water Quality management StrategyGuidelines for wastewater re-use is to be commended. The revised Guidelines nowapprove of a greater range of end-uses for reclaimed water. There is a need to adoptcounterpart guidelines for stormwater re-use and specifically in relation to aquiferinjection. Dillon and Pavelic (1995) have provided draft guidelines on the quality ofstormwater and treated wastewater for injection into aquifers for storage and re-use.There is also a need for ongoing regulatory quality control functions to be provided forall re-use schemes.

92

93
PART III:
STORMWATER MANAGEMENT

94

95
PART III:STORMWATER MANAGEMENT
13. OVERVIEW
13.1 Definitions
For the purposes of this report, ‘stormwater’ includes all surface runoff and infiltrationwithin an urban area. It includes both dry-weather flows and flood discharges. It alsoincludes overflows from sanitary sewers or combined sewer overflow systems(CSOs).
Stormwater management is defined as :
• the planning, design and operation of the natural and constructed conveyancesystem for surface wastewaters, originating in urban areas, which are subject tovarying flow rates and stochastic pollutant loads, so as to achieve the multipleobjectives of flood control, target water qualities and environmental/ecologicalenhancement.
Part II of this report has dealt with questions of stormwater re-use in the general con-text of wastewater re-use. Part III will therefore concentrate on the control of floodsand pollution, the naturalisation of urban waterways, and effects on aquatic eco-systems. Some elements of detention and re-use will also be considered, though lessfrom the point of view of water supply.
13.2 Institutional Context
In Australia, as elsewhere, many organisations impinge on the design and operation ofthe stormwater system. Typically, at a minimum, water resource management depart-ments, water utilities, planning departments, environmental agencies, national region-al and local government, and catchment authorities may all be involved. Section 19discusses institutional structures and possible reforms.
13.3 Stormwater Quantity and Quality
Surface water runoff is enhanced in urban areas by the replacement of relativelyporous natural surfaces and water detaining vegetation with impervious roofs, roads,footpaths, car parks, and other buildings and structures. A range of constituents ofstormwater exist which may degrade receiving water. These include: excessive nu-trients, heavy metals, faecal bacteria, pesticides, non-reactive sediments and turbidity,oils and greases, and litter, such as cans, bottles and plastic bags (Department ofEnvironment and Land Management, 1993).

96
Although the impact of stormwater discharges on the receiving environment is relatedto the extent, level, nature and intensity of urban and industrial development in acatchment, the biological quality is highly variable and under the worst conditions,may be similar to raw sewage or worse (Gutteridge, Haskins and Davey, 1981; Clark,1992). This is particularly so in low rainfall areas. After extended dry periods, forexample, the first flush in Adelaide can have similar characteristics to raw sewage(Pugh and McIntosh, 1991).
A comparison between urban stormwater discharges and effluent from commoneffluent drainage schemes in South Australia, reported by Pugh and McIntosh (1991),is shown in Table 38. It is evident that the pollutants being discharged to receivingwaters from both Adelaide and Mount Gambier stormwater are, in many cases,equivalent (and at times higher) in concentration that those recorded for effluent.
Table 38 . Quality of effluent and stormwater in South Australia, selected sites
PollutantBolivar Treat-
ment PlantEffluent*
Common EffluentDisposalSchemes#
AdelaideStormwater
MountGambier
StormwaterSalinity (TDS) (mg/L) 1400 1253 56–38900 22–120Suspended solids (mg/L) 94 78 2–7120 7–1370Biochemical oxygen
demand (mg/L)86 61 n.a. 4–110
Oil and grease (mg/L) n.a. n.a. <68 n.a.Bacteria:Faecal Coliforms
(organisms/100mL)2300 1509259 up to 13000
n.a.
Nutrients:Total phosphorus (mg/L)Total nitrogen (mg/L)
7.618.7
n.a.13
<0.005–53<0.01–159
0.058–2.150.2–28.3
Heavy metals (mg/L): n.a. n.a. <0.001–4.05 <0.1–2.4Source: Pugh, S.J., and McIntosh, G.F. (1991)
* Activated sludge plant# Average for Clare, Crystal Brook, Cummins, Goolwa, Keith, Lameroo, Mt Barker, Penola, Tailem
Bend, Tanunda, Waikerie, Wallaroo (common effluent-disposal schemes based on lagoons).n.a. = data not available
13.4 Stormwater Systems in Australia and Overseas
Most Australian towns and cities have separate systems for sanitation and storm drain-age. Only in a few parts, notably the eastern suburbs of Sydney, are there combinedstorm and sanitary sewers. However, in most Australian cities the ‘separate’ systemsinteract in various ways. Given the high variability of rainfall in many Australianregions, both drains and sewers become overloaded following heavy rainfall eventswhen their design capacity is exceeded. Failures in one system may impact the other.For example, a hydraulically inefficient stormwater system may lead to excessiveinfiltration to sewers following heavy rain. Any overloading of the sewer system, (forexample, following failure of a pump station) will spill over into the drainage system(as has happened in the Swan River near Perth).

97
There is increasing interest in the question of the optimal mix of combined versusseparate sewer systems. In some countries, for example Germany, opinion is switchingin favour of a mixed approach, as opposed to a completely combined or completelyseparate system (W.F. Geiger, pers comm). Most urban wastewater systems in the UKand north east USA are combined sewer systems. The main reasons for this are:
• in a combined system under normal flow conditions, all stormwater is directedto a treatment plant
• there are difficulties in preventing cross-connections and controlling illicitdischarges in separate systems, and
• rainfall variability is much less in the UK and the north-eastern USA than, forexample, in south-eastern Australia. The relatively reduced peak stormwaterloadings mean that the problem of overflows from combined sewers into naturaldrainage channels during wet weather while problematical in places, is generallyacceptable
The flood hydrology of Australian cities means that separate systems will remain thenorm. Management will continue to address improvements in the storm drainagesystem, including those aspects which arise from interaction with the sanitary sewersystem. Section 16 describes available stormwater management practices.
14. ENVIRONMENTAL IMPACTS OF STORMWATER DISCHARGES
14.1 International Experience
Internationally, there is accumulating evidence of the role of urban non-point sourcepollution in causing deteriorating water quality in lakes, rivers and estuaries. As citiesthroughout the western world are very similar in their emissions of water-borne pollut-ants, it is relevant to consider the experiences of other countries.
While the pollutant characteristics of stormwater runoff are highly variable, the avail-able international data can be summarised as follows:
• Established urban activities, including residential, commercial, and industrialsectors, may contribute a roughly similar amount of suspended sediment per unitarea as agriculture.
• Nitrogen and phosphorus loadings from urban activities are typically lower perunit area than those from agriculture, but in some areas can be comparable inmagnitude.
• Urban areas yield much higher concentrations of heavy metals and othertoxicants than agriculture.
The US EPA publication “Environmental Impacts of Stormwater Discharges” (UnitedStates Environmental Protection Agency, 1992) identifies six primary non-pointsource activities associated with stormwater runoff pollution near urban areas:
1. agriculture2. silviculture3. mining

98
4. construction industry5. urban activities in general, and6. atmospheric deposition.
This study also showed that rural non-point sources represent the largest contributionto use impairment of rivers in the USA. However, for lakes and estuaries, the largestcontributors to use impairment are reported to be urban non-point and point sources.Furthermore, when considered on a per unit area basis, urban areas, which take uponly 2.5% of the USA’s land surface, account for a disproportionately high degree ofwater quality impairment, namely:
• 18% of impaired river miles• 34% of impaired lake acres, and• 62% of impaired estuary square miles.
In the words of the US EPA (United States Environmental Protection Agency, 1992p. 8):
This indicates the importance of focussing efforts on the management and controlof stormwater discharges from urban areas and associated urban activities (i.e.storm sewers, urban runoff, combined sewers, hydromodification, land disposal,construction, urban growth) since the potential for further urban growth andcumulative impacts from increased stormwater discharges from expanding urbanactivities is relatively great.
14.2 Environmental Impacts of Urban Stormwater Discharges in Australia
A Discussion Paper, published by the Australian Commonwealth EnvironmentalProtection Agency (CEPA, 1993), recognised that the principal issues in stormwatermanagement vary from one place to another, depending on climate, soils and theurban water environment. Nevertheless, the paper noted the following prevalentfeatures in Australia:
• Urban catchments are much more efficient in shedding water from their surfacesthan the natural landscapes they have replaced. As a result, flood flows far ex-ceed the capacity of the original waterways. The more frequent flood flows arenow conveyed in hydraulically efficient, but often unsightly pipes and channels.More importantly, however, aquatic ecosystems that depend on the original flowcharacteristics are now threatened.
• In addition, pipes and channels may discharge large quantities of dissolved andsolid contaminants into rivers, lakes and the sea. Stormwater runoff has becomethe main source of pollutants entering many urban waterways, and may alsocontaminate groundwater.
• Increased loads on stormwater and sewage networks have increased the frequen-cy of overflows, causing cross-contamination in systems that were designed tobe separate. This problem is expected to become more prevalent as the infra-structure deteriorates with age, and especially if there is any increase in thefrequency of intense rainfall events as a result of climate change.
99
• While urban stormwater is not generally of high quality, there remain somerelatively clean flows, which, with varying degrees of treatment, can be used fora variety of purposes.
The following sections give illustrative information on the impacts of stormwater onaquatic systems in New South Wales, Queensland, South Australia, and Victoria.
14.2.1 New South WalesThe Sydney Water Project (Dowsett et al., 1995), has presented data on the contri-bution of stormwater to pollution loads in Sydney’s waterways, including PortJackson, the Upper and Lower St Georges River, Botany Bay foreshore, Cooks Riverand the Narrabeen, Dee Why, Manly, and Curl Curl Lagoons. Stormwater accountedfor the following contributions to total pollutant loads (the figures quoted give theminimum and maximum contributions found across the set of waterways considered;see Dowsett et al., 1995 pp. 59–60):
• faecal coliforms: 8 to 68%• nitrogen: 40 to 95%• phosphorus: 45 to 97%.
Thus stormwater is a significant contributor to water pollution in Sydney, and makesan equal or greater contribution to total pollutant loads when compared with sewagetreatment plant discharges and sewer overflows together.
In Sydney in wet weather, the entry of large amounts of stormwater to the sewersystem can cause overflows. The water enters from illegal connections, drainage, andinfiltration through cracks and joints in pipes. Infiltration accounts for about 30% ofdry weather sewage flow. Over 3000 relief points have been designed into Sydney’ssewer system. Leakage from sewers into the Port Jackson catchment, particularlyMiddle Harbour and the Upper Parramatta River, the Cooks River near its entry toBotany Bay and the George’s River create overflow problems in wet weather. Leakagefrom sewers into surrounding sand beds is also thought to be a problem in the Botany–Randwick area and around the northern lagoons in Sydney.
14.2.2 QueenslandThe importance of wastewater and stormwater management to the health of rivers,lakes, estuaries and embayments has been recognised in south east Queensland,leading to the commissioning of the Brisbane River and Moreton Bay WastewaterManagement Study. Another study has recently been initiated, as part of planning forsouth east Queensland to develop a regional approach to water resource and infra-structure management. This study will cover from Noosa Heads to the NSW border.The quality of stormwater runoff has been identified as a critical aspect. TheQueensland and Commonwealth governments are studying and developing strategies(such as integrated catchment management) to address the impacts of land-basedinputs of pollution to the Great Barrier Reef ecosystem.
100
14.2.3 South AustraliaIn Adelaide there has been increasing concern about the impacts of urban stormwaterrunoff in the Torrens and Pattawolonga catchments. Debris from vegetation is a par-ticular issue in these catchments, along with the other contaminants normally assoc-iated with urban runoff.
14.2.4 VictoriaThe Melbourne Water/Melbourne Parks and Waterways publication “Backyard to theBay: Catchment Impacts, the Urban Waterway Challenge”, by Collett et al.,(1993)provided information on the relative importance of various kinds of pollution enteringWesternport Bay and Port Phillip Bay from point and non-point sources, drawn large-ly from studies conducted over the period 1979 to 1985 by the Victorian Environ-mental Protection Authority and Melbourne Water. Key findings were as follows:
• E.coli levels in street gutters exceed those of the Yarra River when measuredsimultaneously. The relationship between rainfall and elevated E.coli levels onbeaches adjacent to stormwater drains is well established. E.coli levels wereinfluenced by sewage overflows in wet weather, sewer collapses, domesticanimals (mostly dogs), and septic tanks in some areas.
• Nitrogen loads to the Melbourne bays from urban runoff and atmospheric fall-out are significant and increasing.
• Urban runoff contributes the majority of toxicant loads to Melbourne’s bays. Awide variety of toxicants, including heavy metals, is found, mainly in associ-ation with sediments. Contamination of sediment increases the costs of dispos-ing of dredge spoil.
• The vast majority (around 95%) of all litter items in receiving waters are fromdiffuse catchment sources, and particularly high-generation zones such as shop-ping centres. Two-thirds of this is plastic material, and most of the remainder ispaper. Glass and metals are a minor element.
• Higher sediment loads are transported in stormwater than in sanitary sewers.Land disturbance during infrastructure construction is a major source of soil lossto waterways. The dredging and disposal of sediment for navigation and floodcontrol purposes is very costly.
• The study concluded that, given the already well-advanced provision of treat-ment for sewage, the law of diminishing returns would suggest that efforts toimprove the quality of stormwater runoff would be more efficient than furthercontrols on sewage effluents.
Since the “Backyard to the Bay” Study (Collett et al., 1993), the Port Phillip BayStudy has been completed. This has produced more up-to-date information that hasconfirmed the earlier conclusions. According to Harris et al., (1996), discharges fromstormwater in the Port Phillip Bay area (South Australia) have been identified as amajor impact on the Bay’s ecosystem. The large but infrequent discharges from urbanstormwater are estimated to have a greater adverse affect on the ecosystem, relative totreated sewage effluent in the Bay area. Furthermore, recommendations put forth inthe Final Report of the Port Phillip Bay Environmental Study (Harris et al., 1996),emphasise cleaning up urban stormwater as the highest priority.
101
15. CHANGING OBJECTIVES OF STORMWATER MANAGEMENT
Throughout the developed world, the objectives of drainage management have beenrevised over the last decade. Whereas the provision of flood protection was once thesole purpose of drainage management, other objectives now include general pollutionabatement, ecological regeneration, and enhancement of environmental amenity forurban dwellers.
As Niemcynowicz (1994 p. 6-1) has stated:
The fundamental problem of linear flows of matter and energy, i.e. the problemof accumulation, is not properly addressed in present societies. Because wateris a general solvent and carrier of residuals, water management is a key issuethat cannot be separated from the management of other resources and humanactivities.
In addition to the objective of reducing pollution, there is also increasing emphasis onthe naturalisation of urban waters and landscapes. As Ellis (1995 p. 19) has stated:
Principles and guidelines are... [needed]... for the development andimplementation of integrated design approaches to achieve sustainable levels ofenvironmental enhancement in urban floodways and corridors.
In-channel bio-engineering combined with out-of-channel landscaping offers arange of opportunities for conservation, recreation and amenity as well asproviding basic flood and pollution control.
In addition, integrated local-scale restoration and remediation is compatiblewith holistic concepts of wider catchment management, as well as supportinglocal community objectives of land enhancement.
Ellis outlined changing government attitudes to stormwater management, as follows:
• The objectives of floodwater control and pollution management are beingsupplemented with aesthetic, recreational, ecological and economic objectives.
• Strategic principles for sustainable development now include precautionaryprinciple, polluter pays and ecosystem carrying capacity. The internationally-agreed AGENDA 21, (to which Australia is a signatory: Ed) provides an actionplanning basis for strategic and integrated approaches. Consequently, conser-vation and enhancement of the water environment are now seen as an essentialcomponent of the decision-making process in land use change, relying on acollaboration between water managers, catchment planners and land useplanners.
• Design approaches require sensitivity to ecological aspects, planning, landscapeand local cultural/historical needs, and should be done in the context of masterplans describing land use, drainage requirements, flow detention devices, andpollution control.
102
As recommended by Ellis (1995), principles and guidelines are needed for the development andimplementation of integrated design approaches to achieve sustainable levels of environmental enhance-ment in urban floodways and corridors. Stormwater management design approaches require sensitivityto ecological aspects, planning, landscape design and local cultural/historical needs, and should be donein the context of master plans describing land use, drainage requirements in terms of flow paths, flowdetention devices, and pollution control.
Stormwater management should not proceed without satisfying specific water quality objectives,particularly conservation of water as a scarce resource, and its equitable allocation in meeting a range ofcommunity needs, without detriment to the environment.
For new urban developments, integrated water cycle management and the related development of water-sensitive urban design guidelines, need to replace traditional drainage design principles.
16. STORMWATER MANAGEMENT PRACTICES
16.1 Overview of Practices
There is a large number of management practices which may be applied in any storm-water catchment. These may be conveniently classified according to:
• the stage of the water cycle, for example: at source, (at the point where rain falls);in-channel (either natural or constructed drains), or at the bottom of the system orsink, (whether at a point of discharge to a surface water, or a point of infiltration togroundwater), and
• whether the management practice is structural or not (non-structural practicestypically involve individual behaviours, or mandate organisational restraints suchas in building codes, licences etc).
The United States Environmental Protection Agency (1992) identifies examples ofsuccessful stormwater source control practices. Geiger and Dreiseitl (1995) give acomprehensive review of new methods for managing stormwaters, from a Europeanperspective. Taking account of the papers presented at the Novatech 1995 Conference,the US EPA listing of structural and non-structural controls has been expanded byintroducing additional controls, those listed in Table 39.
Multiple stormwater management objectives demand innovation and flexibility on thepart of designers. For example, it is important for designers to ‘flood proof’ their pol-lution source controls, so that the good work done in normal weather conditions is notundone in a flood. A wetland providing sediment collection and biological treatmentmay be scoured out in a flood unless by-pass structures are provided.
The following sections briefly comment on factors influencing the performance ofmanagement practices considered individually. Many of the comments in the follow-ing sections are attributable to Aitken’s (1995) report to UWRAA entitled Bench-marking and Best Management Practice for Urban Waterway Management, and the
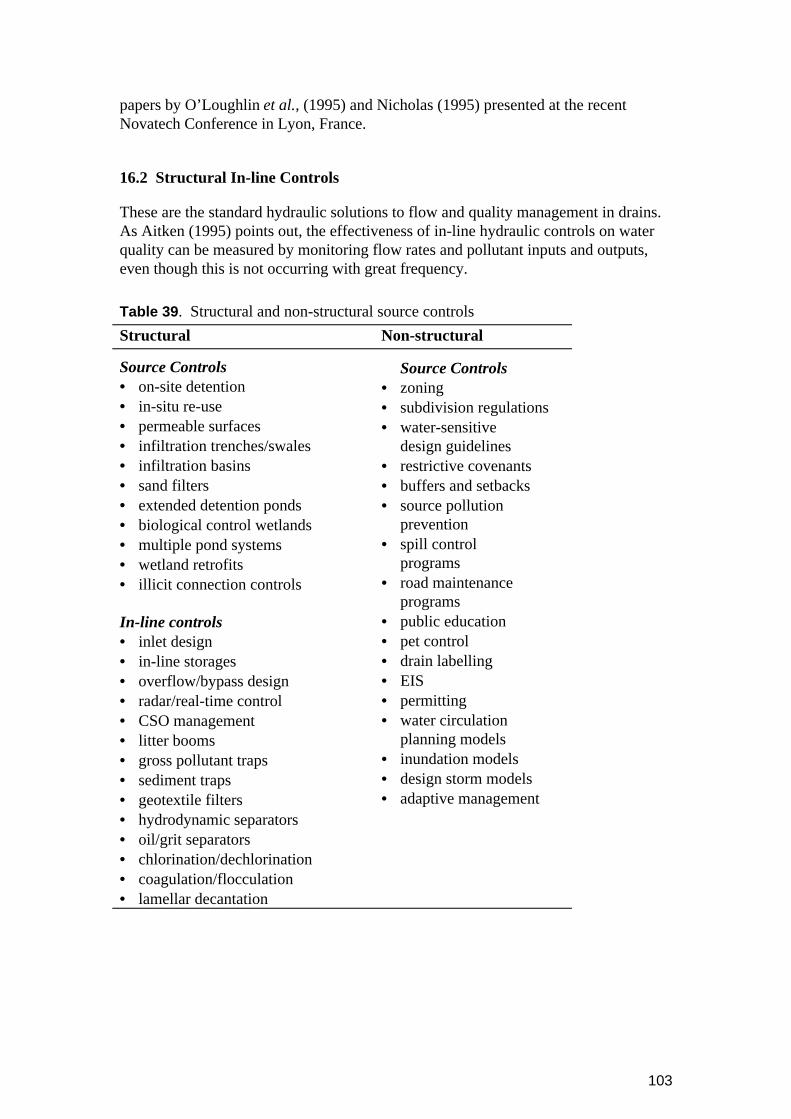
103
papers by O’Loughlin et al., (1995) and Nicholas (1995) presented at the recentNovatech Conference in Lyon, France.
16.2 Structural In-line Controls
These are the standard hydraulic solutions to flow and quality management in drains.As Aitken (1995) points out, the effectiveness of in-line hydraulic controls on waterquality can be measured by monitoring flow rates and pollutant inputs and outputs,even though this is not occurring with great frequency.
Table 39 . Structural and non-structural source controls
Structural Non-structural
Source Controls• on-site detention• in-situ re-use• permeable surfaces• infiltration trenches/swales• infiltration basins• sand filters• extended detention ponds• biological control wetlands• multiple pond systems• wetland retrofits• illicit connection controls
In-line controls• inlet design• in-line storages• overflow/bypass design• radar/real-time control• CSO management• litter booms• gross pollutant traps• sediment traps• geotextile filters• hydrodynamic separators• oil/grit separators• chlorination/dechlorination• coagulation/flocculation• lamellar decantation
Source Controls• zoning• subdivision regulations• water-sensitive
design guidelines• restrictive covenants• buffers and setbacks• source pollution
prevention• spill control
programs• road maintenance
programs• public education• pet control• drain labelling• EIS• permitting• water circulation
planning models• inundation models• design storm models• adaptive management

104
16.2.1 Flow controlsThese are the standard hydraulic structures used in flood control, including channelswith given roughness characteristics, gates, weirs, and surface storages. Recently,increased attention has been given to flow control at source (see Section 16.3).
More recent developments in the operation of installed sewerage and drainage systemsfor large cities in Europe and the USA have been concentrating on real-time weatherforecasting using radar systems, linked to optimal use of the storage available withinthe drainage system. This is particularly relevant for combined sewer systems, but alsohas potential for separate drainage systems in cities such as Melbourne, Sydney andBrisbane. Jorgensen et al., (1995) have suggested that real-time optimal control canreduce event CSO volumes by up to 25%.
16.2.2 Litter and sediment trapsMany organisations use litter and sediment traps in their drainage systems.
Entry gates to constructed drains below streets can be either side-entry or horizontalgrate type. Side-entry is often favoured in Australian cities because of rainfall inten-sity. There is increasing tendency to replace traditional side-entry systems with eithergrates or modified side-entry designs which perform a limited amount of trapping oflitter and debris.
As Aitken (1995) complains, the literature is simply bereft of litter trap designs ofproven effectiveness. Often, simple fencing systems are used. They are invariablyunsightly, and require a high level of maintenance. Trash racks come in variousdesigns from simple screening bars, which are difficult to maintain, to more sophisti-cated designs which are self-cleaning to some degree. These devices are often used inconjunction with gross pollutant traps.
16.2.3 Gross pollutant trapsGross pollutant traps (GPTs) are designed to trap litter, debris, and coarse sedimentsin drains. They are often quite large concrete structures. They sometimes incorporate aweir, and upstream of this swales may be provided along the stream bank to accom-modate flows and impounded water during heavy rainfall events. These structures areused in Brisbane, Sydney, and Melbourne; and extensively in Canberra, which has 10large and 26 smaller installations.
As with all litter-removing structures, GPTs require regular maintenance, and goodinitial design. They also require significant financial outlay and land areas.
16.2.4 Oil and sediment separators: vortex, swirl and dynamic separatorsThese facilities exploit the separating potential of circular flow, often incorporatingskimming devices. The separated materials are either stored and collected, or deliv-ered to a nearby sanitary sewer. Oil and sediment separators are often sited on drainsnear car parks and other points of high traffic density in commercial centres.

105
16.3 Structural Source Controls
16.3.1 Water-sensitive urban designThe concept of water sensitive urban design (WSUD), which is considerably widerthan that of ‘drainage’, refers to the conservative use of both stormwater and waste-water through integrative approaches. An overview of current best managementpractices for designing subdivisions to save and manage water is given in Phillips andGoffman (1993), based on papers and techniques presented at the third Better CitiesTechnical seminar held in Adelaide in 1992. Individual technical approaches whichcan be used within WSUD are discussed in the following sections. A few examples ofthe integrated nature of WSUD are given below.
Moran (1993) developed a set of “Water Sensitive Urban (Residential) DesignGuidelines” for application in Western Australian conditions. These have subsequent-ly been applied in a number of research and planning studies. Experiments in Adelaideand Perth have been based on the principles of water-sensitive urban design. Theseapproaches address flooding, water quality, re-use and environmental issues.
A recent example of integrated detention strategies is the “Stormwater ManagementStrategy and Plans” for the Byford and Mundijong urban development areas south-east of Perth (Evangelisti and Associates and Landvision, 1994). This area suffersfrom water-ponding on clay soils following winter rains. The development of an urbanplan incorporating multi-purpose water management corridors, distributed detentionbasins, artificial wetlands, recreational lakes and channels, and protected areas ofnatural vegetation promises to turn a planning constraint into an opportunity.
Argue (1995) has suggested that the following performance standards are achievablefor stormwater source management practices in Adelaide:
• stormwater runoff peak flows to be reduced following urban redevelopment• all storm runoff to be retained within 300m of its point of origin in the
catchment in new urban developments• all pollution to be retained within 300m of its point of origin in a catchment, and• stormwater to be collected or retained close to its point of origin and used for
non-potable applications such as catchment greening, open space irrigation,industrial use (using surface or sub-surface storage).
Much has been said about the scope for enhancing environmental amenity whileimproving on-site detention by building water features into the built environment.There are many fine examples in Europe and north America. However, there are anumber of reasons why this approach is less suitable in Australia. Firstly, rainfallvariability in Australia is much greater, and so the provision of a permanently flowingwater feature based on frequent, moderate rainfall as in Europe and north-eastAmerica is not possible. Secondly, in many Australian regions the ‘proper’ place forwater is below the ground: urban landscape features may be better achieved in anAustralian context by infiltration which sustains attractive and interesting vegetationcommunities within our cities.

106
16.3.2 On-site detentionOn-site detention may make only a moderate contribution to flood control objectives.This is particularly true for the larger, less frequent floods.
O’Loughlin et al., (1995) describes experiences with on-site detention systems inSydney and Wollongong. He reported that on-site detention systems do retard runoff,and their effects can be reasonably gauged by computer simulation models when theseare based on accurate descriptions of the drainage system. But a major challenge forstormwater programs utilising such source controls is to ensure that designs take ac-count of ongoing maintenance and performance monitoring requirements. O’Loughlinet al., (1995) reported design or construction faults with about 90% of the 3500 on-site systems in the Sydney–Wollongong region. Many were reported to have stoppedfunctioning due to poor maintenance, construction or design faults.
The poor performance of many installations of the last 30 years can largely be explain-ed by the inadequacy of the supporting technology and the lack of standardised designand installation skills. On-site detention remains a key element of source control andis being improved continuously. Nicholas (1995) has summarised a range of newtechniques. These include:
• high early detention: a method of maximising outflow at the onset of storms inorder to conserve storage capacity
• screened outlets: to closely control flow rate and capture litter, debris, andsediment
• frequency-staged storage: this employs all available storage opportunities suchas lawns and gardens, depressions in public open spaces, and open and coveredpavements such as car parks, but in a staged fashion, so that each storage comesinto operation only when the preceding one is full
• tailwater compensation: a method of controlling discharge when the bed of astorage lies below the water surface in the receiving drain
• pump discharge regulation: a method for controlling pumpage from basementtanks
• quality enhancement through separation and treatment of first flushes.
As is clear from the above, a critical component of on-site detention systems is controlof the rate of release of impounded waters into the drainage system. Higgins (1995)describes an Australian device which permits the maximum allowable discharge to bequickly reached, reducing the storage required for the design storm, and producingrelatively constant discharge over a range of operating depths.
At present over 90% of local authorities in Sydney use on-site detention in theirstormwater management strategy, requiring its use in virtually all new developmentand for much redevelopment. Many systems are based on dry surface basins or con-cealed storage tanks. As Nicholas (1995) points out, conveyance systems whichsurcharge every two or three years are quite common, but despite the flood risk, localauthorities are unwilling or unable to expand the drainage infrastructure. Lacking thefunds for widespread enlargement of the drainage network, they encourage land-holders to take up some of the responsibility, and to meet their legal obligation under

107
planning laws to consider downstream stormwater impacts when planning develop-ments.
16.3.3 Constructed wetlands and pollution control pondsWetland and pollution control ponds are used internationally to biologically treatstormwater (Aitken, 1995). These are small lakes with fringing vegetation, sometimesdesigned with a geometry that encourages deposition of sediments. Their intention isto retain runoff long enough to allow aquatic plants to take up nutrients and provide afiltering medium, sunlight to kill bacteria, and sediments to settle. Wetlands aredistinguished from ponds by having a larger vegetated area, a greater variety of waterdepths, and more complex structures. The term can mean any surface which isperiodically saturated with water. The effectiveness of these source controls isdifficult to accurately determine from studies carried out to date, though research iscontinuing, especially within the Cooperative Research Centre for FreshwaterEcology, at Canberra University and Albury-Wodonga.
16.3.4 Infiltration drainage, including permeable surfacesReplacement of porous natural surfaces with impermeable artificial ones is a principalreason for the existence of urban stormwater problems (O’Loughlin et al., 1992).Permeable pavements can restore some of that lost infiltration capacity and also retainpollutants that would otherwise be washed away.
Argue (1995) reported detailed evaluations in Adelaide of rainwater tanks, microgross pollutant traps, houses with leaky well, houses with gravel-filled trench, roofrunoff from a cluster development with bore, single-sloping road carriageway withswale and gravel-filled infiltration trench, and a mixed development including a parkwith a bore.
In Japan, Germany, Sweden, and France permeable pavements are being used extens-ively for carparks, footpaths, and occasionally roads (Aitken, 1995). Considerablereductions in washoff of lead, suspended solids and COD levels have been achieved incarparks. These structures are reported to be cost effective, because other drainageinfrastructure has been either eliminated or down-sized (Balades and Chantre, 1990).Nevertheless the use of porous pavements does imply increased operating costs as thestructure needs to be cleaned and sometimes replaced (every 5 to 10 years in someinstances). If soils are not conducive to percolation, or groundwater must be protected,permeable pavements can employ sub-surface drains or lamellar decantation to dis-charge to a nearby surface drain. There is still some gain in pollution control and run-off peakedness (Aitken, 1995).
Another strategy is for urban planners to try to minimise the area of impermeablesurfaces in new developments. In Denver, USA, this practice extends to fitting grassedswales to collect and detain the first 13mm of runoff. Canberra and Brisbane makeextensive use of swales.
Sand filters are used in many places, including the USA, France and eastern Europe,to treat runoff from roads, commercial and residential areas. They are consideredeffective in removal of sediments and attached pollutants. They may often incorporatecascade inlets and a two-stage storage, one a permanent pool for sediment settling,

108
and the other for filtration through the sand medium with an outflow through a sub-surface drain. In Perth, the ubiquitous sandy soils allow road runoff to be directedtowards numerous local infiltration basins, or sumps. These are no more than fenced,medium-sized excavations, and their effectiveness in filtering contaminants, and soprotecting surficial groundwaters is not known. Generally, sand filters are difficult todesign, construct and maintain. In particular, the accumulated filtrate may be highlycontaminated, and requires regular removal.
16.4 Non-structural Source Controls
16.4.1 Construction, other site-based controls and activity controlsThe use of controls on sediment export from construction sites is common. Recom-mended controls include diversion channels and contour drains, sediment retentionponds, silt fences and hay bales, and vegetated buffer strips. Guidelines for the use ofthese tools are generally available. Aitken (1995) observes however, that enforcementis often lacking in Australian cities.
While construction sites are responsible for a high proportion of sediment fluxes inurban areas, stormwater management programs addressing toxic materials need also totake account of industrial facilities for leaks and spillages, materials stockpiles andwaste disposal sites, such as landfills and car wrecking yards. In the USA under theNational Pollution Discharge Elimination Scheme, individual sites are licensed. MostAustralian States and Territories have environmental approval procedures for individ-ual activities. However, there are few studies which provide an estimate of the collect-ive contribution of such sites to urban water pollution. Consequently, there is no wayof determining whether the present environmental conditions being applied in grantingdevelopment approvals or periodic license renewals are appropriate.
Roads are a significant source of waterway contaminants, and some progress may beachievable through traffic management, as is done as a part of the stormwater manage-ment programs in Santa Clara Valley and Alameda County in the USA. Urban plan-ners can also contribute by designing road systems which are distanced from sensitivereceiving waters, or which have appropriate in-line collection and treatment systems.
16.4.2 Product controlsSome commonly-used manufactured products emit material that contaminates urbanrunoff. A few examples are given here. Motor vehicles are a significant source ofwaterway pollutants. The copper content of brake pads has been identified as a majorsource of contamination of stormwater. In the case of household detergents, SCARMis currently considering new regulations for phosphorus content, while NSW may alsomove independently to implement new regulations. Many products used in the build-ing industry shed metals and /or chemical compounds. National coordination is desir-able, as production facilities for these products invariably serve a national market.

109
The general promotion of recycling is also an important part of product controls, andparticularly the re-cycling of packaging materials which constitute a significantportion of litter in stormwater.
The general promotion of recycling is recommended as an important part of product controls, andparticularly the re-cycling of packaging materials which constitute a significant portion of litter instormwater.
16.5 Combined Sewer Overflows
Overflows from combined sewers during storm events result in the discharge of un-treated sanitary sewage to receiving waters. This may also contain pre-treated indust-rial wastewaters and untreated stormwater (United States Environmental ProtectionAgency, 1993). In many cases, the discharges from combined sewer overflows (CSOs)generally have an adverse effect on receiving water quality. A range of control tech-nologies are available for reducing pollutant discharges from CSOs. These are pre-sented below.
CSO control concepts and design details are influenced by the specific performancegoal that is applied. Control goals are usually governed by receiving-water-quality-based and/or technology-based requirements. Examples of commonly encounteredperformance goals include:
• percent capture: where a specified percentage of flow is captured and/or treated• overflow frequency: where the number of untreated CSOs per year is reduced to
a specified number• treatment level: specifying the pollutant removal efficiency of the CSO controls• first flush: providing capture and/or treatment of some portion of a total
overflow, determined to contain a major fraction of the pollutant load, and• cost effectiveness: basing the size of a control unit on cost effectiveness (United
States Environmental Protection Agency, 1993).
In general, control practices may be divided into one of three categories:
• practices that restrict the rate and/or volume of stormwater runoff that enters thecombined sewer system
• pollution prevention practices that reduce the quantity of pollutants that enterthe system, and
• operation and maintenance practices for the combined sewer system thatimproves its ability to contain wet weather flows and deliver them to treatmentworks (United States Environmental Protection Agency, 1993).
The characteristics of combined sewer systems are site-specific, and often a number ofpossible alternatives exist for a given community. A range of control technologies areavailable to manage sewer overflows. The six most commonly cited (US Environ-mental Protection Agency, 1993), are:
1. in-system controls/in-line storage2. off-line near-surface storage/sedimentation3. deep tunnel storage
110
4. coarse screening5. swirl/vortex technologies, and6. disinfection.
These are discussed below.
16.5.1 In-system controls/In-line storageBy utilising the available storage and conveyance capacity of existing collectionsystems and the available treatment capacity at publicly owned treatment works, in-system controls/in-line storage provide a more readily implementable and cost-effective approach to achieving immediate reductions in CSO volumes (United StatesEnvironmental Protection Agency, 1993). In-system controls/in-line storage reduceoverflow volumes by allowing a larger fraction of the total flow from a storm event tobe conveyed to the treatment works for treatment.
In-system technologies which contribute to maximising in-line storage, maximisingflows to treatment works and reducing overflow volumes include: collection systeminspection and maintenance; tidegate maintenance and repair; reduction of surfaceinflow; adjustment of regulator settings; enlargement of undersized pipes to eliminateflow restrictions; removal of obstructions to flow (example, sediments); polymerinjection to reduce pipe friction; in-system flow diversions through existing systeminterconnections; adjustment and/or upgrade of pumping station operations; partialseparation of storm drain connections from combined sewers; and infiltration removal(United States Environmental Protection Agency, 1993).
16.5.2 Off-line near-surface storage/sedimentationOff-line, near-surface storage/sedimentation facilities consist of tanks that store and/ortreat combined sewer flows that have been diverted from combined trunk sewers andinterceptors. These facilities are constructed at near-surface depths that allow the useof traditional open-cut excavation techniques (as opposed to deep tunnel storage).These near-surface storage treatment facilities provide storage up to the volume of thetanks, as well as sedimentation treatment for flows that pass through the facilities inexcess of the tank volume. Sizing criteria for the storage tanks vary, depending uponthe goal of the CSO control facility. However, coarse screening, floatables control,and disinfection are commonly provided (United States Environmental ProtectionAgency, 1993).
16.5.3 Deep tunnel storageDeep tunnel storage may be used as an alternative to off-line, near-surface storage/sedimentation facilities in areas where space constraints and potential constructionimpacts exist. A major advantage of deep tunnel storage is that relatively large vol-umes can be stored and conveyed with little disturbance to existing surface features.Deep tunnel construction may also avoid some of the issues arising from the use ofopen spaces in congested urban areas, and minimise the disruptions associated with

111
the extensive open-cut excavation associated with near-surface facilities (UnitedStates Environmental Protection Agency, 1993).
Typical deep tunnel storage systems include: regulators (to divert and control stormflows into the tunnel system); consolidated conduits (to convey flows from regulatorsto the tunnel system); coarse screening (to remove large debris and protect down-stream pumps); vertical dropshafts (to deliver flow to the tunnel and dissipate energy);air separation chambers (to allow release of air entrained in the dropshafts); the tunnel(sized to store and convey flows from a given design consideration); access shafts (formaintenance personnel and equipment); vent shafts (for balancing air pressure); a de-watering system (to pump volume stored in the tunnel to the treatment works onceconveyance system and treatment capacity is restored; and odour control systems atcertain venting locations (United States Environmental Protection Agency, 1993).
16.5.4 Coarse screeningCoarse screening technologies are designed to protect downstream equipment byproviding coarse solids removal, as well as a degree of floatables removal. Coarsescreening equipment consists of vertical or inclined steel bars spaced evenly across achannel, and is traditionally located at the headworks of the treatment works. Exam-ples of bar screens used at CSO control facilities include trash racks and both man-ually and mechanically cleaned screens (United States Environmental ProtectionAgency, 1993).
16.5.5 Swirl/vortex technologiesSwirl concentrators and vortex separators are compact flow-throttling and solids-separation devices that regulate flow and remove solids and floatables in combinedflows. The operation of swirl/vortex technologies comprises the following generalmechanisms:
• flow entering the unit is directed around the perimeter of a cylindrical shell,creating a swirling, vortex flow pattern
• the swirling action throttles the influent flow, causing solids to be concentratedat the bottom of the unit
• throttled underflow containing the concentrated solids passes out through a foulsewer outlet in the bottom of the unit
• clarified supernatant passes through the top of the unit.• underflow is discharged to the downstream interceptor for treatment at the
treatment works• baffle arrangements capture floatables in the supernatant• floatables are carried out in the underflow when the unit drains, once storm
flows subside (US Environmental Protection Agency, 1993).
16.5.6 DisinfectionDisinfection destroys or inactivates microorganisms in overflows, and its effectivenessis measured in terms of reduction in bacterial concentration. This is achieved through

112
contact with a range of disinfection technologies (including gaseous chlorine, liquidsodium hypochlorite, chlorine dioxide, ultraviolet radiation and ozone). Liquid hypo-chlorite is the most commonly selected means for disinfecting CSOs (United StatesEnvironmental Protection Agency, 1993).
16.5.7 Other control technologiesOther control technologies that have been applied to CSOs include dissolved airflotation, fine screens and microstrainers, dual-media high rate filtration, and bio-logical treatment. These are discussed in more detail in United States EnvironmentalProtection Agency (1993).
A range of control techniques may also be used to supplement the application ofcontrol technologies at a CSO discharge location. Implementing an appropriatetechnology (or combination of techniques) can enhance performance of the controltechnology applied and, in some cases, reduce design size and cost while stillmaintaining targeted performance objectives (US Environmental Protection Agency,1993).
16.6 Summary: Management Approaches
The different management practices discussed above contribute variously to theachievement of stormwater management objectives. The combination which best suitsa particular catchment will be unique to it. It is a matter for stormwater managers toselect an appropriate mix of achievable objectives in particular catchments, and thecontribution of source controls will vary in each case.
New technical developments are changing the methods available for urban stormwatermanagement. For example:
• real-time control systems are being linked with enhanced modelling capabilityfor storage optimisation within the drainage system during flood events
• source controls: new water-sensitive principles for urban planning andlandscaping and innovative hydrologic/hydraulic structures are beingpromulgated
• research is increasing our knowledge of appropriate design principles andphysical/chemical/biological dynamics of natural and constructed wetlandsystems
• there is a widening range of pollutant/sediment control devices and flow controldevices
• increasing attention is being paid to the physical, biological and chemicaltreatment of stormwater
• a wider range of devices for monitoring, including remote-control, in-situsampling for flow and quality is becoming available, and
• stormwater models are now capable of predicting the behaviour of the drainagesystem to a high level of accuracy.

113
A wider set of stormwater management practices needs to be applied including ‘at source’, in-channel,at sink, structural and non-structural methods. Theses should aim at satisfying all management object-ives, and overcoming existing problems of insufficient capital and operational expenditure, under-performance due to deterioration, technical implementation, public commitment and institutionalstructures. These generally require action by numerous agents in society, as well as drainage utilities(Geiger and Dreiseitl, 1995).
Technical developments that encourage innovation and make multi-objective management ofstormwater systems easier in the future, should be encouraged. The potential for a mixture of combined(sanitary and storm sewers) rather than the separate storm drainage and sewer systems which currentlyexists in Australia should be evaluated.
It is important to keep in touch with the work being undertaken by our international neighbours. Over-seas studies on the cumulative impacts from increased stormwater discharges, indicates the importanceof focussing efforts on the management and control of stormwater discharges from growing urban areasand associated increased urban activities (i.e. storm sewers, urban runoff, combined sewers, hydromodi-fication, land disposal, construction, urban growth, etc).
Stormwater managers must keep abreast of any advancements in technology and research (includingreal-time control systems, source controls, research in design principles, pollutant/sediment controldevices, physical, biological and chemical treatments, monitoring and models) for managing urbanstormwater.
A major challenge for stormwater programs utilising such source controls is to ensure that designs takeaccount of ongoing maintenance and performance monitoring requirements.
17. PUBLIC INVOLVEMENT IN STORMWATER MANAGEMENT
17.1 International Experience
From visits to selected countries (Germany, UK and USA), it was evident that there isgeneral agreement that effective public education was an important element of bestmanagement practice. Public involvement is seen as an essential input in the develop-ment and implementation of stormwater programs. There are, however, differences inthe level of commitment, particularly on the side of public involvement, with someagencies emphasising the education aspect almost exclusively.
There has been growing awareness in the UK of the need for public involvement incontrolling sewage constituents, with emphasis on the need to ‘bag and bin’ (notflush). The National River Authority has been keen to develop public involvementwithin its catchment planning process. From comments at a public meeting it wasapparent, however, that some of the public involvement process was being capturedby a few vested interests. Again, from an Australian perspective, the emphasis in theUSA seems to be on public information rather than involvement in plan formulationand implementation. For example, there did not seem to be any procedure for gainingpublic comment and feedback on stormwater management plans.

114
17.2 CSIRO Study
As the first stage of a study which aims to take a national approach to communitycatchment management of stormwater, a door-to-door survey was conducted inBrisbane, Sydney, Melbourne, and Perth (Nancarrow et al., 1995). A questionnairewas developed to examine the following aspects:
• environmental values for waterways• knowledge and awareness of stormwater issues• responsibility for stormwater management• willingness to pay for stormwater pollution abatement• potential community action, and• attitudes.
Briefly, the results of the survey indicated the following:
• The water quality of urban rivers does not meet the community’s environmentalvalues, but in general the community is satisfied with the current level of servicein flood control and other aspects of quantity management.
• Knowledge and awareness of stormwater issues are variable across the cities,but there is a clear need for further educational efforts.
• While accepting that both the community and polluters must play a role in futuremanagement of stormwaters, many in the community claim to be doing a lotalready to help control stormwater pollution (see Table 40); they see stormwatermanagement as providing a public good, and look to public agencies forleadership technical expertise and resourcing.
• There is positive willingness to pay for stormwater quality improvement. Meanwillingness to pay across all cities was $54 per year per household. The meanwillingness to pay was lowest in Melbourne ($32) and highest in Sydney ($82),with Perth and Brisbane being quite close to the overall average. In policy terms,however, it is also clear from the survey that there is a significant proportion ofpeople who are not prepared to pay for improvements in waterway quality, evenif these were perceived to be desirable. These people sought some redistributionof public expenditure from tax revenues, or more efficient expenditure ondrainage as the means for further improvement.
• With respect to potential community action, repondents reported that they werealready doing many actions which assist with quality management ofstormwater.
• Attitudinal scores reflecting personal motivation/lethargy, sense of moral andsocial responsibility, and familiarity with the problem were the major predictorof potential community action, rather than knowledge of technical facts orperception of personal benefits (for example in personal recreationalopportunities).
17.2.1 Individual behavioursThere is a range of individual behaviours which are thought to contribute to storm-water pollution problems. The CSIRO survey (Nancarrow et al., 1995) measuredconformity with desirable behaviours, and found that there is indeed already a highcompliance rate in most surveyed cities. This suggests that the scope for further

115
improvement, while positive, may be limited, and that those specific behaviourswhere compliance is currently low might be targeted by education campaigns.
Pet droppings are a major source of pathogens in urban drainage systems. Collettet al., (1993), estimated that Melbourne’s dog population (estimated to be approxi-mately 300 000) deposits some 90 tonnes of faeces every day, and that a high pro-portion of this enters drainage systems. Aitken (1995) reports that ‘stoop and scoop’laws are enforced in many cities internationally: New York, Stockholm, and Torontoare three examples. Other areas have pet zoning regulations. For example, local bye-laws have established ‘no-pet’ zones on Perth beaches. Compliance is the key to thesuccess of pet control policies, and this may be achieved by both enforcement andcommunity education/cooperation.
Drain labelling is a means of increasing public awareness of stormwater systems.Community stormwater groups may take on the drain labelling program as a specifictask. The dumping of paints, oils, solvents and garden cuttings into drainage systemsare particular target activities that might be modified by increased awareness.
It is clear, however, that there are many sources of stormwater pollution which are notaddressed by the list of behaviours in Table 40. This underlines the point that com-munity involvement must be accompanied by stormwater management and planning,plus appropriate action and expenditure by public agencies.
Table 40 . Reported stormwater-friendly behaviours in selected Australian cities
Behaviour Respondents (%) claiming that theyalready do listed activity (unweighted)
1. Pick up litter from verge outside home 822. Pick up litter from gutter outside home 733. Sweep leaves/dirt from gutter outside home 574. Sweep and not hose paved/concrete areas 715. Wash car on a grassed area 506. Divert roof runoff to garden 22 (57% in Perth)7. Install a rainwater tank 3 (9% in Perth)8. Remove paved/concrete areas from yard 139. Reduced fertiliser use on lawns/gardens 62 (83% in Perth, 47% in Melbourne)10. Pick up animal faeces from verge 4311. Take plastic bag and trowel when walking dog 2912. Ensure no oil leaks from car 7413. Don’t put anything down stormwater grates 9114. Join a community stormwater action group 2Source: Nancarrow et al., 1995
17.2.2 Evaluation of public involvementThere are serious problems in establishing the performance of behaviour-based sourcecontrols. Camp et al., (1992) have suggested some qualitative methods, including:
• measuring the volume of material removed by street sweeping• undertaking questionnaire surveys to assess public awareness as a function of
educational efforts, and

116
• estimating participation rates in recycling and chemical collection programs.
As Aitken (1995) suggests, implementation and monitoring in urban catchments overextended periods seems the most accurate and rigorous means of evaluatingperformance. Stage 2 of the stormwater study currently being performed by CSIRO isevaluating the performance of a number of community stormwater catchment groupsin a controlled experimental situation.
Public education and public involvement are important elements of any stormwater management pro-gram, and should be encouraged. The total catchment management movement so evident in ruralAustralia needs adaptation if it is to be successful in urban areas. There needs to be better generalunderstanding of how the behaviour of individuals can really help to address stormwater objectives,particularly in the area of a number of gross pollutants. Individual initiative needs to be accompanied byclearer definitions of institutional roles, required public investment, technical advice and environmentalpolicies that deal with systemic inadequacies.
Although public information is an important component for raising community awareness, based oninternational experiences, more efforts should be devoted to allowing the community to provide publiccomment and feedback on stormwater management practices.
Compliance should be recognised as the key to the success of various stormwater control policies (suchas pet control), and this may be achieved by both strict enforcement and community education/cooperation.
Drain labelling is a means of increasing public awareness of stormwater systems. Community storm-water groups may take on the drain labelling program as a specific task. The dumping of paints, oils,solvents and garden cuttings into drainage systems are particular target activities that might be modifiedby increased awareness.
18. ECONOMICS OF STORMWATER MANAGEMENT
The aims in this section are to provide an overview of stormwater management froman economic perspective, and to provide some Australian and overseas examples ofthe costs of alternative stormwater management programs.
18.1 Magnitude of Stormwater Pollution Abatement Costs
The cost of stormwater management programs targeting critical environments may bevery large. Thus decisions about the appropriate scale and content of stormwater man-agement programs can only be properly resolved through some judgement aboutwhether the required abatement expenditures are justified in economic terms. Thestormwater pollution abatement cost curve rises sharply as the stormwater manage-ment program is scaled up for dealing with pollutants that can only be addressed bycostly technical means.
18.1.1 USA StudyIn the USA, drainage engineers are questioning the costs of the NPDES. MontgomeryConsulting Engineers (1992) has estimated nationwide USA costs for various levels of
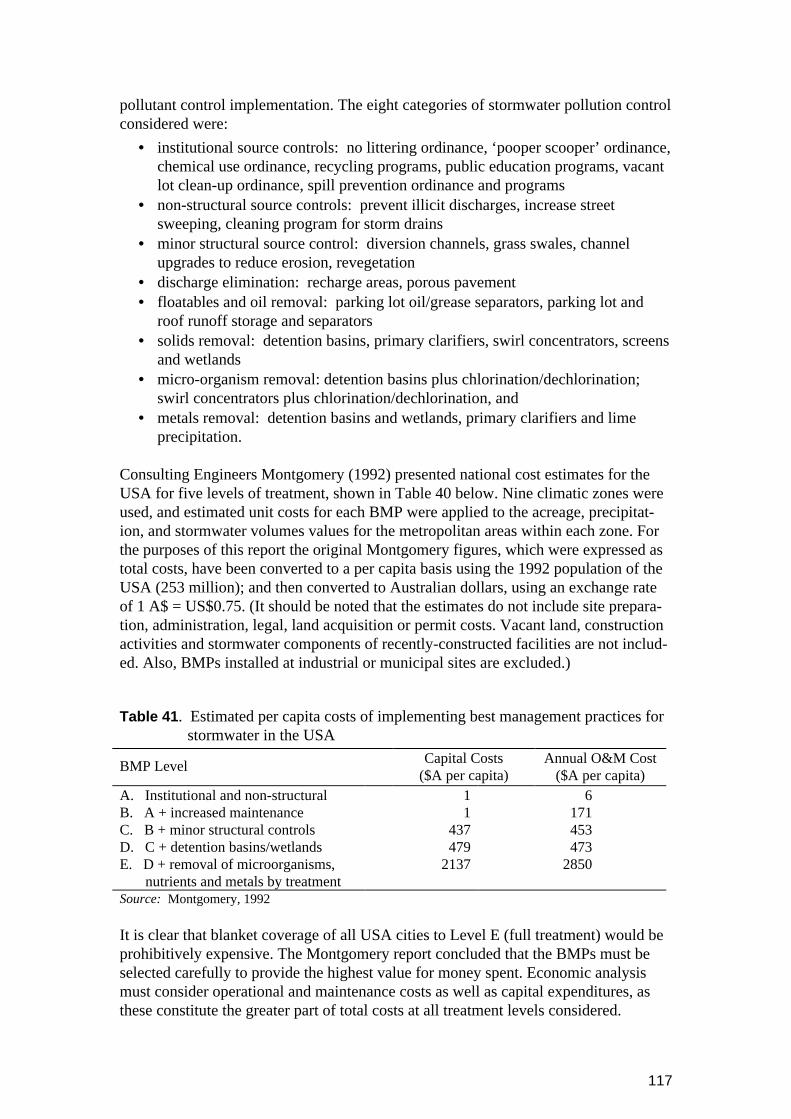
117
pollutant control implementation. The eight categories of stormwater pollution controlconsidered were:
• institutional source controls: no littering ordinance, ‘pooper scooper’ ordinance,chemical use ordinance, recycling programs, public education programs, vacantlot clean-up ordinance, spill prevention ordinance and programs
• non-structural source controls: prevent illicit discharges, increase streetsweeping, cleaning program for storm drains
• minor structural source control: diversion channels, grass swales, channelupgrades to reduce erosion, revegetation
• discharge elimination: recharge areas, porous pavement• floatables and oil removal: parking lot oil/grease separators, parking lot and
roof runoff storage and separators• solids removal: detention basins, primary clarifiers, swirl concentrators, screens
and wetlands• micro-organism removal: detention basins plus chlorination/dechlorination;
swirl concentrators plus chlorination/dechlorination, and• metals removal: detention basins and wetlands, primary clarifiers and lime
precipitation.
Consulting Engineers Montgomery (1992) presented national cost estimates for theUSA for five levels of treatment, shown in Table 40 below. Nine climatic zones wereused, and estimated unit costs for each BMP were applied to the acreage, precipitat-ion, and stormwater volumes values for the metropolitan areas within each zone. Forthe purposes of this report the original Montgomery figures, which were expressed astotal costs, have been converted to a per capita basis using the 1992 population of theUSA (253 million); and then converted to Australian dollars, using an exchange rateof 1 A$ = US$0.75. (It should be noted that the estimates do not include site prepara-tion, administration, legal, land acquisition or permit costs. Vacant land, constructionactivities and stormwater components of recently-constructed facilities are not includ-ed. Also, BMPs installed at industrial or municipal sites are excluded.)
Table 41 . Estimated per capita costs of implementing best management practices forstormwater in the USA
BMP Level Capital Costs($A per capita)
Annual O&M Cost($A per capita)
A. Institutional and non-structuralB. A + increased maintenanceC. B + minor structural controlsD. C + detention basins/wetlandsE. D + removal of microorganisms, nutrients and metals by treatment
11
437479
2137
6 171 453 473 2850
Source: Montgomery, 1992
It is clear that blanket coverage of all USA cities to Level E (full treatment) would beprohibitively expensive. The Montgomery report concluded that the BMPs must beselected carefully to provide the highest value for money spent. Economic analysismust consider operational and maintenance costs as well as capital expenditures, asthese constitute the greater part of total costs at all treatment levels considered.

118
18.1.2 Australian StudiesThe NSW Government Pricing Tribunal has estimated the costs to Sydney Water ofstormwater measures for achieving certain quality-of-service targets in the State(NSW Government Pricing Tribunal, 1993a). Results are summarised in Table 42.
It is noteworthy that the bulk of anticipated expenditure for improving stormwaterservice quality was for flood protection. Out of the total of $765 million in capitalcosts only $43 million was for stormwater pollution control. However, most of theexpected operating cost increases were for stormwater management: $21.0 million outof a total of $31.2 million.
Table 42 . Indicative costs of improved service quality of stormwater drainage inNSW
Options Indicative IncrementalCapital Cost ($m)
Indicative IncreasedOperating Cost ($m/yr)
1:100 year flood protection inNewcastle, Gosford, and Wyong
70.0 0.2
Sydney water to manage localgovernment catchments
nil 10.0
Storm channel flood mitigation inSydney
411.0 10.0
Warragamba dam wall 241.0 nil
Reduce pollution in SydneyWater catchments
43.0 11.0
TOTAL 765.0 31.2Source: Government Pricing Tribunal of NSW, 1993a
In 1994, the Sydney Water Board proposed a catchment-based charging system forstormwater and drainage services. Under this proposal the costs of addressing floodmitigation and water quality problems would be recovered from water consumers inthe catchment area. The amount to be paid by an individual customer would varydepending on the area of land occupied, and the scale of expenditure in the catchment.Charges per customer (not per capita) were estimated to be in the range $47.50/yr to$398/yr. Implementation of this proposal would require community support. TheSydney Water Board was forced to withdraw a proposal for a flat $60 charge in thecatchment of Cabramatta Creek following opposition by residents. The bulk of theplanned expenditure was to be for flood mitigation.
Sydney Water (1994) has outlined the costs of achieving a higher level of control onsewer overflows, with resultant improvements to ocean, beach, river and estuarineenvironments. The incremental costs could be up to $3 billion, if containment to thelevel of the once in two-year event were sought. These costs would be for the follow-ing items:

119
• limit tree root and silt ingress to sewers, and rectify equipment failures• repair leaky customer house service lines• repair gross main sewer defects and rapid inflow sources• repair slow infiltration sources to main sewers• storage of excess volumes in ponds and tanks• installation of relief sewers, and• treatment of excess flows before discharge to nearest waterway or ocean.
Expressing the figure of $3 billion as an annuity of approximately $300 million anddividing by the population served by Sydney Water, the per capita annual cost of fulltreatment of sewer overflows would amount to approximately $82 per year (or around$200 per customer). This exceeds the average willingness to pay for stormwaterquality improvement suggested by contingent valuation studies by a factor of approxi-mately 3. The example serves to illustrate the very large costs of sewer upgrades, andthe need for some rationale for deciding what scale of investment is warranted. Theproperty-rights approach to reform (see section 18.2) cannot escape this basic questionof appropriate resource allocation to pollution abatement.
The prospects for improvement in total water cycle management in new developmentsappear much brighter than in retrofits of existing urban areas. Mouritz (1995) presentsthe results of a detailed cost comparison between (i) ‘conventional’, (ii) ‘proposed’and (iii) ‘towards sustainable’ designs for an urban redevelopment site at Palmyra inPerth. The third of these was based on the Water Sensitive Urban Design Guidelines(Moran, 1993), which emphasise the need to integrate water and land use planning at astrategic level in the urban planning process. For the Palmyra site, there were onlysmall differences in capital and operating costs between the three options.
Thomas et al., (1994) developed cost comparisons for conventional and water-sensitive designs for the MFP Adelaide development at Greater Levels, whichsuggested that on-site costs would be slightly higher for the water sensitive design.Gibert and Maheepala (1995) demonstrated that there would be cost savings in thewider Adelaide system if the water-sensitive designs for Greater Levels were to beadopted.
18.2 Applying Economic Principles to the Problem of Stormwater Management
Two strands of economic thought that may be applied to questions of stormwatermanagement are discussed. The first, which draws on market economics and propertyrights theory, is concerned with institutional structures, including pricing andincentives, to encourage improved management. The second is concerned with thejustification of (mainly public) expenditure programs in terms of their scale, timing,and impacts on gainers (beneficiaries) and losers (those who bear the burden of costs).
18.2.1 Market economicsFor the market economists, the stormwater problem revolves around the public goodnature of stormwater services. The major benefits of stormwater management arepublic health, reduced damages from floods (including damages to property and
120
income-producing activities), and enhanced environmental amenity (including en-hanced property values from better urban landscapes, greater supply of recreationalwaters, and higher ecological values). Some also see paid and voluntary employmentin work related to drainage systems as a benefit of a more participatory approach.
The nature of these benefits poses a problem for the market economists, because:
• they are a public good whereby many individuals receive the benefits• it is not possible to prevent any individual from enjoying them, and• benefits received by one individual do not reduce those of another.
For these reasons it is not possible to price stormwater services as a normal good. Asstated in a report of the NSW Government Pricing Tribunal :
To the extent that each individual is enjoying benefits or imposing costs thatcannot be individually identified, a flat charge [for stormwater services] acrossthe community may be an appropriate response (Government Pricing Tribunalof NSW, 1993b).
Market economists addressing stormwater management problems have therefore em-phasised the better definition of institutional roles. For example, the NSW Govern-ment Pricing Tribunal (1993b) has recommended :
• Integrated environmental regulation: including the treatment of non-point sourcepollution on the same basis as point sources by licensing discharges from storm-water drains
• provision of explicit standards for stormwater and sewer overflows by govern-ments: either in conjunction with transferable pollution entitlements (not currentlyconsidered feasible) or as a part of the urban development consents process. Thestandards would need to take account of economically feasible technologies and thecosts of stormwater pollution reduction relative to those for abating other sourcesof water pollution.
• decision making based on stormwater catchment areas: thereby internalising thepublic good aspects within the basin, reducing free-rider and enforcement problems
• clear allocation of accountabilities and responsibilities: especially clarifying own-ership, and favouring the allocation of all responsibility for works and operationalmatters to the municipal government level, and
• region-based pricing: in particular the incorporation of the costs of stormwaterinfrastructure (based on target service level) into developer charges for new urbandevelopments; and alignment of charging structures with defined responsibilitiesand accountabilities for existing areas.
Section 19.3 returns to the question of institutional structures.
18.2.2 Public sector economicsGiven the difficulties of providing market signals to individuals and organisationsabout the costs and benefits of stormwater management, and given the potentiallylarge public and private sector costs of dealing with stormwater management prob-lems, stormwater management cannot be taken out of the realm of public sector
121
decision-making simply by ‘marketisation’ of the problem. Consideration of theeconomic dimensions of stormwater management initiatives will thus require ananalytical framework grounded in public sector environmental economics.
Environmental economics, based on social welfare economics, provides a frameworkfor estimating the damage and abatement costs of a stormwater program for a givencatchment. The principal outcomes of stormwater management are:
• the level of flooding• water quality in different parts of the catchment, as related to beneficial uses and
environmental values (which presumes some method of water allocation toalternative uses), and
• urban landscape amenity, including ecological benefits.
For each of these outcomes it is possible to compare the total abatement and damagecosts of alternative stormwater management programs in the catchment. Total abate-ment costs are the sum of discounted capital and operating costs needed to attain (andmaintain) a given level of performance. As the target level of abatement is raised, theabatement cost will rise. Total damage costs are the costs incurred by society at givenlevels of effective abatement. For example, the costs from property damages will behigher if abatement expenditure is limited to the containment of the 1 in 20 year flood,rather than the 1 in 50 year flood. Thus, as abatement expenditure is increased, dam-age costs decrease. The economic problem is to determine a stormwater managementplan which minimises the sum of the damage and abatement costs for society as awhole. That is, to recommend increased public or private expenditure on abatementwhen it is justified by estimated damage reduction; and, conversely, to recommendagainst abatement expenditure where this is not justified by the potential reduction indamages in society as a whole.
A similar framework may be applied in relation to the objective of water quality,except that the analysis must inevitably be concerned with a vector of water qualityoutcomes across the whole catchment for a particular stormwater managementprogram. Thus, on the damage cost side it becomes necessary to identify how eachbeneficial use or environmental value is affected at the given level of abatementexpenditure.
There are several reasons why the formulae of environmental economics, above, arenot easily adapted to the problem of determining an optimal stormwater managementprogram in a catchment. The natural dimensions of each of the three outcomes of astormwater management program described above are different in each case: forflooding the appropriate metric is a target flood frequency; for water quality it is avector measurement of physical, chemical and biological parameters, and this may beexpressed either as a limit, as an average, as a load or as a concentration. There is nogenerally-accepted metric of landscape or ecological quality.
There is, however, progress in environmental valuation. The NSW EPA hasdeveloped a bibliographic reference tool, named ENVALUE (New South WalesEnvironmental Protection Authority, 1995), that will help environmental economiststo quantify use values as a function of water quality. In the UK, the National Rivers

122
Authority has established a methodology for assessment of the benefits of waterquality improvements at the level of individual river/stream reaches (Foundation forWater Research, 1994). This is reported to provide robust results, in the sense of(i) providing reproducible estimates when the method is applied by different analysts,and (ii) gaining agreement from stakeholders (Newsome, 1995, pers comm).
Other issues that public policy makers, such as the boards of catchment managementbodies, have to take into account include questions of financial practicality, such ashow money is to be raised to undertake works; equity questions, such as accessibilityof the improved catchment features to the population at large, and who is to bear theburden of costs; and intergenerational questions such as whether it is fair that thecurrent generation bears the burden of costs while only future generations may enjoythe full benefits, due to the lag in ecological response times.
In the face of such complexity, one might conclude that a stormwater managementprogram which is well-based in terms of hydrology, hydraulics, ecology and landscapedesign, which captures well-informed public support and is do-able in terms of avail-able financial resources may be as much as can be expected in many cases. Neverthe-less, given the multiplicity of the components of any stormwater management plan,some overall assessment framework encompassing bio-physical, economic, equity andother issues is needed. Multi-objective analysis that takes account of expected bio-physical outcomes, projected abatement expenditure levels, specific damage costs, andother features of the plan that are not measured in monetary terms is one such frame-work.
18.3 Financing Stormwater Management Programs
Internationally, there are many examples of the ‘polluter pays principle’ in financingstormwater management programs.
In the USA Alameda County and Santa Clara Valley programs, the founding munici-palities contribute funds on the basis of their estimated total annual runoff production.Other catchment bodies collect rates from property owners based on the amount ofimpervious area on their land. The City of Orlando, Florida uses an EquivalentResidential Unit as its basis for monthly charging for stormwater services. Similarcharging systems have been investigated by Melbourne Water. However, it is note-worthy that Melbourne Water already receives drainage rates, and this source ofrevenue would presumably be surrendered on the introduction of a new system. Theincentive-pricing effect in the above cases would appear to be weak, and transactioncosts could be high.
A more active form of polluter pays principle has been applied in the German State ofNorth Rhine-Westphalia, in the Ruhr area, where catchment bodies owned by constit-uent municipal governments are regulated by the State (Lander) government accordingto predetermined water resource standards for quantity and quality of runoff. Failureby the catchment body to meet the prescribed standards results in a fine, the burden ofwhich is passed on to the municipal owners. The level of fines is calibrated with esti-mated abatement costs, and revenue from the fines is earmarked for the financing of

123
abatement measures. This structure has the advantage that the catchment bodies canconsider a range of stormwater management strategies for meeting the targetoutcomes, whereas the number of options available to individual households ororganisations is more limited. Therefore the incentive pricing effect can besignificantly greater, while there can also be some economic evaluation of theappropriate level of the pollution tax.
Vital issues need to be addressed regarding the appropriate scale and composition of stormwatermanagement programs, and these can only be properly resolved through some judgement about whetherthe projected abatement expenditures needed to attain various target levels of outcome, are justified innatural or economic terms. The amount of economic resources allocated to urban stormwater manage-ment should be increased in line with required abatement expenditures. Environmental economicanalyses of the appropriate level of abatement expenditure should be undertaken.
Best Management Practices (BMPs) must be selected carefully to provide the highest value for moneyspent. Economic analysis must consider operational and maintenance costs as well as capital expend-itures, as these constitute the greater part of total costs at all treatment levels considered.
There should be reform of existing drainage rating systems, which should be replaced by charges onhouseholds and organisations which more accurately reflect the costs of planned stormwater manage-ment programs.
18.4 Conclusions
As a starting point it is recommended :
That research be sponsored to estimate the abatement costs of stormwater management programs for aselection of Australian catchments, a vector of target water qualities and a range of flood frequencies.
A range of policy instruments are recommended to address the stormwater management problem. Theseinclude: integrated environmental regulations, the provision of explicit standards for stormwater andsewer overflows by governments; decision-making based on stormwater catchment areas; clear allocat-ion of accountabilities and responsibilities; and region-based pricing. Before such practices are enforc-ed in a catchment area, the relative merits (or otherwise) of the different approaches must be assessed.
Given the multiplicity of the components of any stormwater management plan, some overall assessmentframework encompassing bio-physical, economic, equity and other issues is needed. Multi-objectiveanalysis, that takes account of expected biophysical outcomes, projected abatement expenditure levels,specific damage costs, and other features of the plan that are not measured in monetary terms is onesuch framework.
19. INSTITUTIONAL ARRANGEMENTS FOR STORMWATERMANAGEMENT
The COAG partners have committed themselves to a number of principles forinstitutional development in the water sector. This sub-section elaborates theseprinciples in the context of stormwater management. The next two sub-sections deal,

124
with (i) current institutional arrangements for stormwater management in Australianjurisdictions and (ii) those in Germany, England and USA. Finally, some conclusionsand recommendations for institutional development for Australian stormwatermanagement are put forward.
19.1 COAG’s Institutional Principles for Water Resources Management
Drawing from the Report of the Working Group on Water Resources Policy datedFebruary 1994, the principles already endorsed by COAG are that:
• roles and responsibilities should be clearly separated in different institutions fordifferent purposes
• community involvement in water resources management is essential, and• management and planning needs to be based on a whole-of-catchment approach.
These principles are discussed in more detail below.
19.1.1 Separation of roles and responsibilitiesIn its unpublished report to COAG dated February 1994 the Working Group on WaterResources Policy stated (para 3.9):
While some jurisdictions are moving to change the institutional arrangements ...to delineate more clearly the role and responsibilities of the various players,there is still a deal of overlap in some areas in relation to the trustee for theresource, establishing and enforcing regulatory requirements, and servicedelivery. In a first-best or ideal world it would be desirable for each of thesefunctions to be undertaken by separate entities. The alignment of organisationalstructures with objectives, means separated bodies can be provided with clearand non-conflicting objectives and more transparent accountabilitymechanisms...
19.1.2 Community involvementThe Working Group stated (para 3.12) that:
Community involvement is seen as important in gaining public recognition ofthe challenges facing the nation the proper management and use of our waterresources and in securing community support for the solutions proposed.
19.1.3 Integrated catchment managementThe Working Group recommended (para 4.12) that:
If natural resource management is to be pursued in an integrated manner...there is a requirement for those jurisdictions where institutional arrangementsof this nature have not yet been put fully in place, to consider doing so.
Many detailed issues must be resolved in implementing these institutional principles.

125
In terms of the first principle, the implied separation of powers and responsibilitiesseems to be between a body dedicated to the achievement of efficient and effectivemulti-purpose planning and management of stormwaters, and other bodies dealingwith water supply, sewerage, urban development plans and environmental protection.Some of the questions that need to be resolved include:
• what level of government is appropriate for the urban catchment managementfunction: local authority, catchment board or state government department?
• what should be the statutory, corporate and fiscal status of the catchment body?• what ministerial powers should apply to the catchment body?• what powers should be exercised by the catchment body?• what relationship should exist between the catchment body and the environ-
mental regulator. (for example, should the catchment body set water qualitytargets for receiving waters?)
• what relationship should exist between the catchment body and the naturalresource management department (for example, which institution shoulddetermine water allocations?)
• what relationship should exist between the catchment body and the urbandevelopment planning agency (for example, should the catchment plan, if one isproduced, have statutory status for land use planning?), and
• should there be any attempt to introduce a polluter pays principle?
Before commenting further on such questions, the following sections will summarisecurrent institutional arrangements in some overseas jurisdictions and in Australia.
19.2 Institutional Responses in Other Countries
Given the multiplicity of technical options and actors it is hardly surprising that therehas been a call for integrated management. ‘Integration’ is nevertheless a fuzzyconcept, which needs to be better defined in particular regions. While institutionalstructures vary between countries, two powerfully integrating concepts are:
• integrated catchment management, and• stormwater management programs.
Stormwater management programs are an attempt to specify all the actions that areneeded to improve stormwater management in an area, and to identify who is to beresponsible for implementing them. The development of a program approach is usefulin lending coherence to the set of required actions. It also is useful in maintainingprogress against a targets of achievement, even if the exigencies of fundingavailability cause delays to the program.
All countries visited have been adapting their institutions to address the problems ofurban water management. The general trend has been to make sharper institutionaldistinctions between planning, regulatory and operational functions for urban storm-water services. The need for planning and operational mechanisms at stormwatercatchment scale has been recognised everywhere, though the particular organisationalforms have varied, depending mainly on the structures of government and the waterindustry. All countries recognise that public involvement is an essential input in the

126
development and implementation of improved urban water resources management.There has been less consistency with regard to the incorporation of economic instru-ments and property rights theory in stormwater management.
19.2.1 U.S.A.The USA’s arrangements for stormwater control are of interest in Australia, as anexample of a three-tier government system (federal-state-local) that has adopted newinstitutions during the last decade.
The general framework within the USA is provided by the US Clean Water Act 1971,amended 1987, which is national legislation binding on the states, under which dis-charges from storm sewer systems serving populations of 100 000 or more requirepermits within the National Pollution Discharge Elimination System. In many cases,responsibility for administration and enforcement is vested in a state government.Local governments, generally termed ‘municipalities’ are deemed to be the owners ofthese systems, and are the prime targets of the legislation. In addition there are 11categories of industrial discharges which also require NPDES permits. The US EPAestimates that there are about 100 000 industrial facilities that now fall within theNPDES. (On a crude per capita basis this would imply around 5000 industrial facil-ities if the same scheme were applied in Australia). Agricultural activities (includingirrigation return flows), and uncontaminated runoff from oil, gas and miningoperations are statutorily excluded from permit requirements.
The granting of a NPDES permit depends on the originator of the stormwater dis-charge demonstrating that the point-source effluents are acceptable in the context ofreceiving water impacts, or may be abated through an agreed program of stormwatermanagement. Thus:
the NPDES permitting authorities are directed to ensuring that municipalitiesdevelop and implement stormwater management programs to control pollutantsto the maximum extent practicable. (United States Environmental ProtectionAgency, 1992 p. 10)
The US EPA regards the joint definition of the stormwater management programbetween the NPDES authority and the municipality as giving flexibility to the permit-ting process. However, Montgomery Consulting Engineers (1992) reported that one ofthe key concerns of municipalities is the unknown cost to implement best manage-ment practices (BMPs), because the level of required pollutant reduction is currentlyunknown.
There is currently uncertainty about future coverage of the NPDES. In 1992 it wasplanned to extend the system to smaller municipalities (that is, those having under100 000 population), and a greater range of industrial/commercial/utility activities.Such extension clearly involves a choice about the appropriate form and delegation ofthe permitting process. For example, by contrast, the National Rivers Authority in UKand Lander Governments in Germany only concern themselves with regulation ofdischarges at a macro level, leaving issues of system design, bye-laws, local trade offsand enforcement to local institutions, whether these be catchment authorities, waterutilities or local governments.

127
19.2.2 GermanyGermany has a three-tier federal government system, comparable to that in Australia.For more than twenty years Germany has led European Community environmentalstandard setting, and has implemented a polluter pays approach to surface waterpollution.
For water management Germany has a system of federal-level ‘frame’ laws, whichestablish overall water quality guidelines. Individual states (Lander) then enact theirparticular versions of the federal law, and, as in Australian states, responsibility for theimplementation of policies and enforcement of environmental law resides at statelevel. At that point the similarity ends. At the state level, while there are differences inapproach among the various Lander, they each enforce the polluter-pays principle byempowering state environmental departments to establish, in conjunction with localwater managers, catchment water quality objectives, which must be achieved or a fineis payable.
In the state of North-Rhine-Westphalia, this system has been further refined by theestablishment of catchment agencies. These are statutory bodies which provide waterinfrastructure and catchment management functions, and they obtain their fundingfrom the municipalities which fall within their catchment area. The catchment agen-cies are regulated by the environment department, and pay fines for failure to achieveagreed water quality targets. This institutional system has five advantages:
• there are clearly defined responsibilities and accountabilities between regulators,water managers and local government
• planning, management and regulation are performed at catchment scale• multi-objective planning and management is practised within an integrated
framework• the introduction of incentives for environmental economic efficiency via the
polluter pays principles is straightforward, and• catchment agencies are sufficiently large as to incorporate a critical mass of
water management competencies and scale economies.
19.2.3 England and WalesInstitutional developments for water resources management in the UK are of interestin Australia, partly because of the common system of parliamentary government, andalso because of the water reforms which have been implemented in the UK over thelast decade. Only England and Wales are considered here as there are differentarrangements in Scotland and Northern Ireland.
In England and Wales environmental regulations, administered by the National RiversAuthority (NRA), are based on the ‘beneficial water use’ concept, similar to the con-cept of ‘environmental values’ used in the Australian National Water Quality Guide-lines. The NRA is responsible for monitoring water quality, and may require the(privatised) water companies to do any necessary work to meet environmental require-ments. There is generally a policy of encouraging industries and commercial centres todischarge to sewers, and this means that the NRA almost exclusively deals with thewater companies, who in turn have powers to control discharges by industry and

128
commerce within their catchment areas. The water companies, though privatised, wereset up on the basis of the major catchment areas. Occasionally, the NRA deals directlywith industries which discharge to a surface water body, but the extent of this regu-lation appears quite small when compared with the amount of direct regulation ofindustries practised in the USA under the NPDES. The relationship of the NRA to thewater companies appears similar to that of the Lander environmental departments tothe catchment authorities in Germany, except that in England and Wales, instead of afining system, the NRA may require a water company to undertake particular works.
The UK water companies are required to submit Asset Management Plans to theOffice of Water Services (OFWAT), the economic regulator for the industry, andthese identify all planned upgrades to sewage and drainage infrastructure. A form ofpolluter pays principle is thus in place, through the licence conditions, includingtreatment requirements, imposed by the NRA on the water companies. The watercompanies, in turn, pass the costs on to water consumers, provided that the industryregulator, OFWAT approves. In order to cover monitoring costs, the NRA levies anadministrative charge, based on volumes discharged by each water company(Crabtree, pers comm). This model is not dissimilar to that now in place in New SouthWales, where a request from government to a water utility to undertake environment-ally directed works can be recognised as a community service and submitted to theNew South Wales Prices Tribunal for approval of concomitant water/sewage/drainageprice increases.
In an effort to help water utility managers cope better with sewer discharge require-ments, the UK-based Water Research Foundation has prepared an Urban PollutionManagement Manual (UPMM) (Tyson et al., 1994). This represents the culminationof some 10 years’ investigation and development work on the design and performanceof urban wastewater systems (sewage and stormwater). Clifforde and Morris (1995)describes the UK institutional arrangement, and the role of the UPMM within it. Amost significant aspect of the Manual is that it sets out an evaluation process that fullyintegrates environmental impacts with wastewater/stormwater system design.
Recently, in parallel with its regulatory functions described above, the NRA hasinitiated a catchment planning and management strategy. Since many of the catch-ments in England and Wales are urbanised, this is highly relevant to a consideration ofAustralian urban catchment management. Chandler (1994), describes the NRA’sintegrated Catchment Management Planning Strategy.
The main advantages of the NRA catchment plans are that they (i) summarise infor-mation on catchment conditions, (ii) articulate the existing management priorities ofthe managing authority (that is, the NRA), (iii) identify issues, (iv) identify possiblefuture management responses, detailing agency, urgency, and timing, (v) put in place aconsultation process that should lead to better coordination of policies among thevarious actors who influence the catchment uses and condition, and (vi) provide aframework for multi-functional planning.
From an Australian view point, weaknesses of the NRA system seem to be that(i) there is no obvious framework for the resolution and ‘closure’ of issues, (ii) thecatchment plans have no formal status in the statutory town planning process (for

129
example, in contrast to the statutory status of stormwater management plans requiredbefore issue of NPDES permits in the USA), and (iii) frameworks for broad publicinvolvement do not seem well developed.
The NRA system combines the role of catchment planner and environmental regulatorwithin the same institution. This contrasts with the American framework in which theenvironmental regulators do not so obviously engage in catchment planning, but ratherconcentrate on the permitting function through which individual wastewater utilitiesand owners of municipal drainage schemes must explain how their plans and currentactivities are, or can be made, consistent with prevailing environmental standards orguidelines. This may fall short of a complete catchment analysis, if, for example thedischarge affects just a particular reach of a river.
Local government is not much involved in stormwater management in the U.K. TheConstruction Industry Research and Information Association have, however, develop-ed a set of guidance documents for developers and construction companies, dealingwith source control and pollution aspects. There are signs that town planners aretaking increasing interest in improved management of the urban water cycle in orderto create amenity values. The National Environment Research Council is taking a parthere, as set out in Rees (1994).
19.3 Institutional Arrangements in Australia
Throughout Australia, institutional arrangements for stormwater management arecurrently in a state of flux as the various jurisdictions adapt to the National WaterReform Agenda. There is now an opportunity to adapt these institutions to meet thechallenges ahead.
It is not unreasonable to state that across Australia, arrangements for integrated storm-water management are generally chaotic. Among all the fields of water resources man-agement this must require the most urgent institutional change. Control is generallyvery fragmented and there is a lack of clear accountability for various parts of thewater cycle. The relationships between the various operators, regulators, and councilsis often blurred, and in many cases the operating agencies are also involved in stan-dard or target setting. There is therefore an urgent need to improve the institutionalframework for stormwater management.
Local authorities have traditionally played a dominant role in providing drainage andflood control in the context of land use planning. But in some cases, this responsibilityhas been taken over by State government agencies, especially where some majorcatchment is involved. In some jurisdictions drainage and flood control are providedentirely by state or territory agencies, and local government plays no direct role. In alljurisdictions drainage, flood control and more general stormwater management funct-ions are nested within quite complex institutional arrangements for natural resourcesmanagement, environmental protection, and land use planning. The following sectionssummarise the situation in each jurisdiction.

130
19.3.1 Australian Capital TerritoryIn many respects the water sector institutions in the ACT have developed along linesthat are broadly consistent with National Water Reform Agenda. This includes:
• separation and corporatisation of the water service provider, ACTEW• integrated land and water planning through the Territory Plan• catchment based strategic assessment• incorporation of appropriate stormwater management structures, to ensure
identified environmental values are not compromised, at the development stage• land use management and planning guidelines including floodplain management
guidelines, and• implementation of a regulatory regime to ensure water quality protection.
The objectives of the ACT Water Policy Plan 1991 comprised the conservation ofwater as a scarce resource, and its equitable allocation in meeting a range of commun-ity needs, without detriment to the environment. Major components of the waterquality strategy were as follows:
• designation of water uses and conservation values a basis for determiningpermissible uses and management practices
• identification of the level of water quality which would support the acceptableuses
• provision of sewage and stormwater infrastructure that would be responsive tothe protection of in-stream uses and conservation values, and
• integrated, total catchment-based planning and management.
The implementation strategy outlined in the Policy Plan comprised a suite of measuresdetermined on the basis of cost effectiveness, social equity, and effective attainment ofobjectives. The measures included:
• designation of water use and conservation values• water quality guidelines• all urban and industrial areas to be sewered• upgraded sewage treatment facility• stormwater pollution control measures• controls on soil disturbance during construction• rural soil conservation• licensing of all point source discharges• waste minimisation through re-use of treated wastewater• approval of land development proposals to take account of downstream impacts• protection of floodplains and riparian vegetation, and• provisions for monitoring, review and feedback.
There is currently significant organisational restructuring occurring in the ACT. Re-vised institutional arrangement now being developed are intended to enhance effectiveand coordinated water resource management. The arrangements will assist anintegrated approach which will foster overall efficiency in resource use while ensuringappropriate environmental protection.

131
19.3.2 New South WalesThe discussion in this section is taken largely from James et al., (1994).
Responsibilities for management of the water cycle in New South Wales are dividedamong numerous government agencies, including:
• a Stormwater Coordinating Committee• urban and rural local councils, which operate water, sewerage and drainage
facilities across the State• corporatised water supply authorities, including Sydney Water and Hunter
Water Corporation• the new Department of Land and Water Conservation, which includes the
former departments concerned with Water Resources, Public Works, andConservation and Land Management
• the EPA, which has statutory responsibility for environmental protection, waterquality (through the Clean waters Act) and pollution control (through thePollution Control Act and the Environmental Offences and Penalties Act, 1989).These acts deem pollution of water to be an offence unless licensed by the EPA,and prescribes penalties
• various urban catchment management committees, formed under the CatchmentManagement Act, and the Hawkesbury Nepean Catchment Management Trust,which was formed under its own Act. New legislation is proposed for theestablishment of a Catchment Commission, and
• in many cases the preventative programs relating to stormwater managementneed to be instituted through the land-use planning process which is theresponsibility of the Department of Planning, under the EnvironmentalAssessment and Planning Act.
Regulatory responsibilities for water quality management are defined under the CleanWaters Act. Part 3 of the Act provides a four-level classification, with prescribedwater quality standards for discharges to each classification level. Some ambient waterquality criteria are also set out (for example, faecal coliform density in recreationalwaters). The principal urban areas are classified under this scheme.
Environmental Impact Statements are being prepared on the operation of sewageoverflows from each of Sydney Water’s 36 sewerage systems, as a part of thelicensing process for sewer overflows. The New South Wales EPA will determinelicense conditions, based on an examination of options to be presented in thestatements.
The idea of licensing urban stormwater runoff in the Hawkesbury-Nepean Basin hasbeen canvassed by James et al., (1994). They recognise that it is not feasible todirectly regulate the myriad of urban runoff sources. However, discharge points forstormwater drains could be licensed, as occurs in the USA under the NPDES. Themajor difficulty in this is identifying who actually owns or controls stormwater drains,which often run through several local council areas. Extending NSW regulatory orincentive schemes in the Hawkesbury-Nepean to include urban runoff as well aspossibly extending controls on agricultural runoff and introducing incentive chargeson effluents, would involve the following administrative steps:

132
• establishing a pilot scheme which would involve the Hawkesbury-NepeanCatchment Trust, local councils, the EPA and Sydney Water. Early tasks wouldbe to improve estimates of pollution loads, and to trial a number of controloptions including retention basins, infiltration systems and wetlands. Theauthors acknowledged that the cost and effectiveness of the suggested controlsstill needs to be examined
• the EPA would be required to develop a system of discharge licenses for trunkdrains, including assignment of pollution contributions and complianceresponsibilities to local authority areas within any given drainage system, and
• the local council should be obliged to undertake compliance monitoring.
It is noteworthy that the above suggestions fell short of recommending the creation ofnew stormwater catchment bodies, as is being done in South Australia. Clearly, theauthors felt that the Hawkesbury-Nepean Trust, even if given wider roles and respon-sibilities vis a vis local governments in the basin, was not a suitable target for regu-lation and licensing by the EPA. By contrast, this is exactly what has happened inGermany where catchment bodies, formed from constituent local authorities, are sub-ject to regulation by Lander EPA’s under a polluter pays system.
The issue of appropriate scale for a catchment body in the Sydney region has beenaddressed by Ribbons (1995). Having assessed the likely capital and operating costs ofa system of wetlands and detention basins in the Cabramatta creek catchment,Ribbons concluded that a George’s River Catchment Trust (that is, a body for thewider catchment of which Cabramatta Creek is a tributary) would be a more viableorganisation than one for Cabramatta Creek alone. This would be a similar size oforganisation to the Upper Parramatta River Catchment Trust, and could addressstormwater quality as well as flood control issues. Moreover, by considering thewhole George’s River catchment the danger of ‘overkill’ in a sub-catchment might beavoided.
The New South Wales EPA has been investigating a system of load-based licensing,based on:
• cost modelling to determine compliance costs and charge levels• community consultation• establishment of suitable monitoring systems• extension of licensing systems, and• extension of existing license fee collection systems.
In its licensing functions, the EPA is not unlike the National Rivers Authority, whichlicenses discharges from combined sewer systems in England and Wales. There,catchment plans are developed under the leadership of the NRA itself, so there isdirect feedback from catchment planning and management into licensing policies andpractices. In New South Wales, the relationship of the EPA to the Catchment Trusts isindirect.
The need for coordination at the sub-metropolitan scale is evidenced by the formationof the Sydney Coastal Councils Group in 1989. This consists of fifteen councils with

133
harbour and sea foreshores. The Group recently adopted a four-year forward plan inorder to promote sustainable management of the urban coastal environment. Theprimary objectives are to:
• coordinate and facilitate information exchange• enhance community awareness• expand the role of local government in managing the urban coastal environment• represent the interests of member councils, and• develop and implement strategies for integrated and sustainable management,
including reduction of water pollution and conserving/improving stormwaterand sewage infrastructure.
The Group’s main activities have been:
• preparation of guidelines on regional management of stormwater• design investigations for stormwater pollution interception and treatment• publication of a stormwater pollution control pamphlet aimed at the broader
community, and• submissions to State and Commonwealth governments.
While the Councils’ initiative in setting up the Group is laudable, the questionremains as to whether such a voluntary association has the necessary statutory andfiscal powers to fully implement appropriate stormwater management programs: forexample, in relation to the implementation of economic instruments for pollutionreduction at source or in relation to financing expenditure on pollution abatementprograms.
19.3.3 Northern TerritoryIn the Northern Territory, responsibility for all water management functions rests withthe Power and Water Authority. Given the relatively small size of Darwin and AliceSprings and the development stage of the Territory this probably remains the approp-riate institutional framework.
19.3.4 QueenslandIn Queensland responsibility for stormwater management lies with local government.However, there is a severe mismatch between catchment areas and local governmentareas. Typically, a catchment will include a number of local government areas. Histor-ically, local governments have been responsible for drainage management, with theQueensland government playing a major role in floodplain management. In future,local governments will need to provide stormwater management plans for urban areaswhich deal with both quantity and quality. The Queensland Department of Environ-ment and Heritage will provide guidelines for urban stormwater management tosupport the proposed Environmental Protection (Water) Policy requirements.
Most urban wastewater discharges to the receiving environment will be licensed underthe Environmental Protection Act 1994. The Department of Primary Industries pro-vides water resource management functions for rural areas (that is, integrated catch-ment management).
134
19.3.5 South AustraliaStormwater management arrangements in South Australia have been summarised byRolls (1995). Responsibility for floodplain and watercourse management lies almostentirely with local government, under the Local Government Act 1932. The Stategovernment has assumed responsibility for these functions in the Murray, North Paraand Little Para Rivers, following proclamation under the Water Resources Act 1990.There are 119 local government Councils in the State, serving a population of 1.4million. The state has subsidised drainage related works through a Drainage SubsidyScheme established in 1967.
Although this scheme included an Advisory Committee, arrangements were notconducive to the integrated, multi-objective management of stormwater. Totalexpenditure under the scheme was modest, many local authorities lacked the neces-sary skills and experience to undertake stormwater planning, and hardly any of thelocal government boundaries coincided with catchment boundaries. Recognising thelimitations of these arrangements, several local authorities banded together to formdrainage management bodies. These were constituted formally as controlling Authori-ties under Section 200 of the Local Government Act 1932. But they saw their functionto be drainage and flood control, rather than general resource managers, and theiractivities were not well integrated with land use planning. The result was thatintegrated stormwater management was not achieved, and there are many examples ofsingle-purpose, single-agency works. Opportunities for stormwater detention, re-useand naturalisation of tributaries have been wasted.
South Australia is currently implementing a new Catchment Water Management Act,the major features of which are as follows:
• Catchment management boards, which are statutory authorities responsible tothe Minister for the Environment and Natural Resources, are to be established.
• Membership is to be determined according to the number of local authorities inthe catchment. The chair is to be nominated by the State Minister in consultationwith the President of the Local Government Association; with an equal numbersof nominees from Councils and by the Minister.
• Board areas are to be whole catchments.• Board responsibilities shall cover all water resource management functions,
including allocation, as well as stormwater management.• Boards must develop catchment management plans, to be reviewed annually• Funding is to be partly from State government, but also to include a contribution
form the constituent Councils, through a levy on ratepayers.
Initially, Catchment Management Boards are to be established for the Torrens andPatawalonga Catchments, which have the highest community profile in terms of theirwater quality problems. Responsibility for the Drainage Subsidy scheme is to betransferred to the Minister for the Environment and Natural Resources.
19.3.6 TasmaniaStormwater management in Tasmania is the responsibility of local authorities. To datethese have concentrated issues of wastewater disposal rather than improved storm-water management.

135
19.3.7 VictoriaResponsibility for stormwater management in the Melbourne region currently restswith Melbourne Water. Melbourne Parks and Waterways shares responsibility inrespect of certain areas under its designated control. Under the Victorian TotalCatchment Management Program there is also a TCM group for the whole of theMelbourne Region.
There have been some successful initiatives in the Melbourne region, especially withregard to quantity management. Condina and Thompson (1993) give two exampleswhich deserve special mention:
• Delineation of the 1 in 100 year floodplain of the Dandenong Creek catchment(population 800 000), and protection of major remnant portions through flood-plain declarations. The floodplains now provide considerable stormwaterstorage, minimising the need for stream levees, providing formal and informalrecreational opportunities and opening up the possibility of further potential forstormwater quality improvement.
• Provision of Drainage Strategies for the South East Growth Areas of Melbourne.These plans are prepared at the greenfields stage, and provide: layouts for theproposed drainage system; inventorisation of physical drainage infrastructurerequired; delineation of overland flow paths; identification of recreational areas;identification of water quality treatment areas; floodplains and fill levels; andfinally plans for retention of natural waterways, natural storage zones, wetlandsand indigenous vegetation.
19.3.8 Western AustraliaSince the early part of this century responsibility for drainage has been shared betweenwater agencies of the State Government and local government. The legislation pertain-ing to the state agency has been enabling rather than directive in nature, and involve-ment by the Water Authority and its predecessors in providing drainage has beennegotiated with local governments. In recent decades the Water Authority has provid-ed main drainage schemes for new developments, following involvement in the plan-ning process. Local authorities have supplied subsidiary and minor drainage facilities.
From 1982 the Water Authority, and its predecessor the Metropolitan WaterAuthority, held statutory responsibility for developing the “Arterial Drainage Scheme”for Perth, and this responsibility was carried forward to the Water Bill 1990. Follow-ing the recent corporatisation of the Water Authority, responsibility for urban storm-water management, together with relevant staff, has been transferred from the formerDrainage Branch into a new Water Resources Commission.
The legislation which established the Arterial Drainage Scheme in 1982 referred to theneed for multiple objective planning of drainage, including management of waterresources and the natural environment. But it was not until the early 1990s that watersensitive urban design principles enunciated more integrated approaches and extendedthe concept of ‘drainage’ to total system design in new developments. WesternAustralia was an early participant in the development of water-sensitive urban designprinciples, and this is now being reflected in current approaches to the planning ofnew urban areas to the north and south of Perth.
136
However, the institutional structure remains one based on the planning and manage-ment of natural resources at the State Government level. Surface water catchmentshave not been adopted as a basis for statutory catchment management bodies involv-ing local government.
The catchment areas of the Swan-Avon River/Swan Estuary and two of its importanttributaries, Ellen Brook, and the Canning River are of special significance for thequality of waterways in the Perth Metropolitan Area. Urban consolidation in the Perth-Guildford axis will increase the quantity and range of stormwater contaminants enter-ing the Swan Estuary, and this is likely to widen pollution concerns to litter andtoxics, as well as the present focus on nutrients. The Canning River system is visiblyunder pressure from additional urbanisation in the last decade.
While local groups based on community input have been encouraged, for example theBayswater Main Drain group, and the Swan-Avon Catchment group, arrangements forintegration with statutory land use planning, local government and water resourcemanagement at the level of the whole catchment have been ad hoc.
An area of great importance in Perth is the effects of urbanisation on the groundwaterresources of the Swan Coastal Plain. This has recently been the subject of a Parlia-mentary Inquiry, and Environmental Protection Plans. While the natural phenomena inthis case are local drainage and infiltration to groundwaters, the objectives andprinciples of management are strongly akin to those required in urban stormwatermanagement generally.
The Shire of Wanneroo, in the north western corridor, is the fastest growing localauthority in the Perth Metropolitan Area. It has established a sub-committee dealingwith groundwater and lakes management to address these problems. The Shire ofSerpentine–Jarrahdale in the south eastern corridor faces somewhat different problemsdue to winter ponding of surface runoff on its clay soils. It has been developing awater-sensitive design approach for urban village development that will eventuallyaccommodate some 60 000 people. But institutional arrangements for managementremain complex.
19.4 Conclusion
While the application of the principles for institutional development so far enunciatedand accepted by COAG is necessary, the principles are not in themselves sufficient forimproved stormwater management. Specifically:
• the respective roles of local governments, catchment bodies, state and territoryenvironmental regulators and natural resource managers need to be bothconsistent and clear
• stormwater catchment bodies should have statutory powers and responsibilities,including powers to raise funds and undertake works and other expendituredeemed necessary
• local government should be formally involved

137
• the roles and responsibilities of catchment bodies need to include preparation ofcatchment management plans which (i) identify catchment conditions requiringattention, (ii) list possible management responses, (iii) specify a stormwatermanagement program which identifies costs, timelines and the agencies whichare to be made responsible for each action, and
• catchment bodies should be empowered to set up contractual undertakings byother organisations in the public or private sectors to carry out the catchmentmanagement program.
Within most jurisdictions there is a need for extensive reform of the institutional structures for storm-water management. to complement the corporatisation of water utilities. While the application of theprinciples for institutional development so far enunciated and accepted by COAG is necessary, theprinciples are not in themselves sufficient for improved stormwater management.
A new approach must separate powers and responsibilities. The success of any one institutional form isbound by several factors, including:
• clear definition of roles and responsibilities• motivational factors at corporate and individual level• workable implementation mechanisms• technical and financial backup, and• clear perception in the community about the nature of the resource management problem and how it
can contribute.
Specifically:• the respective roles of local governments, catchment bodies, state and territory environmental
regulators and natural resource managers need to be made both consistent and clear• stormwater catchment bodies should have statutory powers and responsibilities, including powers to
raise funds and undertake works and other expenditure deemed necessary• local government should be formally involved• the roles and responsibilities of catchment bodies need to include preparation of catchment manage-
ment plans which (i) identify catchment conditions requiring attention, (ii) list possible managementresponses, (iii) specify a stormwater management program identifying costs, timelines and theagencies which are to be responsible for carrying out each required action, and
• catchment bodies should be empowered to set up contractual undertakings by other organisations inthe public or private sectors to carry out the catchment management program.
All jurisdictions need to further develop urban stormwater management in ways that are:• programmatic• catchment-based• involve local government• include a mixture of structural and non-structural tools, and• emphasise source controls.
In all jurisdictions the statutory objectives of stormwater management bodies should include floodmanagement, water quality, environmental amenity and ecological integrity. Stormwater managementtargets should be set with reference to the National State of the Environment Reporting System.

138
There is a need for stormwater management to be undertaken at either the metropolitan scale, or at themajor urban catchment scale. The principle of separation of powers and responsibilities, and thehistorical and potential future roles of local governments, imply that bodies established for this purposeshould be preferably owned by local governments and be accountable to environmental regulators atstate/territory level for the achievement of agreed targets within a polluter pays framework. Urbancatchment management bodies should have the power to obtain revenue either from local governmentor through direct charges on households and organisations in the private and public sectors, to employrelevant staff and to commission works. They should also have the power to institute stormwatermanagement bye-laws, including those related to the introduction of economic instruments. They shouldpublish annual reports of their operations and planning activity.
Where not already available, stormwater management programs should be established for all majorurban catchments. These should:
• summarise information on catchment conditions,• articulate the existing management priorities of the managing authority• identify issues• identify possible future management responses, detailing agency, urgency and timing• put in place a consultation process that should lead to better coordination of policies among the
various actors who influence the catchment uses and condition, and• provide a framework for multi-functional planning.
A water quality strategy should involve the:
• designation of water uses and conservation values a basis for determining permissible uses andmanagement practices
• identification of the level of water quality which would support the acceptable uses• provision of sewage and stormwater infrastructure that would be responsive to the protection of in-
stream uses and conservation values, and• integrated, total catchment-based planning and management.
The Commonwealth should support a new Urban Water Care Movement. Initial components couldinclude:
• a public awareness campaign ($2 million/yr for 3 years)• educational materials ($2 million/yr for 3 years)• support for community groups in urban catchments ($2 million/yr for 3 years)• loan scheme for local authorities engaging in urban catchment management programs ($5 million /yr
for 10 years) and• capital grants for minor capital works which demonstrate pilot schemes; and management methods
for water reclamation and integrated stormwater management ($20 million/yr for 5 years).
20. RESEARCH NEEDS
This section highlights a number of areas where the study has suggested the need forfurther research, or changes in research arrangements. These are given below withoutfurther supporting text. The recommendations are not intended to cover all researchneeds that relate to the very wide topics dealt with in the report, but only to express anumber of salient requirements.

139
The Commonwealth should set up a new Research and Development Corporation for the UrbanEnvironment, including the urban water environment. It should deal with issues of urban water cyclemanagement, water pollution, air pollution, energy use and waste management. The budget should besimilar in size to that of the Land and Water Resources Research and Development Corporation, whichis focussed on non-urban resource management issues.
There is an urgent need for a national research project to examine options for improved urban watercycle management and infrastructure cost reduction. This should be supported by the Commonwealth inassociation with the Water Services Association of Australia.
Research into Australian microbiological species that may be associated with water reclamation projectsshould be encouraged.
A national survey of community attitudes and knowledge of issues relating to water re-use is needed asa basis for planning further community involvement in water re-use planning and implementation.
There is a growing need for environmental economic studies that (i) demonstrate the community’swillingness to pay for improved water quality in urban regions, (ii) provide estimates of environmentaldamages associated with the degradation of sensitive environments, and (iii) develop indicativeestimates of the cost schedule for ascending levels of abatement.
Further research is needed into the hydrological and ecological implications of effluent and stormwaterdischarges in sensitive environments.
Research into methods of storage and of seasonal demand equalisation for reclaimed water should besupported.
A case study in a newly-developing urban region should be supported by the Commonwealth in whichconcepts and prototype designs for integrated urban water resources management are demonstrated.This could be a world-first.

140

141
21. BIBLIOGRAPHY
Abbott, J. (1993). Land Treatment of MunicipalWastewater at Albany, NSW. Poster Papers, 3,784–790.
ACT Electricity and Water (1994a). ACT FutureWater Supply Strategy: Our Water Our Future,ACTEW, Canberra.
ACT Electricity and Water (1994b). AnnualReport 1993–94 ACTEW, Canberra.
Aitken, C. (1995). Benchmarking and BestPractice for Urban Waterway Management.Research Report No 87. Urban Water ResearchAssociation of Australia, Melbourne. ISBN1 875298 91 6.
ANZECC Working Group (1994). ANZECCWorking Group on Pollution and ShippingIncidents.
Arar, A. (1991). Wastewater Reuse for Irrigationin the Near East Region. Water Science andTechnology 23, 2127–2134.
Argue, J. R. (1995). Towards a UniversalStormwater Management Practice for AridZone Residential Developments. In:‘NOVATECH 2nd International Conference onInnovative Technologies in Urban StormDrainage, Lyon, May–June 1995. Groupe deRecherche Rhone-Alpes sur les Infrastructureset l’Eau,Villeurbanne, France. pp. 27–35. ISBN2 9509337 0 X.
Ashbolt, N., Grohmann, G., Kueh, G. (1993).Impact of Deepwater Ocean Outfalls on FaecalViruses and Bacteria in Coastal Waters ofSydney. Paper presented at the AustralianWater and Wastewater Association FederalConvention, Gold Coast, Queensland.
Austin, T. (1992). From Sludge to BrokeredBiosolid. Civil Engineering, 62 (8), 33–35.
Australian Institute of Urban Studies (1993).Urban Wastewater: A Lost Resource or anOpportunity. Proc. Seminar held at the QualityLangley Hotel, Perth, 17 August 1993. AIUS,Perth.
Badani, V. (1993). Greener Greens withReclaimed Water. Water Environment &Technology 5(4), 22.
Balades, J.D., Chantre, P. (1990). Urban StormDrainage and Compensating Techniques: TheExperience in Bordeaux, France. InternationalConference on Urban Drainage, Osaka, Japan.International Association for Water Quality.
Beavers, P. (1995). Projects Related to Waste-water Management Strategy. Letter andattachments dated 16 February, 1995. Ref No94/25109, QDPI, Brisbane.
Beavers, P. (1993). Guidelines for the use ofBiosolids – The Queensland Scene.Queensland Department of Primary Industries– Water Resources. Water, December.
Bender, P. (1992). Sludge Management: OneCity’s Long Term Plan. Water and WastewaterInternational 7(4), 29–31.
Bennett, B. (1993). Green Forests and CleanRivers: Smart sewage use on trial at Wagga.Ecos no. 77 (Spring 1993), 14–17.
Bingley E.B. (1994). Greywater Reuse Proposalin Relation to the Plamyra Project. WorkshopPapers on Localised Treatment and Recyclingof Domestic Wastewater. Murdoch University,Perth, Western Australia.
Boland, D.S., Edmonds, L.(1995). WoodmanPoint Effluent Reuse Project: Industrial GradeWater Supply Demonstration Treatment Plants.Proceedings, Australian Water and WastewaterAssociation 16th Federal Convention, 2–6 April1995, Sydney, NSW, vol. 2, pp. 549–554.Australian Water and Wastewater Association,Artarmon, NSW, 1995. ISBN 0646230913.
Borough, C., Johnson, R. (1990). Agroforestry –Creating an environmental asset from aneffluent disposal problem. Paper presented atthe Effluent Reuse Conference, WollongongUniversity, 13–16 February 1990.
Bouwer, H. (1992). Reuse Rules. CivilEngineering 62(7), 72–79.
Bouwer, H. (1991). Ground Water Recharge WithSewage Effluent. Water Science & Technology23 (10–12), 2099–2108.
Brodie, J. (1994). Management of SewageDischarges in the Great Barrier Reef MarinePark. In: O. Bellwood (ed), ‘The Sixth PacificCongress on Marine Science and Technology,4–8 July 1994’ (PACON '94). James CookUniversity of North Queensland, Townsville.
Brodie, J. (1991). Urban Impact on the GreatBarrier Reef. In: ‘Land Use Patterns andNutrient Loading of the Great Barrier ReefRegion’. D. Yellowlees (ed), James CookUniversity, Townsville, pp. 18–26.
Brodie, J, Steven, A, McGill, R (1994). Spatialand Temporal Trends in Chlorophyll in Watersof the Great Barrier Reef Marine Park. In: O.Bellwood (ed), ‘The Sixth Pacific Congress onMarine Science and Technology, 4–8 July 1994’(PACON '94). James Cook University,Townsville.

142
Bryan, A., Gardner, T., and Beavers, P. (1994).Sewage Effluent Generation, Disposal and Re-use in Queensland: a survey of currentpractices, Project Report Series Q94034,Queensland Department of Primary Industries,Brisbane.
Camp Scott Furphy Pty Ltd (1993). EWSDepartment: Strategies for the FutureOperation of the Bolivar Wastewater TreatmentPlant. CMPS&F Pty Ltd, South Australia.
Camp, Dresser and McKee (1992). ManualGuidelines for Water Re-use. United StatesAgency for International Development ReportEPA/625/R-92/004. United StatesEnvironmental Protection Agency,Washington.
Camp, Dresser and McKee Inc (1987). A WhitePaper: Urban Water Re-use in the City of StPetersburg: Water Quality and Public HealthConsiderations. City of St Petersburg, Florida.16 pp.
Camp Scott Furphy (1993). EWS Department:Strategies for the Future Operation of theBolivar Wastewater Treatment Plant. CMPS&FPty Ltd.
CEPA (1993). Urban Stormwater – A ResourceToo Valuable to Waste. Discussion paperissued by the Commonwealth EnvironmentProtection Agency, February 1993.
Chandler, J. (1994). Integrated CatchmentManagement Planning. The Institution ofWater and Environmental Management 8 (1).
Chin, K., Ong, S. (1992). Experience of Non-potable Reuse of Wastewaters. Water Science &Technology 26 (7–8), 1565–1571.
Chin, K., Ong, S. (1991). A Study of Reclamationof Sewage for Industrial Waters. Water Science& Technology 23 (10–12), 2181–2187.
Christova-Boal, D., Eden, B., McFarlane, S.(1994). An Investigation into Greywater Reusefor Urban Residential Properties. WorkshopPapers on Localised Treatment and Recyclingof Domestic Wastewater, 30 November 1994,Murdoch University, Perth, Western Australia.
Clark, R. (1995). Diseconomies of scale in urbanwater infrastructure. CSIRO Division of WaterResources Draft Report (unpublished).
Clark, R.D.S., (1992). Improved WaterManagement in Schools – Putting Theory intoPractice. 13th National Conference ofAustralian Geography Teachers Association,1–17 January 1992. Adelaide.
Clifforde, I.T., and Morris, G. (1995). The UKresponse to the challenge of urban stormwatermanagement. In: Proc. ‘NOVATECH – 2nd Int.Conference on Innovative Technologies inUrban Storm Drainage’, Lyon, France, May 30– June 1, 1995. Groupe de Recherche Rhone-
Alpes sur les Infrastructures et l’Eau,Villeurbanne, France.
Collett, L., Stone, A., and Brown, D. (1993).Backyard to the Bay. Catchment impacts. TheUrban Water Challenge. Melbourne Parks andWaterways, Melbourne. ISBN 0 7306 4801 X.
Commonwealth of Australia (1995). Techniquesto Value Environmental Resources: AnIntroductory Handbook. Published as a jointexercise by the Commonwealth Department ofthe Environment, Sport and Territories, theCommonwealth Department Finance, and theResource Assessment Commission. AustralianGovernment Publishing Service, Canberra.
Condina, P., and Thompson, D.G. (1995). UrbanStormwater Management: Past Practices,Future Trends. Melbourne Water, Melbourne.
Conklin, S., Dunivin, W., Herberg, J., and Leslie,G. (1995). Advanced Water Treatment UsingMicrofiltration and Reverse Osmosis ReclaimsSecondary Effluent in Orange County,California. Warren Johnson, Memtec Ltd.
Conservation Commission of the NorthernTerritory (1994). Conservation Commission ofthe Northern Territory Annual Report 1994.
Consulting Environmental Engineers (1994).Environmental Factors for Waste WaterRecycling Pilot Scheme at Southwell Park,Canberra (Preliminary Assessment Report).ACTEW, Canberra.
Council of the City of Shoalhaven (1995). TheNext Step: Planning for the St GeorgesBasin/Jervis Bay Regional Effluent Manage-ment Scheme is progressing well.
Department of Environment and LandManagement. (1994). Guidelines for re-use ofwastewater in Tasmania. Division ofEnvironmental Management, The Departmentof Environment and Land Management,Hobart.
Department of Environment and LandManagement (1993). The State of theEnvironment Report for South Australia, 1993.Community Education and PolicyDevelopment Group, The Department ofEnvironment and Land Management,Adelaide.
Department of Environmental ProtectionWestern Australia. (1994). Annual Report1993–94. Perth.: Department of EnvironmentalProtection.
Department of Primary Industries and Energy.(1991). Review of Effluent Disposal Practices.(Water Management Series 20). AustralianWater Resources Council, Canberra.
Department of Primary Industries and Energy(1987). 1985 Review of Australia’s WaterResources and Water Use, vol. 2: Water Use

143
Data Set. Australian Government PublishingService, Canberra.
DEST (1994). State of the Environment Report:Framework. Department of the EnvironmentSport and Territories, Canberra.
Dillon, P.J., Hickinbotham, M.R. and Pavelic, P.(1994). Review of International Experience inInjecting Water into Aquifers for Storage andRe-use. In: ‘Water Down Under’, Proceedingsof International Association of Hydrogeologistsand Institute of Australian Engineers, AdelaideConvention Centre, 21–25 November 1994. pp.13–19.
Dillon, P., and Pavelic, P. (1995). Draft Guide-lines on the Quality of Stormwater and TreatedWastewater for Injection into Aquifers forStorage and Re-Use. Centre for GroundwaterStudies, Report No. 63, CSIRO Division ofWater Resources, Adelaide. ISBN 1 875753 12 5.
Dodds, A.A., Fisher P.J., Paull A.J., and Sears J.R.(1993). Developing an appropriate wastewatermanagement strategy for Sydney’s futureurban development. Water Science andTechnology 27(1), 19–29.
Dowsett, B., Mather, G., Mercer, C., Pearson, B.,and Vincent, D. (1995). A New Course forSydney Water: The Final Report of the SydneyWater Project. Friends of the Earth, Sydney.ISBN 0 646 23121 9.
Eden, B. (1994). Wastewater Reuse: Limitationsand Possibilities. Workshop papers on Local-ised Treatment and Recycling of DomesticWastewater, 30 November 1994. MurdochUniversity, Perth, Western Australia.
Ellis, J.B. (1995). Sustainable IntegratedDevelopment of Storm Drainage in UrbanLandscapes. In: ‘NOVATECH – 2nd Inter-national Conference on Innovative Technol-ogies in Urban Storm Drainage’, Lyon, May–June 1995. Groupe de Recherche Rhone-Alpessur les Infrastructures et l’Eau, Villeurbanne,France. pp. 19–25. ISBN 2-9509337-0-X.
Engineering and Water Supply Department(1994a). Expression of Interest No. 130/94: ToUtilise the Stabilisation Lagoons at the BolivarWastewater Treatment Plant in a Beneficial andEcologically Sustainable Manner. EngineeringServices Group, E&WS, South Australia.
Engineering and Water Supply Department(1994b). Country Wastewater Treatment Plants,Reclaimed Water Management Plan StatusReport. Wastewater Treatment Unit,Engineering Services Group, E&WS, SouthAustralia. ISBN 0 7308 4542 7.
Engineering and Water Supply Department(1994c). Metropolitan Wastewater TreatmentPlants, Reclaimed Water Management PlanDiscussion Paper. Engineering Services Group,E&WS, South Australia.
Engineering and Water Supply Department(1993). The Paddocks: Stormwater – ACommunity Resource. E&WS Report No.93/11, prepared by Hydrology Unit, WaterResources Branch, Engineering and WaterSupply Department, South Australia., ISBN0 7308 3937 0.
Environmental Protection Authority &Department of Conservation and NaturalResources (1994). Reforming Victoria’s WaterIndustry: Effluent Standards and Compliancefor Waterways. State Government of Victoria,Melbourne.
Environmental Protection Agency (1994). Codesof Practice for Various Sectors. Paper presentedat ‘What’s Happening to Stormwater in SouthAustralia’, 15 February 1994. Urban WaterResource Centre, University of South Australia.
Environmental Protection Authority, New SouthWales (1993a). Discharge to Ocean Waters.Environment Protection Authority, Chatswood,NSW.
Environmental Protection Authority, New SouthWales (1993b) New South Wales State of theEnvironment, 1993. Chatswood, NSW.
Environment Protection Authority (Victoria) andDepartment of Conservation and NaturalResources Victoria. (1994). Effluent Standardsand Compliance for Waterways. EnvironmentProtection Authority (Victoria) and Departmentof Conservation and Natural ResourcesVictoria, Melbourne.
Environmental Protection Authority. (1993).Western Australian Water Quality Guidelinesfor Fresh and Marine Waters (Draft Guide-lines). Bulletin 711. Environmental ProtectionAuthority, Perth.
Evangelisti & Associates and Landvision (1994).Stormwater Management Strategy and Plansfor Byford and Mundijong Incorporating WaterSensitive Design Principles. Evangelisti andAssociates, Perth. ISBN 0 7309 722 4.
Fagan, P., Miskiewicz, A., Tate, P. (1992). AnApproach to Monitoring Sewage Outfalls: ACase Study on the Sydney Deepwater SewageOutfalls. Marine Pollution Bulletin 25(5–8),172–180.
Fisher, P., Stricker, J. (1992). ConstructedWetlands Systems in Water Pollution Control.Paper presented at ‘Catchments of Green: aNational Conference on Vegetation and WaterManagement’, 23–26 March, Adelaide.
Flood, P., Street, A., O’Brien, P., and Hayman, J.(1994). Mycobacterium ulcerans Infection onPhillip Island, Victoria. Letters to the Editor,Medical Journal of Australia 160.

144
Florida Department of Environmental Protection(1991). Guidelines for Preparation of ReuseFeasibility Studies for Applicants HavingResponsibility for Wastewater Management.Tallahassee, Florida.
Forsyth, J.R.L. (1993). The microbiologicalquality of water: a background to discussions.Water, April 1993, pp. 12–16.
Foundation for Water Research, UK (1994).Assessing the Benefits of River Water QualityImprovements. Interim Manual. Foundation forWater Research, Marlow, Bucks, UK.
Fuqua, T., Bowen, P., Ortiz, R. (1992). Usingreclaimed water for shallow aquifer recharge.Desalination 88, 243–252.
Gardner, B. (1992, 23–25 March 192). Nutrientsand Heavy Metals in Wastewater – TheirUptake and Interaction with Pasture and Soil.Paper presented at the Catchments of Green: aNational Conference on Vegetation and WaterManagement, Adelaide.
Gardner, T., Bryan, A., Hu, X., Gordon, I., andBeavers, P. (1993). Land Disposal of SewageEffluent in Queensland: A Survey of CurrentPractice and Future Opportunities. AWWARegional Conference, ‘Grey Issues, ClearSolutions’, November 1993, Caloundra,Queensland.
Geiger, W.F., Dreiseitl. (1995). Neue Wege furdas Regenwasser. Handbuch zum Ruckhaltund zur Versickerung von Regenwasser inBaugebieten. R. Oldenbourg Verlag GmbH,Munich.
Gibbs, R.A., Ho, G.E., Unkovich, I., Rule, H., andLugg, R. (1993). Pathogens in WastewaterSludge. Australian Water and WastewaterAssociation 15th Federal Convention, 18–23April 1993, Gold Coast, Queensland. 2, 355–363.
Gibert, J., Maheepala, S. (1995). Decision SupportSystem for Integrated Planning and Manage-ment of Urban Water System. In: Proc. SecondInternational Symposium on Urban Storm-water Management, Melbourne, July 1995.National Committee on Water Engineering,Institution of Engineers, Australia. NCP No95/03.
Gobbie, M.R. (1991). Metropolitan AdelaideSewage Sludge Management Plan. AustralianWater and Wastewater Association 14thFederal Convention, 17–22 March 1991, Perth,Western Australia, pp. 401–408.
Gobbie, M. et al., (1991). Strategies for FutureOperation of Glenelg Wastewater TreatmentPlant.
Goldstein, N. (1992a). Beneficial Reuse AnchorsShift from Sea to Land. Biocycle 33(4), 36–49.
Goldstein, N. (1992b). Building the Infrastructurefor Sludge Reuse. Biocycle 33(3), 58–60, 62.
Government Pricing Tribunal of New SouthWales (1993a). Report of the Working Party onWater, Wastewater and Stormwater Demand:Engineering and Cost Issues. Discussion PaperNo 2. Government of New South Wales PricingTribunal, Sydney.
Government Pricing Tribunal of New SouthWales (1993b). Inquiry into Water and RelatedServices. Government Pricing Tribunal of NewSouth Wales, Sydney.
Gresh, H., Henson, J. (1993). Banking on WaterRights. Water Environment & Technology 5 (2),36–37.
Gutteridge, Haskins & Davey Pty Ltd (1994).Strategies for the Future Operation of theChristies Beach Wastewater Treatment Plant.Melbourne.
Gutteridge, Haskins & Davey Pty Ltd., (1993).Nutrient Removal Strategy for SewageTreatment Plants in the Murray Darling Basin.(Preliminary Report R3337). Public WorksDepartment.
Gutteridge, Haskins & Davey Pty Ltd., (1992).CH2M HILL. An Investigation of NutrientPollution in the Murray Darling River System.Report prepared for the Murray Darling BasinCommission, Canberra. Ref No. 311/1048/0504.
Hamann, C., McEwen, B. (1991). Potable WaterReuse. Water Environment & Technology 3 (1),74–80.
Hamilton, G. and Greenfield, P.F. (1991). PotableReuse of Treated Wastewater. Australian Waterand Wastewater Association 14th FederalConvention, 17–22 March 1991, Perth, WesternAustralia, pp. 497–506.
Hanley, J., Couriel, D. (1992). Coastal Manage-ment Issues in the Northern Territory: AnAssessment of Current and Future Problems.Marine Pollution Bulletin 25, 134–142.
Hanna, D. et al. (1994). Nutrient, Solute andWater Distribution in an Australian NativeHardwoods Plantation Irrigated with Reclaim-ed Water from Bolivar Sewage TreatmentWorks. Paper presented at ‘Water Down Under'94’, Adelaide, 21–25 November 1994.
Hanna, D. et al. (1992). Early Performance ofEffluent Irrigated Hardwood Plantations atBolivar, South Australia. Paper presented at theCatchments of Green: a National Conference onVegetation and Water Management, Adelaide,23–26 March 1992.
Harris, G., Batley, G., Fox, D., Hall, D., Jernakoff,P., Molloy, R., Murray, A., Newell, B., Parslow,J., Skyring, G., Walker, S., (1996). Port PhillipBay Environmental Study, Summary and FinalReport. CSIRO, Canberra.
Hartley, K.J., Swanson, T.J.B., Grynberg, H.,Edmonds, L., and Vaughan, R. (1991). Effluent

145
Re-use for Industrial Cooling Water inKwinana. Australian Water and WastewaterAssociation 14th Federal Convention, 17–22March 1991, Perth, Western Australia, pp. 440–447.
Hickinbotham, M. (1994). A Survey of WaterReclamation and Reuse. South Australia.Hickinbotham Group.
Higgins, P.J. (1995). Performance Testing of aFlow Controller for at Source BMPs. In:‘NOVATECH 2nd International Conference onInnovative Technologies in Urban StormDrainage, Lyons, May–June 1995’. Groupe deRecherche Rhone-Alpes sur les Infrastructureset l’Eau, Villeurbanne, France, pp. 627–630.ISBN 2-9509337-0-X.
Hunter, D., Smith, W., Nagy, L., and Jacob, P.(1993). Regional Development Implications ofWastewater Re-use: Werribee Case Study, No.70. Melbourne Water Corporation, Melbourne.
Industry Commission. (1994). Draft Report:Water Resources and Wastewater Disposal.Industry Commission, Canberra.
Jackson, J., Cross, P. (1993). Citrus Trees Blossomwith Reclaimed Water. Water Environment &Technology 5(2), 27–28.
James, D. et al., (1994). Using economicinstruments to control pollution in theHawkesbury–Nepean. Report No 94/19. NewSouth Wales Environmental ProtectionAuthority, Chatswood. ISBN 0 7310 1221 6.
Jeppesen, B.(1994). Domestic Greywater Re-use:Australia’s Challenge for the Future. WorkshopPapers on Localised Treatment and Recyclingof Domestic Wastewater, 30 November 1994.Murdoch University, Perth WA.
Jeppesen, B. and Solley D. (1994) DomesticGreywater Re-use: Overseas Practice and itsApplicability to Australia. Urban WaterResearch Association of Australia, ResearchReport.
Jorgensen, M., Schilling, W., and Harremoes, P.(1995). General Assessment of Potential CSOReduction by Means of Real Time Control. In:‘NOVATECH 2nd International Conference onInnovative Technologies in Urban StormDrainage’, Lyon May–June 1995. Groupe deRecherche Rhone-Alpes sur les Infrastructureset l’Eau, Villeurbanne, France. pp. 85–92. ISBN2-9509337-0-X.
Kanarek, A., Aharoni, A., Michail, M. (1993).Municipal Wastewater Reuse Via Soil AquiferTreatment for Non-Potable Purposes. WaterScience & Technology 27, 53–61.
Kayaalp, N.M. (1994). Regulatory Framework inSouth Australia and Reclaimed Water ReuseOptions and Possibilities. Workshop paper onLocalised Treatment and Recycling of DomesticWastewater, 30 November 1994, MurdochUniversity, Perth, Western Australia.
Kennedy, A. (1992). Irrigated Winery WoodlotCase Study. Paper presented at Catchments ofGreen: a National Conference on Vegetationand Water Management, Adelaide, SA, 23–26March 1992.
Keary, J. et al., (1995). Challenges in Water Policyand Legislation. Paper presented at ‘WaterResources, Law and Management in WesternAustralia’. Perth, WA.
Kindzierski, W.B. and Gabos, S (1994). HealthEffects Associated with Wastewater Treatment,Disposal and Reuse. Water EnvironmentResearch 66 (4), 651–655.
Kinhill (1993). Virginia Pipeline Scheme:Preliminary Commercial Investigation. KinhillEngineers Pty Ltd, South Australia.
Kinhill, Metcalf & Eddy. (1994). Engineeringand Water Supply Department Strategies forthe Future Operation of the GlenelgWastewater Treatment Plant. Kinhill Metcalf &Eddy, Parkside, South Australia.
Kiya, F. and Aya. H. (1991). Trends andProblems of Wastewater Reuse Systems inBuildings. Water Science and Technology 23,2189–2197.
Kuribayashi, S. (1991). Reuse of TreatedWastewater in an Artificial Stream (‘Seseragi’)in Kawasaki City, Japan. Water Science &Technology 23, 2209–2214.
Lakey, R. (1978). A Pilot Study of GroundwaterRecharge at Carrum Using Treated Effluent.Geological Survey of Victoria, Report No 56,Melbourne.
Lang, A.C. (1994). A Review of Domestic Re-usein Australia, Melbourne Water, EnvironmentalManagement and Technology Division,Research Report 2, June 1994.
Law, I.B. (1993). Potable Reuse: Should it not beConsidered More Fully? Australian Water andWastewater Association 15th FederalConvention, 18–23 April 1993, Gold Coast,Queensland, pp. 542–547.
Lechte, P., Shipton, R., and Christova-Boal, D.(1995). Installation and Evaluation of DomesticGreywater Re-use Systems in Melbourne. In:Proc. 16th Federal Convention, vol 2, pp. 91–98,Australian Water and Wastewater Association;Artarmon, NSW. ISBN 0 646 23091.
Legeas, M., Carre, J., Merot, Ph. (1992). Effect ofWastewater Injection on Groundwater Quality.Water Science & Technology 25 (12), 283–286.
Lever, M. (1993). Sustainable WastewaterManagement. Wastewater Management &Environment (November 1993), pp. 50–53.

146
Ling, A., Dennis, P. (1992). The Establishment ofArtificial Wetlands and Woodlots for Disposalof Municipal Effluent in the Lower HunterValley, NSW. Paper presented at ‘Catchmentsof Green’, a National Conference on Vegetationand Water Management., Adelaide, SA, 23–26March 1992.
Los Angeles County Sanitation District (1994).Sewer Mining by Los Angeles County Sani-tation District, California, USA.
McCotter, M. (1993). St Georges Basin/JervisBay Regional Effluent Management SchemeOptions Report Summary. NSW: Public WorksDepartment, Shoalhaven City Council.
McKie, C., Clements, J. (1991). TreatedWastewater Recycling and Disposal to Land ata Petrochemical Plant. Paper presented at theAustralian Water and Wastewater Association14th Federal Convention, Perth, WA., 17–22March, 1991.
Melbourne Water (1994). Melbourne WaterEnvironmental Performance Report 1993–1994.Melbourne, Victoria.
Melbourne Water (1992a). Melbourne WaterResources Review: Interim Report. TheAuthority, Melbourne, Victoria.
Melbourne Water (1992b). Plenty ValleySewerage and Drainage Strategy, Draft Report,The Authority, Melbourne, Victoria.
Millin, P., Heritage, A. (1992). Application ofConstructed wetlands for the Treatment ofDomestic Sewage in Rural Australia. CSIRODivision of Water Resources.
Mills, W. (1993). Groundwater Recharge Success.Water Environment & Technology 5(2), 40–44.
Montgomery, J. M. Consulting Engineers Inc.(1992). A Study of Nationwide Costs to Imple-ment Municipal Stormwater Best ManagementPractices. Water Resources Committee,American Public Works Association, SouthernCalifornia Chapter, Los Angeles, James M.Montgomery Consulting Engineers, Inc.,Walnut Creek, California.
Moran, T. (1993). Water-sensitive Urban(Residential) Design Guidelines for the PerthMetropolitan Region. Department of Planningand Urban Development, Perth.
Moss, A.J., Rayment, G.E., Reilly, N., and Best,E.K. (1992). A Preliminary Assessment ofSediment and Nutrient Exports fromQueensland Coastal Catchments. QueenslandDepartment of Environment and HeritageTechnical Report No 4, Brisbane.
Mouritz, M. (1995). A Feasibility Study of anIntegrated Urban Water Management System:Palmyra Case Study. Research Report. UrbanWater Research Association of Australia,Melbourne.
Murray, A. (1994). Western Treatment PlantOutputs to Port Phillip Bay. CSIRO Institute ofNatural Resources and Environment, PortPhillip Bay Environmental Study, TechnicalReport 15.
Myers, B., Bond, W., Falkiner, R., O’Brien, N.,Polglase, P., Smith, C., and Thieveyanathan, S.(1995). Effluent Irrigation Plantations: Designand Management. Technical Paper No 2,CSIRO Division of Forestry, Canberra. ISBN0 642 05824 9.
Nancarrow, B.E., Jorgensen, B.F., Syme, G.J.(1995). Stormwater management in Australia:Community Perceptions, Attitudes andKnowledge. Urban Water Research Assoc-iation of Australia Research Report 95. UrbanWater Research Association of Australia,Melbourne.
National Health and Medical Research Counciland the Australian Water Resources Council(1987). Guidelines for Use of Reclaimed Waterin Australia. Australian. GovernmentPublishing Service, Canberra.
National Water Quality Management Strategy(1992). Australian Water Quality Guidelines forFresh and Marine Waters. National WaterQuality Management Strategy Volume 4.Australia and New Zealand Environment andConservation Council, Canberra, ACT. ISBN0 642 18297 3.
National Water Quality Management Strategy(1994). Guidelines for Sewerage Systems:Acceptance of Trade Waste (Industrial Waste).National Water Quality Management StrategyVolume 12. Agriculture and Resource Manage-ment Council of Australia and New Zealand,and the Australia and New Zealand Environ-ment and Conservation Council. Department ofPrimary Industries and Energy, Canberra,ACT. ISBN 0 642 19556 0.
National Water Quality Management Strategy(1995). Guidelines for Groundwater Protectionin Australia. National Water Quality StrategyVolume 8. Agriculture and Resource Manage-ment Council of Australia and New Zealand,and Australian and New Zealand Environmentand Conservation Council. Department ofPrimary Industries and Energy, Canberra,ACT.
National Water Quality Management Strategy(1996a). Draft Guidelines for SewerageSystems: Use of Reclaimed Water. NationalWater Quality Management Strategy Volume14. National Health and Medical ResearchCouncil, Agriculture and ResourceManagement Council of Australia and NewZealand, and the Australia and New ZealandEnvironment and Conservation Council.Department of Primary Industries and Energy,Canberra, ACT. ISBN 0 646 20855 1.
147
National Water Quality Management Strategy(1996b). Draft Guidelines for Urban Storm-water Management. National Water QualityManagement Strategy Vol. 10. Agriculture andResource Management Council of Australiaand New Zealand, and the Australia and NewZealand Environment and ConservationCouncil. Department of Primary Industries andEnergy, Canberra, ACT. ISBN 0 642 19560 9.
National Water Quality Management Strategy(1996c). Draft Guidelines for SewerageSystems: Sewerage System Overflows. NationalWater Quality Strategy Volume 14. Agricultureand Resource Management Council ofAustralia and New Zealand, and the Australiaand New Zealand Environment and Conser-vation Council. Department of PrimaryIndustries and Energy, Canberra, ACT.
Newnham, D. (1993). Dual Distribution Systems.Water Environment & Technology 5(2), 60–62.
New South Wales Environmental ProtectionAuthority (1995). ENVALUE EnvironmentalValuation Data Base. Report No 95/34. NSWEnvironmental Protection Authority,Chatswood, NSW. ISBN 0 7310 3741 3.
New South Wales Recycled Water CoordinationCommittee (1993). NSW Guidelines for Urbanand Residential Use of Reclaimed Water. NSWPublic Works Department, Sydney. ISBN0 7310 09703.
Ng, H., & Chia, P. (1991). Re-use of SewageEffluent as Industrial Water in Singapore.Paper presented at the Australian Water andWastewater Association 14th FederalConvention, Perth, WA, 17–22 March 1991.
Nicholas, D.I. (1995). Techniques for On-siteDetention in Sydney, Australia: Quantity andQuality Control Mechanisms for FrequencyStaged Storage. In: ‘NOVATECH 2ndInternational Conference on InnovativeTechnologies in Urban Storm Drainage’, Lyons,May–June 1995. Groupe de Recherche Rhone-Alpes sur les Infrastructures et l’Eau,Villeurbanne, France, pp. 503–510. ISBN2-9509337-0-X.
Niemcynowicz, J (1994). Implementation ofEnvironmentally Sound Water Management.In: W.F Geiger (ed) ‘Integrated WaterResources Management in Urban andSurrounding Areas’ Part 2, Case Studies. Proc.Workshop held at Gelsenkirchen, May 1994.University of Essen, Germany.
Ohgaki, S., & Sato, K. (1991). Use of ReclaimedWastewater for Ornamental and RecreationalPurposes. Water Science & Technology 23,2109–2117.
O’Loughlin, E.M., Young W.J., and Molloy, J.D.(1992). Urban Stormwater: Impacts on theEnvironment. CSIRO Division of WaterResources, Canberra.
O’Loughlin, G., Beecham, S., Lees, S., Rose, L.,and Nicholas, D. (1995). On-site StormwaterDetention Systems in Sydney. In: NOVATECH2nd International Conference on InnovativeTechnologies in Urban Storm Drainage, Lyon,May–June 1995. Groupe de Recherche Rhone-Alpes sur les Infrastructures et l’Eau,Villeurbanne, France. pp. 549–556. ISBN2-9509337-0-X.
Parameswaran, M. (1993). Production ofJerusalem artichoke hybrids under irrigationusing urban wastewater. Report no. 63published for UWRAA by Melbourne WaterCorporation, Melbourne.
Philip, N. (1995). Sewage: Sydney (NSW) – aCase History. In ‘State of the MarineEnvironment Report for Australia, TechnicalAnnex 2: Pollution’, Zann, L., and Sutton D.(eds). Department of Environment Sport andTerritories Ocean Rescue 2000 Program / GreatBarrier Reef Marine Park Authority.
Phillips, B. and Goffman, J. (1993). DesigningSubdivisions to Save and Manage Water.Occasional Paper Series 1, No 3. Reportprepared by the National Capital PlanningAuthority for the Better Cities Program.Australian Government Publishing Service,Canberra.
Pilgrim, D.H. Ed (1991). Australian Rainfall andRunoff: A Guide to Flood Estimation. Insti-tution of Engineers Australia, Barton, A.C.T.
Pound, C.E., Crites, R.W. and Smith, R.G. (1975).Cost-effective Comparison of Land Applicationand Advanced Wastewater Treatment. Tech-nical Report EPA-430/9-75-016. United StatesEnvironmental Protection Agency,Washington, D.C.
Pugh, S.J., and McIntosh, G.F., (1991). A Prelim-inary Assessment of the Reuse Potential ofEffluent and Urban Stormwater in SouthAustralia. Report prepared by the SouthAustralian Department of Mines and Energyand the Engineering and Water SupplyDepartment of South Australia.
Queensland Department of Environment andHeritage. (1994). Annual Report 1993–1994.Department of Environment and Heritage,Brisbane.
Queensland Department of Primary Industries.(1994). Queensland Department of PrimaryIndustries: Annual Report 1993–1994.Department of Primary Industries, Brisbane.
Read, T. (1994). Implications of Effluent WaterResource Management for Agriculture andAquifer Recharge. In: ‘Better Cities Workshop1993–1994’. Workshop 3: DemonstrationPrograms. Department of Planning and UrbanDevelopment, Adelaide, South Australia.

148
Rees, Y.J. (1994). Dissemination of Informationon Water Quality to the Public: ApproachesTaken to Other European Countries. NationalRivers Authority, Bristol.
Regional Planning Advisory Group (1993). ‘ThePreferred Pattern of Urban Development forSouth East Queensland’, Vol 1.
Reily, J., Wojnar, H. (1992). Treating and ReusingIndustrial Wastewater. Water Science &Technology 4(11), 52–53.
Resource Assessment Commission (1993).Coastal Zone Inquiry. Australian GovernmentPublishing Service, Canberra.
Ribbons, S.G. (1995). Engineering andEnvironmental Vision: the Cabramatta CreekStory. In: ‘2nd International Symposium onUrban Stormwater Management’, Melbourne,11–13 July, pp. 69–74. National Committee onWater Engineering, The Institution ofEngineers Australia, Canberra.
Roberts, J., Oliver, R. (ed.), (1994). TheMurrumbidgee, Past and Present: A forum onpast and present research on the lowerMurrumbidgee River. CSIRO Division of WaterResources, Griffith, NSW.
Rogers, S., Lauer, W. (1992). Denver’sDemonstration of Potable Water Reuse: WaterQuality and Health Effects Testing. WaterScience & Technology 26(7–8), 155–164.
Rolls, J.M. (1995). Stormwater Management inMetropolitan Adelaide: Technical Innovationand Institutional Rigidity. In ‘2nd InternationalSymposium on Urban Stormwater Manage-ment’, Melbourne, 11–13 July, pp. 89–91.National Committee on Water Engineering,The Institution of Engineers Australia,Canberra.
Rose, J., Gerba, C. (1991). Assessing PotentialHealth Risks from Viruses and Parasites inReclaimed Water in Arizona and Florida, USA.Water Science & Tecnology 23, 2091–2098.
Rouse Hill Development (1993). Rouse HillDevelopment Area and You. Rouse HillInfrastructure Consortium.
Sarikaya, H., Eroglu, V. (1993). WastewaterReuse Potential in Turkey: Legal and TechnicalAspects. Water Science & Technology 27(9),131–137.
Semiani, W. (1990). Irrigation of Tree Crops atRegional Wastewater Treatment Plants. Paperpresented at the Effluent Reuse Conference,Wollongong University, 13–16 February 1990.
Simpson, C.J., Burt, J.S., Cary, J.L., d’Adamo, N.,Masini, R.J., and Mills, D.A. (1993). SouthernMetropolitan Coastal Waters Study (1991–1994). Progress Report August 1993. WesternAustralia Environmental Protection Authority,Perth.
Simpson, J. (1994). Artificial Wetlands Research.Prime News No 18, Nov/Dec 1994. Depart-ment of Primary Industries, Queensland.
Skinner, R., and Vass, R. (1995). SewerageMaster Planning for Melbourne. In ‘Deliveringthe Vision for the Next Century’, AWWA 16thFederal Convention, Sydney 1995. Vol 1, pp.369–374.
South Australian Centre for Economic Studies(1994). An Economic Assessment of theVirginia Pipeline Scheme: Report to MFPAustralia. Flinders University, Adelaide.
Spulber, N., and Sabbaghi, A. (1994). Economicsof Water Resources: From Regulation to Privat-ization. Natural Resource Management andPolicy Series. Dinar, A., and Zilberman, D.,(eds). Kluwer Academic Publishers, London.
State Government of Victoria (1995). NutrientManagement Strategy for Victorian InlandWaters. Water Resources Management Branch,Department of Conservation and NationalResources, East Melbourne. ISBN 0 7306 6054 0.
Steven, A., Brodie, J. (1994). Barrier Reef MarinePark Authority Water Quality ResearchProgram. In ‘The Sixth Pacific Congress onMarine Science and Technology’ 4–8 July 1994PACON '94, O. Bellwood (ed). James CookUniversity of North Queensland, Townsville.
Sydney Water Board (1995). Water ReuseProjection to 2000. Sydney Water Corporation,Sydney.
Sydney Water (1994). Choices for CleanWaterways: A Discussion Paper on PlanningWastewater Services for the Future. New SouthWales Government’s Clean WaterwaysProgram, March 1994.
Sydney Water (1994a). Managing SewageOverflows in the Sydney Region: A Discussionof Issues for Environmental Impact Statementon Sewage Overflows from the SewerageSystems. Choices for Clean Waterways Series,Sydney Water, Sydney.
Sydney Water Board. (1994a). Special Environ-mental Levy Management Report 1989–1994(Management Report). The Board, Sydney.
Sydney Water Board (1994b). Clean WaterwaysReport For the End of the Five Year SpecialEnvironmental Levy Period 30 June 1994. TheBoard, Sydney.
Sydney Water Board (1994c). Wastewater andReuse Planning Survey of Effluent DischargePractices – C.O.A.G 1994: Sydney WaterResponse. (Prepared for the Council ofAustralian Governments). Agriculture andResource Management Council of Australiaand New Zealand, Water TechnologyCommittee.

149
Sydney Water Board. (1993a). Clean WaterwaysProgramme Report, Year ended 30 June 1993.The Board, Sydney.
Sydney Water Board. (1993b). Clean WaterwaysProgramme Water Reclamation and Reuse:Data and Literature Search. (Preliminary draftreport). The Board, Sydney.
Sydney Water Board. (1993c). Joint Parliament-ary Select Committee on the Water Board,Water Board Submission: The Future of Water(abridged version). The Board, Sydney.
Sydney Water Board (1992). Clean WaterwaysProgram. Water Reclamation and Re-use.Project Identification. The Board, Sydney.
Tchobanoglous, G., and Burton, F.L, (1991).Wastewater Engineering: Treatment, Disposaland Reuse. Third Edition, Metcalf and Eddy,Inc. McGraw-Hill Series in Water Resourcesand Environmental Engineering.
Teltsch, B. et al. (1992). Plankton CommunityChanges Due to the Addition of TreatedEffluents to a Freshwater Reservoir Used forDrip Irrigation. Water Research 26(5), 657–668.
Thomas J.F. (1995a). Council of AustralianGovernments Study on Wastewater Re-use,Improved Stormwater Management andDisposal to Sensitive Environments. Report onInternational Discussions. Part I: WastewaterRe-use. CSIRO Division of Water ResourcesTechnical Memorandum 95/14. CSIRO,Canberra.
Thomas J.F. (1995b). Council of AustralianGovernments Study on Wastewater Re-use,Improved Stormwater Management andDisposal to Sensitive Environments. Report onInternational Discussions. Part II: StormwaterManagement. CSIRO Division of WaterResources Technical Memorandum 95/15.CSIRO, Canberra.
Thomas, J.F., Clark, R., Draper, G., Oliver, J., andRunge, W. (1994). Benchmarking for WaterManagement at the MFP Greater Levels Site.CSIRO Division of Water Resources Consult-ancy Report 94/35. CSIRO, Canberra.
Thompson, K. et al. (1992). City of San DiegoPotable Reuse of Reclaimed Water. FinalResults. Desalination 88, 201–214.
Tomkinson, B. (1993). Low Cost WastewaterReuse – A Case Study. Poster Papers, 3, 779–783.
Tyson, J.M. et al., (1994). Urban PollutionManagement: A Planning Guide for theManagement of Urban Wastewater DischargesDuring Wet Weather. Report FR/CL 0002.Foundation for Water Research, Marlow, UK.ISBN 0 9521712 1 X.
United States Environmental Protection Agency(1978a). Construction Costs for MunicipalWastewater Treatment Plants. Technical Report
EPA 430/9-77-013. United States Environ-mental protection Agency, Washington, D.C.
United States Environmental Protection Agency(1978b). Construction Costs for MunicipalWastewater Conveyance Systems. TechnicalReport EPA 430/9-77-014. United StatesEnvironmental Protection Agency,Washington, D.C.
United States Environmental Protection Agency(1978c). Analysis of Operations and Mainten-ance Costs for Municipal Wastewater Treat-ment Systems. Technical Report EPA 430/9-77-015. United States Environmental ProtectionAgency, Washington, D.C.
United States Environmental Protection Agency(1992). Environmental Impacts of StormwaterDischarges. A National Profile. EPA 841-R-92.Washington, D.C.
United States Environmental Protection Agency(1993). Manual: Combined Sewer OverflowControl. U.S. Environmental ProtectionAgency, Office of Research and Development,Centre for Environmental ResearchInformation, Cincinnati, Ohio.
van der Wel, B., and McIntosh, G. (1995).Integrated Water Management in Rural Townsand Communities of South Australia. SouthAustralian Department of Environment andNatural Resources, Adelaide.
van Woesik, R., Vantier, L.M., and Steven,A.D.L. (1990). Discharge From Tourist Resortsin Queensland, Australia: Coral CommunityResponse. Proc. Congress on Coastal MarineTourism, 25–31 May 1990, Honolulu, Hawaii.
Vines, G. (1992). Geelong Region WastewaterStrategy. Paper presented at the Water inSustainable Urban Environment Forum,Melbourne, 2 June 1992.
Waste Management and Environment (1994a).Biosolids and Agriculture. Waste Managementand Environment 5(4), 27–28.
Waste Management and Environment (1994b).Solid Waste, Add Water, Equals Sludge. WasteManagement and Environment 5(4), 22–24.
Water Authority of Western Australia (1994a).The Flow, April 1994, No 4. The Authority,Perth.
Water Authority of Western Australia (1994b).The Flow, November 1994, No 6. TheAuthority, Perth.
Water Authority of Western Australia (1994c).Perth’s Water Future: a Water Supply Strategyfor Perth to Mandurah to 2021 (With a Focus to2010). The Authority, Perth.
Water Authority of Western Australia (1994d).Pilot Reuse Project Show Case at WoodmanPoint. The Authority, Perth.

150
Water Authority of Western Australia (1994e).Wastewater 2040 Discussion Paper. AnInitiative of the Water Authority of WesternAustralia, John Tonkin Water Centre,Leederville, Western Australia. ISBN0 7309 5275 4.
Water Authority of Western Australia (1994f).Wastewater 2040 South-West Discussion Paper.The Authority, Perth.
Williams, R. (1995). List of InternationalContacts, CMPS & F Engineers and ProjectManagers.
Wright, A., Parsons, R. (1994). ArtificialRecharge of Urban Wastewater: the key
component in the development of an industrialtown on the arid west coast of South Africa.Paper presented at ‘Water Down Under '94’,Adelaide, 21–25 November 1994.
Zann, L. (1995). Our Sea, Our Future: MajorFindings of the State of the MarineEnvironment Report for Australia. GreatBarrier Reef Marine Park Authority (for theDepartment of the Environment, Sport andTerritories Ocean Rescue 2000 Program).
Zhongxiang, Z. (1991). Water Saving andWastewater Reuse and Recycle in China. WaterScience & Technology 23, 2135–2140.
Appendices-1
APPENDIX A
STUDY WORK PROGRAM
WastewaterThe main components of the work program inproducing the study report were as follows:• a National Effluent Re-use Survey of current
(1994) and anticipated sewage re-use to theyear 2000 was conducted by Melbourne Wa-ter, on behalf of the Water Technology Com-mittee; this was made available to the study.Appendix D reproduces the questionnaire.Except where otherwise stated, all data intables and diagrams in Part II (Re-use ofWastewaters) are derived from this survey
• WRMC/WTC representatives were nomi-nated from Commonwealth, State and Terri-tory jurisdictions: these provided inputs tothe study and reviewed the draft report
• the project leader visited France, Germany,UK and the USA to visit regulatory agen-cies, utilities and research groups to ascer-tain latest practices and issues. A report onthese visits is given in Thomas (1995a)
• an intensive literature review and industryconsultation process was undertaken
• meetings were held with stormwater man-agement agencies and committees in Statesand territories.
StormwaterA series of interviews were conducted withagency personnel in each state and territory.The interviews covered:• a discussion of stormwater management
problems• perceived areas for improved management
of stormwaters• current and emerging institutional struc-
tures.
As part of the investigations leading to the pro-duction of the COAG Study Report, France,Germany, the UK and the USA were visited inJune/July 1995.
The objectives of the visits were:• to become acquainted with recent technical
developments in stormwater management• to hear about successes and failures• to ascertain environmental and economic
issues in stormwater management, and• to discuss alternative institutional and
regulatory approaches.
Meetings were arranged with water managers,urban planners, environmental regulators, re-searchers and decision makers. A report onthese exchanges is given in Thomas (1995b).
Through personal contacts and formal litera-ture searches, published and grey literaturewere accessed for all jurisdictions.
Three stormwater conferences were attendedduring the study period, and contributed pa-pers were utilised in preparing this report:• Australian Water and Wastewater Associa-
tion 16th Biennial Federal Convention, Syd-ney, April 1995
• Group de Reserche Rhone-Alpes sur les In-frastructures et l’Eau: Novatech ’95 Interna-tional Stormwater Conference, Lyon, France,June 1995
• The Institution of Engineers, Australia: Sec-ond International Symposium on Stormwa-ter Management, Melbourne, July 1995.

Appendices-2

Appendices-3
APPENDIX B
TABLE OF WASTEWATER DISPOSAL PRACTICESIN AUSTRALIA WITH SOME INTER-
NATIONAL EXAMPLES
(a) Disposal to Oceans and Estuaries(b) Disposal to Inland Waters: creeks, lakes and rivers(c) Disposal to Wetlands(d) Disposal to Land

Appendices-4
(a) Australian Wastewater Disposal Practices:Disposal to Ocean and Estuaries
State Location Project Details Findings and Considerations References
New SouthWales
Sydney: SydneyDeep Ocean Out-falls, Bondi, NorthHead and Malabar
80% of NSW’s population of 5.77m live in the coastalzone in Sydney, Newcastle or Wollongong. Problem ar-eas identified by Zann (1995) are: Sydney ocean outfalls(relocated in 1990), Homebush Bay, Georges River, andLake Illawarra, Lake Macquarie and Tuggerah Lakes.
In 1990/1991 Sydney’s cliff-face outfalls, which dis-charged primary treated effluent, were replaced by deepocean outfalls. Changes in water quality due to the out-falls were to be monitored through a five year Environ-mental Monitoring Plan (EMP). The four majortreatment plants: North Head (1 200 000 people serv-iced), Bondi (600 000 people serviced), Malabar(1 500 000 people serviced) and Cronulla were all up-graded. North Head, Bondi and Malabar receive 80% ofSydney’s total sewage flow, and the remaining 20% isdischarged from smaller coastal and inland treatmentplants.
The outfalls were part of SWB’s integrated manage-ment plan for Sydney’s sewage waste. Monitoring ofwater quality from 1992 and 1993 shows nearly 100%compliance with proposed bathing water guidelines atmajor beaches. Viral presence remains north of SydneyHarbour, but is largely absent south of the Harbour.Overall the deep outfalls have contributed to improvedwater quality. Diluted sewage moves southward andbelow the water’s surface away from Sydney’s oceanoutfalls. Levels of contaminates in fish and deployedoysters along the shoreline have decreased since thedeep ocean outfalls were commissioned.
Fagan et al.,(1992)Ashbolt etal., (1993)Philip(1995)Zann (1995)
Bondi Secondary treated chlorinated effluent discharged via adeep ocean outfall. (600 000 persons serviced; outfalllength 2200m)
Bondi Beach water quality has improved since the deepocean outfall was commissioned in 1991.
SydneyWater Board(1994b)
Sutherland Shire –Cronulla, Bate Bay,Woolooware Bay
The Cronulla WWTP (Sydney Water Corporation’s 4th-largest WWTP) serves a community of 190 000, and isexpected to rise to 220–240 000 by year 2010. 50ML/day of wastewater is treated in dry weather. Thereare 1300 km of sewers and 57 pumping stations. Duringprolonged wet weather wastewater flows can increase to430 ML/day. Treated effluent is discharged from the cliffface 9 m below the waterline.
An options paper has been prepared for the SutherlandShire (1995) as part of the ‘Choices For Clean Water-ways’ Sydney Water Corporation community consulta-tion process. There is a multimillion upgrade of waste-water systems in the Sutherland Shire which includesthe Cronulla WWTP.
SydneyWater Corp-oration(1995)

Appendices-5
State Location Project Details Findings and Considerations References
New SouthWales
The villages of Bundeena and Mainbar are currentlyunsewered, and may be connected to the CronullaWWTP system, which would increases the wastewaterstream by a further 2%.
Significant ecosystems within the Sutherland Shire in-clude the Georges River and Botany Bay which areused for recreational and commercial fishing. Signifi-cant natural wetland habitats include: Quibray Bay,Weeney Bay, Towra Point and Woolooware Bay. TheCronulla WWTP and outfall are on the Kurnell Penin-sula which is a popular recreational area for the villageof Kurnell, Botany Bay National Park and Cronulla.
Options for future disposal/re-use of wastewater will beevaluated as part of the Environmental Impact Assess-ment in keeping with the protection of human healthand ecosystem criteria set by the Environment Protec-tion Authority (NSW). All options will be assessed forbenefits, costs and risks to human health and the envi-ronment.
An Environmental Impact Statement was due for com-pletion in August, 1995. Following a further round ofcommunity consultation the determination report willbe written in conjunction with regulators.
Monitoring by ‘Beachwatch’ has indicated that waterquality at Cronulla Beach has been improving since Syd-ney Water Corporation improved screening and sedimen-tation processes at Cronulla WWTP between 1992 and1993 (cost $7m) . The Bate Bay Study identified the PotterPoint Outfall (operational since October 1990) from theCronulla WWTP as the major contributor to water qualityproblems in the Bay.
Options for future disposal/re-use options need to be inkeeping with the Sydney Water Corporation’s OperatingLicense which include: water conservation; control ofpollution at source and reuse of sewage by-products,treated effluent and sludge (biosolids) and treatment op-tions.
Strategies identified to manage wastewater include: waterconservation; controlling wastewater at source; strategiesthat reduce load on sewers; reuse of any remaining waste-water treated by WWTPs to be treated to standards de-manded by the market and legislation and treat anddischarge any remaining water to meet water qualityguidelines. Re-use options were identified for: small(household) scale; new smaller WWTPs; and large scalereuse. Options for treatment and discharge were: treatmentand discharge within the Shire; and outside the shire.
Three categories of options were identified: those whichcombine effluent reuse with treatment and discharge ofleftover within the shire; those which provide only treat-ment and discharge within the shire and those for treatmentand discharge outside the shire with possibly some reuse.

Appendices-6
State Location Project Details Findings and Considerations References
New SouthWales
Country TownsandCatchments
Bellambi The WWTP has been upgraded as part of the ‘CleanWaterways’ Program.
The preferred option for the Regional Effluent Manage-ment Scheme includes:• reuse of treated wastewater for agricultural irriga-
tion, woodlots and recreation• a constructed wetland at Terara with wet weather
discharges to the Shoalhaven River• provision for including the effluent from the town-
ships of Nowra and Bomaderry.
Sydney WaterBoard (1993b)
Coffs Harbour
Hunter: Newcastle/Port Stephens andShellharbourWWTPs
32 000 persons serviced.
A 4-year Hunter Environmental Monitoring Programbeing conducted by EPA (NSW), Hunter Water Cor-poration, MSB Hunter Ports Authority, commencedin February 1992.
Sydney rock oysters are being used to monitor, sites nearoutfalls at Boulder Bay, Belmont and Burswood BeachWWTPs. Organochlorines and trace metals are generallylow at the site.
EPA (NSW)(1993b)
Lake Illawarra –Shoalhaven
South Coast
The WWTP has been upgraded as part of the ‘CleanWaterways’ Program.
The St Georges Basin and Huskisson wastewatertreatment plants treat the wastewater prior to dis-charge into Plantation Point, Vincentia into JervisBay. The system will reach its capacity by 1996.
By the year 2000 discharges to Jervis Bay will haveceased. The scheme will be divided into stages so the an-nual increase in rates will be a maximum of $140/year(1994 dollar values). By the end of 1995, an Environ-mental Impact Statement will be prepared.
Sydney WaterBoard (1994c)
The Councilof the City ofShoalhaven(1994)
Wollongong –Port Kembla
The WWTP has been upgraded as part of the ‘CleanWaterways’ Program.
EPA (NSW)(1993b)
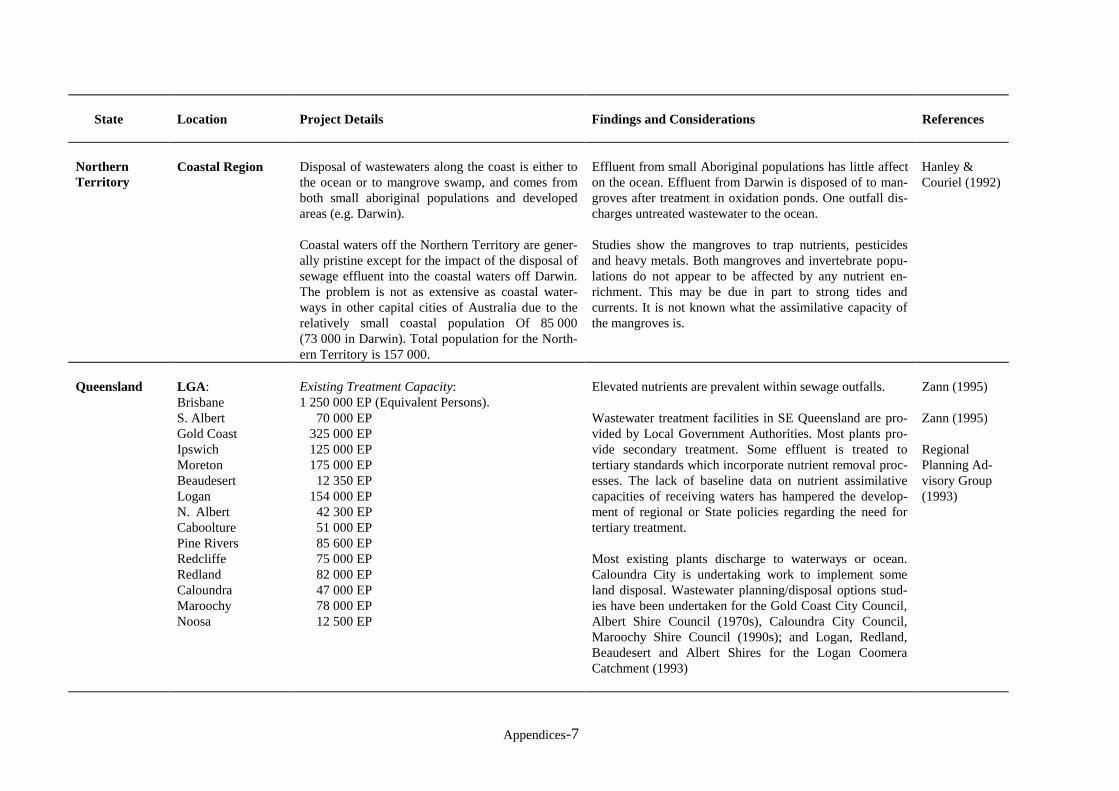
Appendices-7
State Location Project Details Findings and Considerations References
NorthernTerritory
Coastal Region Disposal of wastewaters along the coast is either tothe ocean or to mangrove swamp, and comes fromboth small aboriginal populations and developedareas (e.g. Darwin).
Coastal waters off the Northern Territory are gener-ally pristine except for the impact of the disposal ofsewage effluent into the coastal waters off Darwin.The problem is not as extensive as coastal water-ways in other capital cities of Australia due to therelatively small coastal population Of 85 000(73 000 in Darwin). Total population for the North-ern Territory is 157 000.
Effluent from small Aboriginal populations has little affecton the ocean. Effluent from Darwin is disposed of to man-groves after treatment in oxidation ponds. One outfall dis-charges untreated wastewater to the ocean.
Studies show the mangroves to trap nutrients, pesticidesand heavy metals. Both mangroves and invertebrate popu-lations do not appear to be affected by any nutrient en-richment. This may be due in part to strong tides andcurrents. It is not known what the assimilative capacity ofthe mangroves is.
Hanley &Couriel (1992)
Queensland LGA :Brisbane
Existing Treatment Capacity:1 250 000 EP (Equivalent Persons).
Elevated nutrients are prevalent within sewage outfalls. Zann (1995)
S. AlbertGold CoastIpswichMoretonBeaudesertLoganN. AlbertCaboolturePine RiversRedcliffeRedlandCaloundraMaroochyNoosa
70 000 EP 325 000 EP 125 000 EP 175 000 EP 12 350 EP 154 000 EP 42 300 EP 51 000 EP 85 600 EP 75 000 EP 82 000 EP 47 000 EP 78 000 EP 12 500 EP
Wastewater treatment facilities in SE Queensland are pro-vided by Local Government Authorities. Most plants pro-vide secondary treatment. Some effluent is treated totertiary standards which incorporate nutrient removal proc-esses. The lack of baseline data on nutrient assimilativecapacities of receiving waters has hampered the develop-ment of regional or State policies regarding the need fortertiary treatment.
Most existing plants discharge to waterways or ocean.Caloundra City is undertaking work to implement someland disposal. Wastewater planning/disposal options stud-ies have been undertaken for the Gold Coast City Council,Albert Shire Council (1970s), Caloundra City Council,Maroochy Shire Council (1990s); and Logan, Redland,Beaudesert and Albert Shires for the Logan CoomeraCatchment (1993)
Zann (1995)
RegionalPlanning Ad-visory Group(1993)

Appendices-8
State Location Project Details Findings and Considerations References
Queensland Country Areas
Coombabah 70 000 persons serviced. Secondary treated chlorinatedeffluent is discharged at ebbtide.
WAWA (1994f)
Kawana
Noosaville
35 000 persons serviced. Secondary treated chlorinatedeffluent is discharged from a 1000m long outfall.
8300 persons serviced. Secondary treated chlorinatedeffluent is discharged from a nearshore outfall.
WAWA (1994f)
WAWA (1994f)Brodie (1994)
Great BarrierReef Marine Park
Green Island
Great KeppelIsland
Hamilton Island
South Molle Resort
The lagoon environment of the Great Barrier Reef Ma-rine Park (GBR) has become eutrophic, and one of thecauses is the disposal of wastewater to the marine envi-ronment.
Primary treated effluent discharge has been replaced bytertiary treatment process.
Secondary treated effluent is discharged via a marineoutfall.
60% of Hamilton Island’s secondary treated effluent isdischarged to ocean, the remainder is used in irrigation.
Effluent is tertiary treated before being discharged via amarine outfall.
Sewage inputs contribute less than 10% to coastalQueensland waters. Sewage discharges account foronly 2.2% and 8.1% of total nitrogen and phosphorusbetween Cape Tribulation and Dunk Island. Othersources of nitrogen and phosphorus include rivers,upwelling of oceans, rainfall, reefal nitrogen fixationand Trichodesmium fixation. Each year, 234 tonnesof nitrogen and 62 tonnes of phosphorus are dis-charged to the ocean from 3 plants in Cairns.
Large increase in growth rate and area of seagrasshave been reported near the bay. Ongoing monitoringof seagrass beds is continuing.
Steven andBrodei (1994)
Brodie (1994)
Brodie (1994)
Brodie (1994)
Brodie (1994)
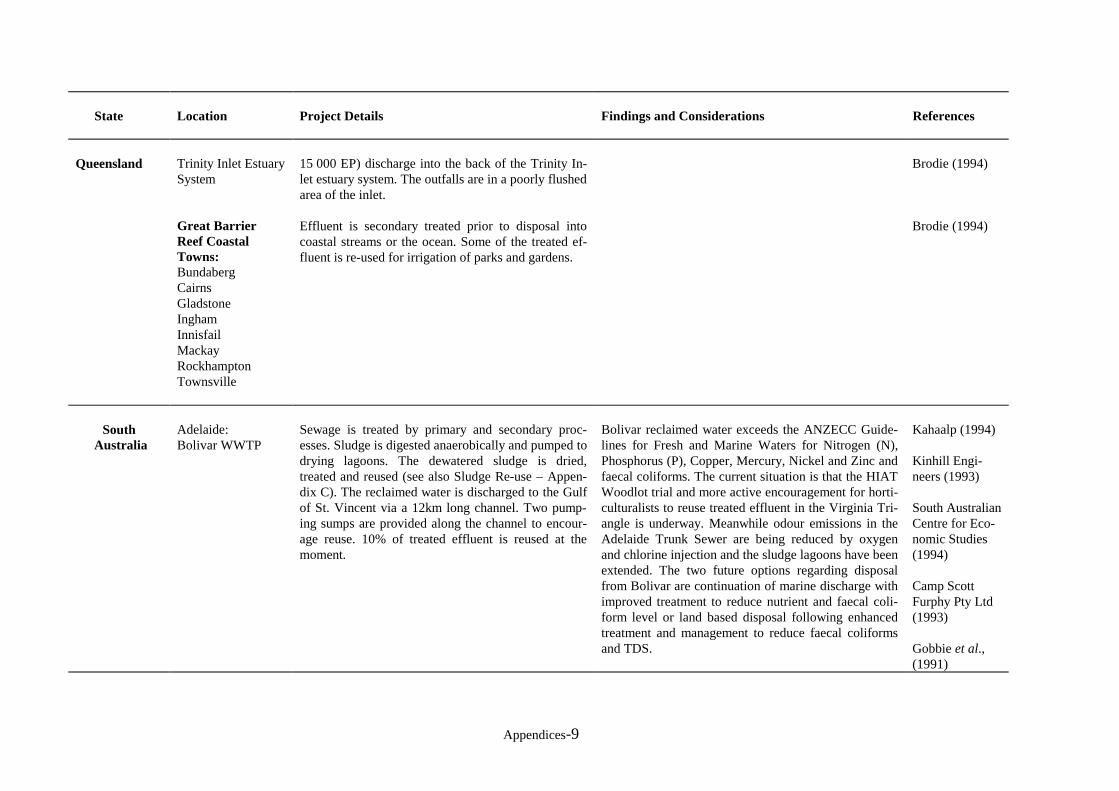
Appendices-9
State Location Project Details Findings and Considerations References
Queensland Trinity Inlet EstuarySystem
Great BarrierReef CoastalTowns:BundabergCairnsGladstoneInghamInnisfailMackayRockhamptonTownsville
15 000 EP) discharge into the back of the Trinity In-let estuary system. The outfalls are in a poorly flushedarea of the inlet.
Effluent is secondary treated prior to disposal intocoastal streams or the ocean. Some of the treated ef-fluent is re-used for irrigation of parks and gardens.
Brodie (1994)
Brodie (1994)
South Australia
Adelaide:Bolivar WWTP
Sewage is treated by primary and secondary proc-esses. Sludge is digested anaerobically and pumped todrying lagoons. The dewatered sludge is dried,treated and reused (see also Sludge Re-use – Appen-dix C). The reclaimed water is discharged to the Gulfof St. Vincent via a 12km long channel. Two pump-ing sumps are provided along the channel to encour-age reuse. 10% of treated effluent is reused at themoment.
Bolivar reclaimed water exceeds the ANZECC Guide-lines for Fresh and Marine Waters for Nitrogen (N),Phosphorus (P), Copper, Mercury, Nickel and Zinc andfaecal coliforms. The current situation is that the HIATWoodlot trial and more active encouragement for horti-culturalists to reuse treated effluent in the Virginia Tri-angle is underway. Meanwhile odour emissions in theAdelaide Trunk Sewer are being reduced by oxygenand chlorine injection and the sludge lagoons have beenextended. The two future options regarding disposalfrom Bolivar are continuation of marine discharge withimproved treatment to reduce nutrient and faecal coli-form level or land based disposal following enhancedtreatment and management to reduce faecal coliformsand TDS.
Kahaalp (1994)
Kinhill Engi-neers (1993)
South AustralianCentre for Eco-nomic Studies(1994)
Camp ScottFurphy Pty Ltd(1993)
Gobbie et al.,(1991)
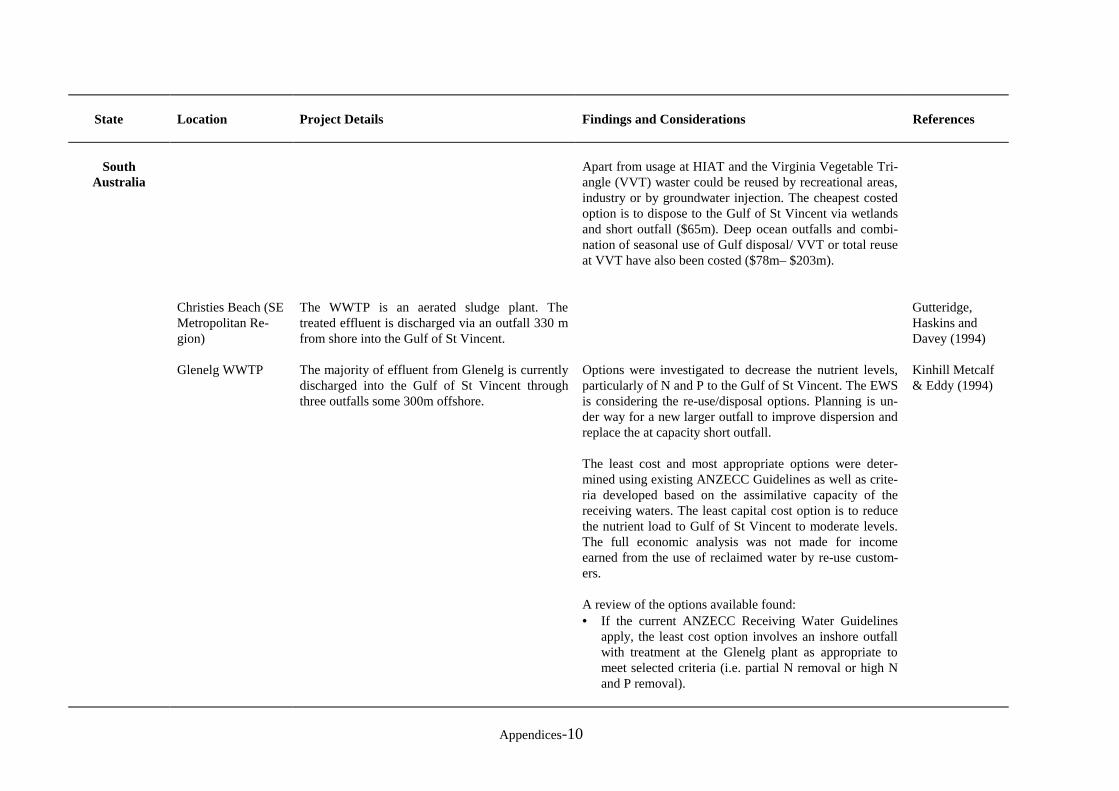
Appendices-10
State Location Project Details Findings and Considerations References
SouthAustralia
Christies Beach (SEMetropolitan Re-gion)
Glenelg WWTP
The WWTP is an aerated sludge plant. Thetreated effluent is discharged via an outfall 330 mfrom shore into the Gulf of St Vincent.
The majority of effluent from Glenelg is currentlydischarged into the Gulf of St Vincent throughthree outfalls some 300m offshore.
Apart from usage at HIAT and the Virginia Vegetable Tri-angle (VVT) waster could be reused by recreational areas,industry or by groundwater injection. The cheapest costedoption is to dispose to the Gulf of St Vincent via wetlandsand short outfall ($65m). Deep ocean outfalls and combi-nation of seasonal use of Gulf disposal/ VVT or total reuseat VVT have also been costed ($78m– $203m).
Options were investigated to decrease the nutrient levels,particularly of N and P to the Gulf of St Vincent. The EWSis considering the re-use/disposal options. Planning is un-der way for a new larger outfall to improve dispersion andreplace the at capacity short outfall.
The least cost and most appropriate options were deter-mined using existing ANZECC Guidelines as well as crite-ria developed based on the assimilative capacity of thereceiving waters. The least capital cost option is to reducethe nutrient load to Gulf of St Vincent to moderate levels.The full economic analysis was not made for incomeearned from the use of reclaimed water by re-use custom-ers.
A review of the options available found:• If the current ANZECC Receiving Water Guidelines
apply, the least cost option involves an inshore outfallwith treatment at the Glenelg plant as appropriate tomeet selected criteria (i.e. partial N removal or high Nand P removal).
Gutteridge,Haskins andDavey (1994)
Kinhill Metcalf& Eddy (1994)
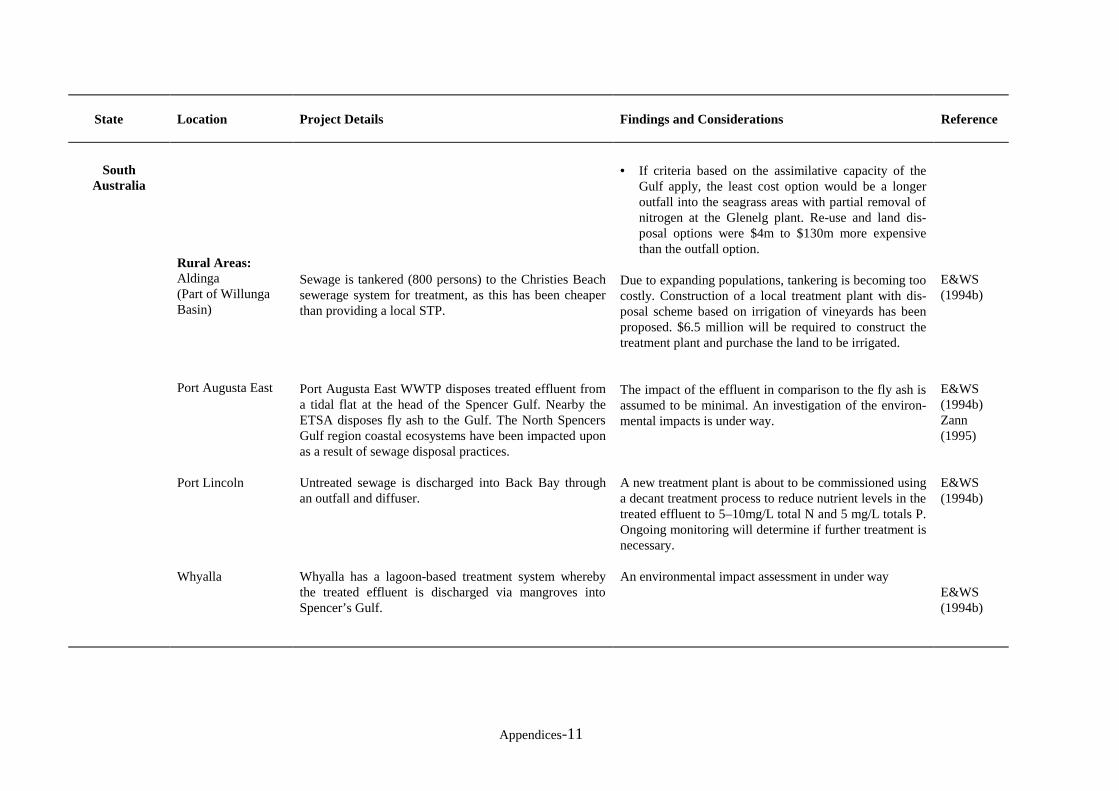
Appendices-11
State Location Project Details Findings and Considerations Reference
SouthAustralia
Rural Areas:Aldinga(Part of WillungaBasin)
Port Augusta East
Sewage is tankered (800 persons) to the Christies Beachsewerage system for treatment, as this has been cheaperthan providing a local STP.
Port Augusta East WWTP disposes treated effluent froma tidal flat at the head of the Spencer Gulf. Nearby theETSA disposes fly ash to the Gulf. The North SpencersGulf region coastal ecosystems have been impacted uponas a result of sewage disposal practices.
• If criteria based on the assimilative capacity of theGulf apply, the least cost option would be a longeroutfall into the seagrass areas with partial removal ofnitrogen at the Glenelg plant. Re-use and land dis-posal options were $4m to $130m more expensivethan the outfall option.
Due to expanding populations, tankering is becoming toocostly. Construction of a local treatment plant with dis-posal scheme based on irrigation of vineyards has beenproposed. $6.5 million will be required to construct thetreatment plant and purchase the land to be irrigated.
The impact of the effluent in comparison to the fly ash isassumed to be minimal. An investigation of the environ-mental impacts is under way.
E&WS(1994b)
E&WS(1994b)Zann(1995)
Port Lincoln
Whyalla
Untreated sewage is discharged into Back Bay throughan outfall and diffuser.
Whyalla has a lagoon-based treatment system wherebythe treated effluent is discharged via mangroves intoSpencer’s Gulf.
A new treatment plant is about to be commissioned usinga decant treatment process to reduce nutrient levels in thetreated effluent to 5–10mg/L total N and 5 mg/L totals P.Ongoing monitoring will determine if further treatment isnecessary.
An environmental impact assessment in under way
E&WS(1994b)
E&WS(1994b)

Appendices-12
State Location Project Details Findings and Considerations References
Tasmania Burnie
Devonport
Elevated nutrients from sewage and agricultural run-offexists
There are several ocean discharging plants in Tasmania.Devonport is the largest with a flow of 14.7 ML/d (only9% of total effluent is discharged to ocean). Most oceandisposal sites undergo primary treatment (fine screening).Secondary treatment is used when discharging into bays.Most discharges are via near-shore outlets except theocean outfall at Devonport.
Zann (1995)
DPIE (1991)
Victoria
Melbourne: Carrum
70% of Victoria’s population (3.7m) live in Melbourneor Geelong. Victoria has 2000 km of coastline, and sup-ports the highest coastal population density in Australia.Water quality problem areas are Port Phillip Bay, West-ern Port Bay and the Gippsland Lakes.
1 200 000 people are serviced by the Eastern WWTP.40% of Melbourne’s wastewaters are treated at Carrum.99.5% of the time the Eastern Treatment Plant compliedwith 1993/94 EPA discharge licensing arrangements.
Zann (1995)
MelbourneWater (1994)WAWA (1994f)
Werribee 2 000 000 people serviced by the WWTP. 520 ML/day(60% of Melbourne’s wastewater/day) is treated at theWestern Treatment Plant. Effluent is secondary treated,chlorinated and discharged from five nearshore outfalls.About 420 ML/day is discharged. The annual volumedischarged was 0.16km3 in 1989. The Western TreatmentPlant occupies 10851ha (6700ha used for the treatmentprocess). Treatment comprises year-round lagooning,supplemented by irrigation in summer and grass filtrationduring cooler months. The plant also treats 90% of Mel-bourne’s industrial liquid waste.
MelbourneWater (1994)Murray (1994)WAWA (1994f)

Appendices-13
State Location Project Details Findings and Considerations References
Victoria During any one year the WWTP discharges: 800t of or-ganic N; 150t of Nitrate; 40t of Nitrite; 1000t of Phos-phorus; and 4000–5000t of Organic Carbon. Concen-trations of metals in discharges are generally slightly inexcess of ANZECC guidelines. Chromium and iron dis-charges have decreased in the 1980s. 99.4% of the timethe Eastern Treatment Plant complied with EPA dis-charge licensing arrangements (1993/1994).
The remaining 10% of Melbourne’s wastewater is treatedat 27 local treatment plants. Of the 24 local treatmentplants licensed by the EPA, 97% achieved compliancelevels in 1993–94.
MelbourneCountry Areas:Geelong WaterBoard
The Geelong and District Water Board provides waterand wastewater services to 3900km2 which includesGeelong, Bellarine Peninsula and coastal and inlandtownships and part of the Otway Ranges. There are 14ocean discharges along the Ocean Coast. Pollution fromsewage discharges is particularly a problem at BoagsRocks.
Vines (1992)
Anglesea
Black Rock
Compact treatment plant (0.6 ML/day) with primarytreatment processes, followed by secondary treatmentprocesses. The treated effluent is discharged beyond theshoreline.
The WWTP services 236 000 people, and is located be-tween Barwon Heads and Torquay. The effluent is milli-screened, and the grit is removed prior to disposal from a1200m long ocean outfall. The plant treats 55 ML/day.13% of this volume is licensed as commercial and indus-trial wastes.
This plant is to be upgraded to meet EPA Guide-lines, to facilitate safe ocean disposal and futurereuse of treated effluent.
Zann (1995)
Vines (1992)
Vines (1992)WAWA (1994f)

Appendices-14
State Location Project Details Findings and Considerations References
WesternAustralia Beenyup
Subiaco
Woodman Point
PerthMetropolitan Area& the South West
Beenyup WWTP services 364 000 people. Effluentis secondary treated prior to discharge via two out-falls of 1600m and 1800m length.
213 000 persons are serviced. Effluent is secondarytreated and discharged from a 1000m outfall.
400 000 persons are serviced. Effluent is primarytreated prior to disposal via a 4200m outfall.
The Perth Coastal Waters Study, in conjunctionwith the Geographe Bay Study, is looking at the ca-pacity of coastal waters, from Alkimos in the northto Dunsborough in the south, to assimilate the com-bined wastewater discharges predicted to occur by2040. It will also establish how the marine envi-ronment has been affected by wastewater dischargesthus far, and what factors will influence the assimi-lative capacity. It makes up part of the WaterAuthority’s Wastewater 2040 initiative, a review ofwastewater treatment and effluent disposal strate-gies for the Alkimos to Dunsborough region.
Major findings of the Perth Coastal Waters Study are:• No measurable influences of treated wastewater
outlets from Swanbourne/Ocean Reef on the ecol-ogy of surrounding coastal waters.
• Treated wastewater from the Cape Peron outlet hascaused minor changes.
• There are no signs of eutrophication due to drainsentering the southern part of Geographe Bay.
A detailed monitoring program will be implemented toensure compliance of bathing beach water qualityhealth standards, which will include water qualitymeasurements, biological sampling and modelling.
The Wastewater 2040 review stated that 83.5% of met-ropolitan Perth’s effluent is disposed of to the ocean,while in the southwest, only 2.1% goes to the ocean.Both primary and secondary treated wastewater reachesthe marine environment. The review also has found thatfor most coastal areas, the ocean alone is capable ofassimilating projected waste water flows for 2040.However, with the push towards reuse of wastewater, itis unlikely that complete ocean disposal of Perth’s ef-fluent will occur.
WAWA (1994f)
WAWA (1994f)
WAWA (1994f)
WAWA (1994b)WAWA(1994e)WAWA(1994f)
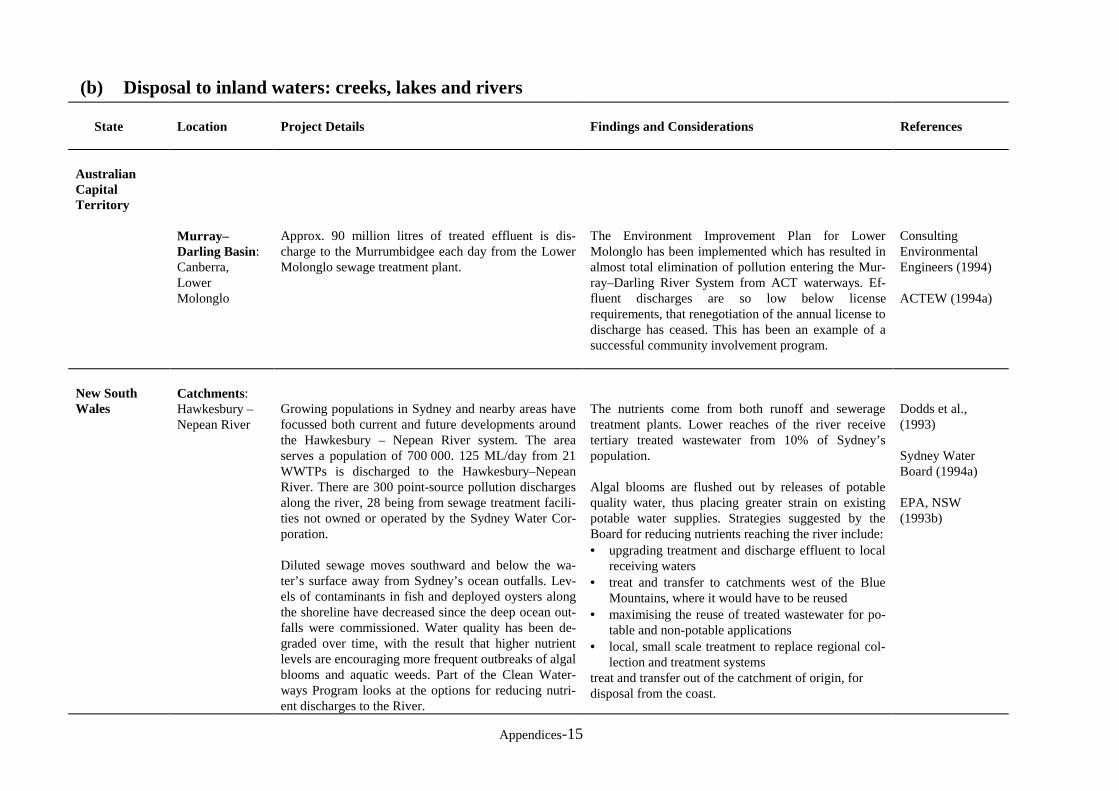
Appendices-15
(b) Disposal to inland waters: creeks, lakes and rivers
State Location Project Details Findings and Considerations References
AustralianCapitalTerritory
Murray–Darling Basin:Canberra,LowerMolonglo
Approx. 90 million litres of treated effluent is dis-charge to the Murrumbidgee each day from the LowerMolonglo sewage treatment plant.
The Environment Improvement Plan for LowerMolonglo has been implemented which has resulted inalmost total elimination of pollution entering the Mur-ray–Darling River System from ACT waterways. Ef-fluent discharges are so low below licenserequirements, that renegotiation of the annual license todischarge has ceased. This has been an example of asuccessful community involvement program.
ConsultingEnvironmentalEngineers (1994)
ACTEW (1994a)
New SouthWales
Catchments:Hawkesbury –Nepean River
Growing populations in Sydney and nearby areas havefocussed both current and future developments aroundthe Hawkesbury – Nepean River system. The areaserves a population of 700 000. 125 ML/day from 21WWTPs is discharged to the Hawkesbury–NepeanRiver. There are 300 point-source pollution dischargesalong the river, 28 being from sewage treatment facili-ties not owned or operated by the Sydney Water Cor-poration.
Diluted sewage moves southward and below the wa-ter’s surface away from Sydney’s ocean outfalls. Lev-els of contaminants in fish and deployed oysters alongthe shoreline have decreased since the deep ocean out-falls were commissioned. Water quality has been de-graded over time, with the result that higher nutrientlevels are encouraging more frequent outbreaks of algalblooms and aquatic weeds. Part of the Clean Water-ways Program looks at the options for reducing nutri-ent discharges to the River.
The nutrients come from both runoff and seweragetreatment plants. Lower reaches of the river receivetertiary treated wastewater from 10% of Sydney’spopulation.
Algal blooms are flushed out by releases of potablequality water, thus placing greater strain on existingpotable water supplies. Strategies suggested by theBoard for reducing nutrients reaching the river include:• upgrading treatment and discharge effluent to local
receiving waters• treat and transfer to catchments west of the Blue
Mountains, where it would have to be reused• maximising the reuse of treated wastewater for po-
table and non-potable applications• local, small scale treatment to replace regional col-
lection and treatment systemstreat and transfer out of the catchment of origin, fordisposal from the coast.
Dodds et al.,(1993)
Sydney WaterBoard (1994a)
EPA, NSW(1993b)
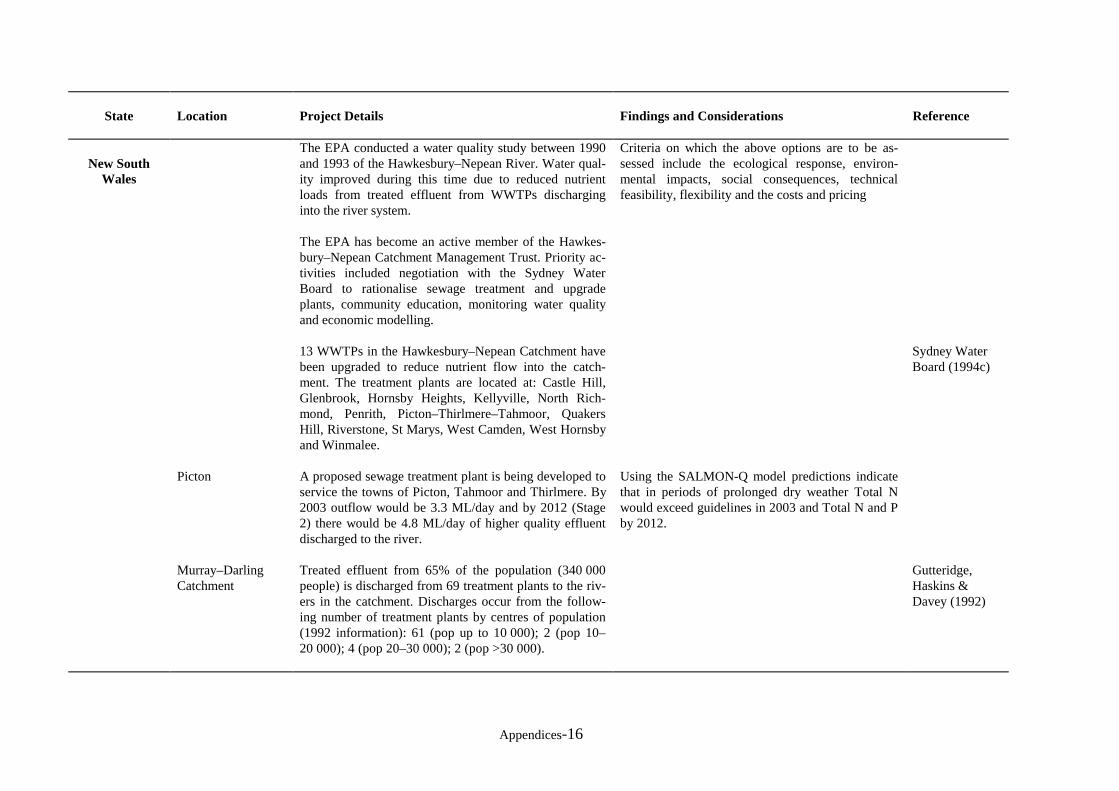
Appendices-16
State Location Project Details Findings and Considerations Reference
New SouthWales
The EPA conducted a water quality study between 1990and 1993 of the Hawkesbury–Nepean River. Water qual-ity improved during this time due to reduced nutrientloads from treated effluent from WWTPs discharginginto the river system.
The EPA has become an active member of the Hawkes-bury–Nepean Catchment Management Trust. Priority ac-tivities included negotiation with the Sydney WaterBoard to rationalise sewage treatment and upgradeplants, community education, monitoring water qualityand economic modelling.
Criteria on which the above options are to be as-sessed include the ecological response, environ-mental impacts, social consequences, technicalfeasibility, flexibility and the costs and pricing
13 WWTPs in the Hawkesbury–Nepean Catchment havebeen upgraded to reduce nutrient flow into the catch-ment. The treatment plants are located at: Castle Hill,Glenbrook, Hornsby Heights, Kellyville, North Rich-mond, Penrith, Picton–Thirlmere–Tahmoor, QuakersHill, Riverstone, St Marys, West Camden, West Hornsbyand Winmalee.
Sydney WaterBoard (1994c)
Picton A proposed sewage treatment plant is being developed toservice the towns of Picton, Tahmoor and Thirlmere. By2003 outflow would be 3.3 ML/day and by 2012 (Stage2) there would be 4.8 ML/day of higher quality effluentdischarged to the river.
Using the SALMON-Q model predictions indicatethat in periods of prolonged dry weather Total Nwould exceed guidelines in 2003 and Total N and Pby 2012.
Murray–DarlingCatchment
Treated effluent from 65% of the population (340 000people) is discharged from 69 treatment plants to the riv-ers in the catchment. Discharges occur from the follow-ing number of treatment plants by centres of population(1992 information): 61 (pop up to 10 000); 2 (pop 10–20 000); 4 (pop 20–30 000); 2 (pop >30 000).
Gutteridge,Haskins &Davey (1992)

Appendices-17
State Location Project Details Findings and Considerations Reference
New SouthWales
Albury The plant has a capacity of 56 000 EP, and uses the ac-tivated sludge treatment method. The sludge is dis-posed of to a secure landfill. The treated effluent isdischarged to the Murray river following chlorinationand detention for 32 days in maturation lagoons.
Phosphorus discharges have been reduced from 100 kg/day in 1985 to 35–40kg/day. Additional nutrient reductionfacilities were about to be installed in 1993.
A new plant at Nursery Valley, 5 km NW of the city willbe completed by 1998, incorporating the best availableeconomically achievable technology. An option for partriver/trial wetlands/land disposal was being considered in1993/4.
EPA, NSW(1993b)
Namoi Catchment Toxic algal blooms have been experienced in reser-voirs, weir pools and sections of the river in the valley.
Sewage treatment plants are being upgraded and reuseschemes to dispose onto land or for agricultural irrigationare being adopted
EPA, NSW(1993b)
Bellinger River The Urunga Wastewater Treatment Plant has installednutrient removal facilities.
Water quality is being investigated EPA, NSW(1993b)
Brunswick River Elevated nutrient levels were measured downstream ofthe Brunswick Heads Wastewater Treatment Plant,however recreational activity and fisheries were not af-fected.
EPA, NSW(1993b)
North CoastalRivers:Hastings River
Discharge of treated effluent into the Yeppin andKooloonbung creeks, tributaries of the Hastings River,resulted in poor localised water quality. The overallriver health was not effected.
EPA, NSW(1993b)
Richmond and Wil-son Rivers
Nutrient levels are high downstream from the towns ofLismore, Casino, Kyogle and Coraki. In the assimila-tion zones noxious weed and toxic algal blooms are ex-perienced during periods of low river flows
EPA, NSW(1993b)

Appendices-18
State Location Project Details Findings and Considerations Reference
Queensland Brisbane Secondary treated wastewater is discharged into thereach of a river system (the Brisbane River), whichthen flows out to Moreton Bay.
The Brisbane City Council initiated a joint study withthe Department of Environment and Heritage exam-ining the available scientific and environmental dataon water quality and community uses of the BrisbaneRiver and Moreton Bay.
A number of heavy metals exist in Brisbane’s domesticsewage, including copper and zinc, as well as pesticides.Industry trade wastes are also accepted into the sewer if thetreatment plants have the capacity to treat them.
The desired dilution factor for wastewater disposed of intothe river system (1000:1) is not often achieved, a result ofthe design of the submerged shoreline outfalls not havingspecially designed diffusers. During the 1980s the waterquality of both Brisbane River and Moreton Bay improvedin terms of BOD and dissolved oxygen levels, but nutrientlevels have risen, causing three ‘red tide’ incidents since1979.
Lever(1993)
Barron River(near Cairns)
Sewage loads of 117 tonnes of Nitrogen/ yr and 31 ton-nes of phosphorus/yr discharge from the Barron Riverinto the Great Barrier Reef Marine Park near Cairns.
Brodie(1994)
Murray–DarlingBasin
Effluent from 12 of the 29 plants in the catchment aredisposed to the rivers. Total treated effluent to the Mur-ray–Darling River in Queensland is 9000 ML/day.Toowoomba is the major contributor (pop 79000). Theother treatment plants are: Dalby (pop 8300); four (pop3–5000); five (pop 200–1100) and one (pop 200).
The Toowoomba Sewerage Strategy has just been com-pleted. The strategy has examined options to reduce nut-rient flows to the Gowrie Creek; dedicated land disposaloption and the possibility of reuse via agricultural, in-dustrial, dual reticulation, urban irrigation, aquifer re-charge and potable reuse options. During phase 2 of theprocess a biological nutrient removal treatment plant for(6000 EP) will be constructed.
Gardner,Bryan, Hu,Gordon,Beavers(1993)
MDBC(1992)

Appendices-19
State Location Project Details Findings and Considerations Reference
SouthAustralia
Adelaide:Port Adelaide
The sewage is quite saline due to infiltration of salinegroundwater. The sewage is treated by the activatedsludge method. The sludge is sent to Bolivar inte-grated sludge management facility. The treated efflu-ent discharges to the head of the Port River near theBowerf Road Embankment. Treated effluent from thePort Adelaide WWTP impacts on the Port AdelaideRiver estuary and the surrounding coastal waters.
Future options under investigation include: continued dis-charge to the Port River; a new outfall to the Gulf of StVincent; combined outfall at Glenelg; diverting Port Ade-laide sewage or disposing to land via industrial reuse, irri-gation, wetlands or groundwater recharge. Upgrading thelevel of treatment to moderately whilst still discharging tothe Port River involves the least capital, operational andmaintenance costs.
Gutteridge,Haskins &Davey(1993a)
Rural Areas:Angaston A submersible mixer had been installed to reduce the
likelihood of algal blooms by mixing the effluent withriver water.
Treated effluent is discharged into Angaston Creekafter chlorination.
Land based disposal to agricultural irrigation is the futurepreferred option based upon economic and environmentalconsiderations. However, the Angaston WWTP also treatswaters from the Boral anadosing factory (40% of wastestream volume)which is a major contributor of salts, metalsand sodium. The Boral wastewater stream would need to betreated separately or concentrations of salt and heavy metalswould need to be reduced before the water could be usedfor horticultural irrigation. Estimated capital cost of thescheme would be $600 000.
E&WS(1994b)
Murray DarlingBasin:Bird in Hand The WWTP serves the towns of Lobethal and Wood-
side and the treated wastewater is discharged into theDawesley Creek, a tributary of the Bremer Riverwhich flows into Lake Alexandrina.
Future options include a total land based disposal or devel-opment of an irrigated woodlot, with discharge to the creekduring non-irrigation periods. The woodlot option was theleast expensive at $325 000. An interim license to dischargewas granted in August 1993, pending the future operationalstrategy.
E&WS(1994b)

Appendices-20
State Location Project Details Findings and Considerations Reference
SouthAustralia
Gumeracha Chlorinated treated wastewater from the WWTP is dis-charged into the River Torrens, which constitutes0.66% total N and 1.96% total P of the total nutrientloss of the river upstream of the Gumeracha weir.
The cheapest land based wastewater re-use optionswere irrigation onto an established vineyard or pineplantation (capital cost est. $200 000). These optionswere cheaper than an increased level of treatment andcontinued discharge to the Torrens River.
E&WS (1994b)
Hahndorf The WWTP has been upgraded. The treated effluent ischlorinated and discharged into Hahndorf Creek, atributary of the Onkaparinga River which flows into theMt. Bold Reservoir.
The treatment plant was commissioned in April 1994and there is a two year creek monitoring program inplace. The original EPA discharge license expired inJune 1994, and the EPA was to decide whether furthernutrient removal will be required before issuing thenew license.
E&WS (1994b)
Heathfield Chlorinated treated effluent is discharged from theWWTP to Heathfield Stream which joins with the SturtRiver. The Sturt River flows via the Adelaide Hills andthe Adelaide Plain and discharges to the Gulf of StVincent at the mouth of the Patawalonga Basin (36.5km from the WWTP).
A creek monitoring program commenced in 1994. Un-suitable terrain for land disposal has made this optioneconomically unfeasible.
E&WS (1994b)
Millicent Treated effluent is discharged into the SE drainagenetwork before entering Lake Bonney.
The coloured effluent from the pulp mill is causes lightto be limiting in Lake Bonney. Now that this effluentwill be treated to reduce colour, the phosphorus fromthe treated municipal effluent may result in algalblooms in the future. Phosphorus removal ($60 000)and continued discharge is more cost effective thanland disposal ($2 800 000).
E&WS (1994b)
Murray–Darling Basin:septic tankserviced towns
The 11 towns (as of 1992) serviced by septic tankswere: Renmark, Paringa, Berri, Loxton, Barmera, Cob-dogla, Walker, Tailem Bend, Meningie, Goolwa andMount Barker.
Septic tank effluent is stored in lagoons and dischargedinto the River Murray under high flow conditions
Department ofEnvironment andLand Manage-ment (1993) Gut-teridge, Haskins& Davey (1992)
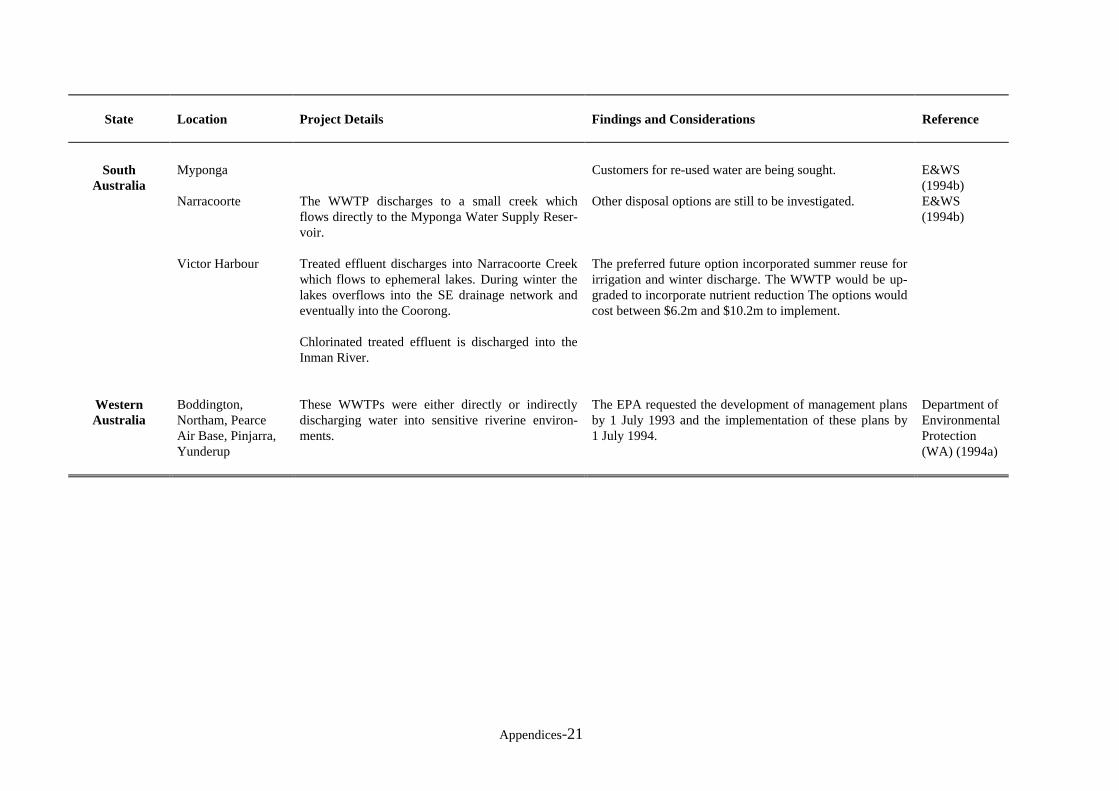
Appendices-21
State Location Project Details Findings and Considerations Reference
SouthAustralia
Myponga Customers for re-used water are being sought. E&WS(1994b)
Narracoorte The WWTP discharges to a small creek whichflows directly to the Myponga Water Supply Reser-voir.
Other disposal options are still to be investigated. E&WS(1994b)
Victor Harbour Treated effluent discharges into Narracoorte Creekwhich flows to ephemeral lakes. During winter thelakes overflows into the SE drainage network andeventually into the Coorong.
Chlorinated treated effluent is discharged into theInman River.
The preferred future option incorporated summer reuse forirrigation and winter discharge. The WWTP would be up-graded to incorporate nutrient reduction The options wouldcost between $6.2m and $10.2m to implement.
WesternAustralia
Boddington,Northam, PearceAir Base, Pinjarra,Yunderup
These WWTPs were either directly or indirectlydischarging water into sensitive riverine environ-ments.
The EPA requested the development of management plansby 1 July 1993 and the implementation of these plans by1 July 1994.
Department ofEnvironmentalProtection(WA) (1994a)
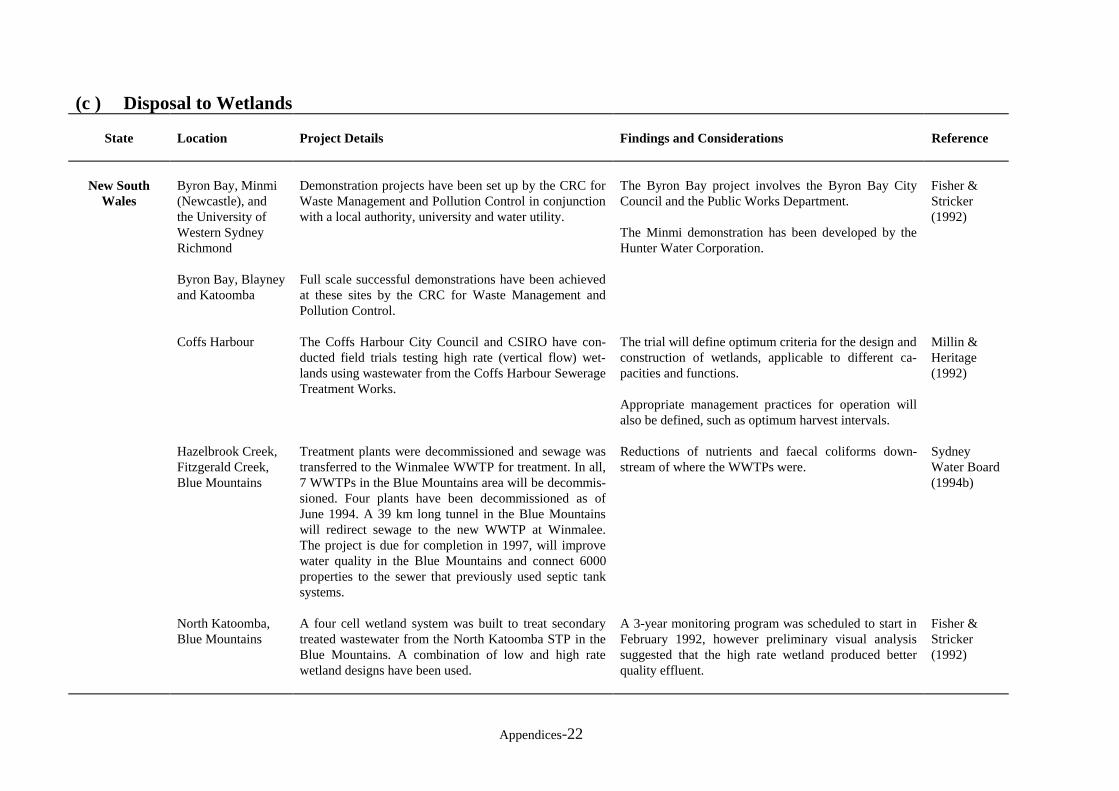
Appendices-22
(c ) Disposal to Wetlands
State Location Project Details Findings and Considerations Reference
New SouthWales
Byron Bay, Minmi(Newcastle), andthe University ofWestern SydneyRichmond
Demonstration projects have been set up by the CRC forWaste Management and Pollution Control in conjunctionwith a local authority, university and water utility.
The Byron Bay project involves the Byron Bay CityCouncil and the Public Works Department.
The Minmi demonstration has been developed by theHunter Water Corporation.
Fisher &Stricker(1992)
Byron Bay, Blayneyand Katoomba
Full scale successful demonstrations have been achievedat these sites by the CRC for Waste Management andPollution Control.
Coffs Harbour The Coffs Harbour City Council and CSIRO have con-ducted field trials testing high rate (vertical flow) wet-lands using wastewater from the Coffs Harbour SewerageTreatment Works.
The trial will define optimum criteria for the design andconstruction of wetlands, applicable to different ca-pacities and functions.
Appropriate management practices for operation willalso be defined, such as optimum harvest intervals.
Millin &Heritage(1992)
Hazelbrook Creek,Fitzgerald Creek,Blue Mountains
Treatment plants were decommissioned and sewage wastransferred to the Winmalee WWTP for treatment. In all,7 WWTPs in the Blue Mountains area will be decommis-sioned. Four plants have been decommissioned as ofJune 1994. A 39 km long tunnel in the Blue Mountainswill redirect sewage to the new WWTP at Winmalee.The project is due for completion in 1997, will improvewater quality in the Blue Mountains and connect 6000properties to the sewer that previously used septic tanksystems.
Reductions of nutrients and faecal coliforms down-stream of where the WWTPs were.
SydneyWater Board(1994b)
North Katoomba,Blue Mountains
A four cell wetland system was built to treat secondarytreated wastewater from the North Katoomba STP in theBlue Mountains. A combination of low and high ratewetland designs have been used.
A 3-year monitoring program was scheduled to start inFebruary 1992, however preliminary visual analysissuggested that the high rate wetland produced betterquality effluent.
Fisher &Stricker(1992)

Appendices-23
State Location Project Details Findings and Considerations Reference
New SouthWales
Rouse Hill Devel-opment Area
Artificial wetlands, covering some 60 ha, will be con-structed to polish effluent from an advanced STP. Thewetlands will be built as ponds along existing streams,using a combination of high and low rate wetland de-signs. Riffle zones, shallow stony-bedded rapids wherefast moving water and effluent becomes oxygenated, willalso be incorporated into the design.
The Treatment plant was opened in April, 1994. TheKellyville WWTP was decommissioned and sewage wasdiverted to Rouse Hill.
Nutrients in the wastewater will be absorbed by reedsand other vegetation.
The riffle zones encourages filamentous algae, fungi,bacteria and other aquatic organisms attached to thestones to further absorb nutrients from the wastewa-ter.
Fisher &Stricker(1992)
Rouse HillDevelopmentArea and You(1993)
Sydney Waterboard (1994b)
Queensland Livingstone ShireCouncil
As of 1994, there are 9 completed pilot constructed wet-lands and 1 pilot wetland under construction for sewagetreatment in Queensland. The ventures were joint be-tween local government and the Queensland Departmentof Primary Industries.
An artificial wetland treatment system was established atEmu Park treatment plant. Reduced nutrients, suspendedsolids and BOD have been reported.
The project focuses on improving the quality of localgovernment effluents in an area extending fromMosman to Blackall to Goondiwindi. Local govern-ment authorities are responsible for the constructionand operation of the wetlands. The drought over thepast four years has been a stimulus for the adoption ofeffluent re-use irrigation schemes. Inflow and outflowis monitored.
QDPI (1994b)
QueenslandDept Envi-ronment &Heritage(1994)
Victoria Broadmeadows,Melbourne
The Shankland Creek Water Quality Improvement Proj-ect constructed a 12 million litre wetland to establish anatural water treatment system using aquatic plants.
MelbourneWater (1994)

Appendices-24
(d) Disposal to land
State Location Project Details Findings and Considerations Reference
New SouthWales
Tamworth Secondary treated effluent is disposed of via the land in-filtration method.
WAWA (1994f)
Murray Darling Ba-sin
35% of treated effluent in the NSW portion of the Mur-ray–Darling Catchment is disposed to land (derived valuebased on disposal to stream – data needs further re-search).
Gutteridge, Haskins& Davey (1992)
NorthernTerritory
Katherine Tertiary treated effluent is evaporated from holdingponds.
WAWA (1994f)
Queensland Noosaville The effluent is treated to secondary level using biologicalfiltration before disposal to dunes.
Queensland DeptEnvironment &Heritage (1994)
Great BarrierReef Marine Park:Hook Island
Heron Island
Lady Elliiot Island
Orpheus Island
Unsatisfactory septic tank disposal.
Secondary treatment of effluent followed by subsoil in-jection.
Secondary treatment of effluent followed by land dis-posal.
Septic tank disposal
Heron, Hook, Lady Elliot and Orpheus Islandswill have to comply by the end of 1996 with theswitch to tertiary treated effluent prior to marinedisposal or irrigation re-use.
Brodie (1994)
Brodie (1994)
Brodie (1994)
Brodie (1994)

Appendices-25
State Location Project Details Findings and Considerations Reference
Queensland Murray–DarlingBasin
Townships in the Murray–Darling Basin that dispose toland: Warwick (pop 9400); Roma (pop 6100); 1 (pop 3–5000); 6 (pop 1–3000); 4 (pop 200–1100); 4 (pop 200).
Gutteridge,Haskins &Davey (1992)
SouthAustralia
Murray–DarlingBasin
See re-use by irrigation for agriculture and recreation.
Victoria Murray DarlingBasin
36 of the 53 WWTPs that dispose of treated wastewaterinto the Murray may also dispose to land. Discharge tostreams occur mainly in winter. Larger towns practicingpartial land disposal are: Bendigo (pop 61400); Mildura(16300); Shepparton (28000); Wangaratta (16500); andWodongo (23000). Mildura plant disposes to land only.
Murray–Darling BasinCommission(1992)
Western Australia
Kwinana, Yan-chep, Bullsbrook,Port MandurahNo. 1, Kennedy,Two Rocks
Eaton, Capel,Busselton No.1,Dunsborough
Mandurah No.1,East Busselton,Halls Head,Australind
Bunbury No.1 andNo.2 WWTP
Effluent from the treatment plants is disposed of by landinfiltration, with water moving down to the ground-water.The typical disposal system involves a series of pondsstoring effluent for a nearby disposal site.
Stabilisation ponds are used to product a secondary treatedeffluent which is discharged on the ground.
Extended aeration plants are used prior to disposal ontoground. While surface monitoring presents no problems,monitoring of groundwater quality is more difficult
Trickling filters are used. Bunbury No.1 discharges via ashort ocean outfall at Rock Groyne. In Jan, 1996 this willbe decommissioned. Effluent flow will be diverted to Bun-bury No.2 where effluent is discharged to land.
The effects of land disposal are more easily measuredfrom the surface. In the case of infiltration, it has theadded benefit of both recharging the groundwater sys-tems and reducing the use of scheme water supplies.
Land disposal has higher infrastructure and treatmentcosts. These plants treat wastewater to either a secondarylevel, or use extended aeration methods.
Pollution and contamination of the land and groundwatercan have significant environmental and health effects.
Land requirements are high, needed for disposal as wellas storage ponds for periods when the land is saturated,and a buffer distance is required to overcome odourproblems.
WAWA(1994e)
WAWA(1994f)

Appendices-26
Appendices-27
APPENDIX C
TABLE OF WASTEWATER RE-USE PRACTICESIN AUSTRALIA, WITH SOME INTER-
NATIONAL EXAMPLES
(a) Re-use of Wastewater for Irrigation to Primary Production – Australia(b) Re-use of Wastewater for Irrigation to Primary Production – International(c) Irrigation for Landscape and Recreation – Australia(d) Irrigation for Landscape and Recreation –International(e) Non-potable Re-use – Australia(f) Non-potable Re-use – International(g) Potable Re-use – International(h) Wastewater Sludge Re-use – Australia(i) Wastewater Sludge Re-use – International(j) Industrial Wastewater Re-use – Australia(k) Industrial Wastewater Re-use – International(l) Re-use of Wastewater for Groundwater Recharge – Australia(m) Reuse of Wastewater for Groundwater Recharge – International
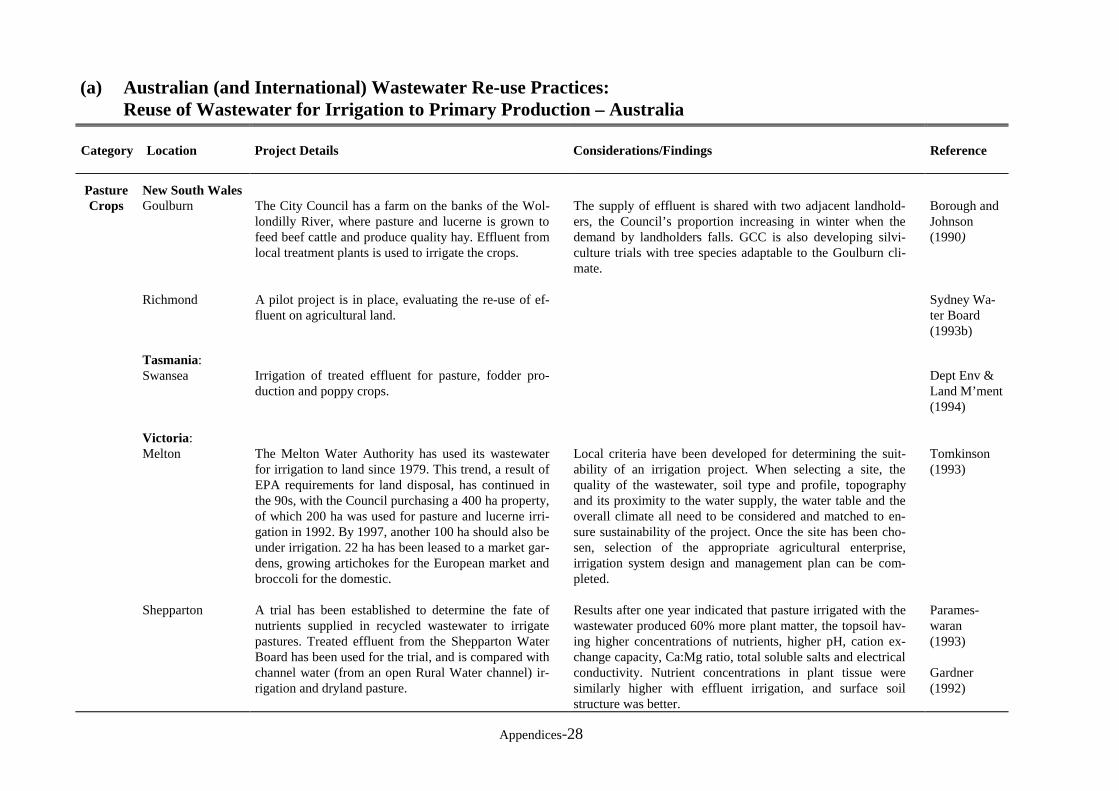
Appendices-28
(a) Australian (and International) Wastewater Re-use Practices:Reuse of Wastewater for Irrigation to Primary Production – Australia
Category Location Project Details Considerations/Findings Reference
PastureCrops
New South WalesGoulburn The City Council has a farm on the banks of the Wol-
londilly River, where pasture and lucerne is grown tofeed beef cattle and produce quality hay. Effluent fromlocal treatment plants is used to irrigate the crops.
The supply of effluent is shared with two adjacent landhold-ers, the Council’s proportion increasing in winter when thedemand by landholders falls. GCC is also developing silvi-culture trials with tree species adaptable to the Goulburn cli-mate.
Borough andJohnson(1990)
Richmond A pilot project is in place, evaluating the re-use of ef-fluent on agricultural land.
Sydney Wa-ter Board(1993b)
Tasmania:Swansea Irrigation of treated effluent for pasture, fodder pro-
duction and poppy crops.Dept Env &Land M’ment(1994)
Victoria :Melton The Melton Water Authority has used its wastewater
for irrigation to land since 1979. This trend, a result ofEPA requirements for land disposal, has continued inthe 90s, with the Council purchasing a 400 ha property,of which 200 ha was used for pasture and lucerne irri-gation in 1992. By 1997, another 100 ha should also beunder irrigation. 22 ha has been leased to a market gar-dens, growing artichokes for the European market andbroccoli for the domestic.
Local criteria have been developed for determining the suit-ability of an irrigation project. When selecting a site, thequality of the wastewater, soil type and profile, topographyand its proximity to the water supply, the water table and theoverall climate all need to be considered and matched to en-sure sustainability of the project. Once the site has been cho-sen, selection of the appropriate agricultural enterprise,irrigation system design and management plan can be com-pleted.
Tomkinson(1993)
Shepparton A trial has been established to determine the fate ofnutrients supplied in recycled wastewater to irrigatepastures. Treated effluent from the Shepparton WaterBoard has been used for the trial, and is compared withchannel water (from an open Rural Water channel) ir-rigation and dryland pasture.
Results after one year indicated that pasture irrigated with thewastewater produced 60% more plant matter, the topsoil hav-ing higher concentrations of nutrients, higher pH, cation ex-change capacity, Ca:Mg ratio, total soluble salts and electricalconductivity. Nutrient concentrations in plant tissue weresimilarly higher with effluent irrigation, and surface soilstructure was better.
Parames-waran(1993)
Gardner(1992)

Appendices-29
Category Location Project Details Considerations/Findings Reference
Turf Farms Western Australia :Yunderup A turf farm is negotiating for the use of
treated wastewater for irrigation purposes.WAWA (1994b)
Vegetablesand
commercialcrops
New South Wales:Dubbo The effluent will be reused for irrigation of
commercial crops on land adjacent to the twotreatment plants, with some water available toirrigate town parks and reserves.
The City has adopted a reuse strategy for wastewater,aimed at eliminating disposal of effluent to the Mac-quarie River by the end of 1994.
Gutteridge, Haskins& DaveyCH2M HILL (1992)
Griffith The new FILTER (Filtration plus Irrigatedcropping for Land Treatment and EffluentReuse) technique developed by CSIRO in-volves physical loosening of the soil andchemical amelioration in the top soil layers tocreate and maintain soil macroporosity. Wa-ter can flow through the soil to a series of in-terconnected drains. Control gates regulatethe rate of leaching from the drains.
This new technique of effluent treatment can be used toirrigate soils with restricted internal drainage on a year-round basis. Irrigation to a soil of low permeability canlead to waterlogging and crop damage. Benefits of thistechnique include the maintenance of watertable depth,and the stripping of nutrients from the water due tocontrolled flow rates through soil. Cropping on landafter such irrigation allows for the removal of nutrientswith harvesting.
CSIRO, Division ofWater Resources(1994)
South Australia:Virginia horticultureregion, Adelaide
Since the 1970s growers in the Virginia areahave used effluent from the Bolivar Treat-ment Plant for growing stock fodder and foodcrops which are cooked or processed beforethey are eaten.
The Virginia Pipeline Scheme was developed in re-sponse to two problems. The Bolivar Sewerage Treat-ment Works were discharging an increasing amount ofeffluent to the Gulf of St Vincent, causing an excessiveaccumulation of nutrients. The result was a decline ofthe sea grass meadows and mangrove forests and envi-ronmental problems in the Port Adelaide River Estuary.Concurrently, growers in the Virginia area were experi-encing water shortages due to over-exploitation of localaquifers. Currently only 10% of the reclaimed water isre-used.
Kahaalp (1994)
Kinhill Engineers(1993)
South AustralianCentre for EconomicStudies (1994)
Camp Scott FurphyPty Ltd (1993)

Appendices-30
Category Location Project Details Considerations/Findings Reference
Vegetablesand
commercialcrops
South Australia:Virginia horticultureregion, Adelaide
There are plans to upgrade the Virginia Pipeline, sothat ocean discharges will eventually cease, with theremaining effluent to be stored for use in summer.Capital cost for additional reticulation to the edge ofthe growers properties will be $30m. Only 200 of the1000 growers have committed to receiving thewastewater. Advantages of adoption would be: thereduction of N and P discharges to the Gulf, therebyreducing pressure on the aquatic environment (saving$4m); increased value of the fishing industry (currentvalue $4m); increased value of the horticultural in-dustry ( $28m increase in production and a further$14m flow on to the wider community). The SAHealth Commission sanctions the project, as long asviral contamination is controlled. The State Govern-ment is deciding on whether to progress with theproject in early 1995.
Victoria :Werribee The Victorian College of Agriculture and Horticul-
ture and Melbourne Water investigated the potentialfor growing Jerusalem artichokes with treated waste-water.
There were no yield reductions and few ill effectsfrom the irrigation. Late in the season some stem rotappeared, and further studies will determine if thefungus causing the rot is effected by the wastewater.Despite this, crops responded well to irrigation, andfurther trials may lead to establishment of commercialcrops of Jerusalem artichokes that in turn help reducethe quantity of effluent released to inland waterways.
Parameswaran(1993)

Appendices-31
Category Location Project Details Considerations/Findings Reference
Woodlots New South Wales:Australian NewsprintMill, Albury
Primary treated effluent is used to irrigate a crop ofPinus radiata, the raw material for its paper manu-facture.
Effluent from the paper plant differs from municipalwastewaters. There are lower concentrations of N andP, and high BOD.
The economic benefits of the scheme include timberproduction and the reduced costs associated with nottreating effluent to tertiary standards.
Borough andJohnson (1990)
Lower Hunter Valley 5000 Eucalyptus grandis were planted in 1992 toremove additional phosphorus loadings resultingfrom the increased capacity of the Branxton Treat-ment Works.
The NSW State Pollution Control Commission tight-ened nutrient discharge standards for effluent frominland wastewater treatment plants. Woodlots havebeen established by the Hunter Water Commission toutilise the excess phosphorus from the secondarytreated effluent.
Ling andDennis (1992)
Wagga Wagga $500 000 has been invested in the Effluent Planta-tion Project which trials the use of wastewater for ir-rigation of woodlots in Wagga Wagga. The projectcommenced in 1991 with the planting of 7600 nativeand exotic trees, and uses wastewater from the CityCouncil’s treatment works, the nearby Royal Austra-lian Air Force base and Forest Hill residents.
This is part of the $20 million waste managementplan that aims to stop effluent discharge to the Mur-rumbidgee River by the year 2000.
Information about the physical and chemical soilproperties, effluent characteristics, climatic data, ex-pected growth/water use, and depth/location of apotable water table is needed to assess the feasibilityof a project site. Changes in soil characteristics, andthe fate of heavy metals and toxins, determines thelong-term viability of effluent irrigation.
Trees irrigated with effluent grow twice as fast asthose without, but may be of a lesser quality.
The rotation period and time to harvest will need tobe short to remove nutrients from the site.
Bennett (1993)

Appendices-32
Category Location Project Details Considerations/Findings Reference
Woodlots South Australia:Berri Winery,Glossop
Since 1986, the wastewaters are settled and screenedbefore being pumped 5 km onto the river plains to a40 000 stand of Eucalyptus camaldulensis. At theBerri Estate, wastewaters were being held in a stor-age and evaporative lagoon at the rear of the site.
The SA State Government required Berri Estate in1984 to establish alternative means of disposal ofdistillery and winery wastewaters.
When the trees are 10 years old a major crowningwill be required. After a further 10 years, the treeswill be replaced with new seedlings.
Kennedy(1992)
Hardwood IrrigatedAfforestation Trial(HIAT)Bolivar, Adelaide
Mount BurrNangwarry
The HIAT Trial was established in 1992 to deter-mine the most suitable tree species and best planta-tion management practices.
The WWTP discharges into a depression/wetland inthe pine plantation.
The shallow saline groundwater table was a site con-straint, limiting the tree species selected for the site.Results to date show high productivity and growthrates, especially for Eucalyptus globulus and E.grandis species. The trees are capable of accumulat-ing nutrients from the wastewater. A number of envi-ronmental changes have been noted. The treatedwastewater seems to be causing cyclic reversals insoil chemical properties between sodic (sodium rich)and saline sodic conditions in the root zone, howeveron a yearly basis the sodic nature is retained. Theleaching of certain key nutrients has also occurred.
The preferred option is to supply drip irrigation for12 months of the year to the pine plantation(estimated cost $75 700 Mount Burr; Nangwarry$103 400).
Hanna et al.,(1992)
Hanna et al.,(1994)
E&WS (1994)
Victoria :Melbourne The Longwarry Wastewater Treatment Plant in SE
Melbourne, treats 0.5ML/day which is irrigated ontoland surrounding the plant.
MelbourneWater (1994)
Mildura The Sunraysia Water Board has established a wood-lot which utilises treated effluent. The area under ir-rigation is soon to grow from 100 to 300 ha.
Eden (1994)

Appendices-33
Category Location Project Details Considerations/Findings Reference
Woodlots Portarlington,Winchelsea
The Geelong and District Water Board has around60 ha of land which will support 150 000 to 160 000trees irrigated with treated effluent from theWinchelsea (0.3 ML/day) and Portarlington (1.3ML/day) Regional Wastewater Treatment Plants.
Semianiw(1990)Vines (1992)
Tatura The Agriculture Victoria project is being conductedin conjunction with Water Authorities and some in-dustries in Northern Victoria. A research project en-titled, ‘The Fate of Nutrients Supplied in WastewaterUsed to Irrigate Pasture’ is being conducted
The main problems with the use of secondary treatedeffluent are: heavy clay soils used for irrigation withwastewater; high sodium content of wastewater; highgroundwater tables and nutrient applications that cancause accessions to wastewater tables.
Keary et al.,(1995)
Western Australia:Albany Treated wastewater is pumped to holding ponds on
the land treatment site, and then distributed over a 14ha overland flow pasture area, to remove 50% of thenitrogen. Runoff from the pasture is diverted to astorage dam, until used to irrigate 300 ha of Euca-lyptus globulus.
Prior to establishment of the woodlot, one of fourtreatment plants in Albany discharged to King GeorgeSound, raising pollution levels.
The cost of the land treatment system was $2.9m. Theannual operating cost has been estimated at $224 000in 1994/5, increasing to $283 000 by 2020. Estimatedincome from harvesting the woodlots is $470 000 –$780 000 pa over the next 25 years. Harvesting willcommence in 1997/8 of 50 ha pa, producing12 000m3 of timber on a 6-year rotation.
Abbott (1993)
Unspecifiedagricultural
use
New South Wales:Richmond A pilot project has commenced which evaluates the
re-use of effluent on agricultural land.Sydney WaterBoard (1993b)

Appendices-34
(b) Reuse of Wastewater for Irrigation to Primary Production – International
Location Project Details Findings & Considerations ReferenceAdditional locations withsimilar projects
Orlando,Florida USA
The Water Conserv II Project is the first exampleof treated wastewater being used to irrigate cropsfor human consumption in Florida. It began in1986/87 and continues today, with high qualitytreated wastewater supplied by the City of Or-lando and Orange County pumped to a distribu-tion centre for storage. About two-thirds of thiswater is supplied to citrus tree growers, the re-maining third disposed of to land by rapid infil-tration basins. Some irrigation water is used oncold nights, sprayed on the trees to prevent frostdamage.
The project operates under a 20-year contractbetween growers and the city and county bindingto the landowner. Under this contract the city pro-vides a guaranteed amount of free, uncontami-nated, reclaimed water. Growers can terminatethis contract if the water has a detrimental impacton the crop. Water allotment can also be increasedor refused on a weekly basis for 4 weeks per year,but for no more than two consecutive weeks. Abuy-out clause is also provided.
This project has worked in conjunction with others (seeinternational groundwater table) to reduce the demandplaced on the Florida aquifer. Water Conserv II hasalso decreased disposal costs and met a zero dischargemandate. The water meets US Environmental Protec-tion Agency Class I reliability requirements, ensuring aclear, odourless, virus-free product that is safe for hu-man contact and does not contaminate groundwater.
A number of studies have been completed over theprojects life to assess the impact of the wastewater onthe trees and their environment. There have been noobvious problems, but rather many obvious benefits.Yields are estimated to have increased by 10–30%,with growth rates of two cultivars of young oranges inone study increasing by 225% and 443%. The increasesin growth and growth rate are associated with greatercanopy growths.
Higher concentrations of nitrogen, phosphorus and so-dium have been found in the leaves of effluent irrigatedcitrus trees, but at levels within the acceptable range.
Soil analyses of the entire soil profile have shownhigher levels of nitrogen and phosphorus, while potas-sium, calcium, magnesium and sodium levels vary an-nually. Soil moisture has also been higher, with overirrigation in the early days of the project causing re-duced sugar contents in the fruit. This was amendedwith better irrigation management.
Jackson &Cross (1993)
Southern California where200 treatment plants supply1000 re-use areas. 1000million ML/day is reusedthroughout California on ag-ricultural irrigation, land-scape irrigation, ground-water recharge and indus-trial reuse (WAWA 1994f).
Tuolumne County WaterDistrict, Sonora Californiabinding contracts for ranch-ers to take water for 20–40years to irrigate their prop-erties (WAWA 1994f).
Adamsville, Tennessee USA
Arizona & Florida, USA(Rose & Gerba, 1991)
Jezreel Valley, Israel(Teltsch et al., 1992)
Near East Region(excluding Israel)(Arar, 1991)
Gabal el Asfar, Egypt
Sicily, Italy

Appendices-35
(c) Irrigation for Landscape and Recreation – Australian
State/Territory Location Project Details Reference
AustralianCapital
Territory
Belconnen
Duntroon
LowerMolongloSTP
SouthwellPark,Lyneham
Reuse of effluent to irrigate grassed areas at the Belconnen Golf Course.
Use of treated effluent to irrigate grassed areas at Duntroon. A long term reuse trial over the last 17 years has beenconducted by CSIRO.
Irrigation of grassed areas surrounding the plant with treated effluent.
A pilot scheme is being trialed involving the reuse of wastewater for irrigation to recreation land. Wastewater flow isextracted from the sewer. It is locally treated using a combination of lime addition, sedimentation, biological treat-ment, membrane filtration and chlorination. The water is then pumped to playing fields for irrigation. Solid wastes arereturned to the sewer for treatment at the Lower Molonglo Water Quality Control Centre. The advantage of the ‘sewermining’ is that treated effluent will not have to be retransported back from the Lower Molonglo WWTP to irrigate thePark. Treated effluent may be used more in Canberra, depending on the success of this trial.
ACTEW (1994b)
ACTEW (1994b)Consulting Envi-ronmental Engi-neers (1994)
ACTEW (1994b)
ACTEW (1994a)
ACTEW(1994b)
New SouthWales
CoffsHarbour
The City Council has use treated wastewater to irrigate playing fields and ovals. R.Siebert, pers.comm.,(2/2/1995)
Junee Treated wastewater is used to irrigate local parks, playing fields, the golf course and the cemetery Gutteridge H &D – CH2MHILL (1992)
LakeCrackenback Village
Effluent generated by the Lake Crackenback Village development, next to the Perisher Ski-tube along Alpine Way, isto be reused for spray irrigation within the Lake catchment area. Four storage ponds are located on the site to hold theeffluent before irrigation occurs. The effluent reuse system satisfies a condition of the development that treated efflu-ent was not to be discharged into the nearby Little Thredbo River.
Gutteridge Has-kins & Davey –CH2M HILL(1992)
Scheyville As part of the move to clean up the Hawkesbury–Nepean catchment, housing developments at Scheyville will reuseeffluent through irrigation of open space. This becomes an alternative disposal option to otherwise discharging efflu-ent into Longneck Lagoon, and the Hawkesbury River.
G H & D –CH2M HILL(1992)

Appendices-36
State/Territory Location Project Details Reference
New SouthWales
Sydney Five golf courses and a race course can each use up to 1 million litres of recycled water per day in dry weather.
The Sydney Water Board (1994) was investigating the potential for re-use at Port Kembla, Kurnell, the Hawkes-bury–Nepean, the industrial area of Camellia and the Olympic Village site.
An effluent reuse scheme incorporating a mixture of zoo effluent, saltwater and stormwater is under constructionusing a biological treatment, double-disinfection process. Most of the funds have been obtained via sponsorship.The reused effluent will be used for cage hose down, moat refill, toilet flushing and irrigation of the zoo’sgrounds. This is the first example of primary contact re-use in NSW and the first zoo in the world to reuse waste-water treated to this level.
Sydney WaterBoard (1993)Sydney WaterBoard (1994)
Queensland Great Barrier ReefMarine Park
Coastal cities outsidethe Great BarrierReef Marine Park:Mulgrave Shire (nearCairns)
Thuringowa City (nearTownsville)
Townsville City
Yeppoon
Pallarenda
Secondary or tertiary treated effluent is used to irrigate resort gardens and or/ golf courses at the following resorts:Bedarra Bay Resort; Brampton Island; Day Dream Island; Dunk Island; Hayman Island; Hamilton Island (40%irrigation); Hitchinbrook Island Resort; Lindeman Island; Lizard Island; Nelly Bay; Community; Radisson LongIsland Resort; Wappaburra Resort
Treated effluent is used to irrigate the Paradise Palms Golf Course.
Effluent is used to irrigate golf courses and there is a policy to reuse all effluent in the future.
50% 0f the effluent is used to irrigate golf courses and beef pasture land.
All effluent is used for golf course irrigation.
An effluent reuse scheme stores effluent from a filter plant in lagoons, which is then used to irrigate a golf courseclose by. Irrigation services were to extend to public open space by the foreshore and the National Parks andWildlife reserve.
Brodie (1994)
Brodie (1994)
Brodie (1994)
Brodie (1994)
Brodie (1994)
Gutteridge,Haskins andDavey (1992)
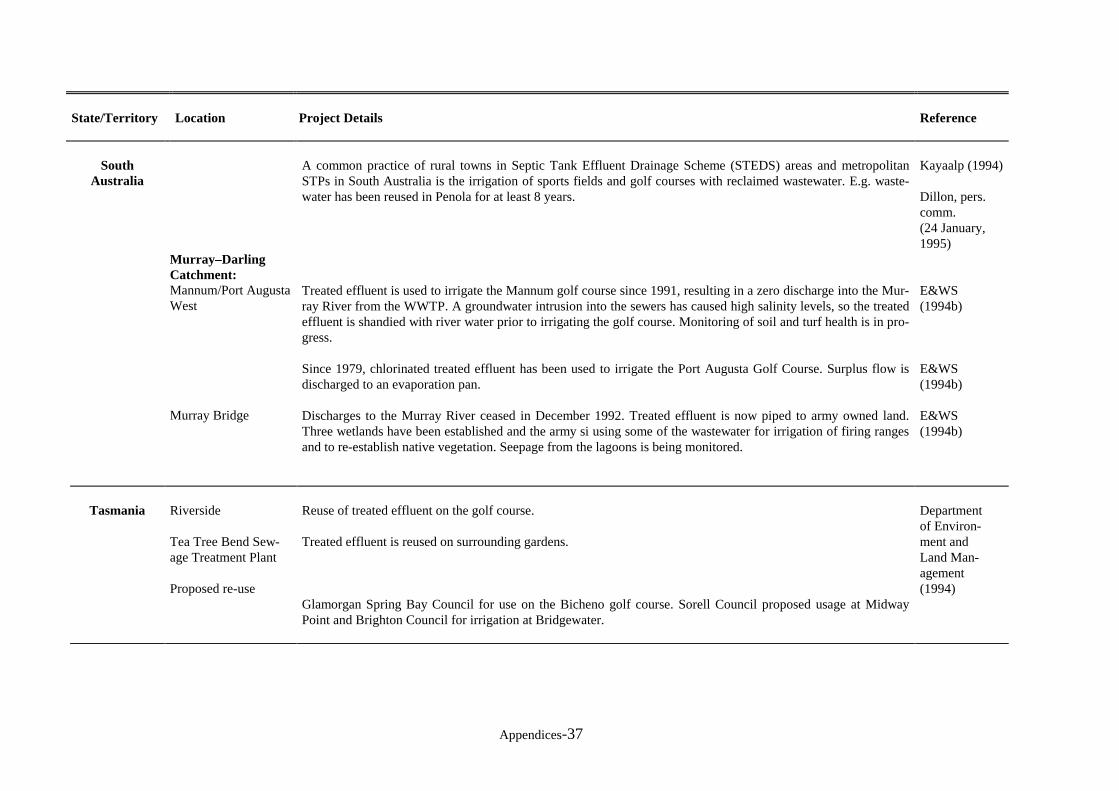
Appendices-37
State/Territory Location Project Details Reference
SouthAustralia
A common practice of rural towns in Septic Tank Effluent Drainage Scheme (STEDS) areas and metropolitanSTPs in South Australia is the irrigation of sports fields and golf courses with reclaimed wastewater. E.g. waste-water has been reused in Penola for at least 8 years.
Kayaalp (1994)
Dillon, pers.comm.(24 January,1995)
Murray–DarlingCatchment:Mannum/Port AugustaWest
Murray Bridge
Treated effluent is used to irrigate the Mannum golf course since 1991, resulting in a zero discharge into the Mur-ray River from the WWTP. A groundwater intrusion into the sewers has caused high salinity levels, so the treatedeffluent is shandied with river water prior to irrigating the golf course. Monitoring of soil and turf health is in pro-gress.
Since 1979, chlorinated treated effluent has been used to irrigate the Port Augusta Golf Course. Surplus flow isdischarged to an evaporation pan.
Discharges to the Murray River ceased in December 1992. Treated effluent is now piped to army owned land.Three wetlands have been established and the army si using some of the wastewater for irrigation of firing rangesand to re-establish native vegetation. Seepage from the lagoons is being monitored.
E&WS(1994b)
E&WS(1994b)
E&WS(1994b)
Tasmania Riverside
Tea Tree Bend Sew-age Treatment Plant
Proposed re-use
Reuse of treated effluent on the golf course.
Treated effluent is reused on surrounding gardens.
Glamorgan Spring Bay Council for use on the Bicheno golf course. Sorell Council proposed usage at MidwayPoint and Brighton Council for irrigation at Bridgewater.
Departmentof Environ-ment andLand Man-agement(1994)

Appendices-38
State/Territory Location Project Details Reference
Victoria Craigieburn The Craigieburn Local Treatment Plant reuses treated effluent during summer and autumn to irrigate thelocal golf course.
Lang (1994)
Melbourne Victoria has two main sewerage treatment plants: Werribee Farm and the South Eastern PurificationPlant (SEPP). During 1992, Melbourne Water estimated around 1 GL of treated effluent from the SEPPwas reused, primarily through irrigation to golf courses near the outfall pipeline. Several racecoursesaround Victoria have also been irrigated with wastewater spray. A study, commissioned by the VictoriaRacing Club and Racecourse Licensing Board, showed that for the seven racecourses examined, therewas a significant build up of nutrients over the period of the trials and water blending would be desirablein most cases.
Sports ovals and wetlands are other reuse destinations for treated wastewater in Victoria.
MelbourneWater (1992)
Eden (1994)
The Victorian State Government has encouraged the disposal of wastewater to land by irrigation wherepractical. Victorian regulations state that water treated to Category Two (wastewater receiving primaryand secondary treatment) can be used for landscape irrigation.
EPA & DCNR (1994)
WesternAustralia Karratha
South West Region
The effluent is treated using secondary ponding techniques before being disposed of via evaporation orirrigation of recreational areas.
Wastewater from Mandurah is treated and then used for irrigation to the local golf course. Negotiationsare under way for the reuse of treated effluent to irrigate a golf course at Caddadup and an oval at Bun-bury.
It is possible for increasing amounts of treated wastewater to be used for irrigation of parks and recrea-tional facilities in the south-west region. However this option can not accommodate all the effluent that isestimated for 2040. Where irrigation is both possible and appropriate, less than 50% is the average pro-portion of total effluent treated that would be reused under this option.
WAWA (1994f)
WAWA (1994b)
WAWA (1994f)
For more than 50 years, 35 inland town councils in rural Western Australia have used secondary treatedand disinfected effluent to irrigate parks and playing fields. Total effluent re-use for these schemes is 8ML/d.
Bingley (1994)WAWA (1994b)WAWA (1994f)

Appendices-39
(d) Irrigation for Landscape and Recreation – International
Location Project Details Findings & Considerations ReferenceAdditional locations withsimilar projects
PebbleBeach,CaliforniaUSA
A $19 million irrigation project will provide sevengolf courses and two recreational areas with sec-ondary treated effluent from the Carmel AreaWastewater Reuse District (CAWD), during an 8-month irrigation-demand period.
The project will bring together the CAWD, thePebble Beach Community Services District, theMonterey Peninsula Water Management Districtand the Pebble Beach Company.
Water will be supplied at the same price as the alterna-tive potable water supply.
The Pebble Beach Company is the major fiscal sponsorof the project, while ownership and operational respon-sibilities belong to the CAWD and the Pebble BeachCommunity Services District.
Five of the seven golf course will require modificationsto their irrigation systems in order to meet County andState regulations for reclaimed water use.
Badani(1993)
Kawasaki City, Japan(Kuribayashi, 1991)
Metropolitan Tokyo, Osaka andTachikawa, Japan (Ohgaki &Sato, 1991)
‘Sewer mining’ by Los AngelesCounty Sanitation District, Cali-fornia, USA (1994)
East Bay Municipal Utility Dis-trict, Oakland California recrea-tional landscaping and industrialreuse (Williams 1995)
Colorado Springs, Colorado,USA. Reused water for parks,education grounds and indus-tries (Williams 1995)
Santee & Arcata, CaliforniaUSA (Hickinbotham, 1994)
Turkey (Sarikaya & Eroglu,1993)
Riyadh, Saudi Arabia 2.6ML/d)for landscape irrigation(WAWA 1994f)
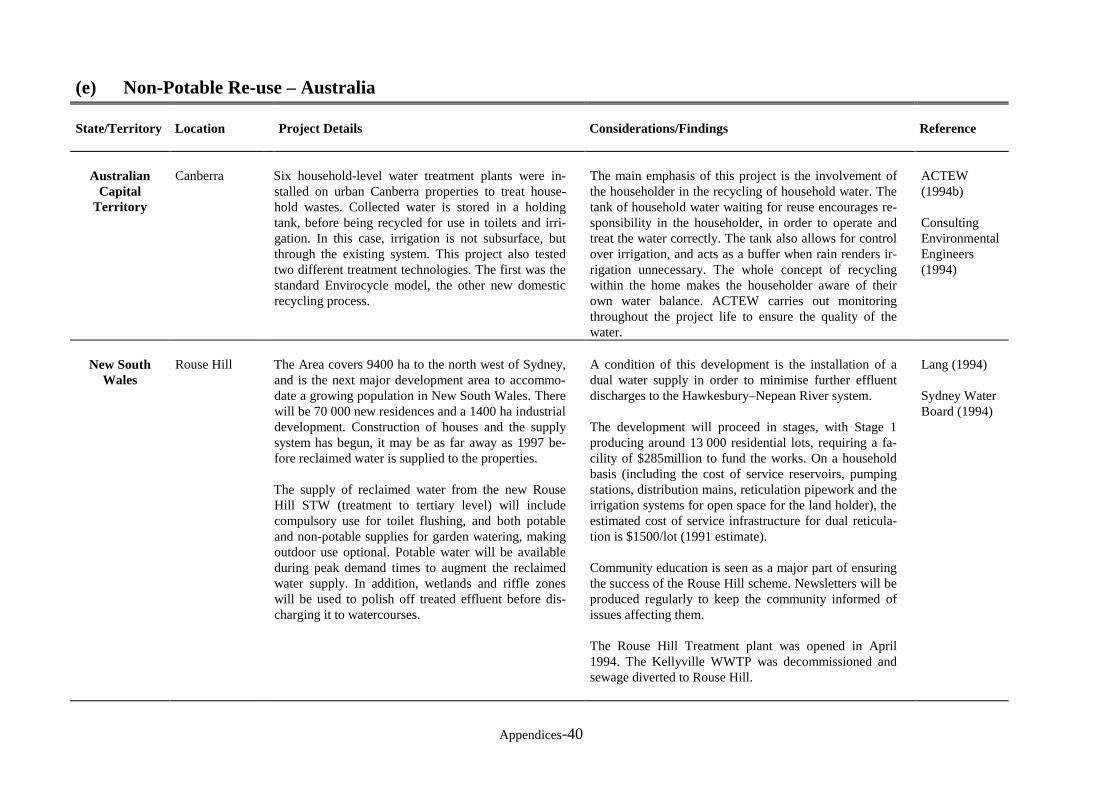
Appendices-40
(e) Non-Potable Re-use – Australia
State/Territory Location Project Details Considerations/Findings Reference
AustralianCapital
Territory
Canberra Six household-level water treatment plants were in-stalled on urban Canberra properties to treat house-hold wastes. Collected water is stored in a holdingtank, before being recycled for use in toilets and irri-gation. In this case, irrigation is not subsurface, butthrough the existing system. This project also testedtwo different treatment technologies. The first was thestandard Envirocycle model, the other new domesticrecycling process.
The main emphasis of this project is the involvement ofthe householder in the recycling of household water. Thetank of household water waiting for reuse encourages re-sponsibility in the householder, in order to operate andtreat the water correctly. The tank also allows for controlover irrigation, and acts as a buffer when rain renders ir-rigation unnecessary. The whole concept of recyclingwithin the home makes the householder aware of theirown water balance. ACTEW carries out monitoringthroughout the project life to ensure the quality of thewater.
ACTEW(1994b)
ConsultingEnvironmentalEngineers(1994)
New SouthWales
Rouse Hill The Area covers 9400 ha to the north west of Sydney,and is the next major development area to accommo-date a growing population in New South Wales. Therewill be 70 000 new residences and a 1400 ha industrialdevelopment. Construction of houses and the supplysystem has begun, it may be as far away as 1997 be-fore reclaimed water is supplied to the properties.
The supply of reclaimed water from the new RouseHill STW (treatment to tertiary level) will includecompulsory use for toilet flushing, and both potableand non-potable supplies for garden watering, makingoutdoor use optional. Potable water will be availableduring peak demand times to augment the reclaimedwater supply. In addition, wetlands and riffle zoneswill be used to polish off treated effluent before dis-charging it to watercourses.
A condition of this development is the installation of adual water supply in order to minimise further effluentdischarges to the Hawkesbury–Nepean River system.
The development will proceed in stages, with Stage 1producing around 13 000 residential lots, requiring a fa-cility of $285million to fund the works. On a householdbasis (including the cost of service reservoirs, pumpingstations, distribution mains, reticulation pipework and theirrigation systems for open space for the land holder), theestimated cost of service infrastructure for dual reticula-tion is $1500/lot (1991 estimate).
Community education is seen as a major part of ensuringthe success of the Rouse Hill scheme. Newsletters will beproduced regularly to keep the community informed ofissues affecting them.
The Rouse Hill Treatment plant was opened in April1994. The Kellyville WWTP was decommissioned andsewage diverted to Rouse Hill.
Lang (1994)
Sydney WaterBoard (1994)

Appendices-41
State/Territory Location Project Details Considerations/Findings Reference
Shoalhaven Heads The Shoalhaven Heads site for a pilot scheme inves-tigating the domestic use of recycled non-potablewastewater, from which a set of guidelines acceptableto regulatory authorities and the public could be de-veloped.
The scheme incorporated 17 houses and operated for16 months, from December 1989 to April 1991.Wastewater from the Shoalhaven Heads treatmentworks was treated to tertiary standard in an effort tomeet National Health and Medical Research Council(NHMRC) 1987 microbiological guidelines for drink-ing water quality. Reclaimed water was then suppliedfree of charge to householders through a dual reticu-lation system, an initiative designed to encourageparticipation in the scheme. Operational problemswere experienced over the life of the project, leadingto either microbiological contamination of the re-claimed water and/or system shut down, mainly dueto algae clogging the filter. As a result the schemewas operational only 92% of the time.
The estimated cost of the scheme was $350 000, withfunding provided by sources within the public sector,with the Shoalhaven City Council operating thescheme and providing other assistance. Council alsoprovided the reclaimed water free of charge, and ret-rofitted the pilot houses.
Project monitoring revealed that: most residents used re-claimed water only for watering gardens; high levels ofsupport for the system despite some persistent concernson the health risk to small children; the level of supportwas attributed to a free supply of reclaimed water, andthe part the residents could play in preserving the avail-ability of potable water supplies; and identical accep-tance levels may not be achieved if residents are chargedfor using the reclaimed water.
Environmental parameters were monitored over the proj-ect, including soil, groundwater and vegetation: Soil pHon land irrigated with wastewater increased from about5.7 to 6.4, a result of the alkaline character of the water;Increases in P in the soil, similarly caused by the natureof the water; Groundwater levels and quality changed lit-tle; and the changing N to P ratio may effect native plantspecies in the future.
The following recommendations were made:• Monitoring is needed to assess environmental impacts• Tests for heavy metals, toxins etc. to be carried outevery 6 months, depending on site characteristics• Soil and groundwater to be monitored every 6 monthsto assess changes due to reusing effluent• Biophysical characteristics and suitability must be con-sidered when selecting a potential reuse site• Vegetation must be inspected regularly, and drainageflows, waterlogging, obvious diseases, deaths, abnormalgrowths and proliferation of weed species recoreded• Attend to odour problems quickly• Monitor nearby waterways to determine any waterquality changes
Lang (1994)

Appendices-42
State/Territory Location Project Details Considerations/Findings Reference
Wagga Wagga Wagga City Council in conjunction with the NSWPublic Works Department have planned a pilot studyproject involving the retrofitting of 100 houses.
The project scale is considered sufficient to allow ade-quate canvassing of community acceptance for reusingwastewater.
Liaison with the Department of Health and thoroughcosting of the project will need to be completed before theproject can proceed.
Lang (1994)
Northern Ter-ritory
Black Point,CobourgPeninsula
A greywater recycling trial is being conducted in theranger houses to assist in the development of a waterconservation program for remote communities.
Conserva-tion Comm-ission of theNorthernTerritory(1994)
South Austra-lia
Adelaide Area:New Haven,LefevrePeninsula
At New Haven, a residential development involvingthe reuse of wastewater for the irrigation of an ovaland gardens, and water for toilet flushing has been ap-proved. The 2 ha site, with 67 houses, will make use ofall water, including stormwater which will be mixedwith treated effluent. Collected wastewater will betreated on site by a small community sewerage treat-ment plant. Water for drinking and on-hose contact istaken from the public mains and supplied via a sepa-rate reticulation system .
Construction at New Haven has commenced Kayaalp (1994)Lang (1994)
Andrews Farm The Andrews Farm program, although smaller thanNew Haven with 27 new houses, will follow a similarreuse plan as the New Haven site. The trial of do-mestic reuse at the site, while approved by the StateGovernment, was yet to be approved by the EPA andDepartment of Health by March, 1994.
Lang(1994)
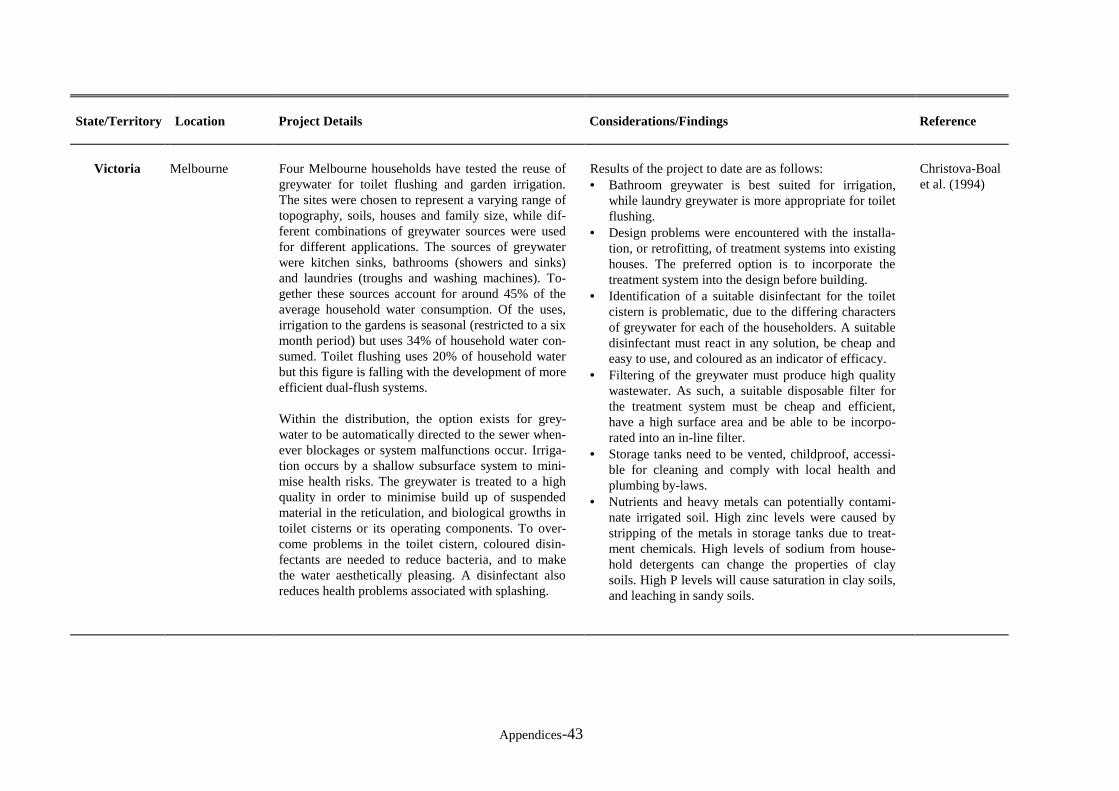
Appendices-43
State/Territory Location Project Details Considerations/Findings Reference
Victoria Melbourne Four Melbourne households have tested the reuse ofgreywater for toilet flushing and garden irrigation.The sites were chosen to represent a varying range oftopography, soils, houses and family size, while dif-ferent combinations of greywater sources were usedfor different applications. The sources of greywaterwere kitchen sinks, bathrooms (showers and sinks)and laundries (troughs and washing machines). To-gether these sources account for around 45% of theaverage household water consumption. Of the uses,irrigation to the gardens is seasonal (restricted to a sixmonth period) but uses 34% of household water con-sumed. Toilet flushing uses 20% of household waterbut this figure is falling with the development of moreefficient dual-flush systems.
Within the distribution, the option exists for grey-water to be automatically directed to the sewer when-ever blockages or system malfunctions occur. Irriga-tion occurs by a shallow subsurface system to mini-mise health risks. The greywater is treated to a highquality in order to minimise build up of suspendedmaterial in the reticulation, and biological growths intoilet cisterns or its operating components. To over-come problems in the toilet cistern, coloured disin-fectants are needed to reduce bacteria, and to makethe water aesthetically pleasing. A disinfectant alsoreduces health problems associated with splashing.
Results of the project to date are as follows:• Bathroom greywater is best suited for irrigation,
while laundry greywater is more appropriate for toiletflushing.
• Design problems were encountered with the installa-tion, or retrofitting, of treatment systems into existinghouses. The preferred option is to incorporate thetreatment system into the design before building.
• Identification of a suitable disinfectant for the toiletcistern is problematic, due to the differing charactersof greywater for each of the householders. A suitabledisinfectant must react in any solution, be cheap andeasy to use, and coloured as an indicator of efficacy.
• Filtering of the greywater must produce high qualitywastewater. As such, a suitable disposable filter forthe treatment system must be cheap and efficient,have a high surface area and be able to be incorpo-rated into an in-line filter.
• Storage tanks need to be vented, childproof, accessi-ble for cleaning and comply with local health andplumbing by-laws.
• Nutrients and heavy metals can potentially contami-nate irrigated soil. High zinc levels were caused bystripping of the metals in storage tanks due to treat-ment chemicals. High levels of sodium from house-hold detergents can change the properties of claysoils. High P levels will cause saturation in clay soils,and leaching in sandy soils.
Christova-Boalet al. (1994)

Appendices-44
State/Territory Location Project Details Considerations/Findings Reference
Western Australia
Palmyra A block of Homeswest aged persons units were sel-ected to test the reuse scheme. Under this scheme,bath, hand basin, shower, laundry and kitchen sinkwater is collected from the units, treated by a biologi-cal treatment unit on the site. The treated wastewateris chlorinated before it is stored in tanks (located inthe ceiling spaces of the houses) for use in toilets, thesurplus used to irrigate a dedicated area of the site.Blackwater continues to be pumped to the main sewerserving the property, with the greywater also con-nected to the sewer to allow for diversion of effluentif trouble occurs.
The domestic treatment units must be easy to check andmonitor, so that an informed lay-person can deal withany minor problems that arise.
Environmental Health Department regulations requirethat the irrigation site, containing trees and shrubs, isfenced-off from the public.
Over the course of the scheme, the quality of the water,the functioning of the equipment and the health of thehouseholders will be monitored. The project has beenapproved in principle, subject to maintenance, quality,and health standards being achieved.
Bingley (1994)

Appendices-45
(f) Non-Potable Reuse – International
Location Project Details Findings & Considerations ReferenceAdditional locations with similarprojects
AltamonteSprings,Florida USA
‘Project Apricot’ provides treated wastewaterfor all non-potable uses to every developedproperty in the Altamonte Springs service area.The project included retrofitting of establishedneighbourhoods, using trenchless constructionmethods to avoid disruptions, and to lowercosts.
The wastewater is treated to a high quality, andsupplied at 40% of the price of potable water.No connection fees are charged.
During project development, regulatory authori-ties resisted change in order to protect potablewater supplies. This was overcome by imple-menting a program to deal with the control ofcross-connection areas, inspection methods andother issues raised. In the interests of safety, re-quirements for infrastructure and operations wentbeyond the state regulations and permit condi-tions.
A public education program was initiated to culti-vate community acceptance of the project. ProjectApricot representatives outlined the long-termbenefits at public gathering and through a numberof videos.
Newnham(1993)
St Petersburg, Florida USA dual re-ticulation system 75 ML/d (1/3) ofcity’s water supply being reclaimedand used by 6000 customers to irri-gate 2000 ha parks, golf courses andresidential gardens. Threat togroundwater by saltwater intrusionmotivated this scheme.(Hickinbotham, 1994) (WAWA1994f)
Irvine Ranch Water District, USA(Hickinbotham, 1994)
Grand Canyon Village, ArizonaUSA. Oldest scheme in USA (1926)(Hickinbotham, 1994) (Williams,1995)
West Basin Municipal Water District(1995) consisting of three recyclingschemes: West Basin (largest inUSA); Century Recycled Water Proj-ect (Los Angeles County); and RioHondo Recycled Water Project(Williams, 1995).
City State of Singapore(Ng &Chia, 1991)(Chin & Ong, 1992)
China (Zhongxiang, 1991)

Appendices-46
(g) Potable Reuse – InternationalLocation Project Details Findings & Considerations Reference Additional locations
with similar projects
Denver,ColoradoUSA
Since 1984, the Denver Potable Water ReuseDemonstration Plant has been operational.Unchlorinated secondary effluent from the met-ropolitan Denver Wastewater Treatment Facil-ity. The treatment processes then applied weredesigned to increase reliability by incorporatingmultiple safety barriers. These ensure that nosingle process is completely responsible for theremoval of any single contaminant.
The project was completed in 1991. A full-scale plant has not been built because cheaperfresh water supplies are still available.
The project was motivated by forecasts of Denver’sdemand for water resources exceeding the availablesupply. After considering the alternatives, potable re-use of wastewater was found to be the only option thatcould utilise the volume of imported water.
Results from water quality and health effects testingwere compared to the quality of the present drinkingwater supply, in addition to national and internationalstandards for drinking water quality. For measurableconstituents, such as chemical parameters and elementconcentrations, the water quality of the reclaimed po-table water equalled or exceeded that of the existingsupply. Preliminary results from health effects testingshowed no health effects associated with the water.
Rogers & Lauer(1992)
Bouwer (1992)
(WAWA 1994f)
City of San Diego,California USA(Thompson et al., 1992)Potable Reuse History,United States (Hamann& McEwen, 1991)
Indirect Potable Reuse:
Upper Occoquan, Vir-ginia USA(Hickinbotham, 1994)Whittier Narrows, Cali-fornia USA(Hickinbotham, 1994)
El Paso,Texas USA
The El Paso Water Utilities Public ServiceBoard has been treating wastewater from theFred Hervey Water Reclamation Plant to pota-ble quality since 1985, and using it to replenishdrinking water supplies.
The wastewater is treated to a secondary stan-dard before undergoing a number of advancedprocesses. The water is then injected throughwells to an aquifer, from where it can be ac-cessed for municipal use.
The motivation for this reuse project came from thedepletion of the Hueco Bolson aquifer, the source of60% of El Paso’s water.
The treatment process is subject to a strict monitoringprogram. Each step of the advanced treatment processis monitored, thus allowing for re-treatment of waste-water if any steps fail. Monitoring continues after thewater has left the reclamation plant and reached thereservoir.
The planning and construction of this project was ac-companied by the formation of a citizens advisorygroup, which allowed for community input.
Bouwer (1992) Windhoek, Namibia(Hickinbotham, 1994)

Appendices-47
(h) Wastewater Sludge Re-use – Australia
State/Territory Location Project Details Considerations/Findings Reference
New SouthWales
Cronulla
The sludge is treated and recycled into biosolidproducts, including soil conditioners and organicfertiliser. The main uses of the products are com-posting, agriculture, forestry and mine site and landrehabilitation. The ‘N-Viro Soil’ product is madefrom sludge generated by the North Head treatmentplant. The product has been used mainly for com-posting and agricultural applications. Examples ofsludge used on mine sites are projects at the Saxon-vale and Ravensworth Mines in the Hunter Valley,and the Spring Creek Quarry in Wollondilly. In bothcases the sludge is used in the re establishment ofpastures and natural vegetation.
Sludge disposal to ocean and incineration hasceased.
Biosolids have been used on acidic agricultural soils:for example, where limed biosolids have been ap-plied; at rehabilitation sites such as Springwood GolfCourse; at coal mining and quarry sites; and land-scaping of the third runway at Sydney Airport.
Biosolids from Cronulla and Bondi are dewatered atCronulla before being trucked to forests for applica-tion to the soil. 15 truckloads of sludge are producedper week.
Sludge regulationsHealth issuesUses of the sludge (refer text)
70% of sludge is recycled and used as: compost;limed products for NSW acid soils; dried products tobe used as commercial fertilisers; liquid productsadded to commercial fertilisers; and dewatered prod-ucts high in organic matter to increase water holdingcapacity of soils.
Bondi is about to upgrade its process to include de-watering.
Sydney WaterBoard (1993b)Sydney WaterBoard (1992c)
Sydney WaterBoard (1994c)
EPA (NSW)1994

Appendices-48
State/Territory Location Project Details Considerations/Findings Reference
Queensland The Queensland Department of Health requiressludge to be stockpiles for 1 year before use. Sludgeused to grow food crops are under stricter regulationto ensure that heavy metals and organic pollutantsare not passed up the food chain.
Beavers (1993)
SouthAustralia
Sludge collected from the drying lagoons at BolivarSewerage Treatment Complex is stockpiled anddried.
Fertiliser plants use this dry sludge, after further heattreatment to disinfect the waste, as a fertiliser baseor a soil conditioner. Approval for this re-use beganin the 1960s, and users of the products include carrotfarmers in the Virginia region and Riverland citrusgrowers. Other South Australian examples includethe production of bricks, 500 tonnes of sludge beingsupplied annually to a brick-making company. Longterm mine-site rehabilitation using sludge from EWStreatment plants occurs at Brukanga, an option rec-ommended in the 1990 EWS report. Future uses tobe developed involve sludge used in woodlots andfor landscaping.
A study undertaken by the EWS in 1990 recom-mended that ocean disposal of sewage sludge shouldbe eliminated. This was to be achieved by transfer-ring sludge from the Glenelg and Port Adelaide Sew-age Treatment Works (STW) to the Bolivar STW,where sludge handling facilities would be upgraded.Reuse and disposal alternatives were also to be de-veloped. A number of the alternatives identified inthe report have since been carried out.
Camp ScottFurphy (1993)
Gobbie (1991)
Kayaalp (1994)
Tasmania GlenorchyHobart
Composting trials are underway at the Hobart andGlenorchy tips and experimental work with sludgeinjection of sewage and selected industrial wastes byprivate operators.
Department ofEnvironmentand LandManagement(1994)

Appendices-49
(i) Wastewater Sludge Reuse – International
Location Project Details Findings & Considerations Reference Additional locationswith similar projects
New YorkCity, USA
The City of New York has developed a $2 billion,3-stage, sludge-management plan that replacesocean dumping of sewage sludge with beneficialreuse options. The agency responsible is the NewYork City Department of Environmental Protection(DEP).
Stage I involved the design and construction of 8dewatering facilities costing $689 million, to allowfor sludge movement to intermediate processing fa-cilities and/or reuse sites.
Under Stage II, contracts were given to privatecompanies to manage the City’s sludge until June1998, allowing the ocean dumping of sludge tocease in 1992. The dewatered sludge is taken fromNew York State to a remote composting facility,used in other states for agriculture and in minedland reclamation purposes. A thermal drying planthas been constructed in the Bronx for thermal dry-ing of the sludge to produce fertiliser pellets.
The long term plan is stage III, and requires that theCity become responsible for owning and operatingits entire sludge management program by June 30,1998. DEP began this plan in 1991, which involvessiting and construction of sludge processing facili-ties that will create beneficial products, marketingstrategies for products developed and the develop-ment of new process technologies. The main usesfor sludge under this plan are composting in thecity, chemical stabilisation for landfill cover andthermal drying to produce fertiliser pellets and soilamendments.
The Ocean Dumping Ban Act (ODBA) of 1988 hasbeen the motivating factor for both the New York CityDEP and other states to change their sludge disposalpractices. New York City signed a consent decree withthe US Environmental Protection Agency in August1989, agreeing to the 3-stage plan. New York City wasgiven until June 30, 1992 to end ocean dumping ofsludge.
The City of New York established a Citizens AdvisoryCouncil (CAC) on sludge management. Representa-tives on the committee came from public interest citi-zen organisations, environmental groups, localactivists, the business community and elected officials.The CAC worked as an independent body advising theDEP of community responses towards aspects of themanagement plans. The Council favoured beneficialreuse options as opposed to land disposal, and encour-aged the DEP in this direction. Involvement in the longterm plan was limited to developing a set of criteria forthe DEP to use when selecting sites for the sludgetreatment facilities. With the announcement of pre-ferred sites, the role of the CAC was to inform andeducate the communities affected.
While the reliance on landfills as a means of sludgedisposal will decrease with implementation of the longterm plan, they will remain a viable option. Long-termfacilities will handle 50% of New York’s sludge by theend of 1995, the remainder by mid-1998. The DEP isinvestigating new applications for their sludge prod-ucts. One such project is the use of sludge to fertilisecorn crops whose ethanol (known as ‘gasohol’) contentcould be used as an alternate fuel source.
Austin (1992)
Bender (1992)
Clark (1992)
City of Los Angeles,USA (Goldstein, 1992a)(Goldstein, 1992b)
Martinez, California,USA(Austin, 1992)
Sayreville, New Jersey,USA (Austin, 1992)
St. Paul, Minnesota,USA(Austin, 1992)
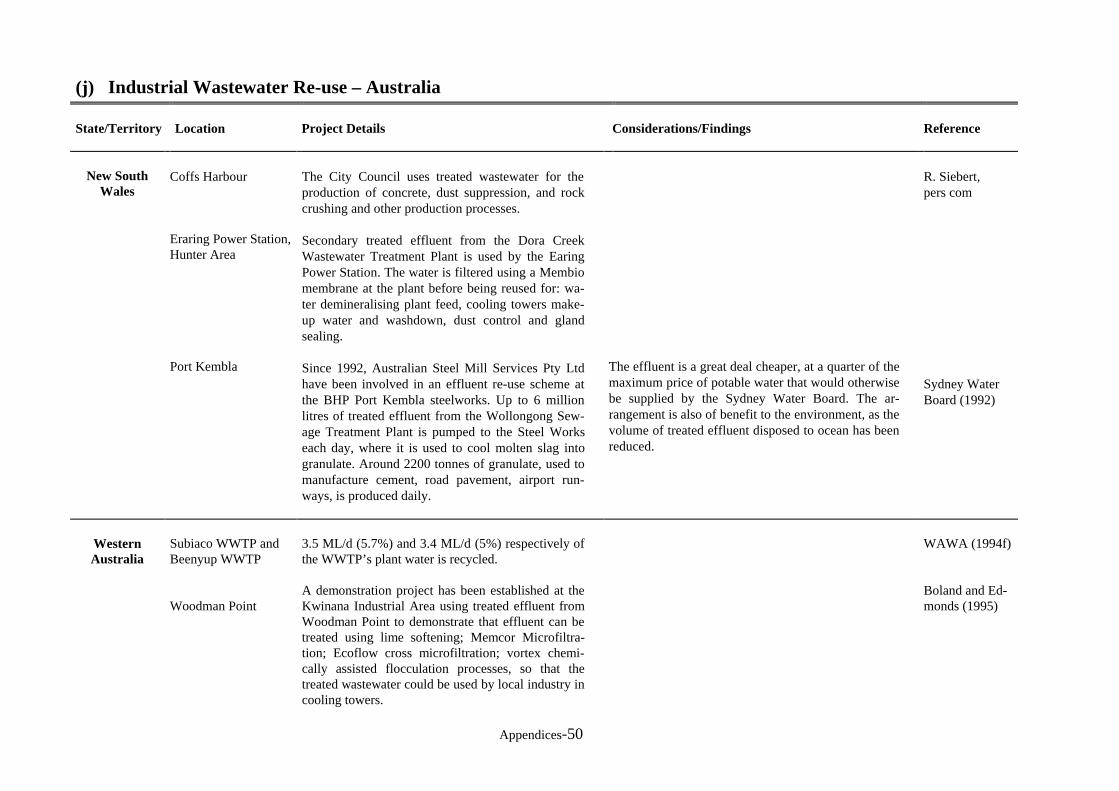
Appendices-50
(j) Industrial Wastewater Re-use – Australia
State/Territory Location Project Details Considerations/Findings Reference
New SouthWales
Coffs Harbour
Eraring Power Station,Hunter Area
Port Kembla
The City Council uses treated wastewater for theproduction of concrete, dust suppression, and rockcrushing and other production processes.
Secondary treated effluent from the Dora CreekWastewater Treatment Plant is used by the EaringPower Station. The water is filtered using a Membiomembrane at the plant before being reused for: wa-ter demineralising plant feed, cooling towers make-up water and washdown, dust control and glandsealing.
Since 1992, Australian Steel Mill Services Pty Ltdhave been involved in an effluent re-use scheme atthe BHP Port Kembla steelworks. Up to 6 millionlitres of treated effluent from the Wollongong Sew-age Treatment Plant is pumped to the Steel Workseach day, where it is used to cool molten slag intogranulate. Around 2200 tonnes of granulate, used tomanufacture cement, road pavement, airport run-ways, is produced daily.
The effluent is a great deal cheaper, at a quarter of themaximum price of potable water that would otherwisebe supplied by the Sydney Water Board. The ar-rangement is also of benefit to the environment, as thevolume of treated effluent disposed to ocean has beenreduced.
R. Siebert,pers com
Sydney WaterBoard (1992)
WesternAustralia
Subiaco WWTP andBeenyup WWTP
Woodman Point
3.5 ML/d (5.7%) and 3.4 ML/d (5%) respectively ofthe WWTP’s plant water is recycled.
A demonstration project has been established at theKwinana Industrial Area using treated effluent fromWoodman Point to demonstrate that effluent can betreated using lime softening; Memcor Microfiltra-tion; Ecoflow cross microfiltration; vortex chemi-cally assisted flocculation processes, so that thetreated wastewater could be used by local industry incooling towers.
WAWA (1994f)
Boland and Ed-monds (1995)

Appendices-51
State/Territory Location Project Details Considerations/Findings Reference
Victoria Commercial PolymersPty Ltd
Commercial Polymers Pty Ltd (Compol) producespolyethylene resins. Since 1974, recycling ofwastewaters from the plant has occurred aftertreatment by an activated sludge plant. The treatedwastewater supplements the water supply in thecooling tower basin, and when a high level isreached, it is diverted to irrigation of woodlots orthe Compol gardens.
The ‘urban forest’ was planted in 1984 with over1000 native trees. This has grown with the addi-tion of a further 2000 trees. A holding dam wasbuilt on the site to store irrigation water. Watercaptured by the dam during winter is pumped backto the plant for use in cooling towers during thesummer, ensuring that the drain does not becomeoverstocked.
The development of land reuse was in response toMcKie & Clements (1991) and discharge limits im-posed by the EPA Victoria. Clements (1991) aimed atreducing wastewater disposal in the nearby KororoitCreek. Compol had 37 ha of suitable land available fordisposal purposes, and therefore followed the EPA’spreferred alterative of land disposal / reuse. The damalso supports a population of fish and birds. So far, tis-sue analysis of fish inhabiting the dam has shownheavy metal concentrations well below NHMRC stan-dards. Similarly, the soil and water quality are belowrelevant guidelines for contaminant levels.
In 1990, Compol estimated that they had saved$51 000 in potable water that would otherwise havebeen purchased for use in the cooling tower. In termsof operating costs, reuse within the plant was estimatedat $10 000 per annum, while the alterative option ofconnecting the municipal sewer would equal $160 000per annum given fixed and variable charges.
McKie &Clements (1991)

Appendices-52
(k) Industrial Wastewater Reuse – International
Location Project Details Findings & Considerations ReferenceAdditional locationswith similar projects
JurongIndustrialEstate,Singapaore
The rapid urbanisation and industrialisation ofSingapore Island has increased both the demandfor potable water supplies and the incentive toreuse treated wastewater. The Jurong IndustrialEstate began in the 1960s, with treated waste-water from the Ulu Pandan Sewage TreatmentWorks supplying the Jurong Industrial WaterWorks. The Water Works treat this wastewaterusing a variety of chlorination, aeration and fil-tration processes producing water of a lowerquality than potable supplies that is availablefor industrial use. Another example of industrialreuse is the Tuas Industrial Estate.
As at 1992, 42 industrial premises on both theJurong and Tuas Estates were reusing the re-claimed water. The main water uses were forcooling (28%), general washing (8%), andprocess applications (paper industry 43% andthe textile industry 7%).
Wastewater not reused from the Ulu Pandan SewageTreatment Works is disposed of in the mouth of theJurong River. The other five treatment works in Sin-gapore similarly dispose of effluent to the surround-ing seas.
Conditions governing the reuse of this wastewatercan be summarised as:• water only to be used in industries not involved in
food or pharmaceuticals production• the industrial water is not to come in contact with
potable supplies, and should be clearly differenti-ated on the basis of different coloured supplypipes, and.
• any installation and extension work on the pipesto be approved and carried out by the relevantbodies.
Industries within the estates requiring higher qualitysupplies have installed their own treatment facilitiesto upgrade the water to meet such requirements. Themost common treatment processes used are reverseosmosis and electrodialysis.
Ng & Chia (1991)
Chin & Ong (1992)
China (Zhongxiang & Yi,1991)
East Bay Municipal Util-ity District, OaklandCalifornia. Recreationallandscaping and indus-trial reuse (Williams1995)
Colarado Springs, Colo-rado, USA. Reused waterfor parks, educationgrounds and industries(Williams 1995).Russellville, KentuckyUSA (Reily & Wojnar,1992)
Singapore Island(Chin & Ong, 1991)(Chin & Ong, 1992)
Riyadh, Saudi Arabia20ML/d at an oil refinery(WAWA 1994f)

Appendices-53
(l) Reuse of Wastewater for Groundwater Recharge – Australia
State/Territory Location Project Details Considerations/Findings Reference
Victoria Carrum Pilot evaluating recharging effluent, using treatedsewage effluent.
Lakey(1978)
SouthAustralia
Adelaide Experimental evaluation of aquifer recharge usingtreated stormwater and wastewater for subsequentrecovery and second-class re-use.
Preliminary trials at Andrews farm have indicated thatthere is potential for rapid rates of injection. Further re-search will evaluate microbiological aspects, includingclogging and pathogens.

Appendices-54
(m) Reuse of Wastewater for Groundwater Recharge – International
Location Project Details Findings & Considerations ReferenceAdditional locationswith similar projects
OrangeCounty,CaliforniaUSA.
Water Factory 21 (WF-21) was built by the Or-ange County Water District (OCWD) in the early1970s. Secondary treated wastewater from theOrange County Sanitation Districts is used byWF-21 to produce tertiary quality effluentthrough advanced treatment processes, includinggranular activated carbon (GAC) and reverse os-mosis (RO). This water has consistently met allapplicable state and federal drinking water stan-dards when injected as a blend of reclaimed anddeep-well water into the County groundwater ba-sin. This replenishment of groundwater suppliesaugments Orange County’s domestic water supplyand prevents saltwater intrusion.
Groundwater monitoring over the projects life hasfound no degradation of the groundwater qualityby chemicals or microorganisms.
In November 1991 the WF-21 became the firstproject of its kind to gain approval to inject 100%reclaimed water for groundwater recharge. Thisapproval was given subject to certain conditionsbeing met.
The WF-21 project was driven by the high demand forgroundwater resources from the Orange County basin.The falling groundwater level was allowing salt waterintrusion from the Pacific Ocean. The blend of deep-well and reclaimed water was injected into the ground-water through a series of wells, creating a hydraulicbarrier to the impinging salt water.
The conditions of approval for the 100% reclaimedwater injection were set by the State Department ofHealth Services (DHS). These were:• Water standards are to be met by the injected water.
Specifically, total organic carbon (TOC) and totalnitrogen shall not exceed 2mg/L and 10mg/L. TheOCWD will achieve this by increasing the propor-tion of wastewater treated by reverse osmosis (RO).The current blend using equal proportions ofwastewater treated by RO and VAC combined withthe deep-well water, occasionally exceeds theselimits.
• The treatment process must comply with state re-quirements for filtered tertiary effluent
• The construction of new domestic water supplywells is not allowed within 610m of injection wells
• The maximum amount of injected water allowed is1095 L/s, the maximum for reclaimed water lowerat 789 L/s.
• The OCWD are responsible for conducting an ap-proved study of the impact of injecting 100% re-claimed water into the groundwater basin. Annualreports are to be published reporting any findings.They must also submit an operating plan to theDHS for approval.
Conklin et al., (1995)
Mills (1993)
(WAWA 1994f)
Vendee, France(Legeas et al., 1992)
Hollywood, FloridaUSA(Fuqua et al., 1992)
Israel (Kanarek et al.,1993)
Atlantis, South Af-rica(Wright & Parsons,1994)
Hays, Kansas USA(Gresh & Henson,1993)
Phoenix, ArizonaUSA(Bouwer, 1991)

APPENDIX D
NATIONAL EFFLUENT RE-USE
SURVEY QUESTIONNAIRE

SURVEY OF EFFLUENT DISCHARGE PRACTICESPART 1
SUMMARY FOR ALL TREATMENT PLANTS WITHIN THE STATE,TERRITORY OR AUTHORITY’S AREA.
(Please tick boxes where appropriate)
2. Information sought in survey
Please provide summary information for all Treatment Plants under the jurisdiction ofthe State, Territory or Authority in questions 3 to 9. Some views on the factorsinfluencing wastewater use are sought in questions 10 to 12
Please also provide specific details of each Treatment Plant with discharge greaterthan 3 Ml/day in separate questionnaire sheets headed “Survey of EftluentDischarge Practices - *Individual Treatment Plants”.
3.
4. Volumes of wastewater received and anticipated.Now .................... Ml/ann.By year 2000 ................... Ml/ann.By year 2020 .................... Ml/ann.
5. Present overall levels of treatment and disinfection.
(b)DisinfectionNo disinfectionChlorinationU/V radiationLagooningOther means

6. Annual volumes of effluent** discharged from Plants.
To land** (ref. item 7)For direct re-use (item 8)To inland/fresh waters
(item 9)To coastal watersTotal
Now By 2000 By 2020............ Ml/ann ............ Ml/ann ............ Ml/ann............ Ml/ann ............ Ml/ann ............ Ml/ann
............ Ml/ann ............ Ml/ann ............ Ml/ann
............ Ml/ann ............ Ml/ann ............ Ml/ann
............ Ml/ann ............ Ml/ann ............ Ml/ann
7. Volumes of effluent or wastewater discharged to land**.
Now By 2000 By 2020
Note: **Include raw or partially treated wastewater discharged to land for treatmentpurposes on site.

8. Volumes of effluent for direct re-use.
Now By 2000Nature of use:-On site Plant purposes ............ Ml/a ............ Ml/aIndustrial ............ Ml/a ............ Ml/aThird pipe urban ............ Ml/a .......... ..Ml/ aAquaculture/mariculture ............ Ml/a ............ Ml/aOrnamental water bodies ............ Ml/a ............ Ml/aGroundwater recharge
by injection ............ Ml/a ............ .Ml/aOther .. . . . . . . . . . . . . . . . . . . . . . . . . . . . . . . . . . . . . . . .Ml/a ............ Ml/aOther. . . . . . . . . . . . . . . . . . . . . . . . . . . . . . . . . . . . . . . . . Ml/a ............ Ml/a
By 2020
........... Ml/a
........... Ml/a
........... Ml/a
9. Volumes of effluent discharged to inland/fresh waterways
Now .................... Ml/ann.By year 2000 .................... Ml/ann.By year 2020 .................... Ml/ann.
Are beneficial uses presently made of the waterways ? Yes / No
If yes, for what purpose(s) ? Please tick squares.
Irrigated agriculture(includ. forestry etc)Urban Water SupplyRecreation,fishing,boating,etcCommerce,tourismProtection of aquatic environmentOther conservationIndustrial purposesOther
Now Futureq qq qq qq qq qq qq qq q

Ruralqq
qqqqqqqq
11. What Federal and/or State Government initiatives do you consider would promotegreater re-use or use of wastewater? (Please tick up to 5 items for each of urban andrural).
12. Does the State/Territory/Authority have available recent relevent scientific orcommunity studies or surveys which would help to overcome impediments or assistwith initiatives for greater use or re-use of wastewater e.g. public attitude surveys,epidemiological studies?
Yes/No
If available, please list documents:-...................................................................................................................................................................................................................................................................................................................................................
13. Contact person within the State/Territory/Authority
Name .............................................................................Title. ................................................................................................................Phone .................................... .Facsimile. ............................... .Date ...................

LIST OF TABLES
Table 1. Current and expected discharges of sewage effluent to coastal waters(including estuaries) 1994–2020 (GL/yr). 9
Table 2. Comparison of stormwater runoff volumes with sewage discharges:selected coastal cities (GL) 10
Table 3. Current and expected discharges of sewage effluent to inland/fresh waters(including estuaries) 1994–2020 (GL/yr) Error! Bookmark not defined.14
Table 4. Beneficial uses of waters receiving discharges of sewage effluent (by state) 15
Table 5. Treatment systems used to remove major contaminants found in wastewater 26
Table 6. Constituent removal by advanced wastewater treatment operations and processes27
Table 7. Estimated capital recovery rates under the Rouse Hill Re-use Scheme 48
Table 8. The costs of reducing phosphorous in sewage treatment plant discharges 55
Table 9. Options and present value costs for major and small coastal wastewater treatment plants56
Table 10. ACT: current and expected future wastewater discharges (ML) 59
Table 11. NSW wastewater treatment levels 1994 (% of flow treated at level specified) 60
Table 12. NSW: current and expected future wastewater discharges (ML) 61
Table 13. Sydney Water: current and expected future wastewater discharges (ML) 62
Table 14. NT: current and expected future wastewater discharges (ML) 63
Table 15. NT: wastewater treatment levels in 1994 (%) 63
Table 16. Queensland: current and expected future wastewater discharges (ML) 64
Table 17. Queensland: wastewater treatment levels in 1994 (%) 64
Table 18. SA: current and expected future wastewater discharges (ML) 65
Table 19. SA: wastewater treatement levels in 1994 (%) 66
Table 20. Country wastewater treatment options for South Australia 67
Table 21. Hobart: current and expected future wastewater discharges (ML) 69
Table 22. Tasmania: current and expected future wastewater discharges (ML) 69
Table 23. Victoria: current and expected future wastewater discharges (ML) 70
Table 24. Victoria: wastewater treatment levels in 1994 (%) 70
Table 25. Wastewater treatment processes and disposal in Victoria 71
Table 26. WA: current and expected future wastewater discharges (ML/yr) 73
Table 27. WA: wastewater treatment levels in 1994 (%) 73
Table 28. Projected populations of Australian States and Territories (’000s) 75
Table 29. Wastewater flow at population growth rate (GL/yr) 75
Table 30. Total volumes of wastewater received and anticipated (ML/yr) 77
Table 31. Expected rate of growth in wastewater flow( %/yr) 77
Table 32. Expected population growth rates (%/yr) 77
Table 33. Current and future discharge volumes, 1994–2020 (ML/yr) 79
Table 34. Direct re-use (%) 80
Table 35. Land discharges by type in 1994 (%) 84
Table 36. Expected land discharges by type by the year 2000 (%) 84
Table 37. Expected land discharges by type by the year 2020 (%) 85
Table 38. Quality of effluent and stormwater in South Australia, selected sites 96
Table 39. Structural and non-structural source controls 103
Table 40. Reported stormwater-friendly behaviours in selected Australian cities 115
Table 41. Estimated per capita costs of implementing best management practices for stormwaterin the USA 117
Table 42. Indicative costs of improved service quality of stormwater drainage, in NSW 118

LIST OF FIGURES
Figure i. Australia-wide Volume of Wastewater
Figure ii. Volume of effluent discharged to various environments by state (1994)
Figure iii. Per cent of effluent discharged, by category (1994–2020)
Figure 1. Treatment levels (by state) – 1994 Error! Bookmark not defined.28
Figure 2. Disinfection methods (by state) – 1994 29Figure 3a. Water flow volumes under conventional water supply and wastewater system
(percent of total supply) 52Figure 3b. Segment-specific unit costs for a conventional water supply and wastewater system
($/m3 of throughput in each segment) 52Figure 3c. Flow-weighted unit costs for conventional water supply and wastewater system
($/m3 of water supply) 53
Figure 4a. Water flow volumes under a simple wastewater recycling system (% of total supply)53Figure 4b. Segment-specific unit costs for a simple wastewater recycling system
($/m3 of throughput in each segment) 53Figure 4c. Flow-weighted unit costs for a simple wastewater recycling system
($/m3 of water supply) 54
Figure 5. The capital cost per equivalent person of removing phosphorus ($/yr) 54
Figure 6. Trends in per capita water use in Melbourne, Sydney, Hunter District and Perth 76
Figure 7. Wastewater volume by state (GL) – 1994 77
Figure 8. Wastewater volume per capita (kL) – 1994 78

GLOSSARY OF TERMS
Best Management Practices (BMP) : Thisterm is often used in reference to various desir-able techniques of stormwater management.
Biochemical oxygen demand (BOD): Theoxygen absorbed by a sewage or effluent samplein 5 days at 20ºC. A low BOD indicates that thesample is low in those chemicals which con-sume oxygen in their breakdown.
Brine: A very salty liquid stream generatedduring reverse osmosis technology and requiresspecial disposal.
Combined Sewer Overflows (CSO): Theseoccur during periods of heavy rain, whenpurpose-built structures in the sewerage systemoverflow, as a result of stormwater loads.
Constructed wetlands system: A series ofponds in which aquatic plants absorb nutrientsand other pollutants from water.
Direct potable re-use: The planned potableuse of treated wastewater delivered directly intothe water supply system.
Disinfection: A process which destroys, in-activates or removes pathogenic micro-organisms.
Dual reticulation system: A water supply sys-tem with two separate sets of pipes, one for pot-able water and the other for non-potable water.
Effluent: The water that is discharged from awastewater treatment plant.
Equivalent person (EP): Unit used indescribing the size and capacity of various partsof a sewerage system. This has been defined as240L/day.
Gigalitre: (GL) = 109 L
Indirect potable reuse: The potable use oftreated wastewater, which is discharged intosurface or underground waters and is used againin its diluted form.
Marginal cost: The cost of making anadditional unit of water available (the sum of themarginal capacity and operating cost).
Megalitre: (ML) = 106 L
Nutrient removal: Removal of nitrogen andphosphorus from wastewater to prevent excess-ive aquatic plant regrowth in receiving waters.
Polishing: Refinement of the quality of highlytreated effluent by additional removal ofnutrients and other pollutants.
Potable re-use: Re-use of highly treatedwastewater for drinking.
Potable water: Water which is suitable forhuman consumption either as drinking water orin food preparation.
Primary treatment: Initial wastewater treat-ment, involving screening, grit removal andsedimentation to remove settleable solids fromwastewater.
Recycled/Reclaimed water: Water derivedfrom wastewater and treated to a standard whichallows its reuse in applications such as wateringlawns, washing cars and industrial cleaning.
Reverse osmosis: An advanced method used inwater and wastewater treatment which relies ona semipermeable membrane to separate thewater from impurities.
Secondary treatment: The biological decom-position or conversion of dissolved or suspend-ed organic matter into a form that reduces itsenvironmental impact.
Suspended solids (SS): Undissolved constit-uents of wastewater.
Sewage: The wastewater from homes, offices,shops and factories. Trade waste from industrymay also be present.
Sewage effluent: Liquid discharge from a sew-age treatment plant after treatment.
Sewerage: The system of pipes in which sew-age flows.
Sewer mining: Diversion and treatment of rawsewage, for on-site purposes such as irrigation.
Stormwater: The water that falls on urban sur-faces and either infiltrates the ground, collects inlakes or wetlands, evaporates or runs off innatural or constructed drains.
Tertiary treatment: The treatment of waste-water beyond the secondary stage. This mayinvolve further removal of nutrients, pathogensand suspended particles, by flocculation andcoagulation, followed by clarification, filtration,and disinfection.
Total water cycle management: The integra-tion of land use planning with the managementof water supply; stormwater drainage; andwastewater collection, treatment and disposal.
Wastewater: Untreated sewage.
Wastewaters: Sewage plus stormwater.
Water re-use: The successive use of water,following treatment of wastewater and convey-ance to point of use.
Water recycling: Water re-use, usually in aclosed system, or re-use of water in the sameestablishment for a lower grade or similar use,as in certain industrial processes such as coolingtowers and boilers.

ACRONYMS
ACTEW Australian Capital Territory Electricity and WaterACTPA Australian Capital Territory Planning AuthorityAIUS Australian Institute of Urban StudiesANZECC Australian and New Zealand Environment and Conservation CouncilARCWIS Australian Research Centre for Water In SocietyARMCANZ Agriculture and Resource Management Council of Australia and New ZealandAWRC Australian Water Resources CouncilBCP Better Cities ProgramCEPA Commonwealth Environmental Protection AgencyCOAG Council of Australian GovernmentsEPA Environmental Protection Agency/AuthorityE&WS Engineering and Water Supply Department, South AustraliaHWC Hunter Water CorporationIUCN International Union for the Conservation of NatureMCPHLG Ministerial Council for Planning, Housing and Local GovernmentMFP Multi Function PolisNCAP National Coastal Action ProgramNHMRC National Health and Medical Research CouncilNPDES National Pollution Discharge Elimination SchemeNRA National River Authority, UKNTP&WC Northern Territory Power and Water CorporationNWQMS National Water Quality Management StrategyOFWAT Office of Water Services, United KingdomO&M Operating and MaintenanceRAC Resource Assessment CommissionSCARM Standing Committee on Agriculture and Resource ManagementSOMER State of the Marine Environment ReportSTP Sewage Treatment PlantTCM Total Catchment ManagementUSEPA United States Environmental Protection AgencyUWRAA Urban Water Research Association of AustraliaWAWA Water Authority of Western AustraliaWAWC Western Australian Water CorporationWSAA Water Services Association of AustraliaWRMC Water Resource and Management CommitteeWSUD Water Sensitive Urban DesignWTC Water Technology CommitteeWTP Wastewater Treatment Plant