wastewater system and potable water supply rules soil evaluation · 2019-05-22 · wastewater...
TRANSCRIPT

Facilitated by Graham Bradley Drinking Water & Groundwater Protection Division
Facilitated by Graham Bradley Drinking Water & Groundwater Protection Division
Wastewater System and Potable Water Supply Rules
Soil EvaluationWastewater System and Potable Water Supply Rules
Soil Evaluation

What is the purpose of soil evaluation?• Observation >>> Interpretation >>> Design• Can wastewater infiltrate the soil at rate to facilitate design flow?
• Is the soil good habitat for aerobic microbes that treat effluent?
• Is an on-site soil-based wastewater system viable?
What should we expect from a test pit log?• Is the minimum permit requirement the same as good practice?
• Is 5 minutes enough time? As a young engineering geologist I was expected to take around 30 minutes to log each test pit.
Discussion

Remember the purpose of the site investigation for a soil-basedwastewater system
Bedrock (ledge)
Seasonal High Water Table
6 ‐ 12 “
6 ‐ 24 “
> 48 “> 36 “
4“ pipe2“ < 36“
UnsaturatedSoil
12‐48“
2. Color / Redox Conditions:Seasonal High Water TableIs there aerobic habitat for the microbes that treat the wastewater once it is in the ground?
1. Texture, structure, consistence: Application RatesCan you get wastewater in the ground?

Teaming with microbes!Mainly the aerobic, bacteria.
Designers, engineers… and microbe farmers?

§1-9 Specific Technical Standards for Wastewater Systems
§ 1-910 Soil Evaluation
• < 600 gpd - 2 excavations per in-ground leachfield & replacement area
• < 600 gpd - 3 excavations per mound or bottomless sand filter area
• Confirm soils under leachfield and 25 ft downslope of a mound
• Soil excavations shall be conducted using a backhoe unless authorized by the Secretary
• Secretary may allow fewer soil excavations if soils are uniform
• Secretary may require additional soil excavations to confirm complying soil conditions

§ 1-911 Application Rates• Maximum application rate for sizing leachfield in mound shall be 1.0 gpd
• Maximum application rate for in-ground or at-grade leachfield shall be determined using one of the following methods:
• Using Table 9-3 for most limiting soil texture and structure identified within 0 to 3 feet below leachfield infiltrative surface
• Using the results of the percolation tests in the most limiting soil texture and structure identified within 0 to 3 feet below leachfield infiltrative surface
• If percolation test gives a higher application rate than soil description (Table 9-3) then the application rate determined by the soil description shall be used – use the lowest application rate
Both tools in your tool box, but you must give full soil descriptions
§1-9 Specific Technical Standards for Wastewater Systems

§1-9 Specific Technical Standards for Wastewater Systems
§ 1-910 Soil Evaluation• Soil described for each horizon according to USDA-NRCS Field Book
• Description shall include
1. Color based on Munsell notation (and name), e.g. 10YR 4/3 (brown)2. Redoximorphic features (reductions and concentration, ‘mottles’)3. Texture as identified by full name and USDA-NRCS abbreviation4. Structure5. Consistence
• Evidence of SHWT: redoximorphic features, seepage, standing water
• Percolation testing may be conducted for establishing application rates

§ 1‐911 Application Rates
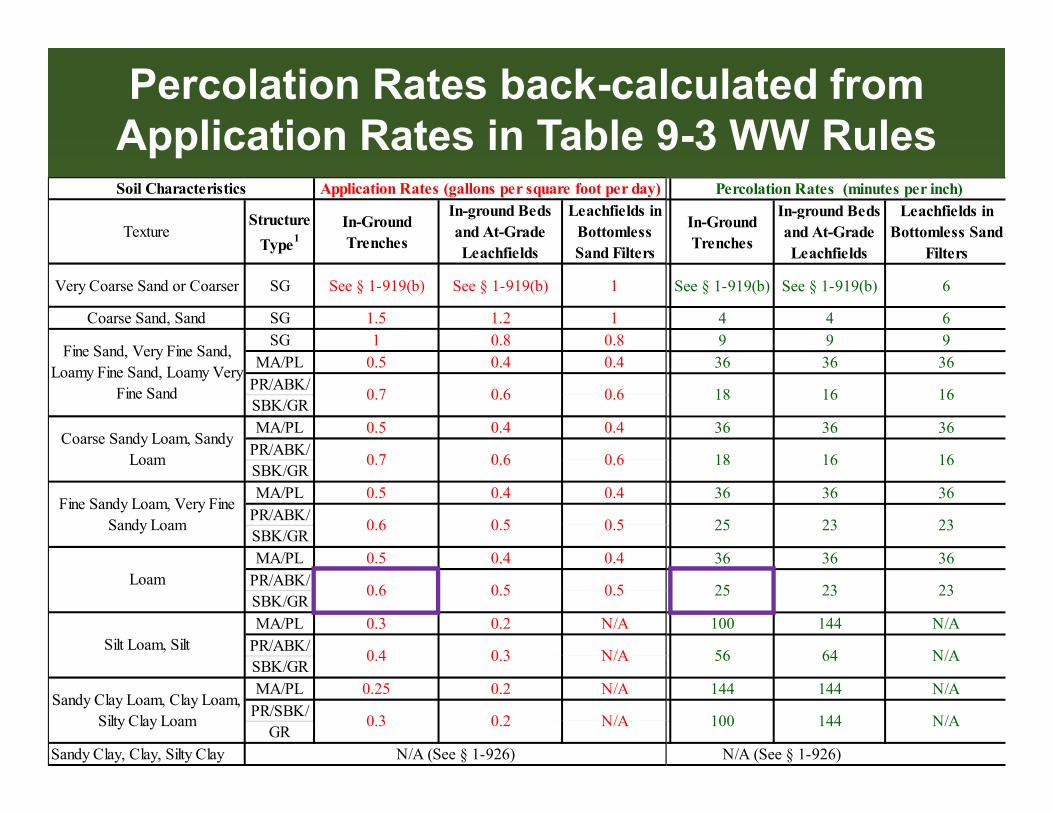
Percolation Rates back-calculated from Application Rates in Table 9-3 WW Rules
TextureStructure
Type1In-Ground Trenches
In-ground Beds and At-Grade Leachfields
Leachfields in Bottomless Sand Filters
Very Coarse Sand or Coarser SG See § 1-919(b) See § 1-919(b) 1
Coarse Sand, Sand SG 1.5 1.2 1SG 1 0.8 0.8
MA/PL 0.5 0.4 0.4PR/ABK/SBK/GRMA/PL 0.5 0.4 0.4
PR/ABK/SBK/GRMA/PL 0.5 0.4 0.4
PR/ABK/SBK/GRMA/PL 0.5 0.4 0.4
PR/ABK/SBK/GRMA/PL 0.3 0.2 N/A
PR/ABK/SBK/GRMA/PL 0.25 0.2 N/A
PR/SBK/GR
Sandy Clay, Clay, Silty Clay
Sandy Clay Loam, Clay Loam, Silty Clay Loam 0.3 0.2 N/A
Loam
Silt Loam, Silt
Coarse Sandy Loam, Sandy Loam
Fine Sandy Loam, Very Fine Sandy Loam 0.5
N/A (See § 1-926)
0.6 0.5 0.5
0.4 0.3 N/A
0.7 0.6 0.6
0.6 0.5
Soil Characteristics Application Rates (gallons per square foot per day)
Fine Sand, Very Fine Sand, Loamy Fine Sand, Loamy Very
Fine Sand 0.7 0.6 0.6
In-Ground Trenches
In-ground Beds and At-Grade Leachfields
Leachfields in Bottomless Sand
Filters
See § 1-919(b) See § 1-919(b) 6
4 4 69 9 936 36 36
36 36 36
36 36 36
36 36 36
100 144 N/A
144 144 N/A
100 144 N/A
25 23 23
56 64 N/A
Percolation Rates (minutes per inch)
18 16 16
18 16 16
25 23 23
N/A (See § 1-926)

Information to be recorded on a test pit log

Diagnostic Soil Horizonse.g. Vermont State Soil ‐Tunbridge Series
A* Topsoil: humus, minerals, organisms
E Leached by humic acid: mineral soil (forest soils, not present in most soils)
B* Subsoil: Mineral soil, weathered with accumulated iron, clay etc.
O Humus: organic leaf litter
C Parent material: weathered rock, glacial till, alluvium, lacustrine etc.(Tunbridge is till)
R Bedrock –metamorphic
* not always present in Tunbridge Series

O
A
E
B/C
C
O
A
C
B
B/E
Lincoln Bromley

Soil Texture(particle size distribution)
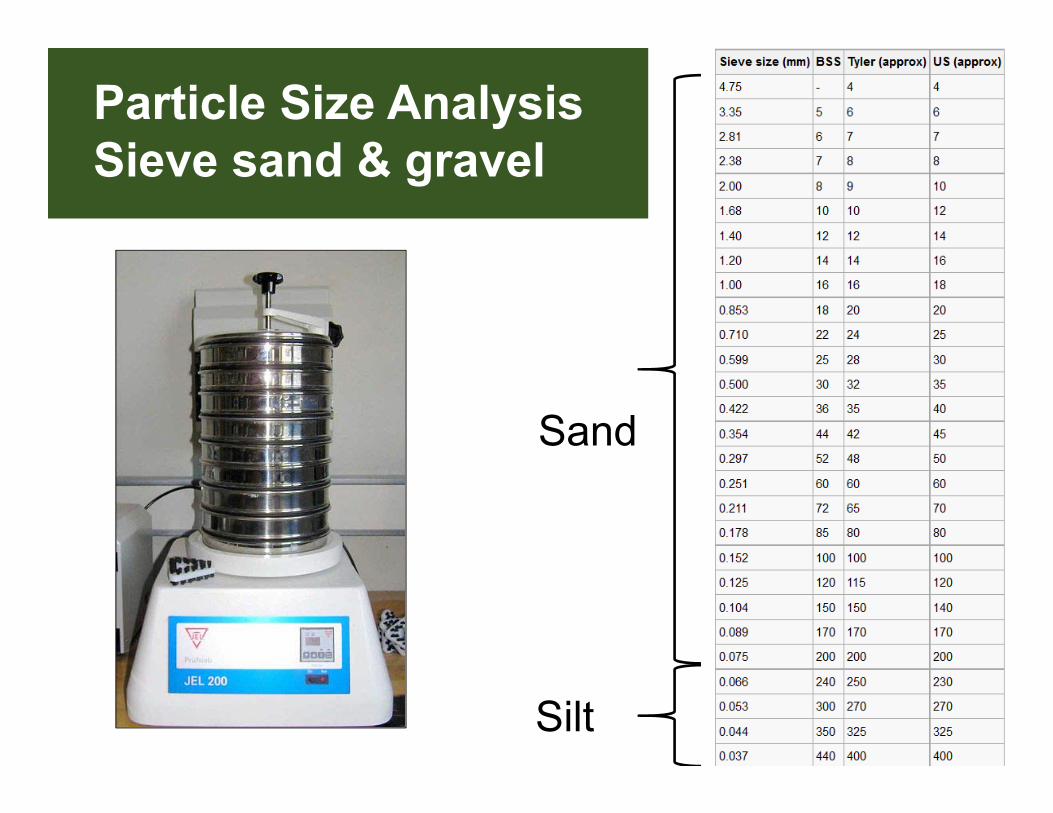
Particle Size AnalysisSieve sand & gravel
Sand
Silt

Use hydrometer and Stokes Law to determine silt and clay fraction

Particle Size Distribution
0%
10%
20%
30%
40%
50%
60%
70%
80%
90%
100%
0.0010.010.1110100Grain Size (mm)
Particle Size Distribution
Gravel Sand Silt Clay
3. silty clay loam
4. sand
5. silt loam
2. gravelly silt loam
6. gravelly sand
1. gravelly sandy loam

USDA‐NRCS Soil Texture Triangle
15% clay

Soil Texture: Field Determination
(<1 inch)
(>1 inch)
(<2 inch)
(>2 inch)

Soil Textures … Stay Calibrated! Professional Soil Scientists• 66% textures correct!• 91% textures ‘correct’ when
include adjacent classes• Sand & clay classes good
• Silt & loam … not so much
Seasonal Field Technicians?• 41% textures correct• 78% textures ‘correct’ when
include adjacent classes• Silty classes most difficult• Professionals: 59% Novice: 17%

Soil StructureArrangement of aggregated particles called peds

Soil Structure: regular field calibration essential
Grade0 = structureless1 = weak2 = moderate3 = strong

Soil Structure• Single Grain• Granular• Crumb• Angular blocky• Subangular blocky• Columnar• Prismatic• Platy• MassiveGrade0 = structureless1 = weak2 = moderate3 = strong

“Consistence”= Ped resistance to deformation

McCarthy (1993) “Consistency”Uses field penetration test similar to designers

USDA “Excavation Difficulty”Field penetration test.
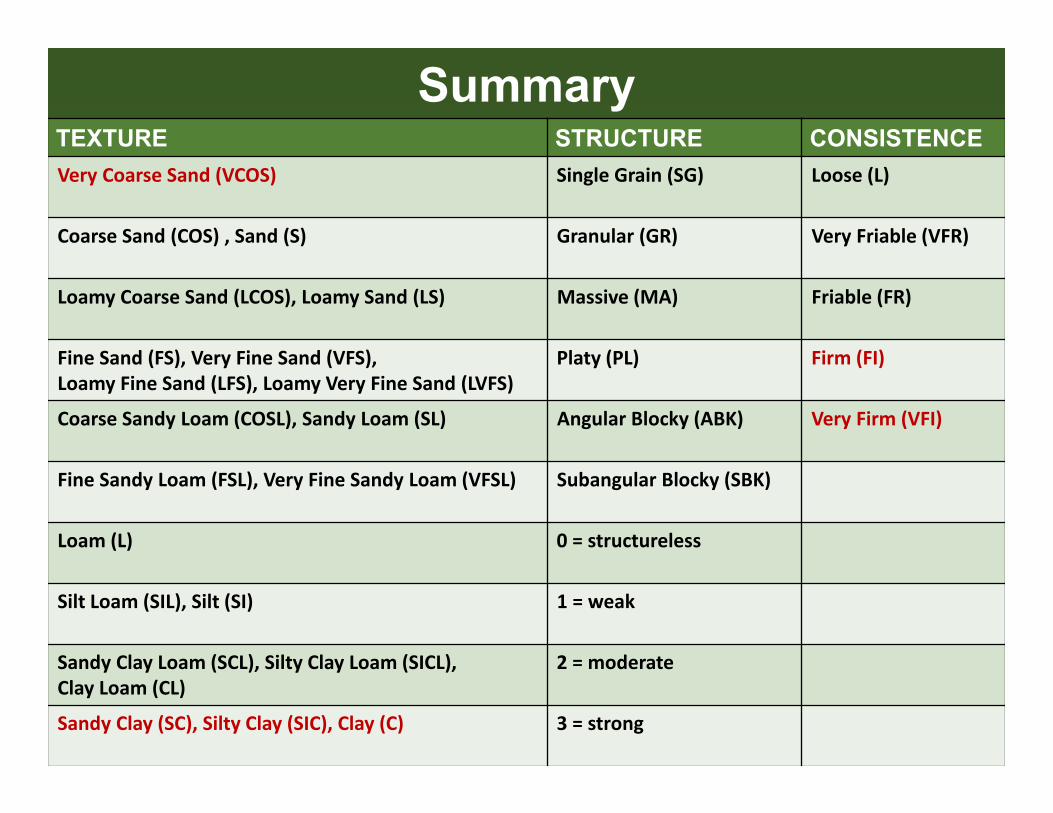
SummaryTEXTURE STRUCTURE CONSISTENCEVery Coarse Sand (VCOS) Single Grain (SG) Loose (L)
Coarse Sand (COS) , Sand (S) Granular (GR) Very Friable (VFR)
Loamy Coarse Sand (LCOS), Loamy Sand (LS) Massive (MA) Friable (FR)
Fine Sand (FS), Very Fine Sand (VFS),Loamy Fine Sand (LFS), Loamy Very Fine Sand (LVFS)
Platy (PL) Firm (FI)
Coarse Sandy Loam (COSL), Sandy Loam (SL) Angular Blocky (ABK) Very Firm (VFI)
Fine Sandy Loam (FSL), Very Fine Sandy Loam (VFSL) Subangular Blocky (SBK)
Loam (L) 0 = structureless
Silt Loam (SIL), Silt (SI) 1 = weak
Sandy Clay Loam (SCL), Silty Clay Loam (SICL), Clay Loam (CL)
2 = moderate
Sandy Clay (SC), Silty Clay (SIC), Clay (C) 3 = strong

TAC Guidance on selecting “desk top” hydraulic conductivity for groundwater mounding calculations.
Soil logs must record: 1. texture2a. structure2b. grade of structure
If they do not then lowest K consistent with available description should be selected.

Munsell Colors, Redox Features, SHWT, and Aerobic Conditions
Munsell Color System:
• hue• value• chroma

Munsell color: hue, value/chroma (name)Example: 2.5YR 4/4 (reddish brown)
Hue (related to wavelength) e.g. 2.5YR
Value (lightness to darkness) e.g. 4/
Chroma (related to saturation / degree washed out) e.g. /4
Name (applied to a group of color chips on adjacent page) e.g. reddish brown
Start on page 10YR!

Chroma is a key indicator!

What is Redox (reduction‐oxidation)?
Oxidation = loss of electrons
https://youtu.be/CMnkqKOTN‐o
Reduction = gain of electrons
Oxygen is an oxidizer. It is reduced bygaining electrons as it oxidizes metals
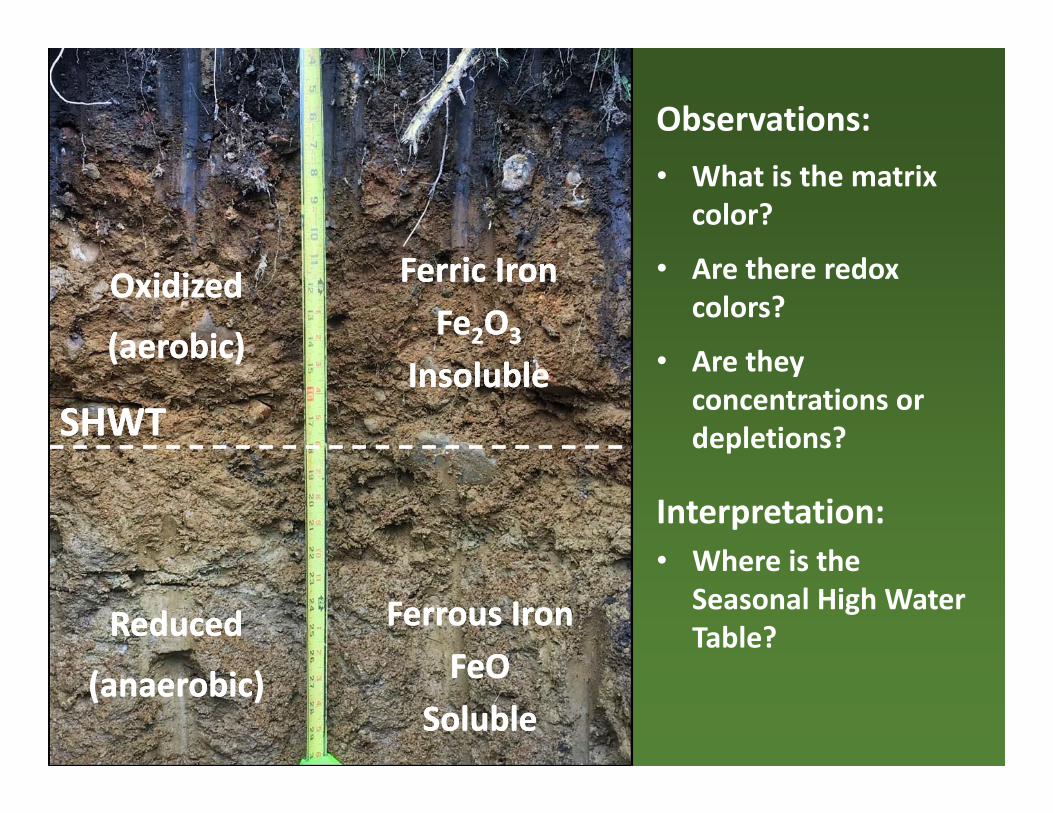
Iron3+ oxide = ferric oxide Fe2O3 is insoluble (rust)
Iron2+ oxide = ferrous oxideFeO dissolves in groundwater
Sodium Fluorine
SHWTSHWT
Reduced
(anaerobic)
Reduced
(anaerobic)
Oxidized
(aerobic)
Oxidized
(aerobic)
Ferric IronFe2O3
Insoluble
Ferric IronFe2O3
Insoluble
Ferrous Iron FeO
Soluble
Ferrous Iron FeO
Soluble
Observations:• What is the matrix
color?
• Are there redox colors?
• Are they concentrations or depletions?
Interpretation:• Where is the
Seasonal High Water Table?
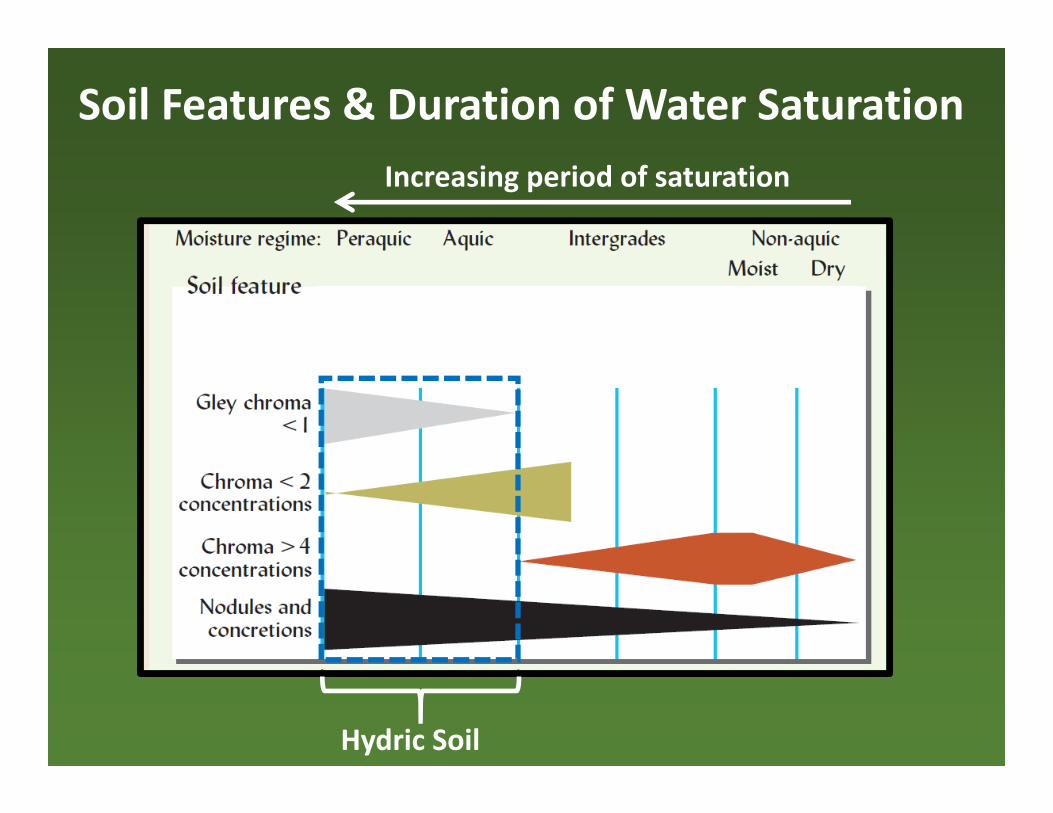
Increasing period of saturation
Hydric Soil
Soil Features & Duration of Water Saturation

Mainly oxidizedchroma >4 concentrations
Mainly oxidizedchroma >4 concentrations
Oxidized with depletionschroma <2 to >4 concentrations Oxidized with depletionschroma <2 to >4 concentrations
Reduced with concentrationschroma <1 depletions to <2 concentrations
Reduced with concentrationschroma <1 depletions to <2 concentrations
Mainly reducedchroma <1 depletions, some <2 concentrations
Mainly reducedchroma <1 depletions, some <2 concentrations
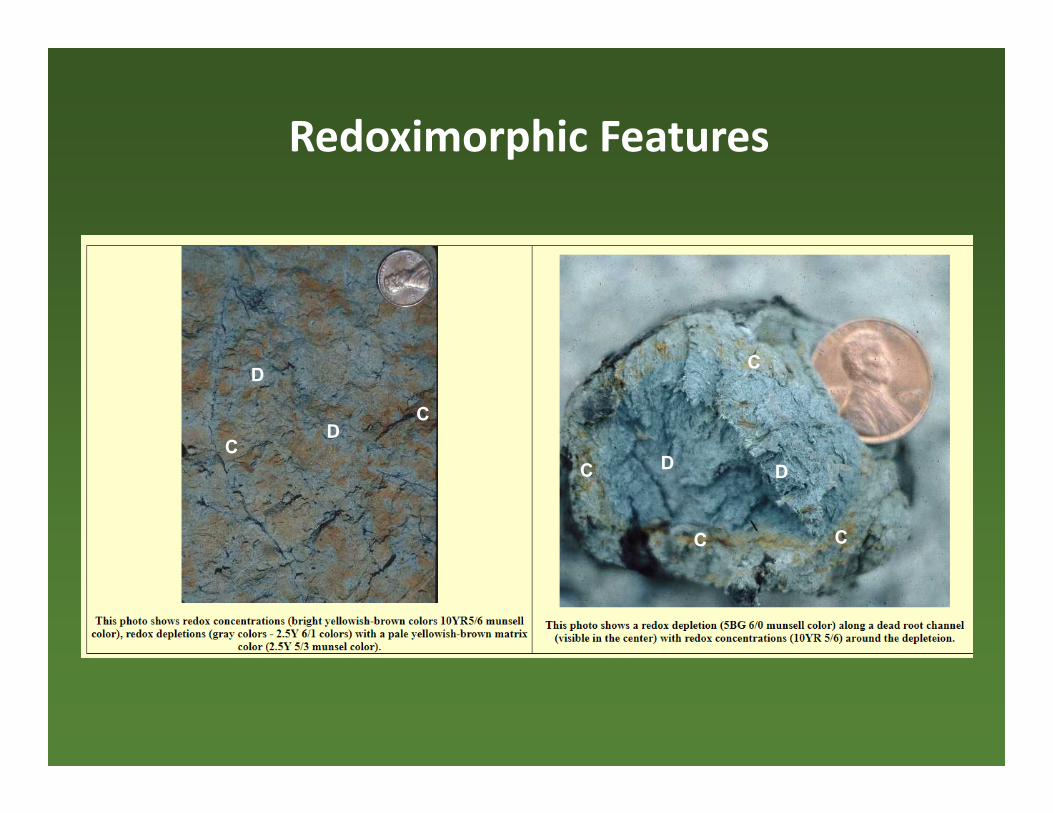
Redoximorphic Features
CC
D
DD
C
C
C
C
D

Redoximorphic Features
e.g. 1: Depletions in macropores & concentrations in matrix ‐ water is infiltrating along macropores, matrix is unsaturated
e.g. 2: Concentration in macropores & depletions in matrix ‐ matrix is saturated for long periods, macropores are drained
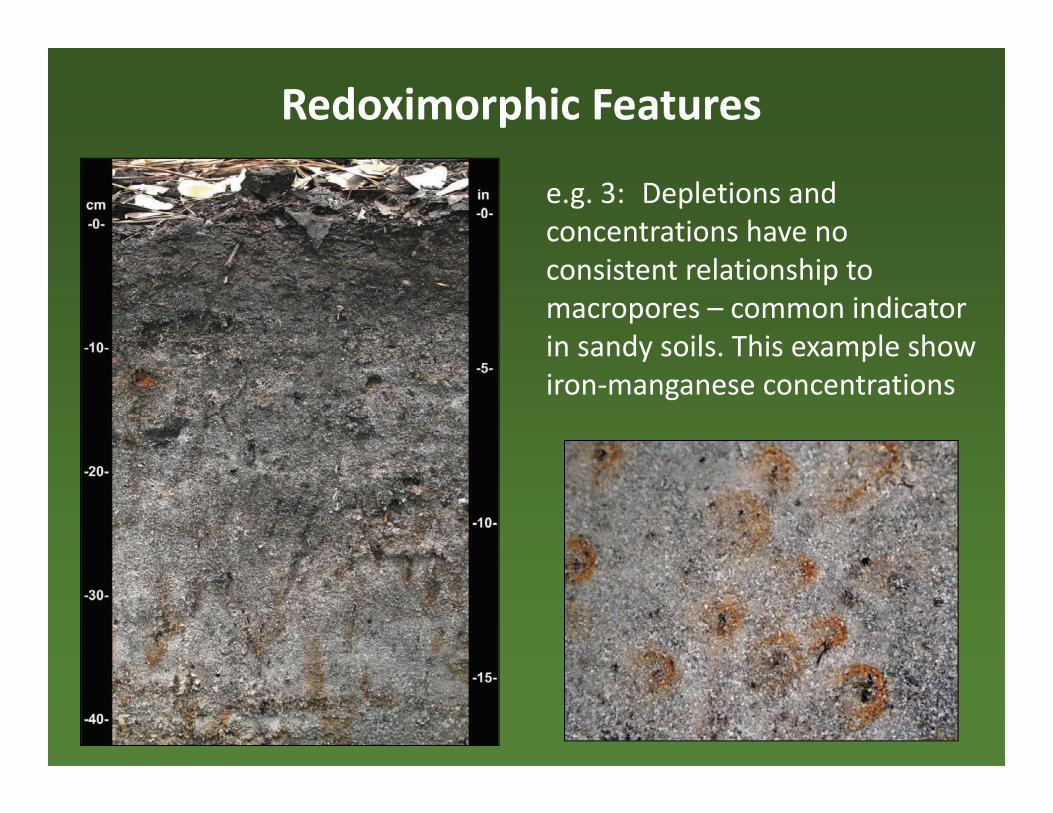
Redoximorphic Features
e.g. 3: Depletions and concentrations have no consistent relationship to macropores – common indicator in sandy soils. This example show iron‐manganese concentrations
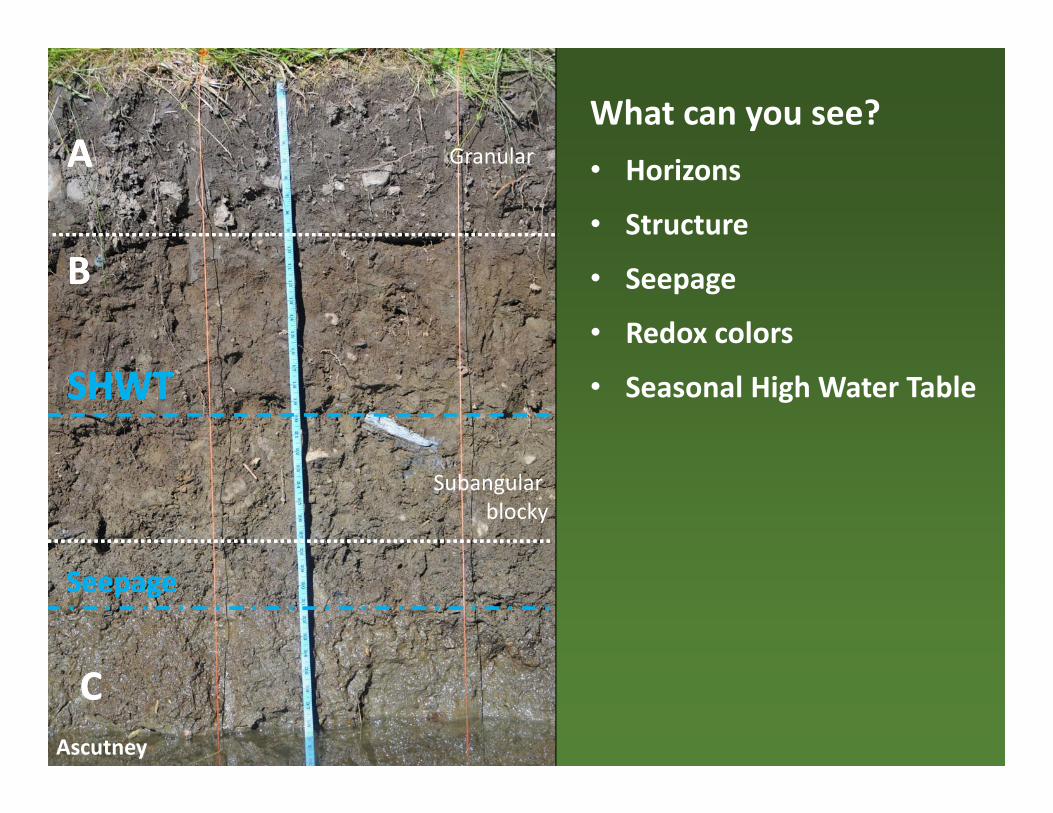
What can you see?• Horizons
• Structure
• Seepage
• Redox colors
• Seasonal High Water Table
Ascutney
AA
BB
CC
SHWTSHWT
SeepageSeepage
Subangular blocky
Granular


What can you see?• Horizons
• Structure
• Seepage
• Redox colors
• Seasonal High Water Table
AA
BB
CC
SHWTSHWT
Platy
Subangular blocky
Granular
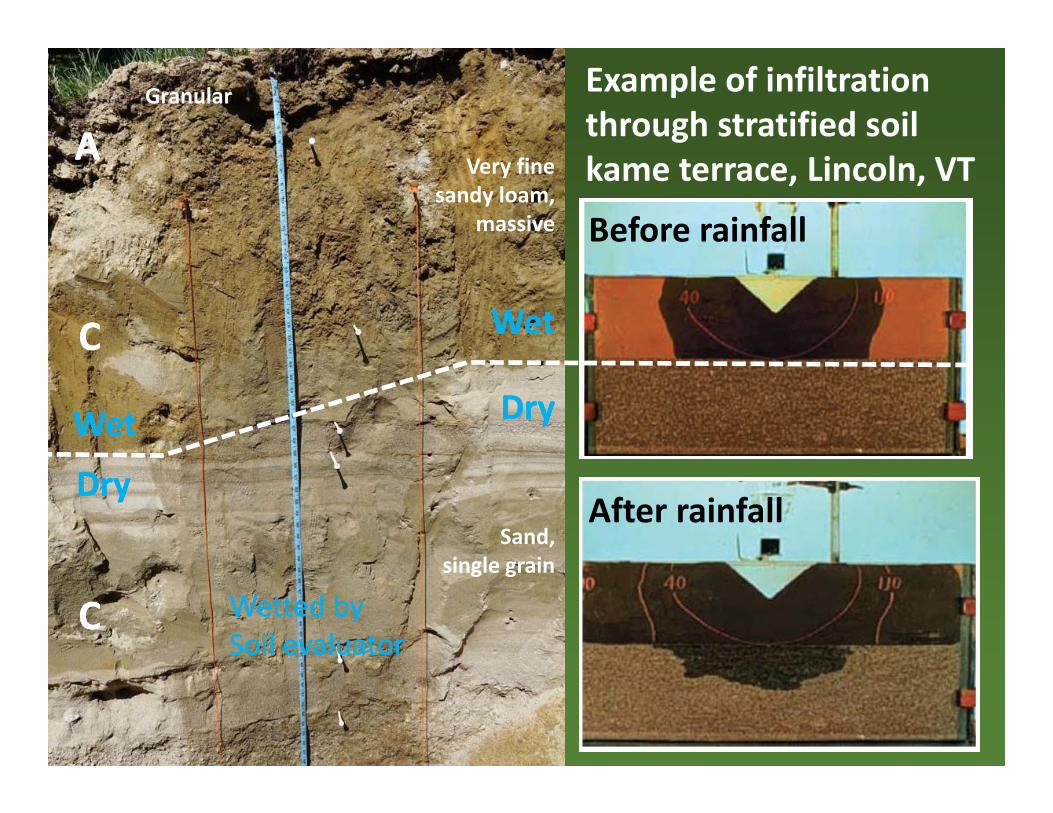
Example of infiltration through stratified soilkame terrace, Lincoln, VTAA
CC
Sand,single grain
Very fine sandy loam,
massive
Granular
CC Wetted by Soil evaluatorWetted by Soil evaluator
After rainfall
DryDry
WetWet
Before rainfall
WetWet
DryDry

Training ExerciseColor and Texture

Texture Selected Munsell Colors Average Value
Average Chroma
organic sandy loam
10YR 3/2
10YR 3/2
10YR 2/2
10YR 2/1
10YR 3/2
10YR 2/2
10YR 3/3 2.6 2.0
sand 10YR 4/6
10YR 5/6
10 YR 5/6
10YR 3/4
10YR 5/6
7.5YR 4/4
10YR 4/4 4.3 5.1
gravelly sandy loam
10YR 5/6
2.5Y 5/3
10YR 4/4
10YR 4/4
10YR 4/4
7.5YR 4/6
10YR 5/4 4.6 4.4
silt loam 2.5Y 6/4
2.5Y 6/4
10YR 4/2
10 YR 5/3
2.5Y 4/3
10YR 4/4
10YR 5/2 4.9 3.1
silty clay loam 2.5Y 6/2
5Y 6/2
10YR 3/1 2.5Y 5/2 5Y
4/25Y 6/2 2.5Y 6/2 5.7 1.9