wastewater treatment in sweden. isbn 978-91-620-8416-5 · waste water treatment in sweden. 2...
TRANSCRIPT
WasteWater treatment in sweden
swedish epa | wastewater treatment in sweden2
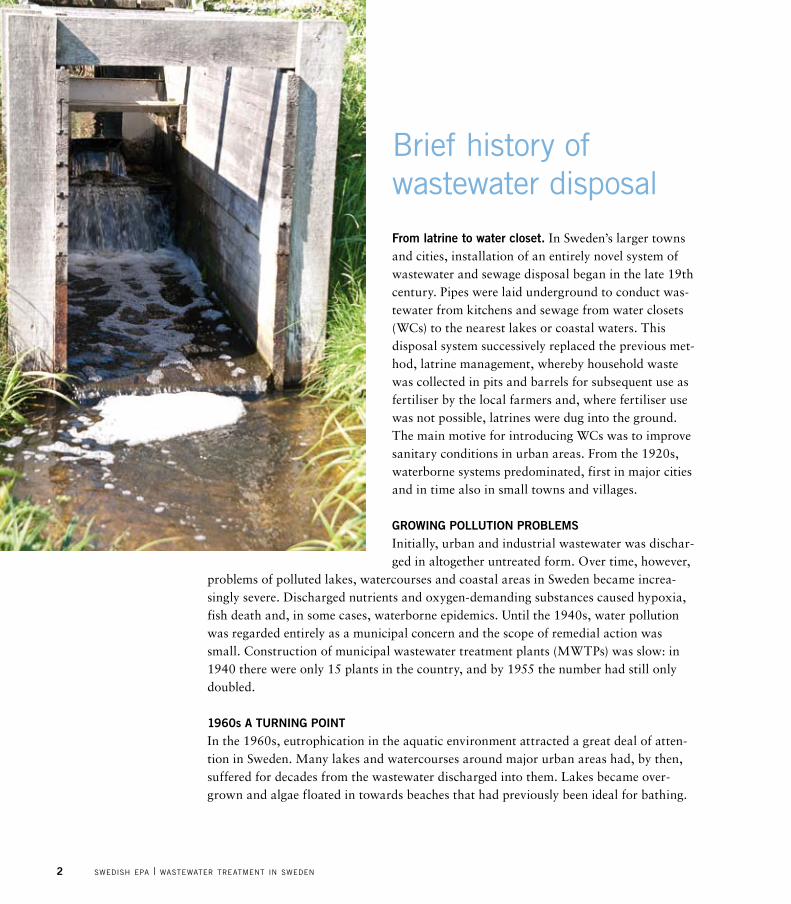
Brief history of wastewater disposal
From latrine to water closet. In Sweden’s larger towns and cities, installation of an entirely novel system of wastewater and sewage disposal began in the late 19th century. Pipes were laid underground to conduct was-tewater from kitchens and sewage from water closets (WCs) to the nearest lakes or coastal waters. This disposal system successively replaced the previous met-hod, latrine management, whereby household waste was collected in pits and barrels for subsequent use as fertiliser by the local farmers and, where fertiliser use was not possible, latrines were dug into the ground. The main motive for introducing WCs was to improve sanitary conditions in urban areas. From the 1920s, waterborne systems predominated, first in major cities and in time also in small towns and villages.
GrowinG pollution problemsInitially, urban and industrial wastewater was dischar-ged in altogether untreated form. Over time, however,
problems of polluted lakes, watercourses and coastal areas in Sweden became increa-singly severe. Discharged nutrients and oxygen-demanding substances caused hypoxia, fish death and, in some cases, waterborne epidemics. Until the 1940s, water pollution was regarded entirely as a municipal concern and the scope of remedial action was small. Construction of municipal wastewater treatment plants (MWTPs) was slow: in 1940 there were only 15 plants in the country, and by 1955 the number had still only doubled.
1960s a turninG pointIn the 1960s, eutrophication in the aquatic environment attracted a great deal of atten-tion in Sweden. Many lakes and watercourses around major urban areas had, by then, suffered for decades from the wastewater discharged into them. Lakes became over-grown and algae floated in towards beaches that had previously been ideal for bathing.
3wastewater treatment in sweden | swedish epa
The water was eutrophic; and in some lakes and watercourses heavy metals and other chemicals were also found to be deposited in the sediments, often the legacy of previous industrial activity. Environmental warning bells rang frequently, soon prompting greater state efforts to combat water pollution. The Swedish Environmental Protection Agency (EPA) was formed in 1967, new government grants for municipal wastewater treatment were introduced in 1968 and an entirely new piece of legislation, the Environmental Protection Act, came into force in 1969.
extension oF wastewater treatment in 1960s and ’70sBetween 1971 and 1979, the Swedish state invested some SEK 1.5 billion (corresponding to approximately SEK 11 billion, i.e. EUR 1 billion, in present-day monetary value) in MWTP construction. In the early 1970s certain industries also received government grants for their environmental conservation measures. These grants were largely used to improve wastewater treatment. Since then, industrial companies with their own waste-water disposal have taken major steps to reduce their effluents. Discharges from proper-ties with on-site wastewater disposal, on the other hand, have shown no corresponding decrease.
The extensive measures taken in the 1970s, in particular, made lakes and water-courses noticeably cleaner within just a few years. Bathing beaches reopened and the fish returned.
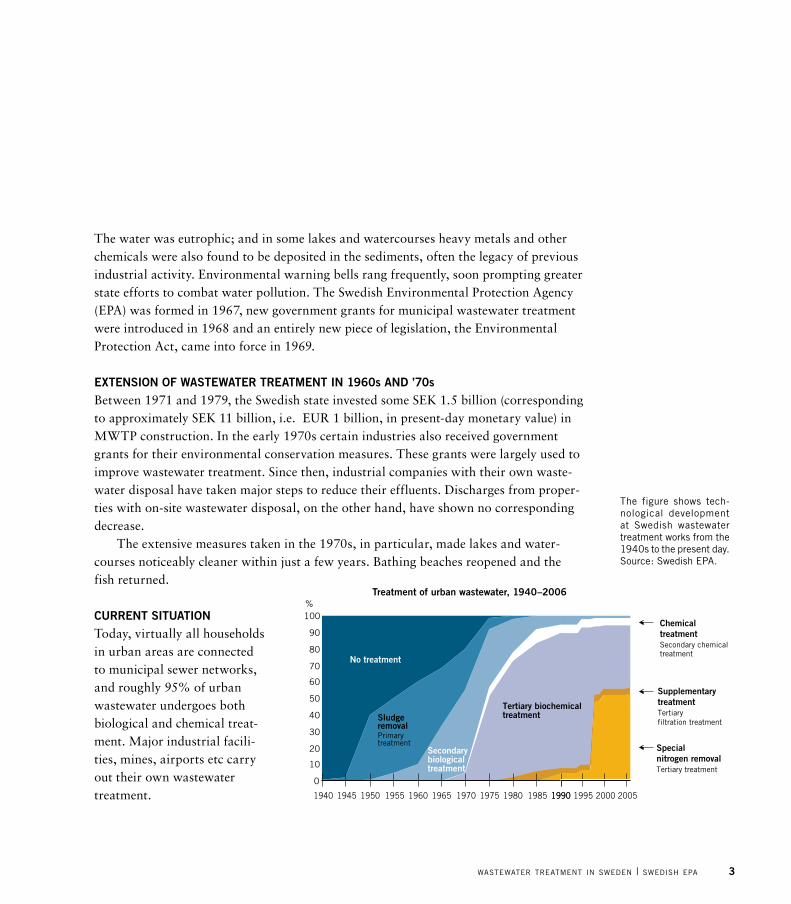
Current situationToday, virtually all households in urban areas are connected to municipal sewer networks, and roughly 95% of urban wastewater undergoes both biological and chemical treat-ment. Major industrial facili-ties, mines, airports etc carry out their own wastewater treatment.
the figure shows tech-nological development at swedish wastewater treatment works from the 1940s to the present day. source: swedish ePa.
treatment of urban wastewater, 1940–2006
1940 1945 1950 1955 1960 1965 1970 1975 1980 1985 1990
0
10
20
30
40
50
60
70
80
90
100
1990 1995 2000 2005
%
No treatment
Sludge removalPrimarytreatment
Tertiary biochemicaltreatment
SupplementarytreatmentTertiaryfiltration treatment
Specialnitrogen removalTertiary treatment
ChemicaltreatmentSecondary chemicaltreatment
Secondarybiologicaltreatment
swedish epa | wastewater treatment in sweden4
Legislation in sweden and the eU
In the Water Act of the early 1940s, Sweden introduced regulations on wastewater discharge and made permits obligatory for certain industries. In 1956 a special Act on supervision of lakes and other water areas was passed and a new agency known as the Swedish Water Inspectorate was formed. With the 1969 Environmental Protection Act and the 1999 Swedish Environmental Code, a collection of rules concerning all forms of disturbance and degradation of the outdoor environment came into being.
After Sweden joined the European Union in 1995, EU water laws were successively incorporated into Swedish legislation. At the time, there were various directives in the EU covering different categories of water and application areas. In 2000, the decision was taken to adopt a Water Framework Directive that, in the long term, will replace a range of other water-related directives. During 2008, a corresponding directive for the marine environment was adopted.
The key water directives are those on•bathingwaters(76/160/EECand2006/7/EC)•drinkingwater(98/83/EC)•urbanwastewater(91/271/EEC)•nitrates(91/676/EEC)•IPPC(IntegratedPollutionPreventionandControl,96/61/EC) and also•theWaterFrameworkDirective(2000/60/EC)•theMarineStrategyFrameworkDirective(2008/56/EC).
the urban waste water direCtiveThe purpose of the EU Urban Waste Water Directive is to combat damage to the en-vironment caused by wastewater discharges from urban areas and certain industrial processes. The requirements imposed by the Directive include the following:•Allbuilt-upareas(withreferencetotheirsizeandlocation)musthavecollectionsys-
tems for wastewater by year-end 1998, 2000 or 2005.•Thewaterpipedintocollectionsystemsmustundergoatleastsecondarytreatment.
In general, this entails biological treatment or some other process whereby set quality standards can be met.
•Treatedwastewatermustmeetcertainminimumwater-qualitystandards.•Wastewaterdischargesin‘sensitiveareas’(watersvulnerabletotheeffectsofnutrient
inputs) are subject to stringent requirements concerning effective treatment.
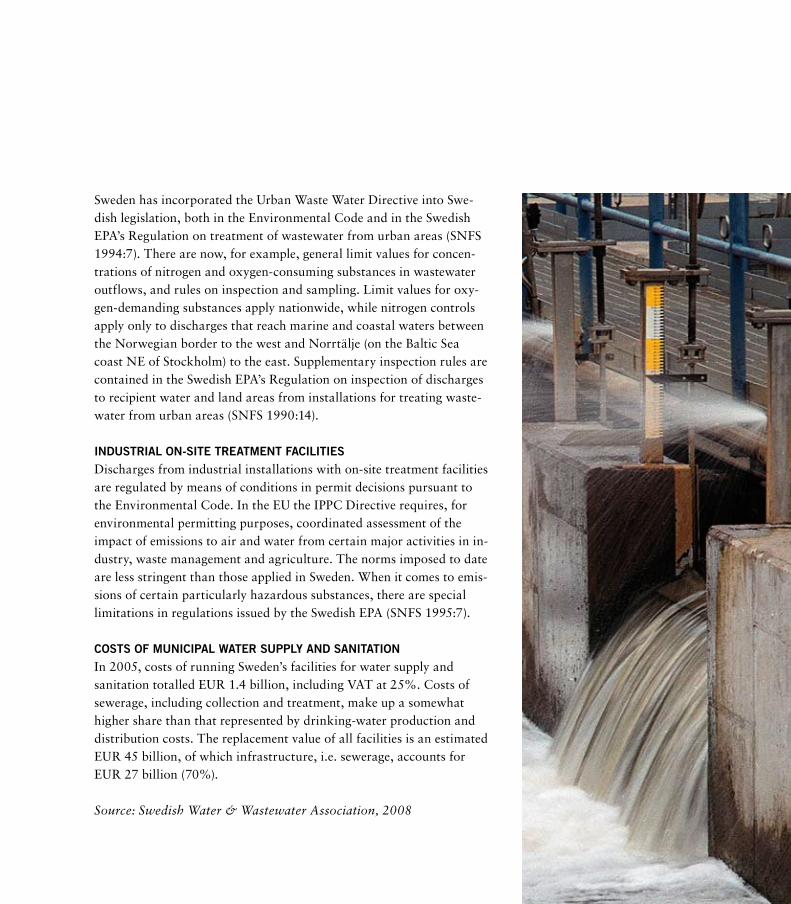
Sweden has incorporated the Urban Waste Water Directive into Swe-dish legislation, both in the Environmental Code and in the Swedish EPA’s Regulation on treatment of wastewater from urban areas (SNFS 1994:7). There are now, for example, general limit values for concen-trations of nitrogen and oxygen-consuming substances in wastewater outflows, and rules on inspection and sampling. Limit values for oxy-gen-demanding substances apply nationwide, while nitrogen controls apply only to discharges that reach marine and coastal waters between the Norwegian border to the west and Norrtälje (on the Baltic Sea coast NE of Stockholm) to the east. Supplementary inspection rules are contained in the Swedish EPA’s Regulation on inspection of discharges to recipient water and land areas from installations for treating waste-water from urban areas (SNFS 1990:14).
industrial on-site treatment FaCilitiesDischarges from industrial installations with on-site treatment facilities are regulated by means of conditions in permit decisions pursuant to the Environmental Code. In the EU the IPPC Directive requires, for environmental permitting purposes, coordinated assessment of the impact of emissions to air and water from certain major activities in in-dustry, waste management and agriculture. The norms imposed to date are less stringent than those applied in Sweden. When it comes to emis-sionsofcertainparticularlyhazardoussubstances,therearespeciallimitations in regulations issued by the Swedish EPA (SNFS 1995:7).
Costs oF muniCipal water supply and sanitation In 2005, costs of running Sweden’s facilities for water supply and sanitation totalled EUR 1.4 billion, including VAT at 25%. Costs of sewerage, including collection and treatment, make up a somewhat higher share than that represented by drinking-water production and distribution costs. The replacement value of all facilities is an estimated EUR 45 billion, of which infrastructure, i.e. sewerage, accounts for EUR 27 billion (70%).
Source: Swedish Water & Wastewater Association, 2008
swedish epa | wastewater treatment in sweden6
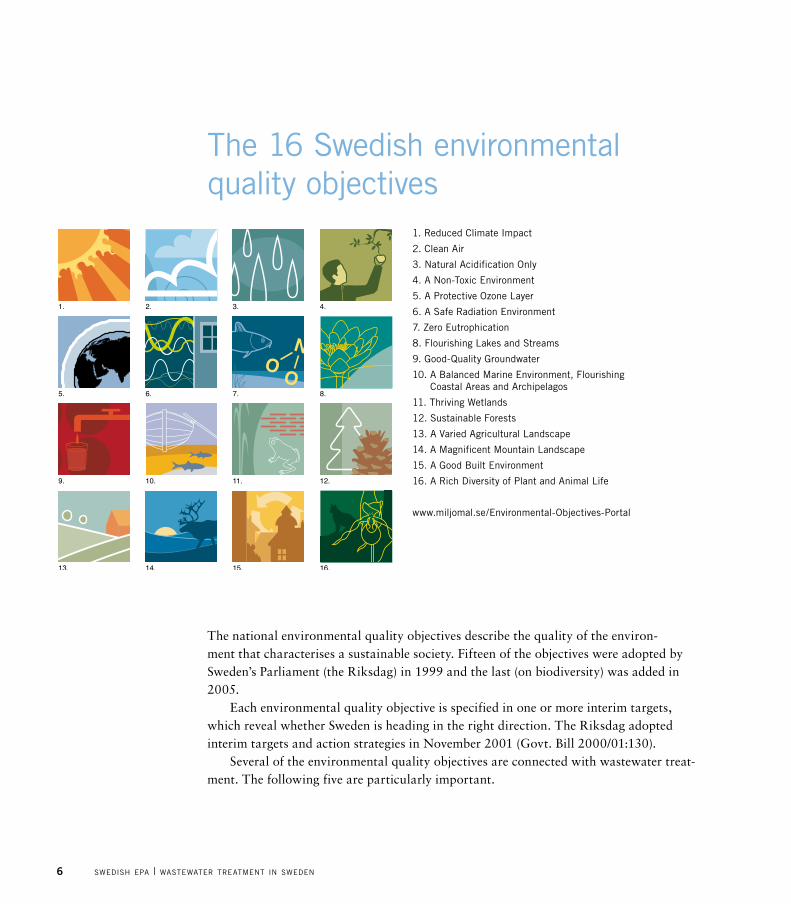
the 16 swedish environmental quality objectives
1. reduced Climate Impact
2. Clean air
3. Natural acidification Only
4. a Non-toxic environment
5. a Protective Ozone Layer
6. a safe radiation environment
7. Zero eutrophication
8. Flourishing Lakes and streams
9. Good-Quality Groundwater
10. a Balanced Marine environment, Flourishing Coastal areas and archipelagos
11. thriving Wetlands
12. sustainable Forests
13. a Varied agricultural Landscape
14. a Magnificent Mountain Landscape
15. a Good Built environment
16. a rich Diversity of Plant and animal Life
www.miljomal.se/environmental-Objectives-Portal
The national environmental quality objectives describe the quality of the environ-ment that characterises a sustainable society. Fifteen of the objectives were adopted by Sweden’s Parliament (the Riksdag) in 1999 and the last (on biodiversity) was added in 2005.
Each environmental quality objective is specified in one or more interim targets, which reveal whether Sweden is heading in the right direction. The Riksdag adopted interimtargetsandactionstrategiesinNovember2001(Govt.Bill2000/01:130).
Several of the environmental quality objectives are connected with wastewater treat-ment. The following five are particularly important.
7wastewater treatment in sweden | swedish epa
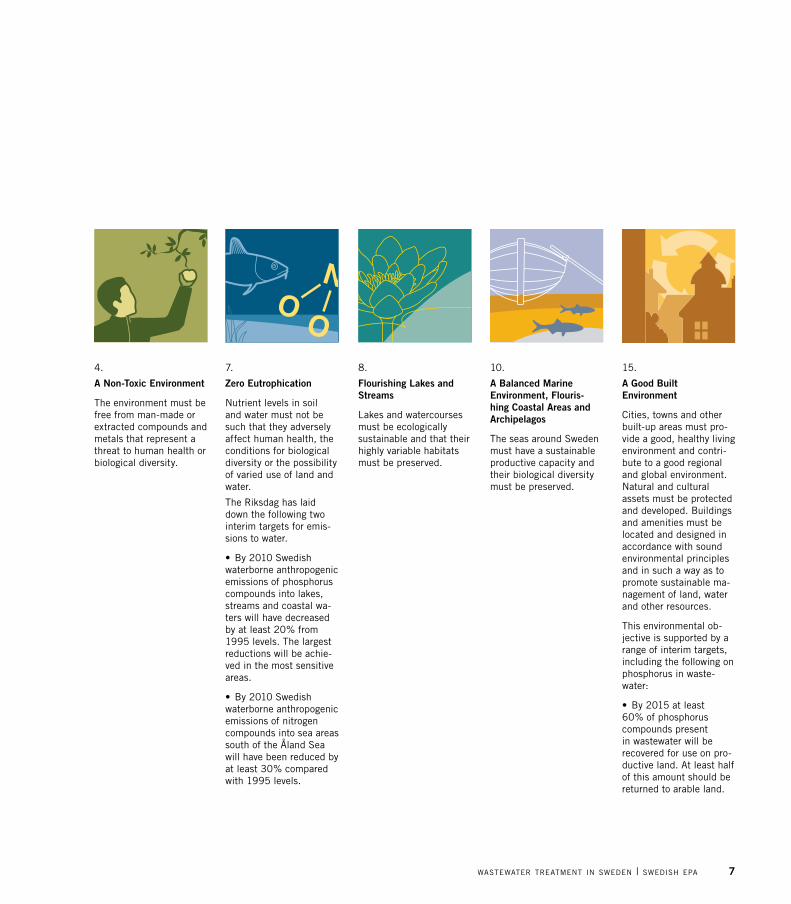
4.
a non-toxic environment
the environment must be free from man-made or extracted compounds and metals that represent a threat to human health or biological diversity.
7.
Zero eutrophication
Nutrient levels in soil and water must not be such that they adversely affect human health, the conditions for biological diversity or the possibility of varied use of land and water.
the riksdag has laid down the following two interim targets for emis-sions to water.
• By 2010 swedish waterborne anthropogenic emissions of phosphorus compounds into lakes, streams and coastal wa-ters will have decreased by at least 20% from 1995 levels. the largest reductions will be achie-ved in the most sensitive areas.
• By 2010 swedish waterborne anthropogenic emissions of nitrogen compounds into sea areas south of the Åland sea will have been reduced by at least 30% compared with 1995 levels.
8.
Flourishing lakes and streams
Lakes and watercourses must be ecologically sustainable and that their highly variable habitats must be preserved.
10.
a balanced marine environment, Flouris-hing Coastal areas and archipelagos
the seas around sweden must have a sustainable productive capacity and their biological diversity must be preserved.
15.
a Good built environment
Cities, towns and other built-up areas must pro-vide a good, healthy living environment and contri-bute to a good regional and global environment. Natural and cultural assets must be protected and developed. Buildings and amenities must be located and designed in accordance with sound environmental principles and in such a way as to promote sustainable ma-nagement of land, water and other resources.
this environmental ob-jective is supported by a range of interim targets, including the following on phosphorus in waste-water:
• By 2015 at least 60% of phosphorus compounds present in wastewater will be recovered for use on pro-ductive land. at least half of this amount should be returned to arable land.
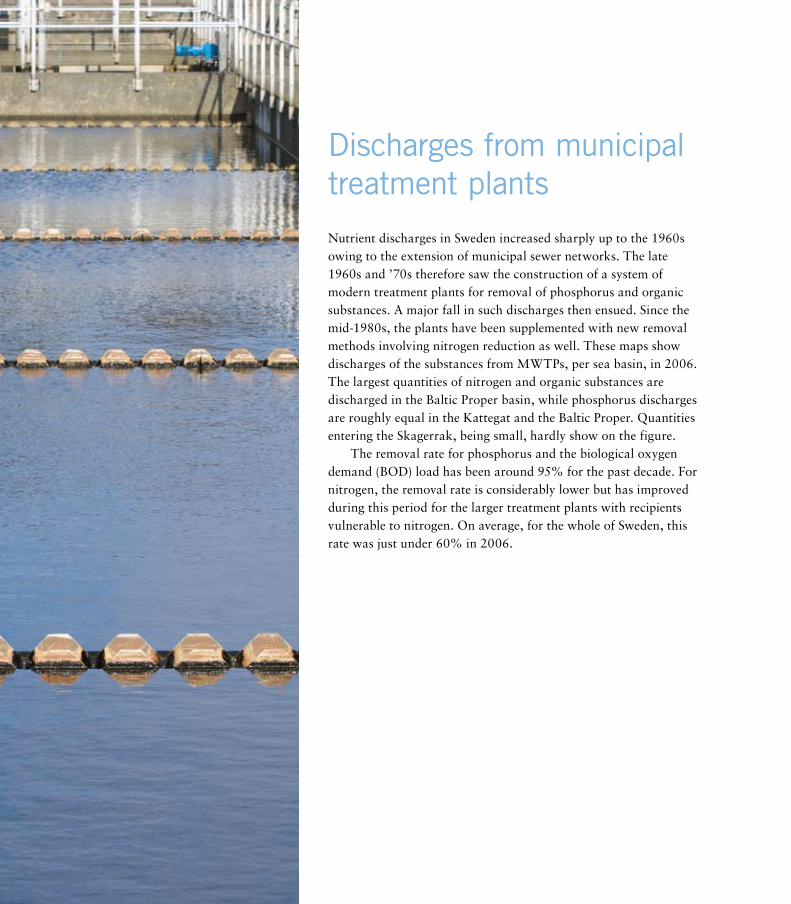
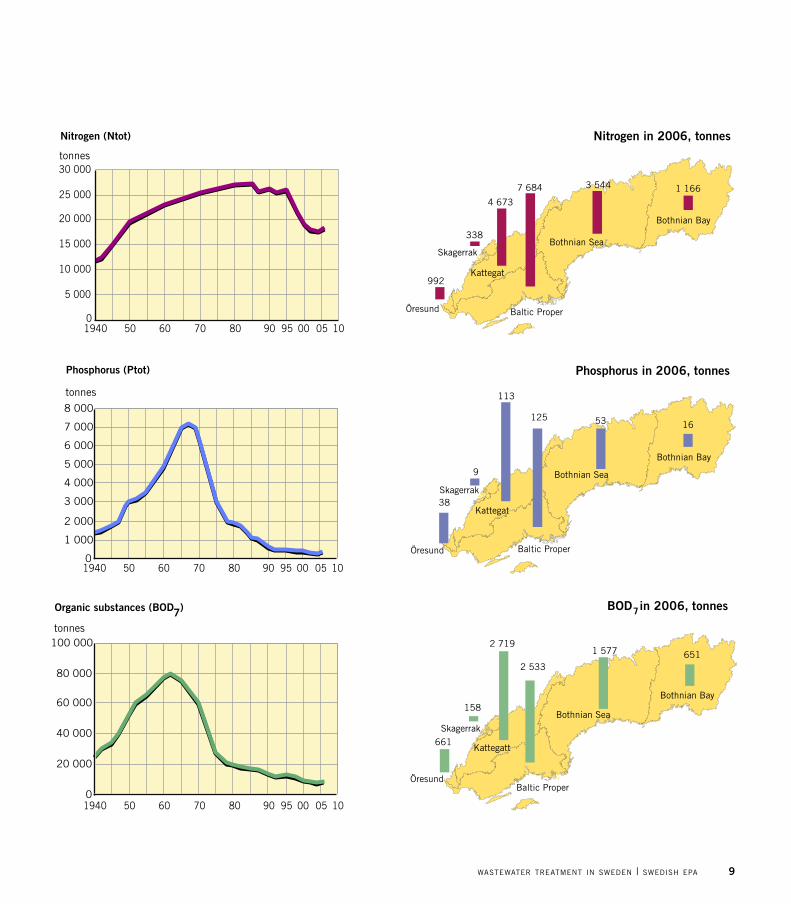
Discharges from municipal treatment plants
Nutrient discharges in Sweden increased sharply up to the 1960s owing to the extension of municipal sewer networks. The late 1960s and ’70s therefore saw the construction of a system of modern treatment plants for removal of phosphorus and organic substances. A major fall in such discharges then ensued. Since the mid-1980s, the plants have been supplemented with new removal methods involving nitrogen reduction as well. These maps show discharges of the substances from MWTPs, per sea basin, in 2006. The largest quantities of nitrogen and organic substances are discharged in the Baltic Proper basin, while phosphorus discharges are roughly equal in the Kattegat and the Baltic Proper. Quantities entering the Skagerrak, being small, hardly show on the figure.
The removal rate for phosphorus and the biological oxygen demand (BOD) load has been around 95% for the past decade. For nitrogen, the removal rate is considerably lower but has improved during this period for the larger treatment plants with recipients vulnerable to nitrogen. On average, for the whole of Sweden, this rate was just under 60% in 2006.
9wastewater treatment in sweden | swedish epa
nitrogen (ntot)
phosphorus (ptot)
organic substances (bod7)
Bothnian Bay
Bothnian Sea
Baltic Proper
Skagerrak
Öresund
Kattegat
9
113
125 53 16
38
Bothnian Bay
Bothnian Sea
Baltic Proper
Skagerrak
Öresund
Kattegat
1 1663 544
4 673
7 684
992
338
Baltic Proper
Bothnian Bay
Bothnian Sea
Skagerrak
Öresund
Kattegatt
651
661
158
2 719
2 533
1 577
Phosphorus in 2006, tonnes
Nitrogen in 2006, tonnes
BOD in 2006, tonnes7
0
5 000
10 000
15 000
20 000
25 000
30 000tonnes
1940 50 60 70 80 90 00 0595 10
0
20 000
40 000
60 000
80 000
100 000tonnes
1940 50 60 70 80 90 00 0595 10
0
1 000
2 000
3 000
4 000
5 000
6 000
7 000
8 000
tonnes
1940 50 60 70 80 90 00 0595 10
Bothnian Bay
Bothnian Sea
Baltic Proper
Skagerrak
Öresund
Kattegat
9
113
125 53 16
38
Bothnian Bay
Bothnian Sea
Baltic Proper
Skagerrak
Öresund
Kattegat
1 1663 544
4 673
7 684
992
338
Baltic Proper
Bothnian Bay
Bothnian Sea
Skagerrak
Öresund
Kattegatt
651
661
158
2 719
2 533
1 577
Phosphorus in 2006, tonnes
Nitrogen in 2006, tonnes
BOD in 2006, tonnes7
Bothnian Bay
Bothnian Sea
Baltic Proper
Skagerrak
Öresund
Kattegat
9
113
125 53 16
38
Bothnian Bay
Bothnian Sea
Baltic Proper
Skagerrak
Öresund
Kattegat
1 1663 544
4 673
7 684
992
338
Baltic Proper
Bothnian Bay
Bothnian Sea
Skagerrak
Öresund
Kattegatt
651
661
158
2 719
2 533
1 577
Phosphorus in 2006, tonnes
Nitrogen in 2006, tonnes
BOD in 2006, tonnes7
swedish epa | wastewater treatment in sweden10
treatment plants as emission sources
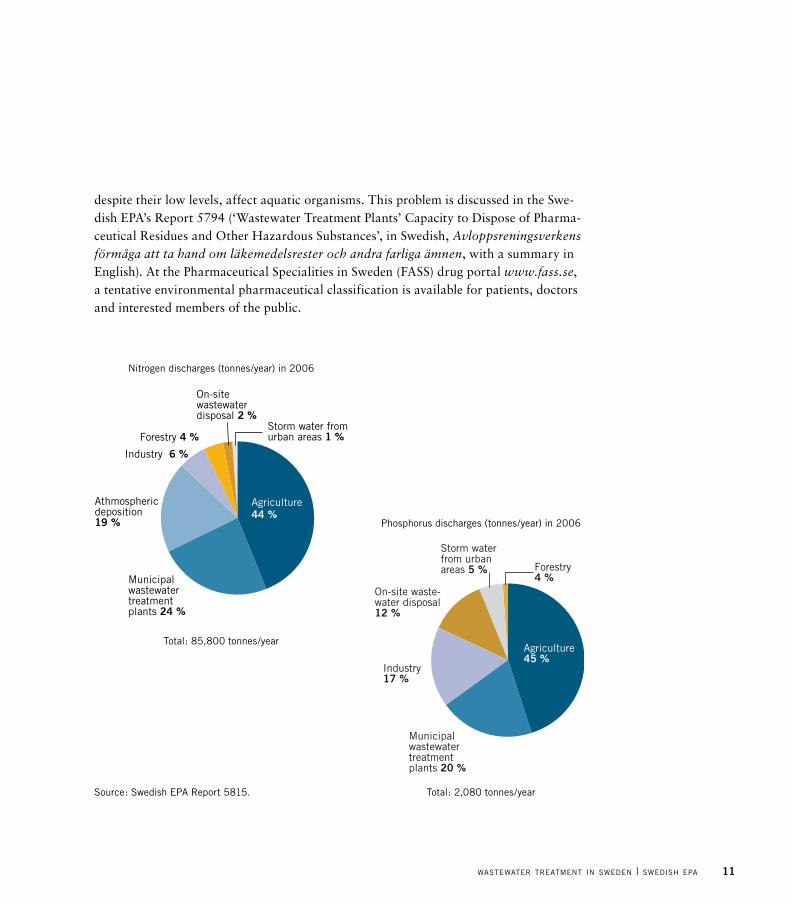
Swedish wastewater treatment plants currently achieve a good and steadily rising removal rate of nutrients. However, discharges from wastewater disposal systems are still a substantial source of eutrophying substances (phosphorus, nitrogen and organic matter) in Swedish waters. Discharges of these substances have decreased considerably over the past few decades. The diagrams below, summarising anthropogenic nitrogen and phosphorus emissions in 2006, show that agriculture is the largest source while the share derived from treatment plants is just under 25% for both nitrogen and phosphorus.
Municipal wastewater treatment plants (MWTPs) receive mainly wastewater from urban areas, while permanent or holiday homes in rural areas often have their own stand-alone(‘local’or‘on-site’)installationsforwastewaterdisposal.InSwedensome750,000 properties are not connected to MWTPs. Disposal standards in these areas are highly variable and only some 60% of installations are estimated as meeting standards complying with the Environmental Code’s requirements. Today, the amount of phospho-rus released from local wastewater disposal is more than half that of the total amount discharged by MWTPs.
To deal with these discharges, the Swedish EPA has drawn up general recommenda-tions concerning small-scale local installations for wastewater disposal. Many municipa-lities are currently engaged in systematic work to bring about improvements and devise action strategies.
metals and other ContaminantsMany chemicals in use today end up in sewers and are found in wastewater and sewage sludge (see page 14). Metals mostly remain in sludge, and quantities of metals in water outflows are therefore relatively small. The total amount of cadmium discharged to wa-ter from treatment plants annually is some 100 kg; the corresponding figure for mercury is 60 kg. The heaviest discharges of mercury are those previously emitted to air and accumulated in forest land. The heaviest cadmium discharges come from atmospheric deposition and fertilisers in farmland.
MWTPs also receive minor quantities of solvents and small amounts of more or less persistent organic pollutants (POPs), such as nonylphenol, brominated flame retardants, polyaromatichydrocarbons(PAHs),polychlorinatedbiphenyls(PCBs),hexachlorobenze-ne and dioxins. Several POPs are used in industry or found in household products. No-nylphenol, for example, is banned in the EU but reaches us in imported textiles. Drugs flushed into sewers cause several types of problem; many are not readily degraded and,
11wastewater treatment in sweden | swedish epa
despite their low levels, affect aquatic organisms. This problem is discussed in the Swe-dishEPA’sReport5794(‘WastewaterTreatmentPlants’CapacitytoDisposeofPharma-ceuticalResiduesandOtherHazardousSubstances’,inSwedish,Avloppsreningsverkens förmåga att ta hand om läkemedelsrester och andra farliga ämnen, with a summary in English). At the Pharmaceutical Specialities in Sweden (FASS) drug portal www.fass.se, a tentative environmental pharmaceutical classification is available for patients, doctors and interested members of the public.
Nitrogen discharges (tonnes/year) in 2006
Phosphorus discharges (tonnes/year) in 2006
total: 85,800 tonnes/year
total: 2,080 tonnes/yearsource: swedish ePa report 5815.
Agriculture45 %
Municipal wastewater treatment plants 20 %
Forestry4 %
On-site waste-water disposal12 %
Industry17 %
Storm waterfrom urbanareas 5 %
Agriculture44 %
Municipalwastewatertreatmentplants 24 %
Athmosphericdeposition19 %
Forestry 4 %
On-sitewastewaterdisposal 2 %
Industry 6 %
Storm water fromurban areas 1 %
swedish epa | wastewater treatment in sweden12
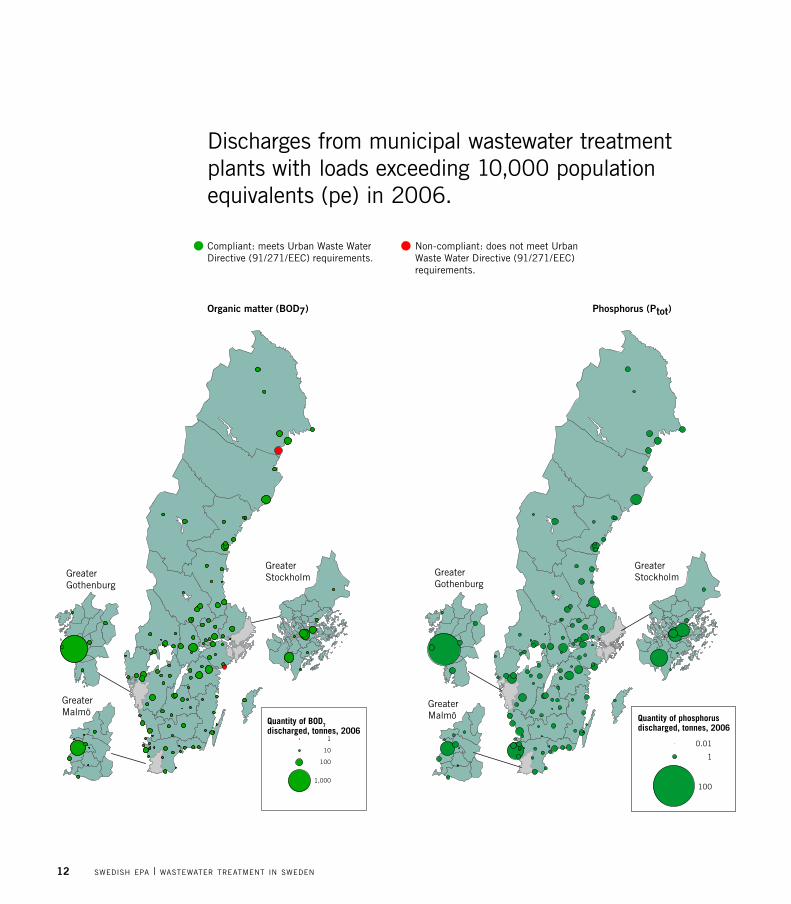
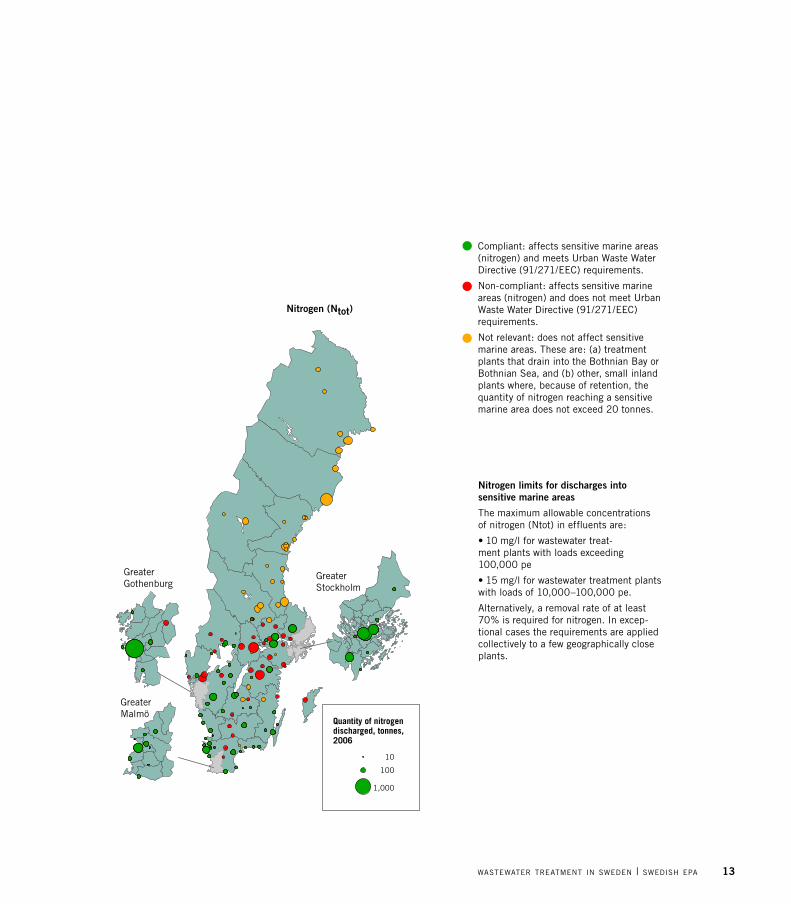
Discharges from municipal wastewater treatment plants with loads exceeding 10,000 population equivalents (pe) in 2006.
Compliant: meets Urban Waste Water Directive (91/271/EEC) requirements.
Non-compliant: does not meet Urban Waste Water Directive (91/271/EEC) requirements.
1
10
100
1,000
Quantity of BOD7discharged, tonnes, 2006
Greater Gothenburg
Greater Malmö
Greater Stockholm
Quantity of phosphorusdischarged, tonnes, 2006
0.01
1
100
Greater Gothenburg
Greater Malmö
Greater Stockholm
Organic matter (BOD7) Phosphorus (Ptot)
13wastewater treatment in sweden | swedish epa
10
100
1,000
Quantity of nitrogendischarged, tonnes,2006
Greater Gothenburg
Greater Malmö
Greater Stockholm
Compliant: affects sensitive marine areas (nitrogen) and meets Urban Waste Water Directive (91/271/EEC) requirements.
Non-compliant: affects sensitive marine areas (nitrogen) and does not meet Urban Waste Water Directive (91/271/EEC) requirements.
Not relevant: does not affect sensitive marine areas. These are: (a) treatment plants that drain into the Bothnian Bay or Bothnian Sea, and (b) other, small inland plants where, because of retention, the quantity of nitrogen reaching a sensitive marine area does not exceed 20 tonnes.
Nitrogen limits for discharges into sensitive marine areas
The maximum allowable concentrations of nitrogen (Ntot) in effluents are:
• 10 mg/l for wastewater treat- ment plants with loads exceeding 100,000 pe
• 15 mg/l for wastewater treatment plants with loads of 10,000–100,000 pe.
Alternatively, a removal rate of at least 70% is required for nitrogen. In excep-tional cases the requirements are applied collectively to a few geographically close plants.
Nitrogen (Ntot)
swedish epa | wastewater treatment in sweden14
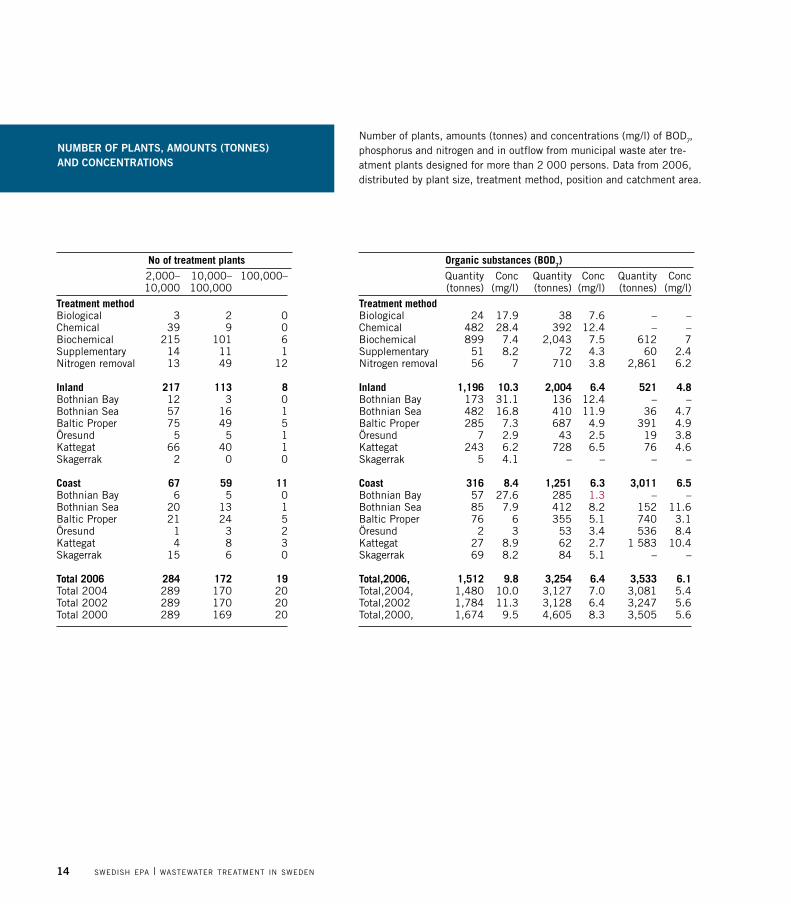
Number of plants, amounts (tonnes) and concentrations (mg/l) of BOD7, phosphorus and nitrogen and in outflow from municipal waste ater tre-atment plants designed for more than 2 000 persons. Data from 2006, distributed by plant size, treatment method, position and catchment area.
No of treatment plants 2,000– 10,000– 100,000– 10,000 100,000 Treatment methodBiological 3 2 0Chemical 39 9 0Biochemical 215 101 6supplementary 14 11 1Nitrogen removal 13 49 12 Inland 217 113 8Bothnian Bay 12 3 0Bothnian sea 57 16 1Baltic Proper 75 49 5Öresund 5 5 1Kattegat 66 40 1skagerrak 2 0 0 Coast 67 59 11Bothnian Bay 6 5 0Bothnian sea 20 13 1Baltic Proper 21 24 5Öresund 1 3 2Kattegat 4 8 3skagerrak 15 6 0 Total 2006 284 172 19total 2004 289 170 20total 2002 289 170 20total 2000 289 169 20
Organic substances (BOD7) Quantity Conc Quantity Conc Quantity Conc (tonnes) (mg/l) (tonnes) (mg/l) (tonnes) (mg/l)Treatment method Biological 24 17.9 38 7.6 – –Chemical 482 28.4 392 12.4 – –Biochemical 899 7.4 2,043 7.5 612 7supplementary 51 8.2 72 4.3 60 2.4Nitrogen removal 56 7 710 3.8 2,861 6.2
Inland 1,196 10.3 2,004 6.4 521 4.8Bothnian Bay 173 31.1 136 12.4 – –Bothnian sea 482 16.8 410 11.9 36 4.7Baltic Proper 285 7.3 687 4.9 391 4.9Öresund 7 2.9 43 2.5 19 3.8Kattegat 243 6.2 728 6.5 76 4.6skagerrak 5 4.1 – – – –
Coast 316 8.4 1,251 6.3 3,011 6.5Bothnian Bay 57 27.6 285 1.3 – –Bothnian sea 85 7.9 412 8.2 152 11.6Baltic Proper 76 6 355 5.1 740 3.1Öresund 2 3 53 3.4 536 8.4Kattegat 27 8.9 62 2.7 1 583 10.4skagerrak 69 8.2 84 5.1 – –
Total,2006, 1,512 9.8 3,254 6.4 3,533 6.1total,2004, 1,480 10.0 3,127 7.0 3,081 5.4total,2002 1,784 11.3 3,128 6.4 3,247 5.6total,2000, 1,674 9.5 4,605 8.3 3,505 5.6
number oF plants, amounts (tonnes) and ConCentrations
15wastewater treatment in sweden | swedish epa
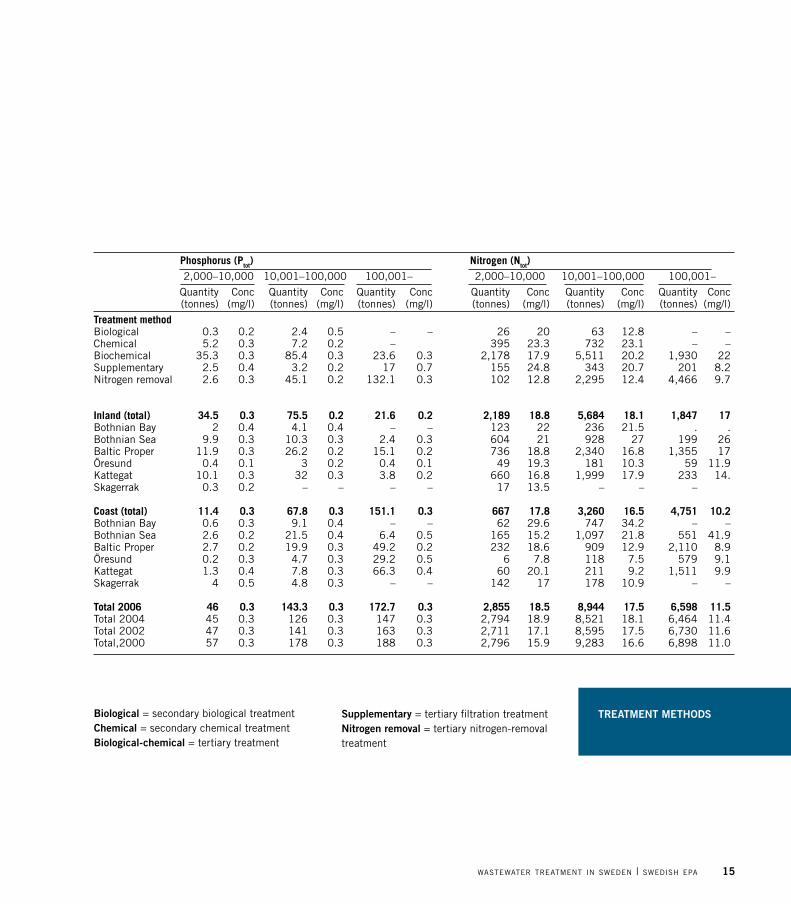
Phosphorus (Ptot) Nitrogen (Ntot) 2,000–10,000 10,001–100,000 100,001– 2,000–10,000 10,001–100,000 100,001– Quantity Conc Quantity Conc Quantity Conc Quantity Conc Quantity Conc Quantity Conc (tonnes) (mg/l) (tonnes) (mg/l) (tonnes) (mg/l) (tonnes) (mg/l) (tonnes) (mg/l) (tonnes) (mg/l)Treatment method Biological 0.3 0.2 2.4 0.5 – – 26 20 63 12.8 – –Chemical 5.2 0.3 7.2 0.2 – 395 23.3 732 23.1 – –Biochemical 35.3 0.3 85.4 0.3 23.6 0.3 2,178 17.9 5,511 20.2 1,930 22supplementary 2.5 0.4 3.2 0.2 17 0.7 155 24.8 343 20.7 201 8.2Nitrogen removal 2.6 0.3 45.1 0.2 132.1 0.3 102 12.8 2,295 12.4 4,466 9.7
Inland (total) 34.5 0.3 75.5 0.2 21.6 0.2 2,189 18.8 5,684 18.1 1,847 17Bothnian Bay 2 0.4 4.1 0.4 – – 123 22 236 21.5 . .Bothnian sea 9.9 0.3 10.3 0.3 2.4 0.3 604 21 928 27 199 26Baltic Proper 11.9 0.3 26.2 0.2 15.1 0.2 736 18.8 2,340 16.8 1,355 17Öresund 0.4 0.1 3 0.2 0.4 0.1 49 19.3 181 10.3 59 11.9Kattegat 10.1 0.3 32 0.3 3.8 0.2 660 16.8 1,999 17.9 233 14.skagerrak 0.3 0.2 – – – – 17 13.5 – – – Coast (total) 11.4 0.3 67.8 0.3 151.1 0.3 667 17.8 3,260 16.5 4,751 10.2Bothnian Bay 0.6 0.3 9.1 0.4 – – 62 29.6 747 34.2 – –Bothnian sea 2.6 0.2 21.5 0.4 6.4 0.5 165 15.2 1,097 21.8 551 41.9Baltic Proper 2.7 0.2 19.9 0.3 49.2 0.2 232 18.6 909 12.9 2,110 8.9Öresund 0.2 0.3 4.7 0.3 29.2 0.5 6 7.8 118 7.5 579 9.1Kattegat 1.3 0.4 7.8 0.3 66.3 0.4 60 20.1 211 9.2 1,511 9.9skagerrak 4 0.5 4.8 0.3 – – 142 17 178 10.9 – – Total 2006 46 0.3 143.3 0.3 172.7 0.3 2,855 18.5 8,944 17.5 6,598 11.5total 2004 45 0.3 126 0.3 147 0.3 2,794 18.9 8,521 18.1 6,464 11.4total 2002 47 0.3 141 0.3 163 0.3 2,711 17.1 8,595 17.5 6,730 11.6total,2000 57 0.3 178 0.3 188 0.3 2,796 15.9 9,283 16.6 6,898 11.0
biological = secondary biological treatmentChemical = secondary chemical treatmentbiological-chemical = tertiary treatment
supplementary = tertiary filtration treatmentnitrogen removal = tertiary nitrogen-removal treatment
treatment methods

swedish epa | wastewater treatment in sweden16
treatment methods
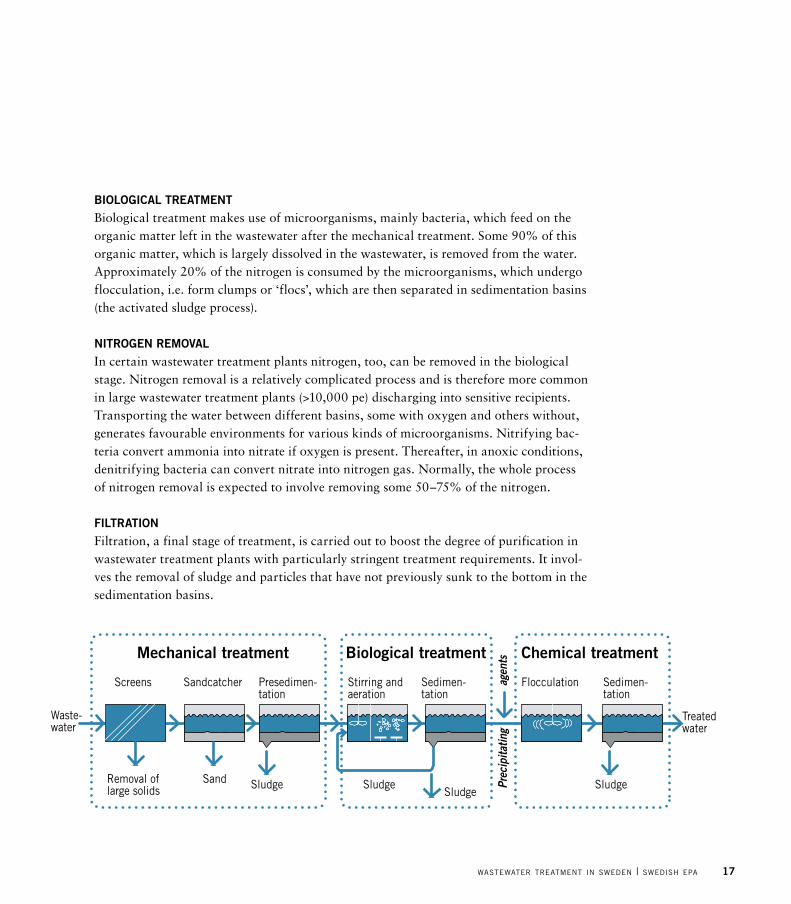
Wastewater treatment plants in Sweden usually combine various means of mechanical, biological and chemical treatment. The process invariably begins with some form of mechanical removal of solids. Thereafter, the most frequent combinations in treatment plants are:•biologicaltreatment•chemicaltreatment•biological-chemicaltreatment(conventionalthree-stagetreatment)•biological-chemicaltreatmentwithaspecialnitrogenremovalstage•biological-chemicaltreatmentwithsupplementarytreatment(e.g.filtering).
meChaniCal treatmentIn this stage of treatment, large solids are removed: grit (stones, sand and gravel), pieces of wood, paper, hair, textiles and plastic. This takes place by means of screening, the use of sand catchers and presedimentation:•Thescreenscatchragsandothercoarsedebristhatwouldotherwiseclog up pumps or cause problems in the rest of the treatment process.•Asandcatcherconsistsofabasin-likechamberwitha‘pocket’tocollect grit and other particles that, owing to their weight, easily sink to the bottom. The particles that settle on the bottom are extracted with pumpsandthesolidsfromthesandcatcheraretransportedtoalandfill.•Inpresedimentation,particlesthathavenotbeencaughtinthescreenor sand catcher and need removing before the subsequent biochemical treatment are extracted. The heavier particles sink to the bottom, where scraperscollectthemandpushthemintoa‘sludgepocket’,fromwherethe sludge is pumped for sludge treatment.
ChemiCal treatmentThe chemical stage mainly involves removing phosphorus from the was-tewater. This is done by adding precipitating chemicals based on alumi-nium or iron that cause the dissolved phosphorus to precipitate. After flocculation (see below) the sludge is separated by means, for example, of sedimentation. Some 90% of the phosphorus is thus removed.
17wastewater treatment in sweden | swedish epa
bioloGiCal treatmentBiological treatment makes use of microorganisms, mainly bacteria, which feed on the organic matter left in the wastewater after the mechanical treatment. Some 90% of this organic matter, which is largely dissolved in the wastewater, is removed from the water. Approximately 20% of the nitrogen is consumed by the microorganisms, which undergo flocculation,i.e.formclumpsor‘flocs’,whicharethenseparatedinsedimentationbasins(the activated sludge process).
nitroGen removalIn certain wastewater treatment plants nitrogen, too, can be removed in the biological stage. Nitrogen removal is a relatively complicated process and is therefore more common in large wastewater treatment plants (>10,000 pe) discharging into sensitive recipients. Transporting the water between different basins, some with oxygen and others without, generates favourable environments for various kinds of microorganisms. Nitrifying bac-teria convert ammonia into nitrate if oxygen is present. Thereafter, in anoxic conditions, denitrifying bacteria can convert nitrate into nitrogen gas. Normally, the whole process of nitrogen removal is expected to involve removing some 50–75% of the nitrogen.
FiltrationFiltration, a final stage of treatment, is carried out to boost the degree of purification in wastewater treatment plants with particularly stringent treatment requirements. It invol-ves the removal of sludge and particles that have not previously sunk to the bottom in the sedimentation basins.
Mechanical treatment Biological treatment Chemical treatment
Screens Sandcatcher Presedimen-tation
Stirring andaeration
Sedimen-tation
Flocculation Sedimen-tation
Removal oflarge solids
Sand Sludge Sludge SludgeSludge
Treatedwater
Waste-water
Prec
ipita
ting
agen
ts
swedish epa | wastewater treatment in sweden18
restoring wastewater nutrients to the soil
In a sustainable society, the nutrients contained in wastewater should be reused. Present-day agriculture is not self-supporting when it comes to plant nutrients and, accordingly, has a large annual requirement of raw phosphate and other substances in commercial fertiliser. If the plant nutrients found in wastewater can be returned to farmland, they can form part of a natural cycle, enabling money to be saved and the environment spared. If nutrients end up in the wrong place, one risk is substantial eutrophication. In wastewater treatment plants the phosphorus in sewage sludge, in particular, is collected and can be used to fertilise fields or other land in need of fertilisation. For sewage sludge to be restored to the land, it must not contain such substances as heavy metals or orga-nic contaminants in excess.
Sweden’s wastewater treatment plants are built to remove plant nutrients from the water phase and bind them in sludge, but the removal methods are not intended to dis-poseofhazardoussubstances.Thelattergenerallypassthroughthesystemandreachla-kes and seas; there they may affect the benthic fauna and fish, for example. Sometimes, toxic substances also kill the organisms contained in the basins at wastewater treatment plants causing problems in the removal. Some substances may also remain in the sludge and thus be spread on farmland.
poluttants in sewaGe sludGeUndesired substances may also reach wastewater treatment plants via storm water. Much of the heavy metals that enter these plants comes from road transport — tyres, brakes and carwash facilities, for example. Work is therefore under way to separate storm water from other wastewater or purify it before it is allowed to enter the flow.
Researchers consider that the risks entailed by undesired substances in sludge are small for human beings, animals and plants. Nevertheless, there is concern about the effects that more or less unknown substances may have. Perfluorooctane sulphonates (PFOS), which belong to the category of substances that are resistant to biodegradation, are an example of substances alien to nature that have been detected in the environment relatively recently.
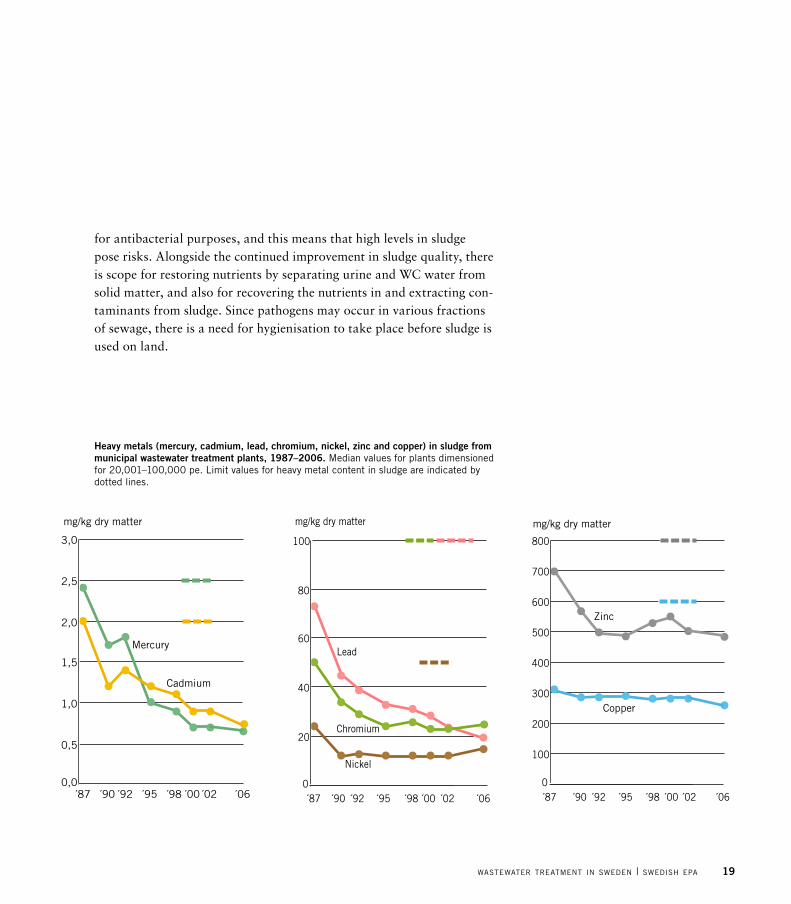
The figures show that the quality of sewage sludge in Sweden has improved in the past few decades. Nonetheless, a great deal of work remains to be done before the sludge is free from undesired substances. Silver and triclosan are substances increasingly used
19wastewater treatment in sweden | swedish epa
for antibacterial purposes, and this means that high levels in sludge pose risks. Alongside the continued improvement in sludge quality, there is scope for restoring nutrients by separating urine and WC water from solid matter, and also for recovering the nutrients in and extracting con-taminants from sludge. Since pathogens may occur in various fractions of sewage, there is a need for hygienisation to take place before sludge is used on land.
0
20
40
60
80
100
mg/kg dry matter
´87 ´90 ´92 ´95 ´98 ´00 ´02 ´06
Lead
Chromium
Nickel
0,0
0,5
1,0
1,5
2,0
2,5
3,0
mg/kg dry matter
´87 ´90 ´92 ´95 ´98 ´00 ´02 ´06
Mercury
Cadmium
0
100
200
300
400
500
600
700
800
´87 ´90 ´92 ´95 ´98 ´00 ´02 ´06
mg/kg dry matter
Zinc
Copper
Heavy metals (mercury, cadmium, lead, chromium, nickel, zinc and copper) in sludge from municipal wastewater treatment plants, 1987–2006. Median values for plants dimensioned for 20,001–100,000 pe. Limit values for heavy metal content in sludge are indicated by dotted lines.
swedish epa | wastewater treatment in sweden20
Monitoring environmental status
Discharges from MWTPs and industrial facilities affect the environment on varying scales, from the local watercourse to the whole Baltic or North Sea. To determine where aloadoriginates,alldischargesaffectingaparticularbodyofwater(the‘recipient’)canbe quantified. Pollution in small lakes, sea inlets or bays can commonly be linked to spe-cific sources, but the larger the recipient, the harder it is to specify the sources. Winds, currents and atmospheric deposition have a major bearing on the distribution of various substances in the marine environment.
reCipient monitorinGAll activities with permits under the Swedish Environmental Code, including treatment plants,carryout‘operatorself-monitoring’.Thisusuallyinvolvesinspectingthefacilitiesthemselves; their handling of chemicals and management of waste; and their emissions to water and air. In some cases, it also involves carrying out measurements in the reci-pient. All these data are reported in annual environmental reports, such as those avai-lable at www.stockholmvatten.se (in Swedish). Stockholm Vatten, a municipal limited company (which produces Stockholm’s drinking water, treats wastewater and operates sewer networks), is the principal for several treatment plants in the Stockholm area. Since the early 1980s, jointly with other municipalities with discharges into the Stock-holm archipelago, it has run a recipient monitoring programme.
In many cases, monitoring of major watercourses, lakes and coastal areas is con-ducted through the agency of local water conservation associations. These associations’ members are usually municipalities, industrial companies and trade organisations. The Lake Vänern water quality association is an example of one engaged in coordinated operator self-monitoring; see www.vanern.se (in Swedish).
environmental monitorinGIn Sweden, state-funded environmental monitoring is in progress to document the over-all state of, and changes in, the environment. Results show whether the environmental protection measures implemented are bringing about the desired improvements, and whether Sweden is attaining its set environmental quality objectives. The Swedish EPA is responsible for nationwide environmental monitoring, which is divided into various programme areas, Freshwater being one and Seas and Coastal Areas another; see www.naturvardsverket.se/en/In-English/Menu/State-of-the-environment/Environmental-monitoring/. The EPA is also in charge of coordinating the regional environmental monitoring that is otherwise organised by the county administrative boards. Regional
21wastewater treatment in sweden | swedish epa
monitoring of surface water has been partly chan-ged: since 2007, monitoring of water status has been at the water-district level, pursuant to the Water Framework Directive and the Swedish Ordinance on Water Quality Management.
epa sCreeninG proGrammeMany of the chemical substances found in society at large end up in sewers and treatment plants. The amounts of heavy metals discharged, at least, are regularly monitored within the obligatory inspec-tion programmes. The numerous organic contami-nants, on the other hand, are not analysed regularly because doing so would be both difficult and costly. In addition, new chemical substances are appea-ring all the time. The Swedish EPA therefore has a special programme with campaign-type sampling and analysis of new environmental pollutants and pharmaceuticalresidues,inparticular.This‘screen-ing programme’ makes it possible to carry out spot checks to see how far these substances occur in the environment, what their sources are and whether human beings are at risk of exposure to them. Sludge, sediments and wastewater from industry and MWTPs are usually sampled, since they collect pollutants from many sources.
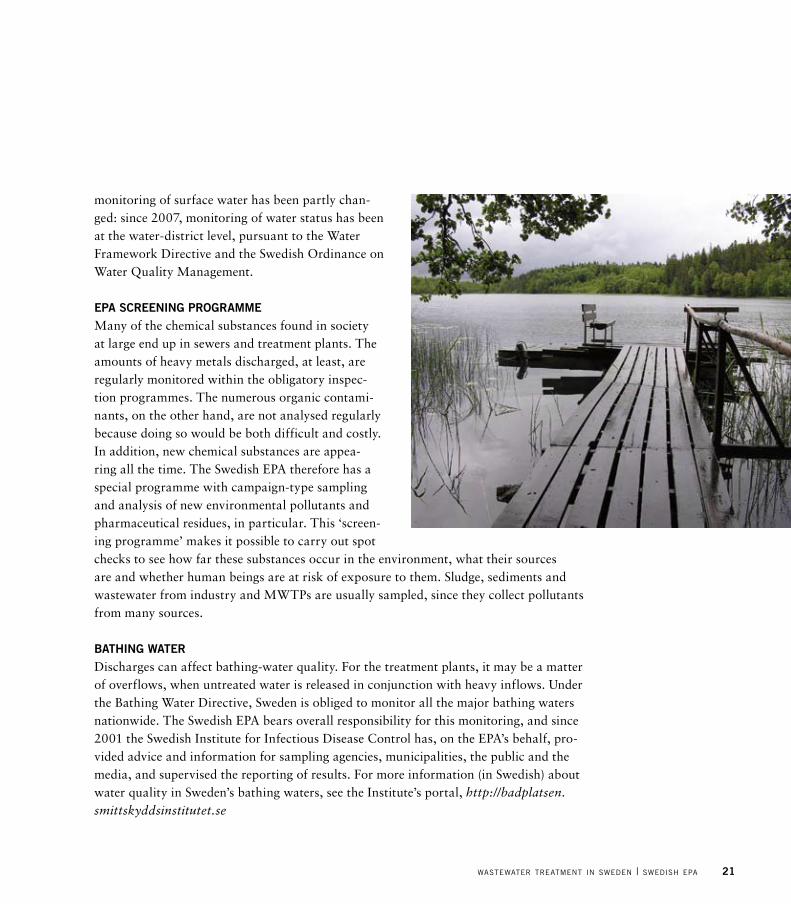
bathinG waterDischarges can affect bathing-water quality. For the treatment plants, it may be a matter of overflows, when untreated water is released in conjunction with heavy inflows. Under the Bathing Water Directive, Sweden is obliged to monitor all the major bathing waters nationwide. The Swedish EPA bears overall responsibility for this monitoring, and since 2001 the Swedish Institute for Infectious Disease Control has, on the EPA’s behalf, pro-vided advice and information for sampling agencies, municipalities, the public and the media, and supervised the reporting of results. For more information (in Swedish) about water quality in Sweden’s bathing waters, see the Institute’s portal, http://badplatsen.smittskyddsinstitutet.se
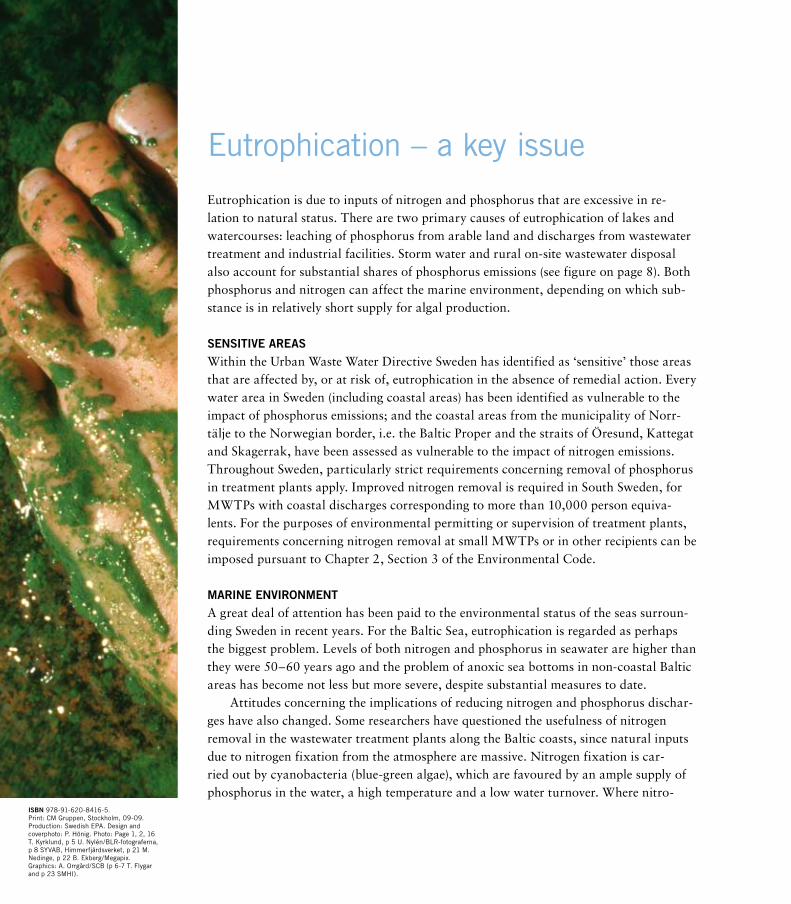
Eutrophication – a key issue
Eutrophication is due to inputs of nitrogen and phosphorus that are excessive in re-lation to natural status. There are two primary causes of eutrophication of lakes and watercourses: leaching of phosphorus from arable land and discharges from wastewater treatment and industrial facilities. Storm water and rural on-site wastewater disposal also account for substantial shares of phosphorus emissions (see figure on page 8). Both phosphorus and nitrogen can affect the marine environment, depending on which sub-stance is in relatively short supply for algal production.
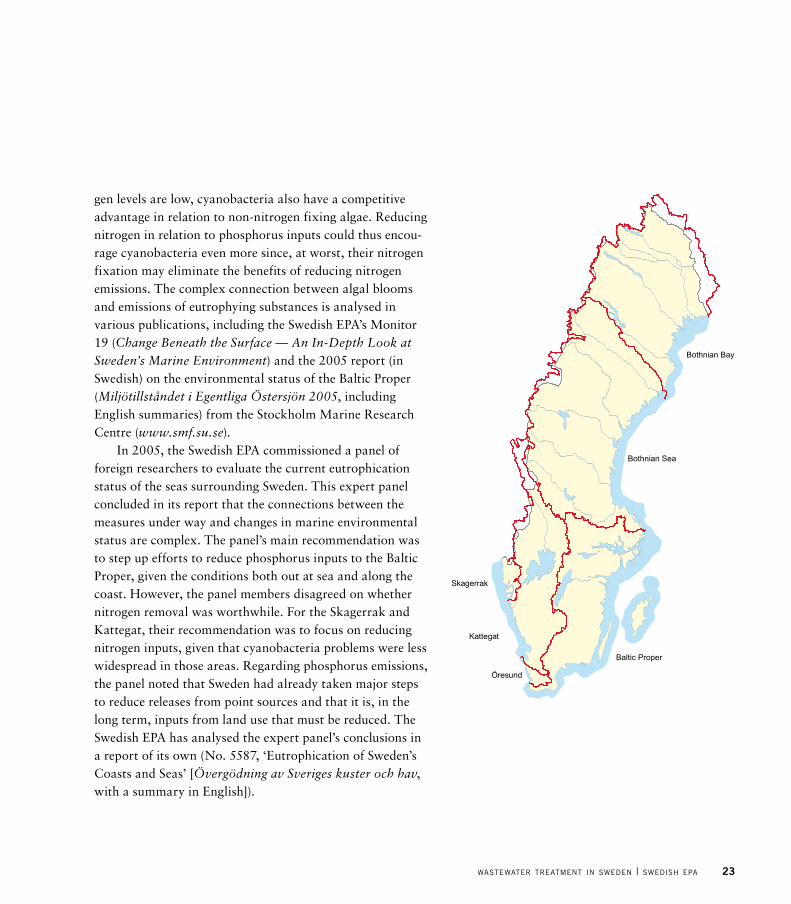
SenSitive areaSWithin the Urban Waste Water Directive Sweden has identified as ‘sensitive’ those areas that are affected by, or at risk of, eutrophication in the absence of remedial action. Every water area in Sweden (including coastal areas) has been identified as vulnerable to the impact of phosphorus emissions; and the coastal areas from the municipality of Norr-tälje to the Norwegian border, i.e. the Baltic Proper and the straits of Öresund, Kattegat and Skagerrak, have been assessed as vulnerable to the impact of nitrogen emissions. Throughout Sweden, particularly strict requirements concerning removal of phosphorus in treatment plants apply. Improved nitrogen removal is required in South Sweden, for MWTPs with coastal discharges corresponding to more than 10,000 person equiva-lents. For the purposes of environmental permitting or supervision of treatment plants, requirements concerning nitrogen removal at small MWTPs or in other recipients can be imposed pursuant to Chapter 2, Section 3 of the Environmental Code.
Marine environMentA great deal of attention has been paid to the environmental status of the seas surroun-ding Sweden in recent years. For the Baltic Sea, eutrophication is regarded as perhaps the biggest problem. Levels of both nitrogen and phosphorus in seawater are higher than they were 50–60 years ago and the problem of anoxic sea bottoms in non-coastal Baltic areas has become not less but more severe, despite substantial measures to date.
Attitudes concerning the implications of reducing nitrogen and phosphorus dischar-ges have also changed. Some researchers have questioned the usefulness of nitrogen removal in the wastewater treatment plants along the Baltic coasts, since natural inputs due to nitrogen fixation from the atmosphere are massive. Nitrogen fixation is car-ried out by cyanobacteria (blue-green algae), which are favoured by an ample supply of phosphorus in the water, a high temperature and a low water turnover. Where nitro-
iSBn 978-91-620-8416-5. Print: CM Gruppen, Stockholm, 09-09. Production: Swedish EPA. Design and coverphoto: P. Hönig. Photo: Page 1, 2, 16 T. Kyrklund, p 5 U. Nylén/BLR-fotograferna, p 8 SYVAB, Himmerfjärdsverket, p 21 M. Nedinge, p 22 B. Ekberg/Megapix. Graphics: A. Orrgård/SCB (p 6-7 T. Flygar and p 23 SMHI).
23wastewater treatment in sweden | swedish epa
gen levels are low, cyanobacteria also have a competitive advantage in relation to non-nitrogen fixing algae. Reducing nitrogen in relation to phosphorus inputs could thus encou-rage cyanobacteria even more since, at worst, their nitrogen fixation may eliminate the benefits of reducing nitrogen emissions. The complex connection between algal blooms and emissions of eutrophying substances is analysed in various publications, including the Swedish EPA’s Monitor 19 (Change Beneath the Surface — An In-Depth Look at Sweden’s Marine Environment) and the 2005 report (in Swedish) on the environmental status of the Baltic Proper (Miljötillståndet i Egentliga Östersjön 2005, including English summaries) from the Stockholm Marine Research Centre (www.smf.su.se).
In 2005, the Swedish EPA commissioned a panel of foreign researchers to evaluate the current eutrophication status of the seas surrounding Sweden. This expert panel concluded in its report that the connections between the measures under way and changes in marine environmental status are complex. The panel’s main recommendation was to step up efforts to reduce phosphorus inputs to the Baltic Proper, given the conditions both out at sea and along the coast. However, the panel members disagreed on whether nitrogen removal was worthwhile. For the Skagerrak and Kattegat, their recommendation was to focus on reducing nitrogen inputs, given that cyanobacteria problems were less widespread in those areas. Regarding phosphorus emissions, the panel noted that Sweden had already taken major steps to reduce releases from point sources and that it is, in the long term, inputs from land use that must be reduced. The Swedish EPA has analysed the expert panel’s conclusions in areportofitsown(No.5587,‘EutrophicationofSweden’s Coasts and Seas’ [Övergödning av Sveriges kuster och hav, with a summary in English]).
Bothnian Bay
Skagerrak
Kattegat
Baltic Proper
Bothnian Sea
Öresund
Wastewater disposal has metamorphosed from a solution to a local sanitary problem into an international environmental issue. This publication describes how treatment of wastewater from urban areas has evolved in Sweden.
The report is issued pursuant to Article 16 of Council Directive 91/271/EEC concerning urban wastewater treatment, often known as ‘the Urban Waste Water Directive’. This Directive covers all wastewater collected in sewer networks, but quanti-tative controls are imposed only on the treatment plants that serve more than 2,000 people. In Sweden, this corresponds to some 450 installations.
Swedish EPA SE-106 48 Stockholm. Visiting address: Stockholm - Valhallavägen 195, Östersund - Forskarens väg 5 hus Ub, Kiruna - Kaserngatan 14. Tel: +46 8-698 10 00, fax: +46 8-20 29 25, e-mail: [email protected] Internet: www.naturvardsverket.se Orders Ordertel: +46 8-505 933 40, orderfax: +46 8-505 933 99, e-mail: [email protected] Address: CM Gruppen, Box 110 93, SE-161 11 Bromma. Internet: www.naturvardsverket.se/bokhandeln
ISB
N 9
78
-91-
62
0-8
416
-5