wastewater treatment using tidal flow wetlands · wastewater treatment using tidal flow wetlands...
TRANSCRIPT

University of Southern Queensland
Faculty of Health, Engineering and Sciences
Wastewater Treatment using Tidal Flow Wetlands
A dissertation submitted by
Ms Ina Weinheimer
In fulfilment of the requirement of
Bachelor of Civil Engineering (Honours)
October 2015

i
ABSTRACT
Over the last century wastewater treatment has evolved immensely. This development is
divided into two different ways of wastewater treatment. There are highly engineered
wastewater treatment systems, which can achieve high treatment standards on a small area.
And on the other hand there are natural treatment systems, such as constructed wetlands (CWs)
that need large areas to achieve suitable treatment. Besides the difference of land area required
by each of those systems they largely differ in the energy they require to perform such
wastewater treatment.
This study investigates a new type of wastewater treatment system, the Tidal Flow Wetland
(TFW). This system is part of a new generation of engineered treatment wetlands that aim to
close the gap between highly engineered smaller systems and large CWs that treat wastewater
naturally.
This study provides a comparison of different wastewater treatment options that are in direct
competition to TFWs. It determines advantages and disadvantages of various systems for
different situations. Furthermore a hypothetical wastewater situation for a small residential
development has been developed to be able to compare a TFW and a conventional CW.
Overall the TFW achieved the same treatment standard to the hybrid conventional CW on less
than a quarter of the area, while keeping energy consumption minimal. The results of the
comparison also confirm the outstanding total nitrogen (TN) removal capability. While the
TFW could achieve TN removal on only 24 m2, the hybrid system required more than half of
its total size (284 m2 of 484 m2) for nitrate removal alone.

ii
LIMITATIONS OF USE
The Council of the University of Southern Queensland, its Faculty of Health, Engineering &
Sciences, and the staff of the University of Southern Queensland, do not accept any
responsibility for the truth, accuracy or completeness of material contained within or associated
with this dissertation.
Persons using all or any part of this material do so at their own risk, and not at the risk of the
Council of the University of Southern Queensland, its Faculty of Health, Engineering &
Sciences or the staff of the University of Southern Queensland.
This dissertation reports an educational exercise and has no purpose or validity beyond this
exercise. The sole purpose of the course pair entitled “Research Project” is to contribute to the
overall education within the student’s chosen degree program. This document, the associated
hardware, software, drawings, and other material set out in the associated appendices should
not be used for any other purpose: if they are so used, it is entirely at the risk of the user.

iii
CANDIDATES CERTIFICATIONS
I certify that the ideas, designs and experimental work, results, analyses and conclusions set
out in this dissertation are entirely my own effort, except where otherwise indicated and
acknowledged.
I further certify that the work is original and has not been previously submitted for assessment
in any other course or institution, except where specifically stated.
Ina Weinheimer
Student Number: W0100754
Signature: Date:

iv
ACKNOWLEDGEMENTS
This research was carried out under the principal supervision of Prof Jochen Bundschuh.
I would like to thank David Austin for answering my many questions via email and his
advice on the topic.
I would also like to thank my partner Graham, my two daughters Milla and Hannah, and
Helen Peden for supporting me during the time of this research.

v
TABLE OF CONTENT
ABSTRACT ............................................................................................................................... i
LIMITATIONS OF USE .......................................................................................................... ii
CANDIDATES CERTIFICATIONS ....................................................................................... iii
ACKNOWLEDGEMENTS ..................................................................................................... iv
TABLE OF CONTENT ............................................................................................................ v
LIST OF FIGURES ................................................................................................................. vii
LIST OF TABLES ................................................................................................................. viii
ABBREVIATIONS .................................................................................................................. ix
CHAPTER 1 - INTRODUCTION ............................................................................................ 1
1.1. Background ................................................................................................................. 1
1.2. The Problem ............................................................................................................... 1
1.3. Research Objectives ................................................................................................... 2
CHAPTER 2 - METHODOLOGY ........................................................................................... 3
CHAPTER 3 - LITERATURE REVIEW ................................................................................. 4
3.1. History of Constructed Wetlands ............................................................................... 4
3.2. Tidal Flow Constructed Wetlands .............................................................................. 6
3.2.1. ReCip Tidal Flow System ................................................................................... 7
3.2.2. Fill and Drain Tidal Flow Wetlands .................................................................. 10
3.3. Contaminants and Contaminant Removal in a TFAW ............................................. 10
3.3.1. Nitrogen ............................................................................................................. 10
3.3.2. Phosphorus ........................................................................................................ 15
3.3.3. Suspended Solids............................................................................................... 15
3.3.4. Biological Oxygen Demand .............................................................................. 16
3.4. Clogging ................................................................................................................... 16
3.5. Aggregate.................................................................................................................. 17
3.6. Summary ................................................................................................................... 17
CHAPTER 4 - CHARACTERIZATION, ANALYSIS AND COMPARISON OF
CONSTRUCTED TREATMENT WETLANDS.................................................................... 19
4.1. Types of passive Constructed Wetlands ................................................................... 19

vi
4.1.1. Free Water Surface Wetlands ............................................................................ 19
4.1.2. Horizontal Sub-surface Flow Wetlands ............................................................ 21
4.1.3. Vertical Sub-surface Flow Wetlands................................................................. 22
4.1.1. Hybrid Constructed Wetlands ........................................................................... 23
4.1.2. The French System Vertical Flow Constructed Wetland .................................. 23
4.2. Aerated Artificial Wetlands ...................................................................................... 24
4.3. Comparison of Alternative Treatment Systems to Tidal Flow CWs ........................ 25
4.3.1. Comparison of Treatment Wetlands ................................................................. 25
4.3.2. Comparison to Conventional Wastewater Treatment Systems ......................... 27
4.4. Summary ................................................................................................................... 29
CHAPTER 5 - COMPARISON OF A TIDAL FLOW WETLAND AND A PASSIVE (VF)
WETLAND WHEN APPLIED TO WASTEWATER TREATMENT FOR A SMALL
RESIDENTIAL DEVELOPMENT ........................................................................................ 31
5.1. Introduction .............................................................................................................. 31
5.2. Wastewater Flow and Strength ................................................................................. 31
5.3. Treatment Target ...................................................................................................... 32
5.4. ReCip Tidal Flow Wetland ....................................................................................... 33
5.4.1. Preliminary Sizing ............................................................................................. 33
5.4.2. Energy Use ........................................................................................................ 37
5.5. Vertical Subsurface Flow Treatment Wetland ......................................................... 40
5.5.1. Choosing an Appropriate Treatment Wetland .................................................. 40
5.5.2. Preliminary Sizing of the Wetland Area ........................................................... 40
5.5.3. Energy Use ........................................................................................................ 43
CHAPTER 6 - RESULTS ....................................................................................................... 44
CHAPTER 7 - CONCLUSION .............................................................................................. 46
APPENDIX A - PROJECT SPECIFICATIONS .................................................................... 47
REFERENCES ........................................................................................................................ 48

vii
LIST OF FIGURES
Figure 3.1: Types of Constructed Wetlands .............................................................................. 6
Figure 3.2: Living Machines® Process Schematic ................................................................... 8
Figure 3.3: Recip Process Schematic ........................................................................................ 9
Figure 3.4: Simplified Nitrogen Removal Stages ................................................................... 12
Figure 3.5: Nitrogen Removal in a Tidal Flow Wetland Cell ................................................. 14
Figure 4.1: Schematic FWS Constructed Wetland................................................................. 20
Figure 4.2: Schematic HSSF Constructed Wetland ................................................................ 21
Figure 4.3: Schematic VF Constructed Wetland ..................................................................... 22
Figure 4.4: French System Treatment Wetland Layout .......................................................... 24
Figure 4.5: System Schematics ............................................................................................... 28
Figure 4.6: Summary of Process Energy Requirements ......................................................... 29
Figure 4.7: Size vs. Energy Consumption On-Site Treatment Systems.................................. 30
Figure 5.1: Flow Diagram Tidal Flow Wetland ...................................................................... 33
Figure 5.2: Layout of Tidal Flow Wetland ............................................................................. 37
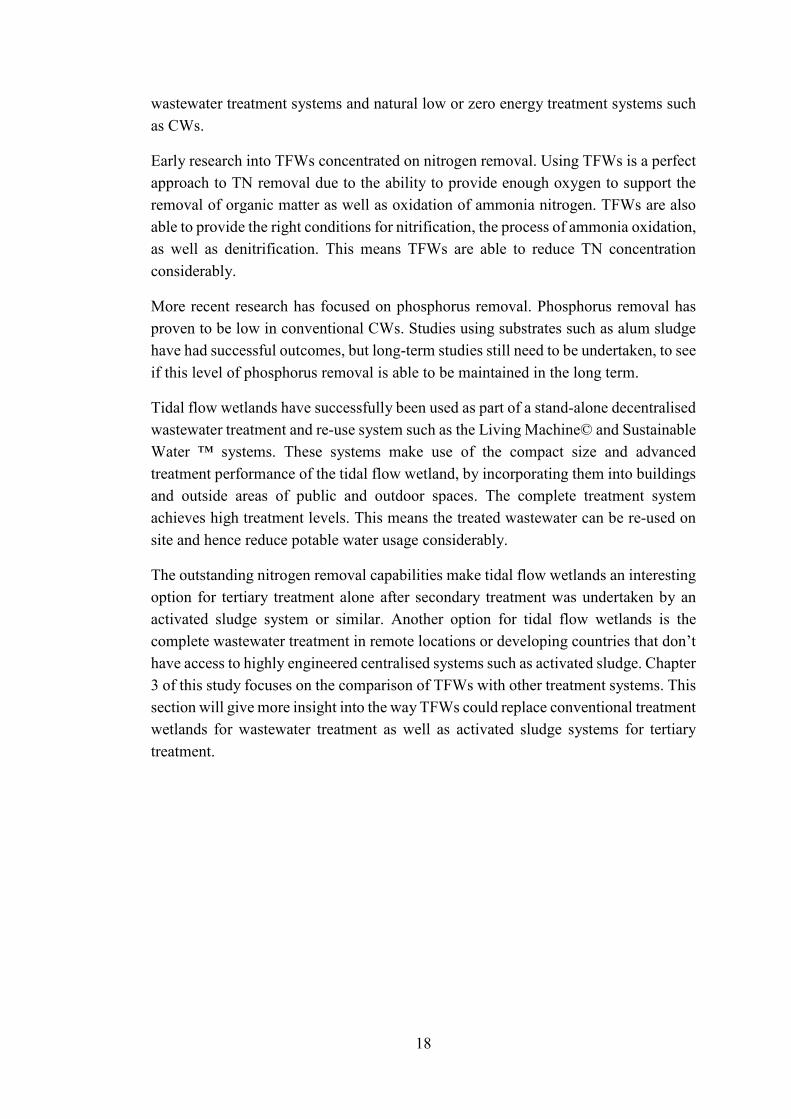
Figure 5.3: Layout Staged French System VF Wetland Followed by FWS Wetland ............. 43

viii
LIST OF TABLES
Table 1: Nitrogen Transformations in Wastewater Treatment/Constructed Wetlands ........... 11
Table 2: Design and Operational Details on the 15 Treatment Systems at Langenreichenbach,
Germany .................................................................................................................................. 26
Table 3: Comparison of Different Types of CWs ................................................................... 27
Table 4: Typical Composition of Municipal Wastewater and Percent Removal at Various
Levels of Treatment ................................................................................................................ 32

ix
ABBREVIATIONS
TFW - Tidal Flow Wetland
CW - Constructed Wetland
HSSF - Horizontal Sub-Surface Flow
VF - Vertical Flow
FWS - Free Water Surface
N - Nitrogen
P - Phosphorus
TKN - Total Kjeldahl Nitrogen
TSS - Total Suspended Solids
BOD - Biological Oxygen Demand
EP - Equivalent Person

1
CHAPTER 1 - INTRODUCTION
1.1. Background
Over the last century wastewater treatment has evolved immensely. This development
is divided into two different ways of wastewater treatment.
On one side are the highly engineered wastewater treatment systems like activated
sludge and trickling filter systems that can achieve high treatment standards on a small
area. To be able to achieve advanced treatment levels these systems use large amounts
of energy.
On the other side are natural treatment systems like constructed wetlands (CWs).
These systems use much larger areas and usually are not designed to achieve advanced
treatment levels, but they use very little energy if at all.
Because of the low energy demand, the use of CWs as a treatment option has become
increasingly popular around the world over the last 25 years. Research into improving
the treatment performance of such systems has increased. This has led to the
development of wastewater treatment systems that can close the gap between highly
engineered energy intensive systems and natural low maintenance, low energy use
CWs.
Tidal flow wetlands (TFWs) are one of those systems that are able to offer a
compromise between energy use, treatment efficiency and area requirements. This is
achieved by introducing additional oxygen to the wetland cell. In a tidal flow wetland
this oxygen is added by introducing a tide to the wetland cell.
1.2. The Problem
Much research has been undertaken on the ability and limitations of TFWs over the
last 15 years. These systems have been found to be a very promising approach for
future applications so far. Total nitrogen (TN) removal in particular is a strength of
TFWs. Most of the research so far undertaken has been done in a laboratory setting.
Pilot studies and the detailed research into the most suitable applications of TFWs is
still very limited.
2
1.3. Research Objectives
The purpose of this research was to identify and summarise the characteristics,
advantages, and disadvantages of TFWs. The expected outcome from this study was
a more thorough understanding of how TFWs work and which factors influence the
design of TFWs in different ways. With this research it was aimed to determine
possible future applications for this type of wastewater treatment.
The research methodology was divided into three main sections:
a) Review relevant literature relating to TFWs and their performance
b) Compare TFWs to other wastewater treatment options in direct competition to
TFWs
c) Set up a wastewater treatment situation to be able to directly compare TFWs
and conventional CWs when applied to this specific situation
d) Evaluate findings
More details on the research methodology can be found in chapter 2.

3
CHAPTER 2 - METHODOLOGY
The type of research undertaken in this study was a thorough review and evaluation
of the current and past knowledge of TFWs as well as a basic evaluation of other
conventional CWs that are in direct competition to TFWs. From the critical literature
review and evaluation a comparison of TFWs and conventional CWs was possible.
From this a direct comparison of a TFW and a conventional (passive) treatment
wetland when applied to a small residential development was developed. This
comparison together with the previous review, evaluation and comparison highlighted
the possibilities, advantages and weaknesses of TFWs.
The comparison of the TFW with the conventional treatment wetland was based on a
hypothetical wastewater situation. This means the comparison was undertaken in
theory only and wetland characteristics and designs were based on calculations and
assumptions. The most suitable type of TFW and setup of conventional CW was based
on available literature and models. The chosen wetlands for this application are
believed to be the best and most accurate options for this scenario.
The hypothetical wastewater situation used for this comparison was based on the
climate of Southeast Queensland and a 100 EP residential development. Design
criteria were based on literature where possible and where necessary on experience
and knowledge of engineers that work in this field.

4
CHAPTER 3 - LITERATURE REVIEW
3.1. History of Constructed Wetlands
First developments and research into tidal flow wetlands started in the 1990s. The
reason was that wastewater treatment using conventional constructed wetlands had
limitations and researchers were trying to find a way to treat wastewater naturally to a
higher treatment level while keeping the area footprint small and energy input low.
Surprisingly back in 1901 a US patent was filed that shows evidence of an engineered
treatment wetland design using a similar approach to today’s tidal flow wetlands
(Monjeau 1901). Cleophas Monjeau’s patent (1901) for a purifying water system hints
that already over 100 years ago some engineers understood the basics of how tidal
flow wetlands work (Austin 2003). It is not known if Monjeau’s system was ever built.
The main problem back then was the BOD load in wastewater. Trying to control the
smell of the rivers was a priority. These types of systems had a limited BOD loading
capacity, while trickling filters on the other hand had a much higher BOD treatment
capacity and hence prevailed. Monjeau’s design and similar approaches were soon
forgotten.
In 1953, Dr Seidel of Max Planck Institute in Plon, Germany, first reported about the
possibility of lessening the over-fertilisation, pollution, and silting up of inland waters
through appropriate plants (Brix 1994a). Seidel conducted experiments on the
possibility of wastewater treatment with wetland plants and her work is regarded as
the origin of modern treatment wetlands (Hoffmann et al. 2011). Her findings,
developments and first implementations form the 1st generation of treatment wetlands.
Designs of these wetlands were based on experience, mainly, design standards were
not yet developed. Further research was fuelled by successes and failures and 2nd
generation wetlands developed out of the need to find a design standard for treatment
wetlands. These first design criteria were based on the BOD loading per hectare of
wetland. 2nd generation treatment wetlands were soon followed by a more detailed 3rd
generation approach. Developers found that basing the design on BOD load alone was
not sufficient. Different models emerged for the design of treatment wetlands that tried
to fit input and output data to a model equation. The wetland itself is treated as a ‘black
box’ with exact internal processes still mostly unknown. These 3rd generation design
models are commonly used by wetland design engineers today. (Austin 2003)
These 1st, 2nd and 3rd generation approaches all have one thing in common - they are
passive designs. This means that energy input is minimal if at all and the treatment of
the wastewater relies on sunlight and atmospheric diffusion alone. (Austin 2003)

5
Since the 1990’s the demand for constructed wetlands increased dramatically due to
the rising cost of fossil fuels and an increasing concern about environmental protection
and climate change (Lee, Fletcher & Sun 2009). Another reason for the increase in
demand is the suitability of CWs to areas without a public sewage system and
undeveloped countries, because they are able to be built out of locally available
materials.
However, studies have shown that conventional types of CWs, although performing
well for BOD, TSS and bacterial pollution, have limited capacity for nutrient removal
especially nitrogen. Therefore these technologies alone have problems meeting strict
discharge or reuse standards while still being considered an economical option.
Conventional CWs face two problems that prevent total nitrogen removal. Nitrogen
removal is a two-step process, nitrification followed by denitrification. The first
problem of conventional CWs is the oxygen supply associated with the first step,
nitrification. Nitrification can only take place if sufficient oxygen is available in the
wastewater. Due to the oxygen demand of the wastewater (BOD) and the nature of
most treatment wetlands (see section 3.3.1) oxygen supply is usually too low to
support the nitrification process. The second problem conventional TWs face is being
able to provide the correct conditions in the right order to support nitrification followed
by denitrification. Nitrification requires aerobic conditions while denitrification can
only take place if conditions are anoxic. This means total nitrogen (TN) removal
cannot be achieved in a single-stage CW due to its inability to simultaneously provide
both nitrification (aerobic) and denitrification (anaerobic) conditions (Zhi et al. 2015).
Because of the need for more effective removal of ammonia and TN during the 1990s
vertical and horizontal flow CWs were combined to complement each other (hybrid
and staged systems) to achieve higher treatment efficiency. However, the extra capital
investment and complex operating conditions required by these hybrid systems create
economic and technical barriers for increasing field application at a large scale (Zhi et
al. 2015).
The problem of adequate removal of TN was the major cause of the emergence of a
new generation of treatment wetlands in the late 1990’s. These 4th generation treatment
wetlands integrate hydraulic or aeration machinery into constructed wetlands to
increase the supply of DO and therefore their treatment capabilities. 4th generation
treatment wetlands, such as tidal flow wetlands and aerated wetlands, are a very
promising approach for the future.
Figure 3.1 gives an overview of all different types of constructed treatment wetlands.

6
FIGURE 3.1: TYPES OF CONSTRUCTED WETLANDS
Note: CW, constructed wetland; FWS, free water surface; HSSF, horizontal sub-surface flow;
and VF, vertical flow.
3.2. Tidal Flow Constructed Wetlands
Tidal flow artificial wetlands (TFAW) are a type of 4th generation (or intensified)
wetland systems (see Figure 3.1) for biological wastewater treatment that are designed
to copy the processes of natural tidal wetlands (http://www.livingmachines.com
2015). A TFAW operates by continually filling and draining the wetland cell with
wastewater. This cycle of filling and draining introduces additional oxygen to the
wetland cell. With this engineered CW vastly improved aeration and hence
outstanding total nitrogen removal compared to traditional wetland systems is
possible. (Behrends 1999)
Early research of tidal flow wetlands was done in the late 1990s (Sun et al. 1999) and
TFAWs were defined by having a fill and drain cycle of less than a day. A tidal flow
Co
nst
ruct
ed
We
tla
nd
s (C
Ws)
Traditional CWs
Free Water Surface
(FWS) CWs
Subsurface Flow (SSF)
CWs
Horizontal Subsurface
Flow CWs (HSSF CWs)
Vertical Flow CWs (VF
CWs)
Hybrid and Staged
CWs
VF-HSSF CWs
HSSF-VF CWs
FWS-HSSF CWs
Multi-stage CWs
VF-VF-HSSF CWs
VF-HSSF-FWS CWs
VF-HSSF-VF CWs
Engineered CWs
Aerated CWs
Baffled Flow CWs
Tidal Flow CWs
Etc.

7
wetland was created with different stages of wetland cells which were operated in
series. The water that filled the first stage was drained to the next stage and so on. 5
stages were common at this early stage of research (Sun et al. 2006; Zhao, Sun & Allen
2004).
Around the same time Leslie L. Behrends was doing research for the Tennessee Valley
Authority in the USA and filed a first patent for “Reciprocating Subsurface-Flow
Constructed Wetlands for Improving Wastewater Treatment” (Behrends 1999). His
type of tidal flow wetland differed in that it consisted of wetland cell pairs. Instead of
filling and draining wastewater through the different stages of the wetland system one
wetland cell was filled and the water reciprocated between the two cells that together
formed a cell pair. This type of tidal flow system is known as a ReCip tidal flow
system.
3.2.1. ReCip Tidal Flow System
As mentioned above L. Behrends’ research and his patents were the basis for a specific
type of tidal flow wetland which was later used by Living Machines® and Sustainable
Water™ for their decentralized wastewater treatment and re-use systems that are still
being designed and implemented today.
This type of TFAW consists of at least two adjacent cells, however, in most designs
the systems consist of more than two cells and these are usually designed to work
together in series in sets of two (pairs). Within these cells the system utilizes plants,
robust microbial fixed-film ecosystems and passive aeration (reciprocating flow) to
treat the wastewater (Behrends & Lohan 2012). For a complete wastewater treatment
system the TFAW wetland is combined with a pre-treatment and a final polishing unit
to make the treated water fit for re-use. A process schematic of a complete treatment
system by Living Machine® is shown in Figure 3.2.

8
FIGURE 3.2: LIVING MACHINES® PROCESS SCHEMATIC
(HTTP://WWW.LIVINGMACHINES.COM 2015)
Treatment advantages compared to conventional CWs occur because of the ability of
the system to provide anaerobic, anoxic and aerobic environments within and between
the cells via reciprocation. Water drained from one cell is stored in the contiguous cell,
and vice-versa. This cycle of draining and filling of the wetland cells means that tidal
flow wetlands provide perfect conditions for nitrification and denitrification which is
essential for the process of total nitrogen removal. (http://sustainablewater.com/recip-
reciprocating-wetlands/ 2015)
To date this type of TFAW has been used to treat and reuse wastewater at schools,
universities, small communities, public buildings, large offices, campgrounds, resorts,
military bases, industrial parks, airports and animal feeding operations (Behrends &
Lohan 2012). They can be designed to be integrated into landscaping or built into a
building or greenhouse (http://www.livingmachines.com 2015). This means they can
be used where space is limited.
Like most other wastewater treatment systems ReCip TFAWs consist of different
stages of water treatment. Firstly is primary treatment which is done in primary
treatment tanks for coarse-solids and floating material removal. A flow equalisation

9
tank can either be separate or integrated with the primary treatment tank. The flow
equalisation tank buffers periods of high and low flow.
Primary treatment is followed by the actual tidal wetland treatment cells. These can
provide treatment to tertiary treatment standards. The tidal flow wetland cells are
gravel-filled modules with underdrains. Each pair is connected via pipes and a
pumping system. The tidal flow wetland cells can be set up in stages which means the
first pair of treatment cells is followed by a second and so on, depending on wastewater
needs. Common are two stages of wetland cells with each stage filled with different
type of aggregate, the second stage usually filled with a smaller type aggregate to
provide faster treatment.
The treatment wetland cells are followed by polishing modules that contain filters and
disinfection components (UV and/or chlorine) for removal of pathogens.
The last step of the treatment system is the reuse tank and associated pumping
components. Plants are added to the system to increase the removal of residual
nutrients.
The whole system is fully automated and uses a remotely sensed control panel which
operates all mechanical components. A summary of all common components can be
seen in Figure 3.3 below.
FIGURE 3.3: RECIP PROCESS SCHEMATIC (HTTP://SUSTAINABLEWATER.COM/RECIP-
RECIPROCATING-WETLANDS/ 2015)

10
3.2.2. Fill and Drain Tidal Flow Wetlands
Research on the original fill and drain tidal flow wetland continued. Various different
operating strategies were investigated to improve treatment processes and to prevent
clogging of the wetland cells. This included using different types of wetland
aggregates (Austin 2006; Liu et al. 2014; Vohla et al. 2011; Zhao et al. 2011; Zhao,
Sun & Allen 2004; Zhao, Zhao & Babatunde 2009). Trials of varying the number of
stages of wetlands cells and the introduction of wetland cell resting periods to prevent
clogging of the wetland media were carried out. In 2006 (Austin) investigated the CEC
capacity of different wetland aggregates and the influence it would have on treatment
performance especially nitrogen. He found that the CEC capacity of the wetland
aggregate affected treatment performance significantly. A high CEC capacity
achieved a higher treatment level due to the high ammonium-ion adsorption capacity
of high CEC aggregates (more in section 3.5). A study by Liu (2014) confirmed this
research.
In 2009 and 2011 (Zhao et al.) carried out research with alum sludge-based treatment
wetlands. His results were promising, as he achieved good treatment performances for
BOD, TSS and nitrogen removal as well as phosphorus. He was able to achieve
comparable treatment results to other previous studies on a smaller area. The most
important part of his study was the high removal rate he achieved for phosphorus.
While these are very promising results, more long term studies are required to
determine the service lifetime of this type substrate. The removal of phosphorus by
adsorption has a finite capacity and the performance of the system is not expected to
be able to be maintained over a long period of time (more in section 3.3.2).
3.3. Contaminants and Contaminant Removal in a TFAW
TFAW are usually designed to receive primary treated wastewater. During the primary
treatment stage solids settle out of the wastewater and begin to degrade. The remaining
(primary treated) wastewater is pumped to the tidal flow wetland cells.
3.3.1. Nitrogen
Nitrogen enters wastewater through various pathways. The most abundant contributor
of nitrogen in typical municipal wastewater is urea (urine), others are food processing
waste, chemical cleaning agents etc. High levels of nitrogen in natural waterways can

11
result in toxic conditions for wildlife, dissolved oxygen (DO) depletion and excessive
algae growth, all harmful to local plant, animal and human populations. This is why
the ability to remove TN during the wastewater treatment process is important.
The removal of nitrogen from wastewater is a complex process. It includes various
forms of nitrogen, all important, especially in a treatment wetland as each form is
necessary to keep the ecosystem balanced. For wastewater treatment, especially
wastewater treatment using constructed wetlands, the most important forms of
inorganic nitrogen are ammonium (NH4+), nitrite (NO2
-) and nitrate (NO3-) and
gaseous forms such as dinitrogen (N2), nitrous oxide (N2O), nitric oxide (NO2 and
N2O4) and ammonia (NH3). Constant chemical processes transform the various forms
of nitrogen from organic to inorganic and back from inorganic to organic. These
constant transformations ensure the ecosystem functions successfully. (Vymazal
2007)
The removal of nitrogen from wastewater can be achieved by various processes. These
include ammonia volatilisation, ammonification, plant and microbial uptake,
adsorption, nitrification, denitrification, and anaerobic ammonia oxidation
(ANAMMOX), among others. Table 1 summarises these processes.
TABLE 1: NITROGEN TRANSFORMATIONS IN WASTEWATER TREATMENT/CONSTRUCTED
WETLANDS (VYMAZAL 2007)

12
Most of these processes only convert nitrogen to its various forms (as shown in Table
1). Only a few of those processes ultimately remove total nitrogen. These include
volatilization, denitrification, ANAMMOX, organic nitrogen burial, ammonia
adsorption and plant/microbial uptake (Vymazal 2007). As this thesis concentrates on
tidal flow wetlands which are a special type of vertical flow subsurface wetlands, the
removal of nitrogen via volitalisation and organic nitrogen burial is irrelevant
(Vymazal 2007). Biological nitrification coupled with denitrification is widely
recognized as being one of the main factors contributing to total nitrogen removal in
TFWs (Liu et al. 2014). A simplified nitrogen process diagram for a tidal flow wetland
is shown in Figure 3.4.
FIGURE 3.4: SIMPLIFIED NITROGEN REMOVAL STAGES
Nitrification reduces the concentration of ammonia nitrogen by converting ammonia
nitrogen to oxidized nitrogen (nitrate). This is a two-step process. Both steps can
proceed only in the presence of oxygen (aerobic conditions), therefore the actual
nitrification rate can be controlled by the flux of dissolved oxygen into the system

13
(Kadlec & Wallace 2008). The chemical equations of the nitrification process are
shown below.
EQUATION 1: OXIDATION OF AMMONIA TO NITRITE (VYMAZAL 2007)
���� + 1.5� ⇒ �� + 2�� + ������������(1)
EQUATION 2: OXIDATION OF NITRITE TO NITRATE (VYMAZAL 2007)
�� + 0.5� ⇒ �� ��������(2)
Nitrification provides nitrate for the following denitrification process (which
ultimately removes nitrogen from the wastewater). This means the available nitrate
from the nitrification process depends on the available oxygen in the systems. Hence
nitrification is the limiting process for this nitrogen removal process (nitrification
coupled with denitrification) and the availability of oxygen needs to be ensured to
achieve high nitrogen removal rates (Vymazal 2007). In most traditional types of
wetlands this rate of oxygen supply needed to achieve a high nitrification rate cannot
be accomplished.
Denitrification is the process in which nitrate is converted into dinitrogen (nitrogen
gas). Denitrification is carried out by facultative heterotrophs, organisms that can
either use oxygen or nitrate as terminal electron acceptors. The chemical equation of
the denitrification process is shown below.
EQUATION 3: CHEMICAL EQUATION DENITRIFICATION (VYMAZAL 2007)
6(���0) + 2�� ⇒ 6�� + 2�� + 6��0�����������(3)
14
For denitrification to take place in a wetland the oxygen content in the water has to
very low (anoxic conditions). Only then do the facultative heterotroph bacteria choose
nitrate over the oxygen as their electron acceptor. The biomass or other organic
residues present in the wastewater are used as the carbon or electron source. (Kadlec
& Wallace 2008).
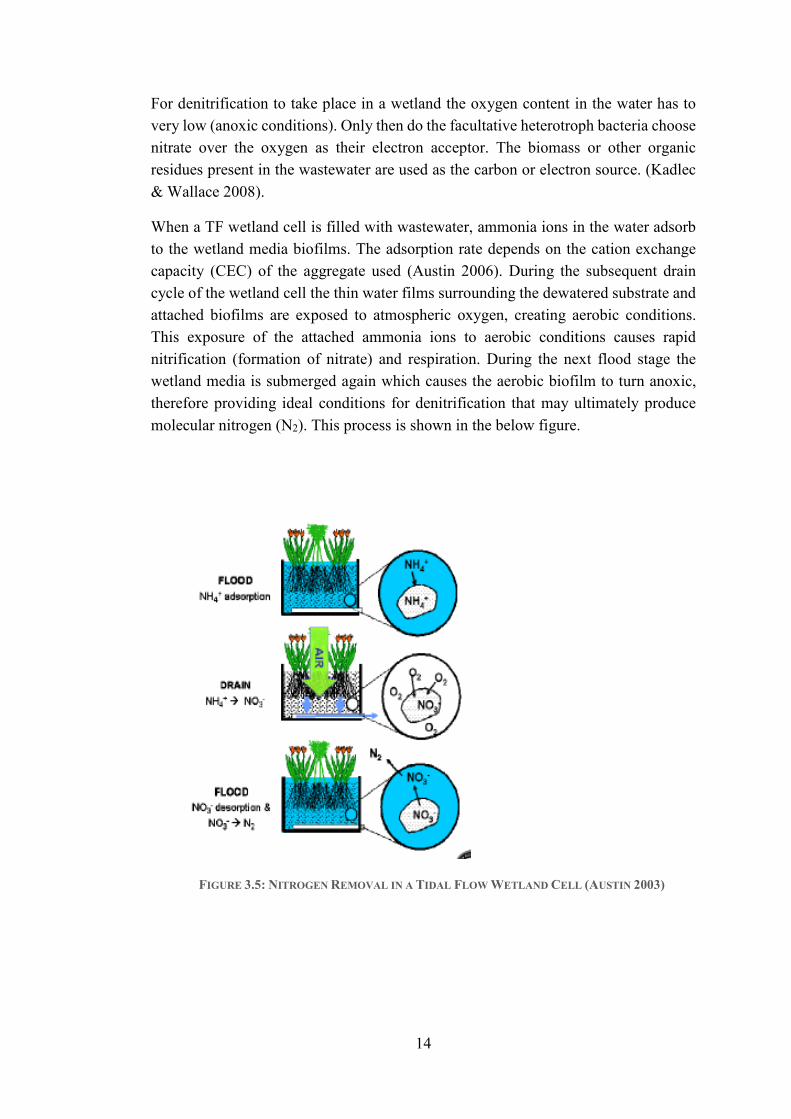
When a TF wetland cell is filled with wastewater, ammonia ions in the water adsorb
to the wetland media biofilms. The adsorption rate depends on the cation exchange
capacity (CEC) of the aggregate used (Austin 2006). During the subsequent drain
cycle of the wetland cell the thin water films surrounding the dewatered substrate and
attached biofilms are exposed to atmospheric oxygen, creating aerobic conditions.
This exposure of the attached ammonia ions to aerobic conditions causes rapid
nitrification (formation of nitrate) and respiration. During the next flood stage the
wetland media is submerged again which causes the aerobic biofilm to turn anoxic,
therefore providing ideal conditions for denitrification that may ultimately produce
molecular nitrogen (N2). This process is shown in the below figure.
FIGURE 3.5: NITROGEN REMOVAL IN A TIDAL FLOW WETLAND CELL (AUSTIN 2003)

15
This process of filling and draining will be repeated depending on wastewater needs
(target treatment level, influent wastewater concentration) usually as often as six to
twelve times a day. (Austin, Lohan & Verson 2003).
3.3.2. Phosphorus
Phosphorus is an essential nutrient for humans, animals and plants and therefore forms
part of a human diet. Similar to nitrogen, it enters our wastewater from various sources.
The main sources of phosphorus in municipal wastewater are human excreta and
chemical cleaning products. Water bodies are naturally low in phosphorus, but human
activities are causing larger amounts of phosphorus to enter freshwater systems.
Unnaturally large amounts of phosphorus create excessive algae growth which
eventually causes the depletion of DO in the water. This is why phosphorus removal
to a level that is acceptable for natural wastewaters is important.
The removal of phosphorus in CWs usually involves adsorption of filter media and
the precipitation of bound metal salt like Fe, Al and Ca. Many studies have been
undertaken to investigate different types of wetland substrates and their influence on
phosphorus removal. Traditional wetland substrates like gravel and crushed rock
provide limited capacity for sorption and precipitation, however some studies have
demonstrated successful removal using different types of substrates like Alum Sludge
and LECA (light weigh clay aggregates) (Zhao et al. 2011). It is important to note,
however that these processes are saturable. This means even though these studies have
demonstrated successful phosphorus removal initially, high removal rates are often
not sustained in the long term. (Vymazal 2007) Further research is needed to
investigate high phosphorus removal rates for the long term.
3.3.3. Suspended Solids
Suspended Solids (SS) are removed from the wastewater by sedimentation and
filtration when the water flows through the wetland cell. SSs are believed to be a main
contributor to wetland cell clogging. Sufficient pre-treatment, allowing the removal of
larger amounts of SS can prevent this. Studies on different types of wetland aggregates
have been undertaken to see the affects these can have on wetland cell clogging due
to SSs (Zhao, Sun & Allen 2004). These have found that anti-sized aggregates could
have a positive effect on SS removal in tidal flow wetlands (Zhao, Sun & Allen 2004).

16
3.3.4. Biological Oxygen Demand
Biological Oxygen Demand (BOD) is a widely used parameter to describe the organic
pollution in (waste-) water. BOD describes how much dissolved oxygen (DO) is
needed by microorganisms to oxidise organic matter. This makes it a tool that
measures organic matter pollution in wastewater. BOD does not include the dissolved
oxygen needed for the nitrification process (see section 3.3.1).
Because DO is depleted when wastewater is high in organic matter insufficient
treatment and discharge of wastewater can quickly lead to oxygen depletion in water
bodies. High BOD concentrations during wastewater treatment also leads to oxygen
competition which results in very low nitrification rates.
Studies have shown that TFWs, as opposed to conventional CWs, can transfer enough
oxygen from the atmosphere to the interface of the biofilm during the drained phase
to support oxidation of organic matter as well as nitrification even for high strength
wastewater (Wu et al. 2011). While in theory high organic loadings are able to be
oxidised in a TFW, some experiments have shown major problems with excessive
growth of biofilm on the wetland aggregate which eventually leads to clogging of the
wetland cell (see section 3.4). Therefore, even though in theory, a tidal flow wetland
can supply enough oxygen to support high BOD and ammonia loadings, BOD
loadings have to be limited to prevent clogging.
3.4. Clogging
The term “clogging” is used in subsurface flow CW’s and describes the blockage of
the wetland aggregate that can occur during operation of the wetland cell. Clogging is
a major operational issue that compromises the treatment performance and therefore
is to be avoided by any means. Issues that arise from wetland cell clogging are:
decreased treatment performance, hydraulic malfunction (ponding of wastewater) and
bypassing of untreated wastewater. Clogging can shorten the lifetime of the system
dramatically. (Knowles et al. 2011)
Clogging can be caused by different processes. It is usually caused by a combination
of solids entrapment and biofilm growth as well as other minor factors such as
vegetation growth and chemical effects (Knowles et al. 2011). These are all factors
that can be influenced by design and operational factors, so there is a need to develop

17
design strategies for different types of wetlands to minimise or eliminate wetland
clogging altogether.
Such design strategies should include maximum influent distribution, intermittent
dosing, wetland cell resting periods, and sufficient pre-treatment (especially for TSS)
(Knowles et al. 2011).
3.5. Aggregate
Conventional CW aggregates usually consist of locally available material such as
crushed granite and basalt. Aggregate can often be the most expensive part of a
subsurface CW. Studies have been undertaken (Austin 2006) to research the treatment
ability of different types of aggregate to determine if treatment ability of better
performing wetland aggregates are worth the additional capital cost. Transportation
costs can add a significant amount to the total cost of aggregate especially in remote
locations with limited choices of locally available aggregates.
It was found that the CEC capacity of an aggregate can have a major influence on the
treatment performance of a wetland cell especially for nitrogen removal (Austin 2006).
Using an aggregate with a high CEC capacity means that wetland cells can achieve
the same treatment performance on a smaller volume. This reduces the amount of
aggregate needed and therefore lowers costs.
3.6. Summary
Over the last century, wastewater treatment has developed from basic removal of BOD
and TSS to advanced treatment technologies, such as activated sludge systems. These
systems can achieve high treatment standards for BOD, TSS as well as nutrients,
pathogens and heavy metals. However, these advances come with high energy use.
Rising costs of fossil fuels and concerns about sustainability and environmental
protection have led to intense research into low energy natural treatment systems such
as CWs. It was soon clear that traditional (passive) CWs struggle to achieve those
required high treatment standards while still being economically feasible. The review
of current and past research shows that engineered CWs, such as TFWs, are a
successful approach in closing the gap between highly engineered, high energy
18
wastewater treatment systems and natural low or zero energy treatment systems such
as CWs.
Early research into TFWs concentrated on nitrogen removal. Using TFWs is a perfect
approach to TN removal due to the ability to provide enough oxygen to support the
removal of organic matter as well as oxidation of ammonia nitrogen. TFWs are also
able to provide the right conditions for nitrification, the process of ammonia oxidation,
as well as denitrification. This means TFWs are able to reduce TN concentration
considerably.
More recent research has focused on phosphorus removal. Phosphorus removal has
proven to be low in conventional CWs. Studies using substrates such as alum sludge
have had successful outcomes, but long-term studies still need to be undertaken, to see
if this level of phosphorus removal is able to be maintained in the long term.
Tidal flow wetlands have successfully been used as part of a stand-alone decentralised
wastewater treatment and re-use system such as the Living Machine© and Sustainable
Water ™ systems. These systems make use of the compact size and advanced
treatment performance of the tidal flow wetland, by incorporating them into buildings
and outside areas of public and outdoor spaces. The complete treatment system
achieves high treatment levels. This means the treated wastewater can be re-used on
site and hence reduce potable water usage considerably.
The outstanding nitrogen removal capabilities make tidal flow wetlands an interesting
option for tertiary treatment alone after secondary treatment was undertaken by an
activated sludge system or similar. Another option for tidal flow wetlands is the
complete wastewater treatment in remote locations or developing countries that don’t
have access to highly engineered centralised systems such as activated sludge. Chapter
3 of this study focuses on the comparison of TFWs with other treatment systems. This
section will give more insight into the way TFWs could replace conventional treatment
wetlands for wastewater treatment as well as activated sludge systems for tertiary
treatment.

19
CHAPTER 4 - CHARACTERIZATION, ANALYSIS AND COMPARISON OF CONSTRUCTED
TREATMENT WETLANDS
4.1. Types of passive Constructed Wetlands
Conventional (passive) constructed wetlands (CW) for wastewater treatment can be
divided into three main types - free water surface (FWS) wetlands, horizontal sub-
surface flow (HSSF) wetlands and vertical sub-surface flow (VF) wetlands. Each of
these has variations in layout, soil media used and flow patterns. Different types of
passive wetlands can be combined to create hybrid or staged systems that utilise the
combined advantages of individual systems.
4.1.1. Free Water Surface Wetlands
Free water surface (FWS) CWs generally consist of large shallow areas of open water
(ponds) lined with an impermeable barrier to prevent seepage and control flow.
Submerged media like rocks, gravel and soil supports the roots of the macrophyte
vegetation which can consist of floating, submerged and/or emergent type plants. The
wastewater treatment processes occurring are sedimentation, filtration, oxidation,
reduction, adsorption and precipitation. A typical FWS wetland layout is shown
below:

20
FIGURE 4.1: SCHEMATIC FWS CONSTRUCTED WETLAND (TILLEY ET AL. 2014)
FWS wetlands are constructed to mimic natural occurring wetlands and hence attract
a wide variety of wildlife such as insects, fish, mammals, amphibians, reptiles and
molluscs (Kadlec & Wallace 2008).
FWS wetlands are efficient in removing BOD by microbial degradation. The removal
of SSs is very efficient. Due to the slow flow, the open water surface and the vegetation
SSs can either be removed by settling or by filtration through the vegetation. Nitrogen
removal in FWS wetlands can be problematic. As mentioned in section 3.3.1. Nitrogen
removal is a two-step process (nitrification followed by denitrification) and FWS
wetlands are not able to provide ideal conditions for the complete process. FWS
wetlands are low in oxygen and cannot provide enough oxygen for the nitrification
process. They do, however, provide suitable conditions for denitrification. Phosphorus
removal in FWS is low. The wastewater in FWS wetlands has limited contact with the
soil which means the conditions needed for phosphorus removal by adsorption or
precipitation are not present. Some phosphorus can be taken up by plants but this is
only a temporary storage unless these plants are harvested before decaying and
reintroducing the phosphorus back to the water. (Vymazal 2010)

21
4.1.2. Horizontal Sub-surface Flow Wetlands
HSSF CWs consist of filter media such as a gravel or soil bed planted with emergent
wetland vegetation, an impermeable liner to prevent infiltrating and inlet and outlet
piping that keeps the water level under control. The water level is kept below the
surface of the gravel/soil media at all times. The pre-treated wastewater flows
horizontally from the water inlet through the wetland media to the outlet pipe. There
is no exposed open water surface, hence the water has to flow through the gravel in
and around the roots. A typical schematic is shown below.
FIGURE 4.2: SCHEMATIC HSSF CONSTRUCTED WETLAND (TILLEY ET AL. 2014)
When the wastewater flows through the wetland aggregate physical, chemical and
biological processes take place. Filtration and sedimentation efficiently remove SSs
while organic compounds are removed by microbial degradation. A HSSF wetland
predominantly provides anaerobic/anoxic conditions where the major removal
mechanisms for nitrogen again is denitrification. This means the removal of ammonia
nitrogen is very limited due to the lack of oxygen throughout the wetland cell.
Phosphorus removal in HSSF wetlands is low unless a suitable wetland media is used.
(Vymazal 2010)

22
4.1.3. Vertical Sub-surface Flow Wetlands
VF CWs can be used for secondary or tertiary treatment of black- or greywater. Wastewater usually undergoes primary settling treatment before entering the system. There are several variations of VF wetlands. One of the main ones uses intermittent downflow and is often used in Europe. The surface of the VF CW is loaded in pulses at the top, the water then flows vertically through the filter media and the treated water is collected at the bottom by drainage pipes. This process allows oxygen to diffuse through the porous filter media during the unsaturated stage. Another type of VFCW uses unsaturated downflow. Wastewater is distributed across the tops of the porous wetland media and slowly trickles through in unsaturated flow, where it comes in contact with microorganisms attached to the filter media. This type of system can be set up as single-pass mode or the water can be recirculated multiple times.
For all above systems the porous media used acts as a filter to remove solids, provides a surface that bacteria can attach to and also provides a base for the vegetation. This means VF wetlands are efficient in BOD and SS removal. The vegetation maintains permeability of the filter media and also provides a habitat for microorganisms. It also transfers small amounts of oxygen to the roots zone which allows aerobic bacteria to colonize the area and degrade organics. (Kadlec & Wallace 2008)
FIGURE 4.3: SCHEMATIC VF CONSTRUCTED WETLAND (TILLEY ET AL. 2014)
Due to the unsaturated flow and the intermittent loading operation of VF wetlands
oxygen is diffused through the wetland bed which creates aerobic conditions within

23
the wetland cell. This means VF wetlands can provide good condition for nitrification.
However the oxygen transfer capacity of a VF CW often still fails to fully meet the
microbial need for carrying out organic matter oxidation and nitrification. VF CWs
cannot provide the right conditions for denitrification and hence TN removal is a VF
CW is not possible. Again phosphorus removal is low unless a high sorption capacity
aggregate is used. (Vymazal 2010)
4.1.1. Hybrid Constructed Wetlands
When different types of CWs are combined to work together in a system they are
referred to as a hybrid system. Hybrid systems were developed to combine the
advantages of single systems in one system and therefore improve treatment
efficiency. This is particularly important for TN removal. Single CW on their own
cannot provide conditions for both nitrification and denitrification at the same time,
but hybrid systems can. Hybrid systems often consist of a VF and a HSSF CW, but
various combinations, including recirculating of the water, are possible.
4.1.2. The French System Vertical Flow Constructed Wetland
The so called “French System” is a specific type of VF CW that has successfully been
implemented mainly in France. The current design of a French System is a two staged
vertical flow CW system with each of its stages further divided into separate parallel
filters. Stage one is divided into 3 parallel filters and stage 2 divided into 2 parallel
filters. This means there are three independent wetland filter bed in stage 1 and two in
stage 2. Each filter bed in stage one is loaded for 3-4 days while the other two filter
beds are being rested. This allows the filters in stage 1 to rest for twice as long as the
operation time. In stage 2 the two filter beds are used alternately, which means equal
time for resting and operation. The alternative operation and resulting wetland filter
resting periods are fundamental in controlling the growth of the attached biofilm on
the wetland aggregate as described in section 3.4. (Molle et al. 2005) Figure 4.4 shows
the layout of a French system CW.

24
FIGURE 4.4: FRENCH SYSTEM TREATMENT WETLAND LAYOUT
The first stage of this type of VF CW is designed to mainly reduce the TSS and BOD
load in the wastewater. During operation in the second stage of the wetland system the
treatment process is completed and most of the nitrification process is carried out.
Within the filter bed aerobic conditions are maintained. This is achieved by batch
feeding of the wetland filters. With this setup near complete nitrification can be
achieved, but denitrification is very low. (Molle et al. 2005).
4.2. Aerated Artificial Wetlands
Like tidal flow wetlands, aerated wetlands are a type of engineered treatment wetland.
In aerated wetlands additional oxygen is introduced to the wetland cell by injecting air
into the wetland bed via an air pump (Wallace et al. 2006). This introduction of
additional oxygen greatly increases the nitrification rate of the wetland. However even
though aeration leads to a reduction of ammonium nitrogen TN nitrogen is limited due
to the lack of anaerobic conditions required for denitrification. The costs of continuous
aeration can also be problematic (Wu et al. 2014).

25
4.3. Comparison of Alternative Treatment Systems to Tidal Flow
CWs
4.3.1. Comparison of Treatment Wetlands
A site by site comparison of all different types of CWs is almost impossible as there
are too many factors that influence results in different studies (e.g.
climate/temperature, influent loads, variations in operation, weather pattern etc.).
Various studies have been carried out, but each one usually focuses on the comparison
of a couple of characteristics only and also includes only a few different wastewater
systems at a time. Comparisons of different CWs can have different results in different
studies, especially when climate or the weather pattern is different.
In 2009 a research facility was established in Langenreichenbach/Germany
(NivalaHeadley, et al. 2013) which aimed to overcome these problems and
investigated different types of advanced subsurface flow treatment wetland designs in
a side by side comparison. Included in this comparison were 15 individual pilot scale
versions of different wetland designs, these included planted and unplanted versions
of passive and intensified wetlands systems. A summary of all included wetland
systems is shown in Table 2. All systems were loaded with the same type municipal
wastewater. Prior to entering the wetland systems the wastewater underwent primary
treatment in a sedimentation tank.

26
TABLE 2: DESIGN AND OPERATIONAL DETAILS ON THE 15 TREATMENT SYSTEMS AT
LANGENREICHENBACH, GERMANY (NIVALAWALLACE, ET AL. 2013)
The study found that the intensified wetland systems (aerated and tidal flow) easily
outperformed the passive systems in contaminant removal especially in the removal
of ammonium-N. Even though hydraulic loading rates were much higher than for the
passive systems the intensified systems still performed better and achieved low
effluent concentrations. The reciprocating (tidal flow, R in table) wetland system had
the highest removal rates for BOD5, TOC and TN, the horizontal system with aeration
had the highest rates for NH4-N degradation and E. Coli removal (Nivala et al. 2012).
The wetlands used in the study were quite specific. While results give a general idea
of how different wetlands behave and compare, it is difficult to get exact numbers for
removal rates and required areas, because the same wetland can perform differently
depending on location, climate and wastewater concentration.
Table 2 gives a general overview of different types of wetlands, their requirements
and removal capabilities.

27
TABLE 3: COMPARISON OF DIFFERENT TYPES OF CWS
BOD
removal
SS
removal
Nitrifi-
cation
Denitrifi-
cation
Phos-
phorus
removal
Land
require-
ment
Energy
requirement
FWS
CW high high low medium low
very
large zero
HSSF
CW high high very low high low large zero
VF CW high high high very low low medium
to large
low or zero if
loaded by a
siphon
Hybrid
CW high high high high low
very
large low
Tidal
Flow
CW
high high very high high low small medium to
low
Aerated
CW
very
high high very high low low
small to
medium medium
4.3.2. Comparison to Conventional Wastewater Treatment Systems
A study undertaken by Austin and Nivala (2009) investiges the energy requirements
of three different constructed wetland systems compared to a traditional centralised
mechanical activated-sludge treatment system. The engineered wetland systems
included in this study were a two-cell aerated subsurface flow wetlands, a six-cell tidal
flow wetlands and a two-cell pulse fed wetland (Figure 4.5).

28
FIGURE 4.5: SYSTEM SCHEMATICS (AUSTIN & NIVALA 2009)
(a) MLE: activated sludge with pre-anoxic denitrification from nitrified process recycle
(b) Aerated wetland: organic carbon removal in passive first-stage horizontal SSF cell,
with pre-anoxic denitrification from nitrifying (aerated) second-stage horizontal SSF cell
(c) Tidal flow wetland: three paired cells with reciprocating pumped flow in each cell
pair and overflow drain to next pair in series. The first stage rotates three paired cells in
parallel to allow resting, but not pictured for simplicity
(d) Pulse-fed wetland with siphon-dosed cells
Energy requirements were calculated based on the same hypothetical domestic
wastewater, discharge target and daily flow rate for all technologies (Austin & Nivala
2009).
The study found that the energy requirement of the wetlands is significantly lower
than the energy requirement of the activated sludge system dispite all theoretical
factors being the same for the calculations used. Tidal flow wetlands used less than
25% of the energy of an activated sludge treatment system in this design exercise and
only half of the energy a equivalent aerated wetland would use. Figure 4.6 summarises
these results.

29
FIGURE 4.6: SUMMARY OF PROCESS ENERGY REQUIREMENTS (AUSTIN & NIVALA 2009)
4.4. Summary
This section has demonstrated some of the characteristics of different wastewater
treatment options that are direct competition to TFWs. It has shown that unless
conventional CWs are used in a hybrid or staged system, they are not able to achieve
the treatment standards necessary for advanced wastewater treatment. The main
reason for this is the inability to provide the right conditions needed for complete
nitrogen removal.
Therefore, out of the chosen systems only aerated wetlands, hybrid/staged wetlands,
and activated sludge systems are able to provide the same treatment level as a TFW.
The comparison of the remaining types of treatment systems (activated sludge, aerated
wetlands, TFWs, and hybrid/staged CWs) shows that the wastewater treatment process
is basically a compromise between land size requirement and energy use. A chart
available on (http://www.livingmachines.com 2015) supports this (Figure 4.7).

30
FIGURE 4.7: SIZE VS. ENERGY CONSUMPTION ON-SITE TREATMENT SYSTEMS
(HTTP://WWW.LIVINGMACHINES.COM 2015)
The simplicity and low energy use of tidal flow wetlands makes them an ideal option
for remote locations and underdeveloped countries where highly engineered systems
such as activated sludge are not applicable due to their high energy demand and
complicated operation and maintenance. Hybrid/staged systems are another option for
remote and underdeveloped areas but can be impractical due to the land requirement
of such systems. Tidal flow wetlands can be built out of locally available materials.
Tidal operation can be maintained by simple pumps that are available even to remote
and less developed areas. TFWs are simple to operate and only need minor
maintenance.
In densely populated areas, highly engineered wastewater treatment systems such as
activated sludge systems, are often the only option. The energy consumption of those
systems could be reduced dramatically if combined with a TFW for nitrogen removal.
The next section shows in more detail how TFWs compare to a conventional (no
energy) CWs for a specific wastewater situation.

31
CHAPTER 5 - COMPARISON OF A TIDAL FLOW WETLAND AND A PASSIVE (VF) WETLAND
WHEN APPLIED TO WASTEWATER TREATMENT FOR A SMALL RESIDENTIAL
DEVELOPMENT
5.1. Introduction
The purpose of this study is to explore in more detail the advantages and possibilities
of TFWs as a sustainable treatment option compared with a conventional passive CW.
For this, a comparison between a TFW and a conventional passive VF wetland was
developed. The study is based on a hypothetical wastewater treatment situation of a
small residential development or village. Both systems were exposed to the same
wastewater situation and required wetland size and energy use was determined.
The small development chosen for this study is residential including about 25 houses.
For this exercise 4 people per house on average are assumed, with a water usage of
200L per person per day. This means the designed wetlands will treat wastewater for
100 PE (person equivalent) and a wastewater flow of 20,000 L/d (20 kL/d). These are
all hypothetical values for the purpose of this study.
5.2. Wastewater Flow and Strength
It is assumed that all wastewater undergoes primary treatment in a septic tank before
entering further treatment. This assumption is made for both of the chosen wastewater
treatment systems of this study.Table 4 shows the typical composition of municipal
wastewater and percent removals at various levels of treatment (Kadlec 1995). Only
constituents important to this study are shown.

32
TABLE 4: TYPICAL COMPOSITION OF MUNICIPAL WASTEWATER AND PERCENT REMOVAL
AT VARIOUS LEVELS OF TREATMENT (KADLEC 1995)
Constituent
Raw Wastewater
(mg/L) Percent Removal
Secondary Effluent
(mg/L)
Typical Range Primar
y Secondary Typical Range
BOD5 220 110-400 0-45 65-95 20 10-45 TSS 220 100-350 0-65 60-90 30 15-60 NH4-N 25 12-50 0-20 8-15 10 <1-20 NO3+NO2-N 0 0 - - 6 <1-20 Org-N 15 8-35 0-20 15-50 4 2-6 TKN 40 20-85 0-20 20-60 14 10-20 Total N 40 20-85 5-10 10-20 20 10-30 Total P 8 6-20 0-30 10-20 6 4-8
As the table shows, wastewater characteristics can vary widely. For the purpose of this
study the following raw wastewater composition and primary effluent levels were
chosen:
BOD5: 220 mg/L after primary treatment: 150 mg/L
TSS: 220 mg/L 110 mg/L
NH4-N: 25 mg/L 22 mg/L
Org-N: 15 mg/L 13 mg/L
TKN: 40 mg/L 35 mg/L
Total N: 40 mg/L 37 mg/L
Total P: 8 mg/L 7 mg/L
5.3. Treatment Target
The target effluent concentration used for this exercise is:
BOD: 10 mg/L
TSS: 10 mg/L
Total nitrogen: 10 mg/L
Phosphorous: 5 mg/L

33
This treatment target is in the range of tertiary treatment.
5.4. ReCip Tidal Flow Wetland
For the comparison in this study a ReCip tidal flow wetland was chosen. This means
the tidal flow wetland will be designed in wetland cell pairs. A flow diagram for this
preliminary design is shown in Figure 5.1.
FIGURE 5.1: FLOW DIAGRAM TIDAL FLOW WETLAND
5.4.1. Preliminary Sizing
Preliminary sizing of the tidal flow wetland is based on the BOD and nitrogen load of
the wastewater. The total size of the wetland is determined by choosing whichever
parameter requires the larger area or volume. This depends on the concentration of
each contaminant.
The daily wastewater flow is 20,000 L/day which is equivalent to 834 L/h
2 hours should be allowed to complete each flood and drain cycle. Hence a maximum
of 12 cycles per day are possible.

34
Screening for BOD:
The total daily BOD load was determined:
BOD load = 20,000 L/d * 150 mg/L = 3000 g/d
To prevent clogging of the wetland cell the BOD load should be limited to 50 g
BOD/m2 (D. Austin 2015, pers. comm., 15th Aug). Many laboratory studies suggest a
much higher BOD loading rate, but wastewater in laboratory based studies are often
artificially prepared, which means they do not contain any suspended solids.
Suspended solids trapping is one of the main reasons for the clogging process (Li, Wu
& Dong 2015), hence for the purpose of this study a much lower BOD loading rate
per square meter was chosen. From that the minimum required surface area can be
calculated.
Minimum surface area = (3000 g/d) / (50 g/m2/d) = 60 m2.
60 m2 is the area required for one wetland cell. The chosen ReCip tidal flow wetland
requires a second wetland cell, as it is designed to operate in cell pairs. This means a
second wetland cell of the same size is required. Therefore the total minimum size
needed to remove the required amount of BOD is 120 m2.
The depth of the wetland cells is assumed to be 0.5 m, with this the wetland cell
volume can be calculated.
Choose a depth of 0.5 m → minimum volume per cell = 30 m3.
This equals a total volume of 60 m3.
Screening for TKN:
To size the wetland cells for total nitrogen removal the nitrogen load in each fill and
drain cycle has to be determined. The ammonium adsorption rate of the wetland cell
depends on the type of aggregate chosen. For the purpose of this comparison an
aggregate with a low adsorption rate is chosen. Choosing an aggregate with a higher
adsorption rate (higher CEC) will result in a higher nitrification rate without changing
the wetland cell size (Austin 2006). Details about the CEC of wetland aggregate can
be found in section 3.5.

35
The nitrogen load during one cycle is determined from the nitrogen concentration of
the wastewater and the length of each cycle (2h).
TKN load = 35 mg/L × 834 L/h ≈ 30 g/h
For a 2-hour cycle the load is 60 g/cycle.
The aggregate should be able to adsorb 2-4 times the TKN -load in each cycle. Hence
the CEC of the aggregate and the size of the wetland cell should be chosen
accordingly. This means that the aggregate in each of the two wetland cells has to be
able to absorb 4×60 g = 240 g of TKN.
Assume a low CEC of the aggregate of 20 g/m3
Minimum volume of the cell = 240 g / 20 g/m3 = 12 m3
Therefore when choosing an aggregate with a CEC of at least 20 g/m3 a minimum cell
size of 12 m3 is required to remove all of the TKN during nitrification. This means
complete nitrification is possible.
After this the wetland cell has to be checked to see if it is large enough to allow for all
the wastewater to be treated during the 12 cycles per day. Therefore the porosity of
the aggregate was assumed to be 40%.
Assume a porosity of the aggregate to be 40%:
Pore volume of the cell = 12 m3 × 0.4 = 4.8 m3
4.8 m3 × 12 cycles per day = 57600 L/d.
Therefore the wetland cell is big enough to treat 57600 L/d of water volume over 12
cycles, sufficient for the design flow of 20,000 m3.

36
Final wetland size:
When comparing the BOD (minimum area per cell: 60 m2) and TKN (minimum
volume per cell: 12 m3 at AEC of 20 g/m3) it was found the BOD loading limited the
design sizing. Therefore the minimum area of each of the two wetland cells was chosen
to be 60 m2. With a depth of 0.5 m the required volume of each cell is 30 m3.
To prevent clogging of the substrate by excess biofilm growth it is recommended that
resting periods of the wetlands cells be allowed. In this instance the wetland cell is
divided into 2 separate parallel operating systems. This means only one of the parallel
systems is operated at any one time while the other wetland beds are rested.
With the wetland cells divided into two systems each operating cell halved in size,
which is 30 m2 and with a depth of 0.5 m the volume is 15 m3. This is still big enough
to ensure full nitrification (minimum volume required 12 m3)
Again a porosity of 40% for the aggregate is assumed, so the pore volume of each cell
is 6 m3 = 6,000 L. This means the forward flow of the wastewater (20,000 L) fills and
drains the wetland cell less than 4 times. To recharge the CEC of the wetland cell
aggregate a recycle flow is recommended. The recycle flow is chosen so that the
wetland cell is filled and drained 8 times per day (Austin, Lohan & Verson 2003). For
that to happen, a total flow of 48,000 L is needed. This means the recycle flow should
create an extra 28,000 L per day.
Figure 5.2 shows a simple sketch of the required wetland set-up.

37
Total area: 200 m2
FIGURE 5.2: LAYOUT OF TIDAL FLOW WETLAND
5.4.2. Energy Use
For both wetland systems, the energy consumption needed for primary treatment is
not included in the calculations.
For the tidal flow system, it is assumed that the flow through the system is by gravity
through an overflow drain. This means the only energy the tidal flow system uses, is
for reciprocation of the water between the cells and for the recycle flow. The
reciprocation pump is used intermittently, while the recycle flow pump is constantly
pumping water.
Reciprocation pumps:
The tidal flow wetland cell receives a constant inflow of 48,000 L/d (20,000 L daily
inflow + 28,000 L recirculation flow per day). This equals a flow rate of 2000 L/h.
During a reciprocation cycle, the reciprocation pump must move the pore volume of
one cell to the other in a reciprocating pair, plus the influent it receives during the
pumping phase. To allow for 8 reciprocation cycles per day and enough resting time
in between pumping phases, the pumping time for reciprocation of the water between
the cells should be 1 hour. This means the reciprocation pump must move the total

38
pore volume plus the inflow in 1hour. From this, the required pumping rate can be
calculated:
Pumping rate = 6000 L/h + 2000 L/h = 8000 L/h
The reciprocation pump runs for 1 hour every 3 hours, which equals a total running
time of 8 hours. Due to the two wetland systems operating in parallel operation and
only one system running at any one time these calculations are based on one
reciprocation pump only.
To find the power consumption of the pumps Equation 4, Equation 5, Equation 6 are
used. The total dynamic head is the sum of the total depth of the wetland cell and the
frictional losses in the pipes etc. The total dynamic head is estimated to be 1.5m. The
pump chosen is a “Zenit 40/2/G32VMGEX”. It is rated for a flow rate of 160 L/min
and a max head of 4 m.
EQUATION 4: HYDRAULIC POWER (AUSTIN & NIVALA 2009)
�� = ���ℎ3.3 ∗ 10� ���������������(4)
where Ph = hydraulic power in kW q = flow capacity in m3/h ! = density of water (=1000 kg/m3) h = total dynamic head in m g = gravitational force (9.81 m/s2)
EQUATION 5: SHAFT POWER (AUSTIN & NIVALA 2009)
�" = ��# �������������������������(5) where Ps = shaft power in kW Ph = hydraulic power in kW $� = pump efficiency (=0.75 (Austin & Nivala 2009))

39
EQUATION 6: ELECTRIC POWER REQUIREMENTS (AUSTIN & NIVALA 2009)
��% = �"# ������������������������(6)
where Pe = electrical power in kW
Ps = shaft power in kW $ = motor efficiency (0.9 (Austin & Nivala 2009))
From Equation 4, 5 and 6 the required electric power is calculated to be 0.053 kW.
With an operational time of 8 hours per day the daily power consumption of the
reciprocation pump is 0.424 kWh/day.
Recycle flow pump:
The recycle flow pump moves water at a constant rate for 24 hours a day. Over 24
hours it moves 48,000 L which equals a flow rate of 2000 L/h.
The total dynamic head of the recycle pump is assumed to be 3 m. From Equation 4,
Equation 5, Equation 6 and the 24 hour operational time per day the total power
consumption of the recycle flow pump is 0.634 kWh/day
Total daily power consumption:
The total daily power consumption of the tidal flow wetland is the sum of the power
consumptions of both pumps. This means the total power consumption of the tidal
flow wetland is 1.058 kWh per day.

40
5.5. Vertical Subsurface Flow Treatment Wetland
5.5.1. Choosing an Appropriate Treatment Wetland
There are a wide range of conventional treatment wetlands available. The main
categories are surface flow, subsurface horizontal flow and subsurface vertical flow.
Each of these have their advantages and disadvantages. These are explained in detail
in chapter 4. To achieve total nitrogen removal (nitrification and denitrification) a
staged or hybrid wetland system is necessary. A good nitrification rate can only be
achieved in a VF wetland, while FWS and HSSF wetlands provide good conditions
for denitrification. This means for this design exercise a VF wetland coupled with a
HSSF or a FWS wetland is necessary.
Sizing of a conventional wetland is complicated and various models (Reed et al 1995,
Kadlec et al 2008) have been developed for preliminary sizing of wetlands. When
trying to apply these to the wastewater situation in this study, it was found that
changing one parameter slightly the required wetland size changed dramatically. This
meant for this hypothetical comparison study, the models were only useful if
parameters, like removal rate, were known or at least able to be assumed without large
error. This was not possible for most contaminants. During further research into
conventional treatment wetlands for advanced wastewater treatment, the French
System Vertical Flow Treatment Wetland (Molle et al. 2005) was found. Details about
the French system can be found in section 4.1.2. This system combined with a FWS
wetland, to complete denitrification, was chosen for the comparison study.
5.5.2. Preliminary Sizing of the Wetland Area
The French system isn’t sized on influent and target effluent water quality, instead the
sizing of the subsurface flow wetland filters is based on the acceptable organic load
on the filter surface per person equivalent (PE). A French System SSF wetland usually
consists of two stages of wetland filters. The first stage consists of 3 filters operated
in parallel. This means only one of the 3 filters is operated at any one time while the
other filters are being rested. The second stage consists of 2 filters in parallel operation.
One filter is being loaded, while the other one is rested. The resting period of the
wetland filters controls the growth of the attached biomass on the filter media. Loading
the filters without allowing for resting periods would result in clogging of the filter
media.

41
The surface area recommended per PE is (Molle et al. 2005):
- 1.2 m2/PE divided over 3 identical wetland filters for the first stage filters
- 0.8 m2/PE divided over 2 identical wetland filters for the second stage filters
For this example (100PE) this results in 5 (3 in stage 1, 2 in stage 2) identical sized
wetland filters, each being 40 m2.
The total area for the French System vertical SSF wetland therefore is 200 m2. This
setup allows for nitrification, but only partially denitrifies (for this exercise total
nitrification and 50% denitrification is assumed (D. Austin 2015, pers. comm., 15th
Aug). Final denitrification, and hence total nitrogen removal, is achieved by a FWS
wetland. The size of the FWS wetland is determined by the first order equation in
Kadlec and Wallace (2008).
The P-k-C* Model (first order equation) (Kadlec & Wallace 2008) can be used as long
as influent wastewater concentration and effluent target concentrations are known and
removal rate (k) and apparent number of tanks in series (P) can be approximated
without large error.
EQUATION 7: CALCULATION OF FWS WETLAND AREA AW (KADLEC & WALLACE 2008)
&' = � ()*+ *∗*, *∗- ./ �− .1 /2,3
4&5 (7)
where Ce = Target effluent concentration in mg/L
Ci = Influent wastewater concentration in mg/L
C* = Irreducible background concentration in mg/L
kAT = First-order areal rate constant in m/yr (here kAT = 100 m/yr
P = Apparent number of tanks in series
Qin = Design flow rate in m3/d

42
Due to the French system only achieving 50% denitrification, the outflow of the
French system wetlands flows into the FWS wetland with a nitrate concentration of
around 17 mg/L. Levels for BOD, TSS, TKN and phosphorus are assumed to be at
acceptable levels after treatment in the French system wetland.
To size the FWS wetland to remove the nitrate concentration to an acceptable level,
the following values are used in the first order equation:
Ci = 17 mg/L
Ce = 10 mg/L
C* = 0
P = 3 (D. Austin 2015, pers. comm., 15th Aug).
kAT = 100 m/yr (D. Austin 2015, pers. comm., 15th Aug).)
Qin = 20000 L
This results in a required area of 283 m2.
Therefore the total area required to treat the initial wastewater to the required effluent
standard in a passive flow treatment wetland, is 483 m2. This is around 4 times the size
of the tidal flow treatment wetland.
Figure 5.3 shows a simple sketch of the required wetland set-up:
43
Total area: 483 m2
FIGURE 5.3: LAYOUT STAGED FRENCH SYSTEM VF WETLAND FOLLOWED BY FWS
WETLAND
5.5.3. Energy Use
As mentioned earlier the energy consumption for primary treatment is ignored.
For the conventional treatment wetland it is assumed that all flow through the wetland
cells is by gravity. For this the wetland has to be constructed on a slope. Wetland cells
are loaded by syphons. This means that this hybrid CW does not need any energy input
at all.

44
CHAPTER 6 - RESULTS
The literature review gave a thorough and detailed overview on research and
knowledge available on the topic of “Tidal Flow Wetlands”. It showed that there is a
wide field of applications that can possibly be covered by TFWs. TFWs can be used
as decentralised wastewater treatment and re-use systems and as standalone systems
to treat high strength wastewater. The literature review suggested that they are also a
promising option for low energy tertiary treatment used after conventional secondary
treatment (trickling filter, activated sludge systems). Another very promising approach
for TFWs is the application in remote locations and developing countries, that don’t
have access to highly engineered wastewater treatment systems.
The calculations and direct comparison of a hybrid CW and a TFW, in chapter 5, has
shown how these two systems compare when applied to a small residential
development. From the given conditions, a French system VF CW, combined with a
FWS CW, was chosen to be the most efficient CW for this situation. Other hybrid CW
are possible options, but removal rates for each contaminants were impossible to
predict accurately. Other type systems would most likely end up being much larger in
size than the chosen French system.
For the given wastewater situation, the TFW required 120 m2 for achieving the given
tertiary treatment standard. The hybrid CW required a total area of 484 m2. This area
was made up of a 200 m2 French system and a 284 m2 FWS CW. The FWS CW was
designed to complete denitrification to achieve TN removal. A high nitrate removal
rate of 100 m/y was assumed, due to the location of the wetland in a subtropical
climate, such as South East Qld. In a colder climate, this nitrate removal rate can be
as low as 15 m/y, which would dramatically increase the size of the FWS wetland.
The hybrid CW was designed to work without any energy input at all. For this the
complete system would have to be installed on a suitable slope. To keep conditions
comparable, it was assumed that flow through the TFW was by gravity also, and
energy input was only required for the reciprocation of the wastewater between the
wetland cells and the required flow recirculation of the system. This means the TFW
would also have to be installed in a way that accommodates the flow by gravity
through the system. The total energy input needed for the TFW was calculated to be
1.058 kWh per day. This energy use is comparable to around 4-5 standard (15 W)
energy saving lightbulbs used for 24 h/day.
From the calculations, it was clear that the TFW required the 120 m2 of area due to the
BOD load. TN removal was able to be achieved on just 12 m3, which with a depth of
45
0.5 m, would only require 24 m2 land area. This area can again be reduced by using
an aggregate with a high CEC such as a lightweight expanded shale aggregate.
By comparison, the hybrid wetland system needed a size of 200 m2 to achieve
sufficient BOD, TSS and ammonia removal. This area only included partial
denitrification. Just to complete the denitrification process, an additional area of 284
m2 was required. This means that for BOD the wetlands are comparable in size and
only the TN removal causes the large gap in area requirements. This again confirms
that especially for TN removal TFWs have a large advantage in the size needed to
achieve advanced levels.
Previous studies show that tidal flow wetlands can remove TN using only a quarter of
the energy required by a comparable activated sludge systems.

46
CHAPTER 7 - CONCLUSION
This study has highlighted that TFWs are a very promising approach for wastewater
treatment in the future. TFWs can close the gap between highly engineered, high
energy wastewater treatment systems and low maintenance natural treatment systems
such as CWs that require minimal to no energy input.
The unique TN removal ability makes these systems a suitable option for situations
like:
• Remote locations and underdeveloped countries, due to the low maintenance
required on these systems and being able to be built out of locally available
materials
• Small communities, due to their ability to treat very small loads of wastewater
• Nitrogen removal to achieve advanced treatment levels after secondary
treatment by an activated sludge systems, reducing energy usage significantly
• As a stand-alone decentralised wastewater treatment and re-use system for
large office buildings and institutions, when coupled with a water polishing
unit
• Wastewater treatment and re-use system for agricultural areas, to reduce
potable water usage for irrigation
• Treatment of high strength nitrogen wastewater
Further studies, especially pilot systems, are required to confirm these findings.

47
APPENDIX A - PROJECT SPECIFICATIONS
FOR: Ina Weinheimer
TOPIC: Water Treatment using Constructed Wetland – Tidal
Flow Wetlands
SUPERVISOR: Prof Jochen Bundschuh
ENROLMENT: ENG 4111 – S1 2015 External
ENG 4112 – S2 2015 External
PROJECT AIM: To evaluate the applicability of Tidal Flow Wetlands as
a wastewater treatment option
PROGRAMME:
1. Research history of constructed wetlands for wastewater treatment
2. Research and identify contaminants occurring in wastewater
3. Research and identify the wastewater treatment process and contaminant removal mechanism involved in constructed wetlands (focus on tidal flow wetlands)
4. Critically analyse and evaluate different constructed wetland systems and other wastewater treatment systems compared to tidal flow wetlands
5. Set up a performance comparison of a tidal flow wetland and a conventional treatment wetland to be able to directly compare treatment outcomes and design methods for a specific wastewater situation
6. Discuss findings, evaluate positive and negative features, suitability and limitations of Tidal Flow Wetlands
7. Conclusion and future outlook
8. Submit dissertation on the research

48
REFERENCES
Austin, D 2003, Advanced Treatment Wetlands: A 4th Generation Technology, White Bear Lake, Minnesota, USA.
Austin, D 2006, 'Influence of cation exchange capacity (CEC) in a tidal flow, flood and drain wastewater treatment wetland', Ecological Engineering, vol. 28, no. 1, pp. 35-43, <http://www.sciencedirect.com/science/article/pii/S0925857406000723>.
Austin, D & Nivala, J 2009, 'Energy requirements for nitrification and bilogical nitrogen removal in engineered wetlands', Ecological Engineering, vol. 35, no. 2, pp. 184-92.
Austin, D, Lohan, E & Verson, E 2003, 'Nitrification and Denitrification in a Tidal Vertical Flow Wetland Pilot', in Water Environment Technical Conference: proceedings of the Water Environment Technical Conference Los Angeles.
Behrends, LL 1999, Reciprocating Subsurface-Flow Constructed Wetlands for Improving Wastewater Treatment, 755858, Tennessee Valley Authority United States Corp., USA.
Behrends, LL & Lohan, E 2012, 'Tidal-Flow Constructed Wetlands: The Intersection of Advanced Treatment, Energy Efficiency, Aesthetics and Water Reuse'.
Hoffmann, DH, Platzer, D-IC, Winker, D-IM & Muench, DEv 2011, Technology review of constructed wetlands, Subsurface flow constructed wetlands for greywater
and domestic wastewater treatment, Eschborn,<.
http://sustainablewater.com/recip-reciprocating-wetlands/, 2015, viewed 1/06/2015, <http://sustainablewater.com/recip-reciprocating-wetlands/>.
http://www.livingmachines.com, 2015, viewed 1/06/2015, <http://www.livingmachines.com/Home.aspx>.
Kadlec, RH 1995, Treatment wetlands, Lewis Publishers, Boca Raton.
Kadlec, RH & Wallace, S 2008, Treatment Wetlands, Second Edition, CRC Press.

49
Knowles, P, Dotro, G, Nivala, J & García, J 2011, 'Clogging in subsurface-flow treatment wetlands: Occurrence and contributing factors', Ecological Engineering, vol. 37, no. 2, pp. 99-112, <http://www.sciencedirect.com/science/article/pii/S0925857410002600>.
Lee, C-g, Fletcher, TD & Sun, G 2009, 'Nitrogen removal in constructed wetland systems', Engineering in Life Sciences, vol. 9, no. 1, pp. 11-22, <http://dx.doi.org/10.1002/elsc.200800049>.
Li, C, Wu, S & Dong, R 2015, 'Dynamics of organic matter, nitrogen and phosphorus removal and their interactions in a tidal operated constructed wetland', Journal of Environmental Management, vol. 151, no. 0, pp. 310-6, <http://www.sciencedirect.com/science/article/pii/S0301479715000195>.
Liu, M, Wu, S, Chen, L & Dong, R 2014, 'How substrate influences nitrogen transformations in tidal flow constructed wetlands treating high ammonium wastewater?', Ecological Engineering, vol. 73, pp. 478-86, <http://www.sciencedirect.com/science/article/pii/S0925857414005229>.
Molle, P, Lienard, A, Boutin, C, Merlin, G & Iwema, A 2005, 'How to treat raw sewage with constructed wetlands: an overview of the French systems', Water Science & Technology, vol. 51, no. 9, pp. 11-21.
Monjeau, C 1901, Purifying water, 40,341, USA, 3/09/1901.
Nivala, J, Wallace, S, Brix, H, Headley, T, Kassa, K, Afferden, Mv & Müller, R 2012, Conventional and intensified subsurface flow treatment wetlands: Comparative
analysis using the P-k-C* model.
Nivala, J, Headley, T, Wallace, S, Bernhard, K, Brix, H, Afferden, Mv & Müller, RA 2013, 'Comparative analysis of constructed wetlands: The design and construction of the ecotechnology research facility in Langenreichenbach, Germany', Ecological Engineering, vol. 61, Part B, no. 0, pp. 527-43, <http://www.sciencedirect.com/science/article/pii/S0925857413000566>.
Nivala, J, Wallace, S, Headley, T, Kassa, K, Brix, H, Afferden, Mv & Müller, R 2013, 'Oxygen transfer and consumption in subsurface flow treatment wetlands', Ecological Engineering, vol. 61, Part B, no. 0, pp. 544-54, <http://www.sciencedirect.com/science/article/pii/S0925857412002881>.
Sun, G, Gray, KR, Biddlestone, AJ & Cooper, Dj 1999, 'Treatment of Agricultural Wastewater in a Combined Tidal Flow-Downflow Reed Bed System', Water Science and Technology, vol. 40, no. 3, pp. 139-46.

50
Sun, G, Zhao, Y, Allen, S & Cooper, D 2006, 'Generating “Tide” in Pilot-Scale Constructed Wetlands to Enhance Agricultural Wastewater Treatment', Engineering in Life Sciences, vol. 6, no. 6, pp. 560-5, <http://dx.doi.org/10.1002/elsc.200620156>.
Tilley, E, Ulrich, L, Lüthi, C, Reymond, P & Zurbrügg, C 2014, Compendium of Sanitation Systems and Technologies, Swiss Federal Institute of Aquatic Science and Technology (Eawag), Duebendorf, Switzerland.
Vohla, C, Kõiv, M, Bavor, HJ, Chazarenc, F & Mander, Ü 2011, 'Filter materials for phosphorus removal from wastewater in treatment wetlands—A review', Ecological Engineering, vol. 37, no. 1, pp. 70-89, <http://www.sciencedirect.com/science/article/pii/S0925857409002419>.
Vymazal, J 2007, 'Removal of nutrients in various types of constructed wetlands', Science of the Total Environment, vol. 380, no. 1–3, pp. 48-65, <http://www.sciencedirect.com/science/article/pii/S0048969706007212>.
Vymazal, J 2010, 'Constructed Wetlands for Wastewater Treatment', Water (Basel), vol. 2, no. 3, pp. 530-49.
Wallace, S, Higgins, J, Crolla, A, Kinsley, C, Bachand, A & Verkuijl, S 2006, 'High-Rate Ammonia Removal in Aerated Engineered Wetlands', in 10th International Conference on Wetland Systems for Water Pollution Control: proceedings of the10th International Conference on Wetland Systems for Water Pollution Control Lisbon, Portugal.
Wu, S, Zhang, D, Austin, D, Dong, R & Pang, C 2011, 'Evaluation of a lab-scale tidal flow constructed wetland performance: Oxygen transfer capacity, organic matter and ammonium removal', Ecological Engineering, vol. 37, no. 11, pp. 1789-95, <http://www.sciencedirect.com/science/article/pii/S0925857411002138>.
Wu, S, Kuschk, P, Brix, H, Vymazal, J & Dong, R 2014, 'Development of constructed wetlands in performance intensifications for wastewater treatment: A nitrogen and organic matter targeted review', Water Research, vol. 57, no. 0, pp. 40-55, <http://www.sciencedirect.com/science/article/pii/S0043135414002103>.
Zhao, YQ, Sun, G & Allen, SJ 2004, 'Anti-sized reed bed system for animal wastewater treatment: a comparative study', Water Research, vol. 38, no. 12, pp. 2907-17, <http://www.sciencedirect.com/science/article/pii/S0043135404001745>.
Zhao, YQ, Zhao, XH & Babatunde, AO 2009, 'Use of dewatered alum sludge as main substrate in treatment reed bed receiving agricultural wastewater: Long-term trial',

51
Bioresource Technology, vol. 100, no. 2, pp. 644-8, <http://www.sciencedirect.com/science/article/pii/S0960852408006391>.
Zhao, YQ, Babatunde, AO, Hu, YS, Kumar, JLG & Zhao, XH 2011, 'Pilot field-scale demonstration of a novel alum sludge-based constructed wetland system for enhanced wastewater treatment', Process Biochemistry, vol. 46, no. 1, pp. 278-83, <http://www.sciencedirect.com/science/article/pii/S135951131000334X>.
Zhi, W, Yuan, L, Ji, G & He, C 2015, 'Enhanced long-term nitrogen removal and its quantitative molecular mechanism in tidal flow constructed wetlands', Environmental Science and Technology, vol. 49, no. 7, pp. 4575-83, <http://dx.doi.org/10.1021/acs.est.5b00017>.