water academy ion exchnage operation
DESCRIPTION
water treatmentTRANSCRIPT

Ion Exchange Operations
Matt Roth

Content
• Performance Drivers – Equilibrium
• Selectivity
• Equilibrium leakage
– Kinetics
• Performance Factors – Operating capacity
• Cycle end point
– Reaction zone
– Flow distribution
– Regeneration
• Plant Operation – Feed water
– Demineralization service cycle: WAC, SAC, WBA, SBA
– Throughput; water quality
– Regeneration: backwash, chemical injection, displacement, fast rinse

Equilibrium and Kinetics
-Controlling principles and performance

Performance drivers content
• Equilibrium
– Selectivity
– Equilibrium leakage
• Kinetics

Equilibrium as a Driving Force
5
A
Potential Difference
B
Equilibrium
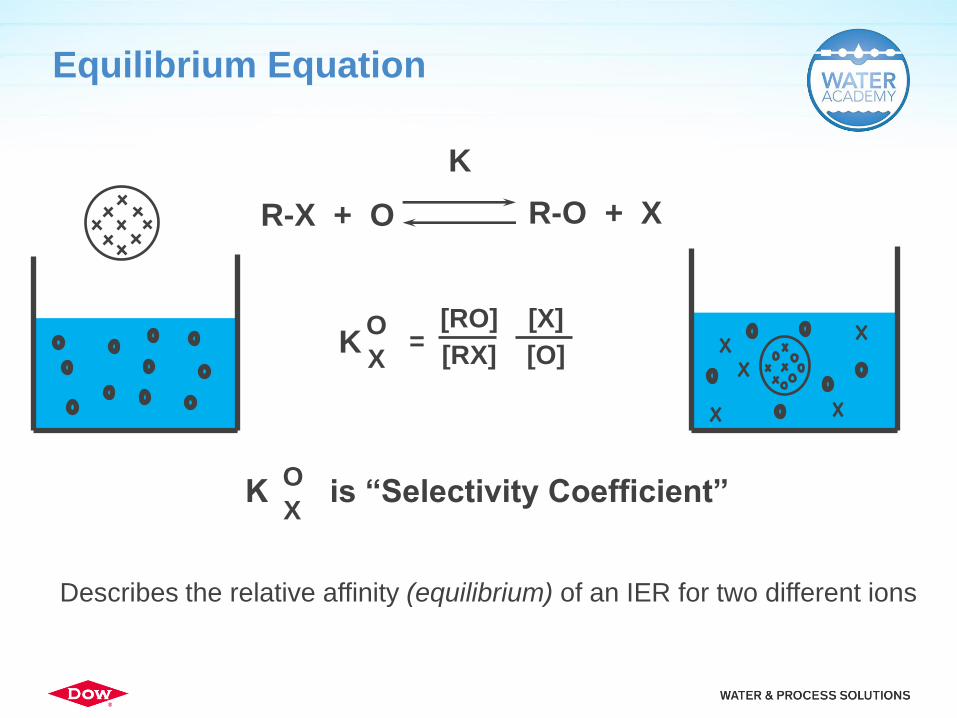
Equilibrium Equation
R-X + O R-O + X
K
K O
X =
[RO]
[RX]
[X]
[O]
K is “Selectivity Coefficient” O
X
Describes the relative affinity (equilibrium) of an IER for two different ions

Selectivity
• Relative preference for one ion over a different ion
– Typically cations vs. H+ and anions vs. OH-
• Divalent ions more selectively held than monovalent
• Highest selectivity ion loads at the top of the bed
• Least selective ion leaks first and indicates exhaustion
• Sodium typically leaks first for cations
• Silica typically leaks first for anions
7
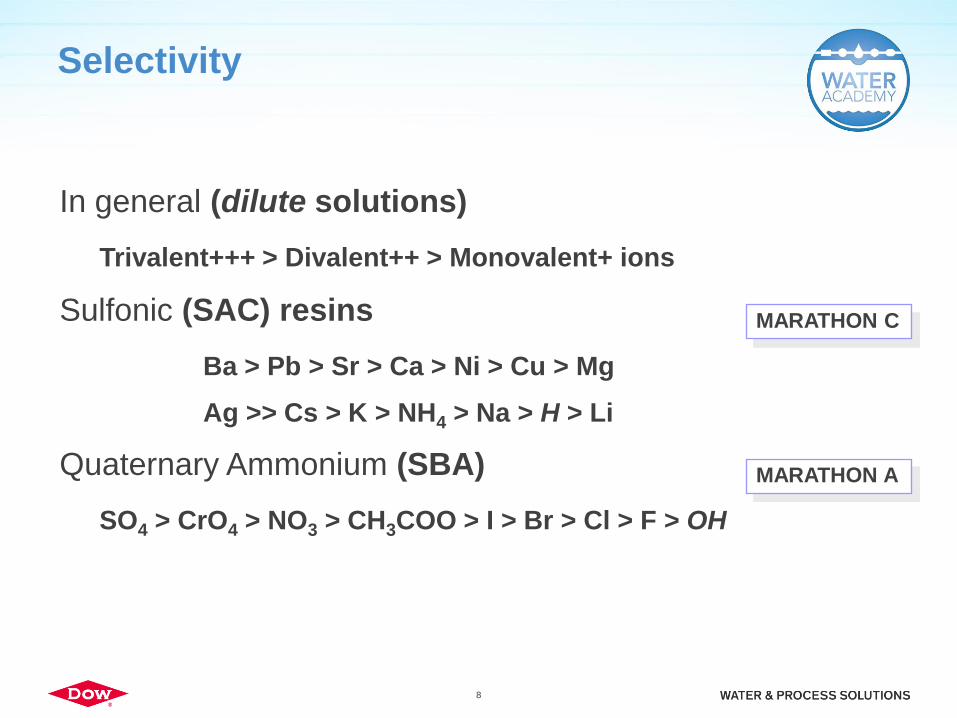
Selectivity
8
In general (dilute solutions)
Trivalent+++ > Divalent++ > Monovalent+ ions
Sulfonic (SAC) resins
Ba > Pb > Sr > Ca > Ni > Cu > Mg
Ag >> Cs > K > NH4 > Na > H > Li
Quaternary Ammonium (SBA)
SO4 > CrO4 > NO3 > CH3COO > I > Br > Cl > F > OH
MARATHON C
MARATHON A

Relative selectivity of common ions
Cation Exchanger Anion Exchanger
Inlet
Outlet
Inlet
Outlet
Ca2+
Mg2+
Na+
H+
SO42-
CO32-
Cl-, HSiO3-
OH-

Example of equilibrium leakage
10
R-H + Na+
K
K Na
H @
[R Na]
[RH]
[H+]
[Na+]
R-Na + H+
1.7 =
Na Leakage = 0.92 ppm Na+
From dissociation [H+] = 10-2
Solve for [R Na]
[RH]
0.7% Sites Na+ Form
pH out of Cation unit = 2
Observation: Cond = 10 µS/cm

Cond, µS/cm Na+ leakage % R-Na
10 920 ppb 0.7%
5 460 ppb 0.34%
2 185 ppb 0.14%
1 92 ppb 0.07%
0.5 44 ppb 0.03%
0.1 8 ppb 0.006%
Equilibrium calculations -Predict leakage

Ion Exchange Kinetics
• Rate at which ion moves to the resin surface and is removed
• In ion exchange film diffusion is the rate limiting step
• Surface fouling slows down removal of ions.

Single Bead Kinetic Model
Stagnant Film
Solid Bead
C*
C L
Bulk Liquid Flow
C = Concentration of Ions in Bulk Liquid C* = Concentration of Ions at Bead Surface L = Film Thickness
In Ion Exchange processes, overall
exchange kinetics is controlled by film
diffusion
R

What is controlling performance?
• Equilibrium Controlled
– Baseline Leakage determined by residual impurities at the outlet of the
column. (what is left on the resin after regeneration)
– Regeneration efficiency-controlled by equlibrium
• Kinetic Controlled
– Mass transfer zone width
– Time to breakthrough and shape of the curve
– SO4 leakage at ppb levels – anion surface fouling

Ion exchange resin breakthrough curve
Time
Baseline Leakage of O
Zero
Influent [O]
Concentration of O

IX Vessel Performance Factors

Performance factors content
• Operating capacity
– Cycle end point
• Reaction zone
• Flow distribution
• Regeneration

Column operation
Fluid to be treated
(Influent)
Treated fluid
(Effluent)
Resin bed
1 Bed volume
(BV)
Total capacity
2.1 eq/l resin

Operating capacity
Exhausted resin
Regenerated resin 0 100
Exhaustion, %
Bed
Depth Reaction zone

Cycle end point
Exhausted resin
Leakage
0 100
Exhaustion, %
Operating
capacity
1.3 eq/l resin
Regenerated resin
Reaction zone

Flow distribution in service vessels is
critical
21

Flow Distribution
• Effect in Service
– Widen mass transfer zone
– Reduces throughput
– Could increase leakage
• Effect in Regeneration
– Reduces throughput
– Increase leakage
– Increases rinse time
– Chemical hideout

Operating capacity- After 1st Cycle
Exhausted resin
Operating capacity
60% of total
Reaction
zone
Begin End
Not all total capacity
available

Co-flow regeneration
Regenerant
Eluate (spent regenerant) Leakage
Liquid to
be treated

Eluate (spent
regenerant)
Counter-flow regeneration
Regenerant
Liquid to
be treated
Clean
polishing
zone

Plant operation
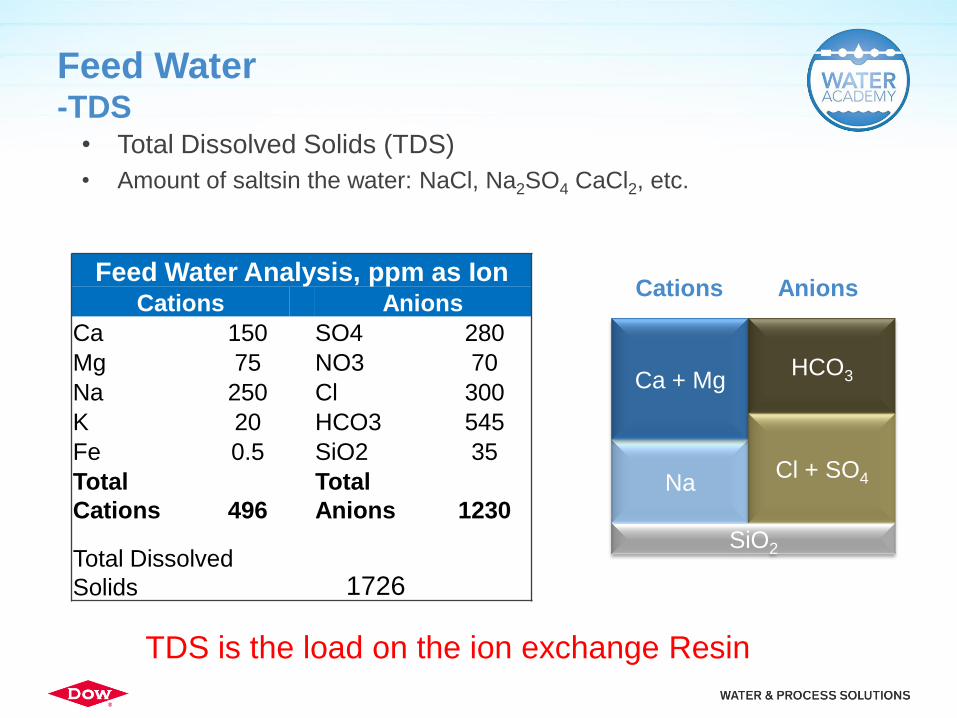
Feed Water -TDS • Total Dissolved Solids (TDS)
• Amount of saltsin the water: NaCl, Na2SO4 CaCl2, etc.
Feed Water Analysis, ppm as Ion Cations Anions
Ca 150 SO4 280
Mg 75 NO3 70
Na 250 Cl 300
K 20 HCO3 545
Fe 0.5 SiO2 35
Total
Cations 496
Total
Anions 1230
Total Dissolved
Solids 1726
TDS is the load on the ion exchange Resin
Na
Ca + Mg HCO3
Cl + SO4
SiO2
Cations Anions

Feed Water
-Other contaminants
• Organics measured as TOC
– Oil/hydrocarbons
– Surfactants
– Natural Organics
• Oxidants
– Chlorine
– Chloramines
• Particulate matter
– TSS – Dirt, Fe, flocculent, etc.
– Turbidity
Not part of the load, but have an impact on performance

Demineralisation
• Trying to remove all ionic contaminates
• Cation resin removes cations from the water
• Anion resin removes anions from the water
• You have created new water molecules
Na
Na
ClCl
Cl
Na
H
H
H OH OH
OH
(charges not shown)

Service cycle
• What happens in each bed?
30
Four Bed System
WAC SAC WBA SBA
WAC SAC WBA SBA

DI – Weak Acid Cation
• Removes hardness associated with alkalinity
• Very efficient regeneration
– 1.05 to 1.15 eq of acid per eq of operating capacity
• Use Rule of thumb
– Total hardness >50% of total cations, Alkalinity/hardness ratio ~1
2R-H + Ca2+(HCO3)2 R2-Ca2+ + 2CO2 + 2H2O
WAC
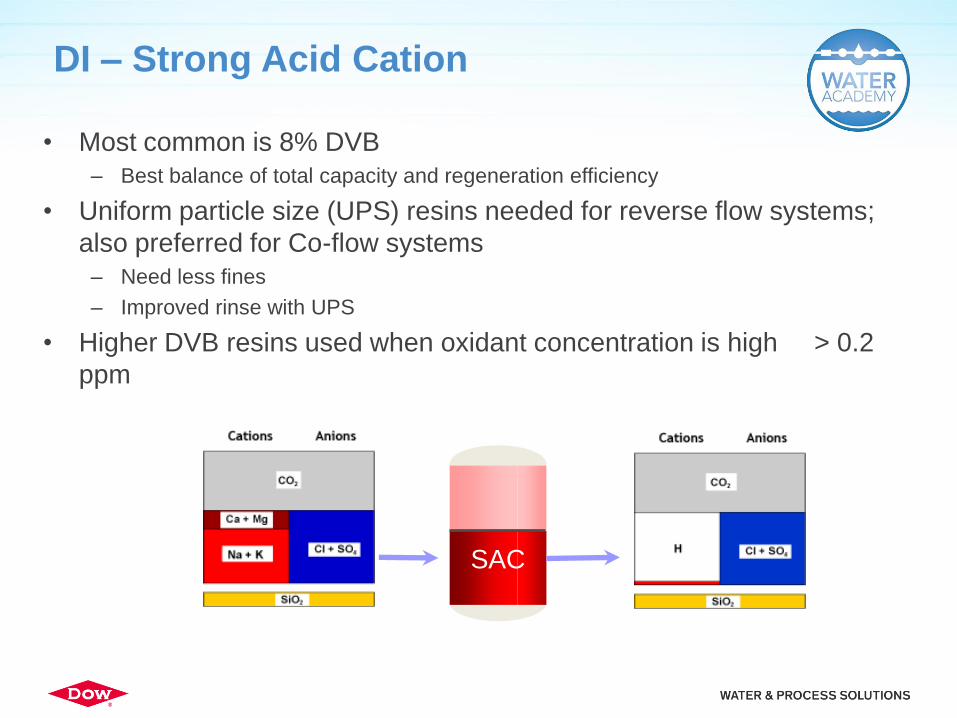
DI – Strong Acid Cation
• Most common is 8% DVB
– Best balance of total capacity and regeneration efficiency
• Uniform particle size (UPS) resins needed for reverse flow systems;
also preferred for Co-flow systems
– Need less fines
– Improved rinse with UPS
• Higher DVB resins used when oxidant concentration is high > 0.2
ppm
SAC

DI – Weak Base Anion
• Removes only strong acids
• Very efficient regeneration
– 1.20 to 1.30 eq of NaOH per equivalent of operating capacity
• Use Rule of thumb
– Total FMA >50% of total anions
– High organics protect SBA
R-N: + H+Cl- R-N: HCl
CO2
WBA

DI – Strong Base Anion
• Resin types
• Type 1 vs. Type 2
• Acrylic vs. Styrenic
• Gel vs. Macroporous
• UPS vs. Gaussian
• High solids vs. Low solids
• Selection criteria
• Temperature
• Organic loading
• Chemical efficiency
• Silica leakage
• Silica load
CO2
SBA
• Many choices
Throughput/Run Time
• Feed water can vary greatly
• Throughput/run time varies with amount of contaminants in
water
– Higher load, lower throughput
– Lower load, higher throughput
• Flow distribution problems
• Resin degradation
• Excess loading of other contaminants
– Fe
– NOM

Water Quality
• Measured by instrumentation and testing
– Instruments need routine calibration
– Testing very important to ensure water quality measured by
instruments
• Boiler reliability and Process reliability dependent on
effluent water quality

Regeneration Steps
• Backwash
• Chemical Injection
– Acid and Caustic
• Chemical Displacement
– Also called slow rinse
• Fast Rinse

Backwash
• Necessary on every regeneration for Co-flow Cation
and Anion Systems
– Must remove particulate matter and Fe from cation
– Must remove anion fines from anion
– Counter-flow systems only backwashed when necessary
• Poor backwash can create pressure drop and flow
distribution problems
– Lower throughput/shorter runs
– Lower water quality
Backwash
• Extreme care must be taken to prevent loss of resin;
ESPECIALLY anion resin
• Expand bed to 1 to 1.5 feet below the outlet
– Ideally 80% expansion, minimum 60%
• Backwash time starts when bed is fully expanded
• Minimum of 20 minutes
• Water temperature affects expansion!

Backwash

Chemical Injection
-Critical parameters
• Quantity of Acid or Caustic
• Concentration of Acid and Caustic
• Temperature of Caustic
• Flow Rate of Acid and Caustic
• Contact Time

Chemical Injection -Quantity of Acid or Caustic
• Must use correct amount of chemical
• Need mass action to drive equilibrium
• Direct effect on throughput/run time
• Direct effect on leakage in co-flow vessels

Chemical Injection -Concentration of Acid and Caustic
• As with quantity of chemical, concentration is critical
for mass action
• Weak Acid Cation < 0.7% H2SO4
– Critical to prevent CaSO4 precipitation
• All other resins typical is 4-8%
– Below 4% effectiveness decreases
– Above 8% high potential for resin breakage
Chemical Injection
-Resin breakage
• Resin shrink and swell as they change forms
– Osmotic stress on the resin is very strong
– Shrink/swell too fast causes beads to break
• WBA are particularly susceptible
– Regenerate very easily, shrink very fast
– Macroporous to increase strength, but still not enough
– Least physically stable resin in the system
– Backwash critically important for good WBA performance
Chemical Injection
-Temperature of caustic
• For more efficient SiO2 removal and prevention of SiO2
precipitation
• Typical temperature 120°F for co-flow systems
• Hot water alone can remove SiO2 from the anion

Chemical Injection -Flow rate
• For cation, flow rate critical to keep
precipitation from occurring inside bed.
• For all other resins, typical flow rate
0.25 – 1 gpm/ft3 (2-8 BV/hr)
– Too low flow rate results in poor
distribution of chemical throughout the
bed.
– Too fast flow rate results in inefficient
regeneration and waste of chemical

Chemical Injection -Contact time
• Given quantity, concentration, and flow rate, contact time
is set
• Needs to be >20 minutes
• Balanced to maximize effectiveness, minimize waste,
and minimize precipitation.

Chemical Displacement
• Continuation of chemical injection
• Must be done at same flow rate as chemical injection
• Completes regeneration
• Rinses out bulk of chemical
• If fast rinse is started too quickly, fast rinse time may
be extended due to mixing in vessel.

Fast Rinse
• Typically performed at service flow rate
• Rinse to final conductivity and SiO2 requirements
• Can be extended for many reasons
– Resin degradation
– NOM loading on anion resin
– Fe loading on cation resin
– Poor flow distribution

Thank You!
For more information please visit our web site or
contact your local Dow representative.
http://www.dowwaterandprocess.com/